evaluation of different approaches to protein engineering ... · evaluation of different approaches...
TRANSCRIPT
EVALUATION OF DIFFERENT APPROACHES TO
PROTEIN ENGINEERING AND MODULATION
APARNA GIRISH
(M.Sc. (Hons), BITS)
A THESIS SUBMITTED
FOR THE DEGREE OF MASTER OF SCIENCE
DEPARTMENT OF BIOLOGICAL SCIENCES
NATIONAL UNIVERSITY OF SINGAPORE
2006

ACKNOWLEDGMENTS
My two and half year research in science has been an eye opening experience. Before
I went into research, science had always been awe inspiring from far, from the text
books. My masters has taught me that behind the awe inspiring discoveries lies a lot a
hard work from large teams of dedicated and zealous scientists. Putting theory into
practice has certainly been challenging. Trouble shooting becomes a way of life in the
lab, it brings forth opportunities to learn more. I’m glad that the journey through
science has been a rewarding and a great learning experience for me and all that
would not have been possible but for a bunch of people whom I owe this
acknowledgement to. I would like to thank my supervisor, Prof. Yao Shao Qin, for his
ideas, for constantly trying to bring forth the best in me, for never giving up, for the
motivation and for the guidance throughout my projects. I thank all my lab mates for
their constant support and valuable suggestions. I would also like to thank the
graduate committee of the Department of Biological sciences, for having given me
this opportunity to learn and do science in NUS. Lastly but certainly not the least, I
thank mother nature, for being so diverse, intricate, complex and beautiful, so that
humans in their life time on earth may never be short of discovering and experiencing
the true joy that only science can bring.
i
TABLE OF CONTENTS
Acknowledgements i
Table of contents ii
Summary vii
List of publications ix
List of tables x
List of figures xi
List of abbreviations xiii
1. Introduction 1
1.1 Protein engineering 1
1.1.1 Rational design and protein evolution to create 1 novel functions or improve existing functions.
1.1.2 Protein engineering: introducing artificial 2
functionalities using enzyme mediated approaches 1.1.3 The three different approaches to protein engineering 3
and modulation that were evaluated in this report
1.2 Inteins 4
1.2.1 Mechanism of protein splicing 5
1.2.2 Engineered inteins in biotechnological 5 applications
1.2.3 The intein based method to tag 7 proteins site-specifically
1.3 Phage display 8
1.3.1 Applications of phage display 11
1.3.2 Enzyme evolution on phage 14
1.3.2.1 Developing a strategy to evolve 14 SrtA on T7 phage
ii
1.3.3 Affinity selection of binders against 19 3CL protease mutant from SARS
2. Materials and methods 22
2.1 Making chemically competent 22 bacteria for transformation
2.2 Transformation of plasmids/ligated vectors 22 into chemically competent cells
2.3 Transformation of yeast cells 23
2.4 PCR 23
2.5 Cloning 24
2.5.1 TA cloning 24
2.5.2 Gateway cloning 24
2.5.3 RE-based cloning into conventional 26 plasmids and large bacteriophage genomes
2.6 Sequencing of genes 28
2.7 Site directed mutagenesis of genes 28
2.8 Expression of different fusion proteins 30 from different vectors and hosts.
2.9 Western blot of proteins 32
2.10 Affinity chromatography of proteins 33
2.10.1 Ni-NTA column 33
2.10.2 GSH column 34
2.10.3 Chitin column 35
2.11 Production of N-terminal cysteine proteins 35
2.12 Spotting of N-terminal cysteine 36 proteins on thioester slides
2.13 In vitro biotinylation of proteins 37
2.14 Spotting biotinylated proteins onto avidin slides 37
iii
2.15 Enzyme activity assays 38
2.15.1 Testing activity of SrtA 38
2.15.2 In vitro self-ligation assay 39
2.15.3 Self-ligation assay on the phage 39
2.16 General phage methods 40
2.16.1 Packaging of T7 phage DNA 40
2.16.2 Amplification of phages 40
2.16.3 PEG precipitation of phages 41
2.16.4 Storage, Serial dilution and titering of phages 41
2.16.5 Plaque lift 42
2.16.6 Sequencing phage 43
2.16.6.1 M13 43
2.16.6.2 T7 43
2.17.7 Phage enrichment methods 44
2.17.7.1 Affinity based enrichment 44 of C-SrtA-T7
2.17.7.2 Activity based enrichment 44 of C-SrtA-T7
2.17.7.3 Bio-panning against SA 45 and 3CL mutant
2.17.7.4 Binding assay 46
3. Results and discussion 47
3A The intein mediated approach to 48 site-specifically label proteins 3A.1 The intein based method to 48
produce N-terminal cysteine proteins
3A.1.1 Expression of N-terminal cysteine 49 -containing proteins from bacteria.
iv
3A.1.2 Spotting N-terminal cysteine- 49 containing EGFP onto thioester slides
3A.2 The intein mediated method to site 50
-specifically label proteins derived from yeast
3A.2.1 Expression levels and the in vivo cleavage 52 pattern of the Intein-fusion proteins in yeast 3A.2.2 On-column cleavage and generation 54
of biotinylated proteins
3A.2.3 Detection on the microarray 56
3B Designing a selection scheme to evolve SrtA on phage 58
3B.1 The N-terminus extension scheme 58
3B.2 The C-terminus extension scheme 60
3B.3 Activity of SrtA with N-and C-terminal extensions 60
3B.4 Self-ligation assay of N/C-SrtA 62
3B.5 Display of N/C-SrtA on phages 62
3B.6 Activity assay of the SrtA on phage 64
3B.7 Enrichment of SrtA-phages from a pool of bare phages 67
3B.7.1 Affinity based enrichment 67
3B.7.2 Activity based enrichment 67
3C Detection of binders of 3CL protease from a phage library 71
3C.1 Biopanning of a model protein Streptavidin 71
3C.2 Binding assay to detect the strongest of binders 72
3C.3 Expression and mutation of the 3CL protease 74
3C.4 Bio-panning against the 3CL protease mutant 74
4. Conclusions 79
5. References 82
Appendix A 95
v

Appendix B 102
vi
SUMMARY
Proteins are important molecular machines within cells. Ability to modulate and
engineer proteins serves as important tools to understand their structure and function.
Different methods are available to engineer proteins. These include protein evolution
methods and enzyme-based methods to introduce artificial functionalities. Protein
evolution can give rise to useful proteins that can fulfill biotechnological and
industrial applications. Protein engineering methods which add on small molecule
tags site-specifically have many applications including bio-imaging, where by
specifically adding a fluorescent tag onto a protein, one can study protein dynamics,
localization, cell movement and cell growth. Site-specific modification of proteins has
also found use in the field of microarrays, where adding on tags such as biotin to a
protein allow it to be specifically immobilized onto an avidin-coated surface.
Different approaches to protein engineering and modulation using the phage display
method and the intein splicing strategy were evaluated in this report.
A strategy for the immobilization of proteins site-specifically via the N-terminus onto
the microarray was developed. The chosen model proteins were cloned into a vector
system that facilitates the expression of the protein with an N-terminal intein fusion.
An extra cysteine residue was introduced at the junction of the intein and protein
fusion. Upon expression of the intein-protein fusion, intein splices out leaving the
protein with an N-terminal cysteine. The proteins thus produced can then be applied
to thioester-functionalized slides for uniform orientation. As a complementary
approach, a system to biotinylate the C-terminus of proteins derived from yeast was
set up. The expression levels and the splicing patterns of three different intein fusion
vii
constructs were studied. Optimal conditions for biotinylation of a model protein were
achieved and the immobilization efficiency onto to an avidin microarray was
evaluated.
As an approach to protein engineering for the enzyme Sortase, a selection scheme for
the evolution of increased activity of Sortase on phage has been devised. Sortase is a
transpeptidase, which catalyzes the transfer of N-terminal glycine peptides to the
sorting motif LPETG found in proteins. Studies of Sortase revealed that it could be
used for attaching small molecule tags to proteins and that Sortase is not a very robust
enzyme in vitro. A selection scheme has been devised to select for mutants of Sortase
with improved activity by displaying them on the surface of the phage. Using this
selection method and a suitable screening system, Sortase may be evolved into a more
active enzyme.
Phage display library displaying random peptides was scanned for good binders to the
active site mutant of SARS main protease 3CL. Using the affinity selection method in
phage display, multiple rounds of selection were carried out. A binding assay at the
end selection revealed the existence of weak binders to the protease. Several
candidate peptides that bound the mutant protease with low affinity were sequenced
and identified.
viii
LIST OF PUBLICATIONS
1. Girish, A., Chen, G.Y.J., and Yao,S.Q., (2006) “Protein engineering for
surface attachment”in Microarrays:pathways to drug discoverey. (P.predki,
ed.) CRC press.
2. Girish, A., Sun, H., Yeo, D.S.Y., Chen, G.Y.J., Chua, T.-K. and Yao, S.Q.
(2005), Site-specific immobilization of proteins in a microarray using intein-
mediated protein splicing. Bioorg. Med. Chem. Lett.,15, 2447-2451.
3. Zhu, Q., Girish, A., Chattopadhaya, S., and Yao, S.Q., (2004), Developing
novel activity-based fluorescent probes that target different classes of
proteases. Chem. Commun., 1512-1513.
ix
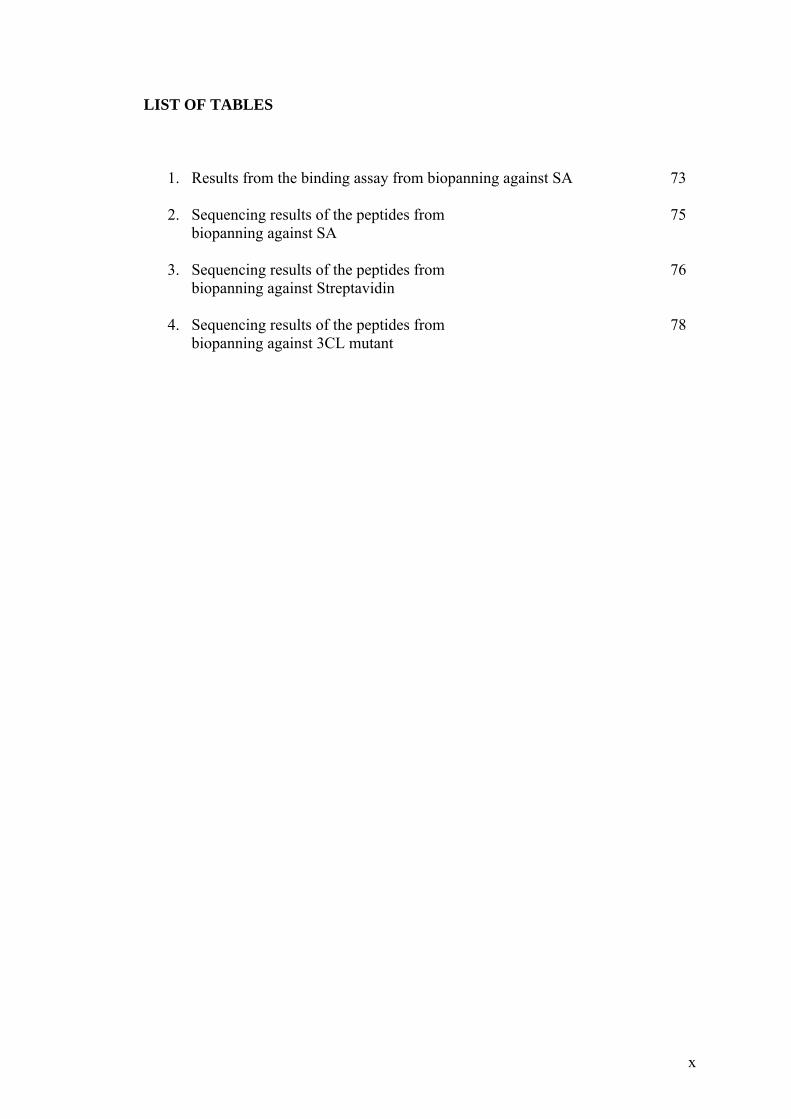
LIST OF TABLES
1. Results from the binding assay from biopanning against SA 73
2. Sequencing results of the peptides from 75 biopanning against SA
3. Sequencing results of the peptides from 76 biopanning against Streptavidin
4. Sequencing results of the peptides from 78 biopanning against 3CL mutant
x
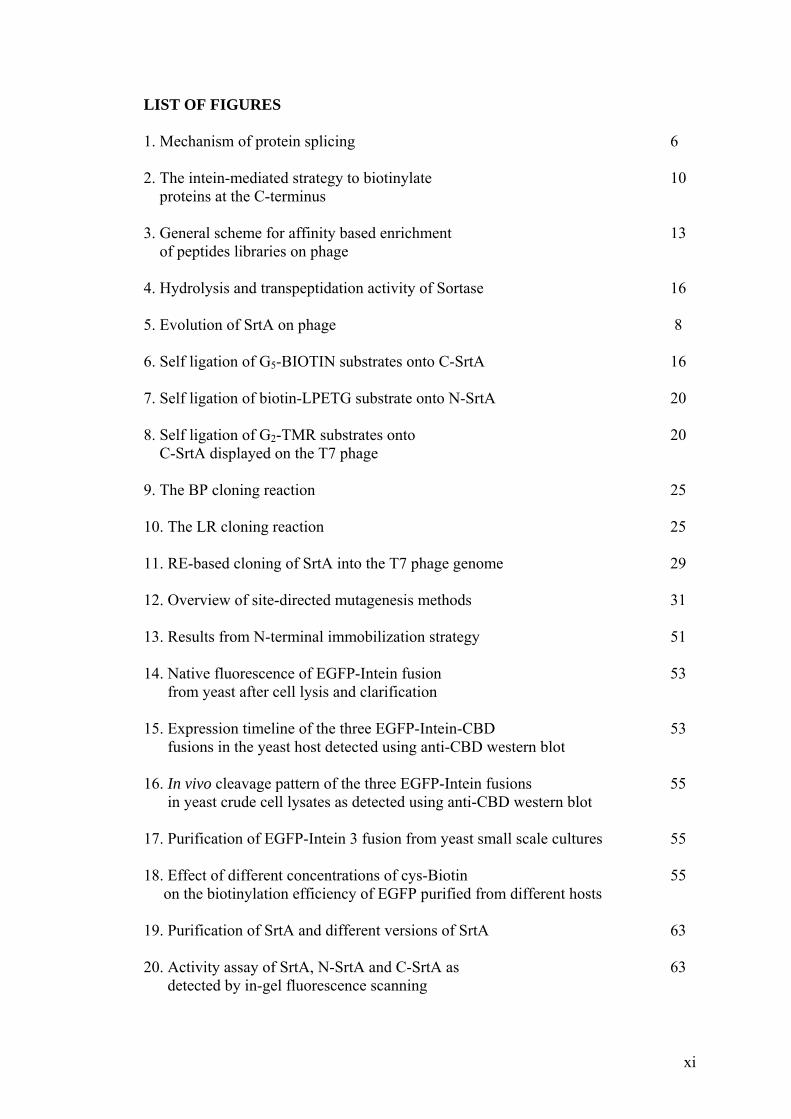
LIST OF FIGURES
1. Mechanism of protein splicing 6
2. The intein-mediated strategy to biotinylate 10 proteins at the C-terminus 3. General scheme for affinity based enrichment 13 of peptides libraries on phage 4. Hydrolysis and transpeptidation activity of Sortase 16
5. Evolution of SrtA on phage 8
6. Self ligation of G5-BIOTIN substrates onto C-SrtA 16
7. Self ligation of biotin-LPETG substrate onto N-SrtA 20
8. Self ligation of G2-TMR substrates onto 20 C-SrtA displayed on the T7 phage 9. The BP cloning reaction 25
10. The LR cloning reaction 25
11. RE-based cloning of SrtA into the T7 phage genome 29
12. Overview of site-directed mutagenesis methods 31
13. Results from N-terminal immobilization strategy 51
14. Native fluorescence of EGFP-Intein fusion 53 from yeast after cell lysis and clarification 15. Expression timeline of the three EGFP-Intein-CBD 53 fusions in the yeast host detected using anti-CBD western blot 16. In vivo cleavage pattern of the three EGFP-Intein fusions 55 in yeast crude cell lysates as detected using anti-CBD western blot 17. Purification of EGFP-Intein 3 fusion from yeast small scale cultures 55 18. Effect of different concentrations of cys-Biotin 55 on the biotinylation efficiency of EGFP purified from different hosts 19. Purification of SrtA and different versions of SrtA 63
20. Activity assay of SrtA, N-SrtA and C-SrtA as 63 detected by in-gel fluorescence scanning
xi
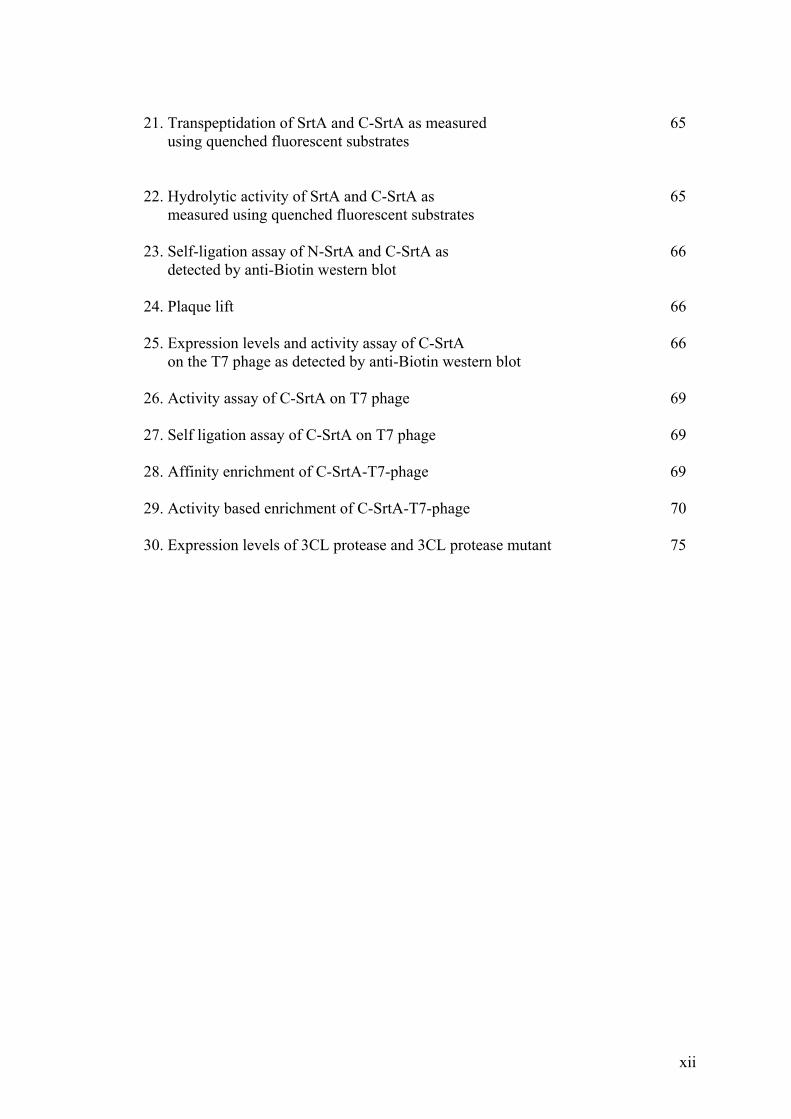
21. Transpeptidation of SrtA and C-SrtA as measured 65 using quenched fluorescent substrates
22. Hydrolytic activity of SrtA and C-SrtA as 65 measured using quenched fluorescent substrates 23. Self-ligation assay of N-SrtA and C-SrtA as 66 detected by anti-Biotin western blot 24. Plaque lift 66
25. Expression levels and activity assay of C-SrtA 66 on the T7 phage as detected by anti-Biotin western blot 26. Activity assay of C-SrtA on T7 phage 69
27. Self ligation assay of C-SrtA on T7 phage 69
28. Affinity enrichment of C-SrtA-T7-phage 69
29. Activity based enrichment of C-SrtA-T7-phage 70
30. Expression levels of 3CL protease and 3CL protease mutant 75
xii
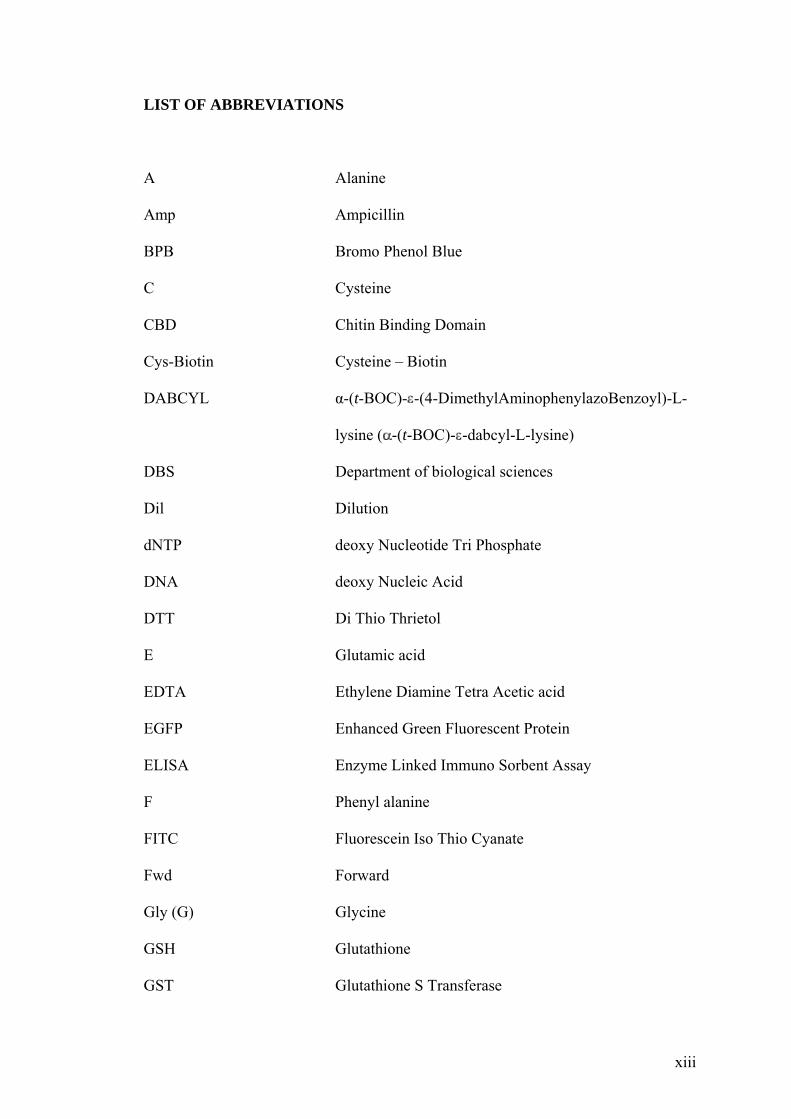
LIST OF ABBREVIATIONS
A Alanine
Amp Ampicillin
BPB Bromo Phenol Blue
C Cysteine
CBD Chitin Binding Domain
Cys-Biotin Cysteine – Biotin
DABCYL α-(t-BOC)- -(4-DimethylAminophenylazoBenzoyl)-L-
lysine ( -(t-BOC)- -dabcyl-L-lysine)
DBS Department of biological sciences
Dil Dilution
dNTP deoxy Nucleotide Tri Phosphate
DNA deoxy Nucleic Acid
DTT Di Thio Thrietol
E Glutamic acid
EDTA Ethylene Diamine Tetra Acetic acid
EGFP Enhanced Green Fluorescent Protein
ELISA Enzyme Linked Immuno Sorbent Assay
F Phenyl alanine
FITC Fluorescein Iso Thio Cyanate
Fwd Forward
Gly (G) Glycine
GSH Glutathione
GST Glutathione S Transferase
xiii
His (H) Histidine
I Isoleucine
IPTG IsoPropyl-beta-D-Thio-Galacto-pyranoside
kDa kilo Daltons
L Leucine
LB Luria Bertani
Min Minute(s)
MESNA Methyl Ethyl Sulfonic Acid
Ni-NTA Nickel- Nitrilo Tri Acetic acid
NUS National university of Singapore
NEB New England Biolabs
O/N Over Night (12 hours)
OD Optical Density
ORF Open Reading Frame
P Proline
PBST Phosphate Buffered Saline with Tween-20
PCR Polymerase Chain Reaction
pfu Plaque Forming Units
PEG Poly Ethylene Glycol
PVDF Poly Vinidiliene Di Fluoride
PAGE Polyacryl Amide Gel Electrophoresis
Q Asparagine
RT Room Temperature
RE Restriction Enzyme
Rev Reverse
xiv
RNA Ribo Nucleic Acid
S Serine
SARS Severe Acute Respiratory Syndrome
SrtA Sortase A
Sec Seconds
SDS Sodium Dodecyl Sulphate
SA Streptavidin
SH3 Src like Homology
TMR tetra methyl rhodamine
T Threonine
U Units
V Valine
W Tryptophan
X-Gal 5-bromo-4-chloro-3-indolyl- beta -D-galactopyranoside
Y Tyrosine
2XYT Rich growth media, see appendix for composition
6XHIS Poly Histidine (6 repeats of Histidine)
2-ME 2-Mercapto-Ethanol
3CL 3C like
xv

1. INTRODUCTION
1.1 Protein engineering
Proteins are the most important work horses in the cells; they serve myriad functions
and are also important structural determinants within cells. Ability to modulate and
engineer proteins serves as important tools to understand their structure and function
[1], it can also give rise to useful proteins that can fulfill biotechnological and
industrial applications [2]. The terms “Protein engineering” and “modulation” are
used in the following context throughout the thesis and are defined as, “Processes of
modifying the structure of proteins or introducing unnatural functionalities to create
tailor-made proteins serving useful applications”. Several methods that exist to
modify and engineer proteins can be broadly grouped into 2 different categories. (a)
Rational design and Protein evolution methods to create novel functions or improve
existing functions. (b) Enzyme-based methods to introduce unnatural but useful
functionalities.
1.1.1 Rational design and protein evolution to create novel functions or
improve existing functions.
Proteins as such are pretty robust inside cells, but their performance is typically
hampered outside natural environments and several proteins fail to behave well in
industrial applications [2, 3]. Traditionally the approach to study and design proteins
with improved or novel function has been through the genetic method of site directed
mutagenesis [1]. It requires detailed knowledge of protein structure and has the
limitation in that substitution of desired amino acids can be done only with their
natural amino counterparts. Proteins are complex entities and more often it is very
difficult to predict exactly what structural changes will give rise to the desired
1
function. These limitations can be overcome by taking the proteins through the
process of protein evolution [4], which mimics the natural process of evolution in the
laboratory test tube. The key points of the protein evolution methods are mutagenesis
and selection of the fittest. A repertoire of random mutants of a desired gene is created
using genetic methods like error prone PCR or gene shuffling and linked to a suitable
genetic coding system like phage display. The pool of mutants is then passed through
a selection/screening assay that select for the mutants with the desired function. The
genetic pool is culled periodically of undesirable mutations through a negative
selection if possible. The whole process of mutagenesis and selection/screen may then
be repeated until the proteins with desirable functions evolve [5]. Thus it is in essence
bringing natural evolution to the test tube.
1.1.2 Protein engineering : introducing artificial functionalities using enzyme-
mediated approaches
Several enzymes that can site specifically add on small molecule functionalities have
been exploited to modify proteins. Some of them include Inteins [6-11], Biotin ligases
[12], Sortase [13], Sfp phosphopantetheinyl transferase [14] and Amino Acyl - tRNA-
transferases [15-19]. Protein engineering methods which add on small molecule tags
site specifically have many applications. One such example is in the field of bio-
imaging, where by specifically adding on fluorescent tags onto proteins, one can study
protein dynamics, localization, cell movement and cell growth [20, 21]. Site-specific
modification of proteins has also found use in the field of microarrays, where adding
on tags like biotin to a protein allows it to be specifically immobilized onto an avidin-
coated surface [10, 11, 22].
2
1.1.3 The three different approaches to protein engineering and modulation
that were evaluated in this report
In this report, three different approaches to protein engineering and modulation were
evaluated. As one of the approaches to protein engineering, a strategy for the
immobilization of proteins site-specifically via the N-terminus onto the microarray
was developed. The chosen model proteins were cloned into a vector system that
facilitates the expression of the protein with an N-terminal intein fusion. An extra
cysteine residue was introduced at the junction of the intein and protein fusion. Upon
expression of the intein-protein fusion, intein splices out, leaving the protein with an
N-terminal cysteine. The proteins thus produced can then be applied onto thioester-
functionalized slides for uniform orientation. As a complementary approach, a system
to biotinylate the C-termini of proteins derived from yeast was set up. The expression
levels and the splicing patterns of three different intein fusion constructs were studied.
Optimal condition for biotinylation of a model protein was achieved and the
immobilization efficiency onto to an avidin microarray was evaluated. Once the
system was established it was foreseen that important enzymes present in the yeast
namely the kinases, phosphatases and proteases could be immobilized using this
versatile method to generate an enzyme array. The enzymes could then be studied in a
high throughput fashion using some of the available activity-based fluorescent probes
in our lab [23-26].
As an approach to protein engineering, a selection scheme for the evolution of
increased activity of SrtA on phage has been devised. SrtA is a transpeptidase, which
catalyzes the transfer of N-terminal glycine peptides to the sorting motif LPETG
found in proteins. Studies of SrtA revealed that it could be used for attaching small
3
molecule tags to proteins and that SrtA is not very robust in vitro. A selection scheme
has been devised to select for mutants of SrtA with improved activity by displaying
them on the surface of the phage. Using this selection method and a suitable screening
system, SrtA could be evolved into a more active enzyme.
Phage display library displaying random peptides was scanned for good binders to the
active site mutant of SARS main protease 3CL. Using the affinity selection method in
phage display, multiple rounds of selection were carried out. A binding assay at the
end of multiple rounds of selection revealed the existence of weak binders to the
protease. Several candidate peptides that bound the mutant protease with low affinity
were sequenced and identified. The subsequent sections of this chapter will introduce
some of the relevant topics in more detail.
1.2 Inteins
Inteins are naturally occurring in frame protein fusions that can self splice out,
ligating together the extein sequences of the gene in which they occur. They are very
similar to the group I self splicing introns which splice at the RNA level [27]. Inteins
since their first description in yeast Saccharomyces cerevisiae [28, 29], have now
been identified in all three kingdoms of life, as well as in bacteriophages. Many of the
inteins like the group I introns are mobile at the genetic level because they code for
homing endonucleases [27]. Upto 70% of the inteins identified are found in genes that
are related to DNA metabolism including DNA polymerases, helicases and gyrases
[27], which often are vital genes to the organism [30]. Although inteins have been
denoted as selfish genes, because no known function exists for many of them, some
experiments have suggested that they might hold regulatory roles in cells, and that
4
ancestral inteins might have had some function but they were lost during evolution
[27, 30].
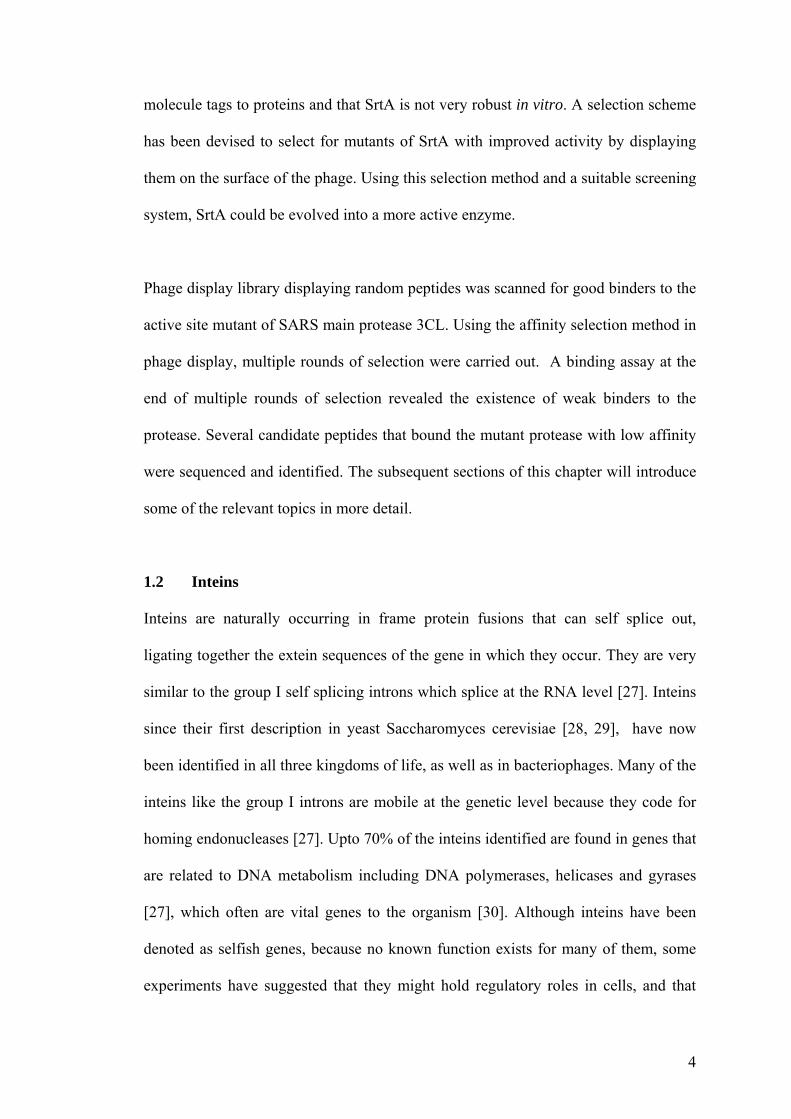
1.2.1 Mechanism of protein splicing
The mechanism of protein splicing has been well studied by many groups [31-33].
There are several key residues involved in protein splicing. The first amino acid of N-
intein (see Figure 1) is invariably a cysteine or a serine residue. The thiol or the
hydroxyl side chains of these amino acids undergo an acyl shift at the N-terminal
splice junction. The first residue of C-extein is invariably a cysteine or threonine or
serine. The side chains of these are equipped to attack the electrophilic N-terminal
splice junction, resulting in a branched intermediate. An asparagine residue precedes
the C-terminal splice junction, and helps in resolving the intermediate through
cyclization and succinimide formation. Eventually an S-N acyl shift releases the
spliced product.
1.2.2 Engineered inteins in biotechnological applications
Intein splicing does not require cofactors and the process of splicing is very efficient
[34]. The novelty of inteins, ever since their discovery, has been exploited for a
variety of biotechnological applications, ranging from synthesizing toxic proteins (by
expressing them in two parts in the cell and ligating them externally using the intein-
mediated method to give the native peptide bond [35]), cyclization of proteins and
peptides [36], attaching novel functionalities to proteins site specifically [6-11],
generation of novel protein combinations [37] and intein mediated genetic switches
5
Figure 1: The steps involved in the self splicing of inteins, see text for details. (Splicing mechanism taken from http://www.neb.com/neb/inteins.html)
6
[38, 39]. NEB has commercialized vectors that enable the cloning of desired genes
with an intein either at the N/C-terminus and a CBD tag. Upon expression and affinity
column purification, the protein of interest can be cleaved off by inducing intein
cleavage under some specified conditions [31]. The inteins that can splice out
conditionally were engineered from the native counterparts through a combination of
both rational engineering and directed evolution approaches [40-42]. These inteins
were designed such that they splice out only from either N/C-terminus, and they were
pH or thiol agent inducible [40-42].
1.2.3 The intein based method to tag proteins site-specifically
Protein microarray is emerging as a powerful tool in the high throughput analysis of
protein abundance and function [43-45]. One of the key concerns in the fabrication of
functional protein microarrays is the method of immobilization, which to some extent
determines whether or not a protein retains its function [46]. There are two obvious
choices, either random immobilization or methods that allow site-specific uniform
orientation. Both of these methods have been used to develop protein microarrays
[47]. In this report a strategy for the immobilization of proteins onto a microarray site
specifically via the N-terminus was developed. For the N-terminal immobilization,
the chosen model proteins were cloned onto a vector system that facilitates the
expression of the protein with an N-terminal intein fusion. An extra cysteine residue
was introduced at the junction of the intein and protein fusion. Upon expression of the
intein-protein fusion, intein splices out, leaving the protein with an N-terminal
cysteine [6]. N-terminal cysteine containing EGFP was produced in this manner and
successfully immobilized onto thioester glass surface. Also as a complementary
approach to the N-terminal immobilization, immobilizing proteins expressed from a
7
yeast host, via a C-terminus biotin moiety onto avidin-functionalized microarrays was
considered. Three different inteins available from NEB, were fused individually to the
C-terminus of the EGFP, and expressed in a suitable yeast expression system. The
expression levels and the in vivo cleavage pattern of the three inteins were analyzed.
One of the three inteins, the Sce VMA Intein was found to express better than the
other fusions and the in vivo cleavage of the fusion was minimal. Hence the Sce VMA
Intein fusion was chosen for further studies. Fusion to intein at the C-terminus allows
the production of thioester functionality at the C-terminus, which in turn can react
with the sulfhydryl moiety of the cysteine in cysteine-biotin, to give a C-terminal
biotinylated protein via a native peptide bond. Using this, a model protein EGFP was
biotinylated and the immobilization efficiency onto to an avidin microarray was
evaluated. Once the system was established it was foreseen that important enzymes
present in the yeast, namely the kinases, phosphatases and proteases, could be
immobilized in a high-throughput fashion using this method. Then they could be
studied in a parallel fashion using the available activity based fluorescent probes in
our lab [23-26].
1.3 Phage display
Bacteriophages are virus that feed on bacteria. They have a simple structure with their
nucleic acid genome surrounded by a coat of proteins [50]. There are two kinds of
bacteriophages, the lytic ones and the nonlytic ones [51]. For many years
bacteriophage genomes have traditionally been used as vehicles of gene transfer to
bacteria [51, 52]. The concept of phage display was introduced by George P Smith,
who came up with a method to display foreign peptides on the surface of the
bacteriophage M13, through a fusion to its coat protein Gene III [53]. Product of Gene
8
9
III resides on the tip of the filamentous bacteriophage and is involved in infection of
the host bacterium. He found that small peptides fused to the N-terminus of the Gene
III can be displayed on the phage tip without interference to its infective capacity
[53]. He called his method phage display and demonstrated its first application in
mapping epitopes of antigens [54]. Ever since, peptides and proteins have been
successfully displayed on phage and a collection of phage display vectors are now
commercially available [52].
Typically the protein/peptide of interest is cloned into either bacteriophage
genome/phagemids using traditional cloning methods. The most commonly used
phage is the M13 phage. There are two different genes that are typically used for the
display of peptides and proteins on M13. One is the gene III, this is present in up to 5
copies on the tip of the virion. Gene VIII is another available display protein system,
it is present in up to 2700 copies per virion. Due to steric limits only small peptides
are tolerated in the latter system. The Gene III system can tolerate proteins up to
100kDa [3], but the number of copies displayed on each virion should be limited as
the protein gets larger [55]. This is done by cloning the protein of interest into a
phagemid rather than into the phage genome itself, and then rescuing the phagemid (a
phagemid is a plasmid with phage origin of replication; when F+ cells, harboring such
phagemids are infected by a helper phage, the phagemid gets replicated from the
phage origin and packaged into the phage heads preferentially over the helper phage
genome) using helper phages (phages whose genomes contain impaired origin of
replications). When using the phagemid method to display proteins, depending on the
size of the protein and how well it is tolerated on the phage, the number of copies of
the displayed protein can vary from 0-5 per phage.
10
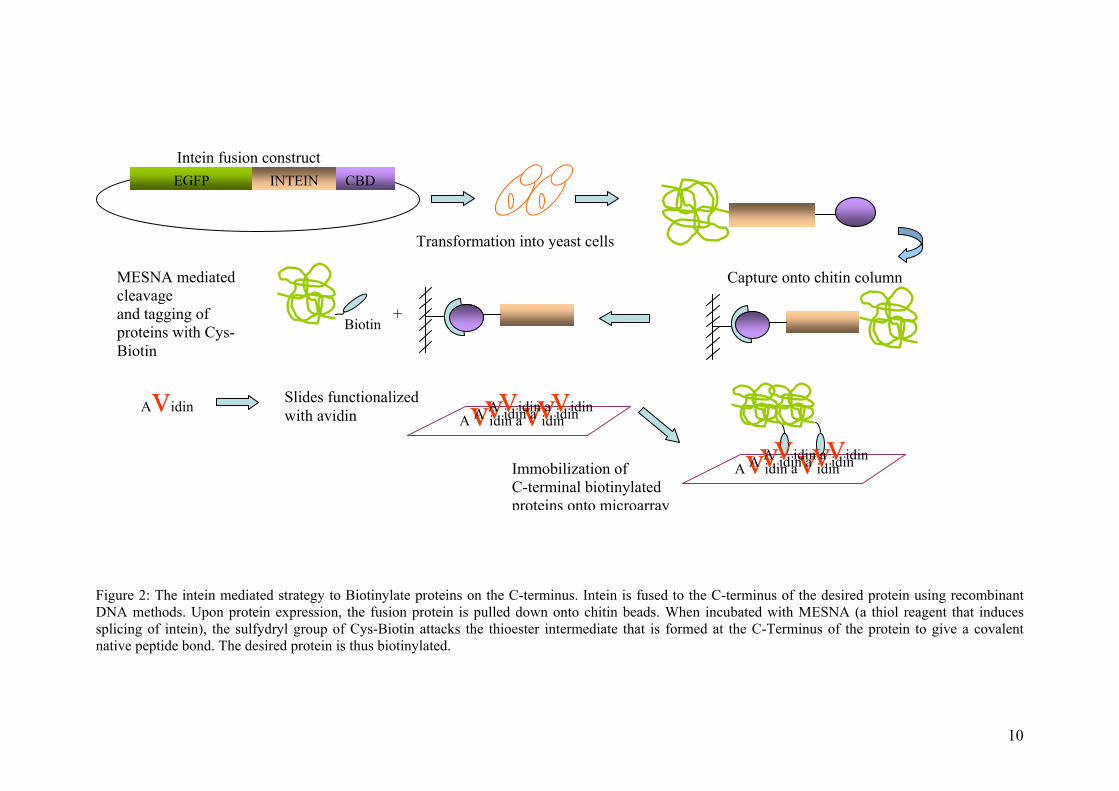
Figure 2: The intein mediated strategy to Biotinylate proteins on the C-terminus. Intein is fused to the C-terminus of the desired protein using recombinant DNA methods. Upon protein expression, the fusion protein is pulled down onto chitin beads. When incubated with MESNA (a thiol reagent that induces splicing of intein), the sulfydryl group of Cys-Biotin attacks the thioester intermediate that is formed at the C-Terminus of the protein to give a covalent native peptide bond. The desired protein is thus biotinylated.
MESNA mediated cleavage and tagging of proteins with Cys-Biotin
EGFP INTEIN CBD
Avidin avidin Avidin avidin Avidin avidin Avidin
Transformation into yeast cells
Capture onto chitin column
Slides functionalized with avidin
Immobilization of C-terminal biotinylated proteins onto microarray
Biotin
Intein fusion construct
Avidin avidin Avidin avidin Avidin avidin
+
1.3.1 Applications of phage display
Using the method described above, libraries of peptides or proteins can be displayed
on the phage giving rise to a number of applications [55]. The phage can be then
viewed as a huge bead with a protein/peptide of interest tethered to it. The genetic
information of the protein/peptide resides inside the phage and is retrievable any time
by a simple sequencing step. As such the phage then is a coded, amplifiable and
infinitely storable bead. In the affinity selection method, the protein of interest is
coated onto a solid surface and the phages bearing the random peptide libraries are
applied to it. After incubation, the non binders are washed off, and the binders are
eluted by nonspecific methods that disrupt protein-protein interaction (e.g. glycine at
pH2.2, the phages themselves are extremely robust and can withstand harsh chemical
conditions) or by the use of a known competing ligand (see Figure 3). Then the
binders are amplified and enriched, before going through another round of selection.
The selection rounds are repeated until significant binders emerge. The binders are
identified through DNA sequencing. Typically a consensus sequence emerges (a
group of binders with similar sequences).
To cite a few interesting examples, using the method of affinity selection, a number of
cloned SH3 domains were used to select ligands from a random peptide library. Upon
identification of the ligands, these were used to probe conventional cDNA libraries
for protein that bind to the identified ligands. In this manner 18 homologs of the SH3
domain were identified, several of them previously unknown [63-65]. A peptide
mimic of the natural protein hormone erythropoietin [66] has been identified using
this method. L-amino acid peptide ligands for the D-amino acid isoform of the SH3
11
12
domain have been selected. The D-version of the L-peptides, then are ligands for the
natural SH3 protein [67].
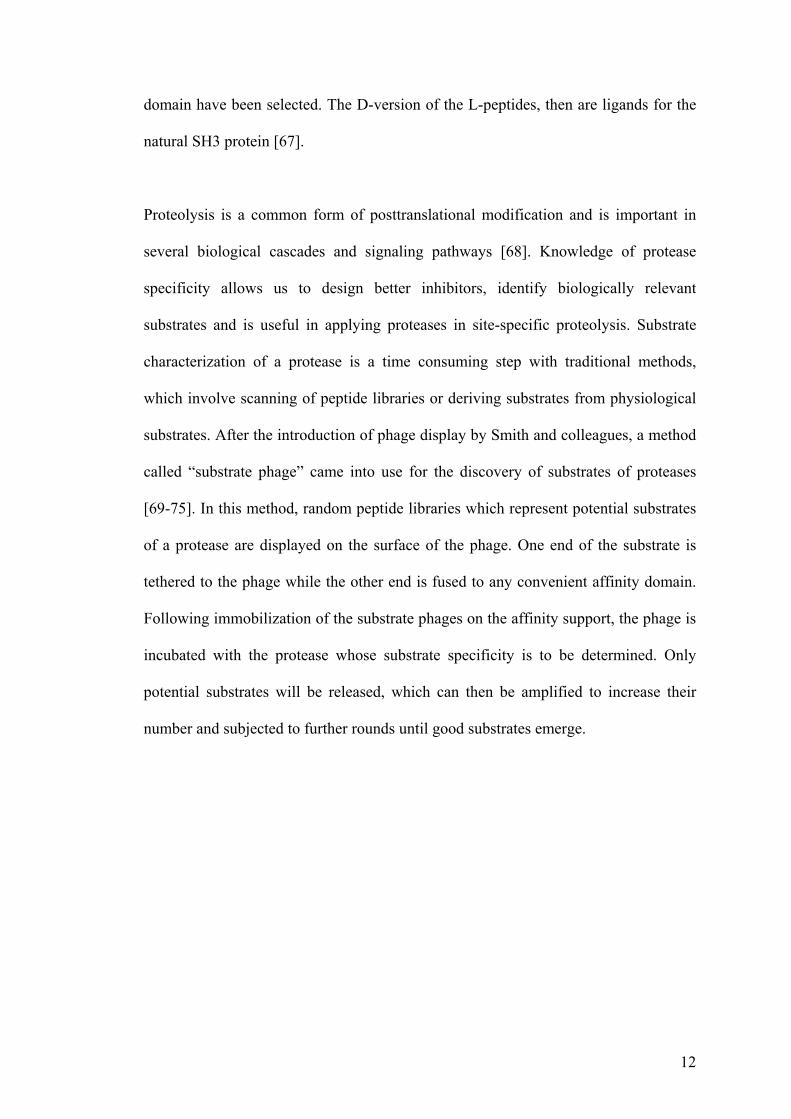
Proteolysis is a common form of posttranslational modification and is important in
several biological cascades and signaling pathways [68]. Knowledge of protease
specificity allows us to design better inhibitors, identify biologically relevant
substrates and is useful in applying proteases in site-specific proteolysis. Substrate
characterization of a protease is a time consuming step with traditional methods,
which involve scanning of peptide libraries or deriving substrates from physiological
substrates. After the introduction of phage display by Smith and colleagues, a method
called “substrate phage” came into use for the discovery of substrates of proteases
[69-75]. In this method, random peptide libraries which represent potential substrates
of a protease are displayed on the surface of the phage. One end of the substrate is
tethered to the phage while the other end is fused to any convenient affinity domain.
Following immobilization of the substrate phages on the affinity support, the phage is
incubated with the protease whose substrate specificity is to be determined. Only
potential substrates will be released, which can then be amplified to increase their
number and subjected to further rounds until good substrates emerge.

13
Figure 3: General scheme for affinity base
d enrichment of peptide libraries on phage.
Library of phages bearing peptides on the surface
Immobilized receptor
Incubation of the of phage with the receptor
Unbound phages are washed away
Bound phages are eluted using a known affinity ligand
Eluted phages are amplified by infection with a host bacterium
The process is repeated until dominant binders emerge
Affinity based binding of ligand phages to the receptor
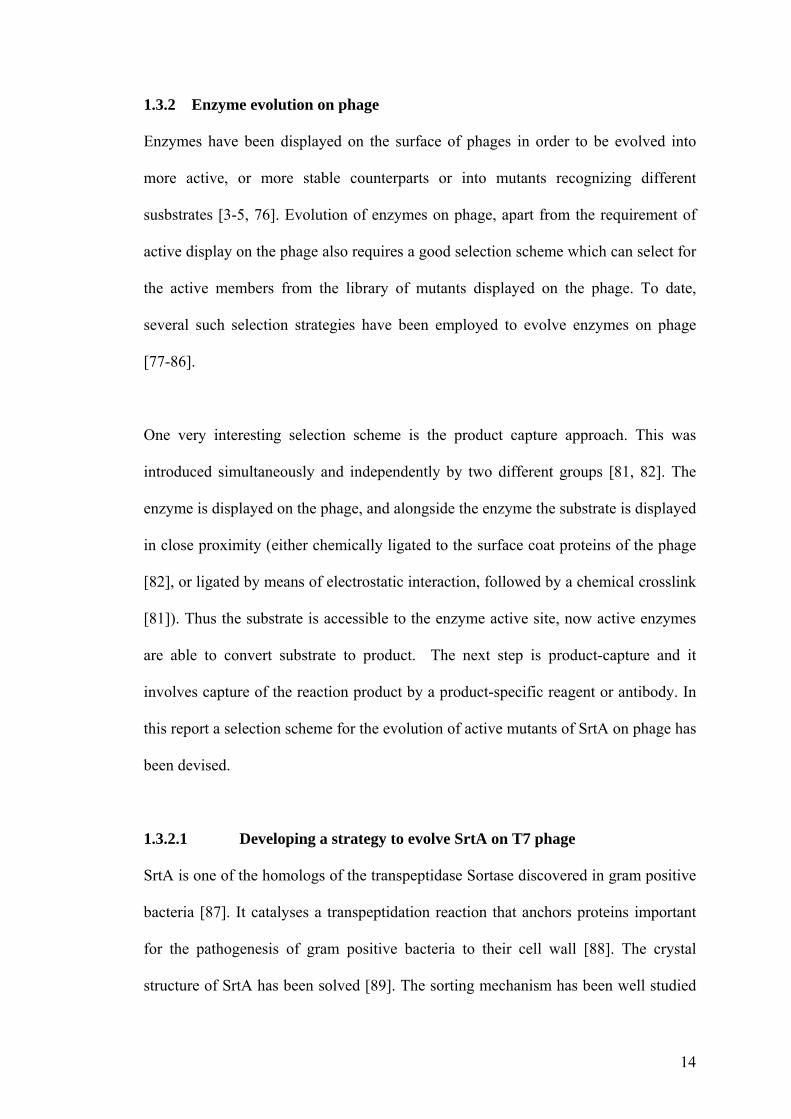
1.3.2 Enzyme evolution on phage
Enzymes have been displayed on the surface of phages in order to be evolved into
more active, or more stable counterparts or into mutants recognizing different
susbstrates [3-5, 76]. Evolution of enzymes on phage, apart from the requirement of
active display on the phage also requires a good selection scheme which can select for
the active members from the library of mutants displayed on the phage. To date,
several such selection strategies have been employed to evolve enzymes on phage
[77-86].
One very interesting selection scheme is the product capture approach. This was
introduced simultaneously and independently by two different groups [81, 82]. The
enzyme is displayed on the phage, and alongside the enzyme the substrate is displayed
in close proximity (either chemically ligated to the surface coat proteins of the phage
[82], or ligated by means of electrostatic interaction, followed by a chemical crosslink
[81]). Thus the substrate is accessible to the enzyme active site, now active enzymes
are able to convert substrate to product. The next step is product-capture and it
involves capture of the reaction product by a product-specific reagent or antibody. In
this report a selection scheme for the evolution of active mutants of SrtA on phage has
been devised.
1.3.2.1 Developing a strategy to evolve SrtA on T7 phage
SrtA is one of the homologs of the transpeptidase Sortase discovered in gram positive
bacteria [87]. It catalyses a transpeptidation reaction that anchors proteins important
for the pathogenesis of gram positive bacteria to their cell wall [88]. The crystal
structure of SrtA has been solved [89]. The sorting mechanism has been well studied
14
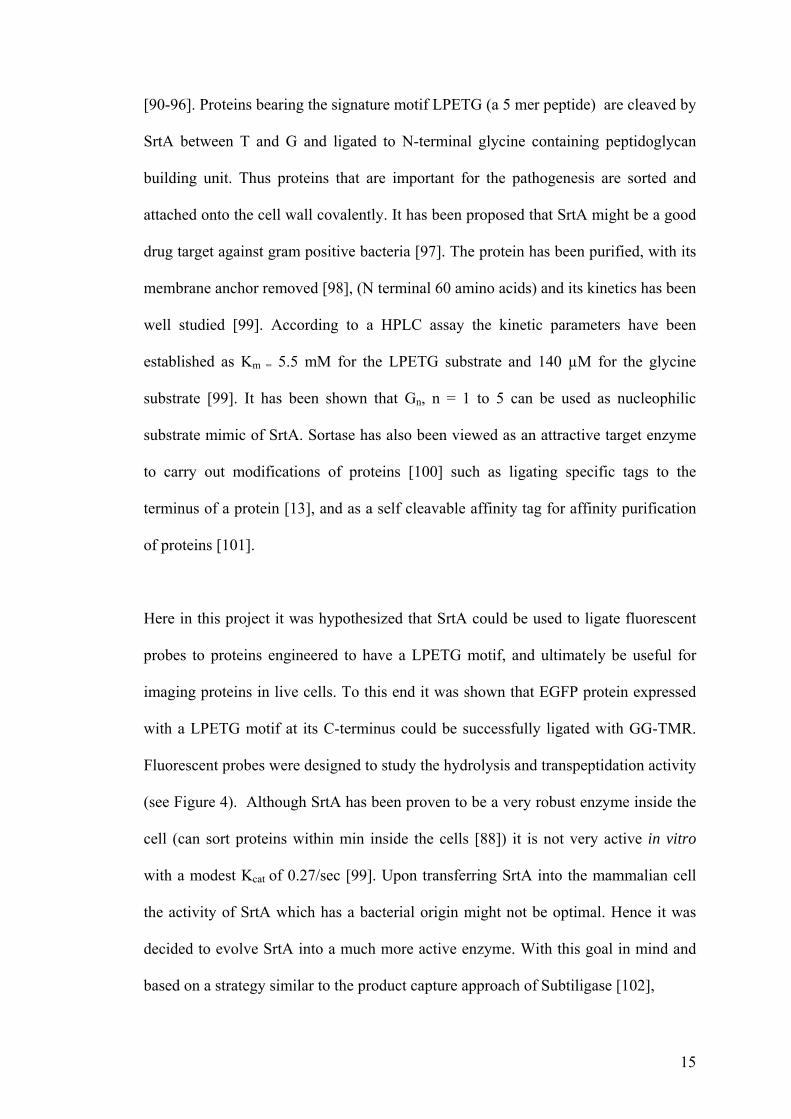
[90-96]. Proteins bearing the signature motif LPETG (a 5 mer peptide) are cleaved by
SrtA between T and G and ligated to N-terminal glycine containing peptidoglycan
building unit. Thus proteins that are important for the pathogenesis are sorted and
attached onto the cell wall covalently. It has been proposed that SrtA might be a good
drug target against gram positive bacteria [97]. The protein has been purified, with its
membrane anchor removed [98], (N terminal 60 amino acids) and its kinetics has been
well studied [99]. According to a HPLC assay the kinetic parameters have been
established as Km = 5.5 mM for the LPETG substrate and 140 µM for the glycine
substrate [99]. It has been shown that Gn, n = 1 to 5 can be used as nucleophilic
substrate mimic of SrtA. Sortase has also been viewed as an attractive target enzyme
to carry out modifications of proteins [100] such as ligating specific tags to the
terminus of a protein [13], and as a self cleavable affinity tag for affinity purification
of proteins [101].
Here in this project it was hypothesized that SrtA could be used to ligate fluorescent
probes to proteins engineered to have a LPETG motif, and ultimately be useful for
imaging proteins in live cells. To this end it was shown that EGFP protein expressed
with a LPETG motif at its C-terminus could be successfully ligated with GG-TMR.
Fluorescent probes were designed to study the hydrolysis and transpeptidation activity
(see Figure 4). Although SrtA has been proven to be a very robust enzyme inside the
cell (can sort proteins within min inside the cells [88]) it is not very active in vitro
with a modest Kcat of 0.27/sec [99]. Upon transferring SrtA into the mammalian cell
the activity of SrtA which has a bacterial origin might not be optimal. Hence it was
decided to evolve SrtA into a much more active enzyme. With this goal in mind and
based on a strategy similar to the product capture approach of Subtiligase [102],
15
Transpeptidation
GG
H2O
Hydrolysis Quenched fluorescent substrate A
Q
+
L A
PE
T
L A
PE
T
G +
GG
G
Q
SH
T E
P L
G
A-ACC Q- DABCYL
NH2 COOH
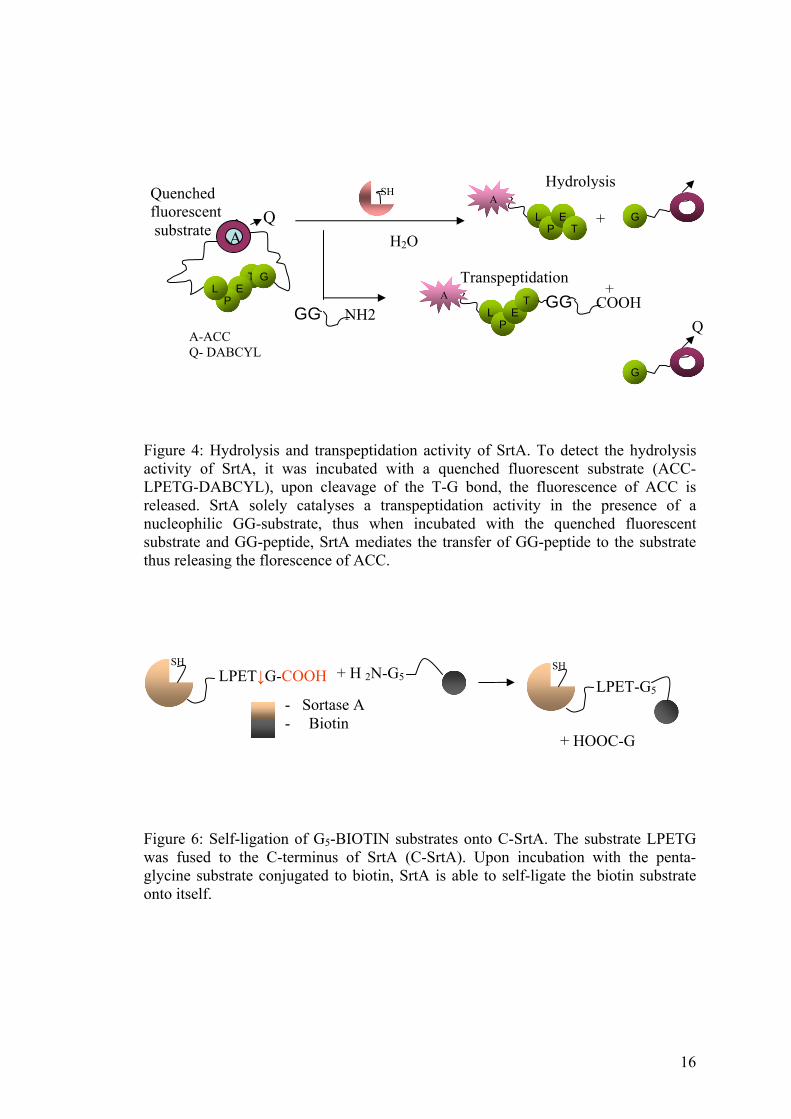
Figure 4: Hydrolysis and transpeptidation activity of SrtA. To detect the hydrolysis activity of SrtA, it was incubated with a quenched fluorescent substrate (ACC-LPETG-DABCYL), upon cleavage of the T-G bond, the fluorescence of ACC is released. SrtA solely catalyses a transpeptidation activity in the presence of a nucleophilic GG-substrate, thus when incubated with the quenched fluorescent substrate and GG-peptide, SrtA mediates the transfer of GG-peptide to the substrate thus releasing the florescence of ACC.
SH
LPET↓G-COOH + H 2N-G5
+ HOOC-G
SH
LPET-G5 - Sortase A
- Biotin
Figure 6: Self-ligation of G5-BIOTIN substrates onto C-SrtA. The substrate LPETG was fused to the C-terminus of SrtA (C-SrtA). Upon incubation with the penta-glycine substrate conjugated to biotin, SrtA is able to self-ligate the biotin substrate onto itself.
16
17
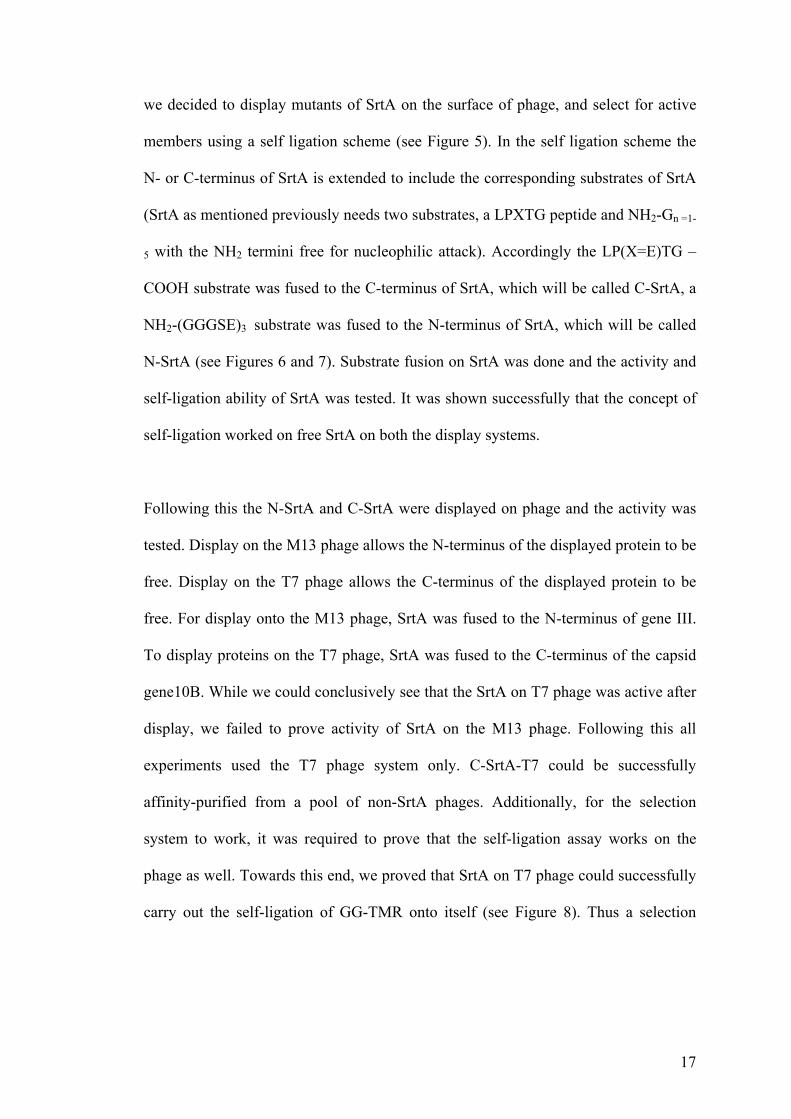
we decided to display mutants of SrtA on the surface of phage, and select for active
members using a self ligation scheme (see Figure 5). In the self ligation scheme the
N- or C-terminus of SrtA is extended to include the corresponding substrates of SrtA
(SrtA as mentioned previously needs two substrates, a LPXTG peptide and NH2-Gn =1-
5 with the NH2 termini free for nucleophilic attack). Accordingly the LP(X=E)TG –
COOH substrate was fused to the C-terminus of SrtA, which will be called C-SrtA, a
NH2-(GGGSE)3 substrate was fused to the N-terminus of SrtA, which will be called
N-SrtA (see Figures 6 and 7). Substrate fusion on SrtA was done and the activity and
self-ligation ability of SrtA was tested. It was shown successfully that the concept of
self-ligation worked on free SrtA on both the display systems.
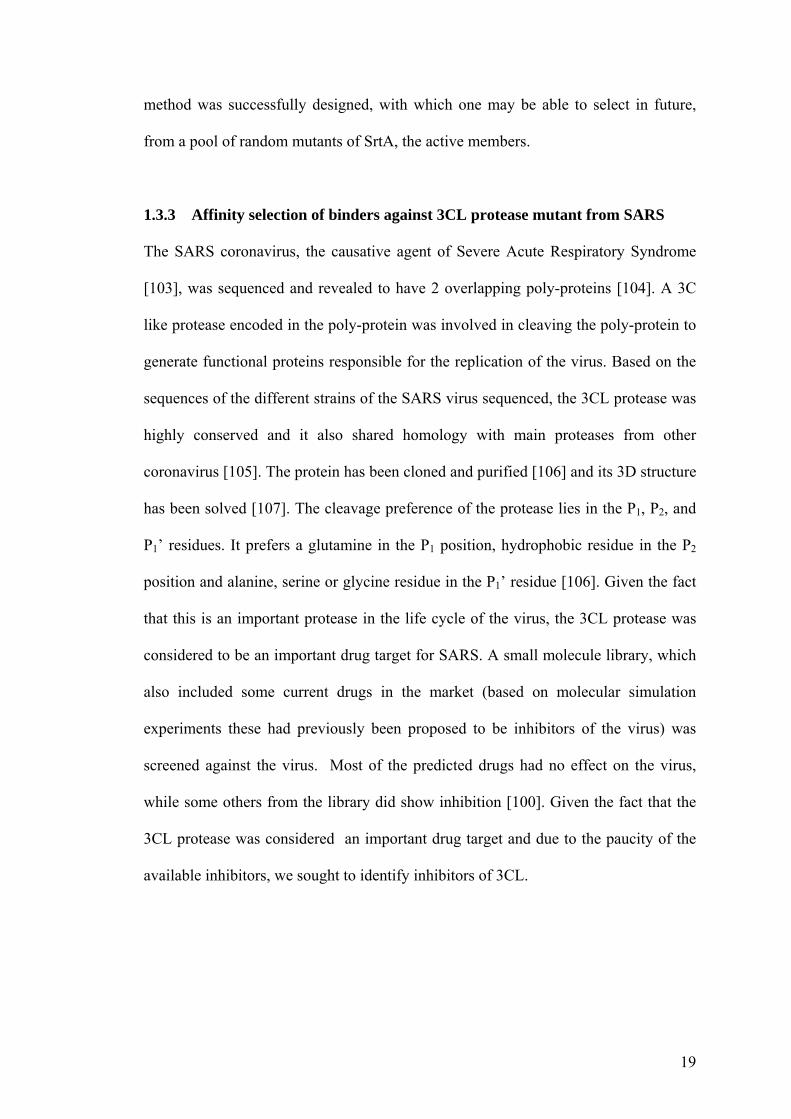
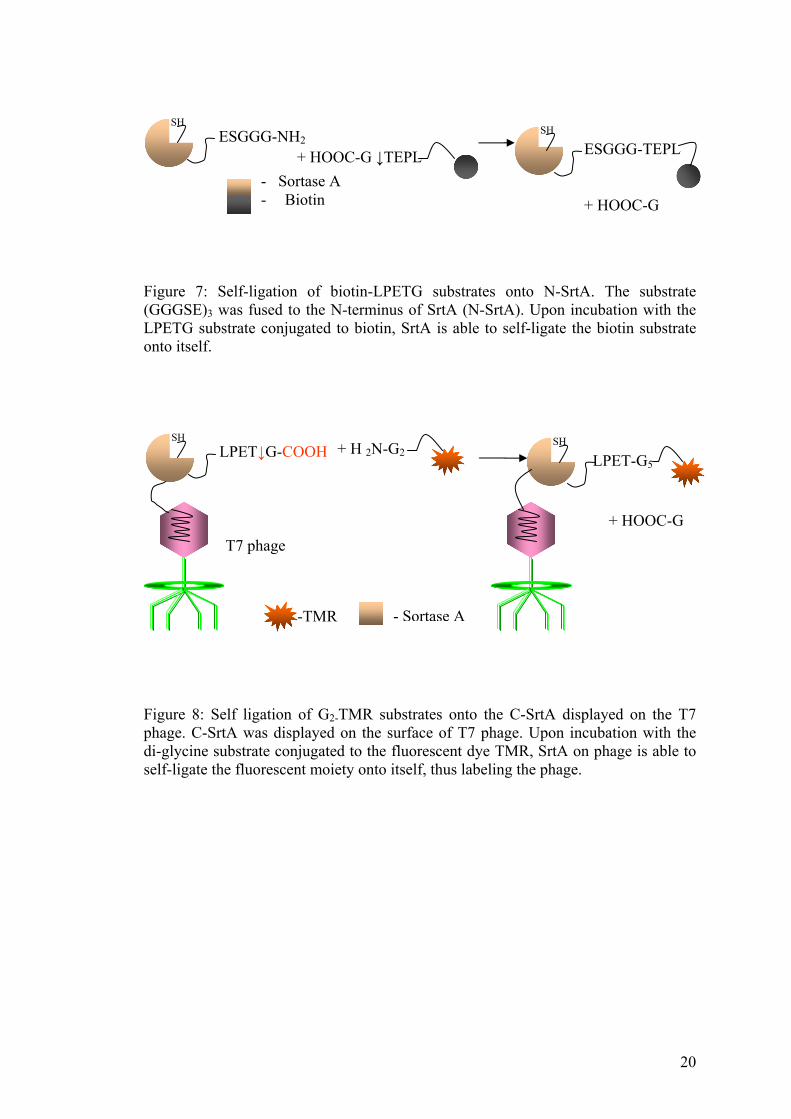
Following this the N-SrtA and C-SrtA were displayed on phage and the activity was
tested. Display on the M13 phage allows the N-terminus of the displayed protein to be
free. Display on the T7 phage allows the C-terminus of the displayed protein to be
free. For display onto the M13 phage, SrtA was fused to the N-terminus of gene III.
To display proteins on the T7 phage, SrtA was fused to the C-terminus of the capsid
gene10B. While we could conclusively see that the SrtA on T7 phage was active after
display, we failed to prove activity of SrtA on the M13 phage. Following this all
experiments used the T7 phage system only. C-SrtA-T7 could be successfully
affinity-purified from a pool of non-SrtA phages. Additionally, for the selection
system to work, it was required to prove that the self-ligation assay works on the
phage as well. Towards this end, we proved that SrtA on T7 phage could successfully
carry out the self-ligation of GG-TMR onto itself (see Figure 8). Thus a selection
18
Figure 5: Evolution of SrtA on phage.
The whole process is repeated until the desired activity is obtained
Displayed on phage
Active members ligate substrate onto themselves
A mutant library of Sortase is made CAPSID SORTASE LPXTG
6X-HIS
Inactive members are pulled down via the HIS tag
Incubated with GG-Biotin bound SA beads
The active members are amplified
TE
PL
G
GG
GG G
G
G
T GE
PLT
E P
L G
Ni-2+
T G E
P L
method was successfully designed, with which one may be able to select in future,
from a pool of random mutants of SrtA, the active members.
1.3.3 Affinity selection of binders against 3CL protease mutant from SARS
The SARS coronavirus, the causative agent of Severe Acute Respiratory Syndrome
[103], was sequenced and revealed to have 2 overlapping poly-proteins [104]. A 3C
like protease encoded in the poly-protein was involved in cleaving the poly-protein to
generate functional proteins responsible for the replication of the virus. Based on the
sequences of the different strains of the SARS virus sequenced, the 3CL protease was
highly conserved and it also shared homology with main proteases from other
coronavirus [105]. The protein has been cloned and purified [106] and its 3D structure
has been solved [107]. The cleavage preference of the protease lies in the P1, P2, and
P1’ residues. It prefers a glutamine in the P1 position, hydrophobic residue in the P2
position and alanine, serine or glycine residue in the P1’ residue [106]. Given the fact
that this is an important protease in the life cycle of the virus, the 3CL protease was
considered to be an important drug target for SARS. A small molecule library, which
also included some current drugs in the market (based on molecular simulation
experiments these had previously been proposed to be inhibitors of the virus) was
screened against the virus. Most of the predicted drugs had no effect on the virus,
while some others from the library did show inhibition [100]. Given the fact that the
3CL protease was considered an important drug target and due to the paucity of the
available inhibitors, we sought to identify inhibitors of 3CL.
19
SH
ESGGG-NH2
+ HOOC-G ↓TEPL
+ HOOC-G
SH
ESGGG-TEPL
- Sortase A - Biotin
Figure 7: Self-ligation of biotin-LPETG substrates onto N-SrtA. The substrate (GGGSE)3 was fused to the N-terminus of SrtA (N-SrtA). Upon incubation with the LPETG substrate conjugated to biotin, SrtA is able to self-ligate the biotin substrate onto itself.
SH
LPET↓G-COOH + H 2N-G2
+ HOOC-G
SH
LPET-G5
T7 phage
-TMR - Sortase A
Figure 8: Self ligation of G2-TMR substrates onto the C-SrtA displayed on the T7 phage. C-SrtA was displayed on the surface of T7 phage. Upon incubation with the di-glycine substrate conjugated to the fluorescent dye TMR, SrtA on phage is able to self-ligate the fluorescent moiety onto itself, thus labeling the phage.
20
It was decided to mutate the active site of the enzyme 3CL and select for good binders
from a commercially available peptide phage display library. While incubation with
the active enzyme will cleave most of the binders, incubation with the mutant will
enable isolation of binders. Upon emergence of a strong binder a group of similar
peptides may then be designed, synthesized and the inhibition of the protease can be
studied in solution. In this report, a commercially available 7 amino acid peptide
library on the phage was used to screen against the active site mutant of the 3CL
protease in efforts to identify good peptide binders to the enzyme (see Figure 3). All
assay procedures was optimized using Streptavidin as a model protein. Using the
affinity selection method, multiple rounds of the library selection were carried out.
This was followed by a binding assay to select for good binders. Several low affinity
binders were identified and these were characterized by DNA sequencing.
21
2. MATERIALS AND METHODS 2.1 Making chemically competent bacteria for transformation
The desired bacterial strain was grown until OD600 reached 0.5 and chilled on ice for
15 min. The cells were harvested at 1681g, 4 °C, for 10 min. 0.5 volumes (of the
starting volume of culture) buffer A was added and the pellet was resuspended by
pipetting up and down. After 15 min of incubation on ice, the cells were harvested
again as above. The pellet was resuspended in 0.04 volumes (of the starting volume of
culture) of buffer B, incubated on ice for 15 min. The cells were then aliquoted into
100 µL aliquots, frozen by placing in liquid nitrogen, and placed immediately at -
80°C. Competency in the orders of 107/µg of plasmid DNA was obtained using this
protocol. For all buffer compositions see appendix A.
2.2 Transformation of plasmids/ligated vectors into chemically competent
cells
The competent cells were thawed on ice. The DNA (plasmid/ligated vector) was
added into the competent cells (the volume of the DNA sample did not exceed 5 % of
the volume of the competent cells). Typically 100 µl of competent cells was used per
transformation reaction. The tube was gently tapped to allow mixing of the DNA with
the cells. This mixture was then incubated for 30 min on ice. A heat shock at 42 °C
was given to the cells, for 45 sec. LB media was added (the volume of the mixture
was topped up to 500µL with LB) and the cells then incubated at 37 °C, 250 rpm, for
1 hr (for the recovery of the cells from the heat shock and expression of the antibiotic
resistance genes). Following this, the cells were either split and plated (100 µl and
400 µl) or all 500 µl was plated, based on the number of colonies expected, on the
22
appropriate LB/antibiotic plates, left to grow O/N at 37 °C until colonies were visible.
2.3 Transformation of yeast cells
The yeast strain InvSC1 (INVITROGEN) was used to make competent cells using the
S.c. EasyComp. Kit™ obtained from Invitrogen. The preparation of the competent
cells and transformation was done according to the company protocol.
2.4 PCR All PCR’s in this thesis, unless otherwise stated, contained the following, in the PCR
master mix: 0.2 mM dNTP mixture, 10-50 ng of template DNA, 0.1 µM of each
primer and 2.5 U DNA polymerase* in the corresponding polymerase buffer. The
PCR program consisted of the following, 15 min , 95 °C; 29 cycles of 30 sec, 95 °C,
X ŧ sec, X° ŧ C, X ŧ min, 72 °C; with a final 10 min 72 °C extension. For primers used
in various cloning experiments please refer to Cloning Table, Appendix B. *Taq
polymerase (Promega) was used for screening (e.g. colony PCR) and optimizing PCR
conditions. *Hot Star Taq polymerase (QIAGEN) was used when cloning was
intended. *Pwo polymerase (Roche) was used when full length amplification of
plasmid DNA was desired. ŧAnnealing temperature was typically set 5 °C less than the
lowest Tm of the two primers; ŧannealing time varied in between 30 sec to 1 min, and
ŧtime of extension was 1kB/min for Taq polymerase. All PCRs were performed in the
PTC-225, Peltier gradient thermal cycler (MJ research).
23
2.5 Cloning
2.5.1 TA cloning
The pCR®2.1-TOPO® ( Invitrogen) vector was used for all TA cloning procedures.
After PCR amplification of the desired gene, an agarose gel was run to check the
yields. If the yield of the PCR product was acceptable (20-40 ng/µL) a 1/3rd reaction
volume of that recommended by the company protocol was set up and found to be
sufficient to give significant number of colonies. Typically 1.33 µL of the PCR
product was combined with 0.33 µL of the salt solution and 0.33 µL of the TOPO
vector, incubated at RT for 30 min. Following incubation the entire reaction mix was
transformed into chemically competent TOP10 cells (Invitrogen) and plated onto X-
Gal/LB/Amp plates. Blue colonies are non recombinants and the white ones are
recombinants.
2.5.2 Gateway cloning To clone genes into gateway destination vectors, primers were designed that flank the
gene of interest, and also carry the necessary recombination sites (AttB) required for
the recombination reaction. See Cloning table, Appendix B, for all primers. After the
production of the AttB-PCR products, a BP cloning was set up. Normally 1/8th of the
reaction volume recommended by the manufacturer (Invitrogen) was found to be
sufficient for a BP reaction (see Figure 9). A 1/8th BP reaction typically contained 5-
15 fmol of the attB PCR product, pDONR™ vector (pDONOR201) ~20 ng, 0.5 µL -1
µL of the BP Clonase™ mix, 0.5 µL of the 5 X reaction buffer and TE (10 mM Tris
and 1 mM EDTA, pH 8) to 4 µL. The reaction mix was incubated at 25 °C for 12 hrs.
At the end 0.25 µl of Proteinase K solution was added and the incubation was
24
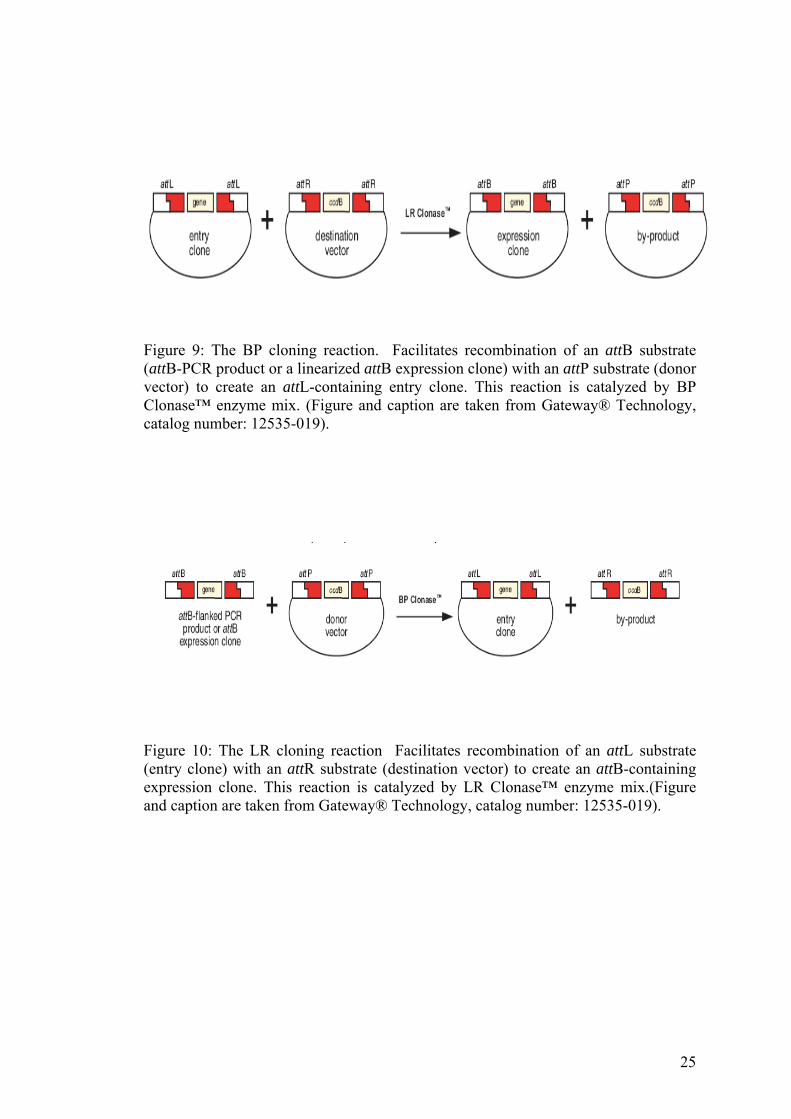
Figure 9: The BP cloning reaction. Facilitates recombination of an attB substrate (attB-PCR product or a linearized attB expression clone) with an attP substrate (donor vector) to create an attL-containing entry clone. This reaction is catalyzed by BP Clonase™ enzyme mix. (Figure and caption are taken from Gateway® Technology, catalog number: 12535-019).
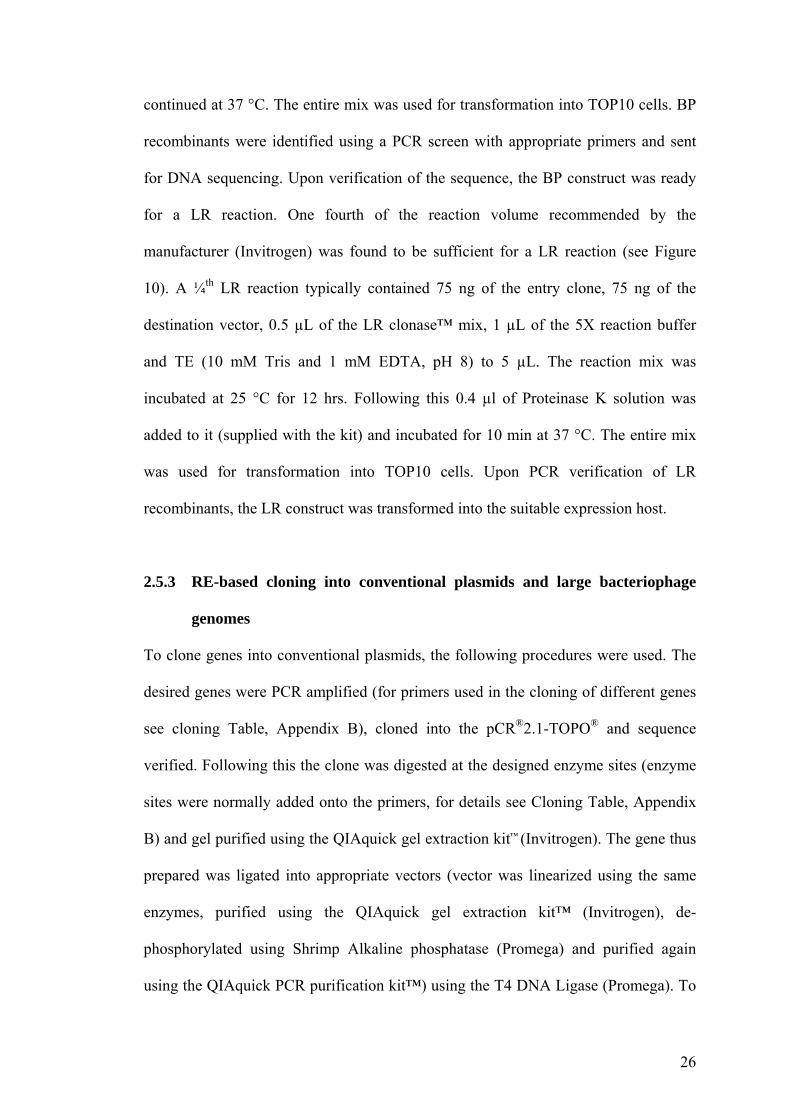
Figure 10: The LR cloning reaction Facilitates recombination of an attL substrate (entry clone) with an attR substrate (destination vector) to create an attB-containing expression clone. This reaction is catalyzed by LR Clonase™ enzyme mix.(Figure and caption are taken from Gateway® Technology, catalog number: 12535-019).
25
continued at 37 °C. The entire mix was used for transformation into TOP10 cells. BP
recombinants were identified using a PCR screen with appropriate primers and sent
for DNA sequencing. Upon verification of the sequence, the BP construct was ready
for a LR reaction. One fourth of the reaction volume recommended by the
manufacturer (Invitrogen) was found to be sufficient for a LR reaction (see Figure
10). A ¼th LR reaction typically contained 75 ng of the entry clone, 75 ng of the
destination vector, 0.5 µL of the LR clonase™ mix, 1 µL of the 5X reaction buffer
and TE (10 mM Tris and 1 mM EDTA, pH 8) to 5 µL. The reaction mix was
incubated at 25 °C for 12 hrs. Following this 0.4 µl of Proteinase K solution was
added to it (supplied with the kit) and incubated for 10 min at 37 °C. The entire mix
was used for transformation into TOP10 cells. Upon PCR verification of LR
recombinants, the LR construct was transformed into the suitable expression host.
2.5.3 RE-based cloning into conventional plasmids and large bacteriophage
genomes
To clone genes into conventional plasmids, the following procedures were used. The
desired genes were PCR amplified (for primers used in the cloning of different genes
see cloning Table, Appendix B), cloned into the pCR®2.1-TOPO® and sequence
verified. Following this the clone was digested at the designed enzyme sites (enzyme
sites were normally added onto the primers, for details see Cloning Table, Appendix
B) and gel purified using the QIAquick gel extraction kit™ (Invitrogen). The gene thus
prepared was ligated into appropriate vectors (vector was linearized using the same
enzymes, purified using the QIAquick gel extraction kit™ (Invitrogen), de-
phosphorylated using Shrimp Alkaline phosphatase (Promega) and purified again
using the QIAquick PCR purification kit™) using the T4 DNA Ligase (Promega). To
26
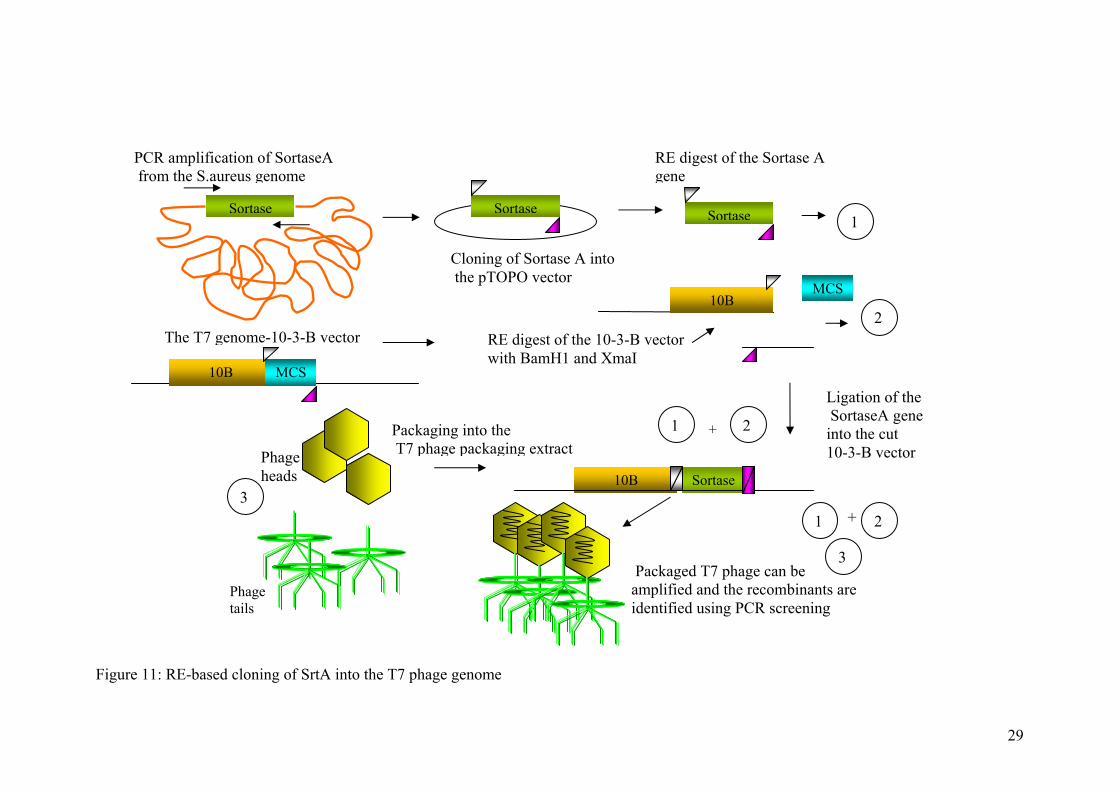
clone into huge bacteriophage genomes, the procedures for preparation of the insert
gene remained the same as above (see Figure 11). The 10-3-B T7 DNA was extracted
as per the protocol from the Lambda Mini purification kit (Qiagen). Buffer L1 from
the kit contained RNAse and DNAse, which were found to degrade in a few months
after the kit was opened. Because of this the extracted DNA was found to contain
huge smears when run on the gel to check for purity. Addition of RNAase (0.3 mg/10
mL lysate) and DNAase (90 µg/10 mL lysate) to the clarified lysate before incubation
at 37 °C with buffer L1 (Step 1 of the protocol), and also an additional proteinase K
treatment (0.2 mg/mL) during step 6, solved this problem. While the digestion of the
T7 vector DNA followed conventional restriction enzyme digestion procedures,
purification of large fragments of DNA (greater than 10 kB, e.g., the 37 kB, 10-3-B
vector from Novagen) using the regular commercial gel/ PCR purification kits was
extremely inefficient. Hence several other alternatives were considered. The only
purification system that has given the highest yields is Agarase (available from
several sellers, NEB, Fermentas etc...) enzyme digestion of the agarose gel (efficient ,
greater than 90% yields), followed by ethanol precipitation of the DNA. But it was
found that packaging (see Section 2.16.1) of the ligated DNA into the T7 packaging
extract (Novagen) is severely impaired when the DNA was purified using agarase
(presumably the carbohydrate moieties that are left over from digestion of the agarase
gel, precipitates during ethanol precipitation and affects the packaging reaction).
Yields upto 30% was obtained after gel purification of large DNA using the QiaExII
beads from Qiagen. But for regular cloning purposes, when purification was intended,
a simple ethanol precipitation of DNA [52] was sufficient. The small DNA fragment
resulting from the digestion of the vector will not be precipitated very efficiently, and
not interfere with the cloning. Since large DNA fragments are susceptible to shearing
27
28
from vigorous pipetting, when possible large bore tips and gentle pipetting was used.
Separation of large fragments of DNA (the 20 kB and the 17 kB fragment obtained
after digestion of 10-3-B) was done by running the fragments in a 0.4 % agarase gel,
at 15 V, for greater than 6 hours up to O/N. For further information on the different
genes that were cloned and the different vector back bones used please refer to
Cloning Table, Appendix B.
2.6 Sequencing of genes
All genes were sequenced using the ½ reaction recommended by the ABI prism
manual. BIG dye V3.1 (ABI), was used and the genes were sequenced using the ABI
3100A sequencer. A typical sequencing PCR mix contained the following, 100-150
ng of Template DNA, 4 µL of the BIG dye reaction mix (with polymerase and
ddNTPs) 3.2 pmoles of each primer, 2 µL of the 5X reaction buffer in a total of 20 µL
reaction volume, and subjected to the following PCR program, 24 cycles of 96 °C, 30
sec; 50 °C, 15 sec; 60 °C, 4 min.
2.7 Site directed mutagenesis of genes
Site directed mutagenesis of genes was carried out by designing the mutation
(typically one to two base pair substitutions) into a forward primer that flanks the
mutation by 20-25 base pairs on either side of the mismatch. The reverse primer was
the exact complement of the forward primer. PCR of the whole plasmid was then
carried out using special long half-life high-fidelity polymerases. The mutations were
29
Figure 11: R
E-based cloning of SrtA into the T7 phage genome
Sortase Sortase Sortase
10B MCS
10B MCS
10B Sortase
Phage tails
PCR amplification of SortaseA from the S.aureus genome
Cloning of Sortase A into the pTOPO vector
RE digest of the Sortase A gene
The T7 RE digest of the 10-3-B vector with BamH1 and XmaI
Ligation of the SortaseA gene into the cut 10-3-B vector
Packaging into the T7
genome-10-3-B vector
phage packaging extract+
Phage heads
2
2
1
3
1
Packaged T7 phage can be amplified and the recombinants are identified using PCR screening
+
21
3
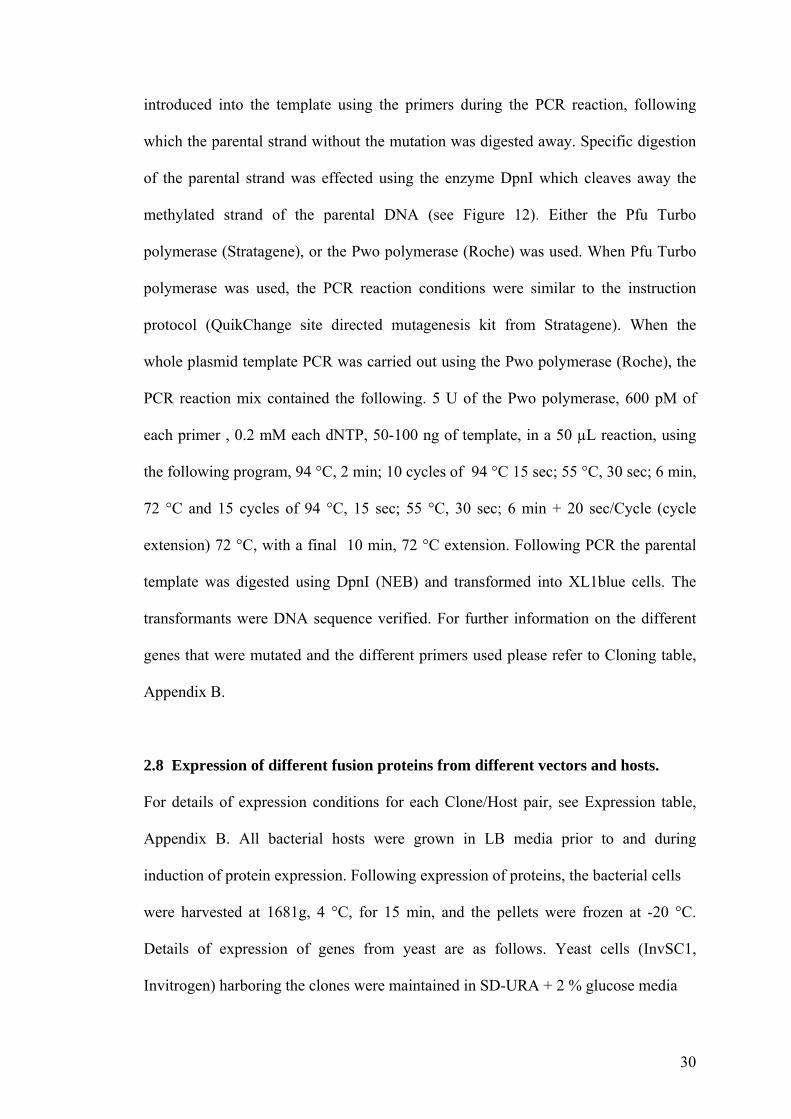
introduced into the template using the primers during the PCR reaction, following
which the parental strand without the mutation was digested away. Specific digestion
of the parental strand was effected using the enzyme DpnI which cleaves away the
methylated strand of the parental DNA (see Figure 12). Either the Pfu Turbo
polymerase (Stratagene), or the Pwo polymerase (Roche) was used. When Pfu Turbo
polymerase was used, the PCR reaction conditions were similar to the instruction
protocol (QuikChange site directed mutagenesis kit from Stratagene). When the
whole plasmid template PCR was carried out using the Pwo polymerase (Roche), the
PCR reaction mix contained the following. 5 U of the Pwo polymerase, 600 pM of
each primer , 0.2 mM each dNTP, 50-100 ng of template, in a 50 µL reaction, using
the following program, 94 °C, 2 min; 10 cycles of 94 °C 15 sec; 55 °C, 30 sec; 6 min,
72 °C and 15 cycles of 94 °C, 15 sec; 55 °C, 30 sec; 6 min + 20 sec/Cycle (cycle
extension) 72 °C, with a final 10 min, 72 °C extension. Following PCR the parental
template was digested using DpnI (NEB) and transformed into XL1blue cells. The
transformants were DNA sequence verified. For further information on the different
genes that were mutated and the different primers used please refer to Cloning table,
Appendix B.
2.8 Expression of different fusion proteins from different vectors and hosts.
For details of expression conditions for each Clone/Host pair, see Expression table,
Appendix B. All bacterial hosts were grown in LB media prior to and during
induction of protein expression. Following expression of proteins, the bacterial cells
were harvested at 1681g, 4 °C, for 15 min, and the pellets were frozen at -20 °C.
Details of expression of genes from yeast are as follows. Yeast cells (InvSC1,
Invitrogen) harboring the clones were maintained in SD-URA + 2 % glucose media
30
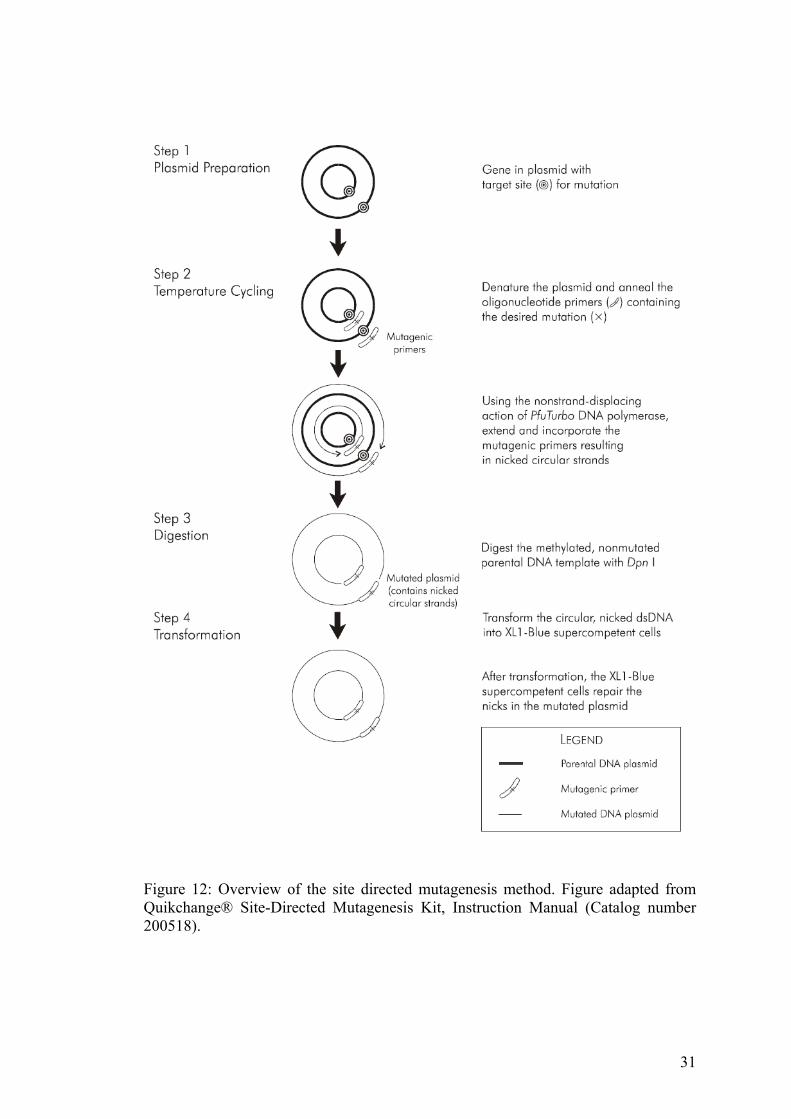
Figure 12: Overview of the site directed mutagenesis method. Figure adapted from Quikchange® Site-Directed Mutagenesis Kit, Instruction Manual (Catalog number 200518).
31
(see appendix for composition). An overnight culture of yeast cells (5 mL) was grown
and the OD600 was measured. A volume of cells needed to give OD600 = 0.4 in 5 mL
of SD-URA + 2 % galactose (Induction media) media was calculated and the same
was added to the induction media. The cells were grown for another 24 hrs and
samples were removed at various time intervals (2, 4, 6, 12, 24 hrs), to check for
expression levels and frozen O/N at -20 °C.
2.9 Western blot of proteins
Western blot protocol that used penta-HIS antibody for detection of 6XHIS-tagged
proteins is given below. Proteins (pure protein/crude cell lysate) to be detected using a
penta-HIS-HRP conjugated antibody, were denatured and run on a SDS –PAGE gel.
Transfer of the proteins from the gel to a solid support (PVDF, Amersham) was done
using either semi dry transfer method (HOEFER TE 70, Amersham) when the
proteins where small (up to 50 kDa) and using the wet transfer method (Mini trans
Blot electrophoretic transfer unit, Biorad) when the proteins were larger than 50 kDa.
The transfer was done following manufacturers instructions. Following transfer, the
membrane was blocked using 5 % skimmed milk dissolved in PBST (Tween 20,
0.1%) either O/N at 4 °C or for 1 hr at RT. Penta HIS HRP conjugate antibody
(QIAGEN) was then added at a 1 in 1000 dilution in 5 % skimmed milk dissolved in
PBST (Tween 20, 0.1%) to the membrane and incubated for 1 hr at RT. Milk is
known to reduce the sensitivity of the anti-HIS antibody (penta-HIS-HRP-conjugate,
QIAGEN), and was used only when substantial amounts of protein was expected to be
transferred onto the blot. Following this the membrane was washed 6 times, with
buffer changes after every 10 min in PBST (Tween 20, 0.1 %) using a suitable shaker.
The HRP signal was then visualized using ECL plus (Amersham pharmacia biotech)
32
or Super Signal® west Pico/Dura substrate (Pierce), depending on the amounts of
protein expected to be transferred. Likewise for more details on dilution ranges,
incubation time, wash conditions of other antibodies used to detect other affinity tags
please refer to Expression table, Appendix B.
2.10 Affinity chromatography of proteins
2.10.1 Ni-NTA column
The 6X-HIS tagged proteins were purified using Ni-NTA resin (QIAGEN). The
frozen pellets (see Section 2.8) were thawed on ice, lysis buffer H1 (for all buffers see
Appendix A) was added followed by addition of Lysozyme (Sigma) at 1 mg/mL and
incubation was continued on ice for 30 min. The volume of lysis buffer H1 added
depended on the expression level of the protein. If the expected yields of protein were
less the 1 mg/liter of culture then a 100X concentration was used, e.g., 50 mL starting
culture volume was concentrated to 0.5 mL lysis buffer. The cells were sonicated for
further lysis. Sonication was carried out with 30% amplitude, 10 sec ON, 10 sec OFF,
12 times, using the SONICS™ ( Newtown, CT, USA) VIBRA CELL. Successful lysis
of cells was followed by using a Bio-Rad-Protein assay (BIORAD) which was carried
out according to manufacturer’s instructions. The micro-assay procedure was used.
The lysed cells were then centrifuged at 20,598g for 30 min at 4 °C. The supernatant
was incubated with 100 µL Ni-NTA™ beads / 100 mL culture, for 1 hr at 4 °C. The
6XHIS tagged proteins were separated from other unbound proteins by washing at
first with 10 bed volumes of wash buffer H2, followed by wash with 10 bed volumes
wash buffer H3. Elution of the 6XHIS tagged proteins was done by the addition of
elution buffer H4. Elution of the proteins was monitored using the Bio-Rad protein
33
assay. The fractions containing substantial amounts of proteins were pooled and
napped using the NAP™ columns (Pharmacia Biotech) into buffer H5, aliquoted into
“use and throw” volumes and frozen at -20 °C. Proteins were napped according to
manufacturer’s instructions, using the NAP™ -5 columns.
2.10.2 GSH column
The GST tagged proteins were purified using GSH resin (Amersham). The frozen
pellets (see Section 2.8) were thawed on ice, lysis buffer G1 (for all buffers see
Appendix A) was added followed by the addition of Lysozyme (Sigma) at 1 mg/mL
and incubation was continued on ice for 30 min. A 20X concentration was
performed, e.g. 200 mL starting culture volume is concentrated to 10 mL lysis buffer.
The cells were sonicated for further lysis. Sonication was carried out with 30 %
amplitude, 10 sec ON, 10 sec OFF, 12 times, using the SONICS™ ( Newtown, CT,
USA) VIBRA CELL. Successful lysis of cells was followed by using a Bio-Rad-
Protein assay (BIORAD) which was carried out according to manufacturer’s
instructions. The micro-assay procedure was used in all cases. The lysed cells were
then centrifuged at 20,598g for 30 min at 4 °C. The supernatant was incubated with
500 µL GSH beads / 100 mL culture, for 30 min at RT. The GST tagged proteins
were separated from other unbound proteins by washing at with 10 bed volumes of
wash buffer G2. Elution of the GST tagged proteins was done by the addition of
elution buffer G3. Elution of the proteins was monitored using the Bio-Rad protein
assay. The fractions containing substantial amounts of proteins were pooled and
napped using the NAP™ columns (Pharmacia Biotech) into buffer G4, aliquoted into
“use and throw volumes” and frozen at -20 °C. Proteins were napped according to
manufacturer’s instructions, using the NAP™ -5 columns.
34
2.10.3 Chitin columns
The CBD (chitin binding domain) tagged proteins were purified using Chitin beads
(NEB). After expression of proteins in yeast (5 ml), the cells were harvested and
frozen O/N at -20 °C. The cells were allowed to thaw on ice and lysis buffer C1, 0.5
ml, was added (a 10X concentration was used). The cells were sonicated for lysis. 30
% amplitude, 30 sec ON, 30 sec OFF, a total of 7 min ON and SONICS™ (Newtown,
CT, USA) VIBRA CELL was used. Following this the lysate was checked for
fluorescence using the Typhoon 9200 (Amersham -Biosciences) at the EGFP
fluorescence wavelength. The lysate was spun down at 20,598g for 30 min at 4 °C.
The supernatant was incubated with 25 µL Chitin beads / 5 mL culture, for 30 min at
RT. The CBD tagged proteins were separated from other unbound proteins by
washing with 10 bed volumes of wash buffer C2. Purification was checked by boiling
the beads and running them on a SDS-PAGE gel.
2.11 Production of N-terminal cysteine proteins
The cells harboring the respective plasmids were grown in 1 L of LB medium
containing 100 mg/L ampicillin at 37 °C in a 250 rpm air shaker. Protein expression
was induced at OD600 ~ 0.6 with 0.5 mM IPTG and left shaking O/N at RT. Cells
were harvested by centrifugation (5000g, 30 min, 4 °C), resuspended in lysis buffer
(20 mM Tris-HCL pH 8.5, 500 mM NaCL, 1 mM EDTA) and lysed by sonication on
ice. The cell debris was pelleted down by centrifugation (4000g, 30 min, 4 °C) to
give a clear lysate containing the intein-fusion proteins. A column packed with 10
mL of chitin beads was pre-equilibrated with column buffer (20 mM Tris-HCL pH
8.5, 500 mM NaCL, 1 mM EDTA). The clear lysate was loaded onto the column at a
flow rate of 0.5 mL/min and washed with 10 volumes of column buffer. The column
35
was then flushed quickly with one column volume of cleavage buffer (20 mM Tris-
HCL pH 7.0, 500 mM NaCL, 1 mM EDTA) before stopping the flow. The above
procedures were carried out at 4 °C to prevent premature on-column cleavage of
intein-tag. On-column incubation with the cleavage buffer took place for 20 hr at RT
with gentle agitation and the protein was eluted in 2 mL fractions.
2.12 Spotting of N-terminal cysteine proteins on thioester slides
Thioester slides were prepared as follows. The epoxy-derivatized slides (see Section
2.14) were incubated with 10 mM diamine-PEG for 30 min. The slides were then
washed with deionized water and placed in a solution of 180 mM succinic anhydride
for 30 min. This was followed by boiling the slides in water for 2 min. NHS solution
was prepared and the slides were incubated with it for 3 hr. Following incubation the
slides were rinsed with deionized water and allowed to react O/N with a solution of
benzylmercaptan. Finally, the slides were washed with deionized water and dried. 10
µL of the clarified cell lysate (see Section 2.11) was added on to a source plate. The
N-terminal cysteine-containing proteins were adjusted to a stock concentration of 1
mg/mL (with PBS buffer, pH 7.4). Stocks with series dilutions were also prepared.
The protein was spotted onto the thioester-functionalized glass slides using an ESI
SMA™ arrayer. All slides were incubated for 3 hrs and subsequently washed with
water for 20 min, followed by detection or storage at 4 ºC. For detection of protein
immobilization, slides were scanned with an ArrayWoRx™ either directly under
FITC channel, or hybridized with Cy5-labeled anti-EGFP for 1 h and analyzed.
36
2.13 In vitro biotinylation of proteins
Following pull down of CBD tagged fusions onto the Chitin column (see Section
2.10.3), biotinylation of the protein was done by quickly flushing the column with
buffer C3 and incubating the dry beads for 24 hrs at 4 °C. After the 24 hr incubation
the protein was eluted in buffer G2. Following elution the proteins were either
checked for the incorporation of the biotin tag using a western blot, or were used for
spotting onto microarrays.
2.14 Spotting biotinylated proteins onto avidin slides
The slides were cleaned in piranha solution (H2SO4:H2O2, 7:3) for at least 2 hr.
Following that slides were washed copiously with de-ionized water and rinsed with
95% ethanol and dried. Then the slides were soaked in 1% solution of Silane (95%
ethanol, 16 mM acetic acid) for 1 hr. The epoxy derivatized slides were then washed
three times in 95 % ethanol and cured for 2 hrs at 150 °C. The slides were once again
rinsed with ethanol and dried. Following this 40-60 µL of 1 mg/ml Avidin (SIGMA)
in 10 mM sodium bicarbonate buffer was applied to the slides, covered with a cover
slip, and incubated for 30 min. The slides were dried after washing with water. The
unbound epoxides were reacted with 2 mM aspartic acid in 0.5 M sodium
bicarbonate, pH 9, and covered with a coverslip. Following this the slides were
washed with water and dried. The spotting was done manually, 2 µL spots of the
samples were applied to the slides and allowed to react for 2-3 hrs in moisture
chambers before drying them in air. The slides were then washed by incubating them
in PBST (Tween 20, 0.1%) 10 times, 1 min each. Following this the antibody solution
was applied to the slide (when required), was covered with a cover slip, allowed to
incubate for 1 hr, before washing off the unbound antibody and dried in air.. The
37
slides were then scanned using the ArrayWoRx™ Microarray scanner (Applied
Precision) at the respective wavelengths.
2.15 Enzyme activity assays
2.15.1 Testing activity of SrtA
Fluorescence assay: SrtA/N-SrtA/N-SrtA-C184A/C-SrtA/C-SrtA-C184A, 20 µM,
was incubated with EGFP-LPETG-V5, 20 µM and GG-TMR, 500 µM in reaction
buffer R1 to a final volume of 100 µL at 37 °C for 1 hr. The reaction was stopped by
adding buffer R2 to the reaction mix and boiling for 10 min at 95 °C. The reaction
contents were then separated in a SDS-PAGE gel. Fluorescence of GG-TMR was
scanned in gel using Typhoon 9200 (Amersham Biosciences), at the appropriate
wavelength.
Hydrolysis/transpeptidation activity: To test the hydrolysis activity, SrtA/C-SrtA/C-
SrtA-C184A, 5 µM, was incubated with ACC-LPETG-DABCYL, 100 µM in reaction
buffer R1 to a final reaction volume of 100 µL (see Figure 4). The increase in
fluorescence that would be observed due to hydrolysis (the fluorescent moiety and its
quencher are separated) was followed using the Spectra Max Gemini XS (Molecular
devices). For transpeptidation activity SrtA/C-srtA/C-SrtA-C184A, 5 µM, was
incubated with ACC-LPETG-DABCYL, 100 µM and Gly6-His6, 100 µM in reaction
buffer R1 in a final reaction volume of 100 µL (see Figure 4). The increase in
fluorescence that would be observed due to transpeptidation (the fluorescent moiety
and its quencher are separated) was followed using the SpectraMax GeminiXS
(Molecular devices).
38
2.15.2 In vitro self-ligation assay
To detect self labeling, N-SrtA/N-SrtA-C184A, was incubated with 500 µM,
BIOTIN- LPETG, whereas as C-srtA/C-SrtA-C184A, was incubated with 500 µM
G5-BIOTIN, in buffer R1 for 1 hr at 37 °C (see Figures 6 and 7). The reaction was
stopped by adding buffer R2 to the reaction mix and boiled for 10 min at 95 °C. The
reaction contents were then separated in a SDS-PAGE gel. Biotin was detected using
anti-BIOTIN antibody; see Section 2.9 and expression table, Appendix B, for more
details on the western blot.
2.15.3 Self-ligation assay on the phage
SrtA on phage was tested as follows, a 10 mL phage lysate was PEG precipitated (see
Section 2.16.3) and re-suspended in 1 mL of buffer R1. 10 µL of this solution was
used in a 50 µL reaction volume, using the same conditions as in Section 2.15.2 (see
Figure 8). Reaction aliquots were taken at required time intervals and the reaction
stopped by the addition of buffer R2, followed by boiling at 95 °C for 10 min.
Fluorescence tagging of the proteins was detected after running a SDS-PAGE and
scanning the gel using the Typhoon 9200 (Amersham Biosciences).
39
2.16 General phage methods
2.16.1 Packaging of T7 phage DNA
One tube of the T7 DNA packaging extract (Novagen) was thawed on ice and
aliquoted into 4 tubes with 6.25 µL each. To this 1.25 µL of the ligation mix was
added and stirred gently with a pipette tip. The reaction was allowed to proceed at RT
for 2 hrs and was stopped by the addition of 75 µL of LB. The packaged phage was
plated out (see Section 2.16.4) or stored up to 24 hrs at 4 °C. If long term storage is
intended then phage was propagated and glycerol stocks were made.
2.16.2 Amplification of phages
M13 phages: The host cells (ER 2738, NEB) were grown to an OD600 of 0.095 at 37
°C in LB broth supplemented with ampicillin at 100 µg/mL. The eluted phages were
then added to the culture and allowed to grow until 4 hrs at 37 °C. The number of host
cells was always in excess to the number of phages. All eluents were amplified in this
manner. To amplify single plaques, plaques were picked into 1 mL OD600 = 0.095
host cells and allowed to grow for 4 hrs at 37 °C. Following amplification the
bacterial cells were pelleted at 10,000g for 10 min at 4 °C. The supernatant contained
the phages.
Rescue of phagemid: The XL1 blue cells containing the appropriate phagemid clones
were grown at 30 °C in 2XYT broth supplemented with 2 % glucose (Glucose is
added to the growth media to repress the protein expression from the Lac promoter of
the phagemid prior to the addition of helper phages, overexpression of Gene III is
toxic to the bacterial cells) and ampicillin, 100 µg/ml until a OD600 of 0.5. The cells
40
were then harvested and re-suspended in 2XYT broth (see Appendix A) containing
ampicillin, 100 µg/ml, Kanamycin, 50 µg/ml, helper phages (M13-K07, NEB) at MOI
0.1 and IPTG 0.4 mM. The incubation was continued at 37 °C for 1 hr without
shaking, followed by incubation at 30 °C O/N at 250 rpm. Upon removal of cells the
supernatant contained the phages.
T7 phages: The host cells (e.g., BLT5403, Novagen) were grown to an OD600 of 0.5
– 0.8 at 37 °C in LB broth supplemented with ampicillin at 50 µg/mL. Phages were
then added at a MOI of 0.001–0.01 (i.e., 100–1000 cells for each pfu) and allowed to
grow until lysis was observed, typically 2 to 3 hrs at 37 °C. Following this the
bacterial cell debris was pelleted at 10,000g for 10 min. The supernatant contained the
phages. Amplification of single plaques was also done in a similar manner.
2.16.3 PEG precipitation of phages.
PEG precipitation of the phages was done by the addition 1/6th volume of buffer C
(M13 phage) or 1/6th volume of buffer D (T7 phage) to the supernatant (see Section
2.16.2), followed incubation on ice for a minimum of 1 hr up to O/N. Centrifugation
was done at 10,000 g, for 15 min at 4 °C for 10 min to pellet the phages. The phages
thus obtained were re-suspended in the desired buffer and desired volume.
2.16.4 Storage, Serial dilution and titering of phages.
Phage (M13/T7) is the most stable in LB and could be stored for several months in
LB, at 4 °C, without any loss of titers. For long term storages however glycerol stocks
were be made (15 % glycerol was added to the phage supernatant and frozen at -80
°C). Serial dilution of phages was done in LB. Typically 100-fold dilutions, were
41
done in 96-well plates, using a 8-channel pipette, in a 96-well plate shaker, to shake in
between dilutions. Up to 8 different samples were processed simultaneously, using
just 8 tips (there was no need to change tips in between dilutions, just pipetting slowly
was enough to prevent cross contamination). Titers from 96-well plates were counted
on appropriate LB-Host-bacterial plates (The host bacteria (250 µL/90 mm dish), was
grown to an OD600 ≥1, mixed with melted top agar (7 mL/90 mm dish) , at 55 °C,
poured onto to LB/Antibiotic plates and allowed to solidify to make host bacterial
plates; the procedure is the same for both M13 and T7 phages) using multi channel
pipettes and spotting 2 µL volumes from each sample. Upon the appearance of
plaques (8 hours, 37 °C for M13 phages, 3 hrs 37 °C for T7 phages) spotted areas
containing discrete phages were counted and multiplied by the dilution factor to
obtain the actual number of phages. All titers were done in triplicate and the average
values were used. Typical phage titers for M13 phage after amplification was 1012
pfu/mL , for T7 phage was 1010 pfu/mL , eluted titers varied between 0-105, serial
dilutions were done accordingly.
2.16.5 Plaque lift
T7 plaques can be lifted onto nitrocellulose membrane and probed for protein
expression using antibody. The plaques (500- 750 in number) were mixed with host
bacteria (250 µl of OD600 ≥ 1 host bacteria /90 mm dish) and 7 mL of top agar/90 mm
dish and plated out on LB/Amp plates. Once the plaques grow to 2-3 mm sizes the
plates were chilled at 4 °C for a minimum of 1 hr. Nitrocellulose membrane cut to the
size of the Petri-dish was marked on one side with a pencil, and laid on the agar plate
gently. After a few min, the membrane was lifted out gently and allowed to dry for at
42
least 20 min. Following this the membrane was processed like a regular western blot
membrane for any antibody.
2.16.6 Sequencing phage
2.16.6.1 M13
The plaque whose DNA was to be sequenced was amplified in a small volume of 1
mL. After amplification the cells were pelleted and 500 µL of the supernatant was
removed into a fresh tube. Following this 200 µL of buffer C was added to the
supernatant, mixed, and let to stand at RT for 10 min. The sample was then
centrifuged at 10,000g for 10 min. The phages were pelleted at this step, and the
supernatant was discarded. The pellet was re-suspended in 100 µL buffer E and 250
µL ethanol, allowed to stand for 10 min. The DNA was recovered by spinning for
another 10 min at 10,000g. The pellet was washed with 70 % ethanol, and air dried.
The pellet was then re-suspended in 10 µL of TE buffer (10 mM Tris-HCL (pH 8.0),
1 mM EDTA), and 5 µL was used for DNA sequencing (See section 2.6).
2.16.6.2 T7
Genes to be sequenced were amplified using the T7 up and T7 down primers (see
Cloning table, Appendix B), purified using QIAGEN PCR purification kit, and used
as templates for sequencing with the same primers. See Section 2.6 for DNA
sequencing.
43

2.17.7 Phage enrichment methods
2.17.7.1 Affinity based enrichment of C-SrtA-T7
Phages bearing the SrtA protein were diluted at 1 in 104 or 1 in 105 of bare T7 phages
(wildtype T7). This pool of phages was then incubated with 25 µL of affinity beads
(Ni-NTA beads were washed in buffer F and blocked for 1 hr at RT in blocking buffer
H), in the binding buffer F and incubated for 1 hr at 4 °C in a rotating platform.
Following incubation the unbound phages were washed away using 0.1% PBST, 1
min each, 5 times. The bound phages were eluted by infecting the beads with 1 mL
OD600 = 0.5 BLT5403 cells, and incubated until lysis occurred at 37 °C. The lysate
was then centrifuged at 10,000g for 10 min to remove the bacterial debris. 100 µL of
the supernatant was used directly for the next round of affinity enrichment. 2 µl of the
phage supernatant was boiled in 100 µL of water for 10 min and 2 µL of this solution
was used as template in a PCR reaction to detect enrichment using T7 Up and T7
down primers. The selection was continued for 6 rounds.
2.17.7.2 Activity based enrichment of C-SrtA-T7
Activity based enrichment was carried out essentially in the same way as affinity
based enrichment with the following modifications. Streptavidin beads
(Promega)/Streptavidin microtiter plates (PIERCE) were washed with wash buffer G2
and blocked with buffer H, incubated with 0.5 mM or with 10 µM of G5-BIOTIN
respectively at RT for 30 min. The unbound G5-BIOTIN was removed by washing
with 0.1% PBST at least 3 times. The phage bearing the C-SrtA was diluted at 1 in
102 to 103 of bare T7 phages (wildtype T7), and incubated with the beads/plate in
buffer R1 at 37 °C for 2 hrs. 13 rounds of enrichment were done. The following was
44
also tried, 0.5 mM of G5-BIOTIN was incubated with the diluted phages (see Section
2.17.1.1) in buffer R1 for 2 hrs at 37 °C, the un reacted G5-BIOTIN was removed by
PEG precipitation, and the phages were incubated with SA beads (washed with wash
buffer G2 and blocked with buffer H) for 30 min at RT. The unbound phages were
washed away and the bound were eluted as in Section 2.17.7.1.
2.17.7.3 Biopanning against SA and 3CL mutant.
Biopanning against the Streptavidin (SA) model protein and the 3CL mutant protease
was done as follows. SA coated plates (High Binding capacity SA plates, PIERCE)
was used for panning against SA, and 25 µL of GSH beads was used to pan against
the GST fusion protein, 3CL-C145A-GST (10 nM concentration of the 3CL-C145A-
GST was used per assay ). The SA plates or the 3CL mutant bound beads (washed in
PBS and blocked using block buffer H) were incubated with 2 x 10¹¹ phage in 100 µL
final volume of PBS for 1 hr at RT. Following incubation the unbound proteins were
removed by washing 10 times, 1 min each with 100 µL of PBST (Tween 20, 0.1%).
Elution of the bound phages was done using 100 µL of buffer G for 15 min at RT.
This was neutralized immediately using 150 µL of 1M Tris, pH 9.1. A small amount
of the eluent (10 µL) was used for titering and the rest was amplified as described
above. The subsequent rounds were performed using 2 x 10¹¹ phages from the
amplified eluent. A total of 3 rounds were performed, at the end of which isolated
phage plaques were sent for DNA sequencing to determine the peptide sequence.
45
2.17.7.4 Binding assay
For each clone/target protein to be tested, 1 µg of the target protein was immobilized
in separate wells of ELISA microtiter plate (NUNC). Immobilization of target was
done by allowing the target to react with the ELISA plate in 100 µL of PBS buffer
(see buffer G2, appendix A), pH 7.4, O/N at 4 °C. The unbound protein was washed
off by rinsing the wells 3 times with PBST. The individual phage clones (109 pfu/each
of cleared phage lysate) were added to the wells and allowed to react for 1-3 hrs at
RT. The unbound phages were washed off using 5 washes, 1 min each with 100 µL of
PBST (Tween 20, 0.1%). Elution of the phages was done using 150 µL of 200 mM
glycine-HCL (pH 2), for 15 min at RT. The phages were then transferred to a new
plate containing 150 µL of 1 M NaPO4 buffer (pH 7.5). The output was then titered,
and the percentage of input pfu recovered from the binding reaction was calculated.
46

3. Results and Discussion In this thesis three different approaches to protein engineering and modulation have
been evaluated. The first involves an intein mediated method to site specifically
engineer proteins for immobilization onto the microarray. The second one is a
selection scheme that should enable protein evolution of an enzyme SrtA has been
designed and setup. As a third approach to protein modulation a phage display library
of random peptides was used to identify binders for a viral protease. The identified
binders may be used to design good inhibitors against the enzyme. The results and
discussions from these three different projects will be presented separately in Sections
3A, 3B and 3C.
47
3A The intein mediated approach to site-specifically label proteins.
An enzyme-mediated approach to modify proteins site-specifically is presented in this
section. Two different approaches are described. The first one enables generation of
N-terminal cysteine proteins, while the second allows biotinylation at C-terminus of
proteins.
3A.1 The intein based method to produce N-terminal cysteine proteins
The Ssp Intein tag was used to generate N-terminal cysteine containing proteins for
site-specific immobilization onto thioester functionalized glass slides by means of a
highly specific chemical reaction known as native chemical ligation [109]. Terminal
cysteine containing proteins were generated using the pTWIN vectors. These vectors
allow the expression of target proteins with the self-cleavable modified Ssp DnaB
Intein having a chitin binding domain fused at their N-termini. The recombinant
protein was engineered by standard PCR-based methods and subsequently expressed
to have a cysteine residue at its N-terminus by inducing intein splicing at pH 7. The
N-terminal cysteine-containing protein thus produced was site-specifically
immobilized onto thioester-functionalized slides via the chemoselective native
chemical ligation reaction [6]. Only the terminal cysteine residue reacts with the
thioester to form a stable peptide bond; other reactive side chains, including internal
cysteines, do not react to form a stable product.
48
3A.1.1 Expression of N-terminal cysteine-containing proteins from bacteria.
EGFP was cloned into the pTWIN vector to allow it to be expressed as a fusion to the
Ssp DNAB intein at its N-terminus. An extra cysteine residue was introduced at the
junction of EGFP and Intein. The construct thus obtained was sequence verified and
transformed into ER2566 host cells for expression. In order to obtain a pure N-
terminal cysteine-containing protein, it was necessary that a sufficient amount of the
uncleaved CBD-intein fusion protein was obtained before binding to a chitin column.
By performing the protein expression at room temperature for 12 hrs, we were able to
obtain a substantial amount of the fusion (at least 50 %; Lane 1 in Figure 13(a))
before chitin column purification. In vitro cleavage of the fusion protein was further
reduced by carrying out on-column loading and washings at 4 °C. On-column
cleavage and purification conditions were also optimized by carrying out the on-
column cleavage reaction at room temperature for 12 hrs using the cleavage buffer
(pH 7.0) (see Section 2.11). On average, highly purified N-terminal cysteine-
containing EGFP fractions could be routinely obtained with sufficient yield (~ 1.5
mg/mL; Lanes 2-4 in Figure 13(a)), and directly used for spotting onto thioester slide.
3A.1.2 Spotting N-terminal cysteine-containing EGFP onto thioester slides
To confirm that the N-terminal cysteine-containing EGFP obtained this way is
suitable for protein microarray generation, the concentration of the protein sample
was adjusted to 1 mg/mL, and other series dilutions, before spotting onto a thioester-
functionalized glass slide. Successful immobilization of EGFP was unambiguously
confirmed by probing the slide with a Cy5-labeled anti-EGFP antibody (see Figure
13(b)). The spots arrayed on the glass slides were generally clear and defined and
with relatively low background signals. As observed from the native fluorescence of
49
the immobilized EGFP (Figure 13(c)), relative spot intensity reached saturation at
about 0.2-1 mg/mL, indicated the upper limit of the amount of a protein that may be
immobilized with this strategy. Significantly, as little as 0.005-0.01 mg/mL of EGFP
was sufficient to give an easily detectable signal. The observation of native EGFP
fluorescence also served to confirm the proper folding of EGFP upon immobilization.
3A.2 The intein mediated method to site-specifically label proteins derived from
yeast
The intein mediated strategy for C-terminal biotinylation of proteins and spotting onto
to a microarray has been previously explored in our lab [7-11]. In this project the
feasibility of producing proteins in yeast, biotinylating them at the C-terminus using
the intein mediated method (see Figure 2) and immobilizing them onto microarrays in
a high throughput fashion was evaluated. Bacterial, mammalian and cell free systems
have been previously used to express the target proteins prior to biotinylation either in
vitro or in vivo [8-11]. Bacterial systems while providing good levels of expression,
lack the complex environment present in the eukaryotic cell, e.g., they do not have
post translational modifications of proteins. While it is feasible to express proteins in
the mammalian system it is expensive and the yields are quite low. So the yeast was
considered as an alternative. Yeast genetics is very well established, the yields of
protein is acceptable and culturing yeasts is inexpensive. It was envisaged that if a
high throughput system of expressing and biotinylating proteins from yeast could be
setup, then the entire array of enzymes from yeast could be immobilized onto avidin
surfaces and studied in a parallel fashion. While the 6000 yeast proteins have been
immobilized in the microarray [110], functions of many ORF’s still remain to be
discovered, an enzyme array typically consisting of all known and putative enzyme
50
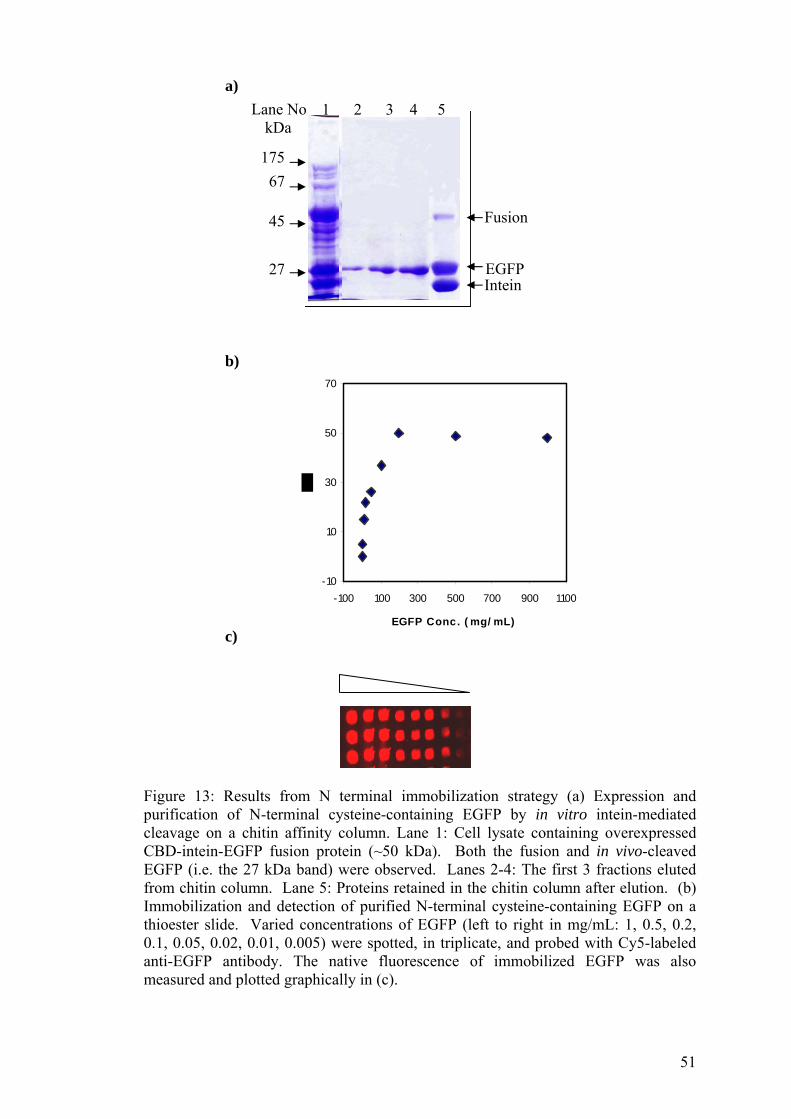
a)
1 2 3 4 5 Lane No kDa
Intein EGFP
175 67
27
45 Fusion
b)
c)
-10
10
30
50
70
-100 100 300 500 700 900 1100
EGFP Conc. ( mg/ mL)
Figure 13: Results from N terminal immobilization strategy (a) Expression and purification of N-terminal cysteine-containing EGFP by in vitro intein-mediated cleavage on a chitin affinity column. Lane 1: Cell lysate containing overexpressed CBD-intein-EGFP fusion protein (~50 kDa). Both the fusion and in vivo-cleaved EGFP (i.e. the 27 kDa band) were observed. Lanes 2-4: The first 3 fractions eluted from chitin column. Lane 5: Proteins retained in the chitin column after elution. (b) Immobilization and detection of purified N-terminal cysteine-containing EGFP on a thioester slide. Varied concentrations of EGFP (left to right in mg/mL: 1, 0.5, 0.2, 0.1, 0.05, 0.02, 0.01, 0.005) were spotted, in triplicate, and probed with Cy5-labeled anti-EGFP antibody. The native fluorescence of immobilized EGFP was also measured and plotted graphically in (c).
51
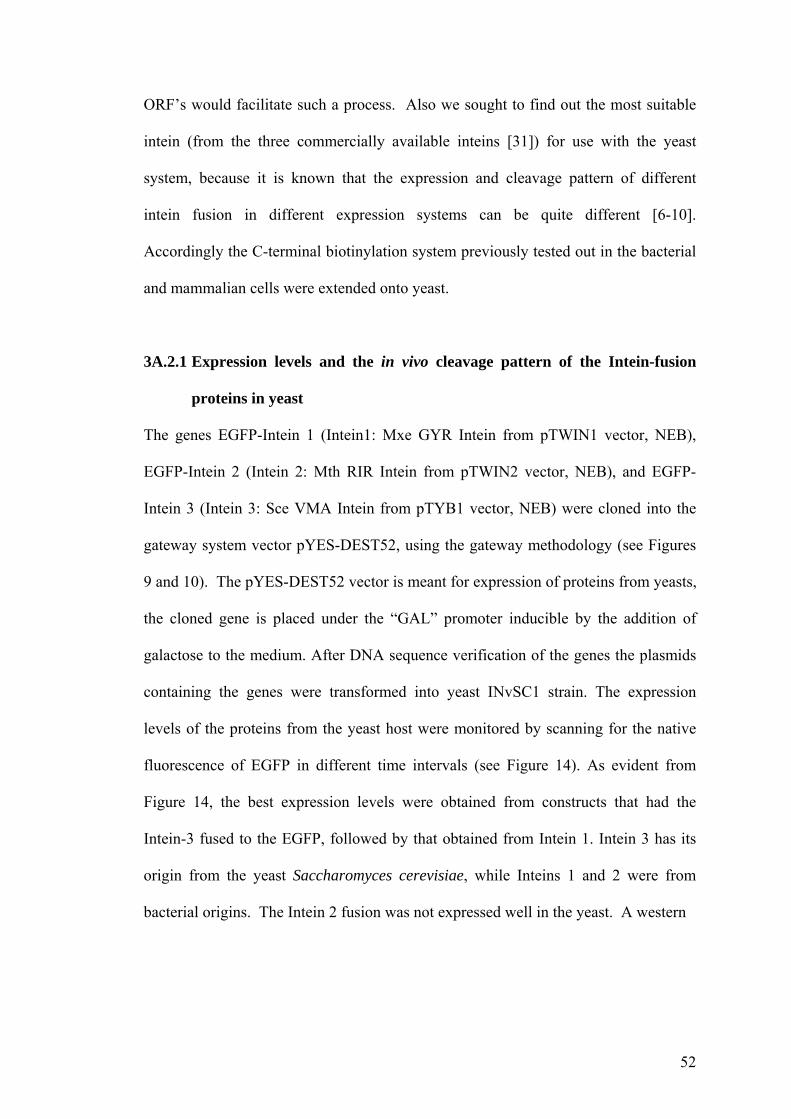
ORF’s would facilitate such a process. Also we sought to find out the most suitable
intein (from the three commercially available inteins [31]) for use with the yeast
system, because it is known that the expression and cleavage pattern of different
intein fusion in different expression systems can be quite different [6-10].
Accordingly the C-terminal biotinylation system previously tested out in the bacterial
and mammalian cells were extended onto yeast.
3A.2.1 Expression levels and the in vivo cleavage pattern of the Intein-fusion
proteins in yeast
The genes EGFP-Intein 1 (Intein1: Mxe GYR Intein from pTWIN1 vector, NEB),
EGFP-Intein 2 (Intein 2: Mth RIR Intein from pTWIN2 vector, NEB), and EGFP-
Intein 3 (Intein 3: Sce VMA Intein from pTYB1 vector, NEB) were cloned into the
gateway system vector pYES-DEST52, using the gateway methodology (see Figures
9 and 10). The pYES-DEST52 vector is meant for expression of proteins from yeasts,
the cloned gene is placed under the “GAL” promoter inducible by the addition of
galactose to the medium. After DNA sequence verification of the genes the plasmids
containing the genes were transformed into yeast INvSC1 strain. The expression
levels of the proteins from the yeast host were monitored by scanning for the native
fluorescence of EGFP in different time intervals (see Figure 14). As evident from
Figure 14, the best expression levels were obtained from constructs that had the
Intein-3 fused to the EGFP, followed by that obtained from Intein 1. Intein 3 has its
origin from the yeast Saccharomyces cerevisiae, while Inteins 1 and 2 were from
bacterial origins. The Intein 2 fusion was not expressed well in the yeast. A western
52
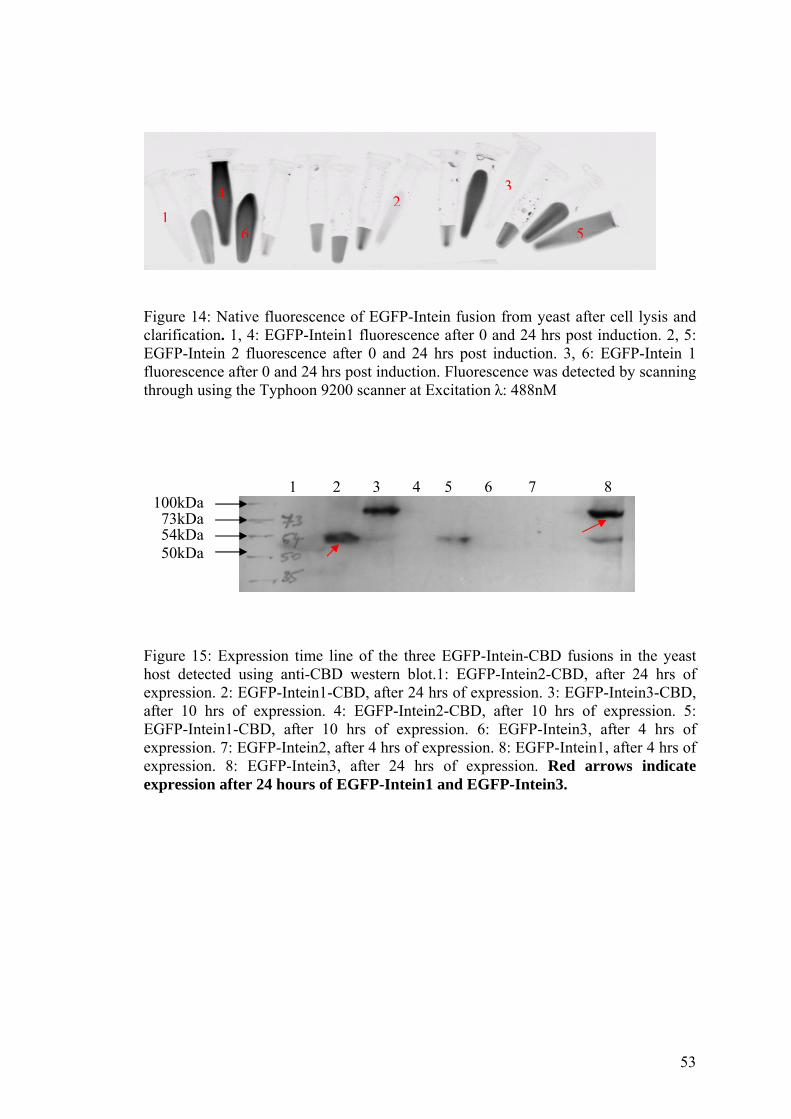
14
6
23
5
Figure 14: Native fluorescence of EGFP-Intein fusion from yeast after cell lysis and clarification. 1, 4: EGFP-Intein1 fluorescence after 0 and 24 hrs post induction. 2, 5: EGFP-Intein 2 fluorescence after 0 and 24 hrs post induction. 3, 6: EGFP-Intein 1 fluorescence after 0 and 24 hrs post induction. Fluorescence was detected by scanning through using the Typhoon 9200 scanner at Excitation λ: 488nM
1 2 3 4 5 6 7 8 100kDa 73kDa 54kDa
50kDa
Figure 15: Expression time line of the three EGFP-Intein-CBD fusions in the yeast host detected using anti-CBD western blot.1: EGFP-Intein2-CBD, after 24 hrs of expression. 2: EGFP-Intein1-CBD, after 24 hrs of expression. 3: EGFP-Intein3-CBD, after 10 hrs of expression. 4: EGFP-Intein2-CBD, after 10 hrs of expression. 5: EGFP-Intein1-CBD, after 10 hrs of expression. 6: EGFP-Intein3, after 4 hrs of expression. 7: EGFP-Intein2, after 4 hrs of expression. 8: EGFP-Intein1, after 4 hrs of expression. 8: EGFP-Intein3, after 24 hrs of expression. Red arrows indicate expression after 24 hours of EGFP-Intein1 and EGFP-Intein3.
53
blot with anti-EGFP antibody corroborated the fluorescence pattern observed with the
protein expression pattern observed on gel (see Figure 15). Also for the success of the
C-terminal Biotinylation strategy it is important that the fusion is obtained intact so
that it can be pulled down using the chitin beads and will be available for
biotinylation. From the western blot results (see Figure 16) it was evident that at least
30% of the fusion was cleaved off inside yeast for the constructs with Intein 1 and 3
and almost no fusion was detected in the case of the Intein 2. But however since
substantial fusion ~ 70% still remained in the cell for Intein 1 and 3 fusions, and
because of the higher levels of expression from the Inteins 1 and 3, it was decided to
use only Intein 1 and 3 fusion proteins for all further experiments.
3A.2.2 On-column cleavage and generation of biotinylated protein
The fusion protein Intein 1/3 -EGFP was purified on chitin beads from a 5 mL yeast
culture, and run on a SDS-PAGE gel. It was found that the levels of expression, and
yields after purification were such that only faint bands were visible after the
coomasie staining of the gel (see Figure 17). Nevertheless due to the very small
amounts of proteins that is required for spotting onto a microarray (fg/spot, [110]) it
was decided to proceed further and biotinylate the proteins using cysteine-biotin.
Upon incubation of the fusion protein with MESNA (a thiol reagent that induces
cleavage of the engineered intein from the fusion) and cysteine–biotin the splicing
process of the engineered intein was initiated and a thioester group was generated at
the C-terminus of the EGFP. This group was then attacked by the SH group of the
cysteine from cysteine – biotin to yield a native peptide bond with biotin on the C-
terminus (see Figure 2). Upon cleavage and elution using MESNA and Cys-biotin,
54
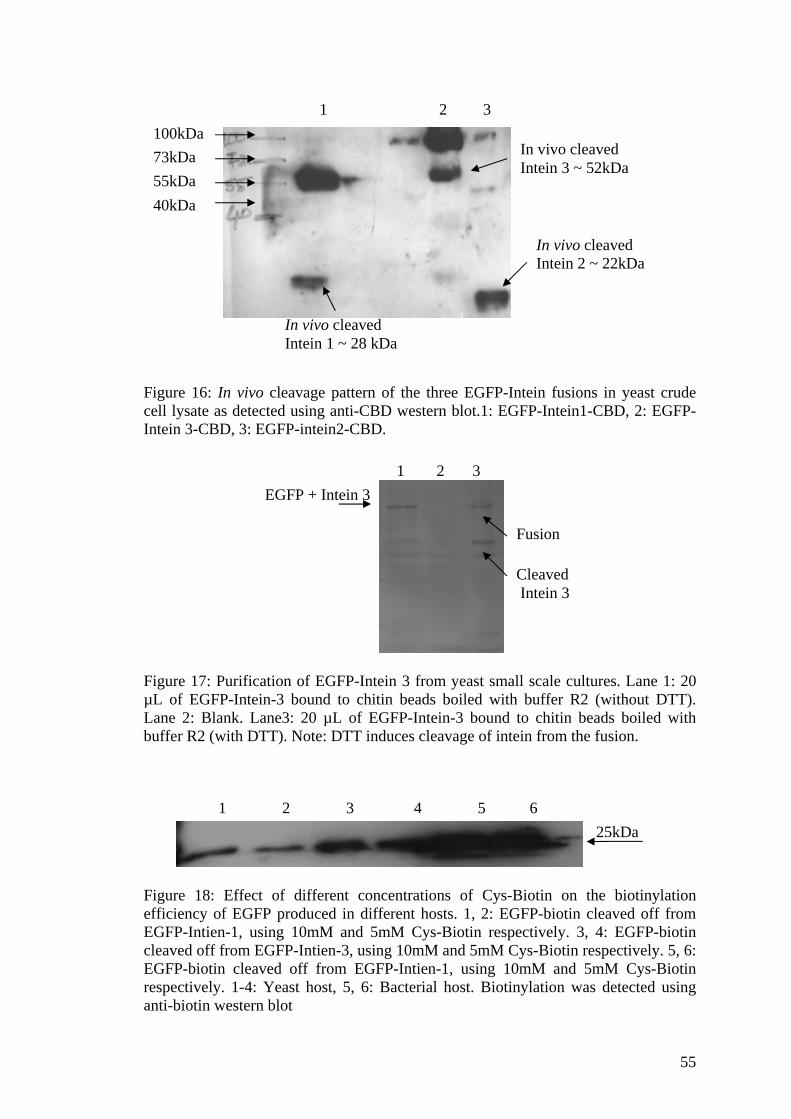
1 2 3 In vivo cleaved Intein 3 ~ 52kDa
In vivo cleaved Intein 1 ~ 28 kDa
In vivo cleaved Intein 2 ~ 22kDa
100kDa 73kDa 55kDa 40kDa
Figure 16: In vivo cleavage pattern of the three EGFP-Intein fusions in yeast crude cell lysate as detected using anti-CBD western blot.1: EGFP-Intein1-CBD, 2: EGFP-Intein 3-CBD, 3: EGFP-intein2-CBD.
1 2 3 EGFP + Intein 3
Cleaved Intein 3
Fusion
Figure 17: Purification of EGFP-Intein 3 from yeast small scale cultures. Lane 1: 20 µL of EGFP-Intein-3 bound to chitin beads boiled with buffer R2 (without DTT). Lane 2: Blank. Lane3: 20 µL of EGFP-Intein-3 bound to chitin beads boiled with buffer R2 (with DTT). Note: DTT induces cleavage of intein from the fusion.
1 2 3 4 5 6 25kDa
Figure 18: Effect of different concentrations of Cys-Biotin on the biotinylation efficiency of EGFP produced in different hosts. 1, 2: EGFP-biotin cleaved off from EGFP-Intien-1, using 10mM and 5mM Cys-Biotin respectively. 3, 4: EGFP-biotin cleaved off from EGFP-Intien-3, using 10mM and 5mM Cys-Biotin respectively. 5, 6: EGFP-biotin cleaved off from EGFP-Intien-1, using 10mM and 5mM Cys-Biotin respectively. 1-4: Yeast host, 5, 6: Bacterial host. Biotinylation was detected using anti-biotin western blot
55
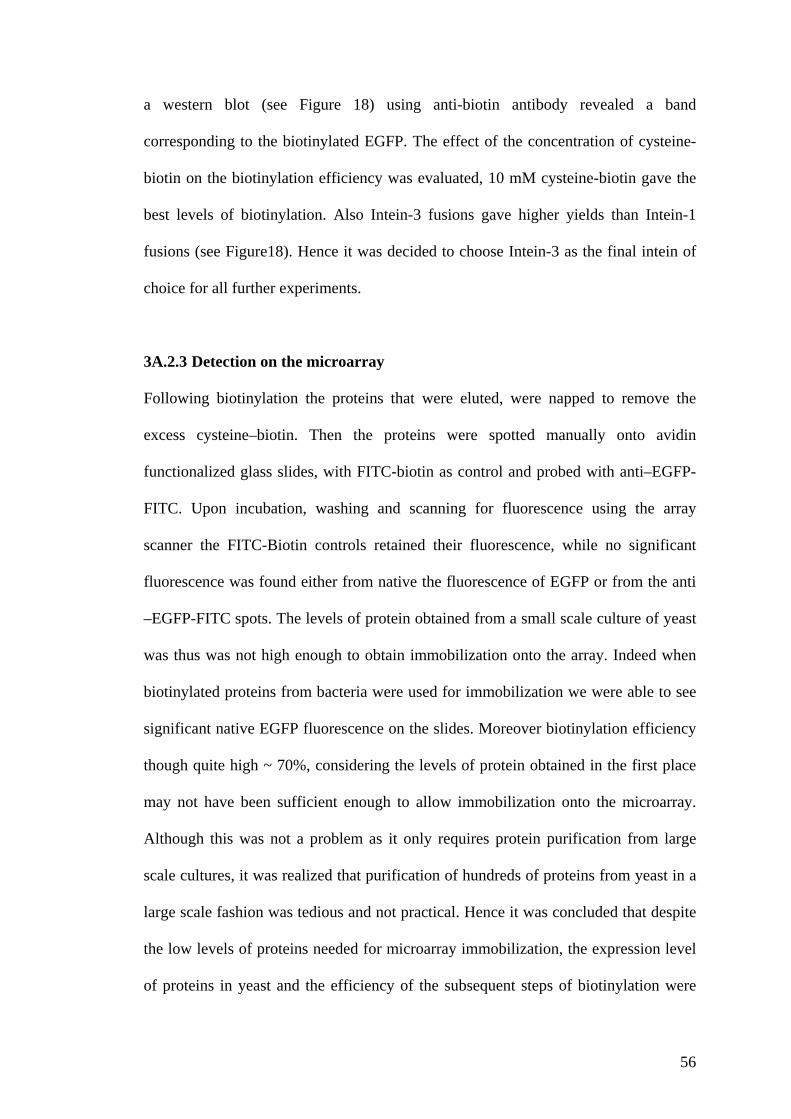
a western blot (see Figure 18) using anti-biotin antibody revealed a band
corresponding to the biotinylated EGFP. The effect of the concentration of cysteine-
biotin on the biotinylation efficiency was evaluated, 10 mM cysteine-biotin gave the
best levels of biotinylation. Also Intein-3 fusions gave higher yields than Intein-1
fusions (see Figure18). Hence it was decided to choose Intein-3 as the final intein of
choice for all further experiments.
3A.2.3 Detection on the microarray
Following biotinylation the proteins that were eluted, were napped to remove the
excess cysteine–biotin. Then the proteins were spotted manually onto avidin
functionalized glass slides, with FITC-biotin as control and probed with anti–EGFP-
FITC. Upon incubation, washing and scanning for fluorescence using the array
scanner the FITC-Biotin controls retained their fluorescence, while no significant
fluorescence was found either from native the fluorescence of EGFP or from the anti
–EGFP-FITC spots. The levels of protein obtained from a small scale culture of yeast
was thus was not high enough to obtain immobilization onto the array. Indeed when
biotinylated proteins from bacteria were used for immobilization we were able to see
significant native EGFP fluorescence on the slides. Moreover biotinylation efficiency
though quite high ~ 70%, considering the levels of protein obtained in the first place
may not have been sufficient enough to allow immobilization onto the microarray.
Although this was not a problem as it only requires protein purification from large
scale cultures, it was realized that purification of hundreds of proteins from yeast in a
large scale fashion was tedious and not practical. Hence it was concluded that despite
the low levels of proteins needed for microarray immobilization, the expression level
of proteins in yeast and the efficiency of the subsequent steps of biotinylation were
56

such that, high throughput production and biotinylation of proteins from yeast was not
feasible.
57
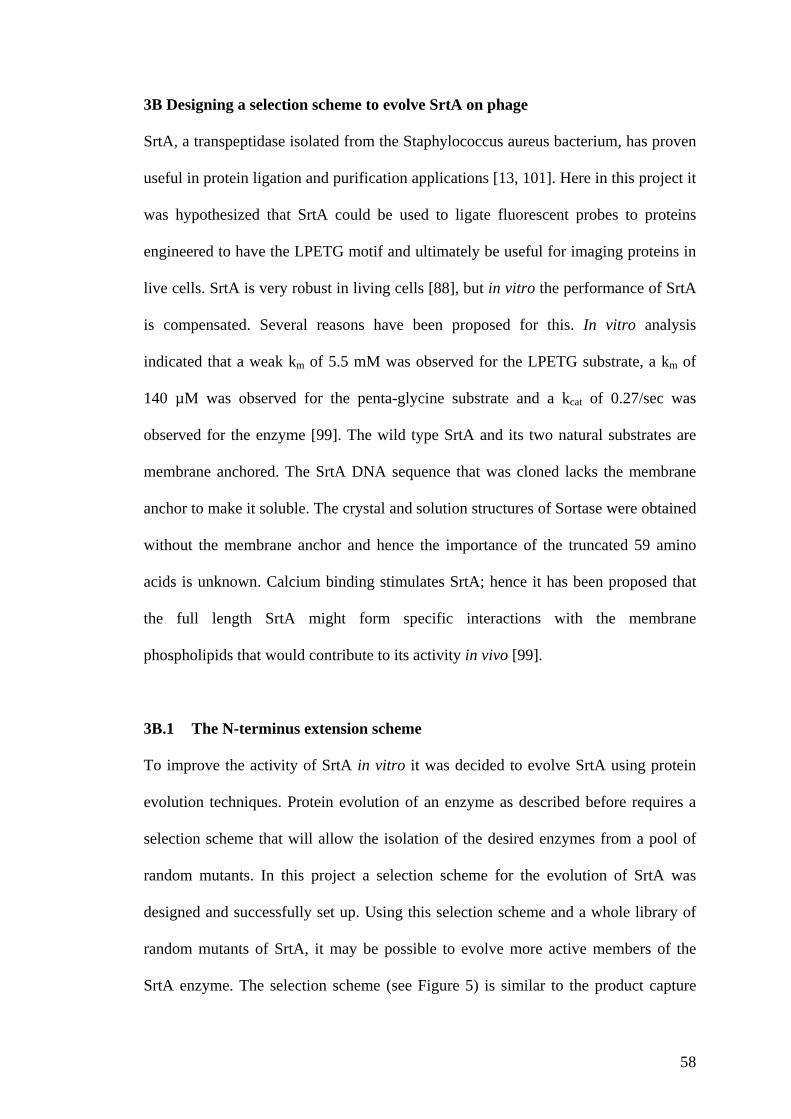
3B Designing a selection scheme to evolve SrtA on phage
SrtA, a transpeptidase isolated from the Staphylococcus aureus bacterium, has proven
useful in protein ligation and purification applications [13, 101]. Here in this project it
was hypothesized that SrtA could be used to ligate fluorescent probes to proteins
engineered to have the LPETG motif and ultimately be useful for imaging proteins in
live cells. SrtA is very robust in living cells [88], but in vitro the performance of SrtA
is compensated. Several reasons have been proposed for this. In vitro analysis
indicated that a weak km of 5.5 mM was observed for the LPETG substrate, a km of
140 µM was observed for the penta-glycine substrate and a kcat of 0.27/sec was
observed for the enzyme [99]. The wild type SrtA and its two natural substrates are
membrane anchored. The SrtA DNA sequence that was cloned lacks the membrane
anchor to make it soluble. The crystal and solution structures of Sortase were obtained
without the membrane anchor and hence the importance of the truncated 59 amino
acids is unknown. Calcium binding stimulates SrtA; hence it has been proposed that
the full length SrtA might form specific interactions with the membrane
phospholipids that would contribute to its activity in vivo [99].
3B.1 The N-terminus extension scheme
To improve the activity of SrtA in vitro it was decided to evolve SrtA using protein
evolution techniques. Protein evolution of an enzyme as described before requires a
selection scheme that will allow the isolation of the desired enzymes from a pool of
random mutants. In this project a selection scheme for the evolution of SrtA was
designed and successfully set up. Using this selection scheme and a whole library of
random mutants of SrtA, it may be possible to evolve more active members of the
SrtA enzyme. The selection scheme (see Figure 5) is similar to the product capture
58
approach to evolve enzymes [81, 82]. Two different selection schemes were set up.
One, the N-terminal extension scheme, displays a N-SrtA (N-terminus extended with
(GGGSE)3 amino acid sequence) on the phage M13. SrtA was fused to one of its
substrates 2HN-GGG on its N-terminal side (see Figure 7). It was hypothesized that if
the N-terminus is extended enough it should bring the substrate of SrtA into its own
active site. The distance between the active site cysteine 184 and the N-terminus was
estimated to be around 26.79 °A. It was estimated that 8-10 amino acids residues
should be enough to extend the N-terminus of SrtA to its active site (note that SrtA
was cloned in without the original N-terminal 59 amino acid residues to keep it
soluble). Accordingly a 15 amino acid peptide sequence GGGSEGGGSEGGGSE was
fused to the N-terminus of SrtA. The “SE” repeat was known to confer flexibility to
peptides and is generally used as linker sequence [112]. It was foreseen that the N-
terminal extended SrtA both on the phage and in solution, would react with Biotin –
LPETG-COOH and thus label itself (see Figure 7). Thus if a pool of active and
inactive members of SrtA was displayed on the phage each with their N-termini
modified, only the active ones will react to label themselves, and they can be isolated
using avidin beads, amplified and enriched.
The M13 phage display has some inherent disadvantages [113]. The protein to be
displayed has to be secreted out into the periplasmic space of the bacterial cell wall.
Not all proteins retain activity after being secreted into the periplasm and some resist
transport. To circumvent this shortcoming, other bacteriophages like the T7 phage
have been used to display proteins [114]. Proteins displayed on the T7 phage need not
be secreted as T7 phage is a lytic phage, moreover proteins can be displayed as C -
terminal fusion to the phage capsid protein 10B. Thus considering the fact that SrtA
59
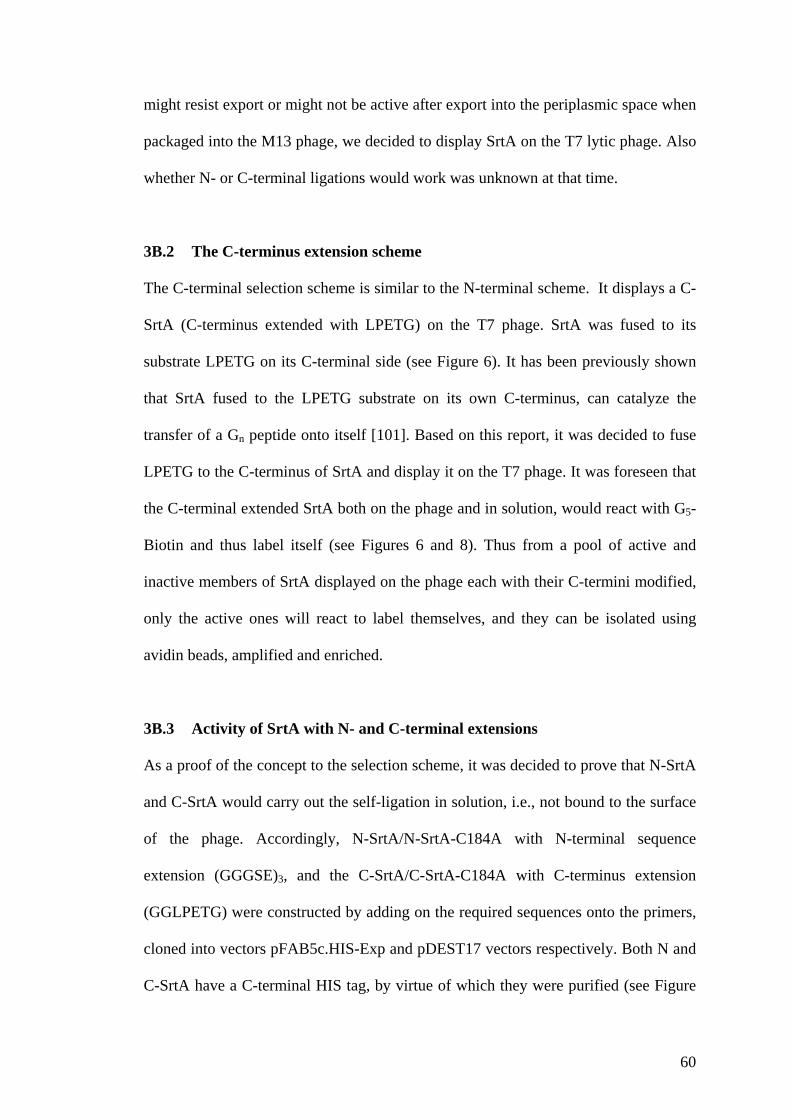
might resist export or might not be active after export into the periplasmic space when
packaged into the M13 phage, we decided to display SrtA on the T7 lytic phage. Also
whether N- or C-terminal ligations would work was unknown at that time.
3B.2 The C-terminus extension scheme
The C-terminal selection scheme is similar to the N-terminal scheme. It displays a C-
SrtA (C-terminus extended with LPETG) on the T7 phage. SrtA was fused to its
substrate LPETG on its C-terminal side (see Figure 6). It has been previously shown
that SrtA fused to the LPETG substrate on its own C-terminus, can catalyze the
transfer of a Gn peptide onto itself [101]. Based on this report, it was decided to fuse
LPETG to the C-terminus of SrtA and display it on the T7 phage. It was foreseen that
the C-terminal extended SrtA both on the phage and in solution, would react with G5-
Biotin and thus label itself (see Figures 6 and 8). Thus from a pool of active and
inactive members of SrtA displayed on the phage each with their C-termini modified,
only the active ones will react to label themselves, and they can be isolated using
avidin beads, amplified and enriched.
3B.3 Activity of SrtA with N- and C-terminal extensions
As a proof of the concept to the selection scheme, it was decided to prove that N-SrtA
and C-SrtA would carry out the self-ligation in solution, i.e., not bound to the surface
of the phage. Accordingly, N-SrtA/N-SrtA-C184A with N-terminal sequence
extension (GGGSE)3, and the C-SrtA/C-SrtA-C184A with C-terminus extension
(GGLPETG) were constructed by adding on the required sequences onto the primers,
cloned into vectors pFAB5c.HIS-Exp and pDEST17 vectors respectively. Both N and
C-SrtA have a C-terminal HIS tag, by virtue of which they were purified (see Figure
60
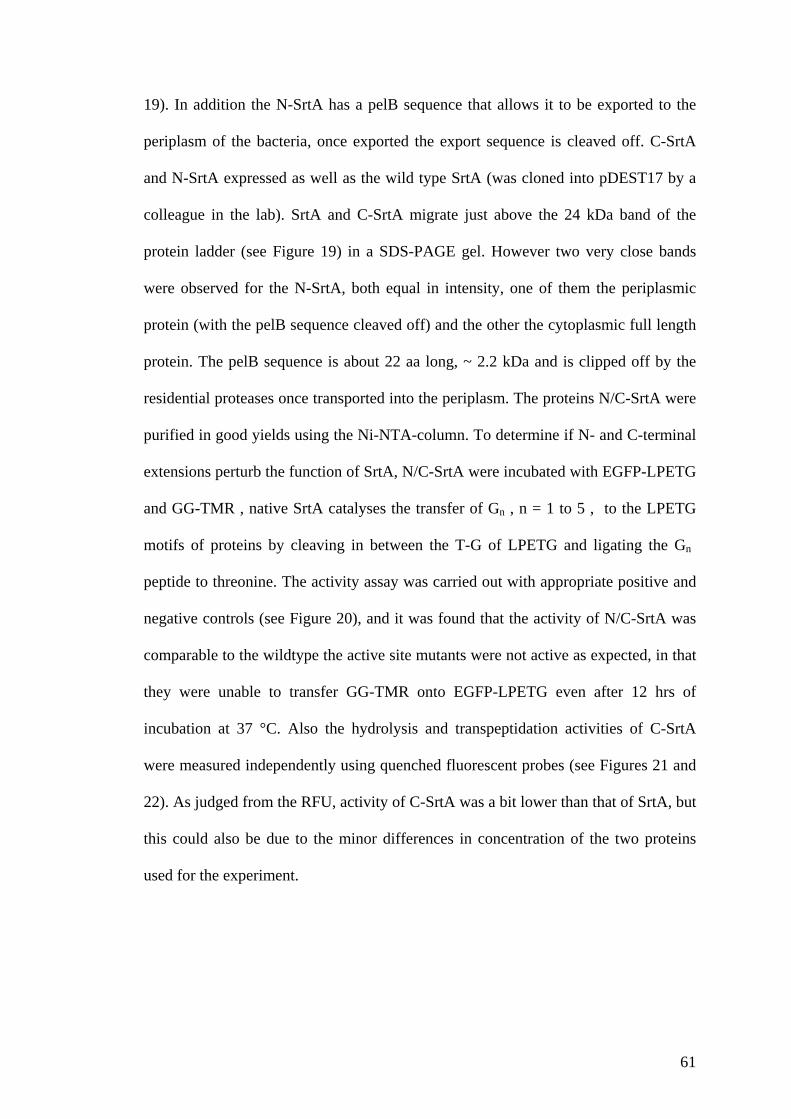
19). In addition the N-SrtA has a pelB sequence that allows it to be exported to the
periplasm of the bacteria, once exported the export sequence is cleaved off. C-SrtA
and N-SrtA expressed as well as the wild type SrtA (was cloned into pDEST17 by a
colleague in the lab). SrtA and C-SrtA migrate just above the 24 kDa band of the
protein ladder (see Figure 19) in a SDS-PAGE gel. However two very close bands
were observed for the N-SrtA, both equal in intensity, one of them the periplasmic
protein (with the pelB sequence cleaved off) and the other the cytoplasmic full length
protein. The pelB sequence is about 22 aa long, ~ 2.2 kDa and is clipped off by the
residential proteases once transported into the periplasm. The proteins N/C-SrtA were
purified in good yields using the Ni-NTA-column. To determine if N- and C-terminal
extensions perturb the function of SrtA, N/C-SrtA were incubated with EGFP-LPETG
and GG-TMR , native SrtA catalyses the transfer of Gn , n = 1 to 5 , to the LPETG
motifs of proteins by cleaving in between the T-G of LPETG and ligating the Gn
peptide to threonine. The activity assay was carried out with appropriate positive and
negative controls (see Figure 20), and it was found that the activity of N/C-SrtA was
comparable to the wildtype the active site mutants were not active as expected, in that
they were unable to transfer GG-TMR onto EGFP-LPETG even after 12 hrs of
incubation at 37 °C. Also the hydrolysis and transpeptidation activities of C-SrtA
were measured independently using quenched fluorescent probes (see Figures 21 and
22). As judged from the RFU, activity of C-SrtA was a bit lower than that of SrtA, but
this could also be due to the minor differences in concentration of the two proteins
used for the experiment.
61
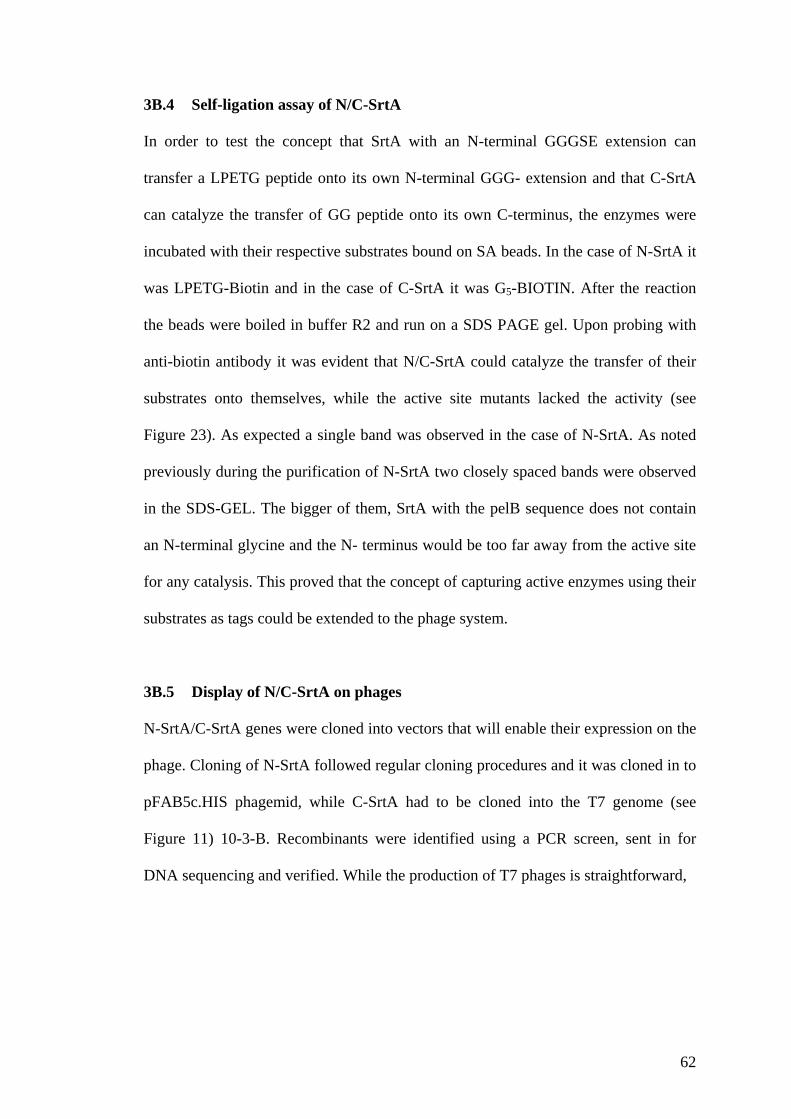
3B.4 Self-ligation assay of N/C-SrtA
In order to test the concept that SrtA with an N-terminal GGGSE extension can
transfer a LPETG peptide onto its own N-terminal GGG- extension and that C-SrtA
can catalyze the transfer of GG peptide onto its own C-terminus, the enzymes were
incubated with their respective substrates bound on SA beads. In the case of N-SrtA it
was LPETG-Biotin and in the case of C-SrtA it was G5-BIOTIN. After the reaction
the beads were boiled in buffer R2 and run on a SDS PAGE gel. Upon probing with
anti-biotin antibody it was evident that N/C-SrtA could catalyze the transfer of their
substrates onto themselves, while the active site mutants lacked the activity (see
Figure 23). As expected a single band was observed in the case of N-SrtA. As noted
previously during the purification of N-SrtA two closely spaced bands were observed
in the SDS-GEL. The bigger of them, SrtA with the pelB sequence does not contain
an N-terminal glycine and the N- terminus would be too far away from the active site
for any catalysis. This proved that the concept of capturing active enzymes using their
substrates as tags could be extended to the phage system.
3B.5 Display of N/C-SrtA on phages
N-SrtA/C-SrtA genes were cloned into vectors that will enable their expression on the
phage. Cloning of N-SrtA followed regular cloning procedures and it was cloned in to
pFAB5c.HIS phagemid, while C-SrtA had to be cloned into the T7 genome (see
Figure 11) 10-3-B. Recombinants were identified using a PCR screen, sent in for
DNA sequencing and verified. While the production of T7 phages is straightforward,
62
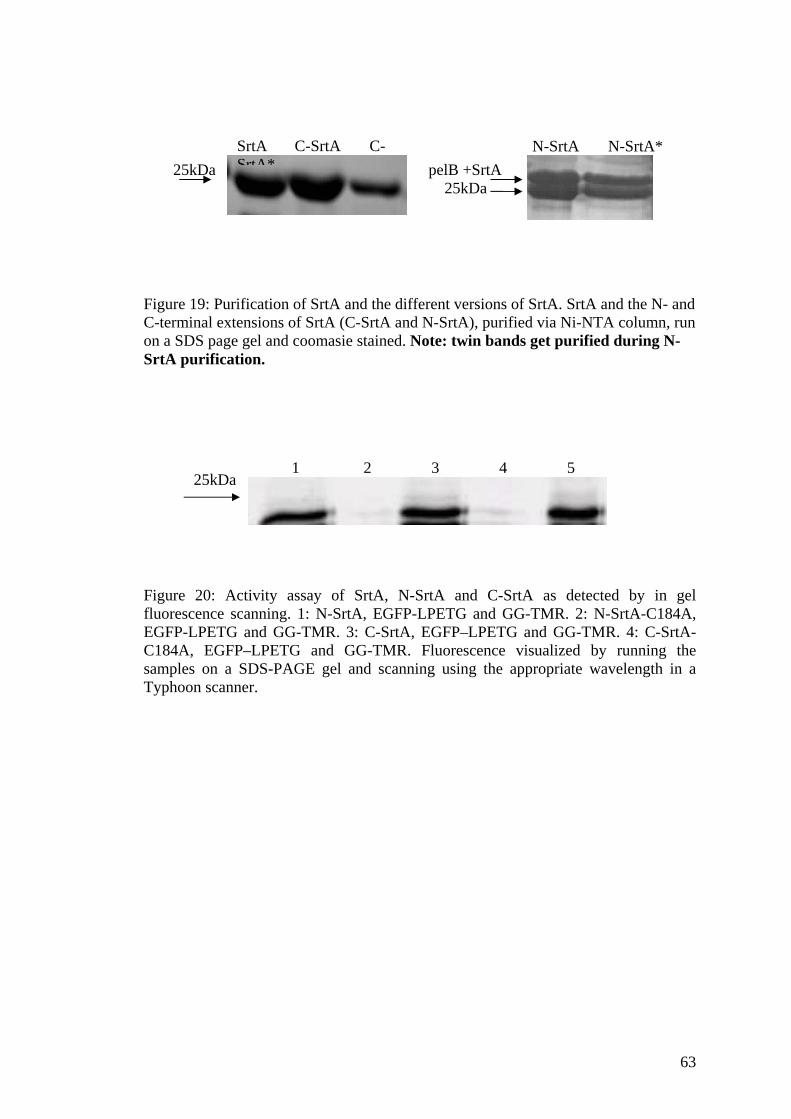
25kDa
pelB +SrtA 25kDa
N-SrtA N-SrtA*SrtA C-SrtA C-SrtA*
Figure 19: Purification of SrtA and the different versions of SrtA. SrtA and the N- and C-terminal extensions of SrtA (C-SrtA and N-SrtA), purified via Ni-NTA column, run on a SDS page gel and coomasie stained. Note: twin bands get purified during N-SrtA purification.
1 2 3 4 5 25kDa
Figure 20: Activity assay of SrtA, N-SrtA and C-SrtA as detected by in gel fluorescence scanning. 1: N-SrtA, EGFP-LPETG and GG-TMR. 2: N-SrtA-C184A, EGFP-LPETG and GG-TMR. 3: C-SrtA, EGFP–LPETG and GG-TMR. 4: C-SrtA-C184A, EGFP–LPETG and GG-TMR. Fluorescence visualized by running the samples on a SDS-PAGE gel and scanning using the appropriate wavelength in a Typhoon scanner.
63
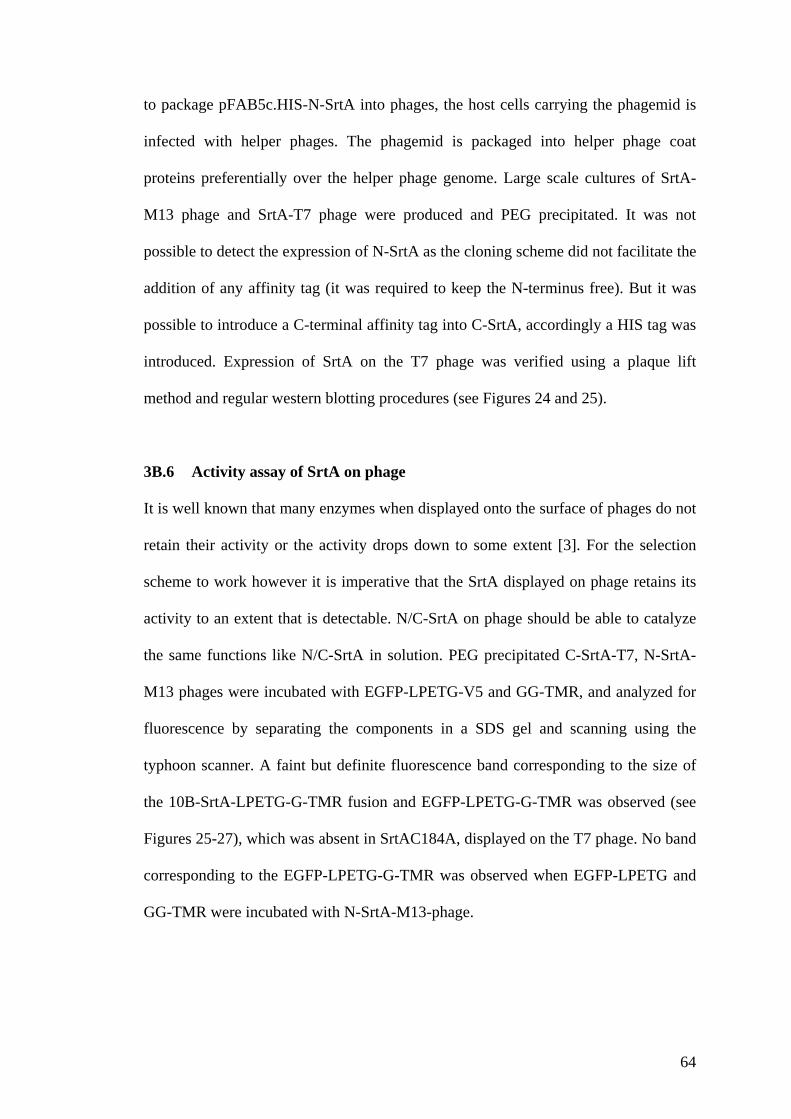
to package pFAB5c.HIS-N-SrtA into phages, the host cells carrying the phagemid is
infected with helper phages. The phagemid is packaged into helper phage coat
proteins preferentially over the helper phage genome. Large scale cultures of SrtA-
M13 phage and SrtA-T7 phage were produced and PEG precipitated. It was not
possible to detect the expression of N-SrtA as the cloning scheme did not facilitate the
addition of any affinity tag (it was required to keep the N-terminus free). But it was
possible to introduce a C-terminal affinity tag into C-SrtA, accordingly a HIS tag was
introduced. Expression of SrtA on the T7 phage was verified using a plaque lift
method and regular western blotting procedures (see Figures 24 and 25).
3B.6 Activity assay of SrtA on phage
It is well known that many enzymes when displayed onto the surface of phages do not
retain their activity or the activity drops down to some extent [3]. For the selection
scheme to work however it is imperative that the SrtA displayed on phage retains its
activity to an extent that is detectable. N/C-SrtA on phage should be able to catalyze
the same functions like N/C-SrtA in solution. PEG precipitated C-SrtA-T7, N-SrtA-
M13 phages were incubated with EGFP-LPETG-V5 and GG-TMR, and analyzed for
fluorescence by separating the components in a SDS gel and scanning using the
typhoon scanner. A faint but definite fluorescence band corresponding to the size of
the 10B-SrtA-LPETG-G-TMR fusion and EGFP-LPETG-G-TMR was observed (see
Figures 25-27), which was absent in SrtAC184A, displayed on the T7 phage. No band
corresponding to the EGFP-LPETG-G-TMR was observed when EGFP-LPETG and
GG-TMR were incubated with N-SrtA-M13-phage.
64
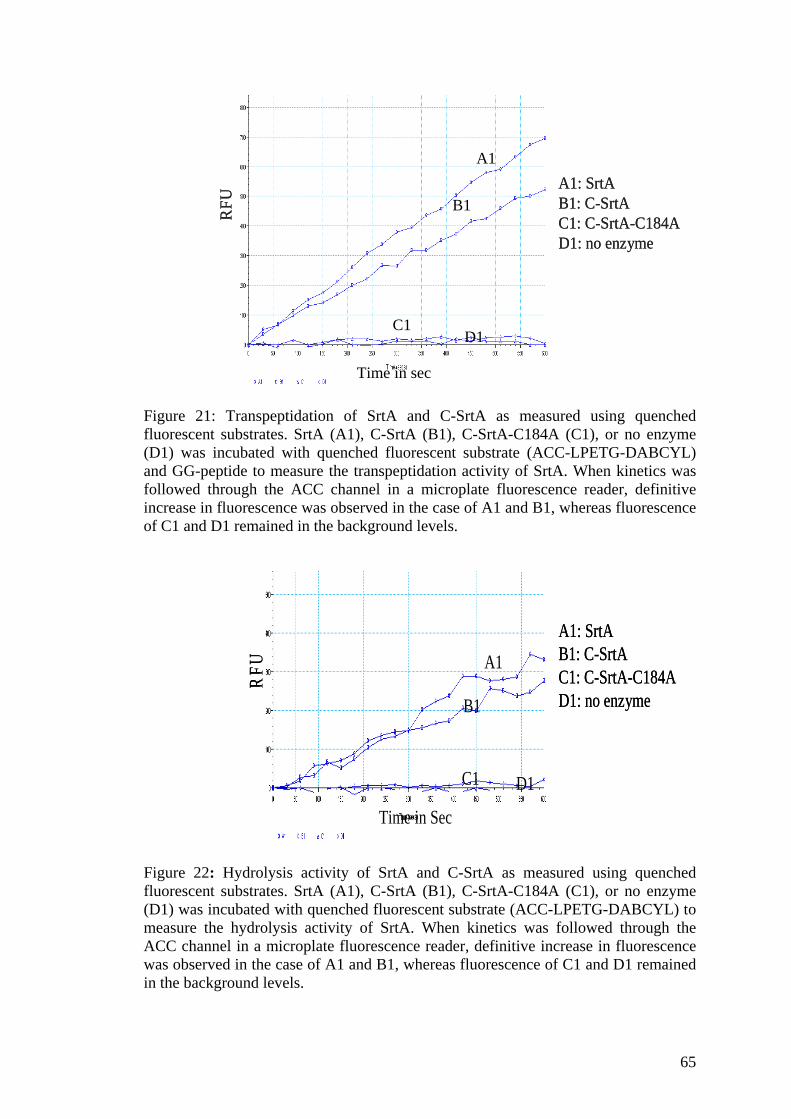
RFU
A1: SrtAB1: C-SrtAC1: C-SrtA-C184AD1: no enzyme
RFU
A1: SrtAB1: C-SrtAC1: C-SrtA-C184AD1: no enzyme
Time in sec
A1
B1
C1 D1
Figure 21: Transpeptidation of SrtA and C-SrtA as measured using quenched fluorescent substrates. SrtA (A1), C-SrtA (B1), C-SrtA-C184A (C1), or no enzyme (D1) was incubated with quenched fluorescent substrate (ACC-LPETG-DABCYL) and GG-peptide to measure the transpeptidation activity of SrtA. When kinetics was followed through the ACC channel in a microplate fluorescence reader, definitive increase in fluorescence was observed in the case of A1 and B1, whereas fluorescence of C1 and D1 remained in the background levels.
RFU
A1: SrtAB1: C-SrtAC1: C-SrtA-C184AD1: no enzyme
Time in Sec
A1
B1
C1 D1
RFU
A1: SrtAB1: C-SrtAC1: C-SrtA-C184AD1: no enzyme
Time in Sec
A1
B1
C1 D1
Figure 22: Hydrolysis activity of SrtA and C-SrtA as measured using quenched fluorescent substrates. SrtA (A1), C-SrtA (B1), C-SrtA-C184A (C1), or no enzyme (D1) was incubated with quenched fluorescent substrate (ACC-LPETG-DABCYL) to measure the hydrolysis activity of SrtA. When kinetics was followed through the ACC channel in a microplate fluorescence reader, definitive increase in fluorescence was observed in the case of A1 and B1, whereas fluorescence of C1 and D1 remained in the background levels.
65
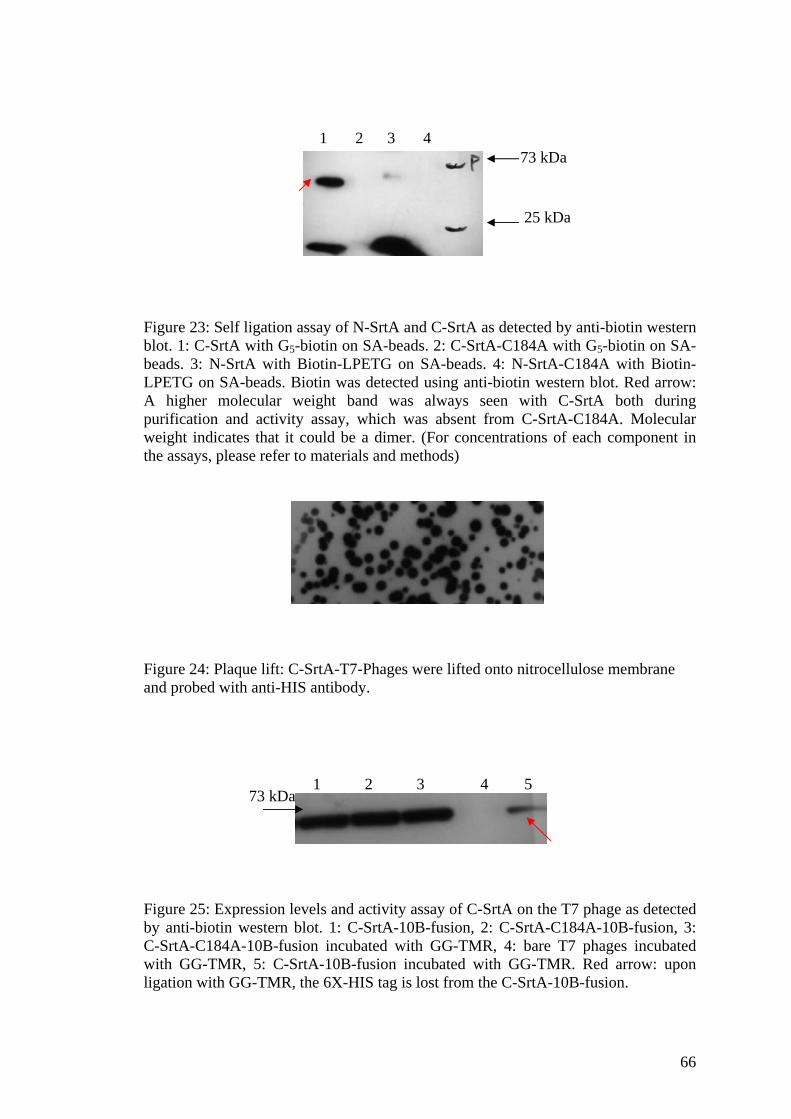
1 2 3 4
73 kDa
25 kDa
Figure 23: Self ligation assay of N-SrtA and C-SrtA as detected by anti-biotin western blot. 1: C-SrtA with G -biotin on SA-beads. 2: C-SrtA-C184A with G5 5-biotin on SA-beads. 3: N-SrtA with Biotin-LPETG on SA-beads. 4: N-SrtA-C184A with Biotin-LPETG on SA-beads. Biotin was detected using anti-biotin western blot. Red arrow: A higher molecular weight band was always seen with C-SrtA both during purification and activity assay, which was absent from C-SrtA-C184A. Molecular weight indicates that it could be a dimer. (For concentrations of each component in the assays, please refer to materials and methods)
Figure 24: Plaque lift: C-SrtA-T7-Phages were lifted onto nitrocellulose membrane and probed with anti-HIS antibody.
1 2 3 4 5 73 kDa
Figure 25: Expression levels and activity assay of C-SrtA on the T7 phage as detected by anti-biotin western blot. 1: C-SrtA-10B-fusion, 2: C-SrtA-C184A-10B-fusion, 3: C-SrtA-C184A-10B-fusion incubated with GG-TMR, 4: bare T7 phages incubated with GG-TMR, 5: C-SrtA-10B-fusion incubated with GG-TMR. Red arrow: upon ligation with GG-TMR, the 6X-HIS tag is lost from the C-SrtA-10B-fusion.
66
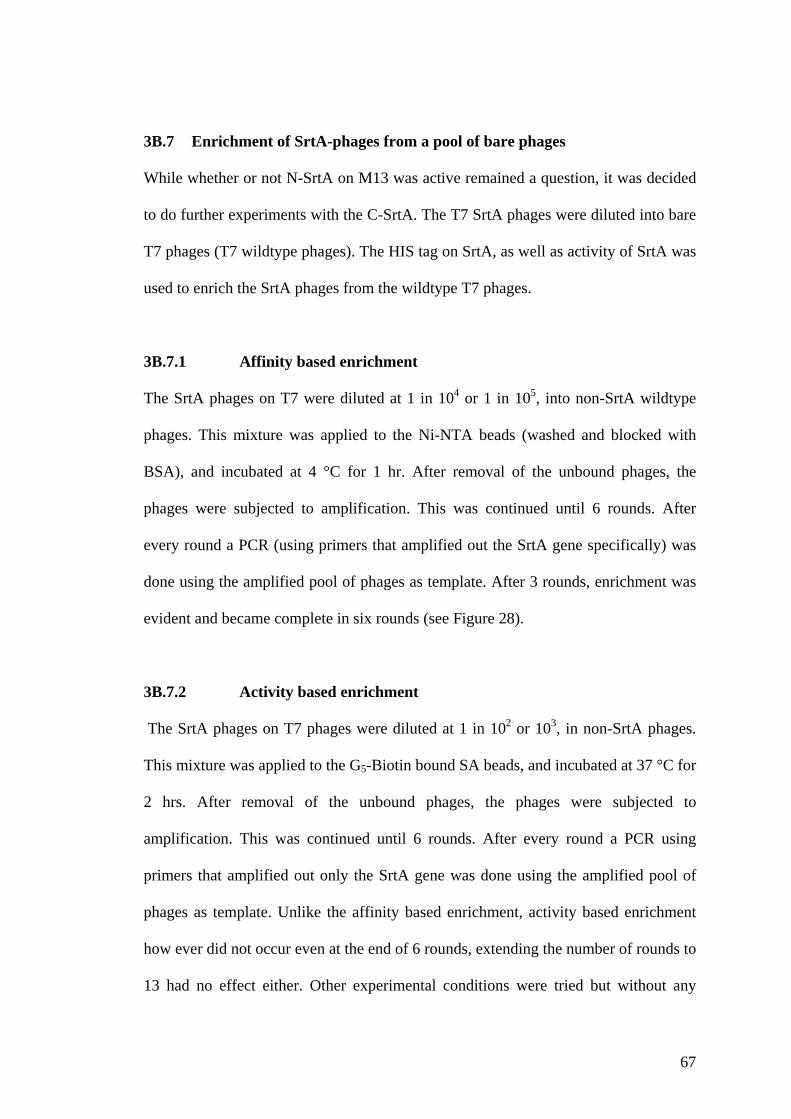
3B.7 Enrichment of SrtA-phages from a pool of bare phages
While whether or not N-SrtA on M13 was active remained a question, it was decided
to do further experiments with the C-SrtA. The T7 SrtA phages were diluted into bare
T7 phages (T7 wildtype phages). The HIS tag on SrtA, as well as activity of SrtA was
used to enrich the SrtA phages from the wildtype T7 phages.
3B.7.1 Affinity based enrichment
The SrtA phages on T7 were diluted at 1 in 104 or 1 in 105, into non-SrtA wildtype
phages. This mixture was applied to the Ni-NTA beads (washed and blocked with
BSA), and incubated at 4 °C for 1 hr. After removal of the unbound phages, the
phages were subjected to amplification. This was continued until 6 rounds. After
every round a PCR (using primers that amplified out the SrtA gene specifically) was
done using the amplified pool of phages as template. After 3 rounds, enrichment was
evident and became complete in six rounds (see Figure 28).
3B.7.2 Activity based enrichment
The SrtA phages on T7 phages were diluted at 1 in 102 or 103, in non-SrtA phages.
This mixture was applied to the G5-Biotin bound SA beads, and incubated at 37 °C for
2 hrs. After removal of the unbound phages, the phages were subjected to
amplification. This was continued until 6 rounds. After every round a PCR using
primers that amplified out only the SrtA gene was done using the amplified pool of
phages as template. Unlike the affinity based enrichment, activity based enrichment
how ever did not occur even at the end of 6 rounds, extending the number of rounds to
13 had no effect either. Other experimental conditions were tried but without any
67
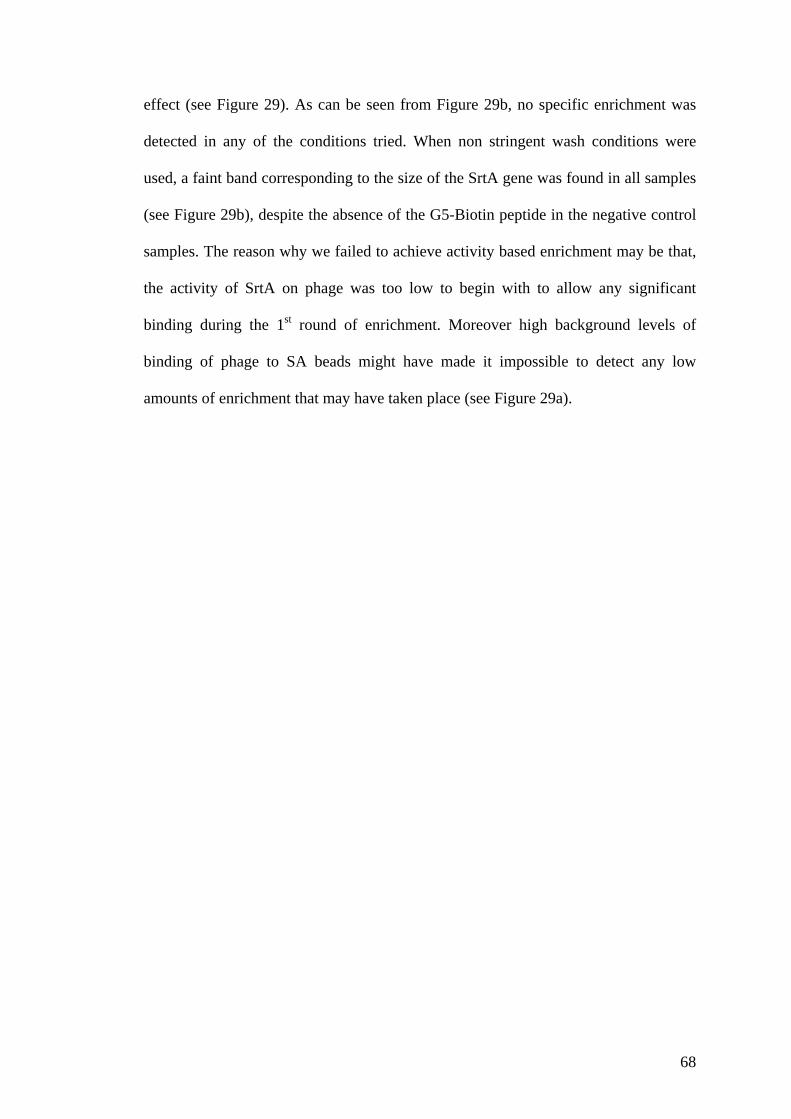
effect (see Figure 29). As can be seen from Figure 29b, no specific enrichment was
detected in any of the conditions tried. When non stringent wash conditions were
used, a faint band corresponding to the size of the SrtA gene was found in all samples
(see Figure 29b), despite the absence of the G5-Biotin peptide in the negative control
samples. The reason why we failed to achieve activity based enrichment may be that,
the activity of SrtA on phage was too low to begin with to allow any significant
binding during the 1st round of enrichment. Moreover high background levels of
binding of phage to SA beads might have made it impossible to detect any low
amounts of enrichment that may have taken place (see Figure 29a).
68
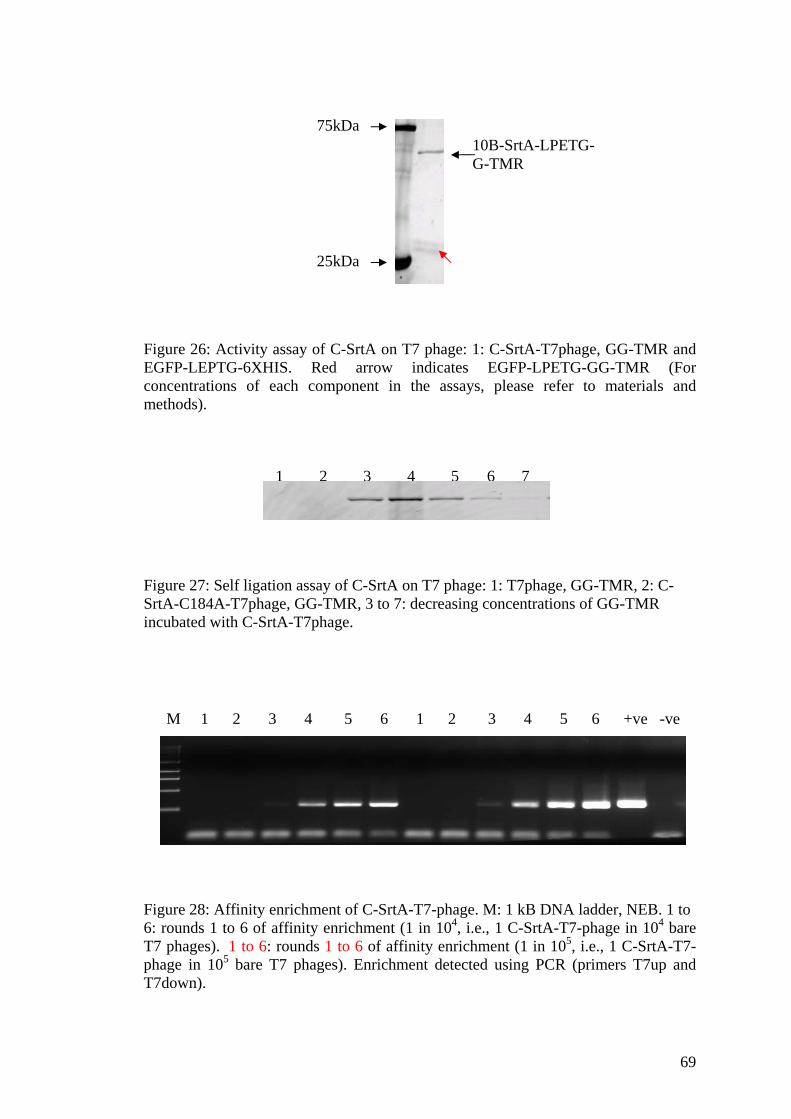
75kDa
25kDa
10B-SrtA-LPETG-G-TMR
Figure 26: Activity assay of C-SrtA on T7 phage: 1: C-SrtA-T7phage, GG-TMR and EGFP-LEPTG-6XHIS. Red arrow indicates EGFP-LPETG-GG-TMR (For concentrations of each component in the assays, please refer to materials and methods).
1 2 3 4 5 6 7
Figure 27: Self ligation assay of C-SrtA on T7 phage: 1: T7phage, GG-TMR, 2: C-SrtA-C184A-T7phage, GG-TMR, 3 to 7: decreasing concentrations of GG-TMR incubated with C-SrtA-T7phage.
M 1 2 3 4 5 6 1 2 3 4 5 6 +ve -ve
Figure 28: Affinity enrichment of C-SrtA-T7-phage. M: 1 kB DNA ladder, NEB. 1 to 6: rounds 1 to 6 of affinity enrichment (1 in 104, i.e., 1 C-SrtA-T7-phage in 104 bare T7 phages). 1 to 6: rounds 1 to 6 of affinity enrichment (1 in 105, i.e., 1 C-SrtA-T7-phage in 105 bare T7 phages). Enrichment detected using PCR (primers T7up and T7down).
69
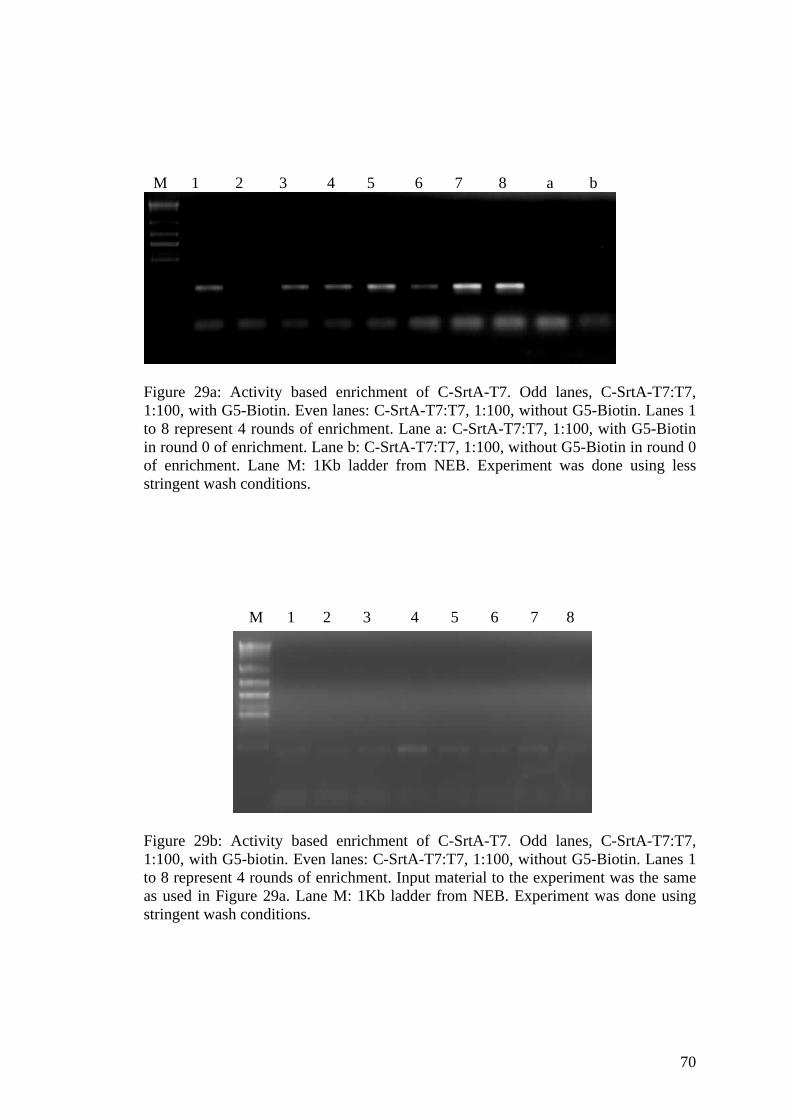
M 1 2 3 4 5 6 7 8 a b
Figure 29a: Activity based enrichment of C-SrtA-T7. Odd lanes, C-SrtA-T7:T7, 1:100, with G5-Biotin. Even lanes: C-SrtA-T7:T7, 1:100, without G5-Biotin. Lanes 1 to 8 represent 4 rounds of enrichment. Lane a: C-SrtA-T7:T7, 1:100, with G5-Biotin in round 0 of enrichment. Lane b: C-SrtA-T7:T7, 1:100, without G5-Biotin in round 0 of enrichment. Lane M: 1Kb ladder from NEB. Experiment was done using less stringent wash conditions.
M 1 2 3 4 5 6 7 8
Figure 29b: Activity based enrichment of C-SrtA-T7. Odd lanes, C-SrtA-T7:T7, 1:100, with G5-biotin. Even lanes: C-SrtA-T7:T7, 1:100, without G5-Biotin. Lanes 1 to 8 represent 4 rounds of enrichment. Input material to the experiment was the same as used in Figure 29a. Lane M: 1Kb ladder from NEB. Experiment was done using stringent wash conditions.
70
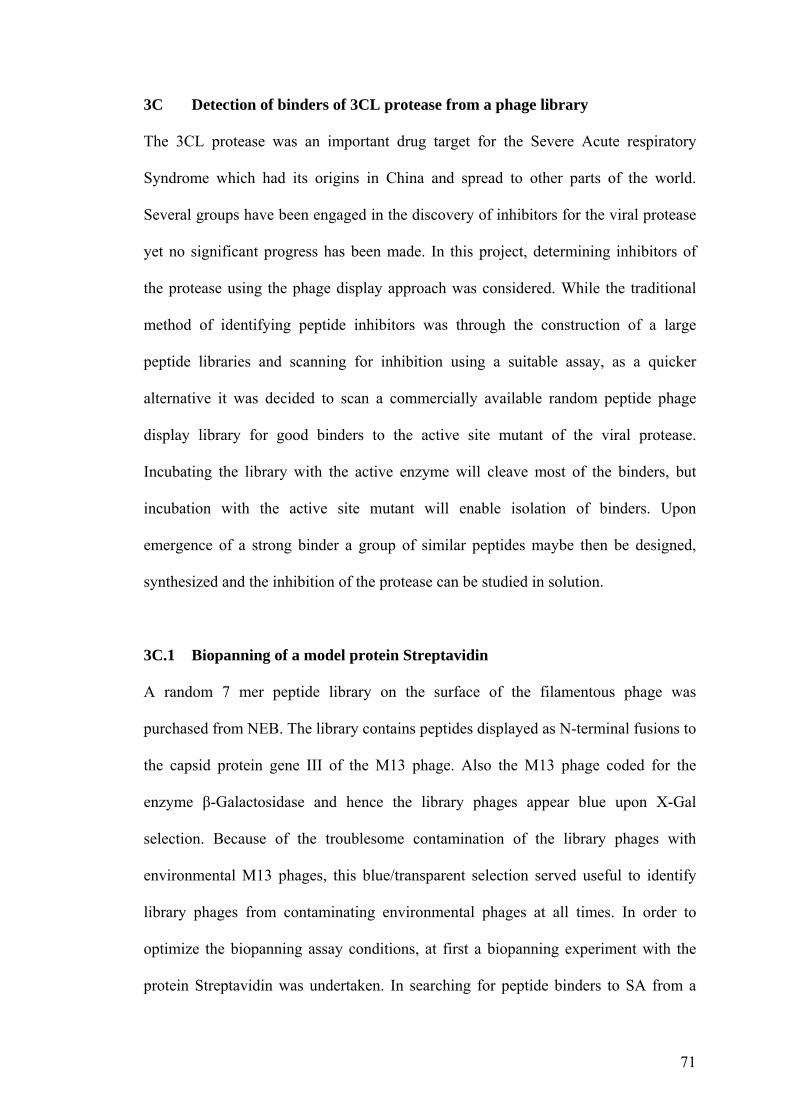
3C Detection of binders of 3CL protease from a phage library
The 3CL protease was an important drug target for the Severe Acute respiratory
Syndrome which had its origins in China and spread to other parts of the world.
Several groups have been engaged in the discovery of inhibitors for the viral protease
yet no significant progress has been made. In this project, determining inhibitors of
the protease using the phage display approach was considered. While the traditional
method of identifying peptide inhibitors was through the construction of a large
peptide libraries and scanning for inhibition using a suitable assay, as a quicker
alternative it was decided to scan a commercially available random peptide phage
display library for good binders to the active site mutant of the viral protease.
Incubating the library with the active enzyme will cleave most of the binders, but
incubation with the active site mutant will enable isolation of binders. Upon
emergence of a strong binder a group of similar peptides maybe then be designed,
synthesized and the inhibition of the protease can be studied in solution.
3C.1 Biopanning of a model protein Streptavidin
A random 7 mer peptide library on the surface of the filamentous phage was
purchased from NEB. The library contains peptides displayed as N-terminal fusions to
the capsid protein gene III of the M13 phage. Also the M13 phage coded for the
enzyme β-Galactosidase and hence the library phages appear blue upon X-Gal
selection. Because of the troublesome contamination of the library phages with
environmental M13 phages, this blue/transparent selection served useful to identify
library phages from contaminating environmental phages at all times. In order to
optimize the biopanning assay conditions, at first a biopanning experiment with the
protein Streptavidin was undertaken. In searching for peptide binders to SA from a
71
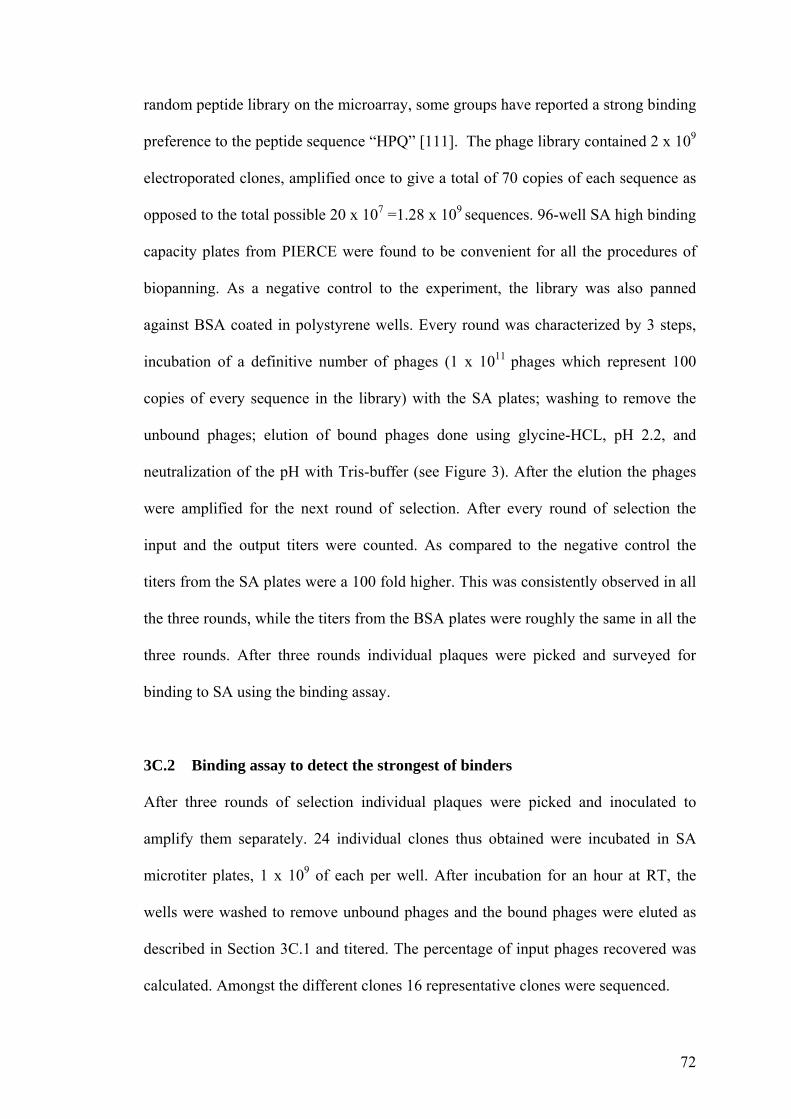
random peptide library on the microarray, some groups have reported a strong binding
preference to the peptide sequence “HPQ” [111]. The phage library contained 2 x 10⁹
electroporated clones, amplified once to give a total of 70 copies of each sequence as
opposed to the total possible 20 x 107 =1.28 x 10⁹ sequences. 96-well SA high binding
capacity plates from PIERCE were found to be convenient for all the procedures of
biopanning. As a negative control to the experiment, the library was also panned
against BSA coated in polystyrene wells. Every round was characterized by 3 steps,
incubation of a definitive number of phages (1 x 10¹¹ phages which represent 100
copies of every sequence in the library) with the SA plates; washing to remove the
unbound phages; elution of bound phages done using glycine-HCL, pH 2.2, and
neutralization of the pH with Tris-buffer (see Figure 3). After the elution the phages
were amplified for the next round of selection. After every round of selection the
input and the output titers were counted. As compared to the negative control the
titers from the SA plates were a 100 fold higher. This was consistently observed in all
the three rounds, while the titers from the BSA plates were roughly the same in all the
three rounds. After three rounds individual plaques were picked and surveyed for
binding to SA using the binding assay.
3C.2 Binding assay to detect the strongest of binders
After three rounds of selection individual plaques were picked and inoculated to
amplify them separately. 24 individual clones thus obtained were incubated in SA
microtiter plates, 1 x 10⁹ of each per well. After incubation for an hour at RT, the
wells were washed to remove unbound phages and the bound phages were eluted as
described in Section 3C.1 and titered. The percentage of input phages recovered was
calculated. Amongst the different clones 16 representative clones were sequenced.
72
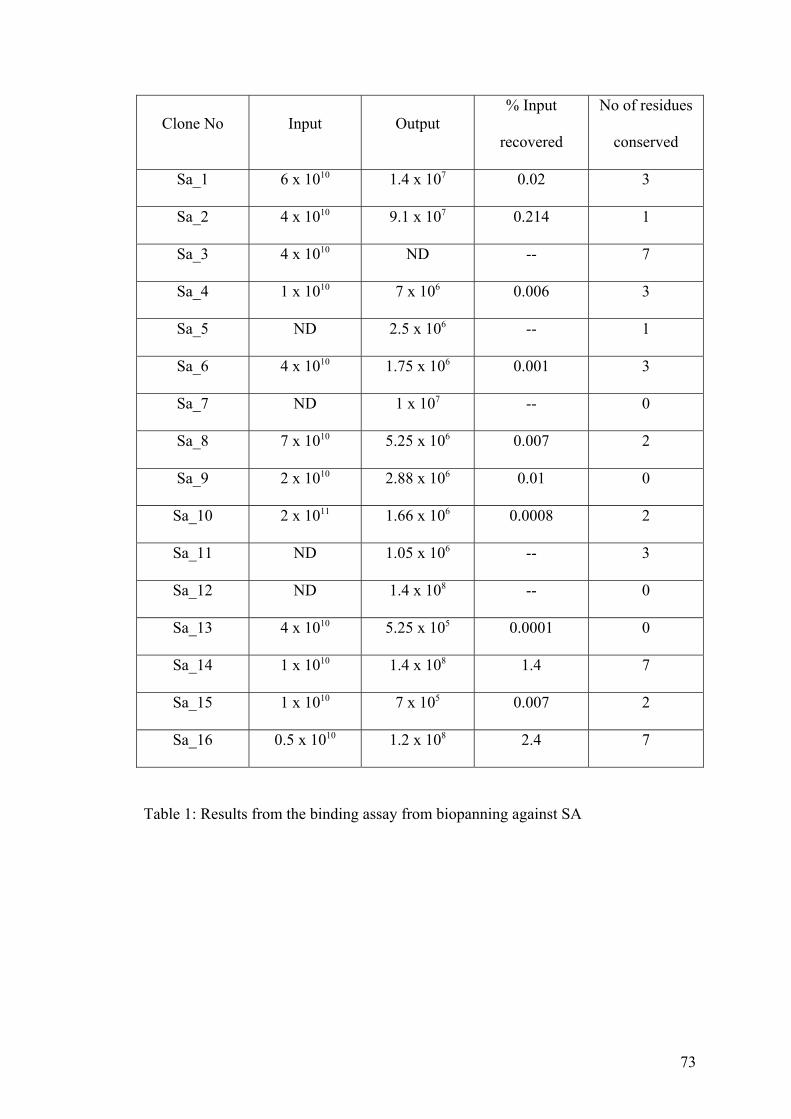
Clone No Input Output % Input
recovered
No of residues
conserved
Sa_1 6 x 10¹⁰ 1.4 x 10⁷ 0.02 3
Sa_2 4 x 10¹⁰ 9.1 x 10⁷ 0.214 1
Sa_3 4 x 10¹⁰ ND -- 7
Sa_4 1 x 10¹⁰ 7 x 10⁶ 0.006 3
Sa_5 ND 2.5 x 10⁶ -- 1
Sa_6 4 x 10¹⁰ 1.75 x 10⁶ 0.001 3
Sa_7 ND 1 x 10⁷ -- 0
Sa_8 7 x 10¹⁰ 5.25 x 10⁶ 0.007 2
Sa_9 2 x 10¹⁰ 2.88 x 10⁶ 0.01 0
Sa_10 2 x 10¹¹ 1.66 x 10⁶ 0.0008 2
Sa_11 ND 1.05 x 10⁶ -- 3
Sa_12 ND 1.4 x 10⁸ -- 0
Sa_13 4 x 10¹⁰ 5.25 x 10⁵ 0.0001 0
Sa_14 1 x 10¹⁰ 1.4 x 10⁸ 1.4 7
Sa_15 1 x 10¹⁰ 7 x 10⁵ 0.007 2
Sa_16 0.5 x 10¹⁰ 1.2 x 10⁸ 2.4 7
Table 1: Results from the binding assay from biopanning against SA
73
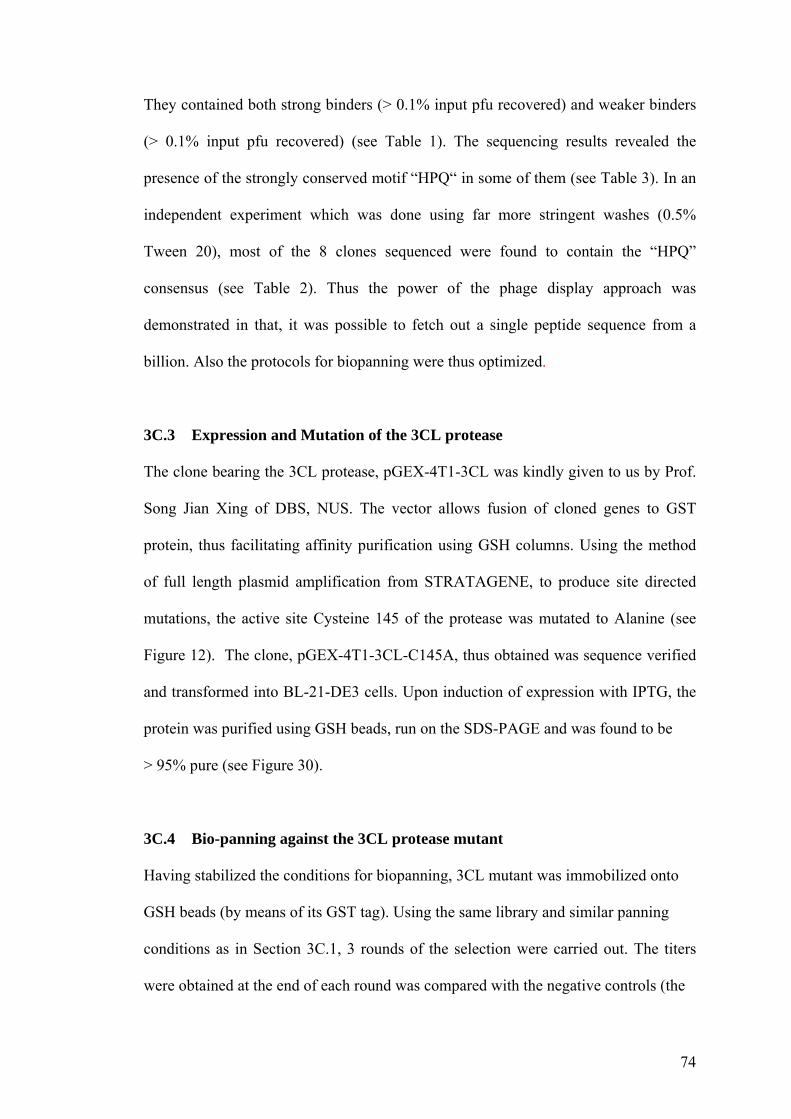
They contained both strong binders (> 0.1% input pfu recovered) and weaker binders
(> 0.1% input pfu recovered) (see Table 1). The sequencing results revealed the
presence of the strongly conserved motif “HPQ“ in some of them (see Table 3). In an
independent experiment which was done using far more stringent washes (0.5%
Tween 20), most of the 8 clones sequenced were found to contain the “HPQ”
consensus (see Table 2). Thus the power of the phage display approach was
demonstrated in that, it was possible to fetch out a single peptide sequence from a
billion. Also the protocols for biopanning were thus optimized.
3C.3 Expression and Mutation of the 3CL protease
The clone bearing the 3CL protease, pGEX-4T1-3CL was kindly given to us by Prof.
Song Jian Xing of DBS, NUS. The vector allows fusion of cloned genes to GST
protein, thus facilitating affinity purification using GSH columns. Using the method
of full length plasmid amplification from STRATAGENE, to produce site directed
mutations, the active site Cysteine 145 of the protease was mutated to Alanine (see
Figure 12). The clone, pGEX-4T1-3CL-C145A, thus obtained was sequence verified
and transformed into BL-21-DE3 cells. Upon induction of expression with IPTG, the
protein was purified using GSH beads, run on the SDS-PAGE and was found to be
> 95% pure (see Figure 30).
3C.4 Bio-panning against the 3CL protease mutant
Having stabilized the conditions for biopanning, 3CL mutant was immobilized onto
GSH beads (by means of its GST tag). Using the same library and similar panning
conditions as in Section 3C.1, 3 rounds of the selection were carried out. The titers
were obtained at the end of each round was compared with the negative controls (the
74

1 2 3
54kDa
Figure 30: Expression levels of 3CL protease and 3CL protease mutant. 1: Crude cell lysate from un-induced lane, 2: Crude cell lysate of over expressed 3CL protease. 3: Crude cell lysate of over expressed 3CL-C145A.
Clone number Sequence
1 S L I A H P Q
2 T L L A H P Q
3 H F W D H P Q
4 S L I N H P Q
5 H F W D H P Q
6 T L L A H P Q
7 L L W P S L P
8 S T G S T F W
Table 2: Sequencing results of the peptides from biopanning against Streptavidin. 6 clones out of the 8 that were sequenced contained the strongly conserved motif HPQ, the rest showed conserved residues in various positions as indicated above in red fonts. This experiment was done using stringent wash conditions.
75
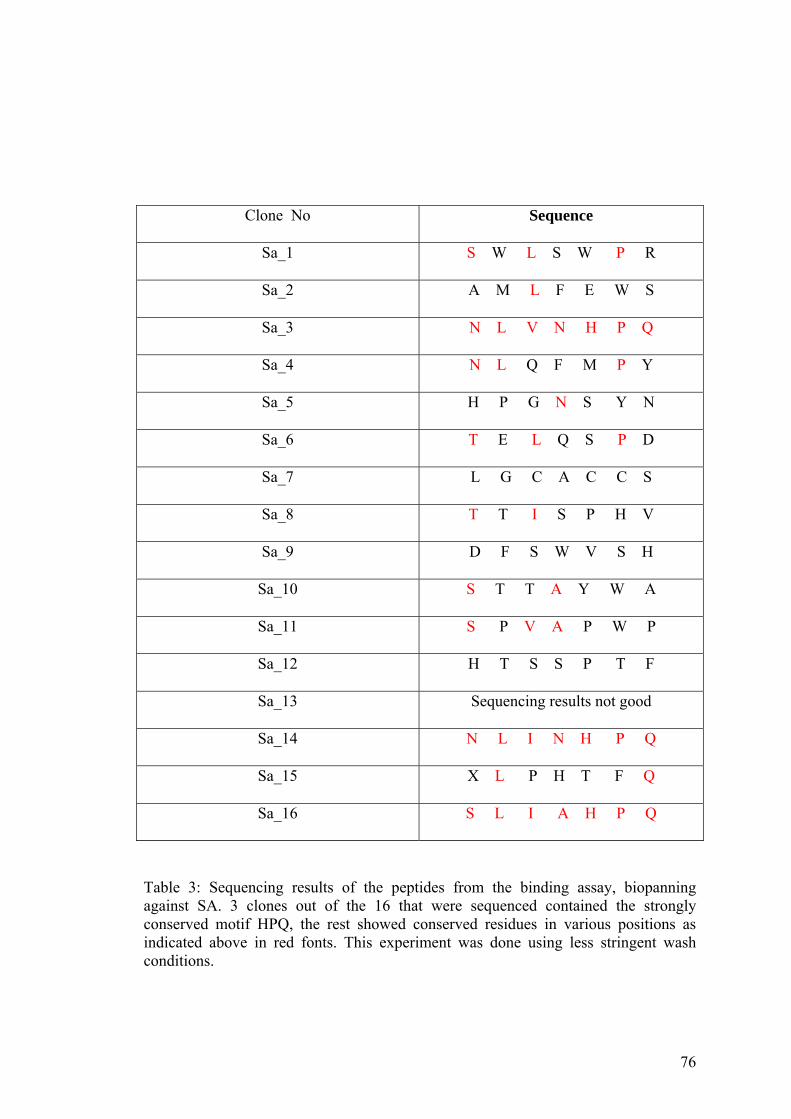
Clone No Sequence
Sa_1 S W L S W P R
Sa_2 A M L F E W S
Sa_3 N L V N H P Q
Sa_4 N L Q F M P Y
Sa_5 H P G N S Y N
Sa_6 T E L Q S P D
Sa_7 L G C A C C S
Sa_8 T T I S P H V
Sa_9 D F S W V S H
Sa_10 S T T A Y W A
Sa_11 S P V A P W P
Sa_12 H T S S P T F
Sa_13 Sequencing results not good
Sa_14 N L I N H P Q
Sa_15 X L P H T F Q
Sa_16 S L I A H P Q
Table 3: Sequencing results of the peptides from the binding assay, biopanning against SA. 3 clones out of the 16 that were sequenced contained the strongly conserved motif HPQ, the rest showed conserved residues in various positions as indicated above in red fonts. This experiment was done using less stringent wash conditions.
76
phage library applied to the GSH beads). However no clear increase in titers as seen
for the SA control experiment was visible. If the binders to the 3CL mutant were
weak in binding affinity then no clear difference in titers between that of the protease
and BSA bound beads could be expected. Hence more rounds of selection were
carried out. At the end of 6 rounds, 24 clones were selected for binding assay against
the 3CL mutant immobilized on ELISA plates. However upon counting the titers,
many of the clones were found to have negligible binding, almost equivalent to that of
the negative control (BSA immobilized on the ELISA plates). Nevertheless some of
the binders were sequenced. None of the sequences obtained were similar to the
substrates already known (see Table 4), and in corroboration to the binding assay
results, no consensus sequence had been reached. The reason why we failed to isolate
good and specific binders could be manifold. It was expected that atleast “substrate
like” sequences would be isolated. Studies have established that the 3CL protease
prefers a hydrophobic residue in the P2 position, a glutamine in the P1 position, and
alanine, serine or glycine residue in the P1’ residue [106]. The probability of finding
the reported substrate sequence “AVLQSGF” was calculated as per the suggestions
given in the manual of the peptide phage display library. The formula suggests the
existence of at least 3 such sequences in the library. During the course of the
experiments, the library material obtained from the manufacturer was amplified once
to give more material. However, once the library is replicated to produce more
material the chances of finding all the sequences from the initial library are reduced. It
largely depends on whether all the phages in the original library infected and
replicated in the host cells. Also it might be possible that the library that was used
contained no good binders at all. Many groups in fact custom-make dedicated peptide
77
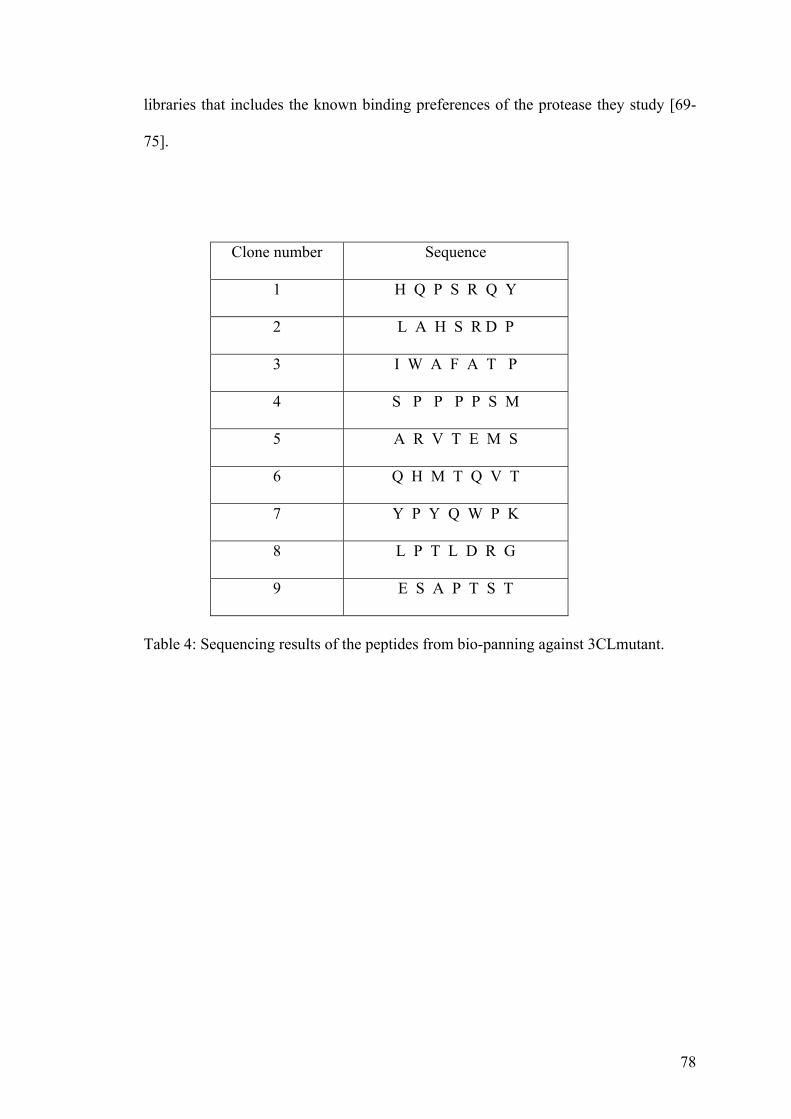
libraries that includes the known binding preferences of the protease they study [69-
75].
Clone number Sequence
1 H Q P S R Q Y
2 L A H S R D P
3 I W A F A T P
4 S P P P P S M
5 A R V T E M S
6 Q H M T Q V T
7 Y P Y Q W P K
8 L P T L D R G
9 E S A P T S T
Table 4: Sequencing results of the peptides from bio-panning against 3CLmutant.
78
4. Conclusions
In this thesis three different approaches to protein engineering and modulation were
evaluated. As one of the approaches to protein engineering, a strategy for the
immobilization of proteins site-specifically via the N-terminus onto the microarray
was developed. The chosen model proteins were cloned into a vector system that
facilitates the expression of the protein with an N-terminal intein fusion. An extra
cysteine residue was introduced at the junction of the intein and protein fusion. Upon
expression of the intein-protein fusion, intein splices out, leaving the protein with an
N-terminal cysteine. The proteins thus produced were applied onto thioester-
functionalized slides for uniform orientation. As a complementary method, intein
based approach to site-specifically biotinylate proteins derived from yeast on their C-
terminus was successfully set up. Three different commercially available inteins were
tested out. Amongst them one, the Sce VMA intein was chosen as the intein of choice
because of its high yields and minimal in vivo cleavage. It was shown successfully
that EGFP fused to Sce VMA intein and expressed from small scale cultures in yeast
could be biotinylated at the C-terminus using the intein mediated thioester generation
process. Further experiments were done to immobilize the biotinylated proteins onto
avidin derived surfaces. Despite optimizing procedures the yields of biotinylated
proteins was not sufficient to achieve immobilization on the microarray. While this
problem could be solved by expressing the proteins in large scale cultures from yeast,
it was not pursued further, as the protocol was not adaptable to high throughput
immobilization. Hence it was concluded that obtaining biotinylated proteins in a high
throughput manner from yeast, (e.g. in 96 well plates), was not feasible using this
approach.
79
A selection scheme for evolving SrtA on phage has been setup. The selection scheme
is a varied version of the product capture approach used to evolve enzymes on the
phages. The selection scheme was at first proved by expressing SrtA with its C-
terminus fused to its LPETG substrate (C-SrtA). When C-SrtA was incubated with
G5-Biotin, it was able to catalyze the transfer of G5-Biotin onto its own C- terminus,
thus proving the self-ligation ability of SrtA. C-SrtA was then successfully displayed
on the phage and its activity was proven. Finally C-SrtA-T7 proved capable of
ligating GG-TMR onto itself, thus demonstrating the success of the selection scheme.
However the activity of SrtA on phage was such that we were unable to enrich it
based on its activity from a pool of bare phages. Nevertheless, using this selection
scheme and a library of random mutants of SrtA, enzymes with improved activity
may be selected for in the future. A suitable screening method may then be used to
identify the most active members. The screened pool can also be subjected to further
rounds of mutagenesis and the selection might be repeated. The whole process can be
continued until SrtA with desired activity evolves.
A peptide library on phage was scanned for inhibitors to the SARS viral protease
3CL. Using the affinity selection method that is routinely used to biopan peptide
libraries on phage, a commercially available peptide library was scanned for affinity
binders to the mutant 3CL protease immobilized on GST beads. After several rounds
of affinity purification weak binders to the protease was identified. While we failed to
identify strong binders from this library, using the protocols that were established
during the course of this project, several commercially available peptide display
libraries could be scanned against mutant proteases. This might yield good binders in
80

a cost effective and rapid fashion compared to other traditional approaches to inhibitor
discovery.
81
5. References
[1] Brannigan, J.A. and Wilkinson, A.J., (2002), Protein engineering 20 years on. Nat.
Rev. Mol. Cell. Biol., 3, 964-970.
[2]. Recktenwald, A., Schomburg, D., and Schmid, R.D., (1993), Protein engineering
and design: Method and the industrial relevance. J. Biotechnol., 28, 1-23.
[3] Gacio, A. F., Uguen, M., and Fastrez, J., (2003), Phage display as a tool for the
directed evolution of enzymes. Trends. Biotechnol., 21, 408-414.
[4] Yuan, L., Kurek, I., English, J., and Keenan, R., (2005), Laboratory-directed
protein evolution. Microbiol. Mol. Biol. Rev., 69, 373-392.
[5] Bloom, J.D., Meyer, M.M., Meinhold P, Otey, C.R., MacMillan, D., and Arnold,
F.H., (2005), Evolving strategies for enzyme engineering. Curr. Opin. Struct. Biol.,
15, 447-452.
[6] Girish, A., Sun, H., Yeo, D.S.Y., Chen, G.Y.J., Chua, T.K., and Yao, S.Q.,
(2005), Site-specific immobilization of proteins in a microarray using intein-mediated
protein splicing. Bioorg. Med. Chem. Lett., 15, 2447-2451.
[7] Tan, L.P., and Yao, S.Q., (2005), Intein-mediated, in vitro and in vivo protein
modifications with small molecules. Prot. Pept. Lett., 12, 769-775.
[8] Tan, L.P., Lue, R.Y.P., Chen, G.Y.J., and Yao, S.Q., (2004), Improving the Intein-
mediated, site-specific protein biotinylation strategies both in vitro and in vivo.
Bioorg. Med. Chem. Lett., 14, 6067-6070.
[9] Tan, L.P., Chen, G.Y.J., and Yao, S.Q., (2004), Expanding the scope of site-
specific protein biotinylation strategies using small molecules. Bioorg. Med. Chem.
Lett., 14, 5735-5738.
82
[10] Lue, R.Y.P., Chen, G.Y.J., Hu, Y., Zhu, Q., and Yao, S.Q., (2004), Versatile
protein biotinylation strategies for potential high-throughput proteomics. J. Am.
Chem. Soc., 126, 1055-1062.
[11] Lesaicherre, M.L., Lue, Y.P.R., Chen, G.Y.J., Zhu, Q., and Yao, S.Q., (2002),
Intein-mediated biotinylation of proteins and its application in a protein microarray. J.
Am. Chem. Soc., 124, 8768-8769.
[12] Howarth, M., Takao, K., Hayashi, Y., Ting, A.Y., (2005), Targeting quantum
dots to surface proteins in living cells with biotin ligase. Proc. Natl. Acad. Sci. USA,
102, 7583-7588.
[13] Mao, H., Hart, S.A., Schink, A., and Pollok, B.A., (2004), Sortase-Mediated
Protein Ligation: A New Method for Protein Engineering. J. Am. Chem. Soc., 126,
2670-2671.
[14] Yin, J., Liu, F., Li, X., Walsh, C.T., (2004), Labeling Proteins with Small
Molecules by Site-Specific Posttranslational Modification. J. Am. Chem. Soc., 126,
7754-7755.
[15] Tian, F., Tsao, M.L., Schultz, P.G., (2004), A phage display system with
unnatural amino acids. J. Am. Chem. Soc., 126, 15962-15963.
[16] Wang, L., Schultz, P.G., (2004), Expanding the genetic code. Angew. Chem. Int.
Ed. Engl., 44, 34-66.
[17] Xie, J., Wang, L., Wu, N., Brock, A., Spraggon, G., Schultz, P.G., (2004), The
site-specific incorporation of p-iodo-L-phenylalanine into proteins for structure
determination. Nat. Biotechnol., 22, 1297-1301.
[18] Zhang, Z., Alfonta, L., Tian, F., Bursulaya, B., Uryu, S., King, D.S., Schultz,
P.G., (2004), Selective incorporation of 5-hydroxytryptophan into proteins in
mammalian cells. Proc. Natl. Acad. Sci. USA, 101, 8882-8887.
83
[19] Zhang, Z., Gildersleeve, J., Yang, Y.Y., Xu, R., Loo, J.A., Uryu, S., Wong,
C.H., Schultz, P.G., (2004), A new strategy for the synthesis of glycoproteins.
Science, 303, 371-373.
[20] Srinivasan, R., Yao, S.Q., and Yeo, D.S., (2004), Chemical approaches for live
cell bioimaging. Comb. Chem. High. Throughput Screen., 7, 597-604.
[21]. Hassan, M., Klaunberg,B.A., (2004), Biomedical applications of fluorescence
imaging in vivo. Comp. Med., 54, 635-644.
[22]. Yeo, S.Y.D., Panicker, R.C., Tan, L.P., and Yao, S.Q., (2004), Strategies for
immobilization of biomolecules in a microarray. Comb. Chem. High Throughput
Screen., 7, 213-221.
[23] Huang, X., Panicker, R.C., and Yao, S.Q., (2005), Activity-Based Fingerprinting
and Inhibitor Discovery of Cysteine Proteases in a Microarray, submitted.
[24] Srinivasan, R., Huang, X., Ng, S.L., and Yao, S.Q., (2006), Activity-Based
Fingerprinting of Proteases. ChemBioChem, 7, 32-36.
[25] Zhu, Q., Girish, A., Chattopadhaya, S., Yao, S.Q., (2004), Developing novel
activity-based fluorescent probes that target different classes of proteases. Chem.
Commun., 13, 1512-1513.
[26] Chen, G.Y.J., Uttamchandani, M., Zhu, Q., Wang, G., and Yao, S.Q., (2003),
Developing a strategy for activity-based detection of enzymes in a protein microarray.
ChemBiochem. 4, 336-339.
[27] Derbyshire,V., and Belfort, M., (1998) Lightning strikes twice: Intron–Intein
coincidence. Proc. Natl. Acad. Sci. USA, 95, 1356–1357.
[28] Hirata,R., Ohsumi,Y., Nakano,A., Kawasaki,H., Suzuki,K. and Anraku,Y.,
(1990), Molecular structure of a gene, VMA1, encoding the catalytic subunit of H(+)-
84
translocating adenosine triphosphatase from vacuolar membranes of Saccharomyces
cerevisiae. J. Biol. Chem., 265, 6726–6733.
[29] Kane, P.M., Yamashiro, C.T., Wolczyk, D.F., Neff, N., Goebl, M. and
Stevens, T.H., (1990), Protein splicing converts the yeast TFP1 gene product to the
69-kD subunit of the vacuolar H(+)-adenosine triphosphatase. Science, 250, 651–657.
[30] Pietrokovski, S., (2001). Intein spread and extinction in Evolution. Trends
Genet., 17, 465-472.
[31] www.neb.com , The Intein database: In Base
[32] Xu, M.Q., and Evans, T.C., (2005), Recent advances in protein splicing:
manipulating proteins in vitro and in vivo. Curr. Opin. Chem. Biol., 16, 440–446
[33] Cooper, A.A., and Stevens, T.H., (1995), Protein splicing: self splicing of
genetically mobile elements at the protein level. Trends Biochem. Sci., 20, 351-356.
[34] Shao, Z., and Arnold, F.H. (1996), Engineering new functions and altering
existing functions. Curr. Opin. Struct.Biol., 6, 513–518.
[35] Evans, T.C. Jr, Benner, J., Xu, M.Q., (1998), Semisynthesis of cytotoxic proteins
using a modified protein splicing element. Protein Sci., 7, 2256–2264.
[36] Evans, T.C. Jr, Benner, J., Xu, M.Q., (1999), The cyclization and polymerization
of bacterially expressed proteins using modified self-splicing inteins. J. Biol. Chem.,
274, 18359-18363.
[37] Muir, T.M., Sondhi, D., and Cole, P.A., (1998), Expressed protein ligation: A
general method for protein engineering. Proc. Natl. Acad. Sci. USA, 95, 6705–6710.
[38] Mootz, H.D., Blum, E.S., Tyszkiewicz, A.B., Muir, T.W., (2003). Conditional
protein splicing: a new tool to control protein structure and function in vitro and in
vivo. J. Am. Chem.Soc., 125, 10561-10569.
85
[39] Skretas, G., and Wood, D.W., (2005), Regulation of protein splicing with small
molecule controlled inteins. Protein Sci, 14, 523-532.
[40] Amitai, G., and Pietrokovski, S., (1999), Fine-tuning an engineered Intein. Nat.
Biotechnol., 17, 854-855.
[41] Derbyshire, V., (1997), Genetic definition of a protein-splicing domain:
Functional mini-inteins support structure predictions and a model for Intein evolution.
Proc. Natl. Acad. Sci. USA., 94, 11466–11471.
[42] Wood, D.W., (1999), A genetic system yields self-cleaving inteins for
bioseparations. Nat. Biotechnol., 17, 889–892
[43] Hu, Y., Uttamchandani, M., and Yao, S.Q., (2006), Microarray: a versatile
platform for high-throughput functional proteomics. Comb. Chem. High Throughput
Screening, in press.
[44] Uttamchandani, M., Wang, J., and Yao, S.Q., (2006), Protein and small molecule
microarrays: powerful tools for high-throughput proteomics. Mol. BioSyst., 2, 58-68.
[45] LaBaer, J., and Ramachandran, N., (2005), Protein Microarrays as tools for
functional proteomics. Curr. Opin. Chem. Biol., 9, 14-19
[46] Cha, T., Guo, A., and Zhu, X.Y., (2005), Enzymatic activity on a chip: The
critical role of protein orientation. Proteomics, 5, 416-419
[47] Yeo, S.Y.D., et al., (2004). Strategies for immobilization of biomolecules in a
microarray. Comb. Chem. High Throughput Screening , 7, 213-221
[50] Wilson D.R., and Finlay, B.R., (1998), Phage display: applications, innovations,
and issues in phage and host biology. Can. J. Micorbiol., 44, 313-329.
[51] Primrose, S., Twyman, R., Old, B., (2001), Principles of gene manipulation. 6th
ed, Blackwell Science, Oxford.
86
[52] Maniatis, T., Fritsch, E.F., Sambrook, J., (1982), Molecular cloning: a laboratory
manual. Cold Spring Harbor, New York.
[53] Parmley, S.F., and Smith, G.P., (1988), Antibody selectable filamentous fd phage
vectors: affinity purification of target genes. Gene, 73, 305-318.
[54] Scott, J.K., Smith, G.P., (1990), Searching for peptide ligands with an epitope
library. Science, 249, 386-390.
[55] Smith, G.P., and Petrenko, V.A., (1997), Phage Display. Chem. Rev., 97, 391-
410
[56] Benhar, I., (2001), Biotechnological applications of phage and cell display.
Biotechnol. Adv., 19, 1-33.
[57] Greenwood, J., Willis, A. E., Perham, R. N., (1991), Multiple display of foreign
peptides on a filamentous bacteriophage : Peptides from Plasmodium falciparum
circumsporozoite protein as antigens. J. Mol. Biol., 220, 821-827.
[58] McConnell, S. J., Kendall, M. L., Reilly, T. M., Hoess, R. H., (1994),
Constrained peptide libraries as a tool for finding mimotopes. Gene, 151, 115-8.
[59] Crameri, R., Jaussi, R., Menz, G., Blaser, K., (1994), Display of Expression
Products of cDNA Libraries on Phage Surfaces: A Versatile Screening System for
Selective Isolation of Genes by Specific Gene-Product/Ligand Interaction. Eur. J.
Biochemistry, 226, 53-58.
[60] Corey, D. R., Shiau, A. K., Yang, Q., Janowski, B. A., Craik, C.S., (1993),
Trypsin display on the surface of bacteriophage. Gene, 128, 129-134.
[61] van Zonneveld, A. J., van den Berg, B. M., van Meijer, M., Pannekoek, H.,
(1995), Identification of functional interaction sites on proteins using bacteriophage-
displayed random epitope libraries. Gene, 167, 49-52.
87
[62] Doorbar, J., Winter, G., (1994), Isolation of a Peptide Antagonist to the
Thrombin Receptor using Phage Display. J. Mol. Biol., 244, 361-369.
[63] Rickles, R.J., Botfield, M. C., Zhou, X. M., Henry, P. A., Brugge, J. S., Zoller,
M. J., (1995), Phage Display Selection of Ligand Residues Important for Src
Homology 3 Domain Binding Specificity. Proc. Natl. Acad. Sci. USA, 92, 10909-
10913.
[64] Cheadle, C., Ivashchenko, Y., South, V., Searfoss, G. H., French, S., Howk, R.,
Ricca, G. A., Jaye, M., (1994), Identification of a Src SH3 domain binding motif by
screening a random phage display library. J. Biol. Chem., 269, 24034-24039.
[65] Rickles, R. J., Botfield, M. C., Weng, Z., Taylor, J. A., Green, O.M., Brugge, J.
S., Zoller, M. J., (1994), Identification of Src, Fyn, Lyn, PI3K and Abl SH3 domain
ligands using phage display libraries. EMBO J., 13, 5598-5604.
[66] Wrighton, N. C., Farrell, F. X., Chang, R., Kashyap, A. K., Barbone, F. P.,
Mulcahy, L. S., Johnson, D. L., Barrett, R. W., Jolliffe, L. K., Dower, W. J., (1996),
Small Peptides as Potent Mimetics of the Protein Hormone Erythropoietin. Science,
273, 458-463.
[67] Schumacher, T. N., Mayr, L. M., Minor, D. L., Jr., Milhollen, M. A., Burgess,
M. W., Kim, P. S., (1996), Identification of D-Peptide Ligands Through Mirror-
Image Phage Display. Science, 271, 1854-1857.
[68] Carlos Lopez-otin, C., and Overall, C.M, (2002), Protease degradomics : a new
challenge for proteomics. Nature Rev, 3, 509-519.
[69] Ke, S.H., Coombs, G.S., Tachias, K., Navre, M., Corey, D.R., and Madison,
E.L., (1997), Distinguishing the specificities of closely related proteases role of p3 in
substrate and inhibitor discrimination between tissue-type plasminogen activator and
urokinase. J. Biol. Chem., 272, 16603–16609.
88
[70] Smith, M.M., Shi, L., and Navre, M., (1995), Rapid identification of highly
active and selective substrates for stromelysin and matrilysin using bacteriophage
peptide libraries, J. Biol. Chem., 270, 6440-6449
[71] Matthews, D.J., and Wells, J.A., 1993, Substrate phage: selection of protease
substrates by monovalent phage display. Science, 260, 1113-1117.
[72] Sharkov, N.A., Davis, R.M., Olson, J.F.R., Navre, M., and Caii, D., (2001),
Reaction kinetics of protease with substrate phage kinetic model developed using
stromelysin. J. Biol. Chem., 276, 10788–10793.
[73] Petkanchanapong, W., Fredriksson, S., Prachayasittikul, V., and Bülow, L.,
(2000), Selection of Burkholderia pseudomallei protease-binding peptides by phage
display. Biotechnol. Lett., 22, 1597–1602,
[74] Beck, Z.Q., Hervio, L., Dawson, P.E., Elder, J.H., and Madison, E.L., (2000),
Identification of Efficiently Cleaved Substrates for HIV-1 Protease Using a Phage
Display Library and Use in Inhibitor Development. Virology, 274, 391-401
[75] Matthews, D.J., Goodman, L.J., Gorman, C.M., and Wells, J.A., (1994), A
survey of furin substrate specificity using substrate phage display. Protein Science,
3, 1197-1205
[76] Hoess, R.H., (2001), Protein Design and Phage Display. Chem. Rev., 101, 3205-
3218
[77] -tadic, S.C., lagos, D., Honegger, A., Rickard, J.H., Partridge, L.J., Blackburn,
G.M., and Pluckthun, A., (2003), Turn over- based in vitro selection and evolution of
biocatalysts from a fully synthetic antibody library. Nature, 21, 679-685
[78] Heinis, C., Huber, A., Demartis, S., Bertschinger, J., Melkko, S., Lozzi, L., Neri,
P., and Neri, D., (2001), Selection of catalytically active biotin ligase and trypsin
mutants by phage display. Protein Eng., 14, 1043-1052.
89
[79] Xia, G., Chen, L., Sera, T., Fa, M., Schultz,P.G., and Romesberg, F.R., (2002),
Directed evolution of novel polymerase activities: Mutation of a DNA polymerase
into an efficient RNA polymerase. Proc. Natl. Acad. Sci. USA, 99, 6597–6602
[80] Demartis, S., Huber, S.A., Viti, F., Lozzi, L., Giovannoni, L., Neri, P., Winter,
G., and Neri, D., (1999), A Strategy for the Isolation of Catalytic Activities from
Repertoires of Enzymes Displayed on Phage. J. Mol. Biol., 286, 617-633
[81] Pedersen, H., Older, S.H., Sutherlin, D.P., Schwitter, U., King, D.S., and
Schultz, P.G., (1998), A method for directed evolution and functional cloning of
enzymes. Proc. Natl. Acad. Sci. USA, 95, 10523–10528.
[82] Jestin, J.L., Kristensen, P., and Winter, G., (1999), A Method for the Selection of
Catalytic Activity Using Phage Display and Proximity Coupling. Angew. Chem. Int.
Ed., 38, 1124-1127.
[83] Ting, A.Y., Witte, K., Shah, K., Kraybill, B., Shokat, K.M., Schultz, P.G.,
(2001), Phage-Display Evolution of Tyrosine Kinases with Altered Nucleotide
Specificity. Biopolymers (peptide science) ,60, 220–228.
[84] Takahashi, N., Kakinuma, H, Liu, L., Nishi, Y., and Fujii, I., (2001), in vitro
abzyme evolution to optimize antibody recognition for catalysis. Nat. Biotech., 19,
563-567.
[85] Ponsard, I., Galleni, M., Soumillion, P., Fastrez, J., (2001), Selection of
Metalloenzymes by Catalytic Activity Using Phage Display and Catalytic Elution.
Chembiochem, 2, 253 -259
[86] Fujii, I., Fukuyama, S., Iwabucho, Y., Tanimura, R., (1998), Evolving catalytic
antibodies in a phage- displayed combinatorial library. Nature, 16, 463-467.
[87] Paterson, G.K., and Mitchell, T.J., (2004), The biology of Gram-positive sortase
enzymes. Trends Microbiol., 12, 89-95
90
[88] Mazmanian, S.K., Liu, G., That, H.T., Schneewind, O., (1999), Staphylococcus
aureus Sortase, an Enzyme that Anchors Surface Proteins to the Cell Wall. Science,
285,760-763
[89] Zong, Y., Bice, T.W., That, H.T., Schneewind, O., and Narayana, S.V.L., (2004)
Crystal Structures of Staphylococcus aureus Sortase A and Its Substrate Complex, J.
Biol. Chem., 279, 31383–31389.
[90] Marraffini, L.A., That, H.T., Zong, Y., Narayana, S.V.L., and Schneewind, O.,
(2004), Anchoring Of Surface Proteins To The Cell Wall Of Staphylococcus Aureus:
A Conserved Arginine Residue Is Required For Efficient Catalysis Of Sortase A, J.
Biol. Chem., 279, 37763–37770.
[91] Ruzin, A., Severin, A., Ritacco, F., Tabei, K., Singh, G., Bradford, P.A., Siegel,
M.M., Projan, S.J., and Shlaes, D.M., (2002), Further Evidence that a Cell Wall
Precursor [C55-MurNAc-(Peptide)-GlcNAc] Serves as an Acceptor in a Sorting
Reaction. J. Bacteriol., 184, 2141–2147.
[92] That, H.T., Mazmanian, S.K., Faull, K.F., and Schneewind, O., (2000),
Anchoring of surface proteins to the cell wall of staphylococcus aureus sortase
catalyzed in vitro transpeptidation reaction using LPXTG peptide and NH2-GLY3
substrates. J. Biol. Chem., 275, 9876–9881.
[93] That, H.T., and Schneewind, O., (1999), Anchor structure of staphylococcal
surface proteins iv. inhibitors of the cell wall sorting reaction. J. Biol. Chem., 274,
24316–24320.
[94] Perry, A.M., That, H.T., Mazmanian, S.K., and Schneewind, O., (2002),
Anchoring of surface proteins to the cell wall of staphylococcus aureus iii. lipid ii is
an in vivo peptidoglycan substrate for sortase-catalyzed surface protein anchoring. J.
Biol. Chem., 277, 16241–16248
91
[95] Connolly, K.M., Smith, B.T., Pilpa, R., Ilangovan, U., Jung, M.E., and Clubb,
R.T., (2003), Sortase from Staphylococcus aureus Does Not Contain a Thiolate
Imidazolium Ion Pair in Its Active Site. J. Biol. Chem., 278, 34061–34065.
[96] That, H.T., Mazmanian, S.K., Alksne, L., and Schneewind, O., Anchoring of
Surface Proteins to the Cell Wall of Staphylococcus aureus cysteine 184 and histidine
120 of sortase form a thiolate-imidazolium ion pair for catalysis, (2002), J. Biol.
Chem., 277, 7447–7452.
[97] Mazmanian, S.K., Liu, G., Jensen, E.R., Lenoy, E., and Schneewind, O., (2000),
Staphylococcus aureus sortase mutants defective in the display of surface proteins and
in the pathogenesis of animal infection. Proc. Natl. Acad. Sci. USA, 97, 5510–5515.
[98] That, H.T., Liu, G., Mazmanian, S.K., Faull, K.F., and Schneewind,O., (1999),
Purification and characterization of sortase, the transpeptidase that cleaves surface
proteins of Staphylococcus aureus at the LPXTG motif. Proc. Natl. Acad. Sci. USA,
26, 12424–12429.
[99] Kruger, R.G., Dostal, P., and McCafferty, D.G., (2004), Development of a high-
performance liquid chromatography assay and revision of kinetic parameters for the
Staphylococcus aureus sortase transpeptidase SrtA. Anal. Biochem., 326, 42–48.
[100] Budisa, N., (2004), Adding New Tools to the Arsenal of Expressed Protein
Ligation. ChemBioChem, 5, 1176 – 1179.
[101] Mao, H., (2004), A self-cleavable sortase fusion for one-step purification of free
recombinant proteins. Protein Exp. Pur., 37, 253–263.
[102] Atwell, S., and Wells, J.A., (1999), Selection for improved subtiligases by
phage display. Proc. Natl. Acad. Sci. USA, 96, 9497-9502.
92
[103] Guan, Y., Zheng, B.J., He, Y.Q., Liu, X.L., Zhuang, Z.X., Cheung, C.L., Luo,
S.W., Li, P.H., Zhang, L. J., Guan, Y.J., Butt, K.M., Wong, K.L., Chan, K.W., Lim,
W. Shortridge, K.F., Yuen, K.Y., Peiris, J.S.M., and Poon, L.L.M., (2003), Isolation
and Characterization of Viruses Related to the SARS Coronavirus from Animals in
Southern China. Science, 276, 276-278.
[104] Yan, L., Velikanov, M., Flook, P., Zheng, W., Szalma, S., Kahn, S., (2003),
Assessment of putative protein targets derived from the SARS genome. FEBS Lett.,
554, 257-263
[105]. Anand, K., Ziebuhr, J., Wadhwani, P., Mesters, J.R., and Hilgenfeld, R.,
(2003), Coronavirus Main Proteinase (3CLpro) Structure: Basis for Design of Anti-
SARS Drugs. Science, 300, 1763-1767
[106] Fan, K., Wei, P., Feng, Q., Chen, S., Huang, C., Ma, L., Lai, B., Pei, J., Liu, Y.,
Chen, J., and Lai,L., (2004), Biosynthesis, Purification, and Substrate Specificity of
Severe Acute Respiratory Syndrome Coronavirus 3C-like Proteinase. Proc. Natl.
Acad. Sci. USA, 279, 1637–1642.
[107] Yang, H., Yang, M., Ding, Y., Liu, Y., Lou, Z., Zhou, Z., Sun, L., Mo, L., Ye,
S., Pang, H., Gao, G.F., Anand, K., Bartlam, M., Hilgenfeld, R., and Rao, Z., (2003),
The crystal structures of severe acute respiratory syndrome virus main protease and its
complex with an inhibitor. Proc. Natl. Acad. Sci. USA, 100, 13190–13195
[108] Wu, C.Y., Jan, J.T., Ma, S.H., Kuo, C.J., Juan, H.F., Cheng, Y.S.E., Hsu,
H.H., Huang, H.C., Wu, D., Brik, A., Liang, F.S., Liu, R.S., Fang, J.M., Chen, S.T.,
Liang, P.H., and Wong, C.H., (2004), Small molecules targeting severe acute
respiratory syndrome human coronavirus, Proc. Natl. Acad. Sci. USA,101, 10012–
10017.
93
[109] Creighton, T.E., (1993), Proteins: structure and molecular properties. 2nd ed.,
Freeman, New York,.
[110] Zhu, H., Bilgin, M., Bangham, R., Hall, D., Casamayor, A., Bertone, P., Lan,
N., Jansen, R., Bidlingmaier, S., Houfek, T., Mitchell, T., Miller, P., Dean, R.A.,
Gerstein, M., and Snyder, M., (2001), Global analysis of protein activities using
proteome chips. Science, 293, 2101-2105
[111] Devlin, J.J., Panganiban, L.C. and Devlin, P.E., (1990), Random peptide
libraries: a source of specific protein binding molecules. Science, 249, 404–406.
[112] Kay, K.B., Winter, J., and McCafferty, J., (1996), Phage display of peptides and
proteins : A laboratory manual. Academic press, San Diego.
[113] Danner, S., and Belasco, J.G., (2001), T7 phage display: A novel genetic
selection system for cloning RNA-binding proteins from cDNA libraries. Proc. Natl.
Acad. Sci. USA , 98, 12954–12959.
[114] Novagen. (2000). T7Select System Manual. TB178 (Novagen, Madison)
94
APPENDIX A
Buffer A
30 mM Potassium Acetate
100 mM Rubidium Chloride
10 mM Calcium Chloride
50 mM Manganese Chloride
15 % v/v Glycerol
pH to 5.8 with dilute Acetic acid, filter sterilize
Buffer B
10 mM MOPS
75 mM Calcium Chloride
10 mm Rubidium Chloride
15 % v/v Glycerol
pH to 6.5 with dilute NaOH, filer sterilize.
Buffer H1
50 mM NaH2PO4·H2O
300 mM NaCl
10 mM Imidazole
Adjust pH to 8.0 using NaOH.
95
Buffer H2
50 mM NaH2PO4·H2O
0.5 % v/v Tween-20
20 mM Imidazole
pH to 8.0 using NaOH.
Buffer H3
50 mM NaH2PO4·H2O
1.5 M NaCl
30 mM Imidazole
pH to 8.0 using NaOH.
Buffer H4
50 mM NaH2PO4·H2O
300 mM NaCl
250 mM Imidazole
pH to 8.0 using NaOH.
Buffer H5
50 mM Tris base
150 mM NaCl
pH to 7.5 using HCL.
96
Buffer G1
20 mM NaH2PO4·H2O
100 mM NaCl
0.1 % v/v Tween-20
1 mM EDTA
1 mM DTT
pH 7.5
Bufffer G2
137 mM NaCl
3 mM KCl
8 mM NaH2PO4
1.5 mM KH2PO4
pH 7.4 with HCL.
Buffer G3
10 mM Tris
50 mM GSH
BUFFER G4
10 mM Tris
1 mM DTT
1 mM EDTA
pH 7.4
97
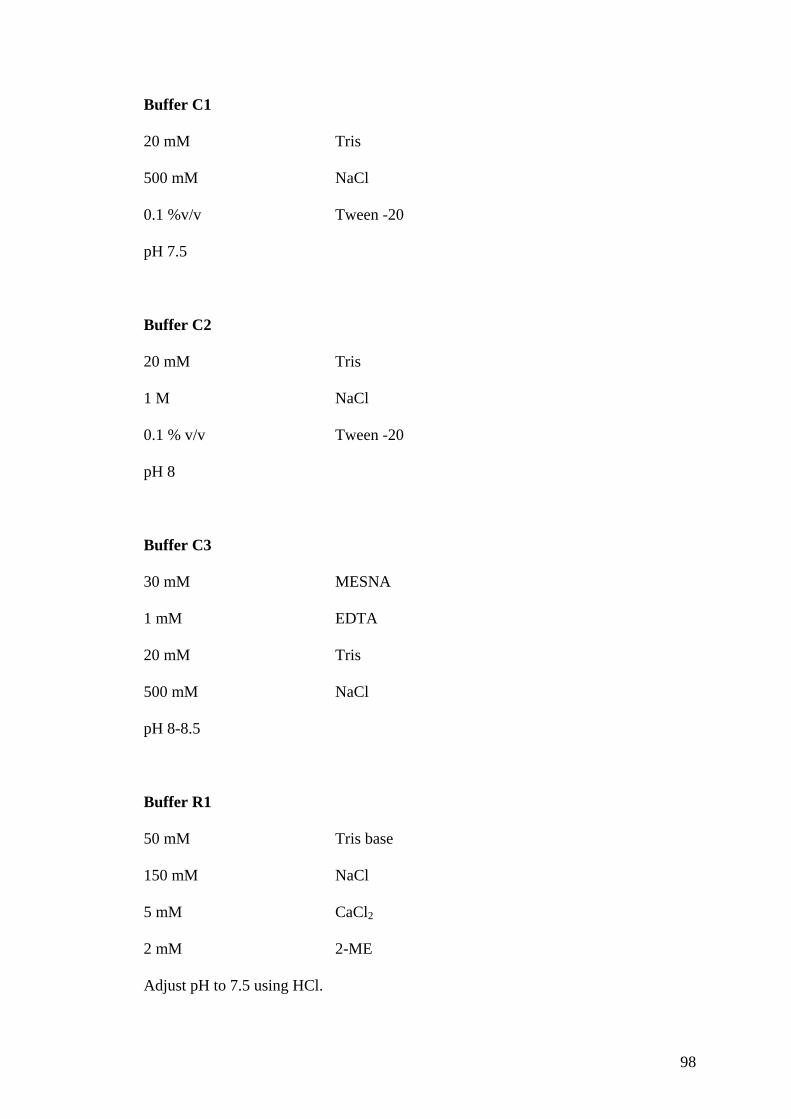
Buffer C1
20 mM Tris
500 mM NaCl
0.1 %v/v Tween -20
pH 7.5
Buffer C2
20 mM Tris
1 M NaCl
0.1 % v/v Tween -20
pH 8
Buffer C3
30 mM MESNA
1 mM EDTA
20 mM Tris
500 mM NaCl
pH 8-8.5
Buffer R1
50 mM Tris base
150 mM NaCl
5 mM CaCl2
2 mM 2-ME
Adjust pH to 7.5 using HCl.
98

Buffer R2
10 % v/v Glycerol
50 mM Tris (pH 6.8)
2 mM EDTA (pH 8)
2 % SDS
100 mM DTT
Pinch BPB
Buffer C
20 % v/v PEG
2.5 M NaCl
Autoclave and store at RT
Buffer D
50 % PEG
Autoclave and store at RT
Buffer E
10 mM Tris (pH 6.8)
1 mM EDTA (pH 8)
4 M NaI
Store at RT in the dark.
99
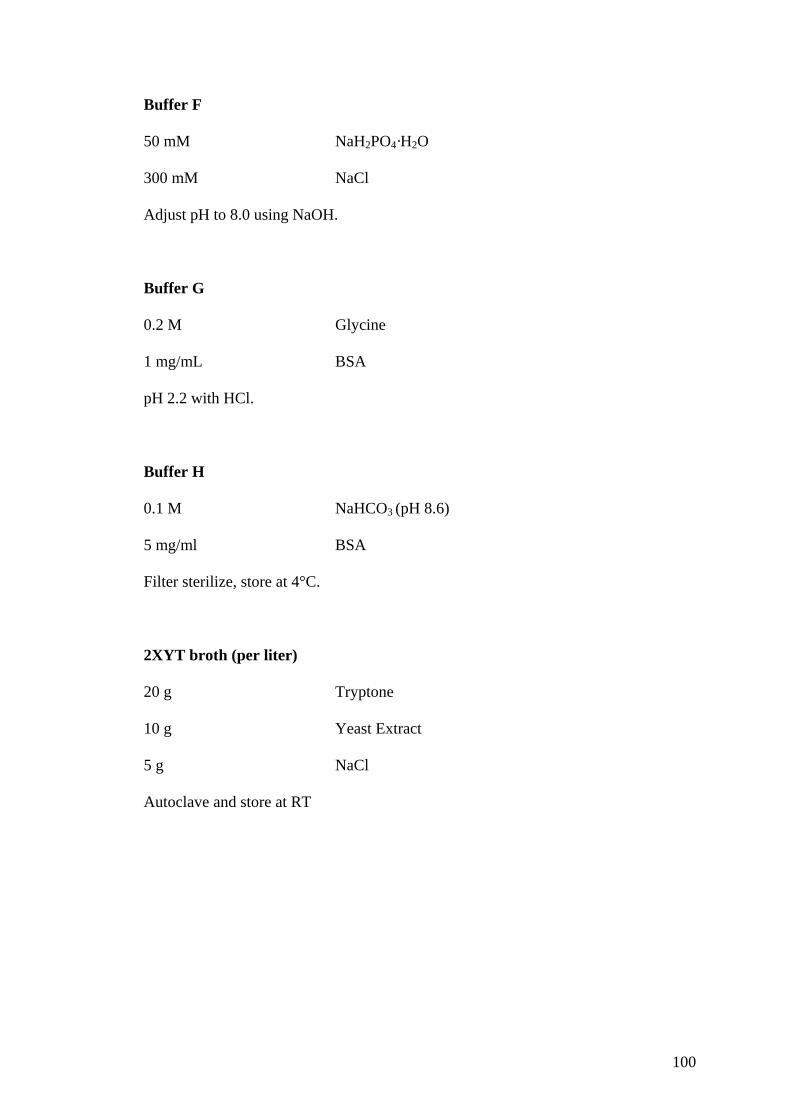
Buffer F
50 mM NaH2PO4·H2O
300 mM NaCl
Adjust pH to 8.0 using NaOH.
Buffer G
0.2 M Glycine
1 mg/mL BSA
pH 2.2 with HCl.
Buffer H
0.1 M NaHCO3 (pH 8.6)
5 mg/ml BSA
Filter sterilize, store at 4°C.
2XYT broth (per liter)
20 g Tryptone
10 g Yeast Extract
5 g NaCl
Autoclave and store at RT
100
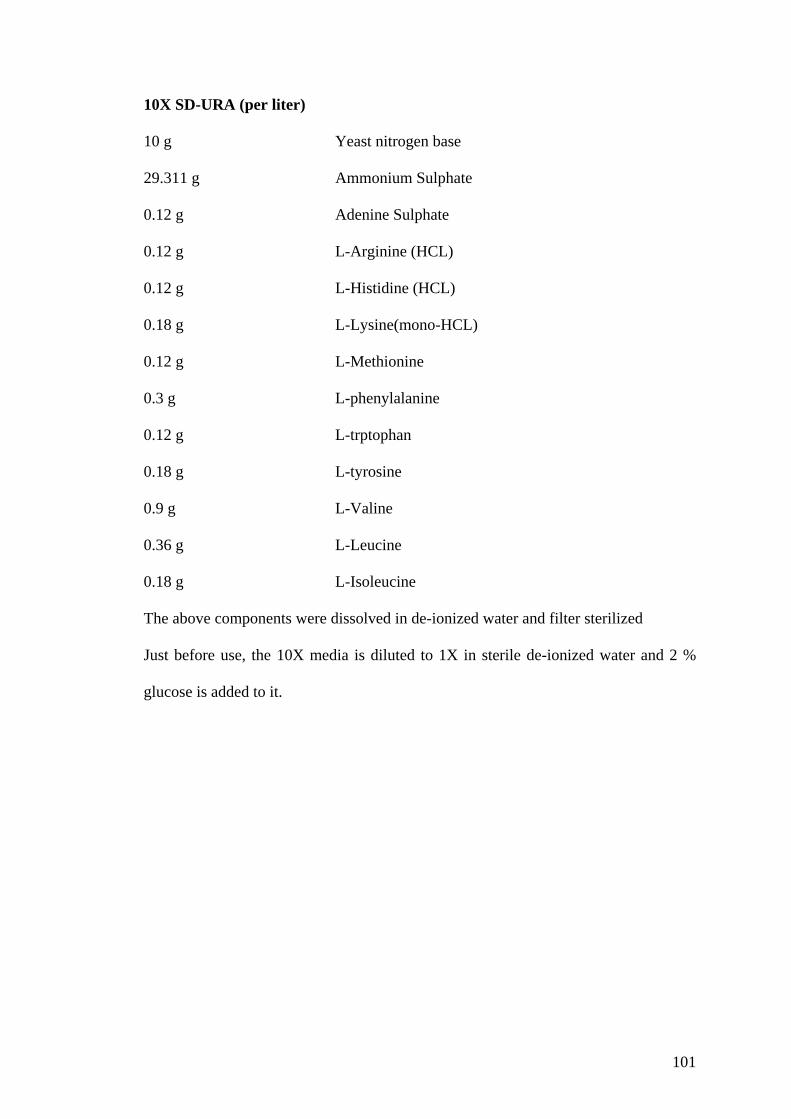
101
10X SD-URA (per liter)
10 g Yeast nitrogen base
29.311 g Ammonium Sulphate
0.12 g Adenine Sulphate
0.12 g L-Arginine (HCL)
0.12 g L-Histidine (HCL)
0.18 g L-Lysine(mono-HCL)
0.12 g L-Methionine
0.3 g L-phenylalanine
0.12 g L-trptophan
0.18 g L-tyrosine
0.9 g L-Valine
0.36 g L-Leucine
0.18 g L-Isoleucine
The above components were dissolved in de-ionized water and filter sterilized
Just before use, the 10X media is diluted to 1X in sterile de-ionized water and 2 %
glucose is added to it.
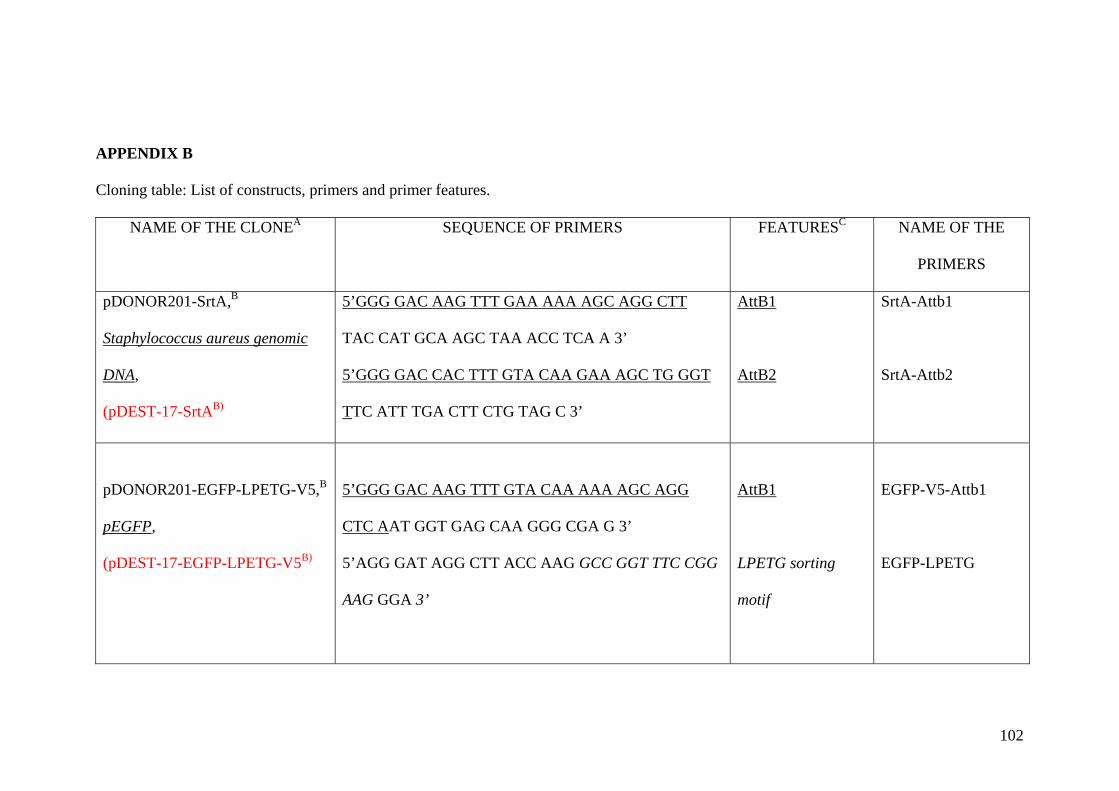
APPENDIX B
Cloning table: List of constructs, primers and primer features.
NAME OF THE CLONEA SEQUENCE OF PRIMERS FEATURESC NAME OF THE
PRIMERS
pDONOR201-SrtA,B
Staphylococcus aureus genomic
DNA,
(pDEST-17-SrtAB)
5’GGG GAC AAG TTT GAA AAA AGC AGG CTT
TAC CAT GCA AGC TAA ACC TCA A 3’
5’GGG GAC CAC TTT GTA CAA GAA AGC TG GGT
TTC ATT TGA CTT CTG TAG C 3’
AttB1
AttB2
SrtA-Attb1
SrtA-Attb2
pDONOR201-EGFP-LPETG-V5,B
pEGFP,
(pDEST-17-EGFP-LPETG-V5B)
5’GGG GAC AAG TTT GTA CAA AAA AGC AGG
CTC AAT GGT GAG CAA GGG CGA G 3’
5’AGG GAT AGG CTT ACC AAG GCC GGT TTC CGG
AAG GGA 3’
AttB1
LPETG sorting
motif
EGFP-V5-Attb1
EGFP-LPETG
102
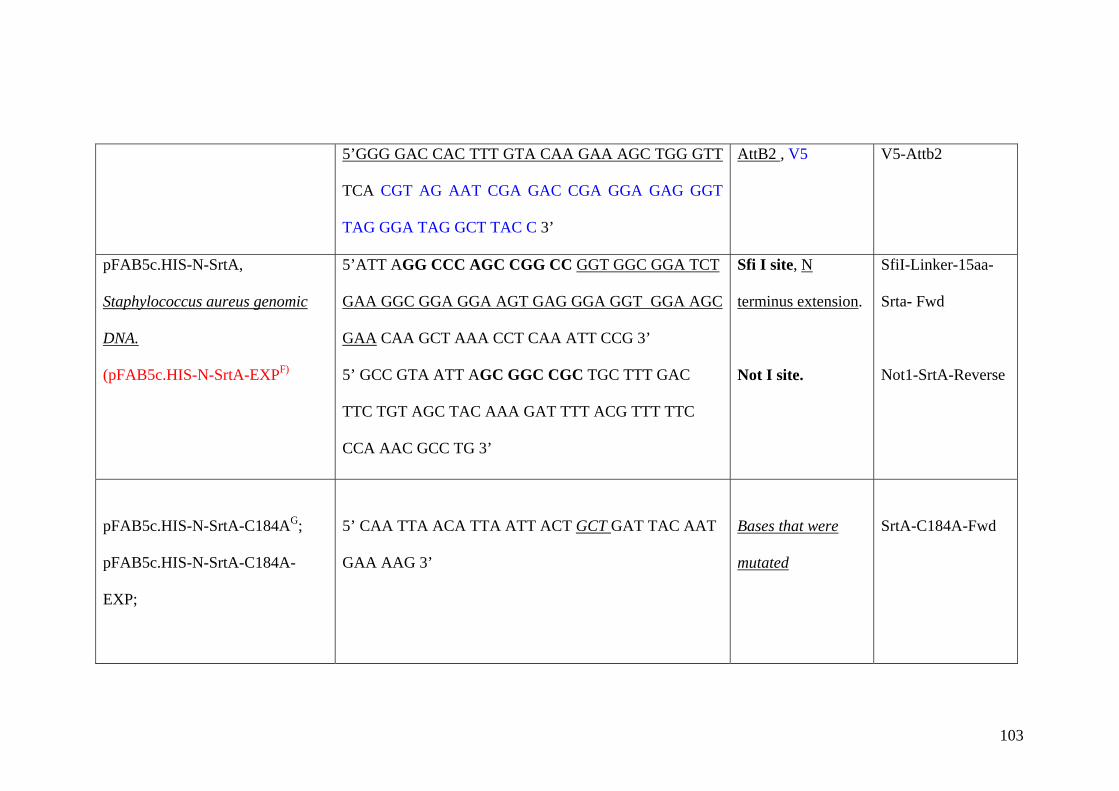
5’GGG GAC CAC TTT GTA CAA GAA AGC TGG GTT
TCA CGT AG AAT CGA GAC CGA GGA GAG GGT
TAG GGA TAG GCT TAC C 3’
AttB2 , V5
V5-Attb2
pFAB5c.HIS-N-SrtA,
Staphylococcus aureus genomic
DNA.
(pFAB5c.HIS-N-SrtA-EXPF)
5’ATT AGG CCC AGC CGG CC GGT GGC GGA TCT
GAA GGC GGA GGA AGT GAG GGA GGT GGA AGC
GAA CAA GCT AAA CCT CAA ATT CCG 3’
5’ GCC GTA ATT AGC GGC CGC TGC TTT GAC
TTC TGT AGC TAC AAA GAT TTT ACG TTT TTC
CCA AAC GCC TG 3’
Sfi I site, N
terminus extension.
Not I site.
SfiI-Linker-15aa-
Srta- Fwd
Not1-SrtA-Reverse
pFAB5c.HIS-N-SrtA-C184AG;
pFAB5c.HIS-N-SrtA-C184A-
EXP;
5’ CAA TTA ACA TTA ATT ACT GCT GAT TAC AAT
GAA AAG 3’
Bases that were
mutated
SrtA-C184A-Fwd
103
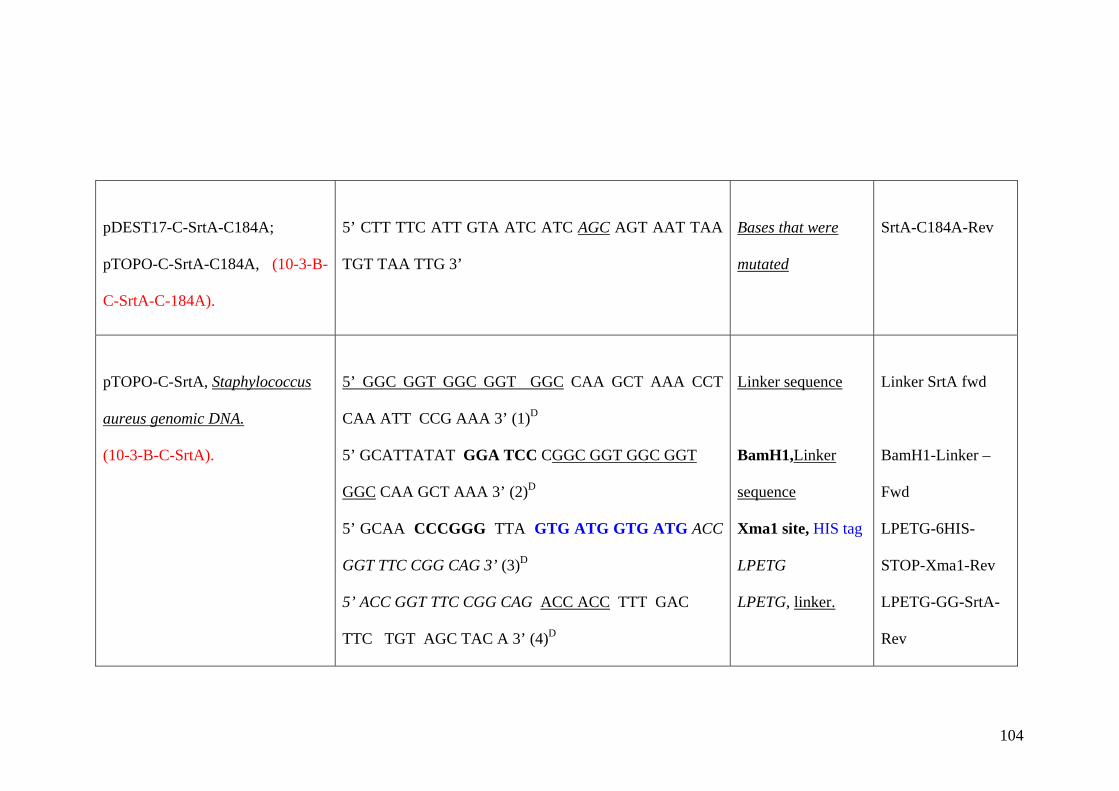
pDEST17-C-SrtA-C184A;
pTOPO-C-SrtA-C184A, (10-3-B-
C-SrtA-C-184A).
5’ CTT TTC ATT GTA ATC ATC AGC AGT AAT TAA
TGT TAA TTG 3’
Bases that were
mutated
SrtA-C184A-Rev
pTOPO-C-SrtA, Staphylococcus
aureus genomic DNA.
(10-3-B-C-SrtA).
5’ GGC GGT GGC GGT GGC CAA GCT AAA CCT
CAA ATT CCG AAA 3’ (1)D
5’ GCATTATAT GGA TCC CGGC GGT GGC GGT
GGC CAA GCT AAA 3’ (2)D
5’ GCAA CCCGGG TTA GTG ATG GTG ATG ACC
GGT TTC CGG CAG 3’ (3)D
5’ ACC GGT TTC CGG CAG ACC ACC TTT GAC
TTC TGT AGC TAC A 3’ (4)D
Linker sequence
BamH1,Linker
sequence
Xma1 site, HIS tag
LPETG
LPETG, linker.
Linker SrtA fwd
BamH1-Linker –
Fwd
LPETG-6HIS-
STOP-Xma1-Rev
LPETG-GG-SrtA-
Rev
104
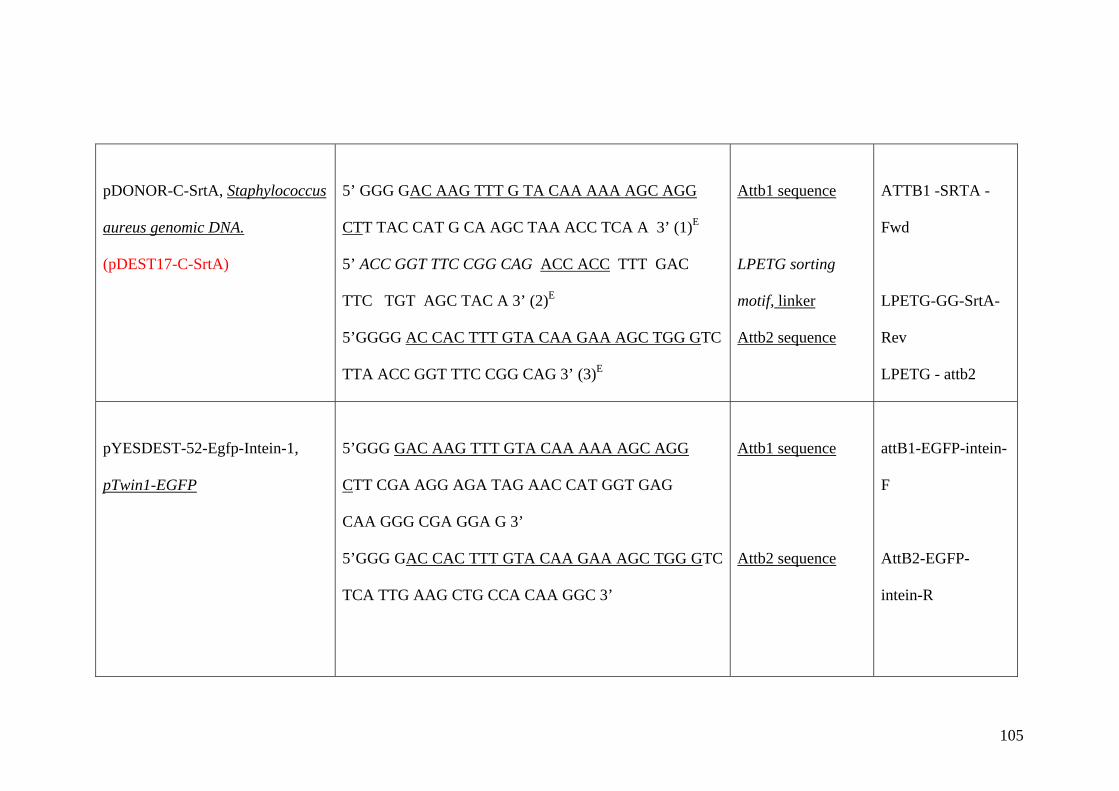
pDONOR-C-SrtA, Staphylococcus
aureus genomic DNA.
(pDEST17-C-SrtA)
5’ GGG GAC AAG TTT G TA CAA AAA AGC AGG
CTT TAC CAT G CA AGC TAA ACC TCA A 3’ (1)E
5’ ACC GGT TTC CGG CAG ACC ACC TTT GAC
TTC TGT AGC TAC A 3’ (2)E
5’GGGG AC CAC TTT GTA CAA GAA AGC TGG GTC
TTA ACC GGT TTC CGG CAG 3’ (3)E
Attb1 sequence
LPETG sorting
motif, linker
Attb2 sequence
ATTB1 -SRTA -
Fwd
LPETG-GG-SrtA-
Rev
LPETG - attb2
pYESDEST-52-Egfp-Intein-1,
pTwin1-EGFP
5’GGG GAC AAG TTT GTA CAA AAA AGC AGG
CTT CGA AGG AGA TAG AAC CAT GGT GAG
CAA GGG CGA GGA G 3’
5’GGG GAC CAC TTT GTA CAA GAA AGC TGG GTC
TCA TTG AAG CTG CCA CAA GGC 3’
Attb1 sequence
Attb2 sequence
attB1-EGFP-intein-
F
AttB2-EGFP-
intein-R
105
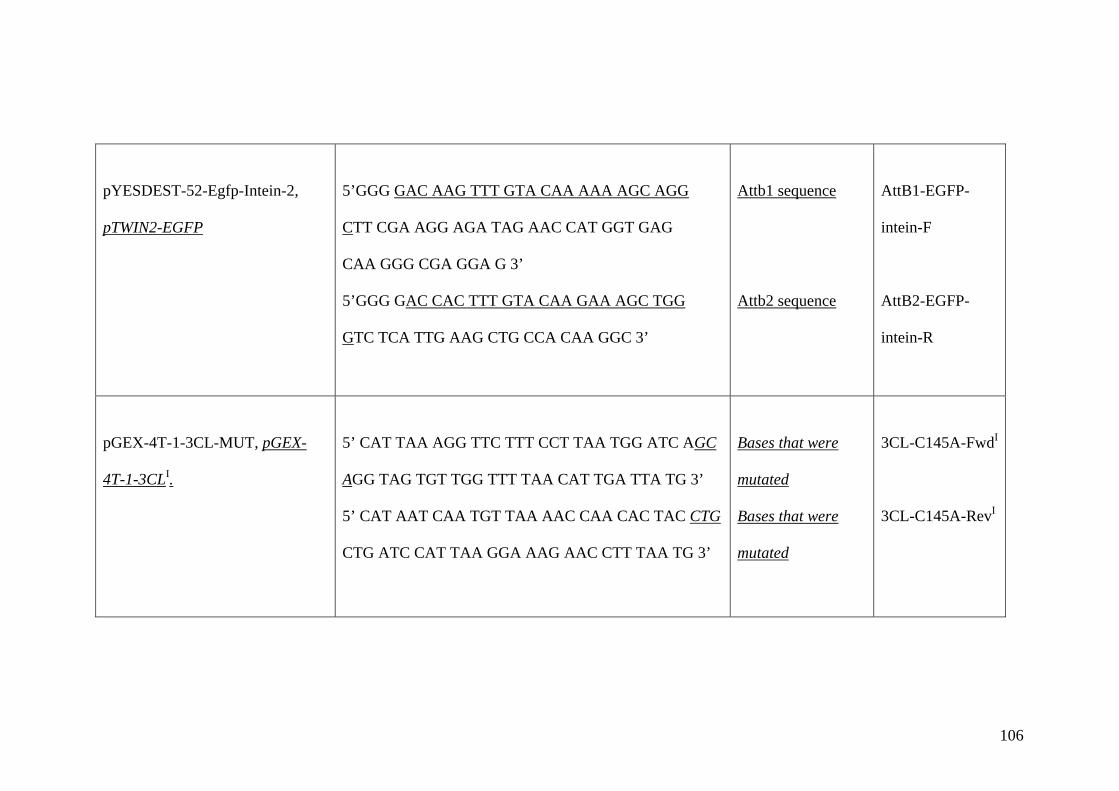
pYESDEST-52-Egfp-Intein-2,
pTWIN2-EGFP
5’GGG GAC AAG TTT GTA CAA AAA AGC AGG
CTT CGA AGG AGA TAG AAC CAT GGT GAG
CAA GGG CGA GGA G 3’
5’GGG GAC CAC TTT GTA CAA GAA AGC TGG
GTC TCA TTG AAG CTG CCA CAA GGC 3’
Attb1 sequence
Attb2 sequence
AttB1-EGFP-
intein-F
AttB2-EGFP-
intein-R
pGEX-4T-1-3CL-MUT, pGEX-
4T-1-3CLI.
5’ CAT TAA AGG TTC TTT CCT TAA TGG ATC AGC
AGG TAG TGT TGG TTT TAA CAT TGA TTA TG 3’
5’ CAT AAT CAA TGT TAA AAC CAA CAC TAC CTG
CTG ATC CAT TAA GGA AAG AAC CTT TAA TG 3’
Bases that were
mutated
Bases that were
mutated
3CL-C145A-FwdI
3CL-C145A-RevI
106
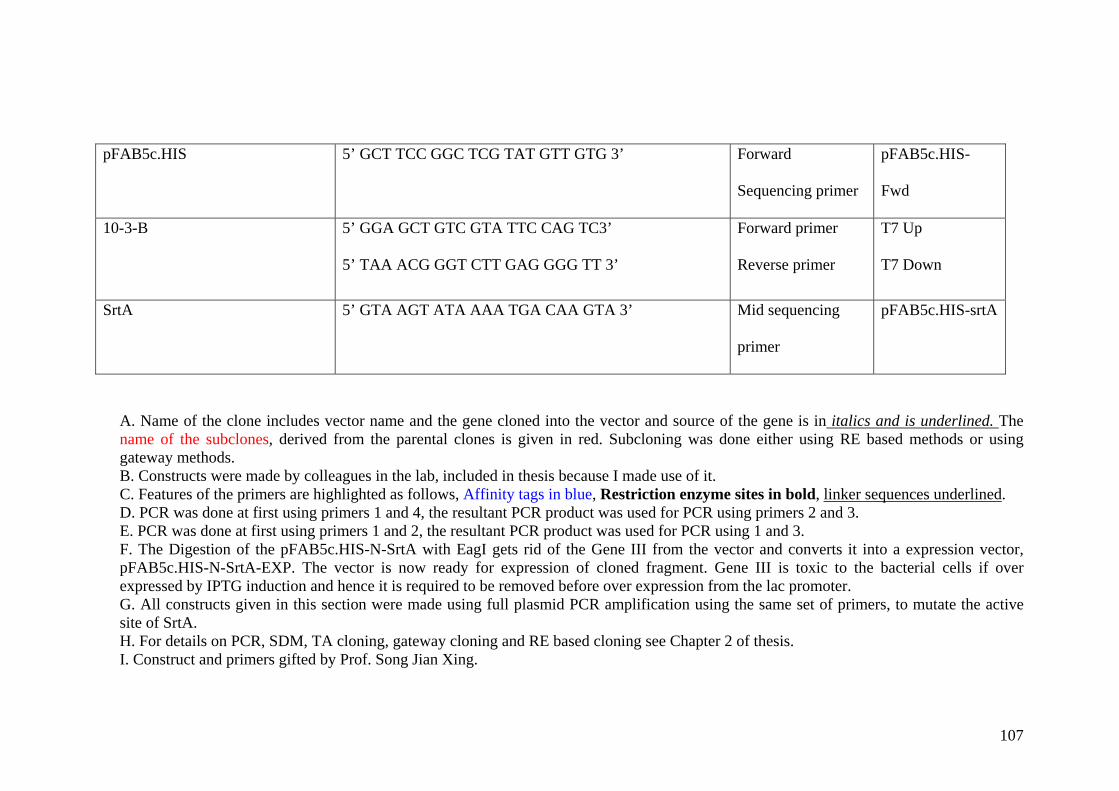
pFAB5c.HIS 5’ GCT TCC GGC TCG TAT GTT GTG 3’ Forward
Sequencing primer
pFAB5c.HIS-
Fwd
10-3-B 5’ GGA GCT GTC GTA TTC CAG TC3’
5’ TAA ACG GGT CTT GAG GGG TT 3’
Forward primer
Reverse primer
T7 Up
T7 Down
SrtA 5’ GTA AGT ATA AAA TGA CAA GTA 3’ Mid sequencing
primer
pFAB5c.HIS-srtA
A. Name of the clone includes vector name and the gene cloned into the vector and source of the gene is in italics and is underlined. The name of the subclones, derived from the parental clones is given in red. Subcloning was done either using RE based methods or using gateway methods. B. Constructs were made by colleagues in the lab, included in thesis because I made use of it. C. Features of the primers are highlighted as follows, Affinity tags in blue, Restriction enzyme sites in bold, linker sequences underlined. D. PCR was done at first using primers 1 and 4, the resultant PCR product was used for PCR using primers 2 and 3. E. PCR was done at first using primers 1 and 2, the resultant PCR product was used for PCR using 1 and 3. F. The Digestion of the pFAB5c.HIS-N-SrtA with EagI gets rid of the Gene III from the vector and converts it into a expression vector, pFAB5c.HIS-N-SrtA-EXP. The vector is now ready for expression of cloned fragment. Gene III is toxic to the bacterial cells if over expressed by IPTG induction and hence it is required to be removed before over expression from the lac promoter. G. All constructs given in this section were made using full plasmid PCR amplification using the same set of primers, to mutate the active site of SrtA. H. For details on PCR, SDM, TA cloning, gateway cloning and RE based cloning see Chapter 2 of thesis. I. Construct and primers gifted by Prof. Song Jian Xing.
107
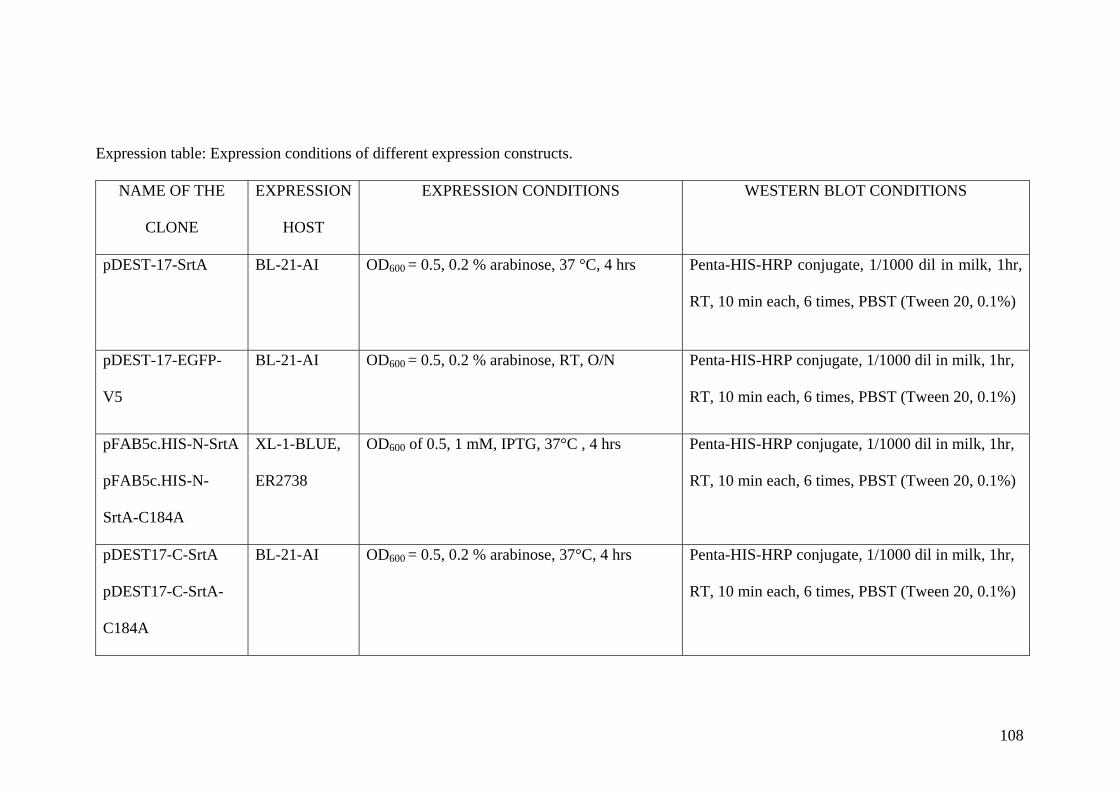
Expression table: Expression conditions of different expression constructs.
NAME OF THE
CLONE
EXPRESSION
HOST
EXPRESSION CONDITIONS WESTERN BLOT CONDITIONS
pDEST-17-SrtA BL-21-AI OD600 = 0.5, 0.2 % arabinose, 37 °C, 4 hrs Penta-HIS-HRP conjugate, 1/1000 dil in milk, 1hr,
RT, 10 min each, 6 times, PBST (Tween 20, 0.1%)
pDEST-17-EGFP-
V5
BL-21-AI OD600 = 0.5, 0.2 % arabinose, RT, O/N Penta-HIS-HRP conjugate, 1/1000 dil in milk, 1hr,
RT, 10 min each, 6 times, PBST (Tween 20, 0.1%)
pFAB5c.HIS-N-SrtA
pFAB5c.HIS-N-
SrtA-C184A
XL-1-BLUE,
ER2738
OD600 of 0.5, 1 mM, IPTG, 37°C , 4 hrs Penta-HIS-HRP conjugate, 1/1000 dil in milk, 1hr,
RT, 10 min each, 6 times, PBST (Tween 20, 0.1%)
pDEST17-C-SrtA
pDEST17-C-SrtA-
C184A
BL-21-AI OD600 = 0.5, 0.2 % arabinose, 37°C, 4 hrs Penta-HIS-HRP conjugate, 1/1000 dil in milk, 1hr,
RT, 10 min each, 6 times, PBST (Tween 20, 0.1%)
108
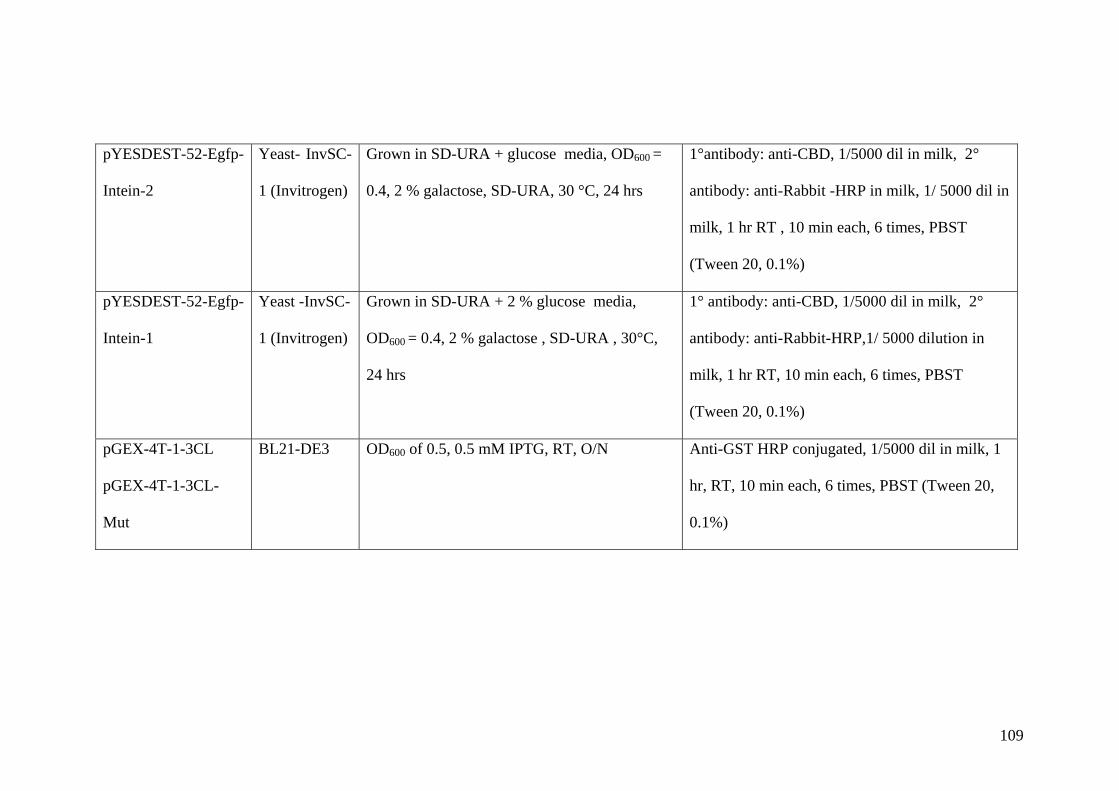
pYESDEST-52-Egfp-
Intein-2
Yeast- InvSC-
1 (Invitrogen)
Grown in SD-URA + glucose media, OD600 =
0.4, 2 % galactose, SD-URA, 30 °C, 24 hrs
1°antibody: anti-CBD, 1/5000 dil in milk, 2°
antibody: anti-Rabbit -HRP in milk, 1/ 5000 dil in
milk, 1 hr RT , 10 min each, 6 times, PBST
(Tween 20, 0.1%)
pYESDEST-52-Egfp-
Intein-1
Yeast -InvSC-
1 (Invitrogen)
Grown in SD-URA + 2 % glucose media,
OD600 = 0.4, 2 % galactose , SD-URA , 30°C,
24 hrs
1° antibody: anti-CBD, 1/5000 dil in milk, 2°
antibody: anti-Rabbit-HRP,1/ 5000 dilution in
milk, 1 hr RT, 10 min each, 6 times, PBST
(Tween 20, 0.1%)
pGEX-4T-1-3CL
pGEX-4T-1-3CL-
Mut
BL21-DE3 OD600 of 0.5, 0.5 mM IPTG, RT, O/N Anti-GST HRP conjugated, 1/5000 dil in milk, 1
hr, RT, 10 min each, 6 times, PBST (Tween 20,
0.1%)
109