evaluation of emulsifiable oils for lubrication and
TRANSCRIPT
vi
EVALUATION OF EMULSIFIABLE OILS FOR LUBRICATION AND
TEMPORARY CORROSION PROTECTION
OF SEVEN-WIRE STRAND
APPROVED: _________________________ John E. Breen _________________________ Karl H. Frank

vii
To my twin brother, Whitaker

viii
EVALUATION OF EMULSIFIABLE OILS FOR LUBRICATION AND
TEMPORARY CORROSION PROTECTION
OF SEVEN-WIRE STRAND
by
WILLIAM MARLEY KITTLEMAN, B.S.C.E.
THESIS
Presented to the Faculty of the Graduate School of
The University of Texas at Austin
in Partial Fulfillment
of the Requirements
for the Degree of
MASTER OF SCIENCE IN ENGINEERING
THE UNIVERSITY OF TEXAS AT AUSTIN
December 1992

ix
ACKNOWLEDGEMENTS
This research was performed at the Ferguson Structural Engineering
Laboratory at The University of Texas at Austin. Funding was provided by the Texas
Department of Transportation and the Federal Highway Administration. Private
organizations that donated specific products and technical support were Viscosity Oil
Company, Shell Oil Company, Unocal 76, Texaco, E.F. Houghton and Company,
Nalco Chemical Company, The PQ Corporation, and the Wright Oil Company.
Special thanks goes to Charles Novak (Viscosity Oil Co.), Jim Smit (Viscosity Oil
Co.), Kevin Friday (Texaco), and Dr. Jerry Hollander (Unocal 76) for their technical
advice and friendly attitudes.
At this time I would like to thank the individuals who made this thesis possible.
First of all I want to think my supervising professors Dr. John Breen and Dr. Karl
Frank. It's not often in life that you get the chance to work with two individuals of
such high caliber. Their guidance and patience, especially in the early stages of this
research were greatly appreciated. More importantly, I would like to thank both of
them for their friendship during my work at The University of Texas at Austin.
The technical and administrative staffs at Ferguson Lab were instrumental in
helping me adapt to my new surroundings two years ago. Thank you Wayne
Fontenot, Wayne Little, Blake Stassney, Pat Ball, Jean Gherke, Laurie Golding, April
Jenkins, and Sharon Cunningham.
The special friends I made during my work at Ferguson Lab deserve special
recognition. In particular I would like to mention five individuals, Raoul Karp, Reed
v
Freeman, Trey Hamilton, Todd Helwig, and Bruce Russell. These individuals were
great role models who were always there when I needed them. I only hope that I gave
back to them what they gave to me.
Finally, I would like to thank my family for their continuous support during my
graduate studies. I love you all.
William Kittleman
August 11, 1992
Austin, Texas

vi
TABLE OF CONTENTS
CHAPTER 1 INTRODUCTION ................................................................................... 1
1.1 General. ................................................................................................................... 1
1.2 Post-tensioned Concrete. ........................................................................................ 1
1.3 Post-tensioned Tendons. ......................................................................................... 3
1.3.1 Description. .......................................................................................................... 3
1.3.2 Concerns. .............................................................................................................. 3
1.3.2.1 Friction Reduction. ........................................................................................... 3
1.3.2.2 Temporary Corrosion Protection. ..................................................................... 7
1.4 Cable-Stays. ............................................................................................................ 7
1.4.1 Description. .......................................................................................................... 7
1.4.2 Temporary Corrosion Protection. ........................................................................ 8
1.5 Problem Statement. ................................................................................................. 9
1.6 Objectives. ............................................................................................................... 9
1.7 Scope. ...................................................................................................................... 9
CHAPTER 2 STATE-OF-THE-ART ........................................................................... 11
2.1 Introduction. ........................................................................................................... 11
2.2 Background on Emulsifiable Oils ......................................................................... 12
2.3 Findings from Literature Review. ......................................................................... 14
2.3.1 Evaluation of Temporary Corrosion Inhibitors. ................................................ 14
2.3.2 Other Temporary Corrosion Protection Methods. ............................................. 20
2.3.2.1 Alkali-polymer Coating. .................................................................................. 20
2.3.2.2 Corrosion Inhibitor Solution. .......................................................................... 20

vii
2.3.2.3 Swedish National Road Administration Study. ....................................... 21
2.3.3 Small-scale Friction Tests using Emulsifiable Oils. ................................... 21
2.3.4 Large-scale Friction Tests using Emulsifiable Oils. ................................... 26
2.3.4.1 Large-scale Friction Tests Performed by the California Department
of Transportation. ................................................... 26
2.3.4.2 Large-Scale Friction Studies Performed by Dywidag Systems
International and the California Department of
Transportation. ....................................................... 29
2.4 Summary of Findings from Literature Review. ............................................. 30
2.5 Findings from Informal Phone Survey. .......................................................... 31
2.6 Candidate Lubricants Selected for Evaluation. .............................................. 32
2.7 Friction Tests. ................................................................................................. 33
2.7.1 Procedures. .................................................................................................. 36
2.7.2 Results ......................................................................................................... 38
CHAPTER 3 ACCELERATED WIRE CORROSION TESTS ............................. 45
3.1 Introduction. ................................................................................................... 45
3.2 Background. ................................................................................................... 45
3.3 Experiment Design. ........................................................................................ 50
3.4 Materials. ........................................................................................................ 50
3.4.1 Prestressing Wire......................................................................................... 50
3.4.2 Five-minute Epoxy. ..................................................................................... 52
3.4.3 Deionized Water .......................................................................................... 53
3.4.4 Sodium Chloride Crystals. .......................................................................... 53
3.5 Specimen Preparation. .................................................................................... 53

viii
3.6 Test Setup. ...................................................................................................... 53
3.7 Instrumentation............................................................................................... 53
3.7.1 Reference Electrodes ................................................................................... 53
3.7.2 Datalogger ................................................................................................... 55
3.8 Test Procedure. ............................................................................................... 55
3.8.1 Scan Rate ..................................................................................................... 55
3.8.2 Visual Observations. ................................................................................... 58
3.9 Results. ........................................................................................................... 58
3.10 Comparison of Wires from Different Reels ................................................. 75
3.11 Discussion of Test Setup. ............................................................................. 76
3.12 Conclusions. ................................................................................................. 78
CHAPTER 4 EXPOSURE TESTS......................................................................... 81
4.1 Introduction. ................................................................................................... 81
4.2 Experiment Design. ........................................................................................ 81
4.3 Materials. ........................................................................................................ 82
4.4 Specimen Preparation. .................................................................................... 83
4.4.1 Lubrication .................................................................................................. 83
4.4.2 Flushing. ...................................................................................................... 84
4.5 Test Setup. ...................................................................................................... 84
4.6 Test Procedure. ............................................................................................... 84
4.6.1 Ambient Conditions .................................................................................... 84
4.6.2 Wetting Cycle .............................................................................................. 84
4.6.3 Visual Observations .................................................................................... 86
4.7 Results. ........................................................................................................... 86

ix
4.8 Conclusions. ....................................................................................................... 98
CHAPTER 5 PULL-OUT TESTS .......................................................................... 103
5.1 Introduction. ................................................................................................... 103
5.2 Purpose. .......................................................................................................... 103
5.3 Experiment Design ......................................................................................... 103
5.4 Materials. ........................................................................................................ 105
5.4.1 Concrete. ..................................................................................................... 105
5.4.2 Cement Grout. ............................................................................................. 105
5.4.3 Prestressing Strand. ..................................................................................... 105
5.4.4 Duct. ............................................................................................................ 105
5.4.5 Grout Hose. ................................................................................................. 105
5.4.6 Grout Plugs. ................................................................................................. 106
5.5 Construction. .................................................................................................. 106
5.5.1 Formwork. ................................................................................................... 106
5.5.2 Batching. ..................................................................................................... 106
5.5.3 Curing. ......................................................................................................... 106
5.6 Lubrication. .................................................................................................... 106
5.7 Flushing. ......................................................................................................... 107
5.8 Grouting. ........................................................................................................ 108
5.9 Test Setup. ...................................................................................................... 108
5.10 Instrumentation............................................................................................. 108
5.11 Test Procedure. ............................................................................................. 111
5.11.1 Initial Seating. ........................................................................................... 111
5.11.2 Potentiometer Setup. ................................................................................. 111

x
5.11.3 Loading Rate. ............................................................................................ 111
5.11.4 Slip Load Reading. .................................................................................... 111
5.12 Test Results. ................................................................................................. 111
5.13 Discussion of Test Results and Conclusions. ............................................... 112
CHAPTER 6 ANCHORED PULL-OUT TESTS .................................................. 120
6.1 Introduction. ................................................................................................... 120
6.2 Experiment Design. ........................................................................................ 120
6.3 Materials. ........................................................................................................ 123
6.3.1 Concrete. ..................................................................................................... 123
6.3.2 Steel Reinforcement .................................................................................... 123
6.3.3 Grout. ........................................................................................................... 123
6.3.4 Prestressing Strand. ..................................................................................... 123
6.3.5 Duct. ............................................................................................................ 124
6.3.6 Anchorages. ................................................................................................. 124
6.4 Construction. .................................................................................................. 124
6.4.1 Formwork. ................................................................................................... 125
6.4.2 Curing. ......................................................................................................... 125
6.4.3 Installation of Strands ................................................................................. 125
6.4.4 Grout Plugs and Grout Hoses. ..................................................................... 125
6.4.5 Flushing. ...................................................................................................... 125
6.4.6 Temporary Post-tensioning. ........................................................................ 128
6.4.7 Grouting. ..................................................................................................... 128
6.5 Test Equipment. ............................................................................................. 128
6.5.1 Prestressing Chair. ....................................................................................... 128

xi
6.5.2 Load Cell ..................................................................................................... 128
6.5.3 Hydraulic Ram. ........................................................................................... 132
6.5.4 Prestressing Chuck. ..................................................................................... 132
6.5.5 Shims. .......................................................................................................... 132
6.5.6 Pump. ........................................................................................................... 132
6.5.7 Potentiometer. ............................................................................................. 132
6.6 Instrumentation............................................................................................... 132
6.7 Test Procedure. ............................................................................................... 132
6.7.1 Initial Loading. ............................................................................................ 133
6.7.2 Load Increments. ......................................................................................... 133
6.7.3 Data Acquisition. ......................................................................................... 134
6.8 Test Results. ................................................................................................... 134
6.9 Conclusions. ................................................................................................... 143
CHAPTER 7 LUBRICANT EVALUATION ........................................................ 147
7.1 Introduction. ................................................................................................... 147
7.2 Matrix Priority Rating System ....................................................................... 147
7.2.1 Background. ................................................................................................ 147
7.2.2 Alternatives. ................................................................................................ 148
7.2.3 Criteria. ........................................................................................................ 148
7.2.3.1 Friction Reduction. ................................................................................... 148
7.2.3.2 Effect on Adhesion. .................................................................................. 148
7.2.3.3 Temporary Corrosion Protection. ............................................................. 148
7.2.3.4 Safety Hazards. ......................................................................................... 151
7.2.3.5 Lubricant Cost. ......................................................................................... 151

xii
7.2.3.6 Difficulty of Use. ...................................................................................... 151
7.2.4 Importance Factors. ..................................................................................... 151
7.2.4.1 Friction Reduction. ................................................................................... 152
7.2.4.2 Effect on Adhesion ................................................................................... 152
7.2.4.3 Temporary Corrosion Protection .............................................................. 152
7.2.4.4 Safety Hazards. ......................................................................................... 153
7.2.4.5 Lubricant Cost. ....................................................................................... 153
7.2.4.6 Difficulty of Use. ...................................................................................... 153
7.2.5 Scales for Rating of Criteria ........................................................................ 154
7.2.5.1 Friction Reduction. ................................................................................... 157
7.2.5.2 Effect on Adhesion. .................................................................................. 158
7.2.5.3 Temporary Corrosion Protection. ............................................................. 158
7.2.5.4 Safety Hazards. ......................................................................................... 160
7.2.5.5 Lubricant Cost. ......................................................................................... 160
7.2.5.6 Difficulty of Use. ...................................................................................... 161
7.2.6 Evaluation Process. ..................................................................................... 163
7.2.7 Matrix Evaluation of Candidate Lubricants. ............................................... 163
7.3 Recommendations. ......................................................................................... 172
CHAPTER 8 SUMMARY, RECOMMENDATIONS, AND
CONCLUSIONS ........................................................................................ 175
8.1 Summary. ....................................................................................................... 175
8.2 Findings. ......................................................................................................... 177
8.2.1 Small-scale Friction Tests. .......................................................................... 177
8.2.2 Accelerated Wire Corrosion Tests in Deionized Water and 3.5%

xiii
NaCl Solution. .................................................................... 177
8.2.3 Exposure Tests in Ambient Outdoor Conditions. ....................................... 178
8.2.4 Small-scale Adhesion Tests. ....................................................................... 178
8.2.5 Anchored Pull-out Tests. ............................................................................. 179
8.3 Recommendations. ......................................................................................... 179
8.4 Future Research. ............................................................................................. 180
APPENDIX A ........................................................................................................ 181
APPENDIX B ......................................................................................................... 206
REFERENCES ....................................................................................................... 216

CHAPTER 1 INTRODUCTION 1.1 General. The use of prestressed concrete has increased at a rapid rate since its introduction in 1928 by Eugene Freyssinet of France[1]. Today prestressed concrete is used in several types of structures including bridges, buildings, and parking garages. In the last thirty years the use of post-tensioned prestressed concrete in U.S. bridge construction has rapidly increased due to its versatility and favorable economics. Two of the most notable developments in which post-tensioned concrete and post-tensioning technology have been used include segmental and cable-stay bridge construction (Figures 1.1 and 1.2). In segmental construction precast or cast-in-place concrete bridge segments are post-tensioned together to form a continuous structure. In cable-stay construction steel girders or concrete segments for deck elements are combined with post-tensioning steel stay elements. During the last twenty years over 100 large segmental bridge projects and 13 cable-stay bridges have been completed in the United States[2,4]. These bridges have provided excellent performance to date and are not expected to have any problems in the near or distant future. However, their have been a number of concerns associated with their construction. Two of these are friction reduction during stressing of post-tensioned tendons and temporary corrosion protection of both post-tensioned tendons and cable-stays after installation and before grouting. 1.2 Post-tensioned Concrete. In post-tensioned prestressed concrete, ducts are placed in the formwork before the concrete. After the concrete has cured, prestressing steel tendons are placed within the ducts. These tendons are then stressed by using a hydraulic ram which jacks the tendon against the end of the

2
Figure 1.1 The H-3 windward viaduct in Hawaii (Reference [2]).
Figure 1.2 Sunshine Skyway Bridge, Tampa, Florida (Reference [3]).

3
concrete member resulting in precompression of the member. At this stage there is no bond between tendon and concrete. When the tendon has been stressed to the desired force, the ram is released with the elongated tendons anchored by special anchorages at the ends of the member. The anchorages therefore hold the force of the tendon and continue the compressive force transfer into the concrete. After anchoring the post-tensioned tendons, the duct may or may not be grouted. If the duct is grouted, the tendon is then bonded to the surrounding concrete by the grout. If the duct is not grouted, the tendon is then attached to the surrounding concrete only at the anchorages. Grouted tendons are referred to as bonded tendons while ungrouted tendons are referred to as unbonded tendons. Unbonded tendons may also be in the form of single strand tendons encased in grease-filled sheaths. 1.3 Post-tensioned Tendons. 1.3.1 Description. As shown in Figure 1.3 a bonded post-tensioned tendon consists of a tension element, duct, anchorages and grouting system. The tension element is often referred to as the tendon and may consist of high strength wires, bars, or strands. In the United States 0.5" diameter or 0.6" diameter seven-wire strands are the preferred types of prestressing steel. The duct usually consists of galvanized steel or high density polyethylene. Anchorages are always steel and vary depending on the type of prestressing steel used for the tendon. The grout usually consists of water, cement, and sometimes commercial admixtures. 1.3.2 Concerns. 1.3.2.1 Friction Reduction. During stressing of multi-strand tendons friction forces are encountered between the tendon and the duct as shown in Figure 1.4a. This friction can be divided into two types, friction due to curvature and friction due to wobble. The curvature of the duct results in direct contact between the tendon and the duct and also high normal forces between the tendon and the duct. These are accompanied by high friction forces. Wobble refers to the actual path of a straight duct in post-tensioned construction. In practice almost all straight ducts will have some amount of wobble due to their large lengths and/or "kinks" caused during the

4
Figure 1.3 Bonded post-tensioned tendon.
fabrication process. Accidental contact with the tendons in these wobble zones also produces friction but of considerably lower magnitude. In curved tendons both curvature and wobble are present. Substantial research has been completed on friction during stressing of post-tensioned tendons[5,6] resulting in ranges of values for both curvature friction and wobble friction coefficients for different post-tensioning systems. From these values general estimates of the friction forces encountered during stressing can be determined. The values are usually expressed as ranges.

5

6
As shown in Figure 1.4b frictional forces encountered during stressing can result in a significant loss in the prestress force along the length of a post-tensioned tendon. In long continuous tendons this loss may be as much as 30 to 40%. Therefore, if the tendon is temporarily stressed at one end to 80% of its ultimate strength, which is the maximum allowed by current codes, then the stress in the tendon at the other end will be approximately 50% of ultimate. If the tendon is jacked from both ends, then frictional losses may be reduced. However, significant losses will still exist along the length of the tendon. High frictional losses are undesirable for the following reasons: (1) If the tendon strength cannot be fully utilized along its full length, then prestressing steel is being wasted which results in higher construction costs. (2) Generally, the level of effective prestress governs tendon design. Additional tendons may be required to obtain the design prestress in the structure. Installation of additional tendons introduces additional costs and time delays in construction. (3) The overall structural design changes when the required prestress cannot be achieved or additional tendons are used. Due to the increasing complexity of tendon layouts for post-tensioned bridges, high frictional forces have become an increasing problem in recent years. In some cases the friction forces encountered in the field have been much larger than the calculated values. In other cases the field friction forces have agreed with the calculated values. In either case high friction losses are considered unacceptable. They have been offset by lubrication of the tendon. Historically, the lubricant of choice has been some type of emulsifiable oil. This type of lubricant has been claimed to provide good friction reduction in the field. However, there are numerous emulsifiable oils available and it is not known whether different oils will provide different amounts of friction reduction. 1.3.2.2 Temporary Corrosion Protection. Another concern during post-tensioned concrete construction is temporary corrosion protection of the tendons after installation in the duct and before grouting. In most cases tendons are installed, stressed,

7
anchored, and grouted within a few days. However, in some staged construction as well as when long construction delays due to inclement weather or other unforeseen events occur, these tendons could be left ungrouted for several months. During this period humidity in the duct or corrosive agents from the ambient outdoor surroundings could lead to corrosion of the tendon. Corrosion of post-tensioned tendons is a serious matter because tendons consist of small cross-sectional areas under high stresses. If corrosion occurs, then a reduction in strength or possible fracture of the tendon could occur leading to serious structural damage. In order to protect post-tensioned tendons from corrosion prior to grouting, emulsifiable oils and vapor phase inhibitors have been used. Vapor phase inhibitors are in the form of fine crystals, which slowly sublime to create a vapor which acts in the presence of moisture and oxygen to prevent corrosion. These inhibitors tend to be preferred over emulsifiable oils for protection of the tendon after installation in the duct[7]. However, both vapor phase inhibitors and emulsifiable oils are used by strand manufacturers for protection of strand during long storage periods[8,9]. Again, there are numerous emulsifiable oils currently available but there is no test data comparing the corrosion protection offered by different oils. 1.4 Cable-Stays. 1.4.1 Description. Cable-stays are another form of a post-tensioned tendon. A cable-stay consists of a tension element anchored at both ends and usually grouted inside a duct. The most common tension elements are multiple wires, multiple bars, or multiple strands. In recent times, cable-stays have usually been grouted in order to provide permanent corrosion protection of the prestressing steel. The grout serves no direct structural purpose since the tendon is only attached to the structure at its ends. A cable-stay is therefore an unbonded post-tensioned tendon on a much larger scale. At the present time, concerns over corrosion protection are leading to the introduction of other cable stay systems with combinations of galvanized strand, epoxy-coated strand, grouting or other blocking agents such as waxes. 1.4.2 Temporary Corrosion Protection. The construction of a cable-stay
8
bridge usually takes several years. During this time the stays are erected, but are often left ungrouted until the final stages of construction. Temporary corrosion protection of the stays during this time is of utmost concern since they are primary load carrying members. Currently, there are no products marketed specifically for temporary corrosion protection of cable-stays. Since the same types of steels are used for both post-tensioned tendons and cable-stays, the same type of temporary corrosion inhibitors have been employed, namely emulsifiable oils. Vapor phase inhibitors are not usually used for temporary corrosion protection of cable-stays due to the length and inclination of the stays. When emulsifiable oils are used for friction reduction or temporary corrosion protection in post-tensioned construction, water is usually pumped through the duct in an attempt to "flush" the oil off of the tendon before grouting. The efficiency of this flushing process is unknown. If the oil is not completely removed from the tendon, then the adhesion between the tendon and the grout may be incomplete leading to problems with serviceability or tendon ultimate strength. In cable-stay construction the stay is usually not flushed in order to prevent the introduction of water into the duct. 1.5 Problem Statement. Emulsifiable oils have been used for friction reduction in post-tensioned tendons and temporary corrosion protection of post-tensioned tendons and cable-stays. Currently, there are numerous emulsifiable oils manufactured, but none are marketed specifically for any or all of these applications. In order to compare the friction reduction and temporary corrosion protection performance of candidate emulsifiable oils, a lubricant evaluation should be performed. 1.6 Objectives. The objectives of this evaluation were to: 1. Identify emulsifiable oils that could be effectively used for lubrication and/or temporary corrosion protection of seven-wire strand. 2. Evaluate the performance of these oils in small-scale corrosion and adhesion tests. These tests should also study the effect of flushing on the corrosion and adhesion properties of lubricated seven-wire strands.

9
3. Provide recommendations for use of the selected oils in post-tensioning or cable-stay applications. 1.7 Scope. In the following chapters an evaluation of eleven candidate lubricants is presented. Of these eleven lubricants, ten are emulsifiable oils and one is a sodium silicate solution. The eleven candidate lubricants were selected after performing an extensive literature review and an informal phone survey of users and manufacturers of emulsifiable oils. Findings of the literature review and phone survey are presented in Chapter 2. Results of small-scale friction tests performed by Hamilton and Davis as part of this overall project are also presented in Chapter 2 since these results are incorporated into the overall lubricant evaluation. Accelerated wire corrosion tests are described in Chapter 3. These tests used a reference electrode and visual observations to compare the corrosion protection offered by the eleven lubricants in deionized water and 3.5% NaCl solution. Chapter 4 presents exposure tests in which lubricated unflushed and lubricated then flushed strands were subjected to a daily wetting cycle in outdoor ambient conditions. Small lubricated wires were also tested to compare the performances of the lubricants in the exposure tests and the accelerated wire corrosion tests reported in Chapter 3. Chapter 5 describes pull-out tests that were performed to compare the effects of the different lubricants on the adhesion between seven-wire strand and cement grout before and after flushing. Additional pull-out tests performed in Chapter 6 were used to determine the relative effects of restricting twist on the behavior of bare, lubricated, and lubricated, then flushed strands. Chapter 7 reports the overall lubricant evaluation that was used to select the best four lubricants for use in large-scale friction tests that were part of this overall project. In Chapter 8 the findings are summarized, conclusions are drawn, recommendations concerning the use of these eleven products, and recommendations for further research are given.

CHAPTER 2
STATE-OF-THE-ART
2.1 Introduction. This chapter presents the findings from the literature review and
phone survey that were completed to determine the state-of-the-art in lubricated tendon
utilization. From these findings it became apparent that no product is currently
marketed specifically for lubrication or temporary corrosion protection of multistrand
post-tensioning tendons. An emulsifiable oil that had been previously marketed for
temporary corrosion protection of post-tensioned tendons before grouting was
identified. However, this oil is no longer manufactured. It is interesting to note that
this product was originally designed for use as a coolant-lubricant in metalworking
operations and that its formulation was only changed slightly before being marketed
for use in post-tensioned concrete construction. This formula change involved the
removal of chlorides from the oil[10].
Related research that was identified in the literature review included a previous
evaluation of temporary corrosion inhibitors, studies of various temporary corrosion
protection techniques, and friction tests using emulsifiable oils.
The informal phone survey identified four emulsifiable oils that have been used
for temporary corrosion protection or friction reduction of post-tensioned tendons. Six
other products were recommended by three different manufacturers of emulsifiable
oils.
After reviewing the literature and completing the phone survey eleven
candidate products were selected for possible use in lubrication or temporary corrosion
protection of prestressing steel. These eleven products were compared using
small-scale corrosion tests, pull-out tests, and small-scale friction tests. The corrosion
and pull-out tests are presented in their entirety in this thesis, while only the procedures
and results of the small-scale friction tests are presented in this chapter. These latter

12
tests were designed and performed by Trey Hamilton and Rodney Davis as part of this
overall project.
2.2 Background on Emulsifiable Oils. Historically, emulsifiable oils have been the
most common products used for friction reduction of post-tensioned tendons. Since
this thesis concentrated primarily on emulsifiable oils, background information on
these types of lubricants will be presented before the findings of the literature review
and phone survey.
Emulsifiable oils are primarily designed for use as coolant-lubricants in
metalworking operations. These oils, which are often described as "water soluble"
oils, are designed to be mixed with water to form an emulsion, which can be pictured
as tiny oil droplets surrounded by a thin film of emulsifier, which in turn is surrounded
by water. The emulsifier is an additive in the oil that reduces the interfacial tension
between the oil and the water. This allows the oil and water to mix[11]. Oil in water
emulsions usually appear as a milky white solution similar to milk. However,
different color emulsions can be encountered depending on the oil.
Table 2.1 shows additives that are commonly used in emulsifiable oils
manufactured for metalworking operations. These additives are designed for several
purposes including friction reduction between the cutting tool and the metal, rust
prevention, odor control, and bacterial growth.
Since emulsifiable oils are usually used "straight" in post-tensioning
operations, problems that are sometimes encountered with an oil in water emulsion are
avoided. These problems include bacterial growth in the emulsion, maintaining the
correct pH in the emulsion, and checking the type of water used to make the emulsion.
One problem that may arise with the use of

13
Table 2.1 Additives commonly used in emulsifiable oils (From reference [11]).

14
an emulsifiable oil in post-tensioned construction is separation of the oil's constituents.
If an emulsifiable oil is subjected to sub-freezing conditions during storage, then there
is a possibility that the components of the oil will separate[11]. This separation could
lead to reduced friction reduction or reduced corrosion protection offered by the oil.
To determine if separation of the oil's components has occurred, a sample of
the oil should be drawn from the container and mixed with water. During mixing the
oil should be added to the water not vice versa. If the oil forms an emulsion, then
separation of the oil has not occurred. However, if the oil does not form an emulsion,
then separation has occurred. The oil can usually be agitated to remix the ingredients.
However, it is not advisable to store an oil under conditions which will cause
separation of the oil's components[11].
2.3 Findings from Literature Review.
2.3.1 Evaluation of Temporary Corrosion Inhibitors. Previous research of
temporary corrosion inhibitors recommended the use of a vapor phase inhibitor or a
sodium silicate-sodium nitrite solution for temporary corrosion protection of
prestressing steel[12]. In that research five products were tested for possible use in
temporary corrosion protection of prestressing steel. These products were evaluated
based on their performance in small-scale corrosion tests and small-scale bond tests.
The products studied in that research were a sodium silicate-sodium nitrite
solution, an emulsifiable oil, two organic corrosion inhibitors, and a vapor phase
inhibitor. The emulsifiable oil and the organic corrosion inhibitors provided better
corrosion protection than the sodium silicate-sodium nitrite solution, but their adverse
effects on bond prevented their recommended use in prestressed concrete. The
sodium silicate-sodium nitrite solution and vapor phase inhibitor essentially had no
affect on bond.
The sodium silicate-sodium nitrite solution consisted of a product called

15
sodium silicate "N", sodium nitrite, and water. The emulsifiable oil was Shell Dromus
B and the two organic corrosion inhibitors were Trachem Drycoat and Trachem
Lubecoat. Shell VPI No. 250 was the vapor phase inhibitor.
Sodium silicate "N" is a multi-purpose product that can be used for corrosion
protection of metals. This product is manufactured by The PQ Corporation of South
Gate, California.
Shell Dromus B is a general purpose emulsifiable oil marketed for use as a
coolant-lubricant in metalworking operations. Shell Dromus B is manufactured by the
Shell Oil Company.
Trachem Drycoat was an organic corrosion inhibitor that dried rapidly to form
a clear, non-tacky film after application. Trachem Lubecoat was an organic,
water-displacing corrosion inhibitor which remained soft and tacky after application.
Both of these products were manufactured by Tracor, Inc. of Austin, Texas. Neither
of these products are currently manufactured[13].
Shell VPI No. 250 is currently manufactured by the Olin Chemical Company
of Stamford, Connecticut under the name Dichan 100[14]. This inhibitor is in the
form of fine crystals. These crystals slowly sublime to create a vapor that prevents
corrosion.
Corrosion tests using 2.5" long, 0.25" diameter prestressing wires were used to
compare the corrosion protection offered by the sodium silicate-sodium nitrite solution,
the emulsifiable oil, and the two organic corrosion inhibitors. A separate corrosion
test was performed for the vapor phase inhibitor due to its physical characteristics.
The vapor phase inhibitor is in the form of fine crystals. Therefore, it could not be
used to coat wire specimens.
In the wire corrosion tests the 2.5" wire specimens were coated with the
corrosion inhibitors for one-half of their length. These wire specimens were then hung
16
on racks and placed in a desiccator containing water in the bottom. Every forty-eight
hours the racks were taken out of the desiccator, placed in a refrigerator for one hour,
and then placed back into the desiccator. This cooling cycle and insertion back into
the desiccator caused water to condense on the wire specimens creating a corrosive
environment. Visual observations were recorded at regular intervals to determine the
length of corrosion protection offered by the different inhibitors.
Two modified versions of this corrosion test were also performed. The first
version dipped the coated wires in distilled water before the cooling cycle. The
second version dipped the coated wires in 3.5% NaCl solution before the cooling cycle.
In the original version of this test all four of the corrosion inhibitors prevented
corrosion for more than 1100 hours, or approximately 46 days. When the coated
wires were dipped in distilled water before cooling the organic corrosion inhibitors
provided the best corrosion protection. Each of these inhibitors prevented corrosion
for more than 1100 hours. Shell Dromus B prevented corrosion for 720 hours and the
sodium silicate-sodium nitrite solution prevented corrosion for 360 hours.
When the coated wires were dipped in the 3.5% NaCl solution the organic
corrosion inhibitors again provided the best corrosion protection. Trachem Drycoat
prevented corrosion for 640 hours and Trachem Lubecoat prevented corrosion for 450
hours. Shell Dromus B prevented corrosion for 240 hours and the sodium
silicate-sodium nitrite solution prevented corrosion for 75 hours.
During the wire corrosion tests performed in that study a white precipitate was
observed on the wires coated with the sodium silicate-sodium nitrite solution.
According to the study the precipitate was probably SiO2 caused by the reaction
between the sodium silicate film and the CO2 in the atmosphere.
Corrosion tests for the vapor phase inhibitor used 0.25" diameter prestressing

17
wire specimens enclosed in Pyrex tubes. The tubes were inclined at 5 on a flat surface
and contained 20 mL of water at the lower end of the tube. Before sealing the tube,
five grams of Shell VPI 250 were sprinkled onto the wire at the top end. After 50
days of exposure, corrosion spots extended from the bottom of the wire to within 1" of
the VPI crystals. No tests were performed using a 3.5% NaCl solution and the vapor
phase inhibitor.
The small-scale bond tests completed in that study used single 0.25" diameter
prestressing wire specimens and single 0.5" diameter seven-wire strand specimens
surrounded by a sand-cement mortar. A complete set of test results was presented for
the strand specimens, but not for the wire specimens.
In the tests using the strand specimens two strands were coated with each
corrosion inhibitor and then rinsed with distilled water to simulate flushing of a
post-tensioned tendon. Each rinsed strand was then placed in the fixture shown in
Figure 2.1 and stressed to 7000 lbs. using a testing machine. After stressing, the load
in the strand was transferred to the fixture by tightening the 1" nuts on the two threaded
rods. The fixture was then removed from the testing machine and a sand-cement
mortar was placed around the center section of the strand while the strand was still in
the fixture. The dimensions of the mortar block were 2.5" x 2.5" x 5".
The specimen shown in Figure 2.1 actually shows a prestressing wire
surrounded by the sand-cement mortar. However, the same size mortar block was
used for both the 0.25" diameter wires and the 0.5" diameter strands.
After the mortar block had cured the fixture was placed back into the testing
machine. The strand was then loaded until the 1" nuts could just be loosened
transferring the load from the fixture to the testing machine. The test procedure
consisted of unloading the strand in 200 lb. increments. At the conclusion of each
load increment the strain in the mortar block and the load in the strand were recorded.

18
Figure 2.1 Fixture used for small-scale bond tests (From reference [12]).
The strain in the mortar block was measured using a strain gauge epoxied to the outer
surface of the block. Load in the strand was indicated from the testing machine. By
comparing the strain in the mortar block with the load in the strand, the bond-slippage
load could be determined. Figure 2.2 shows the results for two uncoated strands and
one coated, but then rinsed strand. The coated strand was coated with Shell Dromus B
before rinsing. One of the uncoated strands was grit-blasted before testing, while the
other uncoated strand was not treated before testing.
Points marked "A" in Figure 2.2 indicate where the outer wires of the strand
began to slip through the mortar block. Points marked "B" indicate where the bond
began to pick-up due to mechanical interlock between the strand and the mortar. For
the bare, uncoated strand with smooth wires the bond-slip load was approximately
2400 lbs. compared to a bond-slip load of approximately 400 lbs. for the rinsed strand
originally coated with Dromus B. The grit blasted strand had a much higher bond-slip

19
load of approximately 7900 lbs.
The average bond release load for the bare strand specimens that were not grit
blasted was 2330 lbs. For the strands coated with the sodium silicate-sodium nitrite
solution the average slip load was 2150 lbs., which was 10% less than the bare strand.
The organic coatings and the emulsifiable oil caused major reductions in bond.
Average slip loads for Trachem Drycoat and Trachem Lubecoat were 1100 lbs. and
900 lbs. respectively. The average slip load for Dromus B was 300 lbs. These slip
loads represented a 60% reduction in bond caused by the organic corrosion inhibitors
and a 90% reduction in bond caused by the emulsifiable oil.
2.3.2 Other Temporary Corrosion Protection Methods.
Figure 2.2 Typical results from small-scale bond tests (From reference [12]).
2.3.2.1 Alkali-polymer Coating. An alkali-resistant polymer coating was
mentioned in the literature as a possible temporary corrosion inhibitor for prestressing

20
steel[15]. Exposure tests using this coating on mild steel reinforcing bars showed it to
provide excellent corrosion protection in outdoor ambient conditions[16]. The
exposure tests were performed in a South London urban atmosphere for 12 months.
After 12 months, bars coated with the polymer coating were virtually unaffected, while
uncoated bars were severely corroded. The polymer coating appeared to be
flexible after drying and had little effect on the bond between reinforcing bars and
concrete. Accelerated corrosion tests also showed this coating to provide excellent
corrosion protection after the bar is surrounded by concrete. No methods for
removing this coating were studied.
The alkali-polymer coating is similar in appearance to a conventional paint and
can be applied by brushing, dipping, or spraying.
2.3.2.2 Corrosion Inhibitor Solution. A patented corrosion inhibitor solution has
been tested for possible use in temporary corrosion protection of post-tensioned
tendons. This passivating, alkaline solution was designed to fill ducts containing
ungrouted tendons[17]. The solution is flushed out of the ducts before grouting.
Small-scale corrosion tests performed with four different corrosion inhibitor
solutions showed the patented solution to provide the best corrosion protection. The
solutions tested were the patented solution, a lime solution, cement extract, a carbonate
solution, and a hydroxide solution. Anodic polarization measurements, peak potential
measurements, immersion studies, and stress corrosion cracking studies were
completed in the research. These tests involved small prestressing steel specimens.
No full-scale tests using ducts filled with the different solutions were performed.
2.3.2.3 Swedish National Road Administration Study. A study conducted by the
Swedish National Road Administration investigated five methods of temporary
corrosion protection for post-tensioned tendons[15]. The tendons examined during
their test were left ungrouted for three years. Twenty-six tendons, located in three

21
different locations in Sweden, were used in this investigation. The corrosion
protection methods were:
1. Careful sealing of the ducts combined with drain pipes at the duct low
points.
2. Continuous flowing of predried air through the ducts.
3. Depositing a vapor phase inhibitor in the ducts.
4. Eliminating oxygen from the steel environment by filling the ducts with
nitrogen. This method was not practical due to problems with gas tube connections and
gas leakage.
5. Applying an emulsifiable oil on the tendons.
After three years of exposure no major differences in the corrosion protection
methods were observed. The prestressing steel in all of the ducts at all three sites was
in good condition. Tensile, fatigue, bend and stress-corrosion tests performed at the
conclusion of the test also showed no variations in the prestressing steel from the
different sites.
2.3.3 Small-scale Friction Tests using Emulsifiable Oils. Small-scale friction
tests performed by Owens and Moore showed no reductions in friction when an
emulsifiable oil was used to lubricate a single strand tendon[9]. This study used the
test setup shown in Figure 2.3 to investigate the effect of different surface conditions
on friction in post-tensioned tendons. Four tendon

22

23
sizes and three surface conditions were investigated in this study. The single tendons
consisted of 7 mm wire, 12.7 mm drawn strand, 15.2 mm round wire strand, and 18
mm drawn strand. The surface conditions were clean, rusty, and oiled.
Table 2.2 shows the results from their tests. For the 15.2 mm round wire
strand there was essentially no difference between the friction coefficients for the clean
strands and the friction coefficients for the oiled strands. Results from this table also
showed a significant increase in the friction coefficient caused by the presence of rust
on the tendon before testing. This increase varied between factors of 1.5 and 2.5.
The test procedure used for these friction tests consisted of loading each single
wire or single strand tendon up to 80% of its ultimate breaking load and then unloading
it back to zero. Ten to fifteen load increments were used during loading and
unloading the tendons.
In a related study, five post-tensioned beams containing clean and lubricated
post-tensioning bars were tested[9]. These tests showed no difference in the cracking
and deflection behavior of beams containing a "clean" bar and beams containing a
lubricated bar that was flushed before grouting.
Figure 2.4 shows the test setup that was used for the beam tests. In this test
each of the beams were loaded at quarter points and deflection was measured at
midspan. The conditions of the post-tensioning bar for each of the five beams is
shown below.
Beam Number Conditions of post-tensioning bar
1,2 Clean, grouted post-tensioning bar 3,4 Lubricated, then flushed and grouted post-tensioning bar
5 Lubricated, ungrouted post-tensioning bar

24

25

26
Each beam contained a single 20 mm diameter Macalloy post-tensioning bar
inside a 30 mm diameter flexible steel duct. The Macalloy bar was stressed to 227.5
kN four weeks after casting the beams. The beams were grouted immediately after
stressing and tested three weeks later. A neat cement grout having a water to cement
ratio of 0.45 was used to grout the ducts in four of the five beams. The duct in the
fifth beam was left ungrouted.
The lubricated bars were lubricated with Shell Dromus B. According to their
study some prestressing steel suppliers have used Shell Dromus B, Caltex Soluble
RGBF, or Mobil Solvag 1535 for temporary corrosion protection of prestressing steel
during storage. These products were shown to provide good corrosion protection in
normal storage conditions. All three of these products are emulsifiable oils.
Figure 2.5 shows the moment-deflection results from the beam tests. The
results for the beams containing the "clean" bars (beams 1 and 2) were noticeably
different with beam 2 appearing to yield at a much lower load than beam 1. Due to
the difference in results for beams 1 and 2 it was difficult to determine the effect of the
flushed lubricant on the flexural behavior of the beams. Crack patterns and crack
widths were similar for all four of the bonded beams (beams 1, 2, 3, and 4).
The behavior of the unbonded beam (beam 5) was quite different than the
behavior of the bonded beams. The unbonded beam had less than half the number of
cracks as the bonded beams and also had one crack that opened very quickly to 2 mm
before loading was removed.
2.3.4 Large-scale Friction Tests using Emulsifiable Oils.
2.3.4.1 Large-scale Friction Tests Performed by the California Department of
Transportation. Large-scale friction tests conducted on a concrete box girder bridge
using an emulsifiable oil reduced the friction in a post-tensioned tendon

27

28
by approximately 15%[18]. In these tests four tendons, described in Table 2.3, were
tested before and after lubrication to determine the effectiveness of an emulsifiable oil
in reducing friction.
Two test procedures were used. The first jacked the tendons from both ends
simultaneously and the second jacked the tendons from one end. In both tests load
cells at both ends of the tendons and strain gages along the lengths of the tendons were
used to determine friction losses along the tendon length.
Each of the four tendons were tested at least three times in a "dry" condition
and then lubricated and tested at least two more times. The lubrication process
consisted of pouring an emulsifiable oil directly into the ducts. Due to the fairly steep
longitudinal grade of the bridge, the oil eventually ran through the ducts. The oil
could not be pumped into the duct since there was no way of creating a tight seal at the
end of the duct.
After the tendons were lubricated the friction was reduced by approximately
15% for the wire tendons. No reductions in friction were observed for the strand
tendons after lubrication. Grout leaks and damaged ducts may have contributed to the
lack of friction reduction in the strand tendons. The four lubricated tendons were
flushed with water after testing and before grouting. The brand of the lubricant used
to lubricate the tendons was not mentioned in the report.

29
2.3.4.2 Large-Scale Friction Studies Performed by Dywidag Systems International and
the California Department of Transportation. Dywidag Systems International in
cooperation with the California Department of Transportation performed large-scale
friction tests on an actual structure to compare two different lubricating agents for use
in post-tensioned tendons[19]. These tests showed a biodegradable soap to provide
slightly better friction reduction than an emulsifiable oil. The soap reduced the
friction by approximately 55% while the emulsifiable oil reduced the friction by 40 -
45%.
The structure used in these tests was a three cell concrete box girder bridge.
Friction tests were performed on six tendons, all of which were located in the two inner
webs of the box. Four of the tendons were stressed "dry" and two of the tendons were
stressed after lubrication. The friction reduction offered by the two lubricants was
determined by comparing the measured elongations and the forces reaching the far
anchorages for both of the lubricated tendons.
Each of the six tendons consisted of 29, 1/2" diameter strands having an
ultimate strength of 270 ksi. The sheathing was a semi-rigid corrugated galvanized
Table 2.3 Lubricated tendons tested in reference [18].

30
steel duct having an inner diameter of 100 mm. All of the tendons were draped
following the same parabolic curve.
One of the two lubricated tendons was lubricated with a solution of Aqualube
MX, while the other tendon was lubricated with a solution of Dromus B. Each
solution was formulated by mixing one part soap, or one part oil, with one part water.
Lubrication of the tendons was completed by pumping approximately 50 gallons of
solution into the duct. Compressed air was used to drive the solution through the duct.
Both ducts containing the lubricated tendons were flushed with water after testing and
before grouting.
2.4 Summary of Findings from Literature Review. Three emulsifiable oils were
mentioned in the literature review for use in lubrication or temporary corrosion
protection of prestressing steel. These oils were Shell Dromus B, CalTex Soluble
RGBF, and Mobil Solvag 1535. Shell Dromus B was used in both lubrication and
corrosion protection studies. The other two oils (CalTex Soluble RGBF and Mobil
Solvag 1535) have both been used for temporary corrosion protection of prestressing
steel in storage. However, no controlled test data was presented which showed the
actual amount of corrosion protection that could be expected from these two oils. A
biodegradable soap (Aqualube MX) was also identified as a possible lubricant for use
in friction reduction in multi-strand tendons.
The test data identified in the literature for Shell Dromus B showed this oil to
provide good temporary corrosion protection[12]. When emulsifiable oils were used
for friction reduction the reported data was conflicting. The reported data showed an
emulsifiable oil to have no effect on friction[9], reduce friction by 15%[18], and reduce
friction by 40 - 45%[19]. Shell Dromus B was the emulsifiable oil used in the first
and third studies. The emulsifiable oil used in the second study was not identified.
Results showing the effect of an emulsifiable oil on adhesion after flushing

31
were also conflicting. One study showed Shell Dromus B to essentially destroy the
adhesion between a flushed seven-wire strand and cement grout[12]. Another study
showed Shell Dromus B to have no effect on the cracking and deflection behavior of a
post-tensioned beam containing a lubricated then flushed post-tensioning bar[9].
Due to these conflicting results in friction reduction, effect on adhesion, and the
lack of test data comparing the corrosion protection of different emulsifiable oils a
comparison of candidate oils was in order. This comparison, which is provided in this
thesis, will serve as a base study that directly compares the friction reduction, effect on
adhesion, and corrosion protection of several different emulsifiable oils. It also gives
some insight into the chemical composition of emulsifiable oils in general.
2.5 Findings from Informal Phone Survey. The informal phone survey was
designed to obtain information on products that are currently being used for lubrication
and\or temporary corrosion protection of prestressing steel. In this survey four bridge
contractors, four state highway departments, and six manufacturers of emulsifiable oils
were contacted. Information was also obtained from the Federal Highway
Administration and the Post-Tensioning Institute.
The primary questions asked during the phone survey were:
1. What products are currently being used to reduce friction in post-tensioned
tendons?
2. What products are currently being used for temporary corrosion protection of
post-tensioned tendons and/or cable-stays?
3. How are these products being applied to post-tensioned tendons or
cable-stays?
4. How are these products being removed from post-tensioned tendons or
cable-stays?
According to the sources contacted in this phone survey, emulsifiable oils are

32
the most common products used for friction reduction in post-tensioned tendons.
These oils are usually applied by one of the five methods shown below.
1. Spraying the tendon with oil as the tendon is entering the duct.
2. Pouring oil over the tendon as the tendon is entering the duct.
3. Pulling the tendon through a bath of the oil as the tendon is entering the duct.
4. Pumping oil into the duct after the tendon has been installed.
5. Pouring oil through grout ports as the tendon is entering the duct.
Removal of emulsifiable oils after stressing and before grouting is usually
accomplished by pumping water through the duct. This "flushing" procedure is
usually continued until the water exiting the duct is free of oil. One of the sources also
mentioned the use of limewater to flush the oil off the tendon.
Graphite powder was mentioned by three of the sources for possible use as a
friction reducer. This powder is smeared onto the tendon as the tendon is entering the
duct.
Emulsifiable oils have also been used for temporary corrosion protection of
post-tensioned tendons and cable-stays. In cable-stay construction the oil may not be
flushed from the tendon in order to prevent the introduction of water into the duct. In
post-tensioned tendons the oil is usually flushed from the tendon before grouting by
pumping water through the duct. These oils can be applied in the same manner when
used for friction reduction or temporary corrosion protection.
The use of a vapor phase inhibitor for temporary corrosion protection of
post-tensioned tendons was also mentioned. This inhibitor is in the form of fine
crystals and can be blown into the duct after the tendon has been installed. Flushing
of a vapor phase inhibitor or graphite powder was not cited by any of the sources, but
is probably performed before grouting.
2.6 Candidate Lubricants Selected for Evaluation. Table 2.4 shows the eleven

33
products that were selected as possible candidates for temporary corrosion protection
and/or lubrication of prestressing steel. These products were selected after reviewing
the literature and completing the informal phone survey. Of these eleven products
nine are emulsifiable oils, one is an emulsifiable oil-free fluid, and one is a sodium
silicate solution. The sodium silicate solution is not designed for use as a lubricant,
but will be referred to as a lubricant in this study. The sodium silicate solution was
selected because it was used in previous research concerning temporary corrosion
protection of prestressing steel.
Four of the eleven lubricants described in Table 2.4 have been used for
temporary corrosion protection and/or friction reduction of post-tensioned tendons.
One of these four lubricants has also been used in previous research studying corrosion
protection and friction reduction in post-tensioned tendons.
Four other lubricants, Aqualube MX, Caltex Soluble RGBF, Mobil Solvag
1535, and Rust-veto 2212 were identified after this research had been completed.
Aqualube MX has been used for friction reduction, while the other three lubricants
have been used for temporary corrosion protection of prestressing steel during
storage[19,9,8]. None of these lubricants were used in this study, but may be used in
future tests.
2.7 Friction Tests. As part of the overall lubricant evaluation small-scale friction
tests were performed to compare the relative lubrication properties of the eleven
products studied in this thesis. In these tests static friction reduction and dynamic
friction reduction were studied. Static friction was considered to be the friction that
exists between the tendon and the duct before the tendon begins to move during
stressing. Dynamic friction was considered to be the friction that exists between the
tendon and the duct after the tendon begins to move during stressing.

34
Table 2.4 Continued.

35
Table 2.4 Continued.
The small-scale friction tests were designed and completed as part of this
overall project by Trey Hamilton and Rodney Davis. This section presents the
procedures and results from these tests.
2.7.1 Procedures. The test setup used for the small-scale friction tests is
shown in Figure 2.6. In this setup a single 1/2" diameter seven-wire strand was
positioned between two concrete blocks. Each concrete block contained a 1.25" x 12"
strip of galvanized steel duct embedded in the surface facing the strand. The strand
was therefore "sandwiched" between these two duct strips, which were embedded in
the concrete blocks. A normal force of 1000 lbs. was applied to the top block by a 60
kip testing machine. This force was used to simulate normal forces encountered
around duct bends in the field.
Two pairs of blocks were constructed for each of the eleven lubricants. For
each pair of blocks the same test procedure was used. Initially, a bare strand was
placed between the blocks and pulled two times. Next, this strand was lubricated with
a candidate lubricant and pulled two more times. This procedure resulted in four sets
of test data for each pair of blocks, two data sets

36
for the bare strand and two data sets for the lubricated strand.
From the four data sets an average static friction factor and an average dynamic
friction factor were determined for bare strand and for lubricated strand. The amount
of friction reduction provided by the different lubricants was determined by comparing
the average friction factors for the bare and lubricated strands.
An additional pair of blocks was also constructed to determine the sensitivity of
the test results to dramatic changes in surface conditions on the duct strips. In these
tests 1.25" x 12" strips of Teflon were placed between a bare strand and the duct strips
that were embedded in the concrete blocks. The bare strand was then pulled two times
to determine the static and dynamic friction factors provided by the Teflon.
Lubrication of the strand specimens was performed as shown in Figures 2.7
and 2.8. During this process approximately 30 mL of the lubricant was poured over
the strand as it was resting on one of the blocks. Another 30 mL of lubricant was also
poured over the duct on the other block. The blocks were then "sandwiched" together
with the strand specimen between them and positioned in the testing machine.
After the first pull of each lubricated strand, the normal force on the blocks was
removed. This allowed the top block to be removed so the strand specimen could be
"rolled" in the duct of the bottom block. By "rolling" the strand in the duct of the
bottom block the lubricant could be redistributed over the surface of the strand before
being pulled for the second time.
2.7.2 Results. Figure 2.9 shows typical results for one pair of blocks. The top
two curves represent the data for two pulls of the same bare strand. The bottom two
curves represent the data for two pulls of the same bare strand, after the strand had
been lubricated with Lubricant L8. The average load at

37
Figure 2.8 Lubrication of strand for small-scale friction tests.
Figure 2.7 Lubrication of strand for small-scale friciton tests.

38

39

40
which the bare strands began to pull through the blocks was 250 lbs. The average load
at which the lubricated strands began to pull through the blocks was 180 lbs. These
average loads were divided by 1000 lbs., which was the normal force on the blocks, to
obtain an average static friction factor of 0.25 for the bare strand and an average static
friction factor of 0.18 for the lubricated strand for this pair of blocks. Therefore, the
static friction reduction for this lubricant for this pair of blocks was (1 - 0.18/0.25) x
100 or 28%. The same process was used to determine the static friction reduction for
the second pair of blocks.
Determination of the loads for calculating the dynamic friction factors was
quite subjective. As indicated by the data in Figure 2.9 several "dips" occurred in the
load-slip data during testing. These "dips" were a result of the loading system used in
the tests. During the tests a manual pump was used to jack the hydraulic ram. Every
time the pump was stroked the load would suddenly increase at the beginning of the
stroke and suddenly decrease at the conclusion of the stroke.
The "dynamic" load for each pull was obtained by using the loads at the first
three "peaks" after the strand began to pull through the blocks. Typical "peaks" are
marked with circles in Figure 2.9. An average "dynamic" load for each pull was
determined by calculating the average of the three "peak" loads. This average
"dynamic" load was then divided by 1000 lbs., which was the normal force, to obtain a
dynamic friction factor for each pull. The dynamic friction reduction was then
determined by comparing the dynamic friction factors for the bare strand and the
lubricated strand.
Tables 2.5 and 2.6 show the average static and dynamic friction factors for the
bare and lubricated strands for each lubricant and each pair of blocks. The lubricants
are in descending order according to their average friction

41

42

43
reduction with the exception of L10 and Teflon which are not water soluble lubricants.
As indicated by Tables 2.5 and 2.6 the amount of friction reduction varied
depending on the lubricant. For static friction the reductions varied from 27% to 0%.
For dynamic friction the reductions varied from 14% to 2%. Three of the lubricants
(L6, L7, and L10) actually increased the friction. The 30% increases in static and
dynamic friction caused by Lubricant L10 were due to the nature of this lubricant.
L10 is a sodium silicate solution that dries quickly to form a clear, glassy film. During
the friction tests this lubricant became "tacky" and restricted movement of the strand
through the blocks. The increase in friction caused by Lubricants L6 and L7 could not
be explained. When Teflon was placed between a bare strand and the duct strips, both
the static and dynamic friction were reduced by approximately 60%.
The results of the small-scale friction tests performed by Hamilton and Davis
contradicted previous results reported by Owens and Moore, which showed no
reductions in friction when an emulsifiable oil was used to lubricate a single strand
tendon. However, the tests performed by Hamilton and Davis did agree somewhat
with preliminary findings from large-scale friction tests performed by Tran at the
University of Texas at Austin[20]. Tran's preliminary results showed average friction
reductions of 10%, 16%, 18%, and 23% for L2, L8, L5, and L11 respectively. The
80' lubricated tendons used in Tran's tests consisted of seven, 1/2" diameter seven-wire
strands in a 2" diameter corrugated galvanized steel duct.
The average static and dynamic friction reductions shown in Tables 2.5 and 2.6
for each of the eleven lubricants were used in the overall lubricant evaluation reported
in Chapter 7.

CHAPTER 3
ACCELERATED WIRE CORROSION TESTS
3.1 Introduction. The purpose of the accelerated wire corrosion tests was to compare
the length of corrosion protection offered by the eleven lubricants in two accelerated
corrosive environments. In these tests small prestressing wire specimens were coated
with each of the eleven lubricants and immersed for three days in either 750 mL of
deionized water or 3.5% NaCl solution. The three day test period was selected after
preliminary tests showed corrosion covering approximately 50% of bare wire
specimens after three days in deionized water. It was decided that a good corrosion
inhibitor should prevent corrosion during three days of immersion. Therefore, a three
day test period was selected.
During this period potential difference readings between the wire specimens
and a reference electrode were recorded. Visual observations were also recorded
every twenty-four hours to record the appearance or increase in corrosion on the wire
specimens.
It was anticipated that the length of corrosion protection offered by the
different lubricants could be determined by comparing the visual observations with the
potential difference data. However, the potential difference results were quite
scattered and were not always consistent with visual observations. Therefore, the
corrosion protection offered by the different lubricants was evaluated based on visual
estimates of percent corrosion on the wire specimens after three days in each
environment.
3.2 Background. Corrosion of steel in water or saltwater is an electrochemical
process[21]. In this process iron from the steel is oxidized to ferrous ions:
Fe Fe2+ + 2e-(Oxidation of iron)
While oxygen is reduced to hydroxyl ions:
O2 + 2H2O + 4e- 4OH- (Reduction of oxygen)

46
The ferrous ions react with the hydroxyl ions to form ferrous hydroxide, Fe(OH)2:
2Fe2+ + 4OH- 2Fe(OH)2
However, ferrous hydroxide is unstable in oxygenated solutions and is oxidized further
to form rust, or Fe(OH)3:
2Fe(OH)2 + H2O + (1/2)O2 2Fe(OH)3
The oxidation and reduction reactions for iron and oxygen are known as
half-reactions. At standard conditions half-reactions have known potentials with
respect to the standard hydrogen electrode. For example, Fe Fe2+ + 2e- has a
potential of -0.44 V with respect to the standard hydrogen electrode, while O2 +
2H2O + 4e- 4OH- has a potential of 0.40 V with respect to the standard
hydrogen electrode. Since different half-reactions have different potentials, a
reference electrode can be used to indicate when new half-reactions begin, such as Fe
Fe2+ + 2e-.
If a reference electrode is connected to a prestressing wire as shown in Figure
3.1, then the potential difference between the reference electrode and the wire can be
measured. Since the reference electrode is at equilibrium any changes that occur in
the potential difference between the wire and the electrode are due to changes that
occur on the wire surface or in the corrosive environment. If no changes occur on the
wire surface or in the corrosive environment, then the potential difference between the
wire and the electrode will remain constant.
If a bare wire is connected to the reference electrode and deionized water is
used for the corrosive environment, then the potential difference readings between the
bare wire and the reference electrode will begin to

47

48
decrease immediately as shown in Figure 3.2. This decrease in potential difference is
due to corrosion occurring on the wire immediately after the wire is immersed in the
water.
If a lubricated wire is now connected to the reference electrode, then the time at
which corrosion begins on the wire surface may or may not be indicated by changes in
the potential difference. Figure 3.3 shows an idealized plot of potential difference data
along with visual observations for this type of test setup. Initially, the lubricant
prevents any activity on the wire resulting in a constant potential for the first
twenty-four hours. However, at twenty-four hours a sharp decrease in the potential
difference occurs indicating a change on the wire surface. At forty-eight hours
corrosion was visually observed on the wire. Based on this idealized data, tcorr, the
length of corrosion protection offered by the lubricant, would be twenty-four hours. If
different wire specimens are lubricated with different lubricants, then the length of
Figure 3.2 Potential difference data for bare wire immersed in deionized water.

49
Figure 3.3 Idealized results for lubricated wire immersed in deionized water.
corrosion protection offered by these lubricants could be compared by using their tcorr
values from this test.
The test setup shown in Figure 3.1 is a mixed-potential test setup because the
reference electrode is connected to two or more oxidation-reduction systems. These
systems can include, but are not limited to, iron, Fe2+, Fe3+, oxygen, and water. The
potential difference between the electrode and the wire is defined as Ecorr (corrosion
voltage) and equals the potential that exists where the total rate of oxidation equals the
total rate of reduction. For a more detailed discussion of mixed-potential theory see
Reference 21.
This study recognizes that mixed-potential data is usually not used in this
manner. However, Ecorr, between a lubricated wire and a reference electrode is easily
measured and does indicate changes on the wire surface or in the corrosive
environment. Also, there is currently no corrosion measurement technique available

50
for lubricated wires, other than visual methods.
3.3 Experiment Design. Forty-eight wire specimens, as shown in Table 3.1, were
tested using the setup shown in Figure 3.1. These wires consisted of two wires for
each of the eleven lubricants in both environments and two bare wires in both
environments. Four additional wires, as shown in Table 3.2, were tested later to study
the effect of changes in the test setup on the potential difference data and to compare
the performance of bare wires obtained from a second reel of strand.
3.4 Materials.
3.4.1 Prestressing Wire. Seven-inch prestressing wire specimens with a
diameter of 0.156" were used in the accelerated wire corrosion tests. These wires
were outside wires obtained by untwisting 7" strand samples cut from two reels of 1/2"
diameter, Grade 270 low-relaxation strand. The strand properties that were reported
by the strand manufacturer are shown in Table 3.3. These strand reels are referred to
as R1 and R2 in the remainder of this thesis. All of the wires tested in the accelerated
wire corrosion tests were from R1 except for the two 7" wires shown in Table 3.2,
which were from R2.
The strand from R2 had a noticeable white coating on its surface that was not
present on the strand from R1. According to the strand manufacturer this white
coating was due to a stearate soap that was used in the strand drawing process. This
white coating is often present in varying amounts, but is not expected to provide any
corrosion protection[8]. It should also be mentioned that the strand from R1 was
approximately two years old, from the time of manufacture, when the accelerated wire
corrosion tests were performed. The strand from R2 was approximately three months
old, from the time of manufacture, when the accelerated wire corrosion tests were
performed. All of the wire specimens were in good condition and were corrosion free
before

51
Table 3.1 Wire specimens tested in accelerated wire corrosion tests.

52
Table 3.2 Additional wires tested in accelerated wire corrosion tests.
Table 3.3 Strand properties reported by manufacturer.
testing.
3.4.2 Five-minute Epoxy. A two-part, five-minute epoxy was used to "cap"
the ends of the wire specimens before lubrication to prevent galvanic corrosion at the

53
ends. In preliminary tests several specimens were immersed without these caps
resulting in heavy corrosion at the immersed cut end and virtually no corrosion along
the length of the wires. The ends of the wires were ground lightly to form a uniform
surface before applying the epoxy "caps".
3.4.3 Deionized Water. Deionized water was used by itself to form one of the
two corrosive environments.
3.4.4 Sodium Chloride Crystals. Sodium chloride crystals were mixed with
deionized water to formulate the 3.5% NaCl solution. This solution was made in 2.5
liter increments.
3.5 Specimen Preparation. Lubrication of the wire specimens was performed by
dipping the wires into a tube of the lubricant as shown in Figure 3.4. After lubrication
the wires were left undisturbed for twenty-four hours on a "drying rack" as shown in
Figure 3.5 before immersion into the corrosive environment. Twenty-four hours was
selected to allow the lubricants time to adhere to the wire surface and "cure" before
immersion into the corrosive environment.
3.6 Test Setup. The overall test setup is shown in Figures 3.6 and 3.7. Eight wire
specimens were tested at a time. The individual test setup for each of the wires was
shown in Figure 3.1. Each individual setup consisted of a corrosive environment,
reference electrode, wire specimen, and c-clamp.
The c-clamp as shown in Figure 3.8 was used to clamp the lead wire from the
datalogger to the wire specimen. Small neoprene pads were attached to the clamp
areas in contact with the wire specimen to isolate the connection from the clamp.
In all of the tests approximately 3.5" of the 7" length of the wire specimens
were immersed into the corrosive environment. The wires were positioned
approximately 1/2" away from the tip of the reference electrode.
3.7 Instrumentation.
54
3.7.1 Reference Electrodes. A saturated calomel reference electrode as shown
in Figure 3.9 was used to measure Ecorr. This electrode, which has a

55
Figure 3.4 Lubrication of wire specimens.
Figure 3.5 "Drying rack" used for lubricated wires.

56
Figure 3.6 Test setup used for accelerated wire corrosion tests.
potential of -0.241 V with respect to the standard hydrogen electrode, consists of a
mercury/mercury chloride element surrounded by a saturated potassium chloride gel.
3.7.2 Datalogger. Ecorr measurements were recorded by a datalogger, as
shown in Figure 3.10, and then downloaded to a personal computer for analysis.
3.8 Test Procedure. The test procedure consisted of immersing the bare
andlubricated wire specimens into the corrosive environments and recording
visual observations and potential difference readings during the next three days.
3.8.1 Scan Rate. Ecorr readings were taken every minute for the first five
minutes and then switched to sixty minute intervals for the remainder of the test. This
scan rate resulted in seventy-seven data points over the three day test period. When
analyzing this data it became apparent that this number of points was not needed.
Also the data was more difficult to present when every point was plotted. Therefore,
the data that was actually used consisted of the readings taken at 0, 1, 3, 5, and 60
minutes followed by readings at 120 minute

57
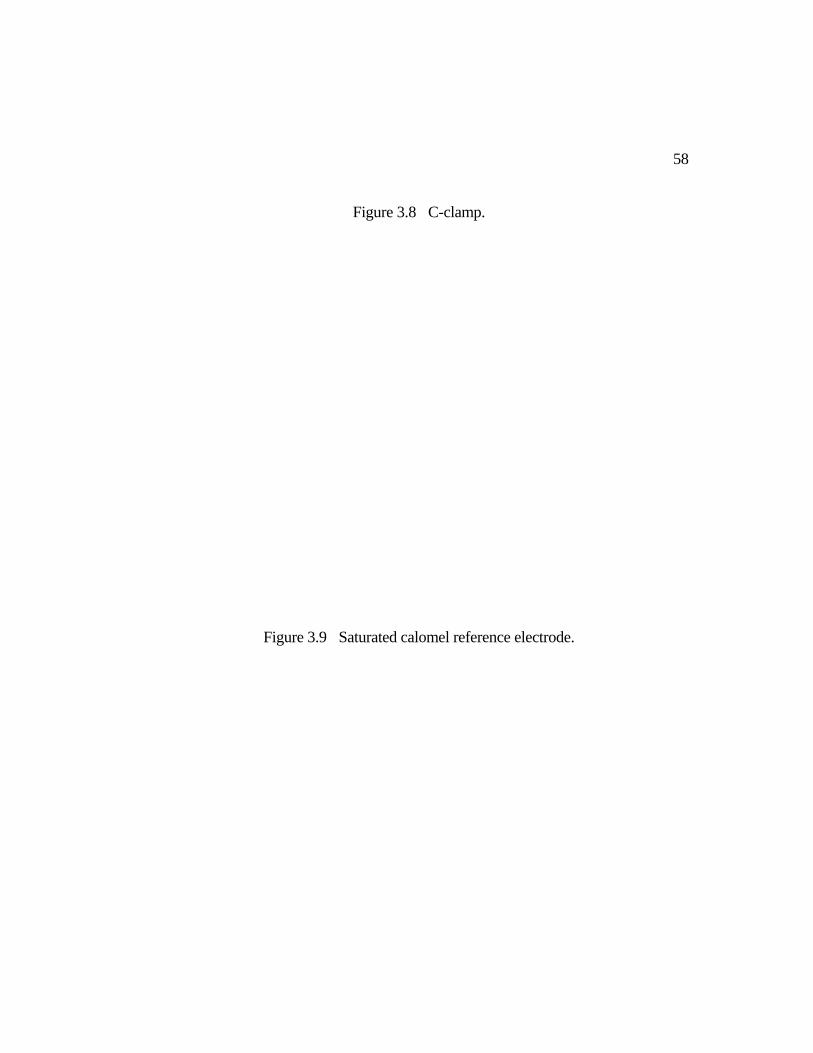
58
Figure 3.8 C-clamp.
Figure 3.9 Saturated calomel reference electrode.

59
Figure 3.10 Datalogger.
intervals. The shorter scan rates at the beginning of the test were used to show any
large changes that might occur in Ecorr after the lubricant on the wires came into contact
with the corrosive environment.
3.8.2 Visual Observations. Visual observations were taken immediately after
immersion and at twenty-four hour intervals. Observations consisted of water color,
type of corrosion, and amount of corrosion. Painted wires as shown in Figure 3.11
were used as visual references to estimate the amount of corrosion present on the wire
specimens. The painted areas indicate 50, 40, 30, 20, and 10% corrosion of the
surface area below the waterline, respectively.
3.9 Results. Figure 3.12 shows the five patterns of corrosion that were observed
during the accelerated wire corrosion tests. These corrosion patterns included
corrosion spots, vertical corrosion streaks, spiral corrosion streaks, corrosion at the
epoxy interface, and corrosion at the waterline. The corrosion spots or corrosion
streaks may be better indicators of the corrosion protection offered by the different
lubricants. Corrosion at the waterline was partially due to evaporation of the water,
while corrosion at the epoxy interface was possibly due to the presence of the epoxy,

60
Figure 3.11 Painted wires used to estimate percent corrosion on wire specimens.
which increased the chance of crevice corrosion at this location.
The spiral corrosion streak was unique because it seemed to follow a path that
was identical to the contact area between the outside wire and the center wire of the
strand. This corrosion pattern was observed on one lubricated wire during the
accelerated wire corrosion tests and three bare wires during preliminary corrosion tests
using distilled water.
The labelling system used for the wire specimens included the lubricant
number, if a lubricant was used , the specimen number, and the type of corrosive
environment. This system is shown below.
Labelling System for Wire Specimens used in Accelerated Wire Corrosion
Tests.
L# = Lubricant number (if a lubricant was used)
BW = Bare wire
1,2 = Specimen number
DW = Deionized water
SW = 3.5% NaCl solution

61
Examples of this labelling system are L1-1DW and BW-2SW. L1-1DW was the

62

63
first wire specimen lubricated with L1 and immersed in deionized water. BW-2SW
was the second bare wire specimen tested in 3.5% NaCl solution. All of the wires
were obtained from strand from R1 (Reel 1) except for two wires which are discussed
in section 3.10. These wires were obtained from R2 (Reel 2).
Table 3.4 shows an example of visual observations for two lubricated wire
specimens. These observations were for wire specimens lubricated with Lubricant L2
and immersed in deionized water for three days. Visual observations for all of the
wire specimens are shown in Tables A.1 through A.4 in Appendix A.
Figure 3.13 shows typical Ecorr data for bare wire specimens immersed in
deionized water and 3.5% NaCl solution. Notice how Ecorr decreased immediately
upon immersion for both wires. The Ecorr data for the bare wire specimen in the
saltwater solution began at a more negative potential due to the presence of the
chloride ions in the solution. Corrosion was present on both wires after twenty-four
hours. This corrosion increased gradually over the next forty-eight hours to cover
approximately 50% of each wire at seventy-two hours.
During immersion the corrosion present on both wires was a bright orange
color. After the wires were removed from their corrosive environments the corrosion
on the saltwater specimen gradually changed to a dark reddish-brown. Corrosion on
the deionized water specimen remained bright orange after removal from the deionized
water. When lubricated wires were removed from their respective saltwater
environments the corrosion also changed from a bright orange to a dark reddish-brown.
The corrosion on the lubricated wires tested in deionized water remained bright
orange after removal from the water.
Figure 3.14 shows the Ecorr data and visual observations for L8-1DW

64
Table 3.4 Typical visual observations for wire specimens in accelerated wire corrosion tests.

65
Figure 3.13 Typical Ecorr data for bare wire specimens.
Figure 3.14 Ecorr data and visual observations for L8-1DW.
66
which exhibited a well defined tcorr (length of corrosion protection) value. As shown
by the visual observations no corrosion was present on this wire after twenty-four
hours. However, at forty-eight hours a spiral corrosion streak covering 10% of the
surface area was observed. The appearance of this corrosion streak was preceded by a
decrease in Ecorr of approximately 160 mV between thirty-six and forty-eight hours.
Since the Ecorr data decreased sharply at thirty-six hours and since corrosion appeared
immediately after this decrease tcorr, or the length of corrosion protection offered by
Lubricant L8 on this wire, was defined to be 36 hours.
After the drop in Ecorr at thirty-six hours the Ecorr readings continued to change
noticeably, which agreed with the noticeable increase in corrosion at seventy-two
hours. At seventy-two hours Ecorr was also approaching the average Ecorr data for the
bare wire specimens indicating that the Ecorr data may show when a lubricated wire
starts to behave like a bare wire. The change in Ecorr for L8-1DW between two and
ten hours cannot be explained entirely, but may have been due to some type of
"stepped" breakdown of the lubricant on the wire surface.
Typical Ecorr data for lubricated wires in both environments are shown in
Figures 3.15 through 3.18. These figures include data where tcorr (the length of
corrosion protection for the lubricants) could be determined and results where tcorr
could not be determined. Average Ecorr data for the bare wire specimens in deionized
water and 3.5% NaCl solution are also included in these figures to show the general
protection offered by the lubricants. This protection is indicated by the more positive
Ecorr data for the lubricated wires.
Figure 3.15 shows typical Ecorr data for lubricated wires in deionized water
where tcorr values could be defined. These tcorr values were determined by comparing
the visual observations and Ecorr readings for these wires. For

67

68

69

70

71
each wire, corrosion was observed after the Ecorr readings began to decrease.
Therefore, tcorr was defined to be the time at which the decrease in Ecorr began. Ecorr
data for all of the wire specimens are shown in Figures A.1 through A.24 in Appendix
A.
Figure 3.16 shows Ecorr data for lubricated wires in deionized water in which
tcorr values could not be defined. For L4-1DW and L8-2DW no corrosion appeared on
the wires during the three day test period. For L3-1DW a corrosion streak covering
10% of the surface area was observed at twenty-four hours. Tcorr could not be
determined for this wire since the Ecorr data did not show a change from inactive
behavior to active behavior. However, this data did indicate that sharp decreases in
Ecorr will occur when significant corrosion appears in a short time frame.
The "dips" in the data for L8-2DW could not be explained. Similar "dips"
were observed in the data for L7-1DW, L7-2DW, L9-1DW, and L9-2DW as shown in
Figures A.8 and A.10 in Appendix A.
Ecorr results were noticeably different when the 3.5% NaCl solution was used
for the corrosive environment. Figures 3.17 and 3.18 show typical Ecorr results for
lubricated wires where tcorr values could and could not be defined. In general, the Ecorr
readings for the saltwater specimens always began to decrease immediately upon
immersion or soon after immersion. Where tcorr values could be determined they were
always less than fourteen hours.
Tcorr values could not be determined for all of the wire specimens tested in the
accelerated wire corrosion tests. Also, when a tcorr value was determined it did not
always seem to be a fair measurement of the corrosion protection offered by the
different lubricants. For example the tcorr value for L4-1DW was thirty-four hours.
The amount of corrosion present on this wire after three days of immersion was
approximately 1%. The tcorr value for L8-1DW was thirty-six hours. The amount of

72
corrosion present on this wire after three days of immersion was 20%. Therefore, for
similar tcorr values the amounts of corrosion varied by a factor of twenty. Due to these
inconsistencies and the lack of tcorr values for several of the wire specimens it was
decided to use the average percent corrosion present on the wire specimens after three
days to compare the corrosion protection offered by the different lubricants. These
average corrosion values were also used in the lubricant evaluation performed in
Chapter 7.
Tables 3.5 and 3.6 show the percent corrosion on all of the wire specimens
after three days of immersion in both environments. The lubricants are placed in order
of decreasing corrosion protection based on their average corrosion allowed during the
three day tests. Tcorr values are also included where they could be determined. In
some cases a tcorr value is given, but the percent corrosion is 0%. In these cases a
noticeable decrease occurred in the Ecorr data, but only a very slight corrosion appeared
after this change. This corrosion covered less than 1% of the surface area and was
considered to be negligible.
In both the deionized water and the 3.5% NaCl solution the lubricants can be
divided into three groups based on their average amounts of corrosion. Lubricants
that allowed 3.5% average corrosion or less were considered to provide excellent
corrosion protection. Lubricants that allowed corrosion between 3.5% and 15% were
considered to provide good corrosion protection and lubricants that allowed 15% or
more corrosion were considered to provide poor corrosion protection.
Figure 3.19 shows wire specimens from each of these three groups as well as
bare wire specimens from both environments. These pictures show the lengths of the
wires that were below the waterline with the epoxy interface at

73

74

75

76
the bottom of the pictures. The estimated amounts of corrosion for each of these wires
is given below the pictures. From these pictures the excellent corrosion protection
offered by L5 in deionized water and L9 in the 3.5% NaCl solution can be seen. The
poor corrosion protection offered by L1 in both environments is also illustrated.
The poor performance of L1 was surprising since this lubricant has been used
for temporary corrosion protection of prestressing steel in post-tensioned construction.
However according to its former manufacturer the sample of L1 used in this thesis did
not contain any emulsifiers, which assist in holding the lubricant in place on the surface
of the wire. If the emulsifiers are not present, then the water will displace the lubricant
eliminating the coating from the wire[22].
As indicated in Tables 3.5 and 3.6 Lubricant L10 also provided poor corrosion
protection during the accelerated wire corrosion tests. This poor corrosion protection
was probably due to the nature of this lubricant, which is a sodium silicate solution that
dries to form a clear, glass-like film. The corrosion observed on the wires lubricated
with L10 was different than the corrosion observed on other lubricated wires. For the
L10 wires tested in deionized water, dark orange corrosion spots appeared underneath
the glass-like film after one day. This corrosion may have occurred because the
protective coating did not cover the entire wire and left small unprotected areas on the
wires' surface.
When wire specimens were lubricated with L10 and immersed in the 3.5%
NaCl solution no corrosion was visible on the wires. Instead, white streaks similar in
size and shape to corrosion streaks on other wires appeared after one day of immersion
and gradually increased over the next two days. These white streaks appeared to be a
result of the saltwater solution dissolving the protective film on the wire. After the
wires were removed from the saltwater solution, corrosion, which covered the same
area as the white streaks, was observed underneath the white streaks indicating that

77
corrosion probably began immediately after the white streaks appeared. After these
wires were removed from the saltwater solution a flaky white film appeared on the
wire surfaces that were above the waterline during the immersion tests. This film was
probably a result of some type of silicate precipitating onto the wire surface. A similar
white precipitate was observed on prestressing wire specimens in previous research
using a sodium silicate-sodium nitrite solution[12].
Figure 3.20 compares the corrosion protection offered by the different
lubricants in the deionized water and the 3.5% NaCl solution. As indicated by this
figure all of the lubricants performed worse in the 3.5% NaCl solution except for L3
which actually performed better in the saltwater solution than in the deionized water.
The important points to note from Figure 3.20 are that L10 and L11 performed
significantly worse in the saltwater solution than in the deionized water. Also, the
performance of L1 in both environments was significantly worse than all of the
lubricants except for L10 in the 3.5% NaCl solution. The average corrosion on the
L4, L5, L6, and L9 wires in deionized water was either very small or nonexistent. L9
also prevented any corrosion on wires immersed in the 3.5% NaCl solution. None of
the lubricants decreased the corrosion resistance of the bare wire specimens.
3.10 Comparison of Wires from Different Reels. For the two additional tests that
used bare wire specimens from R2 (Reel 2), seven-inch bare wire specimens were
immersed in 750 mL of 3.5% NaCl solution for three days. These tests, which used
the test setup shown in Figure 3.1, were performed to determine the affect of a stearate
soap on the corrosion properties of bare wires. After three days the bare wire
specimens from R2 had corrosion covering 50% and 40% of their surface areas. This
amount of corrosion was less than the corrosion observed on the wires from R1 (Reel
1), which had 50% and 70% corrosion after three days in 3.5% NaCl solution.
However, it is difficult to conclude from this small number of tests whether the stearate

78
Figure 3.20 Lubricant performances in deionized water and 3.5% NaCl solution.
soap actually provided any additional corrosion resistance. More tests would have to
be completed to determine the effect of the stearate soap on the corrosion resistance of
the strand.
3.11 Discussion of Test Setup. The test setup that was used in the accelerated wire
corrosion tests was designed for relative comparisons between lubricants. This test
setup provided reasonable results and was considered to be a fair test for all of the
lubricants involved. However, it was felt that some changes could be made that could
possibly improve the results of this test.
The accelerated wire corrosion tests consisted of wire specimens with half of
the wire above the waterline and half of the wire below the waterline. This test should
probably be performed with the wire specimen totally submersed in the corrosive
environment so the wire is only in one environment. To determine if this change in
setup would affect the Ecorr readings an additional test using a 3.5" wire specimen was

79
performed. This specimen, which was lubricated with L4, was totally submersed in
750 mL of deionized water for three days. The lubrication process used for this wire
was the same process that was used for the other lubricated wires tested in this chapter.
The 3.5" length was equivalent to the length of wire that was immersed for the 7" long
specimens. As shown in Figure 3.21 the Ecorr data for the 3.5" specimen was similar to
the Ecorr data for the 7" specimen with both sets of data showing very little change
during the three day test. Also, no corrosion occurred on either specimen during their
respective three day tests. Based on these results it appears that partial submersion of
the wire does not significantly affect the Ecorr data or the corrosion protection offered
by the lubricant. Lubricant L4 was used for this test and the test described in the
following paragraphs since its behavior and physical characteristics were typical of the
eleven lubricants.
Another concern was that the lubricant from the lubricated wire specimens was
mixing with the water. In the deionized water tests this situation occurred with seven
of the eleven lubricants. After the wires were immersed in the water, the lubricant
from the wires mixed with the water giving the water a white tint. The concern was
that the lubricant changes the solubility of oxygen in the water and therefore, changes
the corrosivity of the environment. In the tests using a 3.5% NaCl solution this
problem did not arise.
To determine the affect of the lubricants on the corrosivity of the deionized
water environment another 3.5" wire specimen lubricated with L4 was tested. This
wire was also submersed in 750 mL of deionized water for three days. However, in
this test air was bubbled into the water to keep the solubility of oxygen constant in the
corrosive environment. This air kept the water from turning a white color even though
the lubricant from the wire had mixed with the water. After three days no corrosion
was visible on this specimen indicating that the corrosivity of the environment was

80
Figure 3.21 Ecorr data for 3.5" and 7" wire specimens. Figure 3.22 Ecorr data for lubricated wires with and without air.
probably not affected by the presence of lubricant in the water.
Figure 3.22 shows the Ecorr data for this test along with the data from the 3.5"
lubricated wire, which did not have air bubbled into its environment. As shown in
Figure 3.22 the presence of air in the deionized water slightly increased the Ecorr data
for some unknown reason. However, these two sets of data were well within the
scatter observed for the other wire specimens shown in Appendix A.
3.12 Conclusions. The accelerated wire corrosion tests showed that some differences
in the corrosion protection offered by the eleven lubricants could be determined after
three days of immersion in two accelerated corrosive environments. These tests
showed eight lubricants to provide from good to excellent corrosion protection in both
environments and two lubricants to provide poor corrosion protection in both
environments. The other lubricant, L8, provided good protection in the deionized
water, but poor protection in the 3.5% NaCl solution.

81
Even though the Ecorr results from the accelerated wire corrosion tests could not
be used for evaluating the corrosion protection offered by the different lubricants they
did show that sharp changes in potential difference may precede the appearance of
corrosion on a lubricated wire. This type of corrosion measurement technique seemed
to work best when relatively large amounts of corrosion suddenly appeared on a wire
as indicated by the data for L8-1DW in Figure 3.14. When smaller amounts of
corrosion appeared the changes in Ecorr tended to be gradual over time preventing the
determination of a definite tcorr value.
In order to improve the test setup used for the accelerated wire corrosion tests
the wire specimens should be totally submersed in the corrosive environment to insure
that the specimen is only exposed to one environment. Another type of capping
system at the bottom of the wire specimen also needs to be used to reduce the chance
of crevice corrosion at the epoxy interface. Finally, air or oxygen should be bubbled
into the corrosive environment to keep the solubility of oxygen constant during the test.

CHAPTER 4
EXPOSURE TESTS
4.1 Introduction. During post-tensioned and cable-stay construction emulsifiable oils
have been used to protect the tendon or stay from corrosion between the time the strand
is inserted into the duct and the time at which the duct is grouted. In post-tensioned
construction the oil is usually flushed from the strands before grouting. However,
there are no current guidelines regarding the time limit between flushing and grouting.
In cable-stay construction the oil is usually not flushed from the stay in order to prevent
the introduction of water into the duct. The purpose of the exposure tests was to
compare the corrosion protection of the different lubricants in ambient outdoor
conditions as well as to see whether some corrosion protection remained after normal
flushing.
4.2 Experiment Design. The exposure tests studied the behavior of three types of
specimens for each of the eleven lubricants. These specimens were a lubricated
strand, a lubricated then flushed strand, and four lubricated wires. Two bare strand
specimens and four bare wire specimens were also tested to serve as controls for the
exposure tests.
All of the strand and wire specimens were placed outside the Ferguson
Structural Engineering Laboratory in Austin, Texas for forty-six days and subjected to
a daily wetting cycle. Visual observations were recorded twice a week until all of the
specimens began to corrode. Inner strand protection, outer strand protection and
corrosion rate were used to compare the corrosion protection of the eleven lubricants.
The length of corrosion protection offered by the different lubricants on the
lubricated wire specimens was used to compare the lubricant performances in the
exposure tests with the lubricant performances in the accelerated wire corrosion tests.
A separate exposure test was performed for Lubricant L11. This lubricant has
been used in the field for friction reduction in post-tensioned tendons. A sample of

82
Lubricant L11 was not obtained until after the original exposure test had started.
The separate exposure test consisted of four strand specimens and eight wire
specimens. The four strand specimens consisted of one strand lubricated with L1; one
strand lubricated with L1, but then flushed; one strand lubricated with L11; and one
strand lubricated with L11, but then flushed. The eight wire specimens consisted of
four wires lubricated with L1 and four wires lubricated with L11. The relative
performance of L11 was compared to the other lubricants by first comparing it to the
performance of L1 in the separate exposure test.
A daily wetting cycle was used for both exposure tests. The original exposure
test lasted 46 days. The separate exposure test lasted 68 days. The separate exposure
test was longer since the ambient conditions were less severe during this period.
4.3 Materials. Fifteen inch long strand specimens and 3.5" long wire specimens were
used in the exposure tests. The fifteen inch strand length was selected because this is
equal to the length required for two full wraps of the outer wire around the center wire.
The 3.5" wire length corresponded to the length of wire that was submersed in the
corrosive environments in the accelerated wire corrosion tests.
The strand specimens were cut directly from R1 (Reel 1) while the wire
specimens were obtained by untwisting a 3.5" length of strand from R1. The strand
properties for strand from R1 are shown in Table 3.3. After the strand and wire
specimens were cut to length five-minute epoxy was used to form an epoxy "cap" at
the ends of the specimens to prevent galvanic corrosion at these locations. The
five-minute epoxy was described in section 3.4.2.
4.4 Specimen Preparation.
4.4.1 Lubrication. Strand and wire specimens were lubricated by dipping the
specimen into a tube containing approximately 225 mL of the lubricant as shown in
Figures 4.1 and 3.4 respectively. Each lubricant had its own tube to prevent

83
contamination of the lubricant sample. After lubrication the wires and strands were
placed horizontally on wood racks that supported them throughout the exposure test.
All of the specimens remained indoors for twenty-four hours after lubrication before
they were moved to the outdoor ambient conditions.
4.4.2 Flushing. One of the two lubricated strands for each lubricant was
flushed by using a garden hose as shown in Figure 4.2. During the flushing process
the lubricated strand was held in an upright position and rotated as the hose was moved
in an up and down motion for two minutes. All of the specimens were setup outside
immediately after the flushing process.
This flushing procedure is not considered to be representative of flushing
Figure 4.1 Lubrication of strand specimens.

84
procedures in the field where a stream of water is pumped through the duct. Instead,
this procedure was felt to be more likely to flush off the lubricants and was used to
determine if the lubricants could be removed from the strand by a direct flushing and
how much corrosion protection could be expected after this vigorous type of flushing.
4.5 Test Setup. Figure 4.3 shows the test setup for the exposure tests. All of the
specimens were supported horizontally on wood racks. The specimens were placed in
an East-West direction outside the Ferguson Structural Engineering Laboratory.
4.6 Test Procedure. The exposure specimens were left unprotected in ambient
outdoor conditions and were also subjected to a daily wetting cycle Monday through
Friday to increase the possibility of corrosion on the specimens.
4.6.1 Ambient Conditions. During the forty-six days of the original exposure
test, six inches of rain were recorded. The temperature during this period varied from
70 F to 102 F with 85 F being the average daily temperature. During the sixty-eight
days of the separate exposure test, five inches of rain were recorded. The temperature
during this period varied from 47 F to 98 F with 77 F being the average daily
temperature[23].
4.6.2 Wetting Cycle. A garden hose, as shown in Figure 4.4, was used to wet
each of the strand and wire specimens. The hose was moved along the full length of
the specimen to wet the entire top surface. This cycle lasted

85
Figure 4.2 Flushing of lubricated strand specimen for exposure tests.
Figure 4.3 Test setup for exposure tests.
approximately five seconds for each strand specimen and two seconds for each wire
specimen. The wetting cycle took place between 8:00 a.m. and 9:00 a.m. each day
Monday through Friday.

86
Originally, the wetting cycle was twice a week. However, it was changed
after two weeks to a five day cycle Monday through Friday to increase the possibility
of corrosion on the specimens. The same wetting schedule was used for the separate
exposure test.
4.6.3 Visual Observations. The exposure specimens were inspected daily, but
visual observations were only recorded twice a week (Mondays and Thursdays).
These observations recorded the appearance of new corrosion, increases in existing
corrosion, and an estimate of the existing corrosion on the specimen.
Figure 4.4 Wetting of strand specimen for exposure tests.
4.7 Results. Dark, reddish-brown corrosion spots appeared on the bare strand
specimens after four days of exposure. These spots were approximately 1/16" in
diameter. After seven days of exposure corrosion appeared in the interstices between
87
the outside wires of the bare strand specimens. Both the corrosion spots and the
interstitial corrosion gradually increased during the exposure test to form a heavy,
uniform corrosion that covered 100% of the bare strands at 26 days.
Corrosion was not observed on the bare wire specimens until eleven days after
exposure. This delay in corrosion on the bare wire specimens may have been due to
the size of these specimens. The wire specimens were only 3.5" long compared to the
15" long, strand specimens. The larger the surface area the greater the chance of
corrosion. Also, after eleven days of exposure the corrosion on the bare strand
specimens tended to be in the interstices of the strand with scattered corrosion spots
along the length. The interstices provided areas for water to collect, which could lead
to faster corrosion on the strand specimens.
For the unflushed strand specimens corrosion usually appeared as small
corrosion spots on the top surface of the strands where the specimens were wetted.
These corrosion spots were usually a dark reddish-brown, but a few bright orange
corrosion spots were encountered on some of the specimens. The corrosion spots
were usually about 1/16" in diameter. In most cases the underneath of the unflushed
specimens remained in good condition throughout the test. For the bare strands,
flushed strands, and unflushed wires corrosion occurred on both the top and bottom
surfaces of the specimens.
The labelling system used for the exposure specimens is shown below. This
labelling system includes the lubricant number, if a lubricant was used, and the type of
specimen.
Labelling System for Unflushed and Flushed Specimens.
L# = Lubricant Number
UF = Unflushed strand
F = Flushed strand

88
UFW = Group of unflushed wires (Four wires in a group)
Labelling System for Bare Strand and Bare Wire Specimens.
BS = Bare strand
BW = Group of bare wire specimens (Four wires in a group)
Examples of this labelling system are L2-UF, L2-F, and L2-UFW These labels
represent the unflushed strand, flushed strand, and unflushed wire specimens that were
initially lubricated with lubricant material L2. BS-1, BS-2, and BW represent the first
bare strand specimen, the second bare strand specimen, and the group of four bare wire
specimens, respectively.
Table 4.1 shows a typical summary of visual observations for a strand
specimen in the exposure tests. This strand was lubricated with Lubricant L3 before
being exposed to the ambient outdoor conditions and the daily wetting cycle.
Summaries of visual observations for all of the exposure specimens are shown in
Tables B.1 through B.4 in Appendix B.
Before the results of the exposure tests are presented a few statements
concerning the separate exposure test mentioned in section 4.3 will be made. In the
separate exposure test four strand specimens and eight wire specimens were exposed to
the ambient conditions and the daily wetting cycle. The four strand specimens
consisted of one strand lubricated with L1, one strand lubricated with L1, but then
flushed; one strand lubricated with L11; and one strand lubricated with L11, but then
flushed. The eight wire specimens consisted of four wires lubricated with L1 and four
wires lubricated with L11. None of the wire specimens were flushed.
In order to compare the corrosion protection of L11 with the corrosion
protection of the other lubricants a "data transformation" was performed. For
example, in the separate exposure test, Lubricant L11 prevented corrosion on the
unflushed strand for 25 days. To transform this protection to an equivalent protection

89
Table 4.1 Example of summary of visual observations for one unflushed strand in exposure tests.
in the original exposure test, 25 days was multiplied by 39/64, to give an equivalent
protection of 15 days. Thirty-nine days was the length of corrosion protection offered
by L1 on an unflushed strand in the original exposure test. Sixty-four days was the
length of corrosion protection offered by L1 on an unflushed strand in the separate
exposure test. Similar calculations were performed for the inner strand protection, the
corrosion rate, and the protection of unflushed wires associated with Lubricant L11.
The length of corrosion protection offered by the unflushed and flushed
lubricants on the strand specimens is shown in Figure 4.5. This length of protection
represented the day at which corrosion was first observed on the strands. For the
unflushed strands the length of protection varied from fifteen to thirty-nine days. For
the flushed strands the length of protection was four days for all of the specimens
except for L10-F, which did not have visual corrosion until twenty days. The days
where precipitation occurred[23] are marked with a "P". This precipitation varied
from trace amounts at 1, 12, 17, 18, and 22 days to heavy thunderstorms at 19, 37, and
38 days. As indicated by Figure 4.5 seven of the eleven lubricants allowed corrosion
to occur on the unflushed strands at twenty days. This corrosion may or may not have
been a result of the heavy thunderstorm that occurred at 19 days. In any event the

90
Figure 4.5 Length of corrosion protection offered by unflushed and flushed lubricants.
corrosion behavior of these seven unflushed strands varied noticeably after twenty
days. Therefore, a corrosion rate calculation was performed for all of the strand
specimens after first corrosion occurred. This corrosion rate is discussed in more
detail later in this section.
The corrosion protection provided by L10 after flushing (Figure 4.5) was
probably due to the nature of this lubricant. L10 is a sodium silicate solution that dries
to form a clear, glassy film. This film was probably dry before flushing was carried
out. Therefore, none of the lubricant was removed by the flushing procedure. All of
the other lubricants were essentially removed by the flushing procedure used in these
tests.
It should also be mentioned that the behavior of the unflushed strand lubricated

91
with L10 was similar to the behavior of the flushed strand lubricated with L10. Both
of these strands began to corrode at twenty days. This corrosion increased gradually
to form a moderate, uniform corrosion covering 90% and 95% of the surface areas at
forty-six days for L10-F and L10-UF respectively. Both of these strands also had a
white, flaky film along their length after two days of exposure. This film seemed to
break down over time and leave a white substance in the interstices of both the
unflushed and flushed strands as shown in Figure 4.6, which shows L10-F after
forty-six days of exposure.
The white film on the L10 strand specimens was similar to the white film
observed on the L10 wire specimens after removal from the 3.5% NaCl solution in the
accelerated wire corrosion tests. The unflushed wires originally lubricated with L10
in the exposure tests also had a white film on their surfaces after two days, which
disappeared gradually over time.
Figure 4.6 L10-F at conclusion of exposure tests.
Corrosion rates after initial corrosion appeared for the unflushed and flushed
strands are shown in Tables 4.2 and 4.3 along with the time of initial corrosion and the
percent corrosion present at forty-six days. The corrosion rate after appearance of
corrosion was calculated by dividing the percent corrosion present at forty-six days by
the time difference between forty-six days and the time when initial corrosion was
92
noted. Where two values are present for the time of initial corrosion the first value
indicates the day at which first corrosion was observed on the specimen. The second
value indicates the day at which additional corrosion was observed. After this second
value corrosion on the specimen grew at a gradual rate until the conclusion of the test.
Since additional corrosion did not occur until after the second value and since the
corrosion present at the first value was always very small, the use of the second value
in the corrosion rates seemed to be a more fair indication of the corrosion protection
offered by the different lubricants. The primary reasons for this type of corrosion rate
calculation were the performances of L3-UF, L4-UF, L5-UF, L6-UF, L7-UF and
L8-UF all of which had very small corrosion spots at twenty days. However, for
L3-UF, L4-UF, L5-UF, and L6-UF additional corrosion did not appear until eight or
fifteen days later, whereas the corrosion of L7-UF and L8-UF was increasing
considerably during this time. This method of corrosion rate computation indicates
these differences in corrosion protection. For example the corrosion rate of L7-UF is
twice that of L3-UF even though time of first corrosion was the same for both
specimens. The corrosion rate calculations for L7-UF and L8-UF used 35 and 43
days, respectively, instead of 46 days since 100% corrosion was present on both of
these specimens at these times.
The corrosion rate for L11-UF was determined from a data transformation
using the corrosion rates from the unflushed strands in the separate exposure test. In
this test the corrosion rate for L1 was 3.75% / day, while the corrosion rate for L11 was
2.00% / day. The corrosion rate of L11-UF in Table 4.2 was equal to (2.00/3.75) x
2.14, where 2.14 was the corrosion rate for L1-UF in the original exposure test.
Similar calculations were used to determine the corrosion rate for L11-F shown in
Table 4.3.

93
Table 4.2 Corrosion rate data for bare and unflushed strands.
Corrosion protection of the inner strand was evaluated by cutting a 3" length of
strand from each unflushed, flushed, and bare strand specimen. The 3" strand
specimen was then opened and examined for corrosion. As shown in Table 4.4 seven
of the eleven lubricants provided excellent corrosion protection of the inner strand
when they were not flushed from the strand. These lubricants allowed less than 15%

94
Table 4.3 Corrosion rate data for bare and flushed strands.
corrosion of the inner strand after 46 days of exposure. Lubricant L8 provided
moderate corrosion protection of the inner strand. L1, L7, and L10 provided little
corrosion protection of the inner strand. The amount of corrosion on the inner bare
strands was slightly less than the corrosion amounts on L1-UF and L10-UF, but was
more severe. The inner strand surface consisted of the complete center wire and the
insides of the outer wires.
Table 4.5 shows the inner strand protection provided by the lubricants after

95
Table 4.4 Inner strand corrosion for bare and unflushed strands.
flushing. Only one of the lubricants provided complete corrosion protection of the
inner strand. This lubricant was L9, which is a very thick emulsifiable oil. Inner
strands associated with the other ten lubricants were covered with 70% to 100%
corrosion after forty-six days of exposure. The amount of corrosion present on the
inner bare strands was less than the corrosion present on eight of the flushed inner
strands. However, the corrosion on the bare inner strands was more severe.
The length of corrosion protection offered by the different lubricants on the
unflushed wire specimens is shown in Table 4.6. This table also shows the results
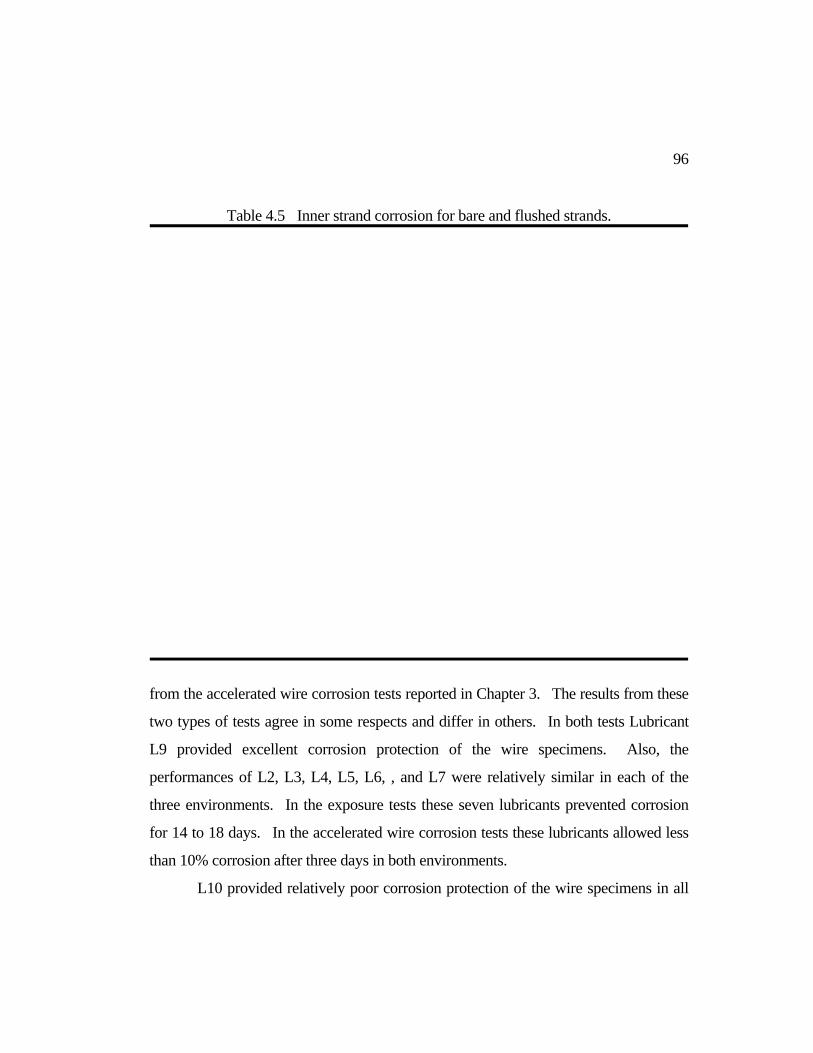
96
Table 4.5 Inner strand corrosion for bare and flushed strands.
from the accelerated wire corrosion tests reported in Chapter 3. The results from these
two types of tests agree in some respects and differ in others. In both tests Lubricant
L9 provided excellent corrosion protection of the wire specimens. Also, the
performances of L2, L3, L4, L5, L6, , and L7 were relatively similar in each of the
three environments. In the exposure tests these seven lubricants prevented corrosion
for 14 to 18 days. In the accelerated wire corrosion tests these lubricants allowed less
than 10% corrosion after three days in both environments.
L10 provided relatively poor corrosion protection of the wire specimens in all

97
Table 4.6 Results for unflushed wires in exposure tests and accelerated wire corrosion tests.
three environments. In the exposure tests this lubricant allowed corrosion on the
unflushed wires after eleven days. In the accelerated wire corrosion tests this lubricant
allowed 15% corrosion after three days in deionized water and 32.5% corrosion after
three days in 3.5% NaCl solution.
The performance of L1 in the exposure tests and the accelerated wire corrosion

98
tests was contradictory. In the exposure tests this lubricant provided good corrosion
protection of the unflushed wires and excellent corrosion protection of the unflushed
strand. However, in the accelerated wire corrosion tests this lubricant provided
minimal corrosion protection. As discussed in section 3.9 this poor corrosion
protection in the accelerated wire corrosion tests was probably due to the lack of
emulsifiers in this oil sample. In the exposure tests this oil probably provided better
corrosion protection since large amounts of water were not present which would
displace the lubricant on the specimen surface. Also, the specimens in the exposure
tests were in a horizontal position, which may have assisted in keeping the oil on the
top surface of the specimens. As indicated in Table 4.6 and Figure 4.5 the lubricants
provided better corrosion protection on the unflushed strand specimens than on the
unflushed wire specimens. The only exception was L9, which provided 39 days of
corrosion protection on both types of specimens. The lower protection values for the
unflushed wires was probably due to the wetting of the specimens. During the wetting
cycle the flow rate of the water was the same for both the strand specimens and the
wire specimens even though the strand specimens have a much higher surface area.
This flow rate probably had more effect on the lubricants coating the smaller wire
specimens than the lubricants coating the larger strand specimens. L9 is a very thick
emulsifiable oil and therefore was affected less than the other lubricants on the
unflushed wires.
4.8 Conclusions. The results from the exposure tests indicated that not all
emulsifiable oils provide the same amount of corrosion protection when exposed to
ambient outdoor conditions and a daily wetting cycle. As shown in Figure 4.5 the
amount of corrosion protection offered by the eleven lubricants before flushing varied
from fifteen days to thirty-nine days. The thirty-nine day protection was considered to
be good corrosion protection especially when compared to the bare strands, which

99
began to corrode at four days. This length of protection would probably be acceptable
for most post-tensioned concrete projects where the tendons are left ungrouted after
installation in the ducts.
Figure 4.7 shows the amounts of corrosion present on the unflushed strand
specimens at the conclusion of the test. Based on these amounts of corrosion the
lubricants can be more or less divided into three groups. The first group, which only
allowed 15% corrosion after forty-six days, consisted of L1 and L9. The second
group, which allowed from 35% to 60% corrosion, consisted of L2, L3, L4, L5, L6,
and L11. Group three was made up of the remaining three lubricants L7, L8, and L10,
all three of which provided poor corrosion protection and had results similar to bare
strand over the forty-six day test period. Figures 4.8 through 4.12 show bare strand
specimens before and after the exposure tests and typical unflushed specimens from
each of the three groups mentioned above.
The strands from Groups 1 and 2 were in much better condition than both the
bare strand specimen shown in Figure 4.9 and the unflushed Group 3 specimen shown
in Figure 4.12. For L9-UF (Figure 4.10) the corrosion is not quite as obvious due to
the nature of this lubricant, which caused the strand to have a "dirty" brown
appearance. When corrosion appeared on this strand at 39 days it appeared as dark,
reddish-black spots along the length of the strand. This corrosion increased gradually
to cover 15% of the surface area at 46 days. Corrosion on L2-UF (Figure 4.11) was a
light-moderate, uniform corrosion that covered 50% of the surface area at 46 days,
while corrosion on L7-UF (Figure 4.12) was a heavy, uniform corrosion that covered
100% of the surface area at 35 days.
As indicated in Figure 4.5 only one of the lubricants provided any corrosion
protection after flushing. This lubricant was L10, which is a sodium silicate solution.
Figures 4.13 and 4.14 show L10-F and L2-F after forty-six days of exposure. L10-F
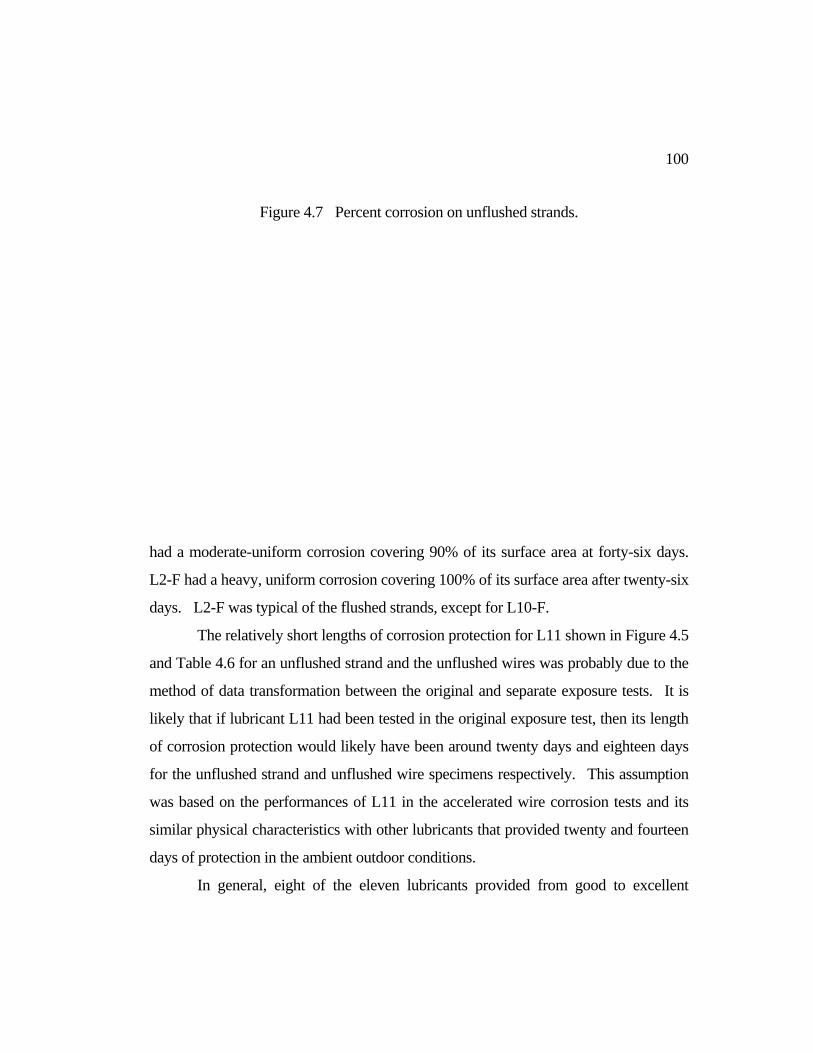
100
Figure 4.7 Percent corrosion on unflushed strands.
had a moderate-uniform corrosion covering 90% of its surface area at forty-six days.
L2-F had a heavy, uniform corrosion covering 100% of its surface area after twenty-six
days. L2-F was typical of the flushed strands, except for L10-F.
The relatively short lengths of corrosion protection for L11 shown in Figure 4.5
and Table 4.6 for an unflushed strand and the unflushed wires was probably due to the
method of data transformation between the original and separate exposure tests. It is
likely that if lubricant L11 had been tested in the original exposure test, then its length
of corrosion protection would likely have been around twenty days and eighteen days
for the unflushed strand and unflushed wire specimens respectively. This assumption
was based on the performances of L11 in the accelerated wire corrosion tests and its
similar physical characteristics with other lubricants that provided twenty and fourteen
days of protection in the ambient outdoor conditions.
In general, eight of the eleven lubricants provided from good to excellent

101
corrosion protection in a corrosive environment that was more severe than most

102
environments encountered by unprotected seven-wire strand before grouting. Results
from the unflushed strand specimens were the best indicators of corrosion protection
offered by the different lubricants. These results showed corrosion protection varying
from 15 days to 39 days depending on the lubricant. However, results from both the
flushed strand and unflushed wires will be used in the overall lubricant evaluation in
Chapter 7 in order to give some credit to the performances of L10 after flushing and to
L9 for its protection of unflushed wires.
Figure 4.13 L10-F at conclusion of exposure tests.
Figure 4.14 L2-F at conclusion of exposure tests.
grouted inside a galvanized steel duct, which was surrounded by concrete. Outside
CHAPTER 5
PULL-OUT TESTS
5.1 Introduction. In order to compare the relative effect of the eleven different
lubricants on the adhesion between seven-wire strand and cement grout a small-scale
test was desired. The test specimen needed to simulate a post-tensioned concrete
member and be constructed using lubrication and flushing procedures that were
representative of those used in post-tensioned construction.
An 8" x 8" x 12" pull-out specimen containing a single seven-wire strand
grouted inside a steel duct was designed. Three conditions of strand were tested, bare
strand, lubricated strand, and lubricated then flushed strand. The specimens were
lubricated, flushed, and grouted using techniques that are similar to those encountered
in the field.
Due to the large number of tests involved, two groups of specimens were
constructed. The first group consisted of bare strand and unflushed specimens, while
the second group consisted of bare strand and flushed specimens. Both groups used
the same concrete mix and the same grout mix. All specimens were tested seven days
after grouting.
5.2 Purpose. The purpose of the pull-out tests was to compare the effect of the
different lubricants on the adhesion between seven-wire strand and cement grout
before and after flushing.
5.3 Experiment Design. Pull-out specimens as shown in Figure 5.1 were used to
compare the effect of the different lubricants on the adhesion between seven-wire
strand and cement grout. Each specimen consisted of a single seven-wire strand

104
nflushed specimens for each of the
Figure 5.1 Pull-out specimen for small-scale pull-out tests.
dimensions of the surrounding concrete were 8" x 8" x 12". The actual adhesion
length between the strand and the grout was 10.5" due to the use of grout plugs at the
ends of the duct during specimen construction.
Fifty-four specimens were tested, two u
eleven lubricants, two flushed specimens for each of the eleven lubricants, eight bare
strand specimens, and two additional unflushed specimens. The eight bare strand
specimens consisted of three specimens from R1 (Reel 1) and five strand specimens
from R2 (Reel 2). The latter strand reel had a noticeable white coating on the strand
surface, which according to the strand manufacturer, was caused by a stearate soap that
is used during the strand drawing process. This white coating is often present in

105
to pull the strands from the specimens.
ncrete. Concrete for the pull-out specimens consisted of 3/4" crushed
Grout. Cement grout having a water-cement ratio of 0.44 was
eter, Grade 270 low-relaxation
.4 Duct. Corrugated, galvanized steel duct having an inner diameter of 2"
varying amounts, but disappears over time and should not affect the adhesion between
the strand and grout[8]. The additional unflushed specimens were used to correlate
data between the two groups of specimens.
A 60-kip testing machine was used
The average pull-out loads for the unflushed and flushed specimens were used in the
overall lubricant evaluation reported in Chapter 7.
5.4 Materials.
5.4.1 Co
limestone aggregate, Colorado River sand, Type II Portland cement, and water. No
admixtures were used in the concrete. The 28-day compressive strength of the
concrete was 6480 psi. for the first group of specimens and 8390 psi. for the second
group of specimens.
5.4.2 Cement
used for both groups of specimens. This w\c ratio was slightly less than the maximum
ratio of 0.45 allowed by section 3.3.5 of the PTI Post-tensioning Manual. The grout,
which was mixed with a hand drill and mixing attachment, was made from Type II
Portland cement and water. Mix quantities, seven day, and twenty-eight day cube
strengths for the grout are shown in Tables 5.1 and 5.2.
5.4.3 Prestressing Strand. One-half inch diam
strand was used in the pull-out specimens. This strand was obtained from two
different reels of strand having the strand properties shown in Table 3.3. All of the
specimens used strand from R2 except for three bare strand specimens that used strand
from R1.
5.4
was used in the pull-out specimens. This duct is typical of duct used in post-tensioned
concrete construction.

106
ose. Three quarter inch diameter grout hose was used for
gs were used to center the seven-wire
ork. A gangform as shown in Figure 5.2 was used for specimen
Batching. Concrete was batched using a 6 ft3. mixer. Both groups of
Figure 5.2 Gangform used for construction of pull-out specimens. Table 5.1 Mix quantities for grout.
Table 5.2 7-day and 28-day cube strengths for grout.
5.4.5 Grout H
flushing and grouting the pull-out specimens. This grout hose is typical of grout hose
used in post-tensioned concrete construction.
5.4.6 Grout Plugs. Wood grout plu
strand in the duct after lubrication and also to provide a water-tight duct that could be
flushed and grouted.
5.5 Construction.
5.5.1 Formw
construction. Twelve-inch steel ducts were placed in the forms before placing
concrete.
5.5.2

107
ring. Curing consisted of covering the concrete with wet burlap and
trands into a tube
ess
was observed in the exiting water during the
p as shown in Figure 5.4 was used to grout the
specimens required three separate casts. Each cell of the gangform was vibrated
during casting.
5.5.3 Cu
plastic sheeting for two days. Forms were removed after three days.
5.6 Lubrication. The lubrication process consisted of dipping the s
containing approximately 225 mL of lubricant as shown in Figure 4.1. After the
strands were lubricated they were inserted into the ducts of their respective pull-out
specimens. Wood grout plugs were used to center the strands in the ducts. Grout
hoses were inserted into each grout plug and silicone caulking was used to seal the
plugs and hoses for each specimen. The grout hoses and silicon caulking provided a
water-tight specimen that could be flushed and grouted easily. The specimens were
left undisturbed for twenty-four hours after the strands were inserted into the ducts.
5.7 Flushing. Flushing was carried out as shown in Figure 5.3. During this proc
the specimen was always positioned so that water was sprayed through a grout hose
that was above the strand and exited through a grout hose that was below the strand.
This hose positioning forced the water to flow over the strand before it exited the duct.
Each specimen was flushed for thirty seconds through each end at a rate of 0.4 ft.3/min.
for a total flushing time of one minute.
During the flushing process oil
first five to ten seconds, but after this time the water was clear. It was felt that a longer
flushing period would not remove additional oil since the amount of water which
flowed through the ducts during the total one minute flush was twenty times the
volume of the sealed duct. The volume of water that flowed through the duct was
approximately 0.4 ft.3 or 3 gallons. The volume of the sealed duct was 0.019 ft.3 or
0.14 gallons.
5.8 Grouting. A hand grout pum

108
ests is shown in Figure 5.5. In this
the pull-out specimen and a
mentation for the pull-out tests consisted of a
specimens. The cement grout was pumped through a plastic tube running from the
grout pump to the grout hose which entered the specimen below the strand. During
grouting the grout hose which exited the duct at the other end above the strand, was
held in a vertical position. After the grout began to flow freely from this hose, it was
plugged with a rubber plug. The grout in the duct was then slightly pressurized by
providing an additional stroke of the grout pump.
5.9 Test Setup. The test setup for the pull-out t
setup a 60 kip testing machine was used to pull the strands out of the specimens. The
strand was gripped by a prestressing chuck above the top crosshead and then pulled out
of the specimen. During this process the top crosshead moved up, while the middle
crosshead remained stationary. The potentiometer attached to the unloaded end of the
strand measured slip of the strand through the specimen.
A hard rubber pad was placed directly on top of
steel plate was placed on top of the pad. The plate and pad distributed the load from
the crosshead over the specimen.
5.10 Instrumentation. Instru
potentiometer, power source for the potentiometer, and an X-Y plotter. The

109
Figure 5.3 Flushing of pull-out specimen.
Figure 5.4 Hand grout pump used to grout pull-out specimens.

110

111
potentiometer was clamped to the unloaded end of the strand to determine when the
strand began to pull through the specimen. The deformation signal from the
potentiometer and the load signal from the testing machine were plotted by the X-Y
plotter.
5.11 Test Procedure. The test procedure consisted of seating the prestressing chuck
and pulling the strand out of the specimen. Each specimen was loaded at
approximately 1.5 k/min. and the slip load was read directly from the testing machine.
5.11.1 Initial Seating. After the specimen was inserted into the testing
machine the strand was gripped above the top crosshead with a standard prestressing
chuck. The specimen was allowed to hang unsupported from the chuck and the teeth
were seated by tapping them lightly with a hammer. After seating the chuck the
bottom crosshead was lowered until it contacted the steel plate above the specimen.
5.11.2 Potentiometer Setup. The potentiometer was attached to the unloaded
end of the strand after the initial seating.
5.11.3 Loading Rate. A loading rate of approximately 1.5 k/min. was used to
pull the strands from the specimens.
5.11.4 Slip Load Reading. The slip load for each specimen was read directly
from the testing machine when the data from the potentiometer indicated initial slip of
the strand on the X-Y plotter. This load was read to the nearest 5 lbs.
5.12 Test Results. The labelling system used for the pull-out specimens is shown
below. This system used the lubricant number, the type of specimen, and the number
of the specimen. For the bare strand specimens the Reel Numbers (R1 or R2) were
used instead of the lubricant number.
Labelling System for Pull-out Specimens:
L# = Lubricant Number
UF = Unflushed Specimen

112
F = Flushed Specimen
R1 = Bare Strand from Reel 1
R2 = Bare Strand from Reel 2
Examples of the labelling system are L1-UF1 and R2-2. L1-UF1 corresponds to the
first unflushed specimen that was lubricated with Lubricant L1. R2-2 corresponds to
the second bare strand specimen from R2 (Reel 2). All of the unflushed and flushed
specimens used strand from R2.
Typical results for bare, flushed, and unflushed specimens are shown in Figure
5.6. For these specimens the strand began to pull through the specimen at 2950, 540,
and 260 lb., respectively. These loads are referred to as "slip loads" and include the
self-weight of the specimen as well as the weights of the steel plate and rubber pad that
were positioned on top of the specimens before testing.
Figure 5.7 shows the slip loads for the eight bare strand specimens. These
loads varied from 1360 lb. for R2-1 to 4040 lb. for R1-1. The overall average was
3260 lb. and the standard deviation was 850 lb. The average slip load for the strands
from R1 was 3640 lb. For strands from R2 the average slip load was 3020 lb. when
all five specimens were included and 3330 lb. when the lowest and highest slip load
values were excluded. With the exception of outlier R2-1, the bare strand slip load
can be taken as greater than 3000 lb.
Slip loads for the unflushed and flushed specimens are shown in Figures 5.8
and 5.9 along with the average slip load for the bare strands from R2. The average
slip loads for the unflushed and flushed specimens were 350 lb. and 750 lb.,
respectively.
5.13 Discussion of Test Results and Conclusions. All of the strands in the pull-

113
Figure 5.6 Typical results from small-scale pull-out tests.
Figure 5.7 Slip loads for bare strand specimens.

114
Figure 5.8 Slip loads for unflushed pull-out specimens.
Figure 5.9 Slip loads for flushed pull-out specimens.

115
out specimens pulled out of the specimen in a twisting motion with virtually no
cracking or spalling of the surrounding grout at the ends of the specimens.
Based on the average slip loads for the bare strand specimens Figure 5.7
indicates that the stearate soap present on the strands from R2 does not appearto have a
significant effect on the adhesive properties of the strand. The difference in average
slip loads for the two reels of strand was less than 10% when the high and low values
for the strands from R2 were excluded. This difference in average values is
acceptable for this type of test considering the number of specimens involved. It
indicates that the stearate soap present on the surfaces of the strand does not
significantly effect the adhesion properties of the strand.
Figure 5.8 clearly indicates that for the unflushed specimens the presence of the
lubricants on the strand almost totally destroyed the adhesion between strand and
grout. In the unflushed specimens the average slip load was 350 lb. when L10 was
included and 260 lb. when L10 was not included. Both of these average slip loads are
only 10% of the average slip load for the bare strand specimen which was 3020 lb.
Only Lubricant L10 had values greater than 33% of the slip load for bare strands.
Figure 5.9 indicates that flushing the lubricants was ineffective since for the
flushed specimens the average slip load was 750 lb. when L10 was included and 520
lb. when L10 was not included. These average slip loads are only 25% and 17%,
respectively, of the average slip load for the bare strand specimens. After flushing
Lubricant L10 was the only lubricant in the range of the bare strand. These results
were similar to the results of previous research which showed a sodium silicate-sodium
nitrite solution to have little effect on bond after flushing. That research also showed
flushed strand specimens previously coated with an emulsifiable oil to have a bond-slip
load that was only 10% of the bond-slip load for bare strand[12].
In several cases the lubricants destroyed virtually all adhesion between strand

116
and grout. For L8-UF2, L9-UF1, L9-UF2, L9-F1, and L9-F2 the strands pulled out
under the weight of the specimen, which was 69 lbs. For L8-UF1 and L7-F2 the
strands pulled out under the weight of the block, rubber pad, and steel plate, which was
a combined load of 86 lbs.
Figure 5.10 shows the average slip loads for the unflushed lubricants in
descending order along with the average slip load for the bare strand specimens from
R2. As indicated by this figure L10 performed considerably better than the other
lubricants followed by L11 and L3. L1, L2, L4, L5, L6, and L7 were similar while L8
and L9 were the worst. The performance of L10 was atypical due to the nature of this
lubricant, which is not an emulsifiable oil. L10 dries to form a clear, glassy film that
bonds to the grout better than the oily film left by the other lubricants.
Average slip loads for the flushed lubricants are shown in Figure 5.11. Again
the performance of the lubricants varied noticeably. After flushing, L10 was almost
identical to the bare strand specimens, while the other lubricants still reduced the
adhesion by more than 2/3 even though ample flushing water was provided. The
increase of the slip load for L10 after flushing was surprising since this lubricant dries
within a few hours to form a hard glassy film. Either this film was not completely dry
and the flushing removed some of the lubricant or the wetting of the dry film increased
the adhesive properties of the lubricated strand.
The two additional unflushed specimens that were constructed in the second
group of specimens showed that the general effect of grouting were the same for both
groups of specimens. These additional specimens used L8 to lubricate the strands.
Slip loads for L8-UF1 and L8-UF2 were 86 lbs. and 69

117
Figure 5.10 Average slip loads for unflushed specimens.
Figure 5.11 Average slip loads for flushed specimens.

118
lbs., respectively. For L8-UF1 the strand began to pull through the specimen after it
was positioned in the testing machine. At this point the load on the specimen included
its self-weight plus the weight of the rubber pad and steel plate. Before the pad and
plate were positioned on L8-UF2 this specimen was suspended by its strand to
determine if the strand would pull out under the weight of the specimen without the
rubber pad and steel plate, which it did. Therefore, L8-UF2 had a slip load of 69 lbs.
In the second group of specimens the same procedures were used for the two
unflushed specimens lubricated with L8. For these specimens the strand began to pull
through the specimen at 86 lbs. and 69 lbs., respectively, which indicated that the
general effects of grouting in both groups of specimens were the same or very similar.
Figure 5.12 compares the effects of the different lubricants on the adhesion
before and after flushing. Based on these results the flushing process slightly
increased the adhesive strength of the lubricated strands. However, the slip loads after
flushing were still 2/3 less than the slip loads for the bare strand specimens.
The pull-out tests performed in this research showed that the presence of a
lubricant on the strand before grouting significantly reduces the adhesion between
strand and grout. These tests also indicated that the lubricants could not be removed
using the flushing procedures utilized in this study which are similar to those that are
used in the field.
The pull-out tests performed in this research provided good, relative results that
were used to compare the eleven lubricants. However, there were two concerns with
these tests. One that the strands twisted out of the specimens during testing. Two
that no admixtures were used in the grout.
In post-tensioned members, strands are anchored at both ends so they are not
allowed to undergo significant twisting. It was felt that restricting twist of the strands

119
may increase their adhesion strength. Therefore additional pull-out tests were
performed with bare strands, lubricated strands, and lubricated then flushed strands that
were all restricted from twisting. These tests are presented in Chapter 6.
Commercial admixtures are sometimes used in grouts employed in
post-tensioned construction. These admixtures can be used to cause the grout to flow
better or to cause the grout to expand during curing. The grout used in the pull-out
specimens in this chapter did not use any admixtures in order to reduce the number of
variables in the tests. However some preliminary tests were performed using the 8" x
8" x 12" pull-out specimen.
These preliminary specimens used bare strand and a grout containing an
expansive admixture. The average slip loads for these specimens was 6420 lb., which
was twice the average slip load for the bare strand specimens tested in this chapter.
This increase in slip load may or may not occur for unflushed or flushed strands.
Figure 5.12 Comparison of unflushed and flushed lubricants.

CHAPTER 6
ANCHORED PULL-OUT TESTS
6.1 Introduction. The pull-out tests performed in Chapter 5 were used to determine
the relative effect of different lubricants on the adhesion between seven-wire strand
and cement grout before and after flushing. From these tests it was shown that all of
the lubricants significantly reduced or totally prevented adhesion between the strand
and grout when the lubricants were not flushed. Results were generally similar for the
flushed specimens which had improved but still greatly reduced adhesion except for
those which had used L10. L10 was shown to have little effect on the adhesion
between strand and grout after the flushing process.
As indicated in the discussion of results in Chapter 5 the strands twisted while
being pulled out so it was decided to perform additional pull-out tests to determine the
effect of restricting the twist on the adhesion between seven-wire strand and cement
grout when the strand specimen is bare, lubricated, and lubricated then flushed
respectively. In these tests Lubricant L5 was used to lubricate the lubricated and
flushed strands, since this lubricant performed the best in the overall lubricant
evaluation reported in Chapter 7.
6.2 Experiment Design. A rectangular concrete specimen, as shown in Figure 6.1,
was used for the anchored pull-out tests. This specimen, which was constructed and
tested outside the Ferguson Structural Engineering Laboratory in Austin, Texas,
contained six bare strands, two lubricated strands, and two lubricated and then flushed
strands. Each strand was grouted inside a 2" diameter, 6' long steel duct, except for
the two bare strands in the middle of the specimen, which were left ungrouted. As
shown in Figure 6.1, eight of the strands were anchored at the dead end of the
specimen and two of the strands

121

122
were unanchored at both ends of the specimen. The anchored strands consisted of two
bare, grouted strands; two bare, ungrouted strands; two lubricated, grouted strands; and
two lubricated, flushed and grouted strands. Both unanchored strands were bare and
grouted.
The testing procedure consisted of jacking the strands at the live end of the
specimen with a hydraulic ram and measuring the elongation of the strand at the loaded
end. By comparing the load-elongation data for the anchored strands as shown
hypothetically in Figure 6.2, the load at which the adhesion between the strands and
grout had been destroyed could be determined. These "pull-out" loads were the loads
at which the grouted strands would start to behave like the bare, ungrouted strands
since at this point the adhesion between the strand and grout had been completely
destroyed. By comparing these "pull-out loads" the relative effect of either unflushed
or flushed lubricants on the adhesion between seven-wire strand and cement grout
when the strands are restricted from twist could be determined.
For the bare, unanchored strands the slip of the strand at the dead end of the
Figure 6.2 Hypothetical results from anchored pull-out tests.

123
specimen was used to determine when the adhesion between the bare strand and grout
had been destroyed. This load was compared to the "pull-out" load for the bare,
anchored strands to determine the effect of restricting twist on the pull-out loads for
bare strands grouted inside a steel duct.
Originally, all of the strands were to be tested seven days after grouting, which
was the same time period used for the pull-out specimens tested in Chapter 5.
However, only a single test on the two bare, ungrouted strands and the first unflushed
strand were completed at seven days due to time constraints. Two additional tests on
each bare, ungrouted strand and a single test on each of the remaining unflushed,
flushed, and bare strands were completed seven days later, or fourteen days after
grouting.
6.3 Materials.
6.3.1 Concrete. Concrete for the anchored pull-out specimen consisted of 3/4"
limestone aggregate, sand, water, Type I Portland cement, and Rheobuild
superplasticizer. The twenty-eight day compressive strength of the concrete was 7770
psi.
6.3.2 Steel Reinforcement. Grade 60, #3 reinforcing bars were used to
reinforce the anchored pull-out specimen to allow handling and movement after
testing.
6.3.3 Grout. Cement grout with a w/c ratio of 0.44 was made from Type II
Portland cement and water. The grout was mixed using an electric hand drill with a
mixing attachment. Mix quantities, seven day, and twenty-eight day cube strengths
for the grout are shown in Tables 6.1 and 6.2. The w/c ratio of 0.44 was the same ratio
that was used in the grout for the pull-out specimens tested in Chapter 5.
6.3.4 Prestressing Strand. One-half inch diameter, Grade 270 low-relaxation
strand from R2 (Reel 2) was used for the strand specimens in the anchored pull-out

124
Table 6.1 Mix quantities for grout.
Table 6.2 7-day and 28-day cube strengths for grout.
tests. The properties for this strand are shown in Table 3.3.
6.3.5 Duct. Corrugated, galvanized steel duct with a 2" inner diameter was
used in the anchored pull-out specimen. This duct, which was also used in the
pull-out specimens constructed in Chapter 5, is representative of duct used in
post-tensioned concrete construction.
6.3.6 Anchorages. Anchorages as shown in Figure 6.3 were fabricated by
welding standard prestressing chucks to 5/8" thick steel plate. Strands were seated in
the anchorages with a preload of 4 kips by using a 60 kip testing machine. It was felt
that a seating load of 4 kips, which is approximately 10% of the ultimate strand load,
would be suitable to prevent twisting of the strands during testing.
6.4 Construction.
6.4.1 Formwork. The formwork for the anchored pull-out specimen is shown

125
in Figure 6.4. A steel cage made from number three reinforcing bars was included in
the formwork to resist forces that might occur during movement of the specimen after
testing.
Steel ducts and 1/2" diameter clear plastic tubing were also positioned in the
formwork before the concrete was placed. The plastic tubing, which was removed
with the formwork, provided openings underneath the fabricated anchorages at the
dead end of the specimen for flushing and grouting the ducts.
6.4.2 Curing. Curing consisted of covering the concrete with plastic sheeting
for four days. Both the formwork and the plastic sheeting were removed four days
after placing the concrete.
6.4.3 Installation of Strands. A compressed air sprayer, as shown in Figure
6.5, was used to lubricate the strands as they were inserted into the ducts. Figure 6.6
shows the stream of lubricant produced from the sprayer that covered the strand as it
was inserted into the duct. This lubrication method is similar to lubrication methods
used in post-tensioned concrete construction. The bare strand specimens were not
lubricated as they were inserted into the specimen.
After the strands were installed, the anchorages were epoxied to the dead end
of the specimen using a two-part epoxy. This epoxy is used between precast bridge
segments in segmental bridge construction.
6.4.4 Grout Plugs and Grout Hoses. Two-inch diameter wood grout plugs
and 3/4" diameter grout hose were used to create water-tight ducts that could be
flushed and grouted easily. Both the grout plugs and the grout hose were described
previously in sections 5.4.5 and 5.4.6.
6.4.5 Flushing. Flushing was accomplished, as shown in Figure 6.7, by using
a garden hose with a spray nozzle. During this process water was sprayed

126
Figure 6.3 Fabricated anchorages.
Figure 6.4 Formwork for anchored pull-out specimen.

127
Figure 6.5 Compressed air sprayer.
Figure 6.6 Lubrication of unflushed and flushed strands.

128

129
through the grout hose at the live end of the specimen at a rate of 0.5 ft.3/min. for two
minutes. Figure 6.8 shows the flow of water from the dead end of the specimen
during flushing.
The flushing procedure shown in Figure 6.7 was considered to be
representative of flushing techniques used in the field. During the flushing process oil
was observed in the water exiting the duct during the first 45 seconds. After this time
the water appeared free of oil.
6.4.6 Temporary Post-tensioning. To remove slack in the strands after
flushing and before grouting a temporary post-tensioning force was applied to the
strands. Each strand that was to be grouted was stressed to approximately 480 lbs.
using a hydraulic ram. Standard prestressing chucks and wood shims, as shown in
Figure 6.9, were used to hold the strands in place after stressing the strands. The
wood shims and chucks were removed seven days after grouting.
6.4.7 Grouting. A hand grout pump as shown in Figure 6.10 was used to grout
eight of the ducts. After grout began to flow freely from the grout openings below the
anchorages at the dead end of the specimen this end was plugged with a rubber plug
and grouting was continued until the duct was full. The two middle ducts, which
contained bare, anchored strands were left ungrouted.
6.5 Test Equipment. The test equipment and instrumentation for the anchored
pull-out tests are shown in Figure 6.11
6.5.1 Prestressing Chair. The prestressing chair used in the anchored
pull-out tests had been used in previous research at the Ferguson Structural
Engineering Laboratory and consisted of four, Grade 60, #7 reinforcing bars and 1"
thick steel plate. The reinforcing bars were 6" long and the dimensions of the steel
plate were 4" x 6".
6.5.2 Load Cell. A 50-kip load cell was used to measure the jacking load

130
Figure 6.7 Flushing of ducts.
Figure 6.8 Exiting water at dead end of specimen during flushing process.
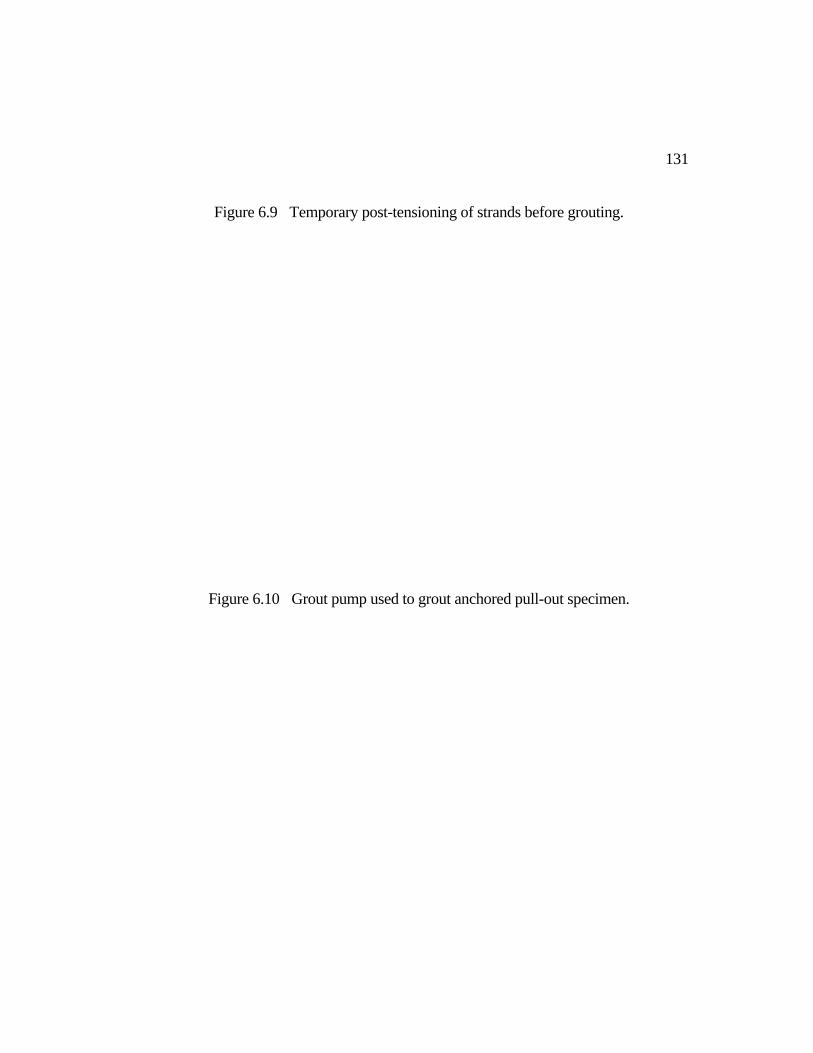
131
Figure 6.9 Temporary post-tensioning of strands before grouting.
Figure 6.10 Grout pump used to grout anchored pull-out specimen.

132
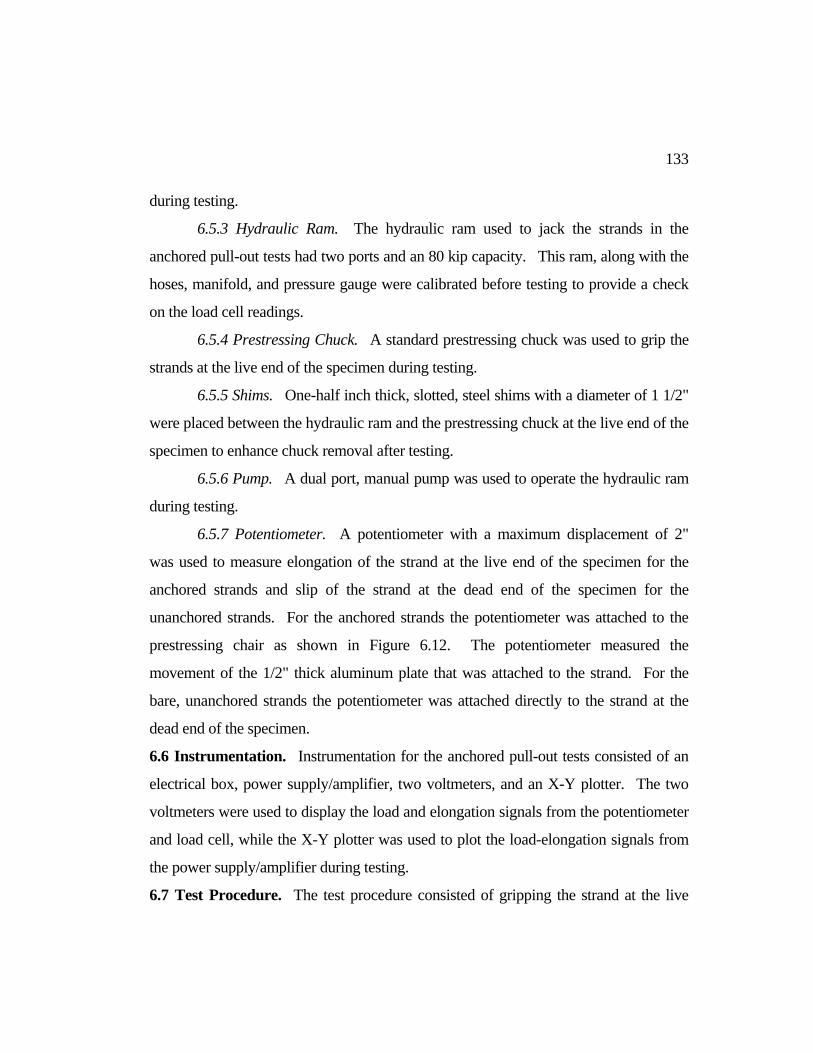
133
during testing.
6.5.3 Hydraulic Ram. The hydraulic ram used to jack the strands in the
anchored pull-out tests had two ports and an 80 kip capacity. This ram, along with the
hoses, manifold, and pressure gauge were calibrated before testing to provide a check
on the load cell readings.
6.5.4 Prestressing Chuck. A standard prestressing chuck was used to grip the
strands at the live end of the specimen during testing.
6.5.5 Shims. One-half inch thick, slotted, steel shims with a diameter of 1 1/2"
were placed between the hydraulic ram and the prestressing chuck at the live end of the
specimen to enhance chuck removal after testing.
6.5.6 Pump. A dual port, manual pump was used to operate the hydraulic ram
during testing.
6.5.7 Potentiometer. A potentiometer with a maximum displacement of 2"
was used to measure elongation of the strand at the live end of the specimen for the
anchored strands and slip of the strand at the dead end of the specimen for the
unanchored strands. For the anchored strands the potentiometer was attached to the
prestressing chair as shown in Figure 6.12. The potentiometer measured the
movement of the 1/2" thick aluminum plate that was attached to the strand. For the
bare, unanchored strands the potentiometer was attached directly to the strand at the
dead end of the specimen.
6.6 Instrumentation. Instrumentation for the anchored pull-out tests consisted of an
electrical box, power supply/amplifier, two voltmeters, and an X-Y plotter. The two
voltmeters were used to display the load and elongation signals from the potentiometer
and load cell, while the X-Y plotter was used to plot the load-elongation signals from
the power supply/amplifier during testing.
6.7 Test Procedure. The test procedure consisted of gripping the strand at the live

134
Figure 6.12 Prestressing chair with potentiometer attachment.
end with a prestressing chuck, providing a small initial load to stabilize the hydraulic
ram and load cell, then loading the strand until the adhesion between strand and grout
was destroyed. Each of the bare, ungrouted strands, which were anchored at one end,
were tested three times. All of the other strands were tested once. The same test
procedure was used for all of the strands.
6.7.1 Initial Loading. An initial loading of approximately 200 lb. was applied
to the strands to stabilize the hydraulic ram and load cell. This initial loading varied
from strand to strand due to the sensitivity of the hand pump used in the tests.
6.7.2 Load Increments. The load increments used in the anchored pull-out
tests varied depending on the type of strand specimen being tested. For the bare,
ungrouted strands load increments of 2 kips were used in the first and second tests. In
the third tests 2 kip load increments were used initially, but were changed to 4 kips
after a load of 10 kips had been reached.

135
For the unflushed and flushed strands the load increments were usually 1 kip,
but 0.25 and 0.5 kips were used in the initial stages of testing to facilitate the
determination of pull-out loads that might occur at very low loads. The loading rate
for all of the tests was approximately the same. However, the length of the stroke
varied depending on the load increment.
6.7.3 Data Acquisition. Load and elongation readings were recorded manually
from the voltmeters and were also plotted during testing using an X-Y plotter.
Pressure readings from the pressure gauge on the manifold were also recorded
manually to serve as a check on the load cell readings.
6.8 Test Results. The labelling system used for the different strand specimens
consisted of five descriptors as shown in Table 6.3. These descriptors included the
surface condition of the strand, anchorage condition, bond condition, specimen
number, and test number.
An example of this labelling system is BAUG23, which was the third test of
the second ungrouted, anchored, bare strand. FAG21 was the first test of the second
flushed strand that was anchored and grouted. All strand specimens were tested once,
except for the bare, anchored, ungrouted strands, which were both tested three times.
In order to simplify the discussion of results the bare, anchored, ungrouted strands will
often be referred to as unbonded strands, since these strands were not bonded to the
anchored pull-out specimen.
Load-elongation results for the second and third tests of the unbonded strands
are shown in Figures 6.13 and 6.14. Results for the first tests of the unbonded strands
were not presented due to problems with the test setup during testing. For BAUG11
the strand was stressed to approximately 12 kips. However, the potentiometer was
incorrectly positioned in the setup. Therefore, this test had to be terminated. For
BAUG21 the strand was stressed to approximately 8 kips, but the hydraulic ram was

136
Table 6.3 Labelling system used for strands in anchored pull-out tests.
out of stroke at this point. Therefore, this test also had to be terminated.
As shown in Figures 6.13 and 6.14 stiffness values (K) were calculated for
each unbonded strand in each test to serve as a check on the test setup. These values
were based on the data points marked with arrowheads since these points seemed to
best indicate the elastic behavior of the strand. The lengths of strand from the tip of
the potentiometer to the tip of the jaws in the fabricated anchorages at the dead end of
the specimen were used to determine the change in strain between the marked data
points for each set of data. These strand lengths were determined after the tests had
been completed by knowing all of the dimensions of the test setup including the initial
displacement of the potentiometer before each test began.
The calculated stiffness values for the two unbonded strands were noticeably
different as indicated in Figures 6.13 and 6.14. In both tests BAUG1 had stiffness
137
values significantly lower than those for BAUG2. This difference in stiffness may
have been due to set or slip of the prestresing chucks used in

138
Figure 6.13 Results from second testing of unbonded strands.
Figure 6.14 Results from third testing of unbonded strands.

139
the anchorages at the dead end of the specimen, since the chucks were the only
difference between the first and second strands and since movement of the jaws was
not measured. The same test equipment and test procedures were used for both
strands in both tests.
The average stiffness value from the second and third tests of the unbonded
strands was 22,500 ksi. with a standard deviation of 1190 ksi. This stiffness was 20%
less than the modulus of elasticity value that was reported by the strand manufacturer
for this strand. The purpose of this test was not to measure the modulus of elasticity
for the strand. However, it was felt that the average stiffness value for the unbonded
strands should be closer than 20% to the modulus value reported by the strand
manufacturer. Therefore, three types of losses were investigated. These losses were
elastic shortening of the prestressing chair, elastic shortening of the concrete, and
anchorage takeup in the fabricated anchorages at the dead end of the specimen. The
first two losses were quickly ruled out since the combined shortening of the
prestressing chair and concrete was less than 0.001" at a load of 30 kips. The most
probable cause for the low stiffness value was anchorage takeup in the prestressing
chuck at the dead end of the specimen. In fact during the third testing of the unbonded
strands both strands were observed to pull in to the anchorages approximately 1/8".
This pull-in was measured using a steel tape with divisions of 1/32". Pull-in was not
examined during the first and second tests of the unbonded strands.
In order to address the possible anchorage takeup, the elongation results for the
unbonded strands were recalculated assuming a gradual anchorage takeup of 0.1"
during the test. The amount of anchorage takeup varies depending on the type of
prestressing chuck used. According to Lin and Burns a reasonable estimate is
0.1"[24].
The adjusted results for the unbonded strands are shown in Figures 6.15
140
through 6.18. These figures show the original and adjusted data for the second and
third tests of each unbonded strand. Based on this adjusted data the new average
stiffness for the unbonded strands was 27,600 ksi. with a standard deviation of 1800
ksi. This stiffness is within 5% of the modulus supplied by the strand manufacturer
and is reasonable for the test setup used in the anchored pull-out tests. Even though it
appears that anchorage takeup did occur during testing of the unbonded strands the
original average stiffness value of 22,500 ksi. was used when analyzing the data for the
unflushed and flushed strands since the same test setup was used for all of the strands.
Figures 6.19 through 6.21 show the results for the bare, unflushed, and
flushed strands, all of which were anchored at one end and therefore, restricted from
twisting out of the specimen. For each strand a pull-out load is indicated where the
adhesion between the strand and grout was destroyed. Ideally, this load was to be
determined graphically where the data for the bare, unflushed, and flushed strands
intersected the average data for the unbonded strands. However, the bare, unflushed,
and flushed strands pulled through the anchorages at the dead end of the specimen after
the adhesion between the strand and grout had been destroyed. Therefore, this
graphical method could not be used. Instead, the pull-out loads were determined by
observing when the strands began to pull through the anchorages at the dead end of the
specimen. This pull through was determined by measuring the length of the strand
exiting the anchorage after each load increment. The load at which the strand began
to pull through the anchorage was considered to be the pull-out load for this strand
since at this load the adhesion between the strand and grout had obviously been
destroyed.
The movement of the strand was measured with a steel tape having
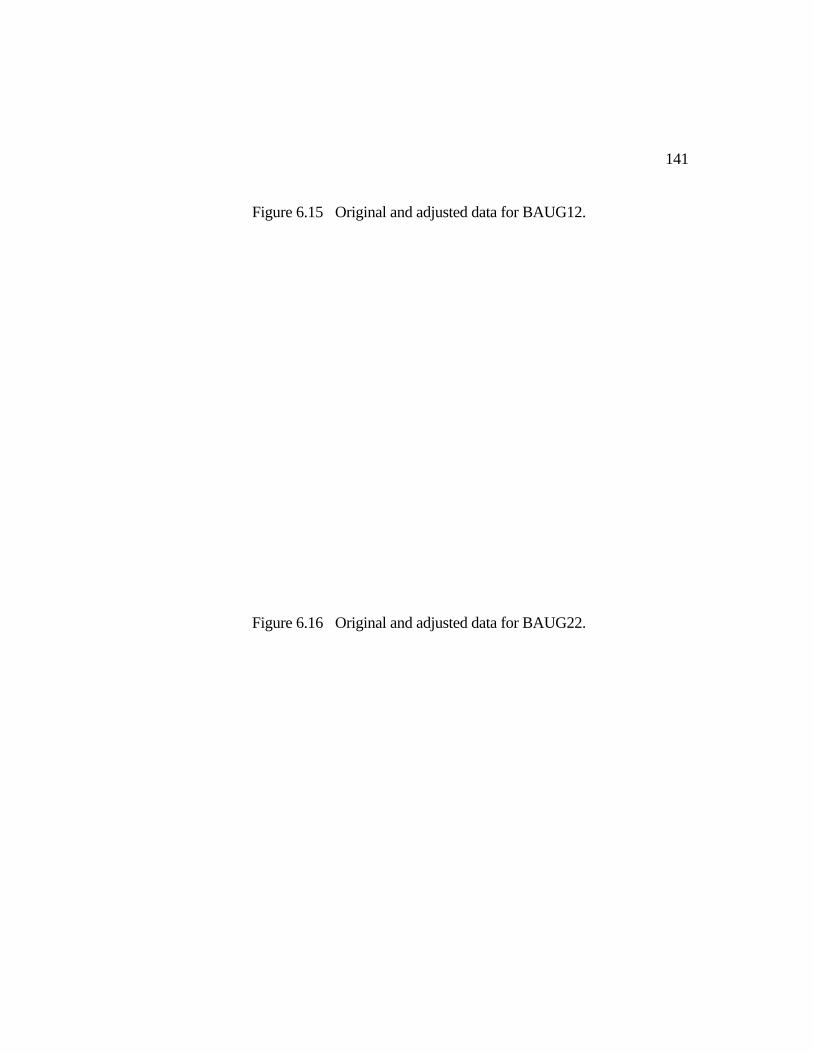
141
Figure 6.15 Original and adjusted data for BAUG12.
Figure 6.16 Original and adjusted data for BAUG22.

142
Figure 6.17 Original and adjusted data for BAUG13.
Figure 6.18 Original and adjusted data for BAUG23.

143
Figure 6.19 Results for bare, anchored strands.
Figure 6.20 Results for unflushed, anchored strands.

144
Figure 6.21 Results for flushed, anchored strands.
divisions of 1/32". It should be mentioned that the strand was not twisting as it was
pulling through the anchorage and that it only pulled through the anchorage in
extremely small increments.
For BAG11 the pull-out load, as shown in Figure 6.19, was 20.3 kips. At this
load the strand had just pulled through the anchorage at the dead end of the specimen
approximately 1/16". For BAG21 only the total pull-through of the strand at the dead
end of the specimen was measured during the test. Therefore, the approximate load at
which the strand began to pull through the anchorage was unknown. However, the
data for BAG21 definitely seems to indicate pull through of the strand at 18.0 kips.
Therefore, this load was defined as the pull-out load for this specimen.
For the unflushed strands the pull-out loads were 7.25 and 8.57 kips for
UFAG11 and UFAG21, respectively. Pull-out loads for the flushed strands were 6.89
kips and 6.60 kips for FAG11 and FAG21, respectively. The results for the unflushed

145
and flushed strands were somewhat contradictory, but were about the same.
The reason for the strand pull-through at the anchorages at the dead end of the
specimen for the bare, unflushed, and flushed grouted strands was probably due to the
low seating force that was used to seat the strands in the anchorages before the strands
were inserted into the ducts. During seating, the jaws in the anchorage must move a
small distance while they are biting into the strand. If a force of 4 kips is applied to
the strand, then the jaws will move a certain distance in the anchorage. However, if a
force greater than 4 kips is applied to the strand, then the jaws will need to move a little
further to continue to bite into the strand.
After the anchorages were attached to the pull-out specimen and the ducts were
grouted, the grout in the duct prevented the jaws from moving with the strand after the
adhesion between strand and grout had been destroyed. The result was pull-through
of the strand at the dead end of the specimen after the adhesion between strand and
grout had been destroyed.
Figure 6.22 shows the results for the bare anchored and bare unanchored
strands tested in this test series. For the unanchored strands, slip of the strands at the
dead end of the specimen was measured instead of elongation of the strands at the live
end of the specimen. The slip loads for the unanchored strands were 14.8 kips and
15.8 kips for BUAG11 and BUAG21, respectively. The pull-out loads for the bare,
anchored strands were 20.3 kips and 18.0 kips for BAG11 and BAG21, respectively.
6.9 Conclusions. Due to the pull-through of the strands at the dead end of the
specimen, the pull-out loads for the anchored strands could not be determined
graphically as explained in section 6.2. Instead, the load at which the strands were
observed to pull through the anchorages at the dead end of the specimen were
considered to be the pull-out loads. However, as indicated by the data for the
unflushed and flushed strands (Figures 6.20 and 6.21), the pull-out loads for these

146
Figure 6.22 Results for bare, anchored and bare, unanchored strands.
strands occurred very close to the average data for the unbonded strands. This
agreement between the intersection of the data and the observed pull-through of the
strands indicated that the data obtained from this test setup was probably accurate even
though some type of losses seemed to occur in the system during testing.
As indicated by the average pull-out loads in Table 6.4 the presence of both the
unflushed lubricant and the flushed lubricant significantly reduced the adhesion
between the seven-wire strand and cement grout. This reduction was approximately
60% for the unflushed lubricant and 65% for the flushed lubricant. These reductions
were less than the reductions observed in the small-scale pull-out tests performed in
Chapter 5, which showed average reductions in adhesion strength of 90% when L5
was used to lubricate the unflushed and flushed strands.

147
Table 6.4 Results of anchored pull-out tests.
The pull-out loads for the bare, unanchored strands and bare, anchored strands
shown in Table 6.5 allowed a direct comparison between the adhesion strength of bare
strands that are free to twist and bare strands that are not free to twist. As shown by
the average pull-out loads for these two types of specimens it appears that restricting
twist of a bare strand may increase the adhesion strength by approximately 20%. This
increase in adhesion strength agreed somewhat with the 30% increase observed for the
unflushed and flushed strands that were restricted from twisting. The values for the
pull-out load per foot for the unanchored strands shown in Table 6.5 agreed somewhat
with the 3.45 k/ft. value determined for the bare strand specimens from R2 in Chapter
5. These values differed by approximately 30%, which is acceptable for these types of

148
Table 6.5 Comparison of bare anchored and bare unanchored strands.
tests and the size differences between the two types of specimens.
Results from the anchored pull-out tests indicated that restricting twist of bare,
unflushed, and flushed strands may increase the adhesion strength between these
strands and cement grout. However, this increase is only around 20-30%, which
means that the presence of an unflushed or flushed lubricant on a seven-wire strand
that is restricted from twist still reduces the adhesion strength between strand and grout
by about 60%. These findings reinforce the findings of Chapter 5, which were (1) the
presence of a lubricant on a seven-wire strand significantly reduces the adhesion
between the strand and cement grout and (2) a lubricant cannot be removed from the
strand surface by the flushing techniques used in this research, which are similar to
those used in post-tensioned concrete construction.

149

147
CHAPTER 7
LUBRICANT EVALUATION
7.1 Introduction. The purpose of this chapter is to evaluate the overall performance
of the eleven lubricants and recommend the best four for use in large-scale friction
tests. A Matrix Priority Rating System was selected for this evaluation because it can
use several criterion of different importances to evaluate several alternatives. In this
study the alternatives were the ten emulsifiable oils, a sodium silicate solution, and
bare strand. The criteria were friction reduction, effect on adhesion, temporary
corrosion protection, safety hazards, lubricant cost, and difficulty of use. An
importance factor is selected for each criterion as a percentage of 100 points. The
system works by rating the lubricants based on their performance under each criterion
and multiplying this rating by the importance of the criterion to obtain a score for that
lubricant. The total score for the lubricant is obtained by summing the scores under
each criterion. The alternative having the highest total score is considered the best
solution.
7.2 Matrix Priority Rating System
7.2.1 Background. The Matrix Priority Rating System was developed by Robert R.
Dunford of the Business Research Division of Dow Corning Corporation in 1974.
Two assumptions were made when designing this system. One, that a variety of
criteria are usually used to judge the success or efficacy of a decision's outcome. Two,
that some criteria are more important than others[25].
This system is similar to methods used by businesses when evaluating new
products or new investments. The advantages of this system are its speed and
simplicity. Its only disadvantage is that it does not include probabilities, which does

148
not affect this application which evaluated the observed behavior of the alternatives
rather than predicting the probable behavior of the alternatives.
7.2.2 Alternatives. The twelve alternatives were the eleven lubricants that
were shown previously in Table 2.4 and bare strand. Each of these alternatives is
described in Table 7.1.
7.2.3 Criteria. A variety of criteria must be used in order to prevent implicit
weighting of a criterion category. For this evaluation six different criteria were
selected as shown in Table 7.2. These criteria were selected based on the demands of
lubricants and the concerns associated with their use. Friction reduction, effect on
adhesion, temporary corrosion protection, and safety hazards were broken down
further as shown in Table 7.3 to account for more specialized criterion. The large
number of corrosion criteria did not cause an implicit weighting problem because three
types of specimens and three types of environments were considered. Also, the total
importance of the corrosion criteria was assigned first and then divided among the
more specialized criterion. Descriptions of each criterion are discussed in detail in the
following sections.
7.2.3.1 Friction Reduction. Friction reduction is the primary reason for using
lubricants in the field. This criterion was divided to include static friction reduction
and dynamic friction reduction since both types of friction are present during stressing
operations.
7.2.3.2 Effect on Adhesion. The effect of the lubricant on the adhesion between
strand and grout is a major concern. Two cases were considered, unflushed and
flushed specimens. The unflushed case showed the effect of the lubricant on grout
adhesion, while the flushed case indicated the flushability of the lubricant.
7.2.3.3 Temporary Corrosion Protection. A secondary use of lubricants in the

149
field is to provide temporary corrosion protection. This criteria was also

150

151
152
included to insure that the alternative lubricants did not decrease the corrosion
resistance of bare strand. The corrosion criteria was divided into three groups;
unflushed strands, flushed strands, and unflushed wires. The strand criteria was
broken down further into outer strand protection, inner strand protection, and corrosion
rate. The unflushed wire criteria was broken down into ambient, deionized water, and
3.5% NaCl solution.
For the unflushed and flushed strands outer strand protection was used to
indicate the length of time of protection offered by the different lubricants to the
outside of the strands. Inner strand protection judged the ability of the lubricants to
enter the interstices of the strand and remain there for corrosion protection and
corrosion rate showed the performance of the lubricants over time.
For the unflushed wires ambient conditions showed the performance of the
lubricants in simulated field conditions while the differences between deionized water
and 3.5% NaCl solution indicated the corrosion protection offered in accelerated
corrosive environments.
7.2.3.4 Safety Hazards. In order to account for the safety risks associated with
handling these lubricants three different safety hazards were considered. These
hazards were health, flammability, and reactivity.
7.2.3.5 Lubricant Cost. Lubricant cost refers to the cost/gallon of the lubricant
when the lubricant is purchased in approximately fifty-five gallon drums.
7.2.3.6 Difficulty of Use. Difficulty of use takes into account the application and
cleanup procedures that are required for each lubricant.
7.2.4 Importance Factors. Importance factors indicate the relative importance
of the criteria. For this evaluation one hundred points was distributed among the
criteria to indicate their importances. This number of points could be any convenient

153
number such as 50, 500 or 1000 since the importances are relative.
The distribution of points is shown in Table 7.4 directly below the criteria. Of
the one hundred points, forty points were given to friction reduction, twenty-five for
effect on adhesion, twenty for temporary corrosion protection, six for safety hazards,
five for lubricant cost, and four for difficulty of use. Importance factors for each
criterion are discussed in detail in the following sections.
7.2.4.1 Friction Reduction. Friction reduction was given the most importance
since it is the primary reason for the use of lubricants in the field. Both static and
dynamic friction are present during stressing operations. Therefore, both of these
criterion were considered equally important and given importance factors of twenty.
7.2.4.2 Effect on Adhesion. Effect on adhesion was considered second in
importance. While the primary reason for this evaluation was to determine the
lubrication properties of the different lubricants there is concern over possible
reduction in bond affecting ultimate strength. Weighting factors of 12.5 were given to
the unflushed and the flushed criterion. These criterion were considered equally
important to give equal credit to lubricants that do not effect the adhesion and to
lubricants that can be totally removed by flushing.
7.2.4.3 Temporary Corrosion Protection. Corrosion protection was considered to
be half as important as friction reduction since corrosion protection is a secondary
reason for lubricated tendons. Twenty points were distributed among nine criterion
with ten going to protection of unflushed strands, five for flushed strands, and five for
unflushed wires.
For the unflushed strands importance factors for outer strand protection, inner
strand protection, and corrosion rate were six, two, and two respectively. Outer strand
protection was given the highest weighting since corrosion usually begins on the outer
strand first. Inner strand protection was of less importance because it was based on

154
smaller specimens and because it was only measured at the conclusion of the exposure
tests. Corrosion rate was also of less importance since it dealt with the performance of
the lubricants after corrosion began.
Corrosion protection of flushed strands was considered half as important as
corrosion protection of unflushed strands since these lubricants are not expected to
provide protection after flushing. However, corrosion protection after flushing is
definitely a plus. Therefore, lubricants were credited for this characteristic. The
importance factors for outer strand protection, inner strand protection, and corrosion
rate were three, one, and one respectively.
Unflushed wires had relatively low importance factors since they were smaller
than the strand specimens. Wires in the ambient conditions were slightly more
important than those in the controlled environments because the ambient conditions
were more closely related to field conditions. The importance factors were 2, 1.5, and
1.5 for ambient, deionized water, and 3.5% NaCl solution respectively.
7.2.4.4 Safety Hazards. Each safety hazard was assigned a weighting of two.
These importance factors were relatively low since no unusual precautions are
necessary when using these lubricants.
7.2.4.5 Lubricant Cost. Lubricant cost was given an importance of five. This
importance was based on the fact that the cost of lubricants is almost negligible when
compared to the cost of a typical project requiring lubricated tendons.
7.2.4.6 Difficulty of Use. For this evaluation difficulty of use was given an
importance of four. This relatively low importance factor was selected because this
evaluation was more concerned with the properties of the lubricants after they were
applied to seven-wire strand.
7.2.5 Scales for Rating of Criteria. The scales used for rating the criteria are
the most important element of the Matrix Priority Rating System because they must

155
separate good performances from bad and also give similar ratings to similar
performances. Ideally, the scales should be designed before any tests are completed.
However, this is hard to do if there is little idea of the ranges of results that will be
encountered. For example, how long should an emulsifiable oil provide temporary
corrosion protection? In this thesis some data was referenced to provide a fair rating
system. This data was only used to design upper and lower limits for the ratings and
not to give preferential treatment to any of the lubricants.
Table 7.5 shows the rating systems that were used for the different criterion.
Ratings varied linearly from zero to ten with ten being the best. This linear
relationship can be seen in the rating system for outer strand protection of unflushed
strands where a rating of ten was given to lubricants providing corrosion protection for
forty days and a rating of zero was given to lubricants providing corrosion protection
for zero days. If a lubricant protected the strand for twenty days, then it would be
given a rating of 20 x (10/40), or 5.
Care must be exercised when designing the upper and lower limits for the
rating systems to prevent lubricants from being credited or penalized too much. Table
7.6 shows the ratings of the lubricants when different lower limits were used for static
friction reduction. The amount of friction reduction provided by each lubricant is
shown in the second column. The third column of the table shows the ratings for the
lubricants based on the rating system for static friction reduction shown in Table 7.5.
In this rating system a rating of zero was given to lubricants increasing friction by 10%
or more. Originally, a rating of zero was given to lubricants increasing friction by
33% or more to

156

157
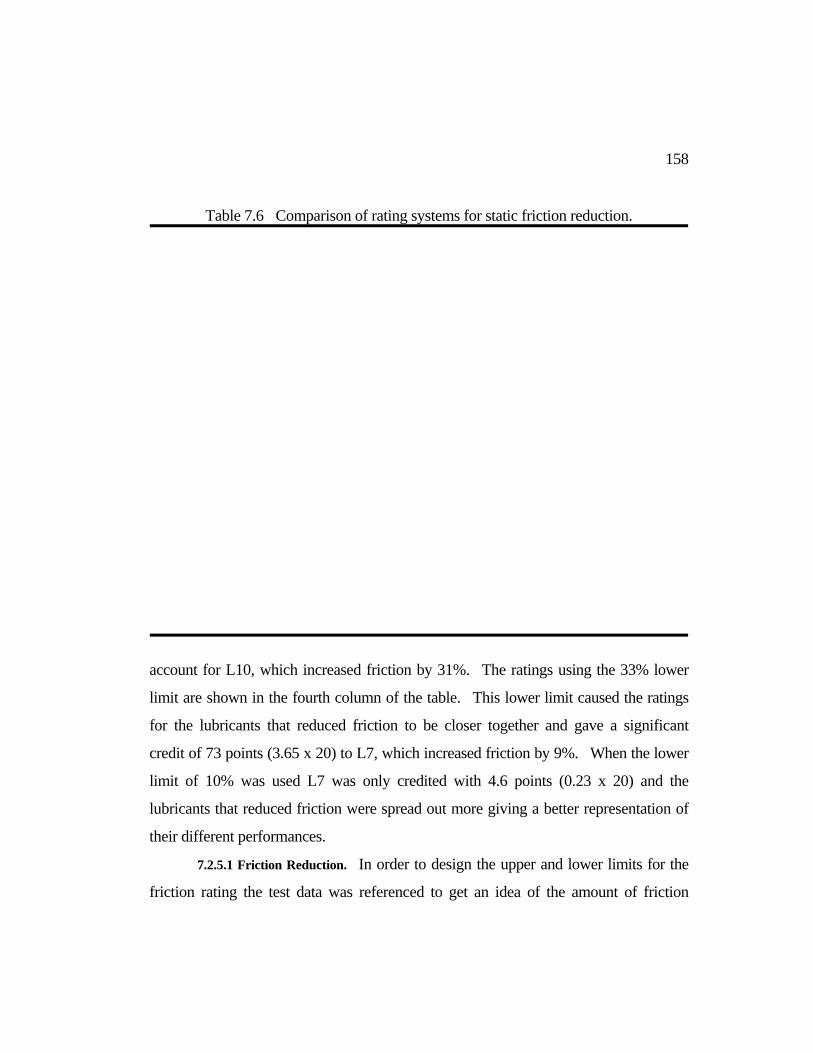
158
Table 7.6 Comparison of rating systems for static friction reduction.
account for L10, which increased friction by 31%. The ratings using the 33% lower
limit are shown in the fourth column of the table. This lower limit caused the ratings
for the lubricants that reduced friction to be closer together and gave a significant
credit of 73 points (3.65 x 20) to L7, which increased friction by 9%. When the lower
limit of 10% was used L7 was only credited with 4.6 points (0.23 x 20) and the
lubricants that reduced friction were spread out more giving a better representation of
their different performances.
7.2.5.1 Friction Reduction. In order to design the upper and lower limits for the
friction rating the test data was referenced to get an idea of the amount of friction

159
reduction that was possible. L5 reduced the static friction by 27% and teflon reduced
the static friction by 61%. It was felt that a reduction of 33% would be a practical
ideal, therefore, a rating of ten was given to any lubricants reducing friction by 33% or
more. This was a significant decrease since only about 10% reduction is usually
expected in the field when frictional problems are encountered.
The lower limit accounted for any lubricants that increased the frictional
resistance. Again, the test data was referenced to get an idea of the amount of
frictional increase possible. The two lubricants that increased the static friction were
L7 and L10. The increases were 9% and 31% respectively. In order to appropriately
penalize these lubricants a rating of zero was given to lubricants that increased the
friction by 10% or more.
The same rating system was used for dynamic friction reduction since both
types of friction were considered equally important.
7.2.5.2 Effect on Adhesion. According to ACI Building Code Section 12.9.1 the
development length of 1/2" diameter Gr. 270 low-relaxation strand is 135" assuming a
maximum nominal stress of 270 ksi. and no prestress losses. This correlates to a force
of 41.3 kips over 135". Assuming the relationship between force and bond length is
linear then the maximum force in bare strand with a bond length of 10.5" is
approximately 3.2 kips. The bond length of the small-scale pull-out specimens was
10.5". Therefore, a rating of ten was given to any lubricant with a slip load of 3.2 kips
or more. A rating of zero was given to any lubricant having a slip load of 100 lbs. or
less, which essentially corresponded to total loss of bond since the weight of the
pull-out specimen with bearing pad and plate was 86 lbs. The same rating system was
used for the unflushed and the flushed cases since they were of equal importance.
7.2.5.3 Temporary Corrosion Protection. The same rating systems were used for
the unflushed and flushed strands to make a direct comparison between the

160
performances of the lubricants with and without flushing.
For outer strand protection a rating of ten was given to lubricants preventing
corrosion for forty days or more and a rating of zero was given to lubricants allowing
corrosion after zero days. These limits were selected as being appropriate for
construction sequences between placement of strands and grouting. They did
reference the visual observations for the exposure tests which showed protection of
unflushed specimens varying from fifteen days to thirty-nine days. Strand that was
not lubricated began to corrode after four days.
For inner strand protection a rating of ten was given to lubricants that allowed
0% corrosion of the inner strand after forty-six days. If 100% of the inner strand was
corroded after forty-six days, then the lubricant was given a rating of zero. The only
problem with this rating system was that it did not account for severity of corrosion or
when corrosion began. For example, 90% of the unflushed strand lubricated with L1
was covered with a light, uniform corrosion , while 85% of the unflushed strand
lubricated with L7 was covered with a heavy, uniform corrosion. However, the L7
strand received a slightly higher rating since it had slightly less corrosion.
A rating of ten was given to lubricants allowing a corrosion rate of 0%/day,
while a rating of zero was given to lubricants allowing a corrosion rate greater than or
equal to 10%/day. This rating system was chosen after noticing that the corrosion
rates of the unflushed strands varied from 1.5%/day to 6.7%/day. It was felt that a
maximum rate of 10%/day would be fair to all of the lubricants.
For the unflushed wires in the ambient conditions a rating of ten was given to
lubricants that prevented corrosion for forty days and a rating of zero was given to
lubricants that allowed corrosion after zero days. This is the same rating system that
was used for the outer strand protection since the strands and wires were both in the
same environment.

161
For the unflushed wires in deionized water and 3.5% NaCl solution a rating of
ten was given to lubricants that allowed 0% corrosion after three days, while a rating of
zero was given to lubricants that allowed 100% corrosion after three days.
7.2.5.4 Safety Hazards. Material Safety Data Sheets were referenced for
information concerning the health, flammability, and reactivity hazards of each
lubricant. For all ten emulsifiable oils NFPA (National Fire Protection Association)
and/or HMIS (Hazardous Material Information Systems) hazard ratings were available.
These ratings were not applicable to L10 so personal judgement was used when rating
this product for safety.
The NFPA and HMIS ratings range from zero to four with zero being an
insignificant hazard and four being an extreme hazard. These ratings were modified
to be consistent with the rating systems used for the other criteria in the decision
matrix. Table 7.7 shows the NFPA, HMIS and modified rating systems.
All of the lubricants posed insignificant to slight hazards to health,
flammability, and reactivity except for L10, which was considered to pose moderate
health and reactivity hazards. L10 dries to form a glassy film that can easily cut skin
and its decomposition or prolonged contact with certain metals can produce flammable
Hydrogen gas[26].
7.2.5.5 Lubricant Cost. Lubricants that cost $2/gallon or less were given a rating
of ten. Lubricants that cost $20/gallon or more were given a rating of zero. The
range of costs for the lubricants as shown in Table 7.8 varied from $3.16/gallon to
$14.38/gallon when purchased in approximately fifty-five gallon drums. L1 is no
longer manufactured, but the price quoted in the table is an approximate cost based on
information from its former manufacturer.

162
Table 7.7 Rating systems for safety criteria.
7.2.5.6 Difficulty of Use. This rating system was based on application and
cleanup procedures associated with lubricated tendons. For this rating system the
normal application procedures were considered to be dipping the tendon or spraying
the tendon as it is entering the duct. Both of these methods are considered to be
moderately difficult, but can be performed in reasonable time frames. Cleanup
procedures refer to removal of lubricant from skin and clothing of employees and
equipment involved in the lubrication or stressing operations. In this rating system
normal cleanup procedures were assumed to use water and soap to remove the
lubricant from skin, clothes, and equipment.
A rating of ten was given to lubricants that were very simple to use and require
no application time and no cleanup. The only alternative that fit this description was

163
bare strand. A rating of five was given to lubricants that were moderately difficult to
use. Lubricants that were very difficult to use were given a rating of zero.
All of the alternatives were given a rating of five except L9, L10, and bare
strand. L9 was given a score of two because it is very thick and could not be sprayed
onto a tendon. It is also very messy and hard to remove from skin or clothing. L10
was given a score of zero because it dries quickly and is hard to remove from
equipment. Bare strand was given a score of ten because it does not require any
application or cleanup procedures.

164
7.2.6 Evaluation Process. The matrix setup, which is shown in Table 7.9, lists
the alternatives in the first column and the criteria across the top. Importance factors
for the criteria are shown in the first row of the table. The matrix works by rating each
alternative based on its performance with respect to each criterion. The rating ranges
from 0 to 10 with 10 being the best. This rating is then entered in the top box for the
lubricant under that particular criterion. For example, L1 was given a rating of 6.28
for its performance in reduction of static friction. This rating is multiplied by the
importance of the criterion to give a score for that lubricant. For L1 the rating of 6.28
Table 7.8 Costs of lubricants.

165
was multiplied by the importance factor of 20 to get a score of 126. This process is
repeated for each lubricant and each criterion. The total score for the alternative
lubricant is obtained by summing the scores from the lubricant's performance with
respect to each criterion. For L1 its total score was 454. The solution with the
highest total score is the best alternative. A perfect solution would have a score of
1000 points.
7.2.7 Matrix Evaluation of Candidate Lubricants. The final matrix evaluation
is shown in Table 7.10. The alternatives were placed in descending order according to
their total scores. The best alternative was L5 with a total score of 529, while the
worst alternative was L7 with a score of 219. Bare strand was considered the third
best alternative with a total score of 516. These results are interesting because they
indicate that only two lubricants were better than bare strand when looking at the
advantages and disadvantages of the lubricants studied in this thesis.
Matrix ratings for bare strand differed under the adhesion criterion due to the
construction sequence of the pull-out specimens. As mentioned in section 5.1, the
pull-out specimens were constructed in two groups. The first group consisted of bare
and unflushed strand specimens. The second group

166

167

168
consisted of bare and flushed strand specimens. Ratings for the bare strand alternative
under the unflushed and flushed adhesion criteria are based on the pull-out loads for
bare strand in these two groups of specimens. In the first group of specimens the
average pull-out load for bare strand was 2560 lbs. which corresponded to a matrix
rating of 7.94. In the second group of specimens the average pull-out load for bare
strand was 3330 lbs., which corresponded to a matrix rating of 10.0. It was felt that
both average pull-out loads should be used since two groups of specimens were tested.
In order to show the relative performances of these lubricants during the
evaluation process their cumulative scores were plotted versus the criterion. Figure
7.1 shows the curves for the eleven lubricants, bare strand, and the ideal lubricant,
which was given a rating of ten under each criterion.
In general the curves for the alternative lubricants were similar in shape. The
curves increased with the addition of the friction scores and then flattened out due to
the low adhesion scores before increasing gradually with the addition of the remaining
criterion scores. The biggest difference between the ideal curve and the alternative
curves occurred above the adhesion criteria. All of the lubricants reduced the
adhesion strength by approximately 90% except for L10, which reduced the adhesion
by 50% for the unflushed case and 10% for the flushed case.
The lubricants were divided into four groups based on the curves shown in
Figure 7.1. These groups are shown in Figures 7.2 through 7.5 along with the ideal
lubricant. The first group consisted of L5 and L11. Group two consisted of L1, L2,
L3, L4, and L8. L6, L7, L9, and L10 made up the third group. The fourth group
consisted of bare strand. Lubricants in groups one and two were considered
acceptable lubricants, while lubricants in group three were considered unacceptable
lubricants.

169

170

171

172

173
L5 and L11 performed well under all of the criteria except for adhesion, where
they significantly reduced the adhesion. Lubricants in the second group were not
quite as good in friction reduction, but were similar under all of the remaining criteria.
Lubricants in the third group behaved in various manners. L9 slightly reduced friction
and was an excellent corrosion inhibitor, but had a disastrous effect on adhesion. This
lubricant is also expensive and difficult to use. All of these characteristics are shown
in the curve for L9 in Figure 7.4. L10 had less effect on the adhesion than the other
lubricants, was the best corrosion inhibitor after flushing and relatively inexpensive.
However, its low scores in friction reduction, safety and difficulty of use kept it from
being an acceptable lubricant. L6 had very little effect on friction reduction and
significantly reduced the adhesion strength. In the remaining criteria its performance
was acceptable. L7 performed poorly in the friction, adhesion, and corrosion tests
resulting in a weak overall performance. L7 is also relatively expensive. Its only
favorable characteristic was its safety.
Figure 7.5 shows the performance of bare strand during the evaluation. Bare
strand was credited in the friction criteria because two of the lubricants actually
increased friction. It was close to ideal for adhesion and was ideal with respect to
safety, cost, and difficulty of use. Its major drawback was its low corrosion resistance
which is shown by the flat region of the curve above the corrosion criteria.
7.3 Recommendations. Table 7.11 shows the four lubricants that were
recommended for use in the large-scale friction tests that were a part of this overall
project. The top four alternatives from the matrix evaluation were L5, L11, bare
strand, and L2. Their respective scores were 529, 518, 516, and 475. However, bare
strand is not a viable candidate for friction reduction. Therefore, it was replaced with
another lubricant. The fifth, sixth, and seventh place candidates were L3, L1, and L8
with scores of 465, 454, and 451 respectively. L8 was selected as the fourth candidate
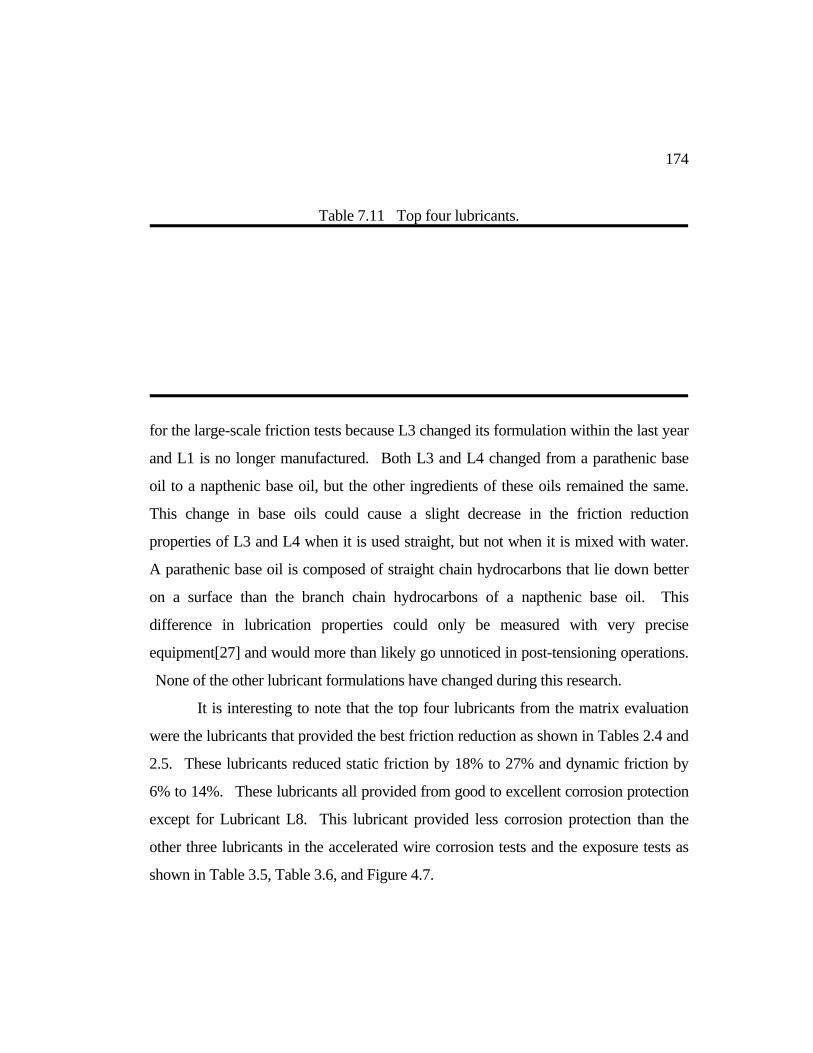
174
Table 7.11 Top four lubricants.
for the large-scale friction tests because L3 changed its formulation within the last year
and L1 is no longer manufactured. Both L3 and L4 changed from a parathenic base
oil to a napthenic base oil, but the other ingredients of these oils remained the same.
This change in base oils could cause a slight decrease in the friction reduction
properties of L3 and L4 when it is used straight, but not when it is mixed with water.
A parathenic base oil is composed of straight chain hydrocarbons that lie down better
on a surface than the branch chain hydrocarbons of a napthenic base oil. This
difference in lubrication properties could only be measured with very precise
equipment[27] and would more than likely go unnoticed in post-tensioning operations.
None of the other lubricant formulations have changed during this research.
It is interesting to note that the top four lubricants from the matrix evaluation
were the lubricants that provided the best friction reduction as shown in Tables 2.4 and
2.5. These lubricants reduced static friction by 18% to 27% and dynamic friction by
6% to 14%. These lubricants all provided from good to excellent corrosion protection
except for Lubricant L8. This lubricant provided less corrosion protection than the
other three lubricants in the accelerated wire corrosion tests and the exposure tests as
shown in Table 3.5, Table 3.6, and Figure 4.7.

CHAPTER 8
SUMMARY, RECOMMENDATIONS, AND CONCLUSIONS
8.1 Summary. The use of post-tensioned concrete and post-tensioning technology in
U.S. bridge structures has increased rapidly in the last twenty years. During this
period over 100 large, post-tensioned segmental bridge projects and 13 cable-stay
bridges have been completed. These bridges have provided excellent performance to
date and are not expected to have any problems in the near or distant future. However,
there have been a number of concerns associated with their construction. Two of
these are friction reduction during stressing of post-tensioned tendons and temporary
corrosion protection of both post-tensioned tendons and cable-stays after installation
and before grouting.
During the stressing of multi-strand post-tensioned tendons large frictional
losses can be encountered between the tendon and the duct. These losses can be a
significant concern since large losses can appreciably reduce the efficiency of the
post-tensioning process. In effect prestressing steel is being wasted since the effective
prestress allowed by codes and standards cannot be totally developed at all sections
along the tendon length.
Temporary corrosion protection of post-tensioned tendons and cable-stays after
installation and before grouting is another concern. Both the tendons and the stays
consist of tension elements that are under very high stresses. Failure of one of these
elements due to corrosion could cause severe structural damage. Failure of several
might cause collapse of a structure.
Historically, the solution to both of these concerns has been the application of
emulsifiable oils to the surface of the tendon or stay. However, there are numerous
oils available and there is very little test data providing the amount of friction reduction
or corrosion protection that can be expected from different oils. There is also no test
176
data comparing the effect of different oils on the adhesion between seven-wire strand
and cement grout before and after flushing. Therefore, an extensive lubricant
evaluation was performed. This evaluation included an extensive search for
emulsifiable oils that could be used for lubrication and/or temporary corrosion
protection of multi-strand tendons. Eleven lubricants were identified. Of these
eleven lubricants, ten were emulsifiable oils and one was a sodium silicate solution.
In order to evaluate the eleven lubricants, small-scale corrosion and adhesion
tests were performed. Small-scale friction tests performed by Hamilton and Davis as
part of the overall project were also incorporated into the evaluation. The corrosion
tests compared the corrosion protection offered by the different lubricants in three
environments. These environments were deionized water, 3.5% NaCl solution, and
ambient outdoor conditions. Small lubricated wire specimens were used in the
deionized water and the 3.5% NaCl solution. In the ambient outdoor conditions,
lubricated wires, lubricated strands, and lubricated then flushed strands were all
exposed to ambient outdoor conditions as well as a daily wetting cycle. In the
deionized water and 3.5% NaCl solution a reference electrode and visual observations
were used to determine the length of corrosion protection offered by the different
lubricants. In the ambient outdoor conditions visual observations were used to
compare the corrosion protection offered by the different lubricants.
The adhesion tests used single bare, lubricated, and lubricated then flushed
strands grouted inside steel ducts to determine the effect of the different lubricants on
the adhesion between seven-wire strand and cement grout before and after flushing by
pulling the strand out of the specimen. Additional pull-out tests, which prevented the
strands from twisting were also performed to determine if restricting twist would
increase the adhesive strength of bare, lubricated, and lubricated then flushed strands.

177
In these additional tests, which were referred to as anchored pull-out tests, the strand
specimens were also grouted inside steel ducts.
The overall performance of the different lubricants was determined by using a
Matrix Priority Rating System. This system was selected since it can use several
criterion of different importances to evaluate several alternatives. Based on the results
of these rankings four lubricants were recommended for use in large-scale friction tests
that were part of this overall project.
8.2 Findings. This section presents the findings from each of the small-scale tests as
well as the results from the matrix evaluation of the different lubricants.
8.2.1 Small-scale Friction Tests. Eight of the eleven lubricants reduced
friction while three of the lubricants increased friction. The reductions in friction
varied between 2% and 30% while the increases varied between 5% and 30%. The
30% increase was caused by the sodium silicate solution which dried during testing
and prevented movement of the strand specimen during the test. The increase caused
by the other two lubricants was between 5% and 10%.
8.2.2 Accelerated Wire Corrosion Tests in Deionized Water and 3.5% NaCl
Solution..
(a) The length of corrosion protection offered by the different lubricants could
not be determined by using a reference electrode. However, sharp changes in
potential difference data did precede the appearance of visual corrosion in several
cases.
(b) Eight of the eleven lubricants provided from good to excellent corrosion
protection in both the deionized water and the 3.5% NaCl solution. Two lubricants
provided poor corrosion protection in both environments. One lubricant provided
good corrosion protection in deionized water and poor corrosion protection in the 3.5%
NaCl solution.

178
(c) Similar amounts of corrosion were observed on bare wires tested in
deionized water and 3.5% NaCl solution. The corrosion on the saltwater specimens
changed from a bright orange color to a dark reddish-brown after the wires were
removed from the saltwater environment.
8.2.3 Exposure Tests in Ambient Outdoor Conditions.
(a) Bare stand specimens began to corrode after four days of exposure.
(b.) The length of corrosion protection offered by the eleven lubricants varied
from fifteen to thirty-nine days on lubricated strands.
(c) A sodium silicate solution was the only lubricant that provided any
corrosion protection after flushing. This lubricant prevented corrosion for twenty days
after flushing.
(d) There was some correlation between the length of corrosion protection
provided by the lubricants on the lubricated wires in the exposure tests and the percent
corrosion present on the lubricated wires in the accelerated wire corrosion tests. In
general, emulsifiable oils that provided corrosion protection for fourteen to eighteen
days in the exposure tests allowed 10% or less corrosion in the accelerated wire
corrosion tests.
8.2.4 Small-scale Adhesion Tests.
(a) Pull out results from the grouted specimens showed that all of the lubricants
essentially destroyed the adhesion between a single seven-wire strand and the hardened
cement grout. On average the reduction in adhesion was 90%. Results were similar
for pull-out tests using lubricated strands which had been generously flushed. For the
flushed specimens the average reduction in adhesion was still approximately 75%.
The only exception was the sodium silicate solution which reduced adhesion by 50%
before flushing and 10% after flushing.
(b) The adhesion properties of seven-wire strand with a stearate soap on its

179
surface were the same as those of seven-wire strand without a stearate soap.
8.2.5 Anchored Pull-out Tests. Restricting twist of bare, lubricated, and
lubricated then flushed strands slightly increased the adhesion strength of these strands.
This increase was approximately 30% for all three types of strands. There was
essentially no difference in the behavior of the lubricated strands and the lubricated
then flushed strands..
8.3 Recommendations. Four lubricants are recommended for use in full-scale tests
for the effectiveness of lubrication of multi-strand tendons. These lubricants were L2,
L5, L8, and L11. Based on the results of the small-scale friction tests these four
lubricants can be expected to reduce friction during stressing by 10 to 20%. These
four lubricants also provided the best overall performance with respect to the criteria
used in this evaluation. These criteria were friction reduction, effect on adhesion,
corrosion protection, safety, cost, and difficulty of use.
Five lubricants are recommended for temporary corrosion protection of
prestressing steel. These lubricants are L2, L3, L4, L5, and L6. All five of these
lubricants provided from good to excellent corrosion protection in the accelerated wire
corrosion tests and the exposure tests. Based on the tests reported in this thesis, it is
difficult to determine the length of corrosion protection that could be expected from
these five lubricants when applied to tendons in ungrouted ducts. However, it is felt
that all five of these lubricants could easily provide excellent corrosion protection of
ungrouted tendons for at least one to two months in a sealed duct.
Different emulsifiable oils provide different amounts of friction reduction and
different amounts of corrosion protection. Therefore, before other emulsifiable oils
are used their lubrication and/or corrosion protection properties should be evaluated.
In order to evaluate these properties small-scale friction tests and small-scale corrosion
tests similar to those presented in this thesis could be used. Small-scale adhesion tests

180
may also be useful even though it appears that all emulsifiable oils will essentially
destroy the adhesion between strand and grout before and after flushing.
8.4 Future Research. The search for a different type of lubricant needs to be
continued. This lubricant needs to reduce friction by at least 10 - 20% yet have
substantially less effect on the adhesion than the emulsifiable oils. One possible
candidate is a biodegradable soap called Aqualube MX. This product has shown to
provide slightly more friction reduction than Lubricant L2, but no adhesion tests have
been performed with this lubricant. Another possible lubricant is graphite powder
which has been used in the field for friction reduction with multi-strand tendons.
Small-scale beam tests using seven-wire strand need to be performed to
determine the effect of a flushed lubricant on the flexural behavior of a post-tensioned
member. Tests performed by Taylor indicated that a flushed lubricant will have little
effect on the flexural behavior of a post-tensioned beam. However, the pull-out tests
and anchored pull-out tests performed in this study indicated that the adhesion between
the strand and the grout will be significantly reduced by an unflushed lubricant
leading to unbonded behavior.
Corrosion tests using lubricated strands in vertical or inclined positions would
be useful. In cable-stay bridges the stays are in an inclined position and it is felt that
an emulsifiable oil may "drain" to the bottom of the stay over time. This "draining" of
the oil may result in less corrosion protection on the upper portions of the stay.

APPENDIX A
VISUAL OBSERVATIONS AND TEST RESULTS FOR ACCELERATED
WIRE CORROSION TESTS

182
This appendix contains the visual observations and Ecorr data for all of the wire
specimens tested in the accelerated wire corrosion tests. The labelling system for the
wire specimens, which is shown below, included the lubricant number, if a lubricant
was used, the specimen number, and the type of corrosive environment.
Labelling System for Wire Specimens used in Accelerated Wire Corrosion
Tests
L# = Lubricant Number (if a lubricant was used)
BW = Bare Wire
1,2 = Specimen Number
DW = Deionized Water
SW = 3.5% NaCl Solution
Examples of the labelling system are L1-1DW and BW-2SW. L1-1DW was
the first wire specimen lubricated with L1 and immersed in deionized water.
BW-2SW was the second bare wire specimen tested in 3.5% NaCl solution.
Tables A.1 through A.4 contain the visual observations for each wire specimen.
Figures A.1 through A.24 contain the Ecorr data for each wire specimen.
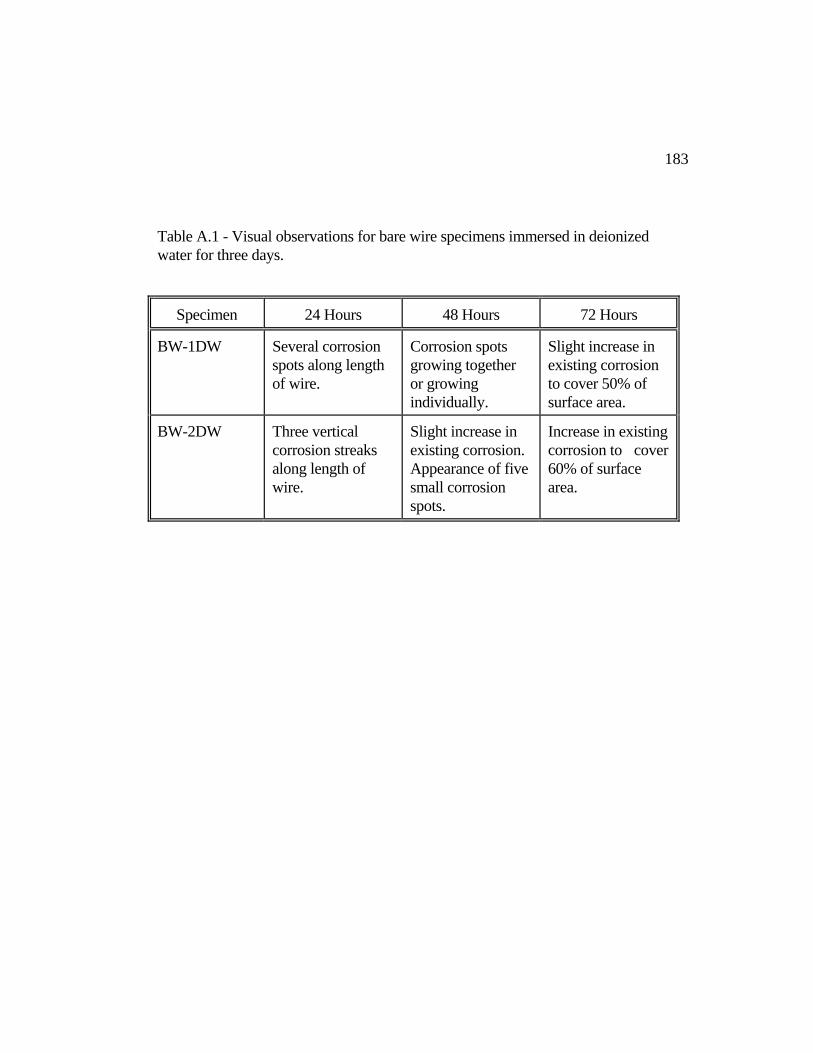
183
Table A.1 - Visual observations for bare wire specimens immersed in deionized water for three days.
Specimen 24 Hours 48 Hours 72 Hours
BW-1DW Several corrosion spots along length of wire.
Corrosion spots growing together or growing individually.
Slight increase in existing corrosion to cover 50% of surface area.
BW-2DW Three vertical corrosion streaks along length of wire.
Slight increase in existing corrosion. Appearance of five small corrosion spots.
Increase in existing corrosion to cover 60% of surface area.

184
Table A.2 - Visual observations for lubricated wires immersed in deionized water for three days.
Specimen 24 Hours 48 Hours 72 Hours
L1-1DW One corrosion streak and one corrosion spot covering a total of 15% of the surface area.
Slight increase in existing corrosion to cover 20% of the surface area.
Noticeable increase in existing corrosion. The corrosion streak and corrosion spot have grown together to cover 35% of the surface area.
L1-2DW Three corrosion streaks covering a total of 15% of the surface area.
Slight increase in corrosion streaks to cover 20% of the surface area.
Slight increase in corrosion streaks to cover 25% of the surface area.
L2-1DW No corrosion. Very slight corrosion at epoxy interface.
Slight increase in existing corrosion at epoxy interface. Appearance of slight corrosion at waterline. Total corrosion covers less than 1% of the surface area.
L2-2DW No corrosion. Corrosion spot at waterline.
No change in existing corrosion at waterline. Appearance of corrosion streak at bottom of wire. Total corrosion

185
covers 7% of surface area.
L3-1DW Corrosion streak covering 10% of the surface area.
Slight increase in corrosion streak.
Slight increase in corrosion streak to cover 15% of the surface area.
L3-2DW Small corrosion streak at bottom of wire covering less than 5% of the surface area.
Slight increase in corrosion streak to cover 5% of the surface area.
No change in existing corrosion.
L4-1DW No corrosion. Slight corrosion at epoxy interface.
Slight increase in corrosion at epoxy interface to cover 1% of surface area.
L4-2DW No corrosion. No corrosion. No corrosion.
L5-1DW No corrosion. No corrosion. Corrosion spot at waterline covering less than 1% of the surface area.
L5-2DW No corrosion. No corrosion. Slight corrosion at epoxy interface covering less than 1% of the surface area.
L6-1DW No corrosion. Very slight corrosion at epoxy interface.
No change in existing corrosion at epoxy interface. Corrosion covers 1% of surface area.
L6-2DW No corrosion. No corrosion. No corrosion.
L7-1DW No corrosion. No corrosion. Very slight
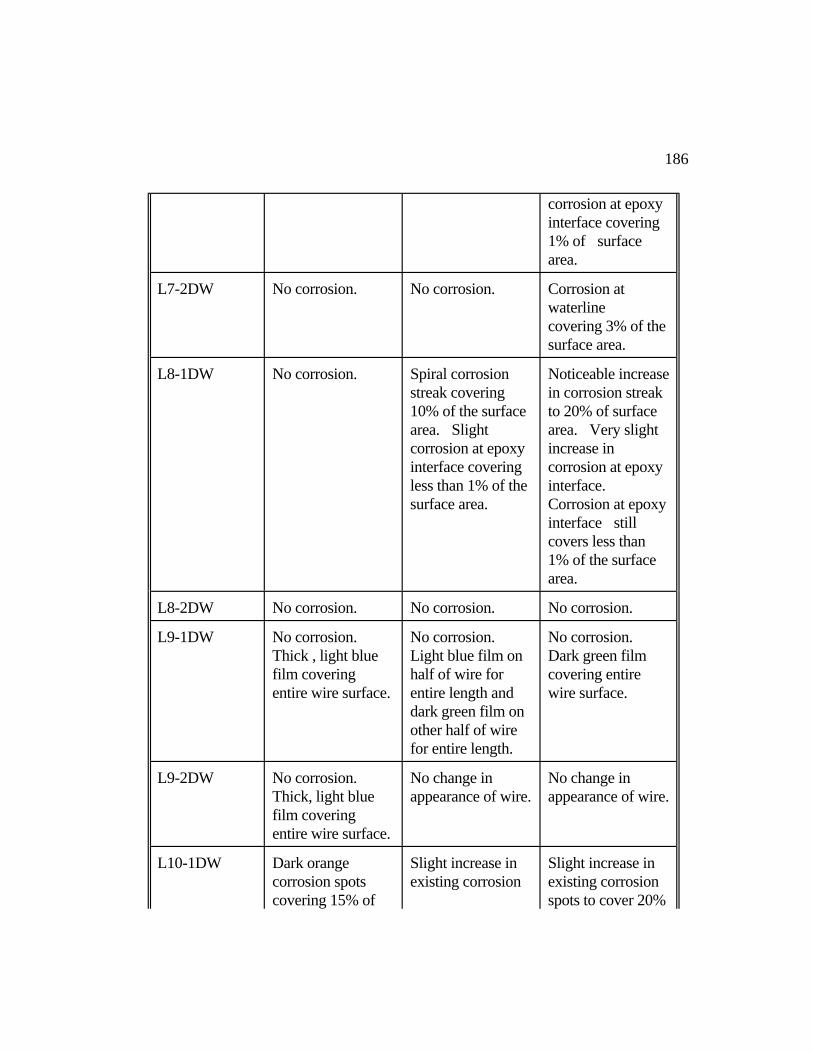
186
corrosion at epoxy interface covering 1% of surface area.
L7-2DW No corrosion. No corrosion. Corrosion at waterline covering 3% of the surface area.
L8-1DW No corrosion. Spiral corrosion streak covering 10% of the surface area. Slight corrosion at epoxy interface covering less than 1% of the surface area.
Noticeable increase in corrosion streak to 20% of surface area. Very slight increase in corrosion at epoxy interface. Corrosion at epoxy interface still covers less than 1% of the surface area.
L8-2DW No corrosion. No corrosion. No corrosion.
L9-1DW No corrosion. Thick , light blue film covering entire wire surface.
No corrosion. Light blue film on half of wire for entire length and dark green film on other half of wire for entire length.
No corrosion. Dark green film covering entire wire surface.
L9-2DW No corrosion. Thick, light blue film covering entire wire surface.
No change in appearance of wire.
No change in appearance of wire.
L10-1DW Dark orange corrosion spots covering 15% of
Slight increase in existing corrosion
Slight increase in existing corrosion spots to cover 20%

187
the surface area. spots. of the surface area.
L10-2DW Dark orange corrosion spots covering 5% of the surface area.
Slight increase in existing corrosion spots.
Slight increase in existing corrosion spots to cover 10% of the surface area.
L11-1DW No corrosion. No corrosion. Corrosion spot at epoxy interface covering less than 1% of the surface area.
L11-2DW No corrosion. Very slight corrosion at epoxy interface.
No change in corrosion at epoxy interface. Corrosion covers 2% of surface area.

188
Table A.3 - Visual observations for bare wire specimens immersed in 3.5% NaCl solution for three days.
Specimen 24 Hours 48 Hours 72 Hours
BW-1SW Corrosion streak covering 25% of surface area.
Slight increase in existing corrosion.
Noticeable increase in existing corrosion to cover 50% of surface area.
BW-2SW Uniform corrosion covering 50% of surface area.
No observation recorded.
Increase in existing corrosion to cover 70% of surface area.

189
Table A.4 - Visual observations for lubricated wires immersed in 3.5% NaCl solution for three days.
Specimen 24 Hours 48 Hours 72 Hours
L1-1SW Light, uniform corrosion near bottom of wire covering 10% of surface area.
Slight increase in existing corrosion. Appearance of corrosion spot slightly below waterline.
Increase in existing corrosion to cover 25% of surface area.
L1-2SW Light, uniform corrosion covering 30% of surface area.
Slight increase in existing corrosion to cover 35% of surface area.
Slight increase in existing corrosion to cover 40% of surface area.
L2-1SW Very slight corrosion at epoxy interface.
Very slight increase in existing corrosion at epoxy interface.
Slight increase in corrosion at epoxy interface to cover 5% of surface area.
L2-2SW Very slight corrosion at epoxy interface.
Slight increase in corrosion at epoxy interface.
Increase in corrosion at epoxy interface to cover 10% of surface area.
L3-1SW Very slight corrosion at epoxy interface.
No change in existing corrosion.
Slight increase in corrosion at epoxy interface to cover 1% of surface area.
L3-2SW Very slight corrosion at epoxy interface.
No change in existing corrosion.
No change in existing corrosion. Total corrosion
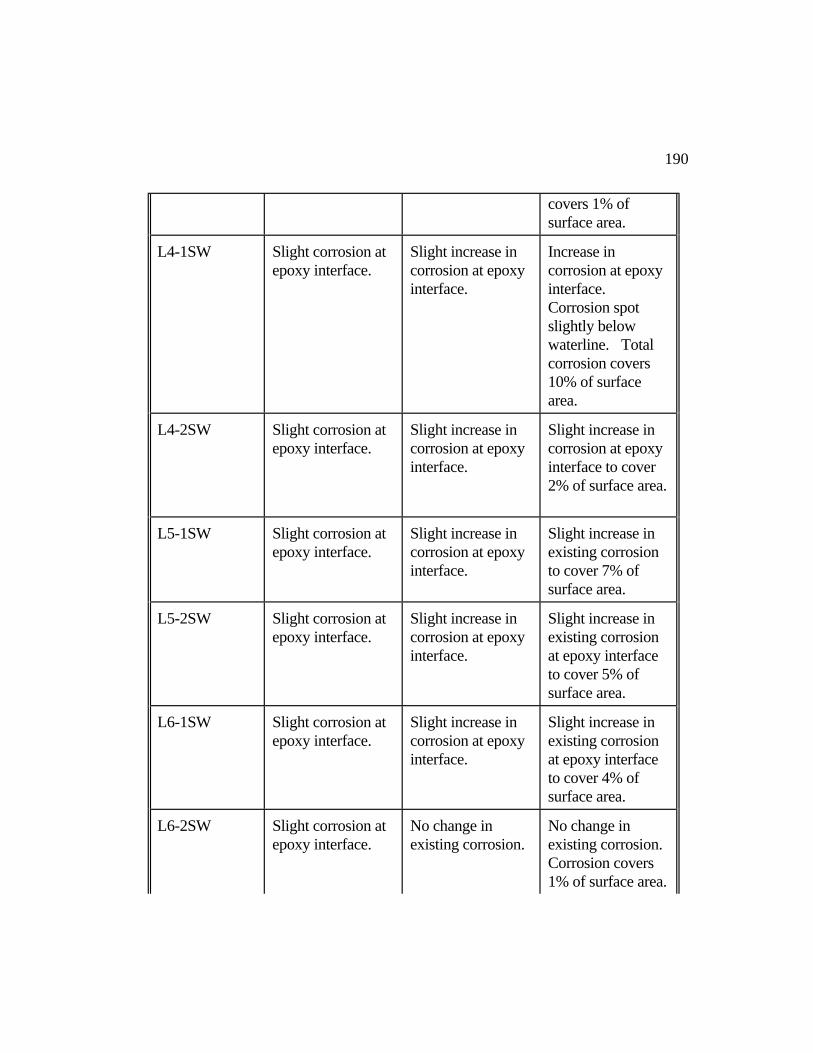
190
covers 1% of surface area.
L4-1SW Slight corrosion at epoxy interface.
Slight increase in corrosion at epoxy interface.
Increase in corrosion at epoxy interface. Corrosion spot slightly below waterline. Total corrosion covers 10% of surface area.
L4-2SW Slight corrosion at epoxy interface.
Slight increase in corrosion at epoxy interface.
Slight increase in corrosion at epoxy interface to cover 2% of surface area.
L5-1SW Slight corrosion at epoxy interface.
Slight increase in corrosion at epoxy interface.
Slight increase in existing corrosion to cover 7% of surface area.
L5-2SW Slight corrosion at epoxy interface.
Slight increase in corrosion at epoxy interface.
Slight increase in existing corrosion at epoxy interface to cover 5% of surface area.
L6-1SW Slight corrosion at epoxy interface.
Slight increase in corrosion at epoxy interface.
Slight increase in existing corrosion at epoxy interface to cover 4% of surface area.
L6-2SW Slight corrosion at epoxy interface.
No change in existing corrosion.
No change in existing corrosion. Corrosion covers 1% of surface area.

191
L7-1SW Slight corrosion at epoxy interface.
Slight increase in corrosion at epoxy interface.
Slight increase in existing corrosion to cover 5% of surface area.
L7-2SW Slight corrosion at epoxy interface.
No change in existing corrosion.
No change in existing corrosion. Corrosion covers 1% of surface area.
L8-1SW Corrosion streak near bottom of wire covering 10% of surface area.
Slight increase in corrosion streak.
Increase in existing corrosion streak to cover 20% of surface area.
L8-2SW Corrosion streak near bottom of wire covering 5% of surface area.
Slight increase in existing corrosion.
Slight increase in existing corrosion to cover 10% of surface area.
L9-1SW Slight corrosion at epoxy interface covering less than 1% of surface area. Wire is covered by dark green film.
Slight increase in existing corrosion, but this corrosion still covers less than 1% of the surface area. Wire is still covered by dark green film.
No change in appearance of wire.
L9-2SW No corrosion. Wire is covered by dark green film.
No change in appearance of wire.
No change in appearance of wire.
L10-1SW White streak covering 20% of surface area.
Slight increase in white streak to cover 25% of surface area.
No change in appearance of wire.
L10-2SW White streak covering 20% of
Slight increase in existing white
Increase in white streak to cover 40% of surface

192
surface area. streak. area.
L11-1SW Light, uniform corrosion near bottom of wire covering 10% of surface area.
Slight increase in existing corrosion.
Slight increase in existing corrosion to cover 15% of surface area.
L11-2SW Light, uniform corrosion near bottom of wire covering 5% of surface area.
Slight increase in existing corrosion to cover 10% of surface area.
No change in existing corrosion.

APPENDIX B
VISUAL OBSERVATIONS FOR EXPOSURE TESTS

207
This appendix contains summaries of the visual observations for the exposure
specimens in Chapter 4. The labelling systems used for these specimens are shown
below.
Labelling System for Unflushed and Flushed Specimens:
Lubricant Number - Type of Specimen
L# = Lubricant Number
UF = Unflushed Strand
F = Flushed Strand
UFW = Group of unflushed wires (Four wires in a group)
Labelling System for Bare Strand and Bare Wire Specimens:
BS = Bare Strand
BW = Group of bare wires (Four wires in a group)
Examples of this labelling system are L2-UF, L2-F, and L2-UFW. These
labels represent the unflushed strand, flushed strand and four unflushed wires
lubricated with Lubricant L2. BS-1, BS-2, and BW represent the first bare strand
specimen, the second bare strand specimen, and the group of bare wire specimens,
respectively.

208
Table B.1 - Summary of visual observations for bare strand and bare wire specimens exposed to ambient conditions and daily wetting cycle.
Specimen Observations
BS-1 Corrosion spots at 4 days. Corrosion in interstices at 7 days. Localized areas of uniform corrosion after 18 days. Gradual increase in corrosion to form a heavy, uniform corrosion that covered 100% of the surface area at 26 days.
BS-2 Corrosion spots at 4 days. Corrosion in interstices at 7 days. Localized areas of uniform corrosion after 18 days. Gradual increase in corrosion to form a heavy, uniform corrosion that covered 100% of the surface area at 26 days.
BW Very light uniform corrosion along length of wires at 11 days. This corrosion gradually increased to a heavy, uniform corrosion that covered 100% of the surface area at 32 days.

209
Table B.2 - Summary of visual observations for unflushed strands exposed to ambient conditions and daily wetting cycle.
Specimen Observations
L1-UF Corrosion spots at 39 days that gradually increased to cover 15% of the surface area at 46 days. During testing the top surface of the strand was darker than the other lubricated specimens and the bottom surface was light brown in color.
L1-UF (Separate Exposure Test)
Strand was light brown in interstices at 38 days. Corrosion spots at 64 days that gradually increased to cover 15% of the surface area at 68 days.
L2-UF Corrosion in interstices at 35 days. Corrosion spots at 39 days. Both the corrosion spots and interstitial corrosion gradually increased to form a light-moderate, uniform corrosion that covered 50% of the surface area at 46 days.
L3-UF Corrosion spots appeared at 20 days, but did not change in size or number for the next 8 days. After 28 days additional corrosion spots and localized areas of light, uniform corrosion began to appear. The spots and uniform corrosion gradually increased to form a light-moderate, uniform corrosion that covered 60% of the surface area at 46 days.
L4-UF Corrosion spots appeared at 20 days, but did not change in size or number for the next 8 days. After 28 days additional corrosion spots and localized areas of light, uniform corrosion began to appear. The spots and uniform corrosion gradually increased to form a light-moderate, uniform corrosion that covered 50% of the surface area at 46 days.
L5-UF Three bright orange corrosion spots appeared at 20 days, but did not change in size or number for the next 8 days. After 28 days additional corrosion spots and localized corrosion in the interstices began to appear. The corrosion spots tended to be bright orange in

210
color and gradually increased to form a light-moderate, uniform corrosion that covered 50% of the surface area at 46 days.
L6-UF Corrosion spots appeared at 20 days, but did not change in size or number for the next 15 days. After 35 days additional corrosion spots appeared. These spots were bright orange in color and tended to be larger than corrosion spots on other lubricated strands. The corrosion spots gradually increased to form a light-moderate, uniform corrosion that covered 35% of the surface area at 46 days.
L7-UF Corrosion spots at 20 days. Rapid increase in corrosion over next 23 days. During this time additional corrosion spots and areas of localized uniform corrosion appeared. The corrosion spots and uniform corrosion rapidly increased to form a moderate-heavy uniform corrosion covering 100% of the surface area at 35 days. This corrosion increased to a heavy, uniform corrosion covering the entire surface are at 43 days.
L8-UF Corrosion spots at 20 days. Noticeable increase in number of corrosion spots over next 23 days. These spots rapidly increased to form a heavy, uniform corrosion that covered 100% of the surface area at 43 days.
L9-UF Corrosion spots at 39 days. Strand had dark, oily appearance. Corrosion spots gradually increased to cover 15% of the surface area at 46 days.
L10-UF White, flaky film at 2 days. Corrosion spots at 20 days. Rapid increase in corrosion over next 26 days. During this time additional corrosion spots and localized areas of light uniform corrosion appeared. Both the corrosion spots and uniform corrosion rapidly increased to form a light, uniform corrosion that covered 95% of the surface area at 46 days. At 46 days a white substance was also visible in the interstices of the strand.
L11-UF Corrosion spots appeared at 25 days, but did not change for another 23 days. After 48 days additional corrosion spots and areas of localized uniform corrosion appeared. The corrosion spots and uniform corrosion gradually increased to cover 40% of the surface area at 68 days.

211
Table B.3 - Summary of visual observations for flushed strands exposed to ambient conditions and daily wetting cycle.
Specimen Observations
L1-F Corrosion spots at 4 days that gradually increased to form a moderate-heavy, uniform corrosion that covered 100% of the surface area at 26 days.
L1-F (Separate Exposure Test)
Corrosion spots at 7 days that gradually increased to form a heavy, uniform corrosion that covered 100% of the surface area at 26 days.
L2-F Corrosion spots at 4 days that gradually increased to form a moderate-heavy, uniform corrosion that covered 100% of the surface area at 26 days.
L3-F Corrosion spots at 4 days that gradually increased to form a moderate-heavy, uniform corrosion that covered 100% of the surface area at 26 days.
L4-F Corrosion spots at 4 days that gradually increased to form a moderate-heavy, uniform corrosion that covered 100% of the surface area at 26 days.
L5-F Corrosion spots at 4 days that gradually increased to form a moderate-heavy, uniform corrosion that covered 100% of the surface area at 26 days.
L6-F Corrosion spots at 4 days that gradually increased to form a moderate-heavy, uniform corrosion that covered 100% of the surface area at 26 days.
L7-F Corrosion spots at 4 days that gradually increased to form a moderate-heavy, uniform corrosion that covered 100% of the surface area at 26 days.
L8-F Corrosion spots at 4 days that gradually increased to form a moderate-heavy, uniform corrosion that covered 100% of the surface

212
area at 26 days.
L9-F Corrosion spots at 4 days that gradually increased to form a moderate-heavy, uniform corrosion that covered 100% of the surface area at 26 days.
L10-F White substance in interstices at 7 days. White, flaky film covering strand at 14 days. Corrosion spots at 20 days that gradually increased to form a light, uniform corrosion that covered 90% of the surface area at 46 days.
L11-F Corrosion spots at 7 days that gradually increased to form a heavy, uniform corrosion that covered 100% of the surface area at 68 days.

213
Table B.4 - Summary of visual observations for unflushed wires exposed to ambient conditions and daily wetting cycle.
Specimen Observations
L1-UFW Corrosion spots on three of four wires at 18 days. Increase in corrosion spots to form a heavy, uniform corrosion that covered 100% of all four wires at 32 days.
L1-UFW (Separate Exposure Test)
Corrosion spots on one wire at 2 days. Other wires were corrosion free at 2 days. Light, uniform corrosion at third points of wires at 12 days increasing to heavy, uniform corrosion covering 100% of all four wires at 33 days.
L2-UFW Corrosion spots at mid-length on bottom of wires at 14 days. Uniform corrosion along middle third of wires at 18 days increasing to a heavy, uniform corrosion covering 100% of all four wires at 32 days.
L3-UFW Corrosion spots at mid-length on bottom and along top of wires at 14 days. Uniform corrosion along middle third of wires at 18 days increasing to heavy, uniform corrosion covering 100% of all four wires at 32 days.
L4-UFW Corrosion spots on bottom and third points of wires at 18 days. Uniform corrosion at third points at 20 days increasing to heavy, uniform corrosion covering 100% of all four wires at 32 days.
L5-UFW Corrosion spots at mid-length on bottom and along top of wires at 14 days. Uniform corrosion along middle third of wires at 18 days increasing to heavy, uniform corrosion covering 100% of all four wires at 32 days.
L6-UFW Corrosion spots along length of wires at 18 days. Uniform corrosion at third points at 20 days gradually increasing to heavy uniform corrosion covering 100% of all four wires at 32 days.
L7-UFW Corrosion spots at mid-length on bottom of wires and along top of wires at 14 days. Uniform corrosion along middle third of wires at

214
18 days increasing to heavy uniform corrosion covering 100% of all four wires at 32 days.
L8-UFW Corrosion spots at mid-length on bottom and along tops of wires at 14 days. Uniform corrosion along middle third of wires at 18 days increasing to heavy, uniform corrosion covering 100% of all four wires at 32 days.
L9-UFW Corrosion spots along length of wires at 39 days. Wires are dirty black color. No noticeable increase in corrosion spots at 46 days.
L10-UFW Flaky, white film covering wires at two days. Corrosion spots at 11 days. Uniform corrosion along middle third of wires at 18 days increasing to heavy, uniform corrosion covering 100% of all four wires at 32 days.
L11-UFW Corrosion spots on all four wires at 2 days. Light, uniform corrosion covering approximately 70% of surface areas at 12 days increasing to heavy, uniform corrosion covering 100% of all four wires at 33 days.

REFERENCES
1. Podolny, W., and Muller, J., Construction and Design of Prestressed Concrete
Segmental Bridges, John Wiley and Son's, Inc., 1982.
2. Freyermuth, C., "Building Better Bridges: Concrete vs. Steel," Civil Engineering,
American Society of Civil Engineers, July 1992, pp. 66-71.
3. Breen, J., "Prestressed Concrete: The State of the Art in North America," Journal
of Prestressed Concrete Institute, Vol. 35, No. 6, November/December 1990, pp 62-67.
4. Swait, W., and Funashi, M., "Corrosion Protection Systems for Bridge Stay Cables
and Anchorages Volume 1: Final Report," Report No. FHWA/RD-91/050, May 1991,
Federal Highway Administration, Washington D.C., 163 p.
5. Cooley, E., "Friction in Posttensioned Prestressing Systems," and "Estimation of
Friction in Prestressed Concrete," Cement and Concrete Association, London, 1953.
6. Lin, T., "Cable Friction in Posttensioning," Journal of the Structural Division,
American Society of Civil Engineers, November 1956.
7. Federation Internationale de la Precontrainte, "Corrosion Protection of Prestressing
Steels," Joint Working Group on Corrosion Protection of Prestressing Steels, August
1990.
8. McCrossen, Robert, Florida Wire and Cable. Phone interview. 9 July 1992.

217
9. "Prestressed Concrete - Friction Losses During Stressing," Construction Industry
Research and Information Association. Report 74. 1978. 53 pp. (Summaries of
results from studies completed by A. Owens, D. Moore, and H. Taylor)
10. Novak, Charles, Viscosity Oil Company. Phone interview. 9 July 1992.
11. "Role of Cutting Fluids," Special Technical Publication, Texaco Library of
Technical Aids for Industry. December 31, 1971.
12. Moore, D., Klodt, D., and Henson, R., "Protection of Steel in Prestressed
Concrete Bridges." National Cooperative Research Program - Report 90 (1970) 86 pp.
13. Kelley, Marion, Tracor Inc. Phone interview. 7 July 1992.
14. Wagner, John, Shell Oil Company. Phone interview. 7 July 1992.
15. Perenchio, W., Franszok, J., and Pfeifer, D., "Corrosion Protection of Prestressing
Systems in Concrete Bridges." National Cooperative Highway Research Program -
Report 313 (1989) 25 pp.
16. Cork, H., "Coating Treatment for Reinforcing Steel," Concrete, January 1977, pp
31-33.
17. Vedalakshmi, R., Rengaswamy, N., and Baludriwshnan, K., "Temporary
Protection of Prestressing Steels Lying in Cable Ducts," Transactions of the SAEST,

218
Vol. 23, No. 2-3, 1988, pp 257-262.
18. Bezouska, T., "Friction Loss in Post-tensioned Prestressing Steel Units,"
California Department of Transportation. Report SSR 3-66. 34 pp.
19. "Methods for Reducing Friction in Post-tensioning Tendons," Field Test Results.
Dywidag Systems International. February 1988. 13 pp.
20. Tran, T. Current research at The University of Texas at Austin. To be published
in Master's thesis.
21. Fontana, M., Corrosion Engineering, McGraw-Hill, 1986.
22. Smit, Jim, Viscosity Oil Company. Phone interview. 9 June 1992.
23. Monthly summary of local climatological data. National Oceanic and
Atmospheric Administration. July through October 1991.
24. Lin, T., and Burns, N., Design of Prestressed Concrete Structures, John Wiley
and Son's, Inc., 1981.
25. Dunford, R., "Decisions, Decisions," Industrial Research, July 1974, pp 27-30.
26. Material Safety Data Sheet, Sodium silicate "N", PQ Corporation, 1991.
27. Hollander, J., Union 76. Phone interview. 5 February 1992.