evaluation of fiber optic technology for advanced reactor
TRANSCRIPT

Evaluation of Fiber Optic Technology for Advanced Reactor Instrumentation
Undergraduate Honors Thesis
Presented in Partial Fulfillment of the Requirements for
Graduation with Distinction
at The Ohio State University
By
John P. Hanson
* * * * *
The Ohio State University
2010
Defense Committee:
Professor Thomas Blue, Advisor
Professor Don Miller
Approved by
Advisor
Undergraduate Program in Mechanical Engineering

ii
Copyrighted by
John P. Hanson
2010

ii
ABSTRACT
The harsh, high temperature, high radiation environment of next generation nuclear
reactors will require new sensor technology to accurately monitor their operating conditions, and
one potential technology for such sensors is that of fiber optics. Previous work has shown that
fiber optics have promising ability to withstand these harsh conditions, in particular single-
crystal sapphire fibers, which can withstand much higher temperatures than traditional silica
fibers. However, they have not been extensively tested in a combined high temperature, high
radiation environment, and the competing effects of radiation damage and annealing within both
types of fiber are not well understood. It has been hypothesized that in these conditions
sapphire-based fiber optic sensors will provide survivability superior to silica-based fibers, and
numerous advantages over traditional electrical sensors. The goal of this project was to design a
furnace needed to test this hypothesis, as well as gain preliminary data on the survivability of
silica-based fibers. A furnace was designed to be operated inside a dry tube experimental facility
at the OSU Research Reactor, allowing simultaneous irradiation and heating of the fibers while
monitoring them in situ. A prototype was constructed of this design for preliminary testing,
providing experience with the construction and instrumentation of the device. This experience
has also helped to validate the feasibility of the furnace design. In addition, the prototype has
been used to gather valuable data on the effects of temperature on silica-based fibers, providing a
baseline of comparison for future sapphire fiber testing. As expected, this testing has confirmed
the limitations of silica-fibers at high temperatures, and the need to analyze more robust
iii
solutions such as sapphire based fibers. Due to the initial success of the prototype, the
construction of the new furnace will soon proceed, enabling future studies of sapphire based
fibers.

iv
ACKNOWLEDGMENTS
I would like to thank many people for their help with this project. Dr. Thomas Blue and
Dr. Don Miller have provided outstanding guidance over the past few years as I became
acquainted with their research lab, and finally got involved in this particular project. Dr. Blue
has been supportive of my growth as both a student and a researcher since I joined the lab, and
has been more than patient as I continued to try to find a balance between these two pursuits.
David Hawn deserves credit for helping me at nearly every turn along the way, being both
instrumental in helping me with my work on this specific project, and in helping me to become a
better researcher during my time in the lab. He has been a great mentor as well as friend. I also
could not have done this project without the love and support of my parents, Marianne and Peter
Hanson, my friends, and especially my girlfriend Lindsey Pack, who has been the encouraging
voice that has kept me going throughout.

v
TABLE OF CONTENTS
ABSTRACT ........................................................................................................................ ii
ACKNOWLEDGMENTS ................................................................................................. iv
TABLE OF CONTENTS .................................................................................................... v
LIST OF FIGURES .......................................................................................................... vii
Chapter 1: INTRODUCTION............................................................................................. 2
1.1 Introduction............................................................................................................. 2
Chapter 2: Background ....................................................................................................... 5
2.1 Fiber Optic Sensors................................................................................................. 5 2.1.1 External Fabry Perot Interferometeric Sensors .................................................. 6 2.1.2 Fiber-Bragg Gratings ....................................................................................... 14
2.2 Effects of Heating Fiber........................................................................................ 17 2.3 Summary ............................................................................................................... 22
Chapter 3: Methods ........................................................................................................... 24
3.1 High Temperature Furnace Design ....................................................................... 24 3.1.1 Sapphire Fiber Specification ............................................................................ 25 3.1.2 Heater Specifications ....................................................................................... 26 3.1.3 Heater Instrumentation ..................................................................................... 28 3.1.4 Furnace Structure ............................................................................................. 29 3.1.5 Control System ................................................................................................. 32
3.2 Furnace Prototype ................................................................................................. 32 3.2.1 Prototype Heater .............................................................................................. 33 3.2.2 Prototype Heater Controller ............................................................................. 33 3.2.3 Prototype Furnace Instrumentation .................................................................. 35 3.2.4 Prototype Furnace Structure ............................................................................ 41 3.2.5 Prototype Furnace Insulation ........................................................................... 41 3.2.6 Prototype Optical Equipment ........................................................................... 43 3.2.7 Prototype Fiber Connectors ............................................................................. 43
3.3 Silica Fiber Testing Procedures ............................................................................ 45 3.3.1 General Fiber Testing Procedures .................................................................... 45

vi
3.3.2 Repeating Previous Experiment by Toossi and Modarress ............................. 45 3.3.3 Prototype Testing at Increasing Temperatures................................................. 46
3.4 Summary ............................................................................................................... 47
Chapter 4: Results ............................................................................................................. 48
4.1 Prototype Furnace Silica Fiber Testing ................................................................ 48 4.1.1 Repeating Previous Experiment ....................................................................... 48 4.1.2 Higher Temperature Testing, With Connectors ............................................... 50
4.2 Physical Damage to Fibers ................................................................................... 53
Chapter 5: Analysis ........................................................................................................... 55
5.1 Optical Performance of Silica Fibers .................................................................... 55 5.1.1 Optical Testing ................................................................................................. 55 5.1.2 Lessons Learned from Optical Testing ............................................................ 60
5.2 Physical Performance of Silica Fibers .................................................................. 60 5.3 Summary ............................................................................................................... 61
Chapter 7: CONCLUSIONS AND FUTURE WORK ..................................................... 63
7.1 Conclusions .......................................................................................................... 63 7.2 Future Work .......................................................................................................... 63 7.2.1 Short Term ....................................................................................................... 63 7.2.2 Long Term ....................................................................................................... 64
Bibliography ..................................................................................................................... 65
Appendix ........................................................................................................................... 67
Appendix A: CAD Drawings of Initial Furnace Design ............................................................... 68
Appendix B: Ocean Optics LS-1 Manufacturer’s Specifications ................................................. 74
Appendix C: Ocean Optics USB 2000 Manufacturer’s Specifications ........................................ 75

vii
LIST OF FIGURES
Figure 1: Schematic of EFPI Sensor ............................................................................................... 6
Figure 2: Schematic of Alternative EFPI Sensor ............................................................................ 8
Figure 3: Illustration of Signal Fading in EFPI Sensors ................................................................. 9
Figure 4: Quadrature Phase Shifted EFPI Sensor Output ............................................................. 10
Figure 5: Interference Pattern for White Light Interferometry ..................................................... 12
Figure 6: Schematic of Data Acquisition System Using Fiber Pro 2 ........................................... 13
Figure 7: Calibration Curve for Luna EFPI Temperature Sensor ................................................. 14
Figure 8: Schematic of Fiber-Bragg Grating and Typical Spectral Response .............................. 16
Figure 9: High Temperature Effects in Aluminum Coated, Germanium Doped Fiber ................ 19
Figure 10: Properties of Fibers in Toossi and Modarress Experiment ......................................... 20
Figure 11: Effect of Temperature on Fiber Degradation, Toossi and Moddarress Experiment ... 21
Figure 12: Schematic of Tube Furnace from MHI ....................................................................... 27
Figure 13: Example Robust Radiator Heater from MHI .............................................................. 28
Figure 14: Initial CAD design for High Temperature Furnace ..................................................... 30
Figure 15: Digi-Sense Temperature Controller ............................................................................ 34
Figure 16: Omega Thermometer for Backup Thermocouple ....................................................... 35
Figure 17: Initial Attempt at Locating Thermocouples ................................................................ 36
Figure 18: Four Bore Ceramic Insulator ....................................................................................... 38
Figure 19: Attaching Ceramic Insulators to Steel All-thread ....................................................... 39

viii
Figure 20: Final Layout of Thermocouples in Prototype Design ................................................. 40
Figure 21: Ceramic Tiles Used as End-Caps for Prototype Heater .............................................. 42
Figure 22: Bullet Bare Fiber Adapter ........................................................................................... 44
Figure 23: Prototype Testing, 325 ºC ............................................................................................ 49
Figure 24: Prototype Testing, 325 ºC, Additional Wavelengths ................................................... 50
Figure 25: Prototype Testing, 750 ºC ............................................................................................ 51
Figure 26: Prototype Testing, 750 ºC, Additional Wavelengths ................................................... 52
Figure 27: Prototype Testing, 750 ºC Prolonged Test .................................................................. 53
Figure 28: Physical Damage to Fiber, Prototype Heater Testing at 750 °C ................................. 54
Figure 29: Physical Damage to Fiber, Prototype Heater Testing at 750 °C, Close-Up ................ 54
Figure 30: Introduction of Light from Secondary Source in Fibers ............................................. 58
Figure 31: Variation of Secondary Source Radiation Signal, Oikari Study ................................. 59

2
CHAPTER 1: INTRODUCTION
1.1 Introduction
As the development of Generation IV nuclear power plants continues, advanced
instrumentation will be an important focus area of research. Nuclear reactors present very
difficult instrumentation challenges, due to the high temperature, high radiation environment
faced by sensors during in-core operation, and advanced reactors will continue to push the limits
of available instrumentation technology. One technology in particular that has the potential to
greatly improve reactor instrumentation is that of fiber optics. Fiber optics present a variety of
favorable characteristics for such applications, including immunity to electromagnetic
interference that plagues electrical sensors, the wavelength-encoded nature of the signal, and
their small size and flexibility. The wavelength-encoded nature of the signal provides resistance
to signal drift due to darkening of the fiber, as the measurement depends on wavelength rather
than strength of the signal. These favorable characteristics, in addition to the wide variety of
different types of fiber optic sensors available, make fiber optic based instrumentation a strong
candidate for implementation in nuclear reactor environments.
Before this technology can be applied to reactor instrumentation, it is crucial that the
behavior of optical fibers in this harsh environment be well understood, as such instrumentation
would ideally be capable of surviving entire refueling cycles of 18 or more months. Silica
optical fibers have shown high potential for use in these environments, but they have not been

3
subjected to conditions as harsh as those that would be faced during extended in-core operation.
The fibers have been tested at high temperatures, approaching 1000°C, and in moderate radiation
environments, but they have not been tested under intense radiation at very high temperatures.
This issue is being addressed by current work in the lab of Dr. Thomas Blue, in which an
experiment is being designed to subject silica optical fibers to high temperatures and high
radiation at the Ohio State University Research Reactor. The goal is to model, as well as
measure, the performance of the fibers in this environment, and pave the way for future optical
sensors employing these fibers.
One of the biggest limitations on silica optical fibers is that they are typically unable to
operate at temperatures exceeding 900°C. This is due to their degraded mechanical strength, as
well as thermal diffusion of the dopant and re-crystallization of the glass. Single-crystal sapphire
optical fibers present a potentially higher performance alternative to silica fibers, with one major
advantage being a melting point of greater than 2000°C. In addition to their high melting point,
the fibers have a variety of other potential benefits, which include increased radiation resistance,
and a lack of dependence on cladding and coating, without which silica fibers become very
brittle and difficult to handle. Like silica fibers, single-crystal sapphire fibers have been tested to
their limits at high temperatures, and have been subjected to moderate radiation, but have not
been studied in a combined high temperature, high radiation environment that approaches the
harsh conditions they would face during in-core operation in a nuclear reactor. There is still
much to be learned about these fibers before they can be used in advanced instrumentation
applications in this setting, and the ability to test the fibers in such an environment is a necessary
first step in learning how they will behave.

4
In addition to designing an experiment to test these sapphire fibers, this project was
concerned with examining the effects of high temperature on silica fibers, as a first step towards
the completion of a larger study on these fibers. This was accomplished by constructing a
prototype of the sapphire furnace, with a design analogous to that of the sapphire furnace, using a
lower temperature heater and other equipment already available in the lab. This process not only
allowed important lessons to be learned prior to the construction of the higher temperature
heater, but it provided useful operating data that will serve as a baseline for future testing of
silica fibers in the lab. Next steps will be to construct two additional furnaces, one for silica fiber
testing, not discussed in this paper, and the other for higher temperature testing of sapphire
fibers, as described in the Methods section of this report. Both of these heaters will allow real-
time monitoring of fiber performance while operating at high temperature in a radiation
environment at the OSU Research Reactor.
5
CHAPTER 2: BACKGROUND
Fiber optic instrumentation presents a variety of potential advantages over current
instrumentation technologies. These advantages, including immunity to electrical noise and
magnetic fields, as well as the wavelength-encoded nature of the signal, are a direct result of the
unique characteristics of fiber optic cables and the creative application of these principles to
various types of sensor designs. By taking advantage of these characteristics, and the correct
types of fiber optic sensors, it is hoped that a new generation of reactor instrumentation, with
superior durability and other unique advantages, can be created. Rather than provide an
overview of light guides, fiber optics, and their properties in this Thesis, the reader is referred to
the literature such as An Introduction to Optical Fibers, by Cherin, for the necessary background
on the subject. An overview of fiber optic sensing technology, as well as the effects of heating
silica fibers to high temperatures, will be included here.
2.1 Fiber Optic Sensors
There are a variety of different fiber optic sensing technologies that have the potential to
be advantageous in nuclear reactor instrumentation. Two types of sensors in particular will be
considered here. Both share common characteristics that offer significant advantages over
traditional electrical sensors, while each operates on different principles. The first type of sensor
is known as the Extrinsic Fabry Perot Interferometric (EFPI) sensor, and it operates using optical
6
interferometry. The second, called the Fiber-Bragg Grating (FBG), operates on the principle of
photosensitivity.
2.1.1 External Fabry Perot Interferometeric Sensors
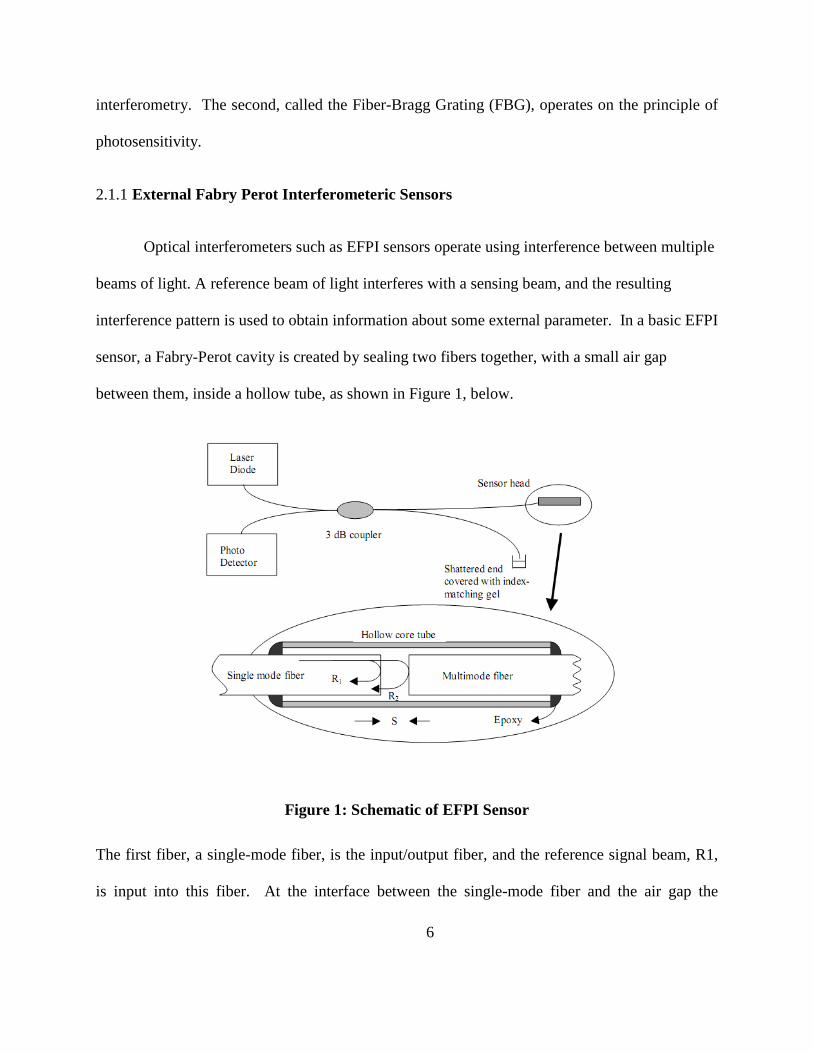
Optical interferometers such as EFPI sensors operate using interference between multiple
beams of light. A reference beam of light interferes with a sensing beam, and the resulting
interference pattern is used to obtain information about some external parameter. In a basic EFPI
sensor, a Fabry-Perot cavity is created by sealing two fibers together, with a small air gap
between them, inside a hollow tube, as shown in Figure 1, below.
Figure 1: Schematic of EFPI Sensor
The first fiber, a single-mode fiber, is the input/output fiber, and the reference signal beam, R1,
is input into this fiber. At the interface between the single-mode fiber and the air gap the
7
reference beam is partially reflected back down the single-mode fiber. The remainder of the
beam, R2, reflects off of the second fiber, a multi-mode fiber, and returns down the single-mode
fiber as well. This beam interferes with the reference beam, creating an interference pattern
which is dependent on the path length difference between the two. This interference pattern can
be measured using a photo detector, and changes in the pattern can be used to determine changes
in the length of the air gap between the two fibers. These changes can then be related to external
variables such as pressure, temperature, or strain, which all predictably alter the length of the air
gap, thus allowing the sensor to be used to measure these variables.
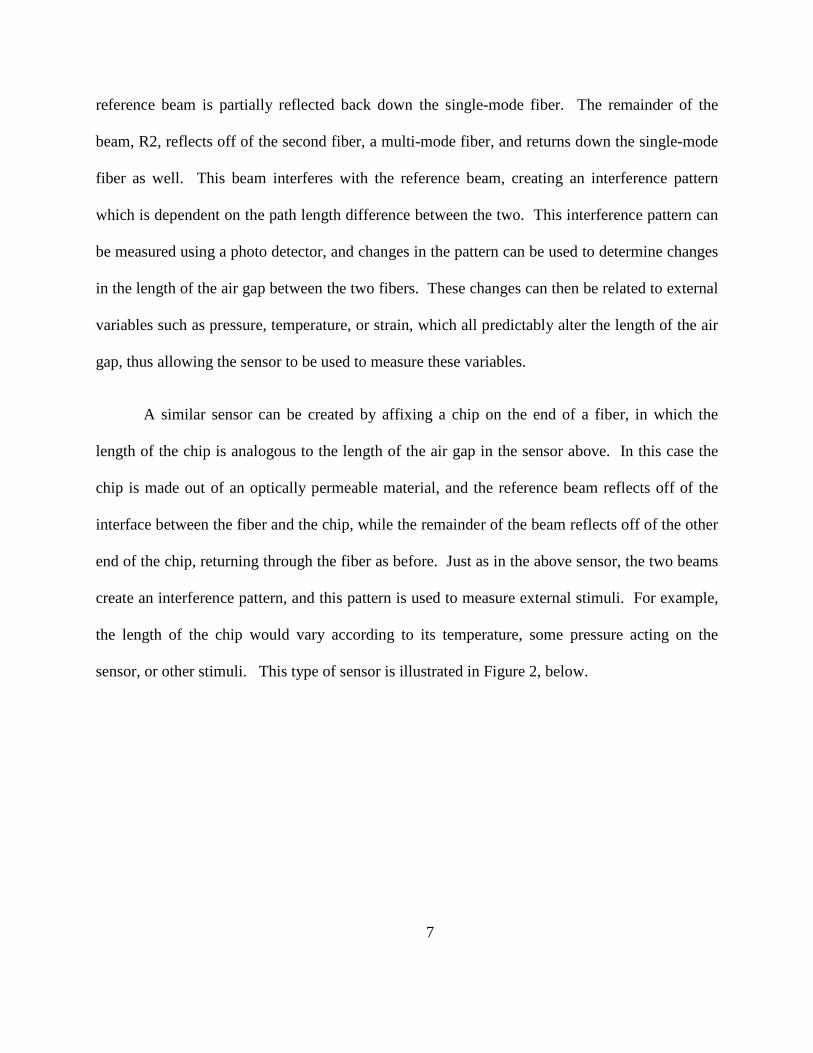
A similar sensor can be created by affixing a chip on the end of a fiber, in which the
length of the chip is analogous to the length of the air gap in the sensor above. In this case the
chip is made out of an optically permeable material, and the reference beam reflects off of the
interface between the fiber and the chip, while the remainder of the beam reflects off of the other
end of the chip, returning through the fiber as before. Just as in the above sensor, the two beams
create an interference pattern, and this pattern is used to measure external stimuli. For example,
the length of the chip would vary according to its temperature, some pressure acting on the
sensor, or other stimuli. This type of sensor is illustrated in Figure 2, below.

8
Figure 2: Schematic of Alternative EFPI Sensor
Both types of EFPI sensors operate on the same optical principles, and are interrogated
using the same methods. There are a variety of different means of interrogating the sensors, each
with its own advantages and disadvantages. The most basic method uses a single wavelength
laser. This method requires the most basic equipment, but it is plagued by difficulties with
‘signal fading,’ due to the nature of the output signal. The output of the EFPI sensors varies
sinusoidally with changes in the length of the air gap, resulting in maximums and minimums in
the sensitivity of the device. As shown in Figure 3, below, the result is that an external
perturbation causing a change in gap length of ΔL will cause changes in the output of very
different magnitude depending on the operating point of the sensor. The signal is said to ‘fade’
as the sensitivity decreases at the minimum and maximum output.

9
Figure 3: Illustration of Signal Fading in EFPI Sensors
Comparing the magnitudes of ∆I 1 and ∆I2 one can see the difficulty in using these sensors when
the operating point is located on an insensitive range. In addition, as the periodic nature of the
output suggests, interrogating the sensors in this way can only give a relative gap length, as the
output signal will be equivalent for a gap length of L and a gap length of L+λ. The result is that
only relative changes in the gap length can be detected, and the sensor has a limited range over
which it can operate.
There are a variety of alternative means of utilizing EFPI sensors that help to mitigate the
effects of signal fading, and even a method that can be used to determine the absolute gap length
rather than simply a relative gap length. The first is called Quadrature Phase Shifted
demodulation. Here two different sensors are used, and their outputs are intentionally set 90° out
of phase. The resulting outputs are shown in Figure 4, below, for comparison to the base case, in
Figure 3 above.

10
Figure 4: Quadrature Phase Shifted EFPI Sensor Output
This system guarantees that when one sensor is operating in a range of low sensitivity, the other
is operating at high sensitivity. The advantage is that much more accurate measurements can be
made using the QPS system. The increased accuracy comes at a cost of complexity, however, as
the sensors must be much more carefully fabricated, complex signal processing is involved, and
there is some difficulty to maintaining the 90° offset through repeated measurements. In
addition, this method does not yet solve the issue of relative vs. absolute gap length, and the
operating range is still limited as a result.
Another method for measuring the change in air gap length is to use a single sensor, with
two wavelengths of light. This method, known as the Dual Wavelength method, allows the
straightforward calculation of the relative gap length. Equations 1.1-1.2, below, are used to
calculate the change in output signal phase for each wavelength, λ, where L is the length of the
air gap.
λ λ/2
3λ/2 2λ

11
(1.1)
(1.2)
The relative phase difference between the two signals is calculated using Equation 1.3, below.
(1.3)
The advantage of this approach is that it requires less complexity than the QPS approach. The
disadvantage, similar to the above methods, is that the dynamic range of the sensor is limited to
radians.
Perhaps the most effective method for interrogating these sensors is the use of White
Light Interferometry. This method has many advantages over laser-based sensors, including
higher accuracy, higher resolution, a larger dynamic measurement range, and immunity to
optical power fluctuations (Han). In this method, the sensor is illuminated using a broadband
LED light source rather than lasers of specific wavelengths, and the output is analyzed using an
optical spectrum analyzer. There are a variety of possible signal demodulation methods, and
Han explains some of the pros and cons of these methods. The basic principle, however, is that
for any wavelength at which the reference and sensing beam exhibit a phase difference of 2π, the
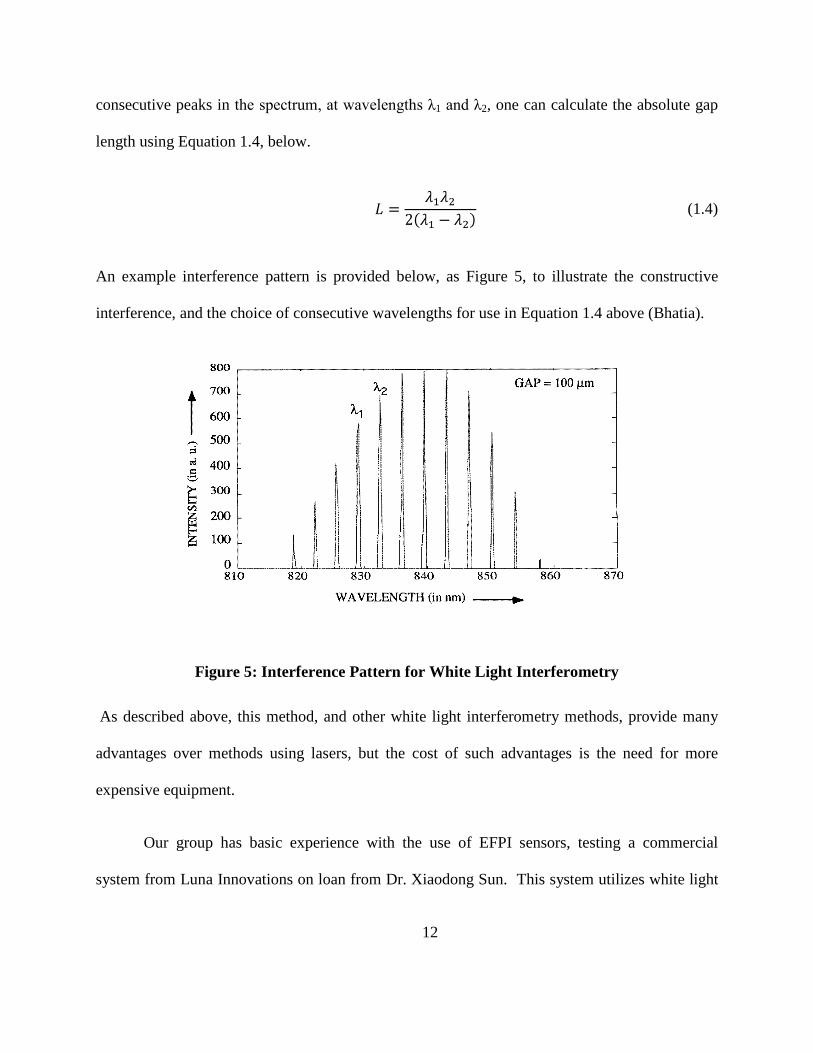
beams interfere constructively, and show up as a peak in the output spectrum. By finding two
12
consecutive peaks in the spectrum, at wavelengths λ1 and λ2, one can calculate the absolute gap
length using Equation 1.4, below.
(1.4)
An example interference pattern is provided below, as Figure 5, to illustrate the constructive
interference, and the choice of consecutive wavelengths for use in Equation 1.4 above (Bhatia).
Figure 5: Interference Pattern for White Light Interferometry
As described above, this method, and other white light interferometry methods, provide many
advantages over methods using lasers, but the cost of such advantages is the need for more
expensive equipment.
Our group has basic experience with the use of EFPI sensors, testing a commercial
system from Luna Innovations on loan from Dr. Xiaodong Sun. This system utilizes white light
13
interferometry, and can be used with any EFPI sensors, but our testing was done on the second
type of sensor described above, those with a sensor chip attached to the end of a fiber. The
system, called the Fiber Pro 2, is a self-contained broadband LED source, spectrum analyzer, and
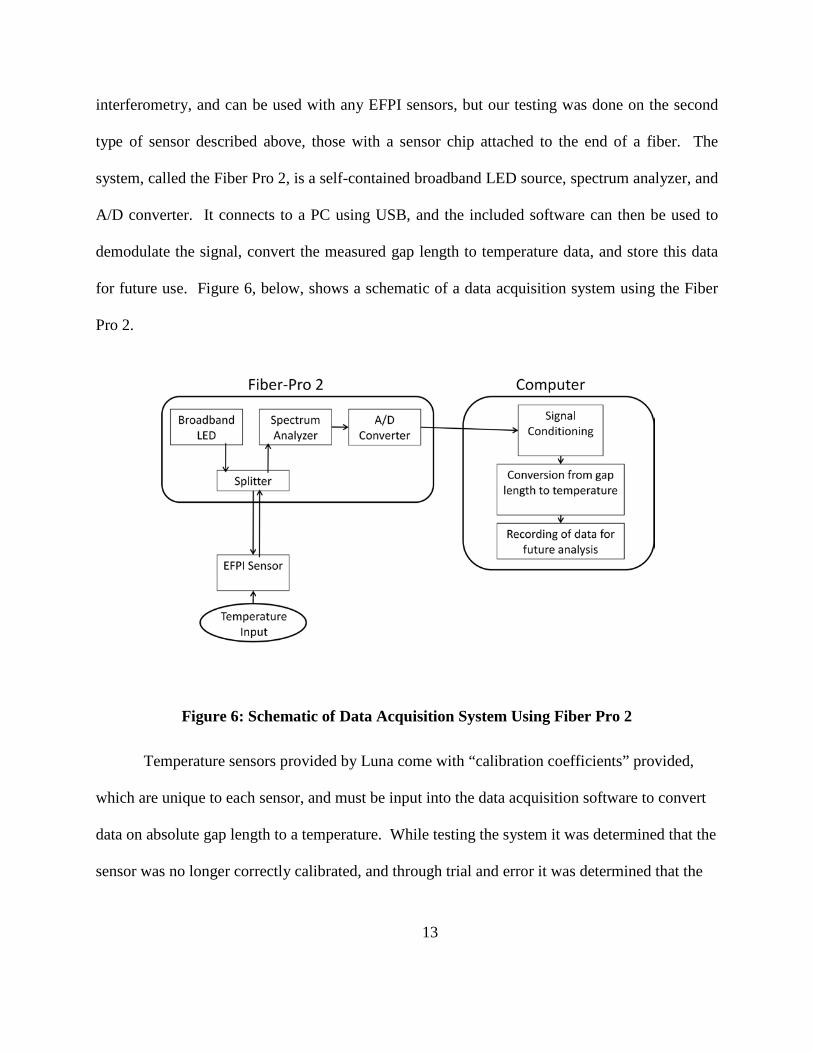
A/D converter. It connects to a PC using USB, and the included software can then be used to
demodulate the signal, convert the measured gap length to temperature data, and store this data
for future use. Figure 6, below, shows a schematic of a data acquisition system using the Fiber
Pro 2.
Figure 6: Schematic of Data Acquisition System Using Fiber Pro 2
Temperature sensors provided by Luna come with “calibration coefficients” provided,
which are unique to each sensor, and must be input into the data acquisition software to convert
data on absolute gap length to a temperature. While testing the system it was determined that the
sensor was no longer correctly calibrated, and through trial and error it was determined that the

14
calibration coefficients were simply the coefficients of a third-order polynomial curve fit to the
temperature vs. absolute gap length data. With this knowledge we were able to manually
calibrate the sensor using an oven to heat the sensor, and a simple type K thermocouple of
known accuracy to measure the temperature. The resulting curve fit is shown in Figure 7 below.
Though the calibration is not accurate to more than a few degrees, this allowed us to gain insight
into the calibration process, and made the sensor usable again, as the previous calibration
suffered from a large enough error as to make the temperature sensor unusable.
Figure 7: Calibration Curve for Luna EFPI Temperature Sensor
2.1.2 Fiber-Bragg Gratings
Another type of fiber-optic sensor that presents particularly valuable characteristics for
reactor instrumentation is called the Fiber-Bragg grating (FBG). This type of sensor was first
y = -20.66x2 + 3574.83x - 154050.63R² = 1.00
0
20
40
60
80
100
120
140
160
81.4 81.45 81.5 81.55 81.6 81.65 81.7 81.75 81.8
Tem
pera
ture
(deg
. Cel
cius
)
Gap Length (um)

15
made possible with the discovery of photosensitivity in 1978 at the Communication Research
Center in Canada (Othonos and Kalli). Photosensitivity refers to a permanent change in the
index of refraction of the fiber core when exposed to light with a characteristic wavelength and
intensity. The appropriate wavelength and intensity is specific to the type of fiber being used,
and it has been found that many types of fibers exhibit photosensitivity. Initially these index of
refraction changes were created using laser light launched into the core, but later it was
discovered that they could be etched into the fiber from the side, using UV light. Fibers are
irradiated using a periodic pattern created by two 244-nm beams, which results in a periodic
change in the index of refraction within the core (Othonos and Kalli). The period can be altered
by changing the angle between the beams, and this periodic change in the index of refraction is
the key to FBG sensors.
Rather than measuring the length of a sensor chip, or an air gap outside the fiber, as with
EFPI sensors, FBG sensors are etched directly into the fiber as described above. They consist of
a periodic change in the index of refraction of the fiber, and operate by reflecting a specific
wavelength of light, known as the Bragg wavelength, determined by the period of the grating.
Figure 8, below, shows a basic representation of an FBG, and the way it reflects a particular
wavelength of light, while transmitting the rest (Othonos and Kalli).

16
Figure 8: Schematic of Fiber-Bragg Grating and Typical Spectral Response
As the fiber is heated, or strained, the period of the grating changes, resulting in a change in the
reflected wavelength. In this way, the grating can be used as a sensor for a variety of external
stimuli. Though the stimulus that is being measured is very similar to that in the case of the
EFPI sensors, the way in which it is measured is very different. Instead of attempting to
determine the amount that the air gap, or chip, has changed in length by using interference
patterns, one need only monitor the reflected wavelength of the FBG to interrogate the sensor.
In addition, FBG sensors provide a variety of other advantages over other types of fiber
optic sensing technologies. One advantage is that etching the sensors directly into the fibers
eliminates the need for additional fiber optic components, thereby decreasing the size and
complexity of the system. Another advantage, which is particularly important to applications in
reactor instrumentation, is the ability to multiplex the sensors, and create a quasi-distributed
sensor network using FBG’s. There are a variety of techniques that can be used to multiplex the

17
sensors that allow multiple measurements to be taken along the same fiber. The first and most
easily implemented technique is called Wavelength Division Multiplexing (WDM). In WDM
each sensor is encoded with its own Bragg wavelength, such that multiple FBGs can be
interrogated on the same fiber. This technique is limited by the usable range of wavelengths
within a fiber, and by the temperature dependence of the Bragg wavelength. For example, if a
fiber has a usable range of just 100 nm in which FBG sensors can be created, and the Bragg
wavelength of a specific grating can shift over a range of 10 nm, this technique can result in a
maximum of ten gratings per fiber. To maximize the number of FBG sensors on a single fiber,
an additional technique, Time Division Multiplexing (TDM) can be used in conjunction with
WDM. In TDM, sensors are interrogated based on timing, and in this way multiple sensors with
the same Bragg wavelength can be distinguished on one fiber, multiplying the number of sensors
possible using WDM. Due to the nature of TDM, each FBG must be only partially reflective, so
that some fraction of the light at each wavelength continues to the next sensor. These
multiplexing techniques can be used in conjunction with a branching system in which multiple
fibers are used, with the end result being a great many distinct measurements being taken with a
relatively compact and unobtrusive system.
2.2 Effects of Heating Fiber
The primary motivation for testing single-crystal sapphire fibers as opposed to silica
fibers is the significantly increased temperature range of these fibers. Silica fibers simply cannot
withstand temperatures greater than 1000 ºC, and in many aspects cannot survive at temperatures
nearly this high. The primary negative effect of high temperatures on silica fibers is the

18
destruction of the fiber coating, or the protective outside layer, as described in the above section.
In fibers typically used for telecom applications the coating is limited to about 180 ºC, while high
temperature polyimide coatings can survive temperatures of about 385 ºC (Wang, Zhu and
Pickerell). The destruction of the coating does not necessarily have a negative effect on the
optical properties of the fiber, but leaves the fibers brittle and weak. Higher temperatures can be
achieved using various metallic coatings, such as gold or aluminum. For example, Shiota and
Hidaka show that an aluminum coating allows fibers to maintain their mechanical strength even
at high temperatures, and using a germanium-doped fiber they are able to produce very good
optical properties at temperatures up to 650 ºC (Shiota and Hidaka). Figure 9, below, shows the
spectral loss change in these fibers from 25 ºC to 650 ºC. It is interesting to note that the process
of coating the fibers in aluminum induces stresses in the fiber known as microbending, which
actually decrease with temperature, resulting in high losses below 100 ºC, and much-improved
properties at higher temperature.

19
Figure 9: High Temperature Effects in Aluminum Coated, Germanium Doped Fiber
Also of note in Figure 9 is the absorption peak that occurs at around 0.95 µm. Although
the ability of the coating to withstand higher temperatures offers a greater operating range of the
fibers, they are still limited by optical losses caused by three main components. The first is the
thermal diffusion of waveguide-defining dopants in the fiber, the second is crystallization of the
glass, and the final factor is the softening of the glass under stress (Wang, Zhu and Pickerell). In
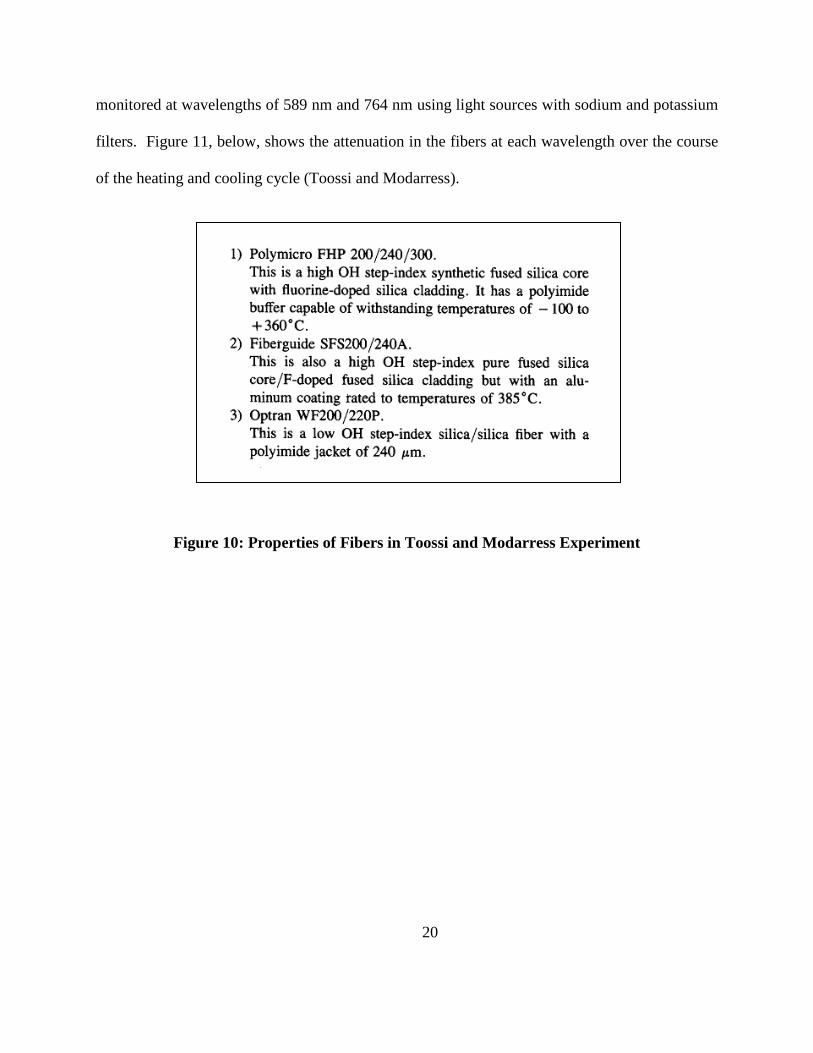
this case, the absorption peak is from the thermal diffusion of OH. Another study, by Toossi and
Modarress, shows the effect of temperature on three different fluorine-doped silica fibers. Figure
10, below, provides the properties of each of these fibers, which were heated to 320 ºC, and
20
monitored at wavelengths of 589 nm and 764 nm using light sources with sodium and potassium
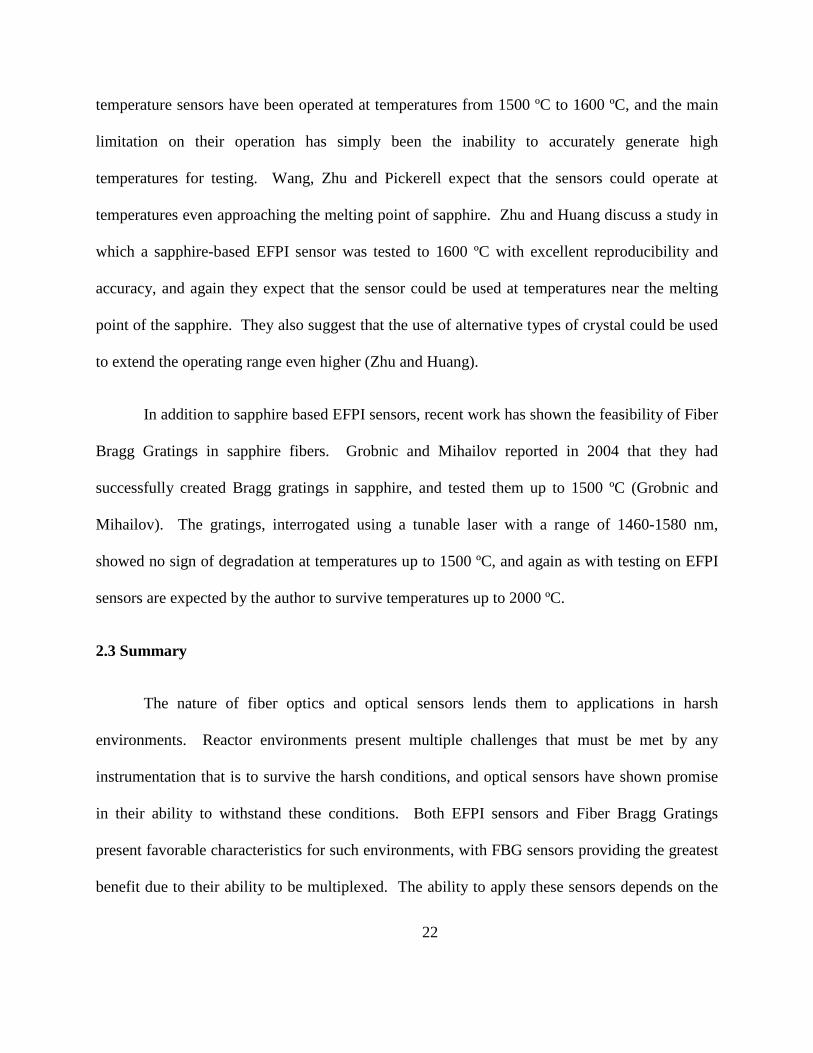
filters. Figure 11, below, shows the attenuation in the fibers at each wavelength over the course
of the heating and cooling cycle (Toossi and Modarress).
Figure 10: Properties of Fibers in Toossi and Modarress Experiment

21
Figure 11: Effect of Temperature on Fiber Degradation, Toossi and Moddarress Experiment
In this experiment the temperature effects on the fibers are significant, with large losses above
around 200 ºC. The authors do not have a complete explanation of this effect, attributing it to the
possibility of jacket or cladding damage. Later in this report an attempt will be made to recreate
this experiment, and understand the effects of temperature on silica fibers.
Due to the three factors mentioned above, the upper limit on the use of silica fibers is
approximately 900 ºC (Wang, Zhu and Pickerell). This limitation results in the need for another
material for higher temperature applications, and sapphire fibers, with a melting point of greater
than 2000 ºC presents great promise in filling this need. In various studies, sapphire fiber based
22
temperature sensors have been operated at temperatures from 1500 ºC to 1600 ºC, and the main
limitation on their operation has simply been the inability to accurately generate high
temperatures for testing. Wang, Zhu and Pickerell expect that the sensors could operate at
temperatures even approaching the melting point of sapphire. Zhu and Huang discuss a study in
which a sapphire-based EFPI sensor was tested to 1600 ºC with excellent reproducibility and
accuracy, and again they expect that the sensor could be used at temperatures near the melting
point of the sapphire. They also suggest that the use of alternative types of crystal could be used
to extend the operating range even higher (Zhu and Huang).
In addition to sapphire based EFPI sensors, recent work has shown the feasibility of Fiber
Bragg Gratings in sapphire fibers. Grobnic and Mihailov reported in 2004 that they had
successfully created Bragg gratings in sapphire, and tested them up to 1500 ºC (Grobnic and
Mihailov). The gratings, interrogated using a tunable laser with a range of 1460-1580 nm,
showed no sign of degradation at temperatures up to 1500 ºC, and again as with testing on EFPI
sensors are expected by the author to survive temperatures up to 2000 ºC.
2.3 Summary
The nature of fiber optics and optical sensors lends them to applications in harsh
environments. Reactor environments present multiple challenges that must be met by any
instrumentation that is to survive the harsh conditions, and optical sensors have shown promise
in their ability to withstand these conditions. Both EFPI sensors and Fiber Bragg Gratings
present favorable characteristics for such environments, with FBG sensors providing the greatest
benefit due to their ability to be multiplexed. The ability to apply these sensors depends on the

23
survivability of the fiber, and research has shown the ability of silica fibers to withstand
relatively high temperatures. However, this requires the use of specialized coatings to maintain
the mechanical strength of the fibers, and they are still vulnerable to crystallization of the fiber,
thermal diffusion of the dopant, and softening of the glass, which all contribute to losses in the
fiber at high temperatures. This effectively limits the operating range of silica fibers to 900 ºC.
For higher temperature applications, sapphire fibers have proven to be effective at temperatures
up to 1600 ºC, and are expected to perform at temperatures approaching their melting point,
greater than 2000 ºC.

24
CHAPTER 3: METHODS
3.1 High Temperature Furnace Design
The first priority of this project was to design a furnace capable of testing single-crystal
sapphire fibers in a nuclear reactor environment, and a significant amount of work was done to
overcome some of the key challenges to designing such a furnace. The furnace had a variety of
design constraints that needed to be satisfied. The first constraint was in the size and shape of
the furnace, as it had to fit in a seven inch dry tube at the OSURR, and be capable of
accommodating the sapphire fiber. The next constraint was that the furnace must reach internal
temperatures in excess of 1500°C, while limiting the external temperature such that the
surrounding water in the reactor pool stays safely below boiling temperature. The third
constraint was that the furnace materials must be compatible with the reactor, both in terms of
avoiding any significant change in reactivity, and limiting activation as much as possible. A
fourth constraint is that the entire furnace must be able to be easily raised and lowered into the
reactor, without risk of any part of the furnace, or fiber, breaking and remaining in the dry tube
upon removal of the device. Another key consideration is safety, and the furnace design requires
that the control system include multiple redundancies to ensure that the furnace is operated
within strict pre-defined conditions, and is shut down safely if any aberration occurs.

25
3.1.1 Sapphire Fiber Specification
As the entire design of the furnace depends on the fibers available for testing, the first
consideration in the design was to specify the single-crystal sapphire fibers that would be tested.
Commercial sapphire fibers, from MicroMaterials Inc., were available in-stock in lengths of 1 m,
with a diameter of 125 μm or 100 μm. Other custom sizes are available, as shown in Table 1,
below, but for this project fibers of 1 m in length, and 125 μm in diameter were chosen since
they were available in stock.
Table 1: Available Sapphire Fibers, MicroMaterials Inc.
Sapphire Fiber Selection Chart Diameter Max. Length
305 - 500 um 50 cm
205 - 300 um 100 cm
100 - 200 um 200 cm
75 - 95 um 100 cm
*100 um fibers with 100 cm length (SF100-100) and 125 um fibers with 100 cm length (SF125-100) are stock items.
In testing silica fibers, it is common to test much longer lengths of fiber. ASTM Standard E
1614-94 specifies that for testing of irradiation effects in fiber optic cables, lengths of 50 ± 5
meters should be used (ASTM). In the design of the silica-fiber furnace our lab has attempted to
accommodate this by designing a heater in which long fibers can be coiled many times. This
introduces the constraint of minimum bend radius of the fiber to the heater design. For 125 μm

26
sapphire fibers, the minimum physical bend radius is 2 cm. In addition to the physical bend
radius, it is important to consider limits placed on the bend radius due to optical properties of the
fiber. Optical losses are specified by the manufacturer as 3% for a 3 cm diameter loop in 100 μm
fibers. For the purposes of designing the high temperature furnace it was determined that
although the minimum bend radius of the fibers would allow multiple loops to be tested, much
like in the silica fiber furnace, other constraints on the design favored testing a single length of
fiber. Because the fiber is only 1 meter in length, any attempt to loop the fiber within the furnace
would gain minimal benefits at the cost of significant complexity. It is also possible that two
lengths of fiber could be tested, by threading the fiber through the furnace from top to bottom,
looping it around at the end, and threading it back through the furnace in the opposite direction.
This would increase the amount of fiber in the heated length of the furnace, as well as simplify
the setup needed to connect the sapphire fiber to the optical equipment via silica fibers.
3.1.2 Heater Specifications
The most important component of the furnace is the heater, as it is crucial to meeting
each of the design constraints listed above. The first constraint that must be addressed is the size
of the heater, and it depends primarily on two factors. The first is the diameter of the dry tube,
and the second is the orientation of the sapphire fibers. In addition, considerations must be made
for temperature, as the thickness of the insulation determines the ability to maintain the outside
temperature of the furnace at acceptable levels. As discussed above, it was decided that due to
the nature of the sapphire fibers available, it would be most logical to test a single length of fiber,
rather than attempting to increase the irradiated/heated length by looping the fiber within the

27
heater. This design decision led to the choice of a cylindrical tube heater, as such a heater would
accommodate a single length of fiber quite easily, and allow us to maximize the thickness of
insulation. Figure 12, below, is a schematic of the heater chosen (MHI).
Figure 12: Schematic of Tube Furnace from MHI
This type of heater was chosen because the decision to test a single length of fiber allowed us to
minimize the inner diameter, C, while choosing the maximum outer diameter, D, that would be
compatible with the size of the dry tube, thus maximizing the thickness of the insulation. The
final dimensions of this heater are 12” heated length, A, 15” overall length, B, 1” inner-diameter
C, and 6.5” outer diameter, D. Figure 13, below, shows an actual example of the heater. This
particular model, the Inline Robust Radiator, was chosen because the leads extend from the top
of the furnace, rather than the side, and this is the only option compatible with the geometry of
the experimental facility. The metal bands around the circumference of the heater will be

28
removed due to activation concerns, and the insulation will be held in place by the aluminum
structure discussed later in this section.
Figure 13: Example Robust Radiator Heater from MHI
3.1.3 Heater Instrumentation
Another important consideration in the design was the choice of instrumentation to
measure the temperature of the heater. It was determined that the most practical option would be
to use a thermocouple, and the appropriate thermocouple type for the needed temperature range
was a Type B thermocouple. Type B thermocouples use Platinum-Rhodium thermoelements,
one with 30% rhodium, and the other with 6% rhodium. These thermocouples are appropriate
for continuous use at temperatures between 870 and 1700°C, and under corresponding conditions

29
they show less grain growth and less drift in calibration than Types R and S thermocouples, also
of the platinum-rhodium type (ASTM International). The difficulty with the use of
thermocouples, or any other means of measuring temperature, is the inability for our lab to
calibrate such devices at the high range of temperatures they will be operating at. However, it
was decided that the thermocouple should be initially calibrated by the manufacturer, and the
relatively short operating time of the thermocouple, as compared to continuous usage in an
industrial setting, will likely allow it to remain accurate enough for our purposes. It is also much
cheaper to replace the thermocouple in the case that it does lose accuracy than to pay to have it
recalibrated, so this option seems to be the best for our initial trials. Laboratory testing once the
furnace has been constructed will help to reveal any problems with this strategy before
introducing the experiment to the nuclear reactor environment.
3.1.4 Furnace Structure
The next important consideration in the design of the furnace was the issue of containing
the heater, ceramic end caps, and other equipment in a structurally sound package that can be
easily lowered into and raised out of the dry tube at the OSURR, as well as set up on a lab bench
in Scott Lab for testing. Important considerations include the strength of the material chosen, but
also concerns with activation of the material. Issues with activation must be reduced by
choosing a balance between strength of the material and its propensity to activate, as well as by
reducing the overall amount of material introduced to the reactor, because even small proportions
of impurities within a material can make a sizable difference. The initial CAD drawings for the
design for the furnace can be seen in Figure 14, below.

30
Figure 14: Initial CAD design for High Temperature Furnace
Initially aluminum 6061 was chosen for the structural material, as it was believed to be
the best suited for balancing concerns about activation, and material strength. The light gray
cylinder is the heater itself, and the two end caps. The light blue material is all aluminum 6061,
with thin 1/4” circular plates at the top and bottom, connected by #10-24 aluminum all-threads.
The base, including a 18”x18”x3/8” base plate, with a 12”x12”x1/4” plate supported by 4 12”x1”
diameter legs were all constructed using aluminum 6061 as well, though these parts will not be
introduced to the reactor. This was determined to be an appropriate choice so that the base
materials can be repurposed for other experiments in the reactor once the base is no longer
31
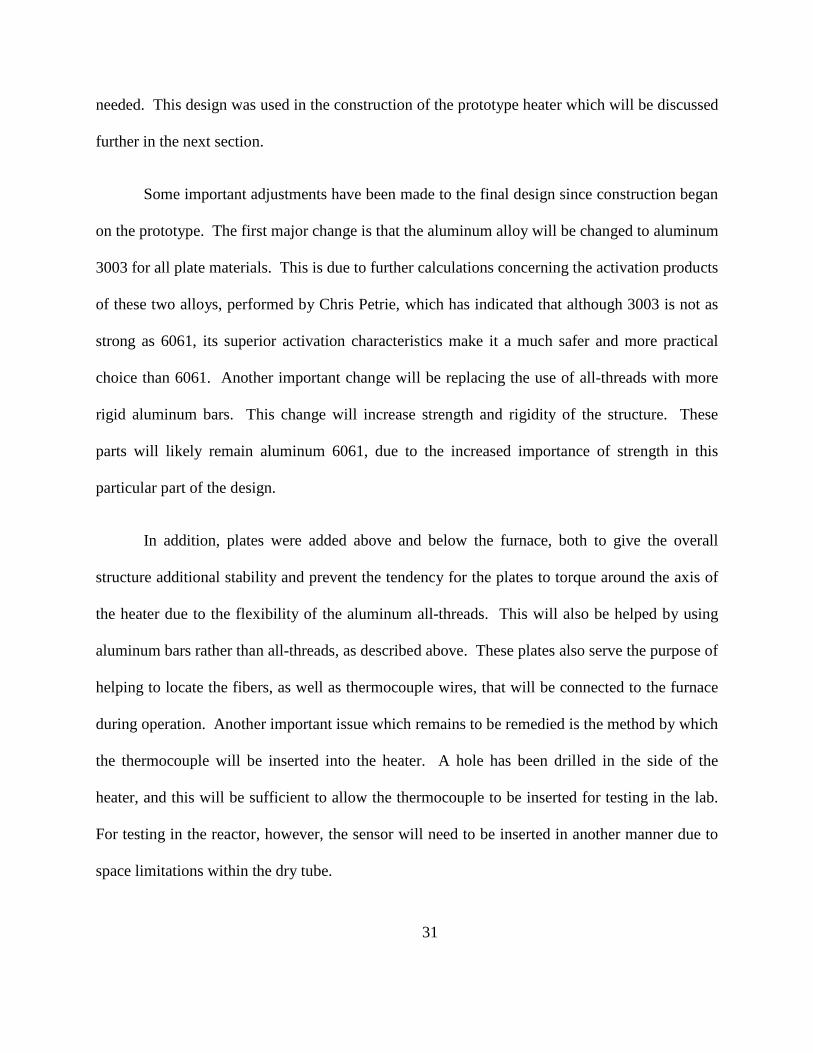
needed. This design was used in the construction of the prototype heater which will be discussed
further in the next section.
Some important adjustments have been made to the final design since construction began
on the prototype. The first major change is that the aluminum alloy will be changed to aluminum
3003 for all plate materials. This is due to further calculations concerning the activation products
of these two alloys, performed by Chris Petrie, which has indicated that although 3003 is not as
strong as 6061, its superior activation characteristics make it a much safer and more practical
choice than 6061. Another important change will be replacing the use of all-threads with more
rigid aluminum bars. This change will increase strength and rigidity of the structure. These
parts will likely remain aluminum 6061, due to the increased importance of strength in this
particular part of the design.
In addition, plates were added above and below the furnace, both to give the overall
structure additional stability and prevent the tendency for the plates to torque around the axis of
the heater due to the flexibility of the aluminum all-threads. This will also be helped by using
aluminum bars rather than all-threads, as described above. These plates also serve the purpose of
helping to locate the fibers, as well as thermocouple wires, that will be connected to the furnace
during operation. Another important issue which remains to be remedied is the method by which
the thermocouple will be inserted into the heater. A hole has been drilled in the side of the
heater, and this will be sufficient to allow the thermocouple to be inserted for testing in the lab.
For testing in the reactor, however, the sensor will need to be inserted in another manner due to
space limitations within the dry tube.
32
3.1.5 Control System
Further design challenges were presented by the need for a reliable control system, which
can safely shut down the experiment under any unusual conditions and avoid any dangerous
conditions during testing in the lab, and more importantly in the reactor. This was not of
particular concern to this project, as the control system that will be used for the high temperature
furnace will be shared with the lower temperature silica fiber testing furnace that is being
designed simultaneously by the lab. David Hawn has done extensive work on this part of the
project, and construction on the control system should begin by the end of this quarter, with
initial testing to follow soon after.
3.2 Furnace Prototype
Due to the nature of the high temperature furnace, both its high cost and long planning
period, it was prudent to build a prototype furnace for the dual purposes of helping to overcome
future design issues before facing them during construction of the final furnace, and for allowing
preliminary data to be collected in a timely fashion. A prototype of the heater was constructed in
Scott Lab, conforming as closely as possible to the design of the high temperature furnace using
relatively inexpensive materials, and when possible, equipment already available in the lab. In
this section, the design of the heater, as well as some issues faced during construction, will be
described.

33
3.2.1 Prototype Heater
Just as the high temperature furnace was based around the specified heater, the choice of
a heater was one of the more important factors in the design of the prototype furnace. The heater
used was chosen simply based on availability, as a tube furnace with control system were already
available in the lab. The furnace, by Watlow, was very similar in design, but significantly
smaller than the heater specified for the high temperature furnace. Both are electric heaters, and
use a coil design, with ceramic insulation. The inside diameter of the prototype heater was 1”,
but the outside diameter only 3”. The length was 12”, with the entire length being heated, unlike
the high temperature heater. The heater’s maximum temperature was 1093°C, significantly
lower than the maximum temperature of the high temperature heater. This temperature limit was
the most important factor in influencing the remainder of the design decisions regarding the
prototype. Because we plan on testing the sapphire fibers at temperatures exceeding 1500ºC, it
was decided that the prototype would only be used to test silica fibers. This way, the expensive
sapphire fibers can be saved for the high temperature furnace, and we can be sure that they all
start from the same baseline, rather than causing some change in the fibers at lower temperatures
that will make comparison of future results more difficult.
3.2.2 Prototype Heater Controller
Temperature control was accomplished using a heater controller that had previously been
used with the heater. The Digi-Sense controller, from Cole-Parmer Instrument Company, can be

34
seen in Figure 15, below. No manual was available for the furnace in the lab, or online. The
controller does not appear to be sold any more, as newer models with automatic calibration and
digital controls are readily available.
Figure 15: Digi-Sense Temperature Controller
The controller uses a type K thermocouple to measure the temperature. The heater is relatively
easy to control, as the set-point temperature is controlled using a simple knob, and the controller
automatically adjusts to new temperature settings. Due to the lack of manual, however, the
ability to finely tune the temperature was limited. In the top-right of the front panel of the
controller are screw adjusters for the variables “Over Temp,” “Prop. Range,” and “Prop. Offset.”
Through trial-and-error it was unable to be determined how to accurately calibrate the heater
using these settings. Instead the temperature setting must be very slowly adjusted upwards, as
the heater is prone to overshooting. In addition, the final set-point value chosen should be
approximately 10ºF lower than the intended value, as the heater has a significant steady-state
error.

35
3.2.3 Prototype Furnace Instrumentation
Instrumenting the furnace turned out to be the greatest challenge of building the
prototype. The controller requires one type K thermocouple to measure the temperature of the
heater. In addition, a second thermocouple was used to provide confirmation of the temperature
in case the control thermocouple were to fail. This second thermocouple was monitored using a
simple Omega Thermometer, as shown in Figure 16, below.
Figure 16: Omega Thermometer for Backup Thermocouple
The confined space inside the heater, with its 1” inner diameter, and the high temperatures
reached during testing, made it very difficult to correctly locate the thermocouples. It was
important that they be located as close to the center of the heater (axially) as possible, as this
would be the location of the fiber. At the same time, it was important that room still be left for
the fiber. One of the first attempts at locating the thermocouples used ceramic insulators and
copper wire. A long section of ceramic was braced by two shorter (approximately 1”) sections,
such that it could be inserted into the heater, and the cross-braces would maintain spacing from
36
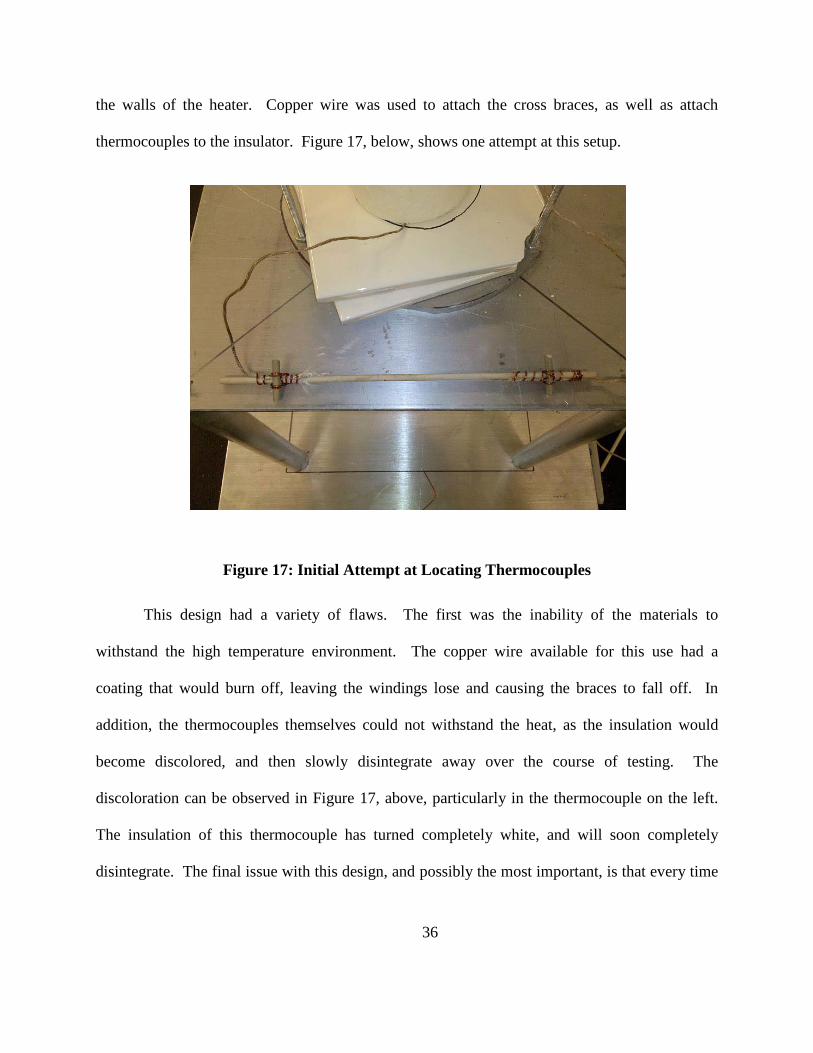
the walls of the heater. Copper wire was used to attach the cross braces, as well as attach
thermocouples to the insulator. Figure 17, below, shows one attempt at this setup.
Figure 17: Initial Attempt at Locating Thermocouples
This design had a variety of flaws. The first was the inability of the materials to
withstand the high temperature environment. The copper wire available for this use had a
coating that would burn off, leaving the windings lose and causing the braces to fall off. In
addition, the thermocouples themselves could not withstand the heat, as the insulation would
become discolored, and then slowly disintegrate away over the course of testing. The
discoloration can be observed in Figure 17, above, particularly in the thermocouple on the left.
The insulation of this thermocouple has turned completely white, and will soon completely
disintegrate. The final issue with this design, and possibly the most important, is that every time

37
the experiment was set up again, the thermocouples and ceramic insulators would have to be
removed and re-inserted, which caused a number of issues. The first is that inconsistent
temperatures would result due to varying placement of thermocouples from experiment to
experiment. The second is that the stress of trying to reposition the thermocouples would lead to
further damage to their insulation, and in one case resulted in a short, in which the control
thermocouple essentially was measuring the temperature at a location other than the welded
junction. This becomes dangerous because the thermocouple becomes less responsive, due to
the larger thermal mass that must be heated at the location of the short. Because the heater
controller already had a tendency to overshoot, this would result in temperatures much higher
than intended, as the controller would continue heating the furnace long after the correct
temperature had been reached.
A variety of other possible designs were attempted before the final design was finally
complete. In the final design, the ceramic insulators were used once again, but this time they
were used as they were originally intended, with the thermocouple wires inserted through the
bore holes, thereby preventing the issue of shorts due to disintegrating insulation. The ceramic
insulators used were of the round four bore type, as pictured in Figure 18, below (ASTM
International).

38
Figure 18: Four Bore Ceramic Insulator
The problem of locating the thermocouples was solved using a steel all-thread that was located in
the center of the heater by locating it in the center-holes of the aluminum plates and ceramic
tiles. The insulators were affixed to the all-thread using uncoated copper wire which was
threaded through one of the bore holes, and wound around the all-thread at either end. Two
ceramic insulators were used, each with one thermocouple, and they were arranged such that
both thermocouple junctions would meet at the center of the furnace. Each ceramic insulator is
6” long, such that they meet in the middle, and extend to either end of the furnace, protecting as
well as locating both the thermocouples and the fiber that is being heated. Figure 19, below,
shows a close-up of the way the ceramic insulators were attached to the all-thread, and Figure 20
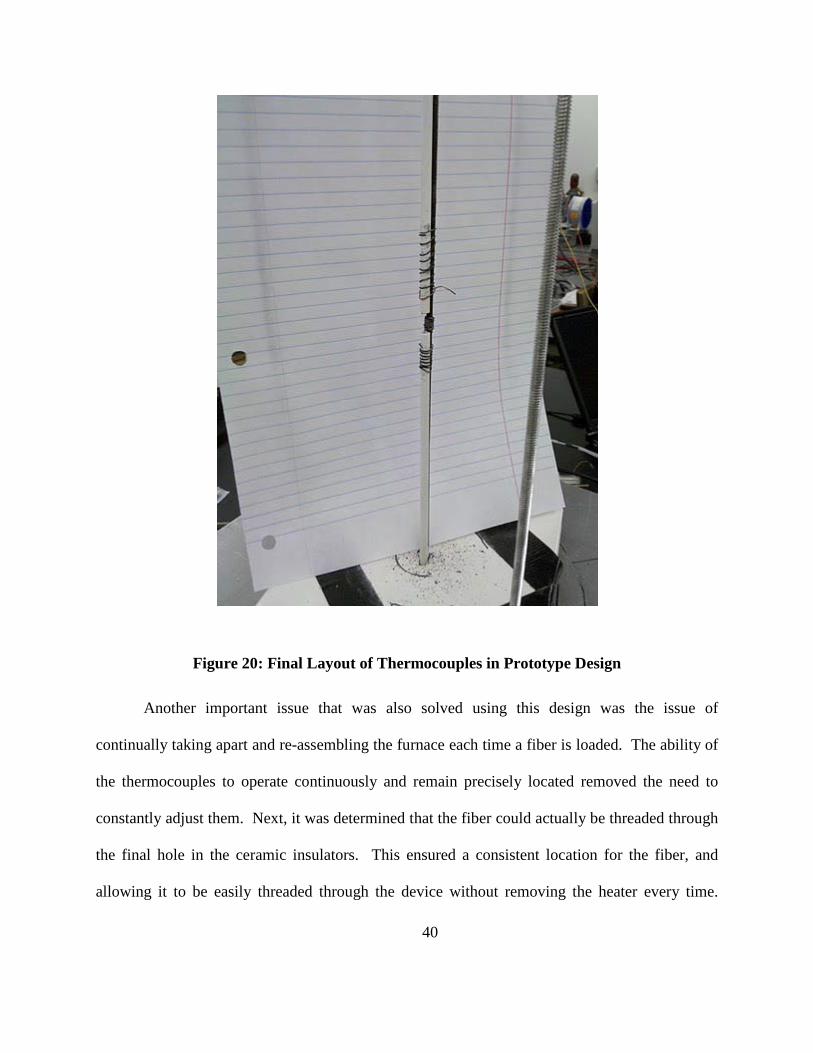
shows the location of the sensors with the heater removed, to show the relative location of the
sensors in the furnace. Of note in Figure 20 is the fact that the copper wires, as well as the steel
all-thread, have blackened, as this picture was taken after testing the furnace at temperatures
exceeding 750 °C. This is one weakness of the system, as the copper wires loosen and allow the
ceramic insulators to shift their position over time. This means that in order to thread the fiber
through without disassembling the system, as described later in this chapter, the system must still
be periodically disassembled and re-adjusted, resulting in potential damage to various

39
components, including further weakening of thermocouple wires, particularly at the ends of the
ceramic insulators where they exit the furnace.
Figure 19: Attaching Ceramic Insulators to Steel All-thread
40
Figure 20: Final Layout of Thermocouples in Prototype Design
Another important issue that was also solved using this design was the issue of
continually taking apart and re-assembling the furnace each time a fiber is loaded. The ability of
the thermocouples to operate continuously and remain precisely located removed the need to
constantly adjust them. Next, it was determined that the fiber could actually be threaded through
the final hole in the ceramic insulators. This ensured a consistent location for the fiber, and
allowing it to be easily threaded through the device without removing the heater every time.

41
This is important because the device is not set up to be easily adjustable by one person. Further,
it is important because the actual heater will one day have been activated in the reactor, and the
easier it is to unload and load a fiber the safer the experiment will be. It is important that this be
taken into consideration in the final design.
3.2.4 Prototype Furnace Structure
The next design decision was how to construct the aluminum frame. Despite the smaller
size of the available heater, it was determined that the full size frame would be constructed,
according to the initial design. This would not only more closely follow the original design,
allowing any design issues to be solved, but it would also potentially be adapted to the final
furnace without the need to re-machine the parts in the future. As discussed above, the
construction of the frame revealed some important issues that required changes to be made to the
final design. The primary difference will be the change to the design of the plates that hold
together the furnace, and the aluminum bars which will replace the all-threads. The CAD
drawings for each individual part of the structure can be found in Appendix A, in addition to
assembly drawings showing the overall design.
3.2.5 Prototype Furnace Insulation
For the design of the prototype it was determined that purchasing ceramic end-caps for
the heater would not be justified for this low-temperature application. It was instead decided that
simple ceramic tiles would be tested to determine their ability to insulate the system. A

42
photograph of these tiles can be seen in Figure 21 below. A hole was drilled in the middle of the
tiles using a ceramic drill bit, and they were later cut down to a small enough size to fit in place.
Figure 21: Ceramic Tiles Used as End-Caps for Prototype Heater
Initial testing of the heater, before the addition of the end-caps, showed that using the
heater controller, discussed above, it was very difficult to maintain the desired temperature, as
large fluctuations in temperature would occur. These fluctuations would have made it nearly
impossible to control the heater, but with the addition of these ceramic tiles, the fluctuations
were almost completely eliminated. Two tiles were added above, and two below the furnace and
in testing as high as 750 º C the tiles have had no problem withstanding the heat. Aside from
some slight discolorations, particularly on the tile immediately in contact with the top of the
furnace, there have been no noticeable changes in the tiles, and they continue to perform
adequately. It has been decided that there is no further need to modify or improve upon this
simple solution.
43
3.2.6 Prototype Optical Equipment
The final component of the prototype was the optical equipment. A light source and
spectrometer, both from Ocean Optics, were used to interrogate the fibers, and software called
Logger Pro was used to collect the data. The light source, model number LS-1 is a tungsten
halogen light source, with a range of 360-2500 nm. It has an SMA 905 connector.
Manufacturer's specifications for the light source can be found in Appendix C. During testing,
the voltage regulator on the device failed. It was replaced using a newer chip, as the part was
obsolete, and the design was improved by adding a capacitor specified by the voltage regulator
manufacturer. This should improve the reliability of the device in the future.
The spectrometer used, also from Ocean Optics, was the USB 2000 model. This device
also has an SMA 905 connector, and connects to a computer via USB for real-time data
collection. The range of the device is 200-1100 nm, and the full manufacturer’s specifications
can be seen in Appendix D. Thus, the overall range available for testing using this particular
setup is 360-1100 nm. This is sufficient to gain insight into the operation of silica fibers, but it is
important that for future fiber testing the range be expanded above 1100 nm. Communication
bands typically range from 1200-1700 nm.
3.2.7 Prototype Fiber Connectors
In order to connect the fibers to the optical equipment, Bullet Bare Fiber Adapters were
purchased from Fiber Plus International. The adapters purchased consist of an aluminum fiber
holder, with a steel SMA 905 connector module that allows the fibers to be connected to the

44
optical equipment described above. A photograph of one of these connectors can be seen in
Figure 22, below.
Figure 22: Bullet Bare Fiber Adapter
The connector modules are interchangeable, such that they could be replaced in the future if an
alternative form of connectors were required for new optical equipment. The particular parts
purchased are custom adapters for 250 µm fiber, with low-density padding, which is used to help
prevent damage to the fibers. The adapters are ideal for the purposes of testing at Scott Lab, as
they allow fibers to be very quickly and easily attached to the optical equipment, without
permanent change to the fibers themselves or any need for special equipment. They also have
the potential to be used in testing at the reactor, as the bulk of the material is aluminum, with the
steel connector modules having the ability to be removed and replaced as needed. Though this is
not the ideal solution for this application, it is important to consider removable connectors such
as these, in particular for the testing of the very expensive sapphire fibers.

45
3.3 Silica Fiber Testing Procedures
Once the prototype construction was complete, the next step was to begin testing of silica
fibers. This served the dual purpose of giving additional practice handling the furnace setup, as
well as the fibers, and it also allowed us to begin looking in detail at the performance of the silica
fibers in a high temperature environment.
3.3.1 General Fiber Testing Procedures
In order to test each silica fiber, a length of fiber of approximately 2 m was chosen, and
the ends were polished using the fiber polishing kit in the lab. The fiber was then carefully
threaded into the furnace, through the holes in the aluminum plate at the top, the ceramic tiles,
and into the ceramic insulator described earlier. At the middle of the heater the fiber exits one
ceramic insulator briefly before entering the second ceramic insulator, and proceeds out of the
furnace through the ceramic tiles and aluminum plate at the bottom. Threading the fiber through
the furnace in this way, although much easier than previous attempts in which the heater was
removed and replaced to load the fiber, is still difficult and fairly often results in breaking of the
fiber. If the fiber breaks, it is simply re-threaded through, and the broken end is re-polished.
Once the fiber has been threaded through the furnace, the ends are connected to the spectrometer
and light source using the Bullet Bare Fiber Adapters as described above.
3.3.2 Repeating Previous Experiment by Toossi and Modarress
The first testing that was done was to try to recreate as closely as possible the results of
the 1991 study by Toossi and Modarress, as described in the “Heating Silica Fibers” section of

46
Chapter 1 of this thesis. The study performed a variety of tests on the effects of both temperature
and radiation on silica fibers, but we are concerned here simply with the temperature effects.
Figure 11, in the above description, shows the results of a test in which silica fibers of three types
were heated to approximately 325ºC over the course of 5 hours, and then cooled back to room
temperature. The same procedure was used as described in this previous study, and the same
wavelengths were monitored, with four additional wavelengths monitored as well. The biggest
differences between the two experiments were the fibers used, and the length of the fibers being
tested. In the previous study 10 m lengths of three different types of silica fiber were heated, but
in this experiment only 12 inches of fiber are heated. The results of this initial test can be seen in
Figure 23, and Figure 24, with the second figure showing the additional wavelengths.
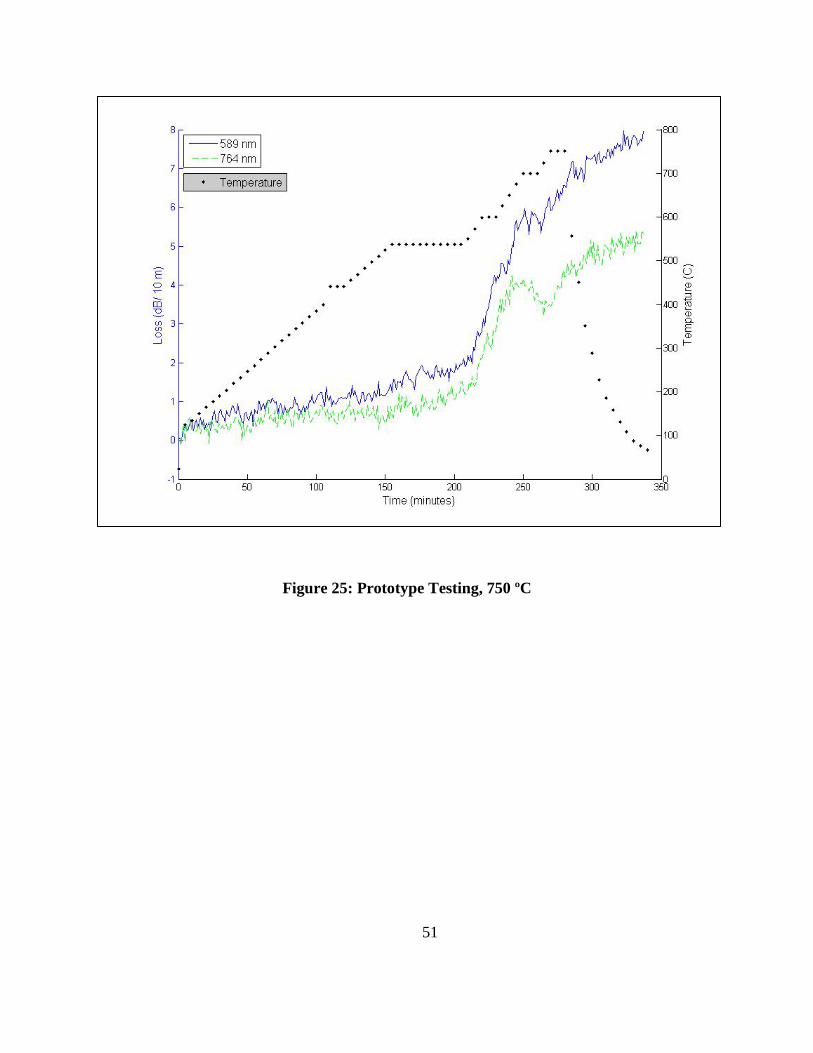
3.3.3 Prototype Testing at Increasing Temperatures
Because little change in the attenuation of the fibers was observed in the first test, it was
decided that the fibers would be tested at higher temperature. In the second experiment the
temperature would continue to be raised in an attempt to cause a more measurable change in the
output. The temperature was stepped up to 750 ºC, which was determined to be the maximum
safe operating temperature of the prototype heater. The results of this test can also be seen in
Figure 25, and Figure 26 below.
After conducting this test and determining that heating the fibers to temperatures greater
than 500 ºC was necessary, a final test was conducted in an attempt to further verify the results
obtained. In this final test, the fibers were heated to greater 750 ºC once again, though over a

47
shorter time than in the previous test, and with a one hour dwell in the temperature at 750 ºC.
The results of this final test can be seen in Figure 27 in the Results section, below.
3.4 Summary
The high temperature furnace, which will be used to test sapphire fibers at the OSURR,
has been designed and the majority of the parts have been specified and ordered. It meets all of
the important design criteria as closely as possible, and prototype testing has helped to support
some important design considerations, such as the choice of a tube furnace, the need for a hole to
be drilled in the side for instrumentation purposes, and the stability of the aluminum frame. The
prototype testing has been successful, both in that it has helped to verify the overall design and
helped to bring to light the challenges that will be faced in constructing the high temperature
furnace, and in that it has allowed us to collect important data on silica fibers. The testing of
silica fibers, though initially unreliable without good fiber connectors, has been remedied, and
has shown the fibers to be capable of withstanding very high temperatures.

48
CHAPTER 4: RESULTS
4.1 Prototype Furnace Silica Fiber Testing
As described in the Methods section above, various tests on silica fibers were conducted
using the prototype furnace that was constructed. The first of these attempted to follow the
procedure used in the previous study by Toossi and Modarress. Later experiments raised the
temperature the fibers were heated to, and added the use of Bullet Bare Fiber Adapters, which
greatly improved the results.
4.1.1 Repeating Previous Experiment
Figure 23, below, shows the results of the first test described in Section 3.3.2, which was
again intended to replicate the results of testing by Toossi and Modarress. Six wavelengths were
sampled in this test rather than two. Figure 23 shows only the wavelengths used in previous
testing, for comparison, but Figure 24, below, shows the same graph with all six wavelengths
included.

49
Figure 23: Prototype Testing, 325 ºC

50
Figure 24: Prototype Testing, 325 ºC, Additional Wavelengths
4.1.2 Higher Temperature Testing, With Connectors
Figure 25, below, shows the results of the second test described in section 3.3.3, and the
fibers were tested to the maximum operating temperature of the prototype furnace, 750 ºC.
Figure 26, below, shows the same graph with additional wavelengths added in. A final test was
conducted in which the temperature was more quickly raised to 750 ºC and remained at this
temperature for one hour before returning to room temperature. This can be seen in Figure 27,
below.
51
Figure 25: Prototype Testing, 750 ºC

52
Figure 26: Prototype Testing, 750 ºC, Additional Wavelengths

53
Figure 27: Prototype Testing, 750 ºC Prolonged Test
4.2 Physical Damage to Fibers
As described in section 3.3.3, above, it is important to consider the physical damage to silica
fibers at high temperatures in addition to their optical properties.
Figure 28, below, shows the entire heated length of fiber. On the far ends of the picture
are unheated sections of fiber, and the color transitions to a dark brown, then black, before
becoming clear as the fiber goes toward the center of the heater. Figure 29, below, shows a close
up of one end of the fiber, giving a clearer picture of this transition.

54
Figure 28: Physical Damage to Fiber, Prototype Heater Testing at 750 °C
Figure 29: Physical Damage to Fiber, Prototype Heater Testing at 750 °C, Close-Up

55
CHAPTER 5: ANALYSIS
Preliminary testing of the silica fibers using the prototype heater has led to some
interesting results which will be useful for future work on this project. The effects of high
temperature on the particular silica fibers being tested in the lab are beginning to be better
understood, though much more testing and further literature review will be necessary to
understand and break down the various different factors that are affecting their behavior.
Preliminary testing has shown that the fibers do much better at temperatures below 500 ºC than
the fibers tested by Toossi and Modarress, but that they begin to be significantly affected by
temperature as it reaches and exceeds around 600 ºC. In addition, lab testing has shown the
severity of the embrittlement of the fibers due to the destruction of the coating at high
temperatures, and further justified the need for higher temperature materials.
5.1 Optical Performance of Silica Fibers
5.1.1 Optical Testing
The first test, as described in the Methods section above, attempted to replicate the results
of the Toossi and Modarress experiment at 320 ºC. The results of this test can be seen in Figure
23 and Figure 24. In this test it appears that what was surmised in the previous testing, that
temperatures this low had very little effect on the fiber, seem to be true. In this case six
wavelengths were tested, and it appears that for the most part the losses in the fibers were
minimal, ranging from -1 to 1 dB/10 m. The notable exception is at 950 nm, where the losses
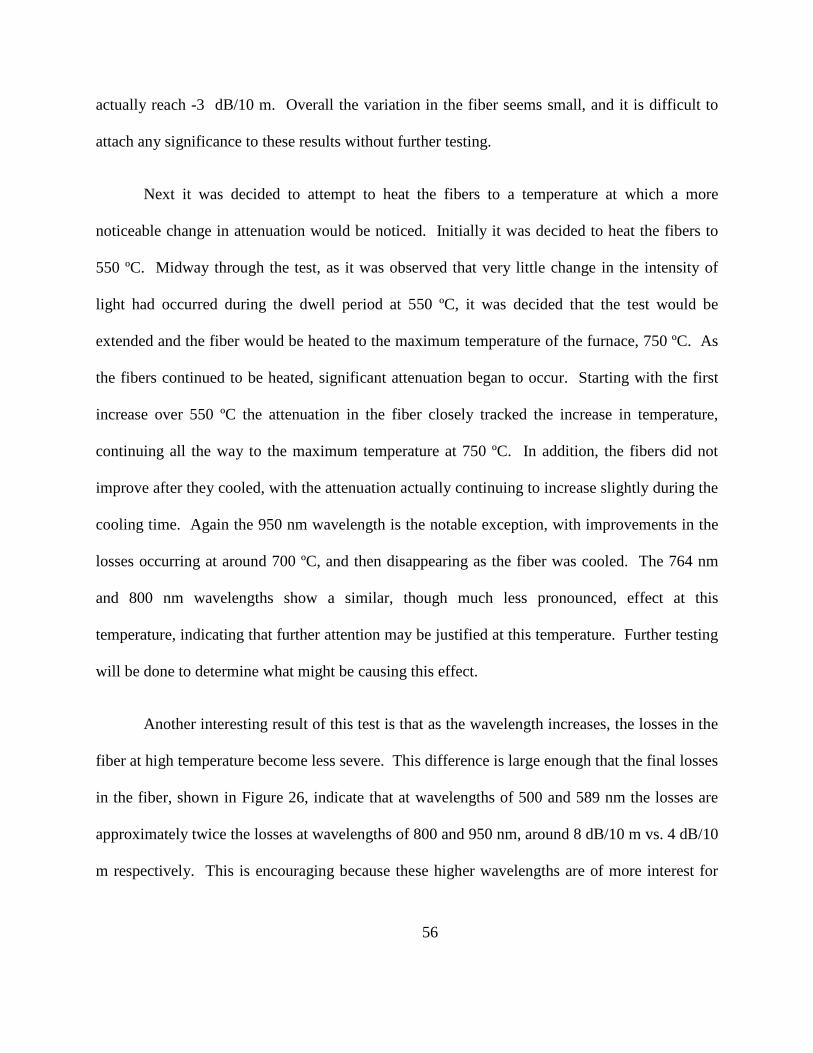
56
actually reach -3 dB/10 m. Overall the variation in the fiber seems small, and it is difficult to
attach any significance to these results without further testing.
Next it was decided to attempt to heat the fibers to a temperature at which a more
noticeable change in attenuation would be noticed. Initially it was decided to heat the fibers to
550 ºC. Midway through the test, as it was observed that very little change in the intensity of
light had occurred during the dwell period at 550 ºC, it was decided that the test would be
extended and the fiber would be heated to the maximum temperature of the furnace, 750 ºC. As
the fibers continued to be heated, significant attenuation began to occur. Starting with the first
increase over 550 ºC the attenuation in the fiber closely tracked the increase in temperature,
continuing all the way to the maximum temperature at 750 ºC. In addition, the fibers did not
improve after they cooled, with the attenuation actually continuing to increase slightly during the
cooling time. Again the 950 nm wavelength is the notable exception, with improvements in the
losses occurring at around 700 ºC, and then disappearing as the fiber was cooled. The 764 nm
and 800 nm wavelengths show a similar, though much less pronounced, effect at this
temperature, indicating that further attention may be justified at this temperature. Further testing
will be done to determine what might be causing this effect.
Another interesting result of this test is that as the wavelength increases, the losses in the
fiber at high temperature become less severe. This difference is large enough that the final losses
in the fiber, shown in Figure 26, indicate that at wavelengths of 500 and 589 nm the losses are
approximately twice the losses at wavelengths of 800 and 950 nm, around 8 dB/10 m vs. 4 dB/10
m respectively. This is encouraging because these higher wavelengths are of more interest for
57
our applications, and future testing will actually be conducted at even higher wavelengths once
the appropriate optical equipment is purchased. The current light source and spectrometer
combination results in a significantly lower photon count at 950 nm, which leaves the output
more susceptible to random variations in output, and could explain some of the unexpected
behavior at this wavelength.
In order to better understand this result, one final test was conducted in which the fibers
were heated to 750 ºC once again, but remained at this temperature for an hour. This helped to
determine whether the effects that were noticed at higher wavelengths were due to experimental
error, or another factor. The result of this experiment can be seen in Figure 27, above. The
fibers again are very resilient up to around 600 ºC, when losses begin to appear. Here the effect
that was noticed at 950 nm in the earlier experiment is very pronounced, however, as the losses
begin to decrease significantly in higher wavelengths at above 700 ºC. The losses at 950 nm
appear to decrease to -25 dB/10 m. The wavelengths from 764-875 nm also show this effect, but
it is much more pronounced as the wavelength increases. This “improvement” in the fibers is
very different from what is expected, and requires additional investigation before it can be fully
explained.
It seems that what is taking place is the introduction of light to the fibers from a
secondary light source, the heater itself. As the heater reaches temperatures in the range of 750
ºC it is likely emitting photons in the infrared wavelength range, some of which end up travelling
through the fibers and resulting in the effect described above. The photons would have to enter
the fiber at just the right angle to totally internally reflect and remain in the fiber, as shown in

58
Figure 30, below. The photon on the left simply passes through the fiber, while the one on the
right is totally internally reflected and adds to the signal in the fiber. In conversations with Luna
on this subject, David Hawn was told that this effect is negligible (Hawn). The major difference
here is that we are testing multi-mode rather than single-mode fibers, and this likely has an effect
on the ability of the photons to totally internally reflect, resulting in a non-negligible effect for
multi-mode fibers.
Figure 30: Introduction of Light from Secondary Source in Fibers
In a previous study similar to the one conducted in this Thesis, Oikari et al showed that
the introduction of light from a furnace has a significant effect on the signal, particularly at high
temperatures and high wavelengths (Oikari, Laurila and Hernberg). Figure 31, below, shows
that in the 700-1100 ºC range the effect does in fact increase with wavelength, just as was
observed in Figure 29, above.
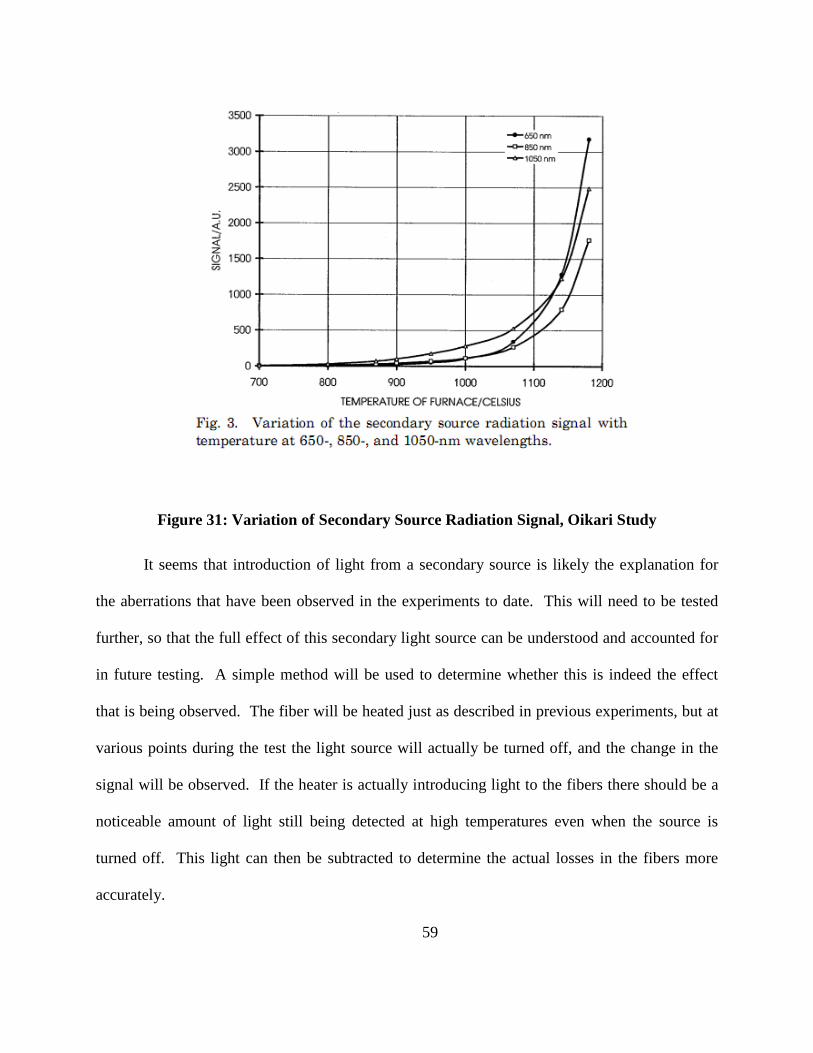
59
Figure 31: Variation of Secondary Source Radiation Signal, Oikari Study
It seems that introduction of light from a secondary source is likely the explanation for
the aberrations that have been observed in the experiments to date. This will need to be tested
further, so that the full effect of this secondary light source can be understood and accounted for
in future testing. A simple method will be used to determine whether this is indeed the effect
that is being observed. The fiber will be heated just as described in previous experiments, but at
various points during the test the light source will actually be turned off, and the change in the
signal will be observed. If the heater is actually introducing light to the fibers there should be a
noticeable amount of light still being detected at high temperatures even when the source is
turned off. This light can then be subtracted to determine the actual losses in the fibers more
accurately.

60
5.1.2 Lessons Learned from Optical Testing
The optical testing of the silica fibers at high temperature has provided some important
lessons learned for the future of fiber testing in the lab. The first important lesson learned is that
the fibers do appear to have an effective operating range up to around 550-600 ºC at which
minimal losses occur in the fiber. This is particularly encouraging following the previous study
in which losses increased rapidly at temperatures exceeding 200 ºC, and helps to validate the
decision to test these fibers for their applications in nuclear reactor environments. At the same
time, increasing the temperature above this range clearly has a strongly negative effect on the
fibers. It is in this range that the effects of diffusion of the dopant, crystallization of the fiber,
and softening of the core likely begin to take effect. Further study will be necessary to break out
these individual effects, and understand what is causing the losses in the fiber in this range, but
these results are expected, as described in the literature in the Background section above. The
second important lesson is that the introduction of light from the heater itself seems to have a
very pronounced effect in the fiber, and this will need to be explained and accounted for in future
testing. Further experiments will be conducted with the prototype furnace to better understand
this effect, and steps will be taken to mitigate it in the construction of the final heater design if
necessary.
5.2 Physical Performance of Silica Fibers
In addition to the optical performance described above, an important component of the
fiber performance is their physical strength and durability. As described in the Background
section, traditional fiber coatings typically can survive to a maximum of 385 ºC, and beyond this

61
temperature metallic coatings must be utilized. In the case of the silica fibers tested here, which
utilize a high-temperature Polymicro coating, the coating does indeed burn off during testing in
the 550 ºC range. The result is that the fibers become extremely brittle, and will break under any
significant stress. As pictured in Figure 28 and Figure 29, the fibers become first brown, then
black as the coating burns off, and finally clear once it has been fully removed. In Figure 28the
fiber was unable to be removed from the heater without breaking, and is actually broken in the
middle though it is nearly impossible to see in the photo. This embrittlement has the potential to
severely limit the reliability of these fibers in instrumentation applications, particularly in reactor
environments in which the survivability of the instrumentation is a crucial safety matter.
5.3 Summary
Overall the prototype has provided promising results for the silica fiber testing that was
performed. Once the light source was repaired, and fiber connectors were added, the data
collected from the experiment was very useful. In this initial testing, the optical properties of the
fibers have been shown to be much more resilient to temperature than expected from previous
studies. The fibers show that they are able to successfully operate at temperatures up to 550 ºC
without significant decrease in efficiency. As the temperature is increased further, however, the
fibers begin to degrade quickly, and attenuation increases, with the greatest attenuation occurring
at lower wavelengths and decreasing as the wavelength increases. This effect, though promising,
may be in large part explained by secondary light source effects, rather than any beneficial aspect
of the fibers. More testing is required to determine the causes of these effects, and to verify the
repeatability of them, but this initial work has provided justification both for future studies of

62
silica fibers at temperatures in the range tested here, and of sapphire fibers which will be
necessary to reach temperatures exceeding 900 ºC.

63
CHAPTER 7: CONCLUSIONS AND FUTURE WORK
7.1 Conclusions
As described in the Analysis section, above, one of the main conclusions that can be
drawn from this study is that silica and sapphire fibers are both viable options at high
temperature, though they have very different applicable ranges, and further study of both fibers
for reactor environments is justified. This is encouraging, as further work continues to be done
in preparation for the construction of two new furnaces, one to test each type of fiber. In
addition, the construction of the prototype has yielded important information regarding the
challenges as well as successes of the current design. These lessons have resulted in the decision
to move forward with the construction of the high temperature furnace, the design of which has
been determined to be viable, though still somewhat incomplete. An important lesson learned in
the construction of the prototype furnace is that flexibility of the design is important, and some
design decisions will need to be made once progress has begun to be made in building the
furnace. The overall design is sound, however, and construction is set to begin very soon.
7.2 Future Work
7.2.1 Short Term
In the short term, there are two directions that will be pursued in future work. The first is
that data will continue to be collected using the prototype furnace, as the silica fibers are further
64
characterized before they are later tested in the silica fiber furnace that will be constructed this
summer. There is much more to be understood about what is causing the attenuation observed at
high temperatures, and how the fibers withstand sustained time at temperature as well. In
addition, construction is ready to begin on the high temperature furnace, and this will begin in
earnest this summer, with testing in the lab, and later at the OSU Research Reactor soon to
follow.
7.2.2 Long Term
Long term goals for this project, once sapphire fibers have been characterized in a high
temperature, radiation environment, include the fabrication and testing of sensors, such as FBG
sensors, in the fibers. The survivability of such sensors will be a completely different issue in
this harsh environment than the survivability of the bulk fiber itself. This is because the
competing effects of radiation damage and annealing will not have the ability to repair the
grating structure etched in the fibers in the same way that it might repair damage in the bulk
fiber. Once sensors are successfully created and characterized in this environment, attention can
be turned to creating a sensor network utilizing these sensors, and providing distributed in-core
temperature measurements.
65
BIBLIOGRAPHY
ASTM International. "Manual On the Use of Thermocouples in Temperature Measurement."
1993.
ASTM. "Standard E 1614-94." 2004.
Bhatia, V. "Optical fibre based absolute extrinsic Fabry-Perot interferometric sensing system."
Measurement Science and Technology
Grobnic, Dan and Stephen J Mihailov. "Sapphire Fiber Bragg Grating Sensor Made Using
Femtosecond Laser Radiation for Ultrahigh Temperatures."
(1996): 58.
IEEE Photonics Technology
Letters
Han, Ming. "Signal-processing algorithm for white-light optical fiber extrinsic Fabry-Perot
interferometric sensors."
November 2004: 2505-2507.
Optics Letters
Hawn, David.
(2004): 1736-1738.
John Hanson's Thesis Defense
MHI.
John Hanson. 14 May 2010.
Robust Radiator Modules.
Oikari, Risto, Toni Laurila and Rolf Hernberg. "High-temperature effects in flourine doped,
fused synthetic silica fibers."
2009. 2010 <http://www.mhi-inc.com/PG3/robust-
radiator.html>.
Applied Optics 20 July 1997.

66
Othonos, Andreas and Kyriacos Kalli. Fiber Bragg Gratings.
Shiota, Takao and Hiroshi Hidaka. "High-Temperature Effects of Aluminum-Coated Fiber."
Boston: Artech House, 1999.
Journal of Lightwave Technology
Toossi, R and D Modarress. "Radiation and Temperature Survivability of Multimode Step-Index
Flourine-Doped Silica Fibers."
(1986): 1151-1156.
IEEE Transactions on Nuclear Science
Wang, Anbo, Yizheng Zhu and Gary Pickerell. "Optical Fiber High-Temperature Sensors."
October 1991: 985-
993.
Optics and Photonics News
Zhu, Yizheng and Zhengyu Huang. "Sapphire-fiber-based white-light interferometric sensor for
high-temperature measurements."
March 2009: 27-31.
Optics Letters
1 April 2005: 711-713.

67
APPENDIX

68
Appendix A: CAD Drawings of Initial Furnace Design

69

70

71

72

73

74
Appendix B: Ocean Optics LS-1 Manufacturer’s Specifications
Spectral range: 360-2500 nm Dimensions: 9.0 cm x 5.0 cm x 3.2 cm; 3.5" x 2.0" x 1.25" Power input: 12 VDC/800 mA; 7-20 VDC/0.4-2 amps Power output: 6.5 watts Bulb life: 900 hours (standard); 10,000 hours (long-life) Bulb color temperature: 3100 K (900-hour bulb); 2800 K (10,000-hour bulb) Output to bulb: 5 volts/1.3 amps Output regulation: 0.2% voltage Time to stabilized output: ~20 minutes Stability: decay rate is ~0.1%/hour of the output power Bulb output: 7400 foot-candles (7.4MSCP) Internal filter accessory: BG-34 conversion filter External filter slot: accepts filters up to 3 mm thickness Spectral attenuation: 50%, 75% and 99% with PTFE disk accessories Connector: SMA 905 * If used with an Ocean Optics spectrometer, the LS-1's practical spectral range is limited to the spectral response of the detector -- for the USB2000, approximately 1100 nm (1.1 µm).
Source: Manufacturers Website (http://www.oceanoptics.com/products/ls1.asp)

75
Appendix C: Ocean Optics USB 2000 Manufacturer’s Specifications
Physical Dimensions: 89.1 mm x 63.3 mm x 34.4 mm Weight: 190 grams Detector Detector: Sony ILX511 linear silicon CCD array Detector range: 200-1100 nm Pixels: 2048 pixels Pixel size: 14 μm x 200 μm Pixel well depth: ~62,500 electrons Sensitivity: 75 photons/count at 400 nm; 41 photons/count at 600 nm Optical Bench Design: f/4, Symmetrical crossed Czerny-Turner Focal length: 42 mm input; 68 mm output Entrance aperture: 5, 10, 25, 50, 100 or 200 µm wide slits or fiber (no slit) Grating options: 14 different gratings, UV through Shortwave NIR HC-1 grating option: No Detector collection lens option:
Yes, L2
OFLV filter options: OFLV-200-850; OFLV-350-1000 Other bench filter options:
Longpass OF-1 filters
Collimating and focusing mirrors:
Standard or SAG+
UV enhanced window: Yes, UV2 Fiber optic connector: SMA 905 to 0.22 numerical aperture single-strand optical
fiber Spectroscopic Wavelength range: Grating dependent Optical resolution: ~0.3-10.0 nm FWHM Signal-to-noise ratio: 250:1 (at full signal) A/D resolution: 12 bit Dark noise: 3.2 RMS counts Dynamic range: 2 x 10^8 (system); 1300:1 for a single acquisition Integration time: 3 ms to 65 seconds Stray light: <0.05% at 600 nm; <0.10% at 435 nm Corrected linearity: >99.8% Electronics Power consumption: 90 mA @ 5 VDC

76
Data transfer speed: Full scans to memory every 13 ms with USB 2.0 or 1.1 port, 300 ms with serial port
Inputs/Outputs: No Analog channels: No Auto nulling: No Breakout box compatibility:
No
Trigger modes: 3 modes Strobe functions: Yes Gated delay feature: Yes Connector: 10-pin connector Computer Operating systems: Windows 98/Me/2000/XP, Mac OS X and Linux with USB
port; Any 32-bit Windows OS with serial port Computer interfaces: USB 2.0 @ 12 Mbps; RS-232 (2-wire) @ 57.6 K baud Peripheral interfaces: I2C inter-integrated circuit
Source: Manufacturers Website (http://www.oceanoptics.com/Products/usb2000.asp)