evaluation of fmvss no. 301, “fuel system integrity,” as
TRANSCRIPT

EVALUATION OF FMVSS NO. 301, “FUEL SYSTEM INTEGRITY,” AS UPGRADED IN 2005 TO 2009
Jia-Ern Pai National Highway Traffic Safety AdministrationEvaluation Division
CompanyLogo Here
This is a U.S. Government work and may be copied and distributed without permission.

SAE INTERNATIONAL
Background & Introduction• FMVSS No. 301 Rear Impact Upgrade• FMVSS No. 301 Side Impact Upgrade• Purpose and Settings of the Evaluation• Database• Statistical Analysis Methods
FMVSS No. 301 Rear Impact Upgrade• Fire-Reducing Effectiveness• Live-Saving Effectiveness• Savable Lives in Rear Impact Fires
FMVSS No. 301 Side Impact Upgrade• Fire-Reducing Effectiveness
Contents
2
SAE INTERNATIONAL
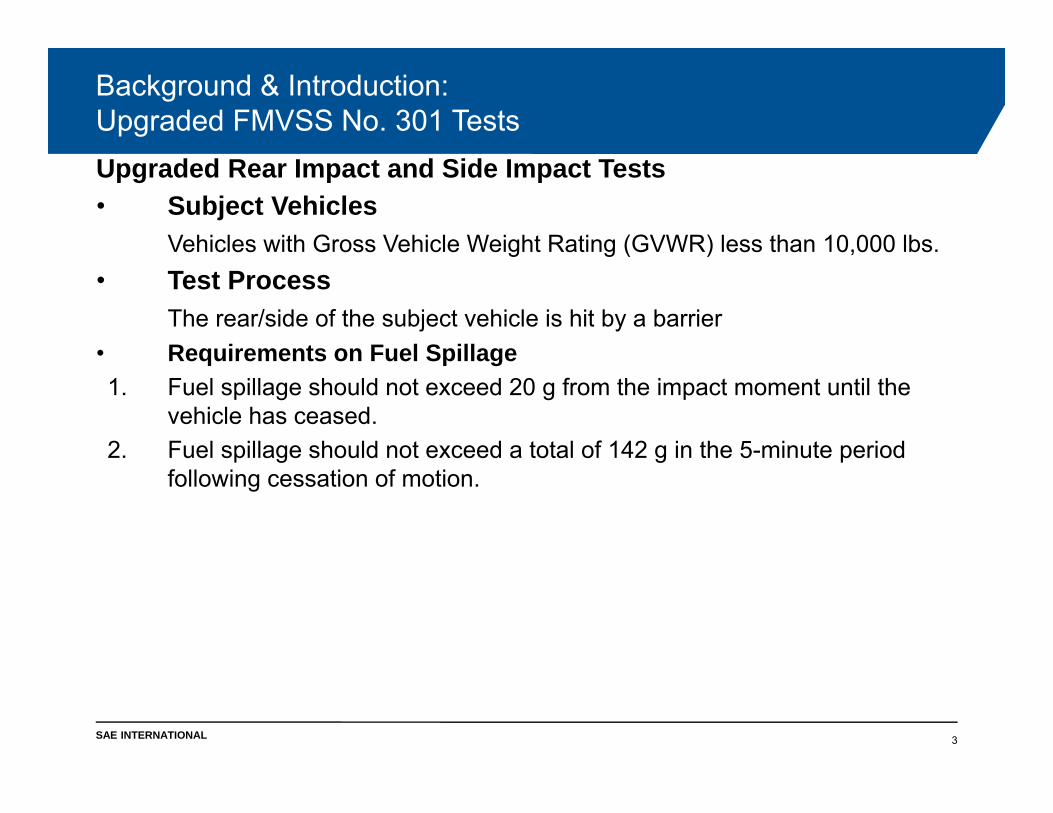
Upgraded Rear Impact and Side Impact Tests• Subject Vehicles
Vehicles with Gross Vehicle Weight Rating (GVWR) less than 10,000 lbs.• Test Process
The rear/side of the subject vehicle is hit by a barrier• Requirements on Fuel Spillage 1. Fuel spillage should not exceed 20 g from the impact moment until the
vehicle has ceased.2. Fuel spillage should not exceed a total of 142 g in the 5-minute period
following cessation of motion.
Background & Introduction:Upgraded FMVSS No. 301 Tests
3

SAE INTERNATIONAL
Test Condition Table 1
Upgraded rear impact test has a higher level of crash forces, impact velocity, and absorbed crush energy than the prior test.
Phase-In ScheduleNHTSA issued the phase-in schedule on December 1, 2003.
Table 2
Background & Introduction:FMVSS No. 301 Rear Impact Upgrade
4
Model Year (MY) Required Certification Percentage2007 40 %2008 70 %
2009 and later 100 %
Prior Test Upgraded Test
Barrier Rigid Barrier Moving Deformable Barrier (MDB)Weight of Barrier 4,000 lbs. 3,015 lbs.
Impact Speed 30 mph 50 mph
SAE INTERNATIONAL
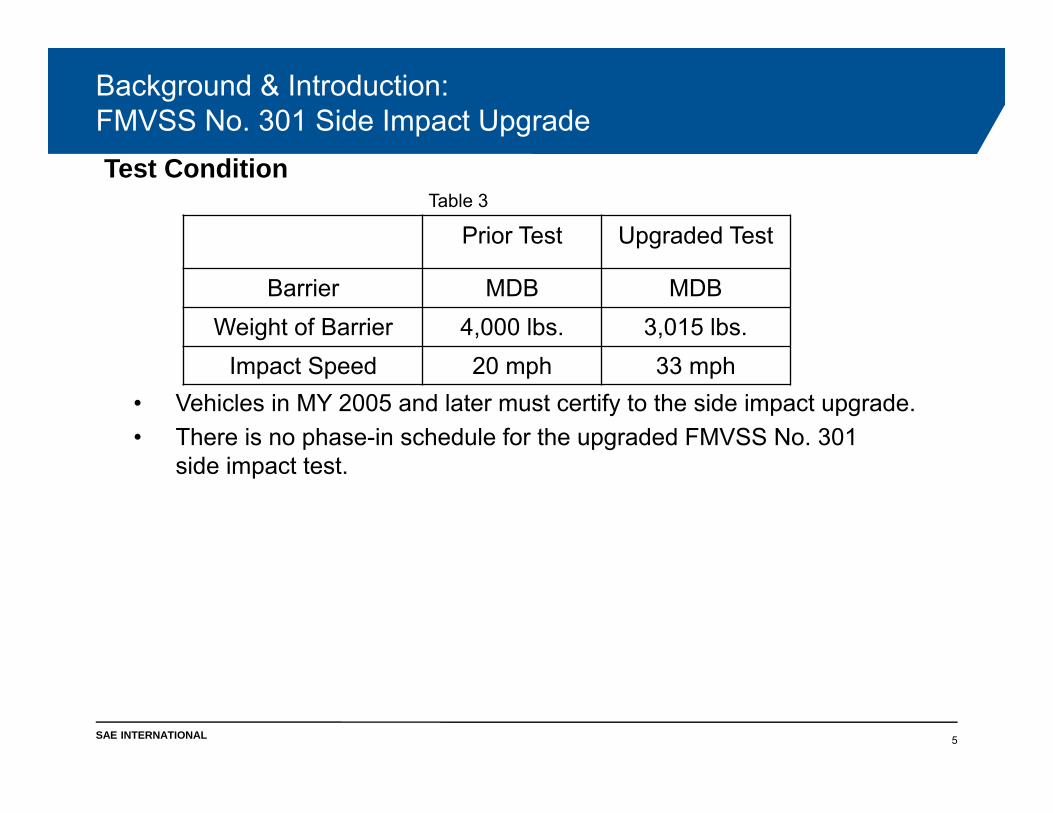
Test ConditionTable 3
• Vehicles in MY 2005 and later must certify to the side impact upgrade. • There is no phase-in schedule for the upgraded FMVSS No. 301
side impact test.
Background & Introduction:FMVSS No. 301 Side Impact Upgrade
5
Prior Test Upgraded Test
Barrier MDB MDBWeight of Barrier 4,000 lbs. 3,015 lbs.
Impact Speed 20 mph 33 mph

SAE INTERNATIONAL
Purpose of EvaluationTo test the effectiveness of the upgraded FMVSS No. 301 in reducing fatal post-crash fires.
Settings of Evaluation• Target Population
Vehicles with GVWR less than 10,000 lbs.• Upgraded Rear Impact Test
• Post-crash-fire related confounding variables (economic climates, gasoline prices) need to be removed.
• MY 2004-2011 and CY 2008-2011• Upgraded Side Impact Test
• New Car Assessment Program (NCAP): only 3 out of 103 vehicles (MY 1997-2000) did not meet the fuel-spillage criterion in the side impact test.
• MY 1995-2011 and CY 1995-2011
Background & Introduction:Purpose and Settings of Evaluation
6

SAE INTERNATIONAL
Fatality Analysis Reporting System (FARS)Principal ImpactThe most severe damaged location in a crash event
Sampling System-Crashworthiness Data System (CDS)• CDS documents the occupants’ injuries based on the data from the
hospitals and treatment facilities.• CDS cannot always identify the exact cause of a fatality.• The injury severity is assessed with the Abbreviated Injury Scale (AIS) from
1 (minor) to 6 (fatal).
Background & Introduction:Database
7
O'clock PositionRear Impact 5, 6, or 7Side Impact 2, 3, 4, 8, 9, or 10

SAE INTERNATIONAL
Odds Ratio and EffectivenessTable 4
• Odds Ratio = (N1N4) / (N2N3)• Effectiveness = 1 – Odds Ratio = 1 - (N1N4) / (N2N3)• The effectiveness indicates the increased/decreased likelihood of the event
occurrence when switching from the control group to the experimental group.
Pearson’s Chi-Squared TestPearson’s Chi-squared test exams whether there is a statistically significant association between the groups and the event occurrences.
Background & Introduction:Statistical Analysis Methods
8
Events No EventsExperimental Group N1 N2
Control Group N3 N4

SAE INTERNATIONAL
MY versus Fatal Post-Crash Fires in Rear ImpactsFARS: MY 2004-2011 and CY 2003-2011
Table 5
There is a significant decrease in the rate of fatal post-crash fires after MY 2007, where is the 1st year of the phase-in schedule.
FMVSS No. 301 Rear Impact Upgrade: Frequency Table of Fatal Post-Crash Fires in Rear Impacts
9
MY Fires No Fires Rate of Fires2004 35 1,320 2.58 %2005 29 1,135 2.49 %2006 22 949 2.27 %2007 19 732 2.53 %2008 5 451 1.10 %2009 2 240 0.83 %2010 1 168 0.59 %2011 1 68 1.45 %

SAE INTERNATIONAL
Certification versus Fatal Post-Crash Fires in Rear Impacts• Manufacturers provided NHTSA the upgrade status of each make model in
every MY since MY 2006.• It is assumed that there is no certified vehicle in MY 2005 or earlier.
Table 6
There is a significant difference in the rate of fatal post-crash fires between the certified group and uncertified group.
FMVSS No. 301 Rear Impact Upgrade: Fire-Reducing Effectiveness
10
FARS: MY 2004-2011 and CY 2008-2011Fires No Fires Rate of Fires
Certified Group 12 1,160 1.02 %Uncertified Group 40 1,680 2.33 %

SAE INTERNATIONAL
Certification versus Fatal Post-Crash Fires in Rear ImpactsTable 7
• If a rear-impacted vehicle switches from the uncertified group to the certified group, then the likelihood of experiencing a fatal post-crash fire willbe reduced by around 57 %.
• The interval estimation is built based on 95 % confidence level.Table 8
There is a statistically significant association between the upgrade certification and fatal post-crash fires in rear impacts.
FMVSS No. 301 Rear Impact Upgrade:Fire-Reducing Effectiveness
11
Point Estimation Interval EstimationOdds Ratio 43.45 % -
Fire-Reducing Effectiveness 56.55 % (16.82 %, 77.31 %)
Pearson’s Chi-Squared Test p-value=0.0097

SAE INTERNATIONAL
CDS: CY 1991-2011• There are 59 fatally injured occupants involving post-crash fires in rear
impacts.• An occupant often experienced more than one injury in a crash. • It is necessary to distinguish:1. Injuries: fatal or non-fatal2. Cause of a fatality: burns or impact trauma
Percentage of Fatalities Attribute to BurnsAssumptions1. In this analysis, injuries with AIS 5 or 6 in a fatality are equally considered to
be potential contributors to the fatality.2. Injuries are mutually independent in a fatality case.
FMVSS No. 301 Rear Impact Upgrade: Percentage of Fatalities Attribute to Burns
12

SAE INTERNATIONAL
• Example 1: AIS 6 BURNSAIS 2 ARM AMPUTATIONAIS 2 ARM AMPUTATION
→ Percentage of fatalities attributable to burns = 100 %• Example 2: AIS 6 BURNS
AIS 5 BRAIN UNK INJURYAIS 3 SKULL FRACTUREAIS 2 LIVER LACERATIONAIS 2 SPLEEN LACERATION
→ Percentage of fatalities attributable to burns = 50 %• Based on 59 cases in CDS: CY 1991-2011:
The overall estimated percentage of fatalities attributable to burns is 62.23 %.
FMVSS No. 301 Rear Impact Upgrade: Percentage of Fatalities Attribute to Burn
13

SAE INTERNATIONAL
Life-Saving Effectiveness• Life-saving effectiveness indicates the reduction in the likelihood of
experiencing fatal burns in a rear impact fire.• Life-Saving Effectiveness
= (Fire-Reducing Effectiveness) X (Percentage of Fatalities Attributable to Burns)
Table 9
If a vehicle switches from the uncertified group to the certified group, then the likelihood of experiencing fatal burns in a rear impact fire will be reduced by around 35 % (with range 10.43 % to 47.96 %).
FMVSS No. 301 Rear Impact Upgrade: Life-Saving Effectiveness
14
Point Estimation Interval EstimationFire-Reducing Effectiveness 56.55 % (16.82 %, 77.31 %)
Fatalities Attributable to Burn 62.23 % -
Life-Saving Effectiveness 35.19 % (10.43 %, 47.96 %)

SAE INTERNATIONAL
Adjusted Baseline Fatalities• Removing the life-saving effectiveness from the certified vehicles to
estimate the number of fatalities when all vehicles did not meet the upgraded test.
• Baseline Year: CY 2007-2011FARS: There are 313 fatalities involving rear impact fires in CY 2007-2011.
Table 10 Table 11
• Adjusted baseline fatalities per year is around 65 (323/5).• If all vehicles did not meet the FMVSS No. 301 rear impact upgrade, there
would be around 65 fatalities per year.
FMVSS No. 301 Rear Impact Upgrade: Adjusted Baseline Fatalities
15
With Life-Saving Effectiveness Certified Vehicles 18
Uncertified Vehicles 295Total Fatalities 313
Without Life-Saving Effectiveness Adjusted Certified Vehicles 28
Adjusted Uncertified Vehicles 295Adjusted Baseline Fatalities 323

SAE INTERNATIONAL
Savable Lives in Fatal Rear Impact Fires• Savable Lives per Year
= (Adjusted Baseline Fatalities per Year) X (Life-Saving Effectiveness)Table 12
• If all vehicles met the FMVSS No. 301 rear impact upgrade, the estimated savable lives per year is 23 (with range 7 to 31).
FMVSS No. 301 Rear Impact Upgrade: Savable Lives in Rear Impact Fires
16
Point Estimation Interval EstimationAdjusted Baseline Fatalities per Year 65 -
Life-Saving Effectiveness 35.19 % (10.43 %, 47.96 %)Savable Lives per Year 23 (7, 31)

SAE INTERNATIONAL
MY versus Fatal Post-Crash Fires in Side ImpactsFARS: MY 1995-2011 and CY 1995-2011
Table 13
There is no significant decrease in the rate of fatal post-crash fires after MY 2005, where is the begin of the side impact upgrade.
FMVSS No. 301 Side Impact Upgrade: Frequency Table of Fatal Post-Crash Fires in Side Impacts
17
MY Fires No Fires Rate of Fires1995 220 10,651 2.02 %1996 189 8,680 2.13 %1997 184 8,884 2.03 %1998 172 8,028 2.10 %1999 165 8,170 1.98 %2000 145 7,586 1.88 %2001 146 6,471 2.21 %2002 122 5,768 2.07 %
MY Fires No Fires Rate of Fires2003 100 4,819 2.03 %2004 86 3,975 2.12 %2005 72 3,191 2.21 %2006 51 2,430 2.06 %2007 41 1,685 2.38 %2008 29 1,065 2.65 %2009 3 426 0.70 %2010 7 273 2.50 %

SAE INTERNATIONAL
Groups of MY versus Post-Crash Fires in Side Impacts• Manufacturers did not provide NHTSA the status information of the side
impact upgrade.• Side-impacted vehicles with fatal post-crash fires are grouped by MY 2005.
Table 14
• There is no significant difference in the rate of fires between two groups of MY.
FMVSS No. 301 Side Impact Upgrade: Fire-Reducing Effectiveness
18
FARS: MY 1995-2011 and CY 1995-2011Fires No Fires Rate of Fires
MY ≥ 2005 133 6,005 2.17 %MY ≤ 2004 1,601 76,223 2.06 %

SAE INTERNATIONAL
Groups of MY versus Post-Crash Fires in Side ImpactsTable 15
• There is no statistically significant association between two groups of MY and fatal post-crash fires in sides impacts.
• A large proportion of vehicles may have already complied with the side impact upgrade before NHTSA requested the upgrade certification.
FMVSS No. 301 Side Impact Upgrade:Fire-Reducing Effectiveness
19
Pearson’s Chi-Squared Test p-value=0.5610

SAE INTERNATIONAL
FMVSS No. 301 Rear Impact Upgrade• The rear impact upgrade shows a statistically significant likelihood reduction
in fatal post-crash fires by 57 %. • The rear impact upgrade would reduce 35 % of the fatalities caused by rear
impact fires. • The rear impact upgrade would save an estimated 23 lives per year.
FMVSS No. 301 Side Impact UpgradeThe side impact upgrade did not show a statistically significant likelihood reduction in fatal post-crash fires.
Summary
20

SAE INTERNATIONAL
Evaluation ReportYou may access the report in PDF format at http://www-nrd.nhtsa.dot.gov/Pubs/812038.pdf
Contact InformationJia-Ern [email protected](202)366-2570
Thank You
21
This is a U.S. Government work and may be copied and distributed without permission.