evaluation of foot arch in adult women: comparison between ... shaliza mohd shariff.pdf ·...
TRANSCRIPT
Sains Malaysiana 46(10)(2017): 1839–1848 http://dx.doi.org/10.17576/jsm-2017-4610-22
Evaluation of Foot Arch in Adult Women: Comparison between Five Different Footprint Parameters
(Penilaian Lengkung Kaki pada Wanita Dewasa: Perbandingan antara Lima Parameter Jejak Kaki yang Berbeza)
SHALIZA MOHD SHARIFF, THAMILVAANI MANAHARAN, ASMA AHMAD SHARIFF & AMIR FEISAL MERICAN*
ABSTRACT
Foot arch determines the shape of the foot, whether it is normal, flat or high. Excessive body weight is known to be the main factor in altering the foot arches. The foot arches of adult women were determined based on five different footprint parameters (Clarke index, Chippaux-Smirak index, Staheli index, Arch index and the Harris-imprint index) and the relationship between Body Mass Index (BMI) and foot arches were studied. A total of 309 adult women from the age of 20 to 60 years were recruited in this study. The shape of participants’ feet were obtained and their left and right foot arches were determined using five different footprint parameters. Body weight and height were measured and BMI was calculated. Paired t-test and one-way ANOVA were applied to perform the statistical analysis. Our analysis showed that two third of the participants have different foot arches between the left and right feet. The Harris-imprint index exhibited the most significant (p=0.004) differences between the left (mean=0.168) and right (mean=1.011) foot arches. Most of the overweight (53%) and obese (15%) participants have normal arches; however the prevalence of flat and high arches is still higher in overweight (flat arch= 51%; high arch= 52% ) and obese (flat arch= 18%; high arch= 12%) compared to other BMI categories. Harris-imprint index was successfully studied as a suitable parameter in determining the left and right foot arches.
Keywords: Body mass index; footprints; foot arch; obesity; women
ABSTRAK
Lengkung kaki dapat menentukan bentuk kaki, sama ada ia adalah normal, rata atau tinggi. Berat badan berlebihan dikenal pasti sebagai faktor utama dalam mengubah bentuk lengkung kaki. Lengkung kaki wanita dewasa ditentukan berdasarkan lima parameter bentuk tapak kaki (Indeks Clarke, indeks Chippaux-Smirak, indeks Staheli, indeks Arch dan indeks Harris-imprint) yang berbeza dan hubungan antara Indek Jisim Tubuh (BMI) dan lengkung kaki adalah diperhatikan dalam kajian ini. Seramai 309 wanita dewasa yang berumur 20 hingga 60 tahun telah mengambil bahagian dalam kajian ini. Bentuk tapak kaki peserta telah diperoleh dan lengkung kaki kiri dan kanan mereka telah ditentukan dengan menggunakan lima parameter yang berbeza. Berat badan dan ketinggian diukur dan BMI dikira. Ujian-t dan ANOVA sehala telah digunakan untuk menjalankan analisis statistik. Keputusan statistik analisis menunjukkan bahawa dua pertiga daripada peserta mempunyai lengkung kaki yang berbeza antara kiri dan kaki kanan. Indeks Harris-imprint menunjukkan (p=0.004) perbezaan yang ketara antara lengkung kaki kiri (purata=0.168) dan kanan (purata=1.011). Kebanyakan peserta mempunyai berat badan berlebihan (53%) dan mereka yang obes (15%) mempunyai lengkung kaki yang normal; bagaimanapun kelaziman gerbang kaki yang rata dan tinggi masih mempunyai peratusan lebih tinggi dalam kategori berat badan berlebihan (lengkung kaki rata= 51%; lengkung kaki tinggi= 52%) dan obes (lengkung kaki rata= 18%; lengkung kaki tinggi= 12% ). Indeks Harris-jejak telah berjaya dikaji sebagai parameter yang sesuai dalam menentukan lengkung kaki kiri dan kanan.
Kata kunci: Indeks jisim tubuh; lengkung kaki; obesiti; tapak kaki; wanita
INTRODUCTION
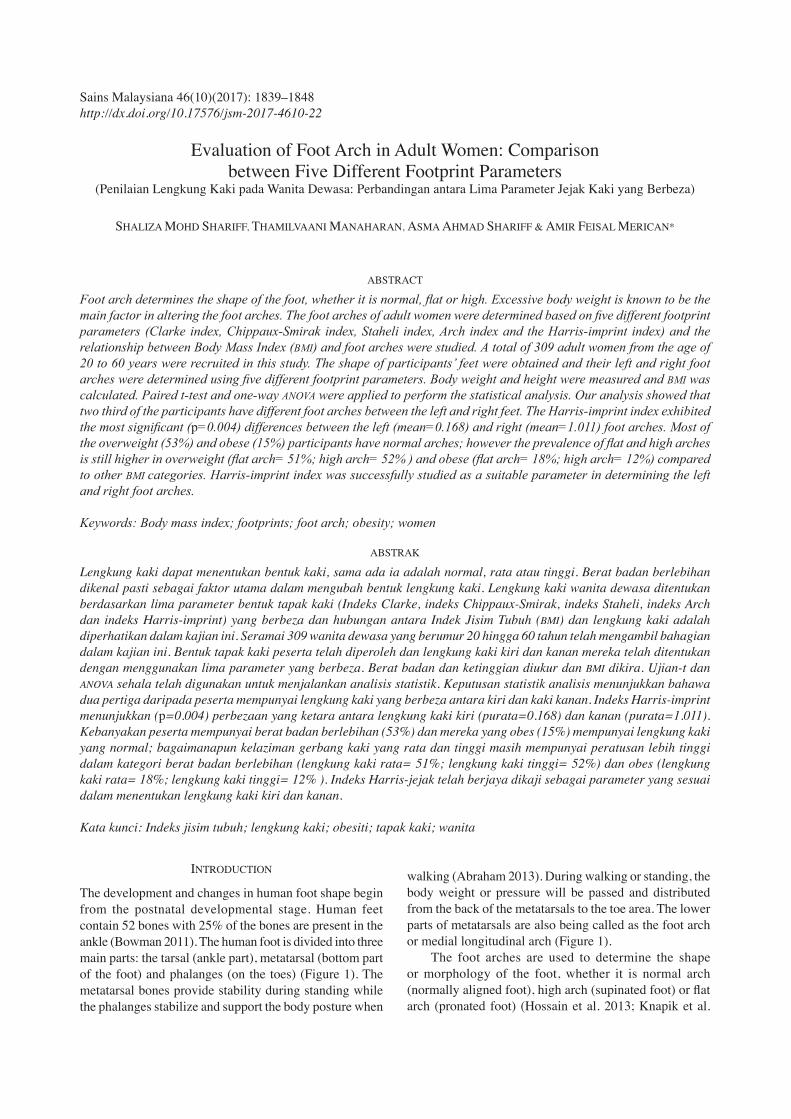
The development and changes in human foot shape begin from the postnatal developmental stage. Human feet contain 52 bones with 25% of the bones are present in the ankle (Bowman 2011). The human foot is divided into three main parts: the tarsal (ankle part), metatarsal (bottom part of the foot) and phalanges (on the toes) (Figure 1). The metatarsal bones provide stability during standing while the phalanges stabilize and support the body posture when
walking (Abraham 2013). During walking or standing, the body weight or pressure will be passed and distributed from the back of the metatarsals to the toe area. The lower parts of metatarsals are also being called as the foot arch or medial longitudinal arch (Figure 1). The foot arches are used to determine the shape or morphology of the foot, whether it is normal arch (normally aligned foot), high arch (supinated foot) or flat arch (pronated foot) (Hossain et al. 2013; Knapik et al.
1840
2014; Wozniacka et al. 2013). Footprint parameters act as an essential tool in assessing the foot arch or foot shape (Vijayakumar et al. 2016). These include Footprint index (Xiong et al. 2010), Harris-imprint index (Tedroff et al. 2013), Clarke index (Lopez et al. 2005), Chippaux-Smirak index (Mathieson et al. 1999), Arch length index (Shiang et al. 1998), Truncated arch index (Hawes et al. 1992), Staheli index (Staheli et al. 1987) and Arch index (Cavanagh & Rodgers 1987). It has been reported that Chippaux-Smirak and Staheli indices are the simplest and easiest parameters to determine the foot arches (Ozer & Barut 2012; Patricia et al. 2009). In another study, Arch index has been reported to be the most suitable parameter in assessing the foot morphology (Menz et al. 2012). Current research is moving towards applying Footprint index (Ashna & Sudhish 2014) on pedobarographic images of foot to estimate the foot arch. However, there is no conclusive evidence on which of the footprint index is the most effective footprint parameter in determining the foot arches. Previous studies have reported that an increase in the body weight and Body Mass Index (BMI) literally influence our foot arch, especially those with flat foot (Agic et al. 2006; Vijayakumar et al. 2016). In overweight and obese individuals, changes in their foot shape were observed due to excessive biomechanical loading and pressure (Crosbie & Burns 2008; Silveri 2015). In addition, foot pain was reported as a common problem in overweight and obese individuals (Butterworth et al. 2012; Tanamas et al. 2012). Overweight and obese individuals with either flat arch or high arch are at high risk of getting foot injuries and foot pain (Domjanic et al. 2013). Hence, the aim of this study was to determine the left and right foot arches of women based on five different footprint parameters; Clarke index, Chippaux-Smirak index, Staheli index, Arch index and the Harris-imprint index. We also evaluate the prevalence of flat arch and high arch among overweight and obese participants, in order to establish the relationship between BMI and foot arches by using different footprint parameters.
MATERIALS & METHODS
ETHICAL APPROVAL AND CONSENT
This research work has been conducted in accordance with the declaration of Helsinki and has been approved by the University of Malaya Research Ethic Committee (UMREC) with reference number: UM.TNC2/RC/H&E/UMREC-49. All participants were provided written informed consent prior to participating in this research study.
PARTICIPANTS
A total of 309 adult women participants were randomly recruited from various locations (Shah Alam, Petaling Jaya, Puncak Alam, Klang, Gombak, Puchong and Subang) in the state of Selangor, Malaysia, from August 2014 to October 2016. Selangor is the most populated state with multi-ethnic citizens (5.78 million) among all the 13 states in Malaysia (Malaysian Population Clock 2013). The participants were recruited based on age range 20 to 60 years and ethnic groups; Malay (n=167), Chinese (n=80) and Indian (n=62). The response rate of the sampling was about 62%. The sample size (n) was calculated by using GPower analysis version 3.1.9.2 (Faul et al. 2009). The population effect size (medium effect size f=0.25) determination indicated that a minimum sample size of 305 produced 95% confidence interval with α=0.05 and 1-β=0.95. Thus, the sample size of 309 in this study was deemed sufficient to represent the women in the state of Selangor, Malaysia. The participants were grouped based on their body mass index (BMI, kg/m2) into underweight (BMI≤18.5), normal weight (BMI 21-25), overweight (BMI 26-30), obese (BMI 31-39) and morbid obese (BMI ≥40) (WHO 2015). Socio-demographic characteristics of the participants were obtained through a self-structured questionnaire. The key exclusion criteria applied in this study were pregnant women and those who had a foot injury in less than one year from the date of participation in this study.
EXPERIMENTAL DESIGN
The body weight and height of all the participants were measured by the trained research staffs. The participants were requested to remove their shoes and socks and stand straight on a calibrated body weight scale (Omron HBF 514C). Weight was recorded to the nearest 0.1 kg. For height measurement, participants were required to stand straight on the floor board of the Seca bodymeter scale (Seca, Germany) with their backs to the vertical backboard of the scale. Height was recorded to the nearest 0.1 cm. BMI was calculated as the ratio of weight (kg) to height (m2). Subsequently, the footprint measurement was conducted with all the women participants. The participants were required to clean the soles of their feet with wet tissue to avoid unwanted stain during footprint stamping. The participants’ feet were then sprayed with clear water until the whole surface of the feet was fully
FIGURE 1. Anatomical structure of the human foot. The image shows the three main parts of the foot; tarsals, metatarsals and phalanges and as well the medial longitudinal foot arch. The image was adopted and re-modified from: Home/Anatomy/Anatomy of The Foot: Complete Guide of All Foot Bones
1841
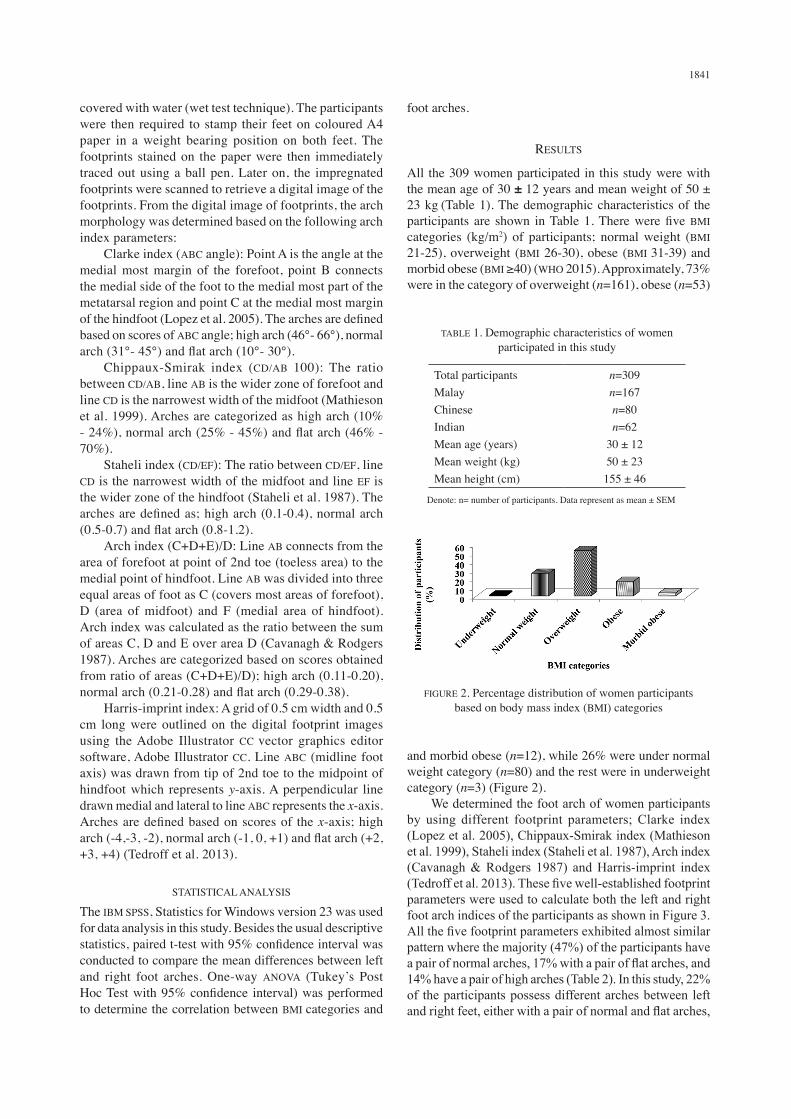
covered with water (wet test technique). The participants were then required to stamp their feet on coloured A4 paper in a weight bearing position on both feet. The footprints stained on the paper were then immediately traced out using a ball pen. Later on, the impregnated footprints were scanned to retrieve a digital image of the footprints. From the digital image of footprints, the arch morphology was determined based on the following arch index parameters: Clarke index (ABC angle): Point A is the angle at the medial most margin of the forefoot, point B connects the medial side of the foot to the medial most part of the metatarsal region and point C at the medial most margin of the hindfoot (Lopez et al. 2005). The arches are defined based on scores of ABC angle; high arch (46°- 66°), normal arch (31°- 45°) and flat arch (10°- 30°). Chippaux-Smirak index (CD/AB 100): The ratio between CD/AB, line AB is the wider zone of forefoot and line CD is the narrowest width of the midfoot (Mathieson et al. 1999). Arches are categorized as high arch (10% - 24%), normal arch (25% - 45%) and flat arch (46% - 70%). Staheli index (CD/EF): The ratio between CD/EF, line CD is the narrowest width of the midfoot and line EF is the wider zone of the hindfoot (Staheli et al. 1987). The arches are defined as; high arch (0.1-0.4), normal arch (0.5-0.7) and flat arch (0.8-1.2). Arch index (C+D+E)/D: Line AB connects from the area of forefoot at point of 2nd toe (toeless area) to the medial point of hindfoot. Line AB was divided into three equal areas of foot as C (covers most areas of forefoot), D (area of midfoot) and F (medial area of hindfoot). Arch index was calculated as the ratio between the sum of areas C, D and E over area D (Cavanagh & Rodgers 1987). Arches are categorized based on scores obtained from ratio of areas (C+D+E)/D); high arch (0.11-0.20), normal arch (0.21-0.28) and flat arch (0.29-0.38). Harris-imprint index: A grid of 0.5 cm width and 0.5 cm long were outlined on the digital footprint images using the Adobe Illustrator CC vector graphics editor software, Adobe Illustrator CC. Line ABC (midline foot axis) was drawn from tip of 2nd toe to the midpoint of hindfoot which represents y-axis. A perpendicular line drawn medial and lateral to line ABC represents the x-axis. Arches are defined based on scores of the x-axis; high arch (-4,-3, -2), normal arch (-1, 0, +1) and flat arch (+2, +3, +4) (Tedroff et al. 2013).
STATISTICAL ANALYSIS
The IBM SPSS, Statistics for Windows version 23 was used for data analysis in this study. Besides the usual descriptive statistics, paired t-test with 95% confidence interval was conducted to compare the mean differences between left and right foot arches. One-way ANOVA (Tukey’s Post Hoc Test with 95% confidence interval) was performed to determine the correlation between BMI categories and
foot arches.
RESULTS
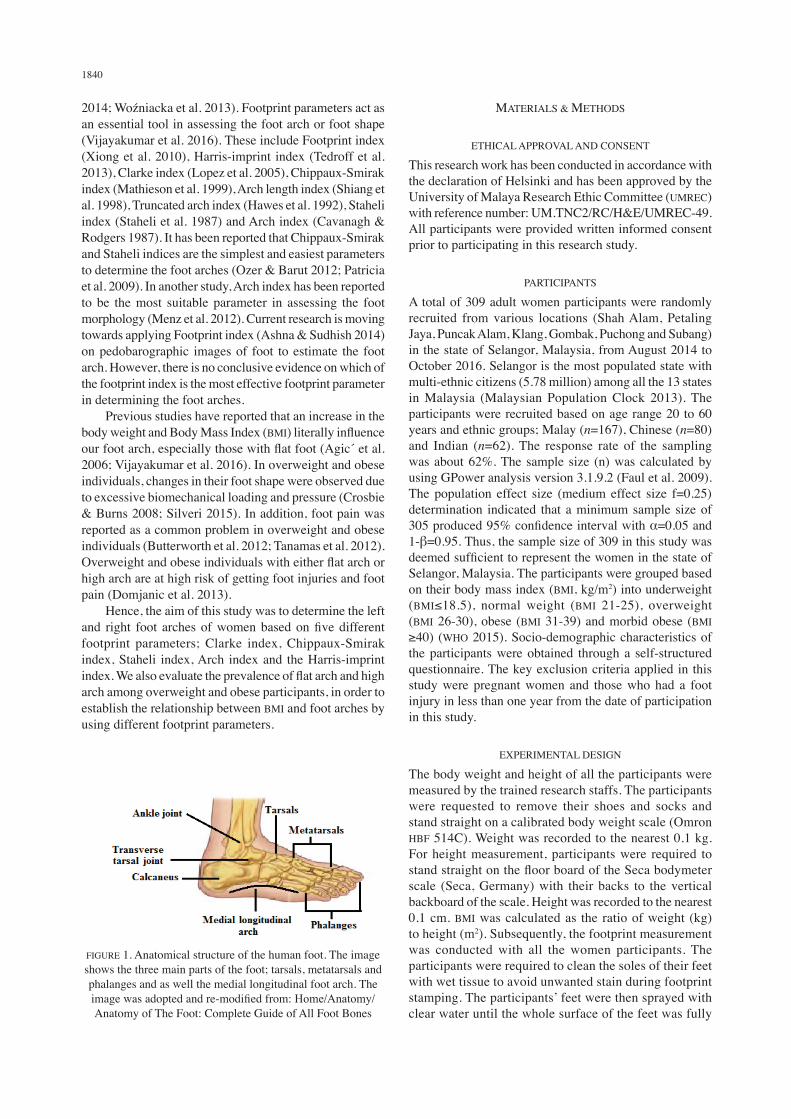
All the 309 women participated in this study were with the mean age of 30 ± 12 years and mean weight of 50 ± 23 kg (Table 1). The demographic characteristics of the participants are shown in Table 1. There were five BMI categories (kg/m2) of participants; normal weight (BMI 21-25), overweight (BMI 26-30), obese (BMI 31-39) and morbid obese (BMI ≥40) (WHO 2015). Approximately, 73% were in the category of overweight (n=161), obese (n=53)
TABLE 1. Demographic characteristics of women participated in this study
Total participants MalayChineseIndianMean age (years)Mean weight (kg)Mean height (cm)
n=309n=167n=80n=62
30 ± 1250 ± 23155 ± 46
Denote: n= number of participants. Data represent as mean ± SEM
FIGURE 2. Percentage distribution of women participants based on body mass index (BMI) categories
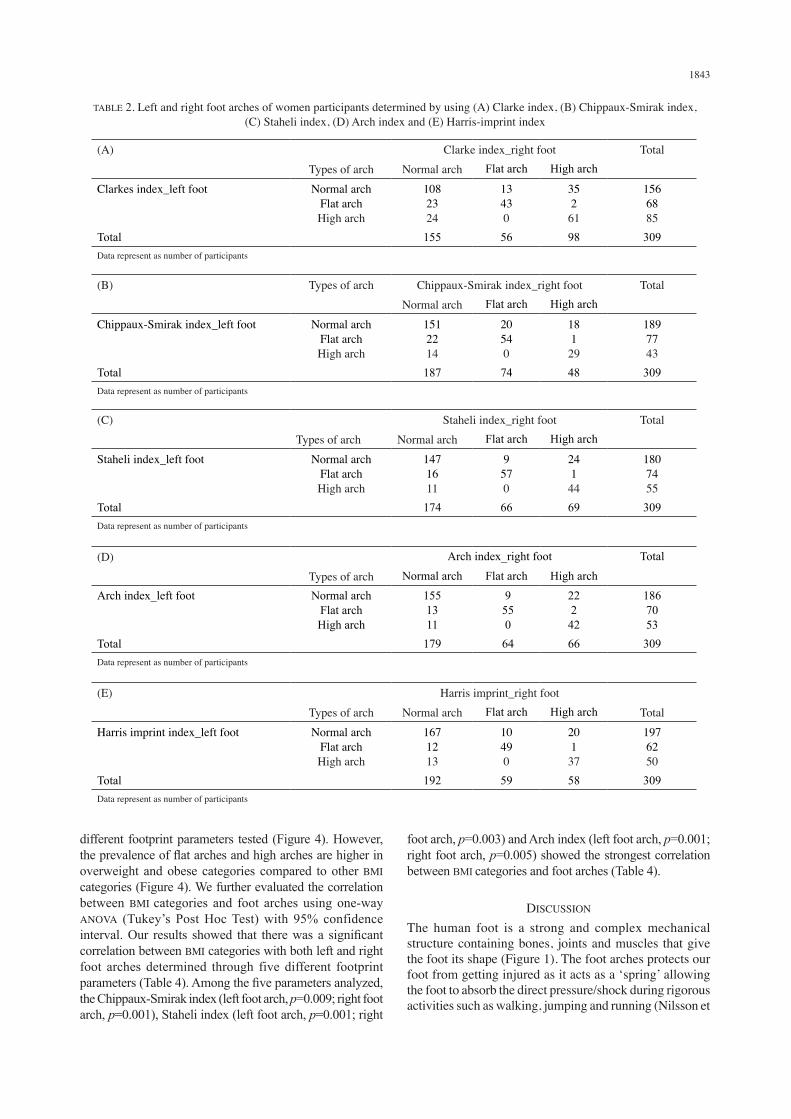
and morbid obese (n=12), while 26% were under normal weight category (n=80) and the rest were in underweight category (n=3) (Figure 2). We determined the foot arch of women participants by using different footprint parameters; Clarke index (Lopez et al. 2005), Chippaux-Smirak index (Mathieson et al. 1999), Staheli index (Staheli et al. 1987), Arch index (Cavanagh & Rodgers 1987) and Harris-imprint index (Tedroff et al. 2013). These five well-established footprint parameters were used to calculate both the left and right foot arch indices of the participants as shown in Figure 3. All the five footprint parameters exhibited almost similar pattern where the majority (47%) of the participants have a pair of normal arches, 17% with a pair of flat arches, and 14% have a pair of high arches (Table 2). In this study, 22% of the participants possess different arches between left and right feet, either with a pair of normal and flat arches,
1842
FIGURE 3. Both left (L) and right (R) foot arches of participants determined through Clarke index, Chippaux-Smirak index, Staheli index, Arch index and Harris-imprint index. The grid outlines (0.5 cm width and 0.5 cm long) with measuring scales (x-axis)
on digital images of footprint, only applied to Harris-imprint index
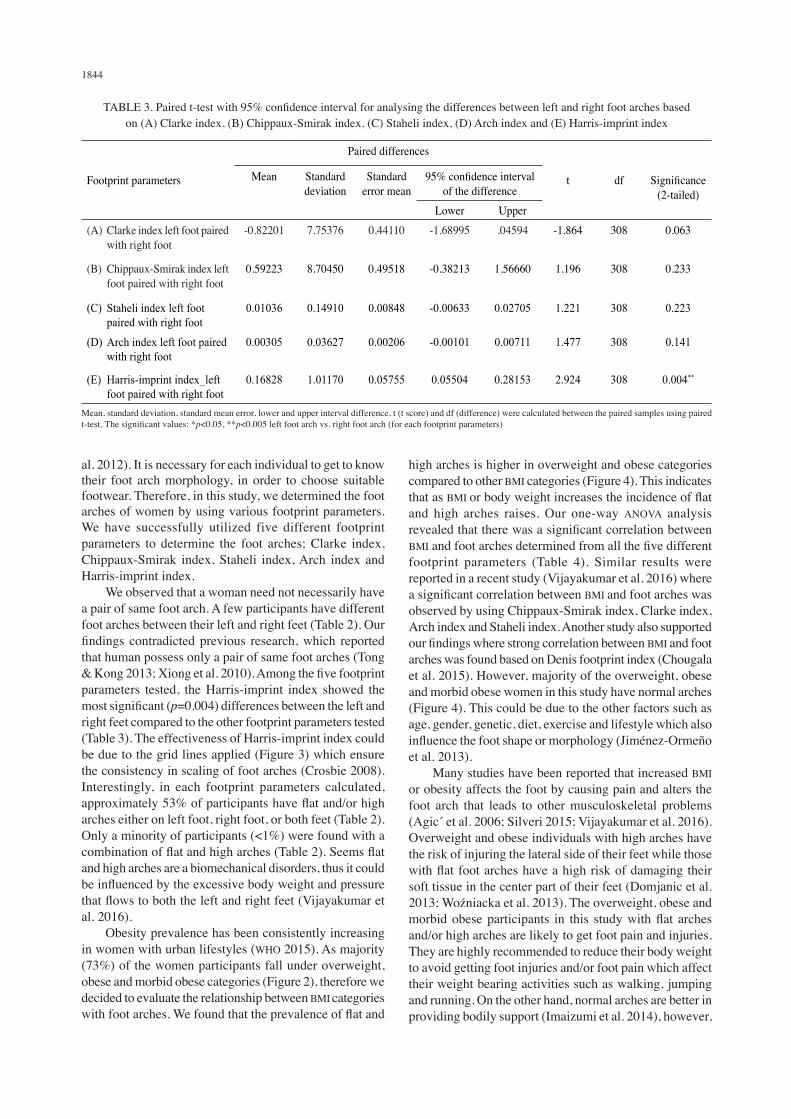
normal and high arches or flat and high arches (Table 2). We further performed paired t-test analysis with 95% confidence interval to identify which footprint parameters show significant differences between left and right feet. We observed that among the five footprint parameters tested, the Harris-imprint index (p=0.004) showed the most significant differences between left and right feet, followed
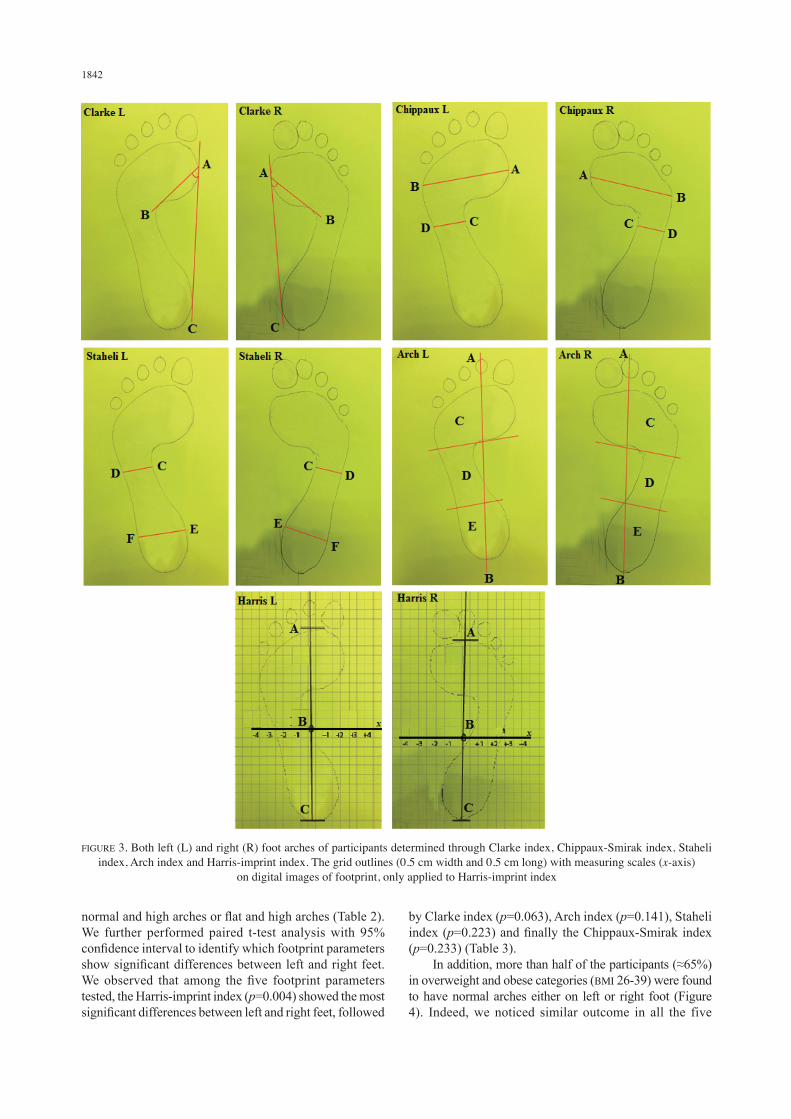
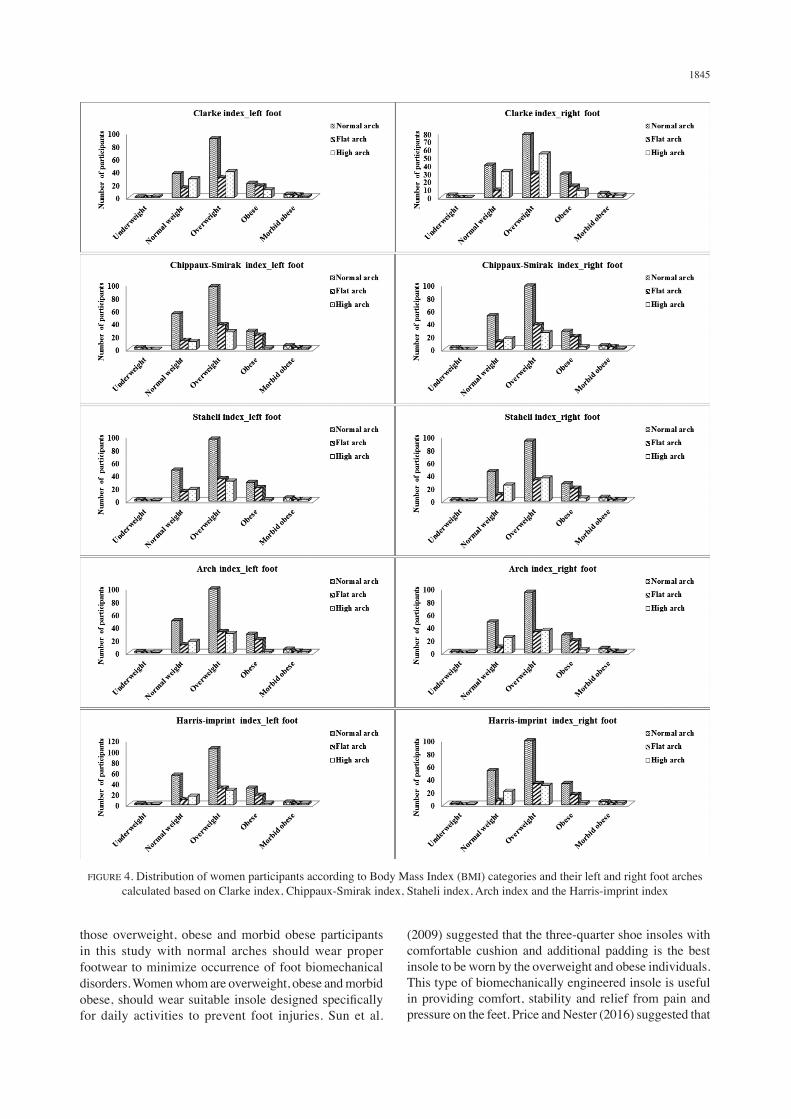
by Clarke index (p=0.063), Arch index (p=0.141), Staheli index (p=0.223) and finally the Chippaux-Smirak index (p=0.233) (Table 3). In addition, more than half of the participants (≈65%) in overweight and obese categories (BMI 26-39) were found to have normal arches either on left or right foot (Figure 4). Indeed, we noticed similar outcome in all the five
1843
TABLE 2. Left and right foot arches of women participants determined by using (A) Clarke index, (B) Chippaux-Smirak index, (C) Staheli index, (D) Arch index and (E) Harris-imprint index
(A) Clarke index_right foot TotalTypes of arch Normal arch Flat arch High arch
Clarkes index_left foot Normal archFlat archHigh arch
1082324
13430
35261
1566885
Total 155 56 98 309Data represent as number of participants
(B)
Types of arch Chippaux-Smirak index_right foot TotalNormal arch Flat arch High arch
Chippaux-Smirak index_left foot Normal archFlat archHigh arch
1512214
20540
18129
1897743
Total 187 74 48 309Data represent as number of participants
(C) Staheli index_right foot TotalTypes of arch Normal arch Flat arch High arch
Staheli index_left foot Normal archFlat archHigh arch
1471611
9570
24144
1807455
Total 174 66 69 309Data represent as number of participants
(D) Arch index_right foot Total
Types of arch Normal arch Flat arch High archArch index_left foot Normal arch
Flat archHigh arch
1551311
9 55 0
22242
1867053
Total 179 64 66 309 Data represent as number of participants
(E) Harris imprint_right footTypes of arch Normal arch Flat arch High arch Total
Harris imprint index_left foot Normal archFlat archHigh arch
1671213
10490
20137
1976250
Total 192 59 58 309 Data represent as number of participants
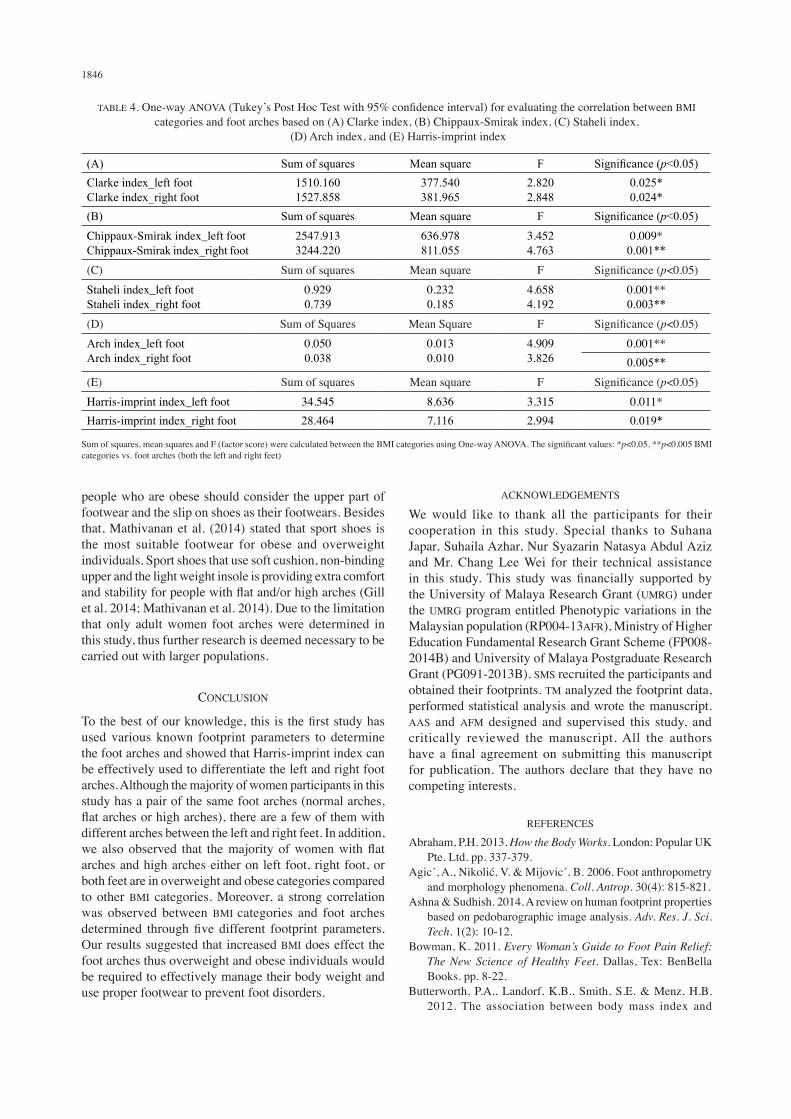
different footprint parameters tested (Figure 4). However, the prevalence of flat arches and high arches are higher in overweight and obese categories compared to other BMI categories (Figure 4). We further evaluated the correlation between BMI categories and foot arches using one-way ANOVA (Tukey’s Post Hoc Test) with 95% confidence interval. Our results showed that there was a significant correlation between BMI categories with both left and right foot arches determined through five different footprint parameters (Table 4). Among the five parameters analyzed, the Chippaux-Smirak index (left foot arch, p=0.009; right foot arch, p=0.001), Staheli index (left foot arch, p=0.001; right
foot arch, p=0.003) and Arch index (left foot arch, p=0.001; right foot arch, p=0.005) showed the strongest correlation between BMI categories and foot arches (Table 4).
DISCUSSION
The human foot is a strong and complex mechanical structure containing bones, joints and muscles that give the foot its shape (Figure 1). The foot arches protects our foot from getting injured as it acts as a ‘spring’ allowing the foot to absorb the direct pressure/shock during rigorous activities such as walking, jumping and running (Nilsson et
1844
al. 2012). It is necessary for each individual to get to know their foot arch morphology, in order to choose suitable footwear. Therefore, in this study, we determined the foot arches of women by using various footprint parameters. We have successfully utilized five different footprint parameters to determine the foot arches; Clarke index, Chippaux-Smirak index, Staheli index, Arch index and Harris-imprint index. We observed that a woman need not necessarily have a pair of same foot arch. A few participants have different foot arches between their left and right feet (Table 2). Our findings contradicted previous research, which reported that human possess only a pair of same foot arches (Tong & Kong 2013; Xiong et al. 2010). Among the five footprint parameters tested, the Harris-imprint index showed the most significant (p=0.004) differences between the left and right feet compared to the other footprint parameters tested (Table 3). The effectiveness of Harris-imprint index could be due to the grid lines applied (Figure 3) which ensure the consistency in scaling of foot arches (Crosbie 2008). Interestingly, in each footprint parameters calculated, approximately 53% of participants have flat and/or high arches either on left foot, right foot, or both feet (Table 2). Only a minority of participants (<1%) were found with a combination of flat and high arches (Table 2). Seems flat and high arches are a biomechanical disorders, thus it could be influenced by the excessive body weight and pressure that flows to both the left and right feet (Vijayakumar et al. 2016). Obesity prevalence has been consistently increasing in women with urban lifestyles (WHO 2015). As majority (73%) of the women participants fall under overweight, obese and morbid obese categories (Figure 2), therefore we decided to evaluate the relationship between BMI categories with foot arches. We found that the prevalence of flat and
high arches is higher in overweight and obese categories compared to other BMI categories (Figure 4). This indicates that as BMI or body weight increases the incidence of flat and high arches raises. Our one-way ANOVA analysis revealed that there was a significant correlation between BMI and foot arches determined from all the five different footprint parameters (Table 4). Similar results were reported in a recent study (Vijayakumar et al. 2016) where a significant correlation between BMI and foot arches was observed by using Chippaux-Smirak index, Clarke index, Arch index and Staheli index. Another study also supported our findings where strong correlation between BMI and foot arches was found based on Denis footprint index (Chougala et al. 2015). However, majority of the overweight, obese and morbid obese women in this study have normal arches (Figure 4). This could be due to the other factors such as age, gender, genetic, diet, exercise and lifestyle which also influence the foot shape or morphology (Jimenez-Ormeno et al. 2013). Many studies have been reported that increased BMI or obesity affects the foot by causing pain and alters the foot arch that leads to other musculoskeletal problems (Agic et al. 2006; Silveri 2015; Vijayakumar et al. 2016). Overweight and obese individuals with high arches have the risk of injuring the lateral side of their feet while those with flat foot arches have a high risk of damaging their soft tissue in the center part of their feet (Domjanic et al. 2013; Wozniacka et al. 2013). The overweight, obese and morbid obese participants in this study with flat arches and/or high arches are likely to get foot pain and injuries. They are highly recommended to reduce their body weight to avoid getting foot injuries and/or foot pain which affect their weight bearing activities such as walking, jumping and running. On the other hand, normal arches are better in providing bodily support (Imaizumi et al. 2014), however,
TABLE 3. Paired t-test with 95% confidence interval for analysing the differences between left and right foot arches based on (A) Clarke index, (B) Chippaux-Smirak index, (C) Staheli index, (D) Arch index and (E) Harris-imprint index
Footprint parameters
Paired differences
t df Significance (2-tailed)
Mean Standard deviation
Standard error mean
95% confidence interval of the difference
Lower Upper(A) Clarke index left foot paired
with right foot-0.82201 7.75376 0.44110 -1.68995 .04594 -1.864 308 0.063
(B) Chippaux-Smirak index left foot paired with right foot
0.59223 8.70450 0.49518 -0.38213 1.56660 1.196 308 0.233
(C) Staheli index left foot paired with right foot
0.01036 0.14910 0.00848 -0.00633 0.02705 1.221 308 0.223
(D) Arch index left foot paired with right foot
0.00305 0.03627 0.00206 -0.00101 0.00711 1.477 308 0.141
(E) Harris-imprint index_left foot paired with right foot
0.16828 1.01170 0.05755 0.05504 0.28153 2.924 308 0.004**
Mean, standard deviation, standard mean error, lower and upper interval difference, t (t score) and df (difference) were calculated between the paired samples using paired t-test. The significant values: *p<0.05, **p<0.005 left foot arch vs. right foot arch (for each footprint parameters)
1845
FIGURE 4. Distribution of women participants according to Body Mass Index (BMI) categories and their left and right foot arches calculated based on Clarke index, Chippaux-Smirak index, Staheli index, Arch index and the Harris-imprint index
those overweight, obese and morbid obese participants in this study with normal arches should wear proper footwear to minimize occurrence of foot biomechanical disorders. Women whom are overweight, obese and morbid obese, should wear suitable insole designed specifically for daily activities to prevent foot injuries. Sun et al.
(2009) suggested that the three-quarter shoe insoles with comfortable cushion and additional padding is the best insole to be worn by the overweight and obese individuals. This type of biomechanically engineered insole is useful in providing comfort, stability and relief from pain and pressure on the feet. Price and Nester (2016) suggested that
1846
people who are obese should consider the upper part of footwear and the slip on shoes as their footwears. Besides that, Mathivanan et al. (2014) stated that sport shoes is the most suitable footwear for obese and overweight individuals. Sport shoes that use soft cushion, non-binding upper and the light weight insole is providing extra comfort and stability for people with flat and/or high arches (Gill et al. 2014; Mathivanan et al. 2014). Due to the limitation that only adult women foot arches were determined in this study, thus further research is deemed necessary to be carried out with larger populations.
CONCLUSION
To the best of our knowledge, this is the first study has used various known footprint parameters to determine the foot arches and showed that Harris-imprint index can be effectively used to differentiate the left and right foot arches. Although the majority of women participants in this study has a pair of the same foot arches (normal arches, flat arches or high arches), there are a few of them with different arches between the left and right feet. In addition, we also observed that the majority of women with flat arches and high arches either on left foot, right foot, or both feet are in overweight and obese categories compared to other BMI categories. Moreover, a strong correlation was observed between BMI categories and foot arches determined through five different footprint parameters. Our results suggested that increased BMI does effect the foot arches thus overweight and obese individuals would be required to effectively manage their body weight and use proper footwear to prevent foot disorders.
ACKNOWLEDGEMENTS
We would like to thank all the participants for their cooperation in this study. Special thanks to Suhana Japar, Suhaila Azhar, Nur Syazarin Natasya Abdul Aziz and Mr. Chang Lee Wei for their technical assistance in this study. This study was financially supported by the University of Malaya Research Grant (UMRG) under the UMRG program entitled Phenotypic variations in the Malaysian population (RP004-13AFR), Ministry of Higher Education Fundamental Research Grant Scheme (FP008-2014B) and University of Malaya Postgraduate Research Grant (PG091-2013B). SMS recruited the participants and obtained their footprints. TM analyzed the footprint data, performed statistical analysis and wrote the manuscript. AAS and AFM designed and supervised this study, and critically reviewed the manuscript. All the authors have a final agreement on submitting this manuscript for publication. The authors declare that they have no competing interests.
REFERENCES
Abraham, P.H. 2013. How the Body Works. London: Popular UK Pte. Ltd. pp. 337-379.
Agic, A., Nikolic, V. & Mijovic, B. 2006. Foot anthropometry and morphology phenomena. Coll. Antrop. 30(4): 815-821.
Ashna & Sudhish. 2014. A review on human footprint properties based on pedobarographic image analysis. Adv. Res. J. Sci. Tech. 1(2): 10-12.
Bowman, K. 2011. Every Woman’s Guide to Foot Pain Relief: The New Science of Healthy Feet. Dallas, Tex: BenBella Books. pp. 8-22.
Butterworth, P.A., Landorf, K.B., Smith, S.E. & Menz, H.B. 2012. The association between body mass index and
TABLE 4. One-way ANOVA (Tukey’s Post Hoc Test with 95% confidence interval) for evaluating the correlation between BMI categories and foot arches based on (A) Clarke index, (B) Chippaux-Smirak index, (C) Staheli index,
(D) Arch index, and (E) Harris-imprint index
(A) Sum of squares Mean square F Significance (p<0.05)Clarke index_left footClarke index_right foot
1510.1601527.858
377.540381.965
2.8202.848
0.025*0.024*
(B) Sum of squares Mean square F Significance (p<0.05)Chippaux-Smirak index_left footChippaux-Smirak index_right foot
2547.9133244.220
636.978811.055
3.4524.763
0.009*0.001**
(C) Sum of squares Mean square F Significance (p<0.05)Staheli index_left footStaheli index_right foot
0.9290.739
0.2320.185
4.6584.192
0.001**0.003**
(D) Sum of Squares Mean Square F Significance (p<0.05)Arch index_left footArch index_right foot
0.0500.038
0.0130.010
4.9093.826
0.001**0.005**
(E) Sum of squares Mean square F Significance (p<0.05)Harris-imprint index_left foot 34.545 8.636 3.315 0.011*Harris-imprint index_right foot 28.464 7.116 2.994 0.019*
Sum of squares, mean squares and F (factor score) were calculated between the BMI categories using One-way ANOVA. The significant values: *p<0.05, **p<0.005 BMI categories vs. foot arches (both the left and right feet)
1847
musculoskeletal foot disorders: A systematic review. Obesity Rev. 13: 630-642.
Cavanagh, P.R. & Rodgers, M.M. 1987. The arch index: A useful measure from footprints. J. Biomech. 20(5): 547-551.
Chougala, A., Phanse, V., Khanna, E. & Panda, S. 2015. Screening of body mass index and functional flatfoot in adult: An observational study quick response code. Int. J. Physiother. Res. 3(3): 1037-1041.
Crosbie, J. & Burns, J. 2008. Are in-shoe pressure characteristics in symptomatic idiopathic pes cavus related to the location of foot pain? Gait & Posture 27: 16-22.
Domjanic, J., Fieder, M., Seidler, H. & Mitteroecker, P. 2013. Geometric morphometric footprint analysis of young women. J. Foot Ankle Res. 27(6): 1-8.
Faul, F. 2009. Statistical power analyses using G*Power 3.1: Tests for correlation and regression analyses. Behv. Res. Methods 41(4): 1149-1160.
Hawes, M.R., Nachbauer, W., Sovak, D. & Nigg, B.M. 1992. Footprint parameters as a measure of arch height. Foot Ankle 13(1): 22-26.
Gill, S.V., Lewis, C.L. & DeSilva, J.M. 2014. Arch height mediation of obesity-related walking in adults: Contributors to physical activity limitations. Physiology Journal 2014: 1-8.
Hossain, P.M.T., Naushaba, H., Ashfaqur, R.M. & Choudhury, S.S. 2013. Types of foot arch of adult Bangladeshi male. Am. J. Med. Sci. Med. 1(4): 52-54.
Imaizumi, K., Iwakami, Y. & Yamashita, K. 2014. Effect of foot load changes on foot arch evaluation using foot pressure distribution data. J. Foot Ankle Res. 7(Suppl 1): A114.
Jimenez-Ormeno, E., Aguado, X., Delgado-Abellan, L., Mecerreyes, L. & Alegre, L.M. 2013. Foot morphology in normal-weight, overweight, and obese schoolchildren. Eur. J. Pediatr. 172(5): 645-652.
Knapik, J.J., Jones, B.H., Trone, D.W. & Tchandja, J. 2014. Injury-reduction effectiveness of prescribing running shoes on the basis of foot arch height: Summary of military investigations. J. Orthop. Sports Phys. Ther. 44(10): 805-812.
Lopez, N., Alburquerque, F., Santos, M., Sanchez, M. & Dominguez, R. 2005. Evaluation and analysis of the footprint of young individuals. A comparative study between football players and non-players. Eur. J. Ana. 9(3): 135-142.
Malaysian Population Clock. http://www.statistics.gov.my.Mathieson, I., Upton, D. & Birchenough, A. 1999. Comparison
of footprint parameters calculated from static and dynamic footprints. The Foot 9(3): 145-149.
Mathivanan, S., Mohan, R., Gopalakrisna, G. & Nath Das, B. 2014. Design innovations of footwear for overweight/obese people. http://icams.ro/icams/editii/2014/download/2014/full_papers/6_Innovation/7-design-innovations-on-footwear-for-overweight-obese-people.pdf.
Menz, H.B., Fotoohabadi, M.R., Wee, E. & Spink, M.J. 2012. Visual categorization of the arch index: A simplified measure of foot posture in older people. J. Foot Ankle Res. 5(10): 1-7.
Nilsson, M.K., Friis, R., Michaelsen, M.S., Jakobsen, P.A. & Nielsen, R.O. 2012. Classification of the height and flexibility of the medial longitudinal arch of the foot. J. Foot Ankle Res. 5(3): 1-9.
Ozer, C.M. & Barut, C. 2012. Evaluation of the sole morphology of professional football players. Int. Sport Med. J. 13(1): 8-17.
Patricia, A.O.P., Isabel, C.N.S. & Silvia, M.A.J. 2009. Foot posture and classification of the plantar arch among adolescent wearers and non-wearers of high-heeled shoes.
Braz. J. Phys. Ther. 13(5): 398-404.Price, C. & Nester, C. 2016. The effect of aging, obesity and
diabetes on foot and general health and wellbeing, and its association with current and future footwear technologies. usir.salford.ac.uk/41223/3/The%20effect%20of%aging_ AuthorCopy.pdf.
Shiang, T.Y., Lee, S.J. & Chu, W.C. 1998. Evaluating different footprint parameters as a predictor of foot arch height. Foot Ankle 7(6): 62-66.
Silveri, C.P. 2015. Back Pain and Obesity: Obesity’s Connection to Back Pain. http://www.spineuniverse.com/conditions/back-pain/back-pain-obesity.
Staheli, L.T., Chew, D.E. & Corbett, M. 1987. The longitudinal arch. J. Bone Joint Surg. 69A(3): 426-428.
Sun, S.P., Chou, Y.J. & Sue, C.C. 2009. Classification and mass production technique for three-quarter shoe insoles using non-weight-bearing plantar shapes. Applied Ergonomics 40(4): 630-635.
Tanamas, S.K., Wluka, A.E., Berry, P., Menz, H.B., Strauss, B.J. & Davies-Tuck, M. 2012. Relationship between obesity and foot pain and its association with fat mass, fat distribution and muscle mass. Arthritis Care Res 64: 262-268.
Tedroff, K., Eriksson, J.M. & Bejerot, S. 2013. What has feet to do with it? Pes planus and medial arch height in adults with and without autism spectrum disorder. Res. Autism. Spectr. Disord. 7(1): 187-192.
Tong, J.W. & Kong, P.W. 2013. Association between foot type and lower extremity injuries: Systematic literature review with meta-analysis. J. Orthop. Sports Phys. Ther. 43(10): 700-714.
Vijayakumar, K., Kumar, S.S. & Subramanian, R. 2016. Study on relationship between BMI and prevalence of flat foot among the adults using footprint parameters. Int. J. Adv. Res. 4(5): 1428-1431.
World Health Organization (WHO). 2015. Overweight and obesity fact sheet N°311 updated January 2015.
Wozniacka, R., Bac, A., Matusik, S., Szczygieł, E. & Ciszek, E. 2013. Body weight and the medial longitudinal foot arch: High-arched foot, a hidden problem? Eur. J. Pediatr. 172(5): 683-691.
Xiong, S., Goonetilleke, R.S., Witana, C.P., Weerasinghe, T.W. & Au, E.Y. 2010. Foot arch characterization: A review, a new metric, and a comparison. J. Am. Podiatr. Med. Assoc. 100(1): 14-24.
Shaliza Mohd Shariff, Thamilvaani Manaharan, Asma Ahmad Shariff & Amir Feisal Merican*Centre of Research for Computational Sciences and Informatics in Biology Bio industry, Environment, Agriculture and Healthcare (CRYSTAL) University of Malaya50603 Kuala Lumpur, Federal Territory Malaysia
Shaliza Mohd Shariff Institute of Postgraduate StudiesUniversity of Malaya 50603 Kuala Lumpur, Federal Territory Malaysia

1848
Asma Ahmad ShariffCentre for Foundation Studies in ScienceUniversity of Malaya 50603 Kuala Lumpur, Federal Territory Malaysia
Amir Feisal Merican*Institute of Biological SciencesUniversity of Malaya 50603 Kuala Lumpur, Federal Territory Malaysia
Shaliza Mohd ShariffFashion Department, Faculty of Art and Design Universiti Teknologi MARA40450 Shah Alam, Selangor Darul Ehsan Malaysia
*Corresponding author; email: [email protected]
Received: 22 February 2017Accepted: 31 March 2017