evaluation of fresh-market potential of arkansas-grown
TRANSCRIPT

University of Arkansas, FayettevilleScholarWorks@UARK
Theses and Dissertations
1-2018
Evaluation of Fresh-market Potential of Arkansas-grown Fruit: Blackberries, Peaches, Table Grapes,and Muscadine GrapesMolly FeltsUniversity of Arkansas, Fayetteville
Follow this and additional works at: http://scholarworks.uark.edu/etd
Part of the Food Processing Commons, Fruit Science Commons, and the HorticultureCommons
This Thesis is brought to you for free and open access by ScholarWorks@UARK. It has been accepted for inclusion in Theses and Dissertations by anauthorized administrator of ScholarWorks@UARK. For more information, please contact [email protected], [email protected].
Recommended CitationFelts, Molly, "Evaluation of Fresh-market Potential of Arkansas-grown Fruit: Blackberries, Peaches, Table Grapes, and MuscadineGrapes" (2018). Theses and Dissertations. 2721.http://scholarworks.uark.edu/etd/2721
Evaluation of Fresh-market Potential of Arkansas-grown Fruit: Blackberries, Peaches, Table
Grapes, and Muscadine Grapes
A thesis submitted in partial fulfillment
of the requirements for the degree of
Master of Science in Food Science
by
Molly Felts
University of Oklahoma
Bachelor of Science in Chemistry, 2015
May 2018
University of Arkansas
This thesis is approved for recommendation to the Graduate Council.
____________________________
Renee T. Threlfall, PhD
Thesis Director
____________________________ ____________________________
Luke R. Howard, PhD John R. Clark, PhD
Committee Member Committee Member
____________________________
Margaret L. Worthington, PhD
Committee Member
Overall Abstract
Fresh-market produce is a major component of commercial market sales. However, shelf-
life of fresh-market produce is limited, so evaluating postharvest potential (time from harvest to
consumption) is critical. Fresh-market fruit can be impacted by many factors that deteriorate the
quality of the fruit. Understanding the postharvest physiology of fruit can lead to better handling
and storage conditions for extended shelf life and enhanced quality for the consumer. This
research project was a collaborative effort within the University of Arkansas System Division of
Agriculture between the Food Science and Horticulture Departments to evaluate the fresh-market
potential of Arkansas-grown fruit. Physiochemical and marketability attributes of fresh-market
blackberries, peaches/nectarines, table grapes, and muscadine grapes were evaluated at harvest
and during postharvest storage. Additionally, the peaches/nectarines and muscadine grapes were
evaluated by a descriptive sensory panel at harvest. Genotype played a critical role in the fresh-
market fruit evaluated in this study. Storage day and storage temperature also had an impact on
postharvest quality of the nine fresh-market blackberry genotypes evaluated, but harvest time
had minimal impact. Blackberries stored at a lower temperature (2 °C) retained marketable
attributes longer than fruit stored at 10 °C. Descriptive sensory analysis of harvest attributes of
nine peach/nectarine genotypes were correlated to many physiochemical attributes. The
peaches/nectarines had strong fresh-market potential after 21 d storage at 2 °C. The table grape
production method (four high tunnel grown cultivars and six traditionally-grown genotypes) did
not impact physiochemical attributes, but had a greater impact on marketability attributes.
Grapes grown in the high tunnel had more marketable berries and longer shelf life. Descriptive
sensory analysis of six muscadine grape genotypes described appearance and basic taste
attributes and correlated to many physiochemical attributes. The six muscadine grape genotypes

had good retention of composition and marketability attributes indicating potential for fresh-
market after 21 d storage at 2 °C. The fresh-market attributes evaluated for these fruits will assist
in fruit breeding efforts at the University of Arkansas, as well as provide insight into the
commercial potential for growers for these advanced selections and cultivars.
Acknowledgments
I am so grateful for everything I have learned during my time at the University of
Arkansas. Coming into a new university and degree program I did not know what to expect. The
experience I have had was far better than I ever could have dreamt, and this project would not
have been possible without the help of everyone involved. First off, I would like to thank my
advisor, Dr. Renee T. Threlfall, for the guidance she provided as well as the opportunity to work
on a research project that exposed me to so much variety within Arkansas fruit production. I
would also like to thank my committee Dr. John R. Clark, Dr. Margaret L. Worthington, and Dr.
Luke R. Howard for all of their input and assistance with understanding both the horticulture and
food chemistry aspects of my research. In addition, I would like to thank my peers and labmates
that helped me out on my busiest days and keep me out of the lab until 3:00 am: Aubrey
Dunteman, Cindi Brownmiller, Natacha Cereau, Laura Fassier, Mary Siebenmorgan, Taunya
Ernst, Tonya Toker, Bethany Sebesta, and Egan Felgus. Finally, I would also like to thank the
Department of Food Science at the University of Arkansas for the opportunity to conduct
research on something so near and dear to my heart, as well as help me grow as both a chemist
and food scientist.

Dedication
This thesis is dedicated to my friends and family who have supported me through my
studies. First, my husband William “Taylor” Felts, for all of his love, generosity, and support
during this journey. My best friend, Genesis Storms, for being my biggest cheerleader and
pushing me through the difficult days. My undergraduate advisor, Dr. Daniel T. Glatzhofer, for
showing me there is so much more to chemistry than meets the eye. And finally, my mother
Amy Retherford, for her motivation, encouragement, and instilling me with a passion for
education. She showed me that learning is not a chore, but rather a gift to cherish every day and
for that I am forever grateful.
Table of Contents
Overall Introduction ..................................................................................................................... 1
Objectives....................................................................................................................................... 2
Literature Review ......................................................................................................................... 3
Blackberries ............................................................................................................................... 3 Physical characteristics ........................................................................................................... 4
Postharvest handling ............................................................................................................... 4
Firmness and composition ...................................................................................................... 5
Nutraceuticals ......................................................................................................................... 6
Sensory .................................................................................................................................... 6
Peaches/Nectarines .................................................................................................................... 7 Physical characteristics ........................................................................................................... 7
Postharvest handling ............................................................................................................... 8
Firmness and composition ...................................................................................................... 9
Nutraceuticals ....................................................................................................................... 10
Sensory .................................................................................................................................. 10
Table Grapes ........................................................................................................................... 11 Physical characteristics ......................................................................................................... 11
Postharvest handling ............................................................................................................. 12
Firmness and composition .................................................................................................... 13
Nutraceuticals ....................................................................................................................... 13
Sensory .................................................................................................................................. 14
Muscadine Grapes .................................................................................................................. 15 Physical characteristics ......................................................................................................... 15
Postharvest handling ............................................................................................................. 16
Firmness and composition .................................................................................................... 17
Nutraceuticals ....................................................................................................................... 17
Sensory .................................................................................................................................. 18
Literature Cited ...................................................................................................................... 19
Chapter I ...................................................................................................................................... 29
Effects of Harvest Time and Storage Temperature on Postharvest Quality of Arkansas
Blackberry Genotypes .................................................................................................................. 29
Abstract .................................................................................................................................... 29
Introduction ............................................................................................................................. 31
Materials and Methods ........................................................................................................... 34 Blackberry plants and culture ............................................................................................... 34
Blackberry harvest ................................................................................................................ 34
Physiochemical analysis ....................................................................................................... 35
Marketability analysis ........................................................................................................... 37
Design and statistical analysis .............................................................................................. 38
Results and Discussion ............................................................................................................ 38 Physiochemical attributes at harvest ..................................................................................... 39
Physiochemical and marketability attributes during postharvest storage ............................. 41
Conclusion ............................................................................................................................... 47
Literature Cited ...................................................................................................................... 49
Tables ....................................................................................................................................... 52
Figures ...................................................................................................................................... 57
Chapter II .................................................................................................................................... 75
Physiochemical, Marketability, and Sensory Analysis of Arkansas-Grown Peaches and
Nectarines for Fresh Market ....................................................................................................... 75
Abstract .................................................................................................................................... 75
Introduction ............................................................................................................................. 77
Materials and Methods ........................................................................................................... 81 Plants and culture .................................................................................................................. 81
Harvest .................................................................................................................................. 81
Physiochemical analysis. ...................................................................................................... 82
Marketability analysis ........................................................................................................... 86
Descriptive sensory evaluation ............................................................................................. 86
Design and statistical analysis .............................................................................................. 87
Results and Discussion ............................................................................................................ 88 Physiochemical attributes at harvest ..................................................................................... 88
Sensory attributes at harvest ................................................................................................. 91
Correlations between physiochemical and sensory at harvest .............................................. 96
Physiochemical and marketability attributes during postharvest storage ............................. 97
Conclusion ............................................................................................................................. 101
Literature Cited .................................................................................................................... 104
Tables ..................................................................................................................................... 108
Figures .................................................................................................................................... 124
Chapter III ................................................................................................................................. 134
Physiochemical and Marketability Analysis of Traditional and High-Tunnel Grown Arkansas
Table Grapes for Fresh Market ................................................................................................. 134
Abstract .................................................................................................................................. 134
Introduction ........................................................................................................................... 136
Materials and Methods ......................................................................................................... 139 Plants and culture ................................................................................................................ 139
Harvest ................................................................................................................................ 140
Physiochemical analysis ..................................................................................................... 141
Marketability analysis ......................................................................................................... 145
Design and statistical analysis ............................................................................................ 145
Results and Discussion .......................................................................................................... 146 High-tunnel grown table grapes .......................................................................................... 146
Traditionally grown table grapes ........................................................................................ 150
Marketability and texture of table grapes at 21 d storage ................................................... 154
Conclusion ............................................................................................................................. 155
Literature Cited .................................................................................................................... 157
Tables ..................................................................................................................................... 161
Figures .................................................................................................................................... 165
Chapter IV ................................................................................................................................. 179
Physiochemical, Marketability, and Sensory Analysis of Arkansas-Grown Muscadine Grapes
for Fresh Market ........................................................................................................................ 179
Abstract .................................................................................................................................. 179
Introduction ........................................................................................................................... 181
Materials and Methods ......................................................................................................... 184 Plants and culture ................................................................................................................ 184
Harvest ................................................................................................................................ 184
Physiochemical analysis ..................................................................................................... 185
Marketability analysis ......................................................................................................... 189
Descriptive sensory evaluation ........................................................................................... 189
Design and statistical analysis ............................................................................................ 190
Results and Discussion .......................................................................................................... 191 Physiochemical attributes at harvest ................................................................................... 191
Sensory attributes at harvest ............................................................................................... 194
Correlations between physiochemical and sensory attributes at harvest ............................ 197
Physiochemical and marketability attributes during postharvest storage ........................... 200
Conclusion ............................................................................................................................. 202
Literature Cited .................................................................................................................... 205
Tables ..................................................................................................................................... 209
Figures .................................................................................................................................... 222
Overall Conclusions .................................................................................................................. 231
Appendix .................................................................................................................................... 232
1
Overall Introduction
Consumer demand for locally-grown produce has sharply increased across the United
States with increasing economic growth and self-sustaining food systems. Local food is defined
as farmers selling directly to consumers (Martinez, 2010). The United States Department of
Agriculture (2015), reported the increased importance of local sales including direct-to-consumer
(farmer’s markets) and intermediated marketing channels (sales to institutions or regional
distributers). In this report, 85% of farms participating in local food sales were small-scale farms
(<$75,000), and it was found that direct-to-consumer farming led to an increased likelihood to
remain in business. In addition, Martinez (2010) found that local foods in the United States have
the potential to reduce food safety risks, help preserve farmland, develop social capital, and
preserve cultivar genetic diversity.
In Arkansas, agriculture is the largest industry contributing $16 billion annually to the
state’s economy (Farm Bureau of Arkansas, 2016). Within the fresh-market sector, produce such
as tomatoes, melons, peaches, grapes, blueberries, and many more enhance the commodity
diversity. In 2015, these commodities earned $17 million dollars for the state (Arkansas State
Agriculture Overview, 2015), showing the economic importance of fresh-market produce. There
were 107 local farmer’s markets in Arkansas which help stimulate and contribute to the local
economy and of these markets, 53 offered fresh fruits and vegetables to their customers (USDA,
2016).
The University of Arkansas System Division of Agriculture supports research and outreach
in locally-produced fruits. In 1964, the University of Arkansas began its Fruit Breeding Program
directed by Dr. James N. Moore. Over the past five decades, the program has led to the
development of over 50 different fruit cultivars including: blackberries, table grapes, wine

2
grapes, peaches, strawberries, and blueberries (Barchenger, 2014; Clark, 1998; Clark, 2002). The
program focuses on developing fruit cultivars for local fresh-markets, but use of many of the
cultivars has extended far beyond Arkansas to other states and countries. One of the most
successful achievements in the program has been the blackberry breeding efforts, with Arkansas
considered a world leader in the development of new blackberry cultivars for shipping, fresh
market, and home gardeners. The fruit breeding program primarily utilized classical breeding
techniques, but has implemented more molecular breeding (Clark, 2011).
Postharvest storage is critical for fresh-market fruit. Postharvest can be defined as the period
of time from harvest to consumption (Florkowski et al., 2014). Postharvest attributes of fresh-
market produce can be related to texture, flavor, nutraceutical composition, and food safety of
the product. From the moment a fruit or vegetable is picked, the product has a long journey to the
consumer with many critical points where the produce can become unacceptable due to over-
ripening, decay, and handling damage (Florkowski et al., 2014). Understanding postharvest
physiology can lead to better handling and storage conditions for extended shelf life and better
quality produce for the consumer. Cultivars and selections of blackberries, peaches, table grapes,
and muscadines from the University of Arkansas Fruit Breeding Program need to be evaluated
after harvest.
Objectives
1) Effects of harvest time and storage temperature on postharvest quality of Arkansas
blackberry genotypes
2) Physiochemical, marketability, and sensory analysis of Arkansas-grown peaches and
nectarines for fresh-market

3
3) Physiochemical and marketability analysis of traditional and high-tunnel grown Arkansas
table grapes for fresh-market
4) Physiochemical, marketability, and sensory analysis of Arkansas muscadine grapes for
fresh-market
Literature Review
For all horticulture fruit crops, postharvest handling is important, as roughly one-third of
fresh produce is lost at various points in the distribution system (Kader, 2002). In addition,
improving the understanding of the physiochemical and marketability of the fruit aids in
identification of breeding advancements and postharvest handling procedures. In the United
States, fruit is graded on the basis of appearance, texture, composition, and marketability
(USDA, 2018). Enhancement in these categories is an important aspect for the fruit breeder
sincethis improves the overall quality of the fruit and enhances the profit obtained by the grower.
Blackberries
Over the last 20 years, blackberry cultivation has rapidly increased worldwide. North
America is the largest producer by weight of blackberries, whereas Europe has more acreage of
production (~7,700 ha) (Finn and Clark, 2011; Kaume et al., 2011; Strik et al., 2012). In North
America, there is roughly ~7,200 ha of commercially cultivated blackberries, with Central and
South America producing substantially less, ~1,600 ha and ~1,600 ha, respectively. This increase
in popularity has caused a surge of new blackberry breeding plantings, and research. As
indicated by Finn and Clark (2011), worldwide raspberry production paved the way for
blackberry production in the 21st century due to similar characteristics between the fruit.
Blackberries have lower production costs, increased vigor of plants, and greater disease tolerance
than raspberries. Blackberries are now ranked fourth as the most important berry, behind
4
strawberries, blueberries, and red raspberries. Blackberry popularity with consumers continues to
increase due to more commercial availability, sweeter cultivars, and knowledge of health
benefits (Barnett, 2007; Finn and Clark, 2011).
Physical characteristics
Blackberries come in many sizes and shapes due to variations in the genetic makeup of
cultivars. In a study by Threlfall et al. (2016), significant variation with respect to weight, length,
width, and number of drupelets per berry was found between multiple genotypes. In contrast to
wild blackberries, cultivated blackberries had greater size but lower soluble solids, titratable
acidity, and pH (Yilmaz et al., 2009). With the rise of blackberry breeding efforts, advancements
in cultivated blackberries have occurred such as the development of thornless plants, erect cane
architecture, increased fruit firmness, and development of primocane-fruiting cultivars (Clark
and Moore, 1999; Clark, 2005; Moore, 1984; Moore and Clark, 1993). Of the three cane types
(erect, semi-erect, and trailing), erect blackberries are grown for fresh-market systems, and they
are easier to harvest by hand (Strick and Finn, 2011). In 2005, the first commercial primocane-
fruiting cultivars, ‘Prime-Jim®’ and ‘Prime-Jan®’, were released from the University of
Arkansas’s Fruit Breeding Program (Clark et al., 2005). Primocane-fruiting blackberries produce
fruit on both current-season canes (primocanes) and second-season canes (floricanes).
Primocane-fruiting blackberries can produce larger and firmer berries from the primocanes
versus floricanes (Segantini et al., 2018). However, when both crops are harvested in a season,
yield and berry size were substantially less for the primocanes (Clark and Perkins-Veazie, 2011)
Postharvest handling
Another important aspect of blackberries is the effect that storage has on the
marketability of the fruit. Caneberries, such as blackberries, have extremely perishable
5
characteristics that can be affected by poor harvest and handling procedures; as well as improper
storage temperatures, leading to fruit deterioration and decreased marketability (Kader, 2002).
Mold growth is a primary concern on fresh-market berries during postharvest storage of which
Botrytis cinerea Pers. and B. caroliniana, also known as gray mold, are the predominant species
(Li et al., 2012). B. cinerea kills host cells before colonizing dead tissue on the fruit. Although
optimum growth of B. cinerea is at 20 C, its ability to grow at colder temperatures (as low as 0
C) leads to slow decay during storage of fresh-market fruit (Bautista-Banos, 2014). Modified
atmosphere packaging can improve storage potential of fruit. In addition, type of storage
container, packing procedures, storage temperature, and humidity affect marketability of the fruit
(Joo et al., 2011). Kim et al. (2015) found that fruit stored at 1 C retained a consistent
marketability, however when removed from cold storage and placed in room temperature, fruit
deterioration rapidly increased. Other research has shown storage temperature was directly
related to degree of deterioration (de Arruda Palharini et al., 2015; Perkins-Veazie et al., 1999;
Perkins-Veazie and Clark, 2005; Segantini et al., 2018).
Firmness and composition
Blackberry composition varies by genotype. A study by Carvalho and Batancur (2015) on
two Andean blackberry cultivars, ‘Pantanillo’ and ‘Guapante’, found that the firmness of the
fruit was 0.1-0.3 N when the fruit was at a maturity stage of 5 and 6, e.g. ready for consumption.
In that study, the texture was analyzed by compression using a texture analyzer. A study on 52
cultivated and wild blackberry cultivars in the United States, indicated that the soluble solids,
titratable acidity, and pH ranged between 6.88%-16.83%, 0.52%-2.24%, and 2.65-3.61
respectively (Fan-Chiang and Wrolstand, 2010). Threlfall et al. (2016) found, using descriptive
and consumer sensory analysis, that a desired blackberry should have a berry weight of 8-10 g,
6
soluble solids of 9%-11%, titratable acidity of 0.9%-1.0%, and a soluble solids/titratable acidity
ratio of 10-13. Organic acids and sugars in blackberries grown in Turkey and Spain had equal
amounts of glucose and fructose as well as small amounts of sucrose in the fruit. Additionally,
malic acid was the predominant acid with ascorbic acid in some cultivars and no citric acid
present (Kafkas et al., 2006; Romero Rodriguez et al., 1992; Yin, 2017). However, studies in
Solvenia and the United States have shown citric acid in equal or greater amounts than malic
acid (Fan-Chiang and Wrolstad, 2010; Mikulic et al., 2012; Segantini et al., 2018)
Nutraceuticals
Nutraceuticals are a food or part of a food that can provide extra health benefits in
addition to the basic nutritional value of the food. They can help prevent chronic diseases and
improve different facets of health by working in with other vitamins and nutrients naturally
present in fruits and vegetables (Kaur, 2016). Blackberries have numerous nutraceutical
compounds. Anthocyanins, phenols such as ellagic acid, catechin, quercetin, and ferulic acid, as
well as polymeric phenols such as ellagitannins and proanthocyanidins are present (Lee et al.,
2012). Genetics, growing conditions, and maturation influence blackberry phenolic composition
(Kaume et al., 2011). In a study by Ali et al. (2011), antioxidant levels were influenced by both
pre- and post- harvest factors and total anthocyanin and phenolic content decreased during
postharvest storage at 2 C while ellagic acid content remained the same. Cavender et al. (2014)
found that certain cultural practices, such as weed management, had a significant effect of the
antioxidant properties of the fruit.
Sensory
Sensory analysis is a useful tool for identifying various qualities of a fruit that may
otherwise be difficult to quantify. In a study by Perkins-Veazie and Collins (2002), consumer

7
sensory analysis was used as a tool for identification of off-flavors in fresh-market blackberries
stored in a controlled atmosphere. In the study, they found that while monomeric anthocyanin
content was decreasing, no off-flavors were detected with 3 or 7 d of storage in the controlled
atmosphere. In a study by Segantini et al. (2017), a combination of physiochemical and
descriptive sensory analyses showed promise in assisting blackberry breeders in developing
superior fruit with extended postharvest storage.
Peaches/Nectarines
Peaches have been grown worldwide for centuries. Cultivation of the fruit began around
6050 BC in an eastern province of China and recently fossilized peach pits have been found
dating back 2.5 million years to the late Pliocene, in southwest China (Feltman, 2015; Zheng et
al., 2014). In 1997, peaches were the second most-grown fruit crop in the world, behind apples,
at roughly 9.1 million metric tons (Fideghelli et al., 1997). Peach and nectarine production has
doubled with roughly 22 million metric tons produced, with 45% of the production occurring in
China (Food and Agricultural Organization, 2016). In 2016, the United States was ranked 4th in
world peach production behind China, Spain, and Italy (Food and Agricultural Organization,
2016). The United States Department of Agriculture (2017) indicated 721,783 metric tons of
peaches and 152,361 metric tons of nectarines were produced in 2016. Of that production,
305,757 metric tons of peaches and 147,145 metric tons of nectarines were produced for fresh-
market consumption.
Physical characteristics
Peaches and nectarines have a wide variety of characteristics across genotypes.
According to Brovelli et al. (1999), the fruit is usually classified as round, flat, or beaked;
pubescent or smooth-skinned; freestone or clingstone; white, yellow, or red-flesh; sweet, sour, or
8
astringent; and melting or non-melting flesh. Classifications such as melting and non-melting
flesh, or pubescent and smooth-skinned are defined by the genetic makeup of the fruit. Peaches
and nectarines have a similar genetic framework, however, nectarines are smooth-skinned, where
peaches have a pubescent, or fuzzy exterior. This is due to a single recessive allele in the fruit,
but peaches and nectarines are categorized similarly in regards to many common traits (Layne
and Bassi, 2008). The main difference in melting and non-melting peaches is increased
enzymatic capacity for pectin degradation in melting-flesh types. The tertiary ripening phase is
generally called the ‘melting’ stage (Ghiani et al., 2011; Maw et al., 2003). Melting-flesh
peaches are used in fresh-markets. Flesh color and stone type (freestone vs. clingstone) are also a
commonly used to distinguish between genotypes. The production of white-flesh fruit has
increased since 1997, while canning clingstone fruit decreased (Fideghelli et al., 1997).
Postharvest handling
When looking at postharvest attributes in peaches, texture, color, and flavor are some of
the most important attributes to maintain. Fully-ripe peaches deteriorate at ambient temperature.
Chilling injury is common in peaches and nectarines and is influenced by storage temperature
and storage period (Lurie and Crisosto, 2005). Cold storage causes damage to fruit quality
(chilling injury) by initiating browning (both internal and external), flesh breakdown, loss of
juiciness (mealiness or woolliness), discoloration, and loss of flavor (Lauxmann et al., 2014;
Delgado et al., 2013). Enzymatic browning of the peach flesh is a common physiological
disorder related to the activation of polyphenoloxidase (Cheng and Crisosto, 1995).
Polyphenoloxidase activity is related to the available substrates, the pH, and the temperature.
With respect to peaches, catechol, catechin, and pyrogallol are the predominant substrates for
polyphenoloxidase, and a pH of 5 is optimal for maximum activity. Lower temperatures decrease
9
the kinetic energies of the reactant molecules slowing polyphenoloxidase activity (Yoruk and
Marshall, 2003). Loss of juiciness in peaches has been attributed to reduced pectinesterase and
polyglacturonase activities in ripe fruit. This chilling injury only occurs in the fruit as it is
ripening in storage. The adequate levels of pectinesterase and polyglacturonase for ripening to
occur are not available, due to the low temperature, leading to an undesirable texture of the fruit
(Buescher and Furmanski, 1978; González-Agüero et al., 2008).
Firmness and composition
According to Crisosto and Mitchell (2002a), the texture of peaches directly relates to
when the fruit is ready to buy and eat. Fruits that reach 27-36 N are considered ready-to-buy and
fruits that reach approximately 9-14 N are considered ready to eat. In a study by Infante et al.
(2008), the cultivars ‘Ryan Sun’, ‘Autumn Red’, ‘September Sun’, and ‘Tardibelle’ had flesh
firmness ranging from 59-64 N at harvest. In addition to firmness, the pH, soluble solids, and
titratable acidity of the fruit are important factors to consider when breeding and growing
peaches and nectarines, as they affect how we perceive the fruit. Fruit composition is dependent
of a variety of different traits and external factors. In a study by Cantín et al. (2009), differences
in sugar concentrations were found between peaches and nectarines, white and yellow-flesh fruit,
freestone, and clingstone, as well as by growing year. Additionally, growing location including
weather, soil type, and crop load had an effect on fruit composition (Day, 1997). Research at the
University of Florida showed that the cultivar ‘Tropic Beauty’, a melting-flesh cultivar, had a pH
of 3.86, soluble solids of 10.5%, and titratable acidity of 2.06%. Whereas the non-melting flesh
genotypes ‘Oro A’ and FL 86-28C, had soluble solids of 12.0% and 11.9%, respectively
(Brovelli et al., 1999).
10
Nutraceuticals
The peach is a source of many nutraceuticals. Prior research has shown the importance of
understanding the role of phenolic compounds in fruit. Senter et al. (1989) evaluated the
phenolic compounds in ‘Cresthaven’ peaches grown in Georgia. The peaches were evaluated at
various postharvest ripening times, and the prominent phenolic compounds did not vary
significantly during storage. Peach cultivars rich in phenolic compounds indicated a positive
correlation with high antioxidant capacity, color stability, and antimicrobial activity (Cevallos-
Casals et al, 2006). From that, Cevallos-Casals et al. (2006) proposed that fruit high in phenolic
compounds have potential breeding for enhanced levels. The nutraceuticals in the exocarp,
mesocarp, and endocarp varied. An investigation on ‘Golden’, ‘Shireen’, and ‘Shahpasand’
peach cultivars found that the skin had higher levels of minerals, antioxidant capacity, and
phenolics than the flesh (Manzoor et al., 2012). This was demonstrated again by Gil et al.
(2002), where the total phenolics, vitamin C, and carotenoids were greater in the skin than flesh.
The total phenolic content is important in fruit breeding because the content is linked to higher
antioxidant potential. Findings from a team at Texas A&M University found that the peach
genotype, BY94P7552, had 46% of the antioxidant capacity of a blueberry, a fruit known to
have an exceptionally high antioxidant activity (Cevallos-Casals et al., 2006). In a study by
Thomàs-Barberàn et al. (2001), no trend was found between peach flesh type and phenolic
content. Rather, the phenolic content was cultivar dependent and as with other studies, the flesh
contained less phenolics than the skin.
Sensory
Sensory analysis is a useful tool for the evaluation of fruit. A study in Brazil compared
eleven peach cultivars using a trained descriptive panel (n=30) to evaluate appearance, aroma,

11
flesh color, flesh firmness, flavor, and juiciness to create a sensory profile (Cuquel et al., 2012).
Comparison of the maturity of peaches at harvest showed that maturity did not affect sensory
quality despite recognizable differences in aroma (Infante et al., 2012). The effects of cold
storage on the ‘Douradão’ peach cultivar was analyzed by a panel of fourteen, and after 28 d
storage at 1 C, mealiness was identified by the panelists (Santana et al., 2011).
Table Grapes
Grapes have had a long history in human culture. Grapes were widely cultivated in the
Middle East and played a role in religion (Fuller, 1996). The first wine from grapes discovered
has been dated to 8500-4000 BC during the Neolithic period (Cocke, 2004). It is thought that the
first domestication of wild grape cultivars began near modern-day Turkey. Over the years,
grapes have had many uses including wine, juice, raisins, and table grapes. One of the most
widespread table grape cultivars is ‘Thomson Seedless’ or ‘Sultana’ which was thought to have
originated in Asia as a raisin grape and was introduced to the United States in 1872 (Bioletti,
1919). Table grape production in the United States in 2016 was around 7.3 million metric tons.
California is the major producer with roughly 907,000 metric tons of table grape production
(USDA, 2017). Overall, the United States is the sixth largest producer of table grapes after
China, India, Turkey, the European Union (EU-27), and Brazil as of 2017 (USDA, 2017).
Physical characteristics
Table grapes have a variety of unique physical characteristics. Grape clusters have berries
attached to a rachis and can be classified as small to large ranging from 113-680 g (USDA,
1999). Fruit breeding efforts have led to significant genetic variation of grapes including: color,
shape, flavor, texture, and aroma. Commercial table grapes such as ‘Cotton Candy’, with a
unique aroma and flavor, and ‘Witch’s Fingers’ grapes, with a unique shape, are prime examples
12
of how fruit breeding has changed the public perception of table grapes. Table grapes, depending
on the cultivar, are generally seedless in United States markets with about 15%-18% soluble
solids. Certain characteristics such as skin friability, thickness, and flesh firmness can be used to
define table grape cultivars (Cliff et. al., 1996). Aroma is another key attribute in table grape
cultivars and is directly related to how the consumer perceives the product (Lung et al., 2016).
Postharvest handling
In table grapes, growth of mold and texture loss are the primary concerns of extended
postharvest storage (Gandara-Ledezma et al., 2015). Table grapes are a non-climacteric fruit and
do not ripen further after harvest, meaning deterioration begins immediately after the fruit is
harvested (Piazzolla et al., 2016). One of the predominant concerns in storage is the decay of the
berries due to Botrytis cinerea or gray mold. Gray mold can be controlled with ethanol, sulfur
dioxide, hot water, ultraviolet irradiation, and edible coatings. Commonly, sulfur dioxide pads
are used inside the clamshell with the grapes to inhibit mold growth (Smilanick et al., 1990;
Palou et al., 2002). Other treatments such as dipping the grape clusters in ethanol were as
effective without impairing the appearance of the bunch, berry firmness, or organoleptic ratings
(Lichter et al., 2002; Karabulut et al., 2004). The identification of gray mold inhibitors that
stimulate the production of bioactive compounds has grown in interest in the last 20 years with
treatments such as ultraviolet irradiation and chitosan used for this purpose. Ultraviolet
irradiation increased the resveratrol content of ‘Napoleon’ table grapes and decreased the
presence of gray mold (Cantos et al., 2000; Cantos et al., 2001; Nigro et al., 1998). Studies
indicated chitosan application on grapes decreased the incidence of gray mold, but also increased
the presence of phenylalanine ammonia-lyase, an enzyme which stimulates the production of
polyphenol compounds (Romanazzi et al., 2002).
13
Firmness and composition
In table grapes, these same physiochemical properties are important in understanding the
postharvest physiology of the fruit. According to Crisosto and Mitchell (2002b), the maturity of
the berries can be indicated by the sugar to titratable acidity ratio. For example, ‘Thomson
Seedless’ is considered ripe when it has an 18:1 sugar to acid ratio. Wu et al. (2016) used soluble
solids, total acidity, and pH to estimate the maturity of 20 table grape cultivars. In these cultivars,
titratable acidity ranged from 2.5%-4.0%, pH ranged from 3.56-4.35, and soluble solids ranged
from 15.0%-21.5%. Research done on ‘Semillon’ reported a pH of 3.97, soluble solids of 24%,
and titratable acidity of 2.72% (Lohitnavy et al., 2010). In a consumer acceptability test, the
soluble solids/titratable acidity ratio of ‘Crimson Seedless’ table grapes was optimal from 35-40
(Jayasena and Cameron, 2008). Texture analysis of table grapes has been conducted since the
1980s with pulp and skin properties analyzed. Commonly, three methods are used in the
evaluation of the table grape, compression, penetration, and traction (Rolle et al. 2012).
Penetration (puncture) tests are commonly used to study the pulp and skin mechanical
characteristics. Lee and Bourne (1980) found that penetration force of the skin was highly
correlated with soluble solids during maturation on northeastern United States table grape
cultivars. Using a penetration test, Sato and Yamada (2003) found that table grape cultivars had
larger maximum force values than wine grapes, and V. vinifera L. cultivars had smaller
maximum forces than V. labruscana L. cultivars where the average force was 0.57 N for V.
vinifera cultivars and 0.76 N for V. labruscana cultivars.
Nutraceuticals
Grapes and grape products have beneficial health effects due to the unique polyphenolic
compounds. Current trends in leading a healthy lifestyle could help the table grape industry

14
capture an increased component of the nutraceutical market (Crupi et al., 2015). Crupi et al.
(2015) found that table grapes have high levels of flavonoids, with darker grape cultivars
showing higher amounts due to higher anthocyanin levels. A study by Mildner-Szkudlarz et al.
(2013) incorporated white grape pomace into wheat flour biscuit and increased the phenolic
compounds and enhanced antioxidant properties of the biscuit. In a study by Mattivi et al.
(2006), 91 grape varieties (V. vinifera) were analyzed and the predominant flavonol was
quercetin in both red and white grapes, 44% and 81%, respectively. In a study by Cantos et al.
(2002), total phenolic contents were found in both red and green table grape cultivars regardless
of the lack of anthocyanins in green table grapes. This phenomenon was offset by a higher
amount of flavon-3-ols in the green cultivars compared to red. Additionally, this study indicated
the use of total phenolic quantification using the sum of all nutraceutical constituents over the
Folin-Ciocalteu method since overestimation is common due to interference of sugars, ascorbic
acid, and aromatic amines.
Sensory
A trained panel at the University of Foggia evaluated seven table grape cultivars using
quantitative descriptive sensory analysis. Overall, changes in composition (titratable acidity,
soluble solids, and pH) were distinguishable across the different cultivars (Baiano et al., 2012).
Another study by Cliff et al. (1996), used descriptive profiling to describe the visual and
flavor/texture characteristics of new table grape cultivars. Their work indicated that attributes
such as color, shape, skin friability, skin thickness, seediness, flesh firmness, and many more
were evaluated and distinguishable among the 12 cultivars profiled. Of the attributes evaluated,
seediness and the skin and flesh attributes were beneficial for the evaluation of grape genotypes.
15
Muscadine Grapes
Native to the southern United States, the muscadine grape (Vitis rotundifolia Michx.) was
first discovered in 1584 by Sir Walter Raleigh, an English explorer, who found the fruit in
abundance off the coast of North Carolina (Stanley, 1997). While native cultivation and
consumption most likely occured far earlier than 1584, this was the first documented account of
the unique grape. Since the resurgence of interest in muscadine production in the United States,
the University of Georgia has released of over 30 cultivars from their fruit breeding program
(Conner, 2006). In 2005, the University of Arkansas initiated a muscadine breeding program
with a focus on improved texture, thinner skins, seedlessness, and dry stem scar (Barchenger,
2014). Currently, muscadines are used for both processing (baking, jellies, jams, juice, and wine)
and fresh-market consumption (Flora, 1977). Muscadines have great fresh-market potential if
limiting factors such as uneven ripening, seediness, low postharvest storability, and short harvest
season are addressed (Barchenger et al., 2015; James et al., 1999; Morris 1980; Perkins-Veazie et
al., 2012).
Physical characteristics
Muscadines have a unique flavor and are classified as either bronze, red, or black;
slipskin or non-slipskin; as well as, by their shape and berry size (Barchenger et al., 2015; Brown
et al., 2016). The berries grow in small clusters (5-10 berries) and unlike bunch grapes, fall from
the vine (shatter) when ripe (Conner, 2009). This native grape is known for its strong musky
flavor and thick skin, which leads to varying acceptability among consumers. Muscadines can
also have 2-4 seeds present in the berry. First time consumers may have a lower acceptability
than repeat consumers who like the unique attributes (Barchenger, 2014; Brown et al., 2016;
Degner and Mathis, 1980). In order to achieve a greater consumer acceptability, muscadine grape
16
breeders have been working on seedless varieties. In a study by Ren et al. (2014), new seedless
muscadine grapes had similar soluble solids and titratable acidities to ‘Fry’, a well-known
cultivar, but the berries were very small 1.4-3.4 g. In 2015, the first seedless muscadine,
‘RazzMatazz’ was released by Scarlet Tanager LLC (Bloodworth, 2015). Unlike traditional
muscadines, ‘RazzMatazz’ berries grow in clusters of ~50 berries and are relatively small (8 mm
wide).
Postharvest handling
Muscadines are known for having a short shelf life due to a loss of texture, shriveling,
browning, and overall weight loss (Walker et al., 2001). In a study done at the University of
Arkansas, storage attributes (percent weight loss and percent unmarketable berries) were affected
by the genotype (Barchenger et al., 2015). The decay of muscadines during postharvest storage is
directly related to storage temperatures. With extended cold storage (<20 C), negative attributes
such as visible tissue deterioration and rapid decay occur, especially when the temperatures are
increased (Takeda et al., 1983). Saunders et al. (1981) indicated that at 1 C with 85% relative
humidity, muscadine grapes lasted 14 d with no visible signs of tissue deterioration, however, a
slight softening occurred. Postharvest storage is of critical importance for shipment of the fruit to
distant markets. In a study by James et al. (1999), the efficacy of shipment of muscadines was
evaluated and showed that while the composition remained fairly consistent, texture was
affected. Additionally, shipment increased the rate of texture loss by about two-thirds as
compared to an in-lab study (James et al., 1999). Controlled atmosphere storage retarded
respiration of the fruit leading to decreased cell wall degradation and decreased titratable acidity
as compared to traditional cold storage (Basiouny, 1996).

17
Firmness and composition
In a study done at the University of Arkansas, physiochemical attributes (penetration
force, titratable acidity, pH, soluble solids, and color) of muscadines were affected by the fruit’s
genotype; however, titratable acidity, pH, soluble solids, and color remained fairly constant
throughout storage (Barchenger et al., 2015). ‘Fry’ muscadine had an average soluble solids of
14% and titratable acidity of 0.6% (Takeda et al., 1983). A study by Threlfall et al. (2007) looked
at the composition of five black muscadine cultivars (Black Beauty, Ison, Nesbitt, Southern
Home, and Supreme) and three bronze cultivars (Carlos, Granny Val, and Summit). Soluble
solids ranged between 12.6% to 14.6%, pH ranged between 3.09 to 3.42, and the titratable
acidity ranged between 3.35-6.00 g/L depending on the cultivar. As the berries matured on the
vine, the weight and sugars (glucose, fructose, and sucrose) increased, and the organic acids
(tartaric and malic acid) decreased leading to an increase in soluble solids and pH, and a
decreased titratable acidity by harvest (Carroll and Marcy, 1982).
Nutraceuticals
Muscadine grapes have some of the highest antioxidant levels among fruits (Greenspan et
al., 2005). Powdered muscadine puree has more dietary fiber than oat or rice bran, are a great
source of resveratrol, and have anti-carcinogenic properties (Stanley, 1997). A study done on
the anti-inflammatory effects of muscadine grape skins found that they had in vitro and in vivo
anti-inflammatory properties, and the polyphenols in muscadines have also shown
anticarcinogenic properties (Greenspan et al., 2005; Yi et al. 2005). Research by Wang et al.
(2010) confirmed that muscadine pomace is rich in phenolics, flavonoids, and anthocyanins. In
a study by You et al. (2012) total phenolic content and total anthocyanin content had strong
18
linear correlations, indicating that the phenolics and anthocyanins contributed to the total
antioxidant potential.
Sensory
Few consumer sensory studies have been done on fresh-market muscadines, and no
published work has been done using a trained descriptive panel. In a study by Brown et al.
(2016), consumer acceptability of muscadines was correlated with thinner skin and higher pH
grouped with overall liking and flavor. Similarly, in a study by Threlfall et al. (2007), consumers
showed preference for high soluble solid muscadine juice (14%) and juice with a soluble
solids/titratable acidity ratio of 26 to 31. In a descriptive analysis of the muscadine juice, overall
liking was positively correlated to sweetness and caramelized flavors, whereas, overall liking
was negatively correlated to sour and green and unripe flavors. A consumer panel evaluated
‘Fry’ and found that muscadines could be distinguished by increasing sweetness, related to sugar
to acid ratio and maturity differences were distinguishable within the cultivar (Walker et al.,
2001). As previous research is lacking with respect to descriptive analysis of fresh-market
muscadines, a generalized understanding of grapes can be gained from looking at results from
descriptive analysis of table grapes.
19
Literature Cited
Ali, L., B. Svensson, B.W. Alsanius, and M.E. Olsson. 2011. Late season harvest and storage of
Rubus berries—major antioxidant and sugar levels. Scientia Hort. 129:376-381.
Baiano, A. and C. Terracone. 2012. Effects of bud load on quality of Beogradska besemena and
Thompson seedless table grapes and cultivar differentiation based on chemometrics of
analytical indices. J. Sci. Food Agri. 92:645-653.
Baiano, A., C. Terracone, G. Peri, and R. Romaniello. 2012. Application of hyperspectral
imaging for prediction of physico-chemical and sensory characteristics of table grapes.
Computers Electronics Agri. 87:142-151.
Barchenger, D.W., 2014. Postharvest storage and nutraceutical evaluation of muscadine
grapes (Vitis rotundifolia Michx.). University of Arkansas.
Barchenger, D.W., J.R. Clark, R.T. Threlfall, L.R. Howard, and C.R. Brownmiller. 2015.
Evaluation of physicochemical and storability attributes of muscadine grapes (Vitis
rotundifolia Michx.). HortScience 50:104-111.
Barnett, S. 2007, Blackberry sales up 44% as part of UK soft fruit boom, Haymarket Business
Publications Ltd, Teddington.
Basiouny, F.M. 1996. Quality of muscadine grapes as influenced by elevated CO2 and
reduced O2 atmosphere. International Postharvest Science Conference 96(464):375-380.
Bautista-Baños, S. 2014. Postharvest Decay: Control Strategies. Elsevier.
Bioletti, F.T. 1919. The seedless raisin grapes. J. Pomol. Hort. Sci. 1:23-27.
Bloodworth, P.J. 2015. Grapevine plant named JB05-22-3-27. US 9045767 B2.
Brovelli, E.A., J.K. Brecht, W.B. Sherman, C.A. Sims, and J.M. Harrison. 1999. Sensory and
compositional attributes of melting‐and non‐melting‐flesh peaches for the fresh market. J.
Sci. Food Agri. 79:707-712.
Brown, K., C. Sims, A. Odabasi, L. Bartoshuk, P. Conner, and D. Gray. 2016. Consumer
acceptability of fresh‐market muscadine grapes. J. Food Sci. 81:S2808-S2816.
Buescher, R.W. and R.J. Furmanski. 1978. Role of pectinesterase and polygalacturonase in the
formation of woolliness in peaches. J. Food Sci. 43:264-266.
Cantín, C.M., Y. Gogorcena, and M.A. Moreno. 2009. Analysis of phenotypic variation of sugar
profile in different peach and nectarine [Prunus persica (L.) Batsch] breeding
progenies. J. Sci. Food Agri. 89:1909-1917.
20
Cantos, E., C. García-Viguera, S. de Pascual-Teresa, and F.A. Tomás-Barberán. 2000. Effect of
postharvest ultraviolet irradiation on resveratrol and other phenolics of cv. Napoleon
table grapes. J. Agri. Food Chem. 48:4606-4612.
Cantos, E., J.C. Espín, and F.A. Tomás-Barberán. 2001. Postharvest induction modeling method
using UV irradiation pulses for obtaining resveratrol-enriched table grapes: a new
“functional” fruit? J. Agri. Food Chem. 49:5052-5058.
Cantos, E., J.C. Espin, and F.A. Tomás-Barberán. 2002. Varietal differences among the
polyphenol profiles of seven table grape cultivars studied by LC− DAD− MS− MS. J.
Agri. Food Chem. 50:5691-5696.
Carroll, D.E. and J.E. Marcy. 1982. Chemical and physical changes during maturation of
Muscadine grapes (Vitis rotundifolia). Amer. J. Enol. Viticult. 33:168-172.
Carvalho, C.P. and J.A. Betancur. 2015. Quality characterization of Andean blackberry fruits
(Rubus glaucus Benth.) in different maturity stages in Antioquia, Colombia. Agronomía
Colombiana 33:74-83.
Cavender, G., M. Liu, D. Hobbs, B. Frei, B. Strik, and Y. Zhao. 2014. Effects of different
Organic weed management strategies on the physicochemical, sensory, and antioxidant
properties of machine‐harvested blackberry fruits. J. Food Sci. 79:S2107-S2116.
Cevallos-Casals, B.A., D. Byrne, W.R. Okie, and L. Cisneros-Zevallos. 2006. Selecting new
peach and plum genotypes rich in phenolic compounds and enhanced functional
properties. Food Chem. 96:273-280.
Cheng, G.W. and C.H. Crisosto. 1995. Browning potential, phenolic composition, and
polyphenoloxidase activity of buffer extracts of peach and nectarine skin tissue. J. Amer.
Soc. Hort. Sci. 120:835-838.
Clark, J.R., 1998. The blackberry breeding program at the University of Arkansas:
Thirty-plus years of progress and developments for the future. Intl. Symp. Rubus Ribes
505:73-78 (Abstr).
Clark, J.R. and J.N. Moore. 1999. Apache 'thornless blackberry. HortScience 34:1291-1293.
Clark, J.R. 2002. Grape breeding at the University of Arkansas: approaching forty years of
progress. Acta Hort. 603:357-360 (Abstr).
Clark, J.R. 2005. Changing times for eastern United States blackberries. HortTechnology
15:491-494.
Clark, J.R., J.N. Moore, J. Lopez-Medina, C. Finn, and P. Perkins-Veazie. 2005. Main content
area 'Prime-Jan' ('APF-8') and 'Prime-Jim' ('APF-12') primocane-fruiting blackberries.

21
HortScience 40:852-855.
Clark, J.R. and C.E. Finn. 2011. Blackberry breeding and genetics. Fruit Veg. Cereal Sci.
Biotechnol. 5:27-43.
Clark, J.R. and P. Perkins-Veazie. 2011. ‘APF-45’ primocane-fruiting blackberry. HortScience
46:670-673.
Cliff, M.A., M.C. Dever, and A.G. Reynolds. 1996. Descriptive profiling of new and
commercial British Columbia table grape cultivars. Amer. J. Enol. Viticult. 47:301-308.
Cocke, W. 2004. First Wine? Archaeologist Traces Drink to Stone Age. National Geographic
News.
Conner, P.J. 2006. A century of muscadine grape (Vitis rotundifolia Michx.) breeding at
the University of Georgia. In IX International Conference on Grape Genetics and
Breeding 827:481-484.
Conner, P.J. 2009. Performance of muscadine grape cultivars in southern Georgia. J. Amer.
Pomol. Soc. 63:101.
Crisosto, C.H. and F.G. Mitchell. 2002a. Postharvest Handling Systems: Stone Fruits, p. 345-
350 and 357-363. In: A.A Kader. Postharvest Technology of Horticultural Crops. Univ.
California. Oakland, CA.
Crisosto, C.H. and F.G. Mitchell. 2002b. Postharvest Handling Systems: Small Fruits, p. 357-
363. In: A.A Kader. Postharvest Technology of Horticultural Crops. Univ. California.
Oakland, CA.
Crupi, P., C. Bergamini, R. Perniola, T. Dipalmo, M.L. Clodoveo, and D. Antonacci. 2015. A
chemometric approach to identify the grape cultivar employed to produce nutraceutical
fruit juice. European Food Res. Technol. 241:487-496.
Cuquel, F.L., C.F.S.D. Oliveira, and O.J. Lavoranti. 2012. Sensory profile of eleven peach
cultivars. Food Sci. Technol. 32:70-75.
Day, K.R. 1997. Orchard factors affecting postharvest stone fruit quality. HortScience, 32:820-
823.
Degner, R.L. and K. Mathis. 1980. Consumer acceptance of muscadine grapes. Proc. Fla. State
Hort. Soc. 93:140-143.
Delgado, C., G.M. Crisosto, H. Heymann, and C.H. Crisosto. 2013. Determining the primary
drivers of liking to predict consumers' acceptance of fresh nectarines and peaches. J.
Food Sci. 78:S605-S614.
22
Fan-Chiang, H.J. and R.E. Wrolstad. 2010. Sugar and nonvolatile acid composition of
blackberries. J. AOAC Intl. 93:956-965.
Farm Bureau of Arkansas. 2016. The Landscape of Arkansas. p. 2.
Feltman, R. 2015. Oldest peach has juicy history: Fossilized remains in China some 2.5 million
years old, Tribune Interactive, LLC, Orlando, Fla.
Fideghelli, C., G. Della Strada, F. Grassi, and G. Morico. 1997. The peach industry in the
world: present situation and trend. IV Intl. Peach Symp. 465:29-40.
Finn, C.E. and J.R. Clark. 2011. Emergence of blackberry as a world crop. Chronica
Hort. 51:8-13.
Flora, L.F. 1977. Processing and quality characteristics of muscadine grapes. J. Food Sci.
42:935-938.
Florkowski, W.J., R.L. Shewfelt, B. Brueckner, and S.E. Prussia. 2014. Challenges in
postharvest handling. In Postharvest Handling 3:543-547.
Food and Agricultural Organization of the United Nations (FAO). 2016. Top 20 countries
production of peaches and nectarines statistics.
http://www.fao.org/faostat/en/#rankings/countries_by_commodity
Fuller, R.C. 1996. Religion and wine: A cultural history of wine drinking in the United States.
Univ. of Tennessee Press. Knoxville, TN.
Gándara‐Ledezma, A., C. Corrales‐Maldonado, M. Rivera‐Domínguez, MA. Martínez‐Téllez,
and I. Vargas‐Arispuro. 2015. Post‐harvest control of gray mold in table grapes using
volatile sulfur compounds from Allium sativum. J. Sci. Food Agri. 95:497-503.
Ghiani, A., E. Onelli, R. Aina, M. Cocucci, and S. Citterio. 2011. A comparative study of
melting and non-melting flesh peach cultivars reveals that during fruit ripening endo-
polygalacturonase (endo-PG) is mainly involved in pericarp textural changes, not in
firmness reduction. J. Experimental Bot. 62:4043-4054.
Gil, M.I., F.A. Tomás-Barberán, B. Hess-Pierce, and A.A. Kader. 2002. Antioxidant capacities,
phenolic compounds, carotenoids, and vitamin C contents of nectarine, peach, and plum
cultivars from California. J. Agri. Food Chem. 50:4976-4982.
González-Agüero, M., L. Pavez, F. Ibáñez, I. Pacheco, R. Campos-Vargas, L.A. Meisel, A.
Orellana, J. Retamales, H. Silva, M. González, and V. Cambiazo. 2008. Identification of
woolliness response genes in peach fruit after post-harvest treatments. J. Experimental
Bot. 59:1973-1986.
Greenspan, P., J.D. Bauer, S.H. Pollock, J.D. Gangemi, E.P. Mayer, A. Ghaffar, J.L. Hargrove,

23
and D.K. Hartle. 2005. Antiinflammatory properties of the muscadine grape (Vitis
rotundifolia). J. Agri. Food Chem. 53:8481-8484.
Infante, R., M. Farcuh, and C. Meneses. 2008. Monitoring the sensorial quality and aroma
through an electronic nose in peaches during cold storage. J. Sci. Food Agri.
88:2073-2078.
Infante, R., D. Aros, L. Contador, and P. Rubio. 2012. Does the maturity at harvest affect
quality and sensory attributes of peaches and nectarines? N.Z. J. Crop Hort. Sci.
40:103-113.
James, J., O. Lamikanra, J.R. Morris, G. Main, T. Walker, and J. Silva. 1999. Interstate
shipment and storage of fresh muscadine grapes. J. Food Quality 22:605-617.
Jayasena, V. and I. Cameron. 2008. Brix/acid ratio as a predictor of consumer acceptability of
Crimson Seedless table grapes. J. Food Qual. 31:736-750.
Joo, M., N. Lewandowski, R. Auras, J. Harte, and E. Almenar. 2011. Comparative shelf life
study of blackberry fruit in bio-based and petroleum-based containers under retail storage
conditions. Food Chem. 126:1734-1740.
Kader, A.A. 2002. Postharvest technology of horticultural crops. Univ. California Agri. Natural
Resources. 3311.
Kafkas, E., M. Koşar, N. Türemiş,. and K.H.C Başer. 2006. Analysis of sugars, organic acids
and vitamin C contents of blackberry genotypes from Turkey. Food Chem. 97:732-736.
Karabulut, O.A., F.M. Gabler, M. Mansour, and J.L. Smilanick. 2004. Postharvest ethanol and
hot water treatments of table grapes to control gray mold. Postharvest Bio. Technol.
34:169-177.
Kaume, L., L.R. Howard, and L. Devareddy. 2011. The blackberry fruit: a review on its
composition and chemistry, metabolism and bioavailability, and health benefits. J. Agri.
Food Chem. 60:5716-5727.
Kaur, K. 2016. Functional Nutraceuticals: Past, Present, and Future. In: A. Grumezescu.
Nutraceuticals Nanotechnology in the Agri-Food Industry. 4th ed. Elsevier. St. Louis,
MO.
Kim, M.J., P. Perkins-Veazie, G. Ma, and G. Fernandez. 2015. Shelf life and changes in
phenolic compounds of organically grown blackberries during refrigerated
storage. Postharvest Bio. Technol. 110:257-263.
Lauxmann, M.A., J. Borsani, S. Osorio, V.A. Lombardo, C.O. Budde, C.A. Bustamante, L.L.
24
Monti, C.S. Andreo, A.R. Fernie, M.F. Drincovich, and M.V. Lara. 2014. Deciphering
the metabolic pathways influencing heat and cold responses during post‐harvest
physiology of peach fruit. Plant Cell Environ. 37:601-616.
Layne, D.R. and D. Bassi. 2008. The peach: botany, production and uses, CABI, Cambridge,
MA; Wallingford, Oxfordshire, UK.
Lee, C.Y. and M.C. Bourne. 1980. Changes in grape firmness during maturation. J. Texture
Studies 11:163-172.
Lee, J., M. Dossett, and C.E. Finn. 2012. Rubus fruit phenolic research: the good, the bad, and
the confusing. Food Chem. 130:785-796.
Li, X., D. Fernández-Ortuño, W. Chai, F. Wang, and G. Schnabel. 2012. Identification and
prevalence of Botrytis spp. from blackberry and strawberry fields of the Carolinas. Plant
Dis. 96:1634-1637.
Lichter, A., Y. Zutkhy, L. Sonego, O. Dvir, T. Kaplunov, P. Sarig, and R. Ben-Arie. 2002.
Ethanol controls postharvest decay of table grapes. Postharvest Bio. Technol. 24:301-
308.
Lohitnavy, N., S. Bastian, and C. Collins. 2010. Berry sensory attributes correlate with
compositional changes under different viticultural management of Semillon (Vitis
vinifera L.). Food Quality and Preference 21:711-719.
Lung, M.L., D. Pamfil, P.O.P. Nastasia, C. Catana, S.L. Lazar, S. Giacosa, F. Torchio, A.
Ferrandino, S.R. Segade, and L. Rolle. 2016. Investigation on phenolic and aroma
compounds of table grapes from Romania. Notulae Botanicae Horti Agrobotanici Cluj-
Napoca 44:140.
Lurie, S. and C.H. Crisosto. 2005. Chilling injury in peach and nectarine. Postharvest Bio.
Technol. 37:195-208.
Manzoor, M., F. Anwar, Z. Mahmood, U. Rashid, and M. Ashraf. 2012. Variation in minerals,
phenolics and antioxidant activity of peel and pulp of different varieties of peach (Prunus
persica L.) fruit from Pakistan. Molecules 17:6491-6506.
Martinez, S.W. 2010. Local food systems; concepts, impacts, and issues (97). Diane Publishing.
Mattivi, F., R. Guzzon, U. Vrhovsek, M. Stefanini, and R. Velasco. 2006. Metabolite profiling of
grape: flavonols and anthocyanins. J. Agri. Food Chem. 54:7692-7702.
Maw, B.W., G.W. Krewer, S.E. Prussia, Y.C. Hung, and B.G. Mullinix. 2003. Non–
melting flesh peaches respond differently from melting flesh peaches to laser puff
firmness evaluation. Appl. Eng. Agri. 19:329.

25
Mildner‐Szkudlarz, S., J. Bajerska, R. Zawirska‐Wojtasiak, and D. Górecka. 2013. White grape
pomace as a source of dietary fibre and polyphenols and its effect on physical and
nutraceutical characteristics of wheat biscuits. J. Sci. Food Agri. 93:389-395.
Mikulic‐Petkovsek, M., V. Schmitzer, A. Slatnar, F. Stampar, and R. Veberic. 2012.
Composition of sugars, organic acids, and total phenolics in 25 wild or cultivated berry
species. J. Food Sci. 77:1064-1070.
Moore, J.N. 1984. Blackberry breeding. HortScience 19:183–185.
Moore, J.N. and J.R. Clark. 1993. ‘Arapaho’ erect thornless blackberry. HortScience 28:861–
862.
Morris, J.R. 1980. Handling and marketing of muscadine grapes. Fruit South 4:12-14.
Nigro, F., A. Ippolito, and G. Lima, 1998. Use of UV-C light to reduce Botrytis storage rot of
table grapes. Postharvest Bio. Technol. 13:171-181.
Palharini, M.C. de Arruda, I.H. Fischer, M.R. da Cruz Vegian, M. de Souza Fileti, and S.M.N.M.
Montes, 2015. Effect of storage temperature on blackberry postharvest conservation,
Pesquisa Agropecuária Tropical 45:413-419.
Palou, L., C.H Crisosto, D. Garner, L.M. Basinal, J.L. Smilanick, and J.P. Zoffoli. 2002.
Minimum constant sulfur dioxide emission rates to control gray mold of cold-stored table
grapes. Amer. J. Enol. Viticult. 53:110-115.
Perkins‐Veazie, P., J.K. Collins, and J.R. Clark. 1999. Shelf-life and quality of ‘Navaho’ and
‘Shawnee’ blackberry fruit stored under retail storage conditions. J. Food Quality
22:535-544.
Perkins-Veazie, P. and J.K. Collins. 2002. Quality of erect-type blackberry fruit after short
intervals of controlled atmosphere storage. Postharvest Bio. Technol. 25:235-239.
Perkins-Veazie, P. and J.R. Clark. 2005. Evaluating a simple system for blackberry shelf
life. HortScience 40:894 (abstr.).
Perkins-Veazie, P., S. Spayd, B. Cline, and C. Fisk. 2012. Handling and marketing guide for
fresh market muscadine grapes. SFRC E03:1-12.
Piazzolla, F., S. Pati, M.L. Amodio, and G. Colelli. 2016. Effect of harvest time on table grape
quality during on‐vine storage. J. Sci. Food Agri. 96:131-139.
Ren, Z., J. Lu, X. Xu, and S. Leong. 2014. Some notable characteristics of seedless muscadine
grapes observed in FAMU’s grape breeding. Proc. Fla. State Hort. Soc. 127:24-27
Rolle, L., R. Siret, S.R. Segade, C. Maury, V. Gerbi, and F. Jourjon. 2012. Instrumental
26
texture analysis parameters as markers of table-grape and winegrape quality: A
review. Amer. J. Enol. Viticult. 63:11-28.
Romanazzi, G., F. Nigro, A. Ippolito, D. Divenere, and M. Salerno. 2002. Effects of pre- and
postharvest chitosan treatments to control storage grey mold of table grapes. J. Food Sci.
67:1862-1867.
Romero Rodriguez, M.A., M.L. Vazquez Oderiz, J. Lopez Hernandez, and L.S. Lozano. 1992.
Determination of vitamin C and organic acids in various fruits by HPLC. J.
Chromatographic Sci. 30:433-437.
Santana, L.R.R.D., B.C. Benedetti, and J.M.M. Sigrist. 2011. Sensory profile of 'Douradão'
peaches cold stored under controlled atmosphere. Food Sci. Technol. 31:238-246.
Sato, A. and M. Yamada. 2003. Berry texture of table, wine, and dual-purpose grape cultivars
quantified. HortScience 38:578-581.
Saunders, M.S., F. Takeda, and T.T. Hatton. 1981. Postharvest physiology and senescence in
Muscadines. Proc. Florida State Hort. Soc. 94:340-343.
Senter, S.D., J.A. Robertson, and F.I. Meredith. 1989. Phenolic compounds of the mesocarp of
Cresthaven peaches during storage and ripening. J. Food Sci. 54:1259-1268.
Segantini, D.M., R. Threlfall, J.R. Clark, C.R. Brownmiller, L.R. Howard, and L.J. Lawless.
2017. Changes in fresh-market and sensory attributes of blackberry genotypes after
postharvest storage. J. Berry Res. 7:129-145.
Segantini, D.M., R.T Threlfall, J.R. Clark, L.R. Howard, and C.R. Brownmiller. 2018,
Physiochemical changes in floricane and primocane blackberries harvested from
primocane genotypes, HortScience 53:9-15.
Smilanick, J.L., J.M. Harvey, P.L. Hartsell, D.J. Hensen, C.M. Harris, D.C. Fouse, and
M. Assemi. 1990. Factors influencing sulfite residues in table grapes after sulfur dioxide
fumigation. Amer. J. Enol. Viticult. 41:131-136.
Stanley, D. 1997. America's first grape: the muscadine. Agri. Res., 45:14.
Strik, B.C. and C.E. Finn. 2011. Blackberry production systems-a worldwide perspective.
In X Intl. Rubus and Ribes Symp. 946:341-347.
Strik, B.C., J.R. Clark, C.E. Finn, and G. Buller. 2012. Management of primocane-fruiting
blackberry: impacts on yield, fruiting season, and cane architecture. HortScience 47:593-
598.
Takeda, F., M.S. Saunders, and J.A. Saunders. 1983. Physical and chemical changes in
Muscadine grapes during postharvest storage. Amer. J. Enol. Viticult. 34:180-185.

27
Tomás-Barberán, F.A., M.I. Gil, P. Cremin, A.L. Waterhouse, B. Hess-Pierce, and A.A. Kader.
2001. HPLC− DAD− ESIMS analysis of phenolic compounds in nectarines, peaches, and
plums. J. Agri. Food Chem. 49:4748-4760.
Threlfall, R.T., J.R. Morris, J.F. Meullenet, and R.K. Striegler. 2007. Sensory characteristics,
composition, and nutraceutical content of juice from Vitis rotundifolia (muscadine)
cultivars. Amer. J. Enol. Viticult. 58:268-273.
Threlfall, R.T., O.S. Hines, J.R. Clark, L.R. Howard, C.R. Brownmiller, D.M. Segantini, and
L.J. Lawless. 2016. Physiochemical and sensory attributes of fresh blackberries grown in
the southeastern United States. HortScience 51:1351-1362.
U.S Dept. Agr. (USDA). 1999. United States standards for grades of table grapes (European or
Vinifera Type).
https://www.ams.usda.gov/sites/default/files/media/Table_Grape_Standard%5B1%5D.pd
f
U.S Dept. Agr. (USDA). 2015. Trends in U.S. local and regional food systems: a report to
congress.
https://www.ers.usda.gov/webdocs/publications/42805/51173_ap068.pdf?v=42083
U.S Dept. Agr. (USDA). 2016. National Farmers Market Directory. Local Food Directories.
https://www.ams.usda.gov/local-food-directories/farmersmarkets
U.S Dept. Agr. (USDA). 2017. National agricultural statistics service, peach and nectarine
statistics. https://www.nass.usda.gov/Statistics_by_Subject/index.php?sector=CROPS.
U.S Dept. Agr. (USDA). 2018. Grades and Standards.
https://www.ams.usda.gov/grades-standards
Wang, X., H. Tong, F. Chen, and J.D. Gangemi. 2010. Chemical characterization and
antioxidant evaluation of muscadine grape pomace extract. Food Chem. 123:1156-1162.
Walker, T.L., J.R. Morris, R.T. Threlfall, G.L. Main, O. Lamikanra, and S. Leong. 2001.
Density separation, storage, shelf life, and sensory evaluation of 'Fry' muscadine
grapes. HortScience 36:941-945.
Wu, Y., S. Duan, L. Zhao, Z. Gao, M. Luo, S. Song, W. Xu, C. Zhang, C. Ma, and S. Wang.
2016. Aroma characterization based on aromatic series analysis in table grapes. Scientific
Rpt. 6:31116.
Yi, W., J. Fischer, and C.C Akoh. 2005. Study of anticancer activities of muscadine grape
phenolics in vitro. J. Agri. Food Chem. 53:8804-8812.
Yilmaz, K.U., Y. Zengin, S. Ercisli, S. Serce, K. Gunduz, M. Sengul, and B.M. Asma. 2009.

28
Some selected physico-chemical characteristics of wild and cultivated blackberry fruits
(Rubus fruticosus L.) from Turkey. Romanian Biotechnol. Lett. 14:4152-4163.
Yin, M. 2017. Studies in blackberry: development and implementation of a phenotyping protocol
for blackberry seedling populations and impact of time of day of harvest on red drupelet
reversion for University of Arkansas blackberry genotypes, Univ. Ark., Fayetteville, MS
Thesis.
Yoruk, R. and M.R. Marshall. 2003. Physicochemical properties and function of plant
polyphenol oxidase: a review. J. Food Biochem. 27:361-422.
You, Q., F. Chen, X. Wang, J.L. Sharp, and Y. You. 2012. Analysis of phenolic composition
of ‘Noble’ muscadine (Vitis rotundifolia) by HPLC‐MS and the Relationship to Its
Antioxidant Capacity. J. Food Sci. 77:C1115-C1123.
Zheng, Y., G.W. Crawford, and X. Chen.V 2014, Archaeological evidence for peach (Prunus
persica) cultivation and domestication in China, Public Library Sci. 9(9):1-9.
29
Chapter I
Effects of Harvest Time and Storage Temperature on Postharvest Quality of Arkansas
Blackberry Genotypes
Abstract
Postharvest storage performance in fresh-market fruits is extremely important to fruit
breeders, growers, and consumers. In blackberries (Rubus subgenus Rubus Watson), postharvest
quality relies on the capacity of the berries to maintain composition and firmness and resist
leakage, decay, and development of red drupelets (reversion) before reaching the consumer. Four
cultivars (Natchez, Osage, Ouachita, and Prime-Ark® Traveler) and five advanced breeding
selections (A-2428, A-2444, A-2453, A-2526, and APF-268) were harvested from the University
of Arkansas Fruit Research Station, Clarksville, AR at 7:00 AM and 12:00 PM at the shiny-black
stage of ripeness. After harvest, berries were randomized and placed in 125-g vented clamshells
in duplicate and stored at 2 °C and 10 °C for both physicochemical analysis (soluble solids, pH,
and titratable acidity) and marketability analysis (firmness, weight loss, leakage, decay, and red
drupelet reversion). Berries were evaluated at harvest (day 0) and after 7 and 14 days at 2 °C and
10 °C. At harvest (day 0) these genotypes had a berry weight of 3.50-10.32 g, soluble solids of
6.40%-11.50%, pH of 2.34-3.67, titratable acidity of 0.48%-1.62%, and firmness of 3.05-13.69
N. A-2444 had the highest soluble solids (10.85%) and pH (3.50). ‘Prime-Ark® Traveler’ and A-
2453, a novel “crispy” genotype, had firmer fruit than the other genotypes at both harvest times,
and A-2453 was more firm at 12:00 PM than 7:00 AM. ‘Natchez’ had the highest berry weight, and
A-2453 the smallest. There was less weight loss at 2 °C (2.52%) than at 10 °C (6.35%) during
storage regardless of harvest time. A-2444 had the greatest weight loss after 14 days storage at
both temperatures. ‘Natchez’ had the highest red drupelet reversion at 7:00 AM on day 7 for both
storage temperatures and after 14 days storage at 2 °C, and red drupelet reversion in ‘Prime-
30
Ark® Traveler’ harvested at 12:00PM increased (9.75%) as compared to day 0. Harvest time had
minimal impact on blackberry marketability after 14 days storage. In general, most berries were
less firm after 14 days storage at 10 °C as compared to 2 °C and leakage, decay, and weight loss
were greater. However, red drupelet reversion was not impacted by storage temperature after 14
days storage. After 14 days storage, A-2453 had the least leakage (13.67%) at 2 °C, and ‘Osage’
had the least leakage (16.04%) at 10 °C. In addition, during storage ‘Ouachita’ and APF-268 had
the least decay at 2 °C and 10 °C, respectively. Overall, greater impact on postharvest quality of
Arkansas-grown blackberries was due to the effects of storage temperature and genotype rather
than harvest time.
31
Introduction
Blackberries (Rubus L. hybrids) are an aggregate fruit native to regions of Europe and
North America, but grown worldwide for processing and fresh-markets. According to the United
States Department of Agriculture (2017), 1,620 ha of blackberries were harvested in the United
States with ~2,740,000 kg for fresh market, though this data is primarily from Oregon. In 2016,
U.S. blackberry production was valued at $26.4 million with $5.0 million from fresh-market
sales and $21.4 million from processed sales (USDA, 2017). Though the total sales were down
36% from 2015, the reduction was mainly due to a decrease in sales of processed blackberries as
value of fresh-market sales remained $5-6 million each year from 2011 to 2016.
Barnett (2007) attributed increased fresh-market blackberry sales in the United Kingdom
to increased availability of sweeter cultivars and awareness of health benefits associated with the
fruit. Blackberries are known to have excellent health benefits attributed to high antioxidant
capacity and presence of various bioactive compounds such as phenolic acids, anthocyanins,
flavonoids, and ellagitannins (Machado et al., 2015). In addition, blackberries are rich in
vitamins (C, A, E, B6), folic acid, dietary fiber, potassium, phosphorous, magnesium, calcium,
and iron, which contribute to other health benefits such as skin, bone, heart, and brain heath
(Lee, 2017).
Blackberry production methods vary by region, and the plants can be erect (self-
supporting), trailing, or semi-erect. A survey in 2005 indicated that half of the cultivars in
production were semi-erect and the remaining half evenly split between erect and trailing types
(Strik et al., 2007). Erect and semi-erect plants are grown primarily for fresh-market production
and are usually hand harvested.
32
In the United States, both public and private blackberry breeding programs have been
working on the development and release of new fresh-market blackberry cultivars. The
University of Arkansas Fruit Breeding Program routinely evaluates blackberry selections at the
Fruit Research Station in Clarksville, AR and has released many fresh-market cultivars with
unique traits. In 2004, the University of Arkansas released the first commercial primocane-
fruiting blackberries (Clark et al., 2005). Most blackberry plants are biennial, meaning first-
season canes grow (primocanes), and in the second season plants, produce fruit on the floricanes.
Primocane-fruiting plants can increase fruit production per plant, but also impact fruit
seasonality. Another advancement from this program is the development of “crispy” blackberry
selections with firm textures to improve postharvest shipping capability and shelf life (Salgado
and Clark, 2016). Currently, the breeding program is focused on improving the understanding of
postharvest quality and releasing new fresh-market cultivars (Clark and Finn, 2011; Clark, 2015)
During postharvest shipping and storage, blackberries are susceptible to many conditions
which lower marketability, shelf life, and fruit quality. Due to their soft skin and fragile nature,
blackberries have a relatively short postharvest shelf-life (de Arruda Palharini et al., 2015).
Softening, leakage, mold development, and weight loss are common postharvest problems in
blackberries and other soft fruit. Another postharvest issue, red drupelet reversion, is when the
black drupes on mature berries turn red during or after cold storage (Salgado and Clark, 2016;
Segantini et. al., 2018). The cause of this injury has not been determined, however it was shown
that “shiny” black berries placed in cold storage then removed can develop red drupelets and
genotypes vary in susceptibility. It is hypothesized that the temperature the fruit is picked or
stored may influence the extent and severity of red drupelet reversion. Previous studies at the
University of Arkansas by Yin (2017) and McCoy et al. (2016) found significantly less red

33
drupelet reversion of fruit harvested early in the morning than fruit harvested in the afternoon
indicating a potential environmental effect. The “crispy”, firm blackberries had less red drupelet
reversion during storage (McCoy et al., 2016; Segantini et. al, 2017; Salgado and Clark, 2016;
Yin, 2017), suggesting that firmness can also impact red drupelet reversion.
By understanding how harvest and storage temperatures affect blackberries, we can
provide information to growers to broaden postharvest potential. The purpose of this study was
to evaluate the effects of different harvest times and storage temperatures on the postharvest
quality of Arkansas-grown fresh-market blackberries.
34
Materials and Methods
Blackberry plants and culture
Nine blackberry genotypes (Rubus subgenus Rubus Watson L.) were evaluated in this
study, including four cultivars (Natchez, Osage, Ouachita, Prime-Ark® Traveler) and five
advanced selections (A-2428, A-2444, A-2453, A-2526, and APF-268). The plants were grown
at the University of Arkansas Research Station in Clarksville, AR (West Central Arkansas, lat.
35 °31’58”N and long. 93 °24’12”W). Plants were trained to a T-trellis with two lower wires ~0.5
m from the soil surface spaced 0.5 m apart and two upper wires ~1.0 m high spaced 0.8 m apart.
The blackberry plants that were harvested for this project were in three plots with five plants per
plot, and the plots were established in 2013, 2015 and 2016. Standard cultural practices for erect
blackberry production were used including annual spring nitrogen fertilization (56 kg·ha–1 N)
using ammonium nitrate. The plants were irrigated as needed using trickle irrigation. Dormant
pruning consisted of removing dead floricanes and removing primocane tissue to a point below
the flowering area on the primocanes. The plants received a single application of liquid lime
sulfur (94 L·ha–1) at budbreak for control of anthracnose (Elsinoë veneta [Burkholder] Jenk.).
Raspberry crown borer (Pennisetia marginata [Harris]) was controlled by a single application of
a labeled insecticide with bifenthrin as the active ingredient in October of each year. Insecticides
labeled for commercial use in Arkansas were used for spotted wing drosophila (Drosophila
suzukii Matsumura) control.
Blackberry harvest
Blackberries were hand harvested from the floricanes at 7:00 AM and 12:00 PM. The fruit
was harvested at the “shiny” black stage of ripeness and were free of major blemishes, flaws, or
damage. About 4 kg of blackberries were harvested for each genotype and harvest time into 150-

35
g vented clamshells and placed in an ice chest chilled with ice packs. ‘Natchez’, ‘Osage’, Prime-
Ark® Traveler’, A-2428, and A-2444 were harvested on 8 June 2017, and ‘Ouachita’, A-2453,
A-2526, and APF-268, were harvested on 20 June 2017 (Table 1). There were no rain events
within 12 h of either harvest. Air temperature in the plots was measured using AcuRite Digital
Humidity and Temperature Comfort Monitor (Primax Family of Companies, Geneva, WI) at the
start and completion of harvest for each genotype. Fruit for this study was transported from
Clarksville, AR to the Food Science Department, Fayetteville, AR (~2 hrs travel time) after both
the 7:00 AM and 12:00 PM harvests were completed. After the fruit was harvested at 7:00 AM, the
closed coolers were placed at 4 °C until the 12:00 PM harvest was complete. The blackberries
were then gently removed from the clamshells, randomized by genotype and harvest time, and
placed into new 150-g ventilated clamshells. The fruit was placed in two different cold storage
temperatures (2 °C and 10 °C) with 85% to 89% relative humidity and evaluated for
physiochemical and marketability attributes at day 0, 7, and 14.
Physiochemical analysis
Physiochemical analysis was performed on fruit in two replicate clamshells. The
physiochemical analysis included berry attributes and composition evaluated at 0, 7, and 14 d at
2 °C and 10 °C for each harvest time and genotype.
Berry attributes. Five berries per genotype and replication were removed to analyze
berry attributes (weight, drupelets/berry, red drupelet reversion (RDR), and firmness). Berry
weight was measured on a digital scale (PA224 Analytic Balance, Ohaus Corporation,
Parsippany, NJ). The total drupelets and total red drupelets were counted on each berry using a
paint pen, and then the percent RDR was calculated.

36
Firmness. Five berries per genotype and replication were removed to analyze firmness
using a Stable Micro Systems TA.XT.plus Texture Analyzer (Texture Technologies Corporation,
Hamilton, MA.). Fruit compression was performed by placing individual berries horizontally on
a flat surface using a cylindrical and plane probe of 7.6 cm diameter at a rate of 2 mm/s with a
trigger force of 0.02 N. Force to compress the berry was measured in Newtons (N).
Composition. Five berries per genotype and replication were frozen (-10 °C) for
compositional analysis (soluble solids, pH, titratable acidity, organic acids, and sugars). The five
berries in each sample were thawed and squeezed through cheese cloth to extract juice. The pH
and titratable acidity were measured using the Titrino plus 862 compact titrosampler (Metrohm
AG, Herisan, Switzerland) with the electrode standardized to pH 4.00, 7.00, and 10.00 buffers.
Titratable acidity was determined using ~3 g of juice diluted with deionized, degassed water with
a titration using 0.1 N sodium hydroxide to an endpoint of pH 8.2. Titratable acidity was
expressed as percentage of citric acid. Soluble solids (expressed as percent) was measured using
an Abbe Mark II refractometer (Bausch and Lomb, Scientific Instrument, Keene, NH).
Organic acids and sugars. Organic acids and sugars were determined using high
performance liquid chromatography (HPLC) in duplicate for each genotype and replication. The
juice for compositional analysis was filtered through a 0.45 𝜇m nylon filter (VWR International,
Radnor, PA) and was analyzed using HPLC. Glucose, fructose, isocitric, isocitric lactone, and
malic acids of blackberries were measured using previously established HPLC procedures
(Walker et al., 2003; Segatini et al., 2018). The HPLC was equipped with a Bio-Rad HPLC
Organic Acid Analysis Aminex HPX-87H ion exclusion column (300 × 7.8 mm), Bio-Rad
HPLC Fast Acid Analysis column (100 x 7.8 mm), and a Bio-Rad HPLC column for
fermentation monitoring (150 × 7.8 mm) in series. A Bio-Rad Micro-Guard Cation-H refill
37
cartridge (30 × 4.5 mm) was used for a guard column (Bio-Rad, Hercules, CA). Columns were
maintained at 65 °C by a temperature control unit. Mobile phase consisted of a pH 2.28 solution
of sulfuric acid and water with a resistivity of 18 M obtained from a Millipore Milli-Q reagent
water system. The sulfuric acid solution was used as the solvent with 0.45 mL/min flow rate. The
solvent delivery system was a Waters 515 HPLC pump equipped with a Waters 717 plus
autosampler (Waters Corporation, Milford, MA). Injection volumes were 10 μL for all samples,
and run time for completion was 35 min. A Waters 410 differential refractometer to measure
refractive index connected in series with a Waters 996 photodiode array detector monitored the
eluting compounds. Isocitric, isocitric lactone, and malic acids were detected by photodiode
array at 210 nm and glucose and fructose were detected by the differential refractometer. The
peaks were quantified using external standard calibration based on peak height estimation with
baseline integration. Individual sugars, individual organic acids, total sugars (glucose + fructose),
and total organic acids (isocitric + isocitric lactone + malic acid) were expressed as g/100 g.
Marketability analysis
Marketability analysis was performed on fruit in two replicate clamshells. The
marketability analysis included total decay, total leakage, and weight loss evaluated at 0, 7, and
14 d at 2 °C and 10 °C for each harvest time and genotype.
Total decay and total leakage. The total decay (visible mold or rot) and leakage (berries
with juice visible) of the berries in the clamshell was calculated as (number of decayed or
leaking fruit/number of total fruit) × 100 and expressed as percent.
Weight loss. The weight loss of the clamshell was calculated as the weight decrease of
the total blackberries in the clamshell expressed as percent.
38
Design and statistical analysis
After harvest, the fruit from each of the nine genotypes was completely randomized for
each harvest time (7:00 AM and 12:00 PM). The fruit was stored at two storage temperatures (2 °C
and 10 °C) for 0, 7, and 14 d. Statistical analyses were conducted using JMP® (version 13.2.0;
SAS Institute, Cary, NC). A univariate analysis of variance (ANOVA) was used to determine the
significance of main factors (genotype, harvest time, storage temperature, and storage day) and
interactions. Tukey’s Honestly Significant Difference (HSD) test was used to detect significant
differences (p < 0.05) among means and verify interactions at 95% significance level. Figures
were created with each standard error bar constructed using 1 standard error from the mean.
Results and Discussion
Overall, the 2017 blackberry harvest season was relatively mild at the Fruit Research
Station, with average high temperature of 28.4 °C and a low of 19.4 °C during the month of June.
Significant rain events occurred through April to June (Fig. 1). Air temperature for fruit
harvested at 7:00 AM was cooler (5 to 10 °C) than fruit harvested at 12:00 PM (Table 1). In
addition, the temperature of the fruit harvested on 8 June was cooler than fruit harvested on 20
June at both harvest times. At harvest (day 0), the blackberries were within a commercially
acceptable range for berry weight (3.50-10.32 g), soluble solids (6.40%-11.50%), pH (2.34-
3.97), and titratable acidity (0.48%-1.62%) (data not shown). The blackberries were evaluated
for physiochemical attributes at harvest and physiochemical and marketability attributes during
postharvest storage. At harvest there were significant two-way interactions (harvest time x
genotype) and during postharvest storage there were significant two-, three-, and four-way
interactions (harvest time x storage day x storage temperature x genotype).

39
Physiochemical attributes at harvest
The blackberries from the nine genotypes were harvested at 7:00 AM and 12:00 PM and
evaluated for physiochemical attributes (berry weight, drupelets/berry, firmness, soluble solids,
pH, titratable acidity, total organic acids, and total sugars). There was no significant harvest time
x genotype interactions for drupelets/berry, soluble solids, pH, titratable acidity, total organic
acids, or total sugars (Table 2), and main effect of harvest time did not impact these attributes.
There were significant differences among genotypes for drupelets/berry, soluble solids, pH, and
titratable acidity, but not total organic acids or total sugars. ‘Natchez’ had the most
drupelets/berry (102), and the lowest soluble solids (7.65%) of the genotypes. A-2453 had the
fewest drupelets/berry (36) and the lowest titratable acidity (0.74%). A-2444 had the highest
soluble solids (10.85%) and pH (3.50) of the genotypes. Segantini et al. (2017) found similar
levels of soluble solids and titratable acidity in blackberries at harvest, ranging from 6.60%-
10.90% and 0.50%-1.50%, respectively. However, in the cultivar release description of
‘Natchez’ it was noted to have a soluble solids content of 8.70%, which was slightly higher than
seen in this study (Clark, 2010).
There were no differences among genotypes for total organic acids (0.52-1.35 g/100 g)
and total sugars (2.87-6.06 g/100 g). Individual organic acids and sugars were evaluated, but
there were no significant main effects or interactions. The berries contained isocitric acid (0.32-
0.80 g/100 g), isocitric lactone (0.08-0.13 g/100 g), malic acid (0.12-0.43 g/100 g), glucose
(1.36-2.99 g/100 g) and fructose (1.42-3.07 g/100 g) (data not shown). Since fructose is
characteristically sweeter than glucose, its concentration is desirable, as the majority of
consumers prefer sweeter fruit (Wang et al., 2009). Glucose and fructose levels in the berries
were predominantly in a 1:1 ratio. A ratio of 1:1 glucose to fructose was also observed by Fan-

40
Chiang and Wrolstad (2010). Isocitric acid was the predominant acid and isocitric acid and malic
acid had a ~2:1 ratio. Yin (2017) found Arkansas blackberries, when grown in Clarksville, to be
malic acid predominant; whereas, Segantini et al. (2018) noted Arkansas blackberries to be
isocitric acid predominant. These differences may be genotype specific as Yin’s results were on
various blackberry populations, whereas, Segantini et al. reported on eleven specific genotypes,
of which six were the same as in this study. Kafkas et al. (2006) reported malic acid to be the
predominant acid with no citric acid present in blackberries grown in Turkey, suggesting
growing conditions may have an effect on acid composition of blackberries.
Berry weight and firmness had significant genotype x harvest time interactions (Table 2).
Although berry weights varied by genotype (4.20-9.10 g), the berry weights at both harvest times
were similar for all genotypes except A-2428, which had a larger berry weight at 12:00 PM than
7:00 AM (Fig. 2). This indicated an overall uniform harvest and proper randomization prior to
analysis. Firmness of blackberries at harvest ranged from (3.05-13.69 N). Segantini et al. (2017)
found similar firmness levels of 4.90-9.00 N. ‘Prime-Ark® Traveler’ and A-2453 harvested at
12:00 PM had firmer fruit than the fruit of the other genotypes at both harvest times (Fig. 3). A-
2453, a novel “crispy” genotype, was more firm at 12:00 PM than 7:00 AM. The other genotypes
had similar berry firmness for both harvest times. In terms of temperature at both harvest days,
the 7:00 AM harvest had average ambient temperature that was ~6.9 °C cooler than the 12:00PM
harvest time. Overall, harvest time had a minimal effect on the initial physiochemical attributes
of blackberries. Significant main effects were predominantly due to genotype, and interactions
between harvest time x genotype were generally significant due to one or two outlier values for
limited genotypes.

41
Physiochemical and marketability attributes during postharvest storage
The nine blackberry genotypes harvested at 7:00 AM and 12:00 PM were stored at two
different temperatures (2 °C and 10 °C) and evaluated at 0, 7, and 14 d. Significant two-, three-,
and four-way interactions were found for many of the attributes (Table 3). Postharvest storage
results were analyzed by storage temperature to demonstrate how different genotypes harvested
at different times performed as storage progressed (Tables 4 and 5).
Berry weight ranged from 2.92-10.50 g during postharvest storage. There was a
significant harvest time x genotype interaction for berry weight at both storage temperatures, but
berry weight was not impacted by harvest time (Fig. 4). ‘Natchez’ had the highest berry weight,
and A-2453 the smallest. There was also an interaction between storage day x genotype at 10 °C
(Fig. 5). Most of the genotypes lost berry weight as storage progressed, but the reduction was not
significant except ‘Natchez’, which had lower berry weight on day 14 than day 0. ‘Natchez’ was
the largest berry and its size might have contributed to greater weight loss. The berry weights in
this study were typically smaller than those found in 2015 (6 to 14 g) for Arkansas-grown
blackberries (Segantini et al., 2017; Threlfall et al., 2016).
Soluble solids ranged from 6.20%-12.20% during storage. Soluble solids of blackberries
at 2 °C were impacted by storage day x genotype, but storage day did not have an effect on
soluble solids (Fig. 6). A-2444 had the highest soluble solids at all storage times. Although,
soluble solids of blackberries at 10 °C had a significant three-way interaction (harvest time x
storage day x genotype), harvest time and storage day did not greatly impact soluble solids (Fig.
7).
The pH of the berries ranged from 2.34-4.31 during storage. There was an interaction
between storage day x genotype for pH at both storage temperatures (Fig. 8). The pH was higher

42
at day 14 than day 0 for A-2453, A-2526, APF-268, and ‘Ouachita’ at both temperatures. As
storage progressed, the pH increased for the genotypes, which has also been observed in previous
studies on blackberries (Tosun et al., 2008).
During storage, titratable acidity ranged from 0.30%-1.62%. There was an interaction
between storage day x genotype at 2 °C, but titratable acidity was not impacted by storage day
(Fig. 9). There was an interaction between harvest time x storage day at 2 °C, but titratable
acidity was not impacted by storage day at either harvest time (Fig. 10). As with berry weight,
there was a general trend for decreased titratable acidity after 14 d storage but was not
significant. At 10 °C, there were no significant interactions for titratable acidity. For the
blackberries stored at 10 °C, fruit harvested at 12:00 PM had slightly higher titratable acidity
(0.77%) than fruit harvested at 7:00 AM (0.68%). Additionally, after 14 d storage, the titratable
acidity was lower (0.54%) than day 0 (0.93%) or day 7 (0.72%). A-2453 had the lowest titratable
acidity (0.61%) during storage, and ‘Ouachita’ had the highest (0.95%) (Table 5).
Weight loss of the blackberry-filled clamshells during storage ranged from 0.00%-
22.14% and was affected by a storage day x genotype and harvest time x genotype interactions at
both temperatures (Tables 4 and 5 and Figs. 11 and 12). When examining the effects of storage
day on weight loss, weight loss increased for all genotypes regardless of storage temperature, but
there was less weight loss at 2 °C (Fig. 11). A-2444 had the greatest weight loss after 14 d
storage at 2 °C and 10 °C, 7.34% and 18.31%, respectively. A-2444 and A-2428 had larger
drupelets than the other genotypes which could have led to increased weight loss (J. R. Clark,
personal communication). There was less weight loss during storage at 2 °C than at 10 °C
regardless of harvest time (Fig. 12). Weight loss at 2 °C during storage averaged 2.52% whereas

43
weight loss at 10 °C averaged 6.35%. During storage, berries harvested at 7:00 AM did not differ
in weight loss from berries harvested at 12:00 PM.
Leakage ranged from 0.00%-92.86% during storage. At 2 °C, there were no significant
interactions for leakage; however, at 10 °C, leakage was impacted by storage day x genotype. At
2 °C, harvest time did not impact leakage of blackberries but storage day and genotype did.
Leakage increased during storage at 2 °C with 8.41% at day 0 to 21.10% at day 14 (Table 4).
‘Natchez’ had the most leakage (18.91%) during storage at 2 °C, and A-2453 the least (5.60%)
(Table 4). After 14 days storage at 10 °C, Natchez had the most leakage (67.78%), and Osage the
least (16.04%) (Fig. 13). At both storage temperatures, generally, ‘Natchez’ had one of the
highest incidences of leakage, which most likely attributed to the decreased berry weight
mentioned previously. With the exception of ‘Ouachita’, storage at 10 °C resulted in increased
leakage during storage.
At both storage temperatures, decay had no significant interactions (Tables 4 and 5).
Decay ranged from 0% to 100% during storage. Harvest time did not impact decay at either
storage temperature. Decay during storage increased at both storage temperatures. After 14 d
storage at 2 °C and 10 °C, decay was 38.92% and 70.00%, respectively. A-2444 had the most
decay at both storage temperatures although most genotypes were statistically similar, while
‘Ouachita’ had the least (12.45%) at 2 °C. There were no differences among genotypes for decay
at 10 °C. In the release of ‘Ouachita’, it was reported to have very good storage potential, with a
storage period longer than previously released cultivars, such as ‘Navaho’, which supports the
low incidence of decay in this study (Clark and Moore, 2005).
Red drupelet reversion ranged from 0.00%-21.52% during storage and was impacted by
harvest time x storage day x genotype interactions at both storage temperatures (Fig. 14).
44
However, harvest time had minimal impact on red drupelet reversion during storage at both 2 °C
and 10 °C (Tables 4 and 5). Yin (2017) and McCoy et al. (2016) evaluated blackberries grown in
Arkansas during 2016 and 2015, respectively, and found that blackberries harvested in the
morning had less red drupelet reversion compared to fruit harvested in the afternoon. When
comparing the 2016 versus 2017 harvest seasons, there were temperature and rainfall differences
that might contribute to the differences between this study’s results and results by the study by
Yin (2016). Although the average temperatures in June were warmer in 2016 compared to 2017,
the temperatures on the days of harvest in June were warmer in 2017 as compared to 2016 for
both harvest times. On 9 June 2016, temperatures at 7:00 AM and 12:00 PM were 22 °C and 28 °C,
respectively as compared to 26 °C and 32 °C on 8 June 2017 (Table 1). Similarly, on 21 June
2016, temperatures at 7:00 AM and 12:00 PM were 24 °C and 30 °C, respectively as compared to
29 °C and 39 °C on 21 June 2017. However, June minimum and maximum temperatures for
2016 and 2017 were 21-31 °C and 19-28 °C, respectively. In terms of rainfall, there was 43 mm
in 2016 and 103 mm in 2017.
‘Natchez’ had the highest red drupelet reversion at 7:00 AM on day 7 for both storage
temperatures (Fig. 14). Previous research has shown ‘Natchez’ had the lowest incidence of red
drupelet reversion during storage as compared to 10 other genotypes (Segantini et al., 2017). As
mentioned previously, ‘Natchez’ had one of the highest incidences of leakage, which potentially
could increase red drupelet reversion. Additionally, in 2015, a week prior to harvest of
‘Natchez’, Segantini et al. (2017) noted 9.10 mm of cumulative rainfall; whereas, a week prior to
the 2017 harvest, ‘Natchez’ experienced a 35.80 mm cumulative rainfall. However, ‘Natchez’ at
14 d storage had much lower reversion than after just 7 d storage although fruit was harvested on
the same day. Most other genotypes had a gradual increase in reversion during storage. This
45
inconsistency is not easily explained, and it remains unclear why ‘Natchez’ harvested at 7:00 AM
experienced such high levels of reversion after 7 d storage. ‘Natchez’ also had lower reversion
for the 12:00 PM harvest compared to 7:00 AM.
Red drupelet reversion for A-2444, A-2453, APF-268, and ‘Ouachita’ was higher after 14
d of storage than 7 d of storage regardless of harvest time and storage temperature. After 14 d
postharvest storage at 2 °C, red drupelet reversion in ‘Prime-Ark® Traveler’ harvested at
12:00PM significantly increased to 9.75% compared to no increase at 10 °C. As mentioned
previously, fruit for this study was transported at harvest from Clarksville, AR to Fayetteville,
AR (~2 hrs travel time) after both the 7:00 AM and 12:00 PM harvests were completed in pre-
chilled ice chests with cooler packs. Red drupelet reversion could have been affected due to
potential temperature acclimation from removing field heat gradually in the ice chest before
placing the fruit at the final storage temperatures. This gradual transition would have allowed the
fruit to acclimate to its conditions, thus minimizing red drupelet reversion as it has been shown
to minimize chilling injury in other fruits such as peaches and plums (Sun et al., 2010; Tanou et
al., 2017).
During storage, berry firmness ranged from 1.88-13.69 N. There was a significant harvest
time x genotype interaction at both storage temperatures (Tables 4 and 5). In general, most
berries were less firm when stored at 10 °C as compared to 2 °C. Studies by Mir et al. (2001) and
NeSmith et al. (2005) also noted decreased firmness as a response to storage temperature in
blueberries and apples. Harvest time did not impact firmness except for A-2453, which was
firmer at 12:00 PM than 7:00 AM at both storage temperatures (Fig. 15). Salgado and Clark (2016)
found that “crispy” genotypes, such as A-2453, were firmer than non-crispy genotypes. In this
study, the “crispy” genotype was firmer at later harvest times. In a previous study by McCoy et

46
al. (2016), harvest time had a minimal effect on fruit firmness and berries harvested at 1:00PM
were not softer than berries harvested at 7:00 AM. This finding is similar to the other eight
genotypes included in this study.
Total organic acids and sugars ranged from 0.09-1.28 g/100g and 0.06-15.41 g/100g,
respectively. At both storage temperatures, total organic acids were not impacted by harvest
time, storage day, nor genotype and there were no significant interaction effects. At 2 °C, total
sugars were impacted by a harvest time x storage day interaction. After 14 days storage, fruit
harvested at 7:00 AM had a higher total sugar content (4.87 g/100g) than fruit harvested at
12:00PM (2.49 g/100g) stored at 2 °C (Fig. 16). However, at 10 °C, there were no significant
interactions or main effects of harvest time, storage day, or genotype for total sugars.
After 14 d of storage at 2 °C and 10 °C, the impact of the marketability attributes
(leakage, decay, weight loss, red drupelet reversion, and firmness) of fresh-market blackberries
was apparent. Storage temperature had a greater impact than harvest time on marketability
attributes, after 14 d of storage, regardless of genotype (Fig. 17). Red drupelet reversion was not
impacted by storage temperature. Leakage, decay, and weight loss were greater, and firmness
lower, when the berries were stored at 10 °C versus 2 °C. A similar study by Palharini et al.
(2015) found increased decay in blackberries when fruit was stored at higher temperatures (15 °C
vs 2 °C or 5 °C). Similar trends were observed when looking at the effects of storage temperature
and genotype on marketability attributes after 14 d storage, regardless of harvest time (Fig. 18).
Genotypes stored at 10 °C had higher leakage, decay, and weight loss, and lower firmness after
14 d storage. A-2453 was the firmest and ‘Ouachita’ was the least firm at both storage
temperatures. A-2526 had the least weight loss at both storage temperatures. At 2 °C, A-2453 had
the least leakage, and at 10 °C ‘Osage’ had the least leakage. A-2453 had the least red drupelet
47
reversion at both storage temperatures. Overall, a greater impact on marketability was due to the
effects of storage temperature over the effects of harvest time for these genotypes.
Conclusion
Overall, genotype and storage day had the most significant effects on the postharvest
quality of fresh-market blackberries grown in Arkansas. Blackberry marketability attribute
performance was directly related to storage temperature. Fruit stored at a lower temperature
retained marketable attributes longer than fruit stored at the higher temperature. Red drupelet
reversion was primarily attributed to genotypic effects, not harvest time nor storage temperature.
A-2453 performed exceptionally well in this study with the least red drupelet reversion at both
storage temperatures, less leakage after 14 d storage at 2 °C, and more firmness at both harvest
times than the “non-crispy” genotypes. Additionally, ‘Osage’ had the least leakage at 10 °C after
14 d storage; and, ‘Ouachita’ and APF-268 had the least decay during storage at 2 °C and 10 °C,
respectively.
Although the previously held theory was that harvest time would impact postharvest
quality of fresh-market blackberries, minimal impact of harvest time was found in this study. On
day 0, harvest time impacted blackberry firmness and berry weight of select genotypes, but in
general did not impact physiochemical attributes. In addition, after 14 d storage, harvest time had
no significant impact on the marketability of fresh-market blackberries. These findings may be
partially attributed to how the harvested blackberries were placed into coolers and transported. In
addition, rain events prior to harvest could have affected the overall fruit quality for example;
berry weight and soluble solids were lower in this study than previously found in other research
on these genotypes in Arkansas. For this reason, further analysis through a multi-year repeated

48
study is needed to investigate how harvest time affects the postharvest quality of Arkansas grown
fresh-market blackberries.

49
Literature Cited
Barnett, S. 2007, Blackberry sales up 44% as part of UK soft fruit boom, Haymarket Business
Pub., Teddington, United Kingdom.
Clark, J.R., and C.E. Finn. 2011. Blackberry breeding and genetics, Fruit Veg. Cereal Sci.
Biotechnol. 5:27-43.
Clark, J.R. 2016. Breeding southern blackberries: Idea to industry. Acta Hort. 1133:3-11.
Clark, J.R., and J.N. Moore. 2008. ‘Natchez’ thornless blackberry. HortScience 43:1897-1899.
Clark, J.R., and J.N. Moore. 2005. ‘Ouachita’ thornless blackberry. HortScience 40:258-260.
Clark, J.R.,J.N. Moore, J. Lopez-Medina, P. Perkins-Veazie, and C.E. Finn. 2005. ‘Prime Jan’
(APF-8) and ‘Prime-Jim’ (APF-12) primocane-fruiting blackberries. HortScience 40:852-
855.
Fan-Chiang, H., and R. Wrolstad. 2010. Sugar and nonvolatile acid composition of blackberries,
J. AOAC Intl., 93:956-965.
Kafkas, E., M. Koşar, N. Türemiş, and K.H.C. Başer. 2006. Analysis of sugars, organic acids
and vitamin C contents of blackberry genotypes from Turkey", Food Chem. 97:732-736.
Lee, J. 2017. Blackberry fruit quality components, composition, and potential health benefits In:
Hall, H.K. and Funt, R.C., editors. Blackberries and Their Hybrids. Oxfordshire, United
Kingdom: CABI. 49-62.
Machado, A.P.D.F., J.L. Pasquel-Reátegui, G.F. Barbero, and J. Martínez. 2015. Pressurized
liquid extraction of bioactive compounds from blackberry (Rubus fruticosus L.) residues: a
comparison with conventional methods, Food Res. Intl., 77:675-683.
Palharini, M.C. de Arruda, I.H. Fischer, M.R. da Cruz Vegian, M. de Souza Fileti, and S.M.N.M.
Montes, 2015. Effect of storage temperature on blackberry postharvest conservation,
Pesquisa Agropecuária Tropical 45:413-419.
McCoy, J.E., J.R. Clark, A. Salgado, and A. Jecmen. 2016. Evaluation of harvest
time/temperature and storage temperature on postharvest incidence of red drupelet reversion
development and firmness of blackberry (Rubus L. subgenus Rubus Watson), Discovery,
17:59-65.
Mir, N.A., E. Curell, N. Khan, M. Whitaker, and R.M. Beaudry. 2001. Harvest maturity, storage
temperature, and 1-mcp application frequency alter firmness retention and chlorophyll
fluorescence of `Redchief delicious' apples, J. Amer. Soc. Hort. Sci., 126:618.

50
NeSmith, D.S., A. Nunez-Barrios, S.E. Prussia, and D. Aggarwal. 2005. Postharvest berry
quality of six rabbiteye blueberry cultivars in response to temperature, J. Amer. Pomol. Soc.
59:13.
Salgado, A.A., and J.R. Clark. 2016. “Crispy” blackberry genotypes: a breeding innovation of
the University of Arkansas blackberry breeding program, HortScience 51:468-471.
Segantini, D.M., R. Thelfall, J.R. Clark, C.R. Brownmiller, L.R. Howard, and L.J.R. Lawless.
2017. Changes in fresh-market and sensory attributes of blackberry genotypes after
postharvest storage, J. Berry Res. 1-17.
Segantini, D.M., R.T. Threlfall, J.R. Clark, L.R. Howard, and C.R. Brownmiller. 2018.
Physiochemical changes in floricane and primocane blackberries harvested from primocane
genotypes, HortScience 53: 9-15.
Strik, B.C., J.R. Clark, C.E. Finn, and M.P. Banados. 2007. Worldwide blackberry production,
HortTechnology 17:205.
Sun, J., J. Chen, J. Kuang, W. Chen, and W. Lu. 2010. Expression of sHSP genes as affected by
heat shock and cold acclimation in relation to chilling tolerance in plum fruit, Postharvest
Bio. Technol. 55:91-96.
Tanou, G., I. Minas, F. Scossa, M. Belghazi, A. Xanthopoulou, I. Ganopoulos, P. Madesis, A.
Fernie, and A. Molassiotis. 2017. Exploring priming responses involved in peach fruit
acclimation to cold stress, Scientific Rpt. 7:1.
Threlfall, R.T., O.S. Hines, J.R. Clark, L.R. Howard, C.R. Brownmiller, D.M. Segantini, and
L.J.R. Lawless. 2016. Physiochemical and sensory attributes of fresh blackberries grown in
the southeastern United States, HortScience 51:1351-1362.
Tosun, I., N.S. Ustun, and B. Tekguler. 2008. Physical and chemical changes during ripening of
blackberry fruits, Scientia Argricola 65:87-90.
Walker, T., J. Morris, R. Threlfall, and G. Main. 2003. Analysis of wine components in
Cynthiana and Syrah wines, J. Agri. Food Chem. 51:1543-1547.
Wang, S.Y., C.Y. Wang, and C. Chen. 2009. The influence of light and maturity on fruit quality
and flavonoid content of red raspberries, Food Chem. 112:676-684.
Yin, M. 2017. Studies in blackberry: development and implementation of a phenotyping protocol
for blackberry seedling populations and impact of time of day of harvest on red drupelet
reversion for University of Arkansas blackberry genotypes, Univ. Ark., Fayetteville, MS
Thesis.

51
U.S. Department of Agriculture (USDA). 2017. National agricultural statistics service,
blackberry statistics.
https://www.nass.usda.gov/Statistics_by_Subject/index.php?sector=CROPS.
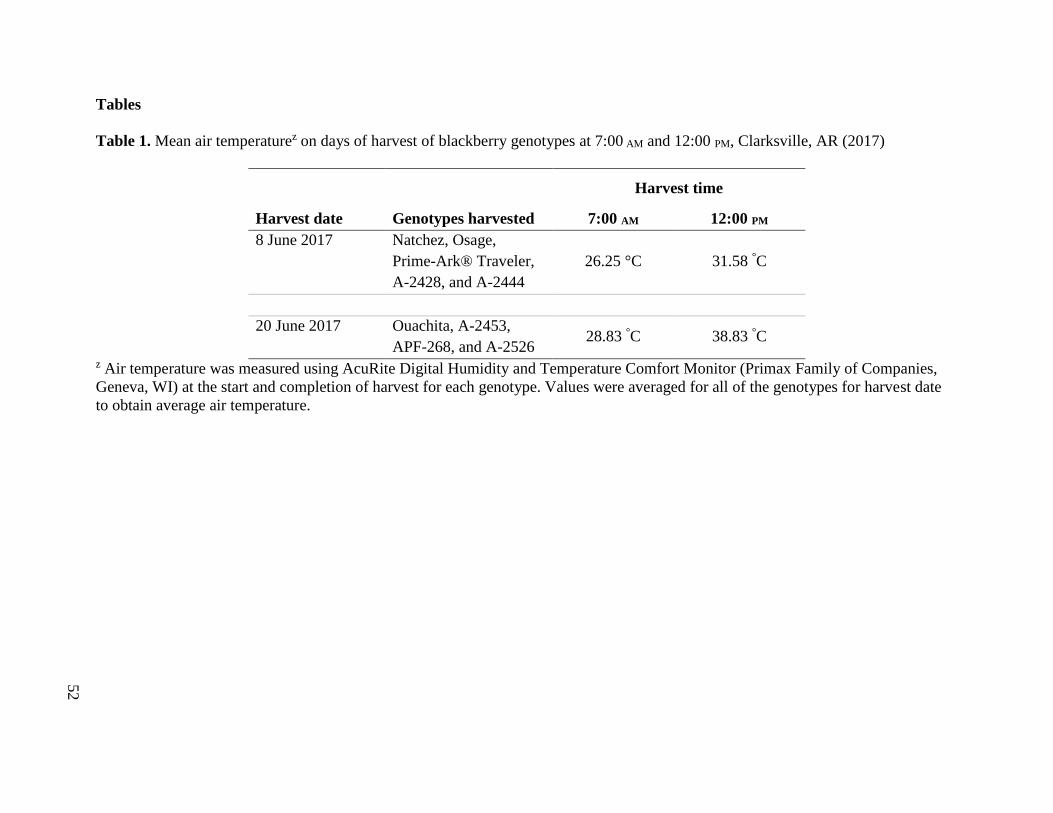
52
Tables
Table 1. Mean air temperaturez on days of harvest of blackberry genotypes at 7:00 AM and 12:00 PM, Clarksville, AR (2017)
Harvest time
Harvest date Genotypes harvested 7:00 AM 12:00 PM
8 June 2017 Natchez, Osage,
Prime-Ark® Traveler,
A-2428, and A-2444
26.25 °C 31.58 °C
20 June 2017 Ouachita, A-2453,
APF-268, and A-2526 28.83 °C 38.83 °C
z Air temperature was measured using AcuRite Digital Humidity and Temperature Comfort Monitor (Primax Family of Companies,
Geneva, WI) at the start and completion of harvest for each genotype. Values were averaged for all of the genotypes for harvest date
to obtain average air temperature.
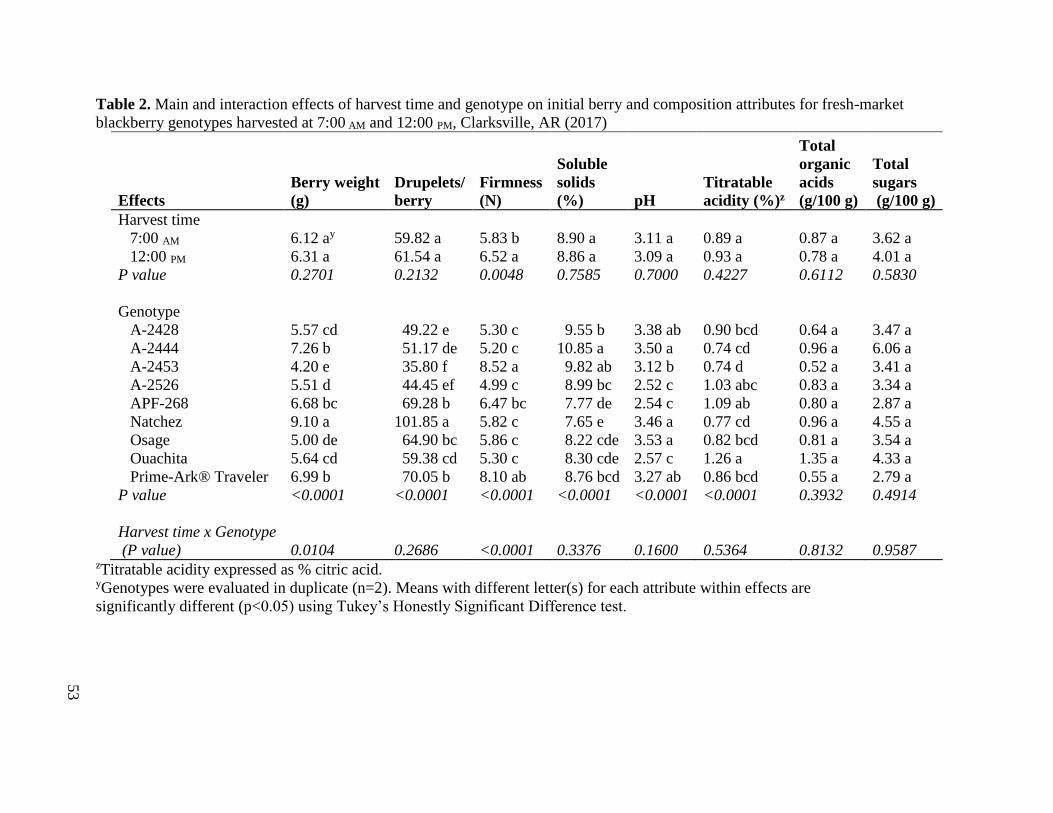
53
Table 2. Main and interaction effects of harvest time and genotype on initial berry and composition attributes for fresh-market
blackberry genotypes harvested at 7:00 AM and 12:00 PM, Clarksville, AR (2017)
Effects
Berry weight
(g)
Drupelets/
berry
Firmness
(N)
Soluble
solids
(%) pH
Titratable
acidity (%)z
Total
organic
acids
(g/100 g)
Total
sugars
(g/100 g)
Harvest time
7:00 AM 6.12 ay 59.82 a 5.83 b 8.90 a 3.11 a 0.89 a 0.87 a 3.62 a
12:00 PM 6.31 a 61.54 a 6.52 a 8.86 a 3.09 a 0.93 a 0.78 a 4.01 a
P value 0.2701 0.2132 0.0048 0.7585 0.7000 0.4227 0.6112 0.5830
Genotype
A-2428 5.57 cd 49.22 e 5.30 c 9.55 b 3.38 ab 0.90 bcd 0.64 a 3.47 a
A-2444 7.26 b 51.17 de 5.20 c 10.85 a 3.50 a 0.74 cd 0.96 a 6.06 a
A-2453 4.20 e 35.80 f 8.52 a 9.82 ab 3.12 b 0.74 d 0.52 a 3.41 a
A-2526 5.51 d 44.45 ef 4.99 c 8.99 bc 2.52 c 1.03 abc 0.83 a 3.34 a
APF-268 6.68 bc 69.28 b 6.47 bc 7.77 de 2.54 c 1.09 ab 0.80 a 2.87 a
Natchez 9.10 a 101.85 a 5.82 c 7.65 e 3.46 a 0.77 cd 0.96 a 4.55 a
Osage 5.00 de 64.90 bc 5.86 c 8.22 cde 3.53 a 0.82 bcd 0.81 a 3.54 a
Ouachita 5.64 cd 59.38 cd 5.30 c 8.30 cde 2.57 c 1.26 a 1.35 a 4.33 a
Prime-Ark® Traveler 6.99 b 70.05 b 8.10 ab 8.76 bcd 3.27 ab 0.86 bcd 0.55 a 2.79 a
P value <0.0001 <0.0001 <0.0001 <0.0001 <0.0001 <0.0001 0.3932 0.4914
Harvest time x Genotype
(P value) 0.0104 0.2686 <0.0001 0.3376 0.1600 0.5364 0.8132 0.9587 zTitratable acidity expressed as % citric acid. yGenotypes were evaluated in duplicate (n=2). Means with different letter(s) for each attribute within effects are
significantly different (p<0.05) using Tukey’s Honestly Significant Difference test.
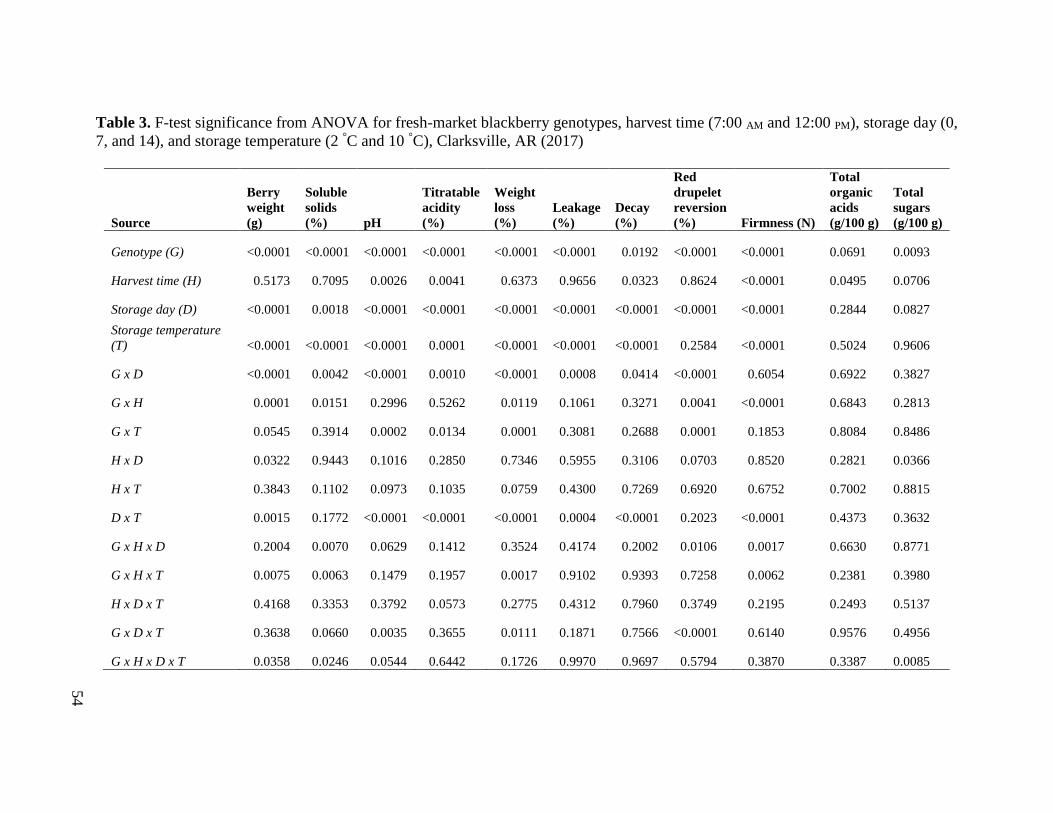
54
Table 3. F-test significance from ANOVA for fresh-market blackberry genotypes, harvest time (7:00 AM and 12:00 PM), storage day (0,
7, and 14), and storage temperature (2 °C and 10 °C), Clarksville, AR (2017)
Source
Berry
weight
(g)
Soluble
solids
(%) pH
Titratable
acidity
(%)
Weight
loss
(%)
Leakage
(%)
Decay
(%)
Red
drupelet
reversion
(%) Firmness (N)
Total
organic
acids
(g/100 g)
Total
sugars
(g/100 g)
Genotype (G) <0.0001 <0.0001 <0.0001 <0.0001 <0.0001 <0.0001 0.0192 <0.0001 <0.0001 0.0691 0.0093
Harvest time (H) 0.5173 0.7095 0.0026 0.0041 0.6373 0.9656 0.0323 0.8624 <0.0001 0.0495 0.0706
Storage day (D) <0.0001 0.0018 <0.0001 <0.0001 <0.0001 <0.0001 <0.0001 <0.0001 <0.0001 0.2844 0.0827
Storage temperature
(T) <0.0001 <0.0001 <0.0001 0.0001 <0.0001 <0.0001 <0.0001 0.2584 <0.0001 0.5024 0.9606
G x D <0.0001 0.0042 <0.0001 0.0010 <0.0001 0.0008 0.0414 <0.0001 0.6054 0.6922 0.3827
G x H 0.0001 0.0151 0.2996 0.5262 0.0119 0.1061 0.3271 0.0041 <0.0001 0.6843 0.2813
G x T 0.0545 0.3914 0.0002 0.0134 0.0001 0.3081 0.2688 0.0001 0.1853 0.8084 0.8486
H x D 0.0322 0.9443 0.1016 0.2850 0.7346 0.5955 0.3106 0.0703 0.8520 0.2821 0.0366
H x T 0.3843 0.1102 0.0973 0.1035 0.0759 0.4300 0.7269 0.6920 0.6752 0.7002 0.8815
D x T 0.0015 0.1772 <0.0001 <0.0001 <0.0001 0.0004 <0.0001 0.2023 <0.0001 0.4373 0.3632
G x H x D 0.2004 0.0070 0.0629 0.1412 0.3524 0.4174 0.2002 0.0106 0.0017 0.6630 0.8771
G x H x T 0.0075 0.0063 0.1479 0.1957 0.0017 0.9102 0.9393 0.7258 0.0062 0.2381 0.3980
H x D x T 0.4168 0.3353 0.3792 0.0573 0.2775 0.4312 0.7960 0.3749 0.2195 0.2493 0.5137
G x D x T 0.3638 0.0660 0.0035 0.3655 0.0111 0.1871 0.7566 <0.0001 0.6140 0.9576 0.4956
G x H x D x T 0.0358 0.0246 0.0544 0.6442 0.1726 0.9970 0.9697 0.5794 0.3870 0.3387 0.0085

55
Table 4. Main and interaction effects of blackberries for harvest time, storage day, and genotypes on physiochemical and marketability
attributes of fresh-market blackberry genotypes harvested at 7:00 AM and 12:00 PM, and stored at 2 °C. Clarksville, AR (2017)
Effects
Berry
weight
(g)
Soluble
solids
(%) pH
Titratable
acidity
(%)
Weight
loss
(%)
Leakage
(%)
Decay
(%)
Red
drupelet
reversion
(%)
Firmness
(N)
Total
organic
acids
(g/100 g)
Total
sugars
(g/100 g)
Harvest time (H)
7:00 AM 6.47 az 8.82 a 3.31 a 0.79 a 2.60 a 9.13 a 17.90 a 4.12 a 5.86 b 0.90 a 4.21 a
12:00 PM 6.49 a 8.92 a 3.28 a 0.82 a 2.45 a 10.54 a 22.77 a 3.89 a 6.55 a 0.72 a 3.52 a
P value 0.8987 0.3438 0.3082 0.3472 0.0613 0.4823 0.0572 0.5566 0.0074 0.0601 0.1010
Storage day (D)
0 days 6.34 a 8.96 a 3.12 b 0.90 a 0.00 c 0.00 c 0.00 c 0.40 b 6.06 ab 0.77 a 3.87 a
7 days 6.73 a 8.86 a 3.20 b 0.78 b 2.60 b 8.41 b 22.08 b 5.66 a 5.83 b 0.84 a 4.04 a
14 days 6.39 a 8.78 a 3.57 a 0.74 b 4.98 a 21.10 a 38.92 a 5.94 a 6.72 a 0.81 a 3.68 a
P value 0.0788 0.3744 <0.0001 <0.0001 <0.0001 <0.0001 <0.0001 <0.0001 0.0144 0.8421 0.7775
Genotype (G)
A-2428 6.16 cde 9.27 bc 3.45 b 0.81 bcd 2.79 b 8.55 b 27.09 ab 3.81 b 6.03 cd 0.78 a 3.85 a
A-2444 7.09 bcd 10.70 a 3.53 ab 0.76 cde 3.83 a 7.22 b 30.00 a 4.40 b 5.40 cd 0.85 a 4.93 a
A-2453 4.10 f 9.84 b 3.36 b 0.66 de 3.04 b 5.60 b 17.88 ab 2.16 b 8.73 a 0.81 a 4.39 a
A-2526 6.11 de 9.14 bc 3.07 c 0.87 abc 1.76 c 11.11 ab 19.17 ab 3.66 b 4.87 d 0.64 a 3.93 a
APF-268 7.77 ab 7.45 f 2.87 d 0.94 ab 2.00 c 6.44 b 20.26 ab 4.63 b 6.97 bc 0.79 a 2.89 a
Natchez 8.76 a 7.73 ef 3.40 b 0.74 cde 2.21 c 18.91 a 12.64 b 7.36 a 5.53 cd 0.92 a 4.17 a
Osage 5.33 e 8.83 cd 3.64 a 0.61 e 2.95 b 6.33 b 20.74 ab 3.42 b 5.50 cd 0.70 a 3.90 a
Ouachita 5.91 e 8.63 cd 2.95 cd 1.04 a 2.23 c 14.02 ab 12.45 b 2.17 b 4.79 d 1.16 a 3.86 a
Prime-Ark®
Traveler 7.14 bc 8.29 de 3.36 b 0.83 bcd 1.92 c 10.32 b 22.80 ab 4.40 b 8.02 ab 0.62 a 2.88
P value <0.0001 <0.0001 <0.0001 <0.0001 <0.0001 0.0475 0.0254 <0.0001 <0.0001 0.2855 0.3802
D x G (P value) 0.3756 0.0073 <0.0001 0.0146 <0.0001 0.6004 0.5346 <0.0001 0.8197 0.6023 0.1217
H x G (P value) 0.0224 0.1113 0.1796 0.1467 0.0021 0.1153 0.8400 0.0582 <0.0001 0.5707 0.4052
H x D (P value) 0.0934 0.5937 0.0726 0.0407 0.3756 0.1061 0.3455 0.5425 0.4007 0.0507 0.0100
H x D x G (P value) 0.2383 0.0684 0.0777 0.3533 0.4174 0.1607 0.8440 0.0242 0.0582 0.5610 0.0977 zGenotypes were evaluated in duplicate (n=2). Means with different letter(s) for each attribute within main effects are significantly
different.

56
Table 5. Main and interaction effects of blackberries for harvest time, storage day, and genotypes on physiochemical and marketability
attributes of fresh-market blackberry genotypes harvested at 7:00 AM and 12:00 PM, and stored at 10 °C. Clarksville, AR (2017)
Effects
Berry
weight
(g)
Soluble
solids
(%) pH
Titratable
acidity
(%)
Weight
loss
(%)
Leakage
(%)
Decay
(%)
Red
drupelet
reversion
(%)
Firmness
(N)
Total
organic
acids
(g/100 g)
Total
sugars
(g/100 g)
Harvest time (H)
7:00 AM 5.86 az 8.64 a 3.47 a 0.68 b 6.23 a 20.78 a 33.27 a 4.06 a 4.66 b 0.92 a 4.18 a
12:00 PM 5.73 a 8.48 a 3.38 b 0.77 a 6.48 a 19.22 a 37.00 a 3.45 b 5.48 a 0.80 a 3.59 a
P value 0.3094 0.1984 0.0019 0.0030 0.2329 0.6245 0.2387 0.0310 <0.0001 0.3133 0.3030
Storage day (D)
0 days 6.09 a 8.80 a 3.08 c 0.93 a 0.00 c 0.20 c 0.00 c 0.47 b 6.28 a 0.87 a 3.76 a
7 days 5.74 ab 8.61 ab 3.32 b 0.72 b 6.08 b 19.60 b 35.37 b 5.49 a 5.04 b 0.99 a 4.73 a
14 days 5.55 b 8.27 b 3.88 a 0.54 c 12.99 a 40.20 a 70.00 a 5.29 a 3.90 c 0.72 a 3.16 a
P value 0.0048 0.0028 <0.0001 <0.0001 <0.0001 <0.0001 <0.0001 <0.0001 <0.0001 0.2120 0.8025
Genotype (G)
A-2428 5.76 de 9.13 bc 3.80 a 0.62 c 7.16 b 19.57 abc 41.07 a 3.27 bc 4.15 d 0.79 a 4.35 a
A-2444 6.66 bc 10.60 a 3.61 ab 0.72 bc 8.82 a 22.62 abc 41.31 a 4.97 b 4.49 cd 1.26 a 6.61 a
A-2453 3.86 g 9.71 b 3.47 b 0.61 c 6.82 bc 9.61 bc 34.82 a 2.43 c 7.17 a 0.60 a 4.25 a
A-2526 4.72 fg 8.70 cd 3.15 c 0.86 ab 4.94 e 26.72 abc 32.52 a 2.71 c 4.42 cd 0.81 a 3.12 a
APF-268 7.26 ab 7.47 e 3.16 c 0.73 bc 4.97 e 11.90 bc 26.42 a 3.07 c 5.47 bc 0.80 a 3.29 a
Natchez 8.12 a 7.38 e 3.48 b 0.67 bc 6.50 bcd 35.55 a 41.09 a 8.06 a 4.60 cd 0.91 a 4.05 a
Osage 4.24 g 8.19 de 3.59 b 0.69 bc 7.18 b 6.60 c 31.25 a 3.39 bc 4.82 cd 0.85 a 3.37 a
Ouachita 5.26 ef 8.00 de 3.06 c 0.95 a 5.48 cde 30.15 ab 32.57 a 2.78 c 4.22 d 1.08 a 3.32 a
Prime-Ark®
Traveler 6.29 cd 7.85 e 3.52 b 0.69 bc 5.31 de 17.28 abc 34.80 a 3.08 c 6.33 ab 0.66 a 2.60 a
P value <0.0001 <0.0001 <0.0001 <0.0001 <0.0001 0.0006 0.2167 <0.0001 <0.0001 0.3143 0.0816
D x G (P value) 0.0027 0.0713 <0.0001 0.0860 <0.0001 0.0055 0.1497 <0.0001 0.3727 0.9468 0.7317
H x G (P value) 0.0080 0.0033 0.2750 0.6259 0.0088 0.6042 0.4974 0.0015 <0.0001 0.3614 0.3167
H x D (P value) 0.5160 0.5418 0.5128 0.3762 0.4648 0.9608 0.6313 0.0324 0.6062 0.7977 0.6524
H x D x G (P value) 0.4148 0.0096 0.0753 0.5000 0.2537 0.9857 0.3999 0.0260 0.2337 0.4598 0.2328 zGenotypes were evaluated in duplicate (n=2). Means with different letter(s) for each attribute within main effects are significantly
different.

57
Figures
Fig. 1. Temperature and rain conditions at the University of Arkansas Fruit Research Station, Clarksville, AR (2017)
0
100
200
300
400
500
600
700
0
5
10
15
20
25
30
35
March April May June July
Tem
per
atu
re (
°C)
Rainfall Average high Average low
Rain
fall (m
m)
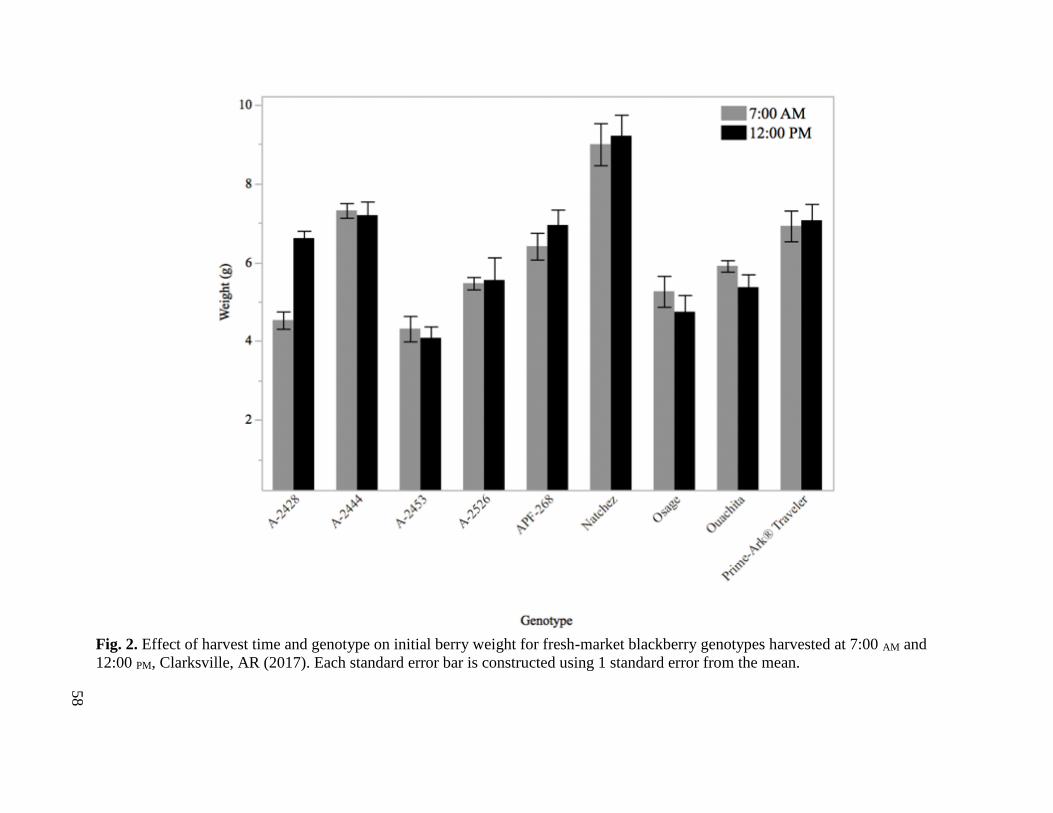
58
Fig. 2. Effect of harvest time and genotype on initial berry weight for fresh-market blackberry genotypes harvested at 7:00 AM and
12:00 PM, Clarksville, AR (2017). Each standard error bar is constructed using 1 standard error from the mean.

59
Fig. 3. Effect of harvest time and genotype on initial firmness for fresh-market blackberry genotypes harvested at 7:00 AM and 12:00
PM, Clarksville, AR (2017). Each standard error bar is constructed using 1 standard error from the mean.
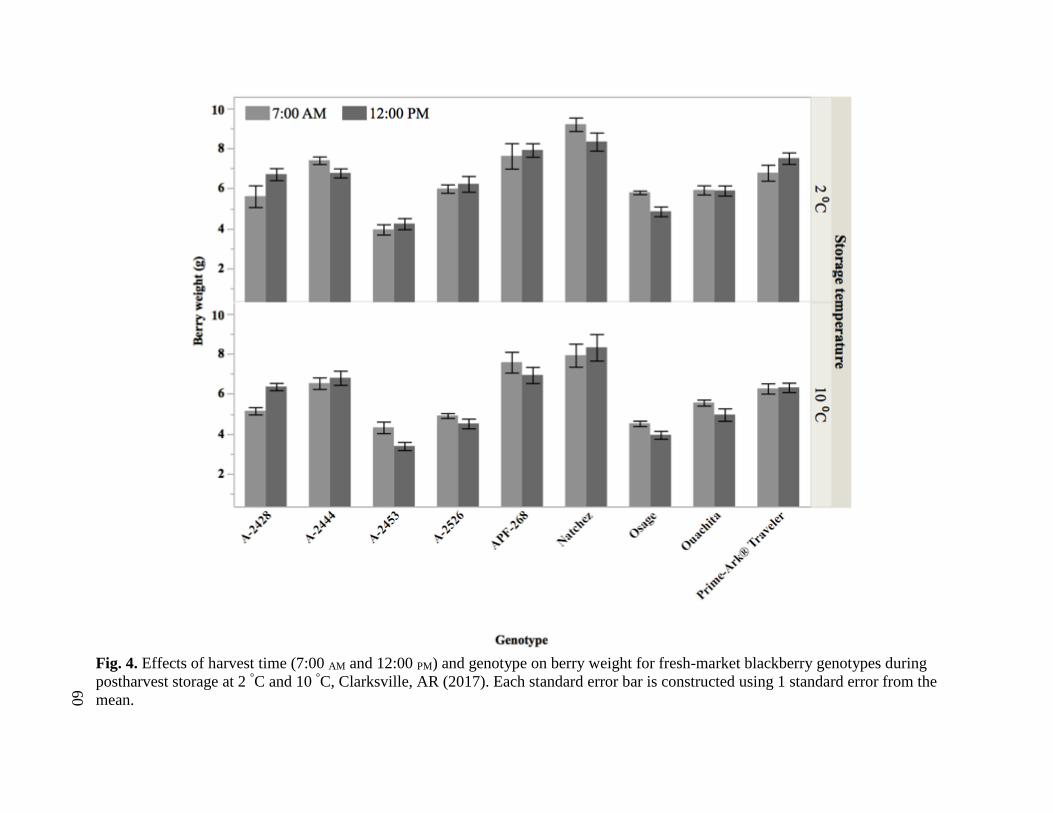
60
Fig. 4. Effects of harvest time (7:00 AM and 12:00 PM) and genotype on berry weight for fresh-market blackberry genotypes during
postharvest storage at 2 °C and 10 °C, Clarksville, AR (2017). Each standard error bar is constructed using 1 standard error from the
mean.

61
Fig. 5. Effects of storage day (0, 7, and 14 d) and genotype on berry weight for fresh-market blackberry genotypes during postharvest
storage at 10 °C, Clarksville, AR (2017). Each standard error bar is constructed using 1 standard error from the mean.
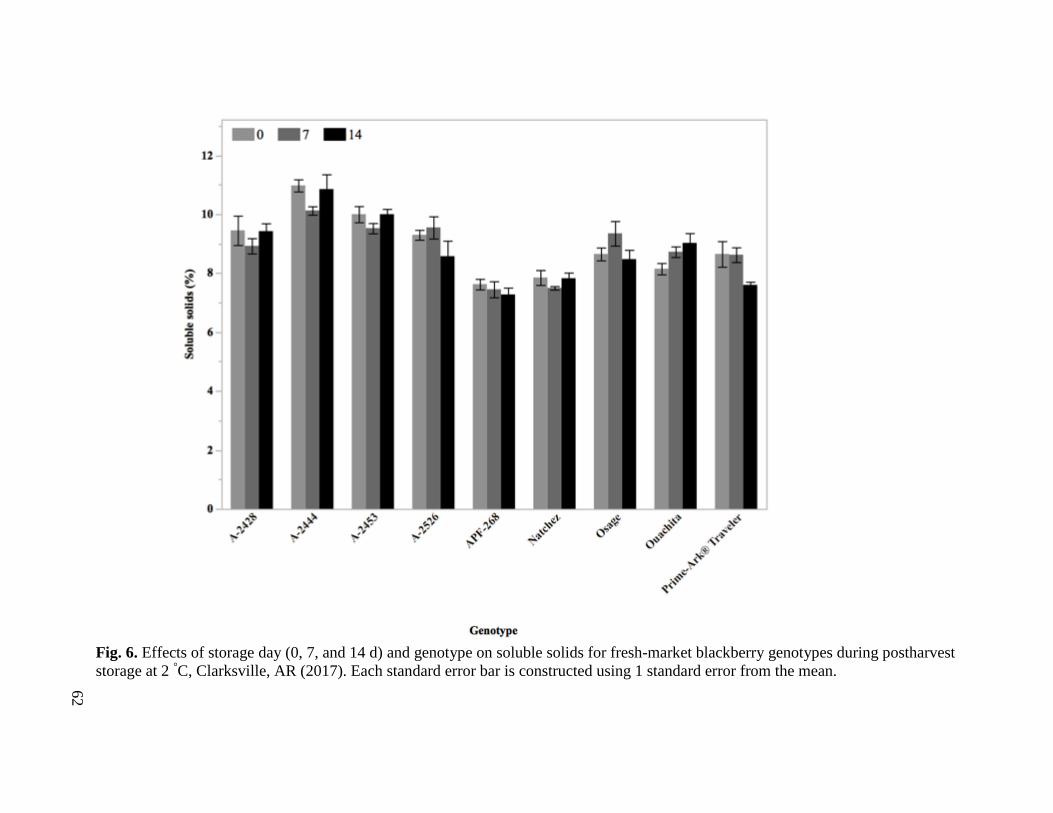
62
Fig. 6. Effects of storage day (0, 7, and 14 d) and genotype on soluble solids for fresh-market blackberry genotypes during postharvest
storage at 2 °C, Clarksville, AR (2017). Each standard error bar is constructed using 1 standard error from the mean.

63
Fig. 7. Effects of harvest time (7:00 AM and 12:00 PM), storage day (0, 7, and 14 d), and genotype on soluble solids for fresh-market
blackberry genotypes during postharvest storage at 10 °C, Clarksville, AR (2017). Each standard error bar is constructed using 1
standard error from the mean.

64
Fig. 8. Effects of storage day (0, 7, and 14 d) and genotype on pH for fresh-market blackberry genotypes during postharvest storage at
2 °C and 10 °C, Clarksville, AR (2017). Each standard error bar is constructed using 1 standard error from the mean.

65
Fig. 9. Effects of storage day (0, 7, and 14 d) and genotype on titratable acidity for fresh-market blackberry genotypes during
postharvest storage at 2 °C, Clarksville, AR (2017). Each standard error bar is constructed using 1 standard error from the mean.

66
Fig. 10. Effects of harvest time (7:00 AM and 12:00 PM) and storage day (0, 7, and 14 d) on titratable acidity for fresh-market
blackberry genotypes during postharvest storage at 2 °C, Clarksville, AR (2017). Each standard error bar is constructed using 1
standard error from the mean.

67
Fig. 11. Effects of storage day (0, 7, and 14 d) and genotype on weight loss for fresh-market blackberry genotypes during postharvest
storage at 2 °C and 10 °C, Clarksville, AR (2017). Each standard error bar is constructed using 1 standard error from the mean.
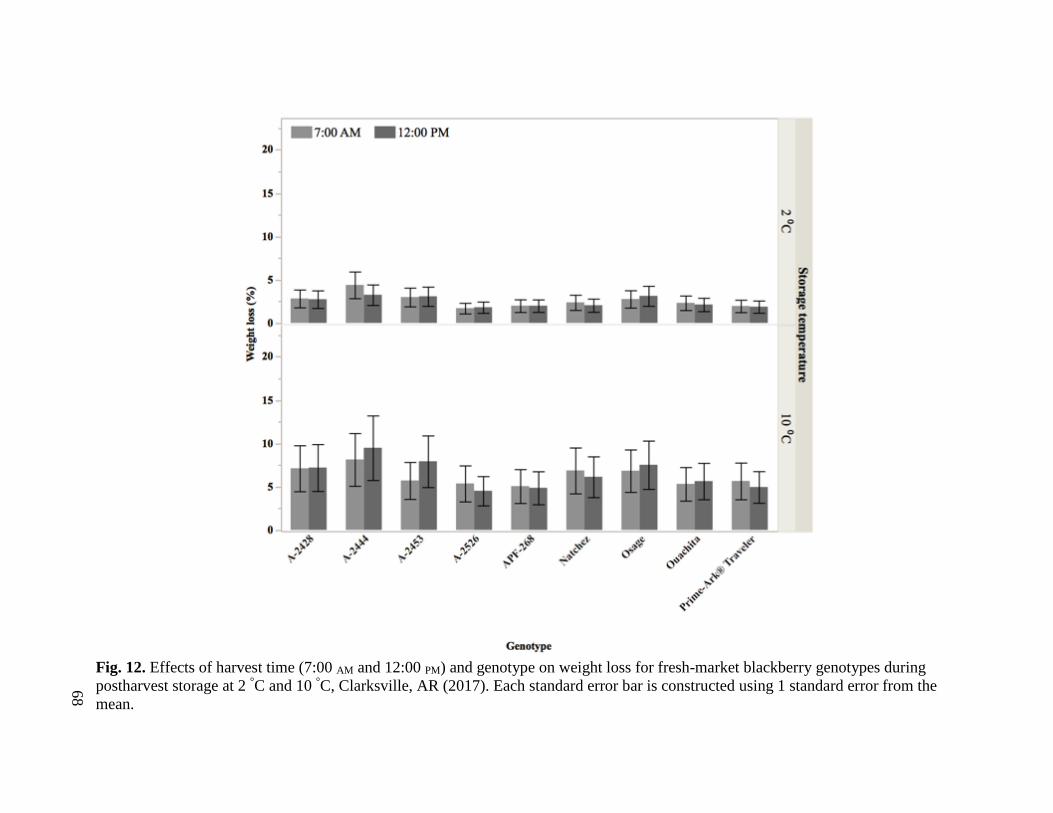
68
Fig. 12. Effects of harvest time (7:00 AM and 12:00 PM) and genotype on weight loss for fresh-market blackberry genotypes during
postharvest storage at 2 °C and 10 °C, Clarksville, AR (2017). Each standard error bar is constructed using 1 standard error from the
mean.

69
Fig. 13. Effects of storage day (0, 7, and 14 d) and genotype on leakage for fresh-market blackberry genotypes during postharvest
storage at 10 °C, Clarksville, AR (2017). Each standard error bar is constructed using 1 standard error from the mean.

70
Fig. 14. Effect of postharvest storage (0, 7, and 14 d), harvest time (7:00 AM and 12:00 PM) and blackberry genotype on red drupelet
reversion stored at 2 °C and 10 °C, Clarksville, AR (2017). Each standard error bar is constructed using 1 standard error from the
mean.
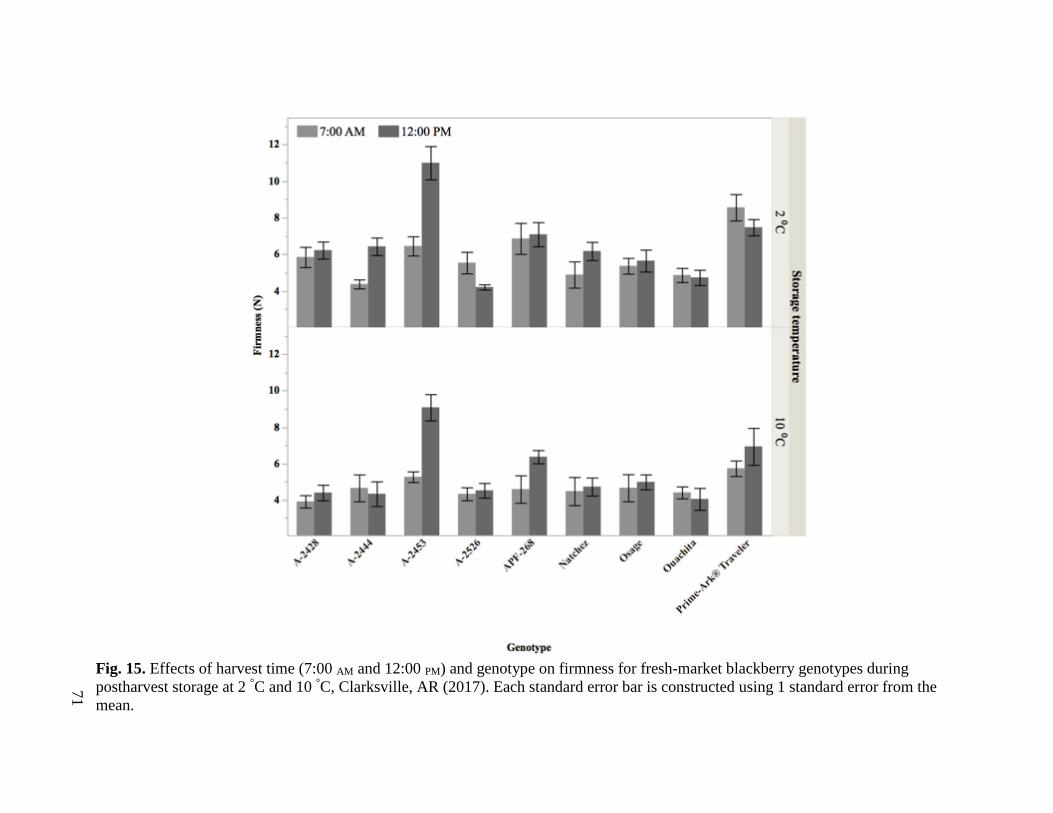
71
Fig. 15. Effects of harvest time (7:00 AM and 12:00 PM) and genotype on firmness for fresh-market blackberry genotypes during
postharvest storage at 2 °C and 10 °C, Clarksville, AR (2017). Each standard error bar is constructed using 1 standard error from the
mean.
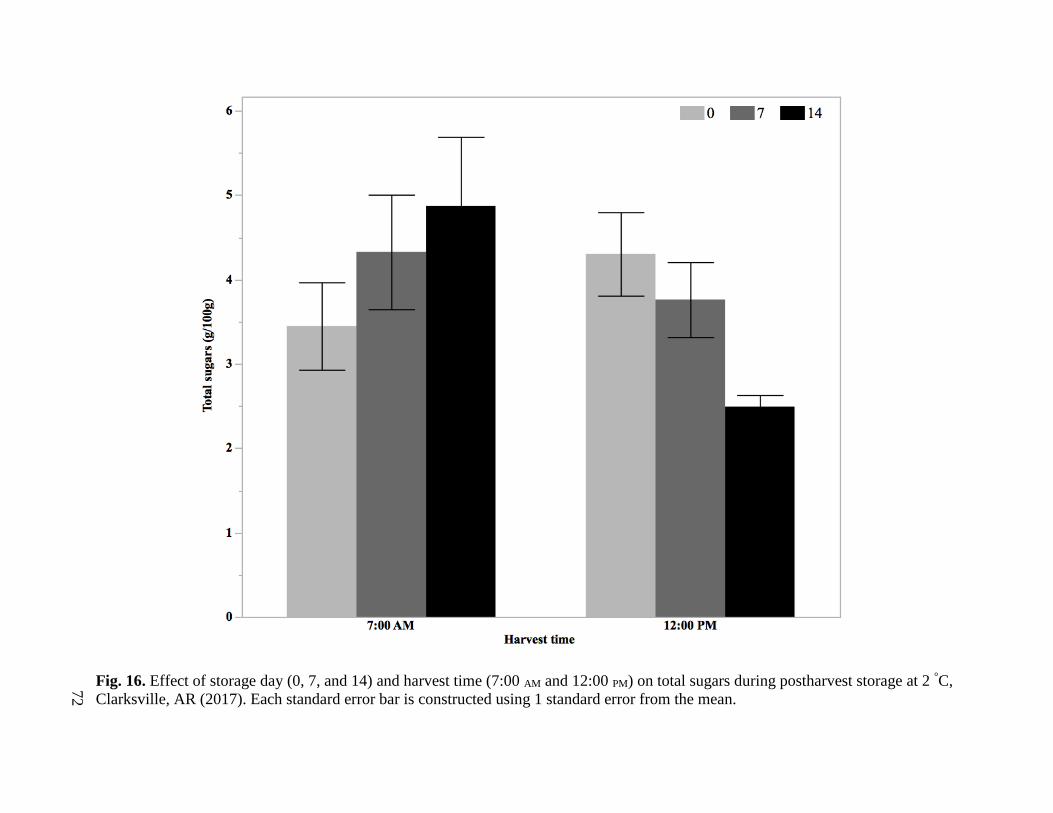
72
Fig. 16. Effect of storage day (0, 7, and 14) and harvest time (7:00 AM and 12:00 PM) on total sugars during postharvest storage at 2 °C,
Clarksville, AR (2017). Each standard error bar is constructed using 1 standard error from the mean.

73
Fig. 17. Marketability attributes of fresh-market blackberries harvested at 7:00 AM and 12:00 PM
after 14 d storage at 2 °C and 10 °C, Clarksville, AR (2017). Each standard error bar is
constructed using 1 standard error from the mean.
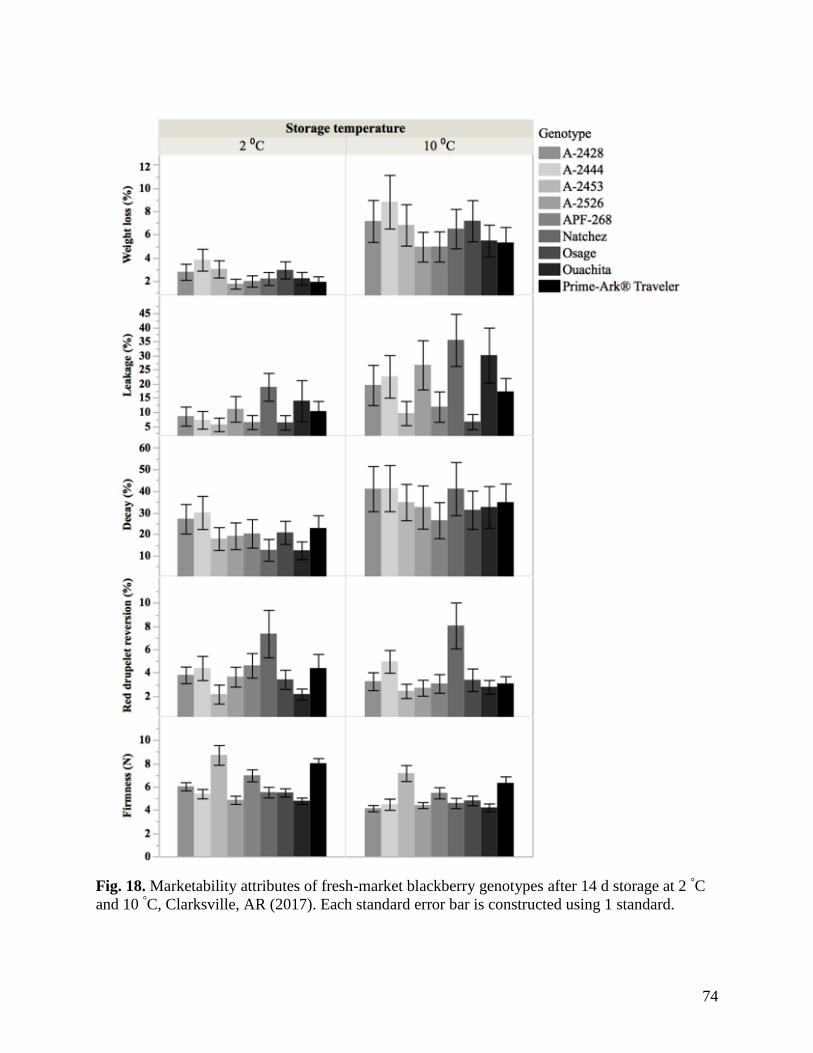
74
Fig. 18. Marketability attributes of fresh-market blackberry genotypes after 14 d storage at 2 °C
and 10 °C, Clarksville, AR (2017). Each standard error bar is constructed using 1 standard.
75
Chapter II
Physiochemical, Marketability, and Sensory Analysis of Arkansas-Grown Peaches and
Nectarines for Fresh Market
Abstract
Understanding how consumer perception is related to physiochemical attributes and how
storage affects fruit quality contribute to identification of harvest, ripeness, and marketability
parameters for peaches and nectarines [Prunus persica (L.) Batsch]. Six peach and nectarine
cultivars (‘Amoore Sweet’, ‘Bowden’, ‘Effie’, ‘Loring’, ‘Souvenirs’, and ‘White River’) and
three advanced breeding selections (A-827, A-850, and A-865) were harvested at optimum
ripeness from the University of Arkansas System Division of Agriculture Fruit Breeding
Program in Clarksville, AR. The physiochemical and sensory attributes of the genotypes were
evaluated at harvest (day 0), and physiochemical and marketability attributes were evaluated
during postharvest storage (day 0, 7, 14, and 21). The range of physiochemical attributes of the
genotypes at harvest were a fruit weight of 134.4-330.2 g, soluble solids of 7.5-14.7%, pH of
3.3-4.8, titratable acidity of 0.2-1.1%, and firmness of 7.8-35.8 N. Overall, A-865 had the lowest
pH (3.3) and the highest firmness (35.8 N), soluble solids (14.7%), and titratable acidity (1.1%).
A-850 had the lowest titratable acidity (0.2%), while ‘Loring’ had the lowest soluble solids
(7.5%). ‘White River’ had the largest fruit (330.20 g). A-850 (63.62) had the highest soluble
solids/titratable acidity ratio where ‘Bowden’ (12.07) had the lowest. A trained descriptive
sensory panel (n = 10) evaluated the fruit attributes for external appearance (n = 8), aroma (n =
4), internal appearance (n = 6), basic tastes (n = 3), aromatics (n = 5), feeling factors (n = 2), and
texture (n = 6). Of all of the physiochemical attributes, texture had the most significant
correlations with the descriptive sensory attributes. Additionally, significant correlations between
total anthocyanins with amount of blemishes/deformities (r = 0.70), and flesh hardness (r = -
76
0.84) were found, as well as correlations between total flavonols and astringent feeling factor (r
= 0.83). During storage, weight loss was positively correlated to soluble solids at 21 days storage
(r = 0.66). Chroma of the fruit flesh was negatively correlated with bruising/pitting (r = -0.59)
during storage. Overall, ‘Amoore Sweet’ performed well during storage for 21 days at 2 °C with
moderate weight loss, low decay, low bruising/pitting, and high firmness retention. The nine
peach and nectarine genotypes had good marketability and retention of compositional attributes
at 21 days storage indicating good potential storage for extended fresh-market sales.

77
Introduction
The peach (Prunus persica L. Batsch) is a juicy temperate tree fruit dated back to 8000
BP, with the oldest archaeological peach stones found in China (Zheng et al., 2014). Cultivation
of indigenous peach stones were first discovered in the Neolithic village of Hemudu (China) in
1973. The peach was regarded as a symbol for long life and a family’s prosperity and throughout
time was cultivated in China between 23-50N Latitude (Layne and Bassi, 2008; Zheng et al.,
2014). In the 18th century, peaches were introduced to the United States by Spanish missionaries
(Crisosto and Kader, 2000). They are typically grown in hardiness zones 5-8 (USDA, 2018).
Peaches and nectarines are almost identical genetically, however, nectarines lack
pubescence, or a fuzzy exterior, common in peaches due to variation at a single genetic locus
(Layne and Bassi, 2008). Peaches and nectarines are both climacteric fruit, as they continue to
ripen after harvest. Peaches and nectarines can have different flesh types, or mesocarp, such as
melting, slow melting, and non-melting. Melting flesh is a dominant trait in peaches and
nectarines caused by softening of the fruit during the last stage of ripening. This softening is
related to the presence of endopolyglacturonase, an enzyme responsible for cleaving the pectins
from the cell wall. Non-melting flesh peaches lack the presence of this enzyme, resulting in
firmer, rubbery flesh during ripening (Karakurt et al., 2000; Tanou et al., 2017). Recent findings
have also indicated the presence of a third flesh type. Slow-melting fruit resemble a non-melting
flesh fruit at ripening with similar firmness and crispness, but during full ripening, the fruit melts
at slow speed and shows expression for the presence of endopolyglacturonase, which is present
in melting-flesh peaches (Ghiani et al., 2011).
In addition to flesh types, the peach can be defined by how the flesh is attached to the pit
or endocarp. Categorized as either freestone or clingstone, the trait is identified by either a
78
dominant or recessive freestone locus (Gu et al., 2016). With varying degrees of intensity,
cultivars can also be defined as semi-clingstone or semi-freestone, a trait particularly found in
earlier-ripening cultivars (Layne and Bassi, 2008). Finally, physical attributes of the fruit differ
such as the base color of the flesh, or mesocarp, the acidity of the flesh, and the shape. The most
common flesh colors are white and yellow, and the exterior of the fruit can have a blush (red
hue) which sometimes continues into the flesh close to the pit or skin. The most common peach
shape in the United States is round (or oblong shaped) although flat-shaped peaches are also
found.
California is the largest U.S. producer of peaches and nectarines, with nearly 508,023
metric tons produced (Arkansas Fruit Production Report, 2015). In 2003, Arkansas was ranked
13th in peach production with most production aimed at the fresh market (Johnson et al., 2003).
Most recent statistics indicate that peach production in Arkansas was about 820 metric tons in
2014 (Arkansas Fruit Production Report, 2015). Peach production in Arkansas has historic
significance and began after the Civil War as a means to diversify crop production. Commercial
plantings of processing peaches began in the late 19th century due to the invention of the
refrigerated railway transport (Zeller et al., 2005). When the University of Arkansas Peach
Breeding Program (Fruit Research Station, Clarksville, AR) began in the mid-1960s, the initial
focus was on the development of canning clingstone peaches to accommodate the needs of the
baby food industry (J.R. Clark, Personal Communication). Eventually, the breeding program
shifted focus in the 1990s towards fresh-market fruit enhancement due to a decline in the need
for processing peaches in Arkansas (Sandefur, 2011). Since the start of the breeding program, 12
new peach and six new nectarine cultivars have been released. Selections criteria includes firm
fruit with different flavors, levels of acidity, sweetness, as well as tree characteristics such as
79
time of ripening, disease resistance, and productivity. The program currently has many advanced
peach and nectarine selections with melting and non-melting flesh, as well as white and yellow
color, varying levels of blush, ranges of ripening dates, size, and both round and flat shapes.
Postharvest research on peach and nectarine genotypes (cultivars and advanced
selections) specific to Arkansas is important in understanding the quality of locally available
produce, as well as aiding in further fruit breeding efforts at the University of Arkansas. Factors
such as climatic conditions, maturity at harvest, cultural practices, and postharvest handling
procedures can influence the overall composition and quality of the fruit. A combination of pre-
harvest environmental factors and genetic factors can strengthen postharvest quality (Kader,
2002). Attributes such as appearance, texture, and flavor are extremely important during
postharvest storage so that the fruit has good quality when it reaches the consumer.
A wide variety of fruits can provide a balanced diet by aiding in the consumption of
various nutrients, antioxidants, phenolics or bioactive compounds, and phytochemicals. Peaches
have many health-promoting compounds (Liu, 2013; Andreotti et al., 2008). Phenolic
compounds such as chlorogenic acid, cyanidin-3-glucoside, and rutin, commonly found in
peaches and nectarines, were negatively correlated with the development of chronic diseases.
Therefore, quantification of the phenolic compounds is important for understanding the overall
quality of the fruit.
Finally, to gain a comprehensive understanding of fruit quality, utilization of sensory
methods, such as descriptive sensory analysis, is important for complete comprehension of how
physiochemical attributes, such as texture, are perceived when evaluated by a human subject
(Colaric et al., 2005; Contador et al., 2017). Previous studies indicated attributes such as
appearance, aroma, flavor, sweetness, sourness, and texture were common indicators of

80
consumer acceptability of peaches (Belisle et al., 2017). Descriptive sensory analysis provides a
means of quantitatively scaling attributes of food; whereas, consumer sensory analysis
demonstrates a degree of liking or preference from consumers. Descriptive sensory analysis was
effective for identification of texture differences in both melting and non-melting flesh peaches,
as well as for soluble solids/titratable acidity ratios (Brovelli et al., 1999; Crisosto and Crisosto,
2005).
Understanding the physiochemical and sensory attributes of Arkansas-grown peach and
nectarine genotypes is important to demonstrate fresh-market potential. The purpose of this study
was to evaluate how descriptive sensory attributes were related to harvest parameters (size,
composition, and firmness) of commercially-ripe fruit and how the physiochemical and
marketability attributes of Arkansas-grown peaches and nectarines were affected during
postharvest storage.

81
Materials and Methods
Plants and culture
Nine peach and nectarine genotypes (‘Amoore Sweet’, ‘Bowden’, ‘Loring’, ‘Souvenirs’,
‘White River’, A-805CN, A-827, A-850, and A-865) were evaluated. The fruit was harvested
from the University of Arkansas Fruit Research Station, Clarksville AR [west-central Arkansas,
lat. 35◦31'58"N and long. 93◦24'12"W; USDA hardiness zone 7a; soil type Linker fine sandy
loam (Typic Hapludult)]. The trees were either open-center trained and spaced 5.5 m between
trees and rows, or trained to a perpendicular-V system with trees spaced 1.9 m in rows spaced
5.5 m apart. All trees were dormant pruned and fertilized annually with either complete or
nitrogen fertilizers and drip irrigated as needed. Pests were managed using a program typical for
commercial orchards in this area. Fruit were thinned to a distance of 12 to 15 cm between fruit
after shuck split but before pit hardening.
Harvest
The peaches and nectarines were hand harvested in the morning (between 7:00-10:00 AM).
The fruit was harvested on two harvest dates (27 June and 11 July, 2017) at optimal ripeness and
were free of major blemishes, flaws, or damage. ‘Amoore Sweet’, ‘Effie’, Souvenirs’, and A-865
were harvested on 27 June, and ‘Loring’, ‘White River’, A-827, and A-850 were harvested on 11
July. There were no rain events within 24 h of either harvest. About 96 peaches and nectarines
were harvested for each genotype and placed onto five boxes that contained corrugated pulp
trays with individual wells for each fruit. The boxes of fruit were transported in an air-
conditioned vehicle to the University of Arkansas, Department of Food Science, in Fayetteville,
AR. The fruit was randomly placed into new pulp trays. The fruit was evaluated for descriptive

82
sensory attributes after harvest (day 0) and physiochemical and marketability attributes at day 0,
7, 14, and 21 at 2C with 85-89% relative humidity.
Physiochemical analysis.
Fruit for physiochemical analysis was done in triplicate per genotype. Each replicate was
an individual peach or nectarine. The physiochemical analysis included weight, color, firmness,
and composition evaluated at 0, 7, 14, and 21 d at 2 C, and nutraceutical analysis evaluated at
day 0. After individual weight, color, and firmness, were evaluated, the fruit were cut in half and
frozen at -10 C for composition and nutraceuticals analysis. Half of each fruit was used for
composition, and the other half was used for nutraceutical analysis.
Weight. Fruit and pit weight was measured on a digital scale (PA224 Analytic Balance,
Ohaus Corporation, Parsippany, NJ) in triplicate. Fruit weight was the weight of a whole intact
peach or nectarine. Pit weight was only evaluated at harvest (day 0) from the pit extracted from
the fruit.
Color. The color of the fruit skin and flesh was analyzed using a Konica Minolta CR-400
Chroma Meter (Konica Minolta Inc, Ramsey, NJ). The L*, chroma, and hue angle were
evaluated. Color analysis was done to determine Commission Internationale de l’Eclairage (CIE)
Lab transmission values of L*=100, a*=0, and b*=0 (C.I.E. 1986). The CIELAB system
describes color variations as perceived by the human eye. CIELAB is a uniform three-
dimensional space defined by colorimetric coordinates, L*, a*, and b*. The vertical axis L*
measures lightness from completely opaque (0) to completely transparent (100), while on the
hue-circle, +a* red, -a* green, +b* yellow, and -b* blue were measured. Hue angle, calculated as
arctan (b*/a*), described color in angles from 0 to 360° (0° is red, 90° is yellow, 180° is green,
270° is blue, and 360° is red). Chroma, calculated as ((a*)2 + (b*)2)0.5, identified color by which

83
a sample appears to differ from gray of the same lightness and corresponds to intensity of the
perceived color. Skin color was evaluated on three locations (90°, 180°, and 270° to the right of
the suture). Immediately after cutting the fruit in half, the flesh was analyzed for color similarly
in three locations.
Firmness. Firmness was measured using a Stable Micro Systems TA.XT.plus Texture
Analyzer (Texture Technologies Corporation, Hamilton, MA). Prior to the firmness
measurement, a section of the fruit skin was removed by slicing off a 5 mm section. The fruit
was then placed on a flat surface. Using the 2-mm-diameter probe, at a rate of 2 mm/s with a
trigger force of 0.02 N, firmness of the fruit flesh was evaluated at three locations per fruit (90°,
180°, and 270° to the right of the suture). Force to penetrate the fruit was measured in Newtons
(N).
Composition. The fruit half for composition was frozen (-10 °C) then thawed for analysis
of soluble solids, pH, titratable acidity, organic acids, and sugars. Each fruit half (skin and flesh)
was macerated in a blender, then the juice was centrifuged at 5,000 rpm for 8 min and strained
through cheese cloth. The pH and titratable acidity were measured using the Titrino plus 862
compact titrosampler (Metrohm AG, Herisan, Switzerland) with the electrode standardized to pH
4.00, 7.00, and 10.00 buffers. Titratable acidity was determined using ~6 g of juice diluted with
50 mL deionized, degassed water with a titration using 0.1 N sodium hydroxide to an endpoint of
pH 8.2. Titratable acidity was expressed as percentage of malic acid. Soluble solids (expressed as
percent) were measured using an Abbe Mark II refractometer (Bausch and Lomb, Scientific
Instrument, Keene, NH). Organic acids and sugars of the fruit were determined using high
performance liquid chromatography (HPLC). The remaining juice from compositional analysis
was filtered through a 0.45 μm nylon filter (VWR International, Radnor, PA) and analyzed using

84
HPLC. Glucose, fructose, isocitric acid, and malic acid of the fruit was measured using
previously established HPLC procedures (Segantini et al., 2018; Walker et al., 2003). The HPLC
was equipped with a Bio-Rad HPLC Organic Acid Analysis Aminex HPX-87H ion exclusion
column (300 × 7.8 mm), Bio-Rad HPLC Fast Acid Analysis column (100 x 7.8 mm), and a Bio-
Rad HPLC column for fermentation monitoring (150 × 7.8 mm) in series (Bio-Rad, Hercules,
CA). A Bio-Rad Micro-Guard Cation-H refill cartridge (30 × 4.5 mm) was used for a guard
column. Columns were maintained at 65 °C by a temperature control unit. Mobile phase
consisted of a pH 2.28 solution of sulfuric acid and water with a resistivity of 18 M obtained
from a Millipore Milli-Q reagent water system. The sulfuric acid solution was used as the solvent
with 0.45 mL/min flow rate. The solvent delivery system was a Waters 515 HPLC pump
equipped with a Waters 717 plus autosampler (Waters Corporation, Milford, MA). Injection
volumes were 10 μL for all samples, and run time for completion was 35 min. A Waters 410
differential refractometer to measure refractive index connected in series with a Waters 996
photodiode array detector monitored the eluting compounds. Isocitric and malic acids were
detected by photodiode array at 210 nm and glucose and fructose were detected by the
differential refractometer. The peaks were quantified using external standard calibration based on
peak height estimation with baseline integration. Individual sugars and acids were expressed as
g/100 g, and total sugars (glucose + fructose) and total organic acids (isocitric + malic) were
expressed as g/100 g.
Nutraceuticals. Total anthocyanins, total phenolic acids (hydroxycinnamic acids), total
carotenoids, and total flavonols were measured by HPLC and ultraviolet-visible (UV-Vis)
spectroscopy following methods described by Cho et al. (2004; 2005), and Hager et al. (2008).
The fruit was homogenized three times for 1 min in alternating washes of 80 ml of extraction
85
solution containing methanol/water/formic acid (60:37:3 v/v/v) and acetone/water/acetic
(70:29.5:0.5 v/v/v) to the smallest particle size using a Euro Turrax T18 Tissuemizer.
Homogenates were centrifuged for 5 min at 10,000 rpm and filtered. The samples were taken to a
final volume of 250 mL with extraction solvent and stored at -70 C until analysis. All samples
were passed through 0.45 μm filters prior to HPLC analysis. Equivalents for the peach and
nectarine nutraceuticals were determined from previous literature for the most common
compounds for each class of phenolics (Brown et al., 2014; Ceccarelli et al., 2016; Gil et al.,
2002). Total nutraceuticals were quantified as the sum (mg) of total anthocyanins, total
flavonols, total phenolic acids, and total carotenoids per 100 g fresh fruit weight.
Total anthocyanins and total phenolic acids. Sample extracts (7.5 mL) were dried using a
Speed Vac concentrator (ThermoSavant, Holbrook, NY) and re-suspended in 1 mL of 5% formic
acid. The reconstituted samples were passed through 0.45-mm polytetrafluoroethylene (PTFE)
syringe filters (Varian Inc, Palo Alto, CA) before HPLC analysis. The anthocyanin analysis by
HPLC was performed based on previous methods (Cho et al., 2004; Hager et al., 2008). The
anthocyanin peaks were quantified at 510 nm with results expressed as milligrams cyanidin-3-
glucoside equivalents per 100 g fresh fruit weight. The phenolic acid peaks were quantified at
320 nm with results expressed as milligrams of chlorogenic acid equivalents per 100 g of fresh
fruit weight.
Total carotenoids. Methods adapted from Biehler et al. (2010) and Gross (1991) were
used for saponification and quantification of carotenoids. Sample extracts (50 mL) were
saponified to reduce chlorophyll interference in samples. Samples were heated at 60 C for 1 hr
with 1 g of butylated hydroxytoluene (BHT) and 30 mL of 5% sodium hydroxide in methanol.
The sample was extracted three times using water, ethanol, and hexane solvent. The hexane
86
fraction was evaporated using a rotary evaporator (Buchi, New Castle, DE) to dryness and
brought up to a known volume with acetone. The reconstituted extract was sonicated for 2 min.
Total carotenoids were quantified using a 8452A Diode Array Spectrophotometer (Hewlett
Packard, Palo Alto, CA) at 452 nm using an extinction coefficient of 140663 L/mol with results
expressed as micrograms beta-carotene equivalents per 100 g fresh fruit weight.
Total flavonols. Sample extracts (3 mL) for flavonols were dried using a Speed Vac
concentrator and resuspended in 1.0 mL of 50% methanol. The reconstituted samples were
passed through AU2 0.45-mm PTFE syringe filters before HPLC analysis. The flavonols were
analyzed according to previous methods (Hager et al., 2008, 2010). The flavonols were
quantified at 360 nm with results expressed as milligrams of rutin equivalents per 100 g of fresh
fruit weight.
Marketability analysis
Fruit for marketability analysis was done in triplicate per genotype with three peaches
and nectarines per replicate evaluated each week (0, 7, 14, and 21 d) at 2 C. The marketability
attributes of the fruit included decay, bruising/pitting, and weight loss.
Decay and bruising/pitting. The decay (visible mold or rot) and bruising/pitting of the
fruit were calculated as (number of decayed or bruised/16)×100 and expressed as percent.
Weight loss. The weight loss of the fruit was calculated as the weight decrease of three
fruits expressed as percent.
Descriptive sensory evaluation
Descriptive sensory analysis was performed at the Sensory and Consumer Research
Center at the University of Arkansas, Fayetteville AR. After harvest, the fruit was stored
overnight at 2 C for sensory. The fruit was removed from cold storage, gently rinsed, placed on
87
pulp trays, and allowed to air-dry. Each panelist evaluated two fruit for each genotype in
duplicate. The fruit was served monadically (one at a time) at room temperature (25 °C) on
plates labeled with three-digit codes in a randomized complete block design. Panelists were
instructed to cleanse their palates with unsalted crackers and water between samples.
Expectorant cups were also provided. The panelists were trained to use a modified Sensory
Spectrum method, an objective method for describing the intensity of attributes in products using
references for the attributes. The ten descriptive panelists developed a lexicon of sensory terms
for the peaches and nectarines through consensus during orientation and practice sessions (Table
1). Serving order was randomized across each replication to prevent presentation order bias. The
descriptive panel evaluated the fruit attributes for external appearance (n = 8), aroma (n = 4),
internal appearance (n = 6), basic tastes (n = 3), aromatics (n = 5), feeling factors (n = 2), and
texture (n = 6). The attributes were evaluated using a 15-point scale where 0 = less of an attribute
and 15 = more of an attribute.
Design and statistical analysis
After harvest, the fruit from each of the nine genotypes was completely randomized. The
fruit was stored at 2 °C for 0, 7, 14, and 21 d. Statistical analyses were conducted using JMP®
(version 13.2.0; SAS Institute, Cary, NC). A univariate analysis of variance (ANOVA) was used
to determine the significance of main factors (genotype and storage) and interactions. Tukey’s
Honestly Significant Difference (HSD) test was used to detect significant differences (p < 0.05)
among means and verify interactions at 95% significance level. Least significant difference
(LSD) test was used to detect significant differences (p < 0.05) among means for sensory data.
Pairwise correlations using multivariate analysis were used to verify the relationship
between/within attributes at a p-value of 0.05 at harvest and at 21 d of storage. Physiochemical

88
and marketability attributes were evaluated in triplicate and sensory attributes were evaluated in
duplicate.
Results and Discussion
At harvest, the peaches and nectarines were within a commercially acceptable range for
fruit weight (114.92-409.98 g), soluble solids (7.00%-17.30%), pH (3.23-5.00), titratable acidity
(0.14%-1.20%), and firmness (3.03-55.40 N) (data not shown). The genotypes evaluated had
various flesh types, flesh colors, and acidity levels (Table 2). The fruit was evaluated for
physiochemical and descriptive sensory attributes at harvest and physiochemical and
marketability attributes during postharvest storage.
Physiochemical attributes at harvest
The nine peach and nectarine genotypes were evaluated for physiochemical attributes
(weight, color, firmness, composition, and nutraceuticals). Initial physiochemical analysis was
significant for all attributes except firmness and skin hue for the genotypes evaluated (Tables 3
and 4). Fruit weight and pit weight were also evaluated. ‘White River’ (330.20 g) was the largest
fruit, and A-865 (134.40 g) was the smallest. ‘White River’ was larger than previously reported,
with a 10-14 year fruit weight of 201 g (Clark and Moore, 2003). A study by Rahmati et al.
(2015) indicated that when drought stress is high, fruit weight is negatively affected. 2017 was
an exceptionally wet year in Arkansas with 455 mm of rain from April-June, which could have
contributed to the increased fruit weight. ‘White River’ (11.06 g) also had the largest pit, and
‘Amoore Sweet’ (4.62 g) had the smallest.
The composition attributes measured included soluble solids, pH, titratable acidity,
organic acids, sugars, and nutraceuticals. A-865 (14.70%) had the highest soluble solids, and
‘Loring’ (7.50%) had the lowest. A-850 (4.79) had the highest pH, and A-865 (3.30) had the

89
lowest. Titratable acidity ranged from 0.16%-1.07% at harvest. Titratable acidity had an inverse
relationship to pH, where A-850 (0.16%) had the lowest titratable acidity, and A-865 (1.07%)
had the highest. Crisosto (1994) established stone fruit maturity indices as a way to define the
stage of development of the fruit to give a minimum acceptable quality to the consumer,
concluding that of the three composition attributes (soluble solids, pH, and titratable acidity),
soluble solids was a good indicator of maturity. Crisosto and Crisosto (2005) found that
consumer acceptability increased with an increase in soluble solids and preferred soluble solids
of high-acid cultivars ranged from 10-12%, and low-acid cultivars ranged from 15-16%. Above
those ranges consumer acceptability plateaued. Another key finding of that study was that
consumer acceptance was greatly influenced by the balance of soluble solids/titratable acidity
ratio, rather than either attribute alone. However, great differences in consumer acceptance were
found for the different acid types indicating no single value will describe the optimum. Of the
soluble solids/titratable acidity ratio of nine genotypes in this study, A-850 (63.62) had the
highest soluble solids/titratable acidity ratio, while ‘Bowden’ (12.07) had the lowest (Fig. 1).
The color of the skin and flesh of the fruit were evaluated. For skin L* value, ‘White
River’ (65.52) had the highest value, and ‘Souvenirs’ (38.38) had the lowest. ‘Amoore Sweet’
(52.23) had the highest skin chroma value, and A-865 (31.73) had the lowest. McGuire (1992)
stated that hue angle can be useful in identification of ripeness as fruit ripen from green to either
yellow or shades of red. There was no difference among genotypes for skin hue. Flesh L* value
and hue ranged from 55.57-73.02 and 56.52-99.89, respectively at harvest. For both attributes,
A-850 had the highest value, and ‘Souvenirs’ had the lowest. A hue angle from 45-90 is orange
to yellow and 90-180 is yellow to green. The flesh hue angle ranged from 57-100, and the skin
hue ranged from 31-58 indicating an orange-yellow color. Commonly, hue angle can be used
90
for identification of ground color as a determination of ripeness (Shinya et al., 2013). A-850, A-
865, ‘Bowden’, ‘Effie’, and ‘White River’ were white-flesh, and A-827, ‘Amoore Sweet’,
‘Loring’, and ‘Souvenirs’ yellow-flesh (Table 2). A-827 (48.63) had the highest flesh chroma
value, and ‘White River’ (19.47) had the lowest. Bible and Singha (1993) indicated fruit from the
upper canopy could have higher chroma values and increasing redness, a lower hue angle than
fruit found in the lower canopy. As the fruit in this study was randomly taken from all locations
on the tree, variations in chroma and hue due to fruit location within a genotype are possible.
The total sugars (glucose and fructose) and total organic acids (isocitric and malic acid)
were evaluated. The sugars and organic acids were significantly different for the genotypes in
this study. A-865 (10.36 g/100 g) had the highest total sugars, and ‘Souvenirs’ (1.71 g/100 g) the
least. ‘Bowden’ had the highest total organic acids (0.80 g/100 g) and ‘Souvenirs’ (0.11 g/100 g)
the lowest. The primary sugars and acids varied by genotype. Glucose and fructose ranged from
0.57-5.57 g/100 g and 1.08-4.80 g/100 g, respectively at harvest (Fig. 2). A-865 had the highest
glucose and fructose, ‘Souvenirs’ had the lowest glucose, and ‘Amoore Sweet’ had the lowest
fructose. In a study by Chinnici et al. (2005), the glucose and fructose concentrations in
commercial peach juice was 3.65-4.26 g/100 g and 3.43-7.54 g/100 g, respectively. Similarly,
they found citric and malic acid concentrations ranging from 0.10-0.19 g/100 g and 0.15-0.56
g/100 g, respectively. At harvest, the isocitric and malic acid contents of the nine genotypes in
this study ranged from 0.06-0.59 g/100 g and 0.03-0.66 g/100 g, respectively (Fig. 3). These
values were similar to those found by Chinnici et al. (2005). The predominant acid varied by
genotype, where A-827, ‘Bowden’, and ‘Souvenirs’ had predominantly isocitric acid, A-850, A-
865, and ‘White River’ were predominantly malic acid, and ‘Effie’ and ‘Loring’ had roughly
equal amounts of both acids. ‘Bowden’ had the highest isocitric acid content, and ‘Amoore
91
Sweet’ had the lowest. A-865 had the highest malic acid content, and ‘Souvenirs’ had the lowest.
In a study by Wang et al., (1993), the malic and citric acid content varied between cultivars
which was similar to the results seen in this study.
Total nutraceuticals (sum of total anthocyanin, total phenolic acids, total flavonols, and
total carotenoids) ranged from 7.01 mg/100 g (‘Loring’) to 29.99 mg/100 g (A-865) and were
significantly different between genotypes. The individual nutraceuticals of the peaches and
nectarines are shown on Fig. 4. Total anthocyanin ranged from 0.31-7.13 mg/100 g. ‘Souvenirs’
had the highest total anthocyanin content, and A-850 had the lowest. Genotypes with a high
degree of blush, or red color, on the exterior of the fruit, had higher total anthocyanins. For
example, ‘Souvenirs’, which had the highest total anthocyanin content, had reported 90% blush,
whereas ‘Loring’ had 71% (Clark and Sandefur, 2013). A-865 (27.38 mg/100 g) had the highest
total phenolic acid content, and ‘Souvenirs’ (1.58 mg/100 g) had the lowest. Total flavonols
ranged from 0.64-2.88 mg/100 g at harvest, and total carotenoids ranged from 84.05-555.98
g/100 g, but the genotypes were not significantly different for either nutraceutical. Total
carotenoid content was slightly higher (7-260 g/100 g) than found by Gil et al. (2002), with
significant variation among cultivars, but different genotypes were used in this study.
Sensory attributes at harvest
Descriptive sensory attributes were evaluated on the nine peaches and nectarines at
harvest. Sensory analysis has been shown to explain cultivar characteristics, such as texture,
better than instrumental measurements alone (Delgado et al., 2013). During orientation and
training, the 10 trained panelists created a lexicon using Arkansas-grown peaches and nectarines
(Table 1). The panelists then evaluated each of the nine genotypes in duplicate using a 15-point
scale where 1 is less of an attribute and 15 is more of an attribute. The panelists evaluated the
92
fruit for seven categories of attributes (aroma, exterior appearance, interior appearance,
aromatics, basic tastes, feeling factors, and texture). Within each category multiple attributes
were evaluated.
The panelists evaluated aroma (fruity/peach, earthy/dirty, green/unripe, and
mold/mildew) of the whole, intact fruit (Table 5). All of the aroma attributes were less than 5 on
the 15-point scale indicating low-mid aroma intensity. Of the attributes, the panelists detected
differences between genotypes in fruity/peach, earthy/dirty, and green/unripe, but not
mold/mildew which were low (≤ 1). ‘Effie’ had the highest fruity/peach and green/unripe
aromas and the lowest earthy/dirty aroma. A-827 had the lowest fruity/peach aroma, ‘White
River’ had the highest earthy/dirty aroma, and ‘Souvenirs’ had the lowest green/unripe aroma. In
a study by Jordan et al. (1989), a relationship was found between aroma and flavor, however,
they concluded that the relationship was not strong enough to influence a consumer to purchase
the fruit. Additionally, they found that aroma intensified during later stages of senescence.
Therefore, since the fruit in this study were evaluated at harvest, the aroma scores may be lower
than the consumer would experience in a commercial setting as the fruit is stored prior to sale.
The panelists then evaluated the appearance (uniformity of color, color-yellowness,
color-redness, size, shape, amount of bruises, amount of blemishes/deformities, and fuzziness) of
the exterior or skin of the whole, intact fruit (Table 6). Of the eight attributes, the panelists
detected differences among the genotypes for all attributes except amount of bruises which was
low (≤ 1.6). Uniformity of color was evaluated using ratio of color uniformity where 0% was
rated 0 and 100% was scored 15. Uniformity of color ranged from 7.3-9.9 where ‘Souvenirs’ had
the highest uniformity, and A-865 had the lowest. This indicated that A-865 had a fairly equal
distribution of yellow and red, whereas ‘Souvenirs’ had more of one color. Yellowness was
93
evaluated using a ratio of yellow where 0% yellow was scored 0 and 100% yellow was scored
15. Yellowness of the fruit did not describe intensity of yellow, but rather the ground color
(whitish yellow-very yellow depending on genotype). Yellowness ranged from 3.4-6.8 where
‘Amoore Sweet’ was the most yellow, and ‘Souvenirs’ was the least yellow. Similar to
yellowness, redness was evaluated using a ratio of red where 0% red was scored 0 and 100% red
was scored 15. Redness ranged from 6.3-10.0 where ‘Souvenirs’ was the most red, and ‘Amoore
Sweet’ was the least red. Using ‘Souvenirs’ as an example, the high degree of uniformity
indicated the skin of the fruit was predominantly one color. Results from the degree of
yellowness indicated little yellow, or ground color and the degree of redness indicated a high
degree of red, or blush. Size was evaluated using spheres of various diameters as references. A
2.5-in (6.4 cm) sphere was scored an 8, whereas a 3-in (7.6 cm) sphere was scored a 13. Size
ranged from 8.9-13.5, where ‘White River’ was the largest, and A-865 was the smallest. Shape
was evaluated as the degree of roundness of the fruit using the 2.5-in sphere to indicate a score of
15, and an egg to indicate a score of 5. Shape ranged from 9.4-11.7 where ‘White River’ was the
roundest, and ‘Amoore Sweet’ was the least round. Shape has been linked to inadequate chilling
or prolonged dormancy which could lead to a more oblong shape (Wert et al., 2007). However,
elongation or a more oval shape, varied between cultivars (Quilot et al., 2007). Amount of
blemishes/deformities were evaluated as the visual ratio of blemishes on the fruit where 0%
would be a score of 0 and 100% a score of 15. Blemishes/deformities ranged from 1.8-4.1, where
‘Effie’ had the most, and ‘Loring’ had the least. Fuzziness was evaluated as the amount of fuzz
or pubescence on the fruit. Fuzziness ranged from 0.0-8.0, with most nectarines scored 0.
Fuzziness of the peaches was indistinguishable between A-827, A-850, ‘Loring’, and ‘White
River’, however, ‘Souvenirs’ was less fuzzy than the other peaches.
94
After evaluating the exterior of the fruit, the panelists were instructed to cut the
peach/nectarine in half, then slice the half without the pit into four slices (1/8 of the whole). The
panelists then evaluated the interior appearance (uniformity of color, color-yellowness, color-
redness, amount of bruises, separation of pit, and pit size) of the fruit (Table 7). The panelists
used the same scoring for uniformity of color, color-yellowness, color-redness, and amount of
bruises as used previously for the exterior appearance. Of the six interior appearance attributes,
the panelists detected differences among the genotypes for all attributes. Uniformity of color
ranged from 8.5-13.3 where ‘Bowden’ had the highest uniformity of color, and ‘White River’
had the least. Yellowness ranged from 7.9-13.5, and redness ranged from 0.9-5.9, where
‘Amoore Sweet’ had the highest yellowness, ‘White River’ had the least yellowness and most
redness, and ‘Bowden’ had the least redness. Amount of bruises ranged from 0.4-2.5 where
‘Loring’ had the most bruises and ‘Amoore Sweet’ the least, although the amount of bruises
were low. Separation from pit was evaluated as the degree of separation of the pit from the flesh
where a score of 0 would be easy, and a score of 15 was completely clingy. Separation from pit
ranged from 6.9-13.9, where ‘Amoore Sweet’, a clingstone nectarine, scored highest, and A-850,
a freestone peach, scored lowest. Pit size was evaluated using a photo reference of pit size (Fig.
5). Pit size ranged from 7.3-11.0 where ‘White River’ had the largest pit, and ‘Souvenirs’ had the
smallest.
Three basic tastes (sweet, sour, and bitter) of the fruit were evaluated. The references for
sweet, sour, and bitter were solutions of sucrose in spring water, solutions of citric acid in spring
water, and solutions of caffeine in spring water, respectively (Table 8). Of the three basic tastes,
sourness was the only attribute that differed among the genotypes. Sourness ranged from 1.6-4.6,
where ‘Bowden’ was the most sour, and A-850 was the least sour (with a 0.05% solution of citric
95
acid = 2 and 0.08% solution = 5). Sweetness ranged from 3.5-4.4 (with a 5% solution of sucrose
= 5) and bitterness was less than 1 (with a 0.05% solution of caffeine = 2).
The aromatic category, which were the aromas/flavors evaluated through retronasal
olfaction (while eating the fruit), had five attributes (overall aromatic impact, peach/fresh,
green/unripe, earthy/dirty, and overripe) (Table 5). Of the five attributes, green/unripe and
overripe were significantly different for the nine genotypes. Overall aromatic impact was about
6.0, peach/fresh aromatic was about 4.6, and earthy/dirty was about 1.3. Green/unripe aromatics
ranged from 3.0-4.3 with White River’ having the least green/unripe. Overripe aromatic
attributes were low (0.0-0.8). A-827, ‘Amoore Sweet’, ‘Bowden’, ‘Effie’, and ‘Souvenirs’ were
the least overripe with scores of 0.0.
Two attributes were evaluated for feeling factors, astringent and metallic, and the
panelists only detected a significant difference in astringency among the nine genotypes (Table
8). Astringency ranged from 5.9-6.5, where A-827 and ‘White River’ were the most astringent,
and ‘Souvenirs’ was the least. Metallic feeling factors were ≤ 0.8 for these genotypes.
Texture (flesh hardness, moisture release, awareness of skins, flesh crispness, flesh
melting, and fibrousness between teeth) of the fruit was evaluated (Table 9). Panelists detected
differences among the genotypes for all these attributes. Flesh hardness was evaluated as the
force required to compress the sample between molars. References ranged from cream cheese =
1 to an almond = 11. Flesh hardness ranged from 5.2-7.5, where ‘Souvenirs’ had the hardest
flesh, and ‘Loring’ was the least hard (beef frank = 5 and olive = 7 for the references). Moisture
release was evaluated as the amount of wetness in the mouth after one bite or chew. References
ranged from a banana = 1 to an orange = 15. Moisture release ranged from 4.9-7.8 where
‘Loring’ had the most moisture release, and ‘Bowden’ had the least (mushroom = 4 and snap pea
96
= 8). Awareness of skins was evaluated as the awareness of the skins during 3-5 bites.
References ranged from baked beans = 4 to medium lima beans = 8. Awareness of skins ranged
from 6.6-7.5, where ‘White River’ had the greatest awareness of skins, and ‘Amoore Sweet’ had
the least. Flesh crispness was evaluated as the unique, strong, clean and acute sound produced in
the first bite of the food with incisors and open lips. References ranged from a ripe banana = 0 to
a carrot = 15. Flesh crispness ranged from 4.8-8.0 where ‘Souvenirs’ and ‘Bowden’ were most
crisp and ‘Loring’ the least. Flesh melting was evaluated as the ease with which the flesh
disintegrates under a slight pressure exerted between the tongue and the palate. References
ranged from a carrot = 0 to a slice of canned mango = 15. Flesh melting ranged from 0.6-6.0,
where ‘Loring’ had the greatest flesh melting, and ‘Bowden’ had the least. Fibrousness between
teeth was evaluated as the amount of grinding of fibers required to chew through the sample in 3-
5 bites (references ranged from an apple = 2 to beef jerky = 20). Fibrousness ranged from 4.2-5.5
where ‘Bowden’ had the greatest fibrousness and ‘White River’ the least. Overall, ‘Loring’ was
moist and soft, and ‘Souvenirs’ and ‘Bowden’ were crisp.
Correlations between physiochemical and sensory at harvest
A multivariate pairwise analysis was carried out to identify significant correlations
between the descriptive sensory attributes and physiochemical and nutraceutical attributes (Table
10). Fruit weight was positively correlated to size (r = 0.68), pit size (r = 0.75), overripe
aromatics (r = 0.67), and moisture release (r = 0.69). The bigger the fruit, the more aromatic and
moist. The pH, titratable acidity, and soluble solids/ titratable acidity ratio were correlated with
sour with an r = -0.82, r = 0.89, and r = -0.77, respectively. Titratable acidity was also positively
correlated to overall aromatic impact (r = 0.68). The higher the pH and soluble solids/ titratable
acidity ratio and lower the titratable acidity, then the least sour.
97
Of all of the physiochemical attributes, firmness had the most significant correlations
with the descriptive sensory attributes. Firmness was correlated with size (r = -0.81), fuzziness (r
= -0.70), amount of bruises on the flesh (r = -0.75), pit size (r = -0.72), sourness (r = 0.68),
overall aromatic impact (r = 0.75), green/unripe aromatics (r = 0.72), flesh hardness (r = 0.70),
moisture release (r = -0.77), flesh crispness (r = 0.69), and fibrousness between the teeth (r =
0.84). The more firm the fruit measured analytically, the smaller the fruit, the bigger the pit, the
more aromatic, sour, hard and crisp the flesh, and the less moisture release and bruising/pitting of
the flesh.
Analysis of the correlations of descriptive attributes with nutraceutical attributes found no
correlations for total carotenoids or total phenolic acids, but a significant correlation of total
anthocyanins with amount of blemishes/deformities (r = 0.70) and flesh hardness (r = -0.84). The
more anthocyanins, the more blemished the fruit and less hard flesh. Total flavonols was
correlated to astringent feeling factor (r = 0.83). A study by Troszynska et al. (2011) indicated
flavonols impact the astringency perception in legumes, and the relationship between
chlorogenic acid and astringency was observed in coffee (Coffea arabica L.) and kiwi (Actinidia
deliciosa Hayward), where positive correlation was found between the two attributes (Kim at al.,
2009; Gloess et al., 2013)
Physiochemical and marketability attributes during postharvest storage
During postharvest storage, the nine peach and nectarine genotypes were evaluated at 0,
7, 14, and 21 d at 2 C. F-test significance from ANOVA indicated significant genotype x
storage interactions for many of the attributes (Table 11). The physiochemical attributes
measured included fruit weight, color, firmness, and composition (Tables 12 and 13). The
genotype x storage interaction was only significant for malic acid, total organic acids, and L*
98
(flesh). For all the physiochemical attributes without significant interactions, there were
significant differences across the genotypes, but storage only impacted soluble solids, pH, and
chroma (skin and flesh).
Fruit weight of the genotypes were significantly different with ‘White River’ (292.27 g)
the largest, and A-865 (145.55 g) the smallest, but fruit weight did not change during storage. A-
865 (15.52%) had the highest soluble solids and ‘Loring’ (7.89%) the lowest. On day 21, soluble
solids were greater than day 7 but not day 0 or 14. Changes in soluble solids during storage of
Arkansas peaches has been shown in previous studies (Sandfur, 2011). A-850 (4.98) had the
highest pH and A-865 (3.41) the lowest. Storage affected the pH, where pH of the fruit on day 21
was greater than day 0. Although A-865 (1.00%) had the highest titratable acidity, and A-850
(0.15%) the lowest, storage did not impact titratable acidity.
Total sugars (glucose and fructose) and total organic acids (isocitric and malic) as well as
individual sugars and acids were evaluated. ‘Bowden’ (7.04 g/100 g) had the highest total sugars
and A-827 and A-850 (3.05 g/100 g) the lowest. Storage did not impact total sugars and glucose
and fructose were in roughly equal amounts. ‘Bowden’ had the highest glucose, fructose, and
total sugars, and A-827 and A-850 the least (Fig. 6). Similarly, storage did not impact individual
sugars.
‘Bowden’ (0.52 g/100 g) had the highest isocitric acid content, and ‘Souvenirs’ (0.09
g/100 g) had the lowest. Storage did not impact isocitric acid. There was a significant storage x
genotype interaction for malic and total organic acids. In general, most genotypes did not have a
significant change of malic or total organic acids during storage (Fig. 7). Organic acid content
increases during early stages of fruit growth and declines during maturation (Bae et al., 2014).
Since peaches are climacteric fruit, ripening can occur during storage, therefore a decrease in

99
organic acids was expected, however, this was not observed in all genotypes. At 21 d, the
average total organic acids was 0.25 g/100 g. Both total organic acids (r = -0.42) and malic acid
(r = -0.47) were negatively correlated to pH after 21 d storage. Since total sugars and total
organic acids were not be impacted by storage, it can be inferred that most of the genotypes were
at full maturity at harvest.
‘Amoore Sweet’ (29.57 N) had the highest firmness, and ‘White River’ (6.96 N) the
lowest. The non-melting flesh fruit was firmer than the melting flesh fruit during storage and
differences were seen between the melting-flesh genotypes, where ‘Souvenirs’ was firmer than
‘White River’. Although the firmness decreased during storage, the decrease was not significant.
Fruit with a firmness of 9-14 N is considered ready to eat, however, this does not account for
different flesh types (Crisosto, 1999). In a study by Iglesias and Echeverri (2008), they indicated
that firmer fruit was positively correlated with consumer acceptance. Unlike Crisosto, the study
by Inglesias and Echeverri indicated that peaches with a firmness of 49 N had the highest degree
of consumer acceptance. These studies indicate that the range of ripeness may be larger than
previously thought as they discuss widely different ranges.
The color attributes (L*, chroma, and hue) were measured on the exterior (skin) and
interior (flesh) of the fruit (Table 13). ‘Bowden’ (57.25), a white-flesh fruit, had the highest L*
of the skin, where ‘Souvenirs’ (42.33), a yellow-flesh fruit, had the lowest. L* (flesh) had a
significant storage x genotype interaction (Figure 8). After day 0, the L* value of the flesh of
‘Souvenirs’ significantly increased. In a study by Cáceres et al. (2015), L* was a quality
indicator for internal flesh browning by both descriptive sensory analysis and CIELAB color
analysis. Little to no flesh browning was defined as a L* value <4.7 and extreme flesh
browning was defined as a L* value >21. At 21 d, A-850 (75.51) had a higher L* of the flesh,
100
and ‘Loring’ (58.04) a lower. This indicates that all of the genotypes in this study had little to no
flesh browning from day 0 to day 21. Chroma and hue were less related to flesh browning than
L*. Storage and genotype were significantly different for both the chroma of the skin and chroma
of the flesh. For the skin, chroma at 7 d was greater than 0 d, but similar to 14 d and 21 d. For the
flesh, chroma at 21 d was greater than 0 d, but similar to 7 d and 14 d. This indicates a higher
degree of colorfulness, as increasing chroma value is positively related to colorfulness in the fruit
during storage (International Commission on Illumination, 1970). ‘Amoore Sweet’, a yellow-
flesh fruit, had the highest skin and flesh chroma, 52.65 and 47.56, respectively. Additionally, A-
865 and A-850, both white-flesh fruit, had the lowest chroma for both skin and flesh,
respectively. ‘Bowden’ (54.49) had the highest hue for the skin, and A-850 (101.27) had the
highest hue for the flesh, both white-flesh fruit. Storage did not impact the hue for the skin or the
flesh.
The marketability attributes were evaluated on the fruit during storage. The marketability
attributes measured included weight loss, decay, and bruising/pittting (Table 12). Correlations
were also performed between physiochemical and marketability data at 21 d. There was a
significant storage day x genotype interaction for weight loss and bruising/pittting, but not decay
(Fig. 9). At 21 d, weight loss was significantly greater than day 0 for all genotypes with A-865
(11.82%) having the greatest weight loss and ‘Loring’ (5.20%) the least. Overall weight loss was
low (<13%) for the genotypes at 21 d storage. Significant correlation was found (r = 0.66) with
respect to weight loss and soluble solids at 21 d storage. As water is lost from the fruit, the
soluble solids concentrated which contributed to the significant change in soluble solids after 21
d storage. After 21 d, A-865 (19.17%) had the greatest bruising and ‘Loring’ (4.17%) the least.
Chroma of the flesh was negatively correlated with bruising (r = -0.59) at 21 d. Although

101
unmarketable sections were evaluated on the exterior of the fruit, a clear relationship between
flesh color intensity and bruising was seen, where decreased color intensity was related to greater
bruising. Storage and genotypes significantly affected decay. A-827 (7.08%) had the most decay,
and A-865 (0.83%) the least. In addition, decay of the fruit was greater at 21 d, as compared to 0
d. An inverse relationship was seen with decay and bruising. A-865 which had the least decay,
had the most bruising. Improper handling such as skin breaks, bruising, or lesions, lead to
increased microbial damage/decay (Kalia and Gupta, 2006). During analysis, bruising was
observed to be the precursor to decay as the sections were highly susceptible locations for mold
or rot to occur. Therefore, decay was increasing as bruising was decreasing since the bruised
locations were becoming decayed locations as mold developed.
At 21 d storage at 2 C, the marketability attributes (weight loss, decay, bruising/pitting)
and firmness of fresh-market peach and nectarine genotypes were apparent (Fig. 10). In a
commercial setting, fruit that is resistant to decay, weight loss, and bruising/pitting and retains
high firmness during storage is preferable because higher quality fruit would reach the consumer
and thus earn a higher price at market. At 21 d of storage, there was a significant difference
among the nine genotypes for weight loss and bruising/pitting. ‘White River’ had the least
weight loss, and A-827 and ‘Loring’ had the least bruising at 21 d storage. Overall, the weight
loss, decay, and bruising/pitting of the peaches and nectarines were relatively low and with good
firmness at 21 d of postharvest storage at 2 °C.
Conclusion
At harvest, the nine peach and nectarine genotypes had significant correlations between
physiochemical and descriptive sensory attributes. Ripeness and harvest parameters, such as
texture and appearance, were well described by the analytical measurements for composition and

102
firmness with firmness having the most correlations. About ≥ 69% of the variation in sensory
flesh hardness, moisture release, flesh crispness, and fibrousness between teeth, could be
explained by firmness measured analytically. In addition, ≥ 70% of the variation in sensory
appearance attributes (amount of bruises, size, fuzziness, and pit size) were explained by
firmness. Of the composition attributes, ≥77% of the sour taste could be explained by pH,
titratable acidity, or soluble solids/titratable acidity ratio. The relationship between methods used
for analysis of fruit ripeness at harvest and the associations between sensory texture, appearance,
and sourness attributes further advances understanding of how consumers perceive ripeness of
peaches and nectarines. Significant correlation between texture, appearance, and sourness
attributes with analytical methods, indicate that analytical methods can describe the ripeness
parameters of the fruit. This is important as attributes such as flesh hardness, moisture release,
and sourness are quality factors the consumer relies on to determine ripeness of the fruit.
Overall, genotype had the most significant effect on the postharvest quality of fresh-
market peaches and nectarines grown in Arkansas. Storage had less of an effect on postharvest
quality parameters than previously expected from a climacteric fruit. Soluble solids, pH, weight
loss, decay, and chroma of the skin and the flesh were significantly affected by storage. The
changes in these attributes during storage indicated a decrease in fruit quality, by increased
decay, increased weight loss, and decreased chroma of the flesh, although these changes were
relatively small. Correlation between soluble solids and weight loss indicated a concentration of
the soluble solids rather than further ripening. This was seen in A-865, which had the highest
soluble solids content and weight loss on day 21. Although chroma of the skin increased after 7 d
in storage, indicating an increase in colorfulness, the lack of change on 14 or 21 d indicated any
potential further ripening was halted after 7 d. Of the nine genotypes evaluated, ‘Amoore Sweet’

103
performed well at 21 d storage, with moderate weight loss, low decay and low bruising/pitting,
and high firmness retention. Overall, at 21 d storage at 2 °C, the nine peach and nectarine
genotypes had good marketability and retention of compositional attributes indicating good
potential for fresh-market.
104
Literature Cited
Andreotti, C., D. Ravaglia, A. Ragaini, and G. Costa. 2008. Phenolic compounds in peach
(Prunus persica) cultivars at harvest and during fruit maturation. Annals of Appl. Biol.
153:11-23.
Bae, H., S. Yun, J. Jun, I. Yoon, E. Nam, and J. Kwon. 2014. Assessment of organic acid and
sugar composition in apricot, plumcot, plum, and peach during fruit development, J. Appl.
Bot. Food Quality 87:24-29.
Biehler, E., F. Mayer, L. Hoffmann, E. Krause, and T. Bohn. 2010. Comparison of 3
spectrophotometric methods for carotenoid determination in frequently consumed fruits and
vegetables. J. Food Sci. 75:C55-C61.
Belisle, C., U. Phan, K. Adhikari, and D. Chavez. 2017. Peaches in Georgia: finding out what
consumers want. HortScience 52:S21.
Bible, B.B. and S. Singha. 1993. Canopy position influences CIELAB coordinates of peach
color. HortScience 28:992-993.
Brovelli, E.A., J.K. Brecht, W.B. Sherman, C.A. Sims, and J.M. Harrison. 1999. Sensory and
compositional attributes of melting- and non-melting-flesh peaches for the fresh market. J.
Sci. Food Agr, 79:707-712.
Brown, A., G. Yousef, I. Guzman, K. Chebrolu, D. Werner, M. Parker, K. Gasic, and P. Perkins-
Veazie. 2014. Variation of carotenoids and polyphenolics in peach and implications on
breeding for modified phytochemical profiles. J. Amer. Soc. Hort. Sci., 139:676-686.
Caceres, D., M. Diaz, P. Shinya, and R. Infante. 2016. Assessment of peach internal flesh
browning through colorimetric measures. Postharvest Bio. Technol. 111:48-52.
Ceccarelli, D., A. Simeone, P. Nota, M. Piazza, C. Fideghelli, and E. Caboni. 2016. Phenolic
compounds (hydroxycinnamic acids, flavan-3-ols, flavonols) profile in fruit of Italian peach
varieties, Plant Biosystems. 150:1370-1375.
Contador, L., M. Díaz, E. Hernández, P. Shinya, and R. Infante. 2017. The relationship between
instrumental tests and sensory determinations of peach and nectarine texture. European J.
Hort. Sci. 81:189-196.
Chinnici, F., U. Spinabelli, C. Riponi, and A. Amati. 2005. Optimization of the determination of
organic acids and sugars in fruit juices by ion-exclusion liquid chromatography. J. Food
Composition and Analysis 18:121-130.
Cho, M.J., L.R. Howard, R.L Prior, and J.R. Clark. 2004. Flavonoid glycosides and antioxidant
capacity of various blackberry, blueberry, and red grape genotypes determined by high-
105
performance liquid chromatography/ mass spectrometry. J. Food Sci. and Agr. 84:1771-
1782.
Cho, M.J., L.R. Howard, R.L. Prior, and J.R. Clark. 2005. Flavonol glycosides and
antioxidant.capacity of various blackberry and blueberry genotypes determined by high‐performance liquid chromatography/mass spectrometry. J. Sci. Food. Agr. 85:2149‐2158.
CIE et a la CEI edn, Bureau central de la CIE, Paris.C.I.E. 1986. Colorimetry. 15.2. 2d ed.
Commission Internationale de l’Eclairage, Vienna.
Clark, J. and J. Moore. 2003. ‘White river’ peach. HortScience 38:1257-1259.
Clark, J. and P. Sandefur. 2013. ‘Souvenirs’ Peach. HortScience 48:800-803.
Colaric, M., R. Veberic, F. Stampar, and M. Hudina. 2005. Evaluation of peach and nectarine
fruit quality and correlations between sensory and chemical attributes. J. Sci. Food Agri.
85(:2611-2616.
Crisosto, C.H. 1994. Stone fruit maturity indices: a descriptive review. Postharvest News Info
5:65N-68N.
Crisosto, C.H. 1999. Optimum procedures for ripening stone fruit. Univ. California. Mgt. of fruit
ripening. Davis, 28-30S.
Crisosto, C.H., and A.A. Kader. 2000. Plum and fresh prune postharvest quality maintenance
guidelines, Dept. Plant Sci., Univ. California, Davis, CA.
Crisosto, C.H., and G.M. Crisosto. 2005. Relationship between ripe soluble solids concentration
(RSSC) and consumer acceptance of high and low acid melting flesh peach and nectarine
(Prunus persica (L.) Batsch) cultivars. Postharvest Bio. Technol. 38(3):239-246.
Delgado, C., G.M. Crisosto, H. Heymann, and C.H. Crisosto. 2013. Determining the primary
drivers of liking to predict consumers' acceptance of fresh nectarines and peaches, J. Food
Sci. 78:S605-S614.
Ghiani, A., N. Negrini, S. Morgutti, F. Baldin, F.F. Nocito, A. Spinardi, I. Mignani, D. Bassi,
and M. Cocucci. 2011. Melting of ‘Big Top’ nectarine fruit: some physiological,
biochemical, and molecular aspects. J. Amer. Soc. Hort. Sci. 136:61-68.
Gil, M., F. Tomas-Barberan, B. Hess-Pierce, and A.A Kader. 2002. Antioxidant capacities,
phenolic compounds, carotenoids, and vitamin C contents of nectarine, peach, and plum
cultivars from California, J. Agri. Food Chem. 50:4976-4982.
Gloess, A.N., B. Schönbächler, B. Klopprogge, L. D`Ambrosio, K. Chatelain, A. Bongartz, A.
Strittmatter, M. Rast, and C. Yeretzian. 2013. Comparison of nine common coffee extraction
methods: instrumental and sensory analysis. European Food Res. Technol. 236:607-627.
106
Gross, J. 1991. Carotenoids. In: Pigments in vegetables. Springer, Boston, MA. 99-101.
Gu, C., L. Wang, W. Wang, H. Zhou, B. Ma, H. Zheng, T. Fang, C. Ogutu, S. Vimolmangkang,
and Y. Han. 2016. Copy number variation of a gene cluster encoding endopolygalacturonase
mediates flesh texture and stone adhesion in peach. J. Experimental Bot. 67:1993-2005.
Hager, T., R. Prior, and L. Howard. 2008. Processing and storage effects on monomeric
anthocyanins, percent polymeric color, and antioxidant capacity of processed blackberry
products. J. Agr. Food Chem. 56:689–695.
Hager, T., R. Prior, and L. Howard. 2010. Processing and storage effects on the ellagitannins
composition of processed blackberry products. J. Agr. Food Chem. 58:11749–11754.
Iglesias, I. and G. Echeverría. 2009. Differential effect of cultivar and harvest date on nectarine
colour, quality and consumer acceptance. Scientia Horticulturae 120:41-50.
International Commission on Illumination and International Electrotechnical Commission 1970,
Vocabulaire international de l'eclairage: Intl. lighting vocabulary 3.
Johnson, D., R.K. Strigler, B.A. Lewis, and C. Lake. 2003. Crop profile for peaches in Arkansas.
Univ. Arkansas.
Jordan, J.L., R.L. Shewfelt, J.C. Garner, and J.N. Variyam.1989. Estimating the value of internal
quality aspects to consumers. In Wkshp. Measuring Consumer Perception Internal Prod.
Qual. 259:139-144.
Kader, A.A. 1985. Quality factors: definition and evaluation for fresh horticultural crops. Spec.
Publ. 3311:118-121.
Kader, A.A. 2002. Postharvest technology of horticultural crops. Univ. California Agri. Natural
Resources. 3311.
Kalia, A. and R.P. Gupta. 2006. Fruit microbiology. Handbook of fruits and fruit processing. 1-
28.
Kim, J.G., K. Beppu, and I. Kataoka. 2009. Varietal differences in phenolic content and
astringency in skin and flesh of hardy kiwifruit resources in Japan. Scientia Horticulturae
120:551-554.
Karakurt, Y., D.J. Huber, and W.B. Sherman. 2000. Quality characteristics of melting and non‐melting flesh peach genotypes. J. Sci. Food Agri. 80:1848-1853.
Liu, R.H. 2013. Health-promoting components of fruits and vegetables in the diet. Adv. Nutr.
4:384S-392S.
107
McGuire, R.G. 1992. Reporting of objective color measurements. HortScience 27(12):1254-
1255.
Quilot, B., J. Kervella, and M. Génard. 2004. Shape, mass and dry matter content of peaches of
varieties with different domestication levels. Scientia horticulturae 99:387-393.
Rahmati, M., G. Vercambre, G. Davarynejad, M. Bannayan, M. Azizi, and M. Génard. 2015.
Water scarcity conditions affect peach fruit size and polyphenol contents more severely than
other fruit quality traits: Water scarcity conditions, peach fruit growth and composition. J.
Sci. Food Agri. 95:1055-1065.
Sandefur, P.J. 2011. Characterization and molecular analysis of university of Arkansas peach,
prunus persica (L.) batsch, flesh types and development of a post-harvest evaluation
protocol for Arkansas peach and nectarine genotypes, Univ. Ark., Fayetteville, PhD Diss.
Segantini, D.M., R.T. Threlfall, J.R. Clark, L.R. Howard, and C.R. Brownmiller. 2018.
Physiochemical changes in floricane and primocane blackberries harvested from primocane
genotypes. HortScience 53:9-15.
Shinya, P., L. Contador, S. Predieri, P. Rubio, and R. Infante. 2013. Peach ripening: segregation
at harvest and postharvest flesh softening. Postharvest Biology and Technology. 86:472-478.
Troszynska, A., I. Estrella, G. Lamparski, T. Hernandez, R. Amarowicz, and R. Pegg. 2011.
Relationship between the sensory quality of lentil (Lens culinaris) sprouts and their phenolic
constituents. Food Res. Intl. 44:3195-3201.
U.S. Department of Agriculture (USDA). 2015. Arkansas Fruit Production Report. Washington,
D.C.
Walker, T., J. Morris, R. Threlfall, and G. Main. 2003. Analysis of wine components in
Cynthiana and Syrah wines. J. Agri. Food Chem. 51:1543-1547.
Wert, T.W., J.G. Williamson, J.X. Chaparro, E.P. Miller, and R.E. Rouse. 2007. The influence of
climate on fruit shape of four low-chill peach cultivars. HortScience 42:1589-1591.
Wang, T., A.R. Gonzalez, E.E. Gbur, and J.M. Aselage. 1993. Organic acid changes during
ripening of processing peaches. J. Food Sci. 58:631-632.
Zellar, G., N.G. Wyatt, and H. Medders. 2005. History of Bumpers College: condensed from the
book, History of the Bumpers College--evolution of education in the agricultural, food and
life sciences in Arkansas, Univ. of Ark., Fayetteville, Ark.
Zheng, Y., G.W. Crawford, and X. Chen.V 2014, Archaeological evidence for peach (Prunus
persica) cultivation and domestication in China. Public Library Sci. 9(9):1-9.

108
Tables
Table 1. Lexicon developed for fresh-market peach and nectarine attributes by a descriptive
sensory panel with ten trained panelists.
Term
Definition
Technique
Reference
Aroma (whole fruit)
Fruity/peach Smell associated with fresh, ripe peach Ripe peach Intensities based on
universal scalez
Earthy/dirty Smell associated with damp soil or wet
foliage
Damp potting soil, allspice Intensities based on
universal scale
Green/unripe Smell associated with freshly cut green
vegetation; unripe
Unripe banana Intensities based on
universal scale
Mold/mildew Smell associated with moldy or mildew
aromas
Old mildewed clothes Intensities based on
universal scale
Appearance (exterior of fruit)
Uniformity of color Ratio of uniformity of color on the
exterior of the peach/nectarine
Observe the sample and rate
the degree to which the
sample is uniform in color.
(un-uniform to uniform)
Ratio of color
uniformity
0%=0, 50%=7.5,
100%=15
Color-yellowness Degree of yellow of the sample Observe the sample and
determine the amount of
yellow on the surface of the
sample.
(none to much)
Ratio of yellow
0%=0, 50%=7.5,
100%=15
Color-redness Degree of red of the sample Observe the sample and
determine the amount of red
on the surface of the sample.
(none to much)
Ratio of red
0%=0, 50%=7.5,
100%=15
Size
The visual size of the sample Observe the sample and
determine the overall size of
the sample.
(small to large)
A=2.5-inch
sphere=8.0
B=3-inch
sphere=13.0
Shape
Visual shape of the sample Observe the sample and
determine the overall shape
of the sample.
(oval to round)
Egg/oval=5
A=2.5-inch
ball=15.0
Amount of bruises
Visual ratio of bruises on the sample Observe the sample and
determine the amount of
bruises on the surface of the
sample. (none to much)
Ratio of bruises
0%=0, 50%=7.5,
100%=15
Amount of
blemishes/
deformities
Visual ratio of blemishes/deformities on
the sample.
Observe the sample and
determine the amount of
blemishes/deformities on the
surface of the sample. (none
to much)
Ratio of blemishes
and deformities
0%=0, 50%=7.5,
100%=15
Fuzziness Amount of fuzz on the sample Feel the sample and
determine the amount of fuzz
on the sample.
(none to much)
Nectarine=0
Artificial peach=10
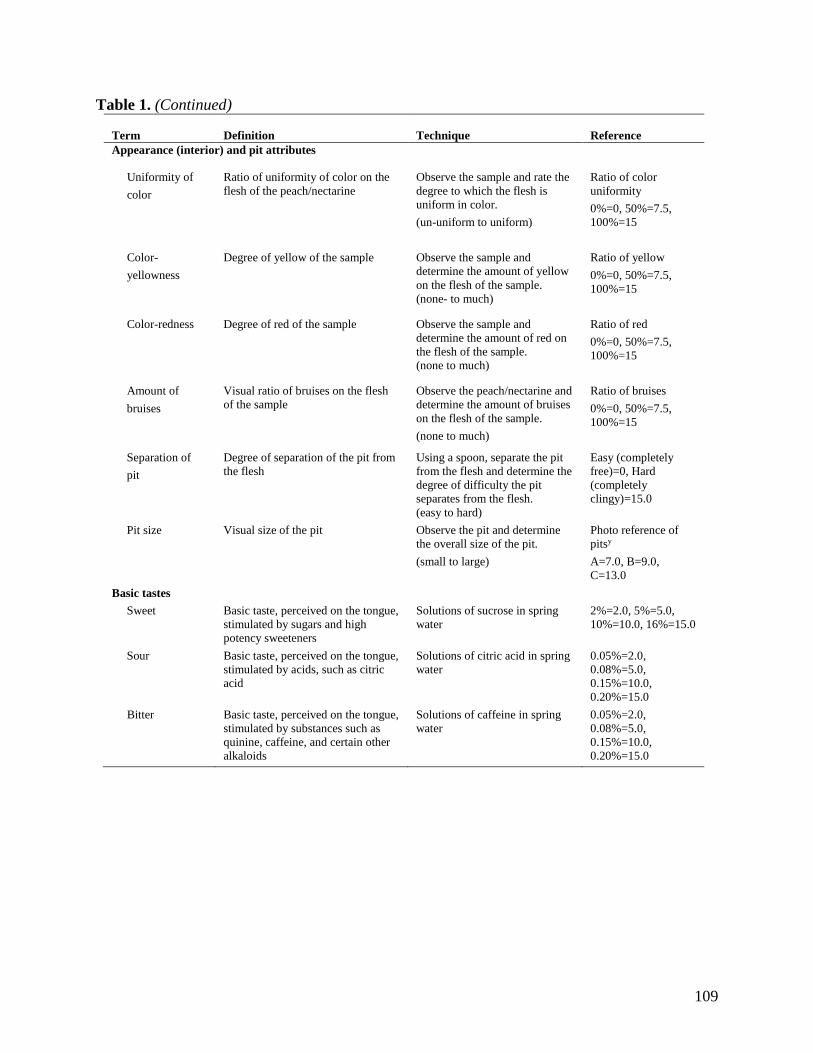
109
Table 1. (Continued)
Term
Definition
Technique
Reference
Appearance (interior) and pit attributes
Uniformity of
color
Ratio of uniformity of color on the
flesh of the peach/nectarine
Observe the sample and rate the
degree to which the flesh is
uniform in color.
(un-uniform to uniform)
Ratio of color
uniformity
0%=0, 50%=7.5,
100%=15
Color-
yellowness
Degree of yellow of the sample Observe the sample and
determine the amount of yellow
on the flesh of the sample.
(none- to much)
Ratio of yellow
0%=0, 50%=7.5,
100%=15
Color-redness Degree of red of the sample Observe the sample and
determine the amount of red on
the flesh of the sample.
(none to much)
Ratio of red
0%=0, 50%=7.5,
100%=15
Amount of
bruises
Visual ratio of bruises on the flesh
of the sample
Observe the peach/nectarine and
determine the amount of bruises
on the flesh of the sample.
(none to much)
Ratio of bruises
0%=0, 50%=7.5,
100%=15
Separation of
pit
Degree of separation of the pit from
the flesh
Using a spoon, separate the pit
from the flesh and determine the
degree of difficulty the pit
separates from the flesh.
(easy to hard)
Easy (completely
free)=0, Hard
(completely
clingy)=15.0
Pit size Visual size of the pit Observe the pit and determine
the overall size of the pit.
(small to large)
Photo reference of
pitsy
A=7.0, B=9.0,
C=13.0
Basic tastes
Sweet Basic taste, perceived on the tongue,
stimulated by sugars and high
potency sweeteners
Solutions of sucrose in spring
water
2%=2.0, 5%=5.0,
10%=10.0, 16%=15.0
Sour Basic taste, perceived on the tongue,
stimulated by acids, such as citric
acid
Solutions of citric acid in spring
water
0.05%=2.0,
0.08%=5.0,
0.15%=10.0,
0.20%=15.0
Bitter Basic taste, perceived on the tongue,
stimulated by substances such as
quinine, caffeine, and certain other
alkaloids
Solutions of caffeine in spring
water
0.05%=2.0,
0.08%=5.0,
0.15%=10.0,
0.20%=15.0

110
Table 1. (Continued)
Term
Definition
Technique
Reference
Aromatics
Overall
aromatic
impact
Overall impact of all aromatics in
the peach/nectarine
Intensities based on universal
scale
Peach/fresh Aromatic associated with
peaches/nectarines
Fresh peach Intensities based on universal
scale
Green/unripe Aromatic associated with freshly
cut green vegetation; unripe
Unripe banana Intensities based on universal
scale
Earthy/dirty Aromatic associated with damp
soil or wet foliage
Damp potting soil,
allspice
Intensities based on universal
scale
Overripe Aromatic associated with overripe
fruit
Over-ripened fruit Intensities based on universal
scale
Feeling factors
Astringent Feeling factor on the tongue or
other skin surfaces of the mouth
described as puckering or drying
Chew sample to
point of swallow,
expectorate and
feel surfaces of the
mouth.
Swish references in
mouth, swallow or
expectorate and
wait 5 seconds.
0.053 g/500 mL water = 6.0
Swish, expectorate, wait 5
seconds
Metallic Aromatic associated with metals,
tinny or iron or a flat chemical
feeling factor stimulated on the
tongue by metal coins
Tin foil to bite on Intensities based on universal
scale
Texture (cut each of the slices in half) Flesh
hardness
Force required to compress the
sample
Place the sample in
the mouth with the
skin facing toward
the cheek.
Compress or bite
through sample one
time with molars or
incisors.
(soft to hard)
Cream cheese=1.0, Egg
white=2.5, Am cheese=4.5, Beef
frank=5.5, Olive=7.0,
Peanut=9.5, Almond=11.0
Moisture
release
Amount of wetness or moistness
felt in the mouth after one bite or
chew
Compress sample
with molars one
time only.
(dry to wet)
Banana=1.0, Carrot=2.0,
Mushroom=4.0, Snap beans=7.0,
Cucumber=8.0, Apple=10.0,
Honeydew=12.0, Orange=15.0
(chew reference 5 times)
Awareness of
skins
How aware are you of the skins
during mastication of the sample
Place sample in
mouth and chew 3-
5 times. Can also
be evaluated in first
bite stage.
(none to much)
Baked beans=4.0, Medium lima
beans=8.0

111
Table 1. (Continued)
Term
Definition
Technique
Reference
Flesh
crispness
Unique, strong, clean and acute
sound produced in the first bite of
the food with incisors and open
lips
Place the sample between the
incisors (front teeth) and penetrate
it. Evaluate the sound intensity
produced at the first bite.
(none to much)
Ripe banana=0.0,
Granny smith
apple=7.5,
Carrot=15.0
Flesh melting Ease with which the flesh
disintegrates under a slight
pressure exerted between the
tongue and the palate
Place the sample on the tongue
with the skin side on the tongue
and press it against the palate.
Evaluate how the sample flows.
(none to much)
Carrot=0.0, Canned
sliced mango=15.0
Fibrousness
between
teeth
Amount of grinding of fibers
required to chew through the
sample. (not including the skins)
Place sample between molars and
chew 3-5 times. Evaluate during
chewing but ignore the skin.
(none to much)
Apple=2.0,
Apricot=5.0,
Salami=7.0,
Celery=9.0, Toasted
oats (4-5)=10.0,
Bacon=12.0, Beef
jerky=20.0 zIntensities based on universal scale (saltine = 3.0; applesauce = 7.0; orange juice = 10.0; grape
juice = 14.0; Big Red Gum = 15.0). ySee Figure 5 for photo reference.
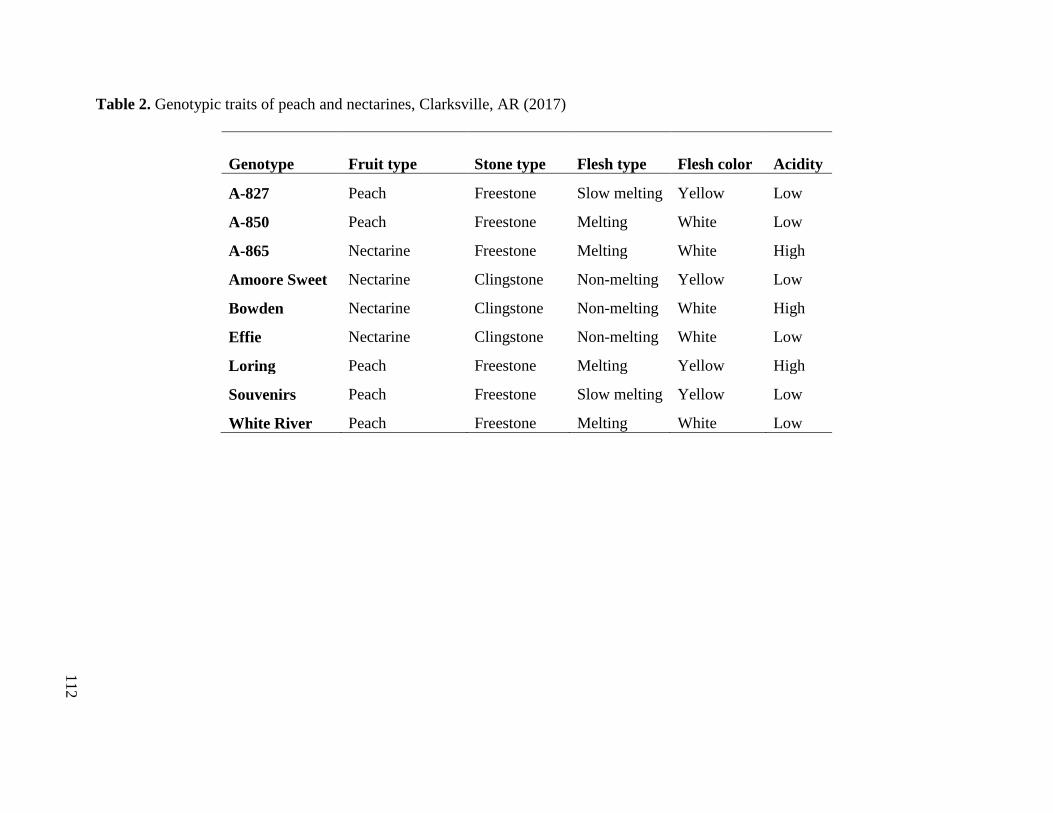
112
Table 2. Genotypic traits of peach and nectarines, Clarksville, AR (2017)
Genotype Fruit type Stone type Flesh type Flesh color Acidity
A-827 Peach Freestone Slow melting Yellow Low
A-850 Peach Freestone Melting White Low
A-865 Nectarine Freestone Melting White High
Amoore Sweet Nectarine Clingstone Non-melting Yellow Low
Bowden Nectarine Clingstone Non-melting White High
Effie Nectarine Clingstone Non-melting White Low
Loring Peach Freestone Melting Yellow High
Souvenirs Peach Freestone Slow melting Yellow Low
White River Peach Freestone Melting White Low
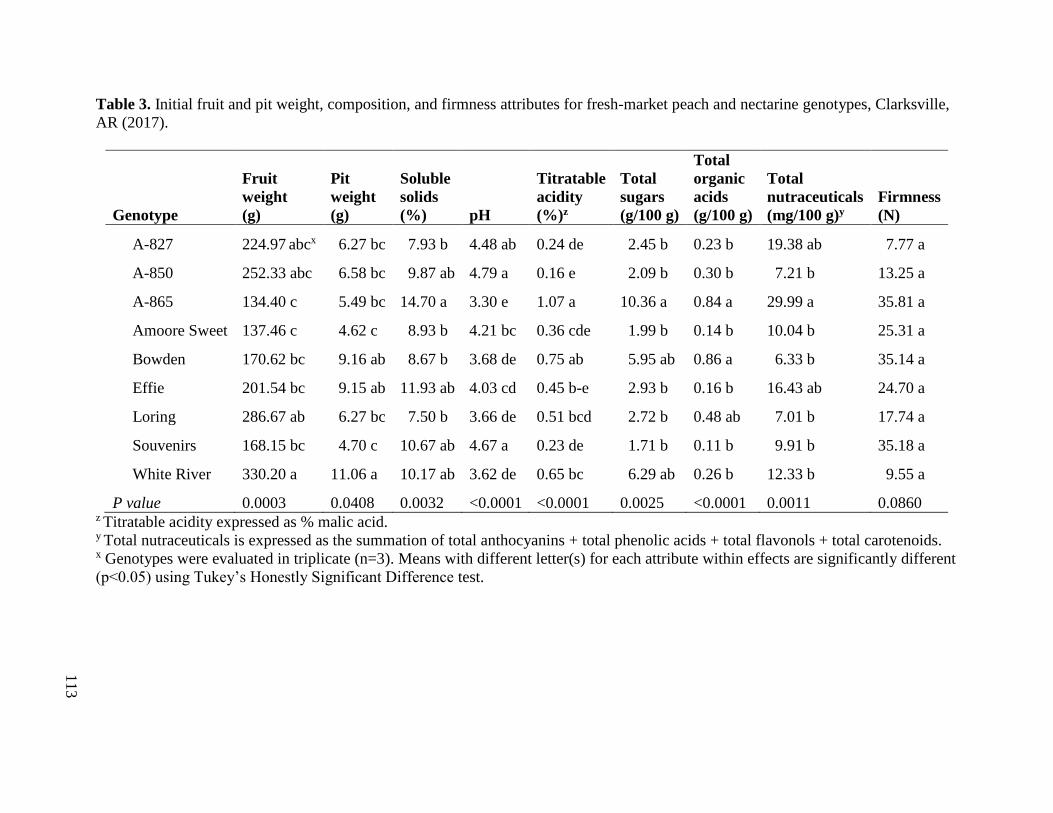
113
Table 3. Initial fruit and pit weight, composition, and firmness attributes for fresh-market peach and nectarine genotypes, Clarksville,
AR (2017).
Genotype
Fruit
weight
(g)
Pit
weight
(g)
Soluble
solids
(%) pH
Titratable
acidity
(%)z
Total
sugars
(g/100 g)
Total
organic
acids
(g/100 g)
Total
nutraceuticals
(mg/100 g)y
Firmness
(N)
A-827 224.97 abcx 6.27 bc 7.93 b 4.48 ab 0.24 de 2.45 b 0.23 b 19.38 ab 7.77 a
A-850 252.33 abc 6.58 bc 9.87 ab 4.79 a 0.16 e 2.09 b 0.30 b 7.21 b 13.25 a
A-865 134.40 c 5.49 bc 14.70 a 3.30 e 1.07 a 10.36 a 0.84 a 29.99 a 35.81 a
Amoore Sweet 137.46 c 4.62 c 8.93 b 4.21 bc 0.36 cde 1.99 b 0.14 b 10.04 b 25.31 a
Bowden 170.62 bc 9.16 ab 8.67 b 3.68 de 0.75 ab 5.95 ab 0.86 a 6.33 b 35.14 a
Effie 201.54 bc 9.15 ab 11.93 ab 4.03 cd 0.45 b-e 2.93 b 0.16 b 16.43 ab 24.70 a
Loring 286.67 ab 6.27 bc 7.50 b 3.66 de 0.51 bcd 2.72 b 0.48 ab 7.01 b 17.74 a
Souvenirs 168.15 bc 4.70 c 10.67 ab 4.67 a 0.23 de 1.71 b 0.11 b 9.91 b 35.18 a
White River 330.20 a 11.06 a 10.17 ab 3.62 de 0.65 bc 6.29 ab 0.26 b 12.33 b 9.55 a
P value 0.0003 0.0408 0.0032 <0.0001 <0.0001 0.0025 <0.0001 0.0011 0.0860 z Titratable acidity expressed as % malic acid. y Total nutraceuticals is expressed as the summation of total anthocyanins + total phenolic acids + total flavonols + total carotenoids. x Genotypes were evaluated in triplicate (n=3). Means with different letter(s) for each attribute within effects are significantly different
(p<0.05) using Tukey’s Honestly Significant Difference test.

114
Table 4. Initial skin and flesh color attributes for fresh-market peach and nectarine genotypes, Clarksville, AR (2017).
Skin Flesh
Genotype L* Chroma Hue L* Chroma Hue
A-827 51.72 abz 44.52 abc 49.76 a 70.56 a 48.63 a 87.20 ab
A-850 56.39 ab 37.71 bcd 41.03 a 73.02 a 16.27 b 99.89 a
A-865 59.51 ab 31.73 d 57.51 a 70.01 a 20.28 b 81.49 ab
Amoore Sweet 49.65 ab 52.23 a 46.68 a 65.70 a 49.68 a 80.45 ab
Bowden 57.73 ab 37.37 bcd 57.45 a 72.42 a 26.14 b 98.22 a
Effie 47.73 ab 36.13 cd 40.64 a 71.15 a 23.09 b 99.08 a
Loring 59.56 a 47.52 ab 57.44 a 66.34 ab 47.50 a 83.85 ab
Souvenirs 38.38 b 37.94 bcd 30.74 a 55.57 b 38.79 a 56.52 b
White River 62.52 a 33.53 d 54.22 a 67.09 ab 19.47 b 60.72 b
P value 0.0205 <0.0001 0.0934 0.0095 <0.0001 0.0039 z Genotypes were evaluated in triplicate (n=3). Means with different letter(s) for each attribute within effects are significantly different
(p<0.05) using Tukey’s Honestly Significant Difference test.

115
Table 5. Descriptive sensory aroma and aromatic attributes for peach and nectarine genotypes evaluated on a 15-point scale (0 = less
of the attribute; 15 = more of the attribute in terms of intensity), Clarksville, AR (2017).
Aroma Aromatics
Genotype
Fruity/
peach
Earthy/
dirty
Green/
unripe
Moldy/
mildew
Overall
aromatic
impact
Peach/
fresh
Green/
unripe
Earthy/
dirty Overripe
A-827 2.5 dz 1.3 a 1.4 cd 0.7 a 5.4 a 4.3 a 3.8 a 1.7 a 0.0 c
A-850 2.7 d 1.2 abc 1.4 cd 0.3 a 5.8 a 4.8 a 3.0 b 1.5 a 0.2 bc
A-865 3.2 cd 1.1 abcd 2.1 ab 1.1 a 6.2 a 4.6 a 4.3 a 1.5 a 0.2 bc
Amoore Sweet 4.0 ab 0.8 bcd 1.8 abc 0.8 a 5.8 a 4.7 a 3.9 a 0.9 a 0.0 c
Bowden 3.7 abc 0.7 cd 1.9 abc 0.9 a 6.2 a 4.8 a 4.0 a 1.1 a 0.0 c
Effie 4.3 a 0.7 d 2.3 a 1.0 a 6.1 a 4.6 a 4.2 a 1.0 a 0.0 c
Loring 4.1 a 1.1 abcd 1.5 bcd 0.6 a 6.0 a 4.8 a 3.0 b 1.3 a 0.6 ab
Souvenirs 3.2 bcd 1.3 ab 1.1 d 0.9 a 5.9 a 4.2 a 4.0 a 1.2 a 0.0 c
White River 3.6 abc 1.5 a 1.2 d 0.8 a 5.8 a 4.6 a 3.0 b 1.6 a 0.8 a
P value <0.0001 0.0240 0.0001 0.3040 0.1240 0.5760 <0.0001 0.0720 0.0090
zGenotypes were evaluated in duplicate by ten trained panelists. Means with different letter(s) for each attribute are significantly
different (P < 0.05) using least significant difference.
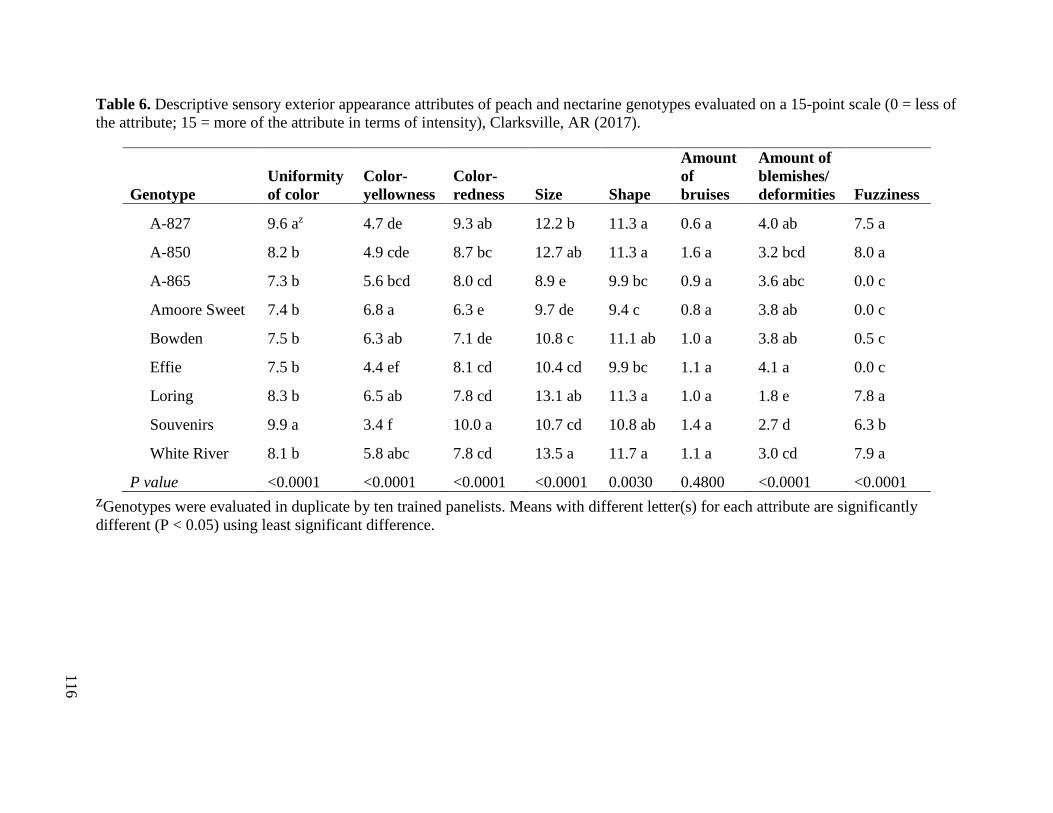
116
Table 6. Descriptive sensory exterior appearance attributes of peach and nectarine genotypes evaluated on a 15-point scale (0 = less of
the attribute; 15 = more of the attribute in terms of intensity), Clarksville, AR (2017).
Genotype
Uniformity
of color
Color-
yellowness
Color-
redness Size Shape
Amount
of
bruises
Amount of
blemishes/
deformities Fuzziness
A-827 9.6 az 4.7 de 9.3 ab 12.2 b 11.3 a 0.6 a 4.0 ab 7.5 a
A-850 8.2 b 4.9 cde 8.7 bc 12.7 ab 11.3 a 1.6 a 3.2 bcd 8.0 a
A-865 7.3 b 5.6 bcd 8.0 cd 8.9 e 9.9 bc 0.9 a 3.6 abc 0.0 c
Amoore Sweet 7.4 b 6.8 a 6.3 e 9.7 de 9.4 c 0.8 a 3.8 ab 0.0 c
Bowden 7.5 b 6.3 ab 7.1 de 10.8 c 11.1 ab 1.0 a 3.8 ab 0.5 c
Effie 7.5 b 4.4 ef 8.1 cd 10.4 cd 9.9 bc 1.1 a 4.1 a 0.0 c
Loring 8.3 b 6.5 ab 7.8 cd 13.1 ab 11.3 a 1.0 a 1.8 e 7.8 a
Souvenirs 9.9 a 3.4 f 10.0 a 10.7 cd 10.8 ab 1.4 a 2.7 d 6.3 b
White River 8.1 b 5.8 abc 7.8 cd 13.5 a 11.7 a 1.1 a 3.0 cd 7.9 a
P value <0.0001 <0.0001 <0.0001 <0.0001 0.0030 0.4800 <0.0001 <0.0001
zGenotypes were evaluated in duplicate by ten trained panelists. Means with different letter(s) for each attribute are significantly
different (P < 0.05) using least significant difference.

117
Table 7. Descriptive sensory interior appearance and pit attributes of the flesh of peach and nectarine genotypes evaluated on a 15-
point scale (0 = less of the attribute; 15 = more of the attribute in terms of intensity), Clarksville, AR (2017).
Genotype
Uniformity
of color
Color-
yellowness
Color-
redness
Amount
of bruises
Separation
of pit Pit size
A-827 10.1 bz 9.8 c 4.4 b 2.1 a 10.8 cd 8.7 bc
A-850 13.1 a 13.0 ab 1.6 c 1.9 a 6.9 f 9.5 b
A-865 10.8 b 9.6 c 3.4 b 1.1 b 11.9 bc 7.9 cd
Amoore Sweet 13.2 a 13.5 a 1.0 c 0.4 b 13.9 a 8.3 cd
Bowden 13.3 a 13.2 ab 0.9 c 0.8 b 13.1 ab 8.1 cd
Effie 12.7 a 12.2 b 1.9 c 0.6 b 13.6 ab 9.4 b
Loring 10.0 b 10.1 c 4.2 b 2.5 a 8.6 ef 10.9 a
Souvenirs 9.9 b 9.8 c 4.4 b 1.0 b 11.8 bc 7.3 d
White River 8.5 c 7.9 d 5.9 a 2.3 a 9.5 de 11.0 a
P value <0.0001 <0.0001 <0.0001 <0.0001 <0.0001 <0.0001
zGenotypes were evaluated in duplicate by ten trained panelists. Means with different letter(s) for each attribute are significantly
different (P < 0.05) using least significant difference.
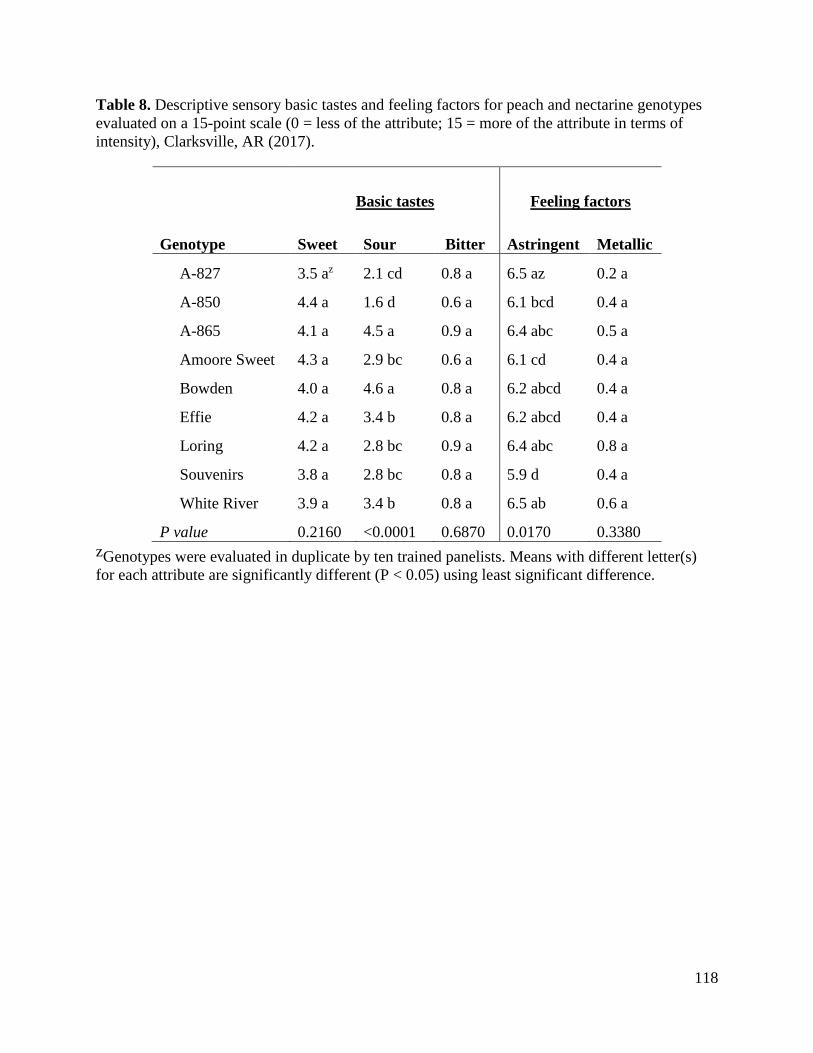
118
Table 8. Descriptive sensory basic tastes and feeling factors for peach and nectarine genotypes
evaluated on a 15-point scale (0 = less of the attribute; 15 = more of the attribute in terms of
intensity), Clarksville, AR (2017).
Basic tastes Feeling factors
Genotype Sweet Sour Bitter Astringent Metallic
A-827 3.5 az 2.1 cd 0.8 a 6.5 az 0.2 a
A-850 4.4 a 1.6 d 0.6 a 6.1 bcd 0.4 a
A-865 4.1 a 4.5 a 0.9 a 6.4 abc 0.5 a
Amoore Sweet 4.3 a 2.9 bc 0.6 a 6.1 cd 0.4 a
Bowden 4.0 a 4.6 a 0.8 a 6.2 abcd 0.4 a
Effie 4.2 a 3.4 b 0.8 a 6.2 abcd 0.4 a
Loring 4.2 a 2.8 bc 0.9 a 6.4 abc 0.8 a
Souvenirs 3.8 a 2.8 bc 0.8 a 5.9 d 0.4 a
White River 3.9 a 3.4 b 0.8 a 6.5 ab 0.6 a
P value 0.2160 <0.0001 0.6870 0.0170 0.3380
zGenotypes were evaluated in duplicate by ten trained panelists. Means with different letter(s)
for each attribute are significantly different (P < 0.05) using least significant difference.

119
Table 9. Descriptive sensory texture attributes for peach and nectarine genotypes evaluated on a 15-point scale (0 = less of the
attribute; 15 = more of the attribute in terms of intensity), Clarksville, AR (2017).
Genotype
Flesh
hardness
Moisture
release
Awareness
of skins
Flesh
crispness
Flesh
melting
Fibrousness
between
teeth
A-827 6.8 az 6.5 b 6.9 abc 7.1 a 2.7 bcd 4.8 bc
A-850 5.9 b 6.6 b 7.2 ab 6.0 b 3.1 bc 4.3 c
A-865 7.1 a 5.6 c 7.0 abc 7.4 a 2.0 cde 5.3 ab
Amoore Sweet 7.2 a 5.1 c 6.6 c 7.8 a 0.8 e 5.4 a
Bowden 7.3 a 4.9 c 6.8 bc 8.0 a 0.6 e 5.5 a
Effie 7.3 a 5.4 c 6.7 bc 7.7 a 1.1 de 5.2 ab
Loring 5.2 b 7.8 a 7.4 a 4.8 c 6.0 a 4.5 c
Souvenirs 7.5 a 5.2 c 7.0 abc 8.0 a 1.3 cde 5.3 ab
White River 5.4 b 7.7 a 7.5 a 5.1 bc 4.6 ab 4.2 c
P value <0.0001 <0.0001 0.0490 <0.0001 <0.0001 <0.0001
zGenotypes were evaluated in duplicate by ten trained panelists. Means with different letter(s) for each attribute are significantly
different (P < 0.05) using least significant difference.
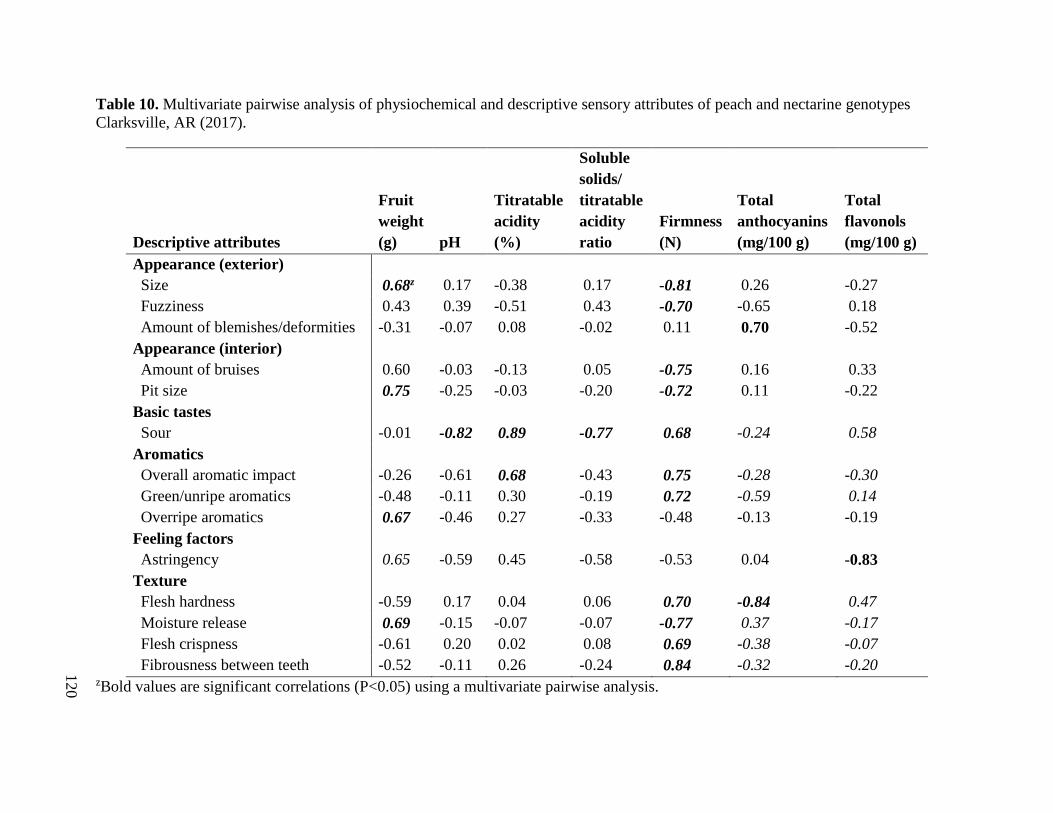
120
Table 10. Multivariate pairwise analysis of physiochemical and descriptive sensory attributes of peach and nectarine genotypes
Clarksville, AR (2017).
Descriptive attributes
Fruit
weight
(g) pH
Titratable
acidity
(%)
Soluble
solids/
titratable
acidity
ratio
Firmness
(N)
Total
anthocyanins
(mg/100 g)
Total
flavonols
(mg/100 g)
Appearance (exterior)
Size 0.68z 0.17 -0.38 0.17 -0.81 0.26 -0.27
Fuzziness 0.43 0.39 -0.51 0.43 -0.70 -0.65 0.18
Amount of blemishes/deformities -0.31 -0.07 0.08 -0.02 0.11 0.70 -0.52
Appearance (interior)
Amount of bruises 0.60 -0.03 -0.13 0.05 -0.75 0.16 0.33
Pit size 0.75 -0.25 -0.03 -0.20 -0.72 0.11 -0.22
Basic tastes
Sour -0.01 -0.82 0.89 -0.77 0.68 -0.24 0.58
Aromatics
Overall aromatic impact -0.26 -0.61 0.68 -0.43 0.75 -0.28 -0.30
Green/unripe aromatics -0.48 -0.11 0.30 -0.19 0.72 -0.59 0.14
Overripe aromatics 0.67 -0.46 0.27 -0.33 -0.48 -0.13 -0.19
Feeling factors
Astringency 0.65 -0.59 0.45 -0.58 -0.53 0.04 -0.83
Texture
Flesh hardness -0.59 0.17 0.04 0.06 0.70 -0.84 0.47
Moisture release 0.69 -0.15 -0.07 -0.07 -0.77 0.37 -0.17
Flesh crispness -0.61 0.20 0.02 0.08 0.69 -0.38 -0.07
Fibrousness between teeth -0.52 -0.11 0.26 -0.24 0.84 -0.32 -0.20 zBold values are significant correlations (P<0.05) using a multivariate pairwise analysis.

121
Table 11. F-test significance from ANOVA for physiochemical and marketability of fresh-market peach and nectarine genotypes
stored at 2 C for 0, 7, 14, and 21 d, Clarksville, AR (2017).
Attributes Genotype Storage day Genotype x storage day
Physiochemical
Fruit weight (g) <0.0001 0.9357 0.4861
Soluble solids (%) <0.0001 0.0269 0.2482
pH <0.0001 0.0269 0.6989
Titratable acidity (%) <0.0001 0.1434 0.7142
Glucose (g/100g) 0.0018 0.0851 0.0736
Fructose (g/100g) 0.0296 0.1852 0.1884
Total sugars (g/100g) 0.0082 0.1452 0.1289
Citric acid (g/100g) <0.0001 0.5602 0.7483
Malic acid (g/100g) 0.0018 0.0029 0.0036
Total organic acids (g/100g) <0.0001 0.0054 0.0030
L* (skin) <0.0001 0.6841 0.6270
Chroma (skin) <0.0001 0.0330 0.4856
Hue (skin) <0.0001 0.1525 0.2783
L* (flesh) <0.0001 0.0995 <0.0001
Chroma (flesh) <0.0001 <0.0001 0.1995
Hue (flesh) <0.0001 0.3716 0.1274
Firmness (N) <0.0001 0.2934 0.4201
Marketability
Weight loss (%) <0.0001 <0.0001 <0.0001
Decay (%) 0.0001 <0.0001 0.5378
Bruised/pitting (%) <0.0001 0.3738 0.0095
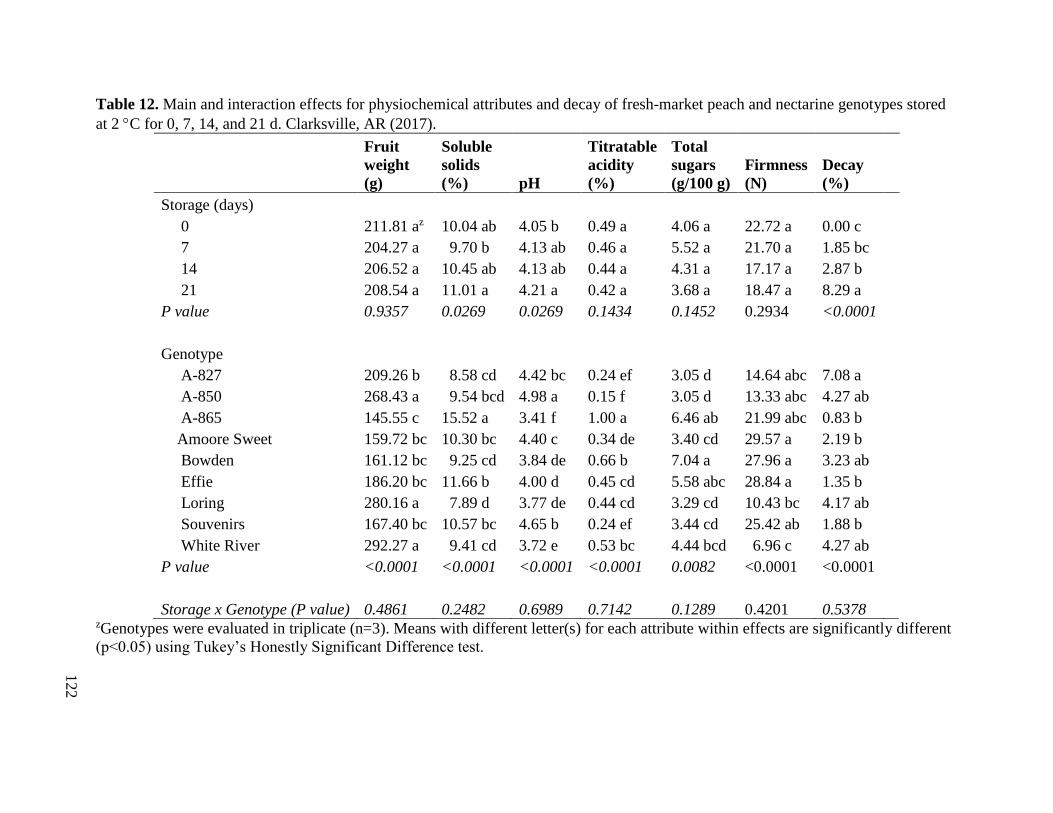
122
Table 12. Main and interaction effects for physiochemical attributes and decay of fresh-market peach and nectarine genotypes stored
at 2 C for 0, 7, 14, and 21 d. Clarksville, AR (2017).
Fruit
weight
(g)
Soluble
solids
(%) pH
Titratable
acidity
(%)
Total
sugars
(g/100 g)
Firmness
(N)
Decay
(%)
Storage (days)
0 211.81 az 10.04 ab 4.05 b 0.49 a 4.06 a 22.72 a 0.00 c
7 204.27 a 9.70 b 4.13 ab 0.46 a 5.52 a 21.70 a 1.85 bc
14 206.52 a 10.45 ab 4.13 ab 0.44 a 4.31 a 17.17 a 2.87 b
21 208.54 a 11.01 a 4.21 a 0.42 a 3.68 a 18.47 a 8.29 a
P value 0.9357 0.0269 0.0269 0.1434 0.1452 0.2934 <0.0001
Genotype
A-827 209.26 b 8.58 cd 4.42 bc 0.24 ef 3.05 d 14.64 abc 7.08 a
A-850 268.43 a 9.54 bcd 4.98 a 0.15 f 3.05 d 13.33 abc 4.27 ab
A-865 145.55 c 15.52 a 3.41 f 1.00 a 6.46 ab 21.99 abc 0.83 b
Amoore Sweet 159.72 bc 10.30 bc 4.40 c 0.34 de 3.40 cd 29.57 a 2.19 b
Bowden 161.12 bc 9.25 cd 3.84 de 0.66 b 7.04 a 27.96 a 3.23 ab
Effie 186.20 bc 11.66 b 4.00 d 0.45 cd 5.58 abc 28.84 a 1.35 b
Loring 280.16 a 7.89 d 3.77 de 0.44 cd 3.29 cd 10.43 bc 4.17 ab
Souvenirs 167.40 bc 10.57 bc 4.65 b 0.24 ef 3.44 cd 25.42 ab 1.88 b
White River 292.27 a 9.41 cd 3.72 e 0.53 bc 4.44 bcd 6.96 c 4.27 ab
P value <0.0001 <0.0001 <0.0001 <0.0001 0.0082 <0.0001 <0.0001
Storage x Genotype (P value) 0.4861 0.2482 0.6989 0.7142 0.1289 0.4201 0.5378 zGenotypes were evaluated in triplicate (n=3). Means with different letter(s) for each attribute within effects are significantly different
(p<0.05) using Tukey’s Honestly Significant Difference test.

123
Table 13. Main and interaction effects for color attributes of fresh-market peach and nectarine genotypes stored at 2 C for 0, 7, 14,
and 21 d. Clarksville, AR (2017)
L*
(skin)
Chroma
(skin)
Hue
(skin)
Chroma
(Flesh)
Hue
(Flesh)
Storage (days) 0 53.69 az 39.85 b 48.39 a 32.21 a 83.05 a
7 52.59 a 43.10 a 45.78 a 29.79 ab 87.16 a
14 52.17 a 42.53 ab 45.74 a 28.78 b 85.14 a
21 51.30 a 41.73 ab 41.95 a 26.19 c 87.14 a
P value 0.6841 0.0330 0.1525 <0.0001 0.3716
Genotype A-827 49.16 ab 46.16 b 46.34 abc 44.94 ab 86.00 bc
A-850 57.13 a 36.78 c 39.91 bc 12.94 f 101.27 a
A-865 55.54 a 35.67 c 47.52 abc 17.06 ef 86.56 bc
Amoore Sweet 52.52 a 52.65 a 52.35 ab 47.56 a 80.01 c
Bowden 57.25 a 38.21 c 54.49 a 24.24 d 96.39 ab
Effie 48.64 ab 39.84 c 39.71 bc 21.20 de 97.76 ab
Loring 55.48 a 48.58 ab 52.82 ab 41.51 b 76.31 cd
Souvenirs 42.33 b 40.13 c 37.32 c 36.27 c 79.41 cd
White River 53.88 a 38.20 c 38.72 c 17.46 e 66.87 d
P value <0.0001 <0.0001 <0.0001 <0.0001 <0.0001
Storage x Genotype (P value) 0.6270 0.4856 0.2783 0.1995 0.1274
zGenotypes were evaluated in triplicate (n=3). Means with different letter(s) for each attribute within effects are significantly different
(p<0.05) using Tukey’s Honestly Significant Difference test.

124
Figures
Fig. 1. Soluble solids/titratable acidity ratio for fresh-market peach and nectarine genotypes, Clarksville, AR (2017). Each standard
error bar is constructed using 1 standard error from the mean. Means with different letter(s) for each attribute are significantly
different (P < 0.05) using Tukey’s Honestly Significant Difference test.
a
bc
c
bc
c c c
bc
ab

125
Fig. 2. Effect of genotype on initial sugars (glucose and fructose) for fresh-market peach and nectarine genotypes, Clarksville, AR
(2017). Each standard error bar is constructed using 1 standard error from the mean. Means with different letter(s) for each attribute
are significantly different (P < 0.05) using Tukey’s Honestly Significant Difference test.
b b b b b
b
b b b
b b
b
ab
ab
ab
ab
a
a
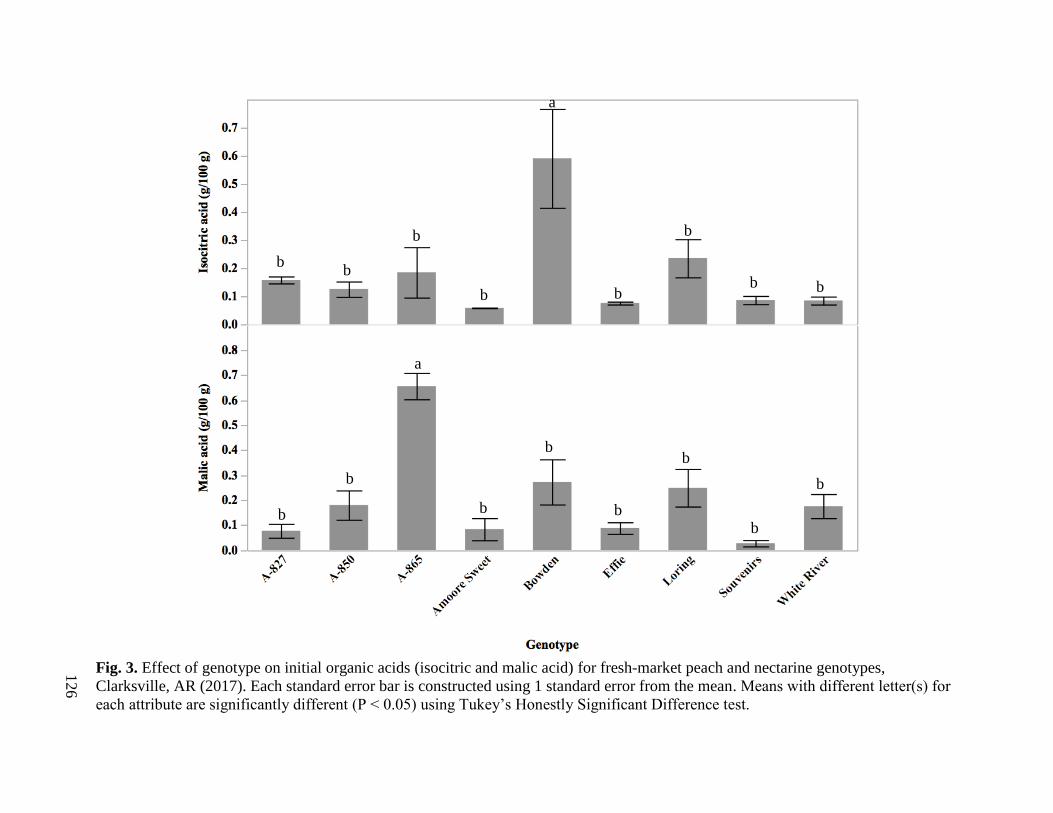
126
Fig. 3. Effect of genotype on initial organic acids (isocitric and malic acid) for fresh-market peach and nectarine genotypes,
Clarksville, AR (2017). Each standard error bar is constructed using 1 standard error from the mean. Means with different letter(s) for
each attribute are significantly different (P < 0.05) using Tukey’s Honestly Significant Difference test.
a
a
b b
b
b b
b
b b
b
b
b
b
b
b
b
b
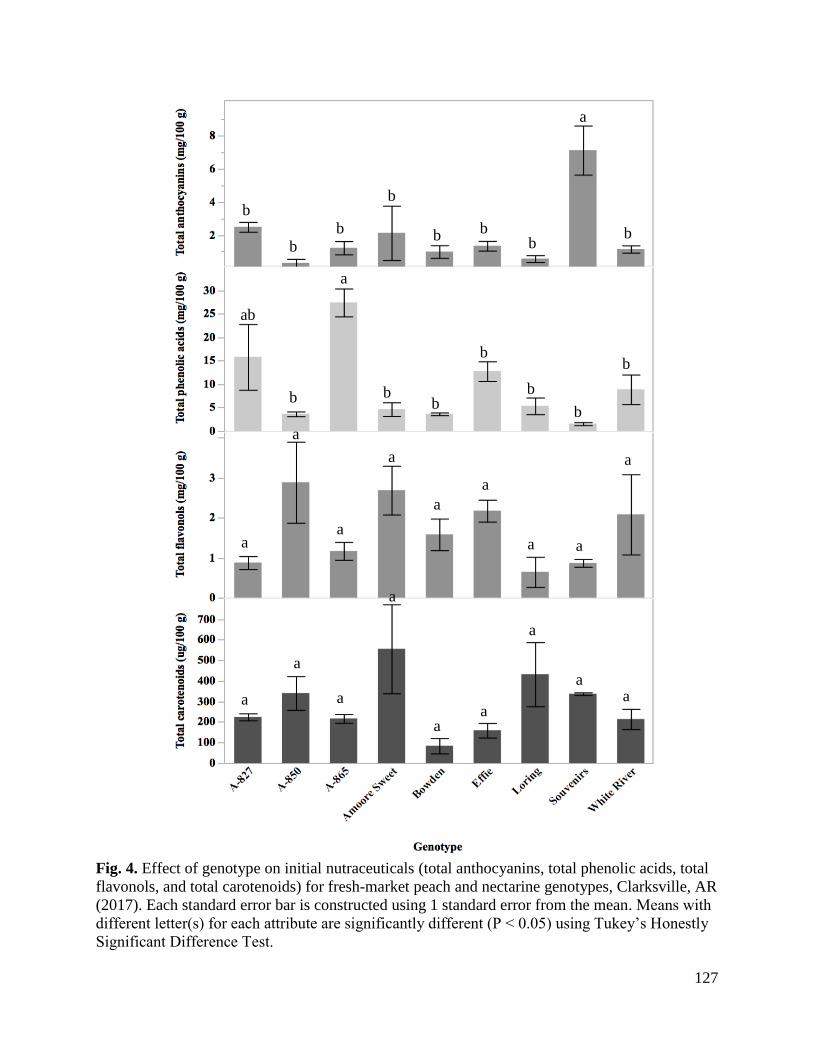
127
Fig. 4. Effect of genotype on initial nutraceuticals (total anthocyanins, total phenolic acids, total
flavonols, and total carotenoids) for fresh-market peach and nectarine genotypes, Clarksville, AR
(2017). Each standard error bar is constructed using 1 standard error from the mean. Means with
different letter(s) for each attribute are significantly different (P < 0.05) using Tukey’s Honestly
Significant Difference Test.
a
a
ab
a
a
a
a
a
a a
a
a a
a
a
a
a
a
a a
a
b b b
b
b
b
b
b b
b b
b
b
b
b
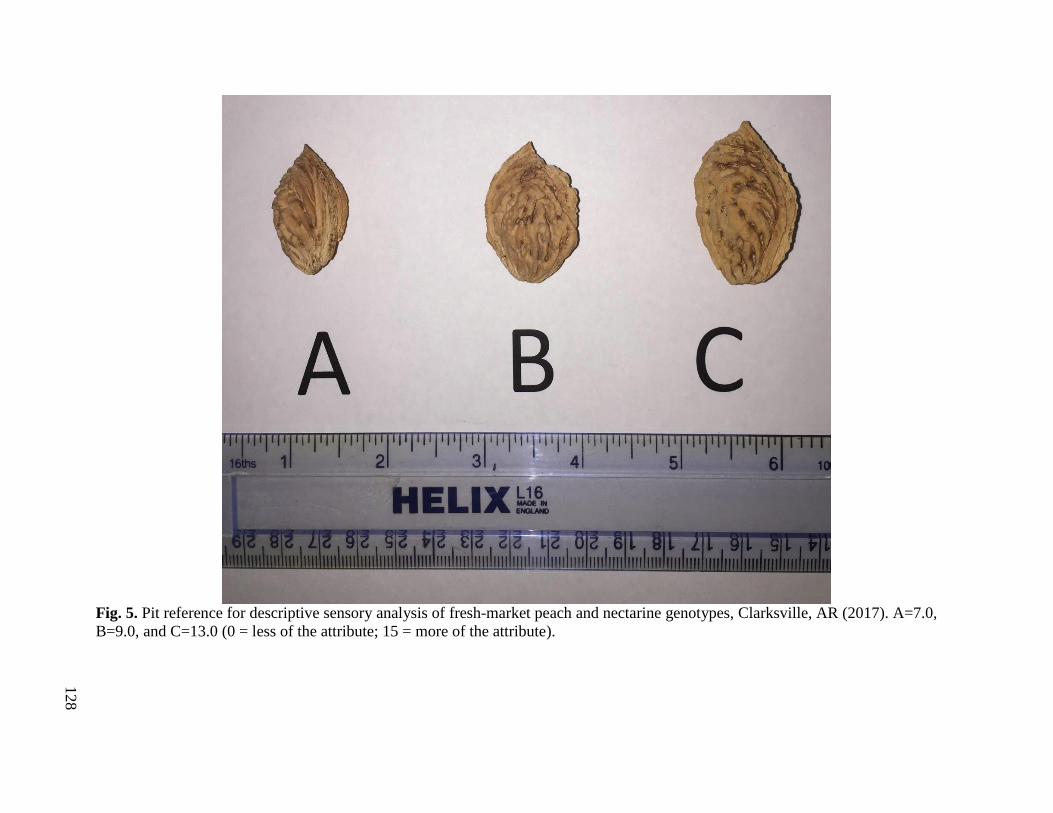
128
Fig. 5. Pit reference for descriptive sensory analysis of fresh-market peach and nectarine genotypes, Clarksville, AR (2017). A=7.0,
B=9.0, and C=13.0 (0 = less of the attribute; 15 = more of the attribute).

129
Fig. 6. Glucose, fructose, and total sugars for fresh-market peach and nectarine genotypes during postharvest storage at 2 C for 0, 7,
14, and 21 d, Clarksville, AR (2017). Each standard error bar is constructed using 1 standard error from the mean.
b b b ab
ab
ab
ab
ab a
a ab abc
bc bc bc bc c c
a ab abc
bcd
cd cd cd d d

130
Fig. 7. Malic acid and total organic acids for fresh-market peach and nectarine genotypes during postharvest storage at 2 C for 0, 7,
14, and 21 d, Clarksville, AR (2017). Each standard error bar is constructed using 1 standard error from the mean.
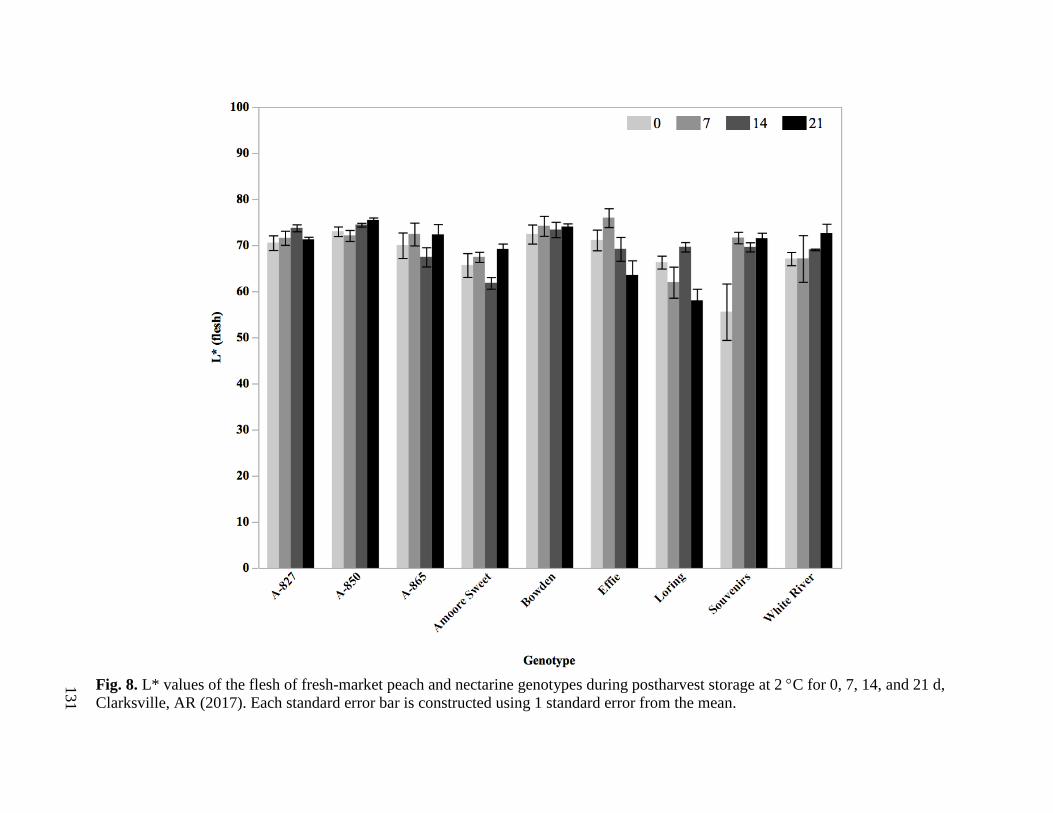
131
Fig. 8. L* values of the flesh of fresh-market peach and nectarine genotypes during postharvest storage at 2 C for 0, 7, 14, and 21 d,
Clarksville, AR (2017). Each standard error bar is constructed using 1 standard error from the mean.
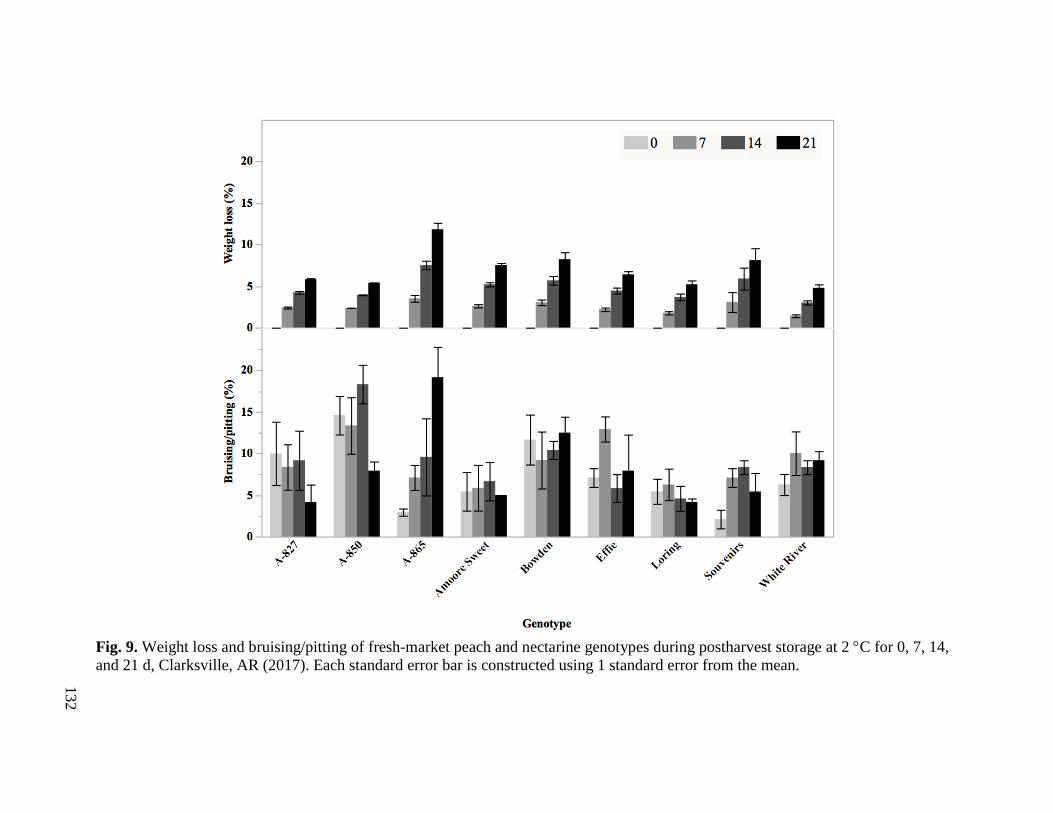
132
Fig. 9. Weight loss and bruising/pitting of fresh-market peach and nectarine genotypes during postharvest storage at 2 C for 0, 7, 14,
and 21 d, Clarksville, AR (2017). Each standard error bar is constructed using 1 standard error from the mean.

133
Fig. 10. Marketability attributes of fresh-market peach and nectarine genotypes after 21 d storage
at 2 C, Clarksville, AR (2017). Each standard error bar is constructed using 1 standard error
from the mean.
134
Chapter III
Physiochemical and Marketability Analysis of Traditional and High-Tunnel Grown
Arkansas Table Grapes for Fresh Market
Abstract
The marketability of table grapes (Vitis sp.) is dependent on the capacity of the fruit to
maintain quality before reaching the consumer. Table grapes grown in the southern region of the
United States are an extremely high input crop because of pest pressures in a humid climate
requiring high fungicide and insecticide inputs. The economic and environmental sustainability
of grape production could be improved in the southern region by producing grapes in protected
agriculture systems such as high tunnels (passively heated structures that physically protect
crops). Postharvest marketability of Arkansas table grapes from two production systems (high
tunnel and traditional) was evaluated. Six traditionally-grown table grape genotypes (‘Gratitude’,
‘Hope’, ‘Jupiter’, ‘Mars’, A-2497, and A-2755) were harvested from the Fruit Research Station,
Clarksville, AR, and four high-tunnel-grown table grape cultivars (Faith, Gratitude, Jupiter, and
Mars) were harvested from the Arkansas Agricultural Research and Extension Center,
Fayetteville. The fruit was hand-harvested into 0.9 kg vented clamshells in July-August, 2017.
Two to three clusters per clamshell were evaluated in triplicate for physiochemical and
marketability attributes. Nutraceuticals were evaluated at harvest (day 0). Physiochemical
attributes (berry and cluster weight, firmness, organic acids, sugars, and composition) and
marketability attributes in a clamshell (weight loss, decay, and berry drop) were evaluated during
storage (0, 7, 14, and 21 days) at 2 °C. At harvest, the ranges from both production systems
were, cluster weight (142.37-396.51 g), berry weight (2.18-5.65 g), soluble solids (12.00%-
17.30%), pH (3.13-3.71), titratable acidity (0.34%-0.65%), firmness (2.53-4.35 N), and skin
elasticity (3.18-9.03 mm). Total nutraceuticals evaluated at harvest were similar for both

135
production methods. During storage, glucose and fructose were present in a 1:1 ratio and tartaric
acid was the predominant acid for all genotypes and production methods. At 21 days of storage,
weight loss, berry drop, and decay were lowest and firmness and skin elasticity were highest in
fruit grown in a high tunnel as compared to traditionally-grown. ‘Jupiter’ and ‘Mars’ from the
high tunnel, and ‘Jupiter’ and A-2497 from the traditional vineyard had the best quality after 21
days storage. Additional growing protection, such as a high tunnel, may improve quality of the
fruit grown in Arkansas, especially with well-adapted genotypes such as ‘Jupiter’ and A-2497.
136
Introduction
Table Grapes (Vitis vinifera.) were first domesticated around 8000 BP in what is
currently known as Georgia and Turkey (This et al., 2006). Grapes were widely cultivated in the
Middle East and played a role in religion and culture, thus utilization of grapes spread rapidly
across the world (Fuller, 1996). In the Mediterranean, native people believed “the wine sprang
from the blood of humans who had fought the gods”, and many aspects of life revolved around
wine (Blanco, 1997; McGovern, 2003). The introduction of V. vinifera grapes to the United
States began with the arrival of European settlers in the 16th century where the grapes were
introduced as seeds then cuttings (Barber et al., 2007; Royer, 1988).
Throughout history, grapes have been eaten fresh and used for wine, juice, and raisins.
Grapes are one of the world’s most important fruit crops, and by total value of production were
the number one crop in the world with 67 million metric tons produced for a $70 billion value in
2014 (FAO, 2016). One of the most utilized table grape cultivars is ‘Thompson Seedless’ or
‘Sultana’ which originated in Asia as a raisin grape and was introduced to the United States in
1872 (Bioletti, 1919). With respect to table grapes, 24 million metric tons were produced
worldwide in 2014. The United States was the fifth largest producer behind China, India, Turkey,
and Egypt. In 2016, the United States produced 907,000 metric tons of fresh-market grapes
(table and raisin) of which 99.97% were used for table grapes (USDA, 2017). U.S. production of
table grapes was valued at $1.56 billion dollars in 2016, of which California is the largest U.S.
producer of over 99% of fresh-market grapes grown.
Known as one of the oldest grape-producing states in the southern United States,
Arkansas has a diverse industry for grapes and was ranked 12th in grape production with 9% of
the crops used for fresh-market consumption (Johnson et al., 2003). In 2015, grape production in
137
Arkansas was around 1,400 metric tons (USDA, 2015). In a state-wide survey by Alman (2016),
22% of Arkansas grape production was table grapes with the remainder used for wine or juice.
Traditional grape varieties (V. vinifera), new world species (V. rotundifolia Michx, V.
labruscana, and V. aestivalis), and hybrids are grown all over the United States. The table grape
breeding program at the University of Arkansas began in 1964 by Dr. James Moore and was
focused on fruit quality, seedlessness, large berry size, skin cracking resistance, adaptation to the
upper South and Midwest United States, non-slip fruit textures, an array of fruit flavors, and a
range of fruit shapes (Clark, 2002). Since the start of the program, 12 cultivars have been
released including: ‘Faith’, ‘Hope’, ‘Gratitude’, ‘Joy’, ‘Jupiter’, ‘Mars’, ‘Neptune’, ‘Saturn’,
‘Venus’, ‘Sunbelt’, ‘Reliance’, and ‘Compassion’. Prior to the program, limited table grape
cultivars for the Midwest, southern, and eastern states existed. Moore began the program with
this in mind as a means to expand production, and Dr. John Clark continued the program after
Moore retired. Clark (2010) defined the objective of table grape breeding as, a grape with
improved physical and eating quality, size, seedless, crispness, and having an edible skin. Many
unique shapes, aromas, and flavors have come from the crosses made in the program. As an
example, the maternal parent of the ‘Cotton Candy’ grape, a popular United States table grape,
released by International Fruit Genetics in 2011, came from an advanced selection from the
University of Arkansas (Vann, 2017).
Although traditional breeding has drastically improved table grape production in the
South, weather, disease, and pest pressures are still higher than more arid production regions
such as the San Joaquin Valley of California. High tunnels, or passively heated structures, have
been used as a way to extend the growing season and protect crops from weather and pests.
Previous research has shown that high tunnels can extend the growing season, increase yields,

138
and increase the marketability of fruit grown in tunnels (Bergefurd et al., 1999; Cavins et al.,
2000; Demchak, 2003; Kadir et al., 2006; Wittwer and Castilla, 1995). In an article published in
Wines and Vines, it was noted that high tunnel grape production had the potential to double
profits and provide an added barrier for frost/weather protection which minimized damage to the
vines (Carey, 2013).
Understanding the physiochemical and marketability attributes of Arkansas table grape
genotypes (cultivars and advanced selections) is important to demonstrate fresh-market potential.
The purpose of this study was to evaluate how the physiochemical and marketability attributes of
Arkansas table grapes, high tunnel and traditionally grown, were affected at harvest and during
postharvest storage.
139
Materials and Methods
Plants and culture
Two production systems for table grapes were evaluated at two vineyards in Arkansas,
Clarksville (traditional) and Fayetteville (high tunnel). The vines in each production system were
grown in research vineyards with an integrated pest management approach and a minimal spray
program. Vines received trickle irrigation as needed, and no cluster, shoot, or leaf removal
practices were implemented.
In the traditional vineyard, the table grape genotypes (‘Gratitude’, ‘Hope’, ‘Jupiter’,
‘Mars’, A-2497, and A-2755) evaluated were grown at the University of Arkansas Fruit
Research Station, Clarksville AR [west-central Arkansas, lat. 35◦31'58"N and long. 93◦24'12"W;
U.S. Dept of Agriculture (USDA) hardiness zone 7a; soil type Linker fine sandy loam (Typic
Hapludult)]. The vines were planted in various years, trained to a bi-lateral, high-cordon/curtain
training system, and pruned to three- to four-bud spurs annually. Vines were spaced 2.4 m and
rows 3.1 m. Weeds were controlled by applications of preemergence and postemergence
herbicides applied annually. Vines were fertilized annually in March or April with nitrogen or
complete fertilizers. Fungicides were applied similar to a commercial requirement to control
black rot (Guignardia bidwellii Viala & Ravaz), powdery mildew (Erysiphe necator Schw.
(syns. Uncinula necator (Schw.) Burr., E. tuckeri Berk., U. americana Howe, and U. spiralis
Berk. & Curt; anamorph Oidium tuckeri Berk.), downy mildew (Plasmopara viticola Berl. & de
Toni), and anthracnose (Elsinoë ampelina Shear). Insecticides were applied as needed to control
climbing cutworm (several species common including Agrotis ipsilon Hufnagel, Feltia jaculifera
Guenée, and Peridroma saucia Hübner) and grape berry moth (Paralobesia viteana Clemens).

140
The last application of fungicides was usually done near the end of June to early July. On
average, 16 sprays (including fungicide and insecticide) were applied to the grapes.
In the high tunnel vineyard, the four table grape cultivars (Faith, Gratitude, Jupiter, and
Mars) evaluated were grown at the Arkansas Agricultural Research and Extension Center,
Fayetteville AR [north-west Arkansas, lat. 36°6'7.8516'' N and long. 94°10'3.8316'' W; U.S. Dept
of Agriculture (USDA) hardiness zone 6b; soil type Captina silt loam. The vines were planted in
2014 under a 8 m x 61 m Quonset-style Haygrove Supper Solo Tunnel with 80 gram (1.0 x 0.6
mm) Tek-Knit exclusion netting (Tek-Knit Industries, Quebec, Canada). The vineyard in the
tunnel had three trellis systems, but grapes for this study were harvested from the Geneva Double
Curtain trellis in the center of the tunnel. The vines were trained to a bilateral cordon and pruned
using a balanced 30 + 10 pruning method annually. Vines were spaced 2.6 m. and 3.0 m between
rows. Fertilizer applications were based on soil and tissue analyses. On average, six sprays (four
fungicide and two insecticide) were applied to the grapes.
Harvest
The table grapes for both production methods were hand harvested in the early morning
prior to 11:00AM. The fruit was harvested from July to August at optimal ripeness and was free of
major blemishes, flaws, or damage (Table 1). The target soluble solids for the grapes at harvest
was ~16%, but fruit was harvested if soluble solids did not increase or fruit quality was
declining. About 10 kg of table grapes of each genotype at each location were harvested into
paper sacks and placed in ice chests chilled with ice packs. ‘Gratitude’, ‘Hope’, ‘Jupiter’, ‘Mars’,
A-2497, and A-2755 were harvested from the traditional vineyard in Clarksville, AR. ‘Faith’,
‘Gratitude’, ‘Jupiter’, and ‘Mars’ were harvested from the high-tunnel vineyard in in
Fayetteville, AR. After harvest the fruit was transported in an air-conditioned vehicle to the
141
University of Arkansas Department of Food Science, Fayetteville, AR. Samples were
randomized, and 2-4 clusters were placed in new 0.9 kg clamshells for each genotype and
replication. The grapes were evaluated for physiochemical and marketability attributes at day 0,
7, 14, and 21 at 2 °C (85% to 89% relative humidity).
Physiochemical analysis
Fruit for physiochemical analysis was done in triplicate per genotype. Each replicate was
a clamshell that contained 2-4 clusters. The physiochemical analysis included berry and cluster
weight, exterior berry color, composition, and berry firmness evaluated at 0, 7, 14, and 21 d at 2
C, and nutraceutical analysis was evaluated at day 0. A five-berry sample was used for berry
weight and firmness, 50 berries were used for composition, and 10 berries were used for
nutraceutical analysis.
Weight. Berry and cluster weight was measured on a digital scale (PA224 Analytic
Balance, Ohaus Corporation, Parsippany, NJ). Cluster weights were only evaluated at harvest.
Color. The exterior color of the berries was analyzed using a Konica Minolta CR-400
Chroma Meter (Konica Minolta Inc, Ramsey, NJ) on the end opposite from the stem scar. The
L*, chroma, and hue angle were evaluated. Color analysis was done to determine Commission
Internationale de l’Eclairage (CIE) Lab transmission values of L*=100, a*=0, and b*=0 (C.I.E.
1986). The CIELAB system describes color variations as perceived by the human eye. CIELAB
is a uniform three-dimensional space defined by colorimetric coordinates, L*, a*, and b*. The
vertical axis L* measures lightness from completely opaque (0) to completely transparent (100),
while on the hue-circle, +a* red, -a* green, +b* yellow, and -b* blue were measured. Hue angle,
calculated as arctan (b*/a*), described color in angles from 0 to 360°: 0° is red, 90° is yellow,
180° is green, 270° is blue, and 360° is red. Chroma, calculated as ((a*)2 + (b*)2)0.5, identified

142
color by which a sample appears to differ from gray of the same lightness and corresponds to
intensity of the perceived color.
Composition. The berries were frozen (-10 °C) then thawed for compositional analysis
(soluble solids, pH, titratable acidity, organic acids, and sugars). The 50 berry samples were
thawed and squeezed through cheese cloth to extract juice. The pH and titratable acidity were
measured using the Titrino plus 862 compact titrosampler (Metrohm AG, Herisan, Switzerland)
with the electrode standardized to pH 4.00, 7.00, and 10.00 buffers. Titratable acidity was
determined using ~6 g of juice diluted with 50 mL deionized, degassed water with a titration
using 0.1 N sodium hydroxide to an endpoint of pH 8.2. Titratable acidity was expressed as
percentage of tartaric acid. Soluble solids (expressed as percent) were measured using an Abbe
Mark II refractometer (Bausch and Lomb, Scientific Instrument, Keene, NH). Organic acids and
sugars of the fruit were determined using high performance liquid chromatography (HPLC). The
remaining juice from compositional analysis was filtered through a 0.45 μm nylon filter (VWR
International, Radnor, PA) and analyzed using HPLC. Glucose, fructose, isocitric acid, malic
acid, and tartaric acid of the fruit was measured using previously established HPLC procedures
(Walker et al., 2003; Segantini et. al., 2018). The HPLC was equipped with a Bio-Rad HPLC
Organic Acid Analysis Aminex HPX-87H ion exclusion column (300 × 7.8 mm), Bio-Rad
HPLC Fast Acid Analysis column (100 x 7.8 mm), and a Bio-Rad HPLC column for
fermentation monitoring (150 × 7.8 mm) in series (Bio-Rad, Hercules, CA). A Bio-Rad Micro-
Guard Cation-H refill cartridge (30 × 4.5 mm) was used for a guard column. Columns were
maintained at 65 °C by a temperature control unit. Mobile phase consisted of a pH 2.28 solution
of sulfuric acid and water with a resistivity of 18 M obtained from a Millipore Milli-Q reagent
water system. The sulfuric acid solution was used as the solvent with a 0.45 mL/min flow rate.

143
The solvent delivery system was a Waters 515 HPLC pump equipped with a Waters 717 plus
autosampler (Waters Corporation, Milford, MA). Injection volumes were 10 μL for all samples,
and run time for completion was 35 min. A Waters 410 differential refractometer to measure
refractive index was connected in series with a Waters 996 photodiode array detector monitored
the eluting compounds. Tartaric, isocitric and malic acid were detected by photodiode array at
210 nm, and glucose and fructose were detected by the differential refractometer. The peaks
were quantified using external standard calibration based on peak height estimation with baseline
integration. Individual sugars and acids were expressed as g/100 g, and total sugars (glucose +
fructose) and total organic acids (isocitric + malic + tartaric) were expressed as g/100 g.
Nutraceuticals. Total anthocyanins, total phenolic acids (hydroxycinnamic acids), total
ellagitannins, and total flavonols were measured by HPLC and ultraviolet-visible (UV-Vis)
spectroscopy, following methods described by Cho et al. (2004; 2005), and Hager et al. (2008).
The fruit was homogenized three times for 1 min in alternating washes of 80 ml of extraction
solution containing methanol/water/formic acid (60:37:3 v/v/v) and acetone/water/acetic
(70:29.5:0.5 v/v/v) to the smallest particle size using a Euro Turrax T18 Tissuemizer.
Homogenates were centrifuged for 5 min at 10,000 rpm and filtered. The samples were taken to a
final volume of 250 mL with extraction solvent and stored at -70 C until analysis. All samples
were passed through 0.45 μm nylon filters prior to HPLC analysis. Equivalents for the table
grape nutraceuticals were determined from previous literature for the most common compounds
for each class of phenolics (Gil et al., 2002; Mattivi et al., 2006; Ceccarelli et al., 2016;
Benmeziane et al., 2016). Total nutraceuticals were quantified as the sum (mg) of total
anthocyanins, total flavonols, total ellagitannins, and total phenolic acids per 100 g fresh fruit
weight.
144
Total anthocyanins and total phenolic acids. Sample extracts (7.5 mL) were dried using a
Speed Vac concentrator (ThermoSavant, Holbrook, NY) and resuspended in 1 mL of 5% formic
acid. The reconstituted samples were passed through 0.45-mm polytetrafluoroethylene (PTFE)
syringe filters (Varian Inc, Palo Alto, CA) before HPLC analysis. The anthocyanin analysis by
HPLC was performed based on previous methods (Cho et al., 2004; Hager et al., 2008). Samples
(50 μL) were analyzed using a Waters HPLC system equipped with a model 600 pump, a model
717 Plus autosampler and a model 996 photodiode array detector. Separation was carried out
using a 4.6 mm × 250 mm Symmetry® C18 column (Waters Corp, Milford, MA) preceded by a
3.9 mm × 20 mm Symmetry® C18 guard column. The mobile phase was a linear gradient of 5%
formic acid and methanol from 2% to 60% for 60 min at 1 ml/min. The system was equilibrated
for 20 min at the initial gradient prior to each injection. The anthocyanins peaks were quantified
at 510 nm with results expressed as milligrams malvidin-3-glucoside equivalents per 100 g fresh
fruit weight. The phenolic acid peaks were quantified at 320 nm with results expressed as
milligrams of chlorogenic acid equivalents per 100 g of fresh fruit weight.
Total ellagitannins and total flavonols. Sample extracts (3 mL) were dried using a Speed
Vac concentrator (ThermoSavant, Holbrook, NY) and resuspended in 1.0 mL of 50% methanol.
The reconstituted samples were passed through 0.45-mm PTFE syringe filters before HPLC
analysis. The ellagitannins and flavonols were analyzed according to previous methods (Hager et
al., 2008; 2010). The samples (50 μL) were then analyzed using a Waters HPLC system (Waters
Corp, Milford, MA) equipped with a model 600 pump, model 717 plus autosampler and model
996 photodiode array detector. Separation was carried out using a 4.6 mm × 250 mm Aqua®
C18 column (Phenomenex, Torrance, CA) preceded by a 3.9 mm × 20 mm Symmetry® C18
guard column. The mobile phase was a gradient of 20 g/L acetic acid (A) and 5 g/L acetic acid in
145
water and acetonitrile (50:50 v/v, B) from 10% B to 55% B in 50 min and from 55% B to 100%
B in 10 min. The system was equilibrated for 20 min at the initial gradient prior to each injection.
The ellagitannins were quantified at 255 nm with results expressed as milligrams of ellagic acid
equivalents per 100 g of fresh fruit weight. The flavonols were quantified at 360 nm with results
expressed as milligrams of quercetin-3-O-glucoside equivalents per 100 g of fresh fruit weight.
Firmness. Firmness was measured using a Stable Micro Systems TA.XT.plus Texture
Analyzer (Texture Technologies Corporation, Hamilton, MA). The berries were placed
horizontally on the plate and using the 2-mm-diameter probe, at a rate of 2 mm/s with a trigger
force of 0.02 N, the firmness and skin elasticity of the berries was measured. Firmness, the force
required to penetrate the fruit (skin and pulp), was measured in Newtons (N). Skin elasticity, the
distance traveled before the fruit was penetrated, was measured in millimeters (mm).
Marketability analysis
Marketability analysis was performed on fruit in triplicate clamshells for each genotype.
The marketability analysis included total decay, total berry drop, and weight loss evaluated at 0,
7, 14, and 21 d at 2 °C.
Decay and berry drop. The decay (visible mold or rot) and berry drop (dislodged berries
from the cluster) of the berries were calculated as (number of decayed or dropped berries/total
berries) × 100 and expressed as percent.
Weight loss. The weight loss of the clamshell was calculated as the weight decrease of
the total grapes in the clamshell expressed as percent.
Design and statistical analysis
After harvest, the fruit from each of the ten genotypes were completely randomized. The
fruit was stored at 2 °C for 0, 7, 14, and 21 d. Statistical analyses were conducted using JMP®

146
(version 13.2.0; SAS Institute, Cary, NC). A univariate analysis of variance (ANOVA) was used
to determine the significance of main factors (genotype and storage) and interactions. Tukey’s
Honestly Significant Difference (HSD) test was used to detect significant differences (p < 0.05)
among means and verify interactions at 95% significance level. Physiochemical and
marketability attributes were evaluated in triplicate.
Results and Discussion
At harvest, the table grapes from both production systems were within a commercially
acceptable range for cluster weight (142.37-396.51 g), berry weight (2.18-5.65 g), soluble solids
(12.00%-17.30%), pH (3.13-3.71), titratable acidity (0.34-0.65%), firmness (2.53-4.35 N), and
skin elasticity (3.18-9.03 mm) (data not shown). The genotypes were evaluated by production
method for physiochemical and nutraceutical attributes at harvest and physiochemical and
marketability attributes during postharvest storage.
High-tunnel grown table grapes
Four cultivars (Faith, Gratitude, Jupiter, and Mars) were evaluated at 0, 7, 14, and 21 d at
2 °C from the high tunnel (Tables 2 and 3). Cluster weight and nutraceuticals were evaluated
only at harvest. During storage, berry weight and weight loss had significant storage x cultivar
interactions, but soluble solids, pH, titratable acidity, L*, chroma, hue, firmness, skin elasticity,
total sugars, individual sugars, total organic acids, individual acids, berry drop, and decay did not
have significant interactions (Figs. 1-4 and Table 3).
At harvest, cluster weight (201.64-359.28 g) was not impacted by cultivar, but berry
weight (2.38-4.56 g) was. ‘Jupiter’ (4.56 g) had the highest berry weight, and ‘Gratitude’ (2.38
g) had the lowest (Table 2). At 21 d, ‘Jupiter’ (5.00 g) had the highest berry weight, and
‘Gratitude’ (2.93 g) and ‘Mars’ (2.61 g) had the lowest (Fig. 1). As the fruit was protected by the

147
high tunnel, size differences could be attributed to genotypic traits or plant age. In the release of
‘Jupiter’ and ‘Gratitude’ average berry weights observed were 5.50 g and 3.50 g, respectively
(Clark and Moore, 1999). ‘Gratitude’ and ‘Jupiter’ were noted to have average berry weights
larger than observed in this study. This could be attributed to vine crop load (Keller et al., 2005).
All of the berries grown in the high tunnel had lower berry weights than reported in their release
manuscript (Clark and Moore, 1999; 2013; Moore, 1985).
The table grapes at harvest had a composition of soluble solids (12.00%-17.30%), pH
(3.13-3.71), and titratable acidity (0.42%-0.65%). ‘Jupiter’ had the highest soluble solids and pH,
and lowest titratable acidity, whereas, ‘Gratitude’ had the lowest soluble solids and pH, and
highest titratable acidity (Table 2). Composition evaluated during storage (Table 3), showed that
‘Jupiter’ had the highest soluble solids (17.90%), pH (3.64), and lowest titratable acidity
(0.48%). ‘Gratitude’ had the lowest soluble solids (13.10%), pH (3.10), and highest titratable
acidity (0.60%). Storage did not impact soluble solids or titratable acidity, but did impact pH. At
day 21 the pH of the fruit was lower than day 0. Studies have shown that the ideal soluble
solids/titratable acidity ratio was 35-40 for ‘Crimson Seedless’ (Jayasena and Cameron, 2008).
‘Jupiter’ and ‘Gratitude’ in this study had soluble solids/titratable acidity ratios of 40 and 22,
respectively. ‘Gratitude’ was not in the ideal range for ratio.
The table grapes at harvest had total organic acids (tartaric, isocitric, and malic acid) of
0.27-0.51 g/100 g and total sugars (glucose and fructose) of 3.95-9.56 g/100 g. Individual
organic acids and sugars were evaluated at harvest; however, cultivar did not have an impact
(data not shown). During storage, individual sugars and organic acids, total sugars, and total
organic acids were evaluated. Total sugars and individual sugars were not impacted by cultivar
or storage. The average total sugars, glucose, and fructose were 8.38 g/100 g, 3.99 g/100 g, and
148
4.39 g/100 g, respectively. Glucose and fructose were present in a 1:1 ratio in all cultivars. At
harvest, the relationship between glucose and fructose has been observed to equilibrate, whereas,
in the early stages of ripening glucose is predominant (Muñoz-Robredo et al., 2011). Malic acid
was impacted by cultivar (Table 3), however total organic acids, isocitric acid, and tartaric acid
were not impacted by cultivar or storage. ‘Jupiter’ (0.11 g/100 g) had the most malic acid, and
‘Mars’ (0.03 g/100 g) had the least. The average total organic acids, tartaric acid, and isocitric
acid, were 0.52 g/100 g, 0.37 g/100 g, and 0.08 g/100 g, respectively. Tartaric was the
predominant acid in all genotypes. In a study by Muñoz-Robredo et al. (2011), tartaric acid was
the predominant acid at harvest followed by malic then isocitric acid. Isocitric acid was present
in the early stages of ripening and gradually depleted during maturation of the berries. The
organic acids and sugars found in this study were similar to values found by Liu et al. (2006),
Muñoz-Robredo et al. (2011), and Soyer et al. (2003).
Nutraceuticals (total anthocyanins, total phenolic acids, total ellagitannins, and total
flavonols) were evaluated only at harvest (day 0) with total nutraceuticals of 3.01-65.01 mg/100
g (Table 2). At harvest, total anthocyanins, total phenolic acids, and total flavonols were different
among the cultivars (Fig. 2), but there were no ellagitannins in these grapes. ‘Gratitude’, a green-
skinned cultivar, had the lowest level (≤3 mg/100 g) of total anthocyanins, total phenolics, total
flavonols, and total nutraceuticals as would be anticipated for a grape of this skin color. ‘Jupiter’,
a blue-skinned cultivar, (24.44 mg/100 g) had the most anthocyanins. There was no difference in
total anthocyanins when comparing the three blue-skinned cultivars (Faith, Jupiter, and Mars).
‘Mars’ had the most phenolic acids (39.37 mg/100 g), total flavonols (7.44 mg/100 g), and total
nutraceuticals (65.01 mg/100 g). These grapes are rich in flavonoids and have high nutraceutical
values. Consumption of fruit with high nutraceutical values has been linked to improved brain

149
function, decreased obesity and diabetes, prevent liver damage, reduce cardiovascular disease,
and act as an anti-cancer agent (Georgiev et al., 2014).
At harvest, L* chroma, and hue values were impacted by cultivar (Fig. 3). ‘Gratitude’ had
the highest L* (42.80) and chroma value (17.46), and lowest hue (116.82). ‘Jupiter’ had the
lowest L*(28.58), and chroma (3.10), and the highest hue (299.55) at harvest. ‘Jupiter’ was in the
blue to red range, and ‘Gratitude’ was in the yellow to green range. During storage, ‘Gratitude’
had the highest L* value (42.73), chroma (16.57), and lowest hue (116.76), while ‘Jupiter’ had
the lowest L* value (27.84), chroma (2.88), and highest hue (281.05) (Table 3). Storage did not
impact L* or hue, but did impact chroma. Grapes at day 14 and 21 had lower chroma values as
compared to day 0. This indicates a decreasing degree of colorfulness, as increasing chroma
value is positively related to colorfulness in the fruit during storage (International Commission
on Illumination, 1970). The decrease in chroma during the 21 d storage indicated the color
intensity of the berries decreased as the fruit began to senesce. However, L* and hue did not
change during storage, indicating significant browning did not occur.
The firmness attributes of the table grapes at harvest included firmness (3.03-4.35 N) and
skin elasticity (4.12-9.03 mm) (Table 2). ‘Mars’ had the highest firmness (4.35 N) and skin
elasticity (9.03 mm). ‘Jupiter’ had the lowest firmness (3.03 N), and ‘Gratitude’ had the lowest
skin elasticity (4.12 mm) at harvest. During storage, firmness was impacted by cultivars (Table
3). ‘Mars’ had the highest firmness (4.39 N) and skin elasticity (9.14 mm), and ‘Gratitude’ had
the lowest firmness (3.25 N) and skin elasticity (4.48 mm). Storage did not impact either texture
attribute. Increased crop densities have been positively correlated with increased berry firmness
as the berries are smaller and less mature (Leão and Lima, 2017).
150
Marketability attributes (weight loss, berry drop, and decay) were evaluated during
storage (Table 3). There was a significant storage x cultivar interaction for weight loss (Fig. 4).
Weight loss increased in each cultivar during storage, but was low (< 4%). At 21 d, ‘Faith’ had
the most weight loss, and ‘Mars’ and ‘Jupiter’ had the least. During storage ‘Faith’ had the most
berry drop (2.65%) and decay (3.36%), and ‘Mars’ had the least berry drop (0.00%) and decay
(0.05%) (Table 3). Storage did not impact berry drop or decay. Overall, decay was low (<3.5%).
Previous studies indicated high tunnels decreased the presence of gray mold in small fruits such
as strawberries by reducing the moisture from rain on the plant (Burlakoti et al., 2013). This
form of protection by the high tunnel could have contributed to the low overall decay of the
grapes.
Traditionally grown table grapes
Four University of Arkansas cultivars (Gratitude, Hope, Jupiter, and Mars) and two
advanced selections (A-2497 and A-2755) were harvested and evaluated at 0, 7, 14, and 21 d at 2
°C (Tables 2 and 3). Cluster weight and nutraceuticals were evaluated only at harvest. During
storage, berry weight, soluble solids, pH, titratable acidity, L*, chroma, hue, firmness, and
weight loss had significant storage x genotype interactions. However, skin elasticity, total sugars,
individual sugars, total organic acids, individual organic acids, berry drop, and decay did not
have significant interactions (Table 4).
At harvest, the grapes had cluster weights of 142.37-433.74 g and berry weights of 3.29-
4.91 g (Table 2). ‘Mars’ (4.91 g) had the highest berry weight, and ‘Gratitude’ (3.29 g) the
lowest. At harvest, there was no difference among the genotypes for cluster weight. During
storage, there was a significant storage x genotype interaction for berry weight (Fig. 5). At 21 d,
A-2755 (6.69 g) had the highest berry weight, and ‘Gratitude’ (3.38 g) had the lowest. During

151
storage A-2755 had a significantly higher berry weight on day 21 as compared to 0 d.
Commercial berry weight of table grapes can be controlled with growth regulators, such as
gibberellic acid. In an experiment on ‘Thompson Seedless’ table grapes, the berry weight of
control fruit (untreated) was 3.55 g, and the berry weight of vines sprayed with gibberellic acid
was 4.01 g (Abu-Zahra, 2010).
The soluble solids (12.50%-16.10%), pH (3.26-3.82), and titratable acidity (0.34%-
0.53%) of these table grapes were evaluated at harvest. At harvest, ‘Gratitude’ had the lowest
soluble solids and pH, ‘Hope’ had the highest soluble solids, A-2497 had the lowest titratable
acidity, and ‘Gratitude’ and ‘Jupiter’ had the highest titratable acidity (Table 2). Composition
(soluble solids, pH, and titratable acidity) during storage had significant storage x genotype
interactions (Fig. 6). At 21 d, there was no significant change in soluble solids or titratable
acidity within a genotype, compared to 0 d. A-2497 had a significantly lower pH at 21 d
compared to 0 d, however, all other genotypes had no significant change during storage.
Total sugars, individual sugars, total organic acids and individual organic acids were not
impacted by genotype at harvest. At harvest, the average total sugars and total organic acids were
7.62 g/100g and 0.51 g/100 g, respectively (Table 2). Total sugars, glucose, and fructose were
evaluated during storage and neither storage nor genotype had a significant impact. As
previously mentioned, glucose and fructose were present in a 1:1 ratio in these six genotypes.
The average total sugars, glucose, and fructose were 7.73 g/100 g, 3.77 g/100 g, and 3.99 g/100
g, respectively. Total organic acids and tartaric acid were not impacted by genotype or storage,
however, isocitric acid and malic acid were impacted by genotype. The average total organic
acids and tartaric acid were 0.50 g/100 g, and 0.31 g/100 g, respectively. Tartaric acid was the
predominant acid in all genotypes. ‘Mars’ (0.10 g/100 g) had the highest isocitric acid, and A-
152
2497 and ‘Hope’ (0.07 g/100 g) the least. ‘Jupiter’ (0.20 g/100 g) had the most malic acid, and
A-2497 (0.06 g/100 g) had the least. Storage did not impact isocitric acid or malic acid. The
organic acids and sugars found in this study were similar to studies done by Liu et al. (2006),
Muñoz-Robredo et al. (2011), and Soyer et al. (2003).
Nutraceuticals (total anthocyanins, total phenolic acids, total ellagitannins, and total
flavonols) were evaluated only at harvest (day 0). There were no ellagitannins in the fruit, similar
to the fruit grown in the high tunnel (Fig. 7). At harvest, the table grapes had total nutraceuticals
of 3.96-64.61 mg/100 g (Table 2). ‘Mars’ had the highest total nutraceuticals (64.61 mg/100 g),
and ‘Gratitude’ had the least (3.96 mg/100 g). Total anthocyanins, total phenolic acids, total
flavonols, and total nutraceuticals were different among the genotypes. A-2755 (34.13 mg/100 g)
had the most anthocyanins and A-2497, ‘Gratitude’, and ‘Hope’ (0.00 mg/100 g) the least. When
comparing the three blue-skinned genotypes (A-2755, Jupiter, and Mars), A-2755 and ‘Mars’
had higher total anthocyanins than ‘Jupiter’. ‘Mars’ had the most phenolic acids (26.90 mg/100
g) and A-2755 (1.38 mg/100 g) the least. A-2755 had the most flavonols (8.58 mg/100 g) and
‘Gratitude’ (0.48 mg/100 g) the least. As seen in this study, blue grapes have anthocyanins,
which greatly increase the total nutraceuticals of the berries.
At harvest, L*, chroma, and hue were impacted by genotype (Fig. 8). ‘Hope’ and ‘Mars’
had the highest L* values, 40.55 and 39.27, respectively and the highest chroma values, 15.27
and 13.75, respectively. A-2755 and ‘Gratitude’ had the highest hue, 311.83 and 257.39,
respectively at harvest. During storage L*, chroma, and hue had significant storage x genotype
interactions (Fig. 9). ‘Hope’ and ‘Mars’ had the highest L* value during all storage days. ‘Rolle
et al. (2013) found similar L* values for colored table grapes ranging from 25.68-28.57. A-2755
and ‘Gratitude’ had the highest mean hue values across all storage days. At 21 d, there was no
153
significant change in L*, chroma, or hue, within a genotype, as compared to 0 d. Careño et al.
(1995) found that the relationship between these color values is appropriate for defining
optimum color of red grapes known as the color index for red grape (CIRG). A CIRG value of
>5 was identified as optimum for red table grape, but was not observed at harvest in any of the
genotypes in this study.
At harvest, the table grapes had firmness of 2.53-4.21 N and skin elasticity of 3.18-7.03
mm (Table 2). ‘Gratitude’ had the lowest firmness and skin elasticity, and ‘Mars’ had the highest
firmness, and A-2497 at the highest skin elasticity at harvest. Texture attributes were evaluated
during storage, and there was a significant storage x genotype interaction for firmness, but not
skin elasticity (Fig. 10). ‘Mars’ had the highest firmness at harvest (4.21 N) and after 21 d (3.72
N), and ‘Gratitude’ had the lowest at harvest (2.53 N) and after 21 d (2.46 N). Storage did not
impact skin elasticity, but genotype had an impact. A relationship between the firmness and skin
elasticity has been used to describe berry firmness, but limited work on the relationship between
instrumental and sensory texture attributes have been performed to correlate ideal texture
analysis methods and properties (Rolle et al., 2011). However, it has been shown that consumers
tend to prefer firmer grape berries. Flesh hardness of grapes has been defined as soft to very firm
where 0.074-0.391 N/mm, firmness divided by skin elasticity, is the established descriptor
(Giacosa et al., 2014). ‘Gratitude’ and ‘Mars’ from this study at harvest would be classified as
extremely firm with values of 0.79 N/mm and 0.80 N/mm, respectively.
Marketability attributes (weight loss, berry drop, and decay) were evaluated during
storage (Table 4 and Fig. 11). There was a significant storage x genotype interaction for weight
loss, but not for berry drop or decay (Fig. 11). Weight loss was low (< 4.5%) but did increase
during storage. At 21 d, A-2755 had the most weight loss, and ‘Jupiter’ had the least. Clamshells

154
or covered packages with lids have been shown to control weight loss in Arkansas cultivars
which likely attributed to the low weight loss in this study (Perkins-Veazie et al., 1992). A-2755
had the most berry drop (8.89%), and ‘Gratitude’ (2.29%) the least. Genotype did not impact
decay. Berry drop and decay were higher on 21 d as compared to 0 d. Decay in vineyards, which
is predominantly caused by Botrytis cinerea, or gray mold, is regularly controlled by fungicides,
sulfur dioxide, biocontrol agents, or antimicrobials such as essential oils (Romanazzi et al.,
2012). However, no control was used on the grapes in this study to quantify the resistance of the
plant. Overall, decay was low (<3.5%) for the genotypes in this study.
Marketability and texture of table grapes at 21 d storage
At 21 d storage at 2 C, the marketability attributes (weight loss, berry drop, and decay),
and texture attributes (firmness and skin elasticity) of the table grape genotypes were apparent in
both production methods (Figs. 12 and 13). There was no difference in either production method
for decay or berry drop for the table grapes evaluated, but there were differences in weight loss,
firmness and skin elasticity. In a commercial setting, fruit that is resistant to weight loss, berry
drop, and decay and retains good texture during storage is preferable because higher quality fruit
would reach the consumer and earn a higher price at market. In the high-tunnel grown vineyard,
‘Jupiter’ and ‘Mars’ had the lowest weight loss, ‘Mars’ had the highest firmness and skin
elasticity (Fig. 12). In the traditionally-grown vineyard, A-2755 had the greatest weight loss,
‘Gratitude’ had the lowest, firmness and skin elasticity, ‘Jupiter’ had the lowest weight loss,
‘Mars’ had the highest firmness, and A-2497 had the highest skin elasticity (Table 13).
Comparisons of the two production methods showed that the fruit grown in a high tunnel
performed better than the fruit traditionally-grown (Fig. 14). Weight loss, berry drop, and decay
were lowest and firmness and skin elasticity were highest in fruit grown in a high tunnel. High
155
tunnels with blackberries have been shown to improve marketability by increasing yield,
reducing disease, and improving quality (Demchak, 2009), which is evident in the lower decay
of the grape clusters grown in the high tunnel. Although these grapes were grown in different
locations, this research demonstrates a general comparison of the two production methods. Fruit
grown in a high tunnel was of higher quality than traditionally-grown fruit.
Conclusion
Analysis of the physiochemical and marketability attributes at harvest and during
postharvest storage at 2 C, indicated that genotype had the most impact on the quality of
Arkansas table grapes regardless of production method. Many of the attributes varied by
genotype, but berry color (blue versus green) also played a key role in analytically measured
berry color and nutraceutical content. At harvest, the fruit from both production methods had
similar size, composition, nutraceutical content, and texture.
Production method did not have a significant impact on physiochemical attributes, but
had a greater impact on marketability attributes of these Arkansas table grapes for fresh market.
While grapes from both production methods performed well during storage with respect to
physiochemical attributes, the high tunnel table grape cultivars had better marketability attributes
than the traditionally-grown table grapes. The high tunnel cultivars had a low degree of decay
and berry drop in the clamshell. The marketability attributes of the traditionally-grown table
grapes were more negatively impacted during storage as demonstrated by greater decay and
berry drop.
‘Jupiter’, regardless of production method, had the low weight loss and decay, and high
firmness during storage. Additionally, ‘Mars’ grown in the high tunnel and A-2497 grown in the
traditional vineyard had good marketability and texture during storage. This study demonstrated

156
that high tunnel production could lead to better marketability and quality in fresh-market table
grapes. If genotypes, such as ‘Jupiter’ and A-2497, have good performance in the traditional
vineyard in Arkansas, then growing these genotypes in a high tunnel may provide additional
improvement on the quality of the fruit. This study demonstrates the potential for a table grape
industry in Arkansas.

157
Literature Cited
Abu-Zahra, T.R. 2010. Berry size of ‘Thompson Seedless’ as influenced by the application of
gibberellic acid and cane girdling. Pak. J. Bot. 42:1755-1760.
Alman, S. 2016. Arkansas grape industry assessment: a summery and report. Univ. Ark.,
Fayetteville, M.S. Thesis. 1-30.
Barber, N., L. Hutchins, and T. Dodd. 2007. A history of the American wine industry. Texas
Tech University Technical Report.
Bergefurd, B.R., D. Funt, T. Harker, C. Welch, and L. Miller. 1999. Evaluation of high tunnel
strawberry production for southern Ohio. http://www.ag. Ohio-state.edu/~prec/hort/data/
hiberr99.html.
Bioletti, F.T. 1919. The seedless raisin grapes. J. Pomol. Hort. Sci. 1:23-27.
Blanco, J.L., 1997. La plus vieille histoire du vin. L’Histoire du vin, une histoire de rites 31-41.
Burlakoti, R.R., J. Zandstra, and K. Jackson. 2013. Comparison of epidemiology of gray mold,
anthracnose fruit rot, and powdery mildew in day-neutral strawberries in field and high-
tunnel conditions in Ontario. Intl. J. Fruit Sci. 13:19-27.
Carreño, J., A. Martinez, L. Almela, and J.A. Fernández-López. 1995. Proposal of an index for
the objective evaluation of the colour of red table grapes. Food Res.Intl. 28:373-377.
Carey, R., 2013. Commercial establishment of high tunnels. Wines and Vines
https://www.winesandvines.com/features/article/113932/Commercial-Establishment-of-
High-Tunnels.
Cavins, T., J. Dole, and V. Stamback. 2000. Unheated and minimally heated winter greenhouse
production of specialty cut flowers. HortTechnology 10:793–799.
Ceccarelli, D., A. Simeone, P. Nota, M. Piazza, C. Fideghelli, and E. Caboni. 2016. Phenolic
compounds (hydroxycinnamic acids, flavan-3-ols, flavonols) profile in fruit of Italian
peach varieties, Plant Biosystems 150:1370-1375.
Cho, M.J., L.R. Howard, R.L Prior, and J.R. Clark. 2004. Flavonoid glycosides and antioxidant
capacity of various blackberry, blueberry, and red grape genotypes determined by high-
performance liquid chromatography/ mass spectrometry. J. Food Sci. and Agr. 84:1771-
1782.
Cho, M.J., L.R. Howard, R.L. Prior, and J.R. Clark. 2005. Flavonol glycosides and antioxidant
capacity of various blackberry and blueberry genotypes determined by high‐performance
liquid chromatography/mass spectrometry. J. Sci. Food. Agr. 85:2149‐2158.

158
CIE et a la CEI edn, Bureau central de la CIE, Paris.C.I.E. 1986. Colorimetry. 15.2. 2d ed.
Commission Internationale de l’Eclairage, Vienna.
Clark, J.R. and J.N. Moore. 1999. ‘Jupiter' seedless grape. HortScience 34:1297-1299.
Clark, J.R. 2002. Grape breeding at the University of Arkansas: approaching forty years of
progress. Acta Hort. 603:357-360 (Abstr).
Clark, J. 2010. Eastern United States table grape breeding. J. Amer. Pomol. Soc. 64:72-77.
Clark, J.R. and J.N. Moore. 2013. ‘Faith’, ‘Gratitude’, ‘Hope’, and ‘Joy’ seedless table
Grapes. HortScience 48:913-919.
Demchak, K. 2003. High tunnel production of primocane-bearing raspberries. http://www.hort.
cornell.edu/extension/commercial/fruit/Berries/hightunnels.htm.
Demchak, K. 2009. Small fruit production in high tunnels. HortTechnology 19:44-49.
Food and Agricultural Organization of the United Nations (FAO). 2016. Table and dried grapes.
http://www.oiv.int/public/medias/5116/booklet-fao-oiv-grapes-focus.pdf
Fuller, R.C. 1996. Religion and wine: A cultural history of wine drinking in the United States.
Univ. of Tennessee Press. Knoxville, TN.
Georgiev, V., A. Ananga, and V. Tsolova. 2014. Recent advances and uses of grape flavonoids
as nutraceuticals. Nutrients 6:391-415.
Giacosa, S., F. Torchio, S.R. Segade, M. Giust, D. Tomasi, V. Gerbi, and L. Rolle. 2014.
Selection of a mechanical property for flesh firmness of table grapes in accordance with
OIV ampelographic descriptor. Amer. J. Enol. Viticult. 65:206-210.
Gil, M., F. Tomas-Barberan, B. Hess-Pierce, and A.A Kader. 2002. Antioxidant capacities,
phenolic compounds, carotenoids, and vitamin C contents of nectarine, peach, and plum
cultivars from California. J. Agr. Food Chem. 50(:4976-4982.
Hager, T., R. Prior, and L. Howard. 2008. Processing and storage effects on monomeric
anthocyanins, percent polymeric color, and antioxidant capacity of processed blackberry
products. J. Agr. Food Chem. 56:689–695.
Hager, T., R. Prior, and L. Howard. 2010. Processing and storage effects on the ellagitannins
composition of processed blackberry products. J. Agr. Food Chem. 58:11749-11754.
International Commission on Illumination and International Electrotechnical Commission 1970,
Vocabulaire international de l'eclairage: Intl. Lighting Vocabulary. 3.
159
Jayasena, V. and I. Cameron. 2008. Brix/acid ratio as a predictor of consumer acceptability of
Crimson Seedless table grapes. J. Food Quality 31:736-750.
Kadir, S., E. Carey, and S. Ennahli, S., 2006. Influence of high tunnel and field conditions on
strawberry growth and development. HortScience 41:329-335.
Keller, M., L.J. Mills, R.L. Wample, and S.E. Spayd. 2005. Cluster thinning effects on three
deficit-irrigated Vitis vinifera cultivars. Amer. J. Enol. Viticult. 56:91-103.
Leão, P.C.D.S. and M.A.C. Lima. 2017. Effect of shoot and bunch density on yield and quality
of ‘Sugraone’ and ‘Thompson Seedless’ table grapes. Revista Brasileira de Fruticultura
39:1-10.
Liu, H.F., B.H. Wu, P.G. Fan, S.H. Li, and L.S. Li. 2006. Sugar and acid concentrations in 98
grape cultivars analyzed by principal component analysis. J. Sci. Food Agr. 86:1526-
1536.
Mattivi, F., R. Guzzon, U. Vrhovsek, M. Stefanini, and R. Velasco. 2006. Metabolite profiling of
grape: flavonols and anthocyanins. J. Agr. Food Chem. 54:7692-7702.
McGovern, P.E., 2003. Ancient wine: the search for the origins of viniculture. Princeton
University Press. Woodstock, Oxfordshire
Moore, J.N., 1985. 'Mars' seedless grape. HortScience 20:313
Muñoz-Robredo, P., P. Robledo, D. Manríquez, R. Molina, and B.G Defilippi. 2011.
Characterization of sugars and organic acids in commercial varieties of table
grapes. Chilean J. Agr. Res. 71:452.
Perkins-Veazie, P.M., J.K. Collins, J. Lloyd, and R.K. Striegler. 1992. Influence of package on
post-harvest quality of Oklahoma and Arkansas table grapes. Amer. J. Enol. Viticult.
43:79-82.
Rolle, L., R. Siret, S.R. Segade, C. Maury, V. Gerbi, and F. Jourjon. 2011. Instrumental texture
analysis parameters as markers of table-grape and winegrape quality: A review. Amer. J.
Enol. Viticult. 1-49
Rolle, L., S. Giacosa, V. Gerbi, M. Bertolino, and V. Novello. 2013. Varietal comparison of the
chemical, physical, and mechanical properties of five colored table grapes. Intl. J. Food
Properties 16:598-612.
Romanazzi, G., Lichter, A., Gabler, F.M. and Smilanick, J.L., 2012. Recent advances on the use
of natural and safe alternatives to conventional methods to control postharvest gray mold
of table grapes. Postharvest Biol. Technol. 63:141-147.
Royer, C., 1988. Mouvement historiques de la vigne dans le monde. La Vigne et le Vin 15-25.

160
Segantini, D.M., R.T Threlfall, J.R. Clark, L.R. Howard, and C.R. Brownmiller. 2018,
Physiochemical changes in floricane and primocane blackberries harvested from primocane
genotypes, HortScience 53:9-15.
Soyer, Y., N. Koca, and F. Karadeniz. 2003. Organic acid profile of Turkish white grapes and
grape juices. J. Food Composition Analysis 16:629-636.
This, P., T. Lacombe, and M.R. Thomas. 2006. Historical origins and genetic diversity of wine
grapes. Trends in Genetics. 22:511-519
U.S. Department of Agriculture (USDA). 2015. Arkansas Fruit Production Report. U.S. Dept.
Agr., Washington, D.C.
U.S. Department of Agriculture (USDA). 2017. National agricultural statistics service, Grapes.
U.S. Dept. Agr., Washington, D.C. 55-60
https://www.nass.usda.gov/Statistics_by_Subject/index.php?sector=CROPS.
Vann, G. 2017. Distinguished professor’s program bears fruit. The Arkansas Traveler. Univ.
Ark. http://www.uatrav.com/the_companion/article_c76a20f2-1409-11e7-acaf-
4f51ba4641ee.html
Walker, T., J. Morris, R. Threlfall, and G. Main. 2003. Analysis of wine components in
Cynthiana and Syrah wines. J. Agri. Food Chem. 51:1543-1547.
Wittwer, S. and N. Castilla. 1995. Protected cultivation of horticultural crops worldwide.
HortTechnology 5:6-23.
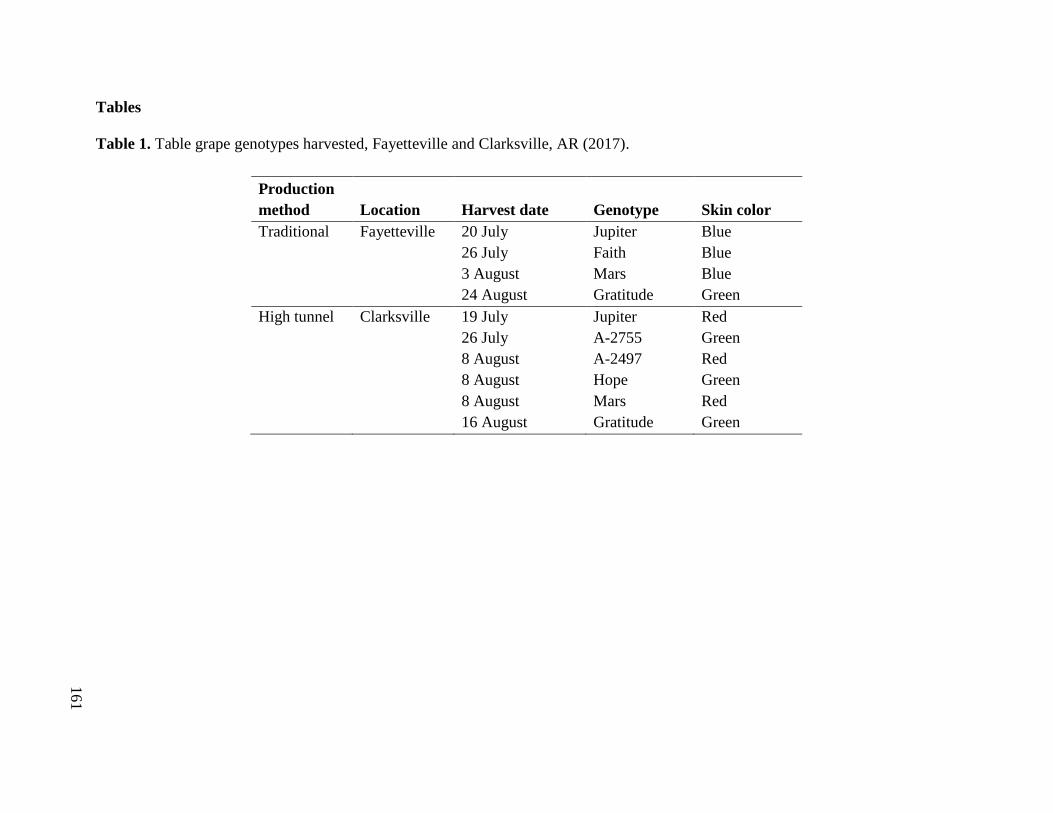
161
Tables
Table 1. Table grape genotypes harvested, Fayetteville and Clarksville, AR (2017).
Production
method Location Harvest date Genotype Skin color
Traditional Fayetteville 20 July Jupiter Blue
26 July Faith Blue
3 August Mars Blue
24 August Gratitude Green
High tunnel Clarksville 19 July Jupiter Red
26 July A-2755 Green
8 August A-2497 Red
8 August Hope Green
8 August Mars Red
16 August Gratitude Green
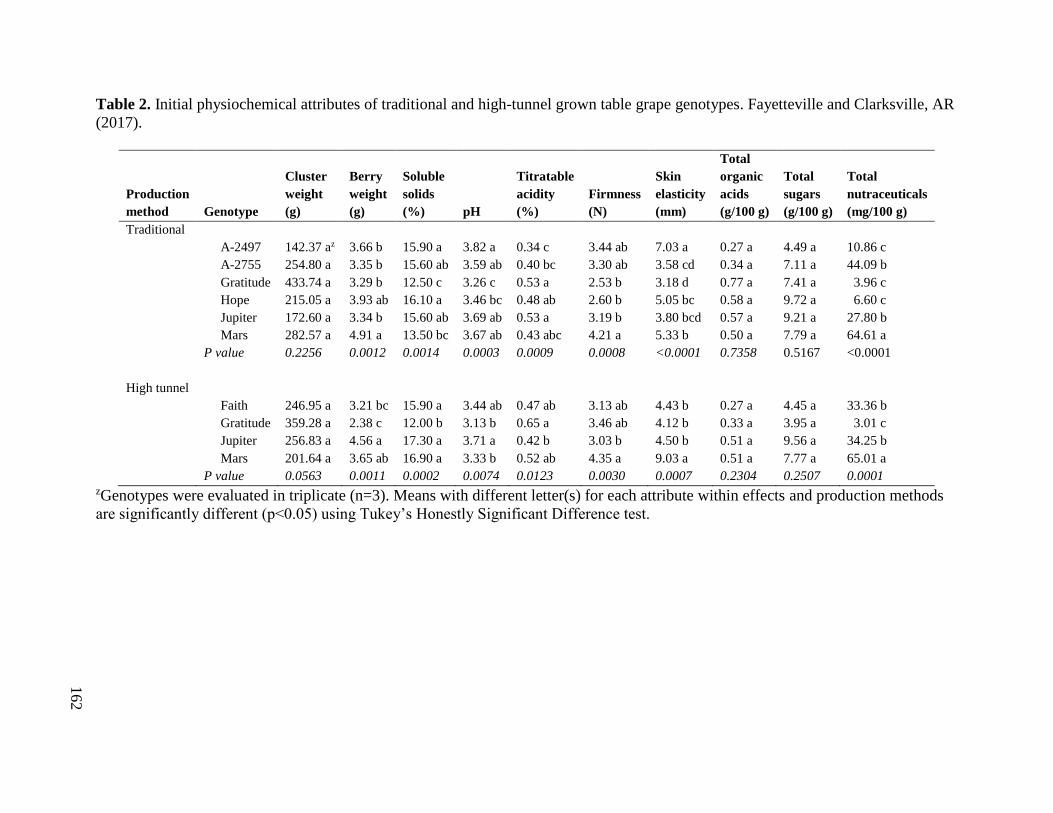
162
Table 2. Initial physiochemical attributes of traditional and high-tunnel grown table grape genotypes. Fayetteville and Clarksville, AR
(2017).
Production
method Genotype
Cluster
weight
(g)
Berry
weight
(g)
Soluble
solids
(%) pH
Titratable
acidity
(%)
Firmness
(N)
Skin
elasticity
(mm)
Total
organic
acids
(g/100 g)
Total
sugars
(g/100 g)
Total
nutraceuticals
(mg/100 g)
Traditional
A-2497 142.37 az 3.66 b 15.90 a 3.82 a 0.34 c 3.44 ab 7.03 a 0.27 a 4.49 a 10.86 c
A-2755 254.80 a 3.35 b 15.60 ab 3.59 ab 0.40 bc 3.30 ab 3.58 cd 0.34 a 7.11 a 44.09 b
Gratitude 433.74 a 3.29 b 12.50 c 3.26 c 0.53 a 2.53 b 3.18 d 0.77 a 7.41 a 3.96 c
Hope 215.05 a 3.93 ab 16.10 a 3.46 bc 0.48 ab 2.60 b 5.05 bc 0.58 a 9.72 a 6.60 c
Jupiter 172.60 a 3.34 b 15.60 ab 3.69 ab 0.53 a 3.19 b 3.80 bcd 0.57 a 9.21 a 27.80 b
Mars 282.57 a 4.91 a 13.50 bc 3.67 ab 0.43 abc 4.21 a 5.33 b 0.50 a 7.79 a 64.61 a
P value 0.2256 0.0012 0.0014 0.0003 0.0009 0.0008 <0.0001 0.7358 0.5167 <0.0001
High tunnel
Faith 246.95 a 3.21 bc 15.90 a 3.44 ab 0.47 ab 3.13 ab 4.43 b 0.27 a 4.45 a 33.36 b
Gratitude 359.28 a 2.38 c 12.00 b 3.13 b 0.65 a 3.46 ab 4.12 b 0.33 a 3.95 a 3.01 c
Jupiter 256.83 a 4.56 a 17.30 a 3.71 a 0.42 b 3.03 b 4.50 b 0.51 a 9.56 a 34.25 b
Mars 201.64 a 3.65 ab 16.90 a 3.33 b 0.52 ab 4.35 a 9.03 a 0.51 a 7.77 a 65.01 a
P value 0.0563 0.0011 0.0002 0.0074 0.0123 0.0030 0.0007 0.2304 0.2507 0.0001 zGenotypes were evaluated in triplicate (n=3). Means with different letter(s) for each attribute within effects and production methods
are significantly different (p<0.05) using Tukey’s Honestly Significant Difference test.

163
Table 3. Main and interaction effects for composition, color, and marketability attributes of high-tunnel table grape cultivars stored at
2 C for 0, 7, 14, and 21 d. Fayetteville, AR (2017).
Soluble
solids
(%) pH
Titratable
acidity
(%)y
Malic
acid
(g/100 g) L* Chroma Hue
Firmness
(N)
Skin
elasticity
(mm)
Berry
drop
(%)
Decay
(%)
Storage
Day 0 15.50 az 3.40 a 0.51 a 0.06 a 32.59 a 8.84 a 198.01 a 3.49 a 5.52 a 0.63 a 0.77 a
Day 7 16.80 a 3.39 ab 0.50 a 0.09 a 33.27 a 7.69 ab 187.96 a 3.73 a 6.15 a 0.86 a 1.37 a
Day 14 16.30 a 3.35 ab 0.53 a 0.08 a 31.62 a 6.51 b 248.24 a 3.55 a 6.14 a 1.41 a 1.77 a
Day 21 16.40 a 3.29 b 0.54 a 0.07 a 32.41 a 7.15 b 215.84 a 3.50 a 5.88 a 2.47 a 2.32 a
P value 0.1397 0.0265 0.8148 0.5738 0.2006 0.0034 0.1259 0.4181 0.2508 0.1309 0.4465
Cultivar
Faith 17.20 a 3.42 a 0.49 ab 0.09 ab 29.31 bc 5.81 b 215.95 a 3.34 b 4.70 b 2.65 a 3.36 a
Gratitude 13.10 b 3.10 d 0.60 a 0.06 ab 42.73 a 16.57 a 116.76 b 3.25 b 4.48 b 2.04 ab 2.72 ab
Jupiter 17.90 a 3.64 a 0.48 b 0.11 a 27.84 c 2.88 c 281.05 a 3.29 b 5.36 b 0.69 ab 0.10 bc
Mars 16.80 a 3.27 c 0.51 ab 0.03 b 30.01 b 4.94 b 236.29 a 4.39 a 9.14 a 0.00 b 0.05 c
P value <0.0001 <0.0001 0.0274 0.0068 <0.0001 <0.0001 <0.0001 <0.0001 <0.0001 0.0101 0.0016
Storage x cultivar
(p value) 0.2294 0.1157 0.5476 0.8326 0.1281 0.1137 0.1235 0.2639 0.4457 0.5393 0.8628 zGenotypes were evaluated in triplicate (n=3). Means with different letter(s) for each attribute within effects are significantly different
(p<0.05) using Tukey’s Honestly Significant Difference test. y Expressed as tartaric acid.
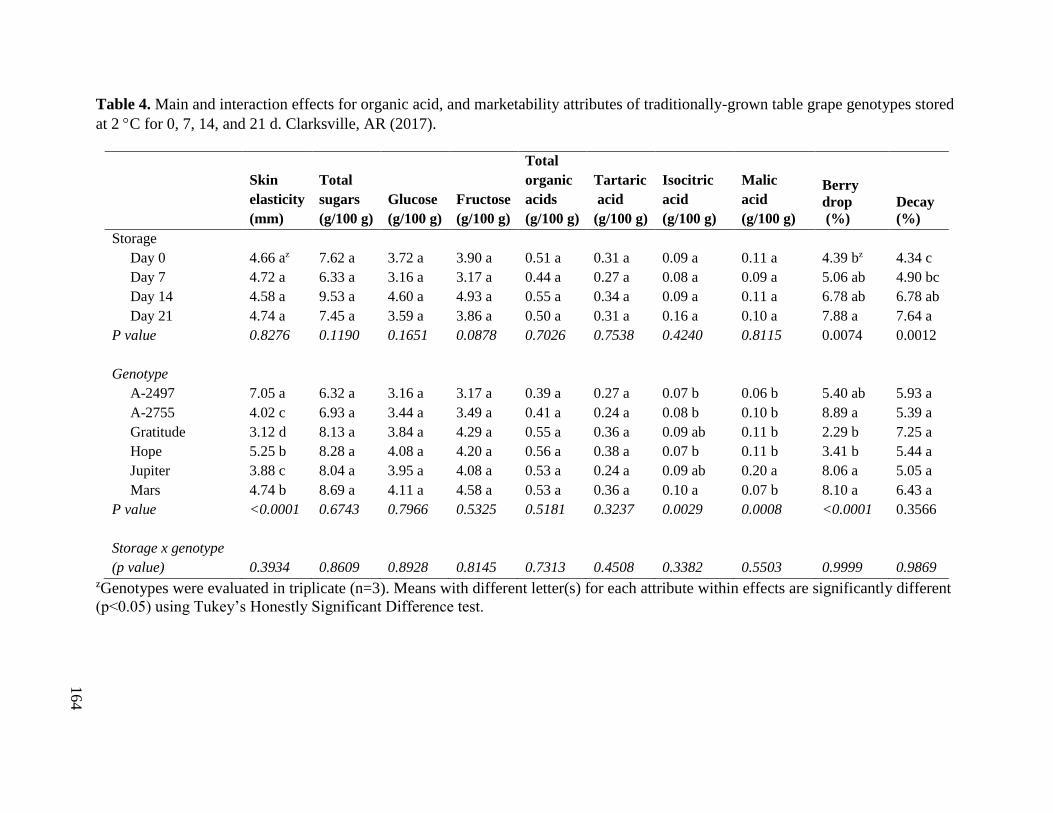
164
Table 4. Main and interaction effects for organic acid, and marketability attributes of traditionally-grown table grape genotypes stored
at 2 C for 0, 7, 14, and 21 d. Clarksville, AR (2017).
Skin
elasticity
(mm)
Total
sugars
(g/100 g)
Glucose
(g/100 g)
Fructose
(g/100 g)
Total
organic
acids
(g/100 g)
Tartaric
acid
(g/100 g)
Isocitric
acid
(g/100 g)
Malic
acid
(g/100 g)
Berry
drop
(%)
Decay
(%)
Storage
Day 0 4.66 az 7.62 a 3.72 a 3.90 a 0.51 a 0.31 a 0.09 a 0.11 a 4.39 bz 4.34 c
Day 7 4.72 a 6.33 a 3.16 a 3.17 a 0.44 a 0.27 a 0.08 a 0.09 a 5.06 ab 4.90 bc
Day 14 4.58 a 9.53 a 4.60 a 4.93 a 0.55 a 0.34 a 0.09 a 0.11 a 6.78 ab 6.78 ab
Day 21 4.74 a 7.45 a 3.59 a 3.86 a 0.50 a 0.31 a 0.16 a 0.10 a 7.88 a 7.64 a
P value 0.8276 0.1190 0.1651 0.0878 0.7026 0.7538 0.4240 0.8115 0.0074 0.0012
Genotype
A-2497 7.05 a 6.32 a 3.16 a 3.17 a 0.39 a 0.27 a 0.07 b 0.06 b 5.40 ab 5.93 a
A-2755 4.02 c 6.93 a 3.44 a 3.49 a 0.41 a 0.24 a 0.08 b 0.10 b 8.89 a 5.39 a
Gratitude 3.12 d 8.13 a 3.84 a 4.29 a 0.55 a 0.36 a 0.09 ab 0.11 b 2.29 b 7.25 a
Hope 5.25 b 8.28 a 4.08 a 4.20 a 0.56 a 0.38 a 0.07 b 0.11 b 3.41 b 5.44 a
Jupiter 3.88 c 8.04 a 3.95 a 4.08 a 0.53 a 0.24 a 0.09 ab 0.20 a 8.06 a 5.05 a
Mars 4.74 b 8.69 a 4.11 a 4.58 a 0.53 a 0.36 a 0.10 a 0.07 b 8.10 a 6.43 a
P value <0.0001 0.6743 0.7966 0.5325 0.5181 0.3237 0.0029 0.0008 <0.0001 0.3566
Storage x genotype
(p value) 0.3934 0.8609 0.8928 0.8145 0.7313 0.4508 0.3382 0.5503 0.9999 0.9869 zGenotypes were evaluated in triplicate (n=3). Means with different letter(s) for each attribute within effects are significantly different
(p<0.05) using Tukey’s Honestly Significant Difference test.
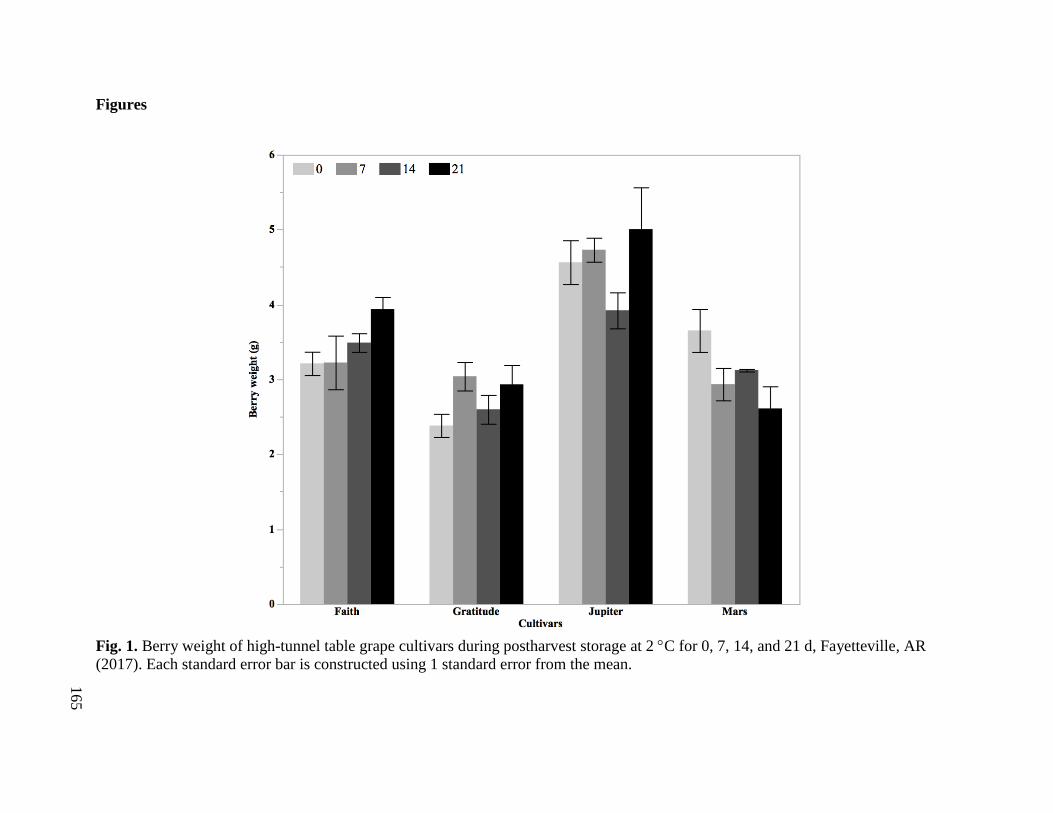
165
Figures
Fig. 1. Berry weight of high-tunnel table grape cultivars during postharvest storage at 2 C for 0, 7, 14, and 21 d, Fayetteville, AR
(2017). Each standard error bar is constructed using 1 standard error from the mean.

166
Fig. 2. Effect of cultivar on initial nutraceuticals (total anthocyanins, total phenolic acids, total
flavonols) for high-tunnel table grapes, Fayetteville, AR (2017). Each standard error bar is
constructed using 1 standard error from the mean. Means with different letter(s) for each
attribute are significantly different (P < 0.05) using Tukey’s Honestly Significant Difference
Test.
a
a
a
a
a a
b
b
bc
b b
b
bc
c
c
c
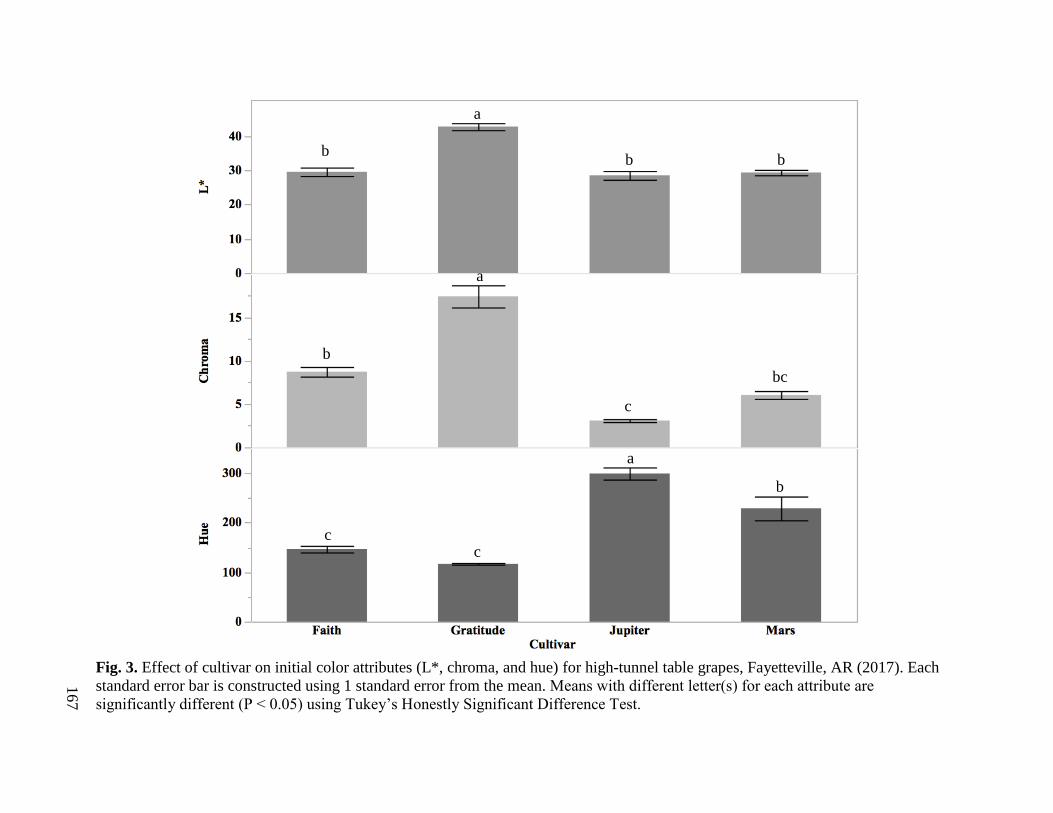
167
Fig. 3. Effect of cultivar on initial color attributes (L*, chroma, and hue) for high-tunnel table grapes, Fayetteville, AR (2017). Each
standard error bar is constructed using 1 standard error from the mean. Means with different letter(s) for each attribute are
significantly different (P < 0.05) using Tukey’s Honestly Significant Difference Test.
b b b
a
a
b
bc
c
c
b
a
c

168
Fig. 4. Weight loss of high-tunnel table grape cultivars during postharvest storage at 2 C for 0, 7, 14, and 21 d, Fayetteville, AR
(2017). Each standard error bar is constructed using 1 standard error from the mean.

169
Fig. 5. Berry weight of traditionally-grown table grape genotypes during postharvest storage at 2 C for 0, 7, 14, and 21 d, Clarksville,
AR (2017). Each standard error bar is constructed using 1 standard error from the mean.
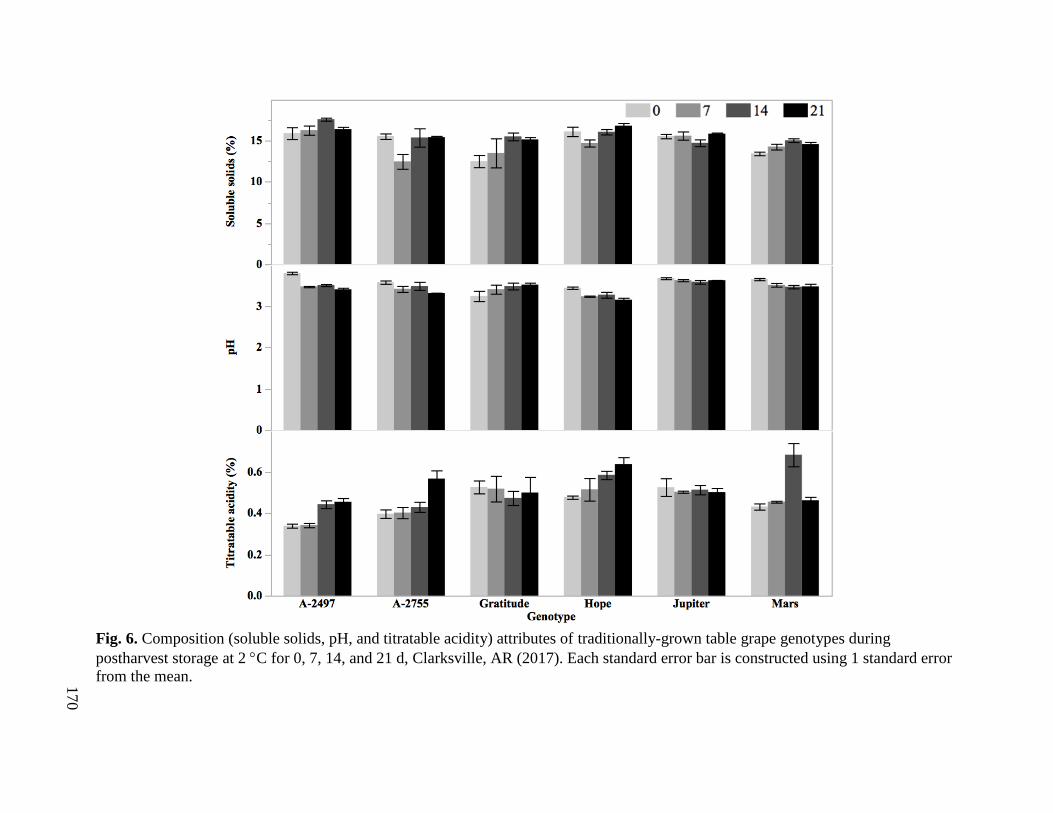
170
Fig. 6. Composition (soluble solids, pH, and titratable acidity) attributes of traditionally-grown table grape genotypes during
postharvest storage at 2 C for 0, 7, 14, and 21 d, Clarksville, AR (2017). Each standard error bar is constructed using 1 standard error
from the mean.
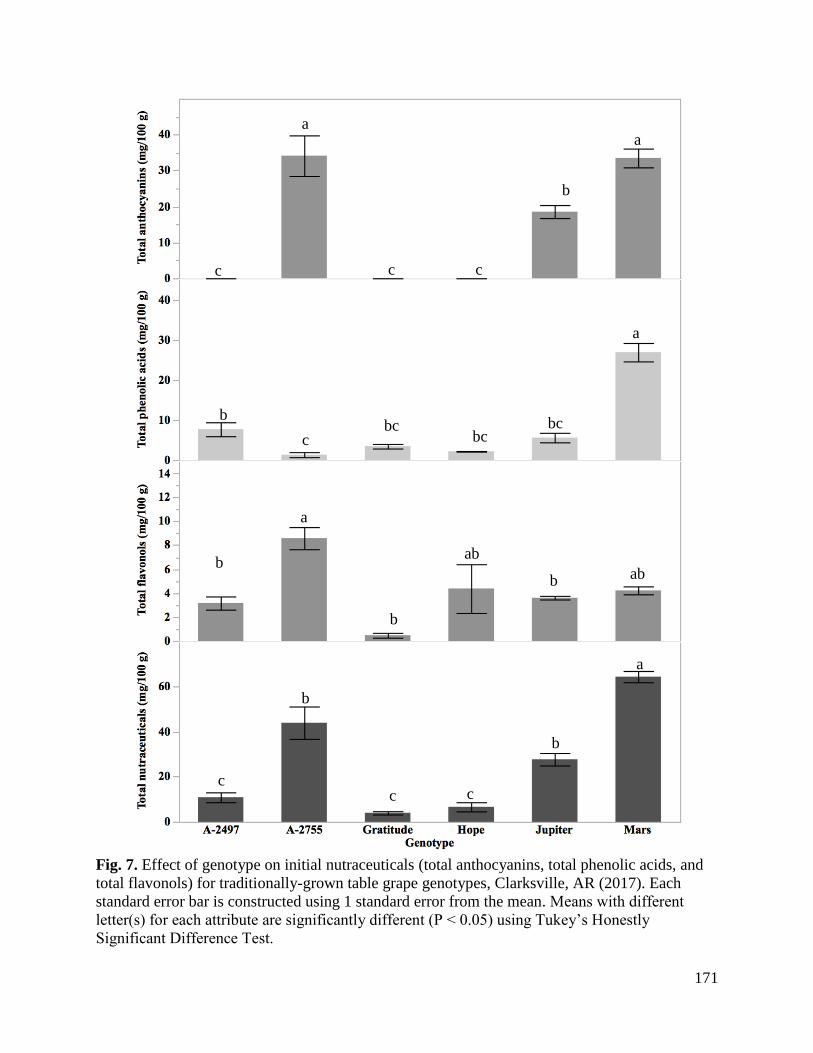
171
Fig. 7. Effect of genotype on initial nutraceuticals (total anthocyanins, total phenolic acids, and
total flavonols) for traditionally-grown table grape genotypes, Clarksville, AR (2017). Each
standard error bar is constructed using 1 standard error from the mean. Means with different
letter(s) for each attribute are significantly different (P < 0.05) using Tukey’s Honestly
Significant Difference Test.
ab
ab
b
bc bc bc
c
c c c
b
b
b
b b
b
c c c
a
a
a
a a

172
Fig. 8. Effect of genotype on initial color attributes (L*, chroma, and hue) for traditionally-grown table grapes, Clarksville, AR
(2017). Each standard error bar is constructed using 1 standard error from the mean. Means with different letter(s) for each attribute
are significantly different (P < 0.05) using Tukey’s Honestly Significant Difference Test.
a
a
a
a a
a
b b
b
b
b
b b
c c
c
d d

173
Fig. 9. Color (L*, chroma, and hue) attributes of traditionally-grown table grape genotypes during postharvest storage at 2 C for 0, 7,
14, and 21 d, Clarksville, AR (2017). Each standard error bar is constructed using 1 standard error from the mean.
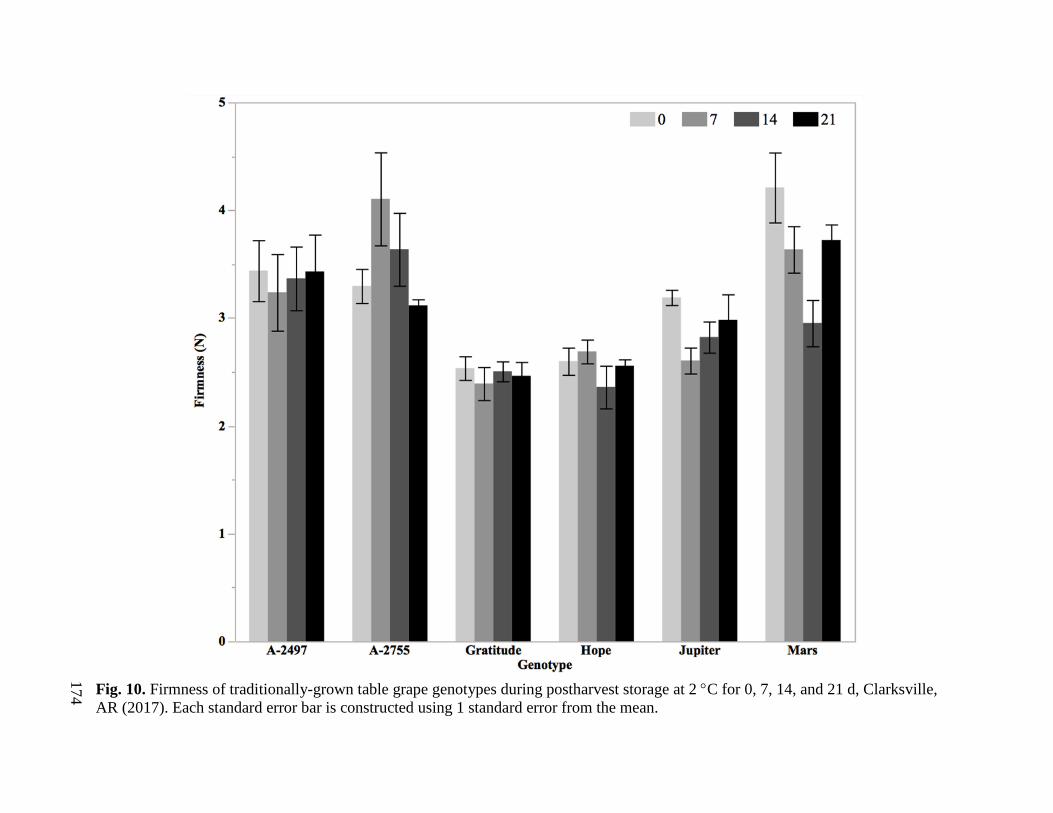
174
Fig. 10. Firmness of traditionally-grown table grape genotypes during postharvest storage at 2 C for 0, 7, 14, and 21 d, Clarksville,
AR (2017). Each standard error bar is constructed using 1 standard error from the mean.

175
Fig. 11. Weight loss of traditionally-grown table grape genotypes during postharvest storage at 2 C for 0, 7, 14, and 21 d, Clarksville,
AR (2017). Each standard error bar is constructed using 1 standard error from the mean.
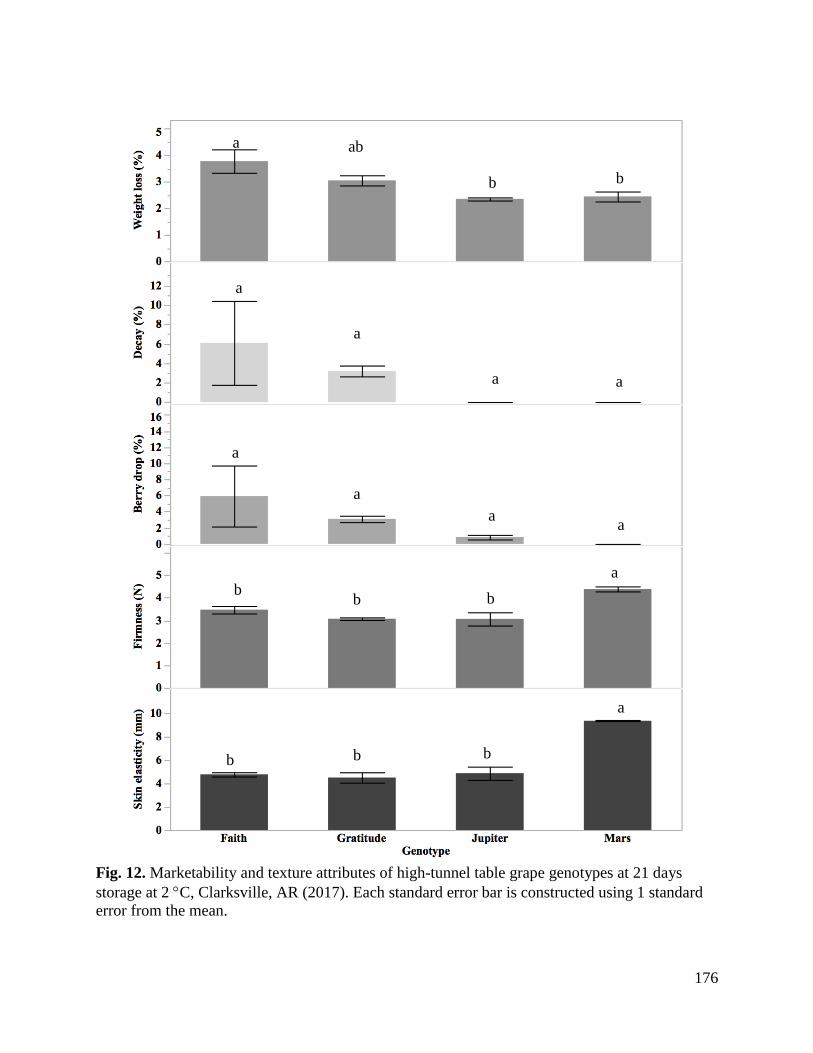
176
Fig. 12. Marketability and texture attributes of high-tunnel table grape genotypes at 21 days
storage at 2 C, Clarksville, AR (2017). Each standard error bar is constructed using 1 standard
error from the mean.
a
a
a
a a
a a
a
a
a
a
b b b
b b b
b b
ab

177
Fig. 13. Marketability and texture attributes of traditionally-grown table grape genotypes at 21
days storage at 2 C, Clarksville, AR (2017). Each standard error bar is constructed using 1
standard error from the mean.
b b
b b
bc
bc bc c
c
c
a
a
a a
a a
a
a
a a a a a
a
a ab
ab abc abc
bc

178
Fig. 14. Marketability and texture attributes of different production methods at 21 days storage at
2 C, Clarksville and Fayetteville, AR (2017). Each standard error bar is constructed using 1
standard error from the mean.
179
Chapter IV
Physiochemical, Marketability, and Sensory Analysis of Arkansas-Grown Muscadine
Grapes for Fresh Market
Abstract
Understanding how consumer perception is related to physiochemical attributes and how storage
affects fruit quality assists in identification of harvest, ripeness, and marketability parameters of
muscadine grapes [Vitis rotundafolia Michx.]. Three muscadine cultivars (Ison, Nesbitt, and
Summit) and three advanced breeding selections (AM-9, AM-74, and AM-83) were harvested at
optimum ripeness from the University of Arkansas System Division of Agriculture Fruit
Research Station in Clarksville, AR. The physiochemical and sensory attributes of the genotypes
were evaluated at harvest (day 0), and physiochemical and marketability attributes were
evaluated during postharvest storage (days 0, 7, 14, and 21) at 2 C. The range of physiochemical
attributes of the genotypes at harvest had a range for berry weight (9.25-14.38 g), soluble solids
(12.73%-15.40%), pH (2.88-3.33), titratable acidity (0.54%-0.76%), soluble solids/titratable
acidity ratio (13.12-28.49), flesh firmness (0.89-2.14 N), and skin firmness (0.85-1.48 N/mm). A
trained descriptive sensory panel (n = 8) evaluated the fruit attributes for aroma (n = 9), external
appearance (n = 10), internal appearance (n = 3), basic tastes (n = 3), aromatics (n = 10), feeling
factors (n = 2), and texture (n = 8). No differences between genotypes were found for texture
attributes in the descriptive analysis. The descriptive sensory analysis differentiated among
genotypes for external appearance, internal appearance, and basic taste attributes, more
specifically with positive attributes rather than negative. Of the physiochemical attributes,
glucose and fructose content had the most significant correlations with the descriptive sensory
attributes, followed by soluble solids/titratable acidity ratio. Additionally, many significant
correlations were seen between analytical color and descriptive sensory attributes indicating that
180
analytical color is a strong method to evaluate the dewscriptive color attributes of the
muscadines. There were significant storage x genotype interactions for the composition and
marketability attributes and on day 21, AM-9 had the lowest unmarketable fruit and weight loss.
The two bronze genotypes, AM-74 and ‘Summit’, did not perform as well as the black genotypes
with respect to unmarketable fruit as the blemishes were more visible on the lighter colored fruit.
Overall, the six muscadine genotypes performed well with low weight loss (<5%) and low
unmarketable fruit (<11% for the black genotypes, and <28% for the bronze). Results from this
study indicated that descriptive sensory analysis has the potential to describe muscadine grapes
for major important attributes, and muscadine grapes had good retention of compositional
attributes and marketability indicating strong potential for fresh-market.
181
Introduction
The muscadine grape (Vitis rotundifolia Michx.), sometimes known as the “bull grape”
and “scuppernong”, is native to the southern United States. Muscadines have a unique berry with
a thick skin and musky-flavored pulp. The muscadine vines were first identified in about 1524 by
Europeans in the Cape Fear River Valley in North Carolina (Morris and Brady, 2004). While
many details about its discovery are unclear, the grape has been cultivated for roughly 200 years
in the southern United States and flourishes in that environment. When discovered by Europeans,
the muscadine grape was reported in abundance, and the land was described as “so full of
grapes... on the sand and on the green soil, on the hills as on the plains, as well as on every little
shrub as also climbing towards the tops of tall cedars, that I think in all the world the like
abundance is not to be found” (Hendrick, 1908). Muscadine cultivation is far easier than V.
vinifera, as the plant is adapted to the southern region (Morris and Brady, 2004). Currently,
muscadines are grown in Alabama, Arkansas, Florida, Georgia, Louisiana, Mississippi, North
Carolina, Oklahoma, Tennessee, Texas, South Carolina, and Virginia (Olien, 1990).
Due to the high humidity and incidence of disease, grapes grown for commercial
production in the southern United States need to be disease tolerant, such as muscadines, other
native species (V. labruscana), and hybrids. Muscadines are resistant to a variety of diseases and
pests such as Pierce’s disease (Xylella fastidiosa), grape fan leaf virus (Nepovirus spp.), and
anthracnose (Elsinoë ampelina Shear) (Bouquet, 1981; Hopkins, 1974; Ren and Lu, 2002). In
addition to disease and pest resistance, the muscadine is capable of being a profitable crop,
especially when irrigated (Carpio et al., 2006). Due to the limited production in each state,
muscadine yields and profits are not typically recorded by the United States Department of
Agriculture, but are categorized as grapes (table, wine, and muscadine). However, a 2006
182
profitability study found there were 12 southern states with ~2,025 ha of muscadine grapes
grown in the United States of which ~90% were the cultivar, ‘Carlos’, a bronze cultivar (Cline
and Fisk, 2006).
The University of Arkansas’s fruit breeding program began breeding muscadines in 2005
with a focus on large fruit size, crisp texture, edible skin, self-fruitful flowers, seedlessness, and
improved postharvest storability (Barchenger, 2014). An increase in the consumer liking of
muscadine grapes, or a product produced from these grapes, is an important consideration in
muscadine breeding and production. With fruit breeding efforts, fresh-market muscadines have
potential to expand the grape market in the United States and provide a grape that is high in
fiber, essential amino acids, minerals, and vitamins to the consumer (Ector, 2001). Improving
consumer acceptability of this grape can be quantified with soluble solids and texture analysis
during post-harvest storage, as well as through sensory analysis (Brown et al., 2016).
Consumer sensory evaluations on muscadines showed that consumers liked the flavor of
the grape but disliked the seeds and tough skin (Degner and Mathis, 1980). In a consumer study
by Brown et al. (2016), thinner skins and higher juice pH was associated with greater overall
liking of muscadine grapes. However, the majority of studies have been focused on juice rather
than the whole muscadine berry (Flora, 1979; Meullenet et al., 2008; Trappey et al., 2007).
Additionally, limited published studies have been performed on descriptive sensory analysis of
whole, fresh-market muscadine berries. Descriptive sensory analysis quantitatively describes
fruit attributes, such as basic tastes, aroma, and texture using trained panelists and was effective
in other fruits such as peaches and nectarines (Colaric et al., 2005; Contador et al., 2017).
Utilization of this method has the potential to describe how an attribute is perceived by the
183
consumer. Descriptive sensory analysis provides valuable information for fruit breeders on fruit
attributes to identify potential improvements.
Previous research has shown that muscadine grapes, pomace, and juice are rich in
nutraceutical compounds and antioxidants (Lee and Talcott, 2002; Threlfall et al., 2007; Wang et
al., 2010). These health-promoting compounds have both anticancer and anti-inflammatory
properties, which could aid in capturing a portion of the health-focused market (Greenspan et al.,
2005; Yi et al., 2005). Previous studies have shown a large portion of the phenolic compounds in
muscadines are mostly found in the seeds and skin, and darker-skinned berries have higher total
phenolic compounds due to anthocyanins (Pastrana-Bonilla et al., 2003; Sandhu et al., 2010).
Understanding the physiochemical, marketability, and sensory attributes of Arkansas-
grown muscadine genotypes (cultivars and advanced selections) is important to demonstrate
fresh-market potential. The purpose of this study was to evaluate the physiochemical attributes,
marketability attributes, and descriptive sensory attributes of fresh-market muscadines at harvest
and evaluate the postharvest storage potential of the fruit.

184
Materials and Methods
Plants and culture
Six muscadine genotypes (AM-9, AM-74, AM-83, ‘Nesbitt’, ‘Ison’, and ‘Summit’) were
harvested from vines grown at the University of Arkansas Fruit Research Station, Clarksville AR
[west-central Arkansas, lat. 35◦31'58"N and long. 93◦24'12"W; U.S. Dept of Agriculture
(USDA) hardiness zone 7a; soil type Linker fine sandy loam (Typic Hapludult)]. Vines were
spaced 6.1 m apart and rows were spaced 3.0 m apart. The vines were trained to a bi-lateral,
high-cordon/curtain training system and pruned to three- to four-bud spurs annually. Weeds were
controlled by applications of preemergence and postemergence herbicides applied annually.
Vines were fertilized annually in March or April with nitrogen or complete fertilizers. Fungicides
were applied similar to a commercial requirement to control macrophoma rot (Botryosphaeria
dothidea Moug.), bitter rot (Greeneria uvicola Burk), and ripe rot (Colletotrichum spp.). The last
application of any fungicide was usually done near the end of June to early July. On average,
five fungicide sprays and two insecticide sprays were applied to the grapes.
Harvest
The muscadines were hand harvested in the early morning (prior to 11:00 AM) on 19
September. The fruit was harvested at optimal ripeness and was free of major visible blemishes,
flaws, or damage. About 5 kg of muscadines were harvested for each genotype. The fruit was
harvested into 0.9 kg clamshells (~ six clamshells per genotype), placed in an ice chest chilled
with ice packs, and transported to the University of Arkansas Department of Food Science in
Fayetteville, AR. Grapes were removed from the clamshells, randomized, placed into new 0.9 kg
clamshells, and stored at 2 °C (85% to 89% relative humidity). AM-74 and ‘Summit’ were
bronze genotypes, and AM-9, AM-83, ‘Ison’, and ‘Nesbitt’ were black. The descriptive sensory

185
of the muscadines was evaluated at harvest and the physiochemical and marketability attributes
were evaluated at harvest and during storage (days 0, 7, 14, and 21) at 2 °C.
Physiochemical analysis
Fruit for physiochemical analysis was done in triplicate per genotype. Each replicate was
a clamshell. The physiochemical analysis included berry weight, seed weight, color, firmness,
and composition evaluated at 0, 7, 14, and 21 d at 2 C, and nutraceutical analysis evaluated at
day 0. For each genotype and replication, five berries were used for berry weight and firmness,
five berries were used for composition, and three berries were used for nutraceutical analysis.
Weight. Berry and seed weight was measured on a digital scale (PA224 Analytic
Balance, Ohaus Corporation, Parsippany, NJ).
Color. The exterior color of the berries was analyzed using a Konica Minolta CR-400
Chroma Meter (Konica Minolta Inc, Ramsey, NJ). The color was measured 180° from the stem
scar. The L*, chroma, and hue angle were evaluated. Color analysis was done to determine
Commission Internationale de l’Eclairage (CIE) Lab transmission values of L*=100, a*=0, and
b*=0 (C.I.E. 1986). The CIELAB system describes color variations as perceived by the human
eye. CIELAB is a uniform three-dimensional space defined by colorimetric coordinates, L*, a*,
and b*. The vertical axis L* measures lightness from completely opaque (0) to completely
transparent (100), while on the hue-circle, +a* red, -a* green, +b* yellow, and -b* blue were
measured. Hue angle, calculated as arctan (b*/a*), described color in angles from 0 to 360°: 0° is
red, 90° is yellow, 180° is green, 270° is blue, and 360° is red. Chroma, calculated as ((a*)2 +
(b*)2)0.5, identified color by which a sample appears to differ from gray of the same lightness and
corresponds to intensity of the perceived color.

186
Firmness. Firmness was measured using a Stable Micro Systems TA.XT.plus Texture
Analyzer (Texture Technologies Corporation, Hamilton, MA). The berries were placed on the
texture unit vertically, stem scar down. Using the 2-mm-diameter probe, at a rate of 2 mm/s with
a trigger force of 0.02 N, the flesh firmness and skin firmness was measured. Flesh firmness, the
force required to penetrate the fruit, was measured in Newtons (N). Skin firmness, the force
required to puncture the skin divided by the distance traveled before the fruit was penetrated, was
measured in Newtons/millimeters (N/mm).
Composition. The berries were frozen (-10 °C) then thawed for compositional analysis
(soluble solids, pH, titratable acidity, organic acids, and sugars). The berries were thawed and
squeezed through cheese cloth to extract juice. The pH and titratable acidity were measured
using the Titrino plus 862 compact titrosampler (Metrohm AG, Herisan, Switzerland) with the
electrode standardized to pH 4.00, 7.00, and 10.00 buffers. Titratable acidity was determined
using ~6 g of juice diluted with 50 mL deionized, degassed water with a titration using 0.1 N
sodium hydroxide to an endpoint of pH 8.2. Titratable acidity was expressed as percentage of
tartaric acid. Soluble solids (expressed as percent) were measured using an Abbe Mark II
refractometer (Bausch and Lomb, Scientific Instrument, Keene, NH). Organic acids and sugars
of the fruit were determined using high performance liquid chromatography (HPLC). The
remaining juice from compositional analysis was filtered through a 0.45 μm nylon filter (VWR
International, Radnor, PA) and analyzed using HPLC. Glucose, fructose, tartaric acids, isocitric
acid, and malic acid of the fruit was measured using previously established HPLC procedures
(Walker et al., 2003; Segantini et. al., 2018). The HPLC was equipped with a Bio-Rad HPLC
Organic Acid Analysis Aminex HPX-87H ion exclusion column (300 × 7.8 mm), Bio-Rad
HPLC Fast Acid Analysis column (100 x 7.8 mm), and a Bio-Rad HPLC column for

187
fermentation monitoring (150 × 7.8 mm) in series (Bio-Rad, Hercules, CA). A Bio-Rad Micro-
Guard Cation-H refill cartridge (30 × 4.5 mm) was used for a guard column. Columns were
maintained at 65 °C by a temperature control unit. Mobile phase consisted of a pH 2.28 solution
of sulfuric acid and water with a resistivity of 18 M obtained from a Millipore Milli-Q reagent
water system. The sulfuric acid solution was used as the solvent with 0.45 mL/min flow rate. The
solvent delivery system was a Waters 515 HPLC pump equipped with a Waters 717 plus
autosampler (Waters Corporation, Milford, MA). Injection volumes were 10 μL for all samples,
and run time for completion was 35 min. A Waters 410 differential refractometer to measure
refractive index connected in series with a Waters 996 photodiode array detector monitored the
eluting compounds. Tartaric, isocitric, and malic acids were detected by photodiode array at 210
nm, and glucose, and fructose were detected by the differential refractometer. The peaks were
quantified using external standard calibration based on peak height estimation with baseline
integration. Individual sugars and acids were expressed as g/100 g, and total sugars (glucose +
fructose) and total organic acids (tartaric + isocitric + malic) were expressed as g/100 g.
Nutraceuticals. Total anthocyanins, total phenolic acids (hydroxycinnamic acids), total
ellagitannins, and total flavonols were measured by HPLC and ultraviolet-visible (UV-Vis)
spectroscopy. Following methods described by Cho et al. (2004 and 2005), and Hager et al.
(2008). The fruit was homogenized three times for 1 min in alternating washes of 30 ml of
extraction solution containing methanol/water/formic acid (60:37:3 v/v/v) and
acetone/water/acetic (70:29.5:0.5 v/v/v) to the smallest particle size using a Euro Turrax T18
Tissuemizer. Homogenates were centrifuged for 5 min at 10,000 rpm and filtered. The samples
were taken to a final volume of 250 mL with extraction solvent and stored at -70 C until
analysis. All samples were passed through 0.45 μm filters prior to HPLC analysis. Equivalents
188
for the table grape nutraceuticals were determined from previous literature for the most common
compounds for each class of phenolics (Benmeziane et al., 2016; Mattivi et al., 2006; Striegler et
al., 2005). Total nutraceuticals were quantified as the sum (milligrams) of total anthocyanins,
total flavonols, total ellagitannins, and total phenolic acids per 100 g fresh fruit weight.
Total anthocyanins and total phenolic acids. Sample extracts (7.5 mL) were dried using a
Speed Vac concentrator (ThermoSavant, Holbrook, NY) and resuspended in 1 mL of 5% formic
acid. The reconstituted samples were passed through 0.45-mm polytetrafluoroethylene (PTFE)
syringe filters (Varian Inc, Palo Alto, CA) before HPLC analysis. The anthocyanin analysis by
HPLC was performed based on previous methods (Cho et al., 2004; Hager et al., 2008). Samples
(50 μL) were analyzed using a Waters HPLC system equipped with a model 600 pump, a model
717 Plus autosampler and a model 996 photodiode array detector. Separation was carried out
using a 4.6 mm × 250 mm Symmetry® C18 column (Waters Corp, Milford, MA) preceded by a
3.9 mm × 20 mm Symmetry® C18 guard column. The mobile phase was a linear gradient of 5%
formic acid and methanol from 2% to 60% for 60 min at 1 ml/min. The system was equilibrated
for 20 min at the initial gradient prior to each injection. The anthocyanins peaks were quantified
at 510 nm with results expressed as milligrams malvidin-3-glucoside equivalents per 100 g fresh
fruit weight. The phenolic acid peaks were quantified at 320 nm with results expressed as
milligrams of chlorogenic acid equivalents per 100 g of fresh fruit weight.
Total ellagitannins and total flavonols. Sample extracts (3 mL) were dried using a Speed
Vac concentrator (ThermoSavant, Holbrook, NY) and resuspended in 1.0 mL of 50% methanol.
The reconstituted samples were passed through 0.45-mm PTFE syringe filters before HPLC
analysis. The ellagitannins and flavonols were analyzed according to previous methods (Hager et
al., 2008, 2010). The samples (50 μL) were then analyzed using a Waters HPLC system (Waters

189
Corp, Milford, MA) equipped with a model 600 pump, model 717 plus autosampler and model
996 photodiode array detector. Separation was carried out using a 4.6 mm × 250 mm Aqua®
C18 column (Phenomenex, Torrance, CA) preceded by a 3.9 mm × 20 mm Symmetry® C18
guard column. The mobile phase was a gradient of 20 g/L acetic acid (A) and 5 g/L acetic acid in
water and acetonitrile (50:50 v/v, B) from 10% B to 55% B in 50 min and from 55% B to 100%
B in 10 min. The system was equilibrated for 20 min at the initial gradient prior to each injection.
The ellagitannins were quantified at 255 nm with results expressed as milligrams of ellagic acid
equivalents per 100 g of fresh fruit weight. The flavonols were quantified at 360 nm with results
expressed as milligrams (mg) of quercetin-3-O-glucoside equivalents per 100 g of fresh fruit
weight.
Marketability analysis
Marketability analysis was performed on fruit in triplicate clamshells. The marketability
analysis included total decay and weight loss evaluated at 0, 7, 14, and 21 d at 2 °C for each
genotype. Stem scar tear was evaluated at harvest (day 0).
Decay and stem scar tear. The decay (visible mold or rot) and stem scar tear (tear > 2x
diameter of stem scar) of the berries were calculated as (number of decayed or torn/total berries)
× 100 and expressed as percent.
Weight loss. The weight loss of the clamshell was calculated as the weight decrease of
the total grapes in the clamshell expressed as percent.
Descriptive sensory evaluation
Descriptive sensory analysis was performed at the Sensory and Consumer Research
Center at the University of Arkansas, Fayetteville AR. After harvest, the fruit was stored
overnight at 2 C for sensory. The fruit was removed from cold storage, gently rinsed, and placed
190
on trays to air-dry. Each panelist evaluated five berries for each genotype in duplicate. The fruit
was served monadically (one at a time) at room temperature (25 °C) on plates labeled with three-
digit codes in a randomized complete block design. Serving order was randomized across each
replication to prevent presentation order bias. Panelists were instructed to cleanse their palates
with unsalted crackers and water between samples. Expectorant cups were provided. The
panelists were trained to use a modified Sensory Spectrum method, an objective method for
describing the intensity of attributes in products using references for the attributes. The eight
descriptive panelists developed a lexicon of sensory terms for the muscadines through consensus
during orientation and practice sessions (Table 1). The descriptive panel evaluated the fruit
attributes for aroma (n = 9), external appearance (n = 10), internal appearance (n = 3), basic
tastes (n = 3), aromatics (n = 10), feeling factors (n = 2), and texture (n = 8). The attributes were
evaluated using a 15-point scale where 0 = less of an attribute and 15 = more of an attribute.
Design and statistical analysis
After harvest, the fruit from each of the ten genotypes were completely randomized. The
fruit was stored at 2 °C for 0, 7, 14, and 21 d. Statistical analyses were conducted using JMP®
(version 13.2.0; SAS Institute, Cary, NC). A univariate analysis of variance (ANOVA) was used
to determine the significance of main factors (genotype and storage) and interactions. Tukey’s
Honestly Significant Difference (HSD) test was used to detect significant differences (p < 0.05)
among means and verify interactions at 95% significance level. Least significant difference
(LSD) test was used to detect significant differences (p < 0.05) among means for sensory data.
Pairwise correlations using multivariate analysis were used to verify the relationship
between/within attributes at a p-value of 0.05 at harvest and at 21 d of storage. Physiochemical
191
and marketability attributes were evaluated in triplicate and sensory attributes were evaluated in
duplicate.
Results and Discussion
At harvest, the muscadines were within a commercially acceptable range for berry weight
(9.25-14.38 g), soluble solids (12.73%-15.40%), pH (2.88-3.33), titratable acidity (0.54%-
0.76%), and flesh firmness (0.89-2.14 N) (Table 2). The fruit was evaluated for physiochemical
and descriptive sensory attributes at harvest and physiochemical and marketability attributes
during postharvest storage.
Physiochemical attributes at harvest
The muscadines from the six genotypes were evaluated for physiochemical attributes
(weight, stem scar, composition, nutraceuticals, color, and firmness). Physiochemical analysis of
the genotypes at harvest was significant for all attributes except total organic acids and total
sugars (Tables 2 and 3) and individual acids and sugars (data not shown).
Berry and seed weight were evaluated (Table 2). AM-74 (14.38 g) had the highest berry
weight and seed weight (0.12 g). ‘Summit’ (9.25 g) had the lowest berry weight. AM-83 (0.09 g)
had the lowest seed weight. There were usually three seeds per berry ranging from one to four
(data not shown). Threlfall et al. (2007) found similar berry weight for ‘Summit’, but slightly
lower berry weights for ‘Ison’ and ‘Nesbitt’ in Arkansas.
Stem scar tear was evaluated (Table 2). AM-74 (11.01%) had the most stem scar tear, and
AM-83 (1.08%) had the least. When muscadines ripen on the vine, the fruit abscises from the
stem, but can tear upon abscission. Dry stem scar, or un-torn berries, is a positive attribute for
muscadines as it is a positive attribute in muscadine marketability (Clark and Barchenger, 2014).

192
High incidence in stem scar tear has been shown to increase decay during storage 6-10x more
than un-torn berries as the tear allows pathogens to enter the berry (Ballinger and Nesbitt, 1982).
Composition (soluble solids, pH, titratable acidity, and soluble solids/titratable acidity
ratio) was evaluated (Table 2). ‘Summit’ had the highest soluble solids (15.40%) and lowest
titratable acidity (0.54%). ‘Nesbitt’ had the lowest soluble solids (12.73%) and ‘Ison’ had the
highest titratable acidity (1.01%). AM-83 (3.33) had the highest pH, and ‘Ison’ (2.88) had the
lowest. Threlfall et al. (2007) found similar soluble solids, pH, and titratable acidity levels for
eight muscadine genotypes grown in Arkansas. The ratio of soluble solids to titratable acidity has
proven useful for understanding how consumers perceived the balance of sugar to acid in fruit
such as peaches and nectarines (Crisosto and Crisosto, 2005). ‘Summit’ (28.49) had the highest
soluble solids/titratable acidity ratio, and ‘Ison’ (13.12) had the lowest. Walker et al. (2001)
indicated preferred soluble solids/titratable acidity ratios of 24 to 33 for muscadine grapes. Flora
(1979) and Threlfall et al. (2007) also found similar preferred ratios for muscadine juice. Using
these established parameters, only three of the six genotypes (AM-9, AM-74, and Summit) in
this study had an ideal ratio, with the other three having a soluble solid/titratable acidity ratio of
<21.
Total organic acids and sugars were evaluated (Table 3). Overall, the total organic sugars
ranged from 6.17-9.75 g/100 g, and the total organic acids ranged from 0.50-0.84 g/100 g. In
addition, individual acids and sugars were evaluated for these genotypes, but there were no
significant differences in glucose, fructose, tartaric, isocitric, or malic acid. At harvest, glucose
and fructose were present in the fruit in a ~1:1 ratio with an average glucose content of 4.14
g/100 g and fructose content of 3.81 g/100 g. Tartaric acid was the predominant acid in the
muscadines with an average tartaric acid content of 0.37 g/100 g, isocitric acid content of 0.11

193
g/100 g, and malic acid content of 0.21 g/100 g (data not shown). Similar organic acid and sugar
contents have been observed in Arkansas-grown muscadines (Striegler et al., 2005).
Nutraceuticals (total phenolic acids, total flavonols, total ellagitannins, and total
anthocyanins) were evaluated (Table 3). The nutraceutical levels were different for these
attributes, except for total ellagitannins which were not present in these genotypes. In terms of
the highest total nutraceuticals, ‘Ison’ (423.24 mg/100 g) had the highest, and AM-9 (132.27
mg/100 g) had the lowest. AM-74 (3.38 mg/100 g) had the highest total phenolic acids, and
‘Summit’ had the lowest total phenolic acids (0.14 mg/100 g) and highest flavonols (396.88
mg/100 g). AM-9 had the lowest flavonols (81.82 mg/100 g). ‘Ison’ had the highest total
anthocyanins (233.38 mg/100 g), and AM-74 and ‘Summit’ had none (both bronze genotypes).
Conner and Maclean (2013) found comparable anthocyanin content in University of Georgia
muscadine grapes. A study by Huang et al. (2009) indicated that approximately 90% of the
anthocyanins were 3,5-diglucoside of delphinidin, cyanidin, and petunidin as the predominant
anthocyanin. However, in another Arkansas muscadine grape report, Striegler et al. (2005)
quantified as total anthocyanins using malvidin-3-glucoside equivalents and found similar but
slightly lower total anthocyanin content than this study. It is possible berry maturity or crop load
could have impacted anthocyanin content. Barchenger et al. (2015) found similar total
nutraceuticals (quantified as total phenolics) in Arkansas-grown muscadines.
Exterior berry color attributes (L*, chroma, and hue) were evaluated (Table 2). AM-74
(47.94) had the highest L* value, and AM-9 (23.85) had the lowest. Overall, the bronze
genotypes had higher L* values than black genotypes. ‘Summit’ had the highest chroma (18.36)
and hue (93.39) indicating the berry was yellow to green. AM-83 (2.47) had the lowest chroma,
and AM-9 (13.89) had the lowest hue, both of which were black-skinned muscadines.
194
Firmness attributes (skin firmness and flesh firmness) were evaluated (Table 2). AM-83
had the highest skin firmness (1.48 N/mm) and flesh firmness (2.14 N). AM-9 (0.85 N/mm) had
the lowest skin firmness, and ‘Ison’ (0.89 N) had the lowest flesh firmness. Conner (2013)
reported flesh firmness ranging from 0.65-3.06 N in a study of 26 muscadine grape genotypes
grown in Georgia. In that study, they also determined that flesh force or firmness was one of the
most useful characteristics for screening in a breeding program. The findings on firmness in this
study were similar to the study by Connor (2013).
Sensory attributes at harvest
As sensory analysis has been shown to explain cultivar characteristics better than
instrumental measurements alone, descriptive sensory analysis was used to identify various
attributes of the muscadine grapes. During orientation and training, the eight trained panelists
created a descriptive sensory lexicon using Arkansas-grown muscadine grapes (Table 1). The
panelists used the lexicon to evaluate the six genotypes in duplicate using a 15-point scale where
1 is less of an attribute, and 15 is more of an attribute. The panelists evaluated the fruit on seven
categories of attributes (aroma, external appearance, internal appearance, aromatics, basic tastes,
feeling factors, and texture). Within each category multiple attributes were evaluated.
The panelists evaluated aroma (grape/overall, grape/muscadine, grape/other, fruity, floral,
earthy/dirty, mold/mildew, and overripe) of five whole, intact berries (Table 4). All of the aroma
attributes were less than 6.5 on the 15-point scale indicating low-mid aroma intensity. Of the
aroma attributes, the panelists detected differences between genotypes in grape/overall,
grape/muscadine, and fruity. The panelists did not detect differences in grape/other, floral,
earthy/dirty, green/unripe, or mold/mildew, which were low values (≤0.8), and did not detect
any overripe aromas. AM-74 had the highest grape/overall and grape/muscadine aroma, and
195
AM-83 had the least. AM-9 had the greatest fruity aroma, and AM-83 had none. The negative
aroma attributes such as earthy/dirty, green/unripe, mold/mildew, and overripe were low for all
genotypes (≤0.8).
The panelists then evaluated external appearance (uniformity of color, color-purple,
color-bronze, glossiness, uniformity of size, size, shape, amount of blemishes/deformities, and
stem scar tear) of five whole, intact berries (Table 5). Of the nine attributes, the panelists
detected differences among the genotypes for all attributes except uniformity of size and amount
of blemishes/deformities. The panelists found the muscadines were uniform in size (~11.6) and
had a low amount of blemishes/deformities (~3.9). AM-9 had the lowest color-bronze, roundest
shape, and least stem scar tear. AM-74 had the least color-purple, most color-bronze, largest size,
and most stem scar tear. The size of AM-74 was close to reference C =25.4 mm (Fig.1). AM-83
was the most uniform in color, had the most color-purple, least color-bronze, most glossiness,
and most oblong shape. ‘Nesbitt’ had the least uniformity of color and smallest size. ‘Summit’
had the least glossiness (most dull exterior) and smallest size along with ‘Nesbitt’.
Internal appearance (visual separation, number of seeds, and seed size) was evaluated
(Table 6). Seed size (~6.9) was not different among the genotypes, with seed size closest to the
reference B= 4.9 x 7.1 mm (Fig. 2). AM-83 had the least visual separation and most seeds. AM-9
had the most visual separation, and AM-74 had the least seeds. In a consumer study by Degner
and Mathis (1980), the primary reason consumers did not purchase muscadines in Florida was
the presence of seeds. AM-74 (~3 seeds) had the least seeds indicating a slight improvement
from ~4 seeds in AM-83.
Basic tastes (sweet, sour, and bitter) and feeling factors (astringent and metallic) were
evaluated (Table 6). Of the attributes evaluated, the panelists detected differences among the

196
genotypes for all attributes except bitter (~1.0) and astringent (~6.7). AM-74 was the most sweet
and least metallic, and AM-83 was the least sweet. ‘Ison’ was the most sour and metallic, and
‘Summit’ was the least sour. The sweetness ranged from 6.3-7.9 with a score of 5 = 5% solution
of sucrose. The sourness ranged from 2.7-3.9 with a reference of 2 = 0.05% solution of citric
acid.
The panelists evaluated aromatics (overall aromatic impact, grape/overall,
grape/muscadine, grape/other, fruity, floral, earthy/dirty, mold/mildew, and overripe) of five
berries (Table 4). All of the aromatic attributes were less than 10 on the 15-point scale indicating
mid-low aromatic intensity. Of the attributes, the panelists detected differences between
genotypes in overall aromatic impact, grape/overall, and overripe, but all other attributes were
not significantly different. AM-9 was the most overripe although the value was very low (<1).
Although the overripe attribute was significant, these values were mostly zero. AM-83 had the
least overall aromatic impact and grape/overall aromatics. ‘Summit’ had the most overall
aromatic impact, however, AM-9 had the most grape/overall aromatics. The panelists found that
the fruit had low levels of grape/other (0.4), floral (0.7), earthy/dirty (1.0), green/unripe (1.8),
and mold/mildew (0.3).
The panelists evaluated texture (uniformity of berry hardness, berry hardness, moisture
release, awareness of skins, pulp crispness, detachability, fibrousness between teeth, and seed
separation) of the five-berry sample (Fig. 3). However, no differences were found among the
genotypes for these attributes. Uniformity of berry hardness had an average score of 12.13
indicating mid to high uniformity of intensity. All genotypes had a mid-high intensity with
respect to awareness of skins (12.95), detachability (11.93), and seed separation (10.32).
Panelists found a medium intensity for all genotypes with respect to berry hardness (8.30) and
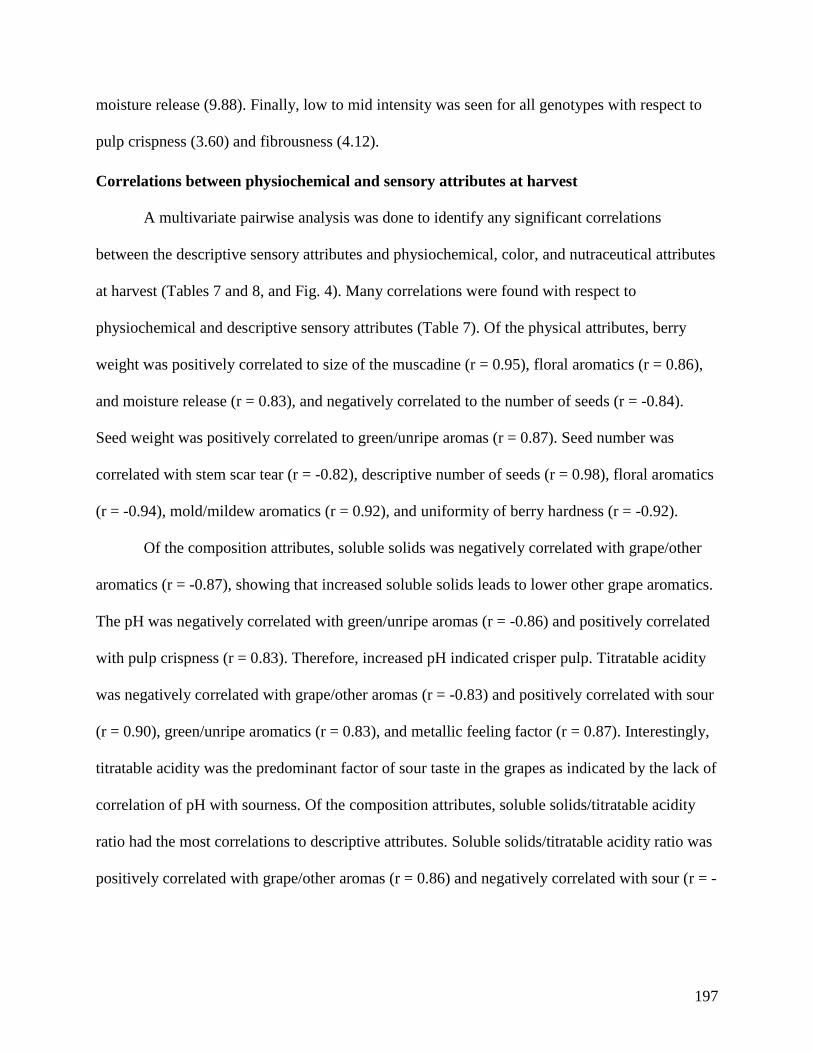
197
moisture release (9.88). Finally, low to mid intensity was seen for all genotypes with respect to
pulp crispness (3.60) and fibrousness (4.12).
Correlations between physiochemical and sensory attributes at harvest
A multivariate pairwise analysis was done to identify any significant correlations
between the descriptive sensory attributes and physiochemical, color, and nutraceutical attributes
at harvest (Tables 7 and 8, and Fig. 4). Many correlations were found with respect to
physiochemical and descriptive sensory attributes (Table 7). Of the physical attributes, berry
weight was positively correlated to size of the muscadine (r = 0.95), floral aromatics (r = 0.86),
and moisture release (r = 0.83), and negatively correlated to the number of seeds (r = -0.84).
Seed weight was positively correlated to green/unripe aromas (r = 0.87). Seed number was
correlated with stem scar tear (r = -0.82), descriptive number of seeds (r = 0.98), floral aromatics
(r = -0.94), mold/mildew aromatics (r = 0.92), and uniformity of berry hardness (r = -0.92).
Of the composition attributes, soluble solids was negatively correlated with grape/other
aromatics (r = -0.87), showing that increased soluble solids leads to lower other grape aromatics.
The pH was negatively correlated with green/unripe aromas (r = -0.86) and positively correlated
with pulp crispness (r = 0.83). Therefore, increased pH indicated crisper pulp. Titratable acidity
was negatively correlated with grape/other aromas (r = -0.83) and positively correlated with sour
(r = 0.90), green/unripe aromatics (r = 0.83), and metallic feeling factor (r = 0.87). Interestingly,
titratable acidity was the predominant factor of sour taste in the grapes as indicated by the lack of
correlation of pH with sourness. Of the composition attributes, soluble solids/titratable acidity
ratio had the most correlations to descriptive attributes. Soluble solids/titratable acidity ratio was
positively correlated with grape/other aromas (r = 0.86) and negatively correlated with sour (r = -
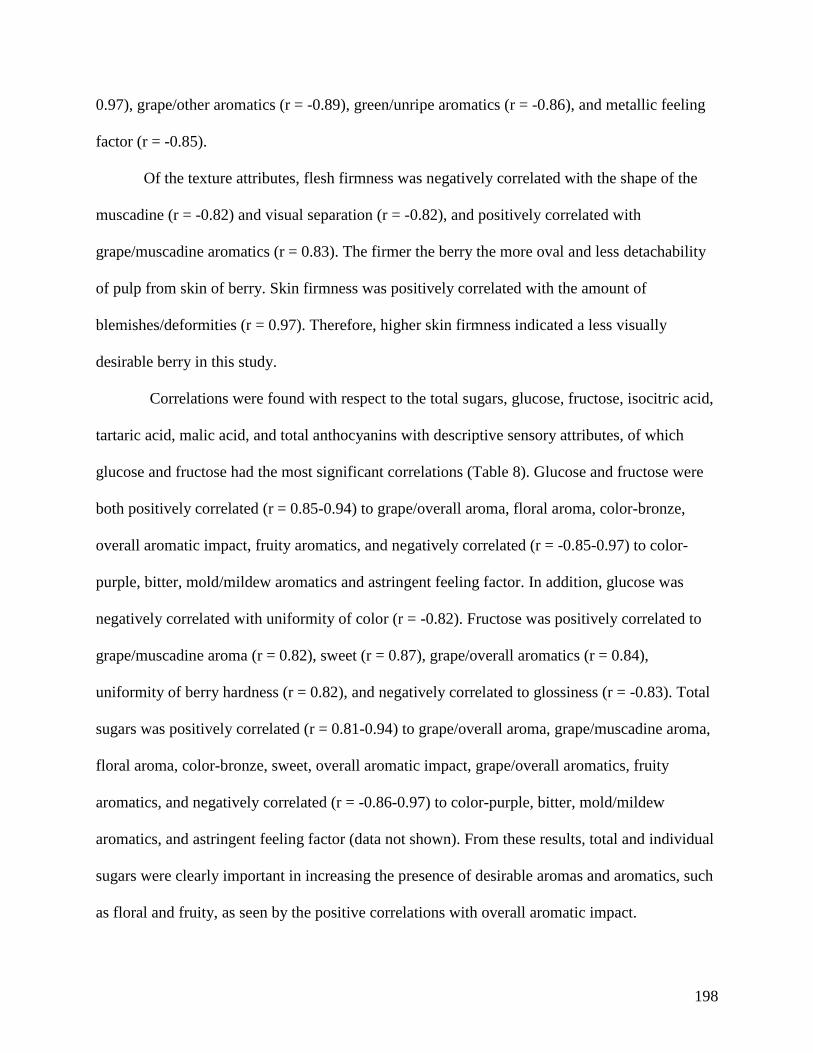
198
0.97), grape/other aromatics (r = -0.89), green/unripe aromatics (r = -0.86), and metallic feeling
factor (r = -0.85).
Of the texture attributes, flesh firmness was negatively correlated with the shape of the
muscadine (r = -0.82) and visual separation (r = -0.82), and positively correlated with
grape/muscadine aromatics (r = 0.83). The firmer the berry the more oval and less detachability
of pulp from skin of berry. Skin firmness was positively correlated with the amount of
blemishes/deformities (r = 0.97). Therefore, higher skin firmness indicated a less visually
desirable berry in this study.
Correlations were found with respect to the total sugars, glucose, fructose, isocitric acid,
tartaric acid, malic acid, and total anthocyanins with descriptive sensory attributes, of which
glucose and fructose had the most significant correlations (Table 8). Glucose and fructose were
both positively correlated (r = 0.85-0.94) to grape/overall aroma, floral aroma, color-bronze,
overall aromatic impact, fruity aromatics, and negatively correlated (r = -0.85-0.97) to color-
purple, bitter, mold/mildew aromatics and astringent feeling factor. In addition, glucose was
negatively correlated with uniformity of color (r = -0.82). Fructose was positively correlated to
grape/muscadine aroma (r = 0.82), sweet (r = 0.87), grape/overall aromatics (r = 0.84),
uniformity of berry hardness (r = 0.82), and negatively correlated to glossiness (r = -0.83). Total
sugars was positively correlated (r = 0.81-0.94) to grape/overall aroma, grape/muscadine aroma,
floral aroma, color-bronze, sweet, overall aromatic impact, grape/overall aromatics, fruity
aromatics, and negatively correlated (r = -0.86-0.97) to color-purple, bitter, mold/mildew
aromatics, and astringent feeling factor (data not shown). From these results, total and individual
sugars were clearly important in increasing the presence of desirable aromas and aromatics, such
as floral and fruity, as seen by the positive correlations with overall aromatic impact.
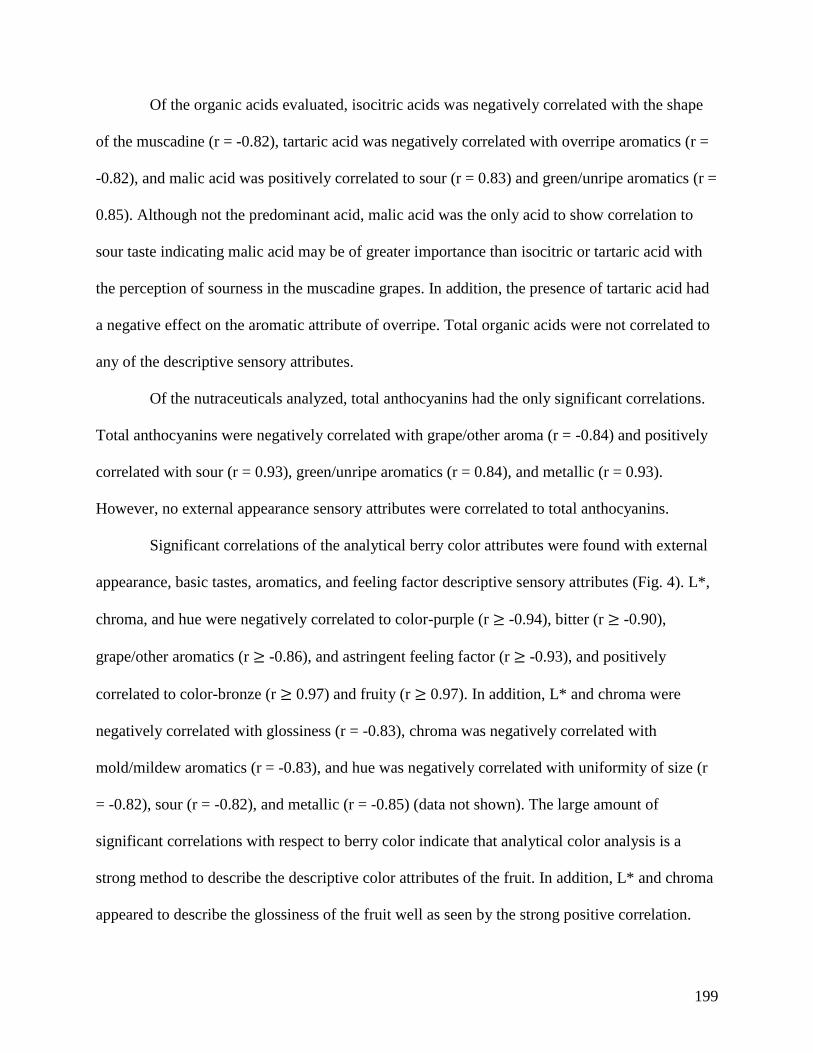
199
Of the organic acids evaluated, isocitric acids was negatively correlated with the shape
of the muscadine (r = -0.82), tartaric acid was negatively correlated with overripe aromatics (r =
-0.82), and malic acid was positively correlated to sour (r = 0.83) and green/unripe aromatics (r =
0.85). Although not the predominant acid, malic acid was the only acid to show correlation to
sour taste indicating malic acid may be of greater importance than isocitric or tartaric acid with
the perception of sourness in the muscadine grapes. In addition, the presence of tartaric acid had
a negative effect on the aromatic attribute of overripe. Total organic acids were not correlated to
any of the descriptive sensory attributes.
Of the nutraceuticals analyzed, total anthocyanins had the only significant correlations.
Total anthocyanins were negatively correlated with grape/other aroma (r = -0.84) and positively
correlated with sour (r = 0.93), green/unripe aromatics (r = 0.84), and metallic (r = 0.93).
However, no external appearance sensory attributes were correlated to total anthocyanins.
Significant correlations of the analytical berry color attributes were found with external
appearance, basic tastes, aromatics, and feeling factor descriptive sensory attributes (Fig. 4). L*,
chroma, and hue were negatively correlated to color-purple (r ≥ -0.94), bitter (r ≥ -0.90),
grape/other aromatics (r ≥ -0.86), and astringent feeling factor (r ≥ -0.93), and positively
correlated to color-bronze (r ≥ 0.97) and fruity (r ≥ 0.97). In addition, L* and chroma were
negatively correlated with glossiness (r = -0.83), chroma was negatively correlated with
mold/mildew aromatics (r = -0.83), and hue was negatively correlated with uniformity of size (r
= -0.82), sour (r = -0.82), and metallic (r = -0.85) (data not shown). The large amount of
significant correlations with respect to berry color indicate that analytical color analysis is a
strong method to describe the descriptive color attributes of the fruit. In addition, L* and chroma
appeared to describe the glossiness of the fruit well as seen by the strong positive correlation.
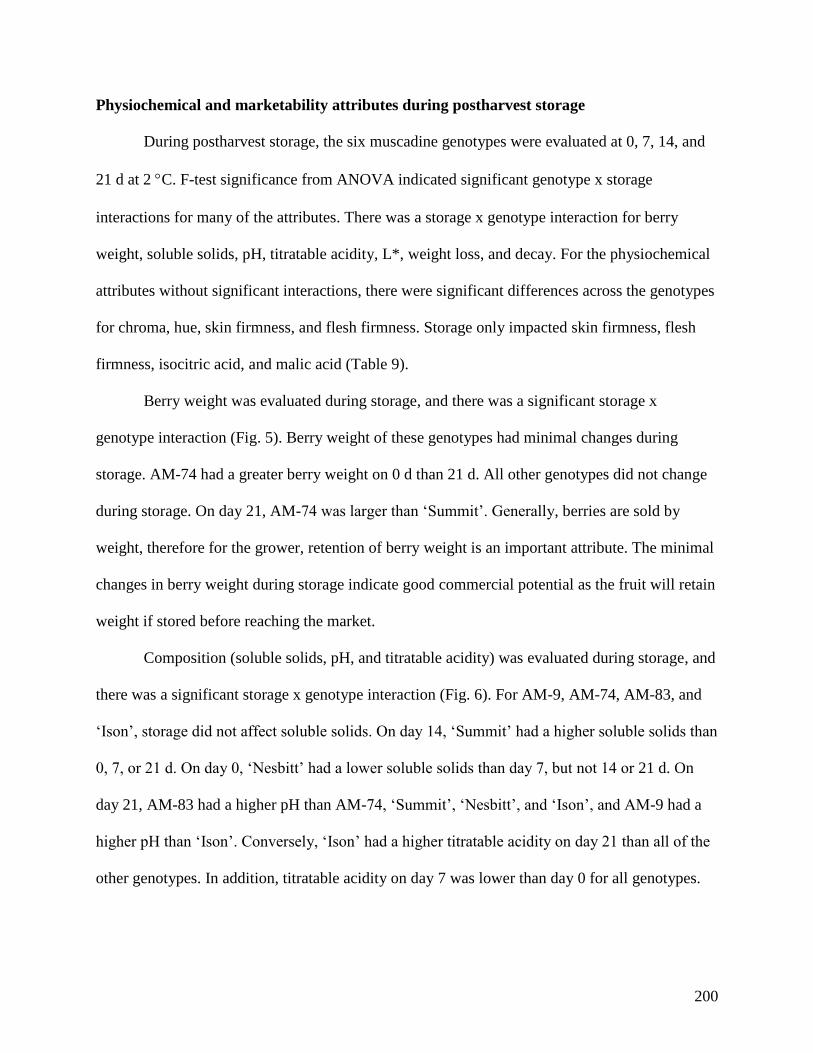
200
Physiochemical and marketability attributes during postharvest storage
During postharvest storage, the six muscadine genotypes were evaluated at 0, 7, 14, and
21 d at 2 C. F-test significance from ANOVA indicated significant genotype x storage
interactions for many of the attributes. There was a storage x genotype interaction for berry
weight, soluble solids, pH, titratable acidity, L*, weight loss, and decay. For the physiochemical
attributes without significant interactions, there were significant differences across the genotypes
for chroma, hue, skin firmness, and flesh firmness. Storage only impacted skin firmness, flesh
firmness, isocitric acid, and malic acid (Table 9).
Berry weight was evaluated during storage, and there was a significant storage x
genotype interaction (Fig. 5). Berry weight of these genotypes had minimal changes during
storage. AM-74 had a greater berry weight on 0 d than 21 d. All other genotypes did not change
during storage. On day 21, AM-74 was larger than ‘Summit’. Generally, berries are sold by
weight, therefore for the grower, retention of berry weight is an important attribute. The minimal
changes in berry weight during storage indicate good commercial potential as the fruit will retain
weight if stored before reaching the market.
Composition (soluble solids, pH, and titratable acidity) was evaluated during storage, and
there was a significant storage x genotype interaction (Fig. 6). For AM-9, AM-74, AM-83, and
‘Ison’, storage did not affect soluble solids. On day 14, ‘Summit’ had a higher soluble solids than
0, 7, or 21 d. On day 0, ‘Nesbitt’ had a lower soluble solids than day 7, but not 14 or 21 d. On
day 21, AM-83 had a higher pH than AM-74, ‘Summit’, ‘Nesbitt’, and ‘Ison’, and AM-9 had a
higher pH than ‘Ison’. Conversely, ‘Ison’ had a higher titratable acidity on day 21 than all of the
other genotypes. In addition, titratable acidity on day 7 was lower than day 0 for all genotypes.

201
Color attributes (L*, chroma, and hue) were evaluated during storage. There was a
significant storage x genotype interaction of L* (Fig. 7). AM-74 and ‘Summit’ had the highest
L* values during storage. On day 21, ‘Summit’ had a lower L* value than day 0 indicating a
darkening of the fruit. AM-9, AM-83, ‘Ison’, and ‘Nesbit’ had similar L* values and were not
affected by storage. ‘Summit’ and AM-74 had the highest chroma values (16.10 and 16.05,
respectively), and AM-83 had the lowest (2.88) (Table 10). Similarly, Summit’ and AM-74 had
the highest hue values (86.27 and 89.88, respectively), and ‘Ison’ had the lowest (13.92). There
were no differences in hue within the black genotypes or the bronze genotypes. Storage did not
impact chroma or hue.
Firmness attributes (flesh firmness and skin firmness) were evaluated during storage
(Table 10). AM-83 had the highest flesh firmness (1.94 N) and skin firmness (1.32 N/mm).
‘Nesbitt’ (1.06 N) had the lowest flesh firmness, and AM-9 (0.80 N/mm) and ‘Ison’ (0.80
N/mm) had the lowest skin firmness. Storage impacted flesh firmness and skin firmness. During
storage, flesh firmness was greater at day 21 than day 7, and skin firmness at day 21 was less
than day 0. There was a trend for increased texture of the muscadines during storage.
Total organic acids and sugars were evaluated during storage, but genotype did not have
an impact on these attributes (Table 10). Total sugars were 7.91 g/100 g, and the average amount
of glucose and fructose was 3.98 g/100 g, and 3.99 g/100 g, respectively. The average tartaric
acid, isocitric acid, and malic acid was 0.28 g/100 g, 0.08 g/100 g, and 0.16 g/100 g,
respectively. Storage had a significant effect on isocitric and malic acid. On day 0, isocitric acid
was higher than 7, 14, or 21 d. On day 0, malic acid was greater than day 7, but not 14 or 21 d.
Marketability (weight loss and unmarketable fruit) was evaluated during storage, and
there was a significant storage x genotype interaction (Fig. 8). On day 21, weight loss was
202
greater than 0, 7, and 14 d for all genotypes. ‘Ison’ and AM-74 had the most weight loss on day
21, and AM-9 had the least. ‘Summit’ had the most unmarketable fruit on 21 d. There was no
difference in unmarketable fruit between AM-9, AM-83, ‘Ison’, and ‘Nesbitt’ during storage. As
fruit became more unmarketable due to browning or decay, the intensity of the color increased as
indicated by a positive correlation with chroma.
At 21 d of storage at 2 C, AM-9 performed well with the lowest weight loss and
unmarketable fruit (Fig. 9). The two bronze genotypes, AM-74 and ‘Summit’, performed poorly
with respect to unmarketable fruit as the blemishes were more visible on the lighter-colored fruit.
‘Ison’ had the most weight loss at 21 d storage, but also had one of the highest flesh firmness
values. Overall, no one genotype exceled or failed in all marketability and texture attribute areas,
and the fruit performed exceptionally well with low weight loss (<5%) and low unmarketable
fruit (<11% for the black genotypes and <28% for the bronze).
Conclusion
In order to improve the consumer acceptance of muscadine grapes, an initial
understanding of how the fruit is perceived must first be investigated. Utilizing a combination of
physiochemical and sensory analysis, a greater understanding of how the consumer perceives the
fruit was obtained. The descriptive sensory analysis differentiated well between genotypes for
external appearance, internal appearance, and basic taste attributes, more specifically with
positive attributes rather than negative, but poorly with the selected aroma, aromatic, and texture
attributes. This indicated that of the attributes evaluated in this study, descriptive sensory
analysis was best suited for appearance and basic taste attributes. Conversely, of the texture
attributes evaluated by the panelists, no differentiation was seen indicating that better descriptors
and references need to be selected for further studies. Physiochemical attributes such as berry

203
color, composition, and sugars had the most significant correlations with descriptive sensory. For
attributes such as soluble solids/titratable acidity ratio, a higher ratio indicated that the fruit was
perceived as riper and potentially more desirable as negative attributes such as green/unripe
aromatics, sour basic taste, and metallic feeling factor decreased. Additionally, higher levels of
glucose and fructose indicated a positive effect on the pleasant aromatics of the fruit, and a
negative effect of the displeasing aromatics and external appearance. Retention of native
muscadine aroma and aromatics, while improving the grape texture is important moving forward
in muscadine breeding programs. Although the panelists were unable to distinguish between
genotypes for texture attributes, analytical texture analysis was correlated to external and internal
appearance and aromatic attributes, indicating that firmness (skin and flesh) plays a role in how
the berry is perceived both visually and aromatically. Results from this study indicated that
descriptive sensory analysis has the potential to describe muscadine grapes well, and current
analytical evaluation methods describe the fruit appropriately as seen by strong correlations.
Overall, genotype had the most impact on the postharvest quality of fresh-market
muscadine grapes grown in Arkansas. Malic acid, isocitric acid, skin firmness, and flesh
firmness were affected by storage. The changes in these attributes during storage indicated a
change in fruit quality, by decreased malic and isocitric acid, increased flesh firmness, decreased
skin firmness. For most genotypes, berry weight, soluble solids, and color (L*, chroma, and hue)
did not change during storage indicating no quality degradation from harvest. Additionally,
evaluation of the fruit at 21 d postharvest storage at 2 °C indicated that while no one genotype
performed well in all categories, AM-9 had exceptional marketability with low weight loss
(<2.5%) and unmarketable fruit (<6.0%). The black genotypes performed better than the bronze
genotypes with respect to unmarketable fruit as the blemishes were more visible on the lighter

204
colored fruit. In addition, ‘Ison’ retained texture well at 21 d of storage as seen by a high flesh
firmness and low skin firmness. Overall, the muscadine grapes had good retention of
compositional attributes and marketability indicating strong potential for fresh-market.
205
Literature Cited
Ballinger, W.E. and W.B. Nesbitt. 1982. Postharvest decay of muscadine grapes (Carlos) in
relation to storage temperature, time, and stem condition Amer. J. Enol. Viticul. 33:173-
175.
Barchenger, D.W., 2014. Postharvest storage and nutraceutical evaluation of muscadine
grapes (Vitis rotundifolia Michx.). University of Arkansas, Fayetteville, M.S. Thesis.
Barchenger, D.W., J.R. Clark, R.T. Threlfall, L.R. Howard, and C.R. Brownmiller. 2015.
Nutraceutical changes in muscadine grape and grape segments during storage. J. Amer.
Pomol. Soc. 69:66-73.
Benmeziane, F., Y. Cadot, R. Djamai, and L. Djermoun. 2016. Determination of major
anthocyanin pigments and flavonols in red grape skin of some table grape varieties (Vitis
vinifera sp.) by high-performance liquid chromatography–photodiode array detection
(HPLC-DAD). OENO One 50(3):1-16.
Bouquet, A., 1981. Resistance to grape fanleaf virus in muscadine grape inoculated with
Xiphinema index. Plant Disease 65:791-793.
Brown, K., C. Sims, A. Odabasi, L. Bartoshuk, P. Conner, and D. Gray. 2016. Consumer
acceptability of fresh‐market muscadine grapes. J. Food Sci. 81:S2808-2816.
Carpio, C.E., C.D. Safley, and E.B. Poling. 2008. Estimated costs and investment analysis of
producing and harvesting muscadine grapes in the southeastern United States.
HortTechnology 18:308-317.
Cho, M.J., L.R. Howard, R.L Prior, and J.R. Clark. 2004. Flavonoid glycosides and antioxidant
capacity of various blackberry, blueberry, and red grape genotypes determined by high-
performance liquid chromatography/ mass spectrometry. J. Food Sci. and Agr. 84:1771-
1782.
Cho, M.J., L.R. Howard, R.L. Prior, and J.R. Clark. 2005. Flavonol glycosides and antioxidant
capacity of various blackberry and blueberry genotypes determined by high‐performance
liquid chromatography/mass spectrometry. J. Sci. Food. Agr. 85:2149‐2158.
CIE et a la CEI edn, Bureau central de la CIE, Paris.C.I.E. 1986. Colorimetry. 15.2. 2d ed.
Commission Internationale de l’Eclairage, Vienna.
Clark, J.R. and D.W Barchenger. 2014. Breeding Muscadine grapes in Arkansas, USA: a
new initiative. In XI Intl. Conf. Grapevine Breeding Genet. 1082:95-98 (abstr).
Cline, B. and C. Fisk. 2006. Overview of muscadine grape acreage, cultivars and production
206
areas in the southeastern U.S. Muscadine Grape Workshop for Cooperative Extension
Agents, 2006. The Southern Region Small Fruit Consortium. 25 July 2007. http://www.
smallfruits.org/CoAgentTraining/ Sept06Training/No1Muscadine_acres_ and_cultivars.pdf.
Colaric, M., R. Veberic, F. Stampar, and M. Hudina. 2005. Evaluation of peach and nectarine
fruit quality and correlations between sensory and chemical attributes. J. Sci. Food Agri.
85:2611-2616.
Conner, P.J., 2013. Instrumental textural analysis of muscadine grape germplasm. HortScience
48:1130-1134.
Conner, P.J. and D. MacLean. 2013. Fruit anthocyanin profile and Berry color of muscadeine
grape cultivars and Muscadinia germaplasm. HortScience 48:1235-1240.
Contador, L., M. Díaz, E. Hernández, P. Shinya, and R. Infante. 2017. The relationship between
instrumental tests and sensory determinations of peach and nectarine texture. European J.
Hort. Sci. 81:189-196.
Crisosto, C.H. and G.M. Crisosto. 2005. Relationship between ripe soluble solids concentration
(RSSC) and consumer acceptance of high and low acid melting flesh peach and nectarine
(Prunus persica (L.) Batsch) cultivars. Postharvest Bio. Technol. 38:239-246.
Degner, R.L. and K. Mathis. 1980. Consumer acceptance of muscadine grapes. Proc. Fla. State
Hort. Soc. 93:140-143.
Ector, B.J., 2001. Compositional and nutritional characteristics. Muscadine grapes. ASHS Press,
Alexandria, VA. 341-367.
Flora, L.F., 1979. Optimum quality parameters of muscadine grape juices, beverages, and blends.
J. Food Quality 2:219-229.
Greenspan, P., J.D. Bauer, S.H. Pollock, J.D. Gangemi, E.P. Mayer, A. Ghaffar, J.L. Hargrove,
and D.K. Hartle. 2005. Antiinflammatory properties of the muscadine grape (Vitis
rotundifolia). J. Agric. Food Chem. 53:8481–8484.
Hager, T., R. Prior, and L. Howard. 2008. Processing and storage effects on monomeric
anthocyanins, percent polymeric color, and antioxidant capacity of processed blackberry
products. J. Agr. Food Chem. 56:689–695.
Hedrick, U.P. 1908. The grapes of New York. State of New York Dept. Agr. 15th Annu. Rpt.
3(2).
Hopkins, D.L., H.H. Mollenhauer, and J.A. Mortensen. 1974. Tolerance to Pierce's disease and
the associated rickettsia-like bacterium in muscadine grape [Cultivars, breeding]. J.Amer.
Soc. Hort. Sci.

207
Lee, J.H. and S.T. Talcott. 2002. Ellagic acid and ellagitannins affect on sedimentation in
muscadine juice and wine. J. Agri. Food Chem. 50:3971-3976.
Mattivi, F., R. Guzzon, U. Vrhovsek, M. Stefanini, and R. Velasco. 2006. Metabolite profiling
of grape: flavonols and anthocyanins. J. Agr. Food Chem. 54:7692-7702.
Meullenet, J.F., C. Lovely, R. Threlfall, J.R. Morris, and R.K. Striegler. 2008. An ideal point
density plot method for determining an optimal sensory profile for Muscadine grape
juice. Food Quality and Preference 19:210-219.
Morris, J. and P. Brady, 2004. The muscadine experience: adding value to enhance profits.
Ark. Agri. Exp. Station/Division of Agriculture/University of Arkansas System,
Fayetteville, AR.
Olien, W.C., 1990. The muscadine grape: botany, viticulture, history, and current industry.
HortScience 25:732-739.
Pastrana-Bonilla, E., C.C. Akoh, S. Sellappan, and G. Krewer. 2003. Phenolic content and
antioxidant capacity of muscadine grapes. J. Agric. Food Chem. 51:5497-5503.
Ren, Z. and J. Lu. 2002. Muscadine rootstock increased the resistance of Florida hybrid bunch
grape cv. Blanc du Bois to Pierce and Anthracnose diseases. Proc. Fla. State Hort.
Soc. 115:108-110
Sandhu, A.K. and L. Gu. 2010. Antioxidant capacity, phenolic content, and profiling of phenolic
compounds in the seeds, skin, and pulp of Vitis rotundifolia (muscadine grapes) as
determined by HPLC-DAD-ESI-MS n. J. Agric. Food Chem. 58:4681-4692.
Segantini, D.M., R.T Threlfall, J.R. Clark, L.R. Howard, and C.R. Brownmiller. 2018,
Physiochemical changes in floricane and primocane blackberries harvested from primocane
genotypes, HortScience 53:9-15.
Striegler, R.K., J.R. Morris, P.M. Carter, J.R. Clark, R.T. Threlfall and L.R. Howard. 2005.
Yield, quality, and nutraceutical potential of selected muscadine cultivars grown in
southwestern Arkansas. HortTechnology 15:276-284.
Threlfall, R.T., J.R. Morris, J.F. Meullenet, and R.K. Striegler. 2007. Sensory characteristics,
composition, and nutraceutical content of juice from Vitis rotundifolia (muscadine)
cultivars. Amer. J. Enol. Viticul. 58:268-273.
Trappey, A.F., C.E. Johnson, and P.W. Wilson. 2007. Consumer Acceptance of Mayhaw
(Crataegus opaca Hook, and Arn.) Juice Blended with Muscadine Grape (Vitis
rotundifolia Michx.) Juice. Intl. J. Fruit Sci. 6:53-65.
Walker, T.L., J.R. Morris, R.T. Threlfall, G.L. Main, O. Lamikanra, and S. Leong. 2001. Density
208
separation, storage, shelf life, and sensory evaluation of ‘Fry’ muscadine grapes.
HortScience 36:941- 945.
Walker, T., J. Morris, R. Threlfall, and G. Main. 2003. Analysis of wine components in
Cynthiana and Syrah wines, J. Agri. Food Chem., 51:1543-1547.
Wang, X., H. Tong, F. Chen, and J.D. Gangemi. 2010, Chemical characterization and antioxidant
evaluation of muscadine grape pomace extract, Food Chem. 123:1156-1162.
Yi, W., J. Fischer, and C.C. Akoh. 2005. Study of anticancer activities of muscadine grape
phenolics in vitro. J. Agric. Food Chem. 53:8804–8812.

209
Tables
Table 1. Lexicon developed for fresh-market peaches and nectarines attributes by a descriptive
sensory panel with ten trained panelists.
Term
Definition
Technique
Reference
Aroma (whole berry)
Grape/overall Smell associated with fresh
grapes
Fresh grapes Intensities based on
universal scalez
Grape/muscadine Smell associated with fresh
muscadine
Ripe muscadine Intensities based on
universal scale
Grape/other Smell associated with other grape
species
Any grape aroma other
than muscadine i.e.
Concord
Intensities based on
universal scale
Fruity Smell associated with fruits other
than grapes
Intensities based on
universal scale
Floral Smell associated with floral
aromas
Intensities based on
universal scale
Earthy/dirty Smell associated with damp soil
or wet foliage
Damp potting soil Intensities based on
universal scale
Green/unripe Smell associated with freshly cut
green vegetation; unripe
Unripe banana Intensities based on
universal scale
Mold/mildew Smell associated with moldy or
mildew aromas
Old mildewed clothes Intensities based on
universal scale
Overripe Smell associated with overripe
aromas
Intensities based on
universal scale
Appearance (exterior of whole berry)
Uniformity of color Ratio of uniformity of color on
the exterior of the muscadines
Observe the five berries
and rate the degree to
which the sample is
uniform in color.
(un-uniform to uniform)
Ratio of color
uniformity
0%=0, 50%=7.5,
100%=15
Color- red Intensity of red of the sample
Color- green Intensity of green of the sample

210
Table 1. (Continued)
Term
Definition
Technique
Reference
Glossiness Degree to which the
surface of the berry shines
Observe the sample and
determine the degree to which
the surface shines.
(dull to wet/shiny)
Copy paper = 3.0, Photo paper
= 15.0
Uniformity of
size
Ratio of uniformity of size Observe the five berries and rate
the degree to which the sample
is uniform in size.
(un-uniform to uniform)
Ratio of size uniformity
0%=0, 50%=7.5, 100%=15
Size of
muscadine
Visual size of the sample Observe the sample and
determine the overall size of the
sample.
(small to large)
Photo reference of size of
circlesy
A=15.0 (1.5 inches), B=11.0
(1.25 inches), C=7.5 (1.0
inches), D=4.0 (0.75 inches),
E=1.0 (0.5 inches)
Shape of
muscadine
Visual shape of the sample Observe the sample and
determine the overall shape of
the sample.
(oval to round)
Egg/oval=5.0, 2.5-inch ball
=15.0
Amount of
specks
Visual ratio of specks on
the sample
Observe the berry and determine
the amount of specks on the
surface.
(none to much)
Ratio of specks
0%=0, 50%=7.5, 100%=15
Amount of
blemishes/
Deformities
Visual ratio of
blemishes/deformities on
the sample
Observe the berry and determine
the amount of
blemishes/deformities on the
surface.
(none to much)
Ratio of blemishes and
deformities
0%=0, 50%=7.5, 100%=15
Stem scar tear Visual presence of tear of
the stem scar
Observe the berry and determine
if there is a tear at the scar
bigger than the scar.
(yes or no)
Yes (=1) or no (=0)
Appearance (pulp of berry cut in half)
Visual
separation
Detachability of pulp from
skin of berry
Squeeze half of berry and
observe the extent of which the
pulp detaches from the skin.
(none to much)
Amount of seeds Number of seed present in
the berry
Count the number of seeds.
Seed size Visual size of the seeds Observe the seeds and
determine the overall size.
(small to large)
Photo reference of sizex
A=12 (5.3 x 8.5 mm)
B=7 (4.9 x 7.1 mm)
C=3 (3.9 x 6.1 mm)
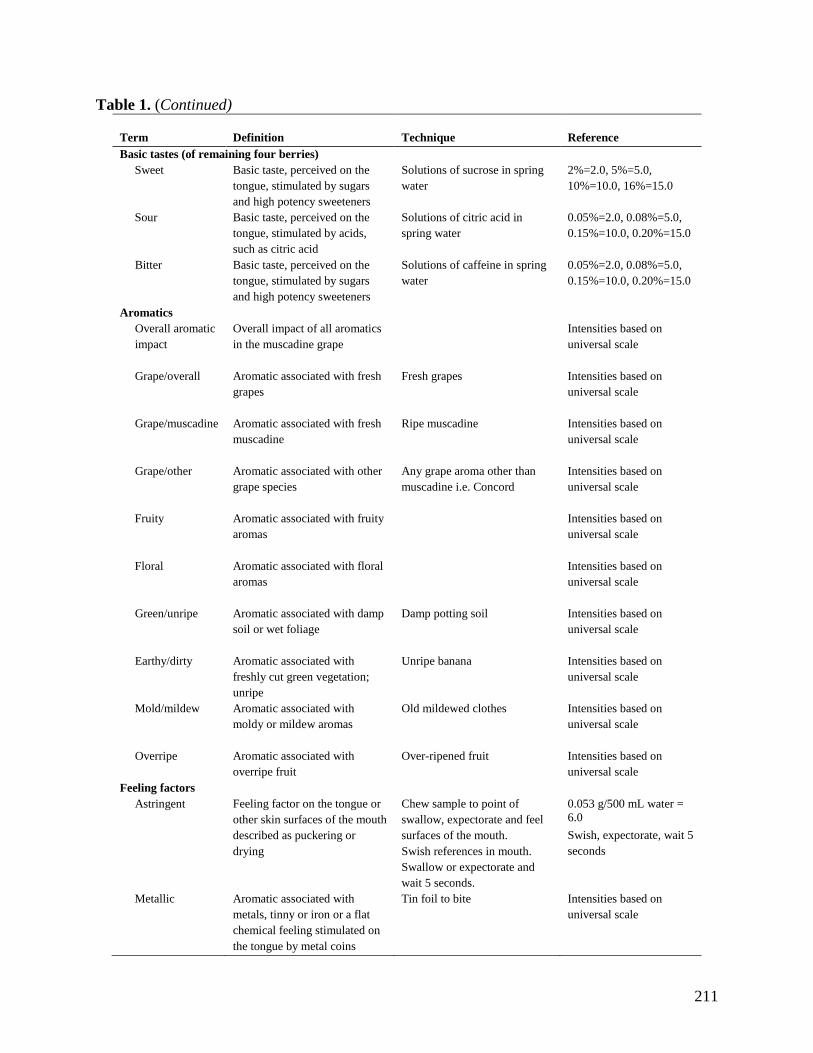
211
Table 1. (Continued)
Term
Definition
Technique
Reference
Basic tastes (of remaining four berries)
Sweet Basic taste, perceived on the
tongue, stimulated by sugars
and high potency sweeteners
Solutions of sucrose in spring
water
2%=2.0, 5%=5.0,
10%=10.0, 16%=15.0
Sour Basic taste, perceived on the
tongue, stimulated by acids,
such as citric acid
Solutions of citric acid in
spring water
0.05%=2.0, 0.08%=5.0,
0.15%=10.0, 0.20%=15.0
Bitter Basic taste, perceived on the
tongue, stimulated by sugars
and high potency sweeteners
Solutions of caffeine in spring
water
0.05%=2.0, 0.08%=5.0,
0.15%=10.0, 0.20%=15.0
Aromatics
Overall aromatic
impact
Overall impact of all aromatics
in the muscadine grape
Intensities based on
universal scale
Grape/overall Aromatic associated with fresh
grapes
Fresh grapes Intensities based on
universal scale
Grape/muscadine Aromatic associated with fresh
muscadine
Ripe muscadine Intensities based on
universal scale
Grape/other Aromatic associated with other
grape species
Any grape aroma other than
muscadine i.e. Concord
Intensities based on
universal scale
Fruity Aromatic associated with fruity
aromas
Intensities based on
universal scale
Floral Aromatic associated with floral
aromas
Intensities based on
universal scale
Green/unripe Aromatic associated with damp
soil or wet foliage
Damp potting soil Intensities based on
universal scale
Earthy/dirty Aromatic associated with
freshly cut green vegetation;
unripe
Unripe banana Intensities based on
universal scale
Mold/mildew Aromatic associated with
moldy or mildew aromas
Old mildewed clothes Intensities based on
universal scale
Overripe Aromatic associated with
overripe fruit
Over-ripened fruit Intensities based on
universal scale
Feeling factors
Astringent Feeling factor on the tongue or
other skin surfaces of the mouth
described as puckering or
drying
Chew sample to point of
swallow, expectorate and feel
surfaces of the mouth.
Swish references in mouth.
Swallow or expectorate and
wait 5 seconds.
0.053 g/500 mL water =
6.0
Swish, expectorate, wait 5
seconds
Metallic Aromatic associated with
metals, tinny or iron or a flat
chemical feeling stimulated on
the tongue by metal coins
Tin foil to bite Intensities based on
universal scale
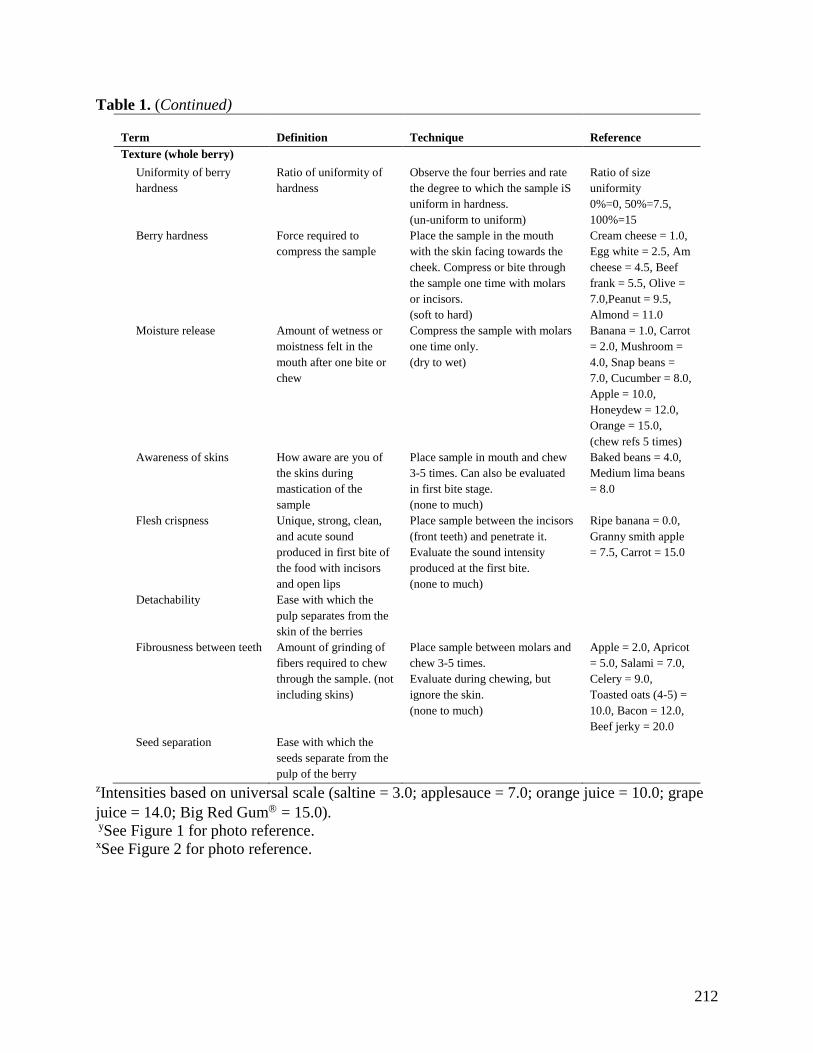
212
Table 1. (Continued)
Term
Definition
Technique
Reference
Texture (whole berry)
Uniformity of berry
hardness
Ratio of uniformity of
hardness
Observe the four berries and rate
the degree to which the sample iS
uniform in hardness.
(un-uniform to uniform)
Ratio of size
uniformity
0%=0, 50%=7.5,
100%=15
Berry hardness Force required to
compress the sample
Place the sample in the mouth
with the skin facing towards the
cheek. Compress or bite through
the sample one time with molars
or incisors.
(soft to hard)
Cream cheese = 1.0,
Egg white = 2.5, Am
cheese = 4.5, Beef
frank = 5.5, Olive =
7.0,Peanut = 9.5,
Almond = 11.0
Moisture release Amount of wetness or
moistness felt in the
mouth after one bite or
chew
Compress the sample with molars
one time only.
(dry to wet)
Banana = 1.0, Carrot
= 2.0, Mushroom =
4.0, Snap beans =
7.0, Cucumber = 8.0,
Apple = 10.0,
Honeydew = 12.0,
Orange = 15.0,
(chew refs 5 times)
Awareness of skins How aware are you of
the skins during
mastication of the
sample
Place sample in mouth and chew
3-5 times. Can also be evaluated
in first bite stage.
(none to much)
Baked beans = 4.0,
Medium lima beans
= 8.0
Flesh crispness Unique, strong, clean,
and acute sound
produced in first bite of
the food with incisors
and open lips
Place sample between the incisors
(front teeth) and penetrate it.
Evaluate the sound intensity
produced at the first bite.
(none to much)
Ripe banana = 0.0,
Granny smith apple
= 7.5, Carrot = 15.0
Detachability Ease with which the
pulp separates from the
skin of the berries
Fibrousness between teeth Amount of grinding of
fibers required to chew
through the sample. (not
including skins)
Place sample between molars and
chew 3-5 times.
Evaluate during chewing, but
ignore the skin.
(none to much)
Apple = 2.0, Apricot
= 5.0, Salami = 7.0,
Celery = 9.0,
Toasted oats (4-5) =
10.0, Bacon = 12.0,
Beef jerky = 20.0
Seed separation Ease with which the
seeds separate from the
pulp of the berry
zIntensities based on universal scale (saltine = 3.0; applesauce = 7.0; orange juice = 10.0; grape
juice = 14.0; Big Red Gum = 15.0). ySee Figure 1 for photo reference. xSee Figure 2 for photo reference.
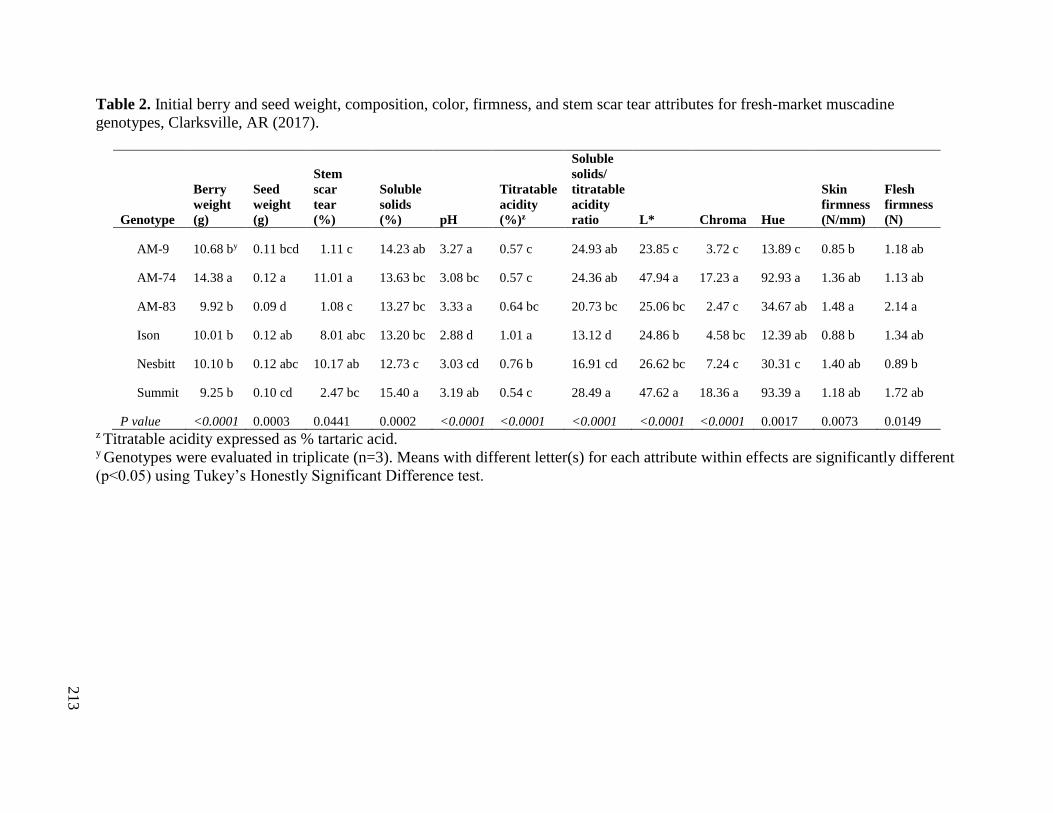
213
Table 2. Initial berry and seed weight, composition, color, firmness, and stem scar tear attributes for fresh-market muscadine
genotypes, Clarksville, AR (2017).
Genotype
Berry
weight
(g)
Seed
weight
(g)
Stem
scar
tear
(%)
Soluble
solids
(%) pH
Titratable
acidity
(%)z
Soluble
solids/
titratable
acidity
ratio L* Chroma Hue
Skin
firmness
(N/mm)
Flesh
firmness
(N)
AM-9 10.68 by 0.11 bcd 1.11 c 14.23 ab 3.27 a 0.57 c 24.93 ab 23.85 c 3.72 c 13.89 c 0.85 b 1.18 ab
AM-74 14.38 a 0.12 a 11.01 a 13.63 bc 3.08 bc 0.57 c 24.36 ab 47.94 a 17.23 a 92.93 a 1.36 ab 1.13 ab
AM-83 9.92 b 0.09 d 1.08 c 13.27 bc 3.33 a 0.64 bc 20.73 bc 25.06 bc 2.47 c 34.67 ab 1.48 a 2.14 a
Ison 10.01 b 0.12 ab 8.01 abc 13.20 bc 2.88 d 1.01 a 13.12 d 24.86 b 4.58 bc 12.39 ab 0.88 b 1.34 ab
Nesbitt 10.10 b 0.12 abc 10.17 ab 12.73 c 3.03 cd 0.76 b 16.91 cd 26.62 bc 7.24 c 30.31 c 1.40 ab 0.89 b
Summit 9.25 b 0.10 cd 2.47 bc 15.40 a 3.19 ab 0.54 c 28.49 a 47.62 a 18.36 a 93.39 a 1.18 ab 1.72 ab
P value <0.0001 0.0003 0.0441 0.0002 <0.0001 <0.0001 <0.0001 <0.0001 <0.0001 0.0017 0.0073 0.0149 z Titratable acidity expressed as % tartaric acid. y Genotypes were evaluated in triplicate (n=3). Means with different letter(s) for each attribute within effects are significantly different
(p<0.05) using Tukey’s Honestly Significant Difference test.
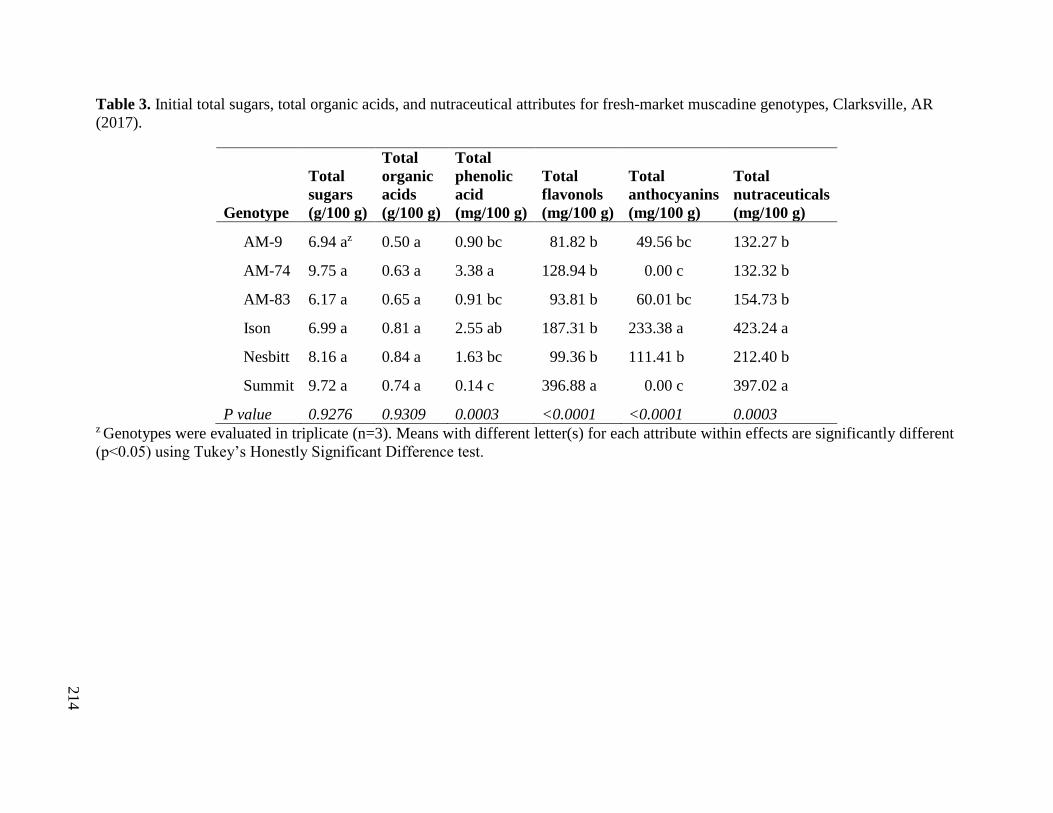
214
Table 3. Initial total sugars, total organic acids, and nutraceutical attributes for fresh-market muscadine genotypes, Clarksville, AR
(2017).
Genotype
Total
sugars
(g/100 g)
Total
organic
acids
(g/100 g)
Total
phenolic
acid
(mg/100 g)
Total
flavonols
(mg/100 g)
Total
anthocyanins
(mg/100 g)
Total
nutraceuticals
(mg/100 g)
AM-9 6.94 az 0.50 a 0.90 bc 81.82 b 49.56 bc 132.27 b
AM-74 9.75 a 0.63 a 3.38 a 128.94 b 0.00 c 132.32 b
AM-83 6.17 a 0.65 a 0.91 bc 93.81 b 60.01 bc 154.73 b
Ison 6.99 a 0.81 a 2.55 ab 187.31 b 233.38 a 423.24 a
Nesbitt 8.16 a 0.84 a 1.63 bc 99.36 b 111.41 b 212.40 b
Summit 9.72 a 0.74 a 0.14 c 396.88 a 0.00 c 397.02 a
P value 0.9276 0.9309 0.0003 <0.0001 <0.0001 0.0003 z Genotypes were evaluated in triplicate (n=3). Means with different letter(s) for each attribute within effects are significantly different
(p<0.05) using Tukey’s Honestly Significant Difference test.
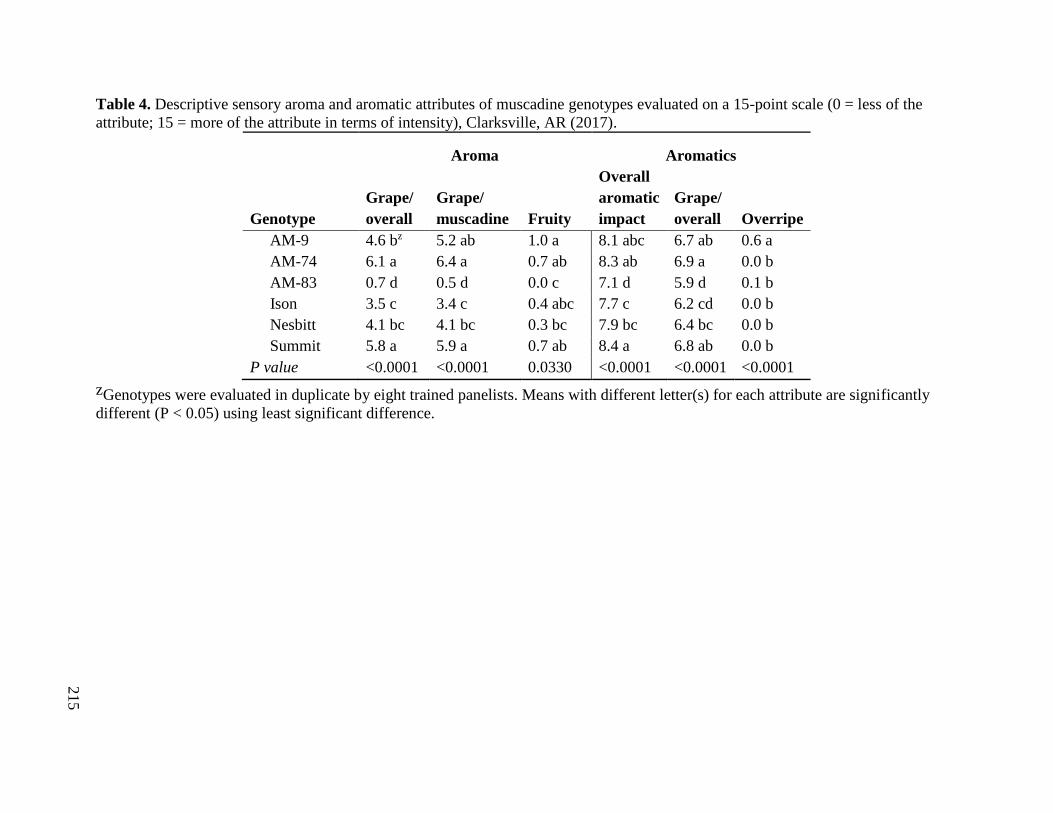
215
Table 4. Descriptive sensory aroma and aromatic attributes of muscadine genotypes evaluated on a 15-point scale (0 = less of the
attribute; 15 = more of the attribute in terms of intensity), Clarksville, AR (2017).
Aroma Aromatics
Genotype
Grape/
overall
Grape/
muscadine Fruity
Overall
aromatic
impact
Grape/
overall Overripe
AM-9 4.6 bz 5.2 ab 1.0 a 8.1 abc 6.7 ab 0.6 a
AM-74 6.1 a 6.4 a 0.7 ab 8.3 ab 6.9 a 0.0 b
AM-83 0.7 d 0.5 d 0.0 c 7.1 d 5.9 d 0.1 b
Ison 3.5 c 3.4 c 0.4 abc 7.7 c 6.2 cd 0.0 b
Nesbitt 4.1 bc 4.1 bc 0.3 bc 7.9 bc 6.4 bc 0.0 b
Summit 5.8 a 5.9 a 0.7 ab 8.4 a 6.8 ab 0.0 b
P value <0.0001 <0.0001 0.0330 <0.0001 <0.0001 <0.0001
zGenotypes were evaluated in duplicate by eight trained panelists. Means with different letter(s) for each attribute are significantly
different (P < 0.05) using least significant difference.
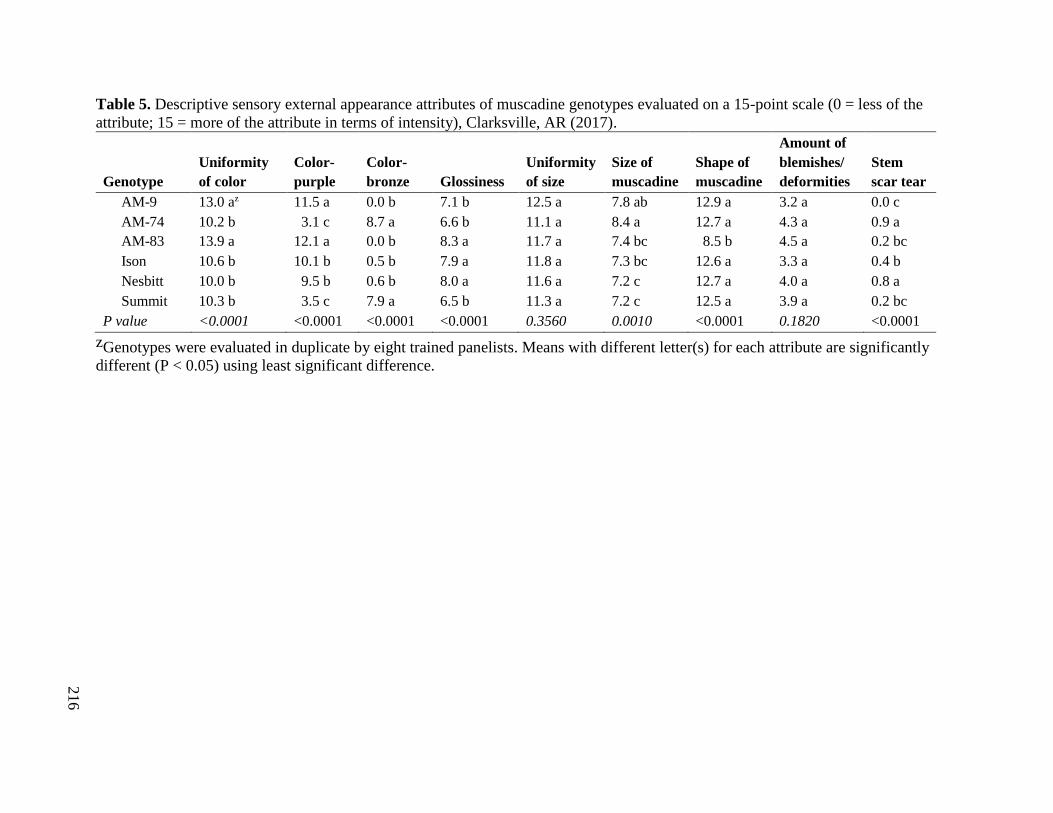
216
Table 5. Descriptive sensory external appearance attributes of muscadine genotypes evaluated on a 15-point scale (0 = less of the
attribute; 15 = more of the attribute in terms of intensity), Clarksville, AR (2017).
Genotype
Uniformity
of color
Color-
purple
Color-
bronze Glossiness
Uniformity
of size
Size of
muscadine
Shape of
muscadine
Amount of
blemishes/
deformities
Stem
scar tear
AM-9 13.0 az 11.5 a 0.0 b 7.1 b 12.5 a 7.8 ab 12.9 a 3.2 a 0.0 c
AM-74 10.2 b 3.1 c 8.7 a 6.6 b 11.1 a 8.4 a 12.7 a 4.3 a 0.9 a
AM-83 13.9 a 12.1 a 0.0 b 8.3 a 11.7 a 7.4 bc 8.5 b 4.5 a 0.2 bc
Ison 10.6 b 10.1 b 0.5 b 7.9 a 11.8 a 7.3 bc 12.6 a 3.3 a 0.4 b
Nesbitt 10.0 b 9.5 b 0.6 b 8.0 a 11.6 a 7.2 c 12.7 a 4.0 a 0.8 a
Summit 10.3 b 3.5 c 7.9 a 6.5 b 11.3 a 7.2 c 12.5 a 3.9 a 0.2 bc
P value <0.0001 <0.0001 <0.0001 <0.0001 0.3560 0.0010 <0.0001 0.1820 <0.0001
zGenotypes were evaluated in duplicate by eight trained panelists. Means with different letter(s) for each attribute are significantly
different (P < 0.05) using least significant difference.

217
Table 6. Descriptive sensory internal appearance, basic taste, and feeling factor attributes of muscadine genotypes evaluated on a 15-
point scale (0 = less of the attribute; 15 = more of the attribute in terms of intensity), Clarksville, AR (2017).
Internal appearance Basic tastes Feeling factors
Genotype
Visual
separation
Number
of seeds
Seed
size Sweet Sour Bitter Astringent Metallic
AM-9 12.1 az 3.3 ab 6.9 a 7.4 abc 3.2 bcd 1.4 a 6.9 a 1.4 abc
AM-74 11.7 a 2.6 c 6.9 a 7.9 a 2.9 cd 0.7 a 6.5 a 1.2 d
AM-83 9.2 b 3.6 a 6.3 a 6.3 d 3.3 bc 1.1 a 6.8 a 1.4 bc
Ison 12.2 a 3.5 a 7.4 a 6.7 cd 3.9 a 1.1 a 7.0 a 1.6 a
Nesbitt 12.1 a 3.0 bc 6.7 a 7.0 bcd 3.7 ab 1.0 a 6.8 a 1.5 ab
Summit 11.8 a 3.4 ab 7.0 a 7.6 ab 2.7 d 0.7 a 6.4 a 1.3 cd
P value <0.0001 0.0040 0.5080 0.0020 0.0010 0.0960 0.0940 0.0010
zGenotypes were evaluated in duplicate by eight trained panelists. Means with different letter(s) for each attribute are significantly
different (P < 0.05) using least significant difference.
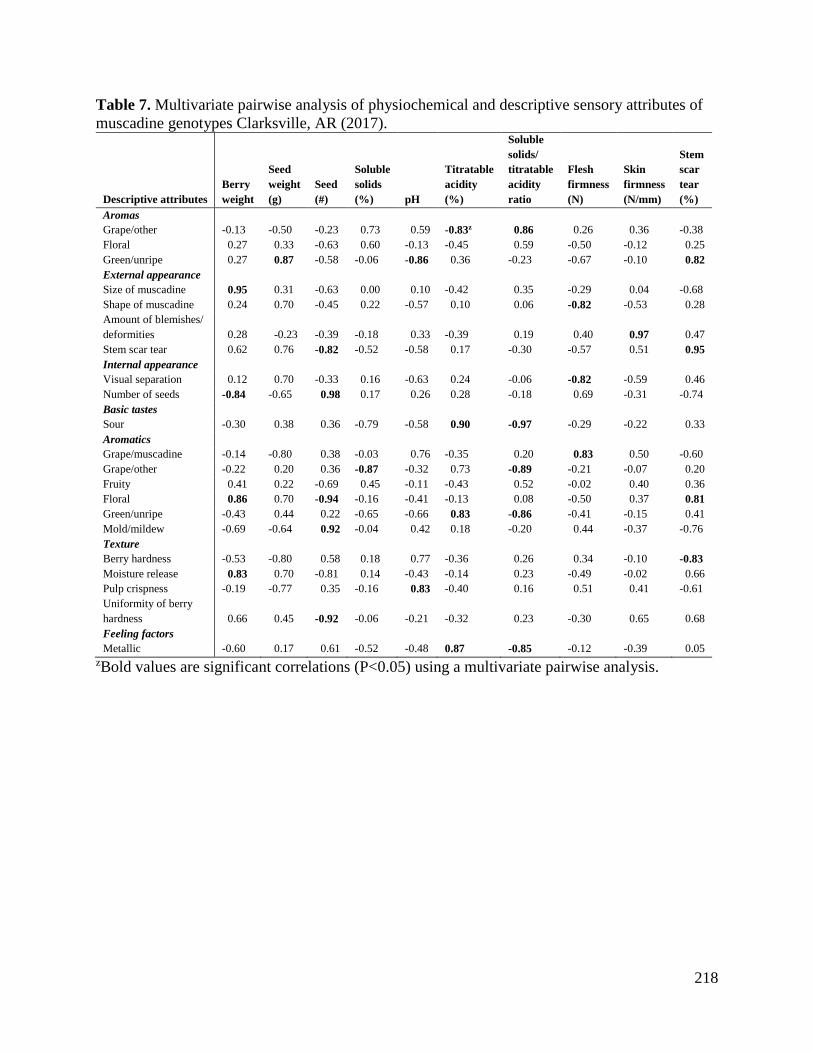
218
Table 7. Multivariate pairwise analysis of physiochemical and descriptive sensory attributes of
muscadine genotypes Clarksville, AR (2017).
Descriptive attributes
Berry
weight
Seed
weight
(g)
Seed
(#)
Soluble
solids
(%) pH
Titratable
acidity
(%)
Soluble
solids/
titratable
acidity
ratio
Flesh
firmness
(N)
Skin
firmness
(N/mm)
Stem
scar
tear
(%)
Aromas
Grape/other -0.13 -0.50 -0.23 0.73 0.59 -0.83z 0.86 0.26 0.36 -0.38
Floral 0.27 0.33 -0.63 0.60 -0.13 -0.45 0.59 -0.50 -0.12 0.25
Green/unripe 0.27 0.87 -0.58 -0.06 -0.86 0.36 -0.23 -0.67 -0.10 0.82
External appearance
Size of muscadine 0.95 0.31 -0.63 0.00 0.10 -0.42 0.35 -0.29 0.04 -0.68
Shape of muscadine 0.24 0.70 -0.45 0.22 -0.57 0.10 0.06 -0.82 -0.53 0.28
Amount of blemishes/
deformities 0.28 -0.23 -0.39 -0.18 0.33 -0.39 0.19 0.40 0.97 0.47
Stem scar tear 0.62 0.76 -0.82 -0.52 -0.58 0.17 -0.30 -0.57 0.51 0.95
Internal appearance
Visual separation 0.12 0.70 -0.33 0.16 -0.63 0.24 -0.06 -0.82 -0.59 0.46
Number of seeds -0.84 -0.65 0.98 0.17 0.26 0.28 -0.18 0.69 -0.31 -0.74
Basic tastes
Sour -0.30 0.38 0.36 -0.79 -0.58 0.90 -0.97 -0.29 -0.22 0.33
Aromatics
Grape/muscadine -0.14 -0.80 0.38 -0.03 0.76 -0.35 0.20 0.83 0.50 -0.60
Grape/other -0.22 0.20 0.36 -0.87 -0.32 0.73 -0.89 -0.21 -0.07 0.20
Fruity 0.41 0.22 -0.69 0.45 -0.11 -0.43 0.52 -0.02 0.40 0.36
Floral 0.86 0.70 -0.94 -0.16 -0.41 -0.13 0.08 -0.50 0.37 0.81
Green/unripe -0.43 0.44 0.22 -0.65 -0.66 0.83 -0.86 -0.41 -0.15 0.41
Mold/mildew -0.69 -0.64 0.92 -0.04 0.42 0.18 -0.20 0.44 -0.37 -0.76
Texture
Berry hardness -0.53 -0.80 0.58 0.18 0.77 -0.36 0.26 0.34 -0.10 -0.83
Moisture release 0.83 0.70 -0.81 0.14 -0.43 -0.14 0.23 -0.49 -0.02 0.66
Pulp crispness -0.19 -0.77 0.35 -0.16 0.83 -0.40 0.16 0.51 0.41 -0.61
Uniformity of berry
hardness 0.66 0.45 -0.92 -0.06 -0.21 -0.32 0.23 -0.30 0.65 0.68
Feeling factors
Metallic -0.60 0.17 0.61 -0.52 -0.48 0.87 -0.85 -0.12 -0.39 0.05
zBold values are significant correlations (P<0.05) using a multivariate pairwise analysis.

219
Table 8. Multivariate pairwise analysis of organic acids, sugars, anthocyanins, and descriptive
sensory attributes of muscadine genotypes Clarksville, AR (2017).
Descriptive attributes
Glucose
(g/100 g)
Fructose
(g/100 g)
Isocitric
acid
(g/100 g)
Tartaric
acid
(g/100 g)
Malic
acid
(g/100 g)
Total
anthocyanins
(mg/100 g)
Aromas
Grape/overall 0.85z 0.86 -0.66 0.12 -0.14 -0.39
Grape/muscadine 0.80 0.82 -0.71 0.02 -0.20 -0.42
Grape/other 0.54 0.59 0.32 0.13 -0.72 -0.84
Floral 0.87 0.87 -0.48 0.21 -0.25 -0.50
External appearance
Uniformity of color -0.82 -0.70 0.33 -0.72 -0.48 -0.11
Color-purple -0.95 -0.97 0.20 -0.33 0.20 0.54
Color-bronze 0.89 0.94 -0.16 0.19 -0.33 -0.63
Glossiness -0.76 -0.83 0.49 0.15 0.49 0.66
Shape of muscadine 0.57 0.51 -0.82 0.16 0.24 0.08
Basic tastes
Sweet 0.80 0.87 -0.61 -0.09 -0.40 -0.61
Sour -0.55 -0.68 -0.03 0.23 0.83 0.93
Bitter -0.86 -0.85 -0.16 -0.57 0.05 0.42
Aromatics
Overall aromatic impact 0.83 0.83 -0.62 0.09 -0.22 -0.44
Grape/overall 0.77 0.84 -0.63 -0.09 -0.40 -0.59
Fruity 0.93 0.94 0.01 0.42 -0.22 -0.57
Green/unripe -0.25 -0.44 0.02 0.54 0.85 0.84
Mold/mildew -0.87 -0.88 0.29 -0.40 -0.03 0.34
Overripe -0.49 -0.38 -0.40 -0.82 -0.48 -0.16
Texture
Uniformity of berry hardness 0.77 0.82 -0.03 0.41 -0.11 -0.47
Feeling factors
Astringent -0.83 -0.89 -0.14 -0.25 0.52 0.80
Metallic -0.57 -0.73 0.06 0.26 0.79 0.93 zBold values are significant correlations (P<0.05) using a multivariate pairwise analysis.

220
Table 9. F-test significance from analysis of variance (ANOVA) for physiochemical and
marketability of muscadine genotypes stored at 2 C for 0, 7, 14, and 21 d, Clarksville, AR
(2017).
Attributes Genotype Storage day Genotype x storage day
Physiochemical
Berry weight (g) <0.0001 0.1572 0.0110
Soluble solids (%) <0.0001 <0.0001 0.0012
pH <0.0001 <0.0001 <0.0001
Titratable acidity (%) <0.0001 <0.0001 <0.0001
Glucose (g/100g) 0.9578 0.9489 0.9203
Fructose (g/100g) 0.9036 0.9444 0.8859
Total sugars (g/100g) 0.9368 0.9777 0.9039
Isocitric acid (g/100g) 0.6470 0.0004 0.9745
Tartaric acid (g/100 g) 0.7851 0.1448 0.9321
Malic acid (g/100g) 0.5270 0.0201 0.9080
Total organic acids (g/100g) 0.8284 0.0609 0.9127
L* <0.0001 0.0113 0.0177
Chroma <0.0001 0.1791 0.2094
Hue <0.0001 0.2122 0.8377
Skin firmness(N/mm) <0.0001 <0.0001 0.8993
Flesh firmness (N) <0.0001 0.0219 0.0646
Marketability
Weight loss (%) <0.0001 <0.0001 <0.0001
Decay (%) <0.0001 <0.0001 <0.0001
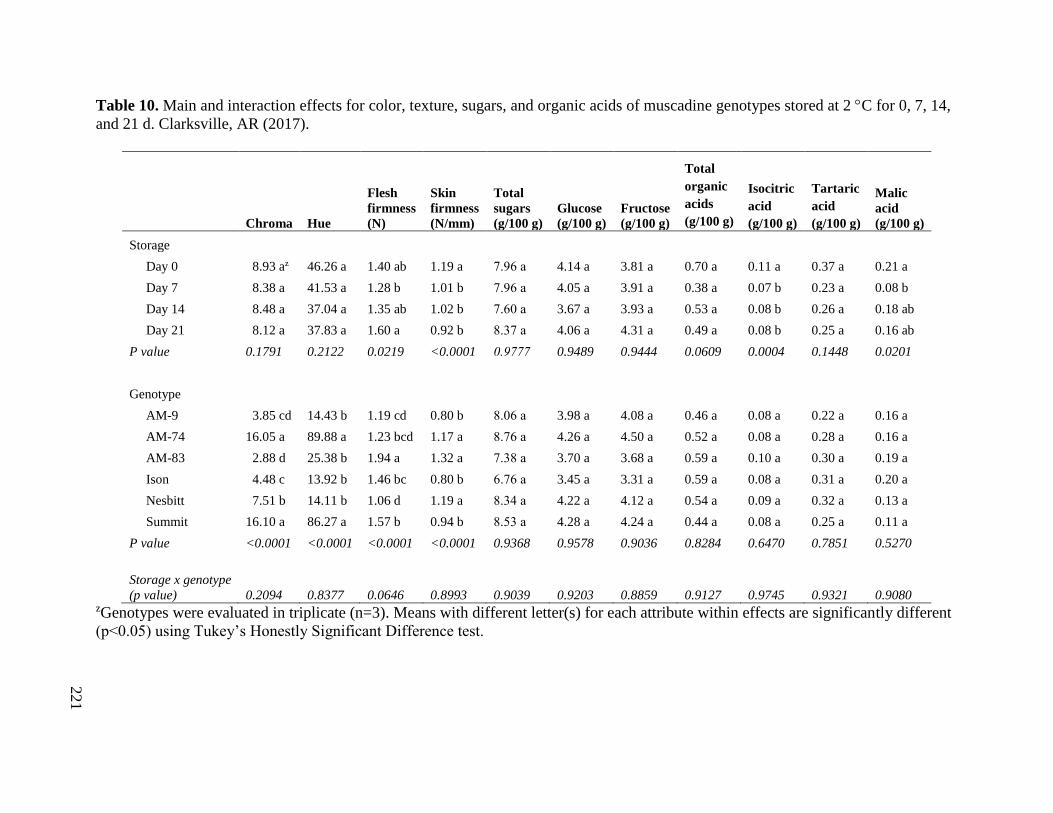
221
Table 10. Main and interaction effects for color, texture, sugars, and organic acids of muscadine genotypes stored at 2 C for 0, 7, 14,
and 21 d. Clarksville, AR (2017).
Chroma Hue
Flesh
firmness
(N)
Skin
firmness
(N/mm)
Total
sugars
(g/100 g)
Glucose
(g/100 g)
Fructose
(g/100 g)
Total
organic
acids
(g/100 g)
Isocitric
acid
(g/100 g)
Tartaric
acid
(g/100 g)
Malic
acid
(g/100 g)
Storage
Day 0 8.93 az 46.26 a 1.40 ab 1.19 a 7.96 a 4.14 a 3.81 a 0.70 a 0.11 a 0.37 a 0.21 a
Day 7 8.38 a 41.53 a 1.28 b 1.01 b 7.96 a 4.05 a 3.91 a 0.38 a 0.07 b 0.23 a 0.08 b
Day 14 8.48 a 37.04 a 1.35 ab 1.02 b 7.60 a 3.67 a 3.93 a 0.53 a 0.08 b 0.26 a 0.18 ab
Day 21 8.12 a 37.83 a 1.60 a 0.92 b 8.37 a 4.06 a 4.31 a 0.49 a 0.08 b 0.25 a 0.16 ab
P value 0.1791 0.2122 0.0219 <0.0001 0.9777 0.9489 0.9444 0.0609 0.0004 0.1448 0.0201
Genotype
AM-9 3.85 cd 14.43 b 1.19 cd 0.80 b 8.06 a 3.98 a 4.08 a 0.46 a 0.08 a 0.22 a 0.16 a
AM-74 16.05 a 89.88 a 1.23 bcd 1.17 a 8.76 a 4.26 a 4.50 a 0.52 a 0.08 a 0.28 a 0.16 a
AM-83 2.88 d 25.38 b 1.94 a 1.32 a 7.38 a 3.70 a 3.68 a 0.59 a 0.10 a 0.30 a 0.19 a
Ison 4.48 c 13.92 b 1.46 bc 0.80 b 6.76 a 3.45 a 3.31 a 0.59 a 0.08 a 0.31 a 0.20 a
Nesbitt 7.51 b 14.11 b 1.06 d 1.19 a 8.34 a 4.22 a 4.12 a 0.54 a 0.09 a 0.32 a 0.13 a
Summit 16.10 a 86.27 a 1.57 b 0.94 b 8.53 a 4.28 a 4.24 a 0.44 a 0.08 a 0.25 a 0.11 a
P value <0.0001 <0.0001 <0.0001 <0.0001 0.9368 0.9578 0.9036 0.8284 0.6470 0.7851 0.5270
Storage x genotype
(p value) 0.2094 0.8377 0.0646 0.8993 0.9039 0.9203 0.8859 0.9127 0.9745 0.9321 0.9080 zGenotypes were evaluated in triplicate (n=3). Means with different letter(s) for each attribute within effects are significantly different
(p<0.05) using Tukey’s Honestly Significant Difference test.
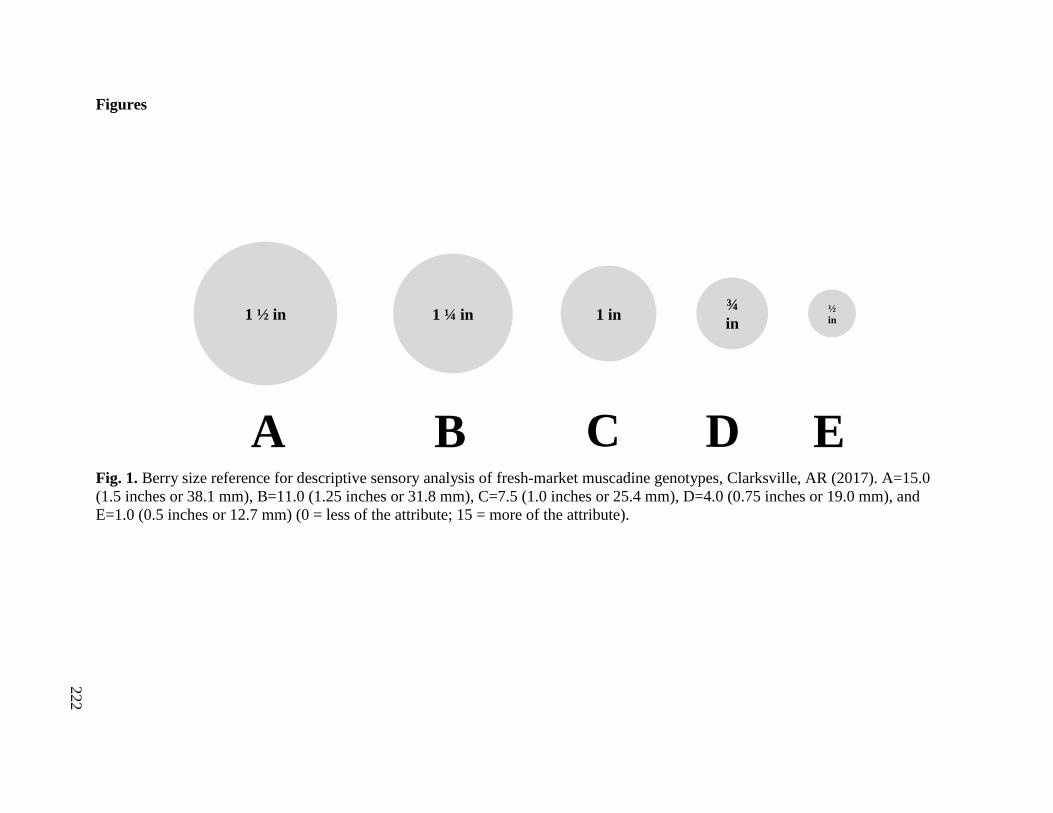
222
Figures
Fig. 1. Berry size reference for descriptive sensory analysis of fresh-market muscadine genotypes, Clarksville, AR (2017). A=15.0
(1.5 inches or 38.1 mm), B=11.0 (1.25 inches or 31.8 mm), C=7.5 (1.0 inches or 25.4 mm), D=4.0 (0.75 inches or 19.0 mm), and
E=1.0 (0.5 inches or 12.7 mm) (0 = less of the attribute; 15 = more of the attribute).
1 in ¾
in ½
in 1 ½ in 1 ¼ in
A B C D E

223
Fig. 2. Seed size reference for descriptive sensory analysis of fresh-market muscadine genotypes, Clarksville, AR (2017). A=12 (5.3 x
8.5 mm), B=7 (4.9 x 7.1 mm), and C=3 (3.9 x 6.1 mm) (0 = less of the attribute; 15 = more of the attribute).
A B C
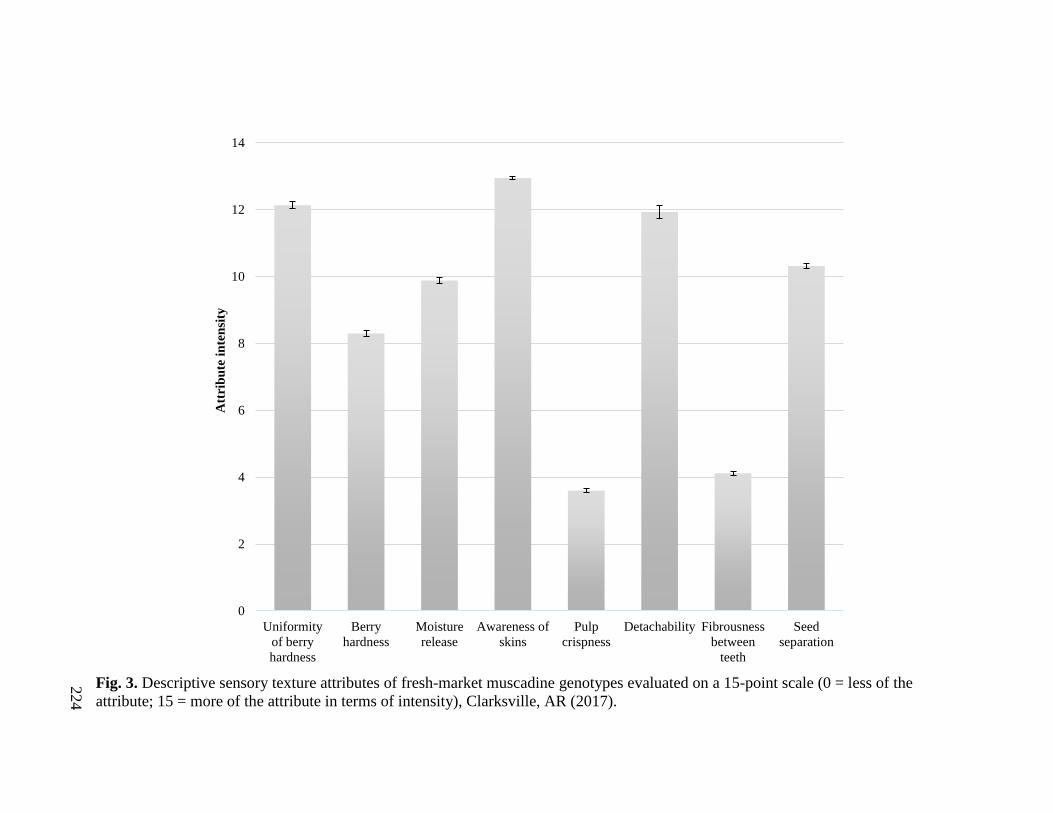
224
Fig. 3. Descriptive sensory texture attributes of fresh-market muscadine genotypes evaluated on a 15-point scale (0 = less of the
attribute; 15 = more of the attribute in terms of intensity), Clarksville, AR (2017).
0
2
4
6
8
10
12
14
Uniformity
of berry
hardness
Berry
hardness
Moisture
release
Awareness of
skins
Pulp
crispness
Detachability Fibrousness
between
teeth
Seed
separation
Att
rib
ute
in
ten
sity

225
Fig. 4. Multivariate pairwise analysis of color attributes and descriptive sensory attributes of fresh-market muscadine genotypes,
Clarksville, AR (2017).
-1.00
-0.80
-0.60
-0.40
-0.20
0.00
0.20
0.40
0.60
0.80
1.00
Color-purple Color-bronze Bitter Grape/other
aromatics
Fruity
aromatics
Astringent
feeling factor
r val
ue
L* Chroma Hue
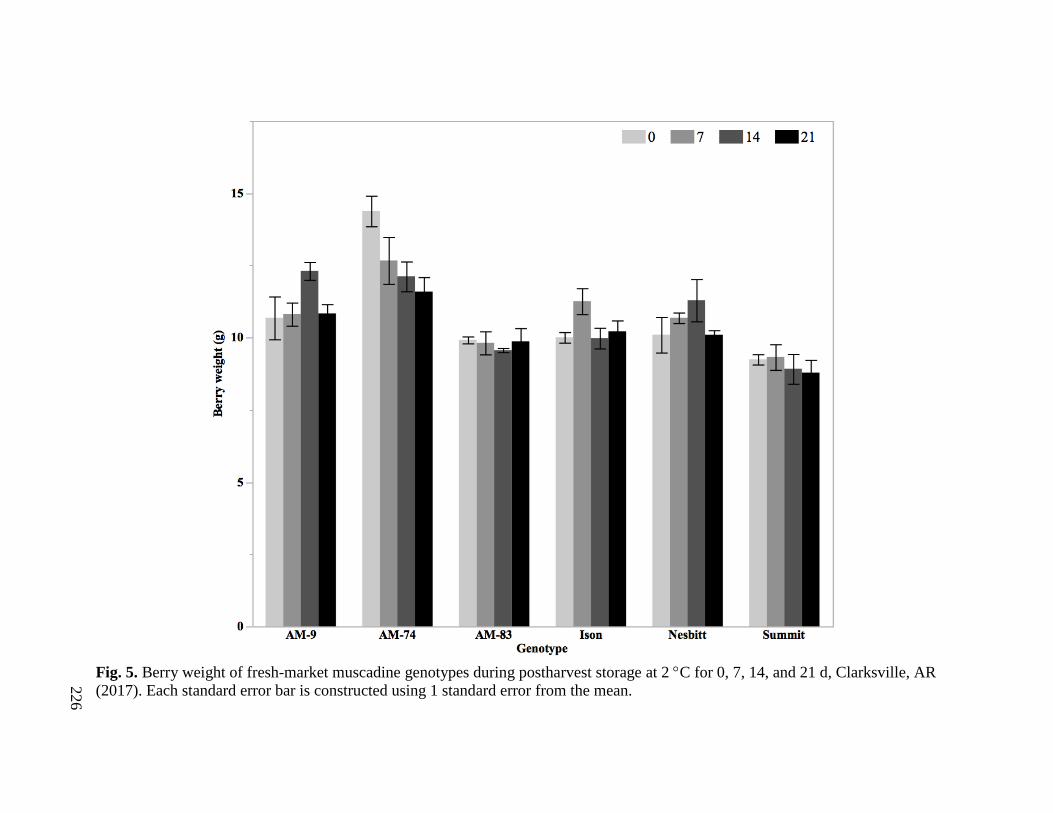
226
Fig. 5. Berry weight of fresh-market muscadine genotypes during postharvest storage at 2 C for 0, 7, 14, and 21 d, Clarksville, AR
(2017). Each standard error bar is constructed using 1 standard error from the mean.
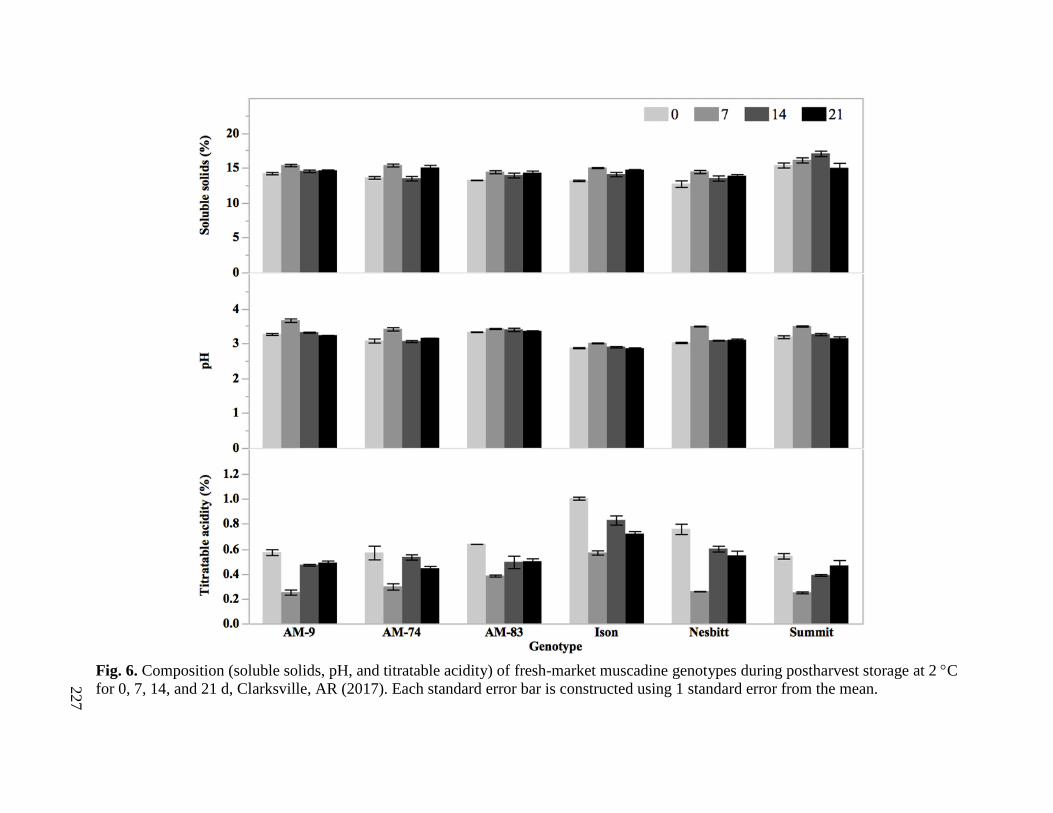
227
Fig. 6. Composition (soluble solids, pH, and titratable acidity) of fresh-market muscadine genotypes during postharvest storage at 2 C
for 0, 7, 14, and 21 d, Clarksville, AR (2017). Each standard error bar is constructed using 1 standard error from the mean.

228
Fig. 7. L*of fresh-market muscadine genotypes during postharvest storage at 2 C for 0, 7, 14, and 21 d, Clarksville, AR (2017). Each
standard error bar is constructed using 1 standard error from the mean.

229
Fig. 8. Marketability (weight loss and unmarketable fruit) of fresh-market muscadine genotypes during postharvest storage at 2 C for
0, 7, 14, and 21 d, Clarksville, AR (2017). Each standard error bar is constructed using 1 standard error from the mean.
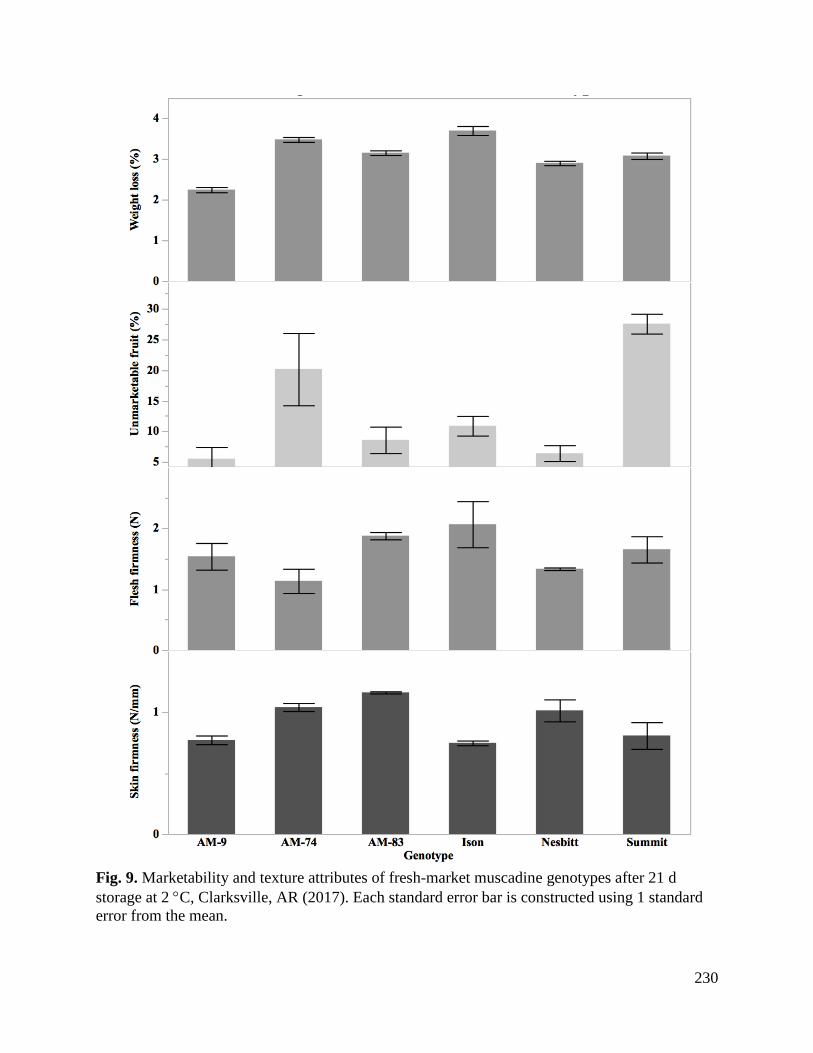
230
Fig. 9. Marketability and texture attributes of fresh-market muscadine genotypes after 21 d
storage at 2 C, Clarksville, AR (2017). Each standard error bar is constructed using 1 standard
error from the mean.

231
Overall Conclusions
The evaluation of fresh-market potential of Arkansas-grown blackberries, peaches, table
grapes, and muscadine grapes provided insight into the parameters for both harvest and
postharvest storage. Regardless of the fruit, genotype played a critical role in fresh-market
potential. During postharvest storage, fruit quality was impacted by how the fruit was grown
(tables grapes in high tunnel versus traditional vineyard), how the fruit was harvested
(blackberries harvested in the morning), what temperature the fruit was stored (blackberries
stored at a lower temperature), and the ripeness attributes of the fruit at harvest (composition and
firmness of blackberries, peaches, table grapes, and muscadine grapes). It was important that
descriptive sensory lexicons were created to evaluate peach/nectarine and muscadine genotypes
for this study to compare to analytical measurements, but to also use the lexicons for further
research on these Arkansas-grown fresh-market fruits. The advanced selections in this study
showed commercial potential as they performed as well if not better than the released cultivars.
After 14 or 21 d of storage, the fruit genotypes generally showed low decay and low
unmarketable fruit indicating strong fresh-market potential. Overall, of the genotypes and fruit
types evaluated, it was apparent that if the genotype is well adapted to the region, high quality
fruit production with good storage potential is possible in Arkansas.
232
Appendix
233