evaluation of heat checking and washout of heat
TRANSCRIPT

EVALUATION OF HEAT CHECKING AND WASHOUT OF HEAT RESISTANT
SUPERALLOYS AND COATINGS FOR DIE INSERT APPLICATIONS
Final Technical Report
David Schwam Edward Courtright John F. Wallace Harold Adkin Yulong Zhu Department of Materials Science Battelle PNNL Case Western Reserve University Richland, WA Cleveland, Ohio
Work Performed Under Contract DE-FC07-01ID14034 US Department of Energy Assistant Secretary for Energy Efficiency and Renewable Energy Washington DC
January 2005

DE-FC07-01ID14034 – Evaluation of Heat Checking and Washout
LIST OF CONTENTS 1.0 EXECUTIVE SUMMARY………………………………………………………………….6 2.0 REVIEW OF TECHNOLOGY STATUS…………………………………………………..8
2.1 Die Casting……………………………………………………………………………8 2.2 Die Casting Industry…………………………………………………….………….10 2.3 Die Life………………………………………………………………………………11 2.4 Failure Mechanisms of Dies………………………………………………………..12
3.0 EXPERIMENTAL PROCEDURE……………………………………………………...…16
3.1 Accelerated Evaluation of Soldering and Washout ……………………………...16 3.2 Pin materials…………………………………………………………………….….18 3.3 Evaluation of Soldering Resistance………………………………………………..18
3.4 Evaluation of Washout……………………………………………………………..19 3.5 Examination of Test Pins…………………………………………………………..20 3.6 Evaluation of Thermal Fatigue……………………………………………………20
3.7 Evaluation of Coatings……………………………………………………………..22 4.0 RESULTS AND DISCUSSION……………………………………………………………23
4.1 Potential Superalloys for Use as Die Materials…………………………………...23 4.2 Test Pin Evaluation…………………………………………………………………35 4.3 Soldering Results……………………………………………………………………36 4.4 Washout Results……………………………………………………………………38
4.5 Thermal Fatigue Results…………………………………………………………...41 4.6 Relationship Between Thermal Fatigue, Soldering and Washout………………42
4.7 Performance of Protective Coatings……………………………………………...43
5.0 GENERAL CONCLUSIONS AND RECOMMENDATION FOR FUTURE WORK...46 6.0 REFERENCES……………………………………………………………………………53 7.0 FIGURES………………………………………………………………………………….56
2

DE-FC07-01ID14034 – Evaluation of Heat Checking and Washout
LIST OF TABLES AND FIGURES Table 1: Chemical Composition of Copper Base Pin (wt%) Table 2: Chemical Composition of Pins (wt%) Table 3: Nominal Superalloy Compositions in wt% Table 4: Types of coating tested and their relative thickness. Table 5: Qualitative Ranking of Heat Checking Resistance Table 6: Characteristics of PVD Coatings Figure 1: UBE VSC 315 Ton Squeeze Cast Machine at CWRU Figure 2: Schematic Diagram of the Accelerated Soldering Test Figure 3: Schematic of the Washout/Soldering Testing Set-up Figure 4a: Sub-Insert for Soldering and Washout Experiments Figure 4b:Test Pin Design and Position Figure 5: Thermal Fatigue Immersion Test and Equipment Figure 6: Dissolution at the Corners of Nickel Alloy Specimens Figure 7: Temperature dependent yield strength of superalloys compared with H-13 Figure 8: Temperature dependent thermal conductivity of superalloys compared with H-13 Figure 9: Percent linear expansion of H-13 and several superalloys Figure 10: Elastic Modulus as a function of temperature for several superalloys and H-13 Figure 11: Equilibrium amounts of various oxide compounds calculated to form when 1
mole of H-13 alloy is reacted with oxygen at 450 Centigrade Figure 12: Equilibrium amounts of various oxide compounds calculated to form when 1 mole of
IN-718 alloy is reacted with oxygen at 450 Centigrade Figure 13: Equilibrium amounts of various oxide compounds calculated to form when 1 mole of
IN-718 alloy with 30% Cr is reacted with oxygen at 450 Centigrade Figure 14:Equilibrium amounts of various oxide compounds calculated to form when 1 mole of
IN-706 alloy is reacted with oxygen at 450 Centigrade Figure 15: Equilibrium amounts of various oxide compounds calculated to form when 1 mole of
Incoloy 901 alloy is reacted with oxygen at 450 Centigrade Figure 16: Equilibrium amounts of various oxide compounds calculated to form when 1 mole of
Incoloy 909 alloy is reacted with oxygen at 450 Centigrade Figure 17: Equilibrium amounts of various oxide compounds calculated to form when 1 mole of
H-13 alloy is reacted with oxygen at 565 Centigrade showing the formation of FeO. Figure 18: Broken Test Pins Figure 19: Appearance of Pins after 50 Shots (with Soldered Al Dissolved in NaOH) Figure 20: Effect of Pin Material on Soldering Figure 21: Effects of Pin Material & Number of Shots on % Area Covered with Soldering Figure 22: Effects of the Pin Material on Soldering Figure 23: Washout in the Hard H13 Pin Impinged Directly by the Al (50 shots) Figure 24: Effects of Pin Material on Washout Figure 25: Washout Induced Weight Loss Figure 26: Percentage of Weight Loss Figure 27: Soldering-Washout & Thermal Fatigue Ranking Figure 28: Hardness Distribution in Nitro-Carburized Diffusion Layers Figure 29: Hardness Distribution in Nitro-Carburized Diffusion Layers
3

DE-FC07-01ID14034 – Evaluation of Heat Checking and Washout
Figure 30: Hardness Distribution in Nitro-Carburized Diffusion Layer Figure 31: Effect of the Nitro-Carburizing Treatment on Soldering Figure 32: Effect of Nitro-carburizing on Soldering After 50 Shots Figure 33: Appearance of H13 and Nitro-Carburized Pins after 30 Shots Figure 34: Appearance of H13 and Nitro-Carburized Pins after the Test (Al Dissolved in NaOH) Figure 35: Effect of Nitro-Carburizing on Washout Figure 36: Impingement Surface of Thin Nitro-Carburized layer in “B” Pin (after 50 Shot
Soldered Al Dissolved in NaOH) Figure 37: Impingement Surface of Thin Nitro-Carburized layer in “B” Pin (after 150 Shots-
Soldered Al Dissolved in NaOH) Figure 38: Impingement Surface of Thick Nitro-Carburized Layer in “U” Pin (after 150 Shots
and Soldered Al Dissolved in NaOH) Figure 40: Average Max Crack Length of Nitrocarburized H13 Figure 41: Total Crack Area of Nitrocarburized H13 Figure 42: Cross- Section of PVD Coatings and Pin Substrates Figure 43: Appearance of PVD Coated Pins before Testing & after 30 Shots Figure 44: Soldering Appearance of H13 Pin with CrN+W PVD Coating Figure 45: Soldering Appearance of H13 Pin with CrN PVD Coating Figure 46: Soldering Appearance of H13 Pin with (TiAl)N PVD Coating Figure 47: Soldering Appearance of H13 Pin with CrC PVD Coating Figure 48: Effect of PVD Coating on Soldering Figure 49: Effect of PVD Coating Materials on Soldering (after 30 shots) Figure 50: Effect of PVD Coatings on Washout Resistance Figure 51: Washout Comparison of PVD Coatings and Nitrocarburizing Figure 52: Degradation of H13 Pin with CrN+W PVD Coating Figure 53: Degradation of H13 Pin with CrN+W PVD Coating (magnified) Figure 54: Degradation of H13 Pin with CrN PVD Coating Figure 55: Degradation of H13 Pin with CrN PVD Coating (magnified) Figure 56: Degradation of H13 Pin with (TiAl)N PVD Coating Figure 57: Degradation of H13 Pin with (TiAl)N PVD Coating (magnified) Figure 58: Degradation of H13 Pin with CrC PVD Coating Figure 59: Degradation of H13 Pin with CrC PVD Coating (magnified) Figure 60: Degradation of H13 Pin with CrN+W PVD Coating (Pin Holes and Worn off) Figure 61: Degradation of H13 Pin with CrN+W PVD Coating after 210 Shots Figure 62: Degradation of H13 Pin with (TiAl)N PVD Coating Figure 63: Degradation of H13 Pin with (TiAl)N PVD Coating after 210 Shots Figure 64: Degradation of H13 Pin with CrC PVD Coating(Only Pin Holes) Figure 65: Degradation of H13 Pin with CrC PVD Coating after 240 Shots (Only Pin Holes) Figure 66: Cross Section View & Failure Mode of CrN+W PVD Coated H13 Pin after 120 Shots Figure 67: Cross Section View & Failure Mode of CrN+W PVD Coated H13 Pin
after 120 Shots
4

DE-FC07-01ID14034 – Evaluation of Heat Checking and Washout
ACKNOWLEDGEMENTS
This research investigation was supported by the Department of Energy, Office of
Industrial Technology through the Cast Metal Coalition program. The Die Materials Committee
of the North American Die Casting Association provided guidance for this work. The efforts of
Mr. Steve Udvardy, Director of Research and Education at NADCA and the members of the
committee are gratefully acknowledged.
This publication was prepared with the support of the U.S. Department of Energy (DOE),
Award No. DE-FC07-01ID14034. However, any opinions, findings, conclusions or
recommendations expressed herein are those of the authors and do not necessarily reflect the
views of the DOE.
5

DE-FC07-01ID14034 – Evaluation of Heat Checking and Washout
1.0 EXECUTIVE SUMMARY
The project had two main objectives:
• To design, fabricate and run a full size test for evaluating soldering and washout in die insert
materials. This test utilizes the unique capabilities of the 350 Ton Squeeze Casting machine
available in the Case Metal Casting Laboratory. Apply the test to evaluate resistance of die
materials and coating, including heat resistant alloys to soldering and washout damage.
• To evaluate materials and coatings, including heat resistant superalloys, for use as inserts in
die casting of aluminum alloys.
An accelerated washout test was initially set up on a commercial UBE VSC 315 tone squeeze
casting machine. A testing procedure was established to evaluate the soldering and washout
resistance of die materials for aluminum die-casting dies. This arrangement simulates well the
actual die casting conditions in a production environment. It allows parametric evaluation, as
well as accurate and quick evaluation of soldering and washout. A wide range of die materials
and coatings were subjected to the test and ranked for soldering and washout resistance. These
materials include Anviloy1150 (a refractory tungsten-based alloy, H13, Mo-785, Ti-6Al-4V, IN-
718, cast iron and copper base alloys. These have been tested for evaluating not only their
resistances to soldering and washout but also their resistance to thermal fatigue. Anviloy1150
shows the best soldering and washout resistance, followed by Ti-6Al-4V, Mo-785, H13 and IN-
718. Anviloy1150 and Mo-785 show the best resistance to thermal fatigue while Ti-6Al-4V
shows poor thermal fatigue resistance. The thermal fatigue resistance of H13 is better than Ti-
6Al-4V but worse than Anviloy1150 and Mo-785. It is hard to evaluate the thermal resistance of
6

DE-FC07-01ID14034 – Evaluation of Heat Checking and Washout
IN-718 because of its severe dissolution in molten aluminum, which makes it difficult to identify
any cracks. However, the absence of cracks on all evaluated samples points at superior thermal
fatigue resistance. Mechanisms of soldering and washout previously reported in the literature
have been confirmed in the present investigation. Formation of intermetallic layers with
mechanical interlocking are the primary reasons for soldering in both heat resistant, nickel-based
alloys and in steels. Washout is caused by erosion-enhanced corrosion and dominated by
corrosion rate.
This investigation determined that nitro-carburizing improves significantly the resistance of
H13 pins to washout (loss of base metal). Thicker nitro-carburized layers provide better
resistance to washout. However, they tend to crack more readily than thin coatings. Thick nitro-
carburized coatings are desirable in “soldering intensive” applications; thin nitro-carburized
coatings may be desirable in “thermal fatigue intensive” applications that can induce cracking.
The “thick” CrC PVD coating was the best performer among the PVD coatings evaluated so
far. However, this coating is primarily recommended for small cores; it is more susceptible to
thermal fatigue cracking than the thin coatings. The thin PVD coatings fail at surface
imperfections in the substrate and at defect sites in the coating (pin-holes). Good coatings
practices are essential in ensuring a high performance coating.
7

DE-FC07-01ID14034 – Evaluation of Heat Checking and Washout
2.0 TECHNOLOGY REVIEW
2.1 Die Casting
In the die casting process, molten metal is injected at high pressure into a water cooled steel die,
where it solidifies as a net shape product (13,14). When solidification is completed and the
casting has cooled sufficiently, the die is opened and the part is ejected. The die is subsequently
sprayed with a lubricant, closed and molten metal is injected again into the die to start a new
cycle.
Very complex shapes ranging in size from less than one inch to fifty inches and more can be
made by die casting of aluminum, magnesium, zinc and copper with no additional machining.
Die-casting can produce castings with close dimensional tolerances, smooth surface finishes and
fine, intricate details at high production rates [15,16]. This is a net-shape fabrication method that
requires limited or no finishing operations. These advantages are offset to some extent by the
relatively high cost of die. Die life is therefore a major consideration in a die casting operations;
Depending on the complexity of the part being produced, a die may cost more than the die
casting machine itself [17]. Usually, dies comprise about 20% of the total cost of producing an
aluminum die casting. Increasing die life could therefore result in significant savings. Typical
die life in aluminum die-casting ranges from 100,000 to 250,000 parts [15]. As the numbers of
parts that can be cast with a single die increases, the process becomes more economical.
Increasing the production life of a die through the prevention of die failure can make a major
contribution toward the profitability of die casting operation. Likewise, reducing die costs can
8

DE-FC07-01ID14034 – Evaluation of Heat Checking and Washout
be beneficial in reducing the costs of the process. Die cast parts have very broad applications in
automotive, aerospace, electronics and household consumer products. Thin section components
can be made to very tight tolerances that few other shaping processes can meet.
The performance and durability of the die material is critical in meeting these engineering
requirements. The die controls not only the dimensions and tolerances of the final part but also
the surface quality of the products. Many dies end their useful life when tiny cracks develop on
the surface, leading to unacceptable marks on the cast part. Other parts are more tolerant to
small cracks, but as these increase in severity the die becomes unserviceable. Improvement in
die materials have a major impact on the dimensional stability, reproducibility and surface
quality of the product.
Die casting competes most favorably with other metal shaping methods for large volume
production. In some cases it also competes with injection-molded plastics. In high-strength,
high-stiffness applications, or when high temperature resistance, creep resistance or thermal
conductivity are required, die casting parts are preferred. In many instances, the technical
requirements are equally satisfied by more than one fabrication method, and the selection is
based on cost per part consideration. Die cast parts have a broad range of applications in
automotive, aerospace, electronic and household products. The automotive industry is the single
largest market. In this market, die casting competes with cast iron and injection molded parts.
Weight savings is a major driver in this industry. Translated into performance, any weight
saving increases the miles per gallon and the energy savings. The Corporate Average Fuel
Economy (CAFE) standards set by the US government currently specifies a minimum of 27.5
miles per gallon. It is expected to increase to 35 mpg by 2003. To meet these demands, lighter
9

DE-FC07-01ID14034 – Evaluation of Heat Checking and Washout
materials will have to be used. In 1991, the average weight of aluminum used in an automobile
was 191 pounds; only 2.2 pounds of magnesium was used. The weight of aluminum parts used
in automobiles is expected to more than double by 2010. An even larger increase is anticipated
for magnesium parts. These projections assume no other substitutes will become available at a
more attractive cost/performance. To a large extent, it is up to the die casting industry to
maintain and increase its competitiveness. The cost and life expectancy of the die often tilts the
balance to one side or another. The cost of the die contributes at least 20% of the final price.
Any design problem or subsequent dimensional modification add to this price. The cost of a die
can exceed one million dollars and it can take months or even years to take it from design to
production. The US alone spends approximately one billion dollars per year on die casting dies.
Improvements in die technology have a direct, significant impact on the profitability and
competitiveness of the die casting industry.
2.2 Die Casting Industry
Die casting is the second largest foundry industry in the US, second only to sand casting. Die
casting produces about one third of all metal castings. In 2004 US die casters sold over 1,500
million pounds of castings, contributing over $7.3 billion to the nation’s economy. There are
roughly 400 die casting plants in the US, providing about 65,000 jobs directly or indirectly. The
average plant has 70 employees, with most employing less than 50 people. These small plants
have to cope with high capital cost and limited engineering staff yet utilize a sophisticated and
technologically demanding process. Moreover, they have to compete with foreign firms in an
increasingly global economy. Development of better dies is an undertaking that no single plant
10
DE-FC07-01ID14034 – Evaluation of Heat Checking and Washout
will assume. Only by a joint effort with support from federal sources, such as the U.S. DOE
Metal Research Casting Program can such an issue be addressed.
2.3 Die Life
Good thermal fatigue resistance and thermal shock resistance are essential for long die life.
These are considered "technological properties" and depend in turn on "basic" materials
properties such as:
• Elevated temperature yield strength: the die has to resist high mechanical and thermal
stresses without deforming. Hot tools steels have good elevated temperature properties; most
superalloys have even better elevated temperature properties; refractory metals have by far
the best elevated temperature properties.
• Temper resistance: excessive softening of the die during use, in the 1100 - 1300oF
temperature range is detrimental and will cause premature heat checking. Temper resistant
steels retain their hardness better after prolonged exposure to such temperatures. Increasing
the alloying content of steels makes them more temper resistant. However, even the most
temper resistant steels eventually soften under the high temperatures and thermal fatigue
cycles experienced by aluminum die casting dies. Superalloys are known to retain their
strength at high temperatures for much longer. The strengthening mechanism of superalloys
are based on constituents that are still stable in the 1250-1350oF range of die casting.
11

DE-FC07-01ID14034 – Evaluation of Heat Checking and Washout
• Impact toughness: die materials have to withstand severe mechanical and thermal shock.
The impact strength of most steels decreases significantly at low temperatures due to the
ductile-brittle transition encountered in Body Centered Cubic type materials. Mechanical
shock at low temperatures, before the die has been preheated can be very damaging.
Refractory alloys belong to the same class of materials and also suffer from low impact
strength when cold. Superalloys belong mostly to the Face Center Cubic category and do not
exhibit the ductile-brittle transition behavior.
All these properties are strongly connected. Finding the right balance of properties is the key to
extending the life of the die. Material properties are strongly linked to microstructural features,
which, in turn, depend on the chemistry and processing of the material. Non-metallic inclusions
and cleanliness of the alloy are of particular importance: non-metallic inclusions are generally
considered undesirable constituents are required to be held at a minimum within practical limits.
Cleanliness is ensured by refining processes such as the Vacuum Arc Remelting (VAR) and
Electro Slag Remelting (ESR); these have become common practice in fabrication of high
quality superalloys and Premium Grade steels.
2.4 Failure Mechanisms of Dies
Die failure is mostly caused by thermal cracks, washout and soldering on the surfaces
that come in contact with the molten metal [18,19]. The hot metal coming in contact with the
water-cooled die surface generates large thermal gradients. The surface of the die expands due
to the temperature increase. At the same time, the colder zone below the surface resists
movement. As a result, the hot working surface goes under compressive stress condition. This
12

DE-FC07-01ID14034 – Evaluation of Heat Checking and Washout
cycle is reversed during cooling; when water is circulated to cool the casting, the working
surface of the die becomes colder than the inside. The working surface of the die is then
subjected to tensile stresses. Repetition of this cycles eventually leads to thermal fatigue failure
of the die, often designated as "heat checking". A network of fine cracks develops gradually on
the working cavity surface of the die, deteriorating the surface quality of the cast product and
eventually destroying the integrity of the die.
Occasionally, long and deep cracks cause catastrophic failure of a die, particularly when a
thermal shock occurs. Named "gross-cracking", this failure mode is primarily related to the
toughness of the die material. Consequently, the toughness of the material has to be monitored
as well as its thermal fatigue resistance, particularly under thermal shock conditions.
Erosion or washout is encountered in areas of fast flow such as runners, in particular where the
metal emerges from a restricted section or it changes direction. It first appears as small pits.
Gradually, the size of the pits increases until it develops into a rough surface. The traditional
approach interprets erosion as a wash-away of metal caused by the impinging, turbulent action of
the incoming metal. Detailed analyses have however shown that most of the erosion occurs at
locations that are not directly impinged by the metal stream, but rather downstream of separation
sites. Voids formed at these separation sites are swept downstream and eventually collapse
causing a momentary spike in pressure at the die surface.
Washout in aluminum die-casting dies usually is caused by a combination of corrosive wear,
erosive wear and soldering. It involves the gradual removal of die material by the impinging jet
13

DE-FC07-01ID14034 – Evaluation of Heat Checking and Washout
of an incoming molten metal stream. Continuous washout can result in severe damage to the die
surface and finally lead to the failure of the die.
Corrosive wear is defined as the dissolution of die material in the melt and the formation of
intermetallic layers. Corrosion is enhanced by the following factors:
(1) Iron and most of the alloying elements in the die steel are more or less dissolvable in liquid
aluminum.
(2) The high casting temperatures may cause oxidation of the die surface.
(3) Intermetallic layers may form at the die surface.
Erosive wear is defined as the gradual removal of material from the die substrate with every
liquid aluminum impingement. This takes place as a result of the rapid flow of the aluminum
melt, which can reach velocities within the range of 20 to 60 m/s in gate area. The three main
erosion mechanisms are:
(1) Liquid-impingement erosion that creates pits on the eroded sample surfaces.
(2) Cavitation, which is the result of the formation and collapse of bubbles (cavities) in a fluid
due to local pressure fluctuations.
(3) Solid erosion, which is caused by the impact of solidified particles (Si particles, oxide
particles and impurities and intermetallic particles) during filling.
Soldering is defined as the adhesion of the cast metal to the die or core surface. Soldering of the
casting to the steel surface inside the cavity takes place during solidification. Chemical and
mechanical reactions occur during the filling and solidification stage due to the affinity of the
14

DE-FC07-01ID14034 – Evaluation of Heat Checking and Washout
aluminum alloy atoms and die substrate atoms for each other. The chemical reaction often
results in the formation of intermetallic layers at the die substrate/ aluminum alloy interface.
When the molten aluminum comes in contact with die surface, mechanical interlocking due to
surface roughness can also result in aluminum buildup on the die surface [20]. The buildup of
aluminum alloy that occurs at the interface is called soldering. Soldering will cause sticking
problems when the casting is ejected and it can also give rise to adhesive wear when the casting
is separated from the die.
In order to extend the die life, die materials in aluminum die-casting should be resistant to heat
checking, washout and soldering in molten aluminum flow. To resist heat checking, die materials
should have a low coefficient of thermal expansion, high thermal conductivity, high hot yield
strength, good temper softening resistance, high creep strength, and adequate ductility. To resist
the washout and soldering, die materials should have high hardness, high temper resistance, low
solubility in molten aluminum and good oxidation resistance. It is difficult for one material to
satisfy with all above requirements. In practice, H13 is the most popular materials for production
dies in aluminum die-casting, followed by H11 and H21 [17].
Instead of depending solely on conventional die steels, efforts have been made to develop
new die materials with higher resistance to thermal fatigue, soldering and washout. Some
copper-base alloys, nickel-base alloys, titanium-base alloys, molybdenum base alloys, tungsten-
base alloys are occasionally used as die materials. Other metal materials, such as yttrium-base
alloys and niobium alloys have also been considered for die material applications.
15

DE-FC07-01ID14034 – Evaluation of Heat Checking and Washout
An accelerated immersion thermal fatigue testing method was developed for evaluation of
thermal fatigue performance of die materials at the Case Metal Casting Laboratory at Case
Western Reserve University. This testing method closely simulates the realistic environment
encountered in aluminum die casting dies [21-24]. Previous work in this area was done by
immersing and/or rotating test pins in molten aluminum alloys [25-29]. However, immersing or
rotating tests do not subject the pin to the molten aluminum impingement and the ejection forces
encountered in production of casting. A key aspect of this investigation was to establish a
realistic method to evaluate the soldering, washout and thermal fatigue resistance of heat
resistance nickel-base and other new die materials in aluminum die casting.
3. EXPERIMENTAL PROCEDURE
3.1 Accelerated Evaluation of Soldering and Washout
This evaluation was carried out on a commercial UBE VSC 315 tone squeeze casting machine
at Case Western Reserve University shown in Figure 1. A special insert was designed and
fabricated to generate a fast jet of molten metal. The volume of the cavity has been maximized
to allow for a large amount of metal to be shot. A sub-insert is bolted to this insert holding two
test core pins positioned side by side in front of a narrow slit gate entry to the die cavity (see Fig.
2 - 4). Molten metal is injected at a high velocity through the narrow slit and impinges onto the
pins. Each shot weighs about seven pounds of aluminum. The molten metal is cast into the
cavity and after it solidifies the entire part is ejected. During ejection the test pins are subjected
16

DE-FC07-01ID14034 – Evaluation of Heat Checking and Washout
to high friction and wear. This experimental set-up provides direct line-of-sight allowing the
operator to observe the tested core pin and examine the development of soldering and washout.
In order to accelerate the soldering and washout effects and to allow for quantifying soldering
and washout damage after a reasonable number of shots, a testing procedure was developed. The
operating conditions chosen to accelerate the soldering and washout rate are listed below:
a) Aluminum alloy: A356 was chosen as the impinging molten aluminum alloys. The chemical
composition of A356 is 7.5% Si, 0.3%Mg, 0.1%Fe. 600 pounds of standard A 356 ingot was
melted in a 75 KW electricity heater furnace. The UBE squeeze caster is equipped with an
automated transfer ladle that scoops molten metal from the furnace and pours it into the shot
sleeve. A plunger then pushes the metal into the cavity.
b) Test pin design: A special test pin was designed with a flat plane and sharp corners facing the
impinging flow of molten aluminum. The test pin and its position in die are also shown in Fig.3
and 4.
c) Gate dimension: In order to accelerate the jetting velocity, a narrow gate was designed with a
2.5 mm in thick and 50 mm width slit.
d) Die lubricant: No die lubricant was sprayed on the pin surface during the experiment. A
graphite lubricant was sprayed only on the shot sleeve, shot block, plunger tip and die cavity.
e) Other parameters:
Melting temperature 1,350 oF
Plunger velocity 5 in/s (127mm/s)
Impinging velocity 240in/s (6000mms-1)
17

DE-FC07-01ID14034 – Evaluation of Heat Checking and Washout
Applied pressure 70 MPa
Die hold time 40 s
Cycle time 110-130s
3.2 Pin materials
Several die materials were selected because they have known applications in high pressure
die casting or permanent mold casting. These include soft H13 with a hardness of 34-36 HRC,
standard H13 (51-54 HRC), a copper-base alloy, a gray cast iron, IN-718 alloy, Ti-6Al-4V alloy,
Mo-785 alloy and Anviloy1150 alloy. Their chemical compositions and physical properties are
shown in Tables 1 and 2.
All pins were machined to the same dimensions, ground to size and finally polished to 1200 grit.
Fig.4b shows the design of the pin.
3.3 Evaluation of Soldering Resistance
After a preset number of shots, the test pins were removed from the machine and erosion was
measured by profilometry. In this method, a fine tip stylus is moved on the measured surface
and the up-down motion is recorded by a sensitive optical sensor. The resolution of such
measurements is in the 0.000001” range. Eroded areas show as a “trough” in the otherwise
linear motion of the stylus. This high sensitivity method allows erosion damage evaluation after
a relatively small number of shots. Additional parameters were chosen to evaluate the soldering
resistance: The literature reports [19,20,25,26,28], two parameters as often used for this purpose:
"Percentage of Soldering Area with aluminum on pin surface (PSA)" and "Weight of Soldered
18

DE-FC07-01ID14034 – Evaluation of Heat Checking and Washout
Aluminum alloy on pin surface (WSA)". Sometimes, the parameter of "Thickness of the
Soldered Aluminum Layer on pin surface (TSAL)" was also selected [18]. However, the
thickness of soldered aluminum on the pin surface varies from place to place, making it difficult
to measure and compare. Therefore, PAS and WSA were selected to evaluate the soldering
resistance. The greater the PAS or WSA, the lower is the resistance to soldering or the more
severe the soldering tendency of the test material is for the same shots. In order to measure PSA,
the pin surface condition was observed and recorded for every cycle. The soldered aluminum is
silver in color while the pin surface is black or dark in color. This difference allows for easy and
accurate determination of the PSA. The weight of test pins was measured before the test, after a
pre-set number of shots with soldering, and after removing the soldered aluminum from the pin
surface with a strong NaOH solution. WSA equals to the weight difference between the weight
after a pre-set number of casting shots with soldering and without soldering.
3.4 Evaluation of Washout
Quantitative parameters are also needed to evaluate the washout resistance. Usually two
major parameters were applied [19,30] and they are " Weight Loss of the pin (WL)" and "
Dimension Reduction of the pin (DR)". A greater of WL and DR means a lower resistance to
washout or more severe corrosive-erosive material losses of the test material for the same cycles.
Sometimes the dimensional changes of the pin vary from location to location making it difficult
to compare between pins. Therefore WL was selected to evaluate the washout resistance. WL
equals to the weight difference before and after a pre-set number of shots with soldered
aluminum cleaned by a strong NaOH solution. WL can be directly used to evaluate materials
with the same or similar density. In order to evaluate materials with different density, WL is
19

DE-FC07-01ID14034 – Evaluation of Heat Checking and Washout
normalized to "Volume Loss of the pin (VL)" by being divided by the density of the test
material. Greater values of VL show a lower resistance or more severe washout tendency of the
material for the same cycles.
3.5 Examination of Test Pins
All the core pins were visually examined during the testing cycle. Optical photographs were
taken of the surface of pins facing the gate. The percentage of area soldered with aluminum was
measured after a pre-set number cycles using a computer image analysis system. A 50-70oC
50%-60% NaOH solution was used to remove the soldered aluminum. The WSA and WL were
measured using a Mettler AE 240 electron balance that can be read to 0.00001g and is accurate
within 0.0001g. WL was divided by density to calculate the VL. Before measuring, the pins were
cleaned with methanol and ethyl alcohol and dried with a heat gun. Cross-sections of some pins
were metallographically examined in the areas where most soldering was evident, using a S450
Hitachi scanning electron microscope.
3.6 Evaluation of Thermal Fatigue [32-36]
The standard thermal fatigue specimen used in the evaluation of relative behavior of die
materials has been employed successfully for this purpose for 25 years. The specimen is
processed to the dimensions shown in Figure 5. It has been used to evaluate a large number of
potential die materials for aluminum die casting dies. It is 2 x 2 x 7 inch rectangular
parallepiped specimen with a 1.5 inch diameter hole in the center for internal water cooling. The
test produces considerable constraint and high thermal fluctuations during immersion and
removal from the 380 alloy bath. The equipment used for the immersion is illustrated in Figure
20

DE-FC07-01ID14034 – Evaluation of Heat Checking and Washout
5. The four corners have a constant 0.010 inch radius that intensifies the predominately uniaxial
stress at this location. The outer surface of the specimen is sprayed with a commercial water-
base lubricant just before it enters the molten aluminum bath. Water flows through the central
hole at a constant rate of 85 gallons per minute. The molten bath is maintained at 1350oF and the
specimen is immersed for 12 seconds and then removed from the bath for 22 seconds to produce
the thermal cycle shown above.
The standard procedure is to operate the test for 5,000 immersion cycles, measure the
cracking pattern and follow this method for 10,000 and 15,000 total cycles. Since the maximum
temperature that is attained is at the corner or edge of the immersion specimen and the stress
state is uniaxial at the edge, thermal fatigue cracks initiate at the corner and then propagate
internally. The cracking pattern is characterized by two parameters, the average maximum crack
length La and the total crack area At to evaluate the thermal fatigue behavior of the specimens.
The average maximum crack length is the average length of the longest crack of each of the four
corners within the middle three inches of the corners. The total crack area is the sum of the
product of the number of cracks in each 100 micron size range and the square of the midpoint of
that range for all the four corners within the middle three inches of the corners. The more severe
the crack pattern and the lower the thermal fatigue resistance of the tested material. The results
of this test have correlated closely with the behavior of dies in industry.
21

DE-FC07-01ID14034 – Evaluation of Heat Checking and Washout
3.7 Evaluation of Coatings
A number of commercially available coatings were evaluated. All these diffusion, PVD and
CVD coatings are used to combat soldering and washout in die casting. A list of the coating
included in the study and their respective thickness is shown in Table 4.
Table 4: Types of coating tested and their relative thickness. Type of Coating Thickness of coating
in microns B-thin 50
U-thick 165
D-thin 50
D-thick 100
CrN 5.0
PVD CrC 6.25
PVD CrN + W 3.5
PVD (TIAI)N 2.0
22

DE-FC07-01ID14034 – Evaluation of Heat Checking and Washout
4.0 RESULTS AND DISCUSSION
4.1 Potential Superalloys for Use as Die Materials
Nickel based superalloys have superior high temperature strength and yield strength
retention properties and should have the potential of reducing the amount of cracking and extend
die life. This section examines the properties of Inconel 718 and several closely related nickel-
iron superalloys for potential improved resistance to heat-checking relative to H-13.
The second most prevalent method of failure in die casting dies is the soldering that
results from a reaction between molten aluminum and iron. This process produces Al5Fe2 and
other intermetallics . The rate of solder formation is determined by the rate of diffusion of iron
and aluminum atoms through the intermetallic layer [3]. There are two competing processes
which control the soldering process. One is the rate of intermetallic layer growth and the other is
the rate of its dissolution in the liquid aluminum. These two processes will not necessarily have
the same temperature dependency. If the rate of dissolution exceeds the rate of growth, then the
surface of the die can recede rapidly. This phenomenon, known as “washout” has been
discussed in the previous sections and it appears to accelerate in alloys of high nickel content.
The iron base H-13 alloy forms a native film composed of the oxide, magnetite, that
provides protection against further dissolution and solder formation [4]. This magnetite (Fe3O4)
film is much more protective than the NiO or CoO that forms on most nickel and cobalt
containing superalloys. However, if the temperature of a H-13 die surface exceeds 1050oF, then
the oxide FeO forms at the metal interface and the rate of soldering increases dramatically. The
23

DE-FC07-01ID14034 – Evaluation of Heat Checking and Washout
relationships between alloy composition and protective oxide formation are discussed for
several candidate superalloys, and a few preliminary recommendations are offered.
4.1.1 Heat-Checking Resistance
Superalloys were primarily developed to provide functional strength at high temperatures
for use in gas turbine engines. Eventually, the development of vacuum-melted, γ’-strengthened
nickel-base alloys developed during the 1950-1970 time frame displaced the cobalt base alloys
which lack a comparable precipitation hardening mechanism. The cobalt alloys rely on solid
solution strengthening from molybdenum and tungsten additions, and lack the high temperature
strength retention provided by γ’ strengthening.
Precipitation-strengthened alloys containing substantial quantities of both nickel and
iron form another distinct class of superalloys, and include the important commercial tooling
alloy Inconel 718. These alloys retain their strength to temperatures near 1200oF, which is an
important attribute for die casting applications. Inconel 718 has proven to be quite resistant to
heat-checking in the CWRU thermal cycle test. Unfortunately, Inconel 718 can be severely
attacked by molten aluminum as illustrated in Figure 6. The problem appears to be related to
nickel dissolution and the lack of a protective film to prevent the attack., thus other nickel base
alloys could also be susceptible to washout corrosion. The purpose of this discusion is to
examine alternate nickel-iron compositions that might be more resistant to corrosion, but still
maintain the same level of resistance to heat-checking as Inconel 718.
24

DE-FC07-01ID14034 – Evaluation of Heat Checking and Washout
Table 4 presents the nominal compositions for each of the alloys considered in this
discussion. The baseline H-13 alloy contains 5% chrome and a little molybdenum to provide
solution hardening. Vanadium is also added to provide some solid solution strengthening and
this element combines with other carbide formers to provide for a good dispersion of carbides in
the martensitic structure. H-13 can be heat treated to strengths in excess of 300 ksi, with
reasonably good ductility and impact strength.
Inconel 718 is a niobium hardened nickel-chromium-iron alloy. The main strengthening
effect comes from a body centered tetragonal coherent precipitate of composition Ni3Nb, called
γ”. This alloy has excellent welding characteristics and good tensile, creep, fatigue, creep
rupture properties. If the alloy is heated above 700oC, γ” transforms into an orthorhombic
precipitate of the same Ni3Nb composition (called delta phase). The delta phase is invariably
incoherent and does not confer the same strength as γ”. Inconel 706 has essentially the same
hardening mechanism as Inconel 718 and exhibits similar properties to Inconel-718, but with
improved machinability.
Incoloy 901 is another nickel-iron-base superalloy designed for high strength and
corrosion resistance in the temperature range 1000-1400 oF. This alloy is hardened by the
precipitation of coherent Ni3(Al,Ti) precipitates. This precipitate phase is also considered to be
γ’. The scaling resistance of Incoloy 901 is slightly less than that of an AISI type 310 stainless
steel. Alloy 909 is another iron rich superalloy that contains cobalt, but is strengthened by γ’
precipitates. It has an unusually low thermal expansion coefficient as a result of eliminating the
25

DE-FC07-01ID14034 – Evaluation of Heat Checking and Washout
ferrite-stabilizing elements. The high temperature oxidation resistance of this alloy is somewhat
questionable, however, because of the lack of chrome additions.
A-286 is another γ’ precipitation hardening autsenitic Fe-Ni-Cr steel with good high
temperature strength properties up to 1300oF. This alloy offers high ductility in notched
sections. The oxidation resistance is equivalent to that of an AISI type 310 stainless.
Analytical studies suggest that the most important variable in resistance to heat-checking
is hot yield strength [2]. Figure 7 shows how yield strength declines with increasing
temperature for Inconel 718, H-13, and several other superalloys. It is very important for the die
to have the highest possible resistance to yielding in the temperature range between 1000 to 1200
oF. Temperatures of this magnitude are achieved in the surface layers of the die at the same
time the highest compressive stresses develop as a result of contact with molten aluminum
during the injection phase of the die casting cycle. Compressive stresses can reach values of the
order of 120 ksi at the peak temperature, or even higher if the die is in an initial state of residual
compression. The stresses then reverse and become tensile during the cool-down portion of the
cycle. The maximum tensile stresses occur when the die is about 700 oF, and again, a high yield
strength is needed to prevent plastic deformation from occurring. On the basis of the yield
strength curves presented in Figure 7, it would appear than Inconel 718 should provide the best
resistance to heat checking. A relative order of ranking suggests that: IN-718 > Incoloy 909 >
IN-706 > Incoloy 901 > H-13 > A286. The H-13 alloy exhibits comparable strength to the
superalloys at 700 oF and is stronger than Incoloy 901 and A 286 at this temperature. The iron
26
DE-FC07-01ID14034 – Evaluation of Heat Checking and Washout
base A-286 alloy retains a high fraction of its room temperature strength between 1000 and 1200
oF, but it is not as intrinsically strong as the other alloys.
Thermal conductivity is another important consideration in heat-checking resistance.
The stresses that develop in the surface layers of the die, where the damage occurs, are a result of
the thermal gradients between the surface of the die and the interior cooling channels. A high
conductivity enables the die to disperse the heat better and this reduces the magnitude of the
gradients. The thermal conductivity’s of the six alloys are compared in Figure 8. Only one data
point was found for Incoloy 909. The temperature dependency of this alloy should be similar to
Incoloy 901. H-13 has a significantly higher thermal conductivity than the superalloys. This
advantage helps to offset its lower high temperature yield strength. The five superalloy
compositions exhibit very similar properties with the slightly higher values corresponding with
the higher iron contents. Accordingly, IN-718 exhibits the lowest thermal conductivity of the
group.
Another property of importance is thermal expansion. The stresses that develop in dies
are a product of the thermal gradient and the linear expansion. If the die material has a very low
thermal expansion, it will experience a lower stress. A curve of percent linear expansion as a
function of temperature for the six alloys is shown in Figure 9. Incoloy 909 has the lowest
thermal expansion value of all the alloys. Only one data point was found for this alloy, but the
curve is expected to have the same temperature dependency as Incoloy 901. H-13 has the next
lowest expansion and A-286 exhibits the highest expansion. The other alloys are intermediate
between A-286 and H-13.
27

DE-FC07-01ID14034 – Evaluation of Heat Checking and Washout
Elastic modulus can be another factor in heat-checking resistance, but it is not, perhaps,
as important as the other three discussed above. A higher modulus will yield a higher stress
level for the same thermally induced strain. The temperature dependent elastic moduli for five
of the six alloys are shown in Figure 10. No data was found for Incoloy 909. The differences
between alloys are not large. H-13 exhibits a larger decline in modulus as a function of
temperature , but has the highest value at 700 oF where the tensile stresses reach their maximum
values.
A qualitative evaluation of Heat Checking Resistance, HCR, is shown in Table 5. The
evaluation criteria include yield strength (YS), thermal expansion (CTE), thermal conductivity
(TC), and elastic modulus (E). More credit was given to hot yield strength and less to elastic
modulus. On this basis, Inconel 718 and Incoloy 909 were judged to have potentially the best
resistance to heat-checking with Inconel 706 a very close third. H-13 would be fair to marginal
and A-286 would be considered poor. Thermal fatigue tests performed at Case Western Reserve
University, CWRU, reported H-13 to be significantly better than A-286 [5]. Recent tests at
CWRU have found IN 718 to be very resistant to heat-checking and perhaps better than high
quality, and optimally heat-treated H-13.
28

DE-FC07-01ID14034 – Evaluation of Heat Checking and Washout
Table 5: Qualitative Ranking of Heat Checking Resistance
Alloy YS CTE TC E HCR
H-13 F-P F-G G F-P F
Inconel 706 F-G F F-G F G
Inconel 718 G F F F G
A-286 P P F-G F P
Incoloy 901 F F F F F-G
Incoloy 909 F-G G F-G F? G
G = Good, F = Fair, P = Poor
4.1.2 Soldering Resistance
Thermal fatigue tests performed at CWRU have revealed that Inconel 718 is attacked
much more severely by molten aluminum than H-13 under essentially identical conditions as
illustrated in Figure 1. Experimental tests performed by Fraser and Jahedi [4] revealed that when
the oxide magnetite, i.e. Fe3O4, was formed on H-13 by steam tempering, it prevented the
formation of intermetallic phases to a great extent. When other oxides of iron, e.g. FeO and
Fe2O3, were present, the steel surface was much more susceptible to soldering. The oxide
wustite or FeO can only form on iron alloys at temperatures in excess of 1050oF. Field
observations of commercial dies confirm that excessive soldering begins to occur at or above this
29

DE-FC07-01ID14034 – Evaluation of Heat Checking and Washout
temperature in conjunction with the development of nonprotective FeO films. X-ray diffraction
measurements made on commercial dies have shown that Fe3O4 will fortunately be favored
under most die casting conditions. This oxide will develop at temperatures below 1050oF, and
in the presence of the steam like conditions that envelope die casting machines, but the initial
density and adherence of the film are probably not optimum.
In nickel base alloys or alloys with high nickel content, the monooxide, NiO, is often the
predominant film, but unlike FeO, nickel oxide can develop at relatively low temperatures. It is
concluded, therefore, that the poor soldering resistance exhibited by Inconel 718 is most likely
due to the development of a nickel oxide film, which provides little or no protection from molten
aluminum.
In order to examine this possibility further, thermochemical calculations were made with
the HSC chemistry software [6] to determine the equilibrium oxides. Preliminary calculations
revealed very little or no temperature dependence over the range of interest up to 1050oF, but a
very strong oxygen dependency. The calculations for H-13 and IN 718 , at a temperature of
450oC (842 oF), are presented in Figures 11 and 12 for comparison. These computations
basically involve the reaction of one mole of alloy composition with up to one mole of oxygen,
O2. The HSC software does not account for adjustments in activity due to solution of the
various elements in the base alloy. In order to compensate for this shortcoming, adjustments
were made to the activity coefficient’s based on the thermodynamic data reported by
Mazandarany and Pehlke for Ni-Cr, Fe-Cr, and Ni-Fe-Cr alloys. [7].
30

DE-FC07-01ID14034 – Evaluation of Heat Checking and Washout
In Figure 11, it can be seen that magnetite, Fe3O4, is favored at low oxygen content and
Fe2O3 is favored at high oxygen content for H-13. These results are consistent with the findings
of Fraser and Jahedi [4]. When H-13 is oxidized in air at 1000oF, the predominant oxide is
Fe2O3, but when the steel is oxidized in steam, consisting of a reduced partial pressure of
oxygen, Fe3O4, is formed. Fortunately, the steam atmosphere generated in die casting operation
when water is used to cool the surface of the dies favors the reformation and repair of the
magnetite film. The corresponding calculation for In 718 show that NiO is the predominant film
except at very low oxygen amounts where Cr2O3 and a magnetite like spinel of composition
FeCr2O4 might be favored, see Figure 6.
The actual morphological of development of oxide scales on nickel- iron alloys show a
layered structure [8]. The outermost layer consists of a two-phase mixture of nickel oxide, i.e.
NiO and a nickel oxide spinel. Underneath this is a single phase layer of nickel oxide, NiO.
Finally, there is an internal oxidation zone containing spinel precipitates.
The oxidation behavior of nickel-chromium alloys has been extensively studied at high
temperatures. When the chromium concentrations were between 5 and 30 percent, external
scales of chromia, Cr2O3, are formed over alloy grain boundaries while internal Cr2O3
precipitates and external scales of NiO are formed at other areas of the alloy surface [9]. Under
the oxidizing conditions employed, which were performed at an atmosphere of 0.1 atmosphere
of oxygen, lateral diffusion of chromium occurred from those areas covered with a continuous
layer of Cr2O3 to areas where a subscale was present. For alloys with chromium concentrations
31

DE-FC07-01ID14034 – Evaluation of Heat Checking and Washout
equal to or greater than 30 percent, chromia formed as a continuous layer over the entire alloy
surface, and the oxidation rates were controlled by diffusion through the Cr2O3 film
On the basis of these observations, it would appear that the goal for protecting Ni-Cr and
Ni-Cr-Fe alloys is to grow a continuous scale of Cr2O3. The conditions that favor chromia films
are low PO2 and high chrome concentrations in the alloy that exceed 30 weight percent. When
the concentration in IN-718 is arbitrarily increased from 19 to 30 w/o, the equilibrium amount of
Cr2O3 increases by about 50%, as shown in Figure 7. It is interesting to note that a slightly
higher oxygen amount is needed to start NiO formation at the higher chrome level.
It would probably be impractical and uneconomical to commercially produce an Inconel
alloy with such a very high chrome content. However, it may be possible to chromize the
surface of the alloy by applying a pack diffusion coating [10]. This was done by pack
cementation on H-13 with good results [11]. A protective adherent coating of Cr23C6 was
formed. There is sufficient carbon in H-13 to support the formation of chrome carbide, but in
Inconel, a dual pack process to add carbon or a second gas phase carburizing treatment would be
required. In addition, the temperatures required for these operations would be in the range where
the undesirable delta phase could form and degrade the properties of the base alloy.
If the chrome content in the outer layers of an Inconel 718 die can’t be increased by a
pack diffusion process or by laser alloying, which is another high temperature process, then the
formation of a continuous chromia coating must be accomplished at a low oxygen partial
pressure. This would have to be performed at the highest temperature possible consistent with
32

DE-FC07-01ID14034 – Evaluation of Heat Checking and Washout
maintaining the integrity of the desired precipitate microstructure. If this option, or other coating
alternatives discussed later, is not viable, then alternative alloys with more favorable oxidation
characteristics will have to be considered.
The equilibrium oxide amounts for Inconel 706, and Incoloy alloy 901 are shown in
Figures 8 and 9 respectively. Inconel 706, see Figure 8, has a higher iron content than Inconel
718 and this promotes the formation of magnetite and FeCr2O4 along with Cr2O3 at low oxygen
amounts. The oxygen range below which NiO will not form is much larger than for In 718.
Incoloy 901, which is shown in Figure 15, is very similar to Inconel-706. It is possible that
steam tempering of these two alloys will produce a protective magnetite layer supplemented by a
complimentary spinel phase. It is very difficult to produce a continuous spinel oxide because the
oxide structure requires specific lattice locations for the cations. X-ray diffraction analysis of the
magnetite on H-13 suggests that the main film is Fe3O4 with Cr cations occupying partial spinel
sites. The combined amounts of these two equilibrium phases may be enough to provide a
completely protective layer in the case of Inconel-706 and Incoloy 901.
The equilibrium oxide that forms on Incoloy 909 at low oxygen amounts is Fe3O4 as
shown in Figure 16. This alloy is not known for good high temperature oxidation resistance, but
if a continuous layer of magnetite can be formed, perhaps initially by steam tempering, this oxide
film might provide the necessary degree of protection under die casting conditions. When
exposed to higher oxygen amounts, the formation of NiO and CoO are favored along with nickel
ferrite, NiFe2O4. The formation of the monoxide’s in a two phase mixture with nickel ferrite can
be expected to degrade the protective nature of the oxide film.
33

DE-FC07-01ID14034 – Evaluation of Heat Checking and Washout
One of the significant differences between equilibrium calculations of alloy mixtures and
the oxidation of an alloy surface exposed to oxygen from one side is the formation of layered
structures, which in turn can influence the diffusion of both anions and cations and , thereby,
affect subsequent formation and growth. When an adherent magnetite film forms on and iron
base alloy, it will restrict to some extent the diffusion of iron to the oxide/gas interface and this
will also favor the formation of Fe3O4 . The most reduced oxide is thermodynamically favored at
the metal/oxide interface.
When the temperature exceeds 1050oF, the formation of the FeO phase becomes
thermodynamically favored, see Figure 17, on high iron content alloys and will take oxygen
away from the Fe3O4 layer to sustains it’s development at the oxide/metal interface. The
protective nature of the oxide film against attack by molten aluminum is quickly destroyed.
However, when nickel is added to the iron, it will significantly reduce the stability range of
wustite , which discourages FeO formation. In addition, if nickel ferrite , NiFe2O4, forms, it can
reduce the rate of iron self-diffusion to the oxide/gas interface(12). This could help slow down
oxidation at the oxide/gas interface, and help maintain the stability of the magnetite protective
layer. These factors underscore the benefits of preoxidizing these superalloy compositions
with the intent of providing the most protective surface at the very beginning of operation.
There are potential advantages to forming a native oxide protective film as opposed to an
external coating of some other compound. As shown in Figure 9, magnetite exhibits a very good
thermal expansion match with iron base alloys and this enables the film to expand and contract
34

DE-FC07-01ID14034 – Evaluation of Heat Checking and Washout
with base material and thereby remain adherent. Perhaps the greatest advantage, however, is the
self healing characteristics. Virtually no coating, grown or applied, remains continuous without
breaks flaws and defects. The ability to self repair during service is a distinct advantage. The
oxygen dependency of the favored oxide forming compounds must somehow be maintained.
Fortunately, the steam like atmosphere created in the die casting operation favors the formation
of magnetite on ferritic steels. This condition could be greatly enhanced by using nitrogen as a
cover gas. If the partial pressure of oxygen can be kept to a low level at the surface of the die,
then Fe3O4 and (Fe,M)3O4 spinels will be favored.
4.2 Test Pin Evaluation
After a number of shots, a few of the following changes were usually noticeable (1) soldering
on pin surface (2) washout on pin surface (3) pin breakage (4) pin elongation. After only three
shots, the copper-based alloy showed severe washout and soldering. It broke during ejection due
to material loss caused by the very high solubility of copper in molten aluminum, as illustrated in
Fig.18. The gray cast iron also broke during ejection of the casting after the third cycle due to its
low strength and ductility. This pin is also shown in Fig.18. These two materials were not
investigated any further since they were deemed unsuitable as die materials in aluminum die
casting. Severe soldering and washout were found on the pin surface of the IN-718 alloy and the
soft H13 after several shots. Minimal soldering and washout occurred in Mo785, Ti-6Al-4V and
Anviloy1150, as shown in Fig. 19. A change in length was noticeable in soft H13 and IN-718
alloys after 30 shots. No elongation of the pins occured in standard H13, Mo-785, Ti-6Al-4V and
Anviloy1150 alloy due to their high thermal strength and higher soldering resistance.
35

DE-FC07-01ID14034 – Evaluation of Heat Checking and Washout
4.3 Soldering Results
The development of soldering on pin surface of some metal materials is shown in Fig.20.
Soldering developed very fast on the surface of the IN-718 alloy pin. The entire surface of the
pin showed severe soldering damage after only 10 shots. Soldering developed relatively slowly
in Mo-785 alloy, Ti-6Al-4V and Anviloy1150. Soldering development has an initiation stage.
After the initiation stage of a few shots, soldering developed very fast in soft and hard-H13 but
still slowly in Mo-785, Ti-6Al-4V and Anviloy1150. According to the PAS measurements,
Anviloy1150 had the best soldering resistance, followed by Ti-6Al-4V, Mo-785, hard-H13, soft-
H13 and IN718. Fig.20 shows the Weight of Soldered Aluminum of some alloys after 50 shots.
It shows the same soldering tendency as PAS. Similar results are reported in the literature [40].
The use of this system and the Percentage of Soldering Area and Weight of Soldered Aluminum
variables to evaluate soldering resistance of die materials is therefore supported by similar
studies.
Based on these experiments, soldering occurs not only when an intermetallic layer is formed
at the interface of the casting/die, such as on the pin surfaces of IN-718 , H13. It also occurs in
the absence of an intermetallic layer, such as on the pin surfaces of Anvilloy1150 and Mo-785,
as illustrated in Fig.20. It is therefore reasonable to conclude that soldering does not necessarily
depend on the formation of an intermetallic layer at the casting /die interface. Soldering can be
described as a strong bonding between casting and die surface [29]. Chemical or metallurgical
reactions, mechanical interlocking or keying, physical adhesion, and diffusion phenomena all
contribute to strong bonding [31]. If the bond strength is higher than the casting, the detachment
36
DE-FC07-01ID14034 – Evaluation of Heat Checking and Washout
of the casting and the die will occur on the side of the casting during ejection, leading to
soldering. If the bonding strength is less than that of the casting, the detachment will occur at the
interface, and less soldering or no soldering will occur. The strength of the bond depends on the
bonding type and the bond area. Those in turn depend on the composition, temperature and die
surface conditions [41]. Usually, a high bond strength results from the formation of intermetallic
layers between casting and die surface. The mechanical keying is caused by molten aluminum
penetrating surface defects in the die surface such as machining marks, cracks, pits and holes.
Physical adhesion is due to the atomic affinity between the cast metal and the die-material.
Normally, soldering is promoted by a high die surface temperature. Also, by a long contact time
between the molten metal and the die surface.
For the first few shots, the bonding between the casting and pin surface is weak. No chemical
reaction, mechanical interlocking and physical adhesion can occur due to the "protective" action
of surface oxides and oil. After a few shots, the molten aluminum alloy will come in direct
contact with the pin material. By then, the impinging jet of molten aluminum alloy will have
removed any oxides and contaminants from the surface. The pin surface is heated to a relatively
high temperature. This creates favorable conditions for forming high strength bonding between
the molten aluminum and the surface of the pin. Metallurgical bonding forms in pins made of
iron base and nickel base alloys due to the formation of intermetallic layers by diffusion [27].
Formation of the intermetallic layers for these pins leads to severe soldering on pin surface. On
the other hand, no intermetallic phases are formed in tungsten and molybdenum alloys.
Consequently, less soldering occurs in materials such as Anvilloy1150 and Mo-785. When it
does occur, soldering originates from mechanical interlocking, diffusion and atomic attraction.
The mechanical interlocking is exacerbated by surface roughness and wetting. Diffusion
37

DE-FC07-01ID14034 – Evaluation of Heat Checking and Washout
phenomena were confirmed by EDAX analysis of the interface, close to the soldering side. In the
case of Ti-6Al-4V there is an intermetallic layer at the interface between the pin and the soldered
aluminum but the soldering is minimal as illustrated in Figs. 21 and 22. According to SEM
observations, there is a separation between the soldered aluminum alloy and the intermetallic
phase. This indicates the bonding between the intermetallic layer and the soldered aluminum
alloy is weak. Therefore, the intermetallic layer acts as a "protective" layer to reduce the
soldering tendency. This finding is also confirmed by Mihelich et al [32] and Sujata et al [33].
Several steps can be taken to reduce or stop the soldering. The chemical bond strength can
be reduced by preventing the formation of intermetallic layers. Decreasing die temperature and
using better die lubricants will act in this direction. Changing die material by using Anviloy1150
instead of tool steel and coating the die surface with a PVD, CVD coating or diffussion layer is
also a means to this end. The mechanical bonding can also be reduced by lowering the surface
roughness, using better die lubricant, reducing die surface temperature and pouring temperature.
4.4 Washout Results
Due to the different density of IN-718, H13, Ti-6Al-4V, Mo-785 and Anviloy1150, Volume
Loss was used to evaluate washout. The typical appearance of washout damage in hard-H13 is
shown in Fig.23. In this case, the soldered aluminum was cleaned with a NaOH solution.
Based on the Volume Loss, Anviloy1150 had the best washout resistance, followed by Ti-6Al-
4V, Mo-785, Hard-H13 and Soft-H13 and IN-718 as illustrated in Figures 24-25. The high
Volume Loss of Ni-base alloy is primarily due to the high solubility of nickel in liquid
aluminum. The washout of H13 in aluminum die-casting is caused primarily by erosive
38

DE-FC07-01ID14034 – Evaluation of Heat Checking and Washout
enhanced corrosive wear. This mechanism is manifested in the smooth surface observed in the
area impinged by the molten metal stream (see Fig.23). Anviloy1150, Mo-785 and Ti-6Al-4V
have very good washout resistance due to their high corrosion-erosion resistance in molten
aluminum. In aluminum die-casting, the die surface is exposed to an impinging jet of molten
aluminum. This results in washout of die material due to chemical corrosion and physical
erosion. Corrosion results from the fact that tool steels and a few other alloys dissolve in liquid
aluminum [19,27]; the high pouring temperature may cause oxidation of the die surface. Erosion
is caused by the impingement of the molten metal onto the surface. Other contributors to erosion
are cavitation and wear due to the high velocity motion of the molten aluminum (the gate
velocity usually reaches to 20-60 m/s) [30]. The concepts of "Erosion-Enhanced Corrosion" or
"Corrosion-Affected Erosion" in flowing fluids [36] can be used to describe the washout
mechanism in aluminum die-casting. These two concepts refer to any synergy between corrosion
and erosion, such that the result of material loss rates is greater than the sum of the individual
processes. According to Coulon [35], the corrosion-erosion mechanisms in the presence of
flowing fluids can be categorized by the velocity of the flow causing them: Pure corrosion
occurs at velocities up to 10 m/s; Erosion-enhanced corrosion between 10 -50 m/s; Corrosion-
affected erosion at 50-200m/s. Pure erosion occurs at velocities higher than 200m/s depending
on the material, temperature, as well as geometry factors.
Based on the impinging velocity in aluminum die-casting, the mechanism of washout can be
separated into two regimes - "Erosion-Enhanced Corrosion (EEC)" and " Corrosion-Affected
Erosion (CAE)". Erosion-enhanced corrosion prevails when the impinging velocity is not high
enough to damage the die substrate. Under these circumstances, the mechanical damage zone is
39
DE-FC07-01ID14034 – Evaluation of Heat Checking and Washout
confined within the intermetallic layers or other layers (such as die lubricant layer and oxide
layer). The materials loss rates are dominated by corrosion. Impingement increases die washout
rates because erosion removes the intermetallic layer or other protective layers and therefore
increases the corrosion rate. Corrosion is controlled by diffusion of atoms from the die materials
into the aluminum alloy. Spallation of the intermetallic layer and the oxide layer can also be
involved in EEC. Corrosion-affected erosion occurs when the impinging velocity is high enough
to cause the mechanical damage in the intermetallic layer and in the die material itself. The
material loss rates in CAE are dominated by erosion and are increased by exposing the bare die
surface repeatedly to corrosion. In CAE, the intermetallic layer is fully damaged by molten
aluminum jet stream, thus thick intermetallic layers cannot survive. If CAE occurs, plastic
depression/ deformation should be found in the impinging area of die surface [20].
The thickness of the intermetallic layer in hard-H13 is thinner in the impinged area than in the
back area without impinging. This demonstrates that an impinging jet erodes the intermetallic
layer and results in a thinner intermetallic layer. This causes higher washout rate in the
impingement zone of the H13 pin. These results agree with Shivpuri et al [30] who showed
higher rotating velocities leads to thinner intermetallic layer. This finding can be fully explained
by EEC. No CAE occurs in our experiment due to low impinging velocity (6 m/s). No CAE
occurs even with impinging velocities as high as 50 m/s [20]. Actually, CAE should be avoided
when the die is designed while EEC can not be avoided when tool steel is used as die material in
aluminum die-casting.
40

DE-FC07-01ID14034 – Evaluation of Heat Checking and Washout
The mechanism of washout in aluminum die-casting can therefore be explained by
"Erosion-Enhanced Corrosion" where washout rates are dominated by the corrosion rate (which
is controlled by transport/diffusion atoms of die material and aluminum alloy). Erosion increases
the washout rate by increasing the corrosion rate because erosion reduces or removes the
intermetallic layer or other protective layers. This allows the molten aluminum to impinge
directly on the fresh die surface without any protection layers. The low washout rate of Ti-6Al-
4V, Mo-785 and Anviloy1150 results primarily from their low corrosion rate in molten
aluminum.
Several preventive methods can be used to reduce or stop washout damage in aluminum die-
casting. Good design and materials selection of dies should avoid CAE and pure erosion or
reduce them to the lowest level. Reducing corrosion can also be promoted by decreasing die
surface temperature, better die lubrication, changing die material from tool steels to high
corrosion resistant alloys (such as Anviloy1150, Mo-base alloys or Ti base alloys), and by die
surface treating [36-38].
4.5 Thermal Fatigue Results
The thermal fatigue behavior of these pin materials are shown in Fig.27. The work shows
that anviloy1150, Mo-785 and copper base alloy were the best. However, Ti-6Al-4V cracks
more easily in thermal fatigue testing. IN-718 has no crack but with the corner dissolved. The
good thermal fatigue resistance of copper base alloy results from its excellent thermal
conductivity. The low thermal conductivity leads to the bad thermal fatigue behavior of Ti-6Al-
4V. The extreme thermal fatigue resistance of anviloy1150, Mo-785 result from the combination
41

DE-FC07-01ID14034 – Evaluation of Heat Checking and Washout
of high thermal conductivity, small thermal expansion, and very high melting point temperature
(this will result in very high softening resistance at the tested temperature).
4.6 Relationship Between Thermal Fatigue, Soldering and Washout
As already been pointed out that soldering results from strong interface bonding between
die and casting due to the formation of intermetallic layers, severe mechanical interlocking and
physical adhesion while washout is usually caused by erosion-enhanced corrosion. Therefore it
is difficult to say which leads to which. But severe soldering and severe washout usually occur
together. For example, the affinity of aluminum atoms and most of the die material atoms will
results in both severe soldering and washout due to the formation of high strength bond and high
corrosion rate. The high die surface temperature, as well as the high impinging velocity, may
also cause both severe soldering and washout. Coating protected die with high surface roughness
will probably get severe soldering after several shots but is not likely to get severe washout if the
hard coating is not been worn off.
Usually, soldering is a short-term phenomenon because soldering will form as soon as the
die surface is heated up to form strong bond. On the contrary, washout is a long-term thing and
obvious washout is not likely to occur before the formation of the soldering because the damage
of "erosion enhanced corrosion" caused by the diffusion of atoms needs time. However,
soldering and washout need to be controlled for extending die life and getting high quality
casting by better die design, optimized casting processing, better cooling, better die lubricant,
better die materials and good surface treating.
42

DE-FC07-01ID14034 – Evaluation of Heat Checking and Washout
Thermal fatigue will lead to cracking on the die surface. The crack will increase the
roughness of the die surface. The increased surface roughness will increase the tendency of
soldering and washout. However, there is no intrinsic relationship between thermal fatigue,
soldering and washout.
4.7 Performance of Protective Coatings
The next group of materials tested were those with nitrided and nitro-carburized
surfaces. Figures 27-30 shows the typical thin and thick diffusion layers in these nitrided and
nitro-carburized materials. The micro-hardness distribution is also shown and clearly identifies
the transition from the diffusion layer to the substrate. Figures 31-32 shows the overall effect of
the nitriding and nitro-carburizing treatments on the resistance of the material to soldering built
up. While all the coatings outperformed the uncoated H13 in terms of resistance to soldering
they seem to provide the same level of protection. Figures 33-35 illustrate the effects of
nitriding and nitro-carburizing treatments on the washout of the different coatings after a large
number of shots. These diffusion coatings increase the resistance of the H13 to soldering and
washout. The thicker coatings last longer and provide better protection from washout but may
initiate thermal fatigue cracking. This conclusion is based on the presence of long cracks in the
thicker coatings, as shown in Figure 38. This type of cracks were not found in the thinner
coatings. However, thinner coatings show larger areas where the coating has been completely
removed and washout of the substrate has occurred, as seen in Figures 36, 37. The overall
behavior of the coating in thermal fatigue is illustrated in Figures 40, 41. Based on this
evaluation, the following conclusions were reached:
43

DE-FC07-01ID14034 – Evaluation of Heat Checking and Washout
o Nitro-carburizing improves somewhat the resistance of H13 pins to soldering (sticking of
Al) but does not prevent it.
o Nitro-carburizing improves significantly the resistance of H13 pins to washout (loss of
base metal).
o Thick nitro-carburized layers provide better resistance to washout. However, they tend to
crack more readily than thin coatings.
o Thick nitro-carburized coatings are desirable in “soldering intensive” applications;
thin nitro-carburized coatings may be desirable in “thermal fatigue intensive”
applications that can induce cracking.
The final group that was tested were the H 13 pins PVD coated with various coatings for
improved soldering and washout resistance. This group included CrC at 6.25 microns, CrN + W
at 3.5 microns, CrN at 5 microns and (TIAI)N at 2.0 microns. Table 6 shows the characteristics
of the PVD coatings. Figure 42 illustrates the thickness of the coatings, shown here in a cross-
section of the coated specimens. Figures 43-47 show the appearance of the coated pins after
increasing number of shots. Figures 48-49 show the effect of the coatings on the resistance to
soldering. Figures 50-51 show the effect of the coatings on the resistance to washout. .It is noted
from this group that the weight of soldered aluminum and washout of the pin was less for the
CrC than the other coating materials. When these coatings were tested for longer periods, the
CrC held up the best, as shown in figure 51. The relative washout resistance of the various
44

DE-FC07-01ID14034 – Evaluation of Heat Checking and Washout
coatings in figure 50 show that the CrN + W as the second best coating. The CrC is a thicker
coating than the others and is more likely to crack in thermal fatigue. Figures 52-58 show the
damage to the coatings with increasing number of shots. The CrC coating shows least damage.
Figures 60-65, 66-68 are scanning electron micrographs of the surface and cross-section of the
coated specimens. They illustrate the failure mechanism of the coatings. Essentially, these
coatings fail at defect sites, primarily pinholes in the coating. Once the aluminum penetrates
under the coating, it starts undercutting it by dissolving the underlying substrate. The area of the
damage increases gradually until the part by formation of new sites and coalescence of the
damaged areas. The main conclusions from the evaluation of the PVD coatings are:
o The “thick” CrC PVD coating was the best performer among the PVD coatings evaluated
so far.
o However, this coating is primarily recommended for small cores; It is more susceptible to
thermal fatigue cracking than the thin coatings.
o The thin PVD coatings fail at surface imperfections in the substrate and at defect sites in
the coating (pin-holes). Good coatings practices are essential in ensuring a high
performance coating.
45

DE-FC07-01ID14034 – Evaluation of Heat Checking and Washout
5. GENERAL CONCLUSIONS AND RECOMMENDATION FOR FUTURE WORK
(1) An accelerated experimental arrangement and a testing procedure have been established to
evaluate the soldering and washout resistance for aluminum die-casting.
(2) Percentage of soldering area with aluminum on pin impinging surface (PSA) and weight of
soldered aluminum on pin surface (WSA) can be used accurately and conveniently for evaluating
the resistance to soldering. Weight loss of pin (WL) or volume loss of pin (VL) can be used to
evaluate the resistance to washout accurately and conveniently.
(3) Anviloy1150 has the best resistance to soldering and washout, followed by Mo-785, Ti-6Al-
4V, hard-H13, soft-H13, Ni718 and cast iron. Copper base alloy has the worst.
(4) Anviloy1150, Mo-785 and copper base alloy have the best thermal fatigue resistance while
Ti-6Al-4V has very bad thermal fatigue behavior.
(5) The mechanism of soldering and washout has been proposed. Soldering results from strong
bond between die and casting due to the formation of intermetallic layers, mechanical
interlocking and physical attraction. Washout usually is caused by erosion-enhanced corrosion
and dominated by corrosion rate.
46

DE-FC07-01ID14034 – Evaluation of Heat Checking and Washout
5.1 Recommendations
If Inconel 718 is to be used in aluminum die casting service, either a suitable protective
coating system must be found or a protective native oxide must be developed.
Potential Coatings for Inconel 718
The Thermo-Reactive Deposition and Diffusion , TRD, developed in Japan, and offered
in the US by the Arvin TD Center in Columbus, Indiana is arguably the most successful
commercial coating in use today for H-13. The dies or inserts to be coated are immersed in a
borax salt, typically Na2B4O7, containing carbide forming elements such as vanadium,
chromium, and niobium. These diffuse into the substrate and react with the carbon to form a
dense adherent carbide protective layer. This works quite well for H-13 which has a carbon
content of 0.4 weight percent. Inconel 718 and most of the other candidate superalloys have
carbon levels that are on the order of ten times lower, i.e. 0.04 weight percent, which is probably
insufficient to support a continuous coating. In addition, this salt bath process is carried out at
temperatures on the order of 1000 – 1050oC (1832 – 1922oF). Immersion times of 4-8 hours are
required for H-13 to produce carbide layers of 5-10 microns in thickness. This type of exposure
could transform γ” precipitates into the delta phase with some degree of loss in mechanical
properties.
47

DE-FC07-01ID14034 – Evaluation of Heat Checking and Washout
If TRD coatings are desired, a gas carburizing step would probably be required to
precede the coating step in order to dissolve sufficient carbon into the surface layers. This is
generally done at temperatures of 850 oC (1560 oF) and above in a gas atmosphere consisting of
a carrier gas, e.g. Endogas, and enriching gas, i.e. methane (CH4) or propane (C3H3).
Inconel 718 and many other nickel-iron superalloy compositions contain sufficient
chromium to directly form a chrome carbide coating on the surface. Yu, Rapp and Shivpuri have
shown that a coating of Cr23C6 can be quite protective against molten aluminum.(11) Thus, a gas
carburizing treatment would offer a straightforward method of coating high chromium
containing superalloys. A chrome carbide surface coating might be expected to oxidize to form
a healing layer of Cr2O3 at defective locations in the original coating if the oxygen partial
pressure is maintained at a low level.
There are a variety of other commercial coatings that have been tried in aluminum die
casting service with various degrees of success. However, there is no coating systems that has
afforded complete protection from soldering attack and most fail quickly if the surface
temperatures exceed 1050 oF. All coatings have cracks, pinholes, or areas of incomplete
coverage. The aluminum quickly attacks these sites and intermetallics form. There is a large
volume expansion associated with the formation of the intermetallic phase and this disrupts or
lifts the adjacent coating, thereby allowing further reaction to spread laterally across the surface.
If the coating has no mechanism to repair itself or if the underlying die alloy cannot form a
native coating to protect itself, then soldering will rapidly develop and washout may become a
48

DE-FC07-01ID14034 – Evaluation of Heat Checking and Washout
threat. This problem presents a significant challenge to all nickel or cobalt containing alloys and
conditions that favor the formation of a nonprotective NiO and CoO scales.
Forming a Protective Oxide on Inconel 718
The equilibrium thermochemical calculations presented in Figure 6, suggest that Cr2O3
and FeCr2O4 will form on Inconel 718 at low partial pressures of oxygen. The growth of a
continuous Cr2O3 film could be insured by increasing the chromium content near the surface of
the die. This could be accomplished with a halide-activated pack cementation process (10). A
pre-oxidation step at temperatures up to 1000oF and at a pressure of 0.1 atm oxygen would help
develop a dense and adherent initial layer. The enriched chromium reservoir would also aid in
repairing the protective layer in service. Even a thin continuous layer of chrome oxide will
reduce the oxygen activity at the oxide/metal interface and discourage, if not prevent, the
formation of nonprotective films consisting of NiO.
Alternative Alloys
Three alternative nickel-iron alloys have been identified that could have the potential of
being more corrosion resistant than Inconel 718. These include, Incoloy 909, which contains
cobalt, and exhibits both high strength as well as low thermal expansion, Inconel 706, which is
similar to Inconel 718, and Incoloy 901. All of these alloys have higher iron contents than
Inconel 718 . As a result, they are more likely to form native protective magnetite or spinel
scales at low oxygen partial pressures It is recommended that these three alloys be tested in the
49

DE-FC07-01ID14034 – Evaluation of Heat Checking and Washout
CWRU thermal cycle test to determine if they are equivalent in heat-checking resistance to
Inconel 718.
Preoxidizing the Alternative Alloys
Figures 8 and 9 suggest that a mixture of Cr2O3, FeCr2O4, and Fe3O4 can form on Inconel
706 and Incoloy 901 at low oxygen partial pressures. These alloys should be preoxidized at
temperatures up 1000 oF in 0.1 atm of oxygen prior to being placed into service. The goal is to
develop a dense adherent protective oxide scale before contact with molten aluminum is
initiated. A low oxygen partial pressure is required to prevent the formation of NiO. It may also
become necessary to maintain a low oxygen activity during service by using a nitrogen cover gas
so that the oxide scale can repair itself when damaged. The high nickel contents in these alloys
should raise the critical temperature for wustitie (FeO) formation which means that oxidation at
higher temperatures may be possible.
Incoloy 909 has no chrome which precludes the formation of chrome containing scales.
The equilibrium oxide at low oxygen partial pressure is expected to be Fe3O4 as shown in Figure
10. This alloy should also be preoxidized prior to service to enable a dense adherent magnetite
film to form. The low PO2 range required to maintain stability of the magnetite film would
probably necessitate that dies be run under a nitrogen cover gas to prevent the formation of
nickel oxide. The high nickel content in the alloy should also raise the temperature required for
FeO formation.
50

DE-FC07-01ID14034 – Evaluation of Heat Checking and Washout
Coating the Alternative Alloys
Neither Inconel 706 nor Incoloy 901 have sufficient chrome to develop continuous
protective Cr2O3 films. It should be possible to chromize both of these alloys and then
preoxidize them to obtain a continuous film as well as provide a reservoir of chrome to assist in
repair of the oxide film during service. However, both alloys have sufficient chrome to support
the formation of chrome carbides, e.g. Cr23C6, if subjected to a gas carburizing treatment. Both
these processes could produce the delta phase in Inconel 706 and Incoloy 909, but not Incoloy
901.
A coating process that has enjoyed some success in the die casting of aluminum is
nitrocarburizing. One form of this process, called Dyna Blue TM is offered by Dynamic Metal
Treating, Inc. of Canton Michigan. Dyna Blue TM is a fluidized bed process that combines gas
phase diffusion of nitrogen and carbon into the surface and then follows this up with a steam
bluing step to produce Fe3O4. The fluidized bed nitrocarburizing step emphasizes nitrogen over
carbon. However, there is no compelling evidence to support the idea that nitrides are more
protective than carbides. There is evidence that the steam tempering of steels to produce a dense
Fe3O4 layer can significantly improve soldering resistance(4). This suggests that the real
advantage of the Dyna Blue process may be the formation of a protective magnetite layer. The
hard carbo-nitride underlayer could also provide some additional resistance to erosion in areas of
the die, e.g. gates, where the metal velocity is very high during the injection step. Thus, this
coating process could be very useful for alloys like Inconel 706 , Incoloy 901, and Incoloy 909
because of their higher iron content. In effect, it is equivalent to a preoxidation step. They key
51

DE-FC07-01ID14034 – Evaluation of Heat Checking and Washout
to a good coating will probably require careful control of the oxygen partial pressure for these
alloys. The fluidized bed nitrocarburizing step can be performed at temperatures below 1200oF
(649oC) and the steam tempering step can be performed at 1000oF (537 oC) so the danger of delta
phase formation is significantly reduced.
52

DE-FC07-01ID14034 – Evaluation of Heat Checking and Washout
6.0 REFERENCES (1) J.F. Wallace, Y. Wang, and D. Schwam, “Effect of Composition and Processing on the Thermal Fatigue and Toughness of High Performance Die Steels"” Die Casting Engineer,
Sept./Oct., 1997, Vol. 41, No. 5, p 26. (2) E.L. Courtright, and J.E. Deibler, “Analytical Modeling of Die Stresses and Their Affect
On Die Life,” Transactions, 20th International Die Casting Congress & Exposition, Paper T99-034, pp109-119, November, 1999.
(3) V.N. Yermenko, Ya.V. Natanzon, and V.I. Dybkov, “The Effect of Dissolution on the
Growth of the Fe2Al5 Interlayer in the Solid Iron-Liquid Aluminum System,” Journal of Materials Science , 16, pp 1748-1756, 1981.
(4) D. Fraser and M. Jahedi, “Magnetite Coating for Prevention of Soldering in Aluminum HPDC Tooling,” Die Casting Engineer, pp 96-100 March/April 2000.
(5) J.C. Benedyk, D.J. Moracz, and J.F. Wallace., “Thermal Fatigue Behavior of Die Materials
for Aluminum Die Casting”, SDCE, Paper No. 111, 6th SDCE International Die Casting Conference, 1970, pp 1-20.
(6) HSC Chemistry for Windows, Version 2.0, Outokumpu Research Oy, P.O Box 60, FIN-28101 PORI, Finland. (7) F.N. Mazandarany and R.D. Pehlke, “Thermodynamic properties of Solid Alloys of Chromium with
Nickel and Iron,” Metallurgical Transactions, Vol 4, September, 1973, pp 2067-2076 (8) A.D. Dalvi and W.W. Smeltzer, “The Kinetics and Morphological Development of the Oxide Scale
on Nickel-Iron Alloys (0-25 w/o Fe) at 1000 oC,” J. Electrochem. Soc., Vol. 118, No. 12, December 1981, pp 1978-1985.
(9) C.S. Giggins, and F.S. Pettit, “Oxidation of Ni-Cr Alloys Betweeen 800o and 1200 oC,”
Transactions of the Metallurgical Society of AIME, Vol. 245, December 1969, pp 2495-2507. (10) R.R. Bianco and R.A. Rapp, “Simultaneous Chromizing and Aluminizing of Nickel-Base
Superalloys with Reactive Element Additions,” High Temperature Materials Chemistry V, ed. W.B. Johnson and R.A. Rapp (Pennington, NJ: Electrochem. Soc, 1990), p 211.
(11) M.Y, R.Shivpuri and R.A. Rapp, “Effects of Molten Aluminum on H13 Dies and Coatings, Journal
of Materials Engineering and Performance, Vol. 4(2), April 1995, pp175-181.
53
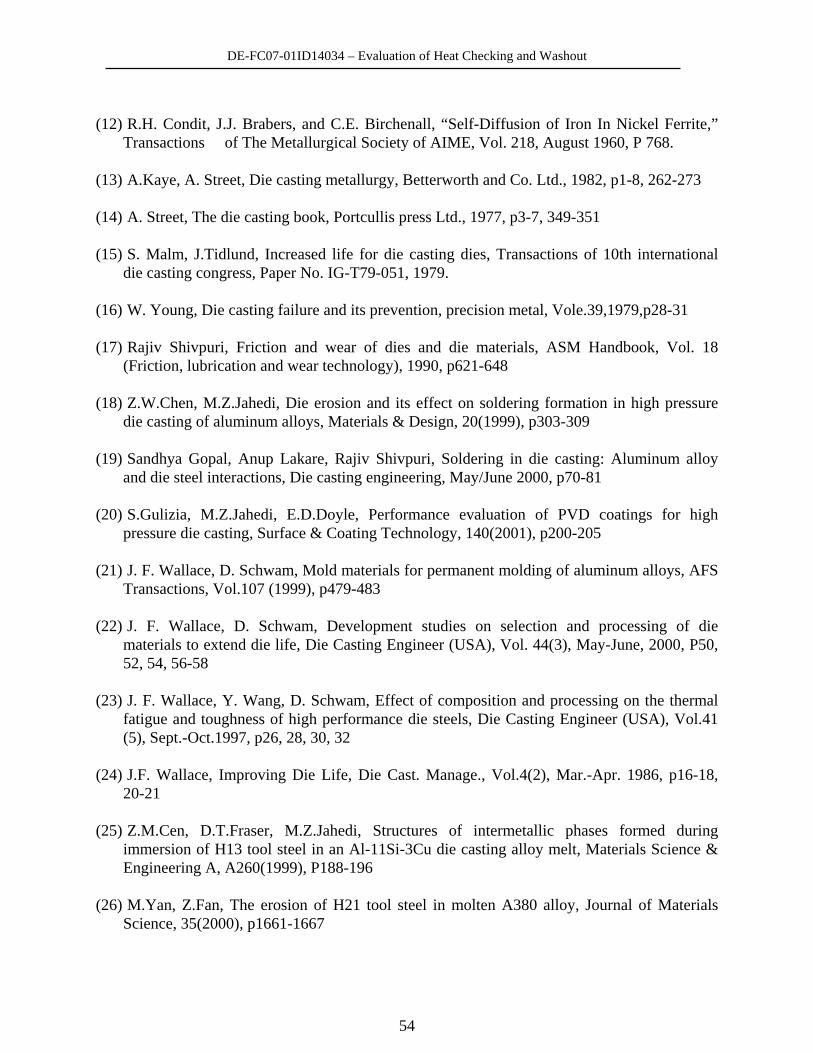
DE-FC07-01ID14034 – Evaluation of Heat Checking and Washout
(12) R.H. Condit, J.J. Brabers, and C.E. Birchenall, “Self-Diffusion of Iron In Nickel Ferrite,”
Transactions of The Metallurgical Society of AIME, Vol. 218, August 1960, P 768. (13) A.Kaye, A. Street, Die casting metallurgy, Betterworth and Co. Ltd., 1982, p1-8, 262-273 (14) A. Street, The die casting book, Portcullis press Ltd., 1977, p3-7, 349-351 (15) S. Malm, J.Tidlund, Increased life for die casting dies, Transactions of 10th international
die casting congress, Paper No. IG-T79-051, 1979. (16) W. Young, Die casting failure and its prevention, precision metal, Vole.39,1979,p28-31 (17) Rajiv Shivpuri, Friction and wear of dies and die materials, ASM Handbook, Vol. 18
(Friction, lubrication and wear technology), 1990, p621-648 (18) Z.W.Chen, M.Z.Jahedi, Die erosion and its effect on soldering formation in high pressure
die casting of aluminum alloys, Materials & Design, 20(1999), p303-309 (19) Sandhya Gopal, Anup Lakare, Rajiv Shivpuri, Soldering in die casting: Aluminum alloy
and die steel interactions, Die casting engineering, May/June 2000, p70-81 (20) S.Gulizia, M.Z.Jahedi, E.D.Doyle, Performance evaluation of PVD coatings for high
pressure die casting, Surface & Coating Technology, 140(2001), p200-205 (21) J. F. Wallace, D. Schwam, Mold materials for permanent molding of aluminum alloys, AFS
Transactions, Vol.107 (1999), p479-483 (22) J. F. Wallace, D. Schwam, Development studies on selection and processing of die
materials to extend die life, Die Casting Engineer (USA), Vol. 44(3), May-June, 2000, P50, 52, 54, 56-58
(23) J. F. Wallace, Y. Wang, D. Schwam, Effect of composition and processing on the thermal
fatigue and toughness of high performance die steels, Die Casting Engineer (USA), Vol.41 (5), Sept.-Oct.1997, p26, 28, 30, 32
(24) J.F. Wallace, Improving Die Life, Die Cast. Manage., Vol.4(2), Mar.-Apr. 1986, p16-18,
20-21 (25) Z.M.Cen, D.T.Fraser, M.Z.Jahedi, Structures of intermetallic phases formed during
immersion of H13 tool steel in an Al-11Si-3Cu die casting alloy melt, Materials Science & Engineering A, A260(1999), P188-196
(26) M.Yan, Z.Fan, The erosion of H21 tool steel in molten A380 alloy, Journal of Materials
Science, 35(2000), p1661-1667
54

DE-FC07-01ID14034 – Evaluation of Heat Checking and Washout
(27) M.Yan, Z.Fan, Review: Durability of materials in molten aluminum alloys, Journal of Materials Science, 36(2001), p285-295
(28) Sumanth Ahankar, Diran Apelian, Soldering tendencies of alternate nonferrous die
materials, NADCA Meeting, November 2000, Chicago. (29) Q.Han, E.A.Kenik, S.Viswanathan, Die soldering in aluminum die casting, Light metals
2000, Aluminum Committee at the 129th TMS Annual Meeting, Nashville, Tenne, 12-16 Mar.2000, p765-770
(30) R. Shivpuri, Y-L. Chu, K. Venkatesan, An evaluation of metallic coating for erosive wear
resistance in die casting applications, Wear, Vol. 192(1996), p49-55 (31) K.L. Mittal, Adhesion aspects of metallization of organic polymer surface, Journal of
vacuum science and technology, Vol.13 (1976), p19-25 (32) J. Mihelich, R.F.Decker, US Patent no.5711366, 1998. (33) M.Sujata, S.Bhargava, S.Sangal, On the formation of TiAl3 during reaction between solid Ti
and liquid Al, Journal of Materials Science Letters (UK). Vol.16(14), 15 July 1997, p1175-1178.
(34) D.M. Rishel, F.S. Petit, N. Birks, Some principal mechanisms in the simultaneous erosion
and corrosion attack of metals at high temperature, Paper 16, Proceedings of corrosion-erosion-wear of materials at elevated temperatures, A.V.Levy, Ed., NACE/EPRI/LBL/DOE-FE, Berkeley, CA, 31 Jan.-2 Feb. 1990.
(35) P.A. Coulon, Erosion-corrosion in stream turbines Part II: a problem largely resolved,
Lubricant engineering, Vol.42 (No.6), 1986, p357-362 (36) V.Joshi, K.Kulkarni, R.Shivpuri, R.S.Bhattachatya, S.J.Dikshit, D.Bhat, Dissolution and
soldering behavior LAFAD PVD coatings, Surface and Coatings Technology, 146-147(2001), P338-343
(37) Yucong Wang, A study of PVD coatings and die materials for extended die-casting die life,
Surface and Coatings Technology, 94-95(1997), P60-63 (38) C. Mitter, F.Holler, F.Ustel, D.Heim, Application of hard coatings in aluminum die casting-
soldering, erosion and thermal fatigue behavior, Surface and Coatings Technology, 125(2000), P233-239
55

DE-FC07-01ID14034 – Evaluation of Heat Checking and Washout
FIGURES
56
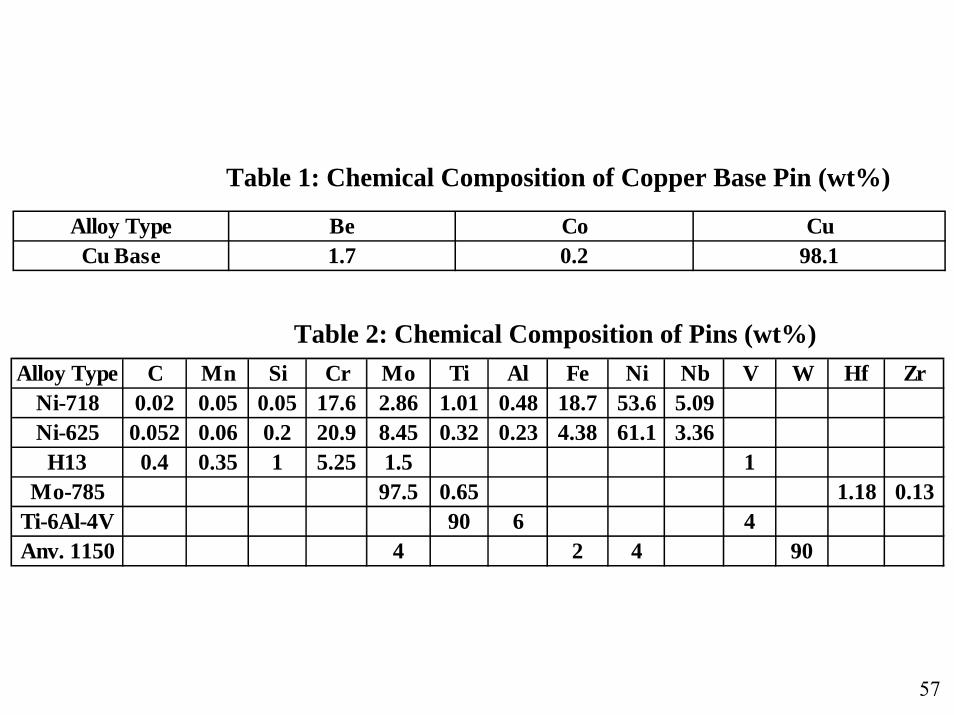
Table 1: Chemical Composition of Copper Base Pin (wt%)
Alloy Type Be Co CuCu Base 1.7 0.2 98.1
Table 2: Chemical Composition of Pins (wt%)Alloy Type C Mn Si Cr Mo Ti Al Fe Ni Nb V W Hf Zr
Ni-718 0.02 0.05 0.05 17.6 2.86 1.01 0.48 18.7 53.6 5.09Ni-625 0.052 0.06 0.2 20.9 8.45 0.32 0.23 4.38 61.1 3.36
H13 0.4 0.35 1 5.25 1.5 1Mo-785 97.5 0.65 1.18 0.13
Ti-6Al-4V 90 6 4Anv. 1150 4 2 4 90
57

Figure 1: UBE VSC 315 Ton Squeeze Cast Machine at CWRU
58

Figure 2: Schematic Diagram of the Accelerated Soldering Test
Die cavityGate Test pin
PlungerShot sleeve
Molten Aluminum
59

Figure 3: Schematic of the Washout/Soldering Testing Set-up
Plunger
Shot Sleeve
Test Pins
CavityAl jet from slitca. 75 in/sec
60

Figure 4a: Sub-Insert for Soldering&Washout Experiments
Anviloy 1150 Hard-H13
The hard H-13 pin is coated with a silvery soldered layer of Al 61
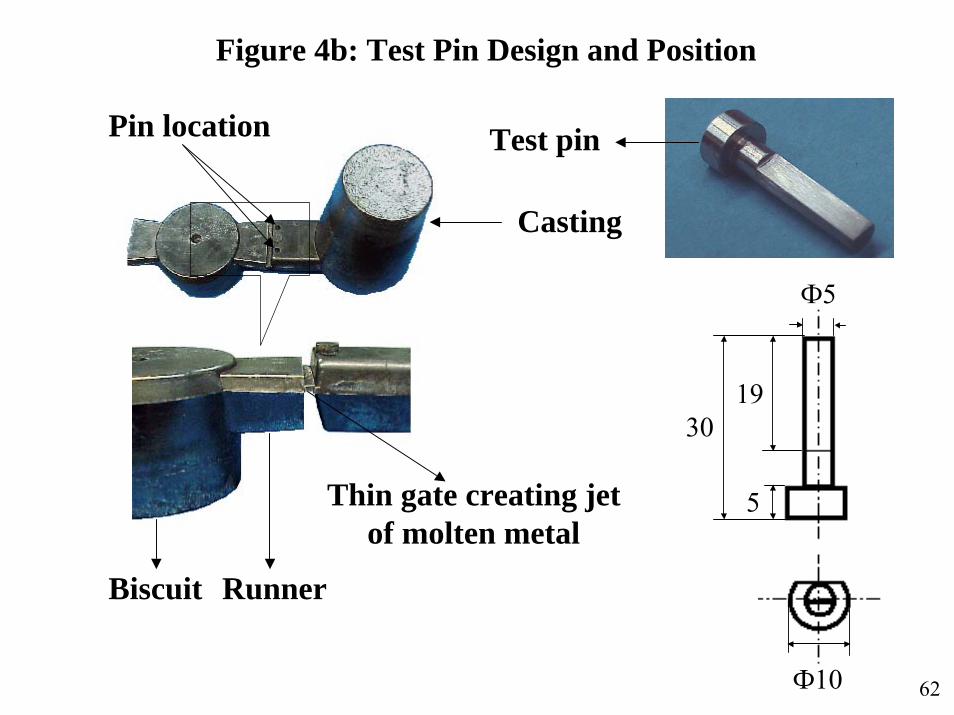
Figure 4b: Test Pin Design and Position
Casting
Pin location
Biscuit Runner
Thin gate creating jetof molten metal
Test pin
3019
5
Ф10
Ф5
62

Figure 5: Thermal Fatigue Immersion Test and Equipment
63
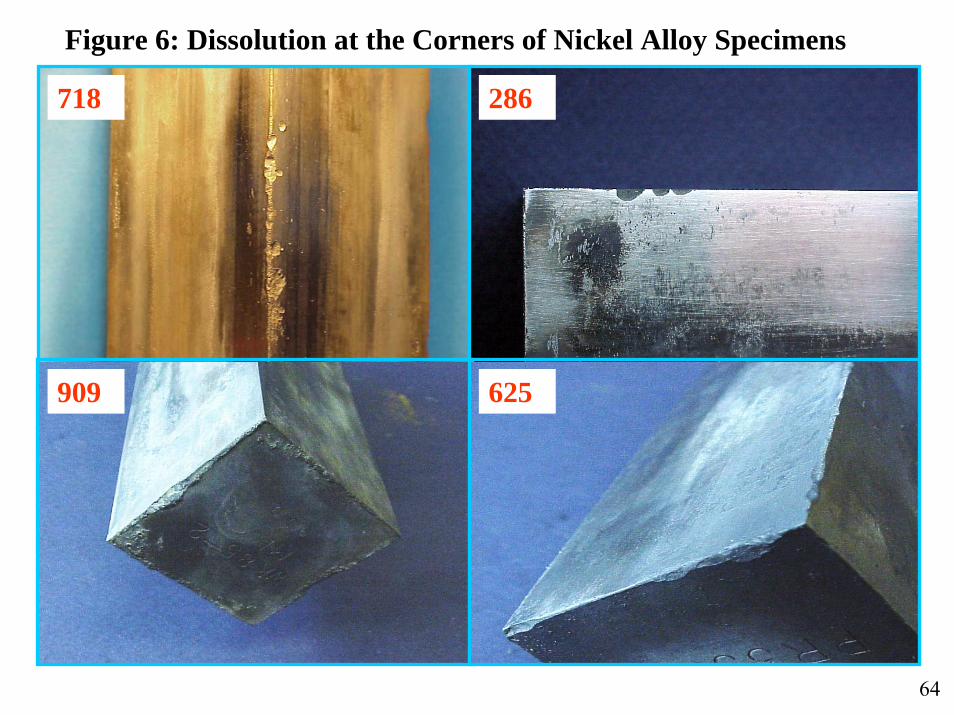
Figure 6: Dissolution at the Corners of Nickel Alloy Specimens
718 286
909 625
64

Table 3: Nominal Superalloy Compositions in wt%
Alloy Fe Ni Cr Co C Mo V Nb Ti Al B Mn Si H-13 90.5 0.3 5.0 0.4 1.4 1.0 0.35 1.0 Inconel 706 37.6 40.0 16.0 0.06 3.0 2.0 0.4 0.35 0.35 Inconel 718 18.5 52.5 19.0 0.04 3.0 5.1 0.9 0.5 0.20 0.2 A-286 55.0 26.0 15.0 0.04 1.25 0.3 2.0 0.2 .005 Incoloy 901 35.0 42.5 12.5 0.1 5.9 2.9 0.35 .015 Incoloy 909 42.0 38.0 13.0 0.01 4.7 1.5 0.4
65

Figure 7: Temperature dependent yield strength forseveral superalloys compared with H-13.
020406080
100120140160180200
0 200 400 600 800 1000 1200 1400
H-13IN 718A-286Incoloy 901Incoloy 909IN 706
0.2%
Yie
ld S
tres
s ksi
Temperature oF
66

Figure 8: Temperature dependent thermal conductivityfor several superalloys compared with H-13.
The
rmal
Con
duct
ivity
Btu
/ft-h
r-o F
0
5
10
15
20
0 200 400 600 800 1000 1200
H-13IN 718A-286Incoloy 901Incoloy 909IN-706
Temperature oF
67

Figure 9: Percent linear expansion of H-13 and several superalloys.
0
0.2
0.4
0.6
0.8
1
1.2
1.4
1.6
0 500 1000 1500Temperature (F)
% L
inear
Exp
ansio
n
H-13Fe3O4IN 718A 286Incoloy 901Incoloy 909IN 706
68

Figure 10: Elastic Modulus as a function of temperaturefor several superalloys and H-13.
20
22
24
26
28
30
32
0 500 1000 1500
H-13IN 718A-286Incoloy 901IN 706
Ela
stic
Mod
ulus
106
psi
Temperature oF
69

Figure 11: Equilibrium amounts of various oxide compounds calculated to form when 1 mole of H-13 alloy is reacted with oxygen at 450 Centigrade
0 0.2 0.4 0.6 0.8 10.00
0.05
0.10
0.15
0.20
0.25
0.30
0.35
0.40
0.45
0.50
Equilibrium compounds forming on H-13 base composition at 450 Centigrade
mol
mol
O2(g)
File: C:\HSC\H13.OGI
Fe2O3Fe3O4FeO*Cr2O3Cr2O3NiO*Fe2O3NiONiO*Cr2O3
Equ
ilibr
ium
Am
ount
70

Figure 12: Equilibrium amounts of various oxide compounds calculated to form when 1 mole of IN-718 alloy is reacted with oxygen at 450 Centigrade
0 0.2 0.4 0.6 0.8 10.00
0.05
0.10
0.15
0.20
0.25
0.30
0.35
0.40
0.45
0.50
Equilibrium compounds forming on In 718 base composition at 450 Centigrade
mol
mol
O2(g)
File: C:\HSC\IN718.OGI
NiOFeO*Cr2O3Cr2O3NiO*Cr2O3NiO*Fe2O3Fe3O4Fe2O3
Equi
libriu
m A
mou
nt
71

Figure 13: Equilibrium amounts of various oxide compounds calculated to form when 1 mole of IN-718 alloy with 30% Cr is reacted with
oxygen at 450 Centigrade
0 0.2 0.4 0.6 0.8 10.00
0.05
0.10
0.15
0.20
0.25
0.30
0.35
0.40
0.45
0.50
Equilibrium compounds forming on In 718 base composition at 450 Centigrade (30
mol
mol
O2(g)
File: C:\HSC\IN718.OGI
NiOFeO*Cr2O3Cr2O3NiO*Cr2O3NiO*Fe2O3Fe3O4Fe2O3
Equ
ilibr
ium
Am
oun t
72

Figure 14: Equilibrium amounts of various oxide compounds calculated to form when 1 mole of IN-706 alloy is reacted with oxygen at 450 Centigrade
0 0.2 0.4 0.6 0.8 10.00
0.05
0.10
0.15
0.20
0.25
0.30
Equilibrium compounds forming on In 706 base compostion at 450 Centigrade
mol
mol
O2(g)
File: C:\HSC\IN706.OGI
NiONiO*Fe2O3Fe3O4FeO*Cr2O3Cr2O3NiO*Cr2O3Fe2O3
Equ
ilibr
ium
Am
oun t
73

Figure 15: Equilibrium amounts of various oxide compounds calculated to form when 1 mole of Incoloy 901 alloy is reacted with oxygen at 450 Centigrade
0 0.2 0.4 0.6 0.8 10.00
0.05
0.10
0.15
0.20
0.25
0.30
Equilibrium Compounds forming on Incoloy 901at 450 Centigrade
mol
mol
O2(g)
File: C:\HSC\INC901.OGI
NiONiO*Fe2O3Fe3O4FeO*Cr2O3Cr2O3NiO*Cr2O3Fe2O3
Equ
ilibr
ium
Am
ount
74

Figure 16: Equilibrium amounts of various oxide compounds calculated to form when 1 mole of Incoloy 909 alloy is reacted with oxygen at 450
Centigrade
0 0.2 0.4 0.6 0.8 10.00
0.05
0.10
0.15
0.20
0.25
0.30
Equilibrium Compounds forming on Incoloy 909 at 450 Centigrade
mol
mol
O2(g)
File: C:\HSC\INC909.OGI
NiONiO*Fe2O3Fe3O4CoOCoO*Fe2O3Co3O4Fe2O3
Equ
ilibr
ium
Am
ount
75

Figure 17: Equilibrium amounts of various oxide compounds calculated to form when 1 mole of H-13 alloy is reacted with oxygen at 565 Centigrade
showing the formation of FeO.
0 0.2 0.4 0.6 0.8 10.00
0.05
0.10
0.15
0.20
0.25
0.30
0.35
0.40
0.45
0.50
Equilibrium compounds forming on H-13 base composition at 450 Centigrade
mol
mol
O2(g)
File: C:\HSC\H13.OGI
Fe2O3FeO(W)Fe3O4FeO*Cr2O3Cr2O3NiO*Fe2O3NiONiO*Cr2O3
Equ
ilibr
ium
Am
ount
76
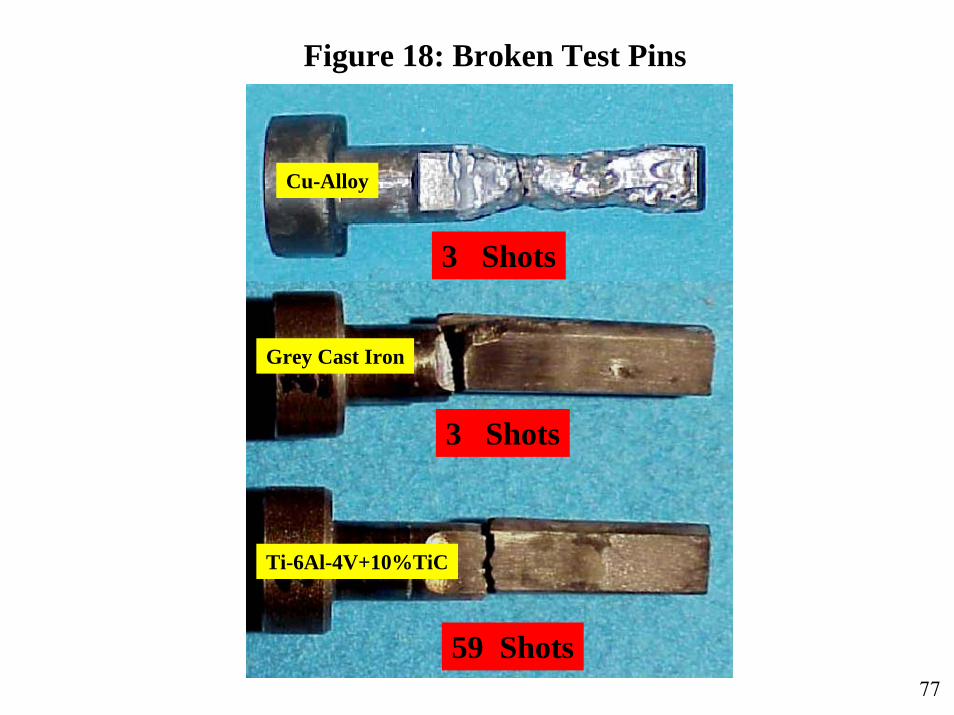
Figure 18: Broken Test Pins
3 Shots
Cu-Alloy
3 Shots
Grey Cast Iron
Ti-6Al-4V+10%TiC
59 Shots77

Figure 19: Appearance of Pins after 50 Shots (with Soldered Al Dissolved in NaOH)
Hard-H13
Anvilloy 1150
Ti-6Al-4V
Mo-785
78

Figure 20: Effect of Pin Material on Soldering
0.00
20.00
40.00
60.00
80.00
100.00
120.00
0 10 20 30 40 50 60
Shot Number
Perc
enta
ge o
f Pin
Sur
face
with
Sol
deri
ng(%
)
H13-BaseAnviloy 1150Ti-6Al-4VMo-785
79

Figure 21: Effects of Pin Material & Number of Shots on Percentage Area Covered with Soldering
0
20
40
60
80
100
120
0 20 40 60 80 100 120
Shot Number
Anviloy 1150Ti-6Al-4VMo-785Hard-H13Soft H13Ni-Base AlloyCu-Base Alloy
Ti-6Al-4VAnviloy 1150
Mo-785
Hard-H13
Soft H13
Ni-Base AlloyCu
Perc
enta
ge o
f Pin
Are
a w
ith S
olde
ring
(%)
80

Figure 22: Effects of the Pin Material on Soldering
0
0.005
0.01
0.015
0.02
0.025
0.03
0.035
Hard-H13Base
Soft-H13 Ni-625 Ni-718 Mo-Base Ti-Base Anv.1150
Wei
ght o
f Sol
dere
d A
l on
Pin
Surf
ace(
g)
81

Figure 23: Washout in the Hard H13 Pin Impinged Directly by the Al (50 shots)
82

0.00
0.02
0.04
0.06
0.08
0.10
0.12
0.14
H-H13 Mo-Base Ti-Base Anv.1150
Wei
ght L
oss(
g)
50 Shots 100 Shots100 Shots100 Shots
Figure 24: Effects of Pin Material on Washout
Determined by weighing the pins before and aftershots w/o soldered layer (cleaned with sodiumhydroxide)
83

Figure 25: Washout Induced Weight Loss
Determined by weighing the pins before and after shots w/o soldered layer (cleaned with sodium hydroxide)
0.0
0.5
1.0
1.5
2.0
2.5
3.0
3.5
4.0
4.5
5.0
H-H1350Shots
Mo-Base100Shots
Ti-Base100 Shots
W-Base100 Shots
Perc
enta
ge o
f Wei
ght L
oss(
%)
84

Figure 26: Percentage of Weight Loss
0.30
0.00
0.05
0.10
0.15
Perc
enta
ge o
f Wei
ght L
oss(
%) 0.25
0.20
Mo-Base Ti-Base W-Base
Determined by weighing the pins before and after shots w/o the solderedlayer (cleaned with sodium hydroxide)
85
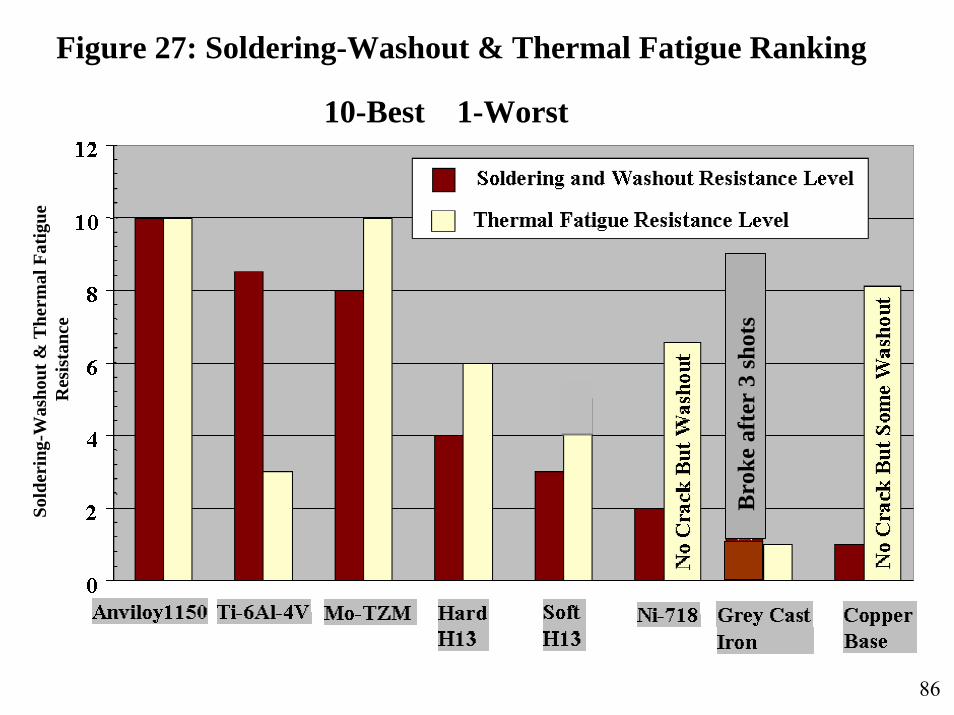
Figure 27: Soldering-Washout & Thermal Fatigue Ranking
10-Best 1-Worst
Sold
erin
g-W
asho
ut &
The
rmal
Fat
igue
R
esis
tanc
e
Br o
ke a
fter
3 sh
ots
86

Figure 28: Hardness Distribution in Nitro-Carburized Diffusion Layers
B U 50 µm50 µm
40
45
50
55
60
65
70
75
80
0 50 100 150 200 250 300 350 400
Distance from Surface(µm)
Har
dnes
s(H
RC
)
40
45
50
55
60
65
70
75
80
0 50 100 150 200 250 300 350 400
Har
dnes
s(H
RC
)
Distance from Surface(µm)87

Figure 29: Hardness Distribution in Nitro-Carburized Diffusion Layers
50 µm50 µm D 8- H1D 5 - A1
40
45
50
55
60
65
70
75
80
0 50 100 150 200 250 300 350 400
Har
dnes
s(H
RC
)
40
45
50
55
60
65
70
75
80
0 50 100 150 200 250 300 350 400
Har
dnes
s(H
RC
)
Distance from Surface(µm) Distance from Surface(µm)88

Figure 30: Hardness Distribution in Nitro-Carburized Diffusion Layer
50 µm50 µmD 5-A2
40
45
50
55
60
65
70
75
80
0 50 100 150 200 250 300 350 400
Distance from Surface(um)
Har
dnes
s(H
RC
)
D8-H2
40
45
50
55
60
65
70
75
80
0 50 100 150 200 250 300 350 400
Har
dnes
s(H
RC
)
Distance from Surface(um)89

Figure 31: Effect of the Nitro-Carburizing Treatment on Soldering
0.00
20.00
40.00
60.00
80.00
100.00
120.00
0 10 20 30 40 50 60
Perc
enta
ge o
f Pin
Sur
face
with
Sol
deri
ng(%
)
H13-Base
B (thin)
U (thick)
D5A-1 (thin)
D8H-1 (thick)
Shot Number
90

Figure 32: Effect of Nitro-carburizing on SolderingAfter 50 Shots
0
0.002
0.004
0.006
0.008
0.01
0.012
0.014
0.016
0.018
H13 Base B U D5A-1 D 5A-2 D8H-1 Dynamic8H-2
Wei
ght o
f Sol
dere
d A
l on
Pin
Surf
ace(
g)
Nitro-carburizing improves soldering resistance of H13
The difference between coatings is small.
91

Figure 33: Appearance of H13 and Nitro-Carburized Pins after 30 Shots
Hard-H13
B
U
D 5A-1 D 5A-2
D 8H-2
D 8H-1
92

Figure 34: Appearance of H13 and Nitro-Carburized Pins after the Test(Soldered Al Dissolved in NaOH)
Hard-H13
B
U
D 5A-1
D 8H-1
50 Shots
210 Shots
210 Shots
185 Shots
195 Shots
93

Figure 35: Effect of Nitro-Carburizing on Washout
0.00
0.02
0.04
0.06
0.08
0.10
0.12
0.14
0 50 100 150 200 250
Shot Number
Wei
ght L
oss o
f Pin
(g)
H13-BaseB (thin)U (thick)D 5A-1 (thin)D8H-1 (thick)
Thick nitro-carburized layers are better for washout than thin layers
Thick
Thin
94

Figure 36: Impingement Surface of Thin Nitro-Carburized layer in “B” Pin (after 50 Shots - Soldered Al Dissolved in NaOH)
95

Figure 37: Impingement Surface of Thin Nitro-Carburized layer in “B” Pin (after 150 Shots-Soldered Al Dissolved in NaOH)
96

Figure 38: Impingement Surface of Thick Nitro-Carburized Layer in “U” Pin (after 150 Shots and Soldered Al Dissolved in NaOH)
Cracked Coating
97

0
5
10
15
20
25
30
B - Thin D8H -Medium
D5A - Thin H13 51 HRC H13 44-46HRC
Ave
rage
Max
Cra
ck L
engt
h (x
100 µ
m)
2"X2"X7", WC7
Figure 40: Average Max Crack Length of Nitrocarburized H13
98

Figure 41: Total Crack Area of Nitrocarburized H13
0
50
100
150
200
250
300
350
400
450
500
B - Thin D8H -Medium
D5A - Thin H13 51 HRC H13 44-46HRC
Tota
l Cra
ck A
rea
(x 1
06m
2 )
2"X2"X7", WC7
99

Table 6: Characteristics of PVD Coatings
Coating Coating Process Thickness*(µm)
Hardness**(Hv -kg/mm2)
OxidationTemperature
(F)**
CrN+W (I) PVD 3.5 2500±400 2,278
CrN (P) PVD 5.0 2500±400 2,278
(TiAl)N (B) PVD 2.0 2600±400 2,278-2,368
CrC (B) PVD 6.25 1850±200 2,278
* Measured** Literature
100

Figure 42: Cross- Section of PVD Coatings and Pin Substrates
CrN+W (TiAl)N
25µm 25µm
CrN CrC
25µm 25µm
101

CrN+W CrN
CrC(TiAl)N
Before
30 Shots
Before Before
Before
30 Shots 30 Shots
30 Shots
Figure 43: Appearance of PVD Coated Pins before Testing & after 30 Shots
102

30 Shots
0 Shot
60 Shots
90 Shots
120 Shots
150 Shots
180 Shots
210 Shots
Figure 44: Soldering Appearance of H13 Pin with CrN+W PVD Coating
103

Figure 45: Soldering Appearance of H13 Pin with CrN PVD Coating
30 Shots
0 Shot
60 Shots
90 Shots
120 Shots
150 Shots
210 Shots
104

0 Shots 120 Shots
90 Shots
60 Shots
30 Shots 150 Shots
180 Shots
210 Shots
Figure 46: Soldering Appearance of H13 Pin with (TiAl)N PVD Coating
105
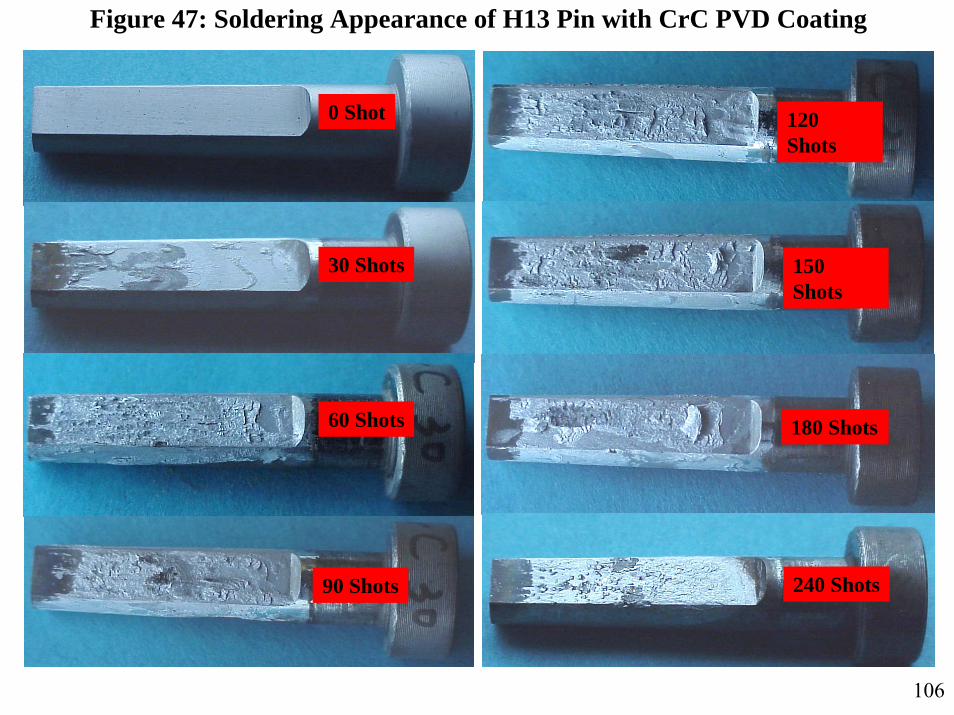
0 Shot 120 Shots
90 Shots
60 Shots
30 Shots 150 Shots
180 Shots
240 Shots
Figure 47: Soldering Appearance of H13 Pin with CrC PVD Coating
106

Figure 48: Effect of PVD Coating on Soldering
0.00
20.00
40.00
60.00
80.00
100.00
120.00
0 5 10 15 20 25 30
Shot Number
Perc
enta
ge o
f Pin
Sur
face
with
Sol
deri
ng(%
)
H13-BaseCrN+WCrN(TiAl)NCrC
107

Figure 49: Effect of PVD Coating Materials on Soldering (after 30 shots)
0.000
0.002
0.004
0.006
0.008
0.010
0.012
0.014
0.016
0.018
H13-Base CrN+W CrN (TiAl)N CrC
Wei
ght(
g)
1.Weight of Soldered Al on Pin Surface Is Determined by Weighting Pins after 30 Shots with and without the Soldered Aluminum 2.Soldered Aluminum Cleaned with Sodium Hydroxide
108

Figure 50: Effect of PVD Coatings on Washout Resistance
0.00
0.02
0.04
0.06
0.08
0.10
0.12
0.14
0 30 60 90 120 150 180 210 240Shot Number
Wei
ght L
oss o
f Pin
(g)
H13-BaseCrN+W PVD CoatingCrN PVD Coating(TiAl)N PVD CoatingCrC PVD Coating
109

Figure 51: Washout Comparison of PVD Coatings and Nitrocarburizing
0.00
0.02
0.04
0.06
0.08
0.10
0.12
0.14
0 30 60 90 120 150 180 210 240
Shot Number
Wei
ght L
oss o
f Pin
(g)
H13-Base(TiAl)N PVD CoatingCrC PVD CoatingNitrocarburizing D5A-ThinNitrocarburizing D8H-Thick
110

Figure 52: Degradation of H13 Pin with CrN+W PVD Coating
0 Shot
30 Shots
60 Shots
90 Shots
120 Shots
180 Shots
150 Shots
210 Shots
111

0 Shot
30 Shots
60 Shots
90 Shots
120 Shots
180 Shots
150 Shots
210 Shots
Figure 53: Degradation of H13 Pin with CrN+W PVD Coating (magnified)
112

Figure 54: Degradation of H13 Pin with CrN PVD Coating
0 Shot
30 Shots
60 Shots
90 Shots
120 Shots
210 Shots
113

Figure 55: Degradation of H13 Pin with CrN PVD Coating (magnified)
90 Shots
120 Shots
0 Shot
30 Shots
60 Shots210 Shots
114

0 Shots 120 Shots
90 Shots
60 Shots
30 Shots 150 Shots
Figure 56: Degradation of H13 Pin with (TiAl)N PVD Coating
180 Shots
210 Shots
115

0 Shot 120 Shots
90 Shots
60 Shots
30 Shots 150 Shots
180 Shots
Figure 57: Degradation of H13 Pin with (TiAl)N PVD Coating (magnified)
210 Shots
116

0 Shot 120 Shots
90 Shots
60 Shots
30 Shots 150 Shots
180 Shots
Figure 58: Degradation of H13 Pin with CrC PVD Coating
240 Shots
117

0 Shot 120 Shots
90 Shots
60 Shots
30 Shots 150 Shots
180 Shots
240 Shots
Figure 59: Degradation of H13 Pin with CrC PVD Coating (magnified)
118

Fig. 60: Degradation of H13 Pin with CrN+W PVD Coating (Pin Holes and Worn off)
Before Before
11930 Shots 30 Shots

Figure 61: Degradation of H13 Pin with CrN+W PVD Coating after 210 Shots(Pin Holes and Worn off)
210 Shots 210 Shots
120
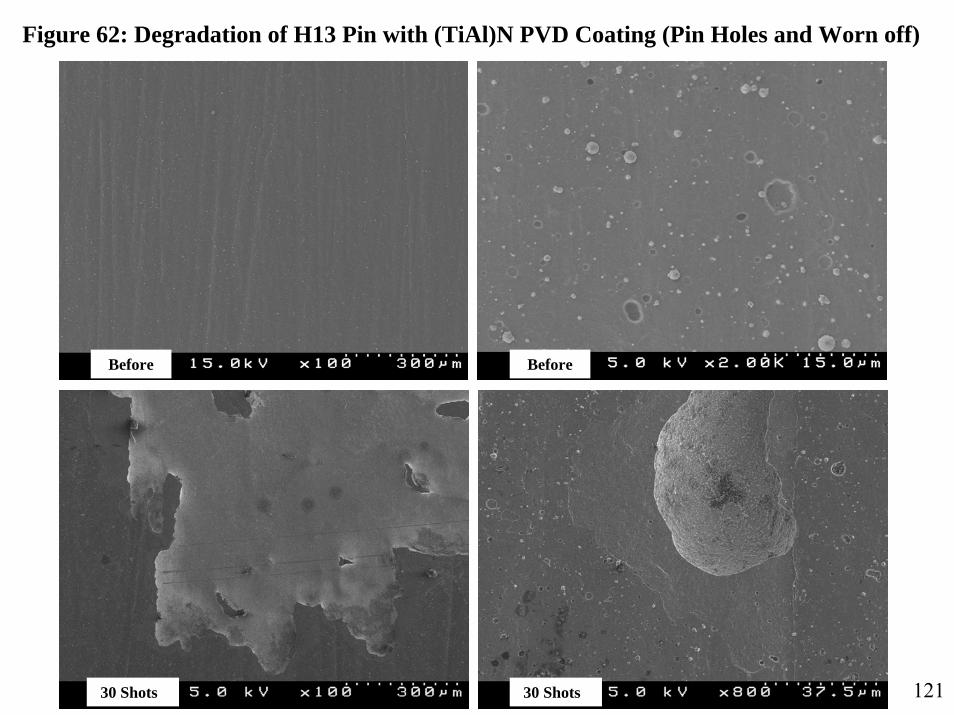
Figure 62: Degradation of H13 Pin with (TiAl)N PVD Coating (Pin Holes and Worn off)
Before Before
12130 Shots 30 Shots
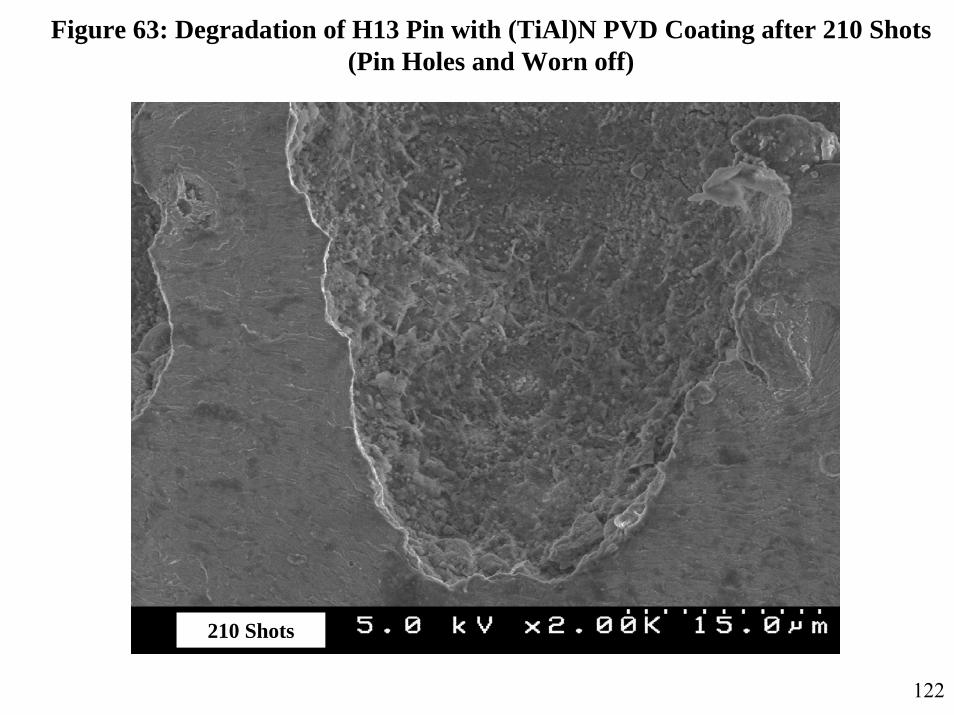
Figure 63: Degradation of H13 Pin with (TiAl)N PVD Coating after 210 Shots(Pin Holes and Worn off)
210 Shots
122

Figure 64: Degradation of H13 Pin with CrC PVD Coating(Only Pin Holes)
Before Before
12330 Shots 30 Shots

Figure 65: Degradation of H13 Pin with CrC PVD Coating after 240 Shots(Only Pin Holes)
210 Shots 210 Shots
124

Figure 66: Cross Section View & Failure Mode of CrN+W PVD Coated H13 Pin after 120 Shots
H13 Base
Soldered Aluminum Alloy
CrN+W PVD Coating
Mounting Material
Molten Aluminum Jet Impinging Surface
125

Figure 67: Cross Section View & Failure Mode of CrN+W PVD Coated H13 Pin after 120 Shots
H13 Base
Soldered Aluminum Alloy
CrN+W PVD Coating
Mounting Material
126
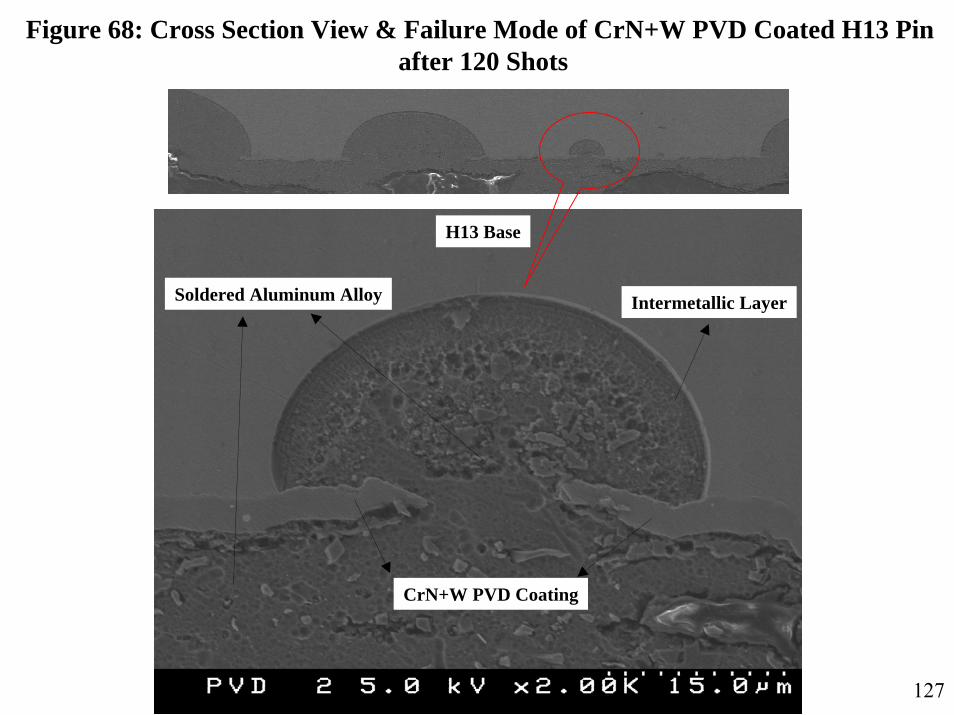
Figure 68: Cross Section View & Failure Mode of CrN+W PVD Coated H13 Pin after 120 Shots
H13 Base
Soldered Aluminum Alloy
CrN+W PVD Coating
Intermetallic Layer
127