evaluation of iaq perception of shopping malls in hong … · 44-cxp-c151 evaluation of iaq...
TRANSCRIPT

44-CXP-C151
Evaluation of IAQ Perception of Shopping Malls in Hong Kong
An Interactive Qualifying Project
By:
Fuchen Chen
Zachary Culp
Benjamin Root
Date Submitted: March 6, 2015

ii
Evaluation of IAQ Perception in Shopping Malls of Hong Kong
An Interactive Qualifying Project Report
Submitted to Worcester Polytechnic Institute
in partial fulfillment of the Bachelor of Science degree
Submitted by:
Fuchen Chen
Zachary Culp
Benjamin Root
In Collaboration with
Business Environment Council Limited
Report Submitted to:
Liaison: Dr. Veronica Chan, BEC
Advisor: Professor Creighton Peet, WPI
Advisor: Professor Stephan Sturm, WPI
Date Submitted: March 6, 2015
This report represents work of WPI undergraduate students submitted to the faculty as evidence of a
degree requirement. WPI routinely publishes these reports on its web site without editorial or peer
review. For more information about the projects program at WPI, see
http://www.wpi.edu/Academics/Projects.

iii
Abstract
This study, sponsored by the Business Environment Council Limited, examined the
public’s perceptions of indoor air quality (IAQ) in shopping malls in Hong Kong. By surveying
shoppers at ten malls, we found IAQ certifications and mall locations within Hong Kong do not
correlate when it comes to perceptions of IAQ. We hypothesized that population density and
configuration of the mall may be the issue. Also we proposed an IAQ management plan that
would educate the shoppers and help mall managers.

iv
Acknowledgements
Our heartfelt thanks go out to the Business Environment Council Limited for being our
sponsor. We would like to give a special thanks to Dr. Veronica Chan. She was a fantastic liaison,
providing us lunch interviews, taking the time to answer our various questions, and always being
understanding when we had difficulties. This project would have been significantly harder to
complete without her help. Agnes Li, the Chief Executive Officer of Business Environment Council
Limited, was also a great help in her feedback and advice.
We also would like to give a big thanks to Professor Peet and Professor Sturm, our two WPI
advisors. They were very understanding of our troubles and always gave us good advice during
our meetings. Their feedback and support were a huge help to our project.
Furthermore, we thank all the malls and shoppers that participated in our project. Your
perceptions and opinions did not go unnoticed.
Lastly, we would like to thank WPI and the IGSD office for giving us this wonderful
opportunity. Living and conducting this project in Hong Kong is a memory we will keep for the
rest of our lives.

v
Authorship
Title Page: Zachary Culp
Abstract: Benjamin Root
Acknowledgements: Benjamin Root
Authorship Page: Zachary Culp
Table of Contents: Zachary Culp
List of Tables: Fuchen Chen
List of Figures: Fuchen Chen
Executive Summary: Benjamin Root
Introduction: Benjamin Root, Fuchen Chen
Background: Zachary Culp, Fuchen Chen
Methodology:
1. Discovering Public Perceptions of IAQ in Hong Kong: Benjamin Root
2. Develop IAQ Management Plan for Hong Kong Malls: Fuchen Chen
3. Determine Feasibility of Plans: Zachary Culp
Results and Discussion / Analysis:
1. Perceptions of IAQ in Hong Kong Malls: Zachary Culp
2. Spending: Zachary Culp
3. IAQ Certification Scheme Knowledge: Zachary Culp
4. Data Comparison: Zachary Culp
5. Management Plan: Fuchen Chen, Benjamin Root
Conclusions and Recommendations: Fuchen Chen, Benjamin Root

vi
References: Zachary Culp, Fuchen Chen, Benjamin Root
Appendix A: Fuchen Chen
Appendix B: Zachary Culp, Fuchen Chen, Benjamin Root
Appendix C: Zachary Culp, Fuchen Chen
Appendix D: Zachary Culp, Fuchen Chen, Benjamin Root
Appendix E: Zachary Culp
Appendix F: Fuchen Chen
Appendix G: Fuchen Chen
Appendix H: Zachary Culp
*All group members edited all sections for improvements

vii
Table of Contents
Title Page ........................................................................................................................................................ i
Abstract ........................................................................................................................................................ iii
Acknowledgements ...................................................................................................................................... iv
Authorship .................................................................................................................................................... v
Table of Contents ........................................................................................................................................ vii
Tables of Tables............................................................................................................................................. x
Table of Figures ........................................................................................................................................... xii
Executive Summary .....................................................................................................................................xiii
1. Introduction .......................................................................................................................................... 1
2. Background ........................................................................................................................................... 3
2.1. Indoor Air Quality .......................................................................................................................... 3
2.1.1. Key factors that affect Indoor Air Quality .............................................................................. 4
2.1.2. Measurement of Indoor Air Quality ....................................................................................... 5
2.1.3. Technologies used to control and maintain good Indoor Air Quality .................................... 6
2.2. Building Management ................................................................................................................... 7
2.2.1. Heating, ventilating, and air conditioning (HVAC) System ..................................................... 7
2.2.2. Cost and Efficiency of HVAC Systems ..................................................................................... 8
2.2.3. Regulations and standards ..................................................................................................... 9
2.2.4. Relationships between Outdoor and Indoor Air Quality ..................................................... 10
2.3. Massachusetts Information ......................................................................................................... 11
2.3.1. Climate of Massachusetts .................................................................................................... 11
2.3.2. Standards and Regulations in Massachusetts ...................................................................... 12
2.4. Hong Kong Information ............................................................................................................... 14
2.4.1. Climate of Hong Kong........................................................................................................... 15
2.4.2. Standards and Regulations in Hong Kong ............................................................................ 15

viii
2.4.3. Past Research ....................................................................................................................... 16
2.5. Mall Industry Persons’ Views on Building Management of Indoor Air Quality ........................... 17
2.6. Summary ...................................................................................................................................... 21
3. Methodology ....................................................................................................................................... 22
3.1. Determining Public Perceptions of IAQ in Hong Kong ................................................................. 22
3.1.1. Selecting Shopping Malls ..................................................................................................... 22
3.1.2. Survey ................................................................................................................................... 23
3.1.3. Interviews ............................................................................................................................. 24
3.1.4. Comparing Data of Massachusetts’ Survey and Last Year’s Project .................................... 25
3.2. Develop Indoor Air Quality management plan for Hong Kong malls .......................................... 25
3.2.1. Analysis of survey questionnaires and interviews ............................................................... 25
3.2.2. Research on management plan ........................................................................................... 26
3.3. Determine Feasibility of Plans ..................................................................................................... 27
3.3.1. Cost Analysis......................................................................................................................... 27
3.3.2. Social Analysis ...................................................................................................................... 27
3.4. Summary ...................................................................................................................................... 28
4. Results and Analysis ............................................................................................................................ 29
4.1. Perceptions of Indoor Air Quality in Hong Kong Malls ................................................................ 29
4.2. Spending ...................................................................................................................................... 33
4.3. IAQ Certification Scheme Knowledge .......................................................................................... 34
4.4. Data Comparison ......................................................................................................................... 36
4.4.1. Comparison to Last Year’s Results ....................................................................................... 36
4.4.2. Comparison to Eastern Massachusetts Malls ...................................................................... 38
4.5. Management Plan ........................................................................................................................ 40
4.5.1. Online Complaint Response System .................................................................................... 41
4.5.2. Digital Display ....................................................................................................................... 42

ix
4.5.3. Cost Feasibility of Management Plan ................................................................................... 43
4.6. Summary ...................................................................................................................................... 44
5. Conclusions and Recommendations ................................................................................................... 46
5.1. Conclusions .................................................................................................................................. 46
5.2. Recommendations ....................................................................................................................... 46
5.2.1. Mall Recommendations ....................................................................................................... 46
5.2.2. Recommendations for Business Environmental Council Limited ........................................ 48
References .................................................................................................................................................. 50
Appendix A: Business Environment Council Limited .................................................................................. 56
Appendix B: Interview Components ........................................................................................................... 58
Appendix C: Questionnaires........................................................................................................................ 63
Appendix D: Survey Data ............................................................................................................................ 67
Appendix E: Demographics ......................................................................................................................... 79
Appendix F: Satisfaction/Complaint Response Survey ............................................................................... 81
Appendix G: Digital Display ......................................................................................................................... 82
Appendix H: Table 2-4 Legend .................................................................................................................... 83

x
Tables of Tables
Table 2-1 Examples of VOCs and Sources ..................................................................................................... 6
Table 2-2 Required Mechanical Ventilation Air in Frequently Encountered Building Spaces/Areas ......... 13
Table 2-3 Potential Sources of Indoor Air Pollutants .................................................................................. 14
Table 2-4 IAQ Objectives for Offices & Public Places .................................................................................. 17
Table 3-1 Certification Class and Locations of the Shopping Malls ............................................................ 23
Table 4-1 Averages for Question 1-5 by Mall ............................................................................................. 29
Table 4-2 Hypothesis Test for Questions 6-7 by Mall ................................................................................. 30
Table 4-3 Knowledge of Certification Scheme of the Mall Visited ............................................................. 36
Table 4-4 Analysis of the Average Difference of Air Quality by Region ...................................................... 39
Table 4-5 Parts Cost of Sensors for Measurement of IAQ .......................................................................... 44
Table D-1 Massachusetts Mall 1 Data ......................................................................................................... 67
Table D-2 Massachusetts Mall 2 Data ......................................................................................................... 68
Table D-3 Hong Kong Mall 1 Data ............................................................................................................... 69
Table D-4 Hong Kong Mall 2 Data ............................................................................................................... 70
Table D-5 Hong Kong Mall 3 Data ............................................................................................................... 71
Table D-6 Hong Kong Mall 4 Data ............................................................................................................... 72
Table D-7 Hong Kong Mall 5 Data ............................................................................................................... 73
Table D-8 Hong Kong Mall 6 Data ............................................................................................................... 74
Table D-9 Hong Kong Mall 7 Data ............................................................................................................... 75

xi
Table D-10 Hong Kong Mall 8 Data ............................................................................................................. 76
Table D-11 Hong Kong Mall 9 Data ............................................................................................................. 77
Table D-12 Hong Kong Mall 10 Data ........................................................................................................... 78

xii
Table of Figures
Figure 4-1 Mall Satisfaction of Survey Respondents .................................................................................. 31
Figure 4-2 Overall Comparison with Respondent’s Home Country Malls .................................................. 32
Figure 4-3 Tourist Comparison to Home Country ....................................................................................... 32
Figure 4-4 HongKonger Comparison to Home Area ................................................................................... 33
Figure 4-5 Air Quality Effect on Spending ................................................................................................... 34
Figure 4-6 Overall Knowledge of the Certification Scheme ........................................................................ 35
Figure 4-7 HongKongers Knowledge of the Certification Scheme .............................................................. 35
Figure 4-8 Correct Certification Answer Comparison ................................................................................. 38
Figure 4-9 Air Quality Affects Spending Comparison .................................................................................. 38
Figure 4-10 Comparison of Digital Display Results ..................................................................................... 39
Figure 4-11 Comparison of Complaint Response System ........................................................................... 40
Figure E-1 Gender distribution of survey respondents ............................................................................... 79
Figure E-2 Age distribution of survey respondents..................................................................................... 80
Figure E-3 Place of origin of survey respondents ....................................................................................... 80
Figure F-1 Satisfaction/Complaint Response Survey Example .................................................................... 81
Figure G-1 Digital Display Example ............................................................................................................. 82

xiii
Executive Summary
Over the last couple of decades, people all around the world have been spending more time
inside buildings. As a result, the air quality inside buildings has increased in importance.
Determining how the general public perceives indoor air quality (IAQ) in shopping malls can
provide valuable information on how the private mall sector should improve on air quality
standards and their management.
IAQ has been a matter of increasing interest in the scientific community. There has been
quite a bit of research on the harmful health effects of poor IAQ, as well as many experiments
that have studied how to properly measure air quality. However, there has not been a lot of
research on the public’s perceptions of IAQ. How people may judge air quality inside buildings,
specifically shopping malls, can depend on a variety of factors, including the mall’s size, social
status, popularity, and even the number of plants growing in the building.
The goal of this project was to assess the public’s perceptions of IAQ in shopping malls, in
Massachusetts and more importantly in Hong Kong. To accomplish this goal, we fulfilled three
objectives. First, we discerned possible causes of different perceptions. We compared
Massachusetts perceptions and Hong Kong perceptions as well as this year’s project to last year’s
project to ascertain any patterns and trends. Second, we developed a plan for improving IAQ
management in Hong Kong malls. This management plan was based on our analysis of the results.
Third, we determined the feasibility of the management plan by consulting with experts as well
as our sponsor, the Business Environment Council Limited.
These three objectives were completed by conducting surveys, and interviewing relevant
IAQ experts and mall managers. One significant conclusion was that neither the mall’s location

xiv
nor its official certification status seemed to influence shoppers’ perceptions of IAQ. Another
significant result was that a significant portion of the shopping population felt their spending was
influenced by IAQ. We also found there was a drop in knowledge among shoppers about the IAQ
Certification Scheme between 2014 and 2015. This lack of awareness may affect the perceptions
of shoppers, especially in malls with poor perceptions but good certification levels. Another
important result was that the majority of the shoppers would utilize a complaint response survey
and a digital display with IAQ information, if they were available. Based on these results, we
developed a management plan that included a complaint response system and an informational
digital display. The recommended management plan also included an annual maintenance of the
ventilation systems.

1
1. Introduction
Over the past several years, IAQ has become a matter of increasing interest in the scientific
community (Jones, 1999). Since some people, especially in urban areas, are spending more time
indoors than they are outdoors, the quality of the air they are breathing has become a significant
concern (Robinson & Nelson, 1995). A recent study found that a variety of symptoms and illnesses
are caused by indoor air pollution (Seltzer, 1995). IAQ and its effect on the public are still being
researched.
In Hong Kong shopping malls especially, IAQ has come under investigation. Hong Kong,
known as a ‘Shopper’s Paradise’, attracts millions of tourists to its shopping malls where its local
residents also spend lots of time (Li, Lee, & Chan, 2001). As a result, the air quality of the malls in
Hong Kong has an important impact on people’s daily life and health. However, when compared
to the outdoor air quality of Hong Kong, air quality inside buildings has not received much
attention. The public’s perceptions of the air quality in malls are unclear. If a plan to manage the
IAQ in Hong Kong malls were developed and successfully implemented, shoppers could have a
more enjoyable experience, and malls would reap the benefits; however, such a plan has yet to
be created.
A 2014 study in Hong Kong discovered customers would be willing to spend more money in
a mall if the IAQ were improved (Anderson et. al, 2014). The study also presented data that
showed the quality of air inside malls in Hong Kong and how it compared to the standards given
by the Hong Kong government’s IAQ guidelines. There has been other research done on indoor
air pollution (Saravanan, 2004; Jones, 1999). Indoor air can have multiple physical effects on
humans as measured by researchers, including various symptoms and illnesses. Some research

2
has also been done on people’s perceptions of IAQ (Brody, Peck, & Highfield, 2004). The study
showed that the way people judge air quality is not correlated with the measurements done by
air monitoring stations, but rather how the elements of the immediate environment are
perceived.
Despite the efforts devoted to the measurement of IAQ, there is insufficient information and
analysis on the relationship between actual IAQ and the perceived IAQ, specifically in Hong
Kong’s malls. Not only the scientific data, but also the public’s perceptions of the air quality
should be fully considered when management plans and policies for shopping malls are
formulated. The Business Environment Council Limited is one of the approved IAQ certificate
issuing bodies in Hong Kong has been very interested to help its members address the problem
of IAQ.
The goal of this project was to determine the public’s perceptions of shopping malls’ IAQ in
both Eastern Massachusetts and in Hong Kong and from this recommend measures to improve
how IAQ can be better managed. To achieve our goal we completed the following objectives. We
determined people’s perceptions of IAQ in malls by using surveys in Hong Kong and Eastern
Massachusetts to determine the opinions of shoppers about the malls’ IAQ. . We then compared
this data to parallel data collected last year by other researchers. From this analysis we developed
an IAQ management plan with suggestions on how to improve IAQ perceptions. Lastly, we
determined the plan’s feasibility for success. After implementing a successful management plan,
shopping malls should be able to adjust the IAQ to better manage the public’s perceptions,
maintain customers’ and employees’ health, attract more visitors, and bring in a larger profit for
malls.

3
2. Background
Controlling IAQ perceptions requires intricate knowledge about the environment,
technology, regional standards and managing people’s perceptions relating to this problem. In
this chapter, we will examine information involving IAQ. First of all, since public perceptions of
IAQ are closely related to the actual IAQ, we summarize the factors that affect air quality inside
buildings, how measurements are made, and what technologies are used to control air quality.
We also discuss research on IAQ in Hong Kong that has already been completed. We discuss HVAC
management systems and their efficiency as well as their influence on indoor and outdoor air
quality. Since we collected information on public perceptions about air inside malls in
Massachusetts for comparison with people’s perceptions in Hong Kong malls, we present basic
information about the environmental and regulatory context of Massachusetts. As for Hong Kong
we present its weather, regulations, past research and surveys done in Hong Kong malls. Lastly,
we will present the interviews we conducted for the project.
2.1. Indoor Air Quality
IAQ can have significant influences on people’s health (Axe, 2014). In the short term, indoor
air pollution can cause irritated or dry mucous membranes in the eyes, nose, respiratory tract
and throat. It may also cause dizziness, fatigue, fever, forgetfulness, headaches, irritability,
lethargy, and nausea. Other health effects can arise with long-term exposure and are harder to
link back to IAQ pollutants. Multiple chemical sensitivity or MCS is on the rise. Symptoms of MCS
include burning eyes, breathlessness, cough, and chronic runny nose, among others. According
to one study US residents spend 88% of their day inside buildings (Robinson & Nelson, 1995).
However, most people do not notice the air quality inside the building unless the IAQ condition

4
exceeds their tolerances. To improve the air quality and make the public aware of problems with
IAQ, many researchers have focused on IAQ and its influences on people’s health over the last
few decades both in Hong Kong and all over the world (Li, Lee, & Chan, 2001; Lee, Chan, & Chiu,
1999; Saravanan, 2004; Smith, 2002; Wyon, 2004).
2.1.1. Key factors that affect Indoor Air Quality
Based on the studies researchers have done over the last few decades, IAQ depends on many
key factors such as temperature, humidity, climate, airborne particles, and gaseous pollutants
(U.S. Consumer Product Safety Commission, 2014).
First of all, the public can easily detect temperature and humidity conditions; those factors
are also closely related to the outside climate (EEOP, 2014). The normal levels of relative humidity
and temperature for indoor air will vary widely from region (climate) to region (climate).
Individuals can also vary widely as to what they find acceptable. According to The American
Society of Heating, Refrigerating, and Air Conditioning Engineers (ASHRAE), their guidelines
recommend temperatures of 68 F to 74 F in the winter and 72 F to 80 F in the summer. The
ASHRAE guidelines recommend a relative humidity (RH) of 30 to 60 percent.
Secondly, air particles and gaseous pollutants are factors that have significant influences on
IAQ; those factors are not easily noticed until conditions are so severe that people are affected
immediately (Rao, 1996). The sources of such indoor air pollution include combustion sources
such as oil, gas, kerosene, coal, wood, and tobacco products; building materials and furnishings
as diverse as deteriorated, asbestos-containing insulation, wet or damp carpets, and cabinetry or
furniture made of certain pressed wood products; products for household cleaning and

5
maintenance, personal care, or hobbies; central heating and cooling systems and humidification
devices; and outdoor sources such as radon, pesticides, and outdoor air pollution.
Finally, although disease pollutants are invisible to the public, they are one of the sources of
indoor air pollution (Smith, 2002). Respiratory infections are the most common disease
pollutants of indoor air. Limiting exposure to pollution is one of the best solutions to reduce or
eliminate the chance of contracting respiratory infections. A method to reduce respiratory
infections is to install a high quality air filter or air purifier system to trap the allergens and
pollutants before they get inside the building as well as the ones that are already in the building
due to human illnesses among building occupants.
2.1.2. Measurement of Indoor Air Quality
In order to maintain high-level IAQ, it should be measured regularly (AppliedSensor, 2009).
Measurement is a scientific and efficient way to keep precise control and maintain a high level of
IAQ. Measurements can be divided into two major parts: measures of temperature and humidity
and measures of volatile organic compounds (VOCs). One method is to control the temperature
and humidity to obtain a comfortable (acceptable) indoor air. The climate control industry
defines the quality of indoor air as a measure based on temperature, humidity and carbon dioxide
(CO2). For decades, the primary method for improving IAQ has been to dilute the amount of CO2
and other contaminants through heating, ventilation and air conditioning systems (HVAC) or air
filtration systems. The other method is to measure the volatile organic compounds (VOCs) in
indoor air. As the air quality monitoring technology has become more sophisticated, it is now
possible to detect the presence of VOCs such as acetone, heptane and many other metabolic
products in human breath in addition to formaldehyde, cooking odors, human bio-effluents,
6
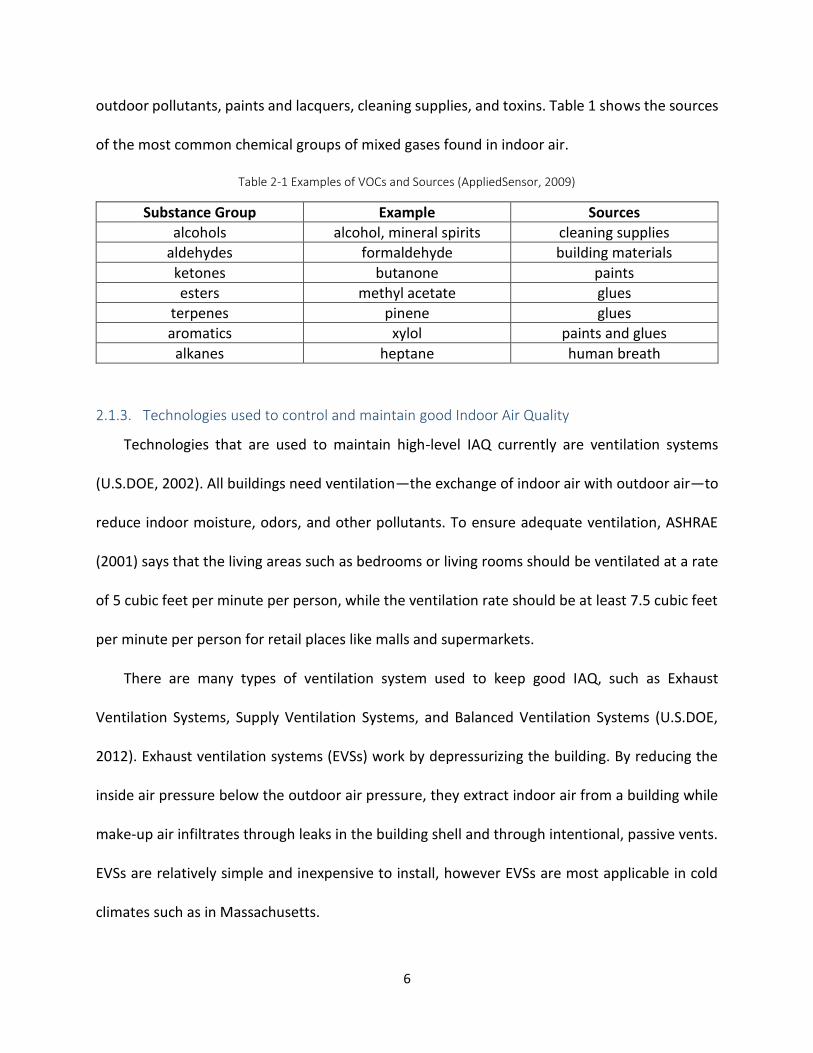
outdoor pollutants, paints and lacquers, cleaning supplies, and toxins. Table 1 shows the sources
of the most common chemical groups of mixed gases found in indoor air.
Table 2-1 Examples of VOCs and Sources (AppliedSensor, 2009)
Substance Group Example Sources
alcohols alcohol, mineral spirits cleaning supplies
aldehydes formaldehyde building materials
ketones butanone paints
esters methyl acetate glues
terpenes pinene glues
aromatics xylol paints and glues
alkanes heptane human breath
2.1.3. Technologies used to control and maintain good Indoor Air Quality
Technologies that are used to maintain high-level IAQ currently are ventilation systems
(U.S.DOE, 2002). All buildings need ventilation—the exchange of indoor air with outdoor air—to
reduce indoor moisture, odors, and other pollutants. To ensure adequate ventilation, ASHRAE
(2001) says that the living areas such as bedrooms or living rooms should be ventilated at a rate
of 5 cubic feet per minute per person, while the ventilation rate should be at least 7.5 cubic feet
per minute per person for retail places like malls and supermarkets.
There are many types of ventilation system used to keep good IAQ, such as Exhaust
Ventilation Systems, Supply Ventilation Systems, and Balanced Ventilation Systems (U.S.DOE,
2012). Exhaust ventilation systems (EVSs) work by depressurizing the building. By reducing the
inside air pressure below the outdoor air pressure, they extract indoor air from a building while
make-up air infiltrates through leaks in the building shell and through intentional, passive vents.
EVSs are relatively simple and inexpensive to install, however EVSs are most applicable in cold
climates such as in Massachusetts.

7
Supply ventilation systems (SVSs) work by pressurizing the building. They use a fan to force
outside air into the building while air leaks out of the building through holes in the shell, bath and
range fan ducts, and intentional vents (if any exist). SVSs are also simple and inexpensive to
install, and SVSs are most applicable in hot or mixed climates such as Hong Kong.
Balanced ventilation systems (BVSs) neither pressurize nor depressurize a building if properly
designed and installed. Rather, they introduce and exhaust approximately equal quantities of
fresh outside air and polluted inside air, respectively. BVSs are appropriate for all climates and so
could be used in both Massachusetts and Hong Kong.
2.2. Building Management
Since people spend plenty of time in buildings such as houses, offices, malls, and factories,
the indoor environment affects people’s everyday lives. Without proper management of the
indoor environment, people will feel uncomfortable, get sick, and be less productive (Wyon,
2004). In order to control the indoor thermal and air quality at a comfortable level, management
systems are designed and installed in buildings to not only monitor but also control the indoor
environment.
2.2.1. Heating, ventilating, and air conditioning (HVAC) System
An HVAC system consists of heating, ventilating, and air conditioning, and it is designed to
satisfy comfort, health, and safety needs of building occupants and the environmental needs of
indoor equipment or processes (Angel, 2012).
Heating of the building can be divided into three main subsystems: source of thermal energy,
thermal distribution, and end users (Rezaie & Rosen, 2012). The thermal energy production plant
generates heat in the form of steam or hot water by combustion of fuels, geothermal resources,

8
solar heaters, and heat pumps. Such thermal energy is transferred, to consumers through a heat
carrying medium, such as air or water, in supply pipes or ducts. After the delivery, the medium
returns to the source through return pipes or ducts to absorb energy again. The size of the
building is important. Heating systems are designed for different load situations such as, single
family houses, commercial buildings, industrial buildings, and so on.
Ventilation maintains a proper composition of air, controls odors, and removes airborne
contaminants inside buildings (Graham, 2012). It can be accomplished passively through natural
ventilation or actively through mechanical distribution systems. Natural ventilation can be
achieved through operable windows, louvers, or grills. These technologies consume little energy
but in warm and humid climates, they are not enough to maintain the thermal comfort.
Mechanical ventilation dilutes and replaces indoor air with outdoor air by using powerful fans.
Such a system is able to control the IAQ better but requires much more energy.
Air conditioning refers to the control of air temperature as well as humidity (Graham, 2012).
Temperature is changed by transferring heat between spaces or expelling the heat to the outside.
Air can be dehumidified by condensing its moisture on a cold surface or removing its moisture
through absorption. In dry climates, the air needs to be humidified for comfort by evaporation
and other means.
2.2.2. Cost and Efficiency of HVAC Systems
In order to maintain a desired indoor environment, a large amount of energy is required for
operating HVAC systems. They are the largest energy end use both in the residential and non-
residential sector (Pérez-Lombard, Ortiz, & Pout, 2008). In developed countries, energy

9
consumption by HVAC systems accounts for half the energy use in buildings and one fifth of the
total national energy use.
Beside the huge energy consumption, there is also a lot of unnecessary usage of HVAC
systems. Almost every building wastes over 10% of the energy it consumes because of inefficient
operation of the HVAC system (Barba, 2009). Many improvements can be implemented to
achieve a more cost-efficient system. Finding a balance between comfort and efficiency of the
HVAC system is essential to worker productivity, occupant satisfaction, and individuals’ health.
2.2.3. Regulations and standards
To improve efficiency and save energy, standards and regulations have been developed for
public buildings and their HVAC systems (Hong, 2009). For example, The Design Standard for
Energy Efficiency of Public Buildings GB50189-2005 (The China Standard) is a national standard
in China first enforced on July 1, 2005, and ASHRAE 90.1-2004 Energy Standard for Buildings
except Low-rise Residential Buildings (The US Standard) is a similar standard in the US.
The China Standard aims to reduce lighting and HVAC energy use in public buildings by 50%
compared with those constructed in the early 1980s (Hong, 2009). It defines minimum efficiency
requirements of chillers, boilers, and package DX (Direct Expansion) units. It also provides energy
efficiency guidelines on determining HVAC system types, thermal zoning, cooling and heating
sources, fan and pump sizing, insulation of pipes, and air ducts, and HVAC system monitoring and
controls.
The purpose of The US Standard is to provide minimum requirements for the energy efficient
design of buildings except low-rise residential buildings (Hong, 2009). It tries to be strictly neutral

10
in the HVAC system type. It has efficiency requirements for boilers, chillers, packaged DX air-
conditioners, and HVAC fan powers.
2.2.4. Relationships between Outdoor and Indoor Air Quality
Outdoor or ambient air quality is affected by both natural and man-made sources
(Enviropedia, 2014). Natural outdoor air pollution includes oxides of sulfur and nitrogen from
volcanoes, oceans, biological decay, lightning strikes, and forest fires, Volatile Organic
Compounds (VOCs) from plants, grasses, and trees, and particulate matter from dust storms.
Most of the man-made pollutants are coming from the burning of fossil fuels. Other sources are
from chemical manufacture and waste incineration. It is also possible that indoor air pollutants
after being vented to the outdoors are strong enough to affect the air quality outside (Smith,
2002).
There are two major factors that determine the quality of indoor air, the quality and amount
of outdoor air getting inside and emissions from inside, which include materials used in building
construction and the use of household chemicals (Saravanan, 2004). Ambient air can have a
significant impact on the indoor environment (Yocom, Clink, & Cote, 1971). Suspended
particulate matter and carbon monoxide, which are key factors in air quality, can easily penetrate
private homes and buildings.
If the air is polluted outside the building, ventilation to dilute contaminants as well as
filtration and source control are the primary methods to maintain the cleanliness of indoor air
(Li, Wall, & Platt, 2010). The influence of outdoor air on IAQ depends on the air exchange rate.
An inadequate air exchange rate causes poor IAQ, and a higher exchange rate results in energy
wastage. In fact, indoor air pollution can be worse than outdoor. According to WHO (2014), 3.7

11
million deaths were attributable to outdoor air pollution, and 4.3 million deaths were attributable
to indoor air pollution in 2012. It is important to think about the amount of time we spend indoors
and how IAQ affects us.
2.3. Massachusetts Information
In order to compare the IAQ of Hong Kong malls to those of malls in Massachusetts, we will
describe the setting of Massachusetts. There are differences between the two areas that affect
the IAQ and management of IAQ. In this section we will discuss the climate of Massachusetts and
the government standards and regulations in Massachusetts.
2.3.1. Climate of Massachusetts
For the climate of Massachusetts, we will focus on Worcester and its surrounding area as
this is where we conducted our study. Worcester is located in central Massachusetts, and the
climate is similar to most of New England. Massachusetts has a climate pattern described at a
“humid continental climate” (Explore Massachusetts, 2012). This humid continental climate
includes four seasons, summer, autumn, winter, and spring. The summers, that span the months
of July, August and, September, are warm averaging about 25 degrees Celsius (77 degrees
Fahrenheit) for Worcester in particular. Summer weather brings mostly sunny days; however,
they can be quite humid, and some thunderstorms may occur. In the summer all the foliage is
green and in full bloom. Following summer, autumn spans October, November, and December.
The temperature cools down during this time and the foliage starts to go through a color change.
By the end of this season most trees are clear of their leaves. The first snowfall may happen
during these months. The winters, which span the months of January, February, and March, are
dry and cold averaging about -2 degrees Celsius (28 degrees Fahrenheit) for Worcester in

12
particular. At this point most of the plants have become dormant for the winter, and the heavier
snowfall occurs. Worcester usually experiences the worst of the snowstorms for the New England
area. In the winter of 2012-2013, Worcester was the snowiest city in all of the United States
(Filipov, D., & Dezenski, L., 2012). Lastly, the spring season spans the months of April, May and
June. During these months, the temperature starts to warm up and the foliage starts to bloom.
Especially during the latter part of spring, rainfall is prevalent. The “four season” climate is quite
a unique experience and presents an ever changing setting for the Worcester area. Climate is
relevant for our project because weather effects how people perceive air quality. The
temperature is quite noticeable, but also during winter months people spend a lot more time
indoors, causing the spread of germs and other pollutants much more easily.
2.3.2. Standards and Regulations in Massachusetts
In Massachusetts, the government assesses buildings that are public such as courthouses and
town halls as well as buildings that the public may enter (Commonwealth of Massachusetts,
2001). This is done for the benefit of the health of the people of Massachusetts. Massachusetts
classifies IAQ problems into three groups:
1. Heating, ventilating, and air-conditioning (HVAC) operations;
2. Indoor microbial growth;
3. Indoor/outdoor sources of respiratory irritants/vapors/gases/particulates.
Addressing the first category, Massachusetts requires a ventilation rate for a range of
different types of buildings and rooms. (See Table 2-2)

13
Table 2-2 Required Mechanical Ventilation Air in Frequently Encountered Building Spaces/Areas (Commonwealth of
Massachusetts, 2001)
Facility/Area Type Outdoor air [cubic feet per minute(cfm) per
occupant]
Classrooms 15
Auditoriums 15
Dining rooms 15
Libraries 15
Gymnasiums 20
Laboratories 20
Office spaces 20
School training shops 20
Beauty salons 25
Commercial dry cleaners 30
Smoking loungesa 60
Dark room 0.5 cfm per square foot of floor space
Swimming pools (pool and deck) area)
0.5 cfm per square foot of floor space
Pet shops 1 cfm per square foot of floor space
Public restroomsb 75 cfm per water closet or urinal
a BOCA National Mechanical Code-1993 b exhaust ventilation required
The reasoning behind the proper airflow for inside a building is due to pollutants being
created in the building. Between the building itself accumulating dust and other pollutants and
the humans that occupy it creating their own pollutants, the air in the building has to be properly
circulated or the building will become uninhabitable.
The second group of IAQ problems is microbial growth, and the only thing that can be
controlled to limit the growth of microbes is the moisture/humidity in the building. Most
microbial growth requires some form of water to grow, so if a building maintains a proper
humidity, less growth will occur. Lastly, Massachusetts lists a group of products that are potential
sources of indoor air pollutants (see Table 2-3).

14
Table 2-3 Potential Sources of Indoor Air Pollutants (Commonwealth of Massachusetts, 2001)
building renovations vocational shops art rooms pottery kilns custodial products pesticide applications vehicle exhaust wood stove smoke photocopier
mimeograph machines chemical storage new furniture carpeting lamination machines school/clerical supplies fuel oil vapors sewer gas from dry traps janitorial supplies
water heaters air fresheners dry cleaning solvents nail application solvents spray paint spray on artificial snow dry erase markers dry erase board cleaners chalkboards
The solution to controlling these pollutants is to make sure the ventilation in the building is
sufficient enough to keep the pollutants at a minimum so they aren’t noticed and don’t cause
health problems.
The reason for addressing how Massachusetts handles IAQ is to be able to see if a standard
may be affecting how people perceive IAQ. Another reason for knowing regulations is if a
problem is found while studies are being conducted, knowing how to fix them according to code
must be keep in mind. Lastly, when determining how to improve air quality perceptions, we have
to see what the government’s regulations are that buildings have to adhere to.
2.4. Hong Kong Information
In order to compare the IAQ of Hong Kong malls to those of malls in Massachusetts we now
describe, the setting of Hong Kong. There are differences between the two areas that affect the
IAQ and management of IAQ in both regions. In this section we will discuss the climate of Hong
Kong, the Hong Kong government’s IAQ standards and regulations, and the results of a previously
completed research project that relates to our project.

15
2.4.1. Climate of Hong Kong
Hong Kong has a humid, subtropical climate. This climate has relatively high temperatures
and a seasonal rain increase (Hong Kong Tourism Board, 2014). Hong Kong has four seasons:
winter, spring, summer, and autumn. Autumn in Hong Kong is said to be the best time to be in
Hong Kong. The humidity and temperatures are at a quite comfortable level, with the
temperature averaging about 24 degrees Celsius. The weather is calm without a lot of changes.
Hong Kong winters are dry and cool, averaging 17 degrees Celsius. Spring time brings a higher
humidity and temperature increases, which average about 26 degrees Celsius. The major change
in the spring is the increased rainfall. During the summer, Hong Kong is at its hottest, averaging
about 28 degrees Celsius. It is also at this time Hong Kong goes through its typhoon season
(Boland, 2014). Summer can be an unpleasant time to be in Hong Kong.
2.4.2. Standards and Regulations in Hong Kong
In Hong Kong, the Environmental Protection Department deals with IAQ regulations (IAQ
Information Centre, 2014). Hong Kong has its own certification scheme.
1. Owner/management of premises/building to engage an HKAS approved "IAQ Certificate
Issuing Body" (hereafter referred to as "CIB");
2. Approved IAQ Signatory of the CIB to carry out a walk-through inspection to check if the
premises/building have any IAQ problem;
3. Owner/management of the premises/building rectifies the IAQ problems, if any, with the
assistance/advice from the CIB;
4. CIB conducts IAQ measurements (sampling, etc.);
5. Approved IAQ Signatory of the CIB to certify the premises/building in compliance with
IAQ objectives and issue a certificate;

16
6. Owner/management of the premises/building sends to the IAQ Information Centre: The
certificate for registration a copy of the certification report for record, application form,
and a CDR soft copy of all items submitted;
7. IAQ Information Centre to return the certificate to owner/management of the
premises/building with a registration number for display in a prominent location for the
public information;
8. Owner/management of the premises/building to manage post certification IAQ;
9. Owner/management of the premises/building to initiate annual re-certification.
Table 4 gives us the ranges for different parameters that the Information Centre finds acceptable.
This is relevant to our project because with a certification scheme in place, we can figure out if
the rating a certain mall gets would affect a person’s perception of the mall and see if it would
change their shopping habits.
2.4.3. Past Research
Some important points were made in a previously completed project done relating to our
project. Arlina Anderson, Alan Cheung and Melinda Lei (2014) made three major points as
conclusions from their project. The first point was that there was no noticeable difference
between malls with good and excellent IAQ. The second point was that people said they would
spend more money in malls if the IAQ was improved. The last point was that there was a need to
increase people’s awareness of the Hong Kong IAQ certification. This preliminary research needs
to be followed up with additional research to determine if these points are widely valid.

17
Table 2-4 IAQ Objectives for Offices & Public Places (IAQ Information Center, 2014)
Parameter Unit 8-hour average a
Excellent Class Good Class
Room Temperature °C 20 to <25.5 b < 25.5 b
Relative Humidity % 40 to <70 c < 70
Air movement m/s < 0.2 < 0.3
Carbon Dioxide (CO2) ppmv < 800 d < 1,000 e
Carbon Monoxide (CO) μg/m3 < 2,000 f < 10,000 g
ppmv < 1.7 < 8.7
Respirable Suspended Particulates (PM10) μg/m3 < 20 f < 180 h
Nitrogen Dioxide (NO2) μg/m3 < 40 g < 150 h
ppbv < 21 < 80
Ozone (O3) μg/m3 < 50 f < 120 g
ppbv < 25 < 61
Formaldehyde (HCHO) μg/m3 < 30 f < 100 f, g
ppbv < 24 < 81
Total Volatile Organic Compounds (TVOC) μg/m3 < 200 f < 600 f
ppbv < 87 < 261
Radon (Rn) Bq/m3 < 150 i < 200 f
Airborne Bacteria cfu/m3 < 500 j, k < 1,000 j, k
(Legend is in Appendix H)
2.5. Mall Industry Persons’ Views on Building Management of Indoor Air Quality
We interviewed Jim McLaughlin, the Director of the WPI Campus Center because in some
ways the Campus Center is like a mall: it is a large building with many people using it for many
different purposes, including eating, working and just relaxing. Mr. McLaughlin gave us his
opinions on the effects of IAQ in WPI’s Campus Center. He believes his job is to make sure the
Campus Center is a comfortable place to work and relax. As such, IAQ does affect his job
responsibilities and must be taken into consideration. For example, smoking used to be a
problem when the campus was not smoke free. Employees and students would go outside the
building and smoke, but the air and smell would filter into the building. Steps had to be taken so
as to prevent the polluted air from traveling inside. Temperature is another major factor in
managing the building well. The WPI’s Campus Center has many large windows and during the

18
summer, the windows let in a lot of sunlight, making the inside of the building hot. As a result,
the air conditioning system would not only have to be at a higher setting, but it was also turned
on early in the morning in order to preemptively cool the building. When asked if air quality
affected business, Mr. McLaughlin answered with a definite yes, especially during summer and
winter months. Temperature plays a big role in keeping people who use the building for any
purpose as well as the employees who work there comfortable during the harsher months of the
year.
In Hong Kong, we conducted an interview with Mr. Low Hon Wah, President of the Hong
Kong Institute of Facility Management (HKFIM). He is also the Division Head (Contracts
Management and Cost Assurance) at Hong Kong Polytechnic University. He has many years of
experience in managing large buildings and building complexes.
First, he gave us a brief introduction of what facility management is. Facility management,
when compared to facility operation, is more objective oriented. It not only helps manage the
whole facility but also allows managers to achieve their objectives. The core value of facility
management is to integrate people, process, and place.
He then added that facility management is changing. For shopping malls, historically
managers just needed to keep them open and functioning because people didn't have many
choices. Currently, however, people have many choices they can make about which mall to visit,
and managers have to think more carefully about facility management to attract more
customers.
Mr. Low believes that there are three points to consider when developing a management
plan or system. One point is that the objective of the system is essential. A system must have a

19
reasonable and profitable goal in order to be reliable. The second point is that it is important to
think about the people who are going to buy and/or use the system. If the system is too
complicated and increases their work load, they won't be willing to use it. The third point is that
the people served by such a system must be considered. For the system to work, the clientele
must be positively affected by whatever changes or improvements the system makes.
Finally, Mr. Low described three examples he had encountered during his work that related
to how people perceived air quality. One example was about smoking around buildings. People
usually smoke outside a building near exits where the air intake system can draw the smoke into
the building. This negatively affects the IAQ. The second example was that even if the readings
of air quality in a room meet all the scientific standards, people may still complain about a smell
due to overly sensitive noses or merely to find reasons for not wanting to be in the room. The
third example explained that even if chimney outputs are filtered and emit clean air, people still
don’t like the visible smoke coming from the chimney and complain about it once they see it. If
they don't see the chimney and its smoke, they won't feel sick or complain.
Our project team also interviewed Dr. Mui and his associate Dr. Wong from the Hong Kong
Polytechnic University. Dr. Mui is very knowledgeable about IAQ and the various issues related
to it. His interest in the subject derives from the challenge it provides. His opinion is that IAQ
mainly has long term effects that are very hard to quantify. It requires a lot of research to learn
how to efficiently measure and change IAQ based on the environment. The equipment used to
measure IAQ is generally very expensive, and mall administrators are reluctant or not interested
in implementing such equipment, because it may or may not provide useful results. As a
consequence, everything done to measure IAQ should considered in relationship to energy

20
efficiency and/or financial costs because these are factors about which mall managers are
concerned. When we asked Dr. Mui about people’s perceptions of IAQ, he mentioned how
people are spending more and more time indoors. As a result, people now tend to be more
concerned with smaller details of the air quality, and there is always some percentage of the
people who are dissatisfied. His personal standard is if five to ten percent of the people are
dissatisfied, then nothing needs to be done. But if there are more than that, then the IAQ should
be improved. Recently, Dr. Mui along with a research group developed a smart phone app that
measures the air quality inside offices, classrooms and labs. The app’s measurement is based on
many variables, including air temperature, radiant temperature, relative humidity, air velocity,
carbon dioxide levels, sound levels, lighting levels, occupancy, floor area, etc. Once each variable
is inputted and a location of the room is also inputted (the app currently only accommodates
Hong Kong), a rating out of five stars is given back. This rating is based on a database Dr. Mui and
his research group have created. The rating can help people get an idea of how the IAQ in a said
room is currently. After learning about his app, we asked Dr. Mui if his app could be applied to
malls. He said that at the moment malls are next to impossible to quantify. They drastically range
in size, number of people present at any point in time, and generally there are too many variables
to be accounted for. People in malls also tend to be harder to satisfy, and the app would have to
be tailored for each mall. However, further research may yield a prototype that could potentially
measure overall IAQ in malls.
We interviewed Mr. Grant Chau, an expert at Hong Kong’s IAQ Information Center. He stated
that shopping malls in Hong Kong pay a lot of attention to their IAQ and managers are trying their
best to improve the shopping experience. Most malls in Hong Kong have at least a good rating

21
on the IAQ Certification Scheme. However, some small-scale and old malls still lack good
management. It is also difficult for malls to achieve and maintain good air quality inside. There
are many limitations such as available budget, space, and technical support. Maintenance of the
equipment can also cost a huge amount of money.
Mr. Chau believes that for shopping malls, crowds can directly affect their IAQ. They bring
dust and bacteria into malls. It is also possible that the size of the crowd exceeds the design
capabilities of the ventilation system.
2.6. Summary
This project deals with three major topics that affect the perception of IAQ: actual IAQ,
building management of air quality, and the Hong Kong and Eastern Massachusetts environment.
We discussed each of these topics so that the context for our project could be properly
understood. Our project will investigate the potential of a management plan, the comparison to
Eastern Massachusetts malls and the data acquired last year to see if there was any significant
change over the year.

22
3. Methodology
The goal of our project was to study the public perceptions of IAQ in Hong Kong malls and
come up with a management plan to monitor and improve perceived IAQ. To achieve this goal,
we identified three main objectives for our project. First, we identified the public perceptions of
IAQ in Hong Kong. We determined how valid our findings were on perceptions of IAQ based on
similar research findings done by last year’s project group. Second, based on the information we
collected on the public’s perceptions of IAQ, we developed IAQ management plans for Hong Kong
malls. Third, we determined the feasibility of the proposed management plans. The methods we
used to accomplish these objectives and thus our goal are discussed in the following sections.
3.1. Determining Public Perceptions of IAQ in Hong Kong
To determine the public’s perceptions of IAQ in Hong Kong mall we surveyed shoppers from
a selected number of malls of our choosing and learned of their perceptions of IAQ. We also
interviewed individuals that have a specialty on an area of IAQ.
3.1.1. Selecting Shopping Malls
Hong Kong has a large number of shopping malls. As a result, there is a large variety of malls
to choose from. In this project, we selected ten shopping malls at which to conduct a survey. The
ten malls we chose were the same ten malls at which researchers in 2014 chose to carry out
research (Anderson et. al, 2014). The reasoning behind this selection has two parts. One reason
was our sponsor, the Hong Kong Business Environmental Council Limited, wanted to compare
our project’s results to last year’s project results. They wanted to see if there was a change in
perceptions and knowledge. The second reason was that the malls the previous research group
selected were diverse in location and prestige, so they represented the range of mall types in

23
Hong Kong well. Lastly, ten malls was a reasonable number of malls to survey in the time span
available to do our research. Each mall was given an arbitrary number to protect the mall’s
identity. We also recorded each mall’s official IAQ certification status, and general location within
Hong Kong. Table 3.1 summarizes all this information.
Table 3-1 Certification Class and Locations of the Shopping Malls
Shopping Mall Certification Status Location
1 Excellent New Territories
2 Excellent Kowloon
3 Good Kowloon
4 Good Kowloon
5 Good Hong Kong Island
6 Good New Territories
7 Uncertified Kowloon
8 Uncertified New Territories
9 Uncertified Kowloon
10 Uncertified Hong Kong Island
3.1.2. Survey
The shoppers and the employees of the malls were the subjects of our survey (see Appendix
C: Questionnaire). The purpose of the survey was to measure the public’s perceptions of IAQ in
shopping malls. The survey we used in Hong Kong was a slight modification of the 2014 project
team’s survey. The congruence between 2014 and 2015 survey questionnaires was used to be
better able to compare this year’s data with last year’s data. Some additional questions were
added, however, so we could also compare the data from the survey we did in Eastern
Massachusetts to our Hong Kong survey results. Lastly, some questions were taken out due to
lack of relevance.
We conducted the survey between January 22, 2015, and February 13, 2015, at the ten Hong
Kong Malls. Fifty questionnaires were collected at each of the malls for a total of 500

24
questionnaires. The survey was carried out Monday through Friday from around 11:00 to 18:00
on sunny to partly sunny days when the temperature ranged from about 15 to 21 degrees Celsius.
All questionnaires were collected outside the mall due to the fact that surveying inside malls
would bother customers, and the mall management wanted to avoid that. We would choose the
exit with the largest exodus of shoppers and approached shoppers after they had left the mall’s
premises. While we randomly approached people to ask if they would participate in our survey,
only people who wanted to stop and take the survey were part of the study.
The sampling method used was a convenience sample along with a quota of 50 respondents
per mall. Each set of responses was kept anonymous. There is some bias in this method due to
the fact that the sampling population was the individuals who filled out our survey, not all the
shoppers in Hong Kong. However, we had limited time to complete our research and we believe
this method was the most appropriate and time efficient.
3.1.3. Interviews
We interviewed people involved with IAQ and facility management to discover their
opinions on our project. Our interviews were fairly brief and used a semi-structured format, but
we had follow-up questions to further the discussion, if appropriate (see Appendix B: Interviews).
We approached each interview differently and adjusted our approach appropriately. The Hong
Kong Business Environmental Council Limited approved all the questions we used. The interviews
were important to determine the respondents’ perceptions of IAQ. Based on their responses, we
also began to develop ideas on how we should create an IAQ management plan. We hoped to
interview as many people as possible in order to acquire the largest amount of information,

25
because more information means a better understanding of the problems the malls face. In total
we were able to carry out four interviews with people involved with IAQ.
3.1.4. Comparing Data of Massachusetts’ Survey and Last Year’s Project
After we fully analyzed our Hong Kong data, we compared the results we deemed significant
and relevant to data from previously completed research. By comparing our Hong Kong data to
the survey data we collected in Massachusetts we were able to determine if there were any
significant differences between the two cultures and if our management plan and conclusions
should be adjusted based on the location of the mall. By comparing the data from this year’s
project and last year’s project we could determine if there were any noticeable trends or patterns
among shoppers’ perceptions in the same ten Hong Kong malls. Graphs were used to represent
the similarities and differences between the sets of data.
3.2. Develop Indoor Air Quality management plan for Hong Kong malls
After collecting the information described in section 3.1, we analyzed the data to come up
with findings and a conclusion about people’s perceptions of IAQ in Hong Kong malls. Based on
the information gathered, we researched what methods could be used to create better
management plans through interviews.
3.2.1. Analysis of survey questionnaires and interviews
There were three main steps involved in the data analysis of our survey. We used Excel
spreadsheets as the main tool for data storage, management, and analysis.
First, the survey questionnaires were checked for validity. We made sure to have exactly fifty
questionnaires for each mall and counted the total number of questionnaires received to be sure.
Second, the responses from the survey questions were organized and grouped for analysis. We
used a spreadsheet to keep and analyze our data. Third, we used standard data analysis

26
techniques such as percentages, averages, and hypothesis testing. For each question, the
percentage of respondents that chose each option was calculated. For the questions with
rankings, we used Excel to calculate standard deviations to prove or disprove hypotheses.
Interviews produced large amounts of qualitative data. The analysis method we used was
content analysis. The notes taken during the interview were the source of our analysis. The notes
were initially recorded by one member during the interview and the two other members would
add on anything they remembered and deemed relevant enough. After all the notes were written
down, we would reflect upon the ideas the interviewee came up with. We focused upon the ideas
relevant to our project and when applicable, expanded upon them. The majority of the ideas
applied to our management plan, both how to create it and how to present it.
3.2.2. Research on management plan
The main method used to help us build a management plan was through interviews. In order
to learn more about building management in Hong Kong, we interviewed several experts in Hong
Kong recommended to us by BEC’s IAQ expert, Dr. Veronica Chan. We did an interview with Jim
McLaughlin, Director of the WPI Campus Center, Mr. Low Hon Wah, Chairman of the Hong Kong
Institute of Facility Management Association, Dr. Mui, an IAQ specialist, and Mr. Chau, a member
of the IAQ Information Centre. Through such interviews and analyzing the interview results, we
obtained suggestions that improved our management plan for better managing people’s
perception of IAQ in Hong Kong malls.

27
3.3. Determine Feasibility of Plans
Two things we considered when determining a solution for improving perceptions of IAQ in
malls were the cost and social factors. We decided not to do any test runs as we did not have
enough time to properly test any management plans we came up with.
3.3.1. Cost Analysis
After we came up with a management plan, we had to determine how much it would cost a
mall to implement the plan. Determining the cost is important because if our solution were too
expensive, the cost might outweigh the benefits of having it in the first place. Determining costs
consisted of determining how much money it would take to create, implement, and maintain the
particular solution. The amount of money required would be determined through research of the
parts on the internet.
3.3.2. Social Analysis
Social analysis of our management plan was examined in three different ways. First, we
talked with our sponsor liaison, Veronica Chan. She gave us feedback on our first ideas and
explained any doubts she had on the feasibility of our thoughts. Second, during each interview,
we asked the interviewee about our management plan and if he had any ideas or suggestions.
Third, we utilized the survey to help us determine how many shoppers would be willing to accept
our management plan. Questions 1 and 2 under Management Plan (See Appendix C:
Questionnaire) directly asked participants if they would use a digital display or complaint
response survey, the two characteristics of the plan we were considering. Based on the results of
the survey, we determined if our management plan would be accepted by the public.

28
3.4. Summary
Our objectives were to determine the public’s perceptions of IAQ in malls in Hong Kong, to
compare the perceptions of IAQ in Hong Kong and Massachusetts malls as well as between this
year’s and last year's data in the same Hong Kong malls, to develop a management plan for
better managing IAQ in malls, and to determine the feasibility of the management plan. Our
main methods were to survey people using the malls, and to interview experts in IAQ and mall
management.
29
4. Results and Analysis
Keeping in mind our goal of discovering the public’s perceptions of IAQ, in this chapter we
present the analysis of the results of our survey and interviews carried out in Hong Kong. We
also compare our data to a study that was conducted last year and to the data from our pre-
project study of Massachusetts malls. From these findings we show how we were able to develop
an IAQ management plan for Hong Kong malls.
4.1. Perceptions of Indoor Air Quality in Hong Kong Malls
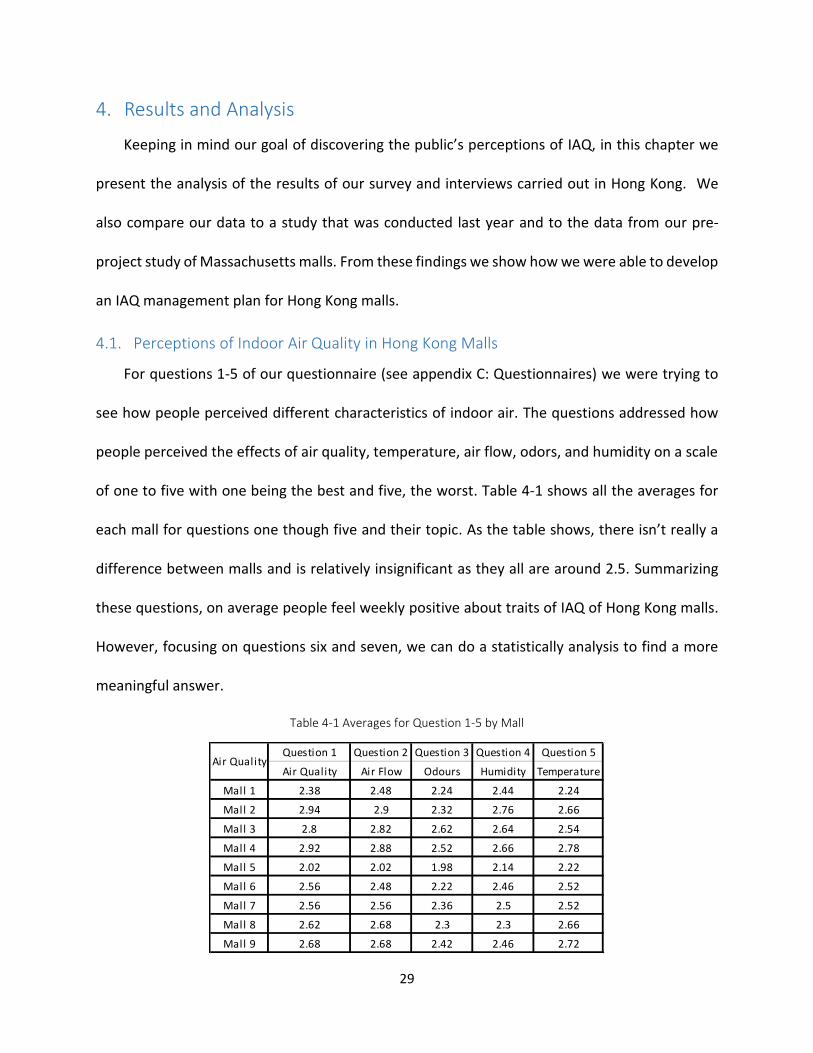
For questions 1-5 of our questionnaire (see appendix C: Questionnaires) we were trying to
see how people perceived different characteristics of indoor air. The questions addressed how
people perceived the effects of air quality, temperature, air flow, odors, and humidity on a scale
of one to five with one being the best and five, the worst. Table 4-1 shows all the averages for
each mall for questions one though five and their topic. As the table shows, there isn’t really a
difference between malls and is relatively insignificant as they all are around 2.5. Summarizing
these questions, on average people feel weekly positive about traits of IAQ of Hong Kong malls.
However, focusing on questions six and seven, we can do a statistically analysis to find a more
meaningful answer.
Table 4-1 Averages for Question 1-5 by Mall
Question 1 Question 2 Question 3 Question 4 Question 5
Air Quality Air Flow Odours Humidity Temperature
Mall 1 2.38 2.48 2.24 2.44 2.24
Mall 2 2.94 2.9 2.32 2.76 2.66
Mall 3 2.8 2.82 2.62 2.64 2.54
Mall 4 2.92 2.88 2.52 2.66 2.78
Mall 5 2.02 2.02 1.98 2.14 2.22
Mall 6 2.56 2.48 2.22 2.46 2.52
Mall 7 2.56 2.56 2.36 2.5 2.52
Mall 8 2.62 2.68 2.3 2.3 2.66
Mall 9 2.68 2.68 2.42 2.46 2.72
Air Quality

30
We wanted to test to see how valid our results were, so we did a welch t-test. We used a
welch t-test over a standard t-test because our samples were multinomial distributed. Our null
hypothesis was that there is no difference between outdoor and IAQ. Our alternative hypothesis
was that IAQ is better than outdoor air quality. Since we conducted all the surveys on days with
similar outdoor weather conditions, we compared the all 500 participants’ perceptions on
outdoor air quality and used that as our base mean (2.718). We were able to do this because our
sample size was big enough to have a good approximation of the normal distribution. Then we
used the average from each mall as the test mean and calculated the p-Value of each mall. For
this statistical test to have conclusive results, we set the significance level to 0.025. Any p-value
below 0.025 would reject the null hypothesis. For 6 out of the 10 malls our null hypothesis was
rejected. For malls 2, 4 and 10 not only did we retain the null hypothesis but we obtained higher
averages than our base meaning that the mall’s IAQ was considered to be worse than the outdoor
air quality, according to our participants. Although Mall 3 had better average, it wasn’t in the
range of the significance level we needed.
Table 4-2 Hypothesis Test for Questions 6-7 by Mall
Mall Average Standard
Error Degrees of Freedom
t-value p-Value Outcome
1 2.3 0.115 74 3.6204 0.0005 Better IAQ
2 2.82 0.12 71 0.8469 0.3999 No Conclusion
3 2.6 0.14 64 0.8416 0.4031 No Conclusion
4 2.82 0.139 64 0.7322 0.4667 No Conclusion
5 2 0.134 66 5.3481 0.0001 Better IAQ
6 2.38 0.137 65 2.4684 0.0162 Better IAQ
7 2.42 0.128 68 2.3224 0.0232 Better IAQ
8 2.3 0.122 70 3.4172 0.0011 Better IAQ
9 2.38 0.128 68 2.6473 0.0101 Better IAQ
10 2.72 0.14 64 0.0143 0.9887 No Conclusion
31
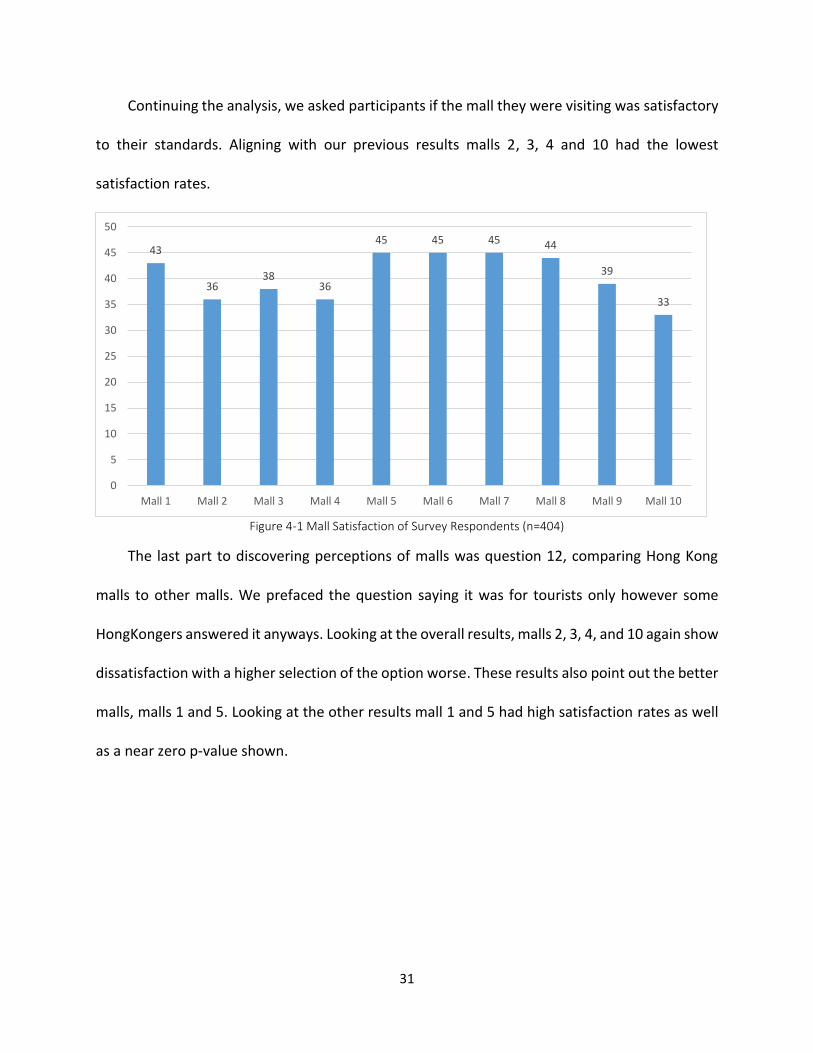
Continuing the analysis, we asked participants if the mall they were visiting was satisfactory
to their standards. Aligning with our previous results malls 2, 3, 4 and 10 had the lowest
satisfaction rates.
Figure 4-1 Mall Satisfaction of Survey Respondents (n=404)
The last part to discovering perceptions of malls was question 12, comparing Hong Kong
malls to other malls. We prefaced the question saying it was for tourists only however some
HongKongers answered it anyways. Looking at the overall results, malls 2, 3, 4, and 10 again show
dissatisfaction with a higher selection of the option worse. These results also point out the better
malls, malls 1 and 5. Looking at the other results mall 1 and 5 had high satisfaction rates as well
as a near zero p-value shown.
43
3638
36
45 45 45 44
39
33
0
5
10
15
20
25
30
35
40
45
50
Mall 1 Mall 2 Mall 3 Mall 4 Mall 5 Mall 6 Mall 7 Mall 8 Mall 9 Mall 10

32
Figure 4-2 Overall Comparison with Respondent’s Home Country Malls (n=321)
Figure 4-3 Tourist Comparison to Home Country (n=144)
Looking a little more in-depth we see more of malls 1 and 5 doing well while mall 2,4,10 and
especially 3 doing poorly.
Lastly, we investigated why some HongKongers answered as tourists. We assume that they
were comparing the mall they were visiting to their home area mall in another part of Hong Kong.
20
5
1
8
17
5
8
12
8
11
19
16
20
18
26
19
21
17
2120
2
4
7
34
1 1 12
4
0
5
10
15
20
25
30
Mall 1 Mall 2 Mall 3 Mall 4 Mall 5 Mall 6 Mall 7 Mall 8 Mall 9 Mall 10
Better Similar Worse
16
0 0
5
15
12
1 1
7
15
6
0
8
25
45
11
2
12
2
0
2
0
2
0 01
01
0
5
10
15
20
25
30
Mall 1 Mall 2 Mall 3 Mall 4 Mall 5 Mall 6 Mall 7 Mall 8 Mall 9 Mall 10
Better Similar Worse

33
Again, following the rest of our data, malls 2, 3, 4 and 10 have some of the highest selection of
the worse option while mall 1 has a high selection of the better option. Different from the others
though is that, malls 7, 8, and 9 seem to be favorites of the HongKongers.
Figure 4-4 HongKonger Comparison to Home Area (n=177)
Looking at IAQ perception, neither certification status nor location was a criterion. However,
malls 2, 3, 4, and 10 did seem to have a larger number of visitors and felt very crowded at times.
While malls 1 and 5 were quite comfortable, having a very manageable number of visitors moving
around inside the mall. We hypothesize that the size and design of the mall as well as number of
visitors in relation to the size of the mall may influence people’s perceptions IAQ.
4.2. Spending
We wanted to have our research provide a practical result. We believed that if the study we
conducted would show that IAQ affected the amount of money spent by customers, it would be
seen as important in the eyes of mall managers. In fact, 54 percent of the people we surveyed
said that air quality does affect the amount of money they spend in a mall. While this may seem
45
1
32
4
6
11
7
44
10
20
10
1
1516
6
19
8
0
45
32
1 10
23
0
5
10
15
20
25
Mall 1 Mall 2 Mall 3 Mall 4 Mall 5 Mall 6 Mall 7 Mall 8 Mall 9 Mall 10
Better Similar Worse

34
neutral, we think that since over half of the respondents say it affects their spending that
managers should take notice. A lot of people visit these malls, half of them may spend more
money if the air quality was better. However the question did not ask if the person would spend
more or less money, and so this topic should be looked into further how IAQ affects spending.
Figure 4-5 Air Quality Effect on Spending (n=500)
4.3. IAQ Certification Scheme Knowledge
Hong Kong Business Environment Council Limited wanted to know if people who shop at
malls know about the IAQ Certification Scheme that the Council conducts. If they knew about it,
we asked them to answer another question about what class they thought the mall they were in
belonged to. With Figure 4-6 showing overall results from all responses, Figure 4-7 shows how
many HongKongers knew about the IAQ Certification Scheme. We then analyzed responses from
those who knew about the scheme to see if they gave the same answer as the actual classification
the mall had received (see Table 4-3). We provide results from all respondents and separately for
just Hong Kong residents because people from other places might not know what the BEC’s
certification scheme is, or they might confuse it with something similar that is used in the place

35
where they came from. Lastly, there were some people, who answered the question even though
they didn’t know about BEC’s IAQ Certification Scheme, (see Table 4-3). We viewed this as an
opportunity to see how people may view the mall’s IAQ despite the fact that they are unaware
of BEC’s IAQ certification scheme. Overall there is a lack of knowledge of the scheme but
comparing it to last year’s results gave us a more realistic idea of how much it changed.
Figure 4-6 Overall Knowledge of the Certification Scheme (n=500)
Figure 4-7 HongKongers Knowledge of the Certification Scheme (n=352)
32%
68%
Know Don’t Know

36
Table 4-3 Knowledge of Certification Scheme of the Mall Visited
Population Number Correct Percent Correct
Total population (n=500) 96 19.20%
Know scheme (n=142) 34 23.94%
Don’t know scheme (n=358) 62 17.32%
HongKongers that know scheme (n=98)
26 26.53%
4.4. Data Comparison
We were able to compare our results to those from two other studies, so we could get a
more complete view on the perceptions of IAQ in Hong Kong malls. The comparison to last year’s
study on IAQ in Hong Kong malls allowed us to see what had changed and what hadn’t. This
helped because we could see what needed to be looked into more. The comparison to our own
survey results in Massachusetts malls allowed us to see if there is anything interesting and
different in malls in another part of the world.
4.4.1. Comparison to Last Year’s Results
The project that was conducted in 2014 had a similar focus to our project. The gender
ratio of respondents in 2014 was 55% females and 45% females which was similar to ours. For
our study we broke up the age groups of respondents somewhat differently than the study in
2014, but the age range from <18 to 30 comprised 78% of our respondents while <21 to 35
comprised 90% of last year’s study (see Appendix E: Demographics). We added a Mainland China
option for residency in our survey, but HongKongers still comprised 71% of our sample, while last
year’s sample had 78% from Hong Kong. With such similar characteristics of respondents we were
able to compare our results with those obtained in 2014 with more confidence. Our study
showed that malls that were certified as excellent and good class didn’t mean that visitors to
these malls perceived IAQ to be good or excellent. Interestingly, last year’s study showed that

37
“more people thought IAQ was unsatisfactory at ‘Excellent’ malls than at uncertified and ‘good’
malls” (Anderson et. al, 2014, 107). In terms of knowledge of the certification scheme our
respondents had an almost identical knowledge as last year’s respondents at about 28 percent
of respondents. In terms of identifying the mall’s certification rating correctly when the individual
knew about the scheme, last year’s study had a higher percentage of accurate answers with
33.6%, while ours only had 23.94% (see Figure 4-8) correct answers, a 10% decrease. To further
investigate, from last year’s project, 42.8% of participants answered with the incorrect
certification of the mall, and 23.6% of the participants knew about the certification scheme but
did not know about the certification of the mall. From our project, 50% of participants answered
with the incorrect certification of the mall, and 26.1% of the participants knew about the
certification scheme but did not know about the certification of the mall. Lastly, we saw a 14%
increase over last year (see Figure 4-9) in the number of people who said that IAQ would affect
the amount of money they would spend in malls. Since two years in a row we saw that about half
of mall goers’ shopping behavior could be influenced by the IAQ, we believe that this should be
looked into further to learn what might be happening and how this might affect businesses’
operating in these malls.

38
Figure 4-8 Correct Certification Answer Comparison (%)
Figure 4-9 Air Quality Affects Spending Comparison (%)
4.4.2. Comparison to Eastern Massachusetts Malls
The two results we compared of our pre-test survey in eastern Massachusetts to our survey
in Hong Kong were the comparison of indoor to outdoor air quality and the desire of shoppers
for a digital display and satisfaction/complaint response system.
Looking at each area as an overall average and calculating a p-value gives us a better idea
on how shoppers in each region view IAQ. As shown in Table 4-4, the overall view is that Hong
33.623.94
66.476.06
0
10
20
30
40
50
60
70
80
90
100
2014 2015
Correct Incorrect
40.554
59.546
0%
10%
20%
30%
40%
50%
60%
70%
80%
90%
100%
2014 2015
Yes No

39
Kong shoppers view IAQ as being better and Massachusetts shoppers view outside air quality as
better. One reason for these perceptions could be that since there isn’t as much outdoor air
pollution in Massachusetts, people are more critical of IAQ there, while people from Hong Kong
use the indoors, such as malls, to escape the poor outdoor air quality.
Table 4-4 Analysis of the Average Difference of Air Quality by Region
Area Outside Average
Inside Average
Difference t-Value p-Value Outcome
Eastern MA
2.04 2.52 -0.48 2.9606 0.0039 Outdoor Air is Better
Hong Kong
2.72 2.47 0.25 3.8238 0.0001 Indoor Air is Better
For the comparison for how people felt about our ideas for the management plan, as seen
in Figure 4-10 shoppers from both areas had a positive response about our idea for a digital
display. We also got a positive response about introducing a complaint response system in both
locations, as shown in Figure 4-11. Both areas received our management plan ideas positively
showing us socially our plan is well received for the two areas.
Figure 4-10 Comparison of Digital Display Results
71.6 74
28.4 26
0%
10%
20%
30%
40%
50%
60%
70%
80%
90%
100%
Hong Kong Eastern MA
Yes No

40
Figure 4-11 Comparison of Complaint Response System
4.5. Management Plan
From our interviews with knowledgeable people in both Massachusetts and Hong Kong, we
learned how to design and improve an IAQ management plan that would be appropriate for Hong
Kong malls. From Mr. McLaughlin we learned that comfort of occupants should be the number
one priority when considering IAQ. As a result, when a mall managers judge customers’
perceptions, they must ask if visitors are comfortable and if the mall could be more comfortable.
From Mr. Low, we learned to think from the management perspective. For example, if a
management plan is difficult to implement and requires a lot of work from the manager’s side,
that plan is less likely to be accepted and implemented. Also, if a plan does not look like it will
yield any tangible results, the manager will not see the reason for implementing it. As a result,
the plan we propose must be easy to implement and be able to produce results that can be
useful. From Dr. Mui, we learned that IAQ has many different variables, and each should be
considered when questioning customers about IAQ. We also learned that there will always be a
number of customers who will be dissatisfied with some feature of the mall. The IAQ of a mall
82.6
68
17.4
32
0%
10%
20%
30%
40%
50%
60%
70%
80%
90%
100%
Hong Kong Eastern MA
Yes No

41
will never be perfect for everyone, and trying to constantly change it will only upset other
customers, who may represent the majority of the people using the mall. As a result, while the
management plan we propose may produce some variation in satisfaction levels among
customers, only consistent patterns of complaints from many customers should be taken as
grounds for making adjustments to how IAQ is managed. Using these insights we should design
a digital display as well as a satisfaction/complaint response system that will satisfy the majority
of shoppers, but can’t be expected to make everyone happy.
4.5.1. Online Complaint Response System
Based on our results, an online complaint response system would be an effective solution
to help improve perceptions of IAQ. The system could function in a variety of ways; however,
based on our interviews, the most efficient method would be an automated system that regularly
updates the ventilation system. How the complaint response system is advertised is up to each
mall; our group suggests either including it in the mall website or including it in the mall app, if
one exists. The updates would be based on the complaints customers have made. However, there
would have to be a certain threshold number of complaints before the ventilation would be
changed. The standards would be decided upon by the mall. Dr. Hui recommended that if more
than ten percent of the mall population is unsatisfied with a certain aspect of the IAQ, then
changes should be made. The standards would be decided upon by the mall. Dr. Hui
recommended that if more than ten percent of the mall population is unsatisfied with a certain
aspect of the IAQ, then changes should be made. However, we assume that not everyone in the
mall with partake in the complaint/satisfaction survey. As a result, we recommend the malls to
find the average number of shoppers that participate in the survey per week after one month. If

42
more than ten percent of that number is complaining about specific factors of the IAQ, then
investigations should be undertaken. The reason for this standard is to avoid changing the
ventilation system when only a few customers complain. There are always likely to be a minority
of people who are unsatisfied with certain aspects of the mall. By changing the ventilation
settings based on only a few complaints, a larger group of people may become unsatisfied with
the IAQ. This system could be even more automated by connecting it to the suggested digital
display and comparing the display numbers to governmental/mall standards as well as comparing
it to customer complaints.
4.5.2. Digital Display
In our survey, most shoppers would like to see a digital display that shows the IAQ of the
shopping mall. Moreover, our interviews also led to the same suggestion. In order to get an
accurate idea of IAQ, there are 12 parameters to measure according to the IAQ Information
Centre standards (see Table 2-4). Therefore, shopping malls would need to purchase different
kinds of sensors to measure different parameters. Furthermore, since shopping malls usually
have a large area as well as multiple floors, which may cause variation of IAQ, same sensors
should be installed in different locations to account for such differences. After collecting all the
information, the data can be processed into a more readable and understandable format. The
IAQ will be shown on digital monitors set up in easily visible places in malls where shoppers can
easily check them.

43
4.5.3. Cost Feasibility of Management Plan
Although shoppers are willing to use a satisfaction/complaint response system as well as a
digital display of shopping mall IAQ, the economic costs of implementing these ideas need to be
taken into consideration before deciding to implement them.
For the satisfaction/complaint response system, a survey can be conducted online through
websites or a mobile application. There are several ways to carry out the survey of shoppers. A
particular website can be designed for such a purpose. The average development cost of a small-
scale website is about US$5,500 to US$12,000 depending on its functionality and size
(Executionists, 2015). A website also requires about US$200 maintenance fee for domain name
and hosting every year. If shopping malls already have their own website, a survey section can
be added by using some online survey tools. The online survey tools usually provide templates of
survey questionnaires, data analysis, and many other useful services. The cost of these online
survey tools vary from free to about US$200 per month (Rich Page, 2014). Another solution for
the survey system is to create a mobile application for shoppers to download and use. The cost
of a relatively simple application is about US$3000 to US$8000 (Astegic, 2013). The selection of
the method to implement the satisfaction/complaint response system should be based on
shopping malls’ demand and their budget. Further research is needed for developing such a
system.
The cost of a digital display of shopping mall IAQ consists of two main parts, sensors and
display devices. For sensors, 10 out of 12 parameters (See Table 2-4) of IAQ can be directly
measured by electronic sensors with relatively low cost. The average prices are listed in Table 4-
5. However, radon and airborne bacteria cannot be easily measured. Specialized devices are

44
required. For example, a device that measures radon costs about US$129.95. A device that
measures airborne bacteria cost around US$8000. In addition, the cost of the sensors also
depends on the number of sampling places in shopping malls. Moreover, the cost of control and
communication hardware, installment, and maintenance should be studied. For display devices,
monitors are widely used. Their prices are related to the size and type of the screen. A 20”-22”
monitor costs about US$200 (PCPARTPICKER, 2015). The larger the size of the monitor, the more
it costs. Also, multiple monitors should be set up to make sure information is accessible
throughout the shopping mall. It is also possible to integrate the IAQ information into an existing
digital display that shopping malls may already have.
Table 4-5 Parts Cost of Sensors for Measurement of IAQ (Information collected from digikey, aliexpress, amazon,
wako-chem)
Parameter Sensor Cost (US$)
Room Temperature 2.19
Relative Humidity 11.48
Air movement 88.37
Carbon Dioxide (CO2) 154.17
Carbon Monoxide (CO) 7.25
Respirable Suspended Particulates (PM10) 25.59
Nitrogen Dioxide (NO2) 144.35
Ozone (O3) 26.18
Formaldehyde (HCHO) 37.51
Total Volatile Organic Compounds (TVOC) 18.91
4.6. Summary
The chapter of our paper provides us with significant results that will influence our
conclusion and recommendations. One significant result we ascertained was how neither
location nor certification status of a mall seem to influence the perceptions of IAQ. The malls that
45
scored poorly in the comparison of IAQ to outdoor air quality, as well as the satisfaction of their
indoor air, were located in different parts of Hong Kong and had different levels of certification.
Another significant result was if IAQ affects the spending amount of shoppers. Since a little over
half the respondents answered positively to this query, we determined that enough shoppers are
affect by IAQ to make this statistic important. Therefore, management should consider the
quality of the mall’s air to affect the shoppers’ budget. Also to be noted was the shoppers’
knowledge of the IAQ Certification Scheme. Compared to last year’s project, there was a drop of
awareness about the Scheme which may affect the opinions of shoppers, especially in malls with
good ratings but bad perceptions. Lastly, our management plan was analyzed and its feasibility
ascertained. Based on the results, a majority of the respondents are in favor of our proposed
management plan of a satisfaction/complaint response system and a digital display showing IAQ
factors. The financial and social feasibility of these two components were researched and points
were brought up about each.

46
5. Conclusions and Recommendations
In this chapter we present the conclusions and recommendations we developed based on
our analyses presented in chapter 4.
5.1. Conclusions
From the analysis of the survey data, we can draw four main conclusions about the public’s
perceptions of IAQ in shopping malls in Hong Kong. First, a mall’s location and IAQ certification
status do not correlate with people’s perceptions of the IAQ. Second, knowledge of the IAQ
certification scheme is generally lacking among mall goers in Hong Kong. Third, the IAQ of Hong
Kong shopping malls is similar to other shopping malls around the world. Moreover, it is usually
perceived to be better than the air quality inside malls in mainland China. Fourth, our two
proposals for a satisfaction/complaint response system and a digital display that displays IAQ
indicators were well received.
5.2. Recommendations
This section has two components: recommendations for malls and recommendations for
future research projects. Mall recommendations include our management plan and other ideas
we have come up with. Recommendations for the Business Environment Council Limited are
suggestions for future research projects about IAQ that our project did not cover.
5.2.1. Mall Recommendations
We have four recommendations for malls. One recommendation is to implement an online
complaint response system. The online complaint response survey could use something similar
to the questionnaire we developed, with a few different questions (see Appendix F:
Satisfaction/Complaint Response Survey). How to direct shoppers to the survey is ultimately up
to the mall; however, we recommend posting links or QR codes to a website or a phone app

47
containing the survey. To most efficiently utilize the complaint response system, the
management would need to set certain standards. One standard would be the number of
complaints required to initiate action on a problem that shoppers are complaining about. By
setting this number, the management can save time and money by not adjusting the HVAC
system for every complaint. The other standard would be how the management judges the actual
IAQ. The reason for this standard is that if people are complaining about the air, but the quality
is high by the mall’s standards, then something may be disturbing the shoppers’ perceptions. On
the other hand, if the air quality is low by the mall’s standards, and people are complaining,
something may be physically wrong with the HVAC system. By utilizing the complaint response
system with these standards, the management would save time and money.
Another recommendation is a digital display. A display could present a selection of variables;
however, we suggest presenting factors shown in Appendix G: Digital Display. From our
interviews, we believe these factors are the more effective and persuasive variables that will
convince shoppers about the high quality of indoor air. Depending on how many and what kind
of displays the mall wants, this part of our plan can be rather cheap or quite expensive.
A third recommendation for malls is to regularly service and maintain existing ventilation
systems. Mr. Grant Chau has commented about how one of the easiest ways for a mall’s
certification rating to decrease is by simply not cleaning and checking the HVAC system on an
annual basis. Last year’s project findings also reinforce this recommendation. Dust particles and
other bacteria can clog up ventilation shafts and fans, or be spread by the ventilation system into
other parts of the mall. Cleaning the system frequently will go a long way in keeping the air inside
clean.
48
Our last recommendation for malls is to promote awareness about their IAQ Certification.
Maintaining high quality indoor air is a trait malls should be proud of and advertise to their
customers. By promoting the mall’s certification status, shoppers should have an improved
perception of the mall’s IAQ.
5.2.2. Recommendations for Business Environmental Council Limited
We have some recommended research directions for BEC to sponsor. Through further study,
a better understanding of the public’s perceptions of IAQ and improvement in customers’
shopping experience in shopping malls in Hong Kong can be achieved.
According to our analysis of the survey, there are differences regarding the satisfaction rate
and preferences between indoor and outdoor air quality. Based on observations, our hypothesis
is that the perceived IAQ is affected by the population density and configuration of the shopping
malls. If there is a large population of shoppers, according to Mr. Chau, this can bring a large
amount of dust and bacteria into the malls and can exceed the maximum capacity of the HVAC
system to handle them, which negatively affects the IAQ. Mall configuration is also related to the
density of shoppers in malls. A more spacious and well-designed mall will be able to handle more
people than a confined mall. Therefore, research needs to be conducted to find out how
significant this factor is to the public’s perception of IAQ. What are the threshold densities that
should be avoided and which mall configurations have which thresholds?
Since an IAQ digital display will be desirable and feasible for shopping malls to implement,
we suggest that what content should be displayed and how the content should be displayed need
to be studied. There are many parameters that characterize air quality, as discussed in our
background section. However, some of them require expensive devices to measure them and

49
take a relatively long time to measure. Furthermore, some of them are not applicable to an
indoor environment and their effects are negligible. Thus, it is important to find out which factors
most affect people’s perceptions of IAQ. It is also important to figure out what the best way to
display the air quality of the shopping mall on a digital display is. It is possible to either show the
levels of different factors separately or show a general IAQ index, or both. In addition, the formula
for calculating the index would require further study.
Another suggestion we have is to do research on how much IAQ affects shoppers’ spending
habits. In our survey, we determined that air quality does affect the amount of spending by
shoppers. We did not determine if better IAQ increases spending, or how much excellent IAQ
would increase spending. By conducting a study of the significance of IAQ on shoppers’ spending
patterns, malls could better understand the importance IAQ has on their business. The results of
this study might also help convince mall managers to invest in IAQ measuring and maintenance
equipment. As a result the malls could be more profitable and the customers would be happy
and spend lots of money.

50
References
Anderson, A., Cheung, A., & Lei, Medlina. (2014). Evaluation of Hong Kong’s Indoor Air Quality
Management Programme: Certification Scheme, Objectives, and Technology. Interactive
Qualifying Project Report. Worcester Polytechnic Institute, Worcester, MA.
Angel, W. L. (2012). HVAC design sourcebook. New York: McGraw-Hill.
AppliedSensor. (2009). Beyond CO2: Sensing VOCs in Indoor Air Protects Health, Saves Energy.
Retrieved December 14, 2014, from
https://www.appliedsensor.com/pdfs/IndoorAirQuality_WhitePaper_0609.pdf
ASHRAE. (2001). Ventilation for Acceptable IAQ. Retrieved December 14, 2014, from
https://www.ashrae.org/file library/doclib/public/200418145036_347.pdf
Astegic. (2013). How Much Does it Cost to Develop a Mobile App? Retrieved March 1, 2015,
from http://www.astegic.com/cost-to-develop-a-mobile-app
Axe, J. (2010). Indoor Air Pollution Worse Than Outdoor. Retrieved March 5, 2015, from
http://draxe.com/indoor-air-pollution-worse-than-outdoor/
Barba, M. D. (2009). HVAC Optimization for Energy Savings. Buildings, 103(12), 18.
BEC. (2014a). BEC Advisory Groups. Retrieved November 30, 2014, from
http://bec.org.hk/about-us/bec-advisory-groups
BEC. (2014b). BEC Executive Committee. Retrieved November 30, 2014, from
http://bec.org.hk/about-us/bec-executive-committee

51
BEC. (2014c). BEC Institute of Environmental Education. Retrieved November 30, 2014, from
http://bec.org.hk/our-professional-services/bec-institute-of-environmental-education
BEC. (2014d). BEC Membership Committee. Retrieved November 30, 2014, from
http://bec.org.hk/about-us/bec-membership-committee
BEC. (2014e). Board of Directors. Retrieved November 30, 2014, from http://bec.org.hk/about-
us/board-of-directors
BEC. (2014f). Core Values. Retrieved November 30, 2014, from http://bec.org.hk/about-
us/core-values
BEC. (2014g). Indoor Air Quality. Retrieved November 30, 2014, from http://bec.org.hk/our-
professional-services/indoor-air-quality
BEC. (2014h). Membership Scheme. Retrieved November 30, 2014, from http://bec.org.hk/our-
members/membership-scheme-menubar
BEC. (2014i). Management Team. Retrieved November 30, 2014, from http://bec.org.hk/about-
us/management-team
BEC. (2014j). Partner Organisations. Retrieved November 30, 2014, from
http://bec.org.hk/about-us/partner-organisations
BEC. (2014k). Partnership Programmes. Retrieved November 30, 2014, from
http://bec.org.hk/our-professional-services/partnership-programmes
Boland, R. (2014). Hong Kong Climate. Retrieved December 17, 2014, from
http://gohongkong.about.com/od/hongkongweather/a/Hong-Kong-Climate.htm

52
Brody, S. D., Peck, B. M., & Highfield, W. E. (2004). Examining localized patterns of air quality
perception in Texas: a spatial and statistical analysis. Risk Analysis, 24(6), 1561-1574.
Commonwealth of Massachusetts. (2001). Overview of Indoor Air Quality in Buildings.
Retrieved March 5, 2015, from
http://www.mass.gov/eohhs/gov/departments/dph/programs/environmental-
health/exposure-topics/iaq/indoor-air-quality.html
Dezenski, L., & Filipov, D. (2013, March 20). Worcester is nation’s snowiest city this year - The
Boston Globe. Retrieved December 17, 2014, from
http://www.bostonglobe.com/2013/03/20/worcester-nation-snowiest-city-this-
year/p0yVC540SuunpEknyItjaK/story.html
EEOP. (2014). Thermal Comfort (Relative Humidity (RH) and Air Temperature). Retrieved
December 14, 2014, from
https://www4.nau.edu/eeop/air_quality/docs/AkIAQ_ThermalComfort.pdf
Enviropedia. (2014). Outdoor Air Pollution. Retrieved December 8, 2014, from
http://www.enviropedia.org.uk/Air_Quality/Outdoor_Air_Pollution.php
Executionists. (2015). How Much Does a Website Cost in 2015? Retrieved March 1, 2015, from
http://www.executionists.com/blog/much-website-cost-2015/
Explore Massachusetts. (2014). Massachusetts Climate - Seasons, Weather, and Charts.
Retrieved December 17, 2014, from http://www.explore-
massachusetts.com/massachusetts-climate.html

53
Graham, C. (2014, November 4). High-Performance HVAC. Retrieved November 30, 2014, from
http://www.wbdg.org/resources/hvac.php
Hong Kong Tourism Board. (2014). Climate. Retrieved December 17, 2014, from
http://www.discoverhongkong.com/eng/plan-your-trip/know-hong-kong/climate.jsp
Hong, T. (2009). A close look at the China Design Standard for Energy Efficiency of Public
Buildings. Energy & Buildings, 41(4), 426-435. doi: 10.1016/j.enbuild.2008.11.003
IAQ Information Centre. (2014). IAQ Certification Scheme. Retrieved December 17, 2014, from
http://www.iaq.gov.hk/second.asp?language=en&page=scheme&sub=
Jones, A. P. (1999). IAQ and health. Atmospheric Environment, 33(28), 4535-4564. doi:
10.1016/S1352-2310(99)00272-1
Lee, S. C., Chan, L. Y., & Chiu, M. Y. (1999). Indoor and outdoor air quality investigation at 14
public places in Hong Kong. Environment International, 25(4), 443-450.
Li, J., Wall, J., & Platt, G. (2010, July). Indoor air quality control of HVAC system. Paper presented
at the 2010 International Conference on Modelling, Identification and Control (ICMIC),
Okayama, Japan. Retrieved from
http://ieeexplore.ieee.org/xpl/articleDetails.jsp?tp=&arnumber=5553469&url=http%3A%2
F%2Fieeexplore.ieee.org%2Fxpls%2Fabs_all.jsp%3Farnumber%3D5553469
Li, W.-M., Lee, S. C., & Chan, L. Y. (2001). IAQ at nine shopping malls in Hong Kong. Science of
the Total Environment, 273(1), 27-40. doi: 10.1016/S0048-9697(00)00833-0

54
Li, W.-M., Lee, S. C., & Chan, L. Y. (2001). IAQ at nine shopping malls in Hong Kong. Science of
the Total Environment, 273(1), 27-40. doi: 10.1016/S0048-9697(00)00833-0
PCPARTPICKER. (2015). Monitors Price Trends. Retrieved March 1, 2015, from
https://pcpartpicker.com/trends/price/monitor/
Pérez-Lombard, L., Ortiz, J., & Pout, C. (2008). A review on buildings energy consumption
information. Energy & Buildings, 40(3), 394-398. doi: 10.1016/j.enbuild.2007.03.007
Rao, C. Y., Burge, H. A., & Chang, J. C. (1996). Review of quantitative standards and guidelines
for fungi in indoor air. Journal of the Air & Waste Management Association, 46(9), 899-
908.
Rezaie, B., & Rosen, M. A. (2012). District heating and cooling: Review of technology and
potential enhancements. Applied Energy, 93, 2-10. doi: 10.1016/j.apenergy.2011.04.020
Rich Page. (2014). Survey Your Visitors Better: Site Survey Tool Ratings. Retrieved March 1,
2015, from http://rich-page.com/web-analytics/survey-your-visitors-better-site-survey-
tool-ratings/
Robinson, J., & Nelson, W. (1995). National Human Activity Pattern Survey Data Base, US EPA.
Research Triangle Park, NC: Atmospheric Research and Exposure Assessment Laboratory.
Saravanan, N. P. (2004). Indoor air pollution: Danger at home. Resonance, 9(1), 6-11. doi:
10.1007/BF02902524
Seltzer, J. (1995). Effects of the indoor environment on health. Philadelphia: Hanley & Belfus.

55
Smith, K. R. (2002). Indoor air pollution in developing countries: recommendations for research.
Indoor air, 12(3), 198-207. doi: 10.1034/j.1600-0668.2002.01137.x
U.S. Consumer Product Safety Commission. (2014). The Inside Story: A Guide to IAQ. Retrieved
December 14, 2014, from http://www.cpsc.gov/en/Safety-Education/Safety-
Guides/Home/The-Inside-Story-A-Guide-to-Indoor-Air-Quality/
U.S.DOE. (2002). Spot ventilation: source control to improve IAQ. Retrieved December 14, 2014,
from http://www.nrel.gov/docs/fy03osti/26466.pdf
U.S.DOE. (2012). Whole-House Ventilation. Retrieved December 14, 2014, from
http://energy.gov/energysaver/articles/whole-house-ventilation
WHO. (2014). Burden of disease from ambient and household air pollution. Retrieved
November 30, 2014, from
http://www.who.int/phe/health_topics/outdoorair/databases/en/
Wyon, D. P. (2004). The effects of IAQ on performance and productivity. Indoor air, 14(s7), 92-
101.
Yocom, J. E., Clink, W. L., & Cote, W. A. (1971). Indoor-outdoor air quality relationships. Journal
of the Air Pollution Control Association, 21(5), 251.

56
Appendix A: Business Environment Council Limited
Business Environment Council Limited, (BEC, 2014f) an independent, non-profit
membership organization, was established at 1992 by the business sector in Hong Kong (BEC,
2014). The mission of the organization is, “To advocate environmental protection amongst our
members and the broader community, the uptake of clean technologies and practices which
reduce waste, conserve resources, prevent pollution, and improve the environment”.
BEC (2014e) determines its strategic direction from a Board of Directors, who come from
different nations and local corporations. There are also two standing committees that assist the
Board. The BEC Executive Committee helps the BEC Board in providing strategic direction to BEC,
while the BEC Membership Committee helps the organization to attract and retain members and
enhance membership services by providing strategic guidance (BEC, 2014b; BEC, 2014d). Beside
the committees, there are four Advisory Groups (BEC ESG, BEC Waste Management, BEC Energy,
and BEC Climate Change Business Forum) to structurally address the major environmental issues
and improve the environmental performance of businesses in Hong Kong (BEC, 2014a). The
management team of the organization is led by Agnes Li, who spearheads the implementation
and execution of the strategies and directions set by the BEC Board of Directors (HKBE, 2014i).
Our liaison, Veronica Chan, is one of the members of the management team as well. She has over
12 years of experience in environmental-related research, consultancy, and training. Her
specialization is on green building assessment, which includes the modelling of the IAQ pollutants.
BEC (2014j) values the cooperation and partnership with government, business and
community bodies. It has a range of partner organizations such as Hong Kong Green Business
Council (HKGBC), BEAM Society, and World Business Council for Sustainable Development

57
(WBCSD). In addition, BEC (2014k) works on lots of partnership programs to pool resources,
implement strategies and facilitate change. For example, they partner with BEAM Society on
Green Building Labelling and with Hong Kong General Chamber of Commerce on a Clean Air
Charter. They also work with the government, such as with the Environmental Protection
Department on waste separation in public housing estates, with the Trade and Industries
Department on Hong Kong Awards for Industries in Environmental Performances, and so on.
Moreover, BEC (2014c) also has a division called, BEC Institute of Environmental Education, to
provide various environmental education courses.
BEC (2014h) offers membership to organizations of all sizes and different fields to push
forward Hong Kong’s sustainable development.
IAQ is one of the core focuses of BEC (2014g). They offer professional indoor environmental
related services. In addition, “BEC IAQ Solutions Centre is the first accredited Certificate Issuing
Body [CIB] under the Hong Kong Inspection Body Accreditation Scheme [HKIAS] to conduct
assessment, certify and audit premises under HKIAS003- IS017020”.

58
Appendix B: Interview Components
Interview Protocol
Email to confirm appointment time and place.
Establish objectives before interview.
Dress business formal: suit and tie.
Shake hands before and after interview.
Inform interviewee that he/she is going on record for our paper. Inform if any recording
devices are being used.
Act politely and appropriately throughout the entire duration.
Thank person for his/her time.
Write follow-up thank you email.

59
Interviewee: Jim McLoughlin
Director of WPI Campus Center
Participants: Zachary Culp
Date: 2014 Dec 9
1. Career a) 14 years at WPI b) 14 years at Plum State U in NH c) 28 years total as a Director of a campus center d) 37 years total working at a campus center e) 5 campus centers over the course of his career
2. Importance of IAQ
a) Would improve IAQ as well as any other detail about the facility to make the clients more comfortable.
b) If there were any issues about IAQ, it would be necessary to address them. c) Important factors: Smoking vs. smoke free, temperature, comfortability and health.
3. IAQ Management a) HVAC system b) Room temperature is modified hourly for different times of the year based on a program c) Because lots of glass, campus center can get very hot in summer d) Any complaints are dealt with accordingly.
4. IAQ Effect on Business a) Especially important in summer and winter months b) Temperature most important aspect of IAQ c) HVAC system does have blowers that cycle outdoor air in for indoor air. It can backfire by
blowing air from food court to offices.
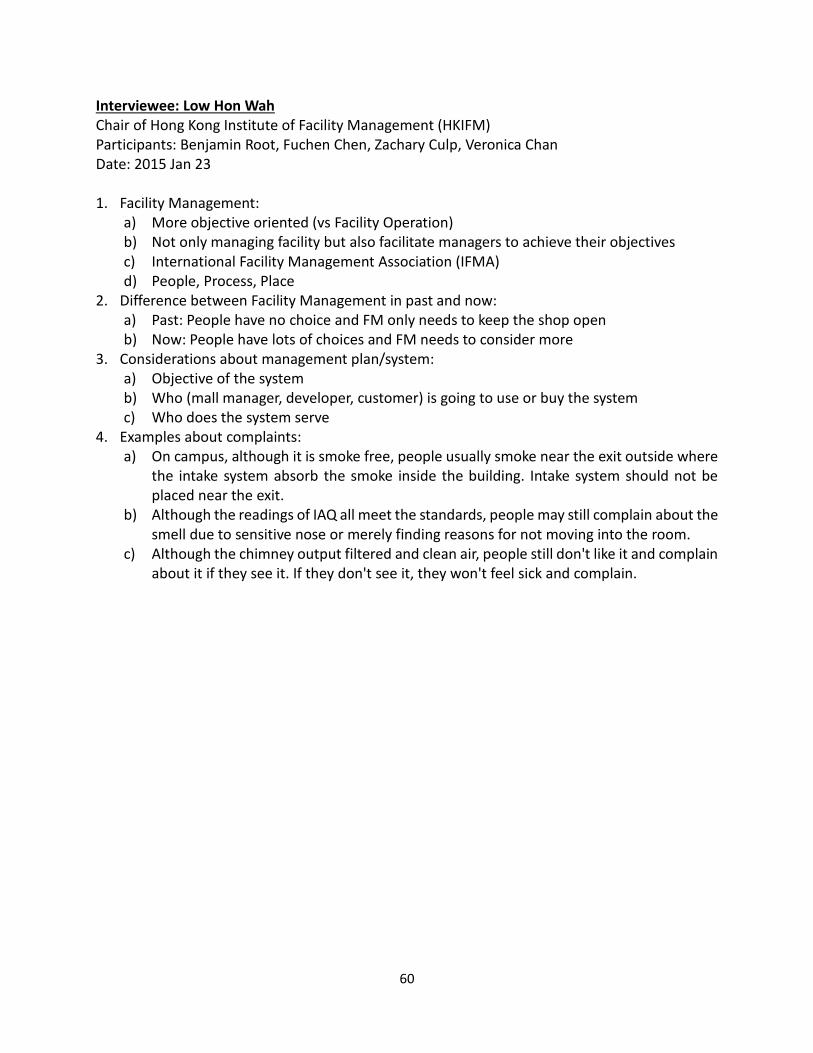
60
Interviewee: Low Hon Wah Chair of Hong Kong Institute of Facility Management (HKIFM) Participants: Benjamin Root, Fuchen Chen, Zachary Culp, Veronica Chan Date: 2015 Jan 23 1. Facility Management:
a) More objective oriented (vs Facility Operation) b) Not only managing facility but also facilitate managers to achieve their objectives c) International Facility Management Association (IFMA) d) People, Process, Place
2. Difference between Facility Management in past and now: a) Past: People have no choice and FM only needs to keep the shop open b) Now: People have lots of choices and FM needs to consider more
3. Considerations about management plan/system: a) Objective of the system b) Who (mall manager, developer, customer) is going to use or buy the system c) Who does the system serve
4. Examples about complaints: a) On campus, although it is smoke free, people usually smoke near the exit outside where
the intake system absorb the smoke inside the building. Intake system should not be placed near the exit.
b) Although the readings of IAQ all meet the standards, people may still complain about the smell due to sensitive nose or merely finding reasons for not moving into the room.
c) Although the chimney output filtered and clean air, people still don't like it and complain about it if they see it. If they don't see it, they won't feel sick and complain.

61
Interviewees: Horace K. W. Mui and Wong Ling Tim
Professors at Hong Kong Polytechnic University
Participants: Benjamin Root, Fuchen Chen, Zachary Culp, Veronica Chan Date: 2015 Jan 21 1. Measuring IAQ
a) It is hard to discover problems of IAQ b) Long term effects (ex: lung cancer) c) Requires a lot of research d) Learn to save energy because of environment and efficiency e) Measure lots of pollutants: bacteria, CO2 just for starters. f) Expensive equipment to measure IAQ. Mall owners are reluctant/ not interested. Long
time to get results/ benefits. g) IAQ very related to the ventilation of building. Outdoor air dust affects IAQ. Fungi,
bacteria also to be noted. h) Relate everything to energy efficiency and financial cost, as that is what sells solutions to
management. i) Volume/ Surface Area of buildings are important to consider. Spacing affects IAQ.
2. People’s Perceptions on IAQ a) People are spending a lot more time indoors than outdoors b) People tend to be concerned with the smaller details of the air. Always some percent of
people that are dissatisfied. 5-10% people is safe. Anything more: problem. 3. AQ App
a) IAQ app: apple and android. b) Works in offices, classrooms, and labs. c) Can measure AQ based on many variables, such as air temperature, radiant temperature,
relative humidity, air velocity, CO2 levels, Sound levels, lighting levels, occupancy, floor area, etc.
d) Can compare the calculated number to a standard based on location. Standards are based on database.
e) With Bluetooth, can be considered cheap equipment. f) Doesn’t work for shopping malls. Malls are bigger, more people, more variables, people
are harder to satisfy; the app would have to be tailored for each mall.

62
Interviewee: Grant Chau Senior Environmental Consultant - Hong Kong Productivity Council (HKPC) Participants: Benjamin Root, Fuchen Chen, Zachary Culp, Veronica Chan Date: 2015 Feb 12 1. HK Shopping Malls:
a) Most are at least good class b) Small scale/old are not good and lack management c) Space limitation d) Occupancy pattern varies
2. Crowd and IAQ: a) Number of visitors directly affect IAQ b) Bring dust and bacteria into malls c) Exceeds design capabilities d) Recommendation: Increase ventilation capacity and fresh air
3. Digital display: a) Factors: CO2, Temperature, Humidity, RSP, VOC b) No reason to compare with outdoor air quality c) Recommended
4. IAQ index system: a) Too many independent parameters b) No easy formula
5. Malls effort: a) HK shopping malls tries to improve IAQ and make customers happy b) Limitations: money, space, technical support, geography. (Hard to get fresh air for malls
beside road) c) Maintenance cost a lot
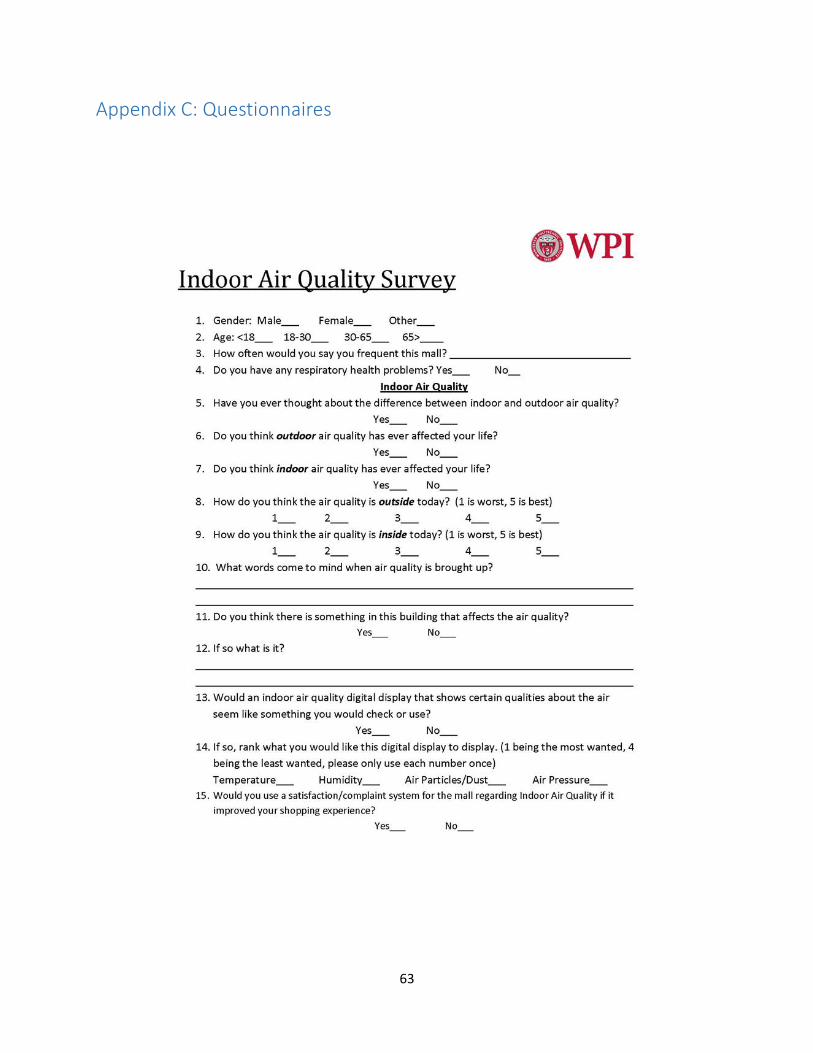
63
Appendix C: Questionnaires

64

65

66
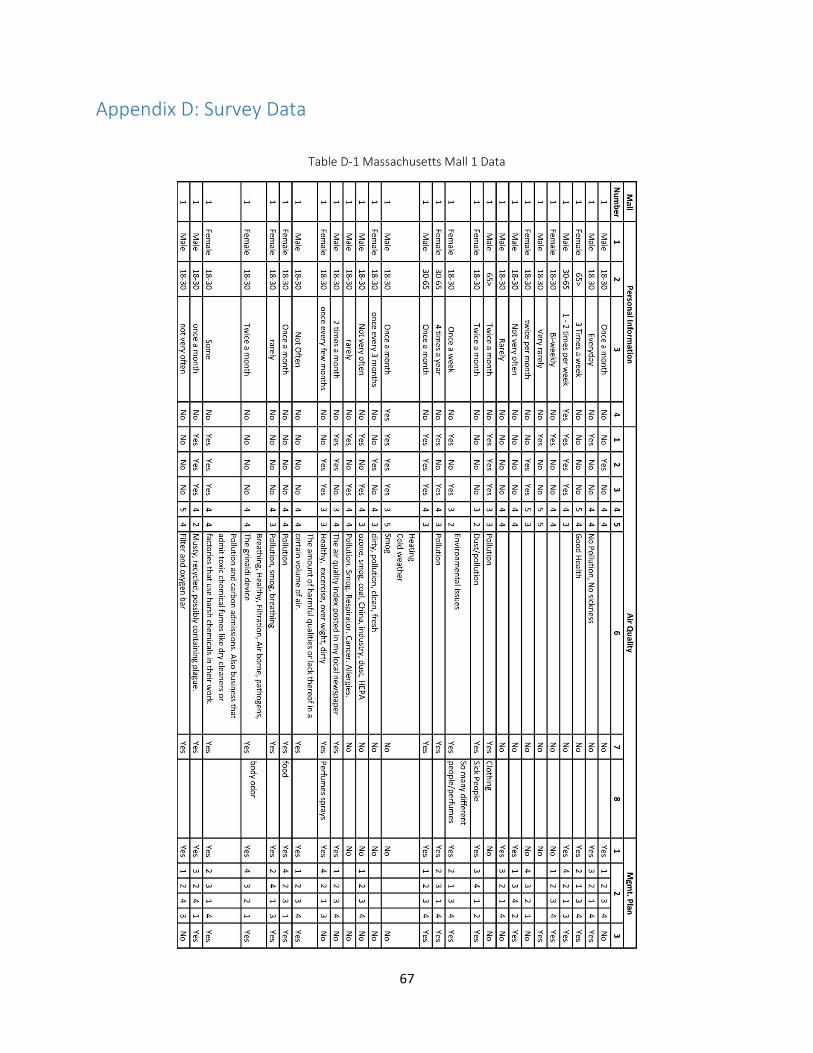
67
Appendix D: Survey Data
Table D-1 Massachusetts Mall 1 Data

68
Table D-2 Massachusetts Mall 2 Data

69
Table D-3 Hong Kong Mall 1 Data

70
Table D-4 Hong Kong Mall 2 Data

71
Table D-5 Hong Kong Mall 3 Data

72
Table D-6 Hong Kong Mall 4 Data

73
Table D-7 Hong Kong Mall 5 Data

74
Table D-8 Hong Kong Mall 6 Data
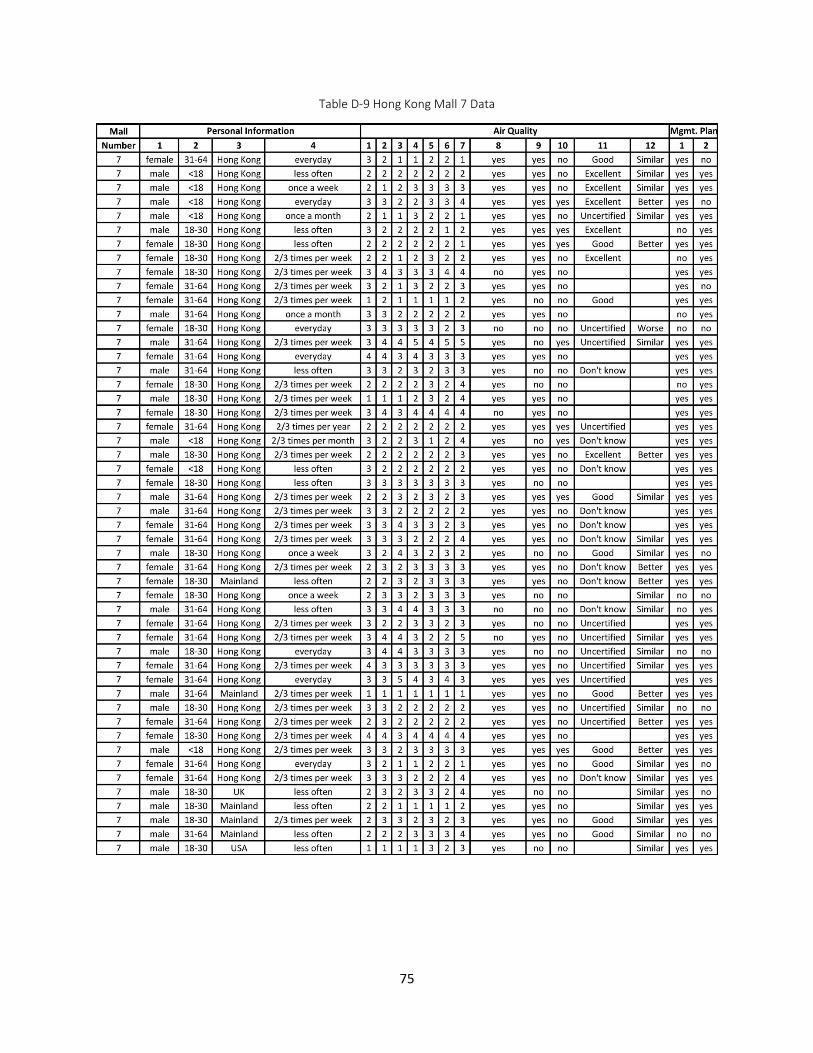
75
Table D-9 Hong Kong Mall 7 Data

76
Table D-10 Hong Kong Mall 8 Data

77
Table D-11 Hong Kong Mall 9 Data

78
Table D-12 Hong Kong Mall 10 Data

79
Appendix E: Demographics
Out of the 500 people we surveyed 277 of the participants were female, while the other 223
were male. While conducting our study, we noticed that females were more interested in
participating in our study than the males.
Figure E-1 Gender distribution of survey respondents (n=500)
The age ranges of people we surveyed were broken up into four categories: <18
(adolescence), 18-30 (Young Adults), 31-64 (Middle Aged Adults), and >64 (Elders). From what
we observed, most young adults were more willing to help us with our study as they took the
time to understand what we were doing, while older people rejected our request to take our
survey.
45%
55%
Male Female

80
Figure E-2 Age distribution of survey respondents (n=500)
We broke up the residency of respondents into three areas: Hong Kong, Mainland (China),
and Other. A lot of Mainlanders come to do their shopping in Hong Kong, so putting them a
separate home location category seemed important, and it helped us draw conclusions about
people’s perceptions of IAQ.
Figure E-3 Place of origin of survey respondents (n=500)

81
Appendix F: Satisfaction/Complaint Response Survey
Figure F-1 Satisfaction/Complaint Response Survey Example

82
Appendix G: Digital Display
Figure G-1 Digital Display Example

83
Appendix H: Table 2-4 Legend
Legends:
a. In some cases, it may not be practicable to take 8-hour continuous measurement. In these circumstances, surrogate measurement (i.e. an intermittent measurement strategy based on the average of half-an-hour measurements conducted at four time-slots) is also accepted.
b. EMSD (1998), Guidelines on Energy Efficiency of Air Conditioning Installations c. IAQ guideline value for Japan (Law of Maintenance of Sanitation in Building) and South
Korea (Public Sanitary Law). d. US EPA (1996), Facilities Manual: Architecture, Engineering, and Planning
Guidelines. Maximum Indoor Air Concentration Standards. e. IAQ guideline value for Australia (Interim National IAQ Goals), Canada (IAQ in Buildings:
A Technical Guide), Japan (Law of Maintenance of Sanitation in Building), South Korea (Public Sanitary Law), Singapore (Guidelines for Good IAQ in Office Premises/building), Sweden (Ventilation Code of Practice) and Norway (Recommended Guidelines for IAQ).
f. Finnish Society of IAQ and Climate (2001), Classification of Indoor Climate 2000: Target Values, Design Guidance and Product Requirements.
g. WHO (2000), Guidelines for Air Quality h. EPD (1987), Hong Kong Air Quality Objectives under the Air Pollution Control Ordinance
(Cap. 311) i. US EPA(1987): US EPA Guideline for Radon in Homes due to Natural Radiation Sources
(Note: 4 pCi/L or 150 Bq/m3 is EPA Action Level) j. ACGIH (1986), ACGIH committee activities and reports “Bioaerosols: Airborne viable
microorganisms in office environments: sampling protocol and analytical procedures”, Applied Industrial Hygiene.
k. The exceedance of bacterial count does not necessarily imply health risk but serve as an indicator for further investigation.