evaluation of landfill leachate pollution: findings …
TRANSCRIPT

19
EVALUATION OF LANDFILL LEACHATE POLLUTION: FINDINGS FROM A MONITORING STUDY AT MUNICIPAL WASTE LANDFILL
Magdalena Daria Vaverková1, Dana Adamcová1
1 Faculty of Agronomy, Mendel University in Brno, Zemědělská 1665/1, 613 00 Brno, Czech Republic, e-mail: [email protected]; [email protected]
INTRODUCTION
Landfills represent a widespread and sig-nificant threat to groundwater quality, human health and even some of the ecosystems due to their nature of operation and abundance. In com-munal language landfill means waste disposal on land. However, technically the International Solid Wastes Association [Bagchi 1994] defines land-fill as “the engineered deposit of waste onto or into land in such a way that pollution or harm to the environment is prevented, and through resto-ration of land provided which may be used for other purpose”. However in works by Kerndorff et al. [1992], Lee and Jones-Lee [1993], Massing [1994], Godson and Moore [1995], Mato [1999], Heron et al. [1998], Mikac et al. [1998], Rie-diker et al. [2000] the environmental impact of the landfill leakage, particularly on groundwater quality, has been noticed several times regardless of an ideal site selection and a monitoring net-
Journal of Ecological EngineeringVolume 16, Issue 2, Apr. 2015, pages 19–32DOI: 10.12911/22998993/1855 Research Article
ABSTRACT The monitoring that was carried out at the landfill specialized in leachate, groundwa-ter and surface water. There were 6 sampling sites. The observed parameters were pH, BOD5, CODCr, conductivity. Leachate reached the high values in all observed param-eters. Groundwater samples were collected at two monitoring wells and the sampling site (A, B, C). Surface water was collected from two sampling sites (D, E). The pH showed slightly acid values at all sampling points. The pH of surface water was slight-ly acid to neutral. Both BOD5 and CODCr values remained stable over the reporting period. The average conductivity value at sampling points D, E remained constant. In line with the Czech National Standard ČSN 75 7221 “Classification of Surface Water Quality” sampling point D belongs to II Water Quality Class – slightly polluted water and sampling site E to Class I water quality – unpolluted water. The authors believe that the fluctuations occurring with regard to the values of certain samples were not caused by the operation of the landfill itself, but were a result of the intense agricul-tural activity nearby the landfill.
Keywords: groundwater monitoring, leachate monitoring, municipal solid waste landfill, surface water, water monitoring.
Received: 2014.11.07Accepted: 2015.02.04Published: 2015.04.01
work design. Therefore, evaluation of potential risks associated with groundwater contamina-tion due to landfills is of great importance in the design of such facilities. Designs of landfill liner systems, detection and assessment of the extent of contaminants in groundwater and risk assess-ment for human health and environment are the three main relevant issues. Groundwater qual-ity monitoring systems are the main link among them since they help to determine the likelihood, and severity of contamination problems. There-fore, a reliable and efficient monitoring network design is of great importance in the overall design of a landfill. However, because of the numerous and significant uncertainties involved, more often it is difficult to ensure that a specific network will detect all of the contaminants released from the landfill. Uncertainties that have great influence on reliability of the monitoring network are size and location of the possible contaminant leak and spatial variability of the hydrogeological charac-

Journal of Ecological Engineering vol. 16(2), 2015
20
teristics, which make groundwater flow and con-taminant paths hard to predict. Locations, depth and number of monitoring wells, chemical char-acteristics of contaminants, and sampling are also significant parameters that affect the reliability of a monitoring network [Buket et al. 2005].
In practice, monitoring network design is controlled and structured by institutional regu-lations. European Community and US Environ-mental Protection Agency (USEPA) regulations are widely recognized and applied in many coun-tries. These regulations require installation of a sufficient number of the detection monitoring wells to detect a contaminant leak before it cross-es the compliance boundary. Minimum require-ments are three down gradient wells and one up gradient well. The post closure monitoring time mentioned is 30 years while the position, number (more than the minimum requirement) and depth of the monitoring wells are proposed by the land-fill owners or operators and by local authorities [Buket et al. 2005].
Landfill leachate is a potentially polluting liq-uid, which unless returned to the environment in a carefully controlled manner may cause harmful effects on the groundwater and surface water sur-rounding a landfill site. The reasons for monitor-ing are to provide assurance that the landfill op-eration does not cause harm to human health or the environment. The leachate formation occurs when soluble components are dissolved (leached) out of a solid material by percolating water. Leachate may also carry insoluble liquids (such as oils) and small particles in the form of sus-pended solids. Depending on the waste types, fur-ther contaminants may be introduced as a result of biodegradation of wastes. Almost any material will produce leachate if water is allowed to per-colate through it. The quality of leachate is deter-mined primarily by the composition and solubil-ity of the waste constituents. If waste is changing in composition, for example due to weathering or biodegradation, then leachate quality will change with time. This is particularly the case in landfills containing municipal waste [Salem et al. 2008].
Our research team has been involved in the investigation of environmental problems of pol-lutants produced and released from landfill facili-ties. As part of such research efforts, a prelimi-nary study was conducted to measure the emis-sion concentrations and leachate from municipal solid waste (MSW) landfill S-OO3 Štěpánovice. Measurements were carried out in the years
1997–2010. The results of this field measurement study are used to diagnose the landfill influence on the nearest surrounding.
From the literature view it can be concluded that papers usually contain only random leachate characterization [Wu et al. 2004, Bila et al. 2005, Kurniawan et al. 2006, Laitinen et al. 2006]. Only some authors have tried to characterize leachate composition during the landfill exploitation [Lo 1996, El-Fadel et al. 2002, Statom et al. 2004, Kulikowska and Klimiuk 2008]. Therefore, the purpose of this study was to search for the ef-fects of a landfill on the characterization of major components in leachate from a Czech MSW land-fill, namely the landfill site in Štěpánovice near Klatovy. Data related to nine years of monitoring (2002–2010) are shown in this study.
MATERIAL AND METHODS
Field investigation - site description
Leachate used in this study was collect-ed from MSW landfill located in Czech Re-public (Figure 1, Figure 2), 1 km north of Štěpánovice commune and 1 km south of Dehtín commune (GPS coordinates of the landfill – 49°26’15.934”N, 13°16’55.352”E). The MSW landfill has been operating since summer 1996. It is situated in the north part of widely opened val-ley directed towards W-E. The bottom part of this area is restricted with a nameless stream being the right tributary of Úhlava River. The upper part of the area is covered with woodland vegetation pre-dominated by Pinus sylvestris. The south slope is used for agriculture (Figure 1).
Figure 1. MSW Štěpánovice [www.mapy.cz]

21
Journal of Ecological Engineering vol. 16(2), 2015
The landfill is located at the north slope from the valley axis. In the past, the landfill area was used as the meadow. In terms of maintenance, the landfill is classified in the S-category - other waste. The landfill has a total authorized volume of about 569 000 m3; at the moment, it is being used to dispose mixed municipal waste. The land-fill (Figure 3) is formed by three sub-landfills: landfill A (closed in 2003, area 8 750 m²); landfill B (operating from 2003, area 26 000 m²); landfill C (that will operate after closing part B). Total volume of both (A,B) parts of the landfill is 289 000 m³. Planned service life of the facility is up to year 2018.
At the moment, the municipal waste treated at the MSW landfill Štěpánovice comes from Klatovy city with satellite towns and villages for a total of about 37 725 inhabitants. The to-tal amount of waste deposited in the landfill in 2004–2011 was in detail described in the arti-cle “Can vegetation indicate a municipal solid waste landfill’s impact on the environment?” [Vaverková and Adamcová 2014].
The activities carried out in this landfill are: landfilling of municipal waste, biogas measure-ment and monitoring, leachate management. Apart from municipal waste the following types of waste are deposited at the landfill: fluid waste, faecal matter, hazardous substances, radioactive and toxic waste. In 1996–2011 approximately 25% of disposed waste was of organic origin. The rest was glass, paper, plastics, metals, textiles and inorganic remains like construction waste, etc.
MONITORING STUDY ON LEACHATE
Landfill monitoring is a set of activities, thereby the effects of a landfill on neighboring environment are monitored and behaviour of individual parts of a landfill is observed. MSW landfill Štěpánovice is equipped with monitoring system. In line with the Czech National Standard ČSN 83 8036 the landfill Štěpánovice is moni-tored throughout the whole duration of its opera-tion. The control programme and monitoring of the landfill as set in the Czech National Standard ČSN 83 8036 involve monitoring of quality and quantity of leachate and monitoring of groundwa-ter and surface water in the vicinity of the landfill.
Methods of monitoring of leachate, ground-water and surface water are set in the Czech National Standard ČSN 83 8036. The Standard stipulates that quality and quantity of leachate are examined on the outflow from the internal drain-age system into the pond. Sampling frequency is determined with regard to the riskiness of the landfill. In terms of quality of surface water and groundwater (water in the vicinity of the landfill) the measurement concerns the following: (i) level and quality of groundwater in the vicinity of the landfill, in particular with respect to potential con-tamination of substances contained in the extracts
Figure 2. Location of the research [www.maps.com, modified by Vaverková and Adamcová 2013]
Figure 3. Map of three sub-landfills [Vaverková and Adamcová 2014]
Journal of Ecological Engineering vol. 16(2), 2015
22
from stored waste, (ii) quality of surface water, into which flows the drainage system of the land-fill and eventual external drainages, at the places above and below the drainage outflow.
The research specializing in monitoring of quality of leachate, groundwater and surface wa-ter at the MSW landfill Štěpánovice at set time intervals took place in the years 2002–2010. Monitoring of leachate was realized via samples taken from leachate pond (Figure 4). The samples were collected via sampler from the surface of the leachate pond. Analyses of the leachate samples were carried out twice a year (spring, autumn). The assessed quality parameters of the leach-ate in the research were as follows: pH, electri-cal conductivity, chemical oxygen demand, di-chromate (CODCr), biological oxygen demand, 5 days (BOD5). An accredited laboratory carried out measurement and subsequent analysis of the samples. The pH parameter and electrical con-ductivity value were determined directly at the sampling place.
In order to determine the parameters of qual-ity of groundwater and surface water, monitoring wells and sampling locations were used (Figure 4). The samples were collected from the wells in a
dynamic state, after short-time drainage (approx. triple exchange of water in the well, or to stable state). Sampling methods were in accordance with the Czech National Standard ČSN ISO 5667, part 11 (groundwater). Surface water samples were collected from the surface of nameless streams – left tributary of Točnický Creek (Točnický po-tok). All samples were collected into airtight glass or plastic containers based on the analyzed com-ponent and immediately transported to accredited laboratory for analysis.
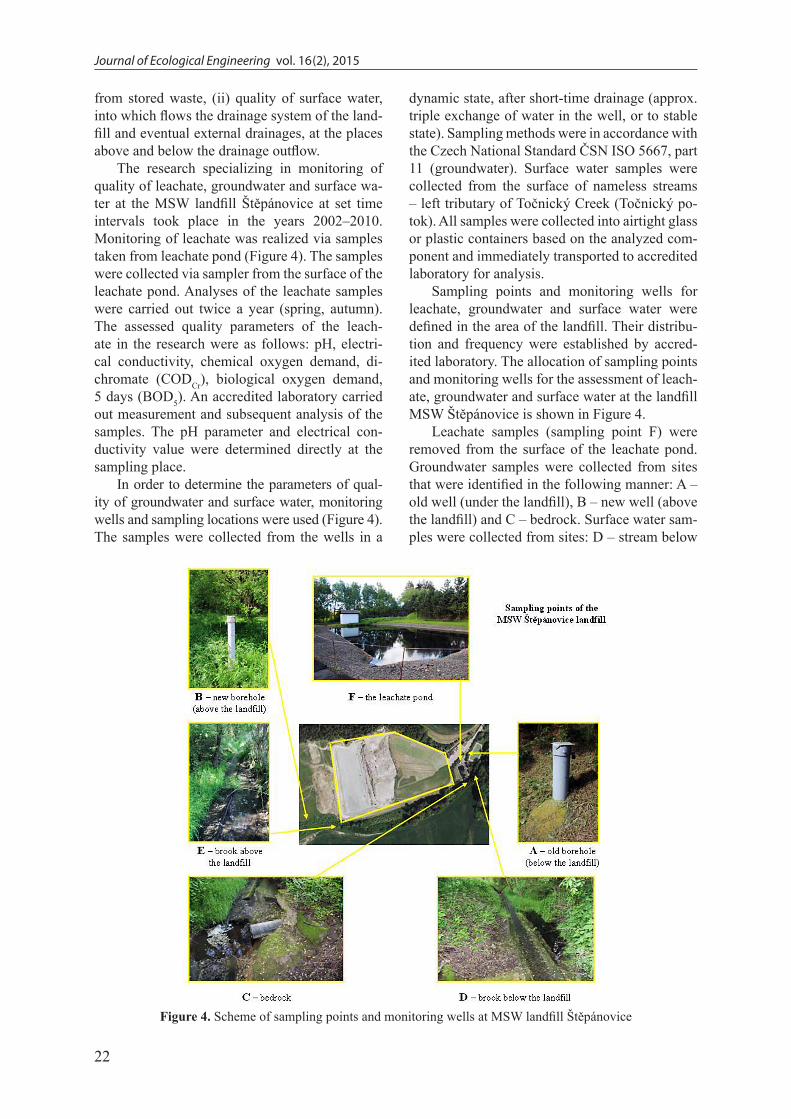
Sampling points and monitoring wells for leachate, groundwater and surface water were defined in the area of the landfill. Their distribu-tion and frequency were established by accred-ited laboratory. The allocation of sampling points and monitoring wells for the assessment of leach-ate, groundwater and surface water at the landfill MSW Štěpánovice is shown in Figure 4.
Leachate samples (sampling point F) were removed from the surface of the leachate pond. Groundwater samples were collected from sites that were identified in the following manner: A –old well (under the landfill), B – new well (above the landfill) and C – bedrock. Surface water sam-ples were collected from sites: D – stream below
Figure 4. Scheme of sampling points and monitoring wells at MSW landfill Štěpánovice

23
Journal of Ecological Engineering vol. 16(2), 2015
the landfill (less than 2 m from sampling point C – the bedrock) and E – stream above the landfill.
Samples of leachate, groundwater and surface water were taken within time period of 9 years (April 2002 - August 2010). The analyses of the samples were carried out by the company SOM, s.r.o., Mníšek pod Brdy and Health Institute seat-ed in Pilsen, the Center of laboratories Klatovy (accreditation No. 150/2007).
RESULTS AND DISCUSSION
The research was divided into three parts. The specifications of particular parts of the research are described in Table 1.
The obtained values were assessed pursuant to the criteria set forth in the Methodological Guide of the Ministry of Environment of the Czech Republic – „Soil and Groundwater Contamination Criteria“ (1996), according to the Czech National Standard ČSN 75 7221 „Classification of Surface Water Quality)“ and ČSN 75 7111 “Drinking water“.
Monitoring – pH
The course of pH values measured for leach-ate (sample from the surface of the leachate pond) for the reporting period is shown in the chart (Fig-
ure 5). The pH figure ranged from 7.64 to 8.83 pH. The average pH figure was 8.15 – the leach-ate showed alkaline values during the reporting period.
The courses of measured values of pH for groundwater (monitoring wells A, B and sam-pling point C) for the reporting period are shown in the graph (Figure 6).
The pH ranged from 6.07 to 7.76 in ground-water samples at monitoring well A. The average pH value was 7.08 – groundwater showed slightly alkaline values. With regard to sample A, it was not possible to determine the pH value on 1 Sep-tember 2008, since the sample could not be col-lected due to drought.
On 27 December 2002 the pH value could not be determined, because it was impossible to collect the sample as the monitoring well was fro-zen. The pH of the sample from monitoring well B ranged from 6.4 to 7.36. The average pH value was 6.66 - groundwater showed slightly acid values.
The pH of sample C (sampling point) ranged from 6.51 to 7.54. The average pH figure was 6.92 – groundwater at the sampling point showed slightly acid values.
The measured pH values for surface water (sampling points D, E) during the reference pe-riod are shown in the graph (Figure 7).
Table 1. Specification of particular parts of the research
Research Specialization Parameters Period Sampling point
I Leachate waterpH, BOD5 [mg/l], CODCr [mg/l] 4/2002 – 8/2010 F
Conductivity [mS/m] 5/2005 – 8/2010 F
II GroundwaterpH, BOD5 [mg/l], CODCr [mg/l] 4/2002 – 8/2010 A, B, C
Conductivity [mS/m] 5/2005 – 8/2010 A, B, C
III Surface waterpH, BOD5 [mg/l], CODCr [mg/l] 4/2002 – 8/2010 D, E
Conductivity [mS/m] 5/2005 – 8/2010 D, E
Figure 5. pH of leachate – F

Journal of Ecological Engineering vol. 16(2), 2015
24
The pH of sample D ranged from 6.33 to 7.9. The average pH value was 7.09 in groundwater – water showed slightly alkaline values. With re-gard to sample D, it was not possible to deter-mine the pH value on 1 September 2008, since the sample could not be collected due to drought. The pH of sample E ranged from 5.82 to 6.94. The average value was 6.65 – the water showed slightly acid values. On 27 December 2002 the pH of sample E was not determined, because it was impossible to collect the sample as the moni-toring well was frozen.
The measured pH values in the period 2002–2010 at monitoring wells and sampling points A, B, C, D, E, according to the Czech National Stan-dard ČSN 75 7111 „Drinking Water“, approved on 5 January 1989, did not exceed the indicator for the reaction of water – pH 6–8; only samples from sampling point F exceeded these values. Since this is leachate water (water that passed through the BOD5 of the landfill), such a result is expectable.
Monitoring – BOD5
The development of BOD5 values in leachate (sampling from the surface of the leachate pond) within the reporting period is presented in the fol-lowing graph (Figure 8).
BOD5 values ranged from 5.6 – 370 mg/l in leachate collected from the surface of the leach-ate pond (F). The mean value for BOD5 at sam-pling point F was 103.24 mg/l. Sampling point F showed highest BOD5 figures of all sampling sites and monitoring wells.
The course of the BOD5 values in groundwa-ter (monitoring wells A, B and sampling point C) is displayed in the following chart (Figure 9).
The values of BOD5 at monitoring well A ranged in the reporting period from 2.0 to 4.2 mg/l. The average BOD5 value was 2.12 mg/l. With re-gard to sample A, it was not possible to determine the BOD5 value on 1 September 2008, since the sample could not be collected due to drought. On 27 December 2002 the BOD5 value for sample A
Figure 6. pH of groundwater– A, B, C
Figure 7. pH of surface water – D, E

25
Journal of Ecological Engineering vol. 16(2), 2015
was not determined, because it was impossible to collect the sample as the monitoring well was frozen. At monitoring well B the values of BOD5 ranged from 2.2 to 130 mg/l and the mean BOD5 value reached 8.41 mg/l. At sampling point C the BOD5 values ranged from 2.0 to 240 mg/l, while the average figure was 14.87 mg/l.
The Methodological Guide of the Ministry of Environment of the Czech Republic – “Soil and Groundwater Contamination Criteria“ (1996) does not stipulate parameters for BOD5 in ground-water.
The development of BOD5 values in surface water at sampling points D and E is presented in the following graph (Figure 10).
BOD5 values at sampling point D fluctuated in the reporting period from 2.0 to 4.4 mg/l. The mean BOD5 value reached 2.31 mg/l. With regard to sample D, it was not possible to determine the BOD5 value on 1 September 2008, since the sample could not be collected due to drought. At sampling point E the values of BOD5 ranged from
2.0 to 150 mg/l and the average figure was 9.62 mg/l. On 27 December 2002 the BOD5 value for sample E was not determined, because it was im-possible to collect the sample as the monitoring well was frozen.
When comparing the measured parameters for sampling points D and E (surface water) with the parameters set forth in the Czech National Standard ČSN 75 7111 “Classification of Surface Water Quality“, it may be stated that sampling point D – relying on average values - is classi-fied in II Water Quality Class (<4 mg/l). Thus, the water is slightly polluted – surface water condi-tion that has been affected by human activities; however, water quality criteria attain values that enable the existence of a rich, balanced and sus-tainable ecosystem.
Sampling point E is classified according to the measured mean values in IV Water Quality Class (<15 mg/l). That means heavily polluted water – surface water condition that has been af-fected by human activities to such an extent that
Figure 8. BOD5 leachate – F
Figure 9. BOD5 groundwater – A, B, C

Journal of Ecological Engineering vol. 16(2), 2015
26
water quality criteria attain values, which per-mit the existence of an unbalanced ecosystem only. The highest measured figure of BOD5 at the sampling point reached 150 mg/l (26 June 2002). Considering this value the source would belong to V Water Quality Class (> 15 mg/l) – very heavily polluted water, but subsequent monitoring showed stable BOD5 values corre-sponding to II Water Quality Class. The reason for such high values of BOD5 could be the loca-tion of dung near the sampling sites.
Monitoring – CODCr
The course of CODCr values in leachate (sam-pling from the surface of leachate pond) within the reporting period is presented in the following graph (Figure 11).
The CODCr values fluctuated between 387 and 2400 mg/l in leachate collected from the sur-face of the leachate pond. The mean CODCr value was 1299.80 mg/l. CODCr at this sampling point
showed the highest rates of water pollution of all sampling sites and monitoring wells.
The development of the CODCr in groundwa-ter (monitoring wells A,B and sampling point C) is displayed in the following graph (Figure 12).
CODCr values at monitoring well A oscillat-ed in the reporting period between 10 and 19.2 mg/l. The mean value of CODCr reached 11.31 mg/l. With regard to sample A, it was not pos-sible to determine CODCr value on 1 September 2008, since the sample could not be collected due to drought. On 27 December 2002 the CODCr could not be determined, because it was impos-sible to collect the sample as the monitoring well was frozen. Monitoring well B showed CODCr values ranging from 10 to 151 mg/l and the mean CODCr figure was 17.5 mg/l. At sampling point C the CODCr values ranged from 10 to 337 mg/l and the average value was 50.75 mg/l.
The Methodological Guide of the Ministry of Environment of the Czech Republic – „Soil and Groundwater Contamination Criteria“ (1996)
Figure 10. BOD5 surface water – D, E
Figure 11. CODCr leachate – F

27
Journal of Ecological Engineering vol. 16(2), 2015
does not stipulate parameters for CODCr in groundwater.
The development of CODCr values for sur-face water at sampling points D and E is shown in the following graph (Figure 13).
CODCr values at sampling point D in the ref-erence period fluctuated between 10 and 64.5 mg/l. The average CODCr figure reached 16.83 mg/l. With regard to sample D, it was not possible to determine the value of CODCr on 1 Septem-ber 2008, since it could not be sampled due to drought. The CODCr values at sampling point E ranged from 10 to 214 mg/l and the mean value reached 21.7 mg/l. It was not possible to deter-mine the value of CODCr on 27 December 2002, because the sample could not be collected as the sampling point was frozen.
When comparing the measured parameters for sampling points D and E (surface water) with the parameters set forth in the Czech National Stan-dard ČSN 75 7111 “Classification of Surface Wa-
ter Quality“, it may be stated that sampling point D – relying on average values – is classified in II Water Quality Class (<25 mg/l). Thus, the water is slightly polluted – surface water condition that has been affected by human activities; however, water quality criteria attain values that enable the existence of a rich, balanced and sustainable eco-system. The highest measured figure reached 64.5 mg/l (30 August 2010) at this sampling point. Considering this value, the source would belong to V Water Quality Class (> 60 mg/l). The reason for such high values of CODCr could be the agri-cultural intervention near the sampling site.
Sampling point E is classified according to the mean measured values to II Water Quality Class (< 25 mg/l). Thus, the water is slightly polluted – surface water condition that has been affected by human activities; however, water quality criteria attain values that enable the existence of a rich, balanced and sustainable ecosystem. The highest measured value of CODCr at the sampling point
Figure 12. CODCr groundwater – A,B,C
Figure 13. CODCr surface water – D, E

Journal of Ecological Engineering vol. 16(2), 2015
28
reached 214 mg/l (26 June 2012). Considering this figure, the source would belong to V Water Quality Class (> 60 mg / l) – very heavily polluted water, but subsequent monitoring recorded stable CODCr, values corresponding to II Water Quality Class. The reason for such high values of CODCr could be the presence of dung near the sampling site. Higher value (39.9 mg/l), exceeding the pa-rameters of II Water Quality Class was also mea-sured on 30 August 2010. At that moment this source would belong to III Water Quality Class > (45 mg /l) – Polluted water. The reason for higher values of CODCr could be the agricultural activity in the vicinity of the sampling point.
Monitoring – conductivity
Conductivity has been measured at the inves-tigated landfill since 2005. The development of conductivity of leachate (sampling from the sur-face of leachate pond) within the examined period is presented in the following graph (Figure 14).
Conductivity values ranged from 80.2 to 1423.0 mS/m in leachate collected from the sur-face of the leachate pond (F). The mean value at the sampling point F was 944.60 mS/m. Of all sampling sites and monitoring wells this sampling point showed the highest conductivity values.
The course of conductivity in groundwater (monitoring wells A, B and sampling point C) is displayed in the following chart (Figure 15).
Conductivity values at monitoring well A ranged in the reporting period from 15.9 to 47.4 mS/m. The mean conductivity value was 36.26 mS/m. With regard to sample A, it was not pos-sible to determine the conductivity value on 1 September 2008, since it could not be sampled due to drought. At monitoring well B the con-ductivity values fluctuated between 4.8 and 45.1 mS/m and the mean value was 37.49 mS/m. At sampling point C the conductivity values oscil-lated between 38.9 and 349 mS/m, whereas the average value reached 108.23 mS/m.
Figure 14. Conductivity leachate – F
Figure 15. Conductivity groundwater – A, B, C
29
Journal of Ecological Engineering vol. 16(2), 2015
The Methodological Guide of the Ministry of Environment of the Czech Republic – „Soil and Groundwater Contamination Criteria“ (1996) does not stipulate parameters for conductivity in groundwater.
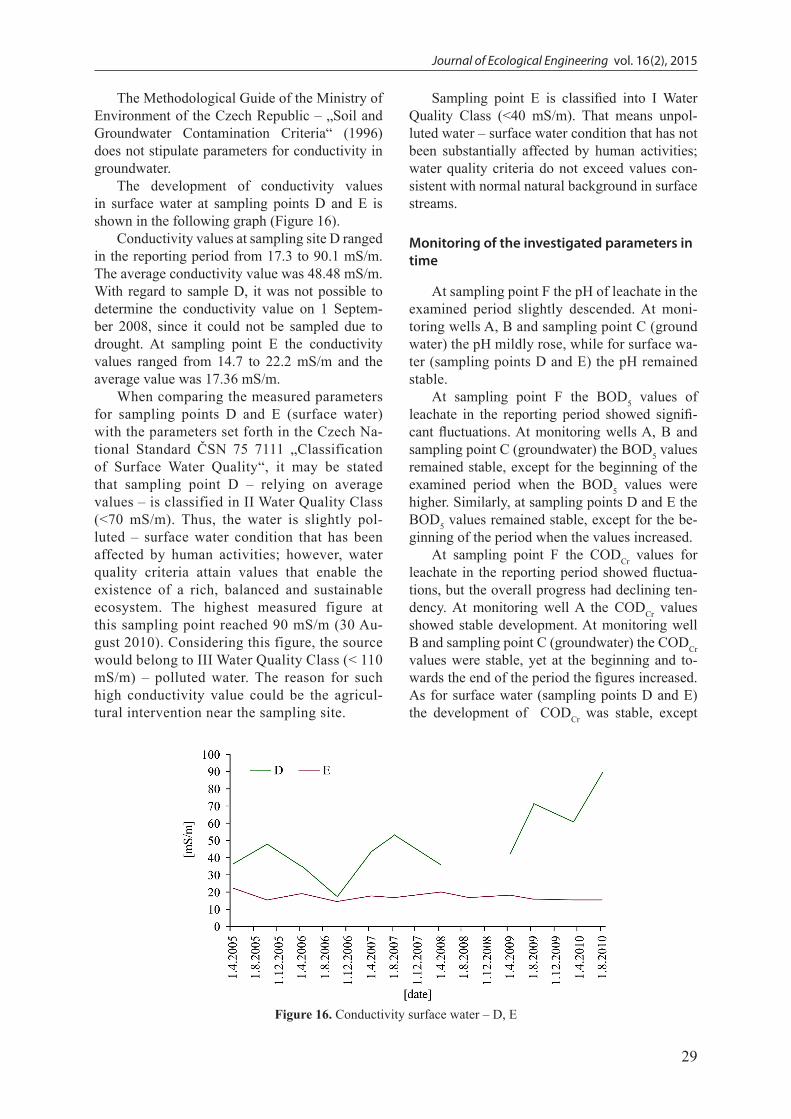
The development of conductivity values in surface water at sampling points D and E is shown in the following graph (Figure 16).
Conductivity values at sampling site D ranged in the reporting period from 17.3 to 90.1 mS/m. The average conductivity value was 48.48 mS/m. With regard to sample D, it was not possible to determine the conductivity value on 1 Septem-ber 2008, since it could not be sampled due to drought. At sampling point E the conductivity values ranged from 14.7 to 22.2 mS/m and the average value was 17.36 mS/m.
When comparing the measured parameters for sampling points D and E (surface water) with the parameters set forth in the Czech Na-tional Standard ČSN 75 7111 „Classification of Surface Water Quality“, it may be stated that sampling point D – relying on average values – is classified in II Water Quality Class (<70 mS/m). Thus, the water is slightly pol-luted – surface water condition that has been affected by human activities; however, water quality criteria attain values that enable the existence of a rich, balanced and sustainable ecosystem. The highest measured figure at this sampling point reached 90 mS/m (30 Au-gust 2010). Considering this figure, the source would belong to III Water Quality Class (< 110 mS/m) – polluted water. The reason for such high conductivity value could be the agricul-tural intervention near the sampling site.
Figure 16. Conductivity surface water – D, E
Sampling point E is classified into I Water Quality Class (<40 mS/m). That means unpol-luted water – surface water condition that has not been substantially affected by human activities; water quality criteria do not exceed values con-sistent with normal natural background in surface streams.
Monitoring of the investigated parameters in time
At sampling point F the pH of leachate in the examined period slightly descended. At moni-toring wells A, B and sampling point C (ground water) the pH mildly rose, while for surface wa-ter (sampling points D and E) the pH remained stable.
At sampling point F the BOD5 values of leachate in the reporting period showed signifi-cant fluctuations. At monitoring wells A, B and sampling point C (groundwater) the BOD5 values remained stable, except for the beginning of the examined period when the BOD5 values were higher. Similarly, at sampling points D and E the BOD5 values remained stable, except for the be-ginning of the period when the values increased.
At sampling point F the CODCr values for leachate in the reporting period showed fluctua-tions, but the overall progress had declining ten-dency. At monitoring well A the CODCr values showed stable development. At monitoring well B and sampling point C (groundwater) the CODCr values were stable, yet at the beginning and to-wards the end of the period the figures increased. As for surface water (sampling points D and E) the development of CODCr was stable, except

Journal of Ecological Engineering vol. 16(2), 2015
30
higher figures at the beginning and at the end of the period.
At sampling point F (leachate) the conduc-tivity showed high values at the beginning of the reporting period, subsequently there was a signif-icant decrease. At monitoring wells for ground-water sampling (A, B) the course of conductivity remained stable, at sampling point C it had in-creasing tendency. At sampling points D and E (surface water) the progress of conductivity was as follows: at sampling point D oscillations were recorded, yet the values tended to increase; at sampling point E the conductivity curve remained stable.
Comparison of selected parameters with other countries
There are shown the range of pH, COD and conductivity values, that were investigated in selected countries [Baun and Christensen 2004] (Tables 2, 3 and 4).
COD values measured at the MSW landfill Štěpánovice reach similar values in Denmark. But the range of specific conductivity values in-dicates lowest values of all examined countries.
Leachate – relying on average values – reached the highest values in all observed pa-rameters. Groundwater samples were collected at two monitoring wells and the sampling site (A, B, C). The Guide of the Ministry of Envi-
ronment does not set forth values for the pa-rameters BOD5, CODCr and conductivity. The pH showed slightly acid values at all sampling points. Samples of surface water were collected from two sampling sites – D and E. The pH of surface water was slightly acid to neutral. BOD5 values were stable over the examined period. Sampling point D belongs to – according to the average values – II Water Quality Class – slightly polluted water and sampling point E to
Table 2. Typical concentrations of pH in landfill leachate [Baun and Christensen, 2004]
Parameter Range Country* Ref.**
pH
4.5–9.0 D a, b
4.5–8.6 DK c, d
4.5–8.2 USA e, f
6.4–8.0 UK g
7.2–8.4 HK h
5.9–7.0 N f
7.8–8.4 F i
5.82–8.83 CZE – MSW Štěpánovice
* D, Germany; DK, Denmark; F, France; HK, Hong Kong; N, The Netherlands; UK, United Kingdom; USA, United States of America; CZE, Czech Re-public.** a Ehrig [1988], bEhrig [1983], c Kjeldsen and Chris-tophersen [2001], dJørgensen and Kjeldsen [1995], eKrug and Ham [1997], fJohansen and Carlson [1976], g Rabinson [1995], hCh et al.[1994], iClement and Thomas [1995]
Table 3. Typical concentrations of COD in landfill leachate [Baun and Christensen, 2004]
Parameter Range Country* Ref.**
CHSK
500–60 000 D a,b
16–2300 DK c,d
50–62 000 USA e,f
<10–33 700 UK g
147–1670 HK h
110–9425 N f
400–8000 F i
10–2400 CZE – MSW Štěpánovice
* D, Germany; DK, Denmark; F, France; HK, Hong Kong; N, The Netherlands; UK, United Kingdom; USA, United States of America; CZE, Czech Re-public.** a Ehrig[1988], bEhrig [1983], c Kjeldsen and Chris-tophersen [2001], dJørgensen and Kjeldsen [1995], eKrug and Ham [1997], fJohansen and Carlson [1976], g Rabinson [1995], hCh et al.[1994], iClement and Thomas [1995]
Table 4. Typical concentrations of specific conductiv-ity in landfill leachate [Baun and Christensen, 2004]
Parameter Range Country* Ref.**
Specific conductivity
(μS/cm)
190–8900 DK c,d
50–35 000 USA e
503–18 400 UK g
2500–12 000 HK h
655–3380 N f
5000–18 200 F i
4.8–1423 CZE – MSW Štěpánovice
* D, Germany; DK, Denmark; F, France; HK, Hong Kong; N, The Netherlands; UK, United Kingdom; USA, United States of America; CZE, Czech Re-public.** a Ehrig[1988], bEhrig [1983], c Kjeldsen and Chris-tophersen [2001], dJørgensen and Kjeldsen [1995], eKrug and Ham [1997], fJohansen and Carlson [1976], g Rabinson [1995], hCh et al.[1994], iClement and Thomas [1995]

31
Journal of Ecological Engineering vol. 16(2), 2015
IV Water Quality Class – heavily polluted wa-ter. CODCr values remained stable over the re-porting period. Sampling point D belongs to II Water Quality Class – slightly polluted water, as well as sampling point E. The average con-ductivity value at sampling points D and E in the reporting period remained constant. In line with the Czech National Standard ČSN 75 7221 “Classification of Surface Water Quality“ sam-pling point D belongs to II Water Quality Class – slightly polluted water and sampling site E to Class I water quality – unpolluted water.
The authors believe that the fluctuations oc-curring with regard to the values of certain sam-ples at the sampling points were not caused by the operation of the landfill itself, but rather were a result of the intense agricultural activity nearby the landfill.
Together with standard monitoring, biologi-cal monitoring with the use of bioindicators has been taking place in the surroundings of MSW landfill Štěpánovice since 2007 up to nowadays (still ongoing). Within the monitoring protected species have been found and identified, such as e.g. Epipactis helleborine, Juniperus commu-nis, Polygala chamaebuxus. Also lichens e.g. Cladonia arbuscula, Hypogymnia physodes and Xanthoria parietina have been recorded.
In the rainwater reservoir (Figure 3) the oc-currence of Triturus vulgaris was recorded. It is necessary to mention that its occurrence may reflect correct operation of the landfill consider-ing the sensitivity of Triturus vulgaris to the en-vironment. This species is legally protected and in accordance with the Regulation No. 395/1992 Coll. belongs to highly endangered species. Its presence in the rainwater reservoir water proves clarity of this water and shows that no contami-nation of water by leachate from the landfill or from drained water tank takes place.
CONCLUSION
The landfill leachate pollution reached the high values in observed parameters: pH, BOD5, CODCr and conductivity. In line with the Czech “Classification of Surface Water Quality“ sam-pling point belongs to Class II – slightly pollut-ed water, and to Class I – unpolluted water. The fluctuations occurring with regard to the values of certain samples were a result of the intense ag-ricultural activity nearby the landfill.
Acknowledgement
This study was supported by the city of Klatovy and the Technical Services of the city of Klatovy. We would like to express our great appreciation to the management of the landfill Štěpánovice. Namely, we are very grateful to Ing. Vladimír Král, Ph.D. and his colleagues for their assistance and their willingness to provide their time so generously.
REFERENCES
1. Baun D.L., Christensen T.H. 2004. Speciation of heavy metals in landfill leachate: a review. Waste Management and Research 22, 3–23.
2. Bagchi A. 1994. Design, construction, and moni-toring of landfill. Willey, Canada.
3. Bila D.M., Montava˜o A.F., Silva, A.C., Dezotti M. 2005. Ozonation of a landfill leachate: evaluation of toxicity removal and biodegradability improvement. Journal of Hazardous Materials 117, 235–242.
4. Buket Yenigu N., Elfeki A.M.M., Gehrels J.C., van den Akker C., Hensbergen A.T., Dekking F.M. 2005. Reliability assessment of groundwater moni-toring networks at landfill sites. Journal of Hydrol-ogy 308, 1–17
5. El-Fadel M., Bou-Zeid E., Chahine W. and Alayli B. 2002. Temporal variation of leachate quality from pre-stored and baled municipal solid waste with high organic and moisture content. Waste management 22, 269–282.
6. Godson R.H., Moore J. 1995. Subtitle D Ground-water monitoring statistics at a Greenfield Landfill Site in Alabama. In: Tappi International Environ-mental Conference; 909 International environmen-tal conference International Environmental Con-ference Proceeding, 1995, pp. 909–915. Technical Association of the Pulp and Paper Industry.
7. Heron G., Bjerg P.L., Gravesen P., Ludvigsen L. and Christensen T.H. 1998. Geology and sediment geochemistry of a landfill leachate contaminated aquifer (Grinsted, Denmark). Journal of Contami-nant Hydrology 29, 301–317.
8. Kerndorff H., Schleyer R., Milde G. and Plumb R.H. 1992. Geochemistry of groundwater pollut-ants at German waste disposal sites, in: Lesage, S., Jackson, R.E. (Eds.), Groundwater Contamination and Analysis at Hazardous Waste Sites. pp. 245–272. Marcel Dekker, New York 1992.
9. Kulikowska D., Klimiuk E. 2008. The effect of landfill age on municipal leachate composition. Bioresource Technology 99, 5981–5985.
10. Kurniawan T.A., Lo W.-H. and Chan, G.Y.S. 2006. Degradation of recalcitrant compounds from sta-
Journal of Ecological Engineering vol. 16(2), 2015
32
bilized landfill leachate using a combination of ozone-GAC adsorption treatment. Journal of Haz-ardous Materials 137, 433–455.
11. Laitinen N., Luonsi A. and Vilen J. 2006. Landfill leachate treatment with sequencing batch reactor and membrane bioreactor. Desalination 191, 86–91.
12. Lee G.F., Jones-Lee A. 1993. A groundwater pro-tection strategy for lined landfills. Environmental Science and Technology 28, 584A–585A.
13. Lo I.M.-C. 1996. Characteristics and treatment of leachates from domestic landfills. Environment In-ternational 22, 433–442.
14. Massing H. 1994. Impacts of leakage from urban solid waste deposits on groundwater quality. Water Science and Technology 29, 239–244.
15. Mato R.R.A.M. 1999. Environmental implications involving the establishment of sanitary landfills in five municipalities in Tanzania: the case of Tanga municipality. Resources, Conservation and Recy-cling 25, 1–16.
16. Mikac N., Cosovic B., Ahel S.A. and Toncic Z. 1998. Assessment of groundwater contamination
in the vicinity of a municipal waste landfill (Za-greb, Croatia). Water Science and Technology 37, 37–44.
17. Riediker S., Suter J.F.M. and Giger W. 2000. Benzene and naphthalene sulfonates in leachates and plumes of landfills. Water Resources 34, 2069–2079.
18. Salem Y., Hamouri K., Djemaa R. and Alois K. 2008. Evaluation of landfill leachate pollution and treatment. Desalination 220, 108–114.
19. Statom R.A., Thyne G.D. and McCray J.E. 2004. Temporal changes in leachate chemistry of munici-pal solid waste landfill cell in Florida, USA. Envi-ronmental Geology 45, 982–991.
20. Vaverková M., Adamcová D. 2014. Can vegetation indicate a municipal solid waste landfill’s impact on the environment? Polish Journal of Environ-mental Studies 23(2), 501–509.
21. Wu J.J., Wu Ch-Ch., Ma H.-W. and Chang Ch-Cha. 2004. Treatment of landfill leachate by ozone-based advanced oxidation processes. Chemosphere 54, 997–1003.