evaluation of mercury emissions from coal-fired facilities ......
TRANSCRIPT
EVALUATION OF MERCURY EMISSIONS FROM COAL-FIRED FACILITIES WITH SCR AND FGD SYSTEMS
Topical Report No. 1
U.S. DOE NETL Cooperative Agreement DE-FC26-02NT41589
Issued: May 2004
J. A. Withum S. C. Tseng J. E. Locke
CONSOL Energy Inc., Research & Development
4000 Brownsville Rd. South Park, PA 15129
(412) 854-6600
DISCLAIMER
This report was prepared as an account of work sponsored by an agency of the United States Government. Neither the United States Government nor any agency thereof, nor any of their employees, makes any warranty, express or implied, or assumes any legal liability or responsibility for the accuracy, completeness, or usefulness of any information, apparatus, product, or process disclosed, or represents that its use would not infringe privately owned rights. Reference herein to any specific commercial product, process, or service by trade name, trademark, manufacturer, or otherwise does not necessarily constitute or imply its endorsement, recommendation, or favoring by the United States Government or any agency thereof. The views and opinions of authors expressed herein do not necessarily state or reflect those of the United States Government or any agency thereof.
ABSTRACT CONSOL Energy Inc., Research & Development (CONSOL), with support from the U.S. Department of Energy, National Energy Technology Laboratory (DOE) is evaluating the effects of selective catalytic reduction (SCR) on mercury (Hg) capture in coal-fired plants equipped with an electrostatic precipitator (ESP) - wet flue gas desulfurization (FGD) combination or a spray dyer absorber – fabric filter (SDA-FF) combination. In this program CONSOL is determining mercury speciation and removal at 10 coal-fired facilities. The objectives are 1) to evaluate the effect of SCR on mercury capture in the ESP-FGD and SDA-FF combinations at coal-fired power plants, 2) evaluate the effect of catalyst degradation on mercury capture; 3) evaluate the effect of low load operation on mercury capture in an SCR-FGD system, and 4) collect data that could provide the basis for fundamental scientific insights into the nature of mercury chemistry in flue gas, the catalytic effect of SCR systems on Hg speciation and the efficacy of different FGD technologies for Hg capture. This document, the first in a series of topical reports, describes the results and analysis of mercury sampling performed on a 684 MW unit burning a bituminous coal containing 4.7% sulfur; the unit is equipped with a plate-type SCR catalyst for NOx control and a forced-oxidation, wet lime FGD scrubber for SO2 control. Four sampling tests were performed in August 2003. Flue gas mercury speciation and concentrations were determined at the SCR inlet, air heater outlet (ESP inlet), and at the stack (FGD outlet) using the Ontario Hydro method. Process stream samples for a mercury balance were collected to coincide with the flue gas measurements. The results showed that the SCR/air heater combination oxidized nearly 90% of the elemental mercury. Mercury removal, on a coal-to-stack basis, was 72%; however, at this plant, 15% of the flue gas was by-passed around the FGD scrubber because of the scrubber’s limited capacity. In the scrubber alone, the removal was calculated to be 84%. The mercury material balances were 106% to 119%, with an average of 110%. These results appear to show that the SCR had a positive effect on mercury removal in the wet FGD system. In earlier programs, CONSOL sampled mercury at six plants with wet FGDs for SO2 control without SCR catalysts. At those plants, an average of 61±15% of the mercury was in the oxidized form at the air heater outlet, and the average mercury removal was 66±8%. The principal purpose of this work is to develop a better understanding of the potential Hg removal "co-benefits" achieved by NOx, and SO2 control technologies. It is expected that this data will provide the basis for fundamental scientific insights into the nature of Hg chemistry in flue gas, the catalytic effect of SCR systems on Hg speciation and the efficacy of different FGD technologies for Hg capture. Ultimately, this insight could help to design and operate SCR and FGD systems to maximize Hg removal.
I

TABLE OF CONTENTS
Page ABSTRACT ...................................................................................................................... I TABLE OF CONTENTS ................................................................................................... i LIST OF ABBREVIATIONS.............................................................................................iv INTRODUCTION............................................................................................................. 1 HOST UTILITY DESCRIPTION ...................................................................................... 1 MERCURY SAMPLING RESULTS ................................................................................. 1 I. Test Matrix .................................................................................................................. 1 II. Flue Gas Mercury Sampling Results .......................................................................... 2
A. SCR Inlet......................................................................................................... 2 B. Air Heater Outlet ............................................................................................. 3 C. Stack............................................................................................................... 4
III. Mercury Material Balance.......................................................................................... 5 IV. SCR/FGD System Hg Removal ................................................................................ 6 V. Comparison of Results with Plants without SCR........................................................ 6 I. Flue Gas Sampling Locations and Sampling Points.................................................... 7
A. SCR Inlet......................................................................................................... 7 B. Air Heater Outlet (ESP Inlet) ........................................................................... 7 C. Stack (FGD Outlet) ......................................................................................... 7
II. Flue Gas Sampling Procedures.................................................................................. 7 A. SCR Inlet......................................................................................................... 8 B. Air Heater Outlet ............................................................................................. 8 C. Stack............................................................................................................... 9
III. Ontario Hydro Flue Gas Hg Measurement Method ................................................... 9 IV. Coal Sampling and Analysis ................................................................................... 10 V. Process Sample Collection and Analysis................................................................. 12
A. Lime Slurry .................................................................................................... 12 B. Gypsum Plant Return Water Samples .......................................................... 15 C. Scrubber Blowdown Slurry............................................................................ 16 D. Bottom Ash Samples .................................................................................... 19 E. ESP Hopper Ash ........................................................................................... 20
QUALITY ASSURANCE/QUALITY CONTROL............................................................. 23 Blank Samples .............................................................................................................. 23 NIST SRM Checks ........................................................................................................ 24 Spike Sample Recoveries ............................................................................................. 24 Duplicate Analyses........................................................................................................ 24 Flue Gas Hg Concentration Detection Limits ................................................................ 24 Mercury Material Balance Calculation Method .............................................................. 25
i
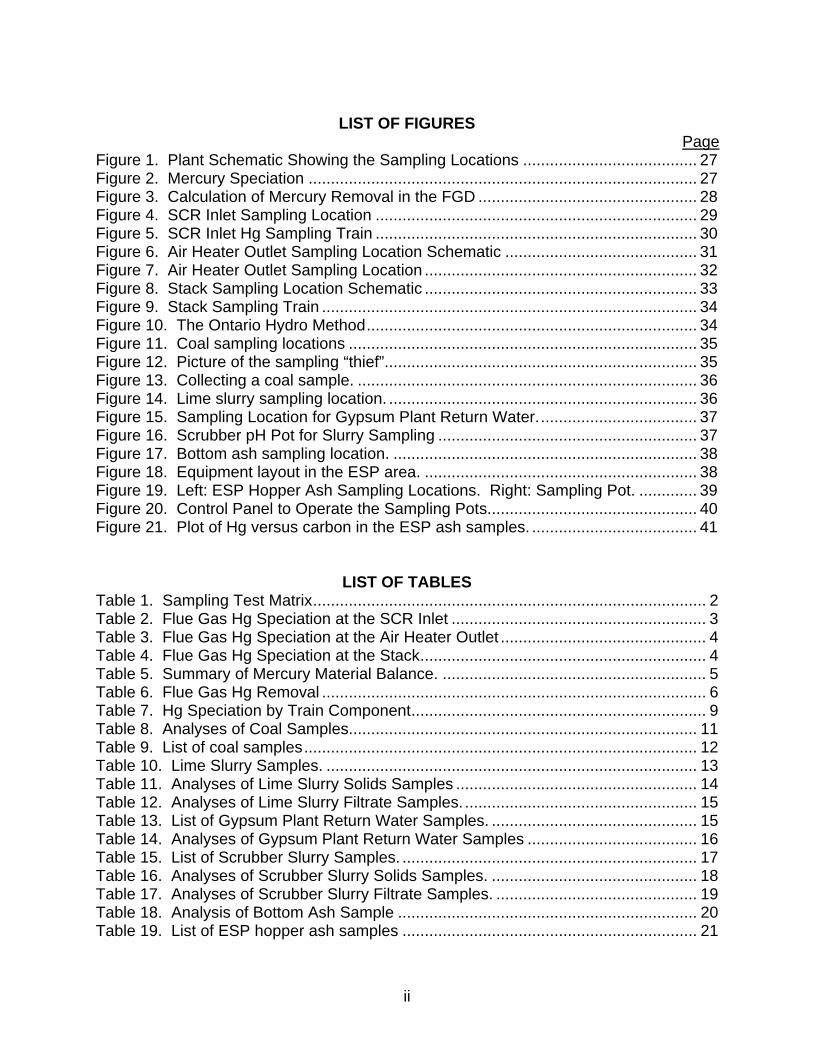
LIST OF FIGURES
PageFigure 1. Plant Schematic Showing the Sampling Locations ....................................... 27 Figure 2. Mercury Speciation ....................................................................................... 27 Figure 3. Calculation of Mercury Removal in the FGD ................................................. 28 Figure 4. SCR Inlet Sampling Location ........................................................................ 29 Figure 5. SCR Inlet Hg Sampling Train ........................................................................ 30 Figure 6. Air Heater Outlet Sampling Location Schematic ........................................... 31 Figure 7. Air Heater Outlet Sampling Location ............................................................. 32 Figure 8. Stack Sampling Location Schematic ............................................................. 33 Figure 9. Stack Sampling Train .................................................................................... 34 Figure 10. The Ontario Hydro Method.......................................................................... 34 Figure 11. Coal sampling locations .............................................................................. 35 Figure 12. Picture of the sampling “thief”...................................................................... 35 Figure 13. Collecting a coal sample. ............................................................................ 36 Figure 14. Lime slurry sampling location. ..................................................................... 36 Figure 15. Sampling Location for Gypsum Plant Return Water.................................... 37 Figure 16. Scrubber pH Pot for Slurry Sampling .......................................................... 37 Figure 17. Bottom ash sampling location. .................................................................... 38 Figure 18. Equipment layout in the ESP area. ............................................................. 38 Figure 19. Left: ESP Hopper Ash Sampling Locations. Right: Sampling Pot. ............. 39 Figure 20. Control Panel to Operate the Sampling Pots............................................... 40 Figure 21. Plot of Hg versus carbon in the ESP ash samples. ..................................... 41
LIST OF TABLES
Table 1. Sampling Test Matrix........................................................................................ 2 Table 2. Flue Gas Hg Speciation at the SCR Inlet ......................................................... 3 Table 3. Flue Gas Hg Speciation at the Air Heater Outlet .............................................. 4 Table 4. Flue Gas Hg Speciation at the Stack................................................................ 4 Table 5. Summary of Mercury Material Balance. ........................................................... 5 Table 6. Flue Gas Hg Removal ...................................................................................... 6 Table 7. Hg Speciation by Train Component.................................................................. 9 Table 8. Analyses of Coal Samples.............................................................................. 11 Table 9. List of coal samples........................................................................................ 12 Table 10. Lime Slurry Samples. ................................................................................... 13 Table 11. Analyses of Lime Slurry Solids Samples ...................................................... 14 Table 12. Analyses of Lime Slurry Filtrate Samples. .................................................... 15 Table 13. List of Gypsum Plant Return Water Samples. .............................................. 15 Table 14. Analyses of Gypsum Plant Return Water Samples ...................................... 16 Table 15. List of Scrubber Slurry Samples. .................................................................. 17 Table 16. Analyses of Scrubber Slurry Solids Samples. .............................................. 18 Table 17. Analyses of Scrubber Slurry Filtrate Samples. ............................................. 19 Table 18. Analysis of Bottom Ash Sample ................................................................... 20 Table 19. List of ESP hopper ash samples .................................................................. 21
ii

Table 20. Analyses of ESP Hopper Ash Samples........................................................ 22 Table 21. NIST SRM Analyses..................................................................................... 24 Table 22. Flue Gas Hg Detection Limits....................................................................... 25
LIST OF APPENDICES
APPENDIX A Flue Gas Hg Data ........................................................................A-1 APPENDIX B Process Material Data..................................................................B-1 APPENDIX C Mercury Sampling Data............................................................... C-1 APPENDIX D Plant Process Data ..................................................................... D-1
iii
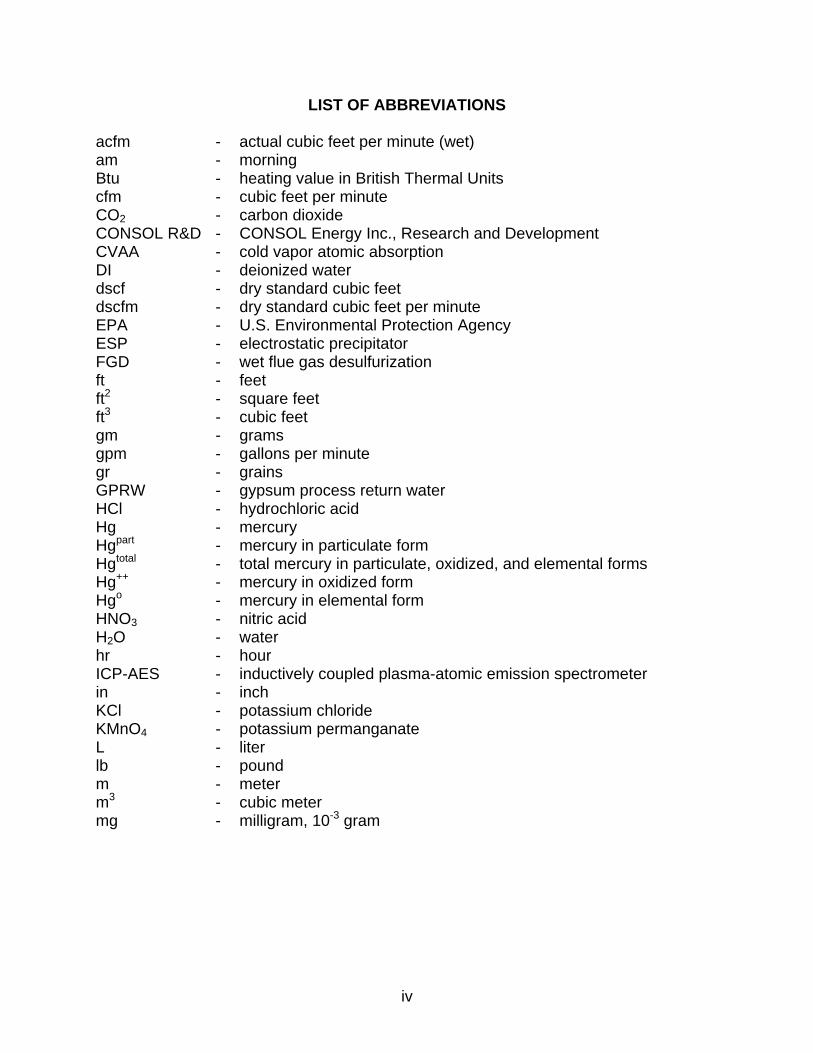
LIST OF ABBREVIATIONS acfm - actual cubic feet per minute (wet) am - morning Btu - heating value in British Thermal Units cfm - cubic feet per minute CO2 - carbon dioxide CONSOL R&D - CONSOL Energy Inc., Research and Development CVAA - cold vapor atomic absorption DI - deionized water dscf - dry standard cubic feet dscfm - dry standard cubic feet per minute EPA - U.S. Environmental Protection Agency ESP - electrostatic precipitator FGD - wet flue gas desulfurization ft - feet ft2 - square feet ft3 - cubic feet gm - grams gpm - gallons per minute gr - grains GPRW - gypsum process return water HCl - hydrochloric acid Hg - mercury Hgpart - mercury in particulate form Hgtotal - total mercury in particulate, oxidized, and elemental forms Hg++ - mercury in oxidized form Hgo - mercury in elemental form HNO3 - nitric acid H2O - water hr - hour ICP-AES - inductively coupled plasma-atomic emission spectrometer in - inch KCl - potassium chloride KMnO4 - potassium permanganate L - liter lb - pound m - meter m3 - cubic meter mg - milligram, 10-3 gram
iv
LIST OF ABBREVIATIONS (continued) min - minute mL - milliliter M - molar, mol/L MM - million mol - mole ng - nanogram, 10-9 gram N2 - molecular nitrogen NIST - National Institute of Standards and Technology NO - nitric oxide NO2 - nitrogen dioxide O2 - molecular oxygen O3 - ozone pm - afternoon PM - particulate matter ppb - parts per billion ppm - parts per million ppmv - parts per million by volume PRSD - percent relative standard deviation QA - quality assurance QC - quality control rpm - revolutions per minute scf - standard cubic feet (68 °F and 29.92"Hg) scfm - standard cubic feet per minute SCR - Selective Catalytic Reduction SRM - Standard Reference Material temp - temperature tph - tons per hour wt - weight V - volts vs - versus °F - temperature in degrees Fahrenheit ~ - approximately < - less than > - more than µg - microgram, 10-6 gram
v
INTRODUCTION
The CONSOL Energy Inc. Research and Development (CONSOL R&D) Exploratory and Environmental Research Group conducted a series of flue gas mercury (Hg), measurements during the week of August 18, 2003, under U. S. Department of Energy (DOE) Cooperative Agreement No. DE-FC26-02NT41589. The test program consisted of four sets of measurements across the combustion emission control system that consists of a selective catalytic reduction (SCR) unit, electrostatic precipitator (ESP), and magnesium-enhanced lime-based flue gas desulfurization (FGD).
The Hg measurements were made using the Ontario-Hydro Flue Gas Hg Speciation Method at the SCR inlet, Air Heater Outlet (upstream of the ESP), and the Stack. The test methods and results are documented in this report.
HOST UTILITY DESCRIPTION The facility consists of two identical power generation units. Each unit consists of an opposed-wall, coal-fired boiler-generator rated at 684 MW output, with a cold-side ESP for particulate matter control. The plant typically burns high sulfur Pittsburgh seam coal. Each unit has a four-module magnesium-enhanced lime-based, wet FGD scrubber to control SO2 emissions. In 2000, an ex-situ oxidation process was installed to produce wallboard grade gypsum, with dissolved magnesium ions in the oxidized liquor recovered as magnesium hydroxide. During normal operation, about 15% of the flue gas bypasses the FGD due to FGD scrubber capacity limitation. In 2003, plate-type SCR catalysts were installed for NOx emissions control; the SCR is operated during the ozone season only.
MERCURY SAMPLING RESULTS I. Test Matrix
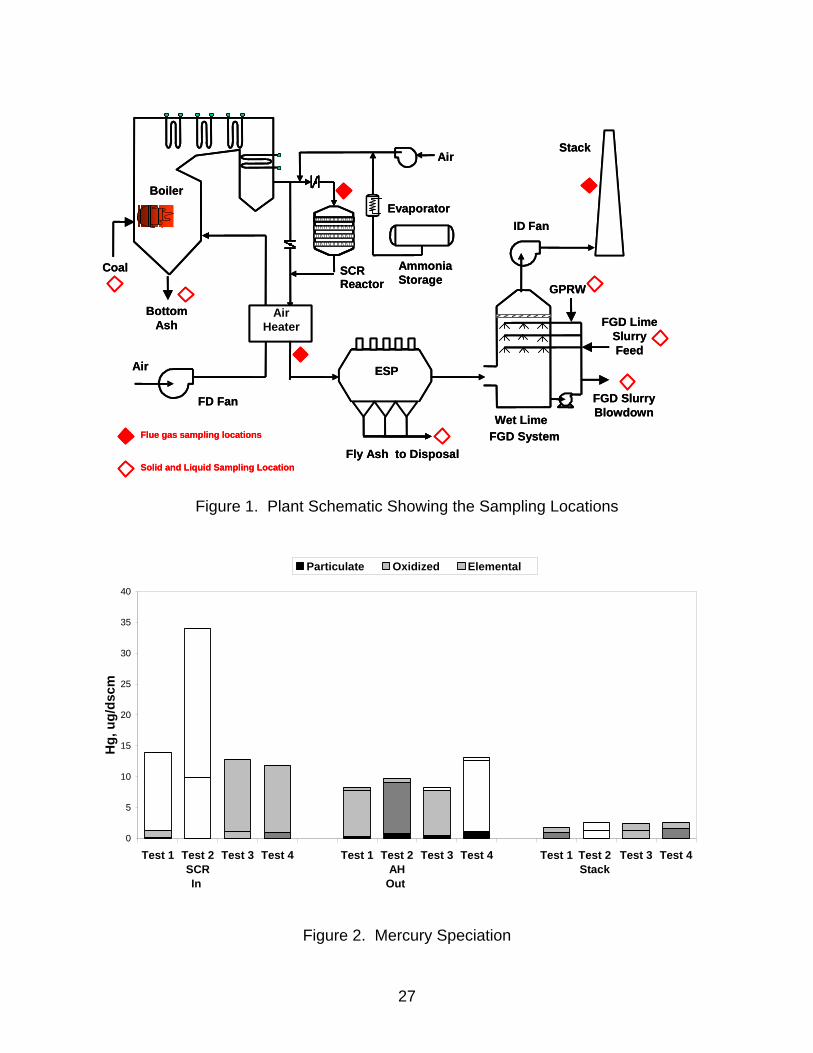
All tests were performed on Unit #1 at this facility. The Hg measurements consisted of a total of four tests over three days. The ASTM Method D-6784-02 (Ontario Hydro Method) was used to measure the concentration and speciation of mercury in the flue gas at three locations: the SCR inlet, the air heater outlet, and the stack. Solid and liquid process samples were obtained during the gas sampling periods to calculate a material balance. A schematic showing the sampling locations is in Figure 1. Laboratory analyses were performed by CONSOL R&D and are included in this report. A total of 12 Hg measurements were conducted over three testing days. Details of sampling conditions are provided later in this report. The test matrix is shown in Table 1.
1
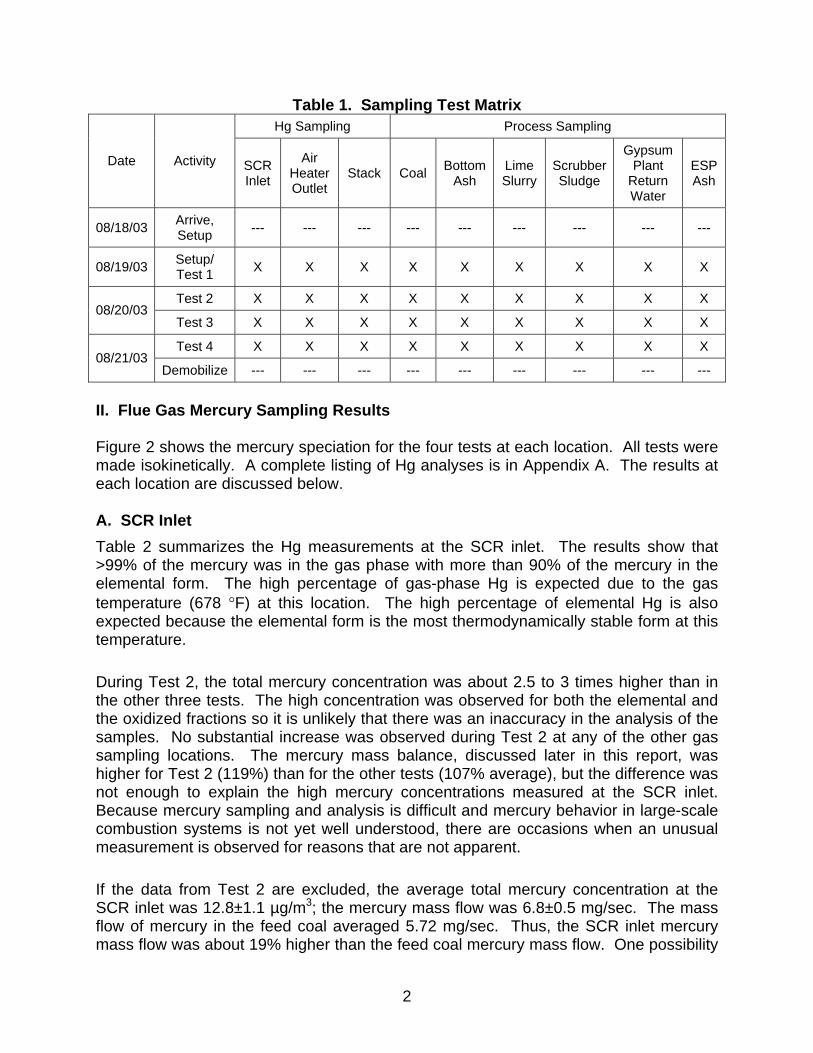
Table 1. Sampling Test Matrix Hg Sampling Process Sampling
Date Activity SCR Inlet
Air Heater Outlet
Stack Coal Bottom Ash
Lime Slurry
Scrubber Sludge
Gypsum Plant
Return Water
ESP Ash
08/18/03 Arrive, Setup --- --- --- --- --- --- --- --- ---
08/19/03 Setup/ Test 1 X X X X X X X X X
Test 2 X X X X X X X X X 08/20/03
Test 3 X X X X X X X X X
Test 4 X X X X X X X X X 08/21/03
Demobilize --- --- --- --- --- --- --- --- ---
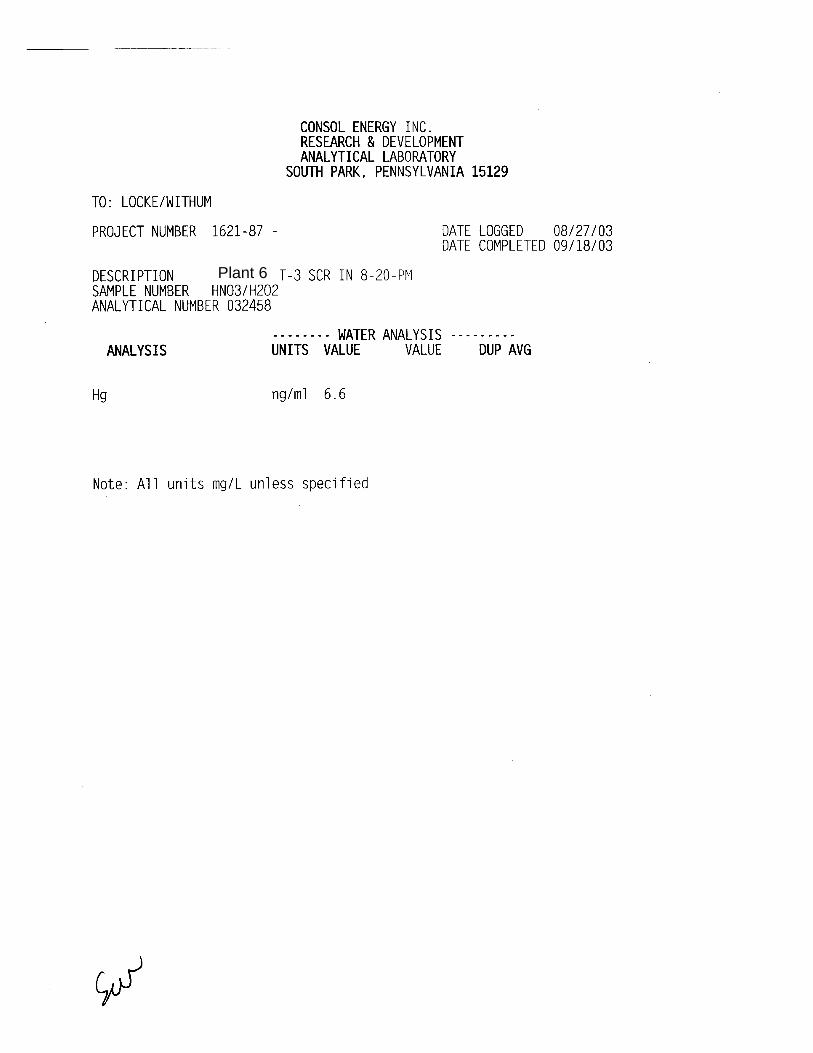
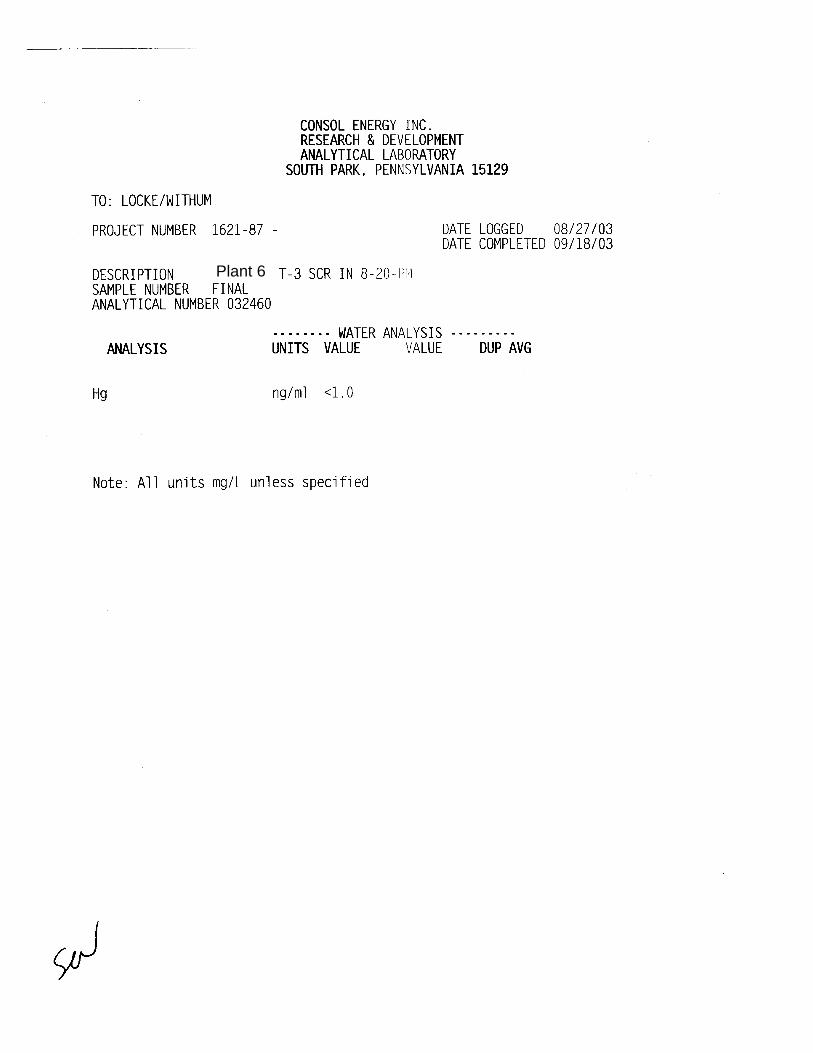
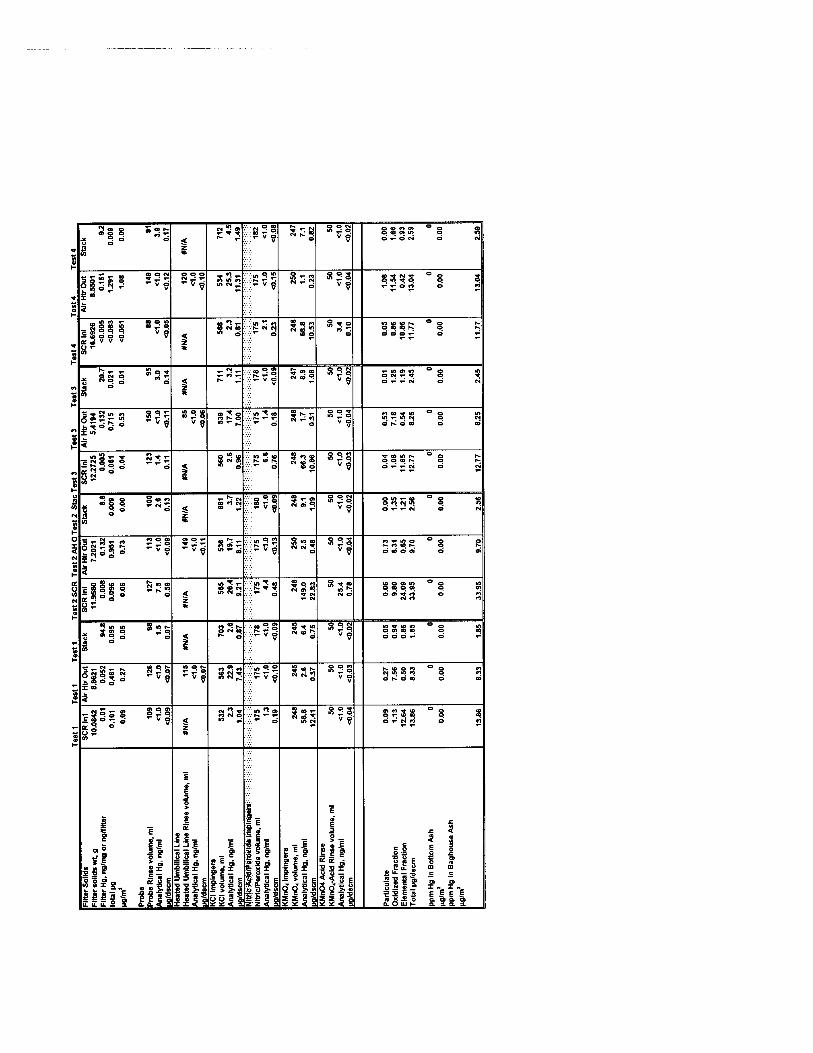
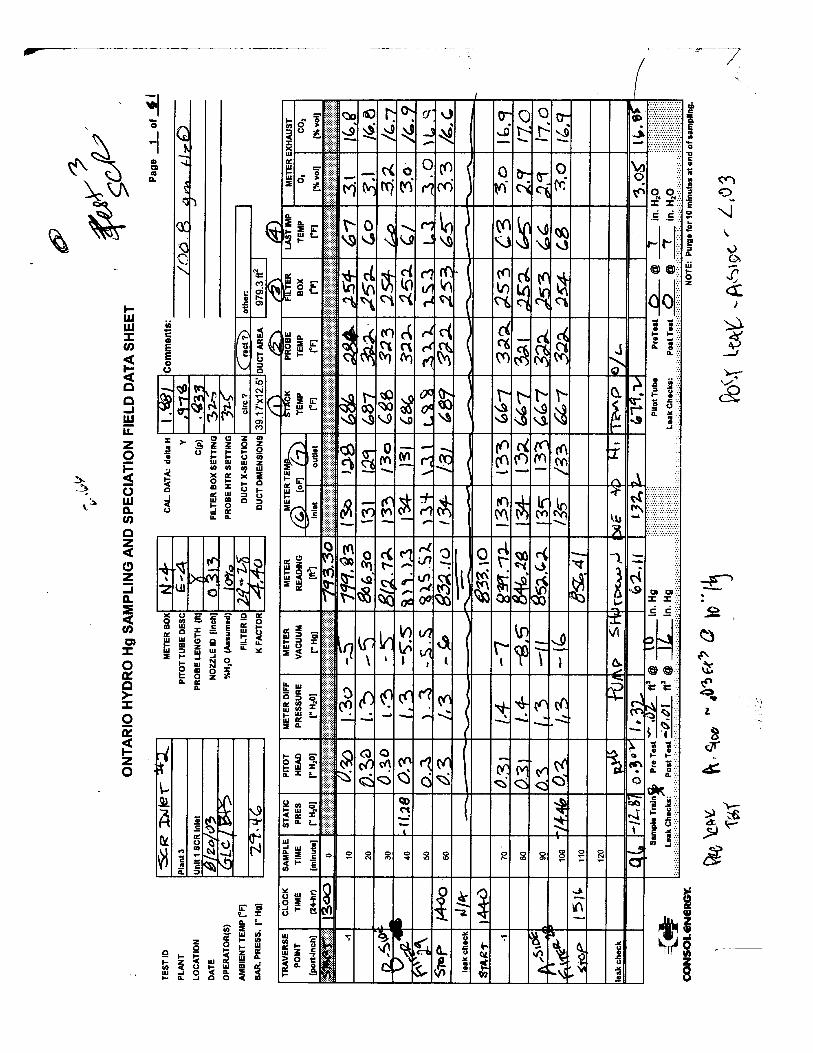
II. Flue Gas Mercury Sampling Results Figure 2 shows the mercury speciation for the four tests at each location. All tests were made isokinetically. A complete listing of Hg analyses is in Appendix A. The results at each location are discussed below. A. SCR Inlet Table 2 summarizes the Hg measurements at the SCR inlet. The results show that >99% of the mercury was in the gas phase with more than 90% of the mercury in the elemental form. The high percentage of gas-phase Hg is expected due to the gas temperature (678 °F) at this location. The high percentage of elemental Hg is also expected because the elemental form is the most thermodynamically stable form at this temperature.
During Test 2, the total mercury concentration was about 2.5 to 3 times higher than in the other three tests. The high concentration was observed for both the elemental and the oxidized fractions so it is unlikely that there was an inaccuracy in the analysis of the samples. No substantial increase was observed during Test 2 at any of the other gas sampling locations. The mercury mass balance, discussed later in this report, was higher for Test 2 (119%) than for the other tests (107% average), but the difference was not enough to explain the high mercury concentrations measured at the SCR inlet. Because mercury sampling and analysis is difficult and mercury behavior in large-scale combustion systems is not yet well understood, there are occasions when an unusual measurement is observed for reasons that are not apparent.
If the data from Test 2 are excluded, the average total mercury concentration at the SCR inlet was 12.8±1.1 µg/m3; the mercury mass flow was 6.8±0.5 mg/sec. The mass flow of mercury in the feed coal averaged 5.72 mg/sec. Thus, the SCR inlet mercury mass flow was about 19% higher than the feed coal mercury mass flow. One possibility
2
is that some of the mercury is transferred from the flue gas to the combustion air in the air heater; CONSOL observed this in two different power plants burning different coals, where mercury concentrations of 0.25 to 2 µg/m3 were measured in the combustion air exiting the air heater.1 A steady-state recycling of mercury to the boiler would increase the mercury content of the flue gas upstream of the air heater.
Table 2. Flue Gas Hg Speciation at the SCR Inlet Hg Concentration, µg/m3
(dry std conditions) Hg Flow, mg/sec Date Test Hgpart Hg++ Hg0 Hgtotal Hgpart Hg++ Hg0 Hgtotal
08/19/03 1 0.09 1.13 12.64 13.86 0.05 0.60 6.70 7.35 08/20/03 2 0.06 9.80 24.09 33.95 0.03 5.27 12.94 18.24 08/20/03 3 0.04 1.08 11.65 12.77 0.02 0.57 6.15 6.74 08/21/03 4 0.05 0.86 10.86 11.77 0.01 0.46 5.84 6.33
Average Standard Deviation
PRSD
0.06 0.02 36.0
3.22 4.39
136.4
14.81 6.23 42.1
18.09 10.61 58.7
0.03 0.01 32.3
1.72 2.36
137.0
7.91 3.37 42.7
9.66 5.73 59.3
Average of Tests 1, 3, and 4
Standard Deviation PRSD
0.06 0.02 39.9
1.02 0.14 14.1
11.72 0.90 7.6
12.80 1.05 8.2
0.03 0.01 39.6
0.54 0.07 13.3
6.23 0.44 7.0
6.80 0.51 7.5
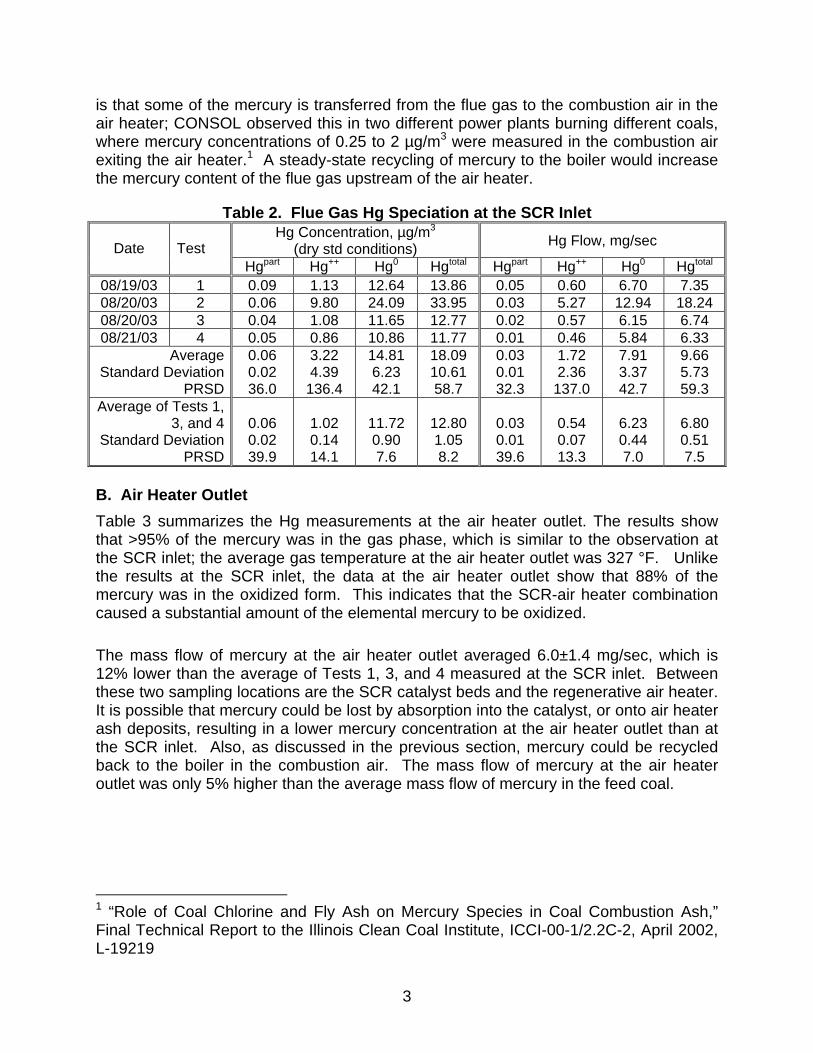
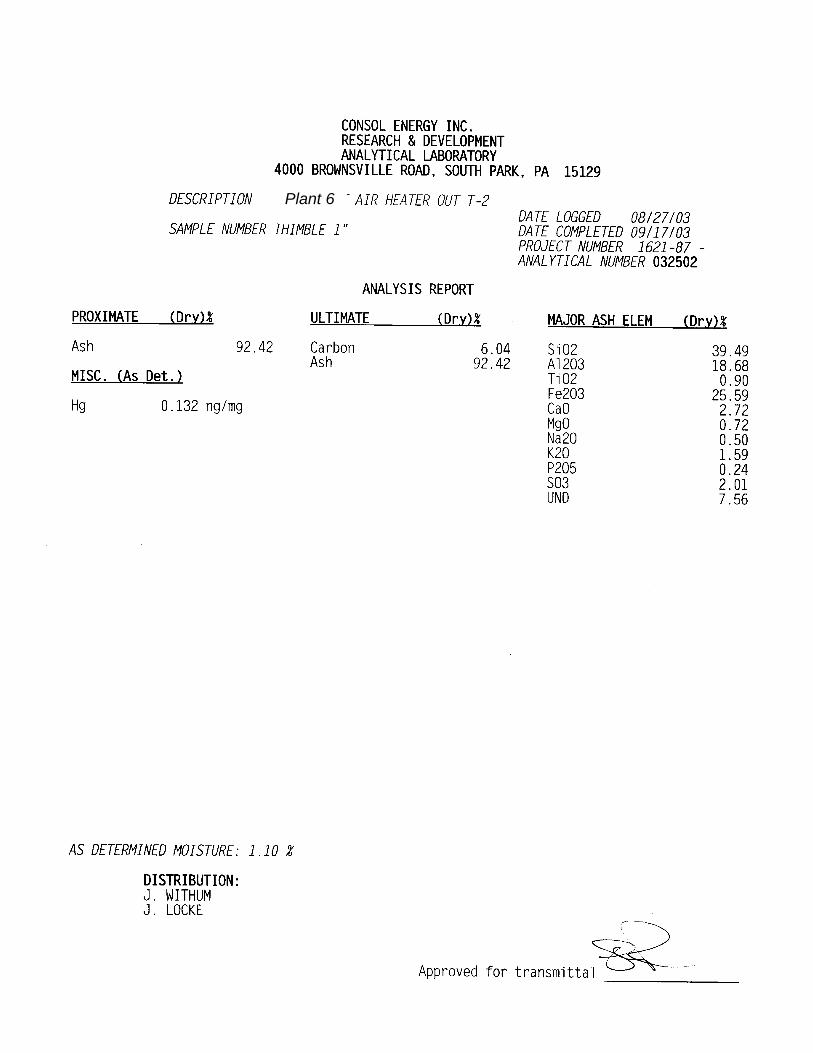
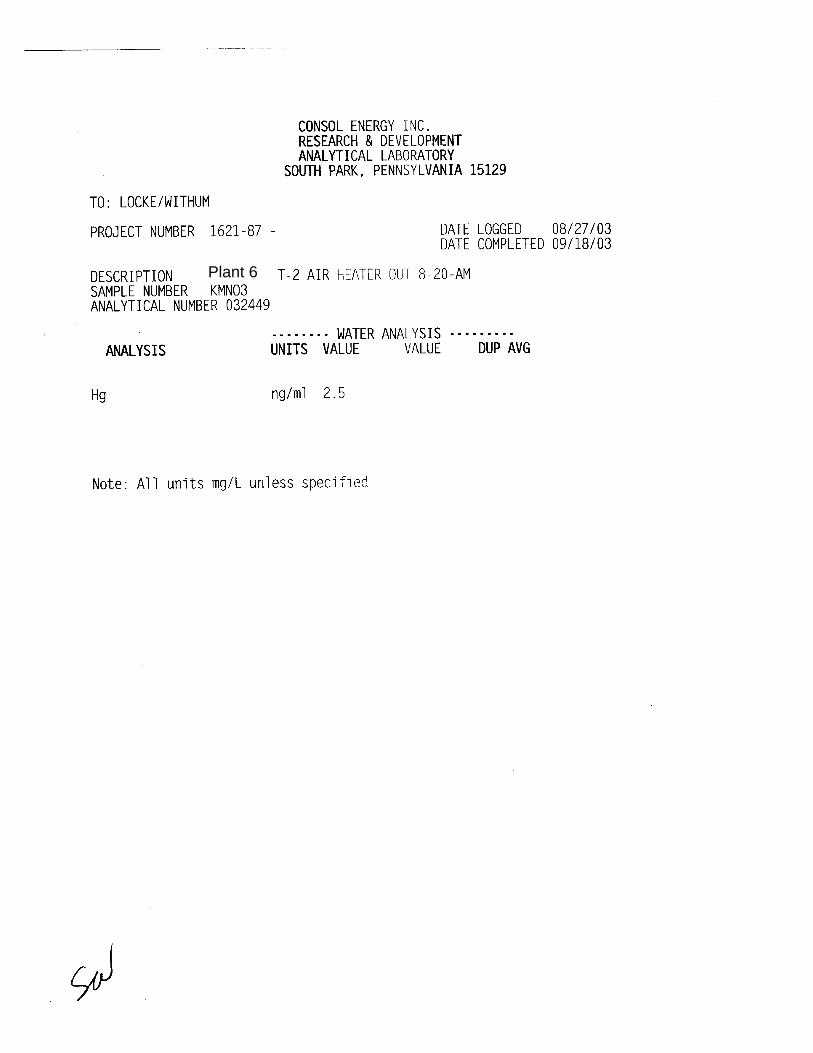
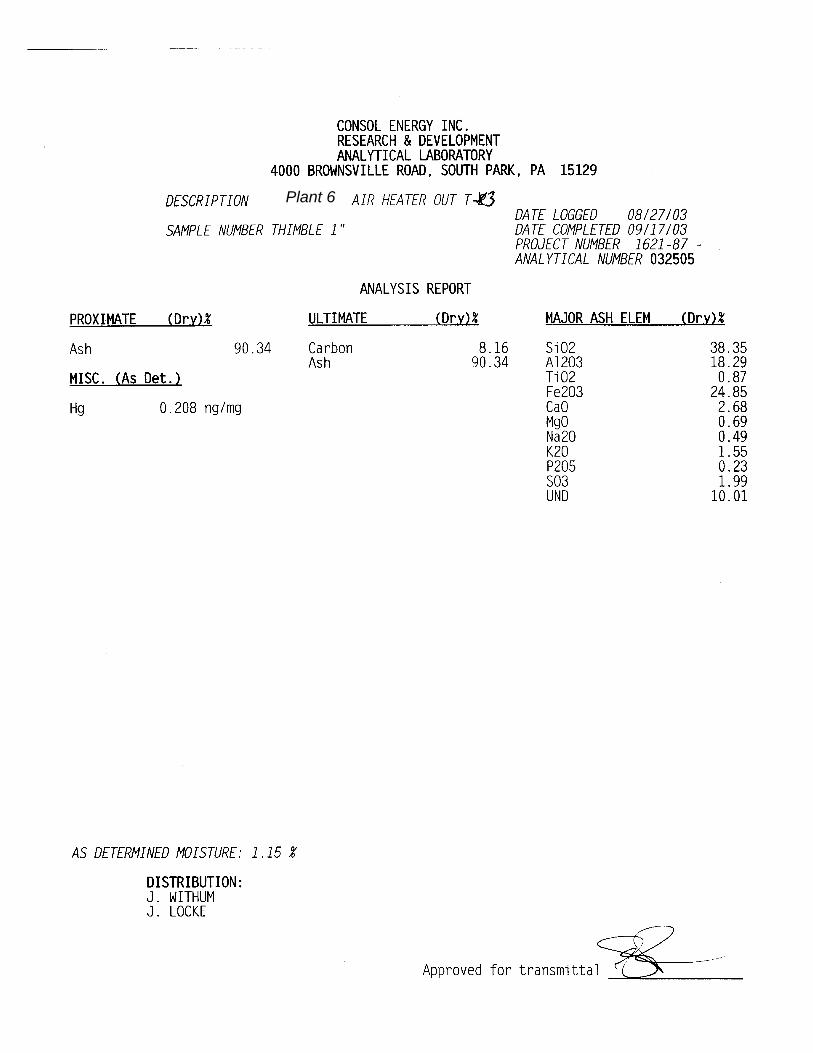
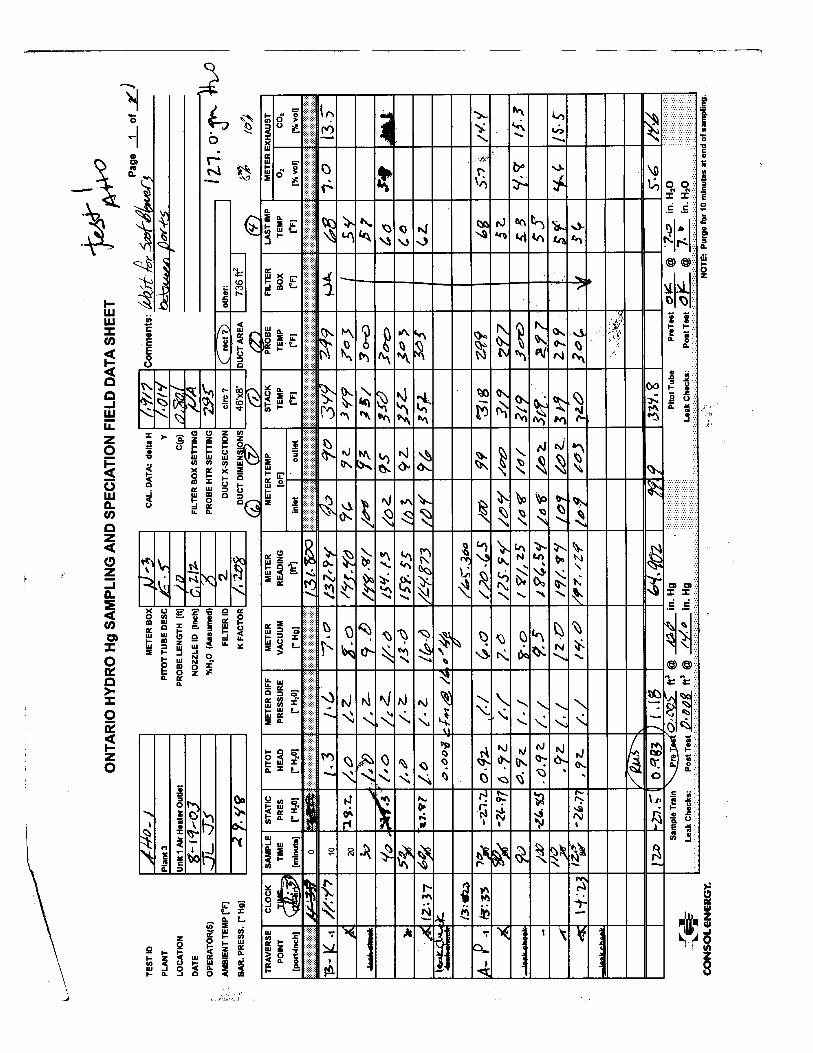
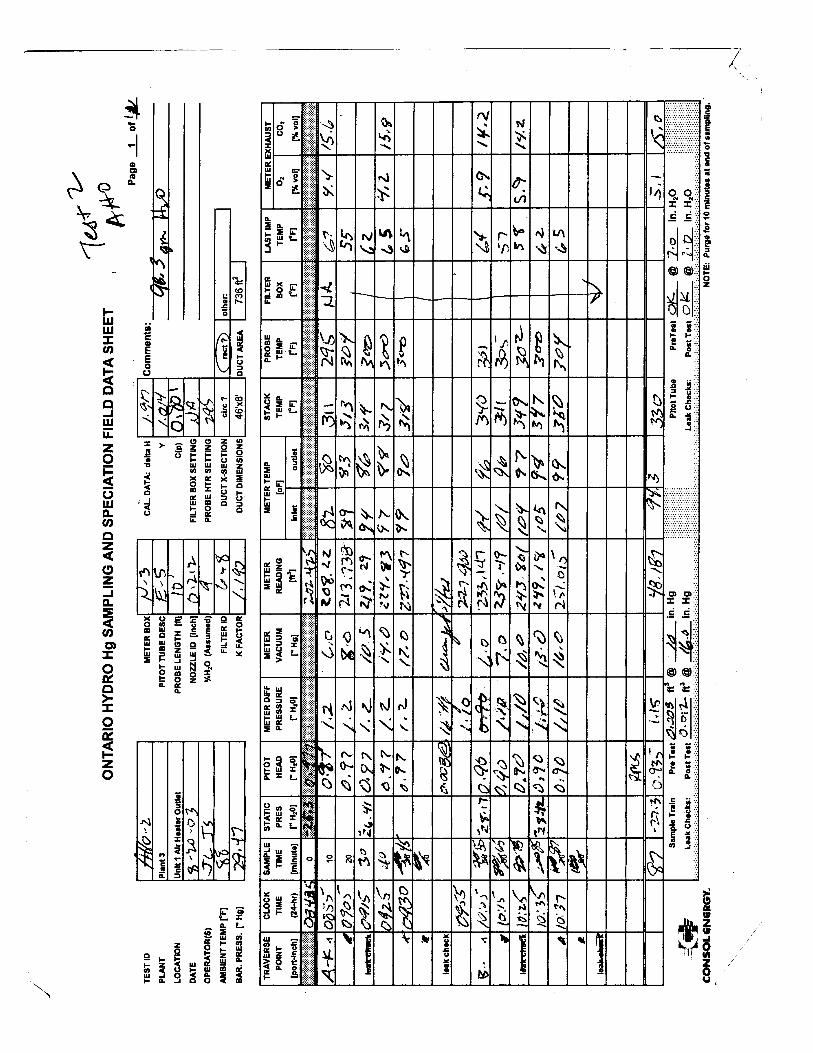
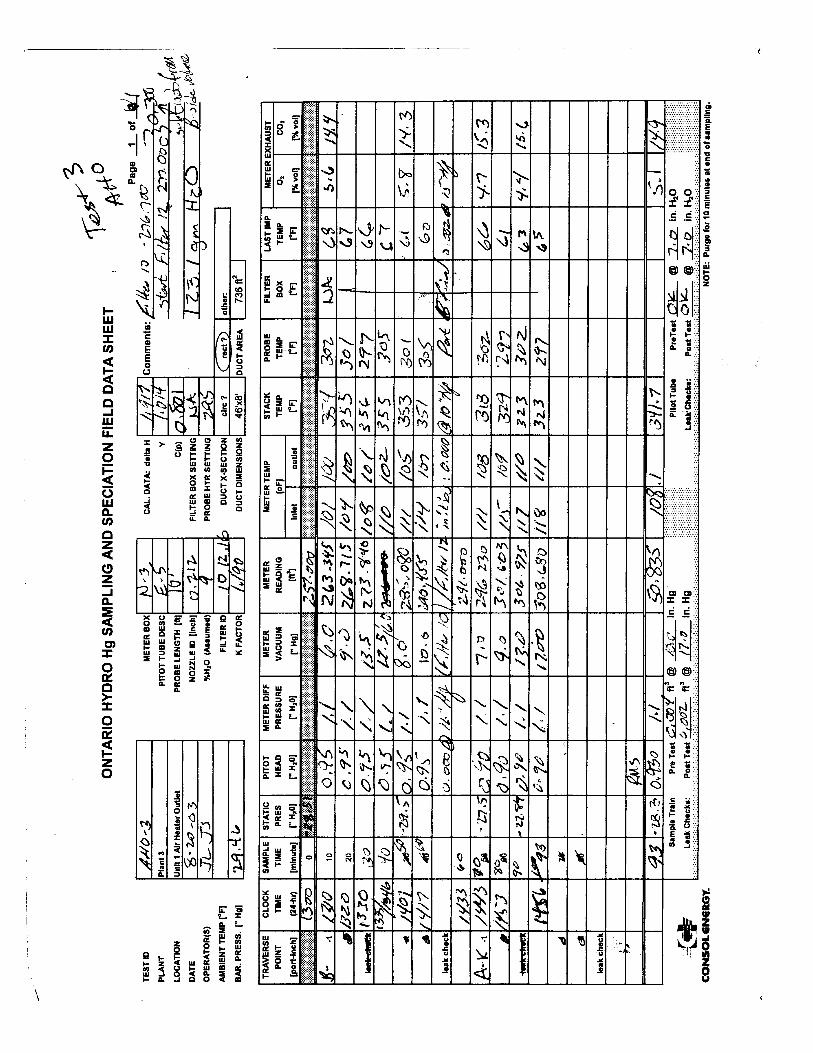
B. Air Heater Outlet Table 3 summarizes the Hg measurements at the air heater outlet. The results show that >95% of the mercury was in the gas phase, which is similar to the observation at the SCR inlet; the average gas temperature at the air heater outlet was 327 °F. Unlike the results at the SCR inlet, the data at the air heater outlet show that 88% of the mercury was in the oxidized form. This indicates that the SCR-air heater combination caused a substantial amount of the elemental mercury to be oxidized.
The mass flow of mercury at the air heater outlet averaged 6.0±1.4 mg/sec, which is 12% lower than the average of Tests 1, 3, and 4 measured at the SCR inlet. Between these two sampling locations are the SCR catalyst beds and the regenerative air heater. It is possible that mercury could be lost by absorption into the catalyst, or onto air heater ash deposits, resulting in a lower mercury concentration at the air heater outlet than at the SCR inlet. Also, as discussed in the previous section, mercury could be recycled back to the boiler in the combustion air. The mass flow of mercury at the air heater outlet was only 5% higher than the average mass flow of mercury in the feed coal.
1 “Role of Coal Chlorine and Fly Ash on Mercury Species in Coal Combustion Ash,” Final Technical Report to the Illinois Clean Coal Institute, ICCI-00-1/2.2C-2, April 2002, L-19219
3
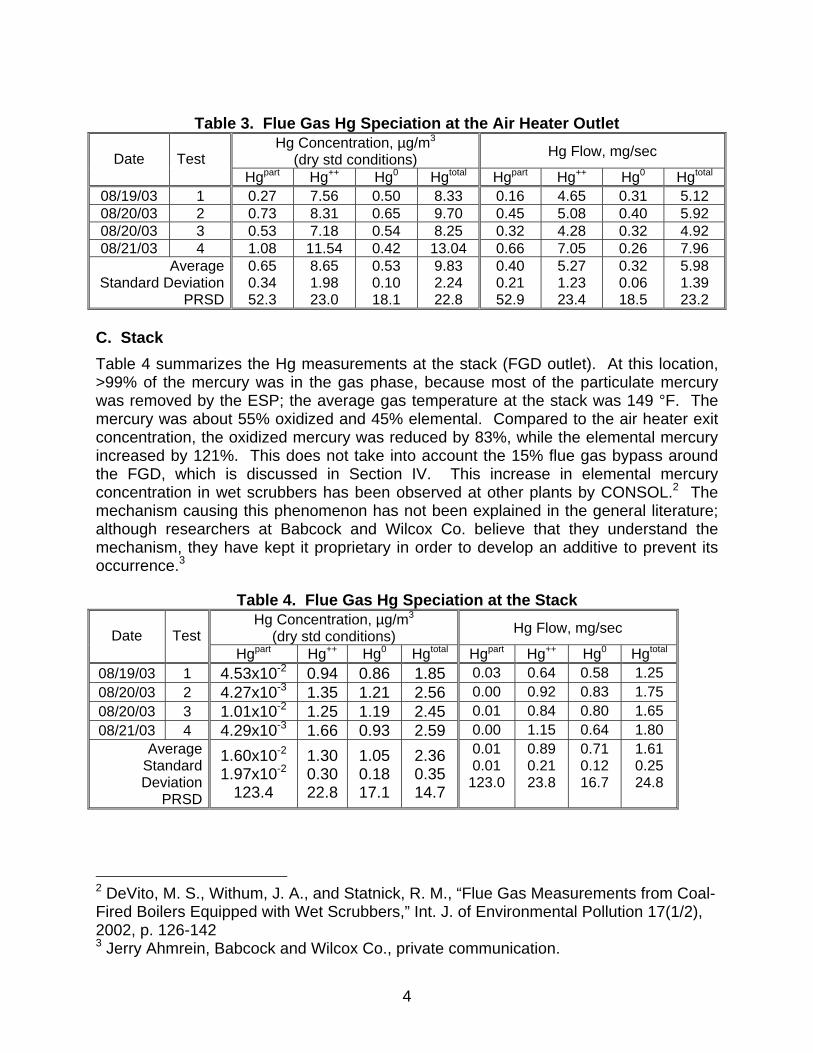
Table 3. Flue Gas Hg Speciation at the Air Heater Outlet
Hg Concentration, µg/m3
(dry std conditions) Hg Flow, mg/sec Date Test Hgpart Hg++ Hg0 Hgtotal Hgpart Hg++ Hg0 Hgtotal
08/19/03 1 0.27 7.56 0.50 8.33 0.16 4.65 0.31 5.12 08/20/03 2 0.73 8.31 0.65 9.70 0.45 5.08 0.40 5.92 08/20/03 3 0.53 7.18 0.54 8.25 0.32 4.28 0.32 4.92 08/21/03 4 1.08 11.54 0.42 13.04 0.66 7.05 0.26 7.96
Average Standard Deviation
PRSD
0.65 0.34 52.3
8.65 1.98 23.0
0.53 0.10 18.1
9.83 2.24 22.8
0.40 0.21 52.9
5.27 1.23 23.4
0.32 0.06 18.5
5.98 1.39 23.2
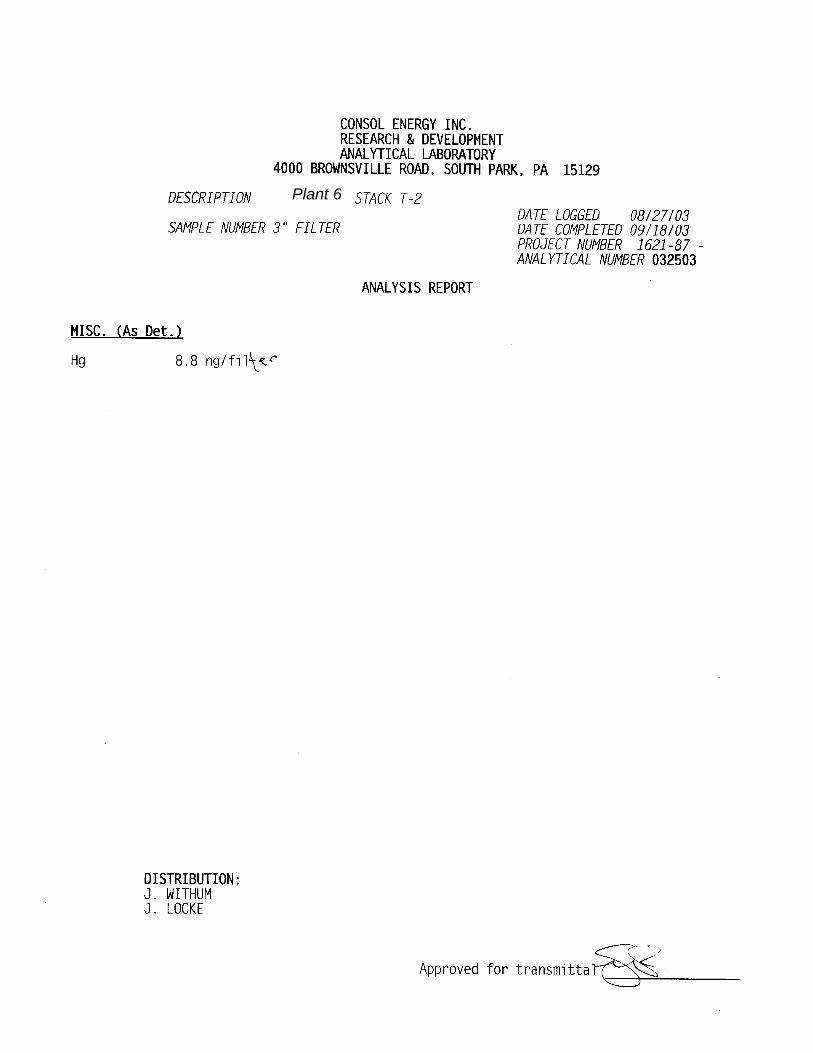
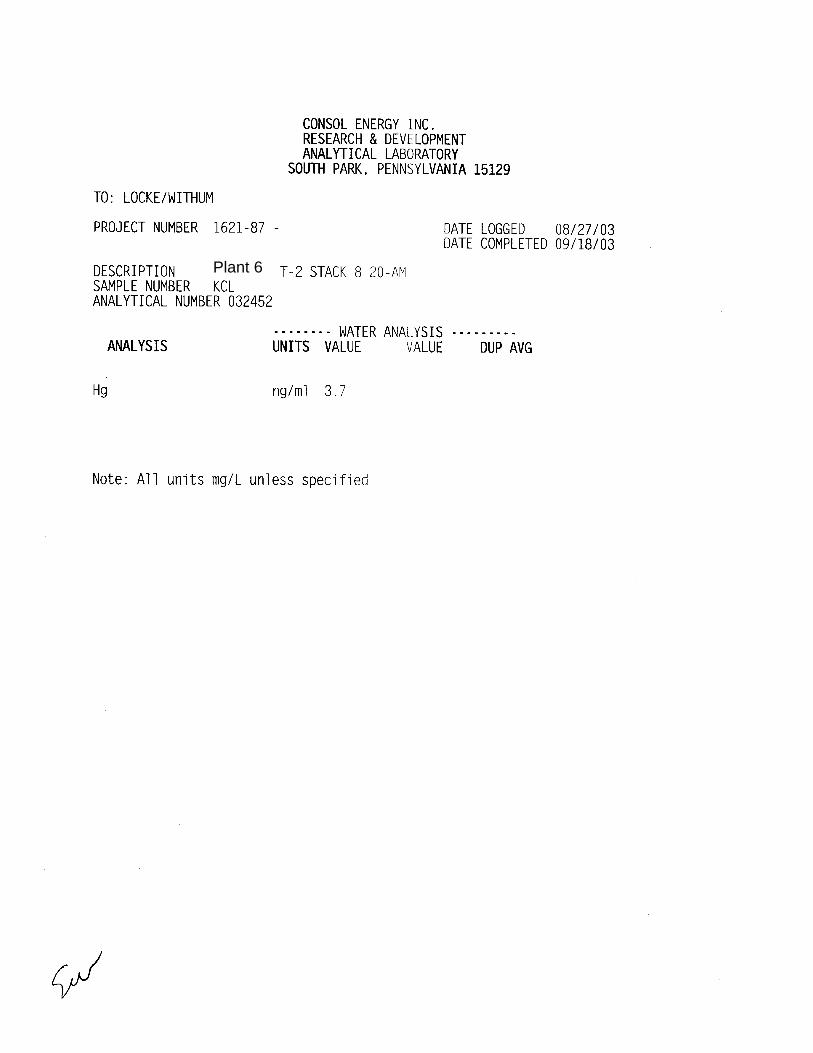
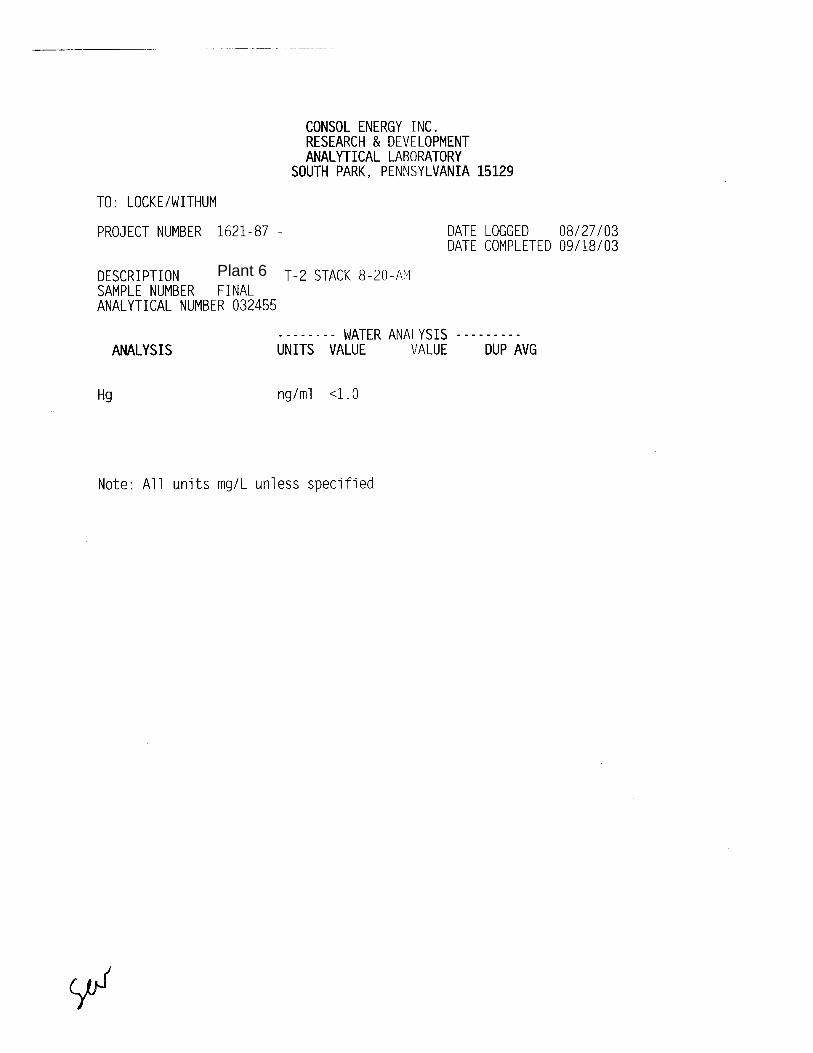
C. Stack Table 4 summarizes the Hg measurements at the stack (FGD outlet). At this location, >99% of the mercury was in the gas phase, because most of the particulate mercury was removed by the ESP; the average gas temperature at the stack was 149 °F. The mercury was about 55% oxidized and 45% elemental. Compared to the air heater exit concentration, the oxidized mercury was reduced by 83%, while the elemental mercury increased by 121%. This does not take into account the 15% flue gas bypass around the FGD, which is discussed in Section IV. This increase in elemental mercury concentration in wet scrubbers has been observed at other plants by CONSOL.2 The mechanism causing this phenomenon has not been explained in the general literature; although researchers at Babcock and Wilcox Co. believe that they understand the mechanism, they have kept it proprietary in order to develop an additive to prevent its occurrence.3
Table 4. Flue Gas Hg Speciation at the Stack Hg Concentration, µg/m3
(dry std conditions) Hg Flow, mg/sec Date Test Hgpart Hg++ Hg0 Hgtotal Hgpart Hg++ Hg0 Hgtotal
08/19/03 1 4.53x10⁻² 0.94 0.86 1.85 0.03 0.64 0.58 1.25 08/20/03 2 4.27x10⁻³ 1.35 1.21 2.56 0.00 0.92 0.83 1.75 08/20/03 3 1.01x10⁻² 1.25 1.19 2.45 0.01 0.84 0.80 1.65 08/21/03 4 4.29x10⁻³ 1.66 0.93 2.59 0.00 1.15 0.64 1.80
Average Standard Deviation
PRSD
1.60x10⁻²
1.97x10⁻²
123.4
1.30 0.30 22.8
1.05 0.18 17.1
2.36 0.35 14.7
0.01 0.01
123.0
0.89 0.21 23.8
0.71 0.12 16.7
1.61 0.25 24.8
2 DeVito, M. S., Withum, J. A., and Statnick, R. M., “Flue Gas Measurements from Coal-Fired Boilers Equipped with Wet Scrubbers,” Int. J. of Environmental Pollution 17(1/2), 2002, p. 126-142 3 Jerry Ahmrein, Babcock and Wilcox Co., private communication.
4
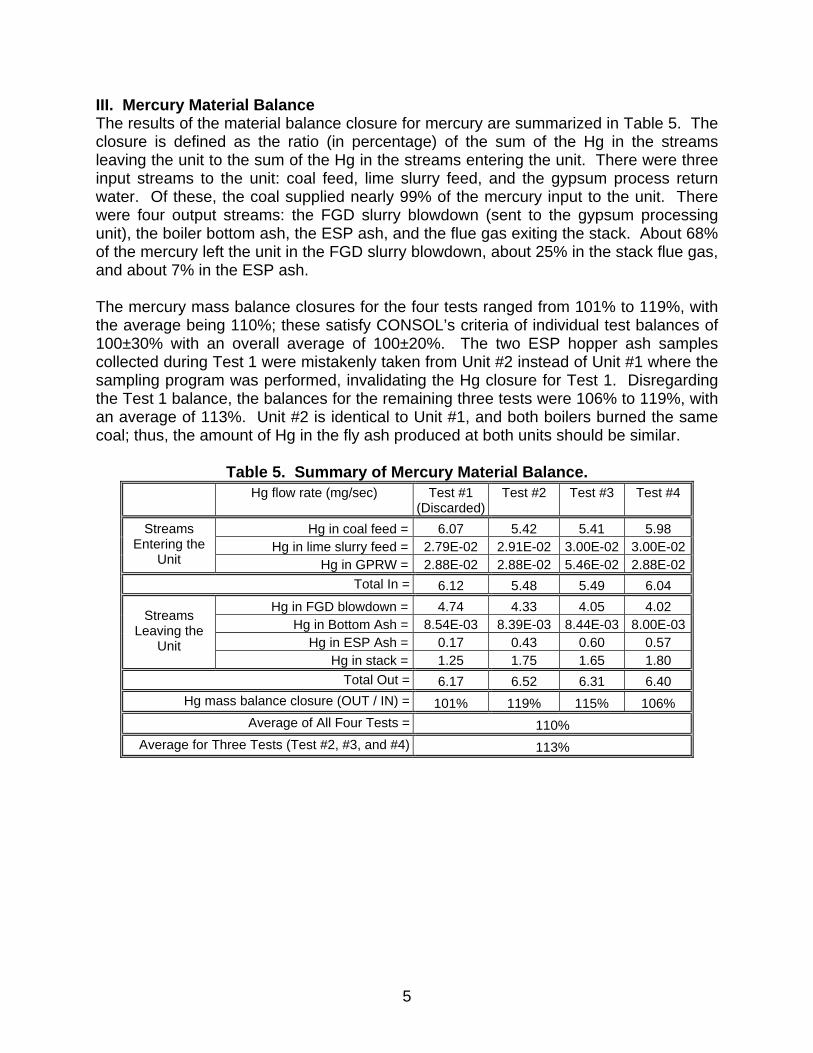
III. Mercury Material Balance The results of the material balance closure for mercury are summarized in Table 5. The closure is defined as the ratio (in percentage) of the sum of the Hg in the streams leaving the unit to the sum of the Hg in the streams entering the unit. There were three input streams to the unit: coal feed, lime slurry feed, and the gypsum process return water. Of these, the coal supplied nearly 99% of the mercury input to the unit. There were four output streams: the FGD slurry blowdown (sent to the gypsum processing unit), the boiler bottom ash, the ESP ash, and the flue gas exiting the stack. About 68% of the mercury left the unit in the FGD slurry blowdown, about 25% in the stack flue gas, and about 7% in the ESP ash. The mercury mass balance closures for the four tests ranged from 101% to 119%, with the average being 110%; these satisfy CONSOL’s criteria of individual test balances of 100±30% with an overall average of 100±20%. The two ESP hopper ash samples collected during Test 1 were mistakenly taken from Unit #2 instead of Unit #1 where the sampling program was performed, invalidating the Hg closure for Test 1. Disregarding the Test 1 balance, the balances for the remaining three tests were 106% to 119%, with an average of 113%. Unit #2 is identical to Unit #1, and both boilers burned the same coal; thus, the amount of Hg in the fly ash produced at both units should be similar.
Table 5. Summary of Mercury Material Balance.
Hg flow rate (mg/sec) Test #1 (Discarded)
Test #2 Test #3 Test #4
Hg in coal feed = 6.07 5.42 5.41 5.98 Hg in lime slurry feed = 2.79E-02 2.91E-02 3.00E-02 3.00E-02
Streams Entering the
Unit Hg in GPRW = 2.88E-02 2.88E-02 5.46E-02 2.88E-02Total In = 6.12 5.48 5.49 6.04
Hg in FGD blowdown = 4.74 4.33 4.05 4.02 Hg in Bottom Ash = 8.54E-03 8.39E-03 8.44E-03 8.00E-03
Hg in ESP Ash = 0.17 0.43 0.60 0.57
Streams Leaving the
Unit Hg in stack = 1.25 1.75 1.65 1.80
Total Out = 6.17 6.52 6.31 6.40 Hg mass balance closure (OUT / IN) = 101% 119% 115% 106%
Average of All Four Tests = 110% Average for Three Tests (Test #2, #3, and #4) 113%
5
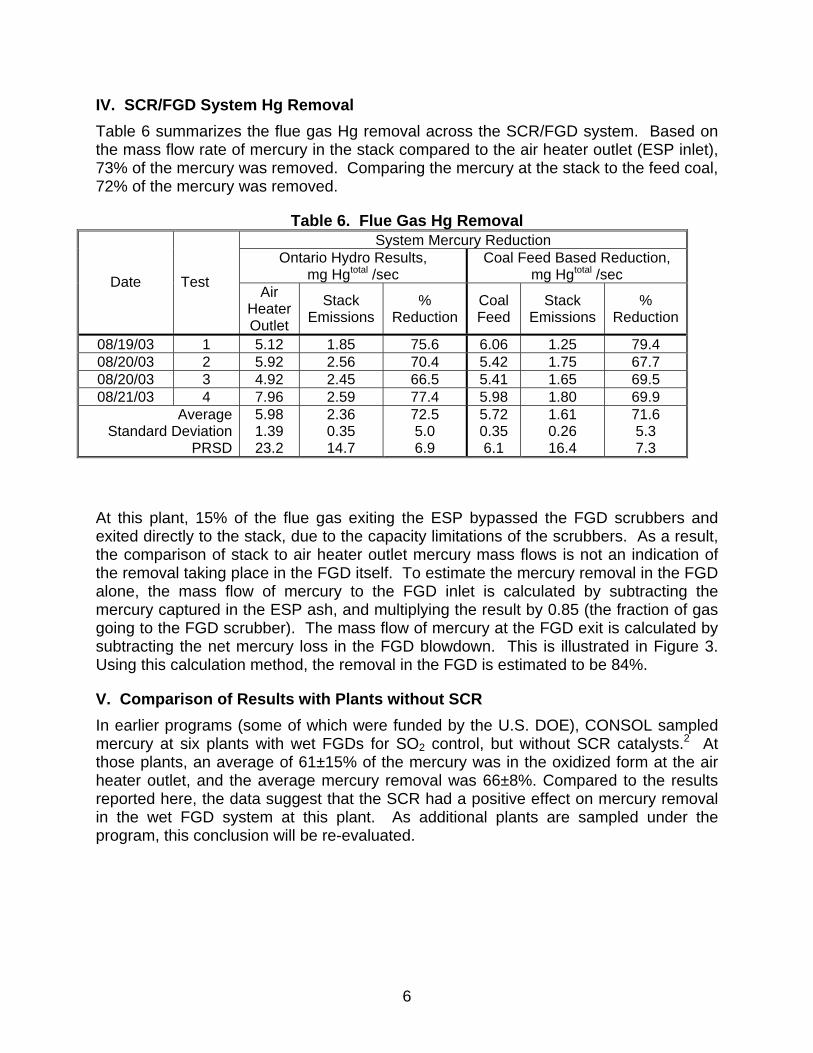
IV. SCR/FGD System Hg Removal Table 6 summarizes the flue gas Hg removal across the SCR/FGD system. Based on the mass flow rate of mercury in the stack compared to the air heater outlet (ESP inlet), 73% of the mercury was removed. Comparing the mercury at the stack to the feed coal, 72% of the mercury was removed.
Table 6. Flue Gas Hg Removal System Mercury Reduction
Ontario Hydro Results, mg Hgtotal /sec
Coal Feed Based Reduction, mg Hgtotal /sec Date Test
Air Heater Outlet
Stack Emissions
% Reduction
Coal Feed
Stack Emissions
% Reduction
08/19/03 1 5.12 1.85 75.6 6.06 1.25 79.4 08/20/03 2 5.92 2.56 70.4 5.42 1.75 67.7 08/20/03 3 4.92 2.45 66.5 5.41 1.65 69.5 08/21/03 4 7.96 2.59 77.4 5.98 1.80 69.9
Average Standard Deviation
PRSD
5.98 1.39 23.2
2.36 0.35 14.7
72.5 5.0 6.9
5.72 0.35 6.1
1.61 0.26 16.4
71.6 5.3 7.3
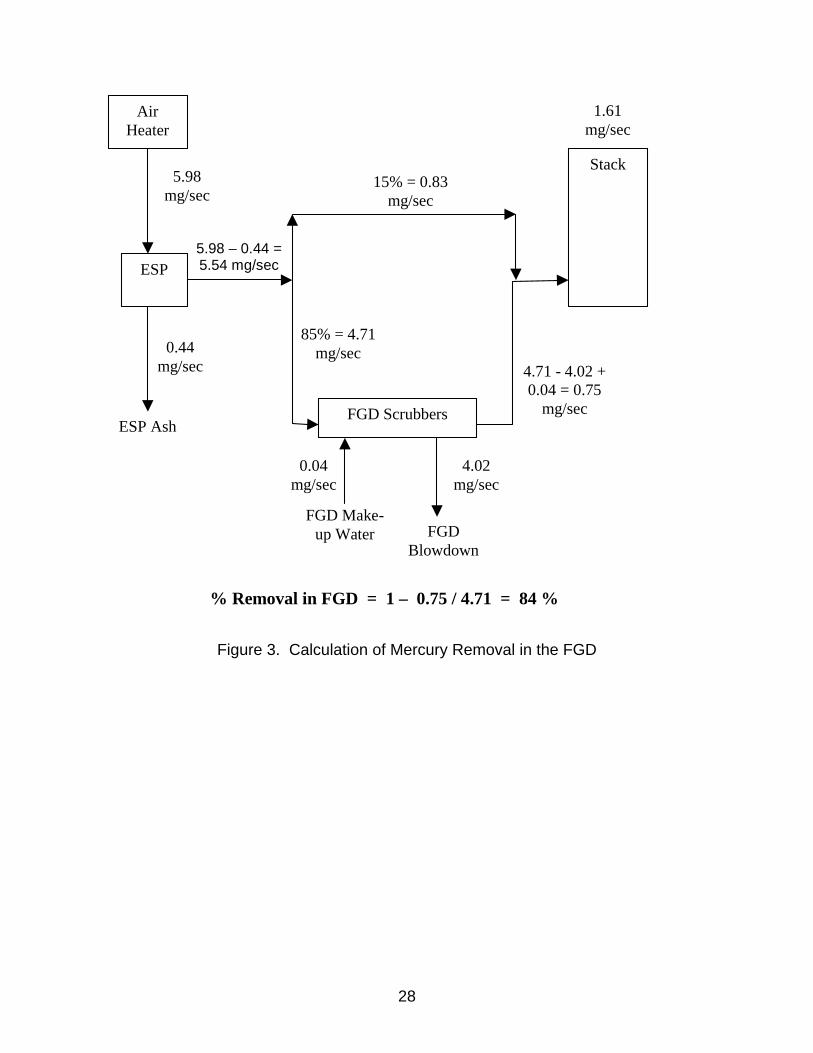
At this plant, 15% of the flue gas exiting the ESP bypassed the FGD scrubbers and exited directly to the stack, due to the capacity limitations of the scrubbers. As a result, the comparison of stack to air heater outlet mercury mass flows is not an indication of the removal taking place in the FGD itself. To estimate the mercury removal in the FGD alone, the mass flow of mercury to the FGD inlet is calculated by subtracting the mercury captured in the ESP ash, and multiplying the result by 0.85 (the fraction of gas going to the FGD scrubber). The mass flow of mercury at the FGD exit is calculated by subtracting the net mercury loss in the FGD blowdown. This is illustrated in Figure 3. Using this calculation method, the removal in the FGD is estimated to be 84%.
V. Comparison of Results with Plants without SCR In earlier programs (some of which were funded by the U.S. DOE), CONSOL sampled mercury at six plants with wet FGDs for SO2 control, but without SCR catalysts.2 At those plants, an average of 61±15% of the mercury was in the oxidized form at the air heater outlet, and the average mercury removal was 66±8%. Compared to the results reported here, the data suggest that the SCR had a positive effect on mercury removal in the wet FGD system at this plant. As additional plants are sampled under the program, this conclusion will be re-evaluated.
6
EXPERIMENTAL AND SAMPLING METHODS
I. Flue Gas Sampling Locations and Sampling Points Three sampling locations, the SCR inlet, air heater outlet (upstream of the ESP), and stack outlet, were tested. Figure 1 is a flow schematic indicating the sampling locations.
A. SCR Inlet Figure 4 is a schematic of the SCR inlet sampling location. The SCR inlet location consists of two vertically oriented ducts, designated as “Side A” and “Side B,” each measuring 12'-6" deep and 39’-2” wide. The ducts channel flue gas to two separate SCR reaction chambers. Each duct was sampled through a single test port, at a single, centrally located point.
Figure 5 is a photograph of the Hg sampling train on the SCR inlet. Hg measurements were conducted isokinetically.
B. Air Heater Outlet (ESP Inlet) Figure 6 is a schematic of the Air Heater outlet sampling location. Flue gas is split in two ducts (Side A and Side B), each measuring approximately 8' deep and 46' wide. The sampling location is immediately downstream of the air heater ductwork attachment point and less than 36 inches from an upward turn of approximately 45-degrees to the ESP inlet plenum. The outside edges of the ductwork also flare outward at this point. Following a preliminary velocity traverse, the test team determined that a single point (located in ports P and K) was adequate to determine average flow.
Figure 7 is a photograph of the Hg sampling train on the Air Heater outlet. Hg measurements were conducted isokinetically.
C. Stack (FGD Outlet) Figure 8 is a schematic of the Stack sampling location. The stack is 20 feet in diameter. Sampling was conducted through four sample access ports, each with four sample points, as determined by EPA Method 1, for a total of 16 traverse points. Figure 9 is a photograph of the Hg sampling train on the stack. Hg measurements were conducted isokinetically. Because the stack was the only location where a full traverse was made, the volumetric gas flows at the other two locations were calculated for each test using the stack flow rate, corrected for temperature, pressure, moisture, and O2 concentration (air in-leakage) differences. II. Flue Gas Sampling Procedures CONSOL R&D performed Hg flue gas determinations using the Ontario-Hydro sampling method. As a quality assurance/quality control (QA/QC) measure, samples of the coal, bottom ash, FGD lime slurry, FGD sludge, gypsum plant return water, and ESP ash,
7
were taken to determine a mercury balance across the system. A total of 12 Hg measurements were conducted over three days. Mercury measurements were a maximum of 120 minutes in duration. Due to high dust loading conditions, sampling times varied as discussed in the following sections. The shortened test durations had no effect on the measurements, because the results are based on the total amount of gas sampled, not the duration of the sampling test.
CONSOL R&D and plant personnel obtained process samples, concurrently with each test. Subsequent analyses were performed by CONSOL R&D and are included in this section.
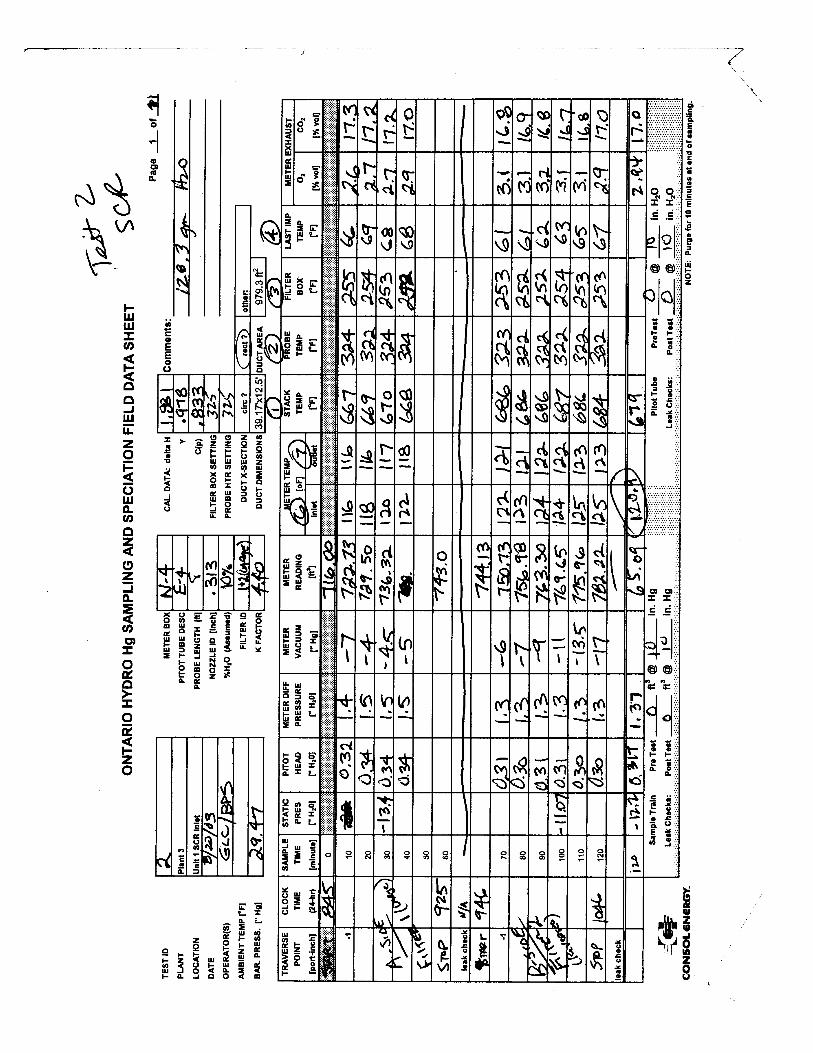
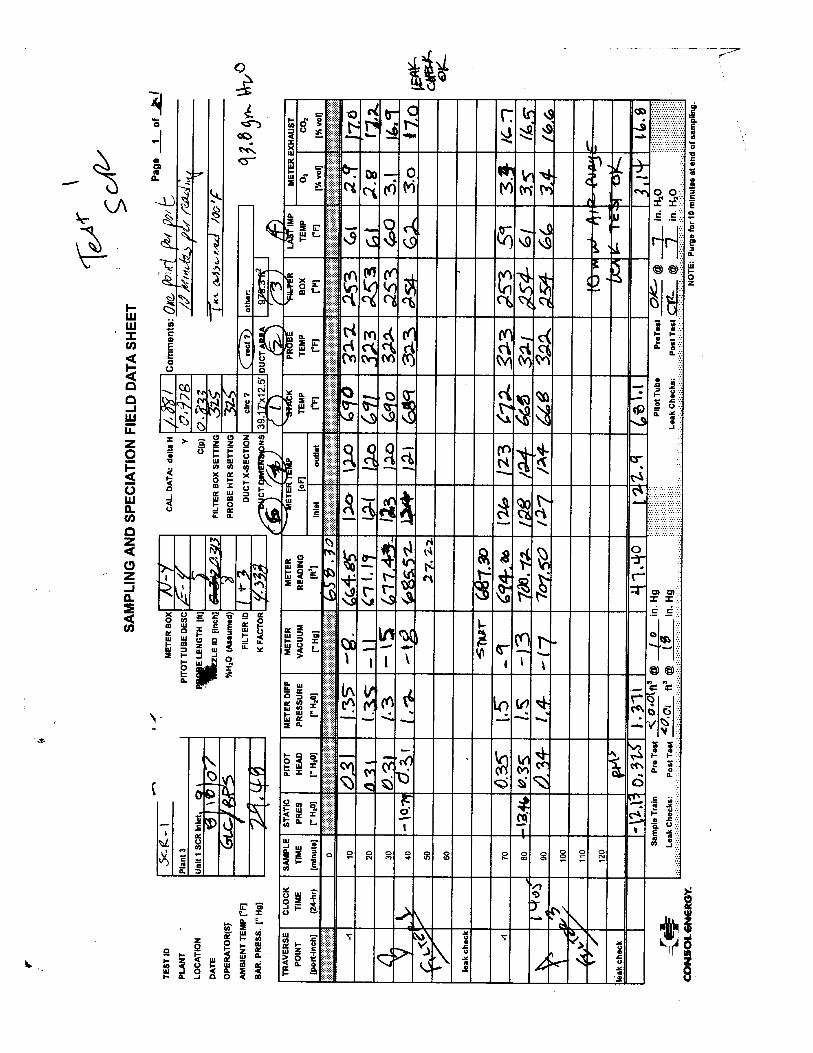
A. SCR Inlet. A preliminary pitot survey was conducted on August 18, 2003, and the flow was found to be laminar. Therefore, Hg measurements were conducted with the sampling nozzle oriented parallel to and directly into the flow. A single point was sampled through a single sample port in each duct.
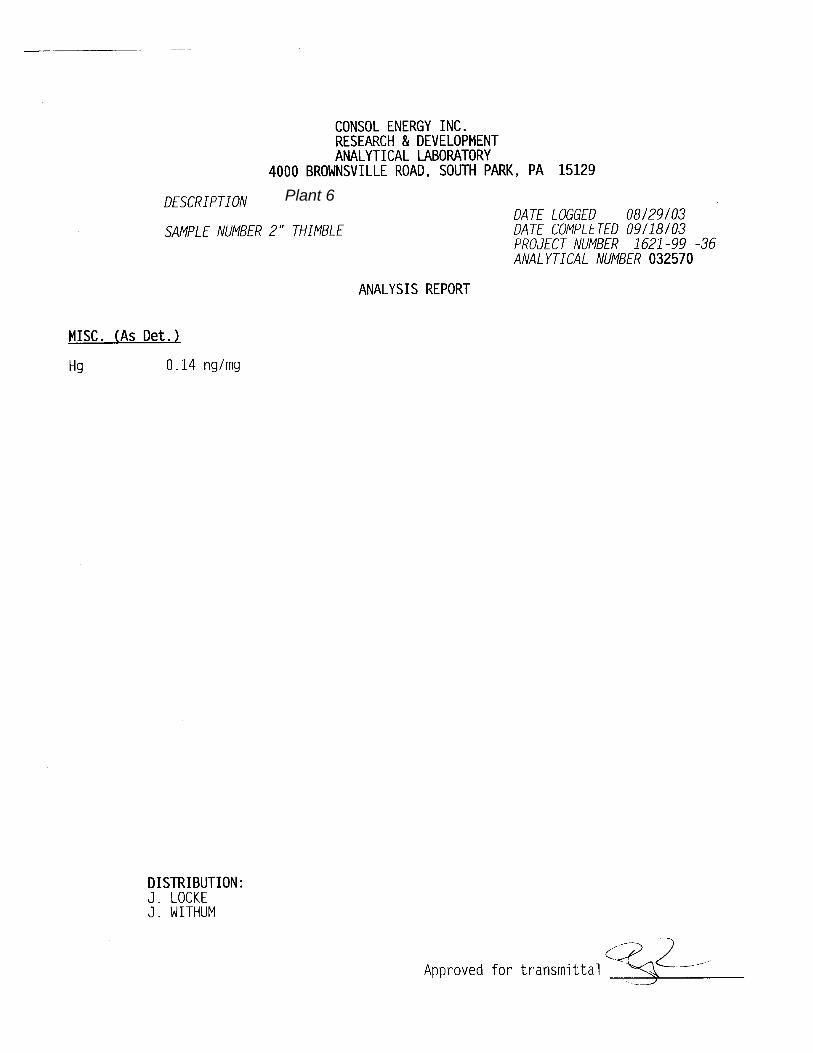
Four Hg measurements were performed on the SCR inlet. The sample train was prepared in a Method 17 configuration using an in-stack 19 mm x 90 mm quartz-fiber thimble filter. The filter apparatus was connected to a heated probe that was attached to the impinger train with a Method 5 filter bypass piece.
Ideally each sampling run would have been a 120-minute duration. However, due to high particulate loading at this site, excessive vacuum, caused by filter particulate loading, forced the early termination of all test runs. Filters were changed to prolong the sampling, however, to maintain sample integrity, it was necessary to stop the tests. Runs 1 through 4 were 70, 100, 90, and 100 minutes, respectively. B. Air Heater Outlet Preliminary pitot surveys were conducted on August 18, 2003, and the flow was found to diverge toward the outside edge of the ducts. Flow was laminar nearer the center of the ducts so a single port was selected in each duct, through which a single point of average flow was sampled. Hg measurements were conducted with the sampling nozzle oriented parallel to and directly into the flow.
Four Hg measurements were performed on the Air Heater Outlet. The sample train was prepared in a Method 17 configuration using an in-stack 19 mm x 90 mm quartz-fiber thimble filter. The filter apparatus was connected to a heated probe that was attached to the impinger train with a flexible, heated, sample line.
Each duct was to be sampled for 60 minutes resulting in test durations of 120 minutes. However, due to high particulate loading at this site, excessive vacuum, caused by filter particulate loading, required the samplers to change filters during the test run. Only Run 1 lasted the full 120 minutes. To maintain sample integrity, it was necessary to stop tests 2 through 4 at 87, 93, and 80 minutes, respectively.
8
C. Stack Preliminary pitot surveys were conducted on the August 18, 2003, and the flow was found to be laminar. Therefore, Hg measurements were conducted with the nozzle oriented horizontally, directly into the flow.
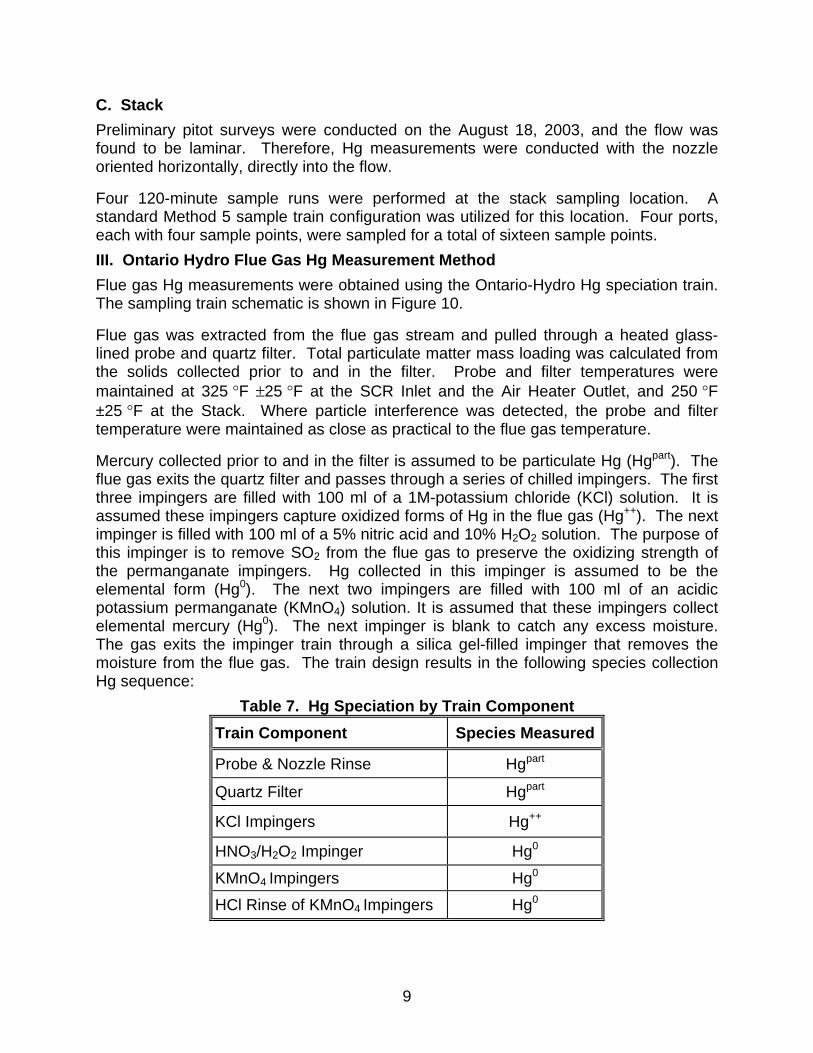
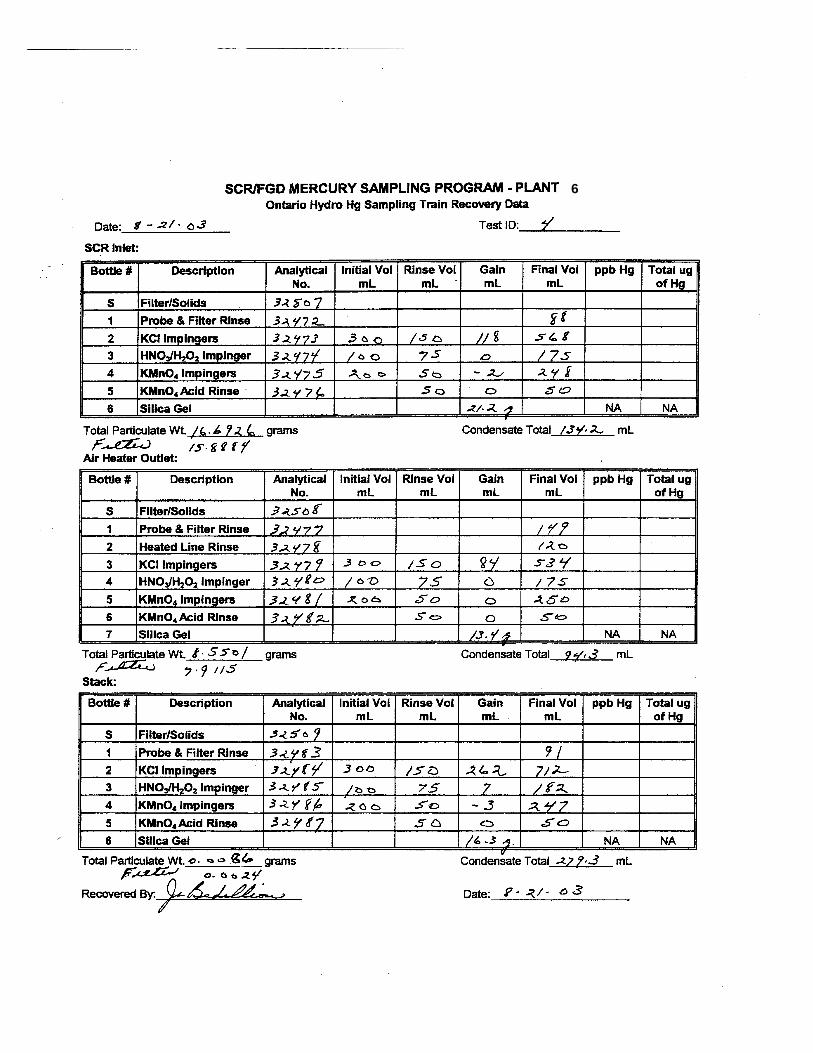
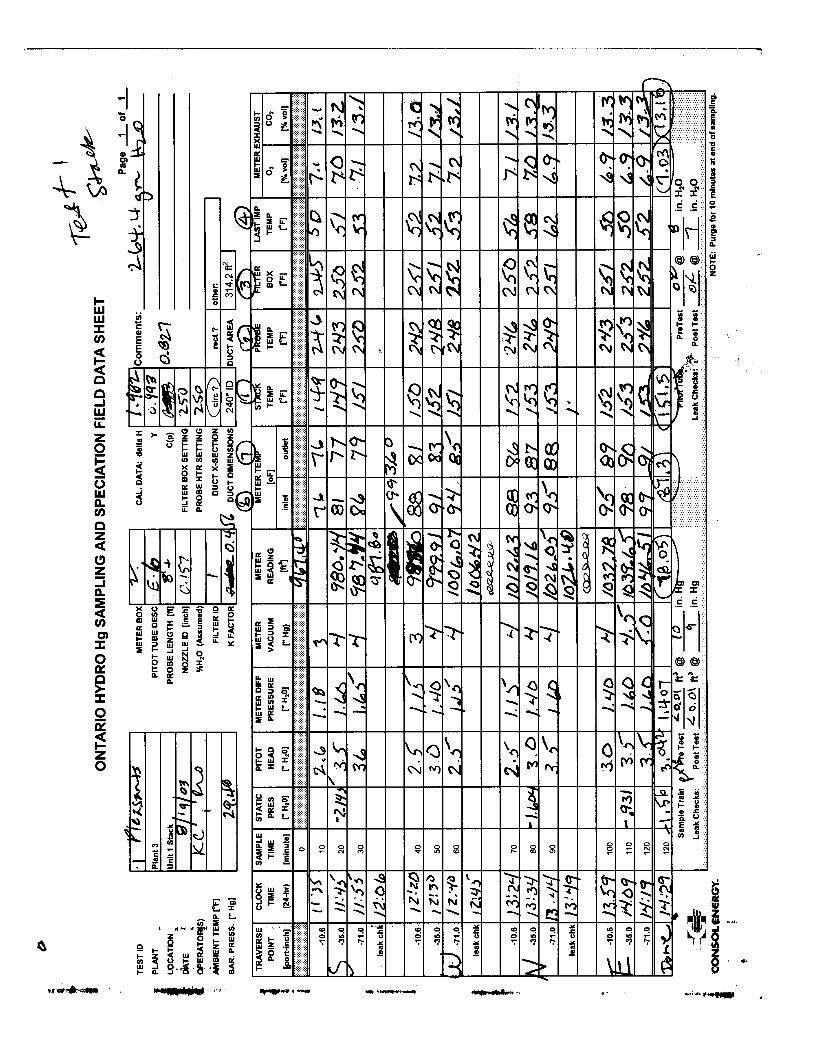
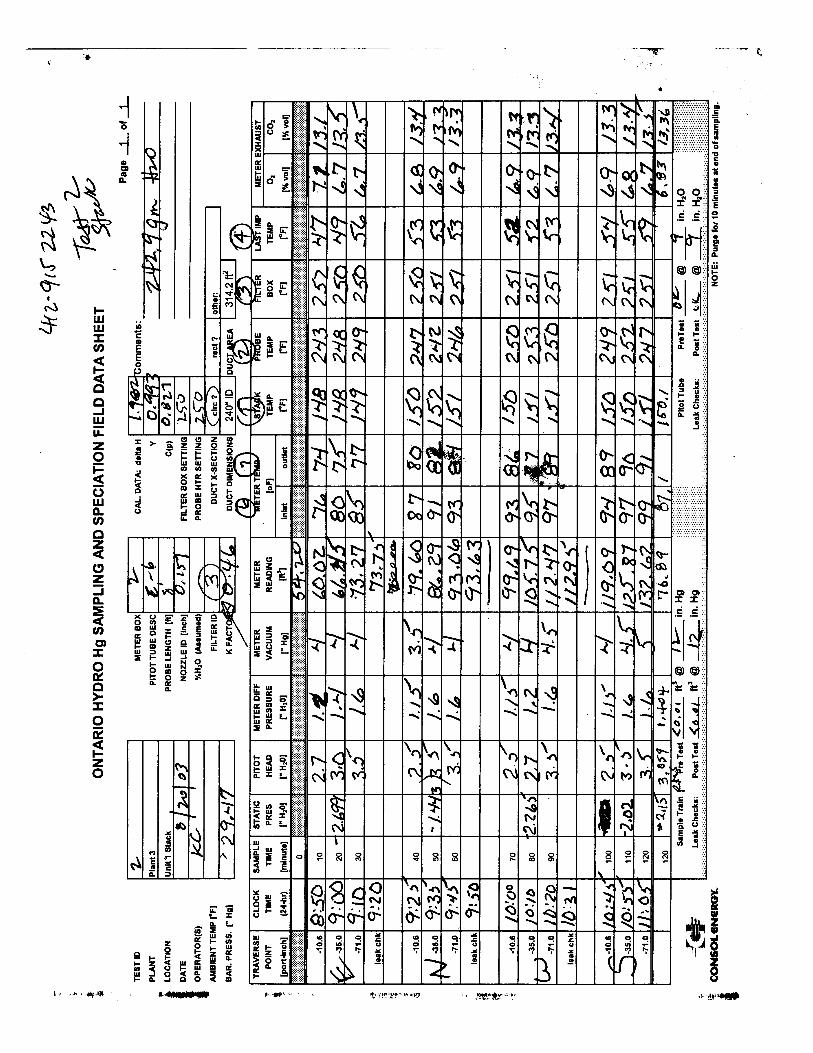
Four 120-minute sample runs were performed at the stack sampling location. A standard Method 5 sample train configuration was utilized for this location. Four ports, each with four sample points, were sampled for a total of sixteen sample points. III. Ontario Hydro Flue Gas Hg Measurement Method Flue gas Hg measurements were obtained using the Ontario-Hydro Hg speciation train. The sampling train schematic is shown in Figure 10.
Flue gas was extracted from the flue gas stream and pulled through a heated glass-lined probe and quartz filter. Total particulate matter mass loading was calculated from the solids collected prior to and in the filter. Probe and filter temperatures were maintained at 325 °F ±25 °F at the SCR Inlet and the Air Heater Outlet, and 250 °F ±25 °F at the Stack. Where particle interference was detected, the probe and filter temperature were maintained as close as practical to the flue gas temperature.
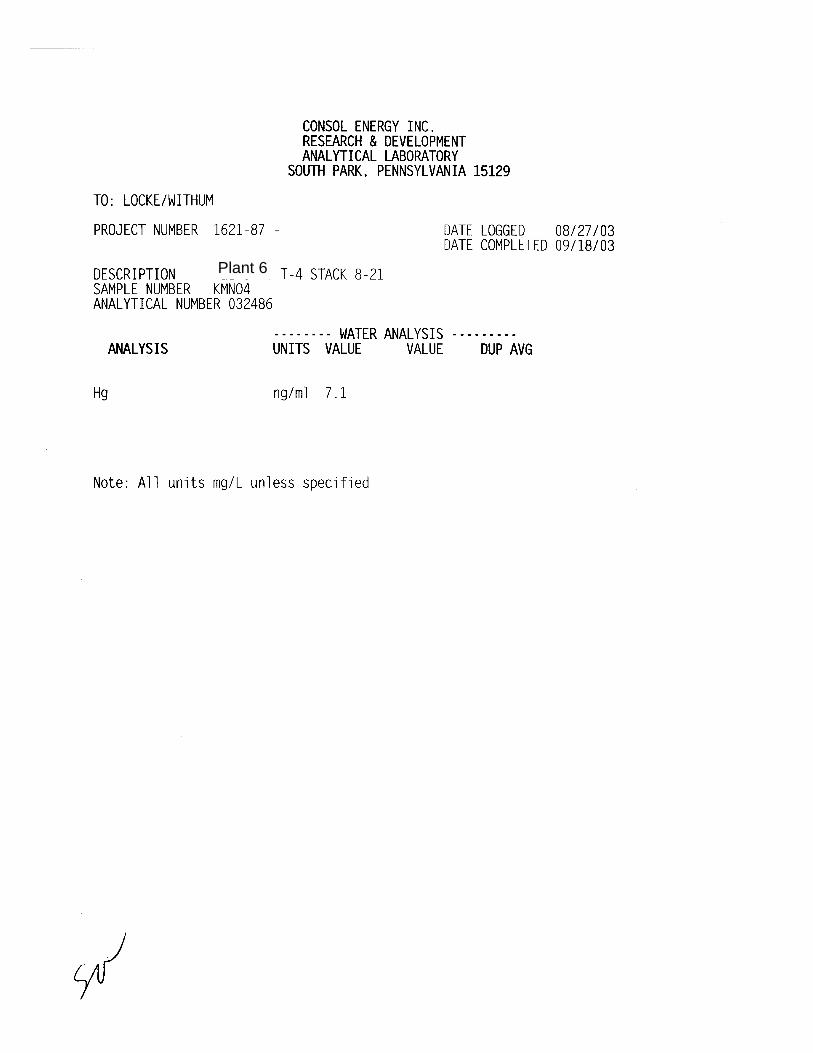
Mercury collected prior to and in the filter is assumed to be particulate Hg (Hgpart). The flue gas exits the quartz filter and passes through a series of chilled impingers. The first three impingers are filled with 100 ml of a 1M-potassium chloride (KCl) solution. It is assumed these impingers capture oxidized forms of Hg in the flue gas (Hg++). The next impinger is filled with 100 ml of a 5% nitric acid and 10% H2O2 solution. The purpose of this impinger is to remove SO2 from the flue gas to preserve the oxidizing strength of the permanganate impingers. Hg collected in this impinger is assumed to be the elemental form (Hg0). The next two impingers are filled with 100 ml of an acidic potassium permanganate (KMnO4) solution. It is assumed that these impingers collect elemental mercury (Hg0). The next impinger is blank to catch any excess moisture. The gas exits the impinger train through a silica gel-filled impinger that removes the moisture from the flue gas. The train design results in the following species collection Hg sequence:
Table 7. Hg Speciation by Train Component Train Component Species Measured
Probe & Nozzle Rinse Hgpart
Quartz Filter Hgpart
KCl Impingers Hg++
HNO3/H2O2 Impinger Hg0
KMnO4 Impingers Hg0
HCl Rinse of KMnO4 Impingers Hg0
9
The absorbing solutions were made fresh daily. The impingers were charged and the sampling components were transported to the required locations. The sampling trains were assembled, pre-heated, and checked for pitot and sample line leaks as detailed in EPA Methods 2 and 5, respectively. After passing the leak-check procedure, the sampling probes were inserted into their respective ducts, in-stack filters were allowed to heat to stack temperature, and sampling was initiated. Leak checks were also performed during port changes.
Oxygen readings were monitored at the outlet of the sampling train using a Teledyne Model Max 5 portable analyzer (electrochemical O2 sensor). At the completion of the sampling period, the sample trains were checked for leaks, purged for 10 min, and then disassembled. The components were transported back to the lab trailer for recovery. The Hg concentration of the individual impinger solutions was determined by cold vapor atomic absorption spectroscopy (CVAA) as specified in the ASTM method. The concentration of Hg on the solids was determined by acid digestion followed by CVAA.
The amount of mercury collected in the impinger solutions was determined as outlined in EPA Method 29 and the Ontario-Hydro Draft Method. An aliquot of the impinger solution was acidified and the mercury was determined using cold vapor-atomic absorption spectroscopy. The atomic absorption spectrometer was calibrated with commercial mercury standard. The calibration was verified using NIST Standard 1641D. The calibration was reassessed periodically by analyzing a quality control standard. The instrument was recalibrated as required. Each sample matrix was analyzed as a set and an individual calibration curve was used for each set. Depending on sample type, selected samples were spiked with 2, 5, 10, or 15 ng/ml (ppb) of mercury and reanalyzed. Spike recovery must be within ±30% or the sample is diluted and reanalyzed. Selected samples were analyzed in duplicate. The duplicates must be within ±30% or the analyses were repeated.
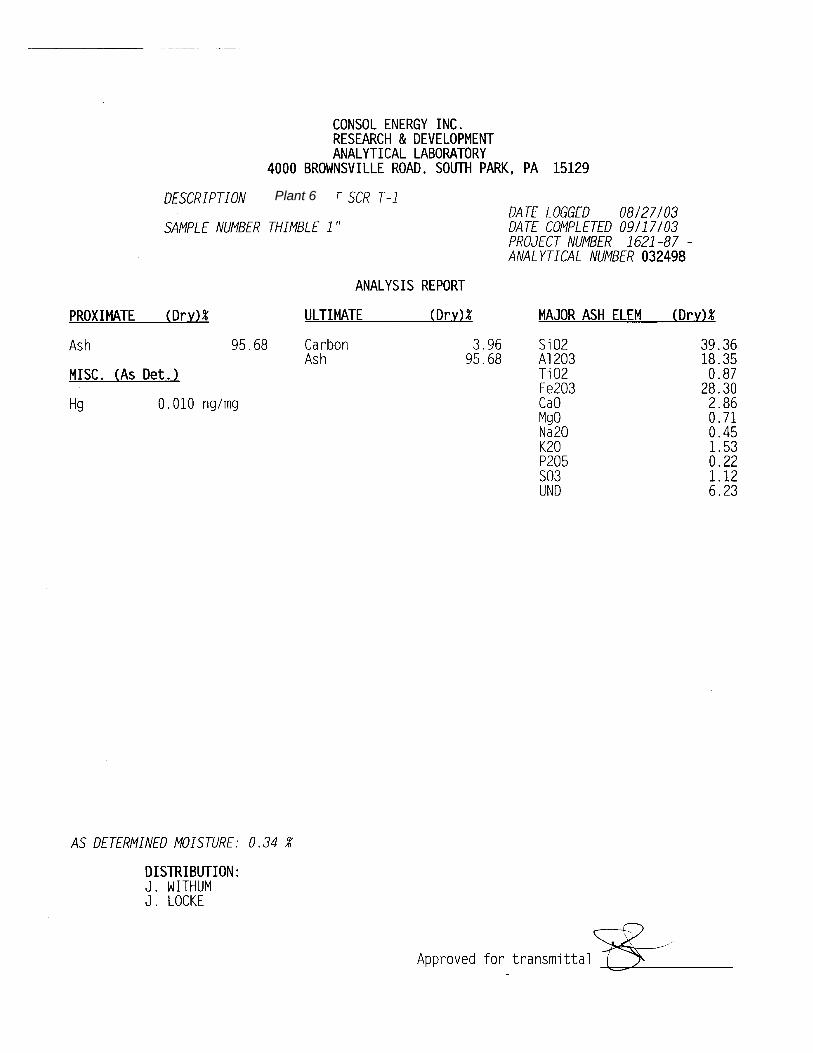
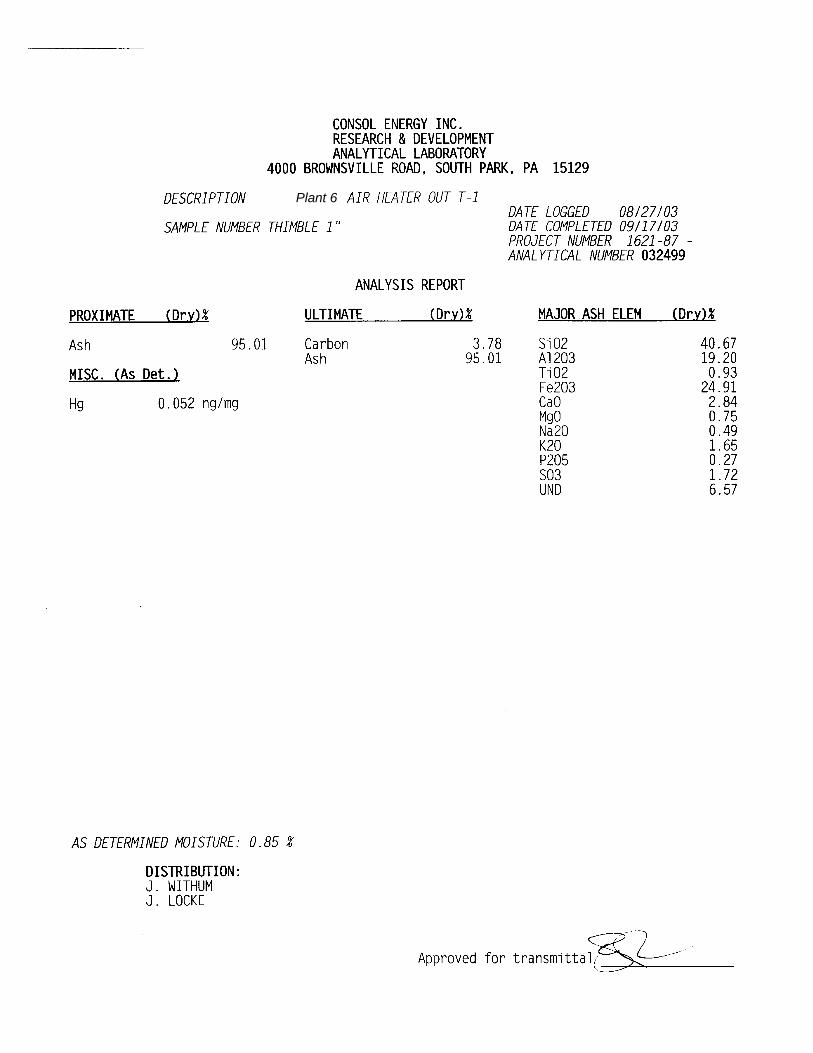
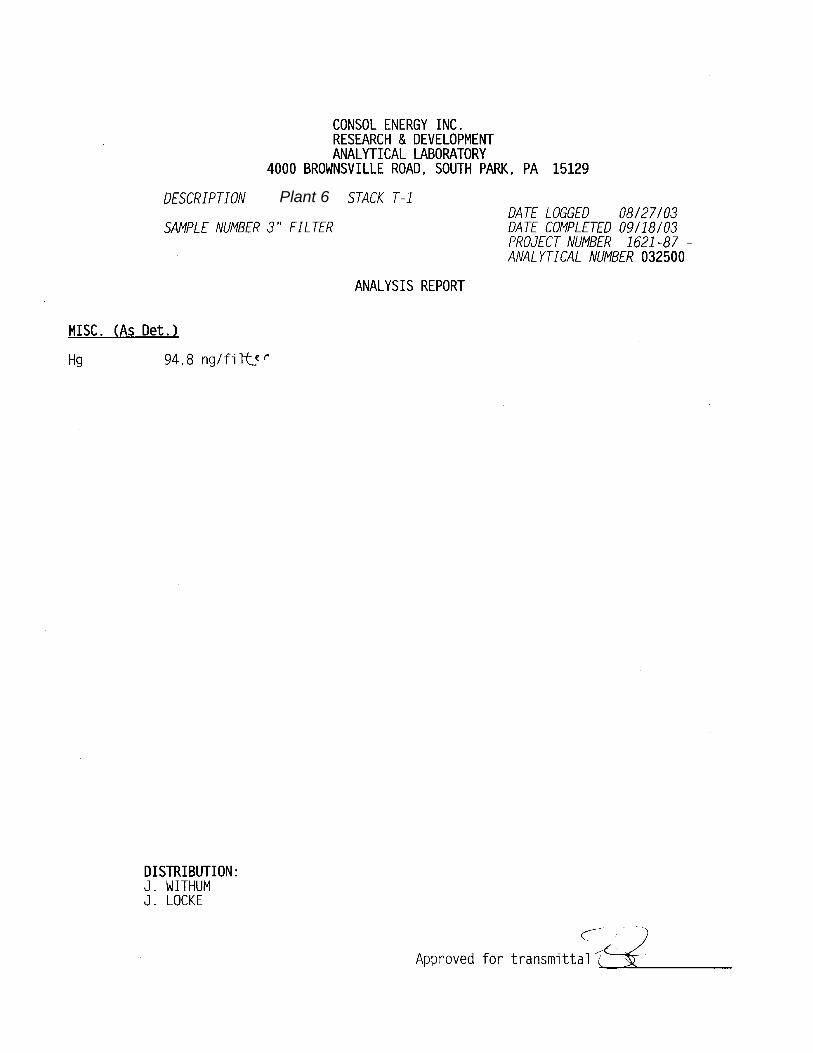
Where sufficient solids were collected, particulate mercury was analyzed using a 0.5-1.0 gm ash sample. In cases where the particulate catch was low (primarily outlet filters) the entire filter sample was digested. The samples were digested with aqua-regia in pressure vessels prior to analysis by CVAA.
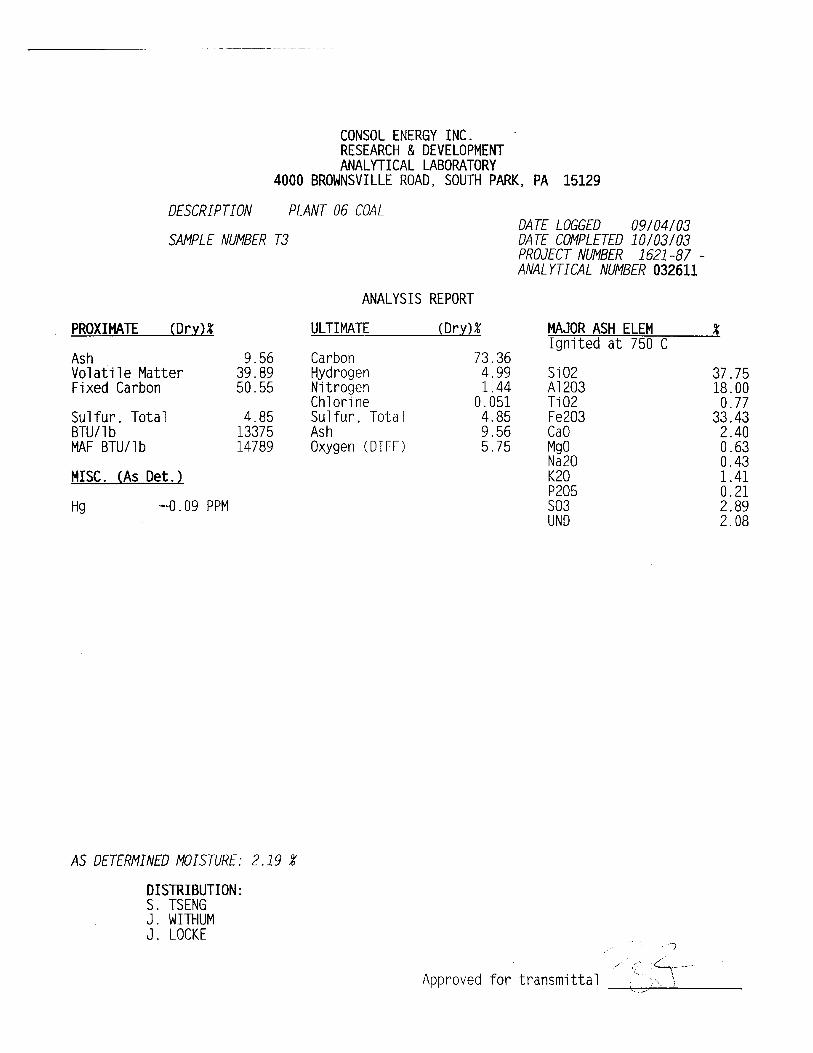
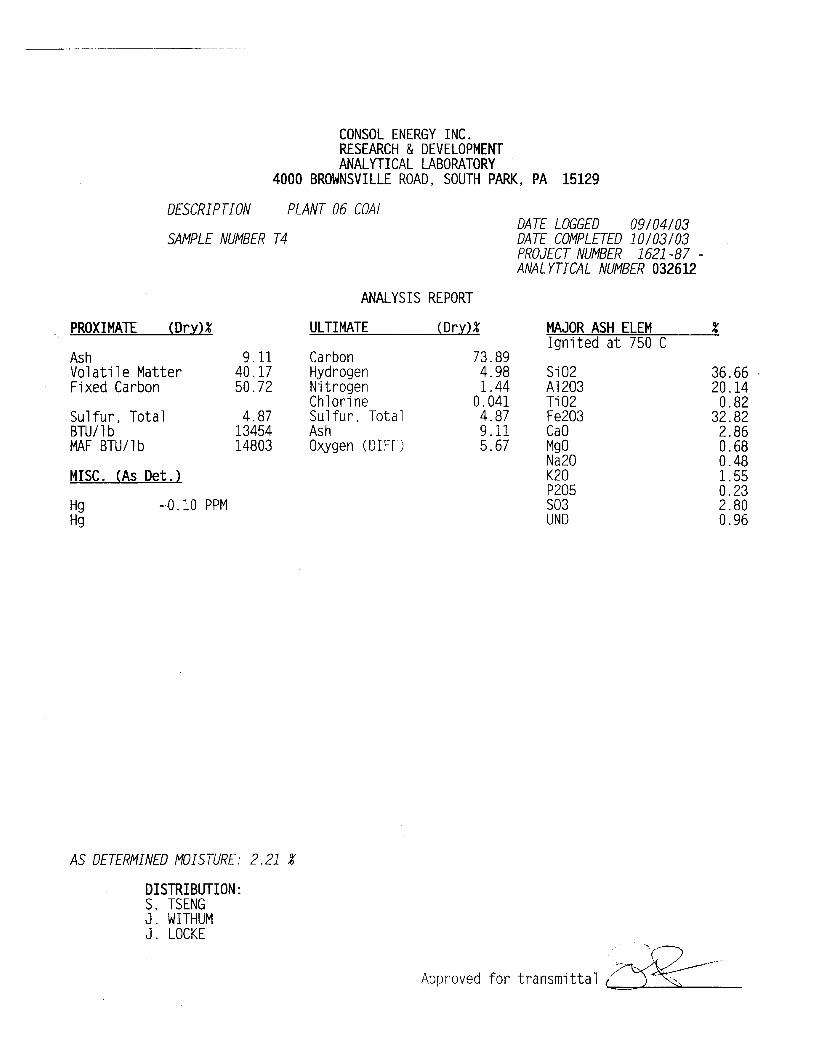
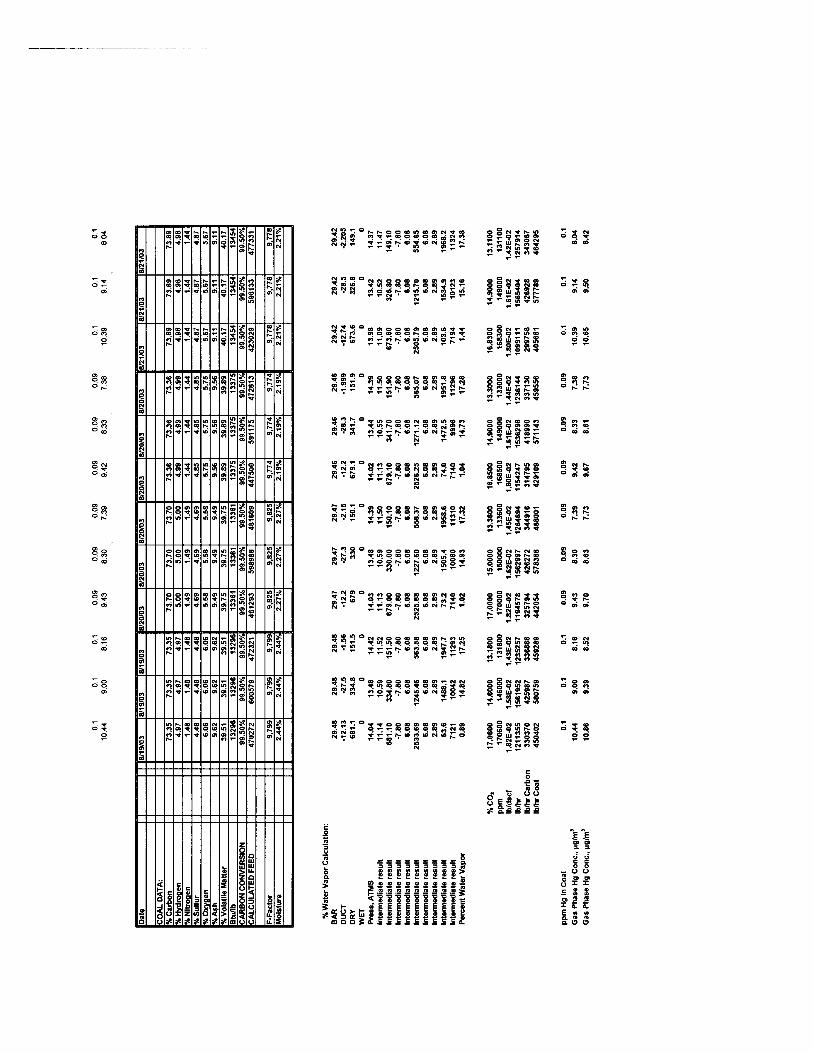
IV. Coal Sampling and Analysis CONSOL R&D and plant personnel collected coal samples with each test run. Coal samples were analyzed using a direct mercury analyzer following the procedures of ASTM Method D6722. Detailed results of the coal analyses for each test are presented in Appendix B and summarized in Table 8.
10
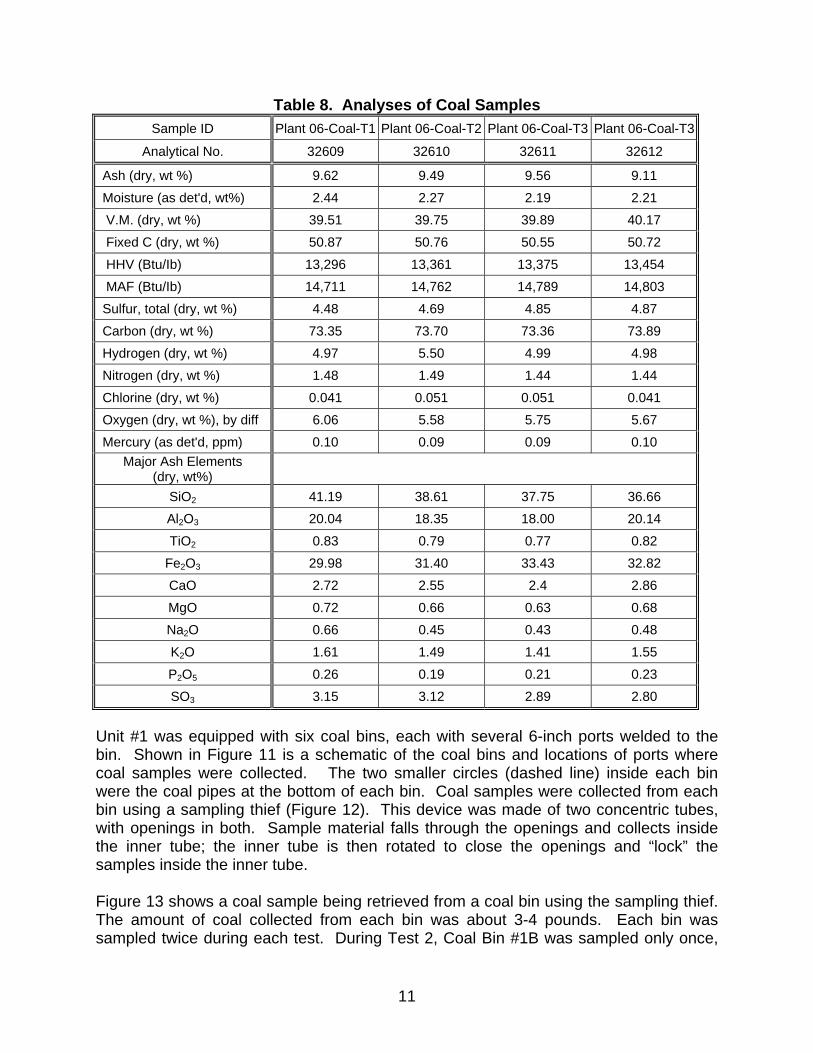
Table 8. Analyses of Coal Samples Sample ID Plant 06-Coal-T1 Plant 06-Coal-T2 Plant 06-Coal-T3 Plant 06-Coal-T3
Analytical No. 32609 32610 32611 32612
Ash (dry, wt %) 9.62 9.49 9.56 9.11
Moisture (as det'd, wt%) 2.44 2.27 2.19 2.21
V.M. (dry, wt %) 39.51 39.75 39.89 40.17
Fixed C (dry, wt %) 50.87 50.76 50.55 50.72
HHV (Btu/Ib) 13,296 13,361 13,375 13,454
MAF (Btu/Ib) 14,711 14,762 14,789 14,803
Sulfur, total (dry, wt %) 4.48 4.69 4.85 4.87
Carbon (dry, wt %) 73.35 73.70 73.36 73.89
Hydrogen (dry, wt %) 4.97 5.50 4.99 4.98
Nitrogen (dry, wt %) 1.48 1.49 1.44 1.44
Chlorine (dry, wt %) 0.041 0.051 0.051 0.041
Oxygen (dry, wt %), by diff 6.06 5.58 5.75 5.67
Mercury (as det'd, ppm) 0.10 0.09 0.09 0.10 Major Ash Elements
(dry, wt%)
SiO2 41.19 38.61 37.75 36.66 Al2O3 20.04 18.35 18.00 20.14
TiO2 0.83 0.79 0.77 0.82
Fe2O3 29.98 31.40 33.43 32.82
CaO 2.72 2.55 2.4 2.86
MgO 0.72 0.66 0.63 0.68
Na2O 0.66 0.45 0.43 0.48
K2O 1.61 1.49 1.41 1.55
P2O5 0.26 0.19 0.21 0.23
SO3 3.15 3.12 2.89 2.80
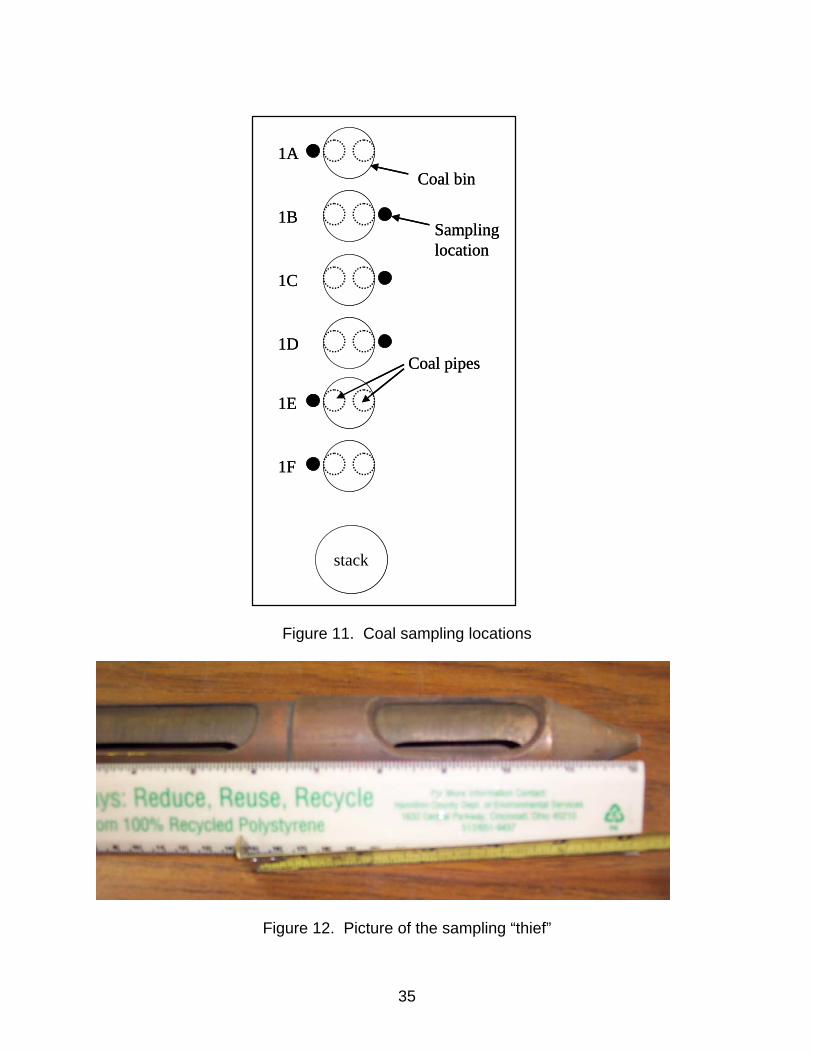
Unit #1 was equipped with six coal bins, each with several 6-inch ports welded to the bin. Shown in Figure 11 is a schematic of the coal bins and locations of ports where coal samples were collected. The two smaller circles (dashed line) inside each bin were the coal pipes at the bottom of each bin. Coal samples were collected from each bin using a sampling thief (Figure 12). This device was made of two concentric tubes, with openings in both. Sample material falls through the openings and collects inside the inner tube; the inner tube is then rotated to close the openings and “lock” the samples inside the inner tube. Figure 13 shows a coal sample being retrieved from a coal bin using the sampling thief. The amount of coal collected from each bin was about 3-4 pounds. Each bin was sampled twice during each test. During Test 2, Coal Bin #1B was sampled only once,
11
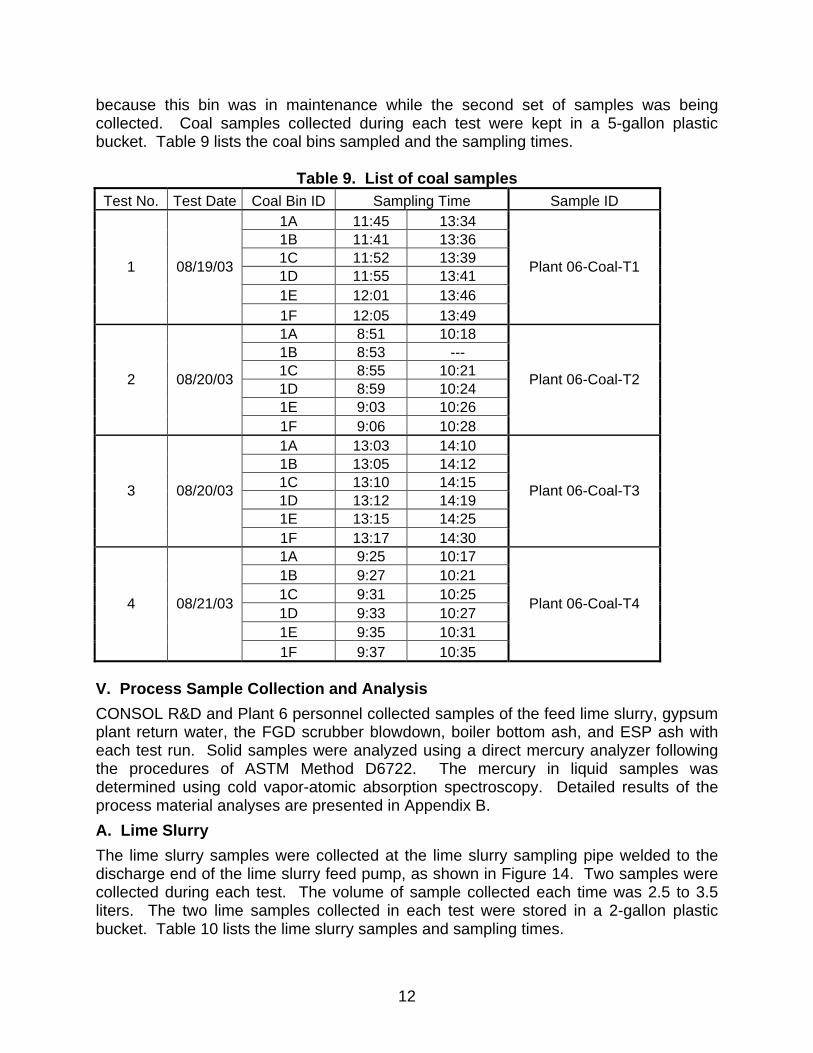
because this bin was in maintenance while the second set of samples was being collected. Coal samples collected during each test were kept in a 5-gallon plastic bucket. Table 9 lists the coal bins sampled and the sampling times.
Table 9. List of coal samples
Test No. Test Date Coal Bin ID Sampling Time Sample ID 1A 11:45 13:34 1B 11:41 13:36 1C 11:52 13:39 1D 11:55 13:41 1E 12:01 13:46
1 08/19/03
1F 12:05 13:49
Plant 06-Coal-T1
1A 8:51 10:18 1B 8:53 --- 1C 8:55 10:21 1D 8:59 10:24 1E 9:03 10:26
2 08/20/03
1F 9:06 10:28
Plant 06-Coal-T2
1A 13:03 14:10 1B 13:05 14:12 1C 13:10 14:15 1D 13:12 14:19 1E 13:15 14:25
3 08/20/03
1F 13:17 14:30
Plant 06-Coal-T3
1A 9:25 10:17 1B 9:27 10:21 1C 9:31 10:25 1D 9:33 10:27 1E 9:35 10:31
4 08/21/03
1F 9:37 10:35
Plant 06-Coal-T4
V. Process Sample Collection and Analysis CONSOL R&D and Plant 6 personnel collected samples of the feed lime slurry, gypsum plant return water, the FGD scrubber blowdown, boiler bottom ash, and ESP ash with each test run. Solid samples were analyzed using a direct mercury analyzer following the procedures of ASTM Method D6722. The mercury in liquid samples was determined using cold vapor-atomic absorption spectroscopy. Detailed results of the process material analyses are presented in Appendix B. A. Lime Slurry The lime slurry samples were collected at the lime slurry sampling pipe welded to the discharge end of the lime slurry feed pump, as shown in Figure 14. Two samples were collected during each test. The volume of sample collected each time was 2.5 to 3.5 liters. The two lime samples collected in each test were stored in a 2-gallon plastic bucket. Table 10 lists the lime slurry samples and sampling times.
12
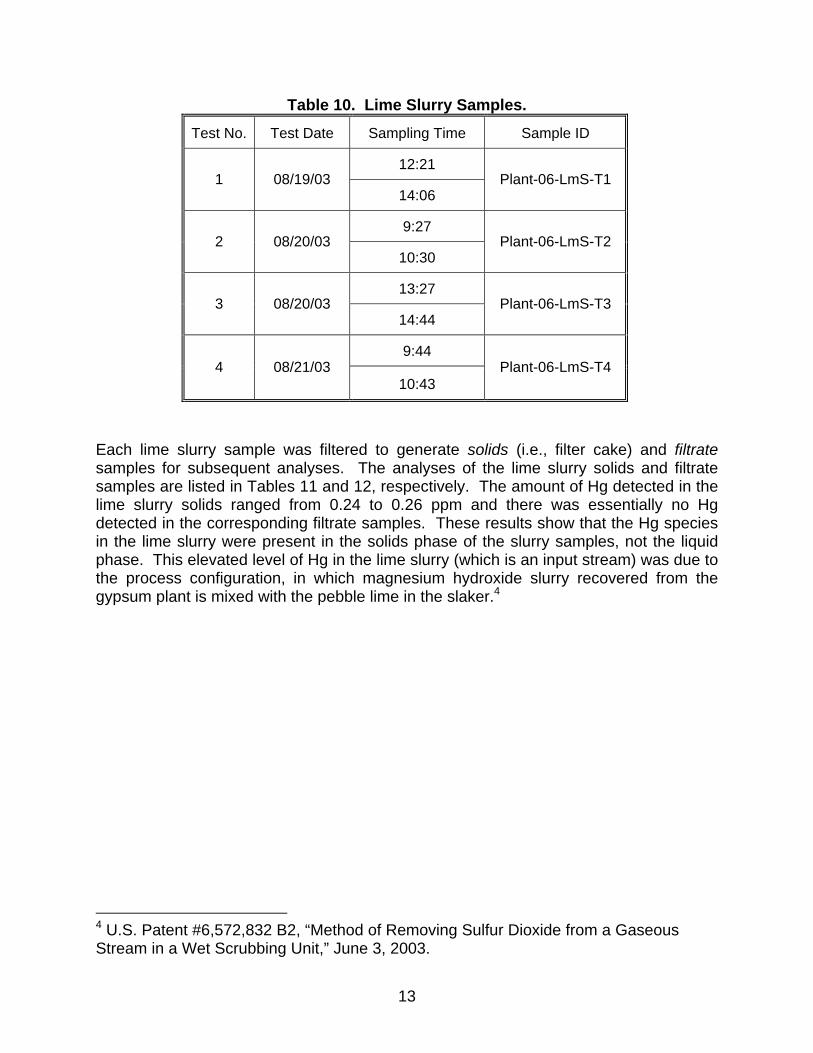
Table 10. Lime Slurry Samples.
Test No. Test Date Sampling Time Sample ID
12:21 1 08/19/03
14:06 Plant-06-LmS-T1
9:27 2 08/20/03
10:30 Plant-06-LmS-T2
13:27 3 08/20/03
14:44 Plant-06-LmS-T3
9:44 4 08/21/03
10:43 Plant-06-LmS-T4
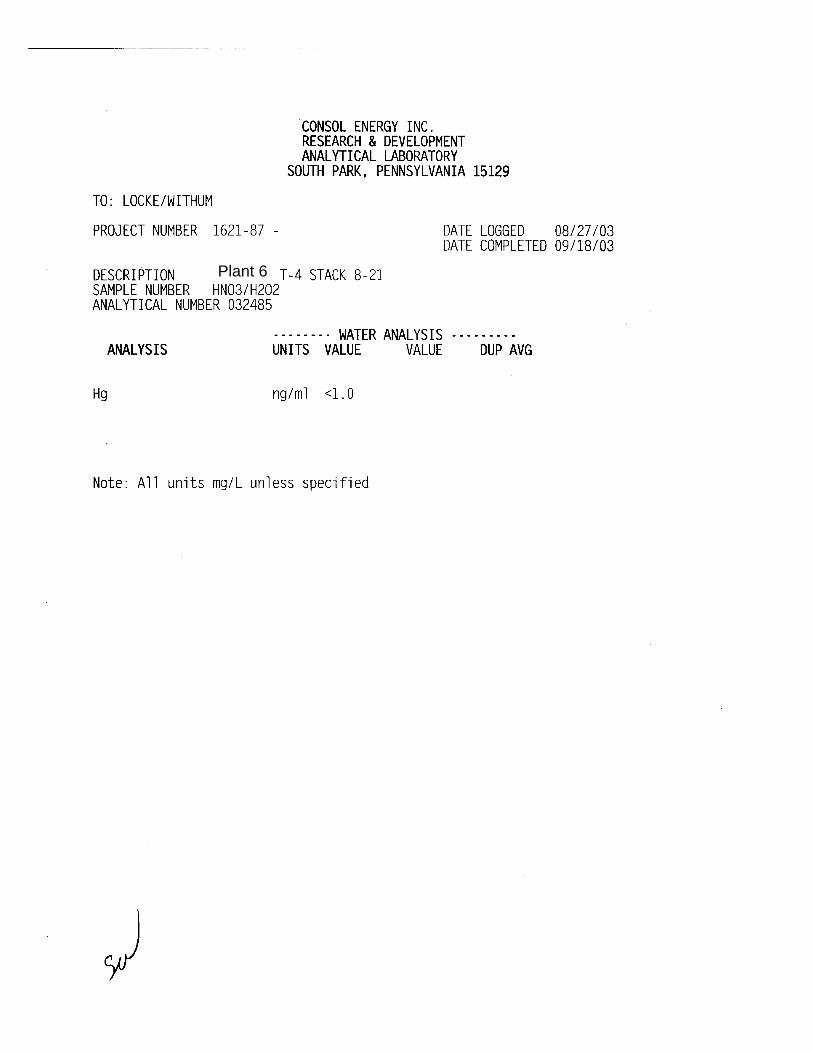
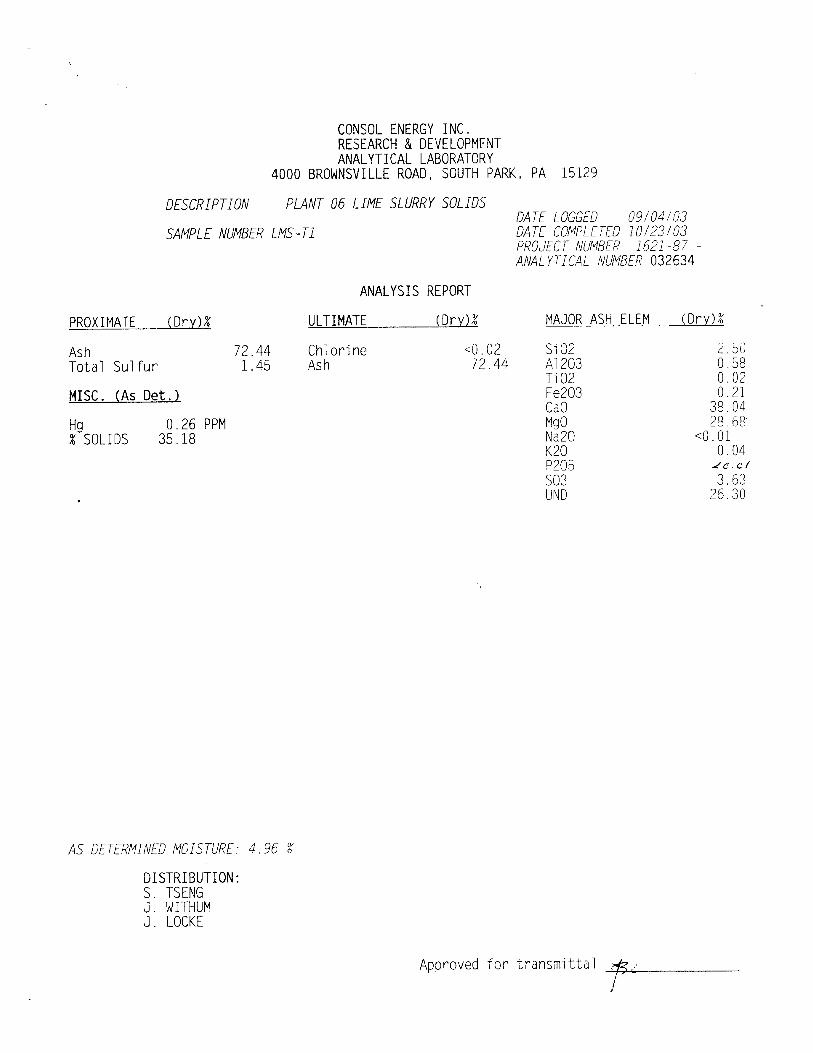
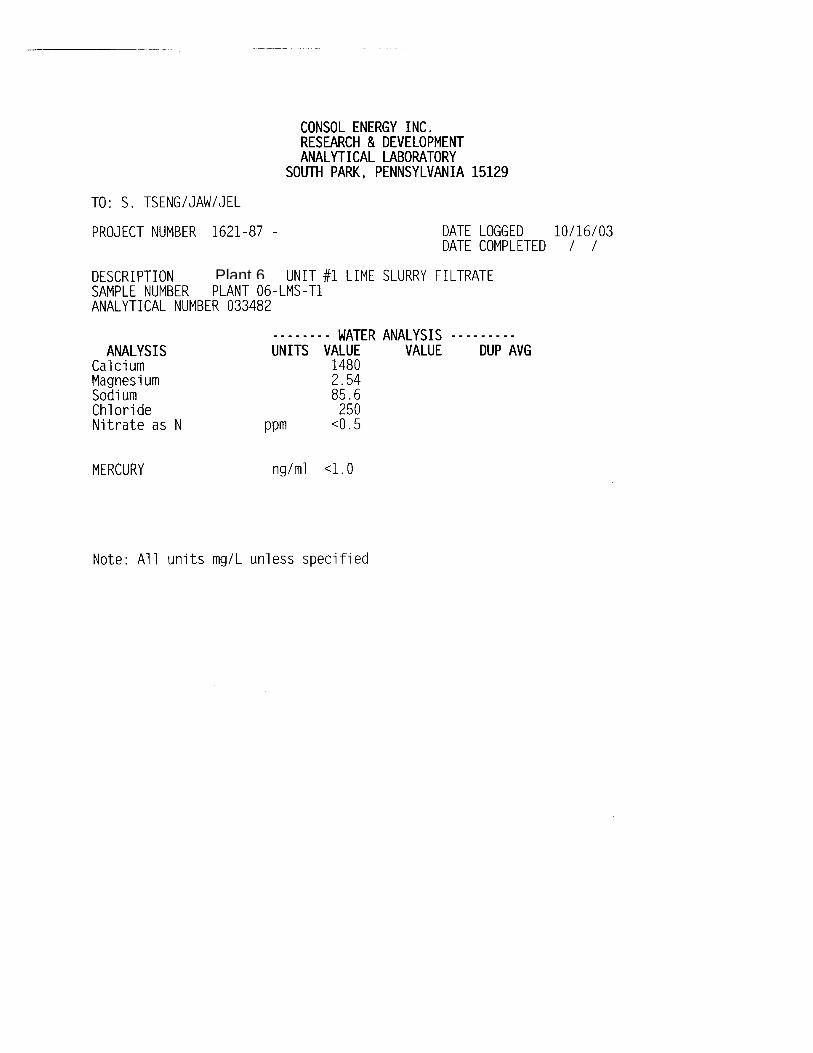
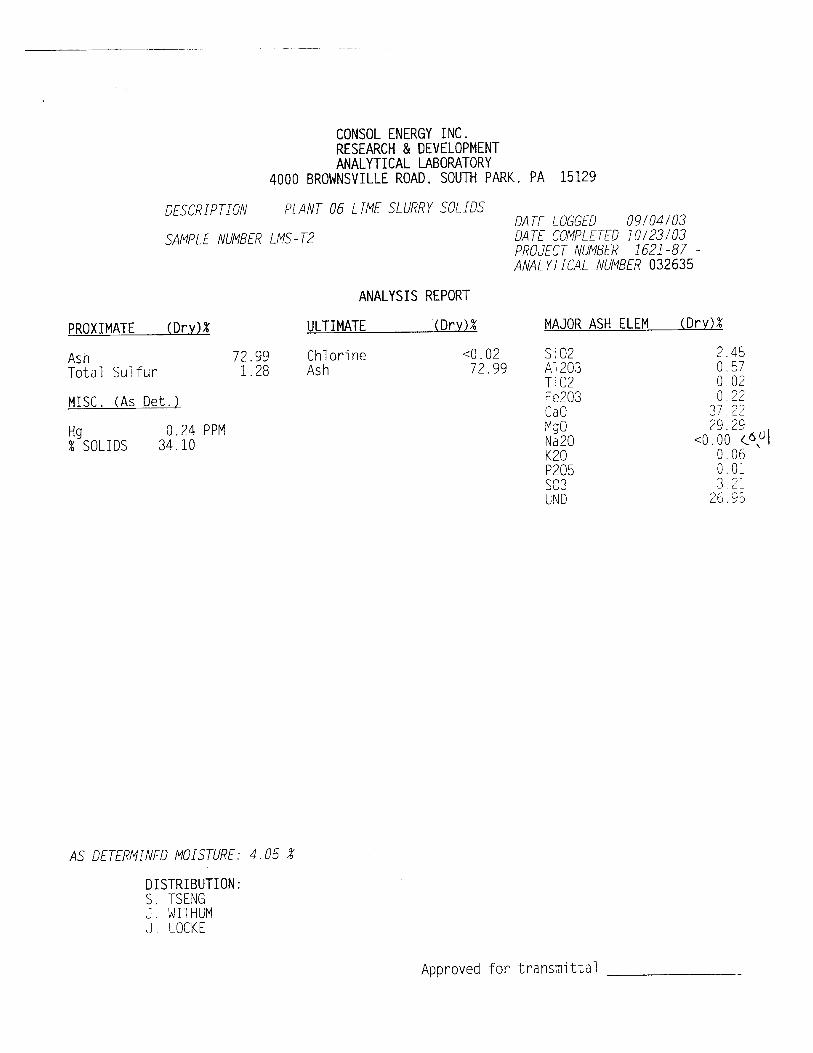
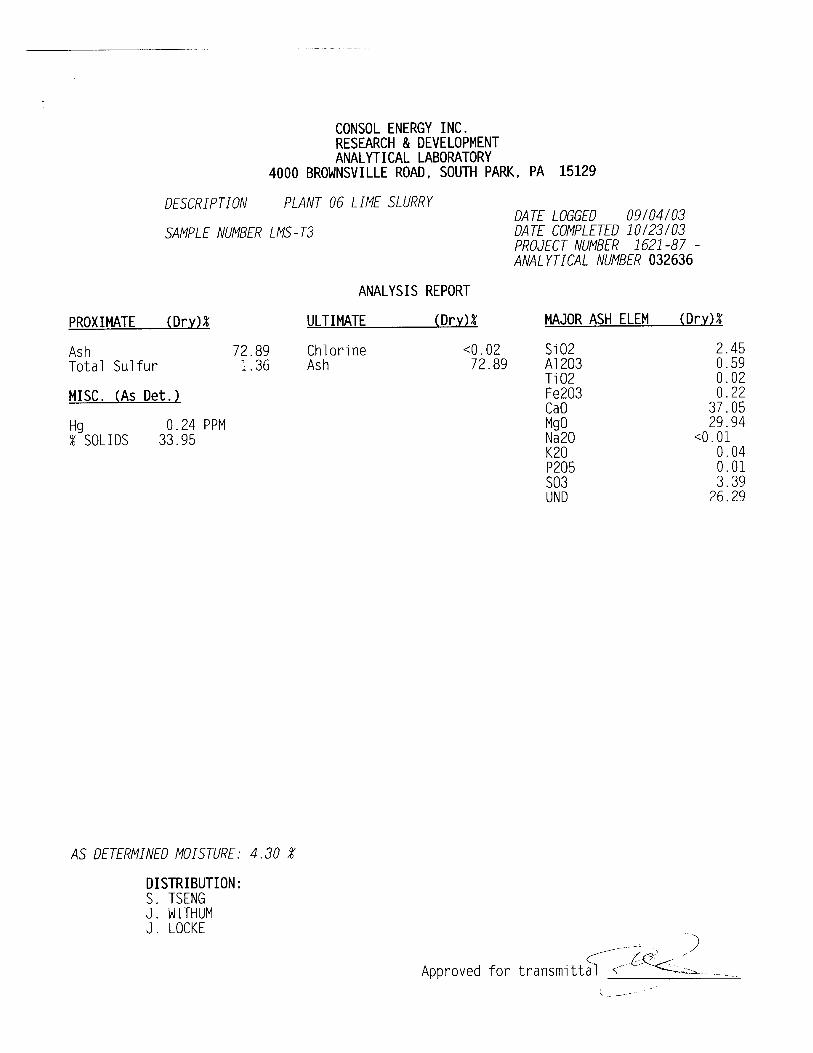
Each lime slurry sample was filtered to generate solids (i.e., filter cake) and filtrate samples for subsequent analyses. The analyses of the lime slurry solids and filtrate samples are listed in Tables 11 and 12, respectively. The amount of Hg detected in the lime slurry solids ranged from 0.24 to 0.26 ppm and there was essentially no Hg detected in the corresponding filtrate samples. These results show that the Hg species in the lime slurry were present in the solids phase of the slurry samples, not the liquid phase. This elevated level of Hg in the lime slurry (which is an input stream) was due to the process configuration, in which magnesium hydroxide slurry recovered from the gypsum plant is mixed with the pebble lime in the slaker.4
4 U.S. Patent #6,572,832 B2, “Method of Removing Sulfur Dioxide from a Gaseous Stream in a Wet Scrubbing Unit,” June 3, 2003.
13
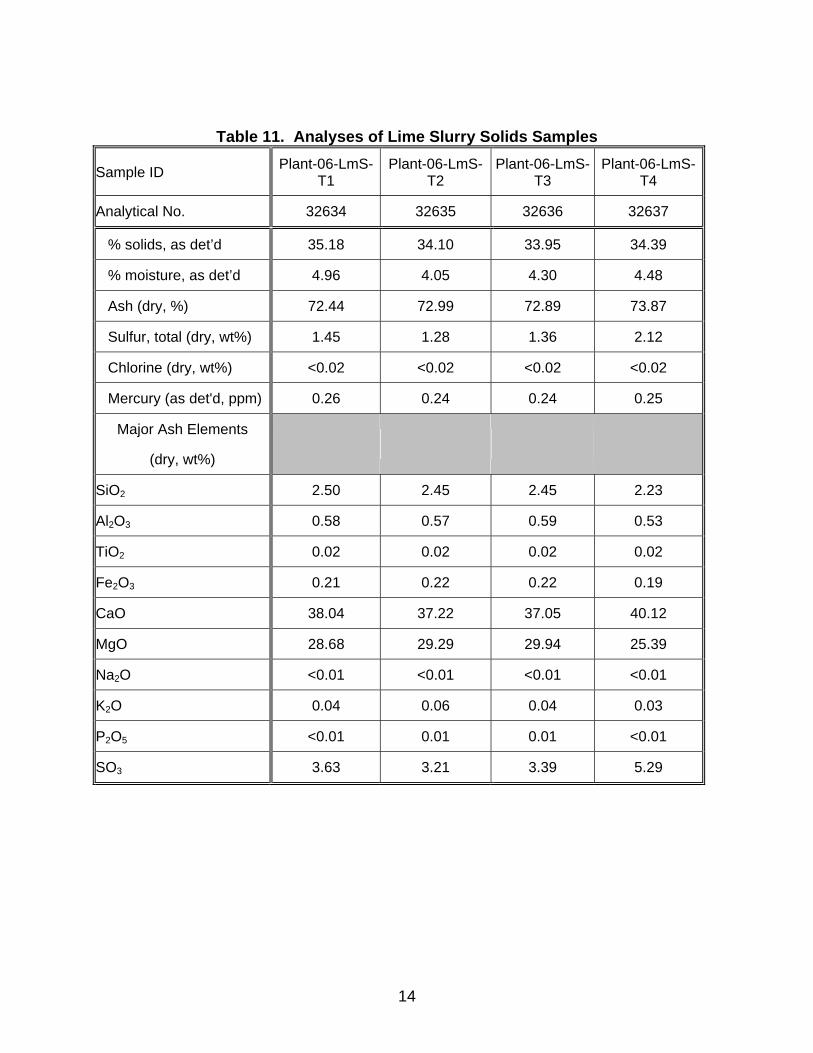
Table 11. Analyses of Lime Slurry Solids Samples
Sample ID Plant-06-LmS-T1
Plant-06-LmS-T2
Plant-06-LmS-T3
Plant-06-LmS-T4
Analytical No. 32634 32635 32636 32637
% solids, as det’d 35.18 34.10 33.95 34.39
% moisture, as det’d 4.96 4.05 4.30 4.48
Ash (dry, %) 72.44 72.99 72.89 73.87
Sulfur, total (dry, wt%) 1.45 1.28 1.36 2.12
Chlorine (dry, wt%) <0.02 <0.02 <0.02 <0.02
Mercury (as det'd, ppm) 0.26 0.24 0.24 0.25
Major Ash Elements
(dry, wt%)
SiO2 2.50 2.45 2.45 2.23
Al2O3 0.58 0.57 0.59 0.53
TiO2 0.02 0.02 0.02 0.02
Fe2O3 0.21 0.22 0.22 0.19
CaO 38.04 37.22 37.05 40.12
MgO 28.68 29.29 29.94 25.39
Na2O <0.01 <0.01 <0.01 <0.01
K2O 0.04 0.06 0.04 0.03
P2O5 <0.01 0.01 0.01 <0.01
SO3 3.63 3.21 3.39 5.29
14
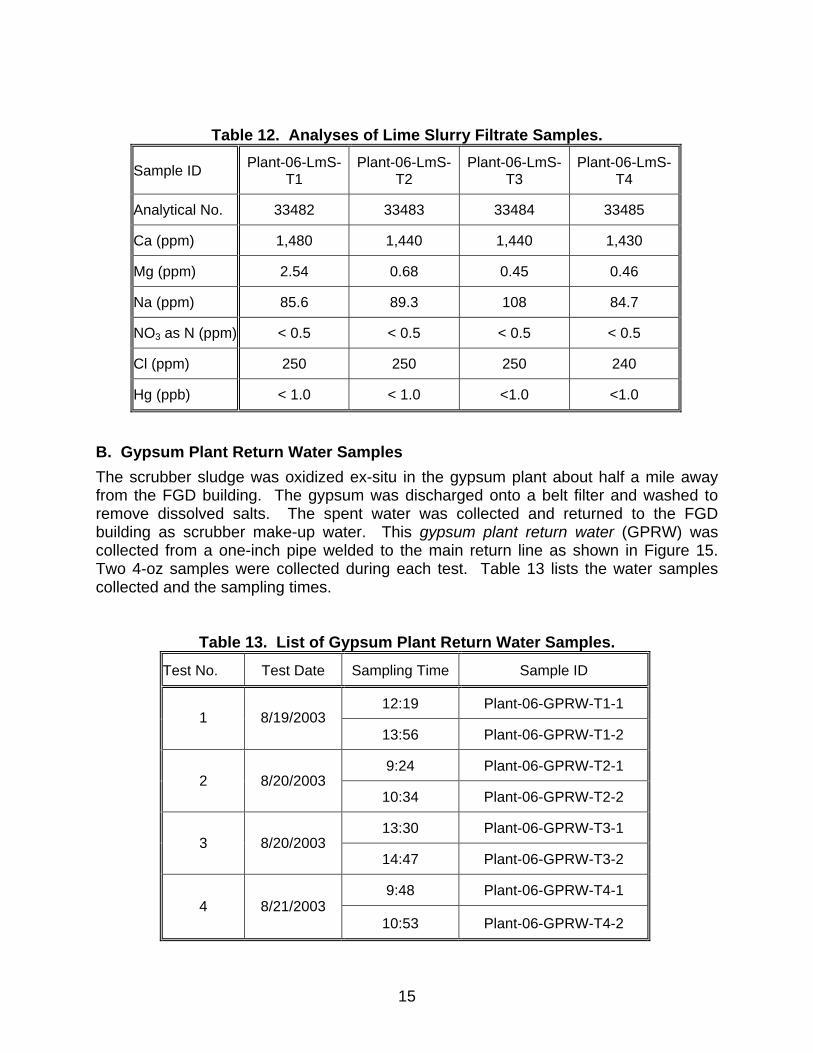
Table 12. Analyses of Lime Slurry Filtrate Samples.
Sample ID Plant-06-LmS-T1
Plant-06-LmS-T2
Plant-06-LmS-T3
Plant-06-LmS-T4
Analytical No. 33482 33483 33484 33485
Ca (ppm) 1,480 1,440 1,440 1,430
Mg (ppm) 2.54 0.68 0.45 0.46
Na (ppm) 85.6 89.3 108 84.7
NO3 as N (ppm) < 0.5 < 0.5 < 0.5 < 0.5
Cl (ppm) 250 250 250 240
Hg (ppb) < 1.0 < 1.0 <1.0 <1.0
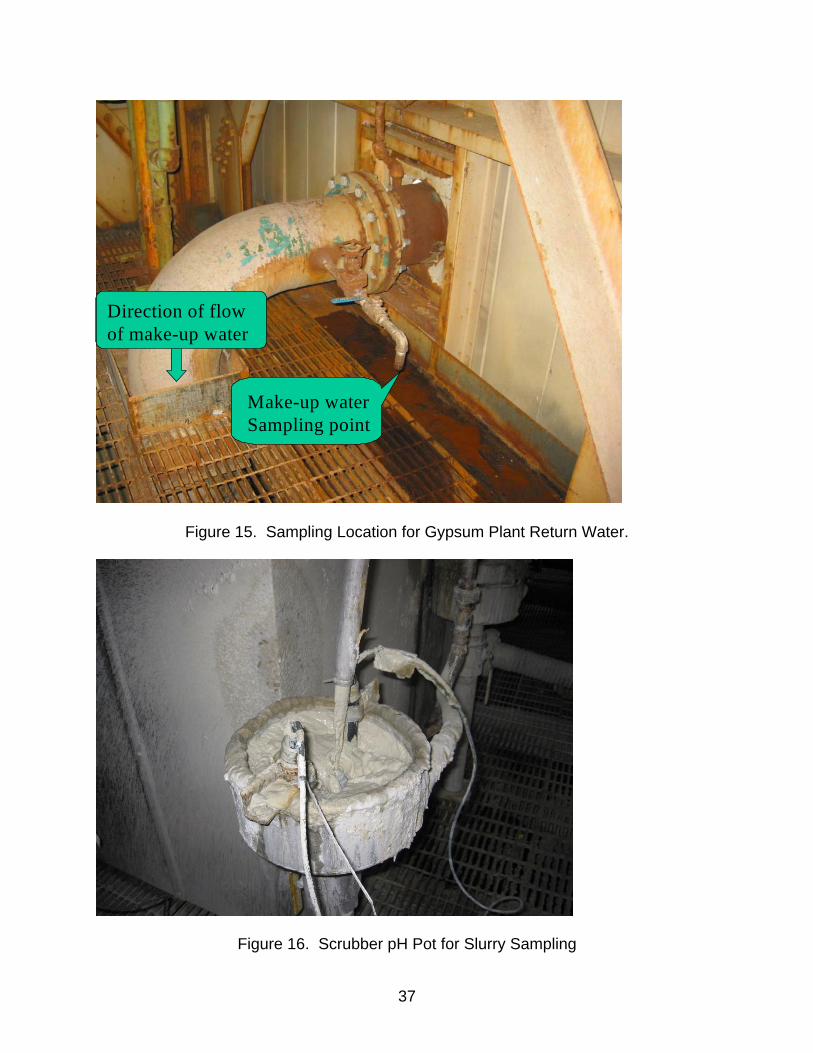
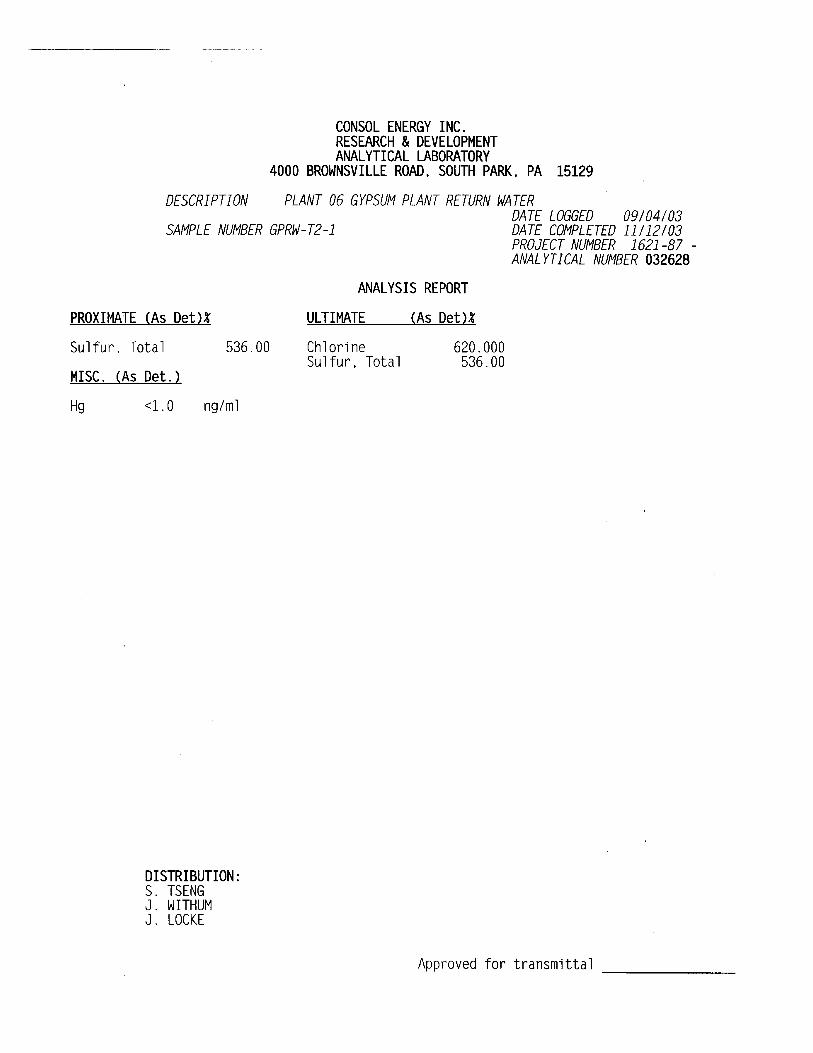
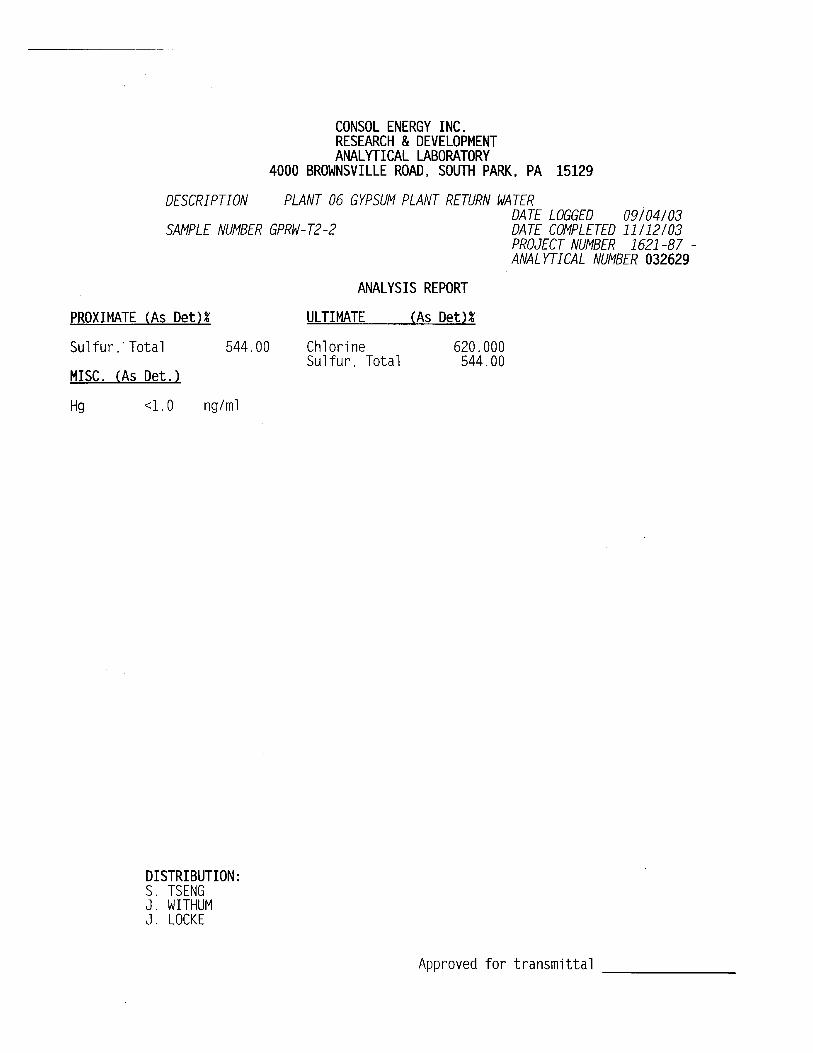
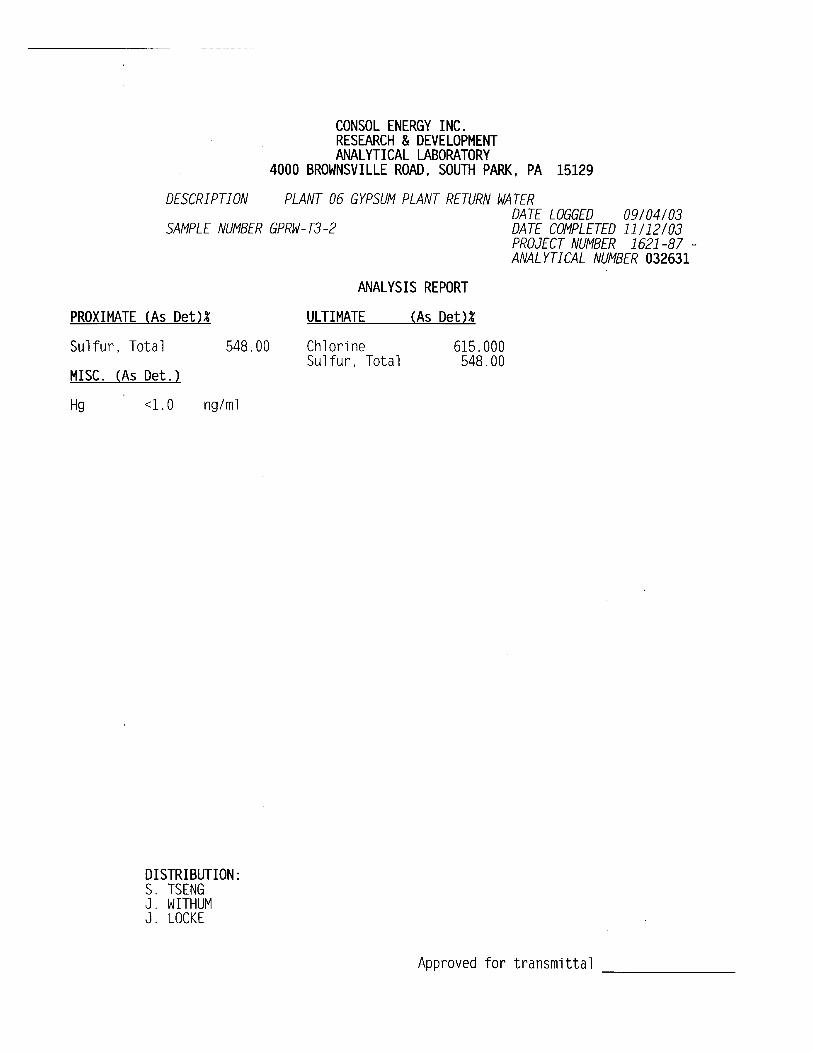
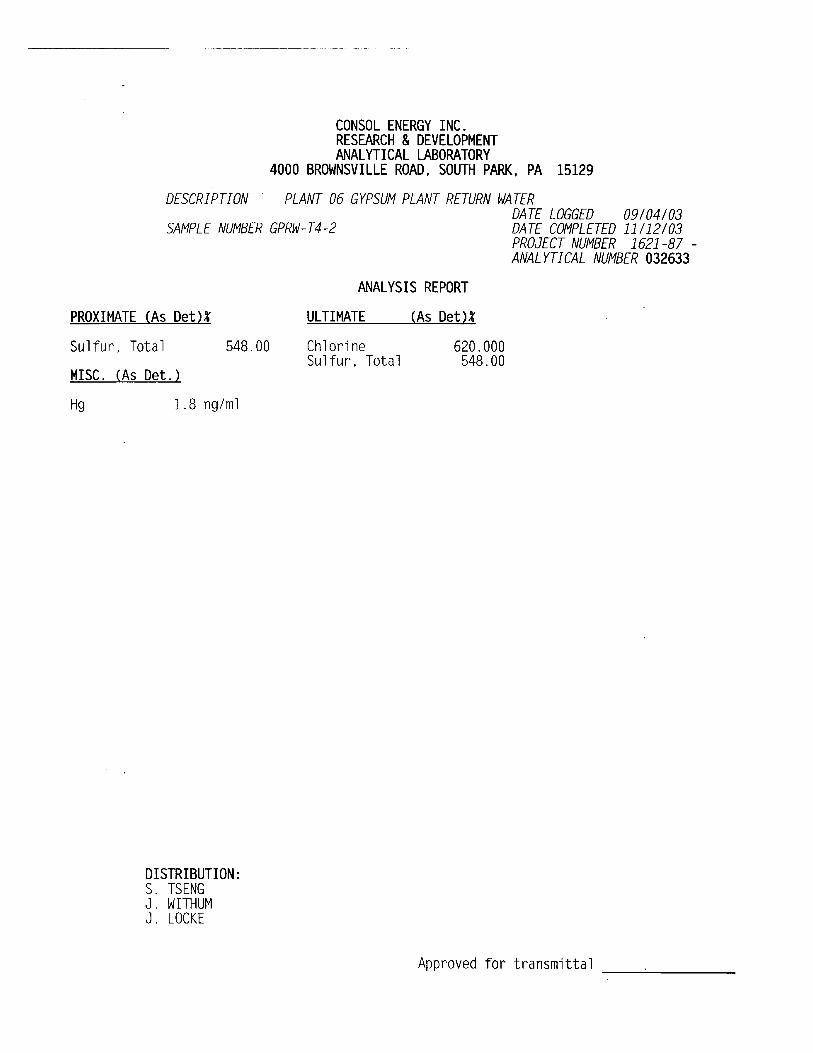
B. Gypsum Plant Return Water Samples The scrubber sludge was oxidized ex-situ in the gypsum plant about half a mile away from the FGD building. The gypsum was discharged onto a belt filter and washed to remove dissolved salts. The spent water was collected and returned to the FGD building as scrubber make-up water. This gypsum plant return water (GPRW) was collected from a one-inch pipe welded to the main return line as shown in Figure 15. Two 4-oz samples were collected during each test. Table 13 lists the water samples collected and the sampling times.
Table 13. List of Gypsum Plant Return Water Samples.
Test No. Test Date Sampling Time Sample ID
12:19 Plant-06-GPRW-T1-1 1 8/19/2003
13:56 Plant-06-GPRW-T1-2
9:24 Plant-06-GPRW-T2-1 2 8/20/2003
10:34 Plant-06-GPRW-T2-2
13:30 Plant-06-GPRW-T3-1 3 8/20/2003
14:47 Plant-06-GPRW-T3-2
9:48 Plant-06-GPRW-T4-1 4 8/21/2003
10:53 Plant-06-GPRW-T4-2
15
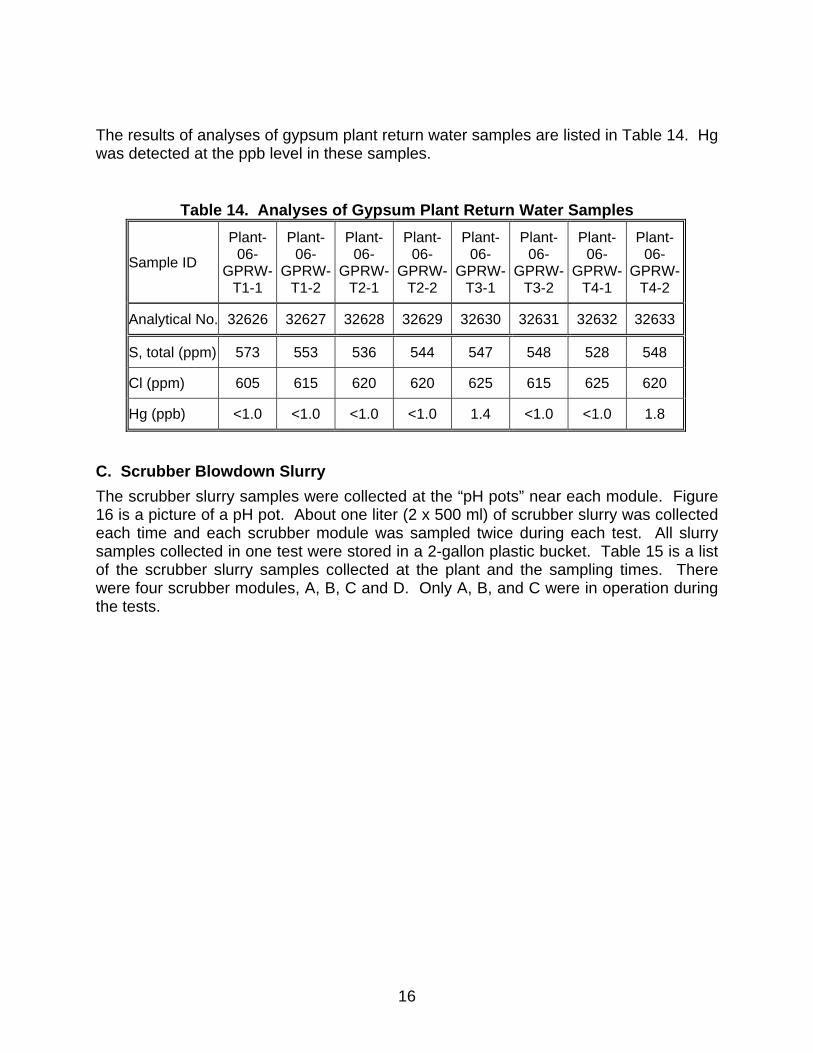
The results of analyses of gypsum plant return water samples are listed in Table 14. Hg was detected at the ppb level in these samples.
Table 14. Analyses of Gypsum Plant Return Water Samples
Sample ID
Plant-06-
GPRW-T1-1
Plant-06-
GPRW-T1-2
Plant-06-
GPRW-T2-1
Plant-06-
GPRW-T2-2
Plant-06-
GPRW-T3-1
Plant-06-
GPRW-T3-2
Plant-06-
GPRW-T4-1
Plant-06-
GPRW-T4-2
Analytical No. 32626 32627 32628 32629 32630 32631 32632 32633
S, total (ppm) 573 553 536 544 547 548 528 548
Cl (ppm) 605 615 620 620 625 615 625 620
Hg (ppb) <1.0 <1.0 <1.0 <1.0 1.4 <1.0 <1.0 1.8
C. Scrubber Blowdown Slurry The scrubber slurry samples were collected at the “pH pots” near each module. Figure 16 is a picture of a pH pot. About one liter (2 x 500 ml) of scrubber slurry was collected each time and each scrubber module was sampled twice during each test. All slurry samples collected in one test were stored in a 2-gallon plastic bucket. Table 15 is a list of the scrubber slurry samples collected at the plant and the sampling times. There were four scrubber modules, A, B, C and D. Only A, B, and C were in operation during the tests.
16

Table 15. List of Scrubber Slurry Samples.
Test No. Test Date Moduel ID Sampling Time Sample ID1A 12:221B 12:241C 12:251A 13:571B 13:581C 14:001A 9:151B 9:171C 9:201A 10:311B 10:321C 10:331A 13:331B 13:341C 13:351A 14:491B 14:501C 14:511A 9:511B 9:521C 9:531A 10:481B 10:501C 10:50
Plant 06-FGD-T1
Plant 06-FGD-T2
Plant 06-FGD-T3
Plant 06-FGD-T4
1
2
4
3
08/19/03
08/20/03
08/20/03
08/21/03
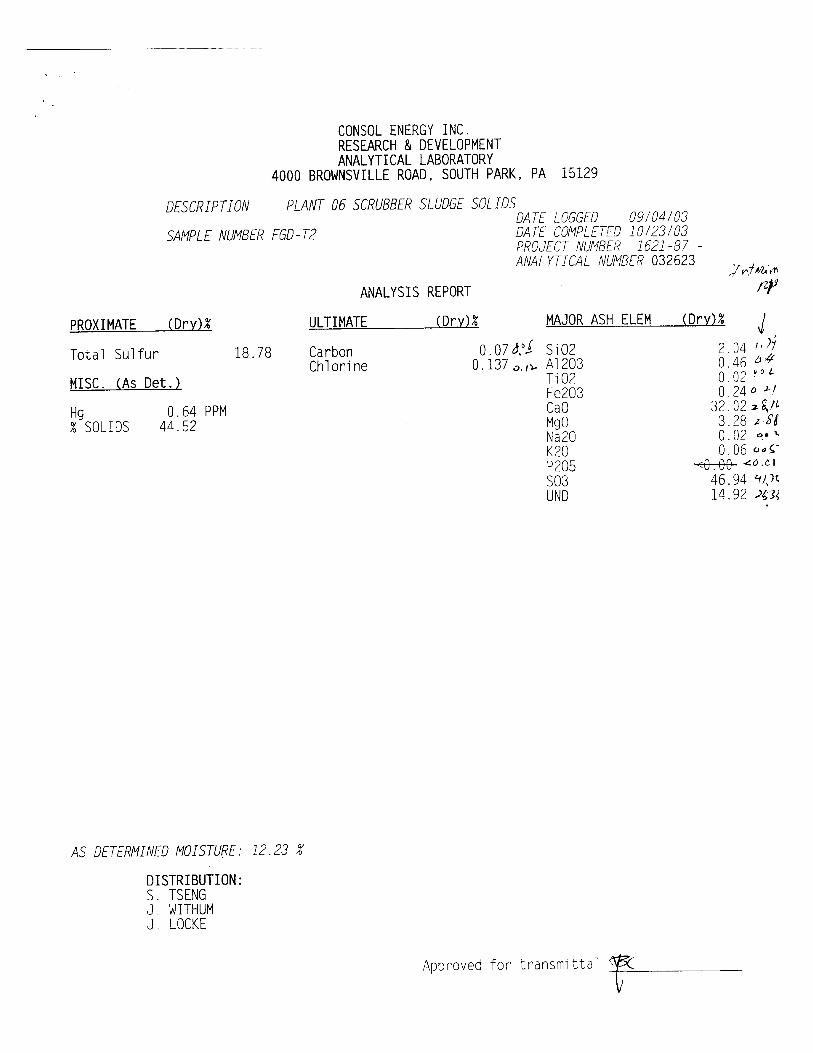
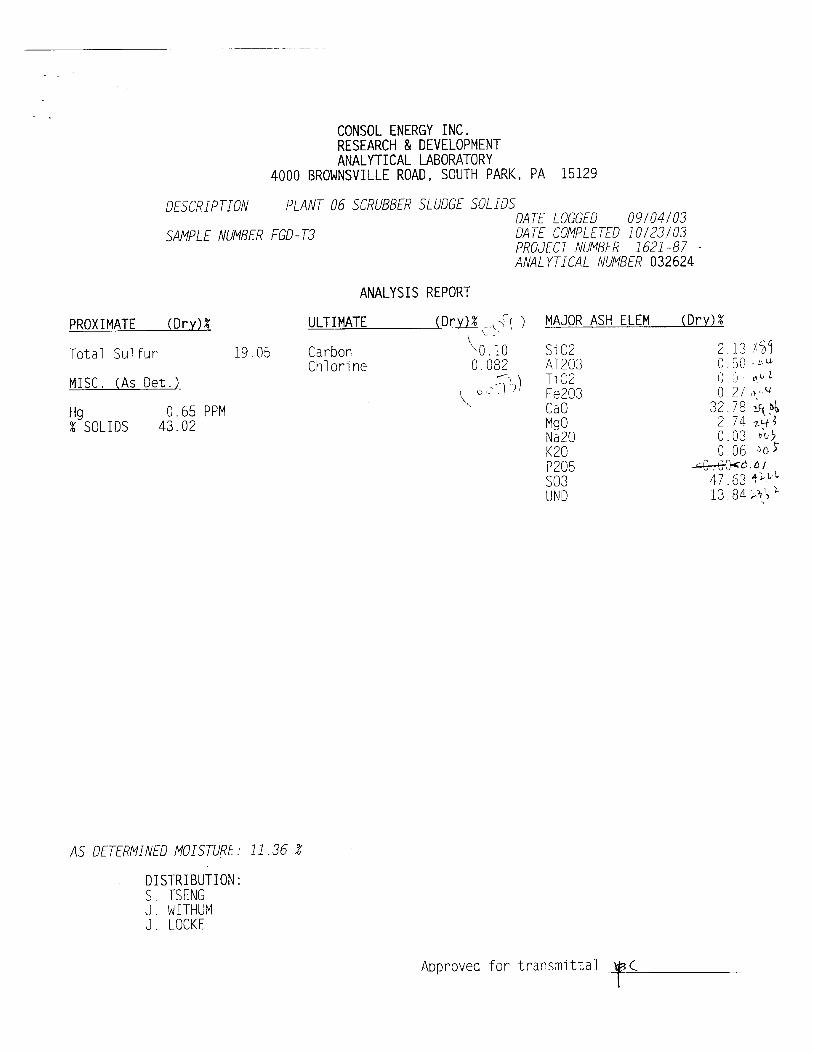
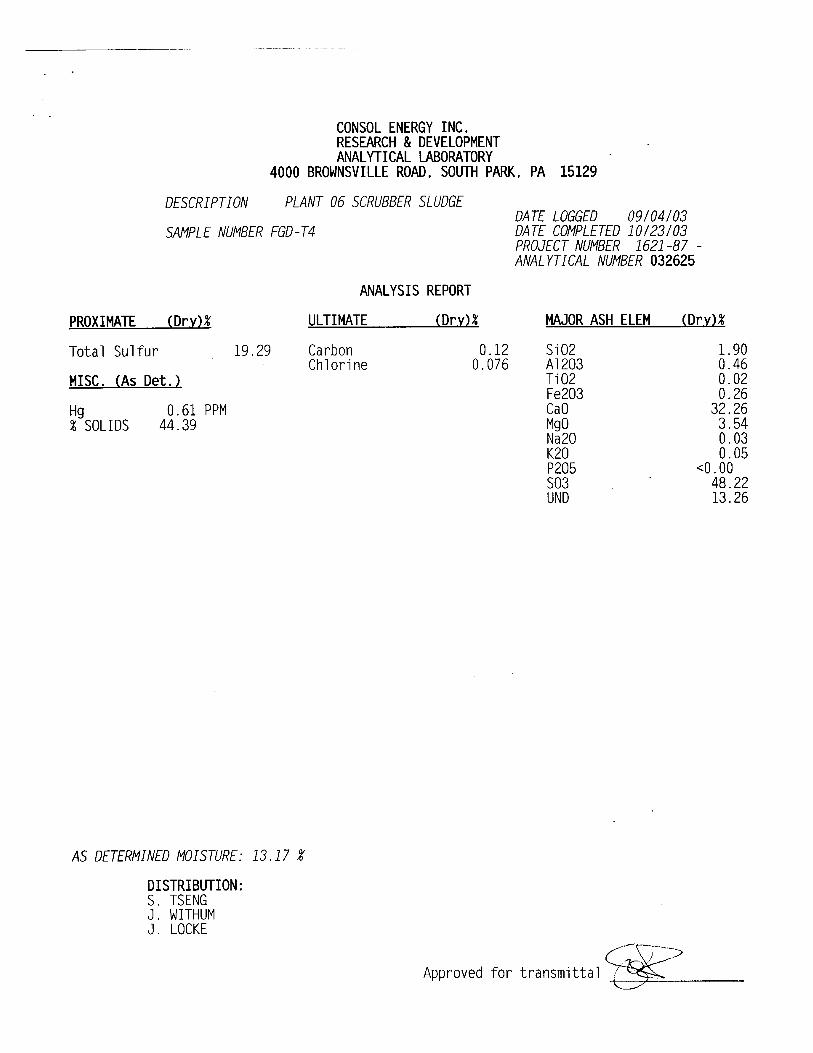
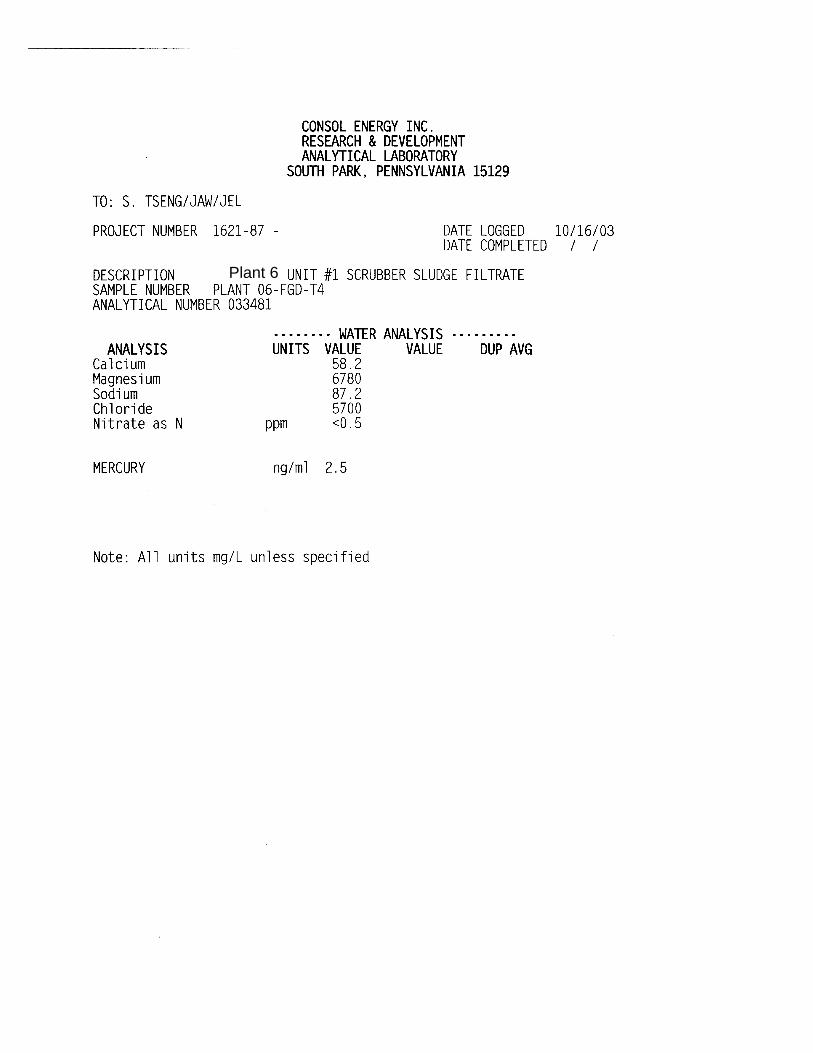
Tables 16 and 17 list the scrubber slurry solids (i.e., filter cake) analyses and filtrate samples analyses, respectively. The Hg detected in the scrubber slurry solids samples ranged from 0.61 to 0.73 ppm, while the amount of Hg detected in the corresponding filtrate portions were at the ppb levels, which indicates that essentially all of the Hg in the scrubber slurry was present in the slurry solids.
17

Table 16. Analyses of Scrubber Slurry Solids Samples.
Sample ID Plant 06-FGD-T1
Plant 06-FGD-T2
Plant 06-FGD-T3
Plant 06-FGD-T4
Analytical No. 32622 32623 32624 32625
% Solids in org. slurry sample 19.06 18.90 18.65 19.91
% Solids in filtered cake 42.56 44.52 43.02 44.39
% Moisture in air-dried sample 12.15 12.23 11.36 13.17
Carbon (dry, %) 0.13 0.07 0.10 0.12
Sulfur, total (%) 19.27 18.78 19.05 19.29
Chlorine (dry, %) 0.114 0.137 0.082 0.076
Mercury (ppm) 0.73 0.64 0.65 0.61
Major Ash Element (%)
SiO2 2.57 2.04 2.13 1.90
Al2O3 0.55 0.46 0.50 0.46
TiO2 0.02 0.02 0.02 0.02
Fe2O3 0.30 0.24 0.27 0.26
CaO 32.70 32.02 32.78 32.26
MgO 3.03 3.28 2.74 3.54
Na2O 0.02 0.02 0.03 0.03
K2O 0.06 0.06 0.06 0.05
P2O5 <0.01 <0.01 <0.01 <0.01
SO3 48.18 46.94 47.63 48.22
UND 12.57 14.92 13.84 13.26
18
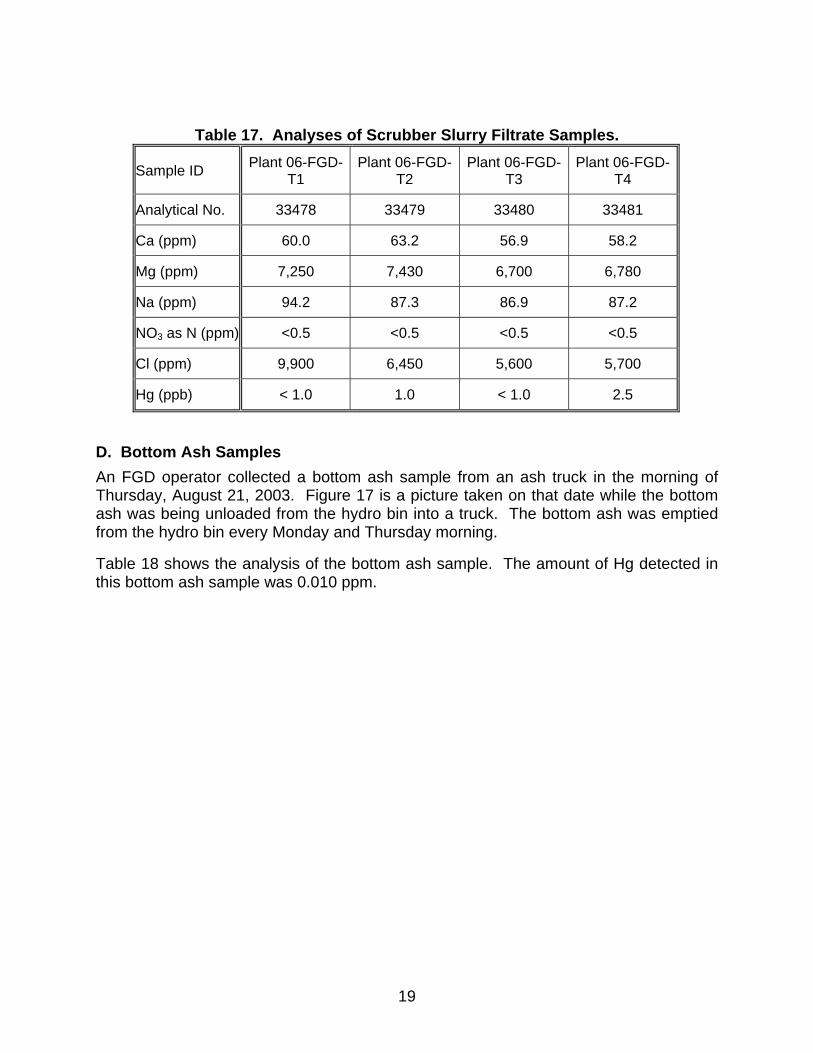
Table 17. Analyses of Scrubber Slurry Filtrate Samples.
Sample ID Plant 06-FGD-T1
Plant 06-FGD-T2
Plant 06-FGD-T3
Plant 06-FGD-T4
Analytical No. 33478 33479 33480 33481
Ca (ppm) 60.0 63.2 56.9 58.2
Mg (ppm) 7,250 7,430 6,700 6,780
Na (ppm) 94.2 87.3 86.9 87.2
NO3 as N (ppm) <0.5 <0.5 <0.5 <0.5
Cl (ppm) 9,900 6,450 5,600 5,700
Hg (ppb) < 1.0 1.0 < 1.0 2.5
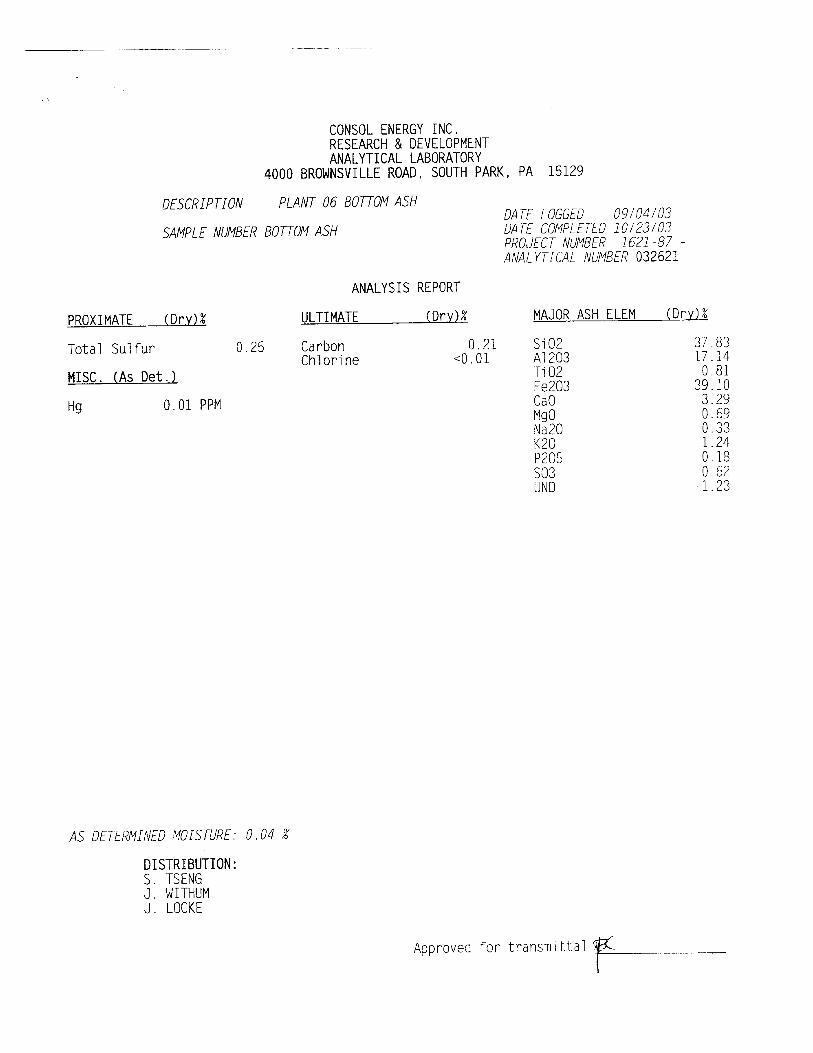
D. Bottom Ash Samples An FGD operator collected a bottom ash sample from an ash truck in the morning of Thursday, August 21, 2003. Figure 17 is a picture taken on that date while the bottom ash was being unloaded from the hydro bin into a truck. The bottom ash was emptied from the hydro bin every Monday and Thursday morning.
Table 18 shows the analysis of the bottom ash sample. The amount of Hg detected in this bottom ash sample was 0.010 ppm.
19
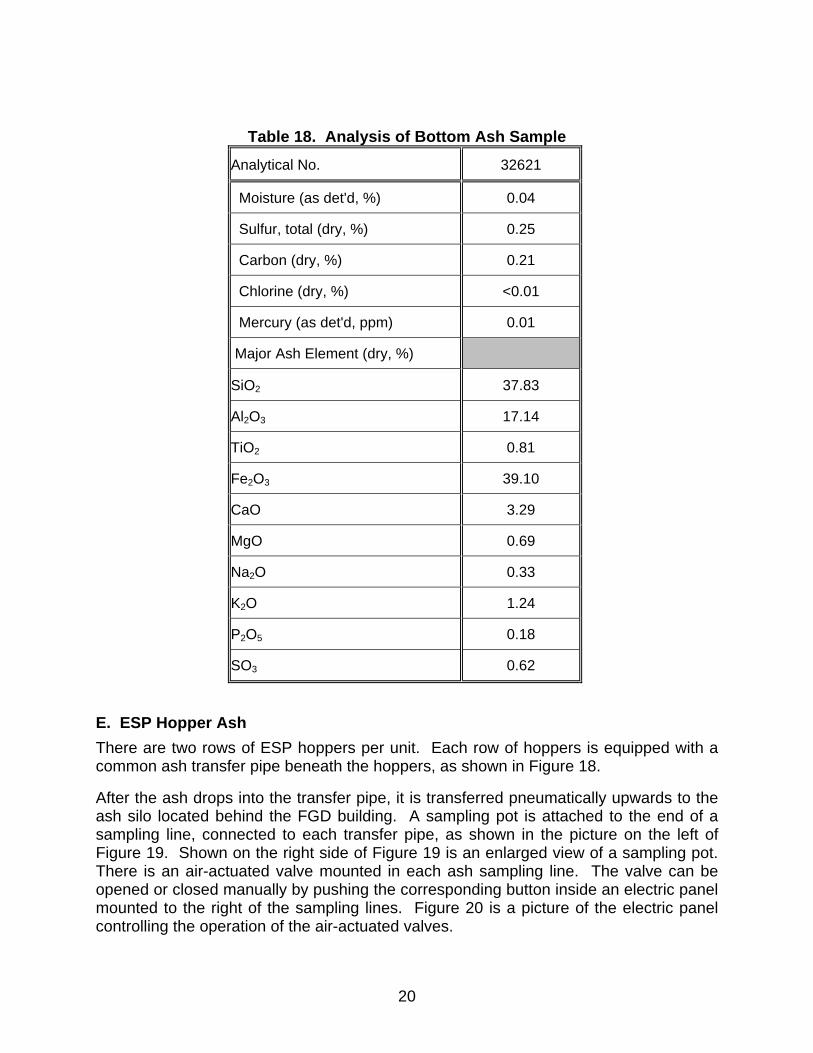
Table 18. Analysis of Bottom Ash Sample
Analytical No. 32621
Moisture (as det'd, %) 0.04
Sulfur, total (dry, %) 0.25
Carbon (dry, %) 0.21
Chlorine (dry, %) <0.01
Mercury (as det'd, ppm) 0.01
Major Ash Element (dry, %)
SiO2 37.83
Al2O3 17.14
TiO2 0.81
Fe2O3 39.10
CaO 3.29
MgO 0.69
Na2O 0.33
K2O 1.24
P2O5 0.18
SO3 0.62
E. ESP Hopper Ash There are two rows of ESP hoppers per unit. Each row of hoppers is equipped with a common ash transfer pipe beneath the hoppers, as shown in Figure 18.
After the ash drops into the transfer pipe, it is transferred pneumatically upwards to the ash silo located behind the FGD building. A sampling pot is attached to the end of a sampling line, connected to each transfer pipe, as shown in the picture on the left of Figure 19. Shown on the right side of Figure 19 is an enlarged view of a sampling pot. There is an air-actuated valve mounted in each ash sampling line. The valve can be opened or closed manually by pushing the corresponding button inside an electric panel mounted to the right of the sampling lines. Figure 20 is a picture of the electric panel controlling the operation of the air-actuated valves.
20
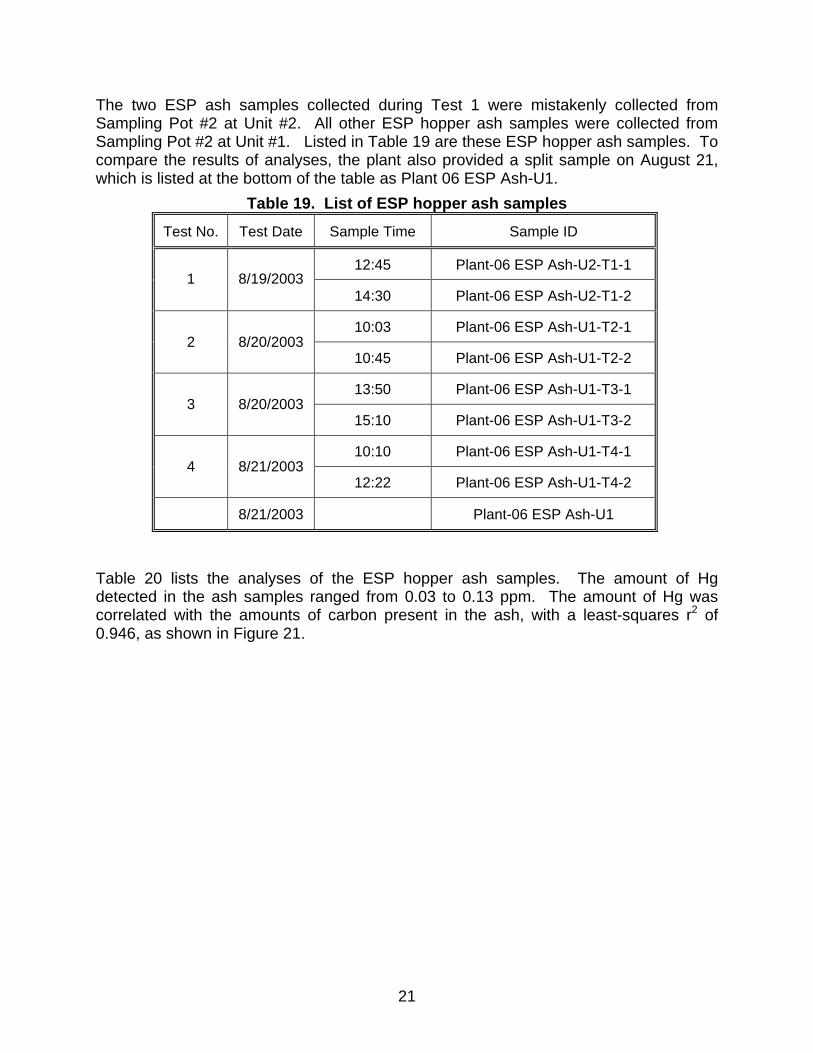
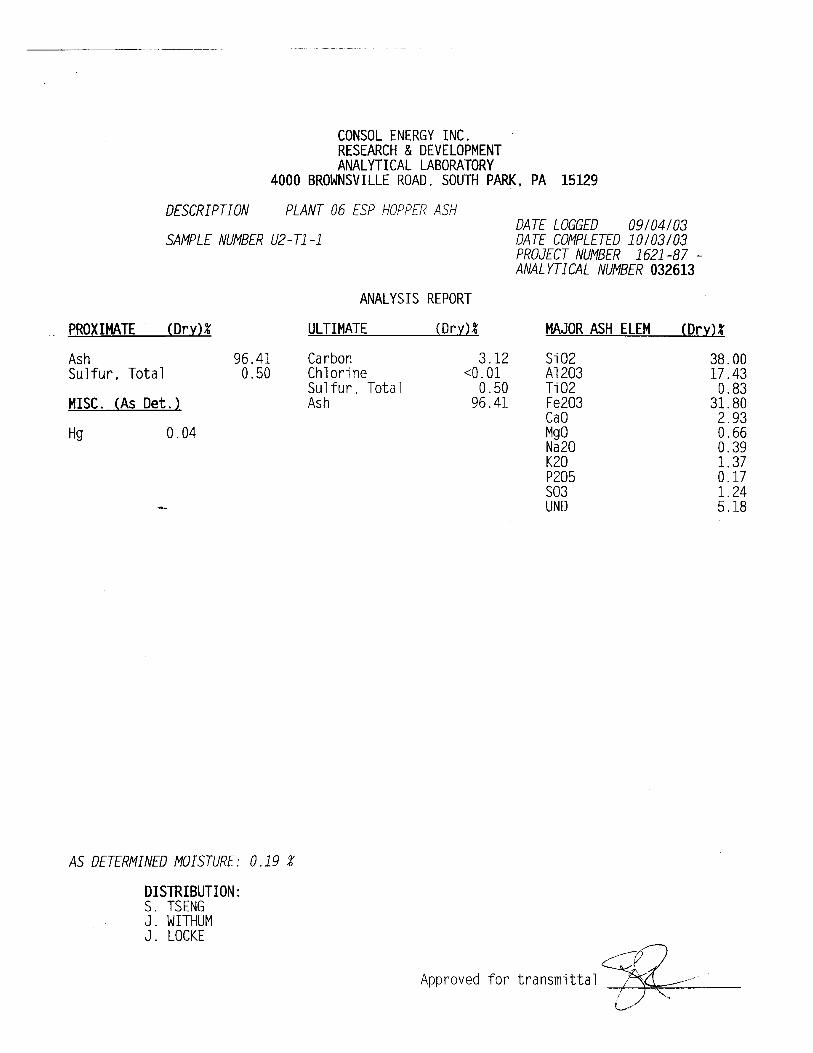
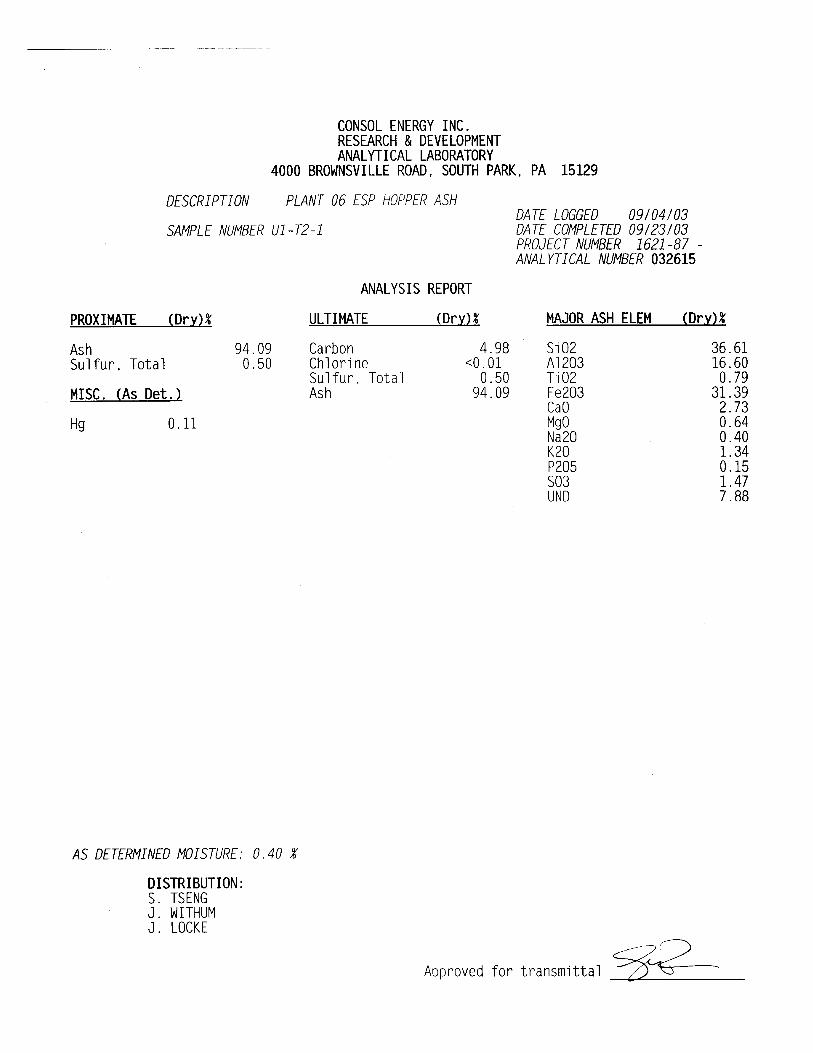
The two ESP ash samples collected during Test 1 were mistakenly collected from Sampling Pot #2 at Unit #2. All other ESP hopper ash samples were collected from Sampling Pot #2 at Unit #1. Listed in Table 19 are these ESP hopper ash samples. To compare the results of analyses, the plant also provided a split sample on August 21, which is listed at the bottom of the table as Plant 06 ESP Ash-U1.
Table 19. List of ESP hopper ash samples
Test No. Test Date Sample Time Sample ID
12:45 Plant-06 ESP Ash-U2-T1-1 1 8/19/2003
14:30 Plant-06 ESP Ash-U2-T1-2
10:03 Plant-06 ESP Ash-U1-T2-1 2 8/20/2003
10:45 Plant-06 ESP Ash-U1-T2-2
13:50 Plant-06 ESP Ash-U1-T3-1 3 8/20/2003
15:10 Plant-06 ESP Ash-U1-T3-2
10:10 Plant-06 ESP Ash-U1-T4-1 4 8/21/2003
12:22 Plant-06 ESP Ash-U1-T4-2
8/21/2003 Plant-06 ESP Ash-U1
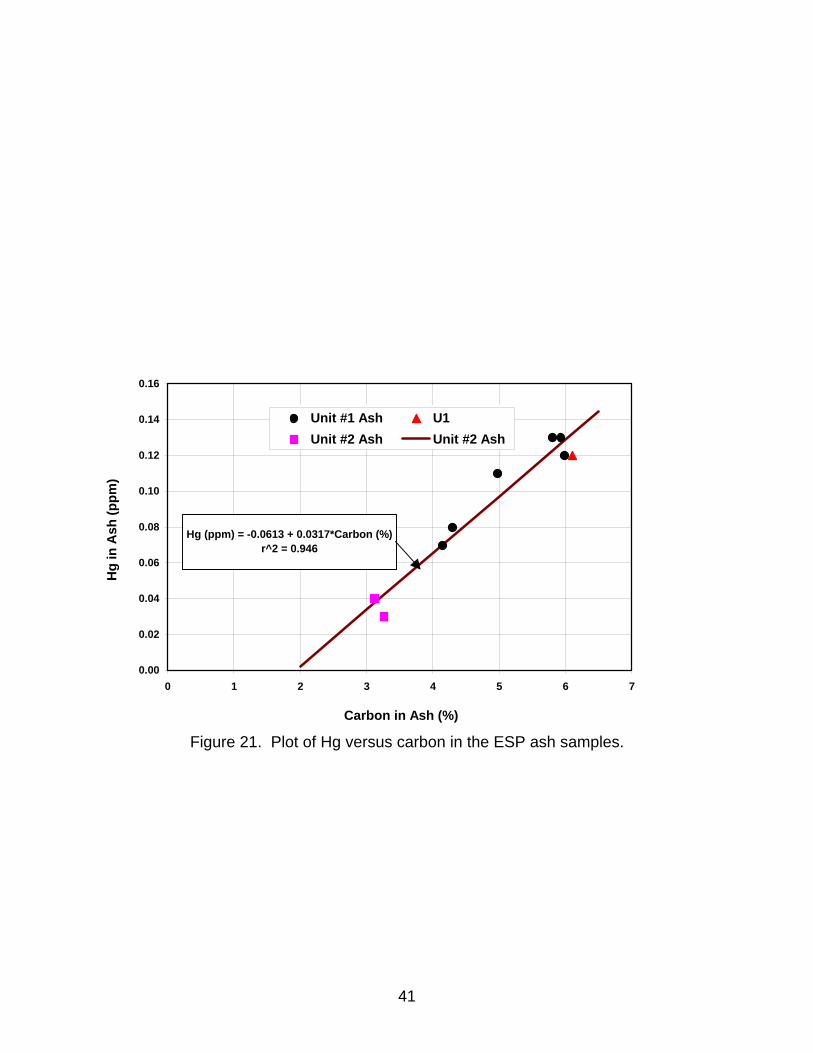
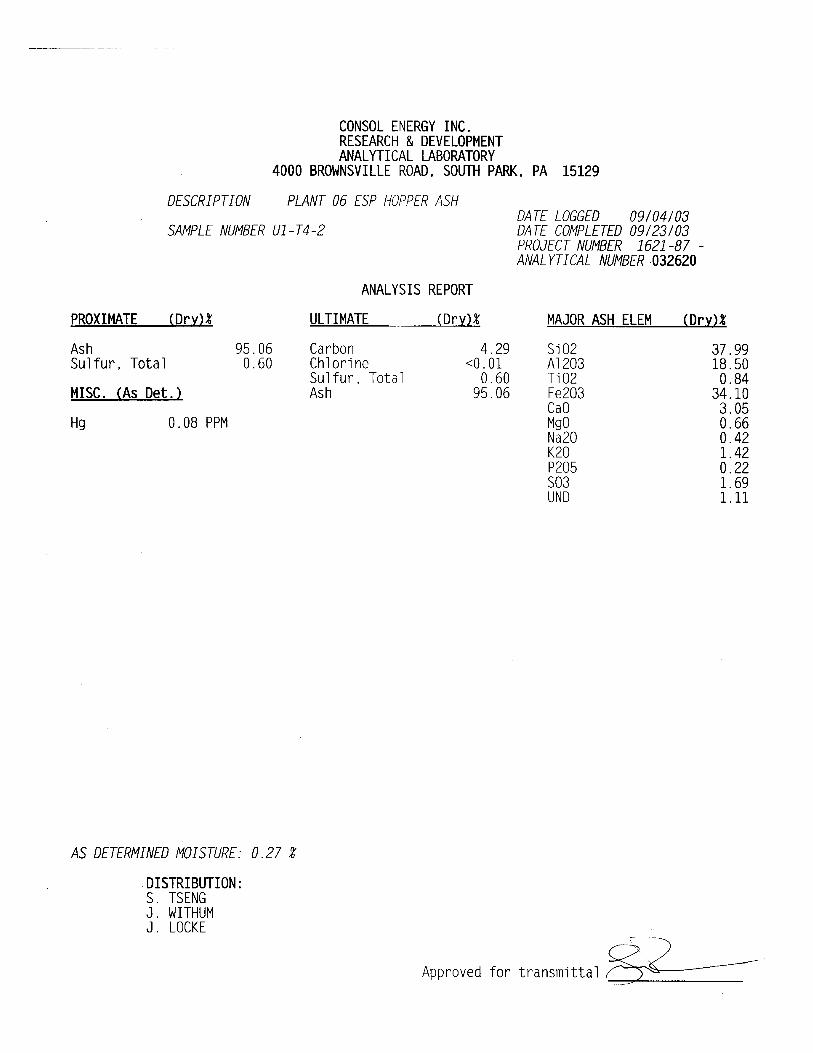
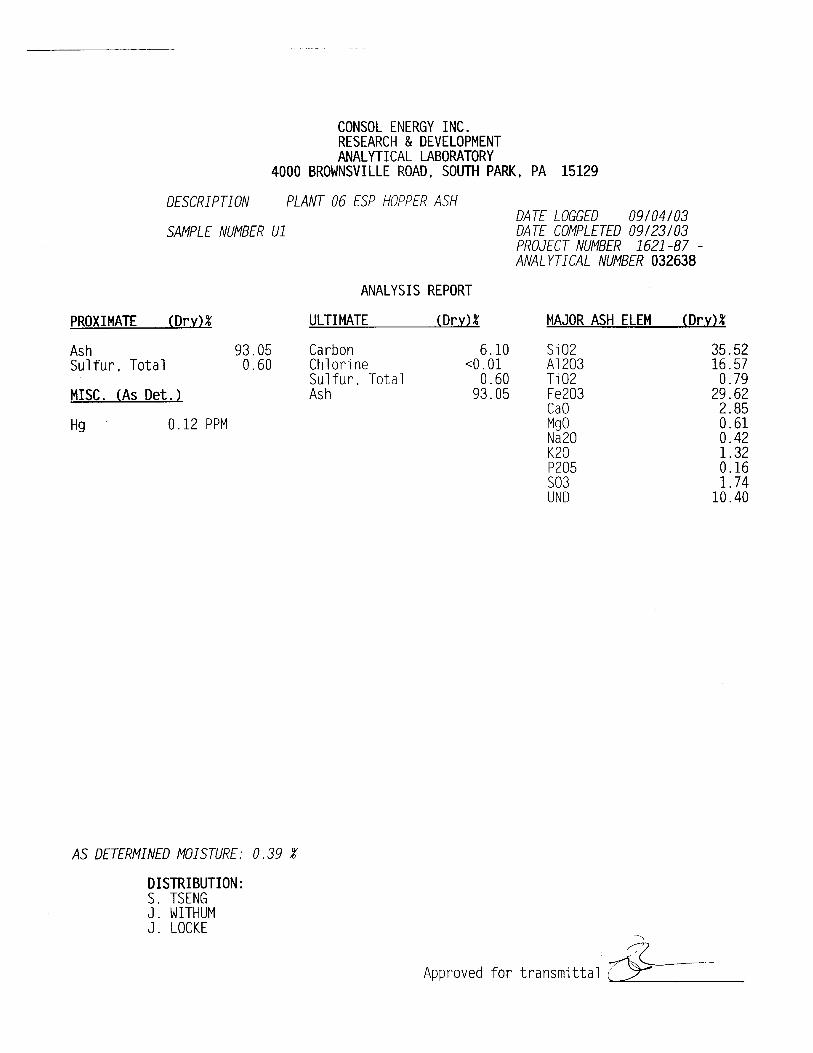
Table 20 lists the analyses of the ESP hopper ash samples. The amount of Hg detected in the ash samples ranged from 0.03 to 0.13 ppm. The amount of Hg was correlated with the amounts of carbon present in the ash, with a least-squares r2 of 0.946, as shown in Figure 21.
21
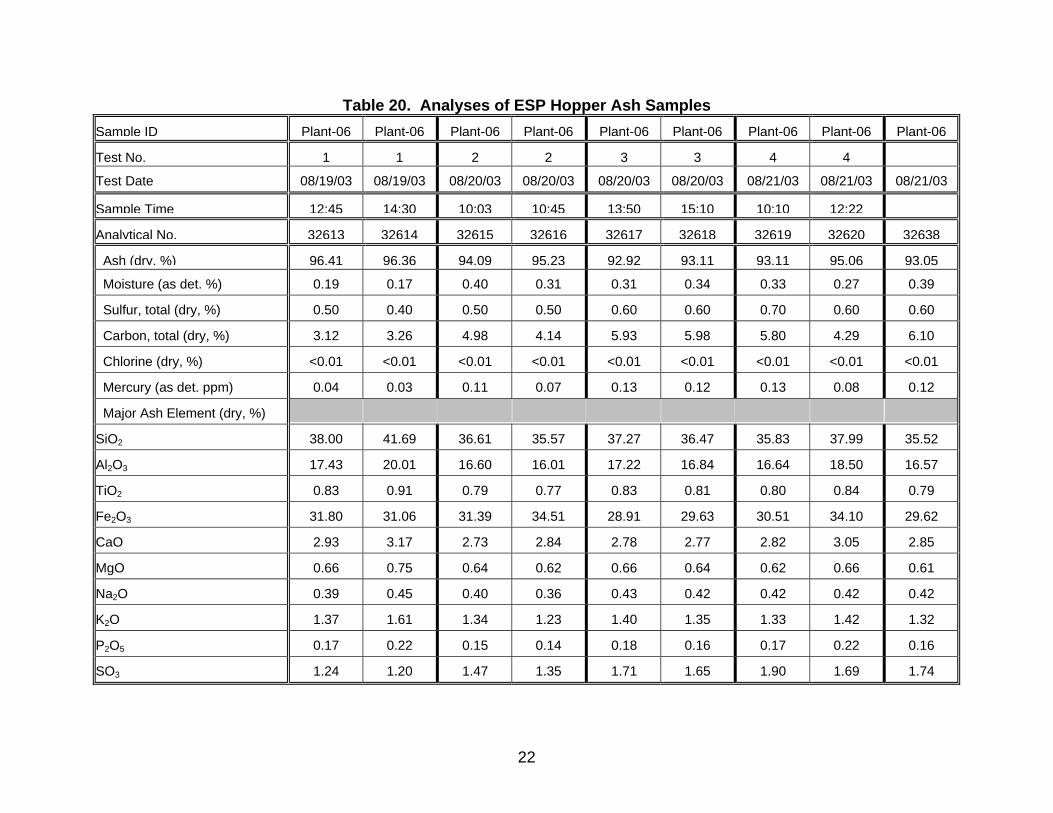
Table 20. Analyses of ESP Hopper Ash Samples Sample ID Plant-06 Plant-06 Plant-06 Plant-06 Plant-06 Plant-06 Plant-06 Plant-06 Plant-06
Test No. 1 1 2 2 3 3 4 4
Test Date 08/19/03 08/19/03 08/20/03 08/20/03 08/20/03 08/20/03 08/21/03 08/21/03 08/21/03
Sample Time 12:45 14:30 10:03 10:45 13:50 15:10 10:10 12:22
Analytical No. 32613 32614 32615 32616 32617 32618 32619 32620 32638
Ash (dry, %) 96.41 96.36 94.09 95.23 92.92 93.11 93.11 95.06 93.05
Moisture (as det. %) 0.19 0.17 0.40 0.31 0.31 0.34 0.33 0.27 0.39
Sulfur, total (dry, %) 0.50 0.40 0.50 0.50 0.60 0.60 0.70 0.60 0.60
Carbon, total (dry, %) 3.12 3.26 4.98 4.14 5.93 5.98 5.80 4.29 6.10
Chlorine (dry, %) <0.01 <0.01 <0.01 <0.01 <0.01 <0.01 <0.01 <0.01 <0.01
Mercury (as det. ppm) 0.04 0.03 0.11 0.07 0.13 0.12 0.13 0.08 0.12
Major Ash Element (dry, %)
SiO2 38.00 41.69 36.61 35.57 37.27 36.47 35.83 37.99 35.52
Al2O3 17.43 20.01 16.60 16.01 17.22 16.84 16.64 18.50 16.57
TiO2 0.83 0.91 0.79 0.77 0.83 0.81 0.80 0.84 0.79
Fe2O3 31.80 31.06 31.39 34.51 28.91 29.63 30.51 34.10 29.62
CaO 2.93 3.17 2.73 2.84 2.78 2.77 2.82 3.05 2.85
MgO 0.66 0.75 0.64 0.62 0.66 0.64 0.62 0.66 0.61
Na2O 0.39 0.45 0.40 0.36 0.43 0.42 0.42 0.42 0.42
K2O 1.37 1.61 1.34 1.23 1.40 1.35 1.33 1.42 1.32
P2O5 0.17 0.22 0.15 0.14 0.18 0.16 0.17 0.22 0.16
SO3 1.24 1.20 1.47 1.35 1.71 1.65 1.90 1.69 1.74
22

QUALITY ASSURANCE/QUALITY CONTROL The sampling and analysis QA/QC procedures are described below.
• Personnel specifically trained and experienced in power plant sampling methods, including the Ontario-Hydro Hg sampling method, conducted all sampling,
• The sampling equipment was maintained and calibrated as required, • Consistent sample preparation and recovery procedures were used, • Samples were logged and tracked under the direction of sample team Group
Leader, • Individual calibration curves were developed for each sample matrix, • NIST Standard Reference Material (SRM) and lab QC samples were
analyzed to verify calibration curves, • Duplicates of selected samples were analyzed to assure repeatability, • Analyses of selected “spiked” samples were analyzed to assure sample
recovery, and • Interim data were reviewed to assure sample completeness.
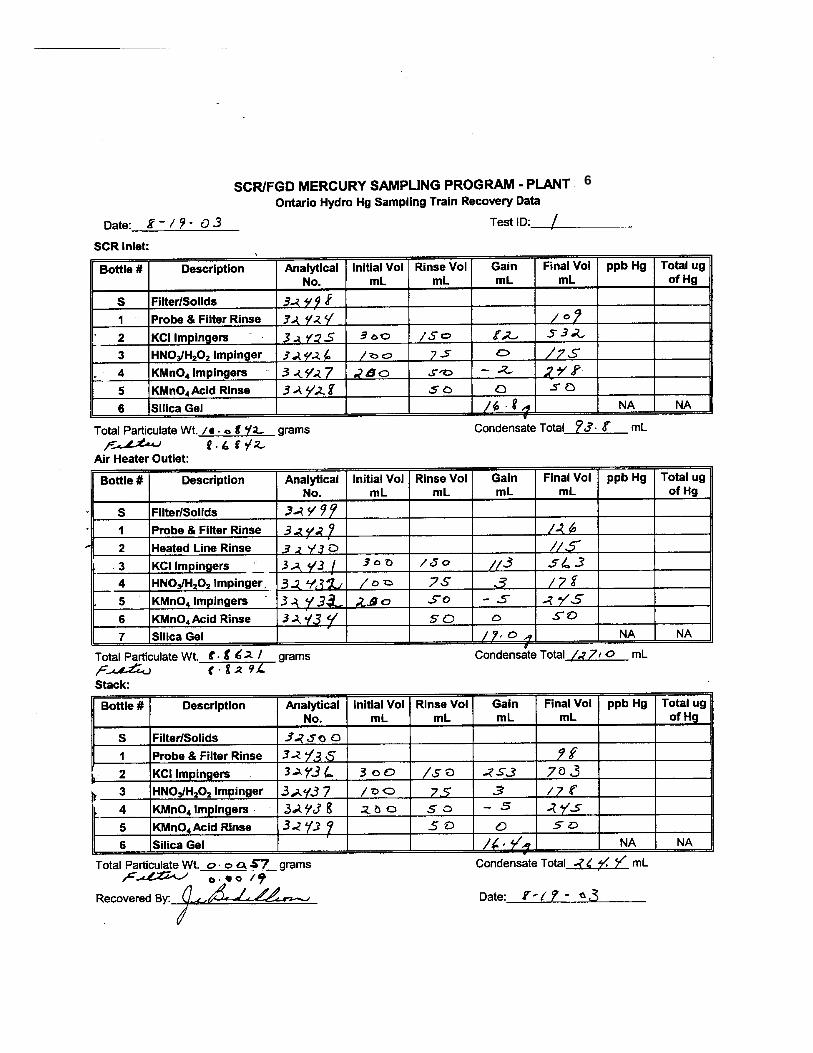
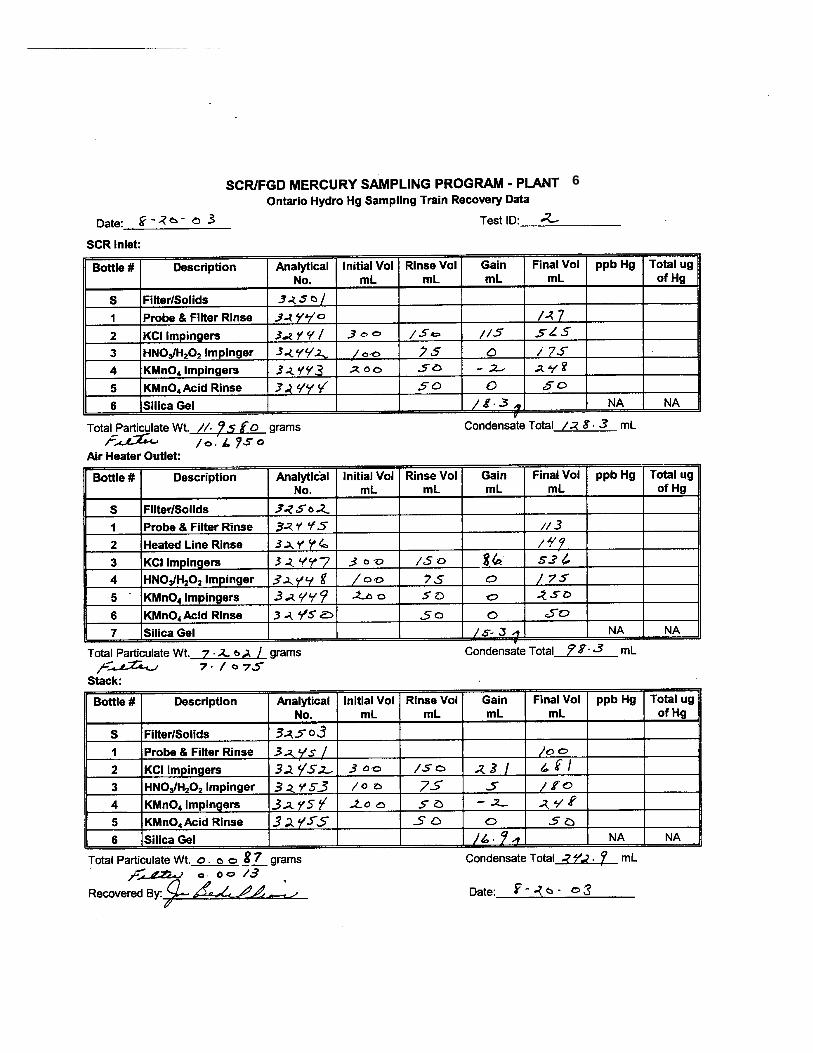
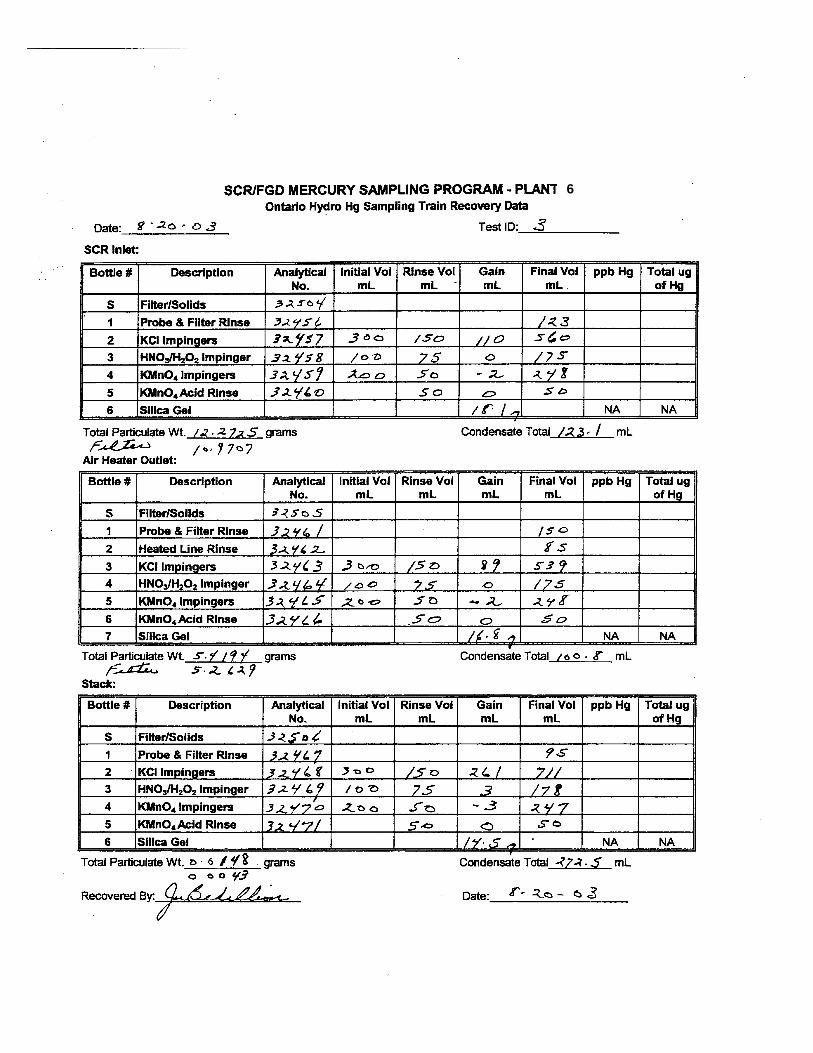
All samples were obtained using the procedures described in EPA Method 5 and the Ontario-Hydro Hg Speciation draft method. Data were recorded on standard forms, which are included in Appendix C. The field data were reduced using standard “in-house” spreadsheets. Copies of the summary sheets are included in Appendix C. To assure consistency, all of the Ontario-Hydro train components were prepared and recovered under the supervision of a senior technician experienced in the Ontario-Hydro Hg speciation lab techniques. Copies of the recovery sheets are included in Appendix A.
The Ontario-Hydro sampling train analysis consisted of eight sub-samples. Each sub-sample analysis consisted of developing a calibration curve (absorbance versus Hg concentration in solution), checks of field and lab blanks, calibration checks with SRM and lab standards, selected duplicates and selected sample spikes. The laboratory summaries for each of these runs are contained in Appendix A.
A total of ~199 individual Hg determinations were completed. This included 12 blank samples, 29 NIST SRM or lab QC checks, 15 sample spikes, and 15 duplicate analyses.
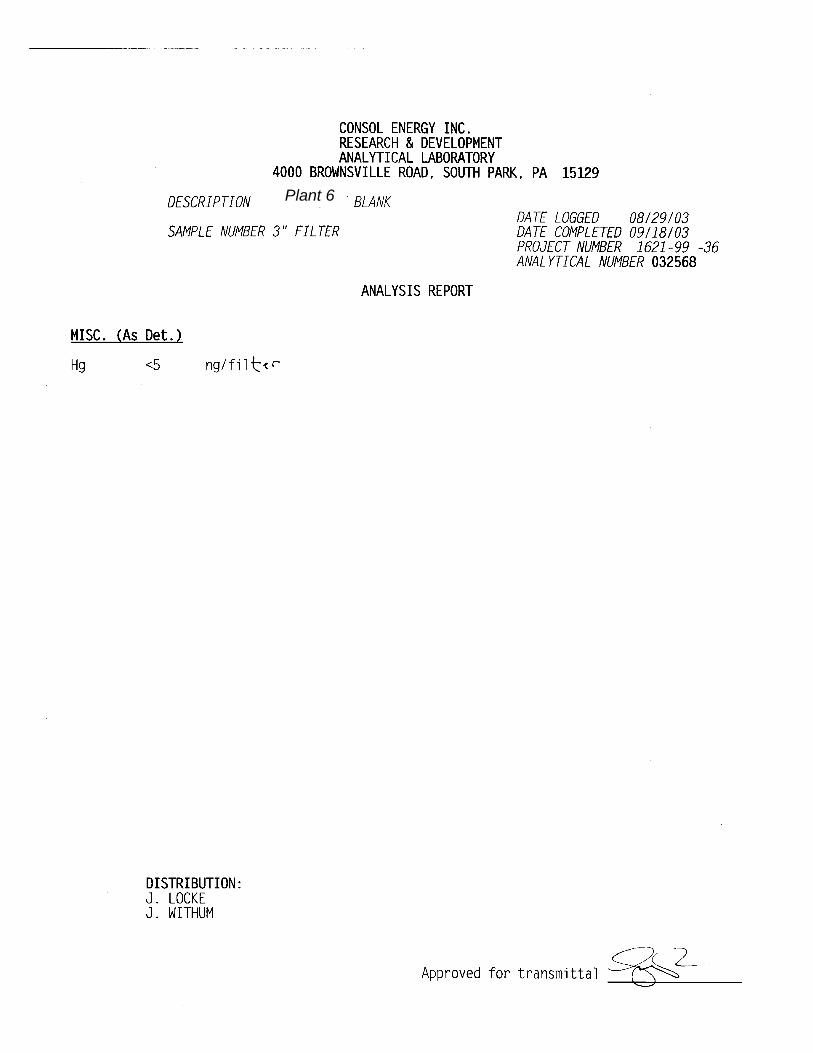
Blank Samples A total of 10 blank liquid samples were analyzed. The average blank value was <1.1 ng/ml (ppb in solution). The average blank value is less than any individual detectable Hgpart, Hg++, or Hg0 determination in ng/ml and, more importantly, is less than the Hg concentration detection limit (discussed later in this report). Consequently, in this report, blank concentrations were not subtracted out from any Hg determination.
23
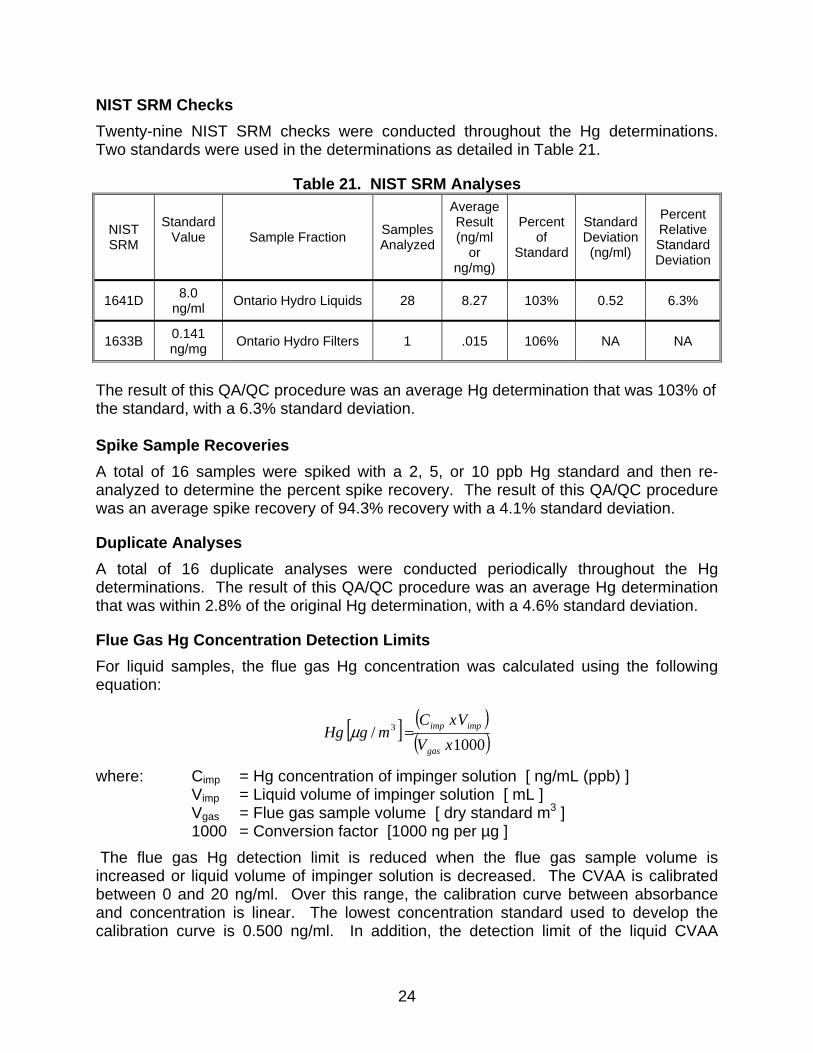
NIST SRM Checks Twenty-nine NIST SRM checks were conducted throughout the Hg determinations. Two standards were used in the determinations as detailed in Table 21.
Table 21. NIST SRM Analyses
NIST SRM
Standard Value
Sample Fraction Samples
Analyzed
Average Result (ng/ml
or ng/mg)
Percent of
Standard
Standard Deviation (ng/ml)
Percent Relative Standard Deviation
1641D 8.0 ng/ml Ontario Hydro Liquids 28 8.27 103% 0.52 6.3%
1633B 0.141 ng/mg Ontario Hydro Filters 1 .015 106% NA NA
The result of this QA/QC procedure was an average Hg determination that was 103% of the standard, with a 6.3% standard deviation. Spike Sample Recoveries A total of 16 samples were spiked with a 2, 5, or 10 ppb Hg standard and then re-analyzed to determine the percent spike recovery. The result of this QA/QC procedure was an average spike recovery of 94.3% recovery with a 4.1% standard deviation.
Duplicate Analyses A total of 16 duplicate analyses were conducted periodically throughout the Hg determinations. The result of this QA/QC procedure was an average Hg determination that was within 2.8% of the original Hg determination, with a 4.6% standard deviation.
Flue Gas Hg Concentration Detection Limits For liquid samples, the flue gas Hg concentration was calculated using the following equation:
[ ] ( )( )1000
/ 3
xVVxC
mgHggas
impimp=µ
where: Cimp = Hg concentration of impinger solution [ ng/mL (ppb) ] Vimp = Liquid volume of impinger solution [ mL ] Vgas = Flue gas sample volume [ dry standard m3 ] 1000 = Conversion factor [1000 ng per µg ] The flue gas Hg detection limit is reduced when the flue gas sample volume is increased or liquid volume of impinger solution is decreased. The CVAA is calibrated between 0 and 20 ng/ml. Over this range, the calibration curve between absorbance and concentration is linear. The lowest concentration standard used to develop the calibration curve is 0.500 ng/ml. In addition, the detection limit of the liquid CVAA
24

analysis was <1.0 ng/ml. The prescribed sampling and recovery procedures result in final liquid volumes varying between 50 and 712 ml. The volume of flue gas collected varied between 1.175 and 2.145 dscm. The sampling variables result in sample-specific flue gas detection limit. The flue gas Hg detection limit for each sample matrix are listed in Table 22.
Table 22. Flue Gas Hg Detection Limits Matrix Maximum Liquid
Volume [ ml ]
Minimum Gas Volume [ dscm ]
Flue Gas Detection Limit
[ µg/m3 ] Probe Rinse 150 1.175 0.13
KCl Impinger 712 1.175 0.61
HNO3/H2O2 Impingers 182 1.175 0.15
KMnO4 Impingers 250 1.175 0.21
HCl Rinse 50 1.175 0.04
Depending on the matrix, the flue gas Hg detection limit ranged from 0.04 to 0.61 µg/m3. When compared with the total Hg concentrations ranging from 1.85 to 33.95 µg/m3, the flue gas detection limit is low enough to be insignificant in the flue gas calculations.
Mercury Material Balance Calculation Method To calculate the material balance for Hg, the following parameters were used:
(1) Fifteen percent (15%) of the flue gas bypassed the FGD. (2) Bottom ash accounted for fifteen percent (15%) of the total ash from coal and the
fly ash accounted for the remaining 85%. (3) The FGD removed 98.5% of the SO2 entering the FGD. (4) FGD blowdown rate was 1,200 gpm (5) GPRW flow rate was 850 gpm
During normal operation, about 15% of the flue gas bypasses the FGD. Based on the U.S. Department of Energy, Energy Information Administration’s (EIA) by- year 2002 Annual Steam-Electric Plant Operation and Design Data, the amounts of flyash and bottom ash generated at the whole plant (two units combined) were 319.1 and 57.3 thousand lb, respectively. Based on these two numbers, the percentage of bottom ash was 15.2% of the total ash produced at the plant. For material balance calculation, a round number of 15% was used for the amount of bottom ash generated during testing, and 85% for fly ash. Listed in the following table are the annual average coal sulfur contents and SO2 emissions obtained from EIA and EPA’s databases.5 Based on the coal sulfur contents 5 U.S. Department of Energy, Energy Information Administration, Annual Steam-Electric Plant Operation and Design Data, EIA-767 Data Files,
25

in EIA’s fuel quality databases and the EPA unit-specific SO2 emissions databases, the SO2 removals for years 1999, 2000, and 2001 were calculated to be 83.4%, 82.5%, and 80.8%, respectively. The three-year average SO2 removal was 82.2%. Since 15% of the flue gas bypassed the FGD, the average SO2 removal efficiency by the FGD was 96.8% (i.e., 82.2% divided by 85%). A slightly higher (than 96.8%) SO2 removal efficiency was assumed to account for the small amounts of sulfur in the bottom ash and ESP hopper ash. Information provided by CarmeuseNA indicated that the about 98-99% of the SO2 entering the FGD was removed.6 For the material balance calculation an SO2 removal efficiency of 98.5% was assumed.
Year S in Coal (tons)1 SO2 Emissions (tons)2 Coal S based Removal (%) 2001 61,257 23,528 80.8% 2000 66,550 23,357 82.5% 1999 59,310 19,752 83.4%
Average = 82.2% Plant personnel provided the following information: the flow rate of FGD blowdown per module was 150-400 gpm and the flow rate of gypsum plant return water (GPRW) to each module was 50-300 gpm.7 CarmeuseNA provided the design FGD blowdown rate and GPRW flow rate of 1,250 gpm and 900 gpm, respectively.8 Since the rated capacity of this unit is 684 MW and the plant was run at about 650 MW during the testing, to calculate the material balance for Hg, the FGD blowdown rate and the GPWR flow rate were assumed to be 1,200 GPM and 850 gpm, respectively.
Hhttp://www.eia.doe.gov/cneaf/electricity/page/eia767.htmlH6 Personal communication with K Smith, December 1, 2003. 7 Email responses from K Smith (CarmeuseNA) on December 3, 2003 and plant personnel on December 5, 2003.
26
Air
Boiler
SCR Reactor
Air
Ammonia Storage
ESP
Wet Lime FGD System
Fly Ash to DisposalFlue gas sampling locations
AirHeater
Coal
Evaporator
Stack
FD Fan
ID Fan
Figure 1. Plant Schematic Showing the Sampling Locations
Figure 2. Mercury Speciation
Solid and Liquid Sampling Location
BottomAsh
GPRW
FGD SlurryBlowdown
FGD LimeSlurryFeed
Air
Boiler
SCR Reactor
Air
Ammonia Storage
ESP
Wet Lime FGD System
Fly Ash to DisposalFlue gas sampling locations
AirHeater
Coal
Evaporator
Stack
FD Fan
ID Fan
BottomAsh
GPRW
FGD SlurryBlowdown
FGD LimeSlurryFeed
Solid and Liquid Sampling Location
0
5
10
15
20
25
30
35
40
Test 1 Test 2SCRIn
Test 3 Test 4 Test 1 Test 2AH
Out
Test 3 Test 4 Test 1 Test 2 Stack
Test 3 Test 4
Hg,
ug/
dscm
Particulate Oxidized Elemental
27
ESP
FGD Scrubbers
Stack 5.98
mg/sec
5.98 – 0.44 = 5.54 mg/sec
0.44 mg/sec
ESP Ash
15% = 0.83 mg/sec
4.02 mg/sec
FGD Blowdown
85% = 4.71 mg/sec
4.71 - 4.02 + 0.04 = 0.75
mg/sec
1.61 mg/sec
% Removal in FGD = 1 – 0.75 / 4.71 = 84 %
0.04 mg/sec
FGD Make-up Water
Air Heater
Figure 3. Calculation of Mercury Removal in the FGD
28
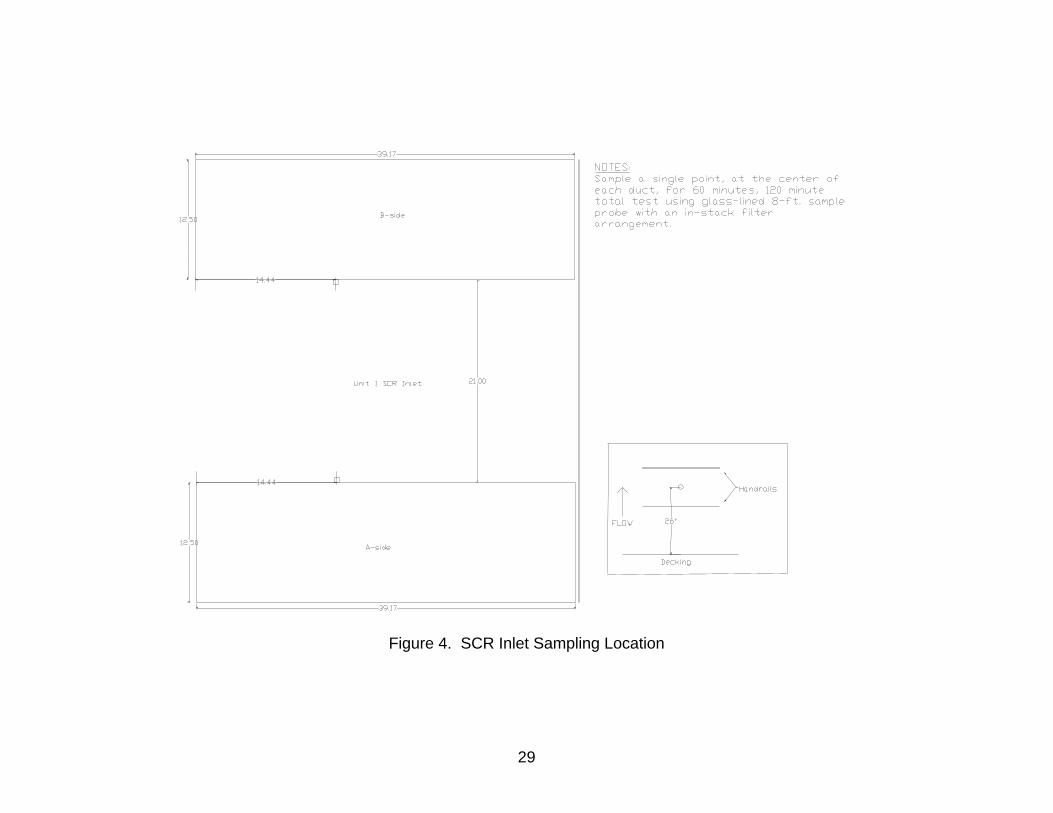
Figure 4. SCR Inlet Sampling Location
29
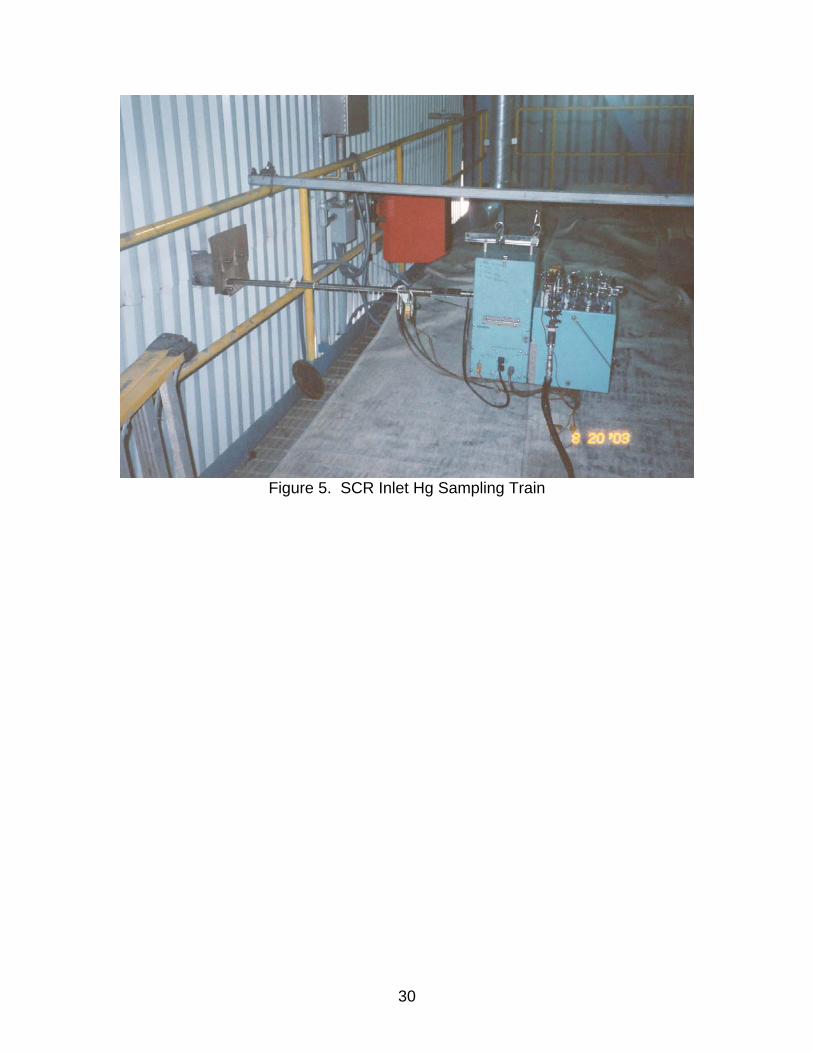
Figure 5. SCR Inlet Hg Sampling Train
30
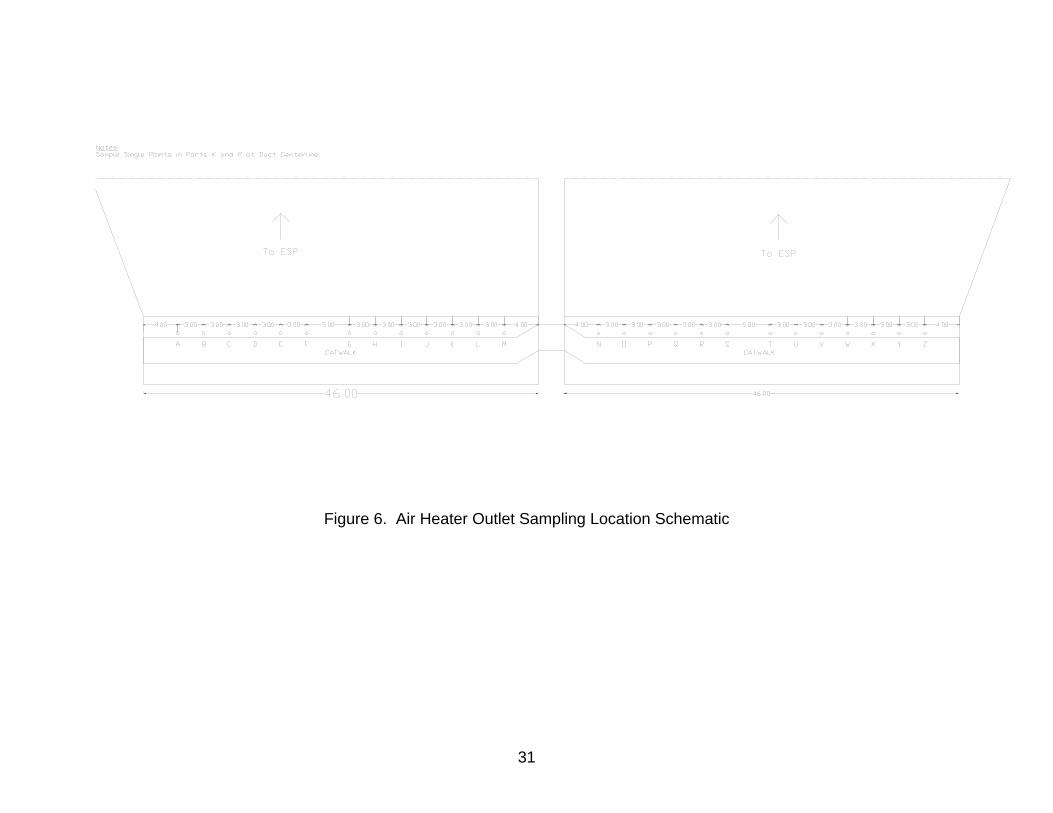
Figure 6. Air Heater Outlet Sampling Location Schematic
31
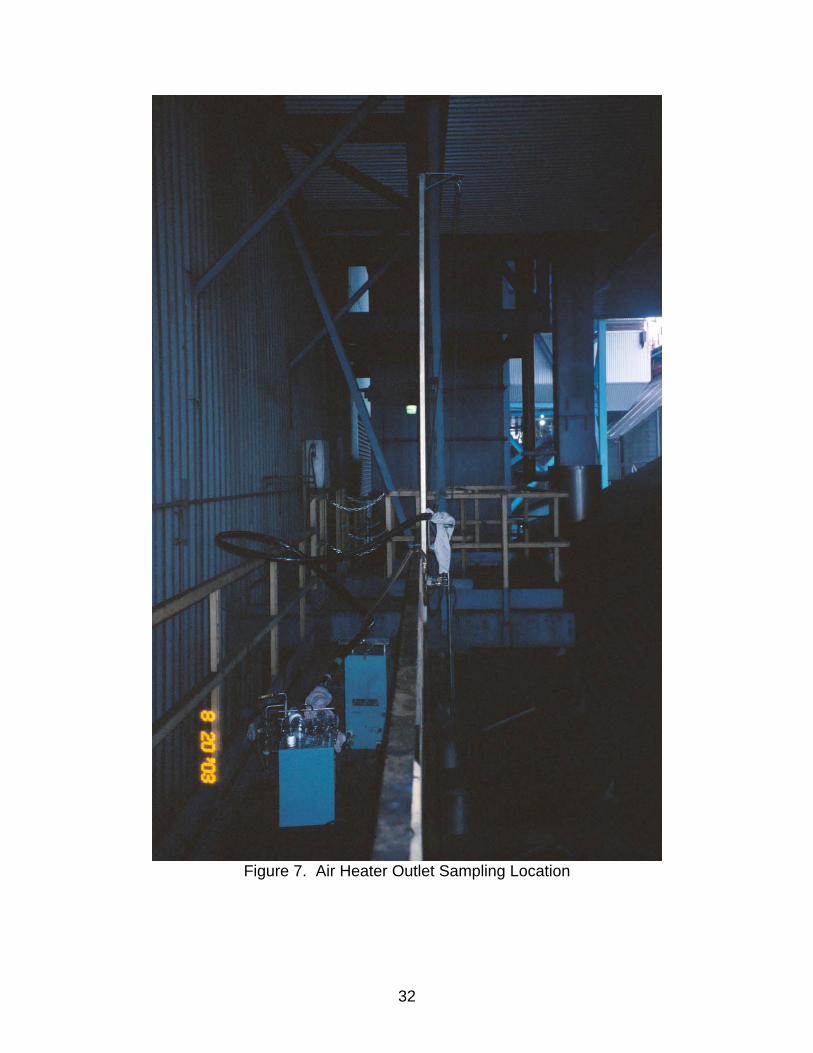
Figure 7. Air Heater Outlet Sampling Location
32
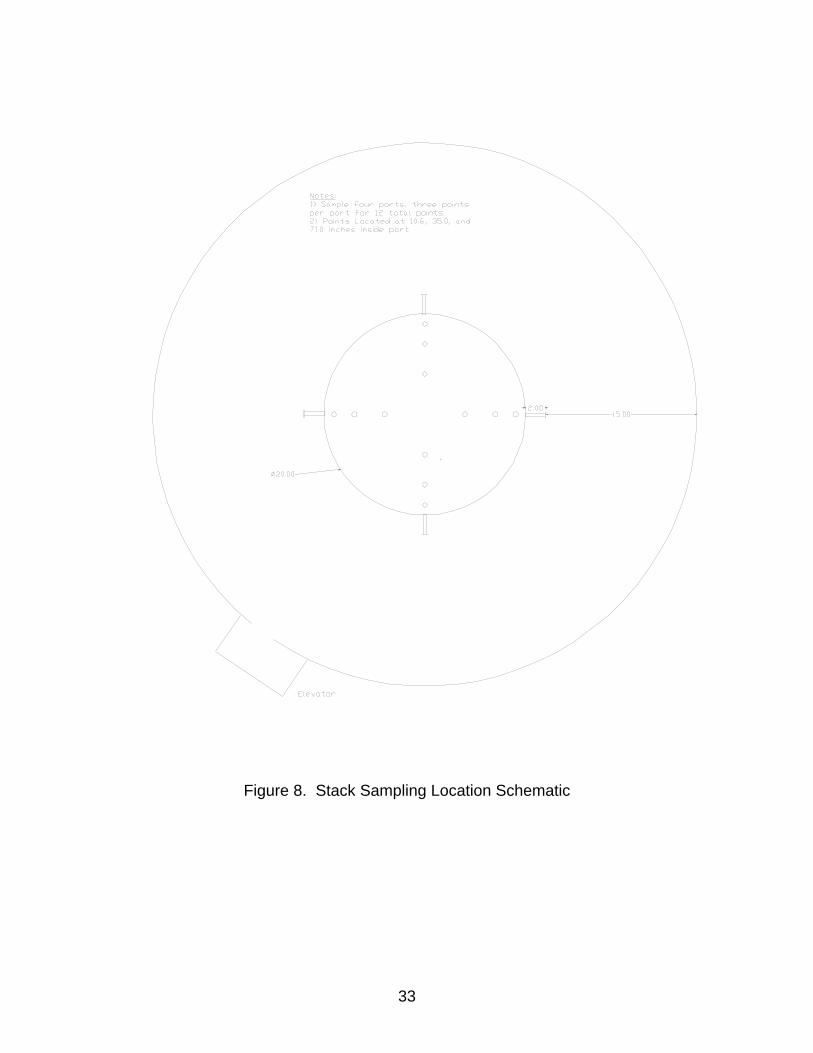
Figure 8. Stack Sampling Location Schematic
33
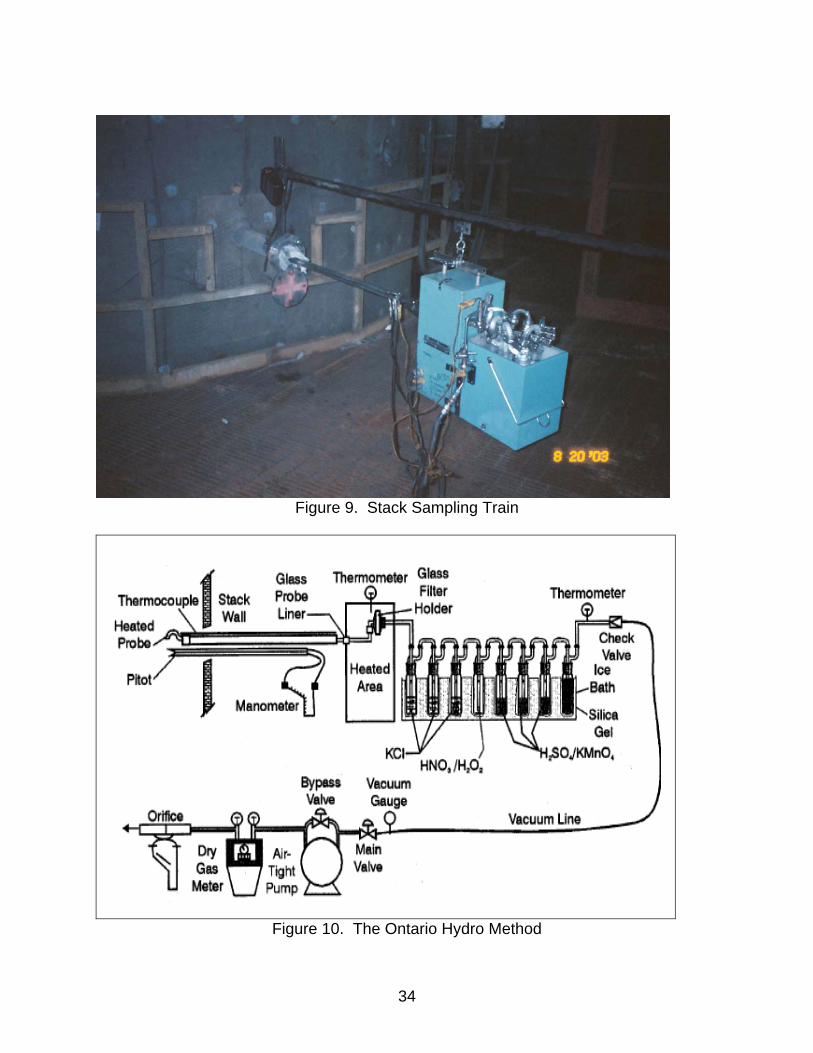
Figure 9. Stack Sampling Train
Figure 10. The Ontario Hydro Method
34
stack
1A
1B
1C
1D
1E
1F
Coal bin
Sampling location
Coal pipes
stack
1A
1B
1C
1D
1E
1F
Coal bin
Sampling location
Coal pipes
Figure 11. Coal sampling locations
Figure 12. Picture of the sampling “thief”
35

sampling thief
coal bin
sampling thief
coal bin
Figure 13. Collecting a coal sample.
Lime slurrysampling
point
Lime slurryfeed pump
Direction of flow of
lime slurry
Lime slurrysampling
point
Lime slurryfeed pump
Direction of flow of
lime slurry
Figure 14. Lime slurry sampling location.
36
Make-up waterSampling point
Direction of flow of make-up water
Make-up waterSampling point
Direction of flow of make-up water
Figure 15. Sampling Location for Gypsum Plant Return Water.
Figure 16. Scrubber pH Pot for Slurry Sampling
37
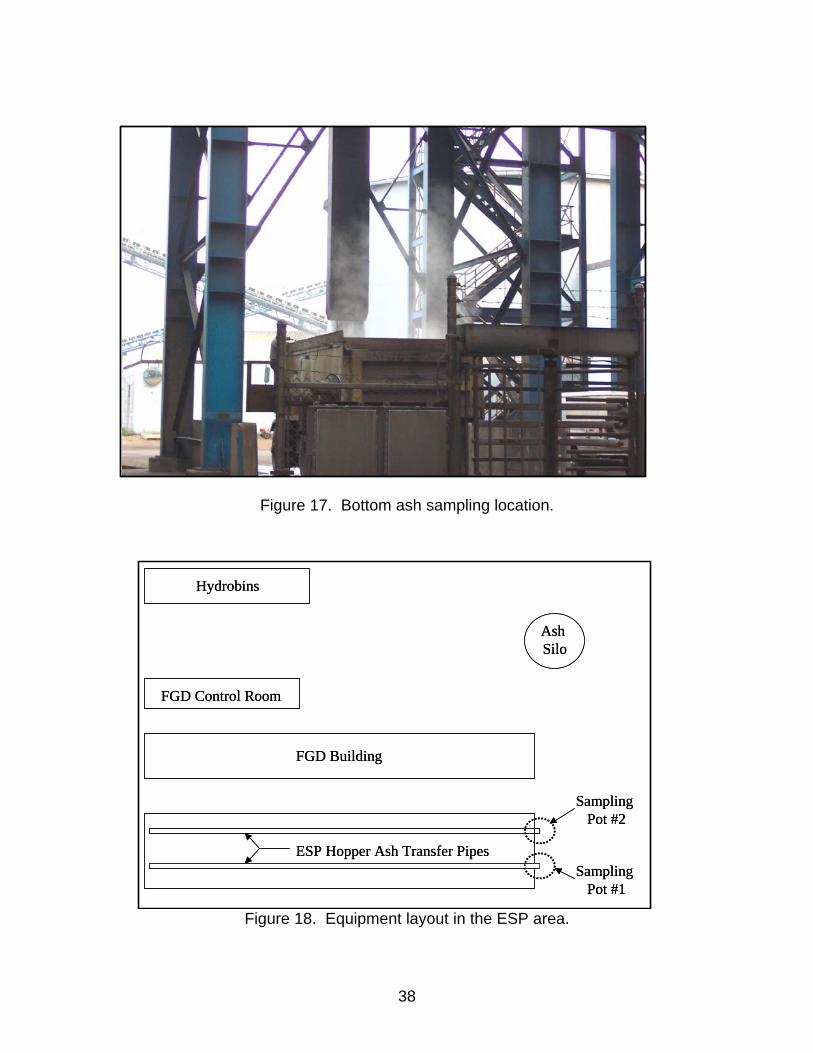
Figure 17. Bottom ash sampling location.
Figure 18. Equipment layout in the ESP area.
ESP Hopper Ash Transfer Pipes
FGD Building
FGD Control Room
Ash Silo
Hydrobins
Sampling Pot #2
Sampling Pot #1
ESP Hopper Ash Transfer Pipes
FGD Building
FGD Control Room
Ash Silo
Hydrobins
Sampling Pot #2
Sampling Pot #1
38
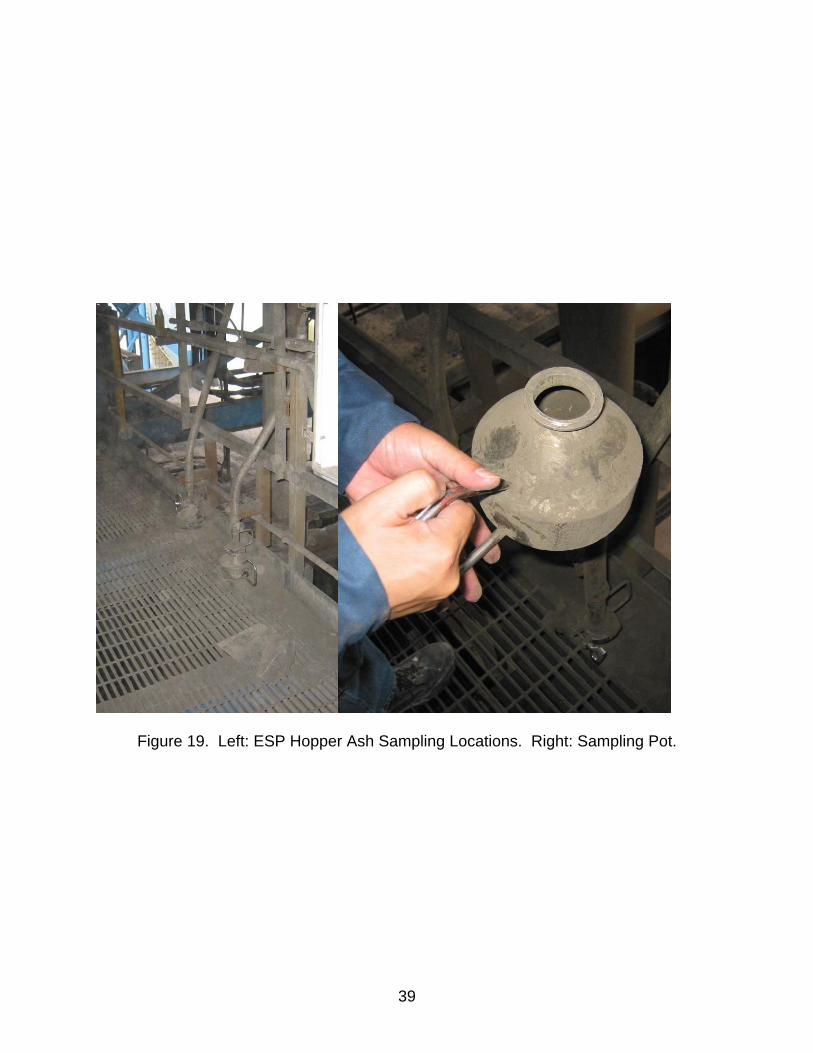
Figure 19. Left: ESP Hopper Ash Sampling Locations. Right: Sampling Pot.
39
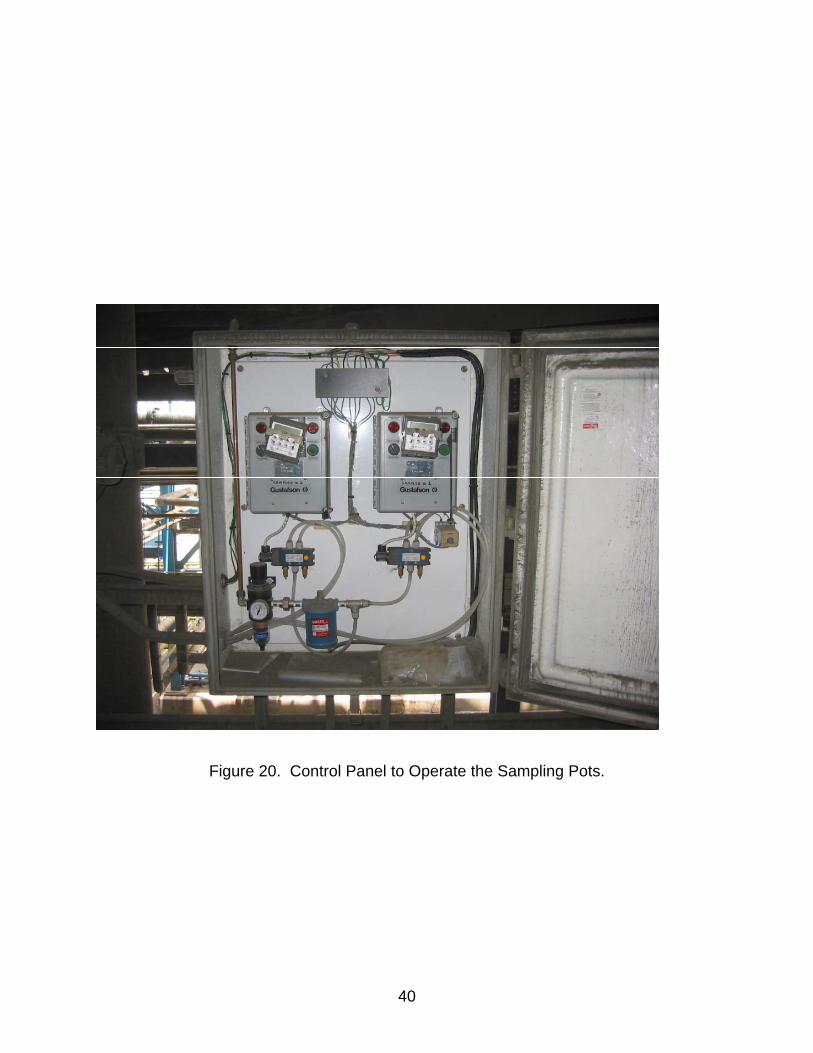
Figure 20. Control Panel to Operate the Sampling Pots.
40
0.00
0.02
0.04
0.06
0.08
0.10
0.12
0.14
0.16
0 1 2 3 4 5 6 7
Carbon in Ash (%)
Hg
in A
sh (p
pm)
Unit #1 Ash U1Unit #2 Ash Unit #2 Ash
Hg (ppm) = -0.0613 + 0.0317*Carbon (%)r^2 = 0.946
Figure 21. Plot of Hg versus carbon in the ESP ash samples.
41
6
6


Plant 6

Plant 6

6
Plant
6
Plant
Plant 6

Plant 6

Plant 6

Plant 6

Plant 6
Plant 6

6
Plant
6
Plant
Plant 6

Plant 6

Plant 6
Plant 6

Plant 6

Plant 6
Plant 6


Plant 6
Plant 6

Plant 6

Plant 6

6
Plant
Plant 6
Plant 6

Plant 6
Plant 6

Plant 6
Plant 6

Plant 6

Plant 6
Plant 6

Plant 6

Plant 6

Plant 6
Plant 6

Plant 6
Plant 6
Plant 6

Plant 6

Plant 6

Plant 6

Plant 6

Plant 6

Plant 6

Plant 6

Plant 6

Plant 6

Plant 6

Plant 6
Plant 6
Plant 6

Plant 6

Plant 6
Plant 6

Plant 6

Plant 6

Plant 6

Plant 6

Plant 6

Plant 6

Plant 6

Plant 6

Plant 6
Plant 6

Plant 6

Plant 6
Plant 6
Plant 6

Plant 6

Plant 6
Plant 6
Plant 6

Plant 6

6
Plant
Plant 6

Plant 6

Plant 6

Plant 6
Plant 6

6
Plant
6
Plant
6
Plant


6
Plant

Plant 6


Plant 6

Plant 6
Plant 6


Plant 6


6