evaluation of mercury in rainbow trout collected from duck ... · evaluation of mercuy in rainbow...
TRANSCRIPT
U.S. Department of the InteriorU.S. Geological Survey
Scientific Investigations Report 2015–5079
Prepared in cooperation with the Shoshone-Paiute Tribes of the Duck Valley Indian Reservation
Evaluation of Mercury in Rainbow Trout Collected from Duck Valley Indian Reservation Reservoirs, Southwestern Idaho and Northern Nevada, 2007, 2009, and 2013


Evaluation of Mercuy in Rainbow Trout Collected from Duck Valley Indian Reservation Reservoirs, Southwestern Idaho and Northern Nevada, 2007, 2009, and 2013
By Marshall L. Williams, Dorene E. MacCoy, and Terry R. Maret
Prepared in cooperation with the Shoshone-Paiute Tribes of the Duck Valley Indian Reservation
Scientific Investigations Report 2015–5079
U.S. Department of the InteriorU.S. Geological Survey

U.S. Department of the InteriorSALLY JEWELL, Secretary
U.S. Geological SurveySuzette M. Kimball, Acting Director
U.S. Geological Survey, Reston, Virginia: 2015
For more information on the USGS—the Federal source for science about the Earth, its natural and living resources, natural hazards, and the environment—visit http://www.usgs.gov or call 1–888–ASK–USGS.
For an overview of USGS information products, including maps, imagery, and publications, visit http://www.usgs.gov/pubprod/.
Any use of trade, firm, or product names is for descriptive purposes only and does not imply endorsement by the U.S. Government.
Although this information product, for the most part, is in the public domain, it also may contain copyrighted materials as noted in the text. Permission to reproduce copyrighted items must be secured from the copyright owner.
Suggested citation:Williams, M.L., MacCoy, D.E., and Maret, T.R., 2015, Evaluation of mercury in rainbow trout collected from Duck Valley Indian Reservation reservoirs, southwestern Idaho and northern Nevada, 2007, 2009, and 2013: U.S. Geological Survey Scientific Investigations Report 2015–5079, 18 p., http://dx.doi.org/10.3133/sir20155079.
ISSN 2328-0328 (online)

iii
Contents
Abstract ..........................................................................................................................................................1Introduction.....................................................................................................................................................1
Regulatory Guidance ............................................................................................................................3Purpose and Scope ..............................................................................................................................3Description of Study Area ...................................................................................................................3
Data Quality Objectives.................................................................................................................................3Sampling and Analysis ..................................................................................................................................4
Field Sampling Methods ......................................................................................................................4Fish-Tissue Laboratory Analysis.........................................................................................................4Atmospheric Mercury Deposition Data Analysis ............................................................................4Statistical Analysis ...............................................................................................................................5
Results and Discussion .................................................................................................................................6Rainbow Trout Mercury Concentrations ...........................................................................................6Atmospheric Wet Mercury Deposition .............................................................................................8Quality Control for Fish Analysis ........................................................................................................8
Summary..........................................................................................................................................................9Acknowledgments .........................................................................................................................................9References Cited............................................................................................................................................9
Figures 1. Map showing location of Duck Valley Indian Reservation reservoirs and
Mercury Deposition Network sites (NV02 and NV99), southwestern Idaho and northern Nevada ...........................................................................................................................2
2. Graphs showing mercury concentration in fish tissue by length from Duck Valley Indian Reservation reservoirs and hatchery background samples from the Black Canyon Trout Farm, southwestern Idaho and northern Nevada, 2007, 2009, and 2013 .................................................................................................................................................5
3. Boxplots showing sample concentration by year for rainbow trout sampled from Duck Valley Indian Reservation reservoirs, southwestern Idaho and northern Nevada, 2007, 2009, and 2013 ......................................................................................................7
4. Graph showing annual wet mercury deposition rate at Mercury Deposition Network site NV02, Lesperance Ranch, Nevada, 2003–2013 ................................................8
Tables 1. Statistical summary of annual sampling events for Duck Valley Indian Reservation
reservoirs, southwestern Idaho and northern Nevada, 2007, 2009, and 2013 ....................6 2. Individual fish size, weight, and mercury concentration data, and statistical
summaries for Duck Valley Indian Reservation reservoirs and hatchery background samples from the Black Canyon Trout Farm, southwestern Idaho and northern Nevada, 2007, 2009, and 2013 ....................................................................................................12
3. Quality-control results for analysis of total mercury in fish from Duck Valley Indian Reservation reservoirs and hatchery background samples from the Black Canyon Trout Farm, southwestern Idaho and northern Nevada, 2007, 2009, and 2013 .................16

iv
Conversion FactorsInch/Pound to SI
Multiply By To obtain
Length
inch (in.) 2.54 centimeter (cm)inch (in.) 25.4 millimeter (mm)
Area
acre 4,047 square meter (m2)acre 0.004047 square kilometer (km2)square mile (mi2) 2.590 square kilometer (km2)
Mass
ounce, avoirdupois (oz) 28.35 gram (g)pound, avoirdupois (lb) 0.4536 kilogram (kg)
SI to Inch/Pound
Multiply By To obtain
Length
centimeter (cm) 0.3937 inch (in.)millimeter (mm) 0.03937 inch (in.)kilometer (km) 0.6214 mile (mi)
Mass
milligram (mg) 0.00003527 ounce, avoirdupois (oz)gram (g) 0.03527 ounce, avoirdupois (oz)kilogram (kg) 2.205 pound avoirdupois (lb)
AbbreviationsANOVA analysis of variance
CRM certified reference material
Hg mercury
IDEQ Idaho Department of Environmental Quality
IFCAP Idaho Fish Consumption Advisory Program
IAEA International Atomic Energy Agency
MDN Mercury Deposition Network
MeHg methylmercury
NADP National Atmospheric Deposition Program
QC quality-control
RPTE reasonable potential to exceed
USEPA U.S. Environmental Protection Agency
USGS U.S. Geological Survey
USGS MRL U.S. Geological Survey Mercury Research Laboratory

Evaluation of Mercury in Rainbow Trout Collected from Duck Valley Indian Reservation Reservoirs, Southwestern Idaho and Northern Nevada, 2007, 2009, and 2013
By Marshall L. Williams, Dorene E. MacCoy, and Terry R. Maret
Abstract The U.S. Geological Survey, in cooperation with the
Shoshone-Paiute Tribes of the Duck Valley Indian Reserva-tion, analyzed mercury (Hg) concentration in rainbow trout (Oncorhynchus mykiss) collected from three reservoirs on the reservation (Mountain View, Lake Billy Shaw, and Sheep Creek) during sampling events in 2007, 2009, and 2013, to determine the risk of Hg exposure to Tribal members and the general public.
Mercury concentration in predatory fish tends to increase with fish length, and this tendency was true for rainbow trout in the reservoirs on the reservation (r2 = 0.44–0.70). Mean (average) and median Hg concentrations in fish tissue were determined for each reservoir for each sample year. All Hg concentrations were less than the U.S. Environmental Protection Agency’s water-quality criterion of 0.30 milligram per kilogram (mg/kg wet weight [ww]) and the Idaho Department of Environmental Quality’s reasonable potential to exceed threshold of 0.24 mg/kg. Idaho Department of Health and Welfare toxicologists determined that the Hg concentrations in rainbow trout in this study would not warrant a fish-consumption advisory for this species.
Throughout this report, statistical findings with a p-value of less than 0.05 are referred to as “significant.” Mean Hg concentrations in fish-tissue samples collected from Mountain View Reservoir were higher in 2007 (0.12 mg/kg ww) than in 2009 and 2013 (0.07 and 0.06 mg/kg ww, respectively), indicating a significant mean decrease. Mean Hg concentrations in fish-tissue samples collected from Lake Billy Shaw showed no significant differences among sample years (2007, 0.12 mg/kg ww; 2009, 0.07 mg/kg ww; 2013, 0.09 mg/kg ww). Mean Hg concentrations in fish-tissue samples collected from Sheep Creek Reservoir significantly increased in 2013 (0.10 mg/kg ww) from concentrations in 2007 and 2009 (0.06 and 0.05 mg/kg ww, respectively). These temporal and spatial variations are not unexpected, as each body of water may differ in the factors and conditions affecting the rate of methylation and demethylation.
Coupled with the dynamic put-and-take fishery, the outcomes reflect the system complexities among reservoirs despite their fairly close proximity to one another. The influence of these other factors is evident when the analysis of atmospheric Hg deposition at Mercury Deposition Network site NV02 in northern Nevada showed no significant linear trend in wet Hg deposition rates for 2003–2013 (average 3.02 micrograms per square meter).
IntroductionThe Duck Valley Indian Reservation spans the border
of Idaho and Nevada (fig. 1). The reservation, established by executive order on April 16, 1877, is home to about 2,000 members of the Shoshone-Paiute Tribes (hereafter referred to as “the Tribes”). The Tribes manage three reservoirs (Mountain View, Lake Billy Shaw, and Sheep Creek Reservoirs) on the reservation as a subsistence fishery, and sport fishery for recreation and economic benefit. The Tribes have expressed concern about the potential for mercury (Hg) contamination of these reservoirs and their aquatic biota. Research conducted in 2005 by Abbot and others (2008) from the U.S. Department of Energy Idaho National Laboratory showed elevated levels of atmospheric Hg entering southern Idaho from gold processing sites in northern Nevada. Average Hg concentrations of trout sampled from nearby Nevada waters in 2005 and 2006 were 0.09–0.17 mg/kg ww (Nevada Department of Wildlife, 2007). Because of mercury’s potential toxicity to humans, the Tribes needed more information on the occurrence of Hg concentrations in their fishery to help determine if those concentrations posed a risk to Tribal members and the general public. To determine the bioaccumulation of Hg in the Tribes’ rainbow trout fishery and the potential risk to the consumers, the U.S. Geological Survey (USGS) began monitoring Hg concentrations in rainbow trout in the reservation’s three reservoirs in 2007, with additional sampling conducted in the 2009 and 2013.

2 Mercury in Rainbow Trout, Duck Valley Indian Reservation Reservoirs, Southwest Idaho and Northern Nevada, 2007, 2009, and 2013
tac14-0959_fig01
STAT
E HW
Y 51
STATE HWY 225
STATE HWY 225
Lake Billy Shaw
Sheep CreekReservoir
Mountain ViewReservoir
Owyhee
Base map modified from U.S. Geological Survey digital data, 1:100,000. Coordinate Reference System IDTM83, Transverse Mercator projection.Horizontal datum is North American Datum of 1983.
Duck ValleyReservation
NEVADA
IDAHO
115°57'116°07'30"116°18'
42°10'
42°00'
41°50'
0 5 10 KILOMETERS2.5
0 5 10 MILES2.5
NV99NV02
IDAHO
NEVADA
Duck ValleyReservation
Figure 1. Location of Duck Valley Indian Reservation reservoirs and Mercury Deposition Network sites (NV02 and NV99), southwestern Idaho and northern Nevada.
Mercury is a global pollutant that ultimately makes its way into every aquatic ecosystem through the hydrologic cycle. Atmospheric deposition of inorganic Hg contributes the vast majority of Hg to aquatic systems as either dry fall or scavenged during precipitation events, although geologic sources and point-source pollution also may contribute to Hg loading (Rada and others, 1989; Fitzgerald and others, 1991; Kamman and Engstrom, 2002). Once it is in aquatic systems, inorganic Hg may become methylated through microbial sulfate and iron reduction (Fitzgerald and Lamborg, 2003; Fleming and others, 2006; Kerin and others, 2006).
Reservoirs are particularly prone to Hg methylation because of increased microbial activity that results from water-level fluctuations; they can also respond quickly to direct Hg deposition (Sorensen and others, 2005; Wiener and others, 2007; Brigham and others, 2014). Methylmercury (MeHg) is the more bioavailable and toxic form of Hg; once Hg has moved through aquatic food chains into predatory fish, almost all Hg present in fish tissue is MeHg. In turn, sport fish that are most commonly captured and consumed by subsistence or recreational anglers tend to be predatory fish.

Data Quality Objectives 3
As a result of these dynamics, risks of human exposure to MeHg are primarily through consumption of fish (U.S. Environmental Protection Agency, 2001). Sources of Hg often are not well quantified. However, they likely include atmospheric deposition, historical gold mining operations, and natural sources. The U.S. Environmental Protection Agency (USEPA, 2015) Toxic Release inventory for data from 2001 to 2013 shows that most Hg (stack) emissions in Nevada come from gold mining and processing facilities. Mercury often is released from thermal processes where it enters the air during the gold extraction process (Jones and Miller, 2005). Air emissions from these mining and processing facilities may travel great distances, affecting States throughout the Intermountain West. In 2001, USEPA toxic release inventory data showed that Nevada metal mining companies reported releasing about 9 percent of total U.S. mercury compounds as point source (stack) emissions. This amount has steadily decreased, becoming 6.5 percent of the total U.S. emissions in 2002, 3.6 percent in 2003 (Jones and Miller, 2005), and 1.4 percent in 2013. Overall, reported Hg mass from stack emissions attributed to mines and mine processing in Nevada has decreased from about 11,800 lb in 2001 to 932 lb in 2013, a 92 percent decrease (U.S. Environmental Protection Agency, 2015).
Regulatory Guidance
The USEPA recommended a water-quality criterion for MeHg expressed as a fish-tissue residue value (MeHg in fish tissue) of 0.30 mg/kg ww (U.S. Environmental Protection Agency, 2001). The MeHg criterion is based on fresh weight, appropriately indicating the nature of fish destined for human consumption. This criterion is based on protecting an adult consumer who eats an average of 17.5 g of fish per day, equivalent to about one 8-ounce serving every other week (U.S. Environmental Protection Agency, 2001; Idaho Department of Environmental Quality, 2005).
The Idaho Department of Environmental Quality (IDEQ) adopted the USEPA fish-tissue criterion and established a reasonable potential to exceed (RPTE) threshold designed to protect consumers that is 20 percent lower than the criterion or Hg greater than 0.24 mg/kg ww based on an average concentration of 10 fish from a receiving waterbody (Idaho Department of Environmental Quality, 2005). The Idaho Fish Consumption Advisory Program (IFCAP) applies an even lower action level of 0.22 mg/kg ww Hg, which is compared to the geometric mean Hg concentration of 10 fish of a single species collected from a single water body (lake or stream). IFCAP compares the action level and angling usage of each water body to determine if a consumption advisory should be issued.
For this study, total Hg is analyzed in place of MeHg in fish tissue for two reasons: (1) total Hg is easier and less costly for laboratories to determine than MeHg, and (2) nearly all Hg present in fish muscle tissue is MeHg (Bloom, 1992; Hammerschmidt and others, 1999; Harris and others, 2003). In comparing fish-tissue results with the criterion, the analytical results for total Hg in the fish tissue should be interpreted as 100 percent MeHg. For the remainder of this report, total Hg analyzed in fish tissue will be referred to as “Hg”.
Purpose and Scope
This report presents the results of the fish tissue analysis from samples collected from three reservoirs on the Duck Valley Indian Reservation in 2007, 2009, and 2013 in order to identify changes in fish-tissue Hg concentration within and between reservoirs for different sampling periods. A summary of annual atmospheric deposition rates measured at one of two northern Nevada Mercury Deposition Network (MDN) sites also is included. The scope of the investigation is limited to rainbow trout in the range of sizes people are likely to catch and eat from the reservoirs on the reservation.
Description of Study Area
Duck Valley Indian Reservation encompasses nearly 290,000 acres, of which 22,000 acres are wetlands. Three reservoirs were created on the reservation as a subsistence fishery, but they also provide the Tribes with a valued sport fishery for recreation and economic benefit (fig. 1). Mountain View Reservoir lies in the north-central part of the reservation and is about 2 mi long with a surface area of about 630 acres. Lake Billy Shaw is about 9 mi southwest of Mountain View Reservoir and covers about 430 surface acres near the central area of the reservation. Sheep Creek Reservoir is 6 mi south of Lake Billy Shaw in the south-west area of the reservation and covers about 855 surface acres. The perimeters of the reservoirs are shallow coves with riparian vegetation consisting of cattails, willows, and other aquatic vegetation; upland areas around the reservoirs primarily are sagebrush and grasses.
Data Quality ObjectivesData-quality objectives for sample collection, analysis,
and reporting for this study are listed as follows, and provide Hg concentrations in fish-tissue data collected from Mountain View, Lake Billy Shaw, and Sheep Creek Reservoirs:

4 Mercury in Rainbow Trout, Duck Valley Indian Reservation Reservoirs, Southwest Idaho and Northern Nevada, 2007, 2009, and 2013
1. Collect fish that represent the size range (>25 cm) likely to be captured and consumed by recreational or subsistence anglers near the sampling sites (table 2, at back of report).
2. Analyze hatchery trout provided by the Tribes from the Black Canyon Trout Farm in Grace, Idaho, as background samples for Hg concentration in stocked fish (table 2).
3. Use sample processing, handling, storage, shipping, and quality-assurance protocols sufficient to avoid introducing sample contamination or bias to the data.
4. Use laboratory analytical techniques that have sufficiently low detection limits to quantify Hg concentrations in fish tissue at less than 0.24 mg/kg ww (Idaho RPTE threshold).
5. Analyze quality-control samples to provide accuracy and precision information for the fish-tissue samples collected (table 3, at back of report). Quality control included analysis of certified reference material (CRM) to verify instrument calibration (accuracy), and analyses of triplicate fish-tissue samples as an assessment of repeatability (precision) for all sample years. In 2009 and 2013, field duplicates were added as an additional measure of quality control.
6. Following review, provide fish-tissue data to the Tribes, to the general public through the USGS National Water Information System, and in this report.
Sampling and Analysis
Field Sampling Methods
Fifteen rainbow trout (Oncorhynchus mykiss) were collected from each of the reservoirs (Mountain View, Lake Billy Shaw, and Sheep Creek Reservoirs) for each sample year (2007, 2009, and 2013). One fish from Lake Billy Shaw in 2013 was not analyzed because of an external injury. Sampling in 2007 was conducted in late May, and samples in 2009 and 2013 were collected during the first week of June. Because one of the objectives was to sample a range of fish in sizes people are likely to catch and eat, experimental gill nets (mesh with several size openings) were used to reduce the effect of size selection based on a single mesh size (Hubert, 1983). These nets were used to collect samples, with the exception of fish collected on Sheep Creek Reservoir in 2007 when electrofishing was used. Fish were collected and stored in a live well on the boat during daily sampling events. Each fish was then measured, weighed, euthanized, and placed in separate clean, clear, zip-seal bags on wet ice; all fish
were frozen within 24 hours of capture. Sample preparation followed guidelines in U.S. Environmental Protection Agency (2000) and Scudder and others (2008); final sample processing was conducted at the USGS Idaho Water Science Center’s sample preparation area in Boise, Idaho. Individual samples, consisting of a 1-in. skinless fillet, were taken from each fish just below the dorsal fin (Goldstein and others, 1996). The samples were placed in self-sealing plastic bags, labeled, and frozen; they later were packed on dry ice for shipment to the USGS Mercury Research Laboratory (USGS MRL) in Middleton, Wisconsin, for analysis.
Fish-Tissue Laboratory Analysis
The USGS MRL provided analysis of Hg in fish tissue consistent with USEPA Method 7473 (U.S. Environmental Protection Agency, 2007). This method provides a minimum detection limit of 0.008 mg/kg dry weight (dw), based on a 20–50 mg sample size. The detection limit is sufficiently low to quantify Hg concentrations in fish tissue at less than 0.22 mg/kg ww required for IFCAP fish consumption advisory assessments.
Atmospheric Mercury Deposition Data Analysis
The USEPA operates two mercury wet deposition sites in northern Nevada (NV02 and NV99), upwind of the Duck Valley Indian Reservation as part of the National Atmospheric Deposition Program’s (NADP) Mercury Deposition Network (MDN) (fig. 1). Wind vector and frequency analysis from a remote automated weather station on the reservation (Western Regional Climate Center, 2014) indicates that 44 percent of the prevailing winds are from the southwest compass quadrant, making site NV02, about 68 mi southwest of Sheep Creek Reservoir—the obvious choice for comparison of the Hg deposition rates in relation to reservoir fish samples. Details of the NADP methods and quality-assurance information are available online (National Atmospheric Deposition Program, 2014a). In general, Hg deposition data are collected at the MDN site and analyzed weekly for mercury deposition, summarized and normalized by precipitation, and reported to the public as an annual precipitation weighted wet Hg deposition rate (National Atmospheric Deposition Program, 2014b). Data from NADP for 2003–2013 were used to assess trends in Hg deposition on the reservation. Analysis of data outside of the tissue sampling year is helpful because elemental Hg may take years to enter into an aquatic system (Harris and others, 2007). Temporal trend testing was done through simple linear regression procedures using NCSS 10 data analysis software (NCSS Statistical Software, 2015). The annual depositional rate at site NV02 was regressed against year; a slope that is significant (p <0.05) indicates a trend.

Sampling and Analysis 5
Statistical Analysis
Analysis of variance (ANOVA) one-way parametric analysis was used to test the significance of difference in mean fish-tissue Hg concentrations for individual reservoirs among years. Because Hg concentration was positively correlated to fish length (fig. 2), Hg concentration was normalized by fish length, and then log transformed to remove much of the heteroscedasticity (unequal variance) of residuals. Data were assumed to be normally distributed. Significant differences were determined if the F-ratio exceeded the critical value (p <0.05). For tests that indicated a significant difference, a
multiple comparison test (Fisher’s LSD, α = 0.05) was used to determine which years were significantly different. All ANOVA and multiple comparison statistical tests were done using NCSS 10 data analysis software (NCSS Statistical Software, 2015). A Mann-Kendall test also was run on the normalized and transformed data to determine monotonic change (trend) of Hg concentration in relation to time. The null hypothesis of “no change” is rejected if the S statistic is significantly different from 0 (p <0.05). The Mann-Kendall statistical test was performed with a USGS software package (Helsel and others, 2006).
tac14-0959_fig02
r2 = 0.70
r2 = 0.53
r² = 0.44
0
0.1
0.2
0.3
0
0.1
0.2
0.3
0
0.1
0.2
0.3
0 10 20 30 40 50 60
Tota
l mer
cury
con
cent
ratio
n, in
mill
igra
ms
per k
ilogr
am
Length, in centimeters
2007
2009
2013
Mountain View Reservoir, Idaho
Lake Billy Shaw, Nevada
Sheep Creek Reservoir, Nevada
Hatchery background samples from Black Canyon Trout Farm, Grace, Idaho
Expon. (All Fish)
EXPLANATION
Figure 2. Mercury concentration in fish tissue by length from Duck Valley Indian Reservation reservoirs and hatchery background samples from the Black Canyon Trout Farm, southwestern Idaho and northern Nevada, 2007, 2009, and 2013.

6 Mercury in Rainbow Trout, Duck Valley Indian Reservation Reservoirs, Southwest Idaho and Northern Nevada, 2007, 2009, and 2013
Results and Discussion
Rainbow Trout Mercury Concentrations
Predatory fish generally tend to bioaccumulate Hg, with larger fish having higher Hg concentrations. Graphs of Hg concentration by fish length (fig. 2) show this principle for each of the sample years and each of the reservoirs. In aggregate, the correlation between fish length and Hg concentration was highest in 2007 (r2 = 0.70), and decreased in subsequent years to r2 = 0.53 (2009) and r2 = 0.44 (2013).
Mean fish-tissue Hg concentrations significantly decreased in Mountain View Reservoir (p = 0.01) between 2007 (0.12 mg/kg ww) and 2009 (0.07 mg/kg ww) (table 1) and changed little between 2009 (0.07 mg/kg ww) and 2013 (0.06 mg/kg ww). Results of the Mann-Kendall trend test showed a significant decreasing trend in Hg concentration in Mountain View Reservoir between 2007 and 2013 (p <0.001). Mean Hg concentration among the sample years in Lake Billy Shaw showed variance in Hg concentrations between sample years (2007, 0.12 mg/kg ww; 2009, 0.07 mg/kg ww; 2013, 0.09 mg/kg ww) with no significant difference between means (p = 0.14), and no temporal trend observed
(p = 0.31). Mean Hg concentrations increased in Sheep Creek Reservoir (p <0.01) between 2009 (0.05 mg/kg ww) and 2013 (0.10 mg/kg ww), with minimal change in concentration between 2007 (0.06 mg/kg ww) and 2009 (0.05 mg/kg ww) (table 1); this reservoir showed an increasing trend in Hg concentration (p <0.01).
Hg concentrations exceeded the RPTE threshold of 0.24 mg/kg ww in only 3 of the 134 fish sampled in the reservoirs during the 3 sampling years, and did not exceed the IDEQ water-quality criterion of 0.30 mg/kg ww in any of the fish sampled in the reservoirs for any of the sampled years. In 2007, Hg concentrations exceeded the RPTE threshold in one fish from each of the reservoirs—Mountain View Reservoir (0.26 mg/kg ww); Lake Billy Shaw (0.26 mg/kg ww); and Sheep Creek Reservoir (0.29 mg/kg ww) (table 1, fig. 3). Hg concentrations did not exceed the RPTE threshold limit in any of the fish sampled in 2009 or 2013 (fig. 3). Idaho Department of Health and Welfare toxicologists determined that the Hg concentrations in rainbow trout in this study would not warrant a fish consumption advisory (Jim Vannoy, Idaho Department of Health and Welfare, written commun., December 11, 2009, and March 11, 2014).
Table 1. Statistical summary of annual sampling events for Duck Valley Indian Reservation reservoirs, southwestern Idaho and northern Nevada, 2007, 2009, and 2013.
[Site locations are shown in figure 1. mg/kg, milligram per killogram]
Sample year
Mercury (mg/kg wet weight)
Standard deviation
Minimum MaximumNumber of samples
Geometric mean
per site
Median per site
Mean per site
Mountain View Reservoir, Idaho
2007 0.10 0.14 0.12 0.08 0.02 0.26 152009 0.06 0.06 0.07 0.03 0.02 0.14 152013 0.05 0.05 0.06 0.02 0.01 0.10 15
Lake Billy Shaw, Nevada
2007 0.10 0.11 0.12 0.07 0.03 0.26 152009 0.07 0.08 0.07 0.03 0.03 0.11 152013 0.08 0.09 0.09 0.03 0.05 0.16 14
Sheep Creek Reservoir, Nevada
2007 0.04 0.03 0.06 0.07 0.02 0.29 152009 0.05 0.04 0.05 0.03 0.02 0.10 152013 0.09 0.08 0.10 0.05 0.04 0.23 15

Results and Discussion 7
tac14-0959_fig03
2007 2009 2013 2007 2009 2013 2007 2009 2013
Tota
l mer
cury
con
cent
ratio
n in
fish
tiss
ue, i
n m
illig
ram
s pe
r kilo
gram
wet
wei
ght
0.5
0.4
0.3
0.2
0.1
0
Idaho water-quality criterion (0.30 mg/kg)
RPTE threshold (average >0.24 mg/kg)
IFCAP action level (geometric mean of 0.22 mg/kg)
Mountain View Reservoir, Idaho Lake Billy Shaw, Nevada Sheep Creek Reservoir, Nevada
Largest point within 3rd quartile plus 1.5 times the IQR
Median
25th percentile
75th percentile
Smallest point within 1st quartile minus 1.5 times the IQR
Inte
rqua
rtile
ra
nge
(IQR)
X Outside values (values from 1.5 to 3.0 times the IQR)
Far-out values (values 3.0 times the IQR)
X Outside values (values 1.5 to 3.0 times the IQR)
Far-out values (values 3.0 times the IQR)
EXPLANATION
Figure 3. Sample concentration by year for rainbow trout sampled from Duck Valley Indian Reservation reservoirs, southwestern Idaho and northern Nevada, 2007, 2009, and 2013. RPTE threshold, reasonable potential to exceed 80 percent of the Idaho mercury water-quality criterion of 0.30 milligram per kilogram (mg/kg) wet weight mercury or greater than 0.24 mg/kg in an average of 10 fish; IFCAP action level, Idaho Fish Consumption Advisory Project recommends consideration of issuing a fish advisory when the geometric mean of mercury in 10 fish exceeds 0.22 mg/kg wet weight).

8 Mercury in Rainbow Trout, Duck Valley Indian Reservation Reservoirs, Southwest Idaho and Northern Nevada, 2007, 2009, and 2013
The variation in Hg concentrations in fish tissue between years in each reservoir may be due to confounding factors such as water-level fluctuations, light penetration limitations due to turbidity from suspended sediments or an abundance of organic matter, or other factors affecting methylation and demethylation rates (Wiener and others, 2007). Changes in fish population because of fish stocking practices and fish harvesting also may create an artifact in data and exemplifies the complexity of the systems (Wiener and others, 2007). The Tribes also stock the reservoirs with large hatchery trout to reduce predation from bass in the reservoirs (Edmond Murrell, Shoshone-Paiute Tribes then-Director of Fish, Wildlife and Parks Department, oral commun., 2012). These hatchery trout have low Hg concentrations, and may be the reason there is variability in the Hg concentration in larger fish (fig. 2). Information provided by the Tribes shows that they stocked 24,000 lb of catchable fish in late April and early May in each of the sample years. In 2007 and 2013, the hatchery stock was distributed equally among the three reservoirs, and ranged from 254 to 355 mm (10–14 in.) in length; in 2009, 16,000 lb was placed in Mountain View Reservoir, and 8,000 lb in Sheep Creek Reservoir, ranging from 254 to 330 mm (10–13 in.) in length (Jinwon Seo and Richard Edwards, Shoshone-Paiute Tribes Fish, Wildlife and Parks Department, written commun., 2015). The lengths should be considered estimates only, as one hatchery trout provided to the USGS for analysis in 2013 was 462 mm (18 in.) in length.
Atmospheric Wet Mercury Deposition
From 2003 to 2013, the rate of wet Hg deposition at site NV02 (average 3.02 μg/m2) showed no significant temporal linear trend (p = 0.79). Despite the decrease in total reported Hg compounds as point source (stack) emissions from Nevada mine operations from 2001 to 2013, there does not seem to be a decrease in the annual mercury deposition rate at site NV02 between 2003 and 2013 (fig. 4) (National Atmospheric Deposition Program, 2014b). This finding may be due to factors such as the locations of active gold processing sites in relation to regional wind patterns, or that the primary source of Hg to site NV02 may be from the global atmospheric Hg pool. Although there was an elevated wet Hg deposition rate measured in 2009 (5.66 μg/m2), there was no significant linear trend between 2003 and 2013 (fig. 4).
tac14-0959_fig04
0
1
2
3
4
5
6
0
1
2
3
4
5
6
2003 2005 2007 2009 2011 2013
Annu
al w
et m
ercu
ry d
epos
ition
rate
, in
mic
rogr
ams
per s
quar
e m
eter
No linear trend, p = 0.79
Quality Control for Fish Analysis
The USGS MRL has extensive quality-assurance and quality control procedures (U.S. Geological Survey, 2014). Briefly, the USGS MRL uses International Atomic Energy Agency certified reference material 407, or Institute for National Measurement Standards certified reference material DORM-2, to verify laboratory instrument calibration before each daily sample run (Institute for National Measurement Standards, 1993; International Atomic Energy Agency, 2003). To determine instrument accuracy, CRM is analyzed at the beginning of the sample processing day, after every 10 samples, and again at the end of the sample run. The relative percentage of difference of duplicates required by the USEPA is less than 24 percent (U.S. Environmental Protection Agency, 2002). Triplicates of sample material are analyzed to determine repeatability (precision) and should be within 15 percent of the relative standard deviation for replicate analysis to meet USGS MRL standards. For this project, field replicates were analyzed to determine bias in sample processing. The goal for relative percentage of difference in field replicates was established at less than 20 percent.
Hg concentrations in QC samples are presented with the environmental sample results (table 3). Table 3 also includes laboratory CRM results used to verify equipment calibration (accuracy), and triplicate sample results from individual fish to assess repeatability (precision) for all sample years. The accuracy of the data was within the USEPA standard of less than 24 percent of the most probable value for certified reference material for Hg (U.S. Environmental Protection Agency, 2002).
Figure 4. Annual wet mercury deposition rate at Mercury Deposition Network site NV02, Lesperance Ranch, Nevada, 2003–2013. Only complete data meeting National Atmospheric Deposition Program standards for data completion are plotted.

References Cited 9
Certified reference material recovery of Hg in QC samples ranged from 84.8 to 122 percent, within the required recovery of 76–124 percent of the theoretical value. The precision of the triplicate sample material was within 15 percent relative standard deviation in laboratory replicate analyses and ranged from 0.474 to 4.31 percent. Field duplicates also were analyzed as a measure of quality control, ranging from 0 to 14.7 percent, below the project goal of less than 20 percent relative percent difference.
SummaryThe U.S. Geological Survey, in cooperation with
the Shoshone-Paiute Tribes of the Duck Valley Indian Reservation, monitored mercury (Hg) concentrations in rainbow trout to determine the risk of Hg exposure to Tribal members and the general public. Mean and median Hg concentrations were determined for 2007, 2009, and 2013, and all were less than the U.S. Environmental Protection Agency water-quality criterion of 0.30 milligram per kilogram (mg/kg) (wet weight, ww), and the Idaho Department of Environmental Quality reasonable potential to exceed threshold of 0.24 mg/kg ww. Idaho Department of Health and Welfare toxicologists determined that the Hg concentrations in rainbow trout in this study would not warrant a fish-consumption advisory for this species.
Analysis of fish-tissue samples from Mountain View Reservoir indicated a significant decrease (p = 0.01, analysis of variance test) in mean Hg concentrations between 2007 (0.12 mg/kg ww) and 2009 (0.07 mg/kg ww), and no significant difference between 2009 (0.07 mg/kg ww) and 2013 (0.06 mg/kg ww). Results of the Mann-Kendall trend test showed a decreasing trend in Hg concentration over time (p <0.001) for this reservoir. Mean Hg concentrations in Lake Billy Shaw indicated no significant difference between sample years (p = 0.14) and no significant trend (p = 0.31). Mean Hg concentrations in Sheep Creek Reservoir indicated little change between 2007 (0.06 mg/kg ww) and 2009 (0.05 mg/kg ww), whereas there was a significant difference (p <0.01) between 2009 (0.05 mg/kg ww) and 2013 (0.10 mg/kg ww); Hg concentration in this reservoir showed an increasing trend (p <0.01). There was no statistically significant linear trend indicating a relationship between a regional atmospheric source of Hg as measured at Mercury Deposition Network site NV02 and the Hg concentration increase in fish collected from Sheep Creek Reservoir during 2009 and 2013. However, there was an elevated annual atmospheric deposition rate in 2009 (5.66 micrograms per square meter [μg/m2]), and terrestrial sources of Hg can take years or decades to enter aquatic ecosystems. Determining the source of Hg in Duck Valley Reservation’s reservoirs
would require additional study. Without attributing cause, or identifying a source, Hg concentrations in trout tend to follow a pattern of increasing Hg concentrations in fish tissue from north to south on the reservation. A decreasing trend was noted in Mountain View Reservoir (p <0.00), no trend was found in Lake Billy Shaw (p = 0.31), and an increasing Hg trend was found in Sheep Creek Reservoir (p <0.01). Overall, management of the fishery as well as other factors may affect the bioaccumulation of Hg in fish tissue. It was beyond the scope of this study to identify methylation processes that may be unique to each reservoir. Further study of Hg processing in the reservoirs may provide important clues for future management decisions concerning the Shoshone-Paiute Tribes fishery.
AcknowledgmentsWe would like to thank the Shoshone-Paiute Tribes
and, in particular, Heather Lawrence, Director for the Tribal Environmental Program, and John Crum, a former staff member, for their contributions to this investigation. This project would not have been possible without their untiring effort over many years. We also would like to express our appreciation to the former Director of Fish, Wildlife and Parks, Edmond Murrell, the current Director, Dr. Jinwon Seo, and their respective staff personnel for the assistance they provided.
References Cited
Abbott, M.L., Lin, C.J., Martian, P., and Einerson, J.J., 2008, Atmospheric mercury near Salmon Falls Creek Reservoir in southern Idaho: Applied Geochemistry, v. 23, no. 3, p. 438–453, accessed December 29, 2014, at http://dx.doi.org/10.1016/j.apgeochem.2007.12.012.
Bloom, N.S., 1992, On the chemical form of mercury in edible fish and marine invertebrate tissue: Canadian Journal of Fisheries and Aquatic Sciences, v. 49, no. 5, p. 1,010–1,017, accessed December 29, 2014, at http://dx.doi.org/10.1139/f92-113.
Brigham, M.E., Sandheinrich, M.B., Gay, D.A., Maki, R.P., Krabbenhoft, D.P., and Wiener, J.G., 2014, Lacustrine responses to decreasing wet mercury deposition rates—Results from a case study in northern Minnesota: Environmental Science and Technology, v. 48, no. 11, p. 6,115–6,123, accessed February 24, 2015, at http://dx.doi.org/10.1021/es500301a.

10 Mercury in Rainbow Trout, Duck Valley Indian Reservation Reservoirs, Southwest Idaho and Northern Nevada, 2007, 2009, and 2013
Fleming, E.J., Mack, E.E., Green, P.G., and Nelson, D.C., 2006, Mercury Methylation from Unexpected Sources—Molybdate-inhibited freshwater sediments and an iron-reducing bacterium: Applied and Environmental Microbiology, v. 72, no. 1, p. 457–464, http://dx.doi.org/10.1128/AEM.72.1.457-464.2006.
Fitzgerald, W.F., and Lamborg, C.H., 2003, Geochemistry of mercury in the environment, in Turekian, K.K., and Holland, H.D., eds., Treatise on geochemistry: San Diego, Elsevier Pergamon, p. 107–148.
Fitzgerald, W.F., Mason, R., and Vandal, G., 1991, Atmospheric cycling and air-water exchange of mercury over mid-continental lacustrine regions: Water, Air, and Soil Pollution, v. 56, no. 1, p. 745–767.
Goldstein, R.M., Brigham, M.E., and Stauffer, J.C., 1996, Comparison of mercury concentrations in liver, muscle, whole bodies, and composites of fish from the Red River of the North: Canadian Journal of Fisheries and Aquatic Sciences, v. 53, no. 2, p. 244–252.
Hammerschmidt, C.R., Wiener, J.G., Frazier, B.E., and Rada, R.G., 1999, Methylmercury content of eggs in yellow perch related to maternal exposure in four Wisconsin lakes: Environmental Science and Technology, v. 33, no. 7, p. 999–1,003.
Harris, H.H., Pickering, I.J., and George, G.N., 2003, The chemical form of mercury in fish: Science, v. 301, no. 5,637, p. 1,203, accessed December 29, 2014, at http://dx.doi.org/10.1126/science.1085941.
Harris, R.C., Rudd, J.W.M., Amyot, M., Babiarz, C.L., Beaty, K.G., Blanchfield, P.J., Bodaly, R.A., Branfireun, B.A., Gilmour, C.C., Graydon, J.A., Heyes, A., Hintelmann, H., Hurley, J.P., Kelly, C.A., Krabbenhoft, D.P., Lindberg, S.E., Mason, R.P., Paterson, M.J., Podemski, C.L., Robinson, A., Sandilands, K.A., Southworth, G.R., St. Louis, V.L., and Tate, M.T., 2007, Whole-ecosystem study shows rapid fish-mercury response to changes in mercury deposition: Proceedings of the National Academy of Sciences, v. 104, no. 42, p. 16,586–16,591, accessed December 29, 2014, at http://dx.doi.org/10.1073/pnas.070418610.
Helsel, D.R., Mueller, D.K., and Slack, J.R., 2006, Computer program for the Kendall family of trend tests: U.S. Geological Survey Scientific Investigations Report 2005-5275, p. 4, http://pubs.usgs.gov/sir/2005/5275/.
Hubert, W.A., 1983, Passive capture techniques, in Nielsen, L.A., and Johnson, D.L., eds., Fisheries techniques: Bethesda, Maryland, American Fisheries Society, p. 95–122.
Idaho Department of Environmental Quality, 2005, Implementation guidance for the Idaho mercury water quality criteria: Boise, Idaho Department of Environmental Quality, p. 212, accessed October 29, 2014, at http://www.deq.state.id.us/water-quality/surface-water/mercury.aspx.
Institute for National Measurement Standards, 1993, DORM-2, dogfish muscle certified reference material for trace metals: Ottawa, Ontario, Canada, National Research Council of Canada, p. 4, accessed February 24, 2015, at http://www.nrc-cnrc.gc.ca/obj/doc/solutions-solutions/advisory-consultatifs/crm-mrc/dorm_2_e.pdf.
International Atomic Energy Agency, 2003, Trace elements and methylmercury in fish tissue: Vienna, Austria, International Atomic Energy Agency Reference Sheet IAEA-407, accessed December 15, 2014, at http://www.iaea.org/nael/refmaterial/iaea407.pdf.
Jones, G., and Miller, G., 2005, Mercury and modern gold mining in Nevada—Final report to the U.S. Environmental Protection Agency, Region IX: University of Nevada, Reno, Department of Environmental Sciences and Natural Resources, p. 41, http://www.chem.unep.ch/mercury/Trade%20information/NRDC-NEVADABYPRODUCTRECOVERYREPORT.pdf.
Kamman, N.C., and Engstrom, D.R., 2002, Historical and present fluxes of mercury to Vermont and New Hampshire lakes inferred from Pb dated sediment cores: Atmospheric Environment, v. 36, no. 10, p. 1599–1609.
Kerin, E.J., Gilmour, C.C., Roden, E., Suzuki, M.T., Coates, J.D., and Mason, R.P., 2006, Mercury Methylation by Dissimilatory Iron-Reducing Bacteria: Applied and Environmental Microbiology, v. 72, no. 12, p. 7919-7921, http://dx.doi.org/10.1128/AEM.01602-06.
National Atmospheric Deposition Program, 2014a, Mercury Deposition Network: Web site, accessed December 19, 2014, at http://nadp.sws.uiuc.edu/mdn/.
National Atmospheric Deposition Program, 2014b, MDN annual data: Web site, accessed December 19, 2014, at http://nadp.sws.uiuc.edu/data/mdn/annual.aspx.
NCSS Statistical Software, 2015, NCSS 10: Kaysville, Utah, NCSS, LLC.
Nevada Department of Wildlife, 2007, Mercury in the environment: Nevada Department of Wildlife Web site, accessed http://www.ndow.org/Fish/Fish_Safety/Mercury/.

References Cited 11
Rada, R., Wiener, J., Winfrey, M., and Powell, D., 1989, Recent increases in atmospheric deposition of mercury to north-central Wisconsin lakes inferred from sediment analyses: Archives of Environmental Contamination and Toxicology, v. 18, nos. 1–2, pp. 175–181, accessed December 29, 2014, at http://dx.doi.org/10.1007/BF01056202.
Scudder, B.C., Chasar, L.C., DeWeese, L.R., Brigham, M.E., Wentz, D.A., and Brumbaugh, W.G., 2008, Procedures for collecting and processing aquatic invertebrates and fish for analysis of mercury as part of the national water-quality assessment program: U.S. Geological Survey Open-File Report 2008-1208, p. 35, http://pubs.usgs.gov/of/2008/1208/.
Sorensen, J.A., Kallemeyn, L.W., and Sydor, M., 2005, Relationship between mercury accumulation in young-of-the-year yellow perch and water-level fluctuations: Environmental Science and Technology, v. 39, no. 23, p. 9,237–9,243, accessed October 28, 2014, at http://dx.doi.org/10.1021/es050471r.
U.S. Environmental Protection Agency, 2000, Guidance for assessing chemical contaminant data for use in fish advisories–Volume 1, Fish sampling and analysis (3rd ed.): U.S. Environmental Protection Agency, EPA 823-B-00-007, 485 p., http://water.epa.gov/scitech/swguidance/fishshellfish/techguidance/.
U.S. Environmental Protection Agency, 2001, Water quality criterion for the protection of human health—Methylmercury: U.S. Environmental Protection Agency, EPA-823-R-10-001, 221 p., accessed March 10, 2014, at http://www.epa.gov/waterscience/criteria/methylmercury/.
U.S. Environmental Protection Agency, 2002, Method 1631, Revision E–Mercury in water by oxidation, purge, and trap, and cold vapor atomic fluorescence spectrometry: .U.S. Environmental Protection Agency, Office of Water, EPA-821-R-02-019, p. 46, accessed December 29, 2014, at http://water.epa.gov/scitech/methods/cwa/metals/mercury/index.cfm.
U.S. Environmental Protection Agency, 2007, Mercury in solids and solutions they thermal decomposition, amalgamation, and atomic absorption spectrophotometry: U.S. Environmental Protection Agency Method 7473 (SW-846), accessed December 29, 2014, at www.epa.gov/osw/hazard/testmethods/sw846/pdfs/7473.pdf.
U.S. Environmental Protection Agency, 2015, Toxic Release Inventory (TRI) Program: Web site, accessed March 11, 2015, at http://www2.epa.gov/toxics-release-inventory-tri-program.
U.S. Geological Survey, 2014, U.S. Geological Survey Mercury Research Laboratory: U.S. Geological Survey Web site, accessed December 29, 2014, at http://wi.water.usgs.gov/mercury-lab/index.html.
Western Regional Climate Center, 2014, Remote automated weather stations USA climate archive: Desert Research Institute Web site, accessed December 29, 2014, at http://www.raws.dri.edu/index.html.
Wiener, J.G., Bodaly, R.A., Brown, S.S., Lucotte, M., Newman, M.C., Porcella, D.B., Reash, R.J., and Swain, E.B., 2007, Monitoring and evaluating trends in methylmercury accumulation in aquatic biota, in Harris, R., Krabbenhoft, D.P., Mason, R., Murray, M.W., Reash, R., and Saltman, R., eds., Ecosystem responses to mercury contamination—Indicators of change: Boca Raton, Florida, CRC Press, p. 87–122.

12 Mercury in Rainbow Trout, Duck Valley Indian Reservation Reservoirs, Southwest Idaho and Northern Nevada, 2007, 2009, and 2013
Table 2. Individual fish size, weight, and mercury concentration data, and statistical summaries for Duck Valley Indian Reservation reservoirs and hatchery background samples from the Black Canyon Trout Farm, southwestern Idaho and northern Nevada, 2007, 2009, and 2013.
[Site locations are shown in figure 1. Abbreviations: g, gram; mm, millimeter; mg/kg, milligram per kilogram]
Sample date
TimeTotal
length (mm)
Weight (g)
Mercury (mg/kg wet
weight)
Mercury (mg/kg wet weight)
Geometric mean
per site
Median per site
Mean per site
Mountain View Reservoir, Idaho
05-21-07 0830 400 747 0.06 0.10 0.14 0.120831 398 651 0.060832 510 1,522 0.170833 536 1,642 0.190834 480 1,376 0.190835 455 1,075 0.260836 442 884 0.140837 445 946 0.060838 473 1,195 0.140839 542 1,601 0.230840 475 1,207 0.220841 330 446 0.040842 335 412 0.020843 322 373 0.030844 312 337 0.06
06-01-09 1200 471 1,153 0.06 0.06 0.06 0.071201 493 1,289 0.141202 374 576 0.061203 396 711 0.081204 530 1,912 0.121205 363 529 0.021206 339 406 0.021207 360 495 0.081208 337 486 0.061209 335 460 0.061210 422 757 0.081211 301 318 0.041212 290 359 0.031213 440 846 0.051214 432 944 0.08
06-04-13 928 272 298 0.01 0.05 0.05 0.06929 481 1,174 0.10930 418 894 0.06931 477 1,368 0.10932 419 890 0.04933 396 730 0.05934 355 575 0.04935 405 805 0.04936 375 646 0.05937 460 1,080 0.05938 446 1,079 0.07939 339 810 0.07940 456 1,224 0.06941 430 1,022 0.05942 397 882 0.04

Table 2 13
Sample date
TimeTotal
length (mm)
Weight (g)
Mercury (mg/kg wet
weight)
Mercury (mg/kg wet weight)
Geometric mean
per site
Median per site
Mean per site
Lake Billy Shaw, Nevada05-22-07 1400 395 605 0.07 0.10 0.11 0.12
1401 490 958 0.261402 470 1,150 0.251403 410 724 0.061404 430 830 0.101405 465 940 0.111406 485 1,030 0.161407 380 604 0.031408 355 462 0.031409 375 600 0.051410 400 665 0.121411 410 745 0.101412 500 1,150 0.191413 470 1,060 0.161414 390 675 0.08
06-02-09 1200 499 1,349 0.09 0.07 0.08 0.071201 414 685 0.091202 463 922 0.081203 431 805 0.061204 409 688 0.081205 293 292 0.101206 380 498 0.081207 370 405 0.091208 433 775 0.041209 342 438 0.031210 471 973 0.101211 332 380 0.031212 463 1,053 0.061213 307 329 0.031214 430 1,099 0.11
06-05-13 946 455 894 0.07 0.08 0.09 0.09947 470 1,073 0.07949 380 1,190 0.12951 403 630 0.06952 478 880 0.06953 413 1,196 0.09954 481 792 0.05956 525 1,345 0.14957 404 1,400 0.16958 423 680 0.07959 470 825 0.091000 441 1,094 0.111001 406 887 0.091003 272 837 0.09
Table 2. Individual fish size, weight, and mercury concentration data, and statistical summaries for Duck Valley Indian Reservation reservoirs and hatchery background samples from the Black Canyon Trout Farm, southwestern Idaho and northern Nevada, 2007, 2009, and 2013.—Continued

14 Mercury in Rainbow Trout, Duck Valley Indian Reservation Reservoirs, Southwest Idaho and Northern Nevada, 2007, 2009, and 2013
Sample date
TimeTotal
length (mm)
Weight (g)
Mercury (mg/kg wet
weight)
Mercury (mg/kg wet weight)
Geometric mean
per site
Median per site
Mean per site
Sheep Creek Reservoir, Nevada05-22-07 1600 335 418 0.03 0.04 0.03 0.06
1601 392 568 0.291602 295 315 0.031603 345 430 0.051604 380 646 0.041605 345 464 0.041606 350 386 0.101607 435 834 0.031608 355 418 0.101609 335 390 0.031610 295 270 0.021611 300 294 0.021612 290 252 0.031613 275 228 0.031614 270 210 0.03
06-03-09 1200 409 693 0.09 0.05 0.04 0.051201 430 867 0.101202 418 761 0.071203 416 873 0.101204 386 607 0.061205 329 409 0.031206 390 723 0.061207 310 357 0.041208 316 372 0.021209 275 205 0.021210 297 276 0.021211 268 216 0.031212 313 326 0.021213 296 264 0.041214 438 806 0.09
06-06-13 957 425 762 0.10 0.09 0.08 0.10959 447 1,010 0.071000 535 1,258 0.041001 450 1,069 0.231002 390 704 0.111003 387 584 0.081004 403 638 0.121006 350 398 0.041007 489 1,340 0.161008 389 565 0.081009 449 887 0.101010 435 783 0.071011 369 552 0.061012 474 1,155 0.191013 415 710 0.08
Table 2. Individual fish size, weight, and mercury concentration data, and statistical summaries for Duck Valley Indian Reservation reservoirs and hatchery background samples from the Black Canyon Trout Farm, southwestern Idaho and northern Nevada, 2007, 2009, and 2013.—Continued
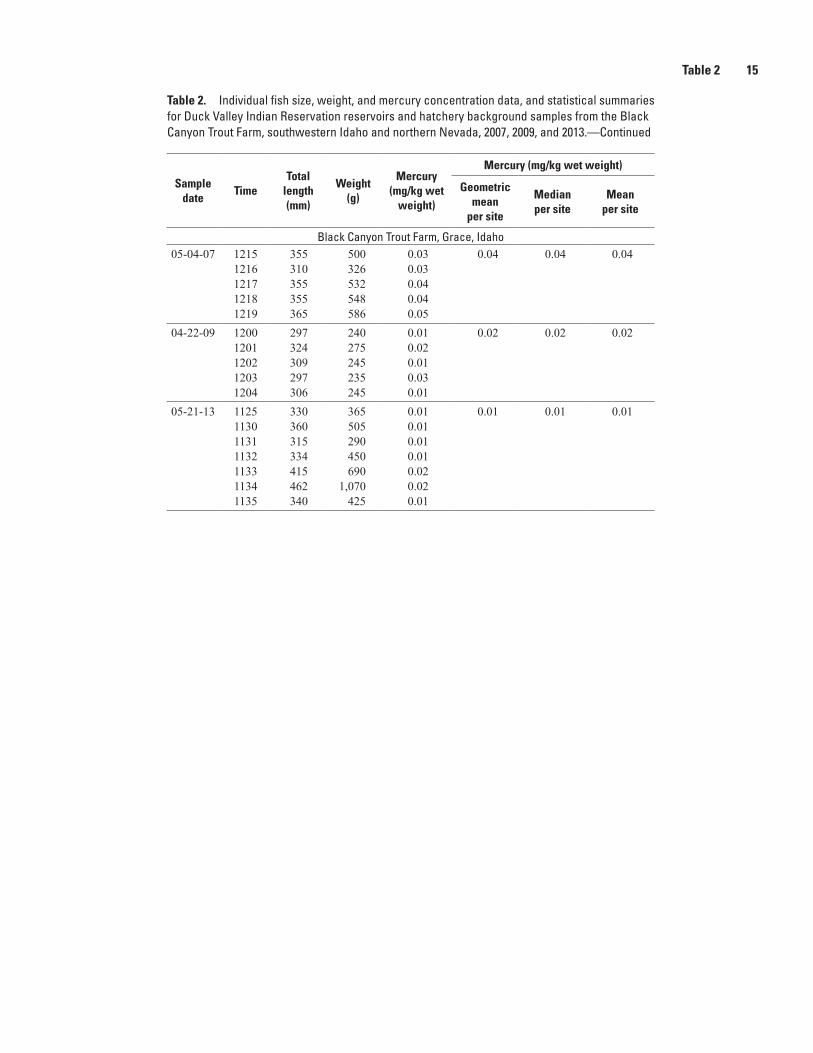
Table 2 15
Table 2. Individual fish size, weight, and mercury concentration data, and statistical summaries for Duck Valley Indian Reservation reservoirs and hatchery background samples from the Black Canyon Trout Farm, southwestern Idaho and northern Nevada, 2007, 2009, and 2013.—Continued
Sample date
TimeTotal
length (mm)
Weight (g)
Mercury (mg/kg wet
weight)
Mercury (mg/kg wet weight)
Geometric mean
per site
Median per site
Mean per site
Black Canyon Trout Farm, Grace, Idaho05-04-07 1215 355 500 0.03 0.04 0.04 0.04
1216 310 326 0.031217 355 532 0.041218 355 548 0.041219 365 586 0.05
04-22-09 1200 297 240 0.01 0.02 0.02 0.021201 324 275 0.021202 309 245 0.011203 297 235 0.031204 306 245 0.01
05-21-13 1125 330 365 0.01 0.01 0.01 0.011130 360 505 0.011131 315 290 0.011132 334 450 0.011133 415 690 0.021134 462 1,070 0.021135 340 425 0.01

16 Mercury in Rainbow Trout, Duck Valley Indian Reservation Reservoirs, Southwest Idaho and Northern Nevada, 2007, 2009, and 2013
Certified — 2007
Laboratory identification
Date of analysis
Mercury, ng/g dry weight
Certified reference
material recovery (percent)
IAEA 407 08-10-07 226 102222 100231 104
IAEA 407 08-13-07 226 102239 108244 110232 105236 106256 115
IAEA 407 08-14-07 232 105238 107270 122237 107238 107250 113
IAEA 407 08-15-07 239 107247 111254 114
IAEA 407 08-16-07 243 110244 110232 105242 109
Laboratory triplicate — 2007
Laboratory identification
Date of analysis
Mercury, ng/g dry weight
Triplicate relative standard
deviation (percent)
MSC603D 08-13-07 148 0.474148147
MSC617D 08-13-07 117 1.11115115
MSC631D 08-14-07 510 1.48496507
MSC645D 08-14-07 286 0.698290287
MSC659D 08-15-07 133 1.18133130
Certified — 2007
Laboratory identification
Date of analysis
Mercury, ng/g dry weight
Certified reference
material recovery (percent)
DORM-2 08-10-07 4,440 95.74,480 96.54,480 96.6
DORM-2 08-13-07 4,240 91.44,480 96.64,600 99.14,690 101.04,400 94.84,660 100.0
DORM-2 08-14-07 4,310 92.94,490 96.84,510 97.34,750 102.04,680 101.04,520 97.4
DORM-2 08-15-07 4,430 95.64,380 94.34,500 97.0
DORM-2 08-16-07 4,480 96.64,560 98.44,460 96.14,620 99.6
Table 3. Quality-control results for analysis of total mercury in fish from Duck Valley Indian Reservation reservoirs and hatchery background samples from the Black Canyon Trout Farm, southwestern Idaho and northern Nevada, 2007, 2009, and 2013.
[Certified reference material from the International Atomic Energy Agency (IAEA), laboratory identification number beginning with International Atomic Energy Agency (2003); a description of IAEA-407 is available at http://www.iaea.org/nael/refmaterial/iaea407.pdf. Certified reference material from the Institute for National Measurement Standards, National Research Council of Canada, laboratory identification number beginning with DORM-2; a description of DORM-2 is available at http://www.nrc-cnrc.gc.ca/obj/doc/solutions-solutions/advisory-consultatifs/crm-mrc/dorm_2_e.pdf. Triplicate samples from a single fish at a sampling site (laboratory identification samples beginning with MSC) were analyzed separate from the original sample for laboratory method repeatability (precision) and reported as relative standard deviation (RSD), RSD = Standard deviation of the three replicate concentrations divided by the average of those replicates. Field duplicates are samples from a single specimen collected as an assessment of quality control. Results are reported as relative percent difference (RPD), where {(x1 – x2)/[x1 + x2)/2]100, and x = sample concentration. Abbreviation: ng/g, nanograms per gram]

Table 3 17
Certified – 2009
Laboratory identification
Date of analysis
Mercury, ng/g dry weight
Certified reference
material recovery (percent)
IAEA 407 09-22-09 201 90.5 222 100.0 225 101.0 219 98.8 220 99.0 224 101.0
09-25-09 222 99.9 218 98.2 220 99.0 217 97.7 219 98.8 208 93.7 220 99.2
Laboratory triplicate — 2009
Laboratory identification
Date of analysis
Mercury, ng/g dry weight
Triplicate relative standard
deviation (percent)
MSC335I 09-25-09 406 3.93433404306 2.58292306
MSC356I 09-25-09 183 3.93171183
MSC348I 09-22-09 490 4.31506534
MSC340I 09-25-09 118 1.77122121
MSC338I 09-22-09 211 2.06219212
Field duplicate — 2009
Laboratory identification
Sample date
Mercury, ng/g dry weight
Relative percent
difference
MSC316I 04-22-09 0.01 10.8 MSC315I 04-22-09 0.01MSC327I 06-02-09 0.03 5.47 MSC326I 06-02-09 0.04MSC364I 06-01-09 0.12 3.68 MSC363I 06-01-09 0.13MSC353I 06-01-09 0.08 4.9 MSC352I 06-01-09 0.09MSC342I 06-03-09 0.02 0.00439MSC341I 06-03-09 0.02
Table 3. Quality-control results for analysis of total mercury in fish from Duck Valley Indian Reservation reservoirs and hatchery background samples from the Black Canyon Trout Farm, southwestern Idaho and northern Nevada, 2007, 2009, and 2013.—Continued

18 Mercury in Rainbow Trout, Duck Valley Indian Reservation Reservoirs, Southwest Idaho and Northern Nevada, 2007, 2009, and 2013
Certified — 2013
Laboratory identification
Date of analysis
Mercury, ng/g dry weight
Certified reference
material recovery (percent)
IAEA 407 10-23-13 243 109.0 241 108.0 250 113.0 251 113.0 263 118.0
10-24-13 229 103.0 231 104.0 248 111.0 230 104.0 233 105.0 240 108.0
10-25-13 224 101.0 228 103.0 227 102.0 238 107.0 233 105.0
10-29-13 212 95.5 226 102.0 216 97.4 233 105.0
10-31-13 204 91.8 198 89.0 199 89.5 188 84.8
Laboratory triplicate — 2013
Laboratory identification
Date of analysis
Mercury, ng/g dry weight
Triplicate relative standard
deviation (percent)
MSC829S 10-23-13 307.0 0.529 304.0 305.0
MSC889S 10-23-13 530.0 3.49 561.0 565.0
MSC837S 10-24-13 752.0 0.416 748.0 754.0
MSC862S 10-24-13 171.0 0.932 169.0 172.0
MSC881S 10-24-13 377.0 1.27 383.0 387.0
MSC890S 10-25-13 495.0 3.89 535.0 520.0
MSC894S 10-25-13 266.0 0.53 265.0 268.0
MSC870S 10-29-13 814.0 1.71 820.0 841.0
MSC850S 10-31-13 56.7 3.96 54.1 52.5
Field duplicate — 2013
Laboratory identification
Sample date
Mercury, ng/g dry weight
Relative percent
difference
MSC849S 06-04-13 0.10 2.9 MSC848S 06-04-13 0.11MSC861S 06-04-13 0.05 14.7 MSC844S 06-04-13 0.06MSC336U 06-05-13 0.07 4.72 MSC337U 06-05-13 0.06MSC834S 06-05-13 0.05 6.48 MSC828S 06-05-13 0.05MSC835S 06-05-13 0.09 4.1 MSC838S 06-05-13 0.08MSC888S 06-06-13 0.10 1.97 MSC889S 06-06-13 0.10MSC882S 06-06-13 0.12 0.796 MSC883S 06-06-13 0.11MSC881S 06-06-13 0.08 7.49 MSC893S 06-06-13 0.09
Table 3. Quality-control results for analysis of total mercury in fish from Duck Valley Indian Reservation reservoirs and hatchery background samples from the Black Canyon Trout Farm, southwestern Idaho and northern Nevada, 2007, 2009, and 2013.—Continued

Publishing support provided by the U.S. Geological Survey Science Publishing Network, Tacoma Publishing Service Center
For more information concerning the research in this report, contact the Director, Idaho Water Science Center U.S. Geological Survey 230 Collins Road Boise, Idaho 83702 http://id.water.usgs.gov

William
s and others—M
ercury in Rainbow Trout, D
uck Valley Indian Reservation Reservoirs, Southwest Idaho and N
orthern Nevada, 2007, 2009, and 2013—
Scientific Investigations Report 2015–5079
ISSN 2328-0328 (online)http://dx.doi.org/10.3133/sir20155079