evaluation of mixing zone and npdes permit renewal ... · evaluation of mixing zone and npdes...
TRANSCRIPT
Prince William Sound Regional Citizens Advisory Council
Evaluation of Mixing Zone and NPDES Permit Renewal Applications for BWTF
at Alyeska Marine Terminal
PWS RCAC Contract No. 551.02.1
James R. Payne William B. Driskell
Mace G. Barron Dennis C. Lees
Joseph A. Kalmar
April 24, 2002 Final Report
i
Principal Consultants James R. Payne, Ph.D.
Payne Environmental Consultants, Inc. 317 North El Camino Real, Suite 201
Encinitas, CA 92024 760-942-1015
William B. Driskell 6536 20th Avenue NE
Seattle, WA 206-522-5930
Mace G. Barron, Ph.D. P.E.A.K. Research 1134 Avon Lane
Longmont, CO 80501 303-684-9646
Dennis C. Lees Littoral Ecological & Environmental Services
1075 Urania Ave. Leucadia, CA 92024
706-635-7998 [email protected]
Joe Kalmar
Landau Associates, Inc. 130 2nd Ave. S.
Edmonds, WA 98020 425-778-0907
Project Manager Tom Kuckertz, Ph.D.
Prince William Sound Regional Citizens' Advisory Council 339 Hazelet
P.O. Box 3089 Valdez, AK 99686
907-835-5957 or 877-478-7221 [email protected]
ii
Table of Contents
Introduction.....................................................................................................................1 Method Shortcomings .....................................................................................................2 Documented Direct Effects..............................................................................................9 Far Field Effects..............................................................................................................9 Speculative Effects..........................................................................................................9 Plume Behavior.............................................................................................................11 Basin Flushing...............................................................................................................12 Plume Mapping .............................................................................................................13 Whole Effluent Toxicity Monitoring .............................................................................14 Engineering Considerations...........................................................................................17
Description of BWTF Operation.................................................................................17 Oil/Water Separation Tanks .......................................................................................19 Dissolved Air Floatation ............................................................................................20 Biological Treatment..................................................................................................22 Air Stripper System ....................................................................................................24 Additional Technologies to be Considered..................................................................24
Proposed Modifications to the NPDES Permit ...............................................................25 References.....................................................................................................................29
List of Tables
Table 1. List of Analytes, Chemical Abbreviations and Laboratory Datasets ..................5 Table 2. Summary of quarterly toxicity test results for samples of Ballast Water
Treatment Facility effluent: February 2000 to April 2001................................15 Table 3. Comparison of petroleum industry DAF unit performance with Alyeska BWTF
DAF unit.........................................................................................................21
List of Figures
Figure 1. Schematic overview of integrated components comprising the Alyeska Environmental Monitoring Program (AEMP) in place in 1996. (from EPA BWTF NPDES Fact Sheet, 1996). ...................................................................1
Figure 2. Measured concentrations of parent and alkyl-substituted PAH and individual n-alkane components in Ballast Water Treatment Facility (BWTF) effluent samples analyzed as part of the recently completed PWS RCAC 2001 Port Valdez Monitoring Program (from Salazar et al. 2002). ...................................4
Figure 3. Histogram plots of PAH concentrations from Station D51 measured by Alyeska (FID GC) and RCAC (SIM GC/MS) protocols (samples IDs starting with AMT). .....................................................................................................7
iii
Figure 4. Physical oceanographic data showing seasonal water-column stratification in Port Valdez (after Muench and Nebert 1973). ................................................11
Figure 5. Bathymetry of Port Valdez. Note sill and Middle Rock pinnacle in the Narrows (from Colonell 1980).......................................................................13
Figure 6. Turner Fluorometer response from 2 minute interval continuous recordings during BTT monitoring trials from 6/14/00 through 7/14/00. ........................16
Figure 7. Expanded fluorometer response for the spiking episode noted on 6/20/00......16 Figure 8. Process flow diagram for Alyeska Ballast Water Treatment Facility – Valdez,
Alaska. ..........................................................................................................18
Abbreviations Used in Report
ADEC – Alaska Department of Environmental Conservation AEMP – Alyeska Environmental Monitoring Program AHC – aliphatic hydrocarbons AMT – Alyeska Marine Terminal BOD – biological oxygen demand BTEX – benzene, toluene, ethyl-benzene, and xylene(s) BWTF – Ballast Water Treatment Facility DAF – dissolved air filtration DMR – discharge monitoring report FID GC – flame ionization detector gas chromatography GC/MS – gas chromatography/mass spectrometry GOC – Gold Creek sampling site IC25 – inhibitory concentration, 25% Kow – octanol/water partition coefficient LTEMP – Long Term Environmental Monitoring Program MDL – method detection limit MGD – millions of gallons/day NMFS – National Marine Fisheries Service NOAA – National Oceanographic and Atmospheric Administration NOEC – no observable effect concentration NPDES – National Pollutant Discharge Elimination System PAH – polynuclear aromatic hydrocarbons RCAC – Regional Citizen’s Advisory Council S/T – steranes/triterpanes SIM – selected ion monitoring TAqH – total aqueous hydrocarbons TOC – total organic carbon TON – total organic nitrogen TPAH – total PAH TSS – total suspended solids TUc – chronic toxicity unit UCM – unresolved complex mixture UV - ultraviolet
1
Evaluation of Mixing Zone and NPDES Permit Renewal Applications for BWTF at Alyeska Marine Terminal
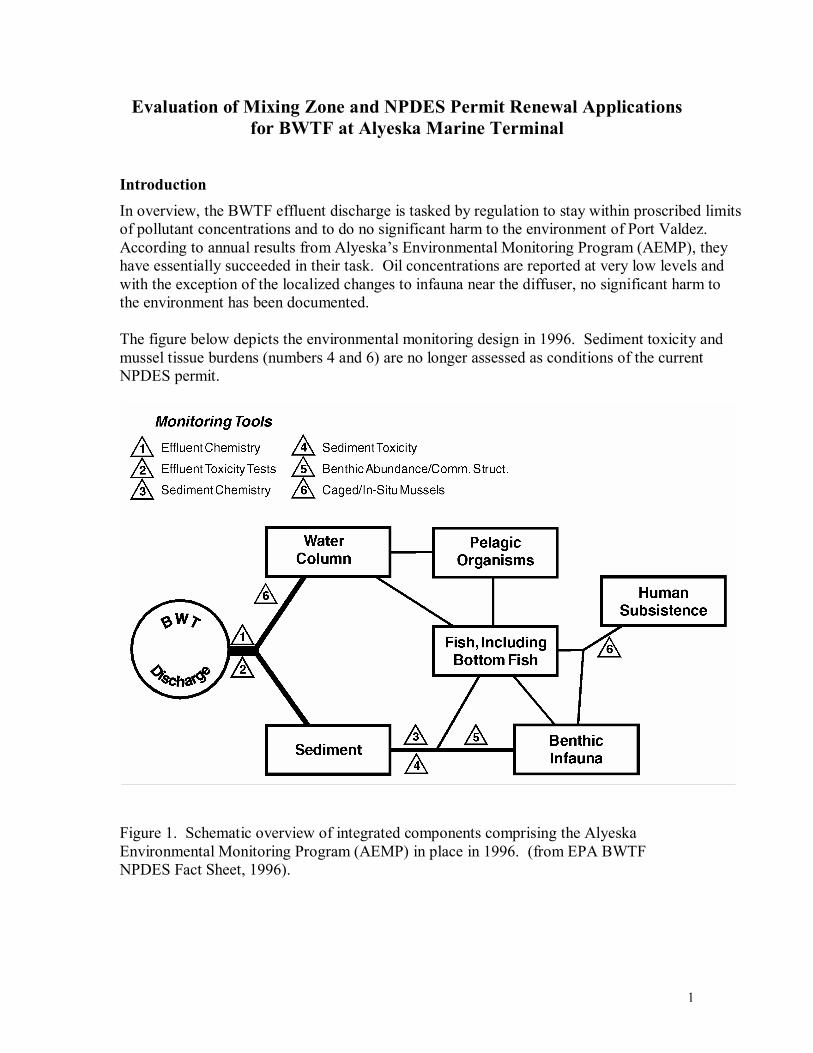
Introduction In overview, the BWTF effluent discharge is tasked by regulation to stay within proscribed limits of pollutant concentrations and to do no significant harm to the environment of Port Valdez. According to annual results from Alyeska’s Environmental Monitoring Program (AEMP), they have essentially succeeded in their task. Oil concentrations are reported at very low levels and with the exception of the localized changes to infauna near the diffuser, no significant harm to the environment has been documented. The figure below depicts the environmental monitoring design in 1996. Sediment toxicity and mussel tissue burdens (numbers 4 and 6) are no longer assessed as conditions of the current NPDES permit.
Figure 1. Schematic overview of integrated components comprising the Alyeska Environmental Monitoring Program (AEMP) in place in 1996. (from EPA BWTF NPDES Fact Sheet, 1996).
2
Since 1977, various environmental parameters, including physical, chemical, and biological concerns, have been the focus of the AEMP. Many were examined for a few years and then appropriately dropped when they seemed to imply no harm to the environment nor exceedances of limits. In hindsight, some of those decisions may have been made with inadequate information. Method Shortcomings In the early 1980s, scientists involved in oil spill research recognized that the alkyl-substituted PAH homologues predominate over the parent PAH components in Alaska North Slope crude oil (Payne et al. 1984; Payne and McNabb, Jr. 1984). As such, they have long used analytical methods based upon selected ion monitoring (SIM) gas chromatography/mass spectrometry (GC/MS) protocols that allow quantification of these important constituents. Sauer and Boehm (1991) contrasted a number of these procedures with EPA promulgated analytical methods (including Methods 625 and 8270 for GC/MS analyses of semivolatile priority pollutant organics) and concluded that the data generated by the EPA methods lacked the chemical specificity to assess environmental damage from oil spills and chronic inputs of petroleum hydrocarbons to the marine environment. Short et al. (1996) documented the more sensitive methods used by NOAA/NMFS for analysis of hydrocarbons in crude oil, tissues, sediments, and seawater collected for National Resource Damage Assessment efforts following the Exxon Valdez oil spill. Those methods (or slight modifications thereof) have been used by NOAA/Trustee and Potential Responsible Party (PRP) scientists for documenting petroleum hydrocarbon impacts from chronic discharges and major oil spill events ever since. The Prince William Sound Regional Citizens Advisory Council (PWS RCAC) has utilized these methods exclusively in the Long Term Environmental Monitoring Program (LTEMP) throughout Prince William Sound and within Port Valdez since 1993 (for a review and synthesis through 1997, see Payne et al. 1998). Similar methods are also utilized by the Cook Inlet RCAC for all of their Environmental Monitoring Programs. In contrast, the methods used by Shaw and Feder for the AEMP analyses are based on flame ionization detector gas chromatography (FID GC) protocols from the mid 1980s. They only report data on parent (priority pollutant) PAH components identified by matching retention times in very complex chromatographic profiles compared to external standard instrument calibrations. As a consequence of this analytical approach, we believe that there is considerable uncertainty in the identification and quantification of the PAH components that are used in the AEMP studies to document petroleum hydrocarbon contamination. Specifically, many PAH components can be missed because they may be at or just below the FID GC method detection limit (MDL)1, they are buried amongst numerous other peaks just barely rising above the unresolved complex mixture (UCM) characteristic of many of the chromatograms, or they may be misidentified and underrepresented due to subtle matrix-
1 FID GC MDLs are often a factor of 100-1000 times higher (less sensitive) than those obtained with SIM GC/MS.
3
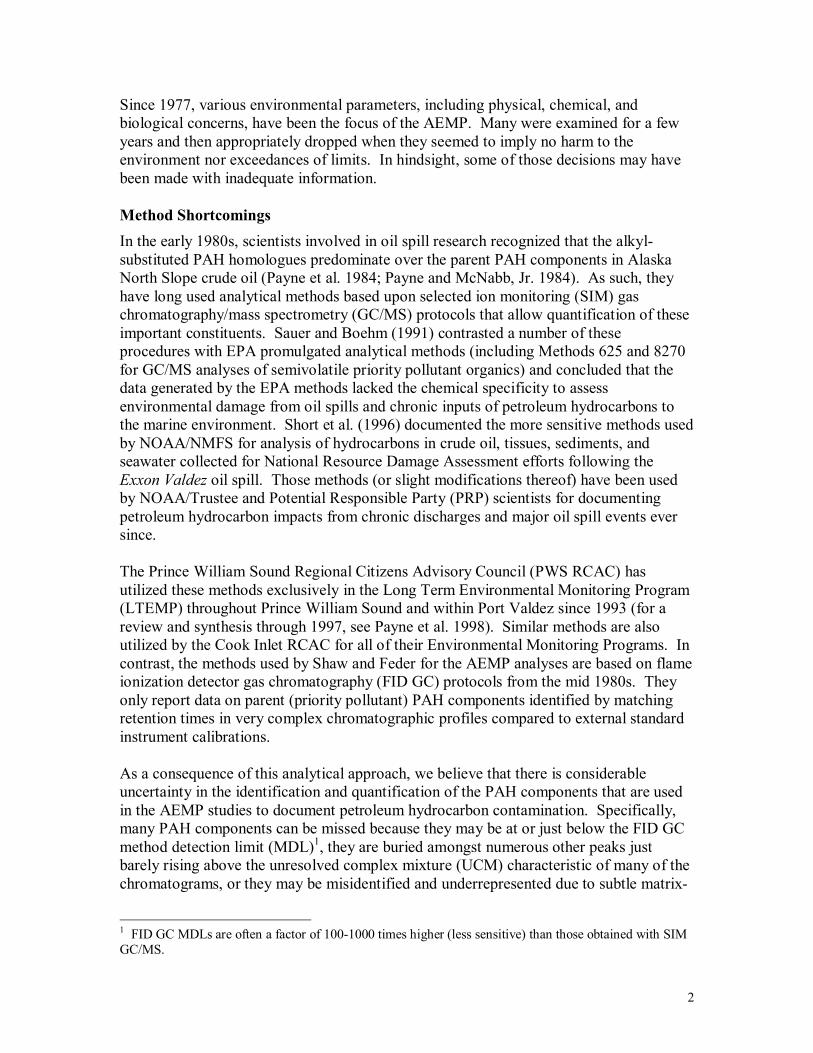
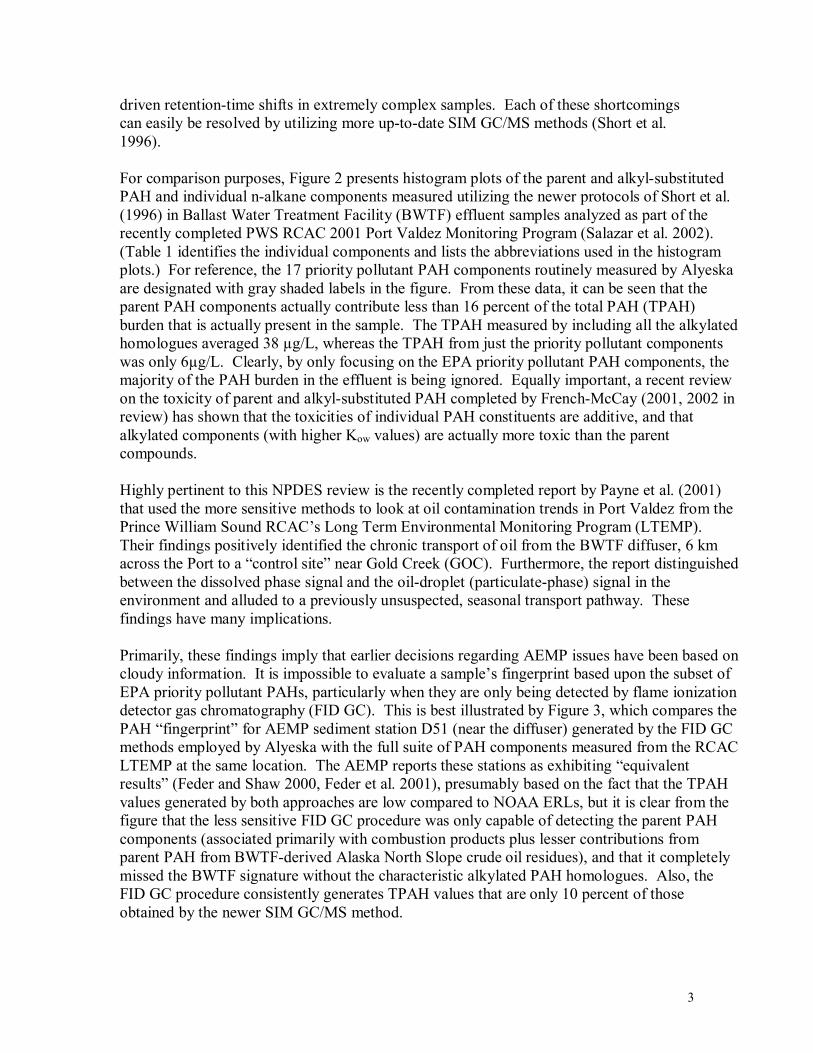
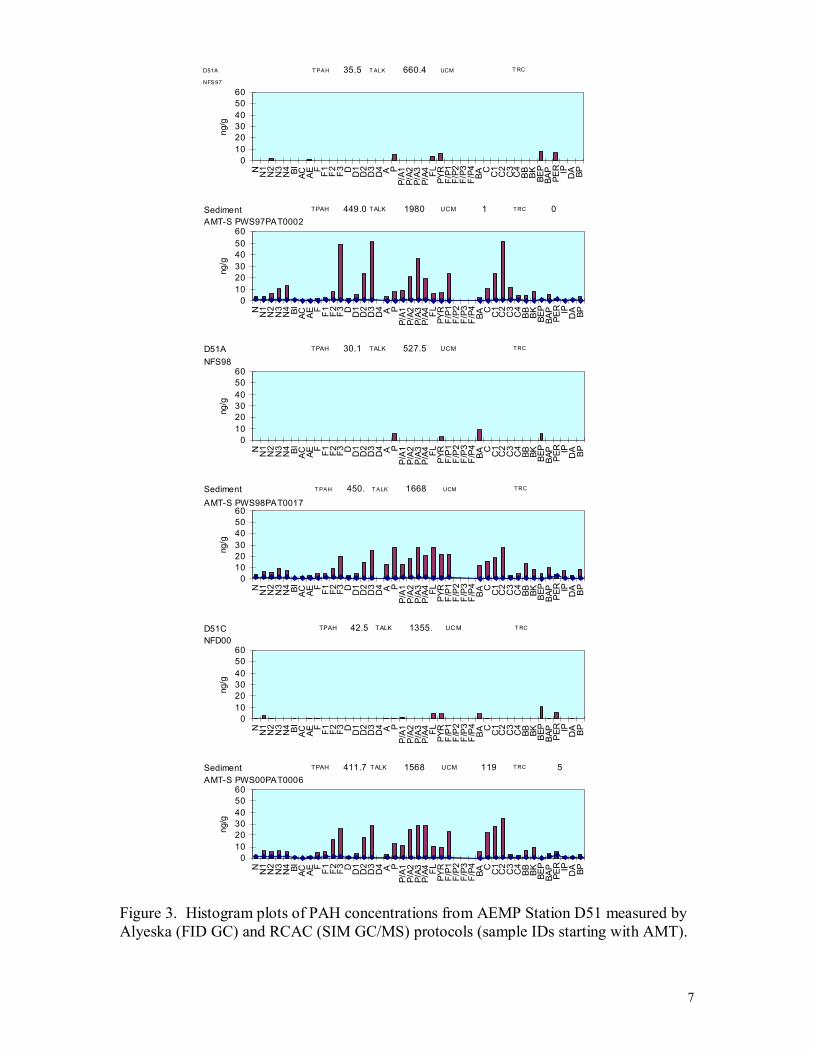
driven retention-time shifts in extremely complex samples. Each of these shortcomings can easily be resolved by utilizing more up-to-date SIM GC/MS methods (Short et al. 1996). For comparison purposes, Figure 2 presents histogram plots of the parent and alkyl-substituted PAH and individual n-alkane components measured utilizing the newer protocols of Short et al. (1996) in Ballast Water Treatment Facility (BWTF) effluent samples analyzed as part of the recently completed PWS RCAC 2001 Port Valdez Monitoring Program (Salazar et al. 2002). (Table 1 identifies the individual components and lists the abbreviations used in the histogram plots.) For reference, the 17 priority pollutant PAH components routinely measured by Alyeska are designated with gray shaded labels in the figure. From these data, it can be seen that the parent PAH components actually contribute less than 16 percent of the total PAH (TPAH) burden that is actually present in the sample. The TPAH measured by including all the alkylated homologues averaged 38 µg/L, whereas the TPAH from just the priority pollutant components was only 6µg/L. Clearly, by only focusing on the EPA priority pollutant PAH components, the majority of the PAH burden in the effluent is being ignored. Equally important, a recent review on the toxicity of parent and alkyl-substituted PAH completed by French-McCay (2001, 2002 in review) has shown that the toxicities of individual PAH constituents are additive, and that alkylated components (with higher Kow values) are actually more toxic than the parent compounds. Highly pertinent to this NPDES review is the recently completed report by Payne et al. (2001) that used the more sensitive methods to look at oil contamination trends in Port Valdez from the Prince William Sound RCAC’s Long Term Environmental Monitoring Program (LTEMP). Their findings positively identified the chronic transport of oil from the BWTF diffuser, 6 km across the Port to a “control site” near Gold Creek (GOC). Furthermore, the report distinguished between the dissolved phase signal and the oil-droplet (particulate-phase) signal in the environment and alluded to a previously unsuspected, seasonal transport pathway. These findings have many implications. Primarily, these findings imply that earlier decisions regarding AEMP issues have been based on cloudy information. It is impossible to evaluate a sample’s fingerprint based upon the subset of EPA priority pollutant PAHs, particularly when they are only being detected by flame ionization detector gas chromatography (FID GC). This is best illustrated by Figure 3, which compares the PAH “fingerprint” for AEMP sediment station D51 (near the diffuser) generated by the FID GC methods employed by Alyeska with the full suite of PAH components measured from the RCAC LTEMP at the same location. The AEMP reports these stations as exhibiting “equivalent results” (Feder and Shaw 2000, Feder et al. 2001), presumably based on the fact that the TPAH values generated by both approaches are low compared to NOAA ERLs, but it is clear from the figure that the less sensitive FID GC procedure was only capable of detecting the parent PAH components (associated primarily with combustion products plus lesser contributions from parent PAH from BWTF-derived Alaska North Slope crude oil residues), and that it completely missed the BWTF signature without the characteristic alkylated PAH homologues. Also, the FID GC procedure consistently generates TPAH values that are only 10 percent of those obtained by the newer SIM GC/MS method.
4
Figure 2. Measured concentrations of parent and alkyl-substituted PAH and individual n-alkane components in Ballast Water Treatment Facility (BWTF) effluent samples analyzed as part of the recently completed PWS RCAC 2001 Port Valdez Monitoring Program (from Salazar et al. 2002). The gray-boxed components are the only ones currently measured in the AEMP.
Average BWTP Water Sample
0
1000
2000
3000
4000
5000
6000
N N1
N2
N3
N4 BI
AC
AE F F1 F2 F3 D D1
D2
D3
D4 A P
P/A
1
P/A
2
P/A
3
P/A
4
FL
PYR
F/P1
F/P2
F/P3
F/P4 B
A C C1
C2
C3
C4
BB
BK
BEP BA
P
PER IP D
A
BP
Average PAH (±SE mean)
ng/L
0
200
400
600
800
1000
1200
1400
1600
1800
C10
C11
C12
C13
C14
C15
C16
C17
Pris
tane C18
Phyt
ane
C19
C20
C21
C22
C23
C24
C25
C26
C27
C28
C29
C30
C31
C32
C33
C34
n-Alkane (±SE mean)
ng/L
5
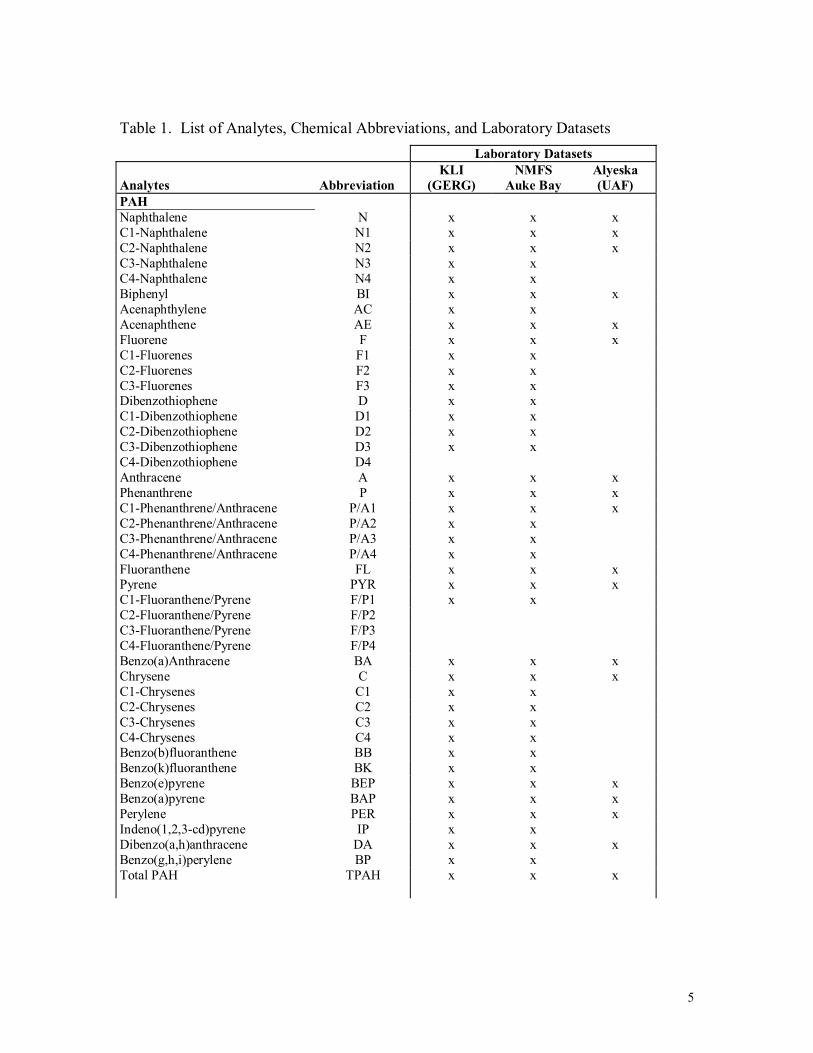
Table 1. List of Analytes, Chemical Abbreviations, and Laboratory Datasets Laboratory Datasets
Analytes Abbreviation KLI
(GERG) NMFS
Auke Bay Alyeska (UAF)
PAH Naphthalene N x x x C1-Naphthalene N1 x x x C2-Naphthalene N2 x x x C3-Naphthalene N3 x x C4-Naphthalene N4 x x Biphenyl BI x x x Acenaphthylene AC x x Acenaphthene AE x x x Fluorene F x x x C1-Fluorenes F1 x x C2-Fluorenes F2 x x C3-Fluorenes F3 x x Dibenzothiophene D x x C1-Dibenzothiophene D1 x x C2-Dibenzothiophene D2 x x C3-Dibenzothiophene D3 x x C4-Dibenzothiophene D4 Anthracene A x x x Phenanthrene P x x x C1-Phenanthrene/Anthracene P/A1 x x x C2-Phenanthrene/Anthracene P/A2 x x C3-Phenanthrene/Anthracene P/A3 x x C4-Phenanthrene/Anthracene P/A4 x x Fluoranthene FL x x x Pyrene PYR x x x C1-Fluoranthene/Pyrene F/P1 x x C2-Fluoranthene/Pyrene F/P2 C3-Fluoranthene/Pyrene F/P3 C4-Fluoranthene/Pyrene F/P4 Benzo(a)Anthracene BA x x x Chrysene C x x x C1-Chrysenes C1 x x C2-Chrysenes C2 x x C3-Chrysenes C3 x x C4-Chrysenes C4 x x Benzo(b)fluoranthene BB x x Benzo(k)fluoranthene BK x x Benzo(e)pyrene BEP x x x Benzo(a)pyrene BAP x x x Perylene PER x x x Indeno(1,2,3-cd)pyrene IP x x Dibenzo(a,h)anthracene DA x x x Benzo(g,h,i)perylene BP x x Total PAH TPAH x x x
6
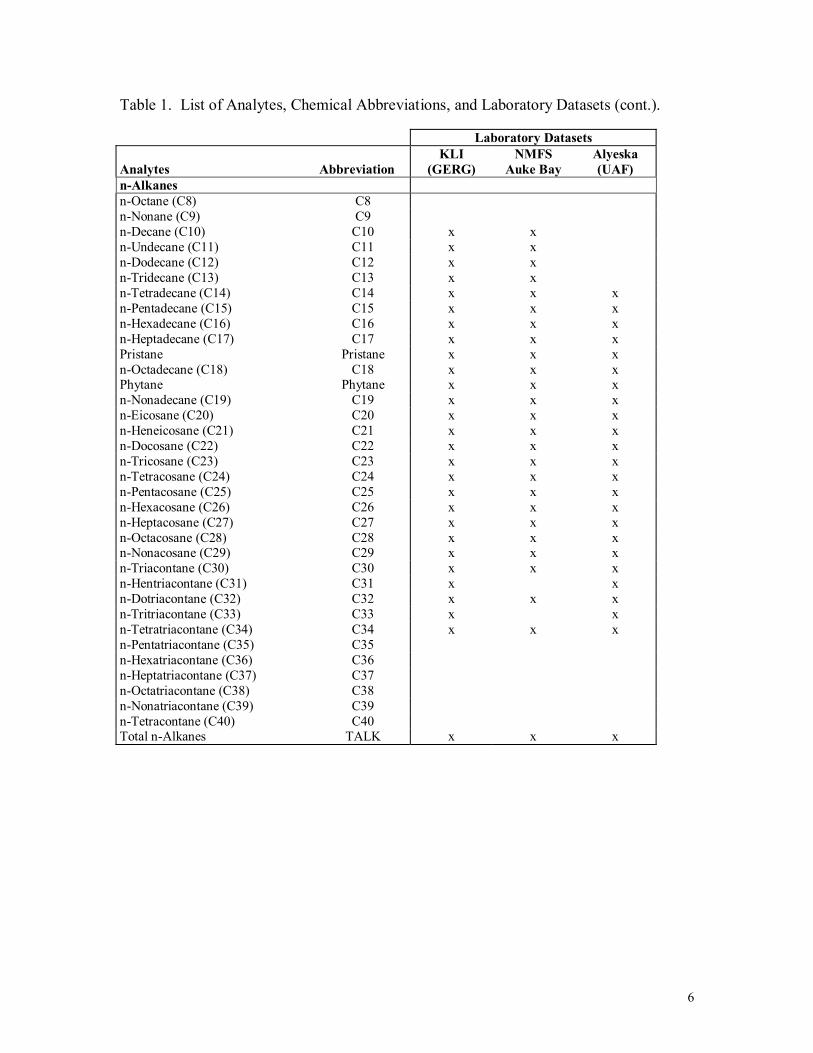
Table 1. List of Analytes, Chemical Abbreviations, and Laboratory Datasets (cont.). Laboratory Datasets
Analytes Abbreviation KLI
(GERG) NMFS
Auke Bay Alyeska (UAF)
n-Alkanes n-Octane (C8) C8 n-Nonane (C9) C9 n-Decane (C10) C10 x x n-Undecane (C11) C11 x x n-Dodecane (C12) C12 x x n-Tridecane (C13) C13 x x n-Tetradecane (C14) C14 x x x n-Pentadecane (C15) C15 x x x n-Hexadecane (C16) C16 x x x n-Heptadecane (C17) C17 x x x Pristane Pristane x x x n-Octadecane (C18) C18 x x x Phytane Phytane x x x n-Nonadecane (C19) C19 x x x n-Eicosane (C20) C20 x x x n-Heneicosane (C21) C21 x x x n-Docosane (C22) C22 x x x n-Tricosane (C23) C23 x x x n-Tetracosane (C24) C24 x x x n-Pentacosane (C25) C25 x x x n-Hexacosane (C26) C26 x x x n-Heptacosane (C27) C27 x x x n-Octacosane (C28) C28 x x x n-Nonacosane (C29) C29 x x x n-Triacontane (C30) C30 x x x n-Hentriacontane (C31) C31 x x n-Dotriacontane (C32) C32 x x x n-Tritriacontane (C33) C33 x x n-Tetratriacontane (C34) C34 x x x n-Pentatriacontane (C35) C35 n-Hexatriacontane (C36) C36 n-Heptatriacontane (C37) C37 n-Octatriacontane (C38) C38 n-Nonatriacontane (C39) C39 n-Tetracontane (C40) C40 Total n-Alkanes TALK x x x
7
Figure 3. Histogram plots of PAH concentrations from AEMP Station D51 measured by Alyeska (FID GC) and RCAC (SIM GC/MS) protocols (sample IDs starting with AMT).
0102030405060
N N1
N2
N3
N4 BI AC AEF F1 F2 F3 D D1
D2
D3
D4 A P
P/A1
P/A2
P/A3
P/A4 FL
PYR
F/P1
F/P2
F/P3
F/P4 BAC C1
C2
C3
C4
BB BK BEP
BAP
PER IP DA BP
ng/g
NFS97
T PAH T ALK UCM35.5 660.4D51A T RC
0102030405060
N N1
N2
N3
N4 BI AC AEF F1 F2 F3 D D1
D2
D3
D4 A P
P/A1
P/A2
P/A3
P/A4 FL
PYR
F/P1
F/P2
F/P3
F/P4 BAC C1
C2
C3
C4
BB BK BEP
BAP
PER IP DA BP
ng/g
AMT-S PWS97PAT0002TPAH TALK UCM449.0 1980 1Sediment TRC 0
0102030405060
N N1
N2
N3
N4 BI AC AEF F1 F2 F3 D D1
D2
D3
D4 A P
P/A1
P/A2
P/A3
P/A4 FL
PYR
F/P1
F/P2
F/P3
F/P4 BAC C1
C2
C3
C4
BB BK BEP
BAP
PER IP DA BP
ng/g
NFS98TPAH TALK UCM30.1 527.5D51A TRC
0102030405060
N N1
N2
N3
N4 BI AC AEF F1 F2 F3 D D1
D2
D3
D4 A P
P/A1
P/A2
P/A3
P/A4 FL
PYR
F/P1
F/P2
F/P3
F/P4 BAC C1
C2
C3
C4
BB BK BEP
BAP
PER IP DA BP
ng/g
AMT-S PWS98PAT0017
T PAH T ALK UCM450. 1668Sediment TRC
0102030405060
N N1
N2
N3
N4 BI AC AEF F1 F2 F3 D D1
D2
D3
D4 A P
P/A1
P/A2
P/A3
P/A4 FL
PYR
F/P1
F/P2
F/P3
F/P4 BAC C1
C2
C3
C4
BB BK BEP
BAP
PER IP DA BP
ng/g
NFD00TPAH TALK UCM42.5 1355.D51C T RC
0102030405060
N N1
N2
N3
N4 BI AC AEF F1 F2 F3 D D1
D2
D3
D4 A P
P/A1
P/A2
P/A3
P/A4 FL
PYR
F/P1
F/P2
F/P3
F/P4 BAC C1
C2
C3
C4
BB BK BEP
BAP
PER IP DA BP
ng/g
AMT-S PWS00PAT0006TPAH TALK UCM411.7 1568 119Sediment TRC 5
8
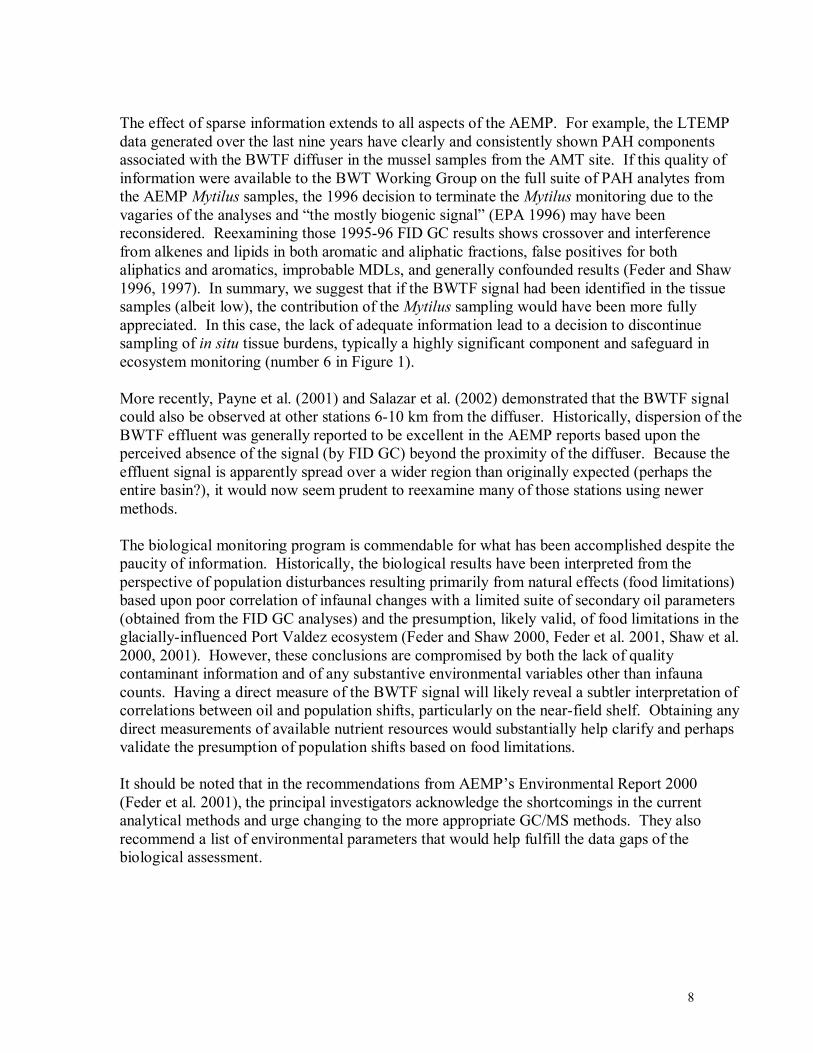
The effect of sparse information extends to all aspects of the AEMP. For example, the LTEMP data generated over the last nine years have clearly and consistently shown PAH components associated with the BWTF diffuser in the mussel samples from the AMT site. If this quality of information were available to the BWT Working Group on the full suite of PAH analytes from the AEMP Mytilus samples, the 1996 decision to terminate the Mytilus monitoring due to the vagaries of the analyses and “the mostly biogenic signal” (EPA 1996) may have been reconsidered. Reexamining those 1995-96 FID GC results shows crossover and interference from alkenes and lipids in both aromatic and aliphatic fractions, false positives for both aliphatics and aromatics, improbable MDLs, and generally confounded results (Feder and Shaw 1996, 1997). In summary, we suggest that if the BWTF signal had been identified in the tissue samples (albeit low), the contribution of the Mytilus sampling would have been more fully appreciated. In this case, the lack of adequate information lead to a decision to discontinue sampling of in situ tissue burdens, typically a highly significant component and safeguard in ecosystem monitoring (number 6 in Figure 1). More recently, Payne et al. (2001) and Salazar et al. (2002) demonstrated that the BWTF signal could also be observed at other stations 6-10 km from the diffuser. Historically, dispersion of the BWTF effluent was generally reported to be excellent in the AEMP reports based upon the perceived absence of the signal (by FID GC) beyond the proximity of the diffuser. Because the effluent signal is apparently spread over a wider region than originally expected (perhaps the entire basin?), it would now seem prudent to reexamine many of those stations using newer methods. The biological monitoring program is commendable for what has been accomplished despite the paucity of information. Historically, the biological results have been interpreted from the perspective of population disturbances resulting primarily from natural effects (food limitations) based upon poor correlation of infaunal changes with a limited suite of secondary oil parameters (obtained from the FID GC analyses) and the presumption, likely valid, of food limitations in the glacially-influenced Port Valdez ecosystem (Feder and Shaw 2000, Feder et al. 2001, Shaw et al. 2000, 2001). However, these conclusions are compromised by both the lack of quality contaminant information and of any substantive environmental variables other than infauna counts. Having a direct measure of the BWTF signal will likely reveal a subtler interpretation of correlations between oil and population shifts, particularly on the near-field shelf. Obtaining any direct measurements of available nutrient resources would substantially help clarify and perhaps validate the presumption of population shifts based on food limitations. It should be noted that in the recommendations from AEMP’s Environmental Report 2000 (Feder et al. 2001), the principal investigators acknowledge the shortcomings in the current analytical methods and urge changing to the more appropriate GC/MS methods. They also recommend a list of environmental parameters that would help fulfill the data gaps of the biological assessment.
9
Documented Direct Effects Despite the ambiguous chemistry data, a pattern of effects in the near field has been documented. In an early study looking at phenanthrene metabolites in flat fish at two sites within the Port, effects were found only near the diffuser (EPA 1996). In 1995, the AEMP noted a discharge event (chronic or acute?- related to activation of the BWTF air stripper system) that resulted in a spike of sediment contamination at station D25, just north of the diffuser on the 50 fathom isobath. This anomaly prompted an intensive supplemental sampling program in 1997, which identified a gradient of contamination and biological disturbance in proximity to the diffuser. The intensive sampling found oil drops, sheens, and elevated oil levels in the sediments around the diffuser. In succeeding years, both the FID GC-based sediment contaminant loads and biological effects have been characterized as diminishing, although in 2000, sheens were still noted from some of the biological grabs near the diffuser. In 1994, a small spill from the TV Eastern Lion was easily detected at the LTEMP control site, GOC, located across the Port and 6 km away. The event demonstrated that transport via surface-driven processes does occur across the fjord. This transport process is also confirmed at the same location during routine monitoring by differentiating the chronic low-level BWTF oil signal from the background signal (Payne et al. 2001). From the LTEMP samples, it is obvious that the seasonally surfacing plume from the BWTF (discussed below) brings oil droplets to the surface that are ingested by intertidal mussels. When the effluent plume is trapped in a stratified water column, only the dissolved-phase PAH signal is detected in the mussels at the control site; the dispersed oil droplets are trapped beneath the surface layer. Although the LTEMP program only samples from two locations with the Port, it is probable that the BWTF effluent signal is present throughout the Port Valdez basin. Far Field Effects Far field effects seem unlikely with the recorded low level of oil contaminants (from any source within the Port). However, with the findings discussed above, it would again seem prudent to check the tissue loads of selected species using improved chemistry methods. One highly appropriate species would be the intertidal clam, Macoma balthica, a common food item for many birds, fishes, and macro-invertebrates. Speculative Effects Feder and Blanchard (Feder et al. 2001) report that the infauna populations are structured primarily by depth. Further, the deep basin infauna fall into populations characterized as east- or west-basin types with shifting transitional species in the middle. On the shallow shelf, the infauna are reported to seem quite dynamic and variable. In fact, this is an incredibly stable data set given that depths range from about 10 fathoms to over 130 fathoms. Several of the species that dominate in terms of biomass and abundance are found at both the deep and shallower stations. This degree of stability would occur in very few locations. Many of the dominant species are long-lived (life-spans of several years), and the fact that they are ranked in the top 10 by either abundance or biomass at different depths is striking for an infaunal data set. The types
10
of changes detected and described in these reports are, in actuality, relatively subtle compared to the kinds of changes that are observed around wastewater outfalls or other substantial sources of organic enrichment or chemical contaminants. Feder implies that the shifts are most likely the result of nutrient availability in a food-limited habitat. This explanation has some credence, but there is no direct supporting evidence—there are no environmental measurements of available food or of shifts in the physical habitat; only total organic carbon (TOC) and total organic nitrogen (TON). An alternative perspective whereby disturbance correlates to some degree with sediment chemistry (previously discarded from lack of supporting FID GC chemistry results) might be better tested with improved chemistry data. Because the effluent plume is said to predominantly disperse along the shallow shelf isobath at the location of the diffuser (Colonell, 1980), it seems highly probable that some of the population variance in the near field shallow (NFS) stations may correlate with the effluent signal. Efforts to identify potential responses of the assemblages to carbon availability and possible hydrocarbon contamination on the basis of the trophic structure may need some revisions. Further research into the feeding type of some of the dominant species may show that their mode of feeding differs from the reported mode. A large proportion of the interpretation for changes in infaunal abundance at the sampling sites and the potential effects of the BWTF discharge seems to be based on the response of these organisms to available carbon and assumptions of feeding behavior. In the case of Axinopsida/Adontorhina in particular, the preponderance of evidence on thyasirids and Lucinacea in general seems to indicate that these clams depend on the contributions of symbiotic chemoautotrophic bacteria for nutrition (Fisher 1990; Slack-Smith 1994; Hickman 1994; Distel 1998) and are not morphologically “equipped” to perform as a suspension feeder. They have reduced gut and labial palps, no incurrent siphon, and enlarged fleshy gills. Kuznetsov and Gebruk (1991) reported evidence of chemosymbiosis in another species of Axinopsida. The presumption of suspension feeding for these species, which is a crucial component of the arguments relating population shifts to changes in available food resources, needs to be tested. The errant polychaete worm Nephtys punctata, another dominant at many stations, is considered to be a predator. Again, this feeding type needs to be confirmed by observation of the gut contents of different sized specimens. In studies of the infauna in Port Valdez, Lees et al. (1979) concluded that this worm was an important subsurface deposit feeder whose feeding activities caused substantial sediment mixing (mounding) on the upper slopes of the fjord. If the conclusion was incorrect, another large but relatively common subsurface deposit feeder remains unidentified in these sediments. At this point, it is unclear what the implications of these differences in trophic structure would mean. The observed presence of a common, large subsurface deposit feeder easily explains suggestions in the reports of mixing organics into the sediment. If the thyasirid clams are shown to be chemosymbiotrophs, they would likely no longer be considered competitors with the surface deposit feeders and the suspension-feeding guild would become considerably less important.

11
Elevated concentrations of dissolved and suspended hydrocarbons fron the BWTF could have at least two potential effects on the energy budgets in the Port. First, the hydrocarbons constitute a source of carbon for microbial populations (bacteria and fungi), thus increasing microbial biomass. This can be beneficial to suspension feeders in the water column and on the sea floor. Another consequence is that, because bacteria are more efficient at scavenging inorganic nutrients from the water column than marine plants, increased microbial biomass may result in a reduction in phytoplankton primary productivity and, therefore, biomass. This could result in reduced phytoplantkon flux to the sediments in the Port.
Plume Behavior From the numerous studies of the mixing zone, the general behavior of the effluent plume is well described. Under typical conditions, the plume achieves its required dispersion within the mixing zone and transports from the area highly diluted. When the water column is stratified (late spring/summer/fall), the plume is typically trapped at depth beneath the lighter density surface layer. In Figure 4, stratification is indicated when the σT (density) plot decreases near the surface (compare August vs. December). Due to the physical dynamics of the Port (local rivers, wind patterns, silled fjord basin, tidal exchanges, storm surges, etc.), the trap depth is highly dynamic although generally occurring below 20 m. In contrast, when the stratification is lost during the months of winter and early spring, the plume is no longer trapped and can reach the surface. Dye studies confirm these observations (Woodward-Clyde Consultants 1987). While plume surfacings were reported in only 3% (= 11 days/year) of the Monte Carlo plume simulations (Woodward-Clyde Consultant 1987), data from Muench and Nebert (1973) suggest the unstratified conditions may occur anytime between December and March (Figure 4). .
Figure 4. Physical oceanographic data showing seasonal water-column stratification in Port Valdez (after Muench and Nebert 1973).
12
A surfacing plume adds credibility to the proposed surface-microlayer transport mechanism advanced by Payne et al. (2001). Depending upon the direction of prevailing winds and tides, such a layer would readily expose the intertidal biota. A similar situation occurred during the T/V Eastern Lion spill when a surface megalayer was transported to the LTEMP control site. The Woodward Clyde simulation also reported the plume to be negatively buoyant 6% of the time (= 22 days/year). For example, the DMR for December 1995 reports the average monthly discharge having a density of 27.4 σT (sigma t units) versus 24-25 σT for ambient Port seawater. Evidence of BWTF sourced PAH were observed even deeper than the diffuser at several stations within and around the perimeter of the mixing zone in the integrated mussel, water-column, and plastic-strip sampling program recently completed by Salazar et al. (2002). Although the current Mixing Zone application presents worst case modeling for negatively buoyant discharges under low current conditions with acceptable dilution outcome, there has been no expressed concern of extremely-dense discharges gravity-driven down a 19 degree slope (angle at the diffuser pipe) to deeper depths. Basin Flushing Despite years of operation, there is little knowledge beyond the near-field about where the effluent plume actually goes and some question about flushing times. Commonly quoted is the work by Colonell (1980) that describes the waters of Port Valdez flushing through the fjord on the order of a few days to weeks. In that estimate, he invokes 3 oceanographic processes: tidal flushing, seasonal deep-water exchange, and weather-related events. Tidal flushing is driven by the mean amplitude of tides in Port Valdez, about 3 meters. Thus, the tidal prism corresponds to about 1.6 percent of the total volume of water contained in Port Valdez, a value that Colonell uses to calculate “…during [non-stratified] winter conditions, the half-life of a volume of conservative pollutant is about 22 days.” Colonell also suggests that the slow intrusion of dense water from the continental shelf into the fjords of south-central Alaska serves to replace the deepest waters at least annually. Estuarine flow also occurs during summer months with outbound freshwater countered by inbound salt water, but this flow is confined to the top 15m of the water column (Muench and Nebert 1973). Colonell concludes that the individual effectiveness of these processes is difficult to determine because of their simultaneous occurrence, but earlier computations for Port Valdez have suggested residence times of approximately 40 days (Muench and Nebert 1973). From a single string of current meters moored in the Narrows, Colonell identified a previously unrecognized exchange phenomenon. “Surges of surface water from Prince William Sound into Port Valdez, accompanied by large outflows from depths greater than 50 to 65 m, appear to be related to the passage of weather systems through south-central Alaska. These events appear to be more effective in promoting deep water exchange than either tidal action or annual bottom water intrusions. Because of their apparent connection with atmospheric conditions, a certain degree of randomness is associated with these events so that a characteristic flushing rate is difficult to identify; however, the latter is probably a matter of no more than several days, in view of the large outflow volumes that were indicated by the current meter data.” This
13
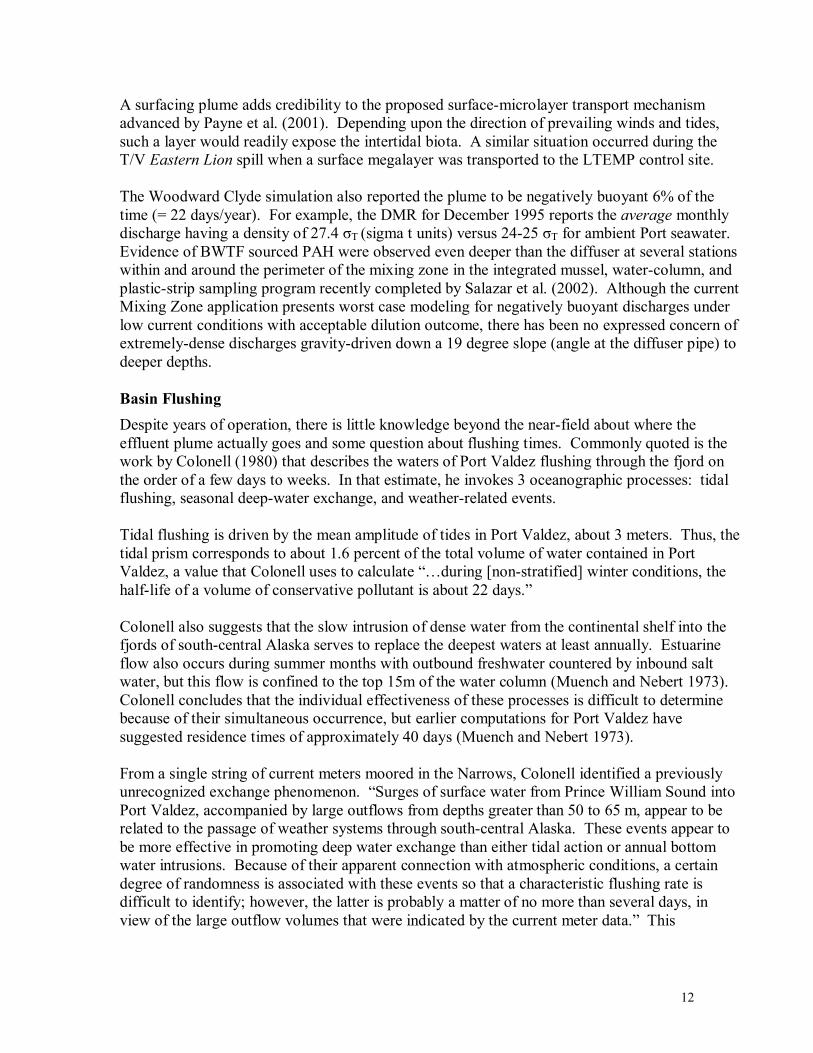
conclusion somewhat overstates the correlation with weather events when Colonell admits, “…attempts to correlate such events with available weather data were less satisfying than for the previous example and had to be regarded as inconclusive.” Whatever the driving force, it is plain that voluminous surge events do occur and dramatically flush the system. What is unclear is the extrapolation of the mass balance data involving current patterns and computed volumes of exchange, to imply circulation patterns and the thoroughness of a flushing event within the Port basin. Just south of Valdez Narrows there is a double sill (Figure 5), with maximum depth of 160 m, which limits direct exchange of Port Valdez water below that depth with the deep waters of Prince William Sound. Without actual current data or even a modeling effort to understand the magnitude of mixing processes below the sill depth within the basin, the flushing estimates are merely back-of-the-envelope calculations.
Figure 5. Bathymetry of Port Valdez. Note sill and Middle Rock pinnacle in the Narrows (from Colonell 1980).
Colonell acknowledges this data gap in the last sentence of his often cited conclusions: “The random nature of the weather-related events, in conjunction with the generally predictable seasonal and tidal exchange processes, suggests that the notion of a unique residence time for Port Valdez is inappropriate. However, the observational evidence suggests that a conservative estimate of a composite residence time is probably no more than a few weeks. This conclusion depends, of course, on an assumption of reasonably uniform mixing throughout Port Valdez.” In other words, he is either ignoring the possibility of incomplete mixing behind the sill or assumes that the influx volume creates enough turbulence to cause complete flushing. Plume Mapping Assuming the basin flushing estimates are reasonable this is an excellent scenario for dilution disposal. But what happens under worse case conditions with minimal flushing? For example, on a neap tide series during summer with the pycnocline down around 50 m, where does the
14
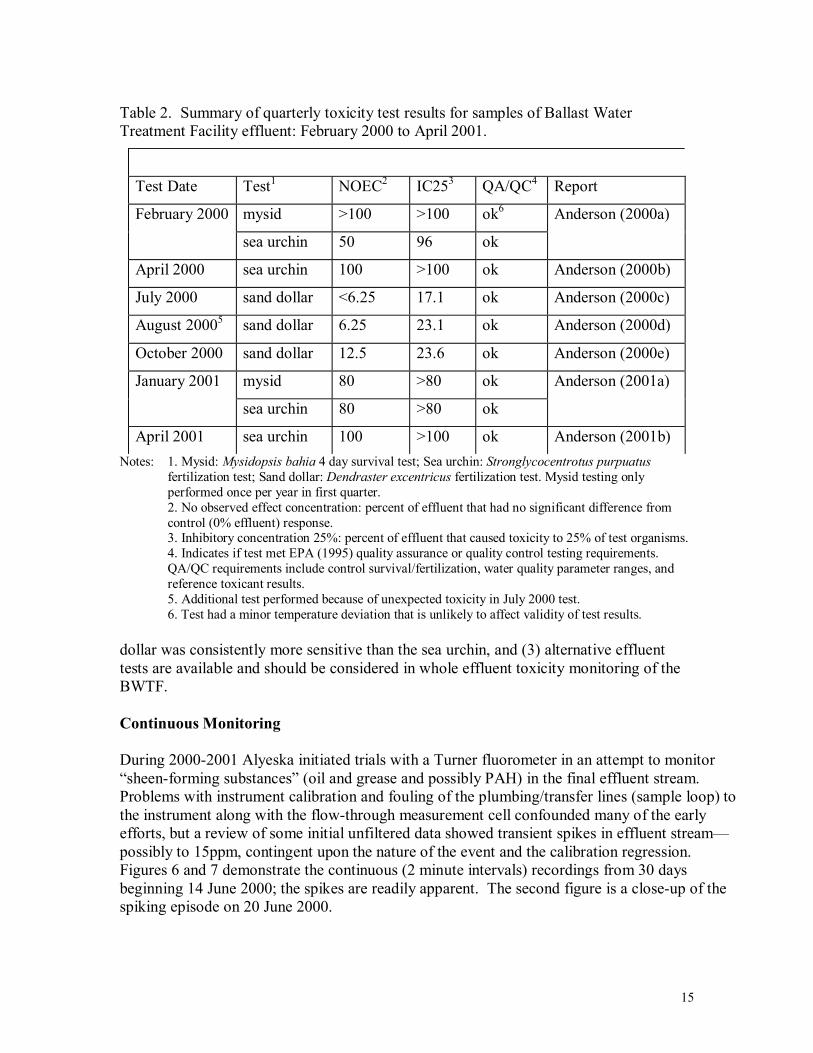
plume go? From Colonell’s work with current meters at the diffuser site, there was no dominant direction to the currents until they reached higher speeds when they would then drift to the east to east-northeast (sometimes reversing); i.e., in a direction approximately parallel to the local isobaths. In March 1986, dye measurements showed the plume being advected to the east as part of what appeared to be a counter-clockwise gyre in the eastern portion of Port Valdez. During spring tides, there was also evidence of occasional flow reversals, which appeared to advect the plume to the northwest. These data only describe near-field conditions. Without longer range studies, are the current far-field sampling locations appropriate? The current sampling design (based on inadequate chemistry information and little current data) has evolved to look only in the far-field deep and in the near field, shallow and deep. Where does the plume leave the basin shelf? How and to what magnitude (advective or diffusive) does it mix with deep basin waters? Some exploratory chemistry sampling using more updated methods at far-field shallow sites may be informative. In an alternative approach, Cook Inlet’s circulation is currently being documented synoptically using a Doppler current profiler (see www.circac.org/adcp.htm). Tracking the currents within the Port Valdez basin would greatly advance the understanding of the dispersion process. Whole Effluent Toxicity Monitoring We reviewed summaries of historical (1990 to 2001) acute and chronic toxicity test results summarized in the Mixing Zone Application (Alyeska 2001), and inspected selected quarterly toxicity test reports for compliance with EPA (1995) testing requirements. Toxicity monitoring of the BWTF effluent has been routinely performed with (1) acute toxicity tests with a Gulf of Mexico mysid (Mysidopsis bahia) and (2) a short-term fertilization test with either a sea urchin (Stronglycocentrotus purpuatus) or a sand dollar (Dendraster excentricus). The quarterly toxicity test reports we inspected are summarized in Table 2, and encompassed the period of February 2000 to April 2001. We also reviewed the current EPA (1995) testing manual for west coast species to determine if more appropriate tests and test species were available and applicable. Additionally, we reviewed the NPDES Permit (No. AK-002324-8) in developing recommendations regarding whole effluent toxicity monitoring. The test results in Table 2 are reported as no observed effect concentrations (NOEC: percent of effluent that had no significant difference from control (0% effluent) response), and IC25 values (inhibitory concentration 25%: percent of effluent that caused toxicity to 25% of test organisms). Compliance with the NPDES Permit is determined from the calculated IC25 values at the edge of the mixing zone, assuming a 100 fold dilution: TUc = 1/IC25, where TUc is defined as 1 chronic toxic unit. This means that IC25 values must be greater than or equal to 1% effluent to be in compliance with the Permit limits for chronic toxicity (i.e., effluent must be toxic at a 1 to 100 dilution before it is a concern). Between 1990 and 2001, the IC25 values ranged from to 1.8% effluent to >100% effluent, and between 1997 and 2001 IC25 values have ranged from 17% to >100% effluent. Our review of the available information indicates that (1) tests were of generally high quality and met QA/QC requirements, (2) during 2000 and 2001, the sand
15
Table 2. Summary of quarterly toxicity test results for samples of Ballast Water Treatment Facility effluent: February 2000 to April 2001.
Test Date Test1 NOEC2 IC253 QA/QC4 Report
February 2000 mysid >100 >100 ok6 Anderson (2000a)
sea urchin 50 96 ok
April 2000 sea urchin 100 >100 ok Anderson (2000b)
July 2000 sand dollar <6.25 17.1 ok Anderson (2000c)
August 20005 sand dollar 6.25 23.1 ok Anderson (2000d)
October 2000 sand dollar 12.5 23.6 ok Anderson (2000e)
January 2001 mysid 80 >80 ok Anderson (2001a)
sea urchin 80 >80 ok
April 2001 sea urchin 100 >100 ok Anderson (2001b) Notes: 1. Mysid: Mysidopsis bahia 4 day survival test; Sea urchin: Stronglycocentrotus purpuatus
fertilization test; Sand dollar: Dendraster excentricus fertilization test. Mysid testing only performed once per year in first quarter. 2. No observed effect concentration: percent of effluent that had no significant difference from control (0% effluent) response. 3. Inhibitory concentration 25%: percent of effluent that caused toxicity to 25% of test organisms. 4. Indicates if test met EPA (1995) quality assurance or quality control testing requirements. QA/QC requirements include control survival/fertilization, water quality parameter ranges, and reference toxicant results. 5. Additional test performed because of unexpected toxicity in July 2000 test. 6. Test had a minor temperature deviation that is unlikely to affect validity of test results.
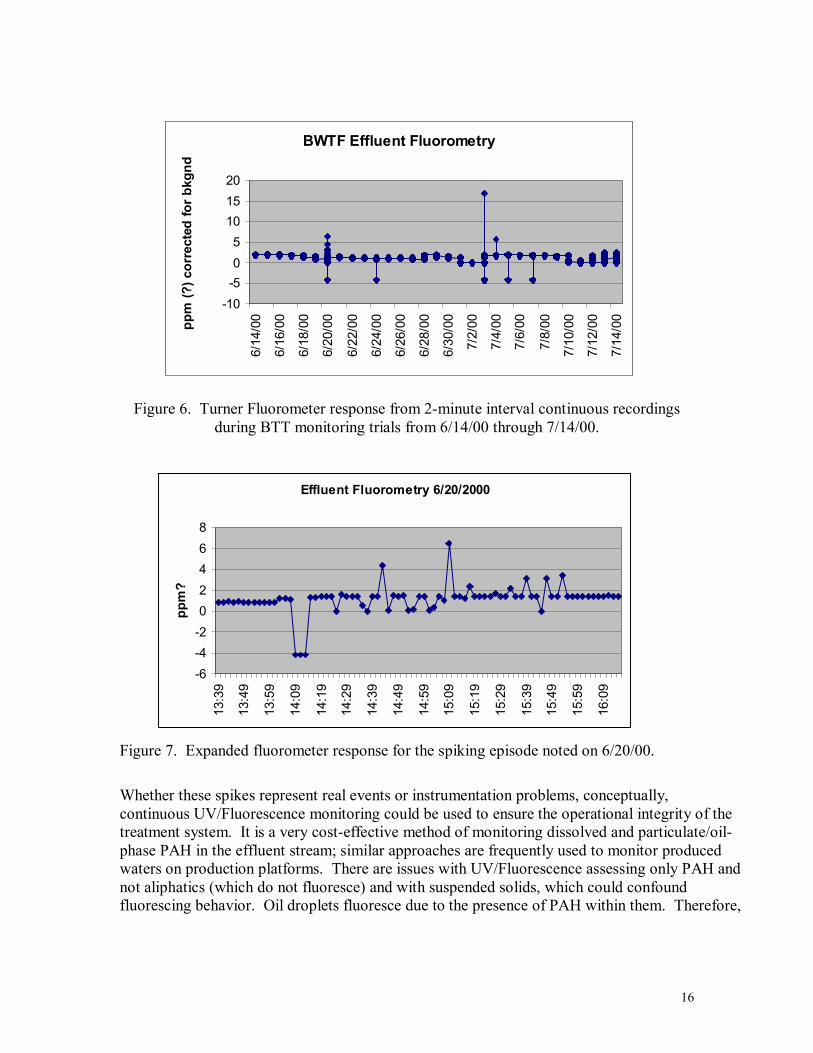
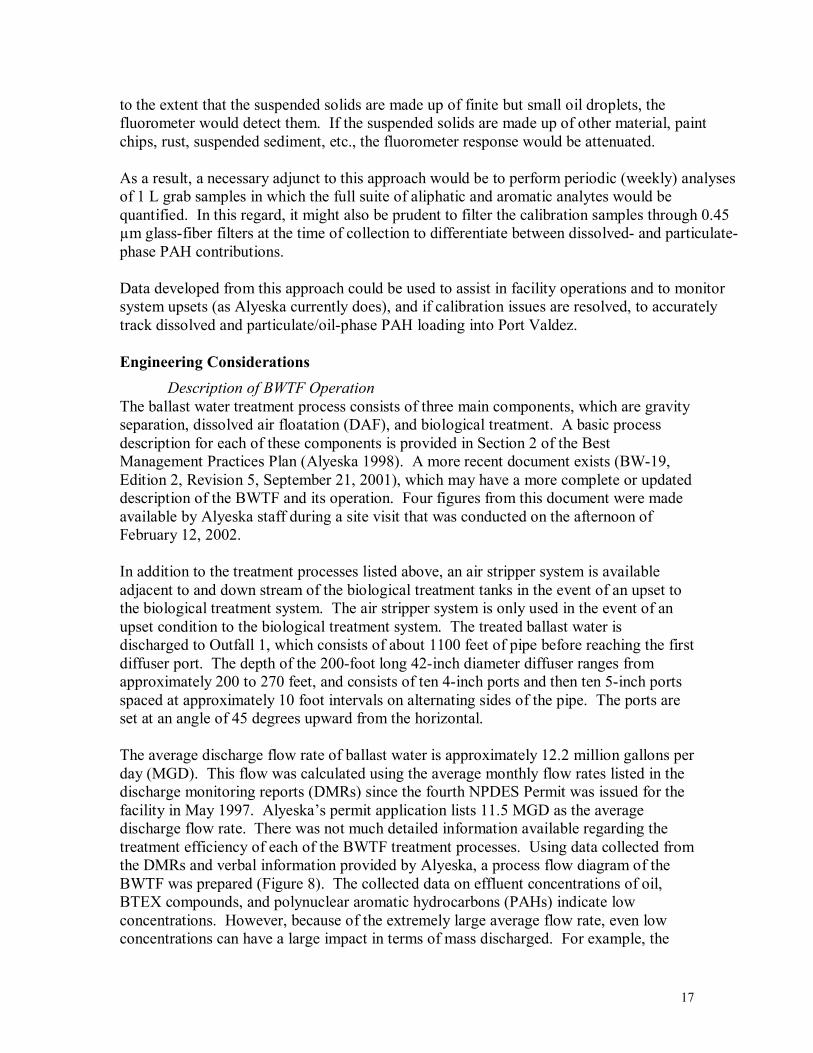
dollar was consistently more sensitive than the sea urchin, and (3) alternative effluent tests are available and should be considered in whole effluent toxicity monitoring of the BWTF. Continuous Monitoring During 2000-2001 Alyeska initiated trials with a Turner fluorometer in an attempt to monitor “sheen-forming substances” (oil and grease and possibly PAH) in the final effluent stream. Problems with instrument calibration and fouling of the plumbing/transfer lines (sample loop) to the instrument along with the flow-through measurement cell confounded many of the early efforts, but a review of some initial unfiltered data showed transient spikes in effluent stream—possibly to 15ppm, contingent upon the nature of the event and the calibration regression. Figures 6 and 7 demonstrate the continuous (2 minute intervals) recordings from 30 days beginning 14 June 2000; the spikes are readily apparent. The second figure is a close-up of the spiking episode on 20 June 2000.
16
Figure 6. Turner Fluorometer response from 2-minute interval continuous recordings
during BTT monitoring trials from 6/14/00 through 7/14/00.
Figure 7. Expanded fluorometer response for the spiking episode noted on 6/20/00.
Whether these spikes represent real events or instrumentation problems, conceptually, continuous UV/Fluorescence monitoring could be used to ensure the operational integrity of the treatment system. It is a very cost-effective method of monitoring dissolved and particulate/oil-phase PAH in the effluent stream; similar approaches are frequently used to monitor produced waters on production platforms. There are issues with UV/Fluorescence assessing only PAH and not aliphatics (which do not fluoresce) and with suspended solids, which could confound fluorescing behavior. Oil droplets fluoresce due to the presence of PAH within them. Therefore,
BWTF Effluent Fluorometry
-10-505
101520
6/14
/00
6/16
/00
6/18
/00
6/20
/00
6/22
/00
6/24
/00
6/26
/00
6/28
/00
6/30
/00
7/2/
00
7/4/
00
7/6/
00
7/8/
00
7/10
/00
7/12
/00
7/14
/00ppm
(?) c
orre
cted
for b
kgnd
Effluent Fluorometry 6/20/2000
-6-4-202468
13:3
9
13:4
9
13:5
9
14:0
9
14:1
9
14:2
9
14:3
9
14:4
9
14:5
9
15:0
9
15:1
9
15:2
9
15:3
9
15:4
9
15:5
9
16:0
9
ppm
?
17
to the extent that the suspended solids are made up of finite but small oil droplets, the fluorometer would detect them. If the suspended solids are made up of other material, paint chips, rust, suspended sediment, etc., the fluorometer response would be attenuated. As a result, a necessary adjunct to this approach would be to perform periodic (weekly) analyses of 1 L grab samples in which the full suite of aliphatic and aromatic analytes would be quantified. In this regard, it might also be prudent to filter the calibration samples through 0.45 µm glass-fiber filters at the time of collection to differentiate between dissolved- and particulate-phase PAH contributions. Data developed from this approach could be used to assist in facility operations and to monitor system upsets (as Alyeska currently does), and if calibration issues are resolved, to accurately track dissolved and particulate/oil-phase PAH loading into Port Valdez. Engineering Considerations
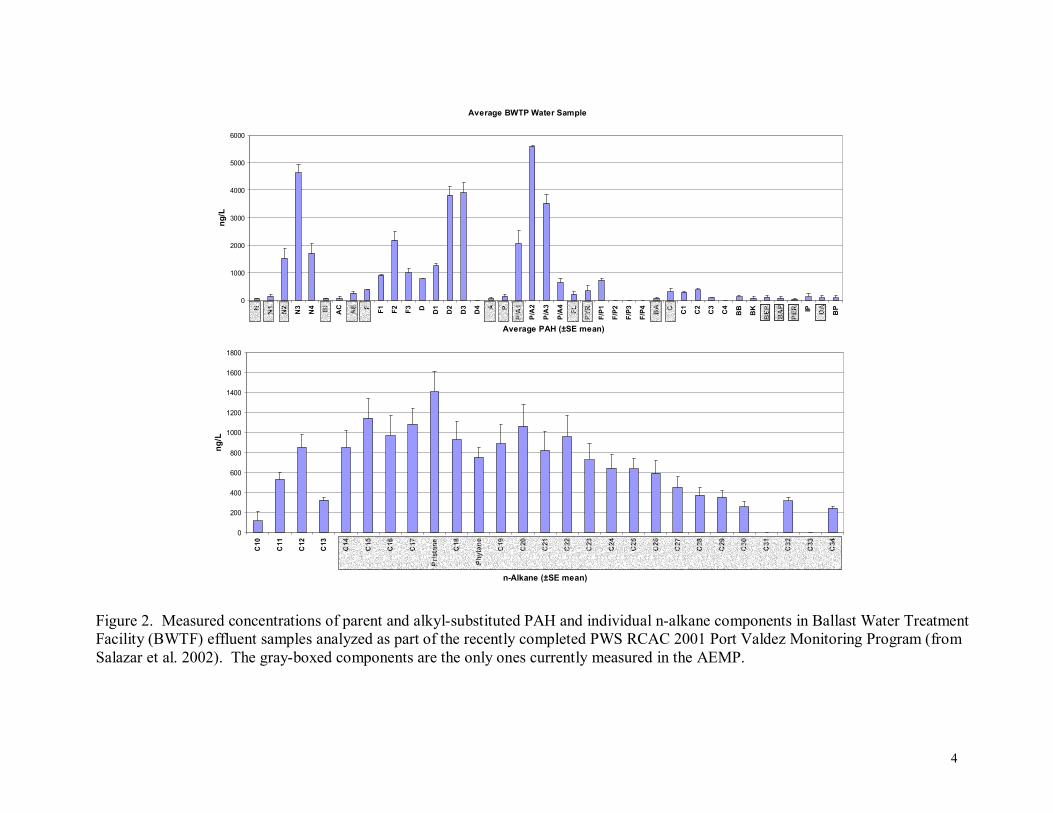
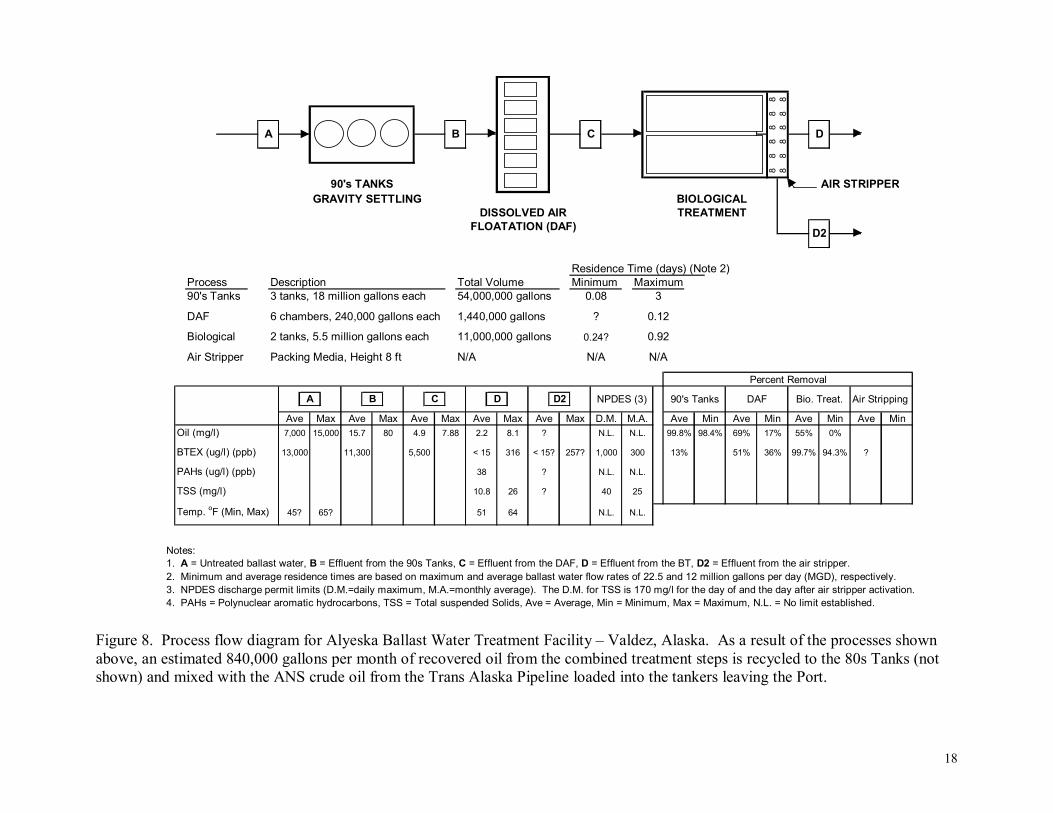
Description of BWTF Operation The ballast water treatment process consists of three main components, which are gravity separation, dissolved air floatation (DAF), and biological treatment. A basic process description for each of these components is provided in Section 2 of the Best Management Practices Plan (Alyeska 1998). A more recent document exists (BW-19, Edition 2, Revision 5, September 21, 2001), which may have a more complete or updated description of the BWTF and its operation. Four figures from this document were made available by Alyeska staff during a site visit that was conducted on the afternoon of February 12, 2002. In addition to the treatment processes listed above, an air stripper system is available adjacent to and down stream of the biological treatment tanks in the event of an upset to the biological treatment system. The air stripper system is only used in the event of an upset condition to the biological treatment system. The treated ballast water is discharged to Outfall 1, which consists of about 1100 feet of pipe before reaching the first diffuser port. The depth of the 200-foot long 42-inch diameter diffuser ranges from approximately 200 to 270 feet, and consists of ten 4-inch ports and then ten 5-inch ports spaced at approximately 10 foot intervals on alternating sides of the pipe. The ports are set at an angle of 45 degrees upward from the horizontal. The average discharge flow rate of ballast water is approximately 12.2 million gallons per day (MGD). This flow was calculated using the average monthly flow rates listed in the discharge monitoring reports (DMRs) since the fourth NPDES Permit was issued for the facility in May 1997. Alyeska’s permit application lists 11.5 MGD as the average discharge flow rate. There was not much detailed information available regarding the treatment efficiency of each of the BWTF treatment processes. Using data collected from the DMRs and verbal information provided by Alyeska, a process flow diagram of the BWTF was prepared (Figure 8). The collected data on effluent concentrations of oil, BTEX compounds, and polynuclear aromatic hydrocarbons (PAHs) indicate low concentrations. However, because of the extremely large average flow rate, even low concentrations can have a large impact in terms of mass discharged. For example, the
18
Figure 8. Process flow diagram for Alyeska Ballast Water Treatment Facility – Valdez, Alaska. As a result of the processes shown above, an estimated 840,000 gallons per month of recovered oil from the combined treatment steps is recycled to the 80s Tanks (not shown) and mixed with the ANS crude oil from the Trans Alaska Pipeline loaded into the tankers leaving the Port.
8 88 8
8 88 8
8 88 8
AIR STRIPPER BIOLOGICAL
DISSOLVED AIR TREATMENTFLOATATION (DAF)
Residence Time (days) (Note 2)Process Description Total Volume Minimum Maximum90's Tanks 3 tanks, 18 million gallons each 54,000,000 gallons
DAF 6 chambers, 240,000 gallons each 1,440,000 gallons
Biological 2 tanks, 5.5 million gallons each 11,000,000 gallons
Air Stripper Packing Media, Height 8 ft N/A
Air Stripping
Oil (mg/l)
BTEX (ug/l) (ppb)
PAHs (ug/l) (ppb)
TSS (mg/l) ?
Temp. oF (Min, Max)
Notes:1. A = Untreated ballast water, B = Effluent from the 90s Tanks, C = Effluent from the DAF, D = Effluent from the BT, D2 = Effluent from the air stripper.2. Minimum and average residence times are based on maximum and average ballast water flow rates of 22.5 and 12 million gallons per day (MGD), respectively.3. NPDES discharge permit limits (D.M.=daily maximum, M.A.=monthly average). The D.M. for TSS is 170 mg/l for the day of and the day after air stripper activation.4. PAHs = Polynuclear aromatic hydrocarbons, TSS = Total suspended Solids, Ave = Average, Min = Minimum, Max = Maximum, N.L. = No limit established.
GRAVITY SETTLING
N.L. N.L.
3
0.12
0.92
N/A
0.08
?
0.24?
55% 0%
13%
17%98.4%
51
10.8
N.L.
D.M. M.A.
?
64
N.L.
257?
N/A
69%
99.7%
38
Percent Removal
< 15?< 15
Min
DAF Bio. Treat.
5,500
Ave2.2
316
N.L. N.L.8.1 ?Ave Min
45? 65?
99.8%
40 25
1,000 300
7.8815.7 80
D
D2
Ave Max
A B D D2C
Ave
B C
Ave Max Ave Max Ave Max Ave Max
A
90's TANKS
7,000 15,000 4.9
13,000 11,300
NPDES (3)
?
26
51% 36%
MinMin
90's Tanks
Ave
94.3%
19
average flow of 12 MGD this translates into approximately 220 pounds per day. Assuming a specific gravity of 0.9, this is the equivalent of 0.7 barrels of oil per day being discharged into the Port. The existing NPDES permit for the BWTF effluent has relatively high limits on BTEX at 1,000 mg/L as a daily maximum and 300 mg/L as a monthly average. There is also a permit requirement for analysis of total aqueous hydrocarbons (TAqH), which is a sum of BTEX and PAHs, but there is no established NPDES limit for the effluent. There is an ADEC limit of 15 µg/L for TAqH at the boundaries of the established mixing zone, but there is no easy way to monitor this requirement. In addition, there is not an NPDES permit limit or sampling requirement for recoverable oil and grease. According to a review of regulations published in the year 2000 regarding hydrocarbons in water, the typical discharge limit in the U.S. and internationally is 15 mg/L or less oil and grease (Mohr 2000). The review also stated that the European Committee for Standardization developed a standard for 5 mg/L or less oil and grease for discharges to surface water. That standard was still in draft form in early 2000. The NPDES Permit renewal for the Alyeska Valdez facility also includes a sanitary sewage treatment system and discharge. However, due to its very low average flow 0.0022 MGD compared to the BWTF the focus of this evaluation is on the BWTF.
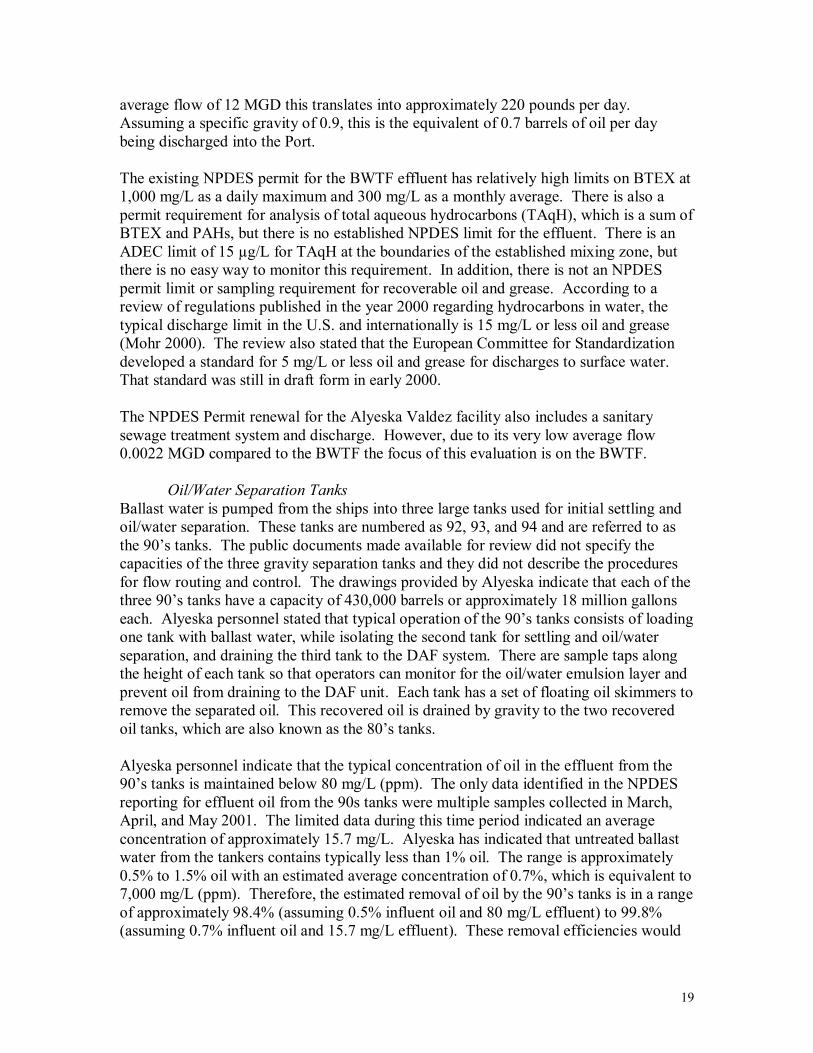
Oil/Water Separation Tanks Ballast water is pumped from the ships into three large tanks used for initial settling and oil/water separation. These tanks are numbered as 92, 93, and 94 and are referred to as the 90’s tanks. The public documents made available for review did not specify the capacities of the three gravity separation tanks and they did not describe the procedures for flow routing and control. The drawings provided by Alyeska indicate that each of the three 90’s tanks have a capacity of 430,000 barrels or approximately 18 million gallons each. Alyeska personnel stated that typical operation of the 90’s tanks consists of loading one tank with ballast water, while isolating the second tank for settling and oil/water separation, and draining the third tank to the DAF system. There are sample taps along the height of each tank so that operators can monitor for the oil/water emulsion layer and prevent oil from draining to the DAF unit. Each tank has a set of floating oil skimmers to remove the separated oil. This recovered oil is drained by gravity to the two recovered oil tanks, which are also known as the 80’s tanks. Alyeska personnel indicate that the typical concentration of oil in the effluent from the 90’s tanks is maintained below 80 mg/L (ppm). The only data identified in the NPDES reporting for effluent oil from the 90s tanks were multiple samples collected in March, April, and May 2001. The limited data during this time period indicated an average concentration of approximately 15.7 mg/L. Alyeska has indicated that untreated ballast water from the tankers contains typically less than 1% oil. The range is approximately 0.5% to 1.5% oil with an estimated average concentration of 0.7%, which is equivalent to 7,000 mg/L (ppm). Therefore, the estimated removal of oil by the 90’s tanks is in a range of approximately 98.4% (assuming 0.5% influent oil and 80 mg/L effluent) to 99.8% (assuming 0.7% influent oil and 15.7 mg/L effluent). These removal efficiencies would
20
exceed those typically observed with conventional type (i.e., excluding parallel plate type) oil/water separators, which typically range in removal efficiency from approximately 52% to 87% (Eckenfelder 2000). The main parameter that affects the efficiency of oil separation and settling of suspended solids is retention or residence time in the tanks. Under normal described operating procedure using all three tanks assuming an equivalent two tanks are full at any one time (36 million gallons) and assuming an average flow rate of 12 MGD, the maximum retention time would be approximately 3 days. This retention time is significantly longer than the retention time of an oil/water separator for the average industrial application. Factors that would reduce retention time and act to reduce oil removal efficiency would be the accumulation of settled solids in the bottom of the tank, accumulation of floating oil in the tanks that is not removed, the removal of a tank(s) from service, a higher than average ballast water flow rate, and not filling the 90’s tanks to their full capacity. Alyeska personnel claim that solids generation does not occur at a high rate and that cleanout of each of the 90’s tanks is scheduled at only once every 5 years. The Best Management Practices Plan for the facility (Alyeska 1998) states that the standard operating procedure is to have a 4-hour holding time and that “no transfer will be made from the 90’s tanks to the DAF cells with less than 2-hours of holding time.” This statement is not clear. It is assumed that this statement means that the ballast water will be allowed to settle for a minimum of two hours after tank loading is completed and before tank drainage to the DAF system is initiated. Alyeska should clarify the minimum operating standards and minimum retention time for the 90’s tanks.
Dissolved Air Floatation The ballast water goes through a secondary treatment step for removal of oil and this process is the dissolved air floatation (DAF) system. The system consists of 6 open-top tanks or cells, which are operated in parallel. The ballast water is pressurized by pumps in the presence of air to near the oxygen saturation point. As the pressurized and aerated water is released to the DAF tanks small air bubbles are released from solution and rise through the water collecting oil and suspended solids. The floated oil is collected by one set of manually operated skimmers and one set of automatically operated skimmers. Skimmed oil is pumped to the 80’s tanks for further oil/water separation and ultimately will be re-mixed with the crude oil loaded onto the tankers leaving the facility. As is typical with DAF systems, a polymer is added as a flocculent to assist with the clarification process. The Best Management Practices Plan indicates that a cationic high molecular weight polyamine polymer is used. No information was given by Alyeska personnel regarding comparison testing of this polymer versus other commercially available polymers. The public documents made available for review did not specify the dimensions or capacities of the six DAF cells and they did not describe the procedures for flow routing and control. The information provided verbally by Alyeska personnel is that each of the cells has a length of 120 ft, a width of 24 ft, and a water depth of 12 ft. This would give a ballast water holding capacity of approximately 240,000 gallons per cell, or 1,440,000 gallons total.
21
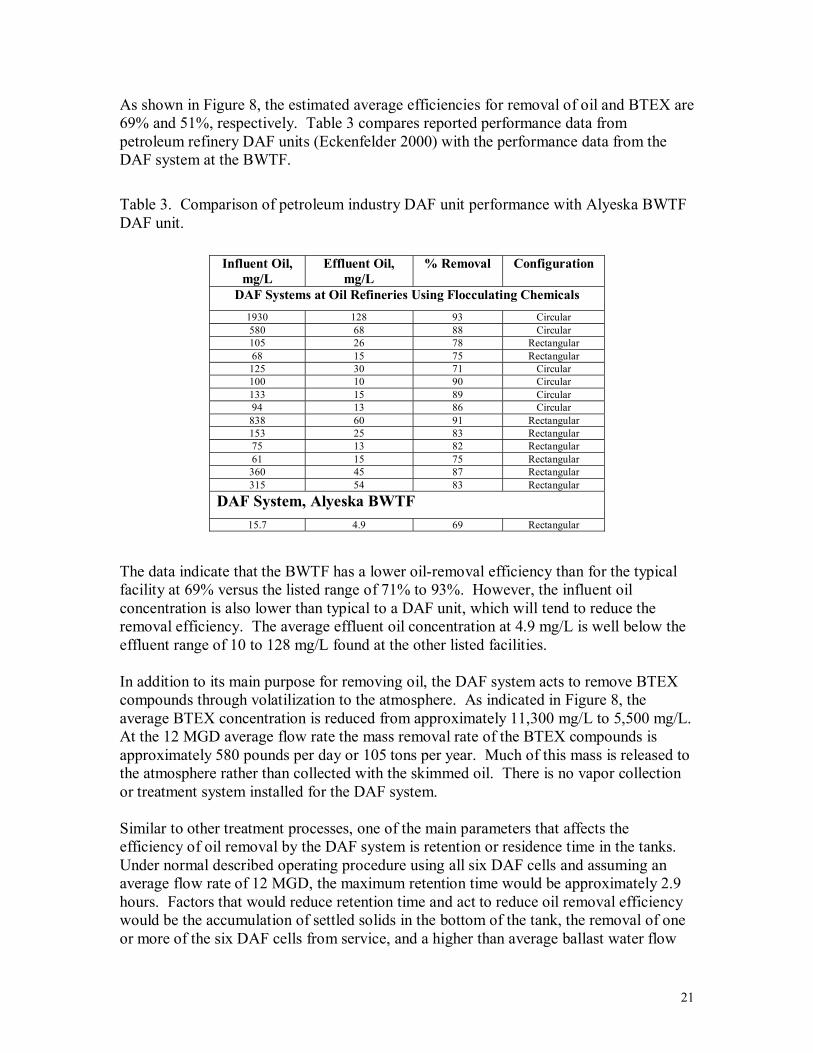
As shown in Figure 8, the estimated average efficiencies for removal of oil and BTEX are 69% and 51%, respectively. Table 3 compares reported performance data from petroleum refinery DAF units (Eckenfelder 2000) with the performance data from the DAF system at the BWTF. Table 3. Comparison of petroleum industry DAF unit performance with Alyeska BWTF DAF unit.
Influent Oil, mg/L
Effluent Oil, mg/L
% Removal Configuration
DAF Systems at Oil Refineries Using Flocculating Chemicals 1930 128 93 Circular 580 68 88 Circular 105 26 78 Rectangular 68 15 75 Rectangular 125 30 71 Circular 100 10 90 Circular 133 15 89 Circular 94 13 86 Circular 838 60 91 Rectangular 153 25 83 Rectangular 75 13 82 Rectangular 61 15 75 Rectangular 360 45 87 Rectangular 315 54 83 Rectangular
DAF System, Alyeska BWTF 15.7 4.9 69 Rectangular
The data indicate that the BWTF has a lower oil-removal efficiency than for the typical facility at 69% versus the listed range of 71% to 93%. However, the influent oil concentration is also lower than typical to a DAF unit, which will tend to reduce the removal efficiency. The average effluent oil concentration at 4.9 mg/L is well below the effluent range of 10 to 128 mg/L found at the other listed facilities. In addition to its main purpose for removing oil, the DAF system acts to remove BTEX compounds through volatilization to the atmosphere. As indicated in Figure 8, the average BTEX concentration is reduced from approximately 11,300 mg/L to 5,500 mg/L. At the 12 MGD average flow rate the mass removal rate of the BTEX compounds is approximately 580 pounds per day or 105 tons per year. Much of this mass is released to the atmosphere rather than collected with the skimmed oil. There is no vapor collection or treatment system installed for the DAF system. Similar to other treatment processes, one of the main parameters that affects the efficiency of oil removal by the DAF system is retention or residence time in the tanks. Under normal described operating procedure using all six DAF cells and assuming an average flow rate of 12 MGD, the maximum retention time would be approximately 2.9 hours. Factors that would reduce retention time and act to reduce oil removal efficiency would be the accumulation of settled solids in the bottom of the tank, the removal of one or more of the six DAF cells from service, and a higher than average ballast water flow
22
rate. Alyeska personnel indicate that the accumulation rate of sediment in the bottom of the DAF cells is only about 2 inches per year and that cleanout for each cell occurs only once every few years. The Best Management Practices Plan for the facility (Alyeska 1998) does not indicate that there are minimum standards to ensure that a minimum retention time is maintained. During the site visit one of the DAF cells was drained and another cell appeared to be inactive. Alyeska should clarify the minimum retention time for the DAF system or the minimum number of DAF cells to be active at various flow rate ranges.
Biological Treatment Following the DAF system, the ballast water flows to the biological treatment system. The biological treatment system consists of two 5.5 million gallon open-top tanks that are operated in parallel. Microorganisms capable of consuming petroleum hydrocarbons are already present in the untreated ballast water and do not need to be added. Nitrogen- and phosphorous-based nutrients are added to the ballast water after the DAF system. The biological treatment employed at the BWTF is fully aerobic. Oxygen is added to the biological treatment tanks by pumping air through diffusers mounted along the bottom of the biological treatment tanks. In addition to the biological degradation, it is expected that a significant portion of the removal of the volatile BTEX compounds from the biological treatment tanks is performed by volatilization into the injected air and subsequent dispersal into the atmosphere. The temperature of the BWTF effluent varies between winter and summer months from approximately 47°F (8°C) to 59°F (15°C). This temperature drop in the colder months is significant enough to drop the treatment efficiency of the biological treatment, and historical data indicate that the highest effluent BTEX results occur in the winter and early spring months. As shown on the process flow diagram in Figure 8, the hydraulic retention time in the biological treatment system would be approximately 0.92 days under the average daily flow rate of 12 MGD and could be less than 0.5 days at the maximum observed flow rate of 22.5 MGD. If one of the tanks were to be shut down for cleaning or maintenance then the retention time would be half of these values. Figure 8 also lists the estimated average efficiencies for removal of oil and BTEX as 55% and 99.7%, respectively based on data collected from the NPDES DMR forms. Currently there are no available data on PAHs at the influent to the biological treatment system to characterize its effectiveness in degrading PAHs. It is expected that the biological treatment is much less effective for reduction of the concentration of PAHs. One reason is that PAHs have much lower volatility and lower Henry’s Law constants and will not be removed to a significant level by aeration. Second, the microorganisms can much more easily consume the lower molecular weight aliphatic and BTEX compounds for energy versus the higher molecular weight PAHs. Large-scale biological treatment systems are not as common compared to DAF systems for oily wastewater, so it is more difficult to make a comparison of the BWTF with respect to the typical industry practice. Biological treatment systems are typically designed to be large enough to provide more than 1 day of retention time, which is longer than the retention time of the BWTF biological system, as discussed above. Literature
23
suggests that typically more than 20% of the waste load, in terms of biochemical oxygen demand (BOD), remains after a single-stage aerated lagoon with only 1 day of hydraulic retention time (Eckenfelder 2000). Biological treatment systems are usually employed to treat a high BOD wastewater to a level below typical effluent targets of 20 mg/L in summer and 30 mg/L in winter. The influent BOD to the BWTF biological treatment system is unknown, but one sample of the effluent was measured to be 6.96 mg/L, which is well below treatment goals for a typical biological system. There are a number of types and variations for biological treatment systems. Within the class of lagoons and stabilization basins are facultative ponds (with an oxygenated aerobic surface and an anaerobic bottom), anaerobic ponds, and aerated lagoons. Activated sludge systems can supply their own nitrogen and phosphorous through the collection and re-introduction of anoxic biological sludge. Other biological treatment options that typically accomplish biological treatment using less land area include rotating biological contactors and trickling bed filters. Both of these methods provide increased biological growth surface area to more efficiently consume the pollutants. The existing air stripper system may even be convertible into a type of biological trickling bed filter with use of lower airflow rates. However, snow and low ambient air and water temperatures may negatively impact these processes. No information is available which describes the selection process for the aerobic aerated lagoon type system constructed for the BWTF. There is also a lack of evidence that the biological treatment system is monitored to demonstrate effective biological activity. No data were made available on laboratory testing of the biological populations or on biological BTEX degradation rate studies. If the BTEX concentrations go up, then Alyeska personnel conclude that there has been a biological upset. The aerated lagoon does not allow the biological solids to settle to the bottom, as is the case with other types of biological treatment such as activated sludge. With the aerated lagoon such as the biological treatment system at the BWTF, there will be a higher biological solids level in the effluent. The effluent of the BWTF contains an average total suspended solids level of approximately 11 mg/L, which is fairly low but equals an average mass discharge of approximately 1,100 pounds per day. Where low suspended solids are desired, a final settling basin can be added following the biological treatment tanks with a minimum recommended retention time of 1 day (Eckenfelder 2000). Suspended solids can also be reduced using less land area than a settling pond by adding a coagulant to the biological treatment system effluent with the water then flowing to a clarifier to settle and remove the sludge. One future concern mentioned for the biological treatment system is with the increased use of ships having segregated (i.e., clean) ballast water that does not require treatment. This would reduce flows and potentially make the flow rate more sporadic. The concern would be that the flow may drop to zero or to such a low rate that the biological life in the system would die off from lack of food source. However, a lower or more sporadic flow rate can be handled in a number of ways and better effluent results could actually be achieved. The biological treatment tanks could be modified to allow operation in series
24
rather than only in parallel. The flows can be regulated through the controlled drainage of the 90s tanks. As long as scheduling of ships is monitored effectively, BWTF operators should be able to ensure that the flow rate to the biological treatment tanks never drops to zero or below a level that risks killing the microorganisms in the biological treatment tanks.
Air Stripper System The air stripper system is installed down stream of the biological treatment tanks, but this system is bypassed in normal operation. The air stripper system is specifically designed to remove BTEX compounds to meet the NPDES permit limits in the event of an upset to the biological treatment system. The air stripper system has disadvantages compared to biological treatment in that it introduces the BTEX into the ambient air rather than degrading the compounds (although the aerated biological treatment system likely introduces a significant quantity of BTEX compounds to the atmosphere as well). Air stripping also has the disadvantage in that other non-volatile or less-volatile hydrocarbons are not removed from the ballast water, whereas biological treatment can have effectiveness in removing some of these compounds. One concern would be if Alyeska were relying on air stripping to remove BTEX rather than making the effort to ensure that the biological treatment system continues to operate efficiently. However, there are disincentives for Alyeska to operate the air stripper units in the cost of running the air blowers and having to worry about cleaning the air stripper packing that tends to get fouled with biological growth over time. In fact, it has not been necessary for Alyeska to operate this system since February 1999, according to NPDES records and Alyeska personnel.
Additional Technologies to be Considered The RCAC requested that additional technologies be identified that could further reduce hydrocarbon concentrations in the BWTF effluent. PAHs have become an area of interest as a result of the PWS RCAC LTEMP and caged mussel studies. Two technologies that would be effective in reducing the concentration of PAHs (as well as oil and BTEX) in the BWTF effluent, if these pollutants are found to be at unacceptable levels following additional data collection, are activated carbon and chemical oxidation. Activated carbon has a long history of use in the wastewater treatment industry. The dissolved contaminants are adsorbed to the carbon media until the carbon reaches saturation, at which point the carbon can be regenerated onsite using steam or solvent but is more typically sent to an offsite location for thermal regeneration. Wastewater is typically pumped through vessels loaded with granular carbon that are operated in series to allow maximum loading of contaminants onto the lead vessel(s). The Freundlich equation can be used to estimate the capacity of activated carbon to adsorb a contaminant at a given contaminant concentration, and the isotherm constants for BTEX compounds and especially PAHs indicate high carbon loadings (U.S. Army Corps of Engineers 2001). These contaminants could be effectively removed to non-detectable levels. However, sizing the carbon vessels for an empty bed contact time of approximately 10 minutes indicates that the lead carbon vessel(s) would need to have a capacity of
25
approximately 280,000 pounds of activated carbon. Powdered activated carbon (PAC) could be added directly to the waste stream to eliminate the need for large storage vessels, but a large clarifier would be necessary to separate and recover the PAC. And although the levels of PAHs and BTEX are very low, the relatively higher level of residual oil (2.2 mg/L) would also compete for adsorption onto the carbon. As a result, the carbon usage rate would be higher than calculated. For waste loads at the level of the BWTF effluent, literature data for refineries indicate that carbon usage would be at least 1 pound per 1,000 gallons of water. This would equate to a carbon usage rate of 12,000 pounds per day. The transportation costs for offsite regeneration would also be quite high. Chemical oxidation involves the use of an oxidizing agent (e.g., hydrogen peroxide, chlorine, permanganate, ozone, peroxide with UV light, etc.) to break down organic contaminants to carbon dioxide and water or at least to generally less toxic intermediates. Chlorine has the disadvantage of producing toxic chlorinated byproducts and may not be a strong enough oxidant. Hydrogen peroxide is a stronger oxidant than chlorine but still may not be a strong enough oxidant to significantly destroy the PAHs. Ozone is composed of three oxygen atoms (O3) and is a very strong oxidant. Ozone is an unstable gas with a short half-life in water, and it has been used extensively in the potable water and wastewater treatment industries. Literature also suggests that ozone is effective in the destruction of PAHs (AWWA 2000). The disadvantage of using ozone would be the large amount of power, and therefore cost, that it takes to generate ozone. Ozone would be cost effective if PAHs were the only constituent in the effluent ballast water or if the ozone would target only the PAHs. However, ozone is an indiscriminant oxidizer and there is at least a 2.2 mg/L average loading of oil, which has a chemical oxygen demand. To be able to estimate the required ozone dosage the chemical oxygen demand (COD) should be well established. However, only one sample of COD from the BWTF has been collected according to the NPDES permit application with a poorly quantified value of less than (<) 100 mg/L. Proposed Modifications to the NPDES Permit 1. Update the required chemistry methods (also suggested by the AEMP investigators). As a
start, the methods of Short et al. (1996) should be implemented by the UAF investigators in future studies. Alternatively, there are several commercial and governmental laboratories that are capable of performing these methods (Battelle, New England; Texas A&M Geochemical and Environmental Research Group (GERG); the Woods Hole Group Environmental Laboratories; and the NOAA/NMFS Auke Bay Laboratories).
2. Begin continuous monitoring of the effluent stream using a fluorometer to quantify PAH content. At a minimum, at least initiate weekly SIM GC/MS analyses using updated chemistry methods to provide PAH discharge data and allow calibration of the fluorometer. Previous trials with a Turner fluorometer monitoring the BWTF effluent during 2000-01 suggest there may be sporadic spikes in PAH discharge. Continuous fluorometer monitoring ensures system integrity and is cost-effective.
26
3. Assess the level of concentration and magnitude of transport from surface microlayers. Results from Payne et al. (2001) demonstrate chronic seasonal shallow (most likely, surface) transport across the Port. There is a data gap regarding the confirmation and magnitude of this process.
4. De-emphasize the hypothesis testing, use only as necessary (also suggested by the AEMP investigators); a plethora of nonessential hypothesis results tends to obscure the relevant findings. The multivariate approaches used by Feder and Blanchard (Shaw et al. 2000a,b) is modern, appropriate and flexible in addressing pertinent issues. Also, when the updated chemistry data become available, rather than being limited to the NPDES specified list of secondary oiling indicators, analysts should be allowed to derive their own set of pertinent parameters. The CRUDE index used in the LTEMP reports (Payne et al. 1998) may also be helpful. (AEMP investigators concur).
5. Collect additional environmental parameters that would help to better understand the variance in infaunal populations (also suggested by the AEMP investigators). “Reproductive success and subsequent larval stages of benthic organisms, and survival of recently recruited individuals on the bottom are dependent to a large extent on food availability. Monitoring environmental parameters (temperature, salinity, primary productivity, phytoplankton pigment accumulation within sediments and total annual carbon flux to the bottom) would improve the understanding of interannual fluctuations in community structure. Lack of such data throughout the years has made it difficult to interpret faunal changes. Addition of some of the parameters noted above, in particular, phytoplankton flux to the bottom and annual carbon flux to the bottom, is highly recommended for future surveys” (AEMP Final Environmental Report 2000).
6. Conduct studies to assess feeding modes for several dominant infaunal species that are important in the understanding of response of the infaunal assemblages to carbon availability in Port Valdez. The interpretations of biological trends are currently based upon debateable assumptions of feeding modes which are relevant to understantding the source of nutrition, exposure to hydrocarbons and shifts (natural or unnatural) in populations. The animals to be studied should include, at least the thyasirid bivalves (Axinopsida spp. and Adontorhina cyclia) and the polychaete worm Nephtys punctata. (AEMP investigators concur).
7. Reinitiate Mytilus sampling (similar to the RCAC’s LTEMP approach) into the monitoring suite to assess surface transport, particularly at far field locations. The previous chemistry analyses were inadequate to ascertain the BWTF signature, and the decision to drop that aspect of the program was ill-founded. Surface waters and intertidal exposure are aspects of the ecosystem currently being ignored.
8. Evaluate other potential receptor species particularly Macoma balthica. The exposure of intertidal deposit feeders is of high ecological significance.
9. Initiate a reconnaissance program to identify other intertidal sites that support ambient mussel populations that could be used to obtain a wider geographic evaluation of intertidal contamination within the Port. Because there are only data from three sites (AMT, Gold Creek, and Anderson Bay) with no information on transport processes or geographic fate, there may be other areas receiving more concentrated levels of pollutants.
10. Sample shrimp and other species that have been commercially fished or used in subsistence diets from the Port near the BWTP mixing zone and quantify PAH and SHC tissue concentrations. Compare against the same species collected from other locations not influenced by the AMT (possibly Jack Bay or other locations west of the Valdez Narrows).
27
11. Conduct a visual survey with an ROV on the slope and on the floor of the fjord during winter (or when water clarity is greatest) to document the nature of bioturbation and, especially in the vicinity of AEMP stations D-33 and D-25, slope stability. The intent is to determine the abundance of large subsurface deposit feeders (e.g., presence of large fecal cones) or other large burrowers and the likely frequency of slope failure due to earthquakes of prop wash and other shipping activities.
12. Incorporate a conductivity-temperature-depth (CTD) profiler to identify the overall depth and structure of the water column and possibly a submersible fluorometer to better define the BWTP effluent plume. Then confirm its presence and PAH concentrations outside the mixing zone by more detailed chemical analyses of discrete filtered 3 L grab samples at specific depths suggested by the CTD and fluorometer data.
13. Consider a better assessment of far-field effluent transport. Conduct an exploratory assessment of chemistry along the far-field shallow shelf or track the far field plume pathway with subsurface buoys or an acoustic Doppler current profiler.
14. Evaluate rate and degree of thoroughness of basin flushing by gathering more information on basin circulation. Conclusions from previous studies are qualified crude estimates from mass balance models that are widely misused in the decision-making process.
15. Mysid toxicity tests. The current acute testing requirement (once per year; 96 hour acute toxicity test) should be changed to a chronic (7 day test duration) requirement. US EPA testing guidance specifies a 7 day Growth and Survival Test with either the west coast mysid, Holemesimysis costata (EPA, 1995), or Gulf Coast mysid, Mysidopsis bahia (EPA, 1994). These tests are routinely performed by contract bioassay laboratories, and in addition to allowing an assessment of chronic toxicity these tests also allow determination of a 96 hour acute toxicity consistent with previous testing.
16. Sea urchin and sand dollar toxicity tests. The current fertilization test requirement (total of 40 minutes of effluent exposure) should be eliminated and replaced with one of the longer-term bivalve or echinoderm development tests:
• Purple Urchin and Sand dollar Larval Development Test. This is a 72 hour static test described in EPA (1995) for the same species performed with the fertilization test.
• Pacific Oyster and Mussel Embryo-Larval Development Test. This is a 48 hour static renewal test described in EPA (1995) for the oyster Crassostrea gigas and a mussel (Mytilus edulis, M. californianus, M. galloprovincialis, or M. trossulus [the local Alaskan species]).
These tests will evaluate larval survival and development during a longer duration of exposure than the current fertilization tests. Additionally, as stated in the EPA (1995) testing manual, the invertebrate embryo-larval tests tend to be more sensitive test organisms to many chemicals and the tests are more robust statistically. Development testing should be initiated as soon as the new Permit is issued. The fertilization test should continue for 4 quarters after initiation of development testing to allow comparison to the historical testing database, while a database with the development test is established.
17. There are no current NPDES permit requirements for sampling total recoverable oil and grease (TROG) and only the once per month sampling requirement for effluent total aqueous hydrocarbons (TAqH). Unfortunately, the EPA Priority Pollutant PAH included in the TAqH calculation do not yet include the alkyl-substituted homologues that are predominant in ANS and other crude oils. The full suite of PAH presented in Table 1 of this report should be included in future TAqH measurements. In addition, the current TAqH sampling is
28
conducted at a time selected by Alyeska. The effluent concentrations of oil may have been and continue to be much higher than average during non-routine events (e.g., when one or more tanks or cells are shutdown for maintenance, during high ballast water flow, or for some other reason that causes a reduced process retention time). Therefore, it is recommended that Alyeska define the minimum retention time and operational conditions for the 90’s tanks, the DAF system, and the biological treatment tanks in their Best Management Practices Plan, and that a water quality sample should be collected for total recoverable oil and grease (and TAqH and BTEX in the case of the biological treatment system) from the effluent of the particular treatment process on any day where the standard range of operating conditions are not able to be provided. In addition, another sample for oil and grease should be collected from the overall BWTF effluent following one of these non-routine events. The additional sampling during non-routine events will help to demonstrate that the BWTF operates in an environmentally responsible manner on a consistent basis.
18. Consideration should be given by EPA to establishing BWTF effluent limits on total recoverable oil and grease and TAqH. The BWTF effluent is frequently monitored for BTEX under the current permit conditions. However, although the BTEX concentration can be used as a rough guide to assess the effectiveness of removal of oil and PAHs, the aeration and biological treatment processes are much more effective at removal of BTEX compounds compared to oil and PAHs. Therefore, BTEX effluent data and permit limits do not necessarily insure that low levels of TROG and TAqH are also achieved. Alternatively, these permit limits might be better defined after several years of more consistent effluent monitoring by SIM GC/MS to establish a valid database on current discharge rates for these parameters. This would also allow inclusion of the alkylated-PAH components in future limits for TAqH.
19. The effluent limits on BTEX could also be decreased to below current levels. These new or lowered limits should not pose an undue burden to Alyeska considering that under normal operation, the BWTF is able to achieve low levels for these parameters in the effluent.
29
References Alyeska Pipeline Service Company. 1998. Best Management Practices Plan Ballast Water Treatment Facility. May 31, 1998. Alyeska 2001. Alyeska Pipeline Service Company, Application for an NPDES Certification and Mixing Zones, Valdez Marine Terminal, NPDES Permit AK-002324-8 Renewal. Submitted to Pete McGee, Alaska Dept of Environmental Conservation. 189 pp. American Water Works Association. 1991. Ozone in Water Treatment, Application and Engineering. AWWA Research Foundation. Anderson, J.W. 2000a. Effluent Toxicity Testing Results for February, 2000. Prepared by Columbia Analytical Services for Alyeska Pipeline Service Company. Anderson, J.W. 2000b. Ballast Water Treatment Facility Effluent Toxicity Testing Results for April, 2000. Prepared by Columbia Analytical Services for Alyeska Pipeline Service Company. Anderson, J.W. 2000c. Ballast Water Treatment Facility Effluent Toxicity Testing Results for July, 2000. Prepared by Columbia Analytical Services for Alyeska Pipeline Service Company. Anderson, J.W. 2000d. Ballast Water Treatment Facility Effluent Toxicity Testing Results for a Supplemental Sample Taken on August 15, 2000. Prepared by Columbia Analytical Services for Alyeska Pipeline Service Company. Anderson, J.W. 2000e. Ballast Water Treatment Facility Effluent Toxicity Testing Results for October 13, 2000. Prepared by Columbia Analytical Services for Alyeska Pipeline Service Company. Anderson, J.W. 2001a. Effluent Toxicity Testing Results for January, 2001. Prepared by Columbia Analytical Services for Alyeska Pipeline Service Company. Anderson, J.W. 2001b. Effluent Toxicity Testing Results for April, 2001. Prepared by Columbia Analytical Services for Alyeska Pipeline Service Company. Colonell, J.M. 1980. Port Valdez, Alaska: Environmental Studies, 1976-1979. Occasional Publication No. 5. Institute of Marine Science, University of Alaska, Fairbanks, AK. 373 pp. Distel, D. L. 1998. Evolution of chemoautotrophic endosymbioses in bivalves. BioScience 48(4):277-286.
30
Eckenfelder, Wesley W. Jr. 2000. Industrial Water Pollution Control. McGraw-Hill Companies, Inc. EPA 1994. Short-Term Methods for Estimating the Chronic Toxicity of Effluents and Receiving Waters to Marine and Estuarine Organisms. Second Edition. EPA/600/4-91/003. EPA 1995. Short-Term Methods for Estimating the Chronic Toxicity of Effluents and Receiving Waters to West Coast Marine and Estuarine Organisms. First Edition. EPA/600/R-95-136. EPA 1996. Fact Sheet and Technical Evaluation for NPDES Permit AK-0023244-8. Environmental Protection Agency, Seattle, WA. 59 pp. Feder, H.M. and D.G. Shaw 1996. Environmental Studies in Port Valdez, Alaska: 1995. Final Report to Alyeska Pipeline Co., Inst. Of Marine Science, Univ Alaska Fairbanks, 304 pp. Feder, H.M. and D.G. Shaw 1997. Environmental Studies in Port Valdez, Alaska: 1996. Final Report to Alyeska Pipeline Co., Inst. Of Marine Science, Univ Alaska Fairbanks, 267 pp. Feder, H.M. and D.G. Shaw 2000. Environmental Studies in Port Valdez, Alaska: 1999. Final Report to Alyeska Pipeline Co., Inst. Of Marine Science, Univ Alaska Fairbanks, 194 pp. Feder, H.M., D.G. Shaw and A.L. Blanchard 2001. Environmental Studies in Port Valdez, Alaska: 2000. Final Report to Alyeska Pipeline Co., Inst. Of Marine Science, Univ. Alaska Fairbanks, 331 pp. Fisher, C. R. 1990. Chemoautotrophic and methanotrophic symbioses in marine invertebrates. Review in Aquatic Sciences 2:399-436. French-McCay, D.P. (2002, in review). Development and application of an oil toxicity and exposure model, OILTOXX. Submitted to Environmental Toxicology and Chemistry. French-McCay, D.P. (2001). Development and application of an oil toxicity and exposure model, OILTOXX. Final Report to NOAA DAC. Silver Spring, MD. 47 pp plus appendices. Hickman, C. S. 1994. The genus Parvilucina in the eastern Pacific: Making evolutionary sense of a chemosymbiotic species complex. Veliger 37(1):43-61. Kuznetzov, A P; A V. Gebruk. 1991. Bacterial symbiotrophy and structure of the respiration-feeding system in Axinopsida orbiculata (Thyasiridae, Bivalvia) from the Craternaya Bay (Kurile Islands). Okeanologiya 31(1):162-169.
31
Lees, D.C., D. Erikson, W. Driskell, and D. Boettcher. 1979. Intertidal and shallow subtidal habitats of Port Valdez. Appendix 11. In: City of Valdez Port Expansion Project Environment Assessment. Dames & Moore. Prepared for City of Valdez. 43 pp., 8 appendices. Mohr, Kirby S. 2000. An Overview of US and International Regulations Regarding Hydrocarbons in Water Effluents. WEF and Purdue University Industrial Wastes Technical Conference. May 2000, Water Environment Federation. Muench, R.D. and D.L. Nebert. 1973. Physical Oceanography. Pages 103-149 in: D.W. Hood, W.E. Shields, and E.J. Kelley (eds.). Environmental Studies of Port Valdez. Institute of Marine Sciences, University of Alaska, Fairbanks. Payne, J.R. and G.D. McNabb, Jr. 1984. Weathering of petroleum in the marine environment, Marine Technology Society Journal, 18(3) 24-42 (1984). Payne, J.R., B.E. Kirstein, G.D. McNabb, Jr., J.L. Lambach, R. Redding, R.E. Jordan, W. Hom, C. de Oliveira, G.S. Smith, D.M. Baxter, and R. Geagel. 1984. Multivariate analysis of petroleum weathering in the marine environment - subarctic. Volume I, Technical Results; Volume II, Appendices. In: Final Reports of Principal Investigators, Vol. 21 and 22. February 1984, U.S. Department of Commerce, National Oceanic and Atmospheric Administration, Ocean Assessment Division, Juneau, Alaska. 690 pp. Payne, J.R., W.B. Driskell, and D.C. Lees. 1998. Long Term Environmental Monitoring Program Data Analysis of Hydrocarbons in Intertidal Mussels and Marine Sediments, 1993-1996. Final Report prepared for the Prince William Sound Regional Citizens Advisory Council, Anchorage, Alaska 99501. (PWS RCAC Contract No. 611.98.1). March 16, 1998. 97 pp plus appendices. Payne, J.R., W.B. Driskell, M.G. Barron, D.C. Lees. 2001. Assessing transport and exposure pathways and potential petroleum toxicity to marine resources in Port Valdez, Alaska. Final Report Prepared for Prince William Sound Regional Citizens' Advisory Council Contract No. 956.02.1. Prepared by Payne Environmental Consultants, Inc., Encinitas, CA. December 21, 2001. 64 pp plus appendices. Salazar, M., J.W. Short, S.M. Salazar, and J.R. Payne. 2002. Port Valdez Monitoring Report. Prince William Sound Regional Citizens' Advisory Council Contract No. 633.01.1. February 7, 2002. 109 pp plus appendices. Sauer, T. and P. Boehm. 1991. The use of defensible analytical chemical measurements for oil spill natural resource damage assessment. Proceedings of the 1991 Oil Spill Conference, American Petroleum Institute, Washington, D.C., pp 363-369 (1991).
32
Shaw D.G., H.M. Feder, D.J. McIntosh and A.L. Blanchard 2000. Supplemental Environmental Studies in Port Valdez, Alaska 1999. Final Report to Alyeska Pipeline Co., Inst. Of Marine Science, Univ Alaska Fairbanks, 69 pp. Shaw D.G., H.M. Feder, A.L. Blanchard and D.J. McIntosh 2001. Supplemental Environmental Studies in Port Valdez, Alaska 1999. Final Report to Alyeska Pipeline Co., Inst. Of Marine Science, Univ Alaska Fairbanks, 54 pp. Short, J.W., T.J. Jackson, M.L. Larsen, and T.L. Wade. 1996. Analytical methods used for the analysis of hydrocarbons in crude oil, tissues, sediments, and seawater collected for the Natural Resources Damage Assessment of the Exxon Valdez oil spill. American Fisheries Society Symposium 18:140-148 (1996). Slack-Smith, S M. 1994. Axinopsida serricata (Carpenter, 1864), its burrowing behavior and the functional anatomy of its pallial organs (Mollusca:Thyasiridae). Veliger 37(1):30-35. U.S. Army Corps of Engineers. 2001. Engineering and Design, Adsorption Design Guide. March 2001. Department of the U.S. Army. Woodward-Clyde Consultants 1987. Ballast Water Treatment facility Effluent Plume Behavior, A Synthesis of Findings. Prepared for Alyeska Pipeline Service Company. March 1987.