evaluation of montgomery county s safe speed program
TRANSCRIPT
EVALUATION OF MONTGOMERY COUNTY S SAFE SPEED PROGRAM
OFFICE OF LEGISLATIVE OVERSIGHT REPORT NUMBER 2010-3
September 29, 2009
Richard Romer Aron Trombka Sarah Downie

EVALUATION OF MONTGOMERY COUNTY S SAFE SPEED PROGRAM
OFFICE OF LEGISLATIVE OVERSIGHT REPORT 2010-3 SEPTEMBER 29, 2009
i
SPEED CAMERA OVERVIEW
Speed cameras detect the speed of motor vehicles using radar or laser, and photograph vehicles exceeding a preset speed enforcement threshold. The primary objective of a speed camera program is to improve public safety by reducing the frequency and severity of collisions. The National Highway Traffic Safety Administration reports that higher vehicle speeds are associated with increased risks of collision and more severe pedestrian injuries.
Speed camera programs tend to engender both support and complaints from the community. Commonly cited objections to speed cameras include privacy and due process concerns, and the perception that the goal of a speed camera program is to raise revenue rather than increase public safety.
Montgomery County is among 48 jurisdictions and the District of Columbia that have implemented speed camera programs. A public opinion survey conducted this year by the Insurance Institute of Highway Safety (IIHS) found that 70% of the Montgomery County drivers surveyed agreed that speeding was a problem on residential streets. In addition, 64% supported the use of speed cameras on residential streets, an increase from the 58% who had supported speed cameras before the County launched its program.
THE COUNTY S SAFE SPEED PROGRAM
Montgomery County began implementing the Safe Speed program shortly after State authorizing legislation took effect in February 2006. The current program uses speed cameras to photograph vehicles traveling 11 or more miles per hour above the speed limit on selected residential streets or school zones with a maximum speed limit of 35 miles per hour.
The County s Safe Speed program uses a combination of fixed speed cameras and mobile speed camera vans. At the start of the program in May 2007, the Police Department (MCPD) deployed mobile speed cameras to 18 enforcement sites in the County. The first fixed speed cameras were installed in September 2007. At present, the Safe Speed program operates at 60 fixed and 59 mobile enforcement sites.
The County implemented the Safe Speed program in compliance with the State law s requirements. Specifically, as mandated by State law, MCPD:
Sets cameras to photograph the rear of vehicles traveling at least ten miles per hour above the speed limit in streets with a maximum speed limit of 35 miles per hour.
Calibrates and tests speed cameras before operators begin detecting violations.
Issues a $40 speed camera fine (a non-moving violation that is not reported to insurance providers).
Allows a person issued a citation to contest the violation in District Court.
The County hired a vendor to purchase, install, and maintain the speed camera equipment, process citations and payments, and conduct certain outreach and customer service functions. The County pays the contractor $16.25 for each paid citation. The Office of the Attorney General has ruled that the terms of the County s contract comply with State law.
The County s public awareness campaign informed residents of the Safe Speed program. The County s ongoing speed camera public awareness campaign includes: press releases; Photo Enforced warning signs; a website listing the location of enforcement zones; a customer service telephone line; and warning citations at the beginning of the program. In addition, MCPD convened a Citizens Advisory Board for Traffic Issues to provide public input on in the speed camera site selection process. A 2009 survey conducted by IIHS found that 74% of County drivers know about the speed camera program.

ii
MUNICIPAL SPEED CAMERA PROGRAMS
Rockville, Gaithersburg, Chevy Chase Village, and Takoma Park operate speed camera programs under the State law that authorizes the County s Safe Speed program. The municipalities operate both fixed and mobile speed cameras with a combined total of 93 enforcement locations. Under current memoranda of understanding (MOU), the County processes citations from municipal speed cameras at no charge to the municipalities. In July 2009, County staff initiated discussions to renegotiate the terms of these agreements to include a reasonable administrative fee paid to the County.
SAFE SPEED PROGRAM FINANCES
Safe Speed program revenue has increased annually. In FY08, the first full year of the program, County speed cameras generated $12.5 million in revenue; in FY09, the revenue increased to $18.6 million. The approved FY10 budget includes estimated program revenue of $29.4 million. The annual increases in program revenue correlate with the addition of new speed camera enforcement sites.
Contract costs are the largest component of the Safe Speed budget. The FY10 Safe Speed program budget is $13.2 million. Vendor costs account for 84% of budgeted expenditures; personnel costs account for 15% of the budget and fund one uniform position (1.0 WY) and 33 civilian (29.8 WY) positions.
Net revenues fund public safety expenditures. In the FY10 approved budget, Safe Speed program revenues are estimated to exceed program costs by $13 million. The budgeted uses of these net revenues include: funding police officers in schools and district stations ($4.8 million); support of fire and rescue operations ($2.9 million); and pedestrian safety initiatives ($1.5 million).
SPEED CAMERAS AND DRIVER BEHAVIOR
Few drivers repeatedly pass speed cameras at excessive speeds. Two-thirds of the more than half a million vehicles identified on speed camera citations between May 2007 and June 2009 received only one citation during that period. Only 2% of vehicles received more than five citations during this time. These data suggest that for most drivers, the $40 fine effectively deters future speeding in speed camera enforcement locations.
Citations generated by speed cameras drop precipitously within the first year. At all fixed speed camera sites, the number of citations issued per month decreased sharply within one year after activation. On average, the number of citations generated by speed cameras decreased by 78% from the first full month of operation compared to the same month a year later.
A substantial number of speed camera citations are for vehicles traveling at the enforcement threshold. Since the program started, MCPD calibrated its speed cameras to generate citations for vehicles traveling 11 or more miles per hour above the speed limit. To date, 32% of citations have been for vehicles measured at exactly 11 miles per hour above the speed limit.
Speeding occurs at all hours. A large portion of speed camera citations result from speeding that occurs during weekend and overnight hours. Nearly half of all citations generated by school zone speed cameras are for violations on Saturdays, Sundays, and weekdays between 8 pm and 6 am.
Average Percent Change in Speed Camera Citations/Month
-55%-60%
-72%-77% -78%
-40%
-100%
-80%
-60%
-40%
-20%
0%
20%
40%
1 2 3 4 5 6 7 8 9 10 11 12Month After Activation
Baseline (first full month of camera operation)

ROADWAY SAFETY
iii
SPEED CAMERAS AND ROADWAY SAFETY
Vehicle speeds decreased near speed camera sites. After one year of automated enforcement, the speed of vehicles passing camera sites declined by an average of 6%. At 40 miles per hour, a decline of 6% equates to a 2.4 miles per hour reduction in average vehicle speed.
After one year of automated enforcement, the percent of vehicles exceeding the speed limit when passing camera sites was cut in half. During the first full month after camera activation, 25% of vehicles passed fixed speed camera sites traveling above the speed limit with 2% of vehicles passing at 11 or more miles per hour above the speed limit. One year later, the percent of vehicles traveling above the speed limit decreased to 13% with less than 1% of vehicles speeding at 11 or more mph above the speed limit.
Vehicle Speeds Passing Fixed Speed Camera Sites: First and Thirteenth Full Months after Camera Activation
Percent of Vehicles Passing Camera Site:
First Month After Activation
Thirteenth Month After Activation
At or Below Speed Limit 73% 87%
1 to 10 MPH Above Speed Limit 25% 13%
11+ MPH Above Speed Limit 2% <1%
Reported collisions near speed camera sites decreased after camera activation. An annual average of 462 reported collisions occurred within one half mile of camera sites during the four years preceding activation of the speed cameras. During the year following camera activation, a total of 329 reported collisions occurred near the same locations, a 28% decline from the annual rate before camera activation.
Percent Reduction in Annual Reported Collisions near Speed Camera Sites
Number of Collisions
Type of Collision Before Camera Activation
(Four-Year Average)
After Camera Activation (One Year)
Percent Change (Before vs. After)
Property Damage Only 252 203 -19%
Injury or Fatality 206 126 -39%
All Reported Collisions 458 329 -28%
In the vicinity of speed cameras, the annual number of reported collisions that involved an injury or fatality declined by 39% after camera activation. In contrast, reported collisions involving property damage only dropped by 19% after the activation of speed cameras. The higher rate of decline for injury/fatality collisions suggests that reduced speeds may have a greater effect on the severity of collisions than on the prevalence of collisions.
Rear-end Collisions. A common concern raised about speed cameras is that they cause drivers to brake suddenly before passing a camera site, which then results in rear-end collisions. However, the data show an opposite outcome. Compared to the average for the previous four years, rear-end collisions occurring with one half mile of speed camera sites decreased by 18% in the year after speed camera activation.
Collisions involving pedestrians/bicyclists. While the overall rate of collisions declined in the first year following activation of speed cameras, collisions involving pedestrians and bicycles did not experience a parallel decrease.

iv
NEW STATE LAW
On October 1, 2009, a new State law will go into effect. The 2009 State law includes three provisions that will have a notable impact on the County s Safe Speed program. Specifically, the new State law:
Limits the operation of school zone speed cameras from 6 a.m. to 8 p.m. on weekdays.
Restricts enforcement to vehicles exceeding the posted speed limit by at least 12 miles per hour.
Requires the Council authorize each new speed camera installed in the County after October 1, 2009.
OLO RECOMMENDATIONS FOR COUNCIL ACTION
OLO s recommendations for Council action are aimed at refining and further improving the County s speed camera program.
1. Ensure that public outreach and community involvement remain core aspects of the program. The County should continue public outreach/involvement in the speed camera program to include:
Ongoing outreach to inform residents of the purpose of the program and the location of cameras;
Increased visibility of speed limit and speed camera warning signs;
Continued consultation with advisory bodies about the locations of new enforcement zones; and
Ongoing assessment of roadway design to assure that speed limits in speed camera enforcement zones are properly established.
2. Require that revenue and expenditure data related to the Safe Speed program are readily accessible to the public on the County s website and in annual budget documents. At present, County residents cannot easily access information about the cost of the Safe Speed program; the revenues generated by speed cameras; or how the County spends net program revenues.
3 Request that the Executive revise its agreements with municipalities to recover the County s full cost for collecting and processing speed camera fees, fines, and penalties. Currently, the County processes fines, fees, and penalties from municipal speed camera citations at no charge. This summer, the County has started the process of renegotiating the terms of these agreements.
4. Provide policy guidance on operational and public outreach issues resulting from the new State limit on school zone speed camera operating hours. When the new State law takes effect, the County will have different hours of operation for cameras in residential districts (which are not affected by the time limitations) than for cameras located in school zones. The Council should consider the trade-off between: public confusion that might come from a program that lacks uniform hours; and the safety consequences of limiting all speed camera hours to those in the school zones.
5. Request that the Executive monitor driving speeds and collision rates to determine whether the restricted speed camera hours affect roadway safety. Nearly half of all citations generated by school zone speed cameras were for violations that occurred during weekend and overnight hours. The new State law s restriction on school zone camera operating hours could result in increased vehicle speeds and collisions in these areas.
6. Ask that the Executive adjust revenue projections to account for changes in State law. Two changes in State law the restriction on school zone speed cameras hours of operation and increase in the enforcement threshold to 12 miles per hour above the speed limit -- could result in fewer citations and a potential loss of up to $5 million in what had been budgeted as General Fund revenue in FY10.
The 2006 State law mandates that the County Council report to the General Assembly on the effectiveness of speed monitoring systems in Montgomery County by December 31, 2009. To fulfill
this responsibility, OLO recommends the Council direct staff to prepare a memorandum report from the Council to the General Assembly that summarizes the major findings of this OLO evaluation.

Evaluation of Montgomery County s Safe Speed Program
OLO Report 2010-3 September 29, 2009 1
CHAPTER I: AUTHORITY, SCOPE, AND ORGANIZATION OF REPORT
A. Authority
As detailed below, State Law requires that the County Council report to the General Assembly on the effectiveness of the speed camera programs in Montgomery County. The County Council delegated the responsibility for conducting the State-mandated report to the Office of Legislative Oversight through Council Resolution 16-1047, Fiscal Year 2010 Work Program of the Office of Legislative Oversight, adopted July 21, 2009.
B. Purpose and Scope of Report
In January 2006, the Maryland General Assembly enacted legislation authorizing the use of automated speed monitoring systems (speed cameras) in Montgomery County.1 The law required that by December 31, 2009, the Montgomery County Council must report back to the General Assembly on the effectiveness of speed monitoring systems in Montgomery County. 2
In anticipation of this reporting requirement, the Council assigned the Office of Legislative Oversight (OLO) the task of completing an evaluation of the County s Safe Speed program. In September 2008, the Council approved OLO s recommended scope and methodology for the study (OLO Memorandum Report 2008-7, Planning for the FY10 Evaluation of the County s Safe Speed Program).
This evaluation was designed to assist the Council with its oversight of the County s Safe Speed program; and to provide the information needed for the Council s required report to the General Assembly. The study includes:
An overview of automated speed enforcement programs in general and in other jurisdictions;
An overview of the County s Safe Speed program and summary descriptions of the municipal speed camera programs operating in Montgomery County;
An evaluation of the administration of the Safe Speed program, including compliance with the requirements outlined in State law; and
An analysis of data on citations, vehicle speeds, and collisions along road segments with speed cameras.
Finally, the report describes the 2009 amendments to the authorizing legislation and how these changes will impact the operation of the speed camera programs in Montgomery County.
1 Maryland Department of Legislative Services. 2006 Chapters
2005 Overridden Vetoed Legislation. http://mlis.state.md.us/2006RS/misc/effectivedates/2006_misc.pdf
2 Section 5, Chapter 15, 2006 Laws of Maryland.

Evaluation of Montgomery County s Safe Speed Program
OLO Report 2010-3 September 29, 2009 2
C. Organization of Report
Chapter II, Overview of Automated Speed Enforcement, provides an overview of automated speed enforcement, including a summary of the research on its effectiveness in reducing vehicle speeds, automobile collisions, and speed-related injuries and fatalities.
Chapter III, Speed Cameras in Other Jurisdictions, describes the use of speed camera programs in other jurisdictions.
Chapter IV, State Law Authorizing Speed Cameras in Montgomery County, provides an overview of the State law that authorizes the use of automated speed monitoring systems in the County, and reviews the 2009 State law authorizing the statewide use of speed cameras in school zones and highway work zones.
Chapter V, Montgomery County s Safe Speed Program, reviews the administration and operation of the County s Safe Speed program, including compliance with the requirements outlined in the State law.
Chapter VI, Safe Speed Program Budget, examines the County s Safe Speed program s operating budget and revenues.
Chapter VII, Municipal Speed Camera Programs in the County, provides an overview of the municipal speed camera programs in the County.
Chapter VIII, Speed Cameras, Driver Behavior, and Roadway Safety, presents an analysis of data on citations, vehicle speeds, and collisions along road segments with speed cameras.
Chapter IX, Public Opinion Regarding Speed Cameras, summarizes findings of public opinion surveys designed to measure driver attitudes about automated speed enforcement.
Chapters X and XI presents the Office of Legislative Oversight s Findings and Recommendations.
Chapter XII, Agency Comments, contains the Chief Administrative Officer s comments on the final draft of this report.
D. Methodology
Office of Legislative Oversight (OLO) staff members Richard Romer, Aron Trombka, and Sarah Downie conducted this study. OLO gathered information through document reviews, data analysis, site visits, and interviews with staff from the Montgomery County Police Department (MCPD), Office of Management and Budget, Chevy Chase Village, the City of Gaithersburg, the City of Rockville, and the City of Takoma Park. OLO also met with representatives from the Insurance Institute for Highway Safety and Affiliated Computer Services, Inc. (County s speed camera vendor). OLO conducted its analysis based on information and data collected by the County Government and Affiliated Computer Services, Inc.

Evaluation of Montgomery County s Safe Speed Program
OLO Report 2010-3 September 29, 2009 3
E. Acknowledgements
OLO received a high level of cooperation from everyone involved in this study. OLO appreciates the significant contributions of time, information, and insights from all who participated in this project. In particular, OLO thanks the following individuals who provided invaluable input and information:
Alice Afifi, MCPD
Joseph Beach, Office of Management and Budget
Biodun Ayo-Durojaiye, MCPD
Geoffrey Biddle, Chevy Chevy Village
Lynn Board, City of Gaithersburg
Kathleen Boucher, Assistant Chief Administrative Officer
Lieutenant Tom Campbell, City of Gaithersburg
Christina Cassarella, City of Rockville
Captain John Damskey, MCPD
Assistant Chief of Police Betsy Davis, MCPD
Captain Thomas Didone, MCPD
Jeff Dunckel, Department of Transportation
Alex Espinosa, Office of Management and Budget
William German, MCPD
Police Chief Roy Gordon, Chevy Chevy Village
Dory Hackey, MCPD
Richard Harrison, MCPD
Angel Jones, City of Gaithersburg
Police Chief John King, City of Gaithersburg
Chong Lee, MCPD
Ti Lor, MCPD
Barbara Matthews, City of Takoma Park
Maurice Nelson, MCPD
Alessandro Nuzzo, MCPD
Roselle Paquette, Department of Transportation.
Ed Piesen, Office of Management and Budget
Tom Pogue, Department of Transportation
Captain Robert Rappoport, City of Rockville
Police Chief Ronald Ricucci, City of Takoma Park
Alexandria Shabelski, Office of Management and Budget
Neil Shorb, MCPD

Evaluation of Montgomery County s Safe Speed Program
OLO Report 2010-3 September 29, 2009 4
Arnold Silverman, MCPD
Lieutenant Ron Smith, MCPD
William Snoddy, Office of the County Attorney
Sheila Sprague, Office of Intergovernmental Relations,
Police Chief Terry Treschuk, City of Rockville
Joseph Venuto, MCPD
In addition, OLO acknowledges the valuable information and assistance provided by Richard Retting from Sam Schwartz Engineering; Stephen Oesch and Russ Rader from the Insurance Institute for Highway Safety; and Daniel Seid and Debbie Walker from Affiliated Computer Services State and Local Solutions, Inc.
OLO would also like to thank the members of the Citizens Advisory Board for Transportation Issues and the Pedestrian and Traffic Safety Advisory Committee.

Evaluation of Montgomery County s Safe Speed Program
OLO Report 2010-3 5 September 29, 2009
CHAPTER II: OVERVIEW OF AUTOMATED SPEED ENFORCEMENT
This chapter provides an overview of the use of automated speed enforcement (speed cameras) as a means to reduce vehicle speeds, collisions, and speed-related injuries and fatalities.
Section A presents research findings on the relationship between vehicle speeds and safety;
Section B provides an overview of automated speed enforcement; and
Section C presents research on the effectiveness of speed cameras.
A. Vehicle Speeds and Safety
This section presents the published research findings on the relationship between vehicle speeds and safety.
1. Driver Attitudes Towards Speeding
A 2002 nationwide survey of 4,000 drivers age 16 or older conducted by the federal National Highway Traffic Safety Administration (NHTSA) found that:
73% of respondents reported driving at speeds higher than the posted limits on local and neighborhood streets during the past month;
On average, respondents felt seven to eight miles per hour over the speed limit is usually allowed on roads; and
Over half of respondents (54-75%) felt that police should only ticket drivers traveling faster than ten miles per hour over the speed limit on roads with speed limits of 40 miles per hour or more.
However, while most respondents admitted to speeding, over three-quarters agreed with the view that it is at least somewhat important to reduce speeding on all road types, and about two-thirds (68%) agreed that speeding by others is a major threat to themselves and their family.1
2. Affect of Speed on Vehicle Collisions and Fatalities
Speeding affects both the probability and the severity of injuries in a collision. According to NHTSA, speeding is one of the most prevalent factors contributing to traffic collisions, injuries, and fatalities because it:
Reduces a driver s ability to steer safely around curves or objects in the roadway;
Extends the distance necessary to stop a vehicle; and
Increases the distance a vehicle travels while the driver reacts to a dangerous situation.2
1 National Highway Traffic Safety Administration. National Survey of Speeding and Unsafe Driving Attitudes and Behavior: 2002. Department of Transportation. 2002.
Evaluation of Montgomery County s Safe Speed Program
OLO Report 2010-3 6 September 29, 2009
National Data. NHTSA reports that during 2007, speeding was a contributing factor in 31% of all fatal collisions in the United States.3 Of the 13,040 speed-related fatalities in 2007, approximately 88% occurred on roads that were not interstate highways, and approximately 23% were on roads with speed limits of 35 miles per hour or less. NHTSA estimates the total economic cost of speed-related collisions is about $40 billion each year.4
Maryland Data. In Maryland, data on speed-related traffic fatalities closely mirror the national picture. In 2007, speeding was a contributing factor in 35% of the 614 total fatal traffic collisions. Of the 216 speed-related traffic fatalities in 2007, approximately 88% occurred on roads that were not interstate highways, and approximately 37% were on roads with speed limits of 35 miles per hour or less.5
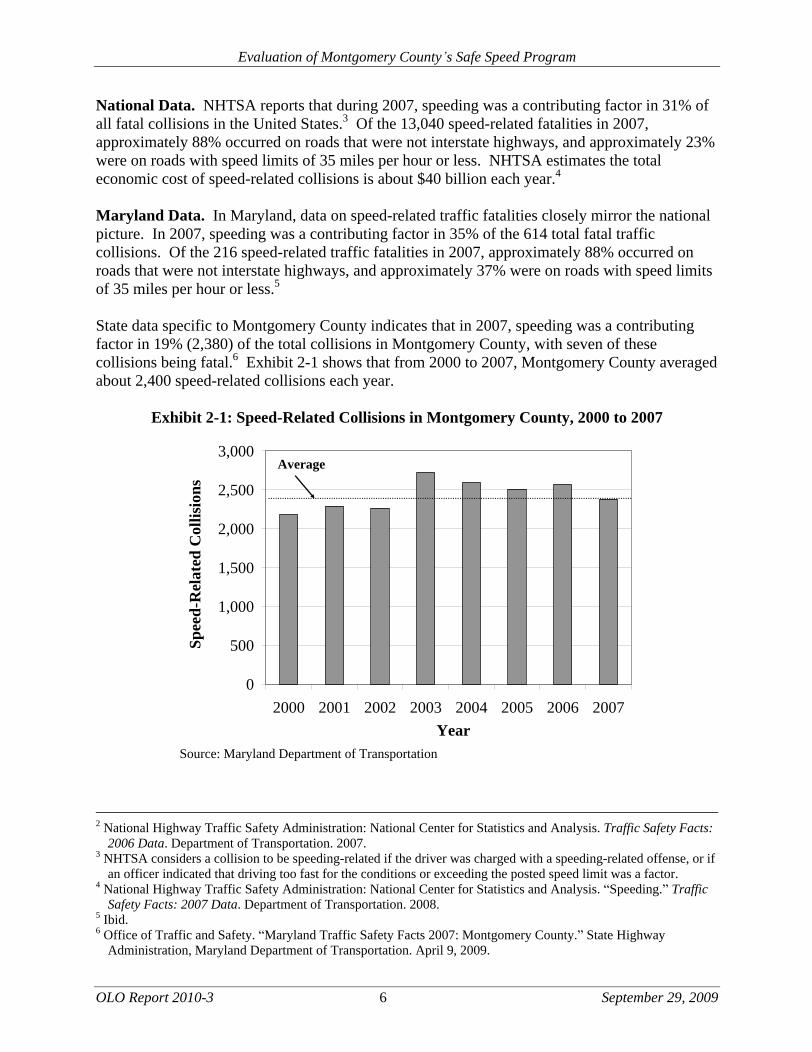
State data specific to Montgomery County indicates that in 2007, speeding was a contributing factor in 19% (2,380) of the total collisions in Montgomery County, with seven of these collisions being fatal.6 Exhibit 2-1 shows that from 2000 to 2007, Montgomery County averaged about 2,400 speed-related collisions each year.
Exhibit 2-1: Speed-Related Collisions in Montgomery County, 2000 to 2007
0
500
1,000
1,500
2,000
2,500
3,000
2000 2001 2002 2003 2004 2005 2006 2007
Year
Spee
d-R
elat
ed C
ollis
ions
Average
Source: Maryland Department of Transportation
2 National Highway Traffic Safety Administration: National Center for Statistics and Analysis. Traffic Safety Facts: 2006 Data. Department of Transportation. 2007.
3 NHTSA considers a collision to be speeding-related if the driver was charged with a speeding-related offense, or if an officer indicated that driving too fast for the conditions or exceeding the posted speed limit was a factor.
4 National Highway Traffic Safety Administration: National Center for Statistics and Analysis. Speeding. Traffic Safety Facts: 2007 Data. Department of Transportation. 2008.
5 Ibid. 6 Office of Traffic and Safety. Maryland Traffic Safety Facts 2007: Montgomery County. State Highway
Administration, Maryland Department of Transportation. April 9, 2009.

Evaluation of Montgomery County s Safe Speed Program
OLO Report 2010-3 7 September 29, 2009
3. Speeding and Pedestrian Injuries/Fatalities
In addition to increasing the risk of automobile collisions, speeding also contributes to more pedestrian injuries and fatalities. The Insurance Institute for Highway Safety (IIHS) reports that the risk of death for a pedestrian struck by a vehicle increases as vehicle speeds increase. For example, the risk of death for a pedestrian struck by a vehicle traveling at 20 mph is 5%; the risk of death increases to about 80% for a vehicle traveling at 40 mph.7
National Data. In 2007, pedestrian fatalities accounted for 85% of all non-occupant speed-related fatalities in the United States.8 According to NHTSA, lower vehicle speeds decrease both the likelihood of a collision, and the severity of injuries in cases that involve a pedestrian collision.9
A NHTSA study found that during 2007, pedestrians comprised about 70,000 or 3% of the speed-related injuries, and 4,654 or 11% of speed-related fatalities nationwide. Most pedestrian fatalities occurred in urban areas (72%), at non-intersection locations (77%), in normal weather conditions (90%), and at night (67%). In addition, almost half (48%) of all pedestrian fatalities occurred on Friday, Saturday, or Sunday.10
Maryland Data. In 2007, pedestrians comprised 116 or 19% of Maryland s 614 total traffic fatalities.11 Approximately 70% of all pedestrian collisions in the State were on roads with a posted speed limit of 35 miles per hour or less, and two-thirds of fatal pedestrian collisions occurred at night. In addition, over one half (52%) of all pedestrian fatalities occurred on Friday, Saturday, or Sunday 12
B. Automated Speed Enforcement
Across the country, local governments use education, engineering, and enforcement strategies to reduce vehicle speeds, automobile collisions, and speed-related injuries and fatalities:
Education strategies inform the public of the dangers of excessive speed and/or the likely presence of police enforcement;
Engineering strategies involve designing, altering, and/or marking roadways and intersections to encourage or require drivers to reduce their speeds; and
7 Insurance Institute for Highway Safety. Fatality Facts 2007: Pedestrians. Arlington, VA. 2008. http://www.iihs.org/research/fatality_facts_2007/pedestrians.html.
8 The NHTSA defines non-occupants as persons not riding in motorized vehicles, such as pedestrians, bicyclists, etc. 9 National Highway Traffic Safety Administration. Literature Review on Vehicle Travel Speeds and Pedestrian
Injuries. U.S. Department of Transportation. October 1999. 10 National Highway Traffic Safety Administration: National Center for Statistics and Analysis. Pedestrians.
Traffic Safety Facts: 2007 Data. Department of Transportation. 2008. 11 National Highway Traffic Safety Administration: National Center for Statistics and Analysis. State Traffic
Data. Traffic Safety Facts: 2007 Data. Department of Transportation. 2008. 12 Office of Traffic and Safety. Maryland Traffic Safety Facts 2007: Pedestrians. State Highway Administration,
Maryland Department of Transportation. April 16, 2009.

Evaluation of Montgomery County s Safe Speed Program
OLO Report 2010-3 8 September 29, 2009
Enforcement strategies focus on policing roadways and issuing warnings and/or citations to motorists that violate traffic laws.13
According to NHTSA, jurisdictions should use a combination of all three strategies to address the specific speed-related safety problems of the community.14
Automated enforcement is the use of camera technology to enforce traffic laws, such as red light cameras or speed cameras. Red light cameras, the most common form of automated enforcement implemented in the United States, detect and photograph vehicles that commit red light traffic violations. According to IIHS, about 430 communities in the United States use red light cameras (as of June 2009).15
Automated speed enforcement is the use of camera technology to detect the speed of motor vehicles and photograph vehicles exceeding a preset speed enforcement threshold with no immediate human interaction or traffic stop. The photograph provides evidence of the vehicle make, model, and license tag number; is stamped with information, such as the date, time, location, and speed; and is mailed with a citation to the owner or driver of the vehicle. The photograph provides evidence of the vehicle make, model, and registration plate; is stamped with information, such as the date, time, location, and speed; and is mailed to the owner of the vehicle.
There are two forms of speed monitoring systems: mobile and fixed. Both consist of speed detection and camera systems, but vary in their method of deployment.
Mobile speed cameras are speed detection and camera systems transported by or equipped to a vehicle, and often staffed by an on-site operator. Mobile speed cameras allow the operator to deter speeding in multiple locations by rotating the camera among various enforcement locations.
Fixed speed cameras are speed detection and camera systems installed at a single location without the need for on-site personnel. Fixed speed cameras have a constant, but site-specific deterrent effect on speeding because of their permanent presence.16
According to IIHS, over the last 20 years about 50 jurisdictions in 11 states and the District of Columbia have implemented speed camera programs.17 Chapter III provides a summary of other jurisdictions using speed cameras in the United States.
The rest of this section reviews the commonly cited goals and objections to the use of speed camera programs.
13 National Highway Traffic Safety Administration. Literature Review on Vehicle Travel Speeds and Pedestrian Injuries. U. S. Department of Transportation. October 1999.
14 National Highway Traffic Safety Administration. Speed Enforcement Program Guidelines. U.S. Department of Transportation. March 2008.
15 Insurance Institute for Highway Safety. Communities Using Red Light and/or Speed Cameras. June 2009. 16 National Highway Traffic Safety Administration. Speed Enforcement Camera Systems Operational Guidelines.
U.S. Department of Transportation. March 2008. 17 Insurance Institute for Highway Safety. Automated Enforcement Laws. June 2009.
http://www.iihs.org/research/topics/auto_enforce_list.html

Evaluation of Montgomery County s Safe Speed Program
OLO Report 2010-3 9 September 29, 2009
1. Commonly Cited Goals of Speed Camera Programs
The primary objective of a speed camera program is to deter speeding and thereby improve public safety. In addition, communities implement speed cameras programs to provide safer and more consistent speed enforcement, and to relieve the burden on limited police resources.
To deter speeding. A recently completed study by the Governors Highway Safety Association concluded that speed cameras capability to detect and record multiple violations per minute acts as a strong deterrent to speeding and an incentive to change driver behavior.18
The Transportation Research Board of the National Academy of Sciences found that the traditional, non-automated approach to speed enforcement produces only a short-lived deterrent effect on speeding. Maintaining deterrence requires a level of enforcement intensity and expense that is difficult to sustain because of competing law enforcement priorities and limited resources.19 Speed cameras automatically photograph violations of all vehicles exceeding a preset speed threshold.
By publicizing the presence of speed cameras and deterring vehicles from exceeding the speed limit in high-risk areas, speed cameras can help prevent speed-related collisions and injuries. According to a 2004 World Report on Road Traffic Injury Prevention, issued by the World Health Organization, an analysis of several countries
experiences found that speed cameras reduced serious traffic injuries and deaths by 14%, whereas traditional enforcement by police officers achieved a 6% reduction.20
To provide safer and consistent speed enforcement. Speed cameras are a method of enforcing speed limit laws in areas where the roads are not conducive to traditional traffic enforcement. In locations with high risk roadway design, such as roads with narrow lanes or school zones, traffic stops may be infeasible or even dangerous. Speed cameras can consistently photograph all violators, operating continuously in these locations without risk to police officers or an increase in congestion caused by driver distraction from a traffic stop.21
To relieve the burden on limited police resources. A 2005 Governors Highway Safety Association survey of its member jurisdictions found that many police departments struggle to routinely enforce speed limits because of uncertainty in highway safety funding, as well as being asked to perform more tasks, such as homeland security functions. Speed cameras allow law enforcement officials to efficiently enforce traffic laws while continuing to devote time to other concerns.22 In addition, speed camera programs are typically funded by the revenue generated from citations, which means the programs often do not compete for public safety resources.
18 Governors Highway Safety Association. Speed and Red Light Cameras. 2009. http://www.ghsa.org/html/issues/redlight_autoenforce.html
19 Transportation Research Board. Managing Speed: Review of Current Practice for Setting and Enforcing Speed Limits. National Academy Press. 1998.
20 World Health Organization. World Report on Road Traffic Injury Prevention: Summary. 2004. http://www.who.int/violence_injury_prevention/publications/road_traffic/world_report/summary_en_rev.pdf
21 National Highway Traffic Safety Administration. Speed Enforcement Camera Systems Operational Guidelines. U.S. Department of Transportation. March 2008.
22 Ibid.

Evaluation of Montgomery County s Safe Speed Program
OLO Report 2010-3 10 September 29, 2009
2. Commonly Cited Objections to Speed Cameras
This section summarizes the commonly cited objections to speed camera programs, which include that the technology infringes upon individual civil liberties and the perception that the purpose of a speed camera program is to raise revenue rather than increase safety.
Speed cameras invade personal privacy. A common objection to speed cameras is that the technology invades personal privacy, especially when photos are taken of a vehicle s driver. Even though courts have ruled that photographing license plates and individuals in motor vehicles on public roads is constitutional, privacy concerns can generate public opposition.23 According to a 1998 study by the Transportation Research Board, one approach to addressing privacy concerns is to photograph only the rear of vehicles in violation.24
Speed cameras do not provide for due process. Traditional speed enforcement involves a law enforcement officer who identifies that a traffic violation occurred, intercepts the violator, and immediately issues a notice of violation. Since speed camera programs photograph vehicles exceeding a preset speed threshold and mail a citation to the owner or driver, some opponents claim this technology violates one s right to due process. Opponents argue that the citations are a trial by camera, automatically presuming that the driver committed the offense, and that the process inhibits the right to confront the witness of the accused violator.25
While no court that has reviewed an automated enforcement case has ruled that using the technology violates any provision of the U.S. Constitution, several courts have required some jurisdictions to make operational or administrative changes to protect civil protections spelled out in state or local law (see pages 18-19).26
Speed cameras are deployed to make money. Speed cameras have the potential to raise a significant amount of revenue through the collection of fines. Some opponents claim that the principal motivation for speed camera programs is for governments to generate revenue. A 2005 study of speed camera programs in the Journal of Public Health Policy concluded that the primary controversy over speed cameras is related to whether the goal of speed camera programs is to generate revenue or to increase safety.27
23 Kendall, S. Is Automated Enforcement Constitutional? Insurance Institute for Highway Safety, May 2004. 24 Glauz, William. Review of Automated Technologies for Speed Management and Enforcement. Transportation
Research Board. Midwest Research Institute. Managing Speed: Review of Current Practice for Setting and Enforcing Speed Limits. National Academy Press. 1998.
25 National Highway Traffic Safety Administration. Speed Enforcement Camera Systems Operational Guidelines. U.S. Department of Transportation. March 2008.
26 Delaney, Amanda, Heather Ward and Max Cameron. The History and Development of Speed Camera Use. Monash University. September 2005.
27 Delaney, Amanda, Heather Ward, Max Cameron, and Allan Williams. Controversies and Speed Cameras: Lessons Learnt Internationally. Journal of Public Health Policy. Vol. 26, No. 4. 2005.

Evaluation of Montgomery County s Safe Speed Program
OLO Report 2010-3 11 September 29, 2009
This revenue objection can become increasingly prevalent in communities where speed cameras are perceived to be covertly placed, or are located on roadways that are perceived as being safe to speed. Controversy surrounding the location of speed cameras includes:
The use of speed cameras on major arteries or downhill slopes;
Little or no warning of the presence of a speed camera;
Locations with low volumes of traffic and no history of speed-related collisions; and
Locations where the speed limit is set too low or the speed limit changes suddenly.
According to a 2006 Texas A&M University study of speed camera programs, using speed cameras under these conditions generates public skepticism about the motive for their use. 28
Speeding is not a problem. Some drivers believe there is a weak connection between speed limits and public safety. The Journal of Public Health Policy study found, based on experiences from around the world, that speed cameras are viewed as controversial where speeding is not perceived as a safety problem, and where moderate speeding is not necessarily associated with an increased risk of collisions.29 Further, some opponents disagree with the premise that speeding is dangerous, believing instead that other factors are to be blamed in vehicle collisions, and that speed limits often are set arbitrarily.30
Attention to cameras leads to unsafe driving. Some opponents claim that speed cameras may lower speeds, but at the expense of safe driving. For example, a driver approaching a speed camera may focus extra attention to the speedometer and less attention to the road ahead. Further, opponents claim that this may lead to an increase in rear-end collisions when drivers suddenly slow down as they approach a speed camera.31
C. Research on the Effectiveness of Speed Cameras
Research studies that evaluate automated enforcement programs typically track changes in driver speed and collision rates as measures of program effectiveness.
1. National Highway Traffic Safety Administration Study
Based on a review of about 90 studies of speed camera programs from 16 different countries, NHTSA selected the 13 highest quality empirical studies and analyzed the findings. Table 2-1 on the next page lists the studies selected by NHTSA.
28 Willis, David. An Effectiveness and Policy Review. Center for Transportation Safety. Texas A&M University. May 2006.
29 Delaney, Amanda, Heather Ward, Max Cameron, and Allan Williams. Controversies and Speed Cameras: Lessons Learnt Internationally. Journal of Public Health Policy. Vol. 26, No. 4. 2005.
30 Turner, Shawn and Amy Polk. Overview in Automated Enforcement in Transportation. ITE Journal. June 1998. 31 Smith, Paul. Speed Cameras: The Case Against. June 2004.
http://www.bbc.co.uk/radio4/today/reports/pdf/camera_smith.pdf

Evaluation of Montgomery County s Safe Speed Program
OLO Report 2010-3 12 September 29, 2009
In sum, NHTSA reported that all 13 studies found significant reductions in estimated collisions following the implementation of speed camera programs. Specifically, the implementation of speed camera programs was associated with a 20-25% reported reduction in collisions resulting in injuries at fixed camera sites; and more variable (21-51%) reported reductions in collisions for mobile enforcement programs. While the studies did not indicate that there was evidence of sudden braking when vehicles approached speed cameras, there was a measured shifting of traffic to other routes.32
Table 2-1: Studies of Speed Camera Programs Analyzed by NHTSA in 2007
Location of Intervention Study Year
Type of Deployment
New South Wales, Australia 2005 Fixed Charlotte, North Carolina, USA 2005 Mobile Friesland Province, the Netherlands 2005 Mobile United Kingdom 2004 Fixed and Mobile Cambridgeshire, United Kingdom 2004 Fixed Great Britain, United Kingdom 2004 Fixed South Wales, United Kingdom 2003 Mobile Queensland, Australia 2003 Mobile British Columbia, Canada 2002 Mobile British Columbia, Canada 2000 Mobile Christchurch, New Zealand 2000 Mobile Norway 1997 Fixed Victoria, Australia 1992 Mobile
Source: National Highway Traffic Safety Administration
2. Case Studies on the Impact of Speed Cameras
Case studies on the impact of speed cameras on driver behavior evidence reductions in speed, collisions, and injuries on roadways targeted for automated enforcement. Table 2-2 (on the next page) summarizes the key outcomes of six studies of speed camera programs in the United States. The major findings include:
Use of speed cameras reduced average vehicle speed. All six studies that evaluated whether the use of speed cameras affected vehicle speed documented a reduction of average vehicle speed in the enforcement zones. The percent reduction in average vehicle speed ranged from 2-14%.
Use of speed cameras reduced number of vehicles exceeding the speed limit. All four studies that evaluated whether the use of speed cameras affected the number of vehicles exceeding the speed limit documented a reduction in enforcement zones. The data showed a 27-82% reduction in vehicles exceeding the speed limit by more than 10 miles per hour.
32 Decina, Lawrence, Libby Thomas, Raghavan Srinivasan, and Loren Staplin. National Highway Traffic Safety Administration. Automated Enforcement: A Compendium of Worldwide Evaluations of Results. September 2007.

Evaluation of Montgomery County s Safe Speed Program
OLO Report 2010-3 13 September 29, 2009
Use of speed cameras reduced total number of collisions. The two studies that evaluated whether the use of speed cameras affected the number/percent of collisions found an overall reduction in the number of collisions. However, the Arizona State University (ASU) study of Scottsdale s highway speed cameras also showed a 33% increase in rear-end collisions.
Table 2-2: Key Findings of United States Speed Camera Case Studies
Study Completed Year Key Findings
Residential Streets and School Zones
Portland, OR33 1997
Reduction of 9% in average speeds of vehicles
Reduction of 27% of vehicles exceeding the posted speed limit by more than 10 miles per hour
Beaverton, OR34 1997
Reduction of 2% in average speeds
Average speeds on the streets with photo radar were 5% lower than on streets without photo radar after two weeks
Streets and Highways
Washington, DC35 2002
Reduction of 14% in average speeds
Reduction of 82% in the proportion of drivers traveling more than 10 miles per hour above the speed limit
Charlotte, NC36 2005
Reduction of 55% in the percentage of vehicles exceeding the speed limit by 10 miles per hour
Reduction of 12% in total collisions on the enforced roadways
Highways
Scottsdale, AZ37
(IIHS Study) 2008
Reduction of 7 miles per hour in average speed
Reduction in the percent of drivers exceeding the speed limit by 11 mph or more (76 mph+) during the enforcement period
Reductions in average speeds 25 miles away in Glendale, Arizona
Scottsdale, AZ38
(ASU Study) 2007
Reduction in total number and severity of collisions
Increase of 33% in rear-end collisions
33 Cities of Beaverton and Portland. Photo Radar: Demonstration Project Evaluation, Beaverton and Portland, OR. 1997.
34 Ibid. 35 Retting, Richard and Charles Farmer. Evaluation of Speed Camera Enforcement in the District of Columbia.
Insurance Institute for Highway Safety. November 12, 2002. 36 Cunningham, Christopher, Joseph Hummer and Jae-Pil Moon. An Evaluation of the Safety Affects of Speed
Enforcement Cameras in Charlotte, NC. North Carolina State University. October 2005. 37 Retting, Richard, Sergey Kyrychenko, and Anne McCartt. Evaluation of Automated Speed Enforcement on Loop
101 Freeway in Scottsdale, Arizona. Insurance Institute for Highway Safety. January 2008. 38 Washington, Simon, Kangwon Shin and Ida Van Shalkwyk. Evaluation of the City of Scottsdale Loop 101 Photo
Enforcement Demonstration Program. Arizona State University. January 11, 2007.

Evaluation of Montgomery County s Safe Speed Program
OLO Report 2010-3 September 29, 2009 14
CHAPTER III: SPEED CAMERAS IN OTHER JURISDICTIONS
This chapter describes the use of speed camera programs in other jurisdictions.
Section A lists countries and United States jurisdictions identified by the Insurance Institute for Highway Safety as using some form of speed camera program; and
Section B identifies a number of jurisdictions that have altered or discontinued speed camera programs.
A. Jurisdictions with Speed Camera Programs
Automated speed enforcement (speed camera) technology has been used around the world to supplement traditional speed enforcement in countries for the last 30 years, including: Australia; Canada; Germany; Great Britain; Norway; and Sweden.1
Table 3-1 (on the next page) lists comparative information on speed camera programs in the United States. According to the Insurance Institute for Highway Safety (IIHS), as of June 2009, 48 jurisdictions in 11 states and the District of Columbia currently use speed cameras.2 The Town of Paradise Valley, Arizona began its program in 1987 and is the oldest program in the United States. Most speed camera programs were started during the past decade.3
Although state laws usually regulate local speed camera programs, most jurisdictions have some degree of local autonomy in implementing these programs. As a result, there is substantial diversity in the way that speed camera programs operate in the United States.4 A review of the jurisdictions identified shows these variations in implementation include:
Speed camera enforcement locations;
Type of photograph taken and person responsible for the citation; and
The level of penalty, including fines and points on the driving record.
1 Transportation Research Board. Managing Speed: Review of Current Practice for Setting and Enforcing Speed Limits. National Academy Press. 1998.
2 Insurance Institute for Highway Safety, June 2009. http://www.iihs.org/research/topics/auto_enforce_list.html 3 OLO contacted staff from jurisdictions that have implemented speed camera programs based on a list of
jurisdictions identified by IIHS. Since the number of jurisdictions with speed camera programs changes over time, OLO compiled up-to-date information based on staff interviews and website data, as of June 2009.
4 National Highway Traffic Safety Administration. Speed Enforcement Camera Systems Operational Guidelines. U.S. Department of Transportation. March 2008.

Evaluation of Montgomery County s Safe Speed Program
OLO Report 2010-3 September 29, 2009 15
Table 3-1: Jurisdictions with Speed Camera Programs, June 2009
State Jurisdiction Date Began
Photograph Taken of Driver?
Responsible for Citation
Fine Points?
State of Arizona 2008 Yes Driver $165+ No*
City of Chandler 2007 Yes Driver $210+ Yes
City of El Mirage 2009 Yes Driver Begins Aug. 2009 No
City of Mesa 1996 Yes Driver $176-$504 Yes
Town of Paradise Valley 1987 Yes Owner $205-$400+ Yes
City of Phoenix 2004 Yes Driver $171-$249+ Yes
Pima County 2009 Yes Owner $216-$389 Yes
Town of Prescott Valley 2006 Yes Driver $190-$470 Yes
City of Scottsdale 1997 Yes Driver $145-$210 Yes
Town of Star Valley 2008 Yes Driver $187-$555 Yes
City of Tempe 2007 Yes Driver $180 Yes
Arizona
City of Tucson 2007 Yes Driver $191-$366 Yes
City of Boulder 1998 Yes Driver $40 No
City & County of Denver 1998 Yes Driver $40 or $80 No Colorado
City of Fort Collins 1996 Yes Driver $40 No
District of Columbia 2001 No Owner $50-$200 No
Illinois Statewide (work zones) 2005 Yes Driver $375-$1,000 Yes
Iowa City of Davenport 2006 No Owner $65-$150 No
City of Gretna 2008 No Owner $120-$300 No
City of Lafayette 2007 Yes Owner $25-$150 No
City of New Orleans 2008 No Owner $115-$240 No
City of Westwego 2009 No Owner $40-$500 No
Louisiana
City of Zachary 2009 No Owner $40-$300 No
Maryland Montgomery County 2006 No Owner $40 No City of Albuquerque 2004 No Owner $75 No
New Mexico City of Las Cruces 2008 No Owner $100 No
City of Akron 2005 No Owner $100 No
City of East Cleveland 2006 No Owner $95 No
City of Northwood 2005 No Owner $105-$145 No
City of Parma 2009 No Owner $100-$200 No
City of Toledo 2004 No Owner $120 No
Ohio
City of West Carrollton 2008 No Owner $100 No
Statewide** 2009 Yes Owner $127+ No
City of Beaverton 1996 Yes Owner $125-$242 Yes***
City of Medford 2002 Yes Owner $145-$427 Yes*** Oregon
City of Portland 1996 Yes Owner $97-$427 Yes*** *An Arizona law passed in July 2009 allows the state to issue points for commercial driver s license holders. ** The Oregon State program is a pilot that began recently on a state highway in Portland and is being conducted by the Portland Police Bureau. ***Oregon does not have a point system, but the speed camera citation does go on the violator s driving record.

Evaluation of Montgomery County s Safe Speed Program
OLO Report 2010-3 September 29, 2009 16
Table 3-1: Jurisdictions with Speed Camera Programs, June 2009 (cont.)
State Jurisdiction Date Began
Photograph Taken of Driver?
Responsible for Citation
Fine Points?
City of Chattanooga 2006 No Owner $50 No
City of Jackson 2009 No Owner $50 No
Town of Jonesborough 2009 No Owner $89 No
City of Morristown 2009 No Owner $50 No
Town of Mount Carmel 2008 No Owner $75 No
City of Oak Ridge 2009 No Owner $50 No
City of Red Bank 2008 No Owner $50 No
Tennessee
City of Selmer 2008 Yes Owner $139 No Statewide (work zones)****
2008 No Owner $137 No
City of Issaquah 2009 No Owner $124 No
City of Moses Lake 2008 No Owner $112-$250 No Washington
City of Tacoma 2007 No Owner $101 No ****The Washington State program was a pilot program that ended June 30, 2009. Source: Insurance Institute for Highway Safety; state, county, and municipal interviews and/or websites
1. Speed Camera Enforcement Locations
Many jurisdictions are subject to state or local legislation that limits where speed cameras can be located. For example, some places are only allowed to deploy speed cameras in school zones and/or on residential streets with speed limits of 30-50 miles per hour.5 For example, the State of Washington only allows speed cameras in school zones.6 However, some jurisdictions are authorized to use speed cameras on roads with higher speeds. For example:
The District of Columbia deploys fixed and mobile speed cameras on residential streets, major arteries, and highways;7 and
Illinois, Washington, and Oregon use speed cameras in state highway work zones.
In several states (e.g., Arizona, Colorado, Oregon, and Tennessee), a jurisdiction must post signs in the vicinity of the speed cameras that indicate to drivers that they are entering a speed camera enforcement location.
5 Rodier, Caroline, Susan Shaheen, and Ellen Cavanagh. Automated Speed Enforcement in the US: A Review of the Literature on Benefits and Barriers to Implementation. Transportation Research Board. July 2007.
6 Revised Code of Washington § 46.63.170(1)(a) 7 Metropolitan Police Department. Automated Speed Enforcement. District of Columbia website.

Evaluation of Montgomery County s Safe Speed Program
OLO Report 2010-3 September 29, 2009 17
2. Type of Photograph and Person Responsible for the Citation
Jurisdictions differ in terms of the direction of the speed camera photographs (rear or front of vehicle), as well as who is responsible for the speed camera citation, when a motor vehicle exceeds the posted speed limit.
In about half of the jurisdictions, speed cameras take a photograph of the rear of the vehicle and the license plate, and the citation is issued to the registered owner of the vehicle. Most of these jurisdictions allow the owner to identify a different driver and transfer the liability for the citation if the owner was not the driver at the time of the violation, making the driver responsible for paying the citation.
In the remaining jurisdictions, speed cameras photograph the front of the vehicle and the license plate. In most of these cases, the jurisdiction still issues the citation to the registered owner of the vehicle, but the photograph can be used to transfer or remove responsibility from the owner to the driver of the vehicle. For example:
The City of Boulder, Colorado issues citations to the registered owner of the vehicle, but the registered owner can contest it based on the photograph. If the photograph confirms that the owner was not driving the vehicle, the owner may disclose the identity of the driver to transfer the liability for the citation, but is not required to do so.8
The City of Tucson, Arizona considers a citation valid only if the speed camera photograph clearly matches the driver s license photo of the registered owner. Tucson also uses the photograph to cite the driver for additional violations along with the speeding violation (e.g., not wearing a seat belt or driving with a suspended license).
Although taking a photograph of the front of the vehicle allows for more accurate identification of the actual driver committing the violation, privacy concerns among the public regarding frontal photos can generate public opposition to speed camera programs (see page 10).
3. Level of Penalty
Jurisdictions vary in the level of penalty associated with a speed camera citation.
Fixed vs. graduated fines. The level of the penalty for a speed camera citation varies by jurisdiction. Just over half of the jurisdictions use a graduated system of fines that increase with the number of miles per hour in excess of the posted speed limit, which can reach to over $500. A few jurisdictions, such as Morristown and Mount Carmel, Tennessee, raise the fine if a person contests the ticket in court and loses. As shown in Table 3-1 (pages 15-16), Montgomery County is among the jurisdictions that issue a flat fine for a citation.
8 Colorado Revised Statutes § 42-4-110.5(2)(e)

Evaluation of Montgomery County s Safe Speed Program
OLO Report 2010-3 September 29, 2009 18
Recorded on driving record. Jurisdictions also differ on whether the speed camera citation is reflected on a person s driving record, as well as whether points are issued. Most speed camera programs treat a speeding violation as a non-moving civil infraction, similar to a parking ticket. However, some jurisdictions such as Oregon require that speed camera violations be recorded on the violator s driving record, similar to any other speed violation.9
4. Other Variations in Speed Camera Programs
Other notable variations in how jurisdictions have implemented speed camera programs include:
Number of miles per hour over the speed limit
The threshold speed at which jurisdictions issue citations ranges from five to 12 miles per hour over the speed limit.10
Contractor involvement
All of the jurisdictions identified in Table 3-1 contract with a vendor to install and maintain the speed camera equipment. Jurisdictions differ, however, in the extent to which operational functions of the program are contracted out, such as staffing mobile speed cameras, authorizing citations, and processing fines.
Contractor payment Jurisdictions also differ in how they pay the contractor. Some jurisdictions pay the contractor a percentage of the fine revenue; others pay a flat fee. Washington11 and Colorado12, for example, do not allow jurisdictions to reimburse the contractor based on a portion of fines generated, requiring instead that compensation be based on the value of the equipment or services provided.
B. Altered or Discontinued Speed Camera Programs
During the course of conducting research on speed camera programs, OLO identified a number of jurisdictions that have either altered or discontinued their speed camera programs.
1. Altered Speed Camera Programs
When the City of West Carrollton, Ohio began its program in 2008, a person appealing a speed camera citation was not required to pay the citation in advance of the hearing. However, City officials noticed that many people were not appearing at hearings, and were requesting hearings just to allow themselves more time to pay the ticket. The City now requires citation recipients requesting a hearing to pay the citation in advance. If the citation recipient is found not guilty, the City reimburses the fine.
9 Oregon Revised Statutes § 810.439. 10 Through interviews with jurisdictions, OLO found that some jurisdictions choose not to share the threshold speed
for a speed camera citation with the public. 11 Revised Code of Washington § 46.63.170(1)(g) 12 Colorado Revised Statutes § 42-4-110.5(5)
Evaluation of Montgomery County s Safe Speed Program
OLO Report 2010-3 September 29, 2009 19
The City of San Jose, California s Neighborhood Automated Speed Compliance Program (NASCOP) began in 1996. In 2000, the California Vehicle Code was amended to clarify that the use of speed cameras was not authorized. In response to court cases filed by recipients of citations, NASCOP changed to a warning-only system in March 2007.13
2. Discontinued Speed Camera Programs
Several jurisdictions have discontinued the use of speed camera enforcement. In April 2009, the City of Sulphur, Louisiana ended its speed camera program after 86% of residents voted in a special election to repeal the ordinance that authorized speed cameras.14 The City of Steubenville, Ohio repealed the ordinance authorizing the speed camera program in December 2006.15 The State of Hawaii repealed its pilot speed camera program, which began in 1998, following intense public opposition in spring 2002.16
In March 1997, residents in the City of Anchorage, Alaska voted to amend the City Charter to require police officers to issue traffic citations, which effectively banned the City s speed camera program.17 Further, in October 1997, the Alaska Court of Appeals affirmed a district court s ruling that the speed camera system was unreliable and inadmissible.18
OLO found one jurisdiction that suspended its program due to a court decision. The City of Charlotte, North Carolina began its Safe Speed program in 2004. In May 2006, the City suspended its program to limit the financial liability of a North Carolina Court of Appeals ruling.19 The Court of Appeals ruled that Article IX, Section 7 of the North Carolina Constitution requires jurisdictions to pay photo enforcement fines to the public school system.20
OLO found two jurisdictions that suspended their speed camera program because they were deemed unsuccessful. In July 2009, Livingston Parish, Louisiana suspended the speed camera program. According to staff from the Sheriff s Office, this suspension followed several incidents that fueled public opposition, including the program mistakenly mailing out citations with fines rather than warnings during the 30-day warning period. In January 2009, the Pinal County (Arizona) Board of Supervisors voted to discontinue the program at the recommendation of the County s newly-elected Sheriff. The Sheriff said that the mobile speed cameras did not generate significant revenue beyond covering the cost of the program and that motor vehicle collisions increased during the program period.21
13 Helmer, James Modification to the Photo Radar Speed Enforcement Program. City of San Jose. Feb. 27, 2007. 14 Speed vehicle voted out. Southwest Daily News. April 5, 2009.
http://www.sulphurdailynews.com/homepage/x180626032/Speed-vehicle-voted-out 15 Codified Ordinances of the City of Steubenville, Ohio. January 1, 2009.
http://www.cityofsteubenville.us/PDFs/CODIFIED.pdf 16 Motorists Slam Traffic Cam Program. KITV Honolulu, Hawaii. January 25, 2002. 17 Municipality of Anchorage Alaska. Anchorage Municipal Charter, Code, and Regulations. Article XXI. Motor
Vehicle Code Enforcement Standards. 18 Court of Appeals of Alaska. Municipality of Anchorage v. Clyde Baxley, October 16, 1997. 19 City of Charlotte. City Suspends SafeLight & SafeSpeed. May 31, 2006. 20 North Carolina Court of Appeals. Shavitz v. City of High Point. May 16, 2006.
http://www.aoc.state.nc.us/www/public/coa/opinions/2006/pdf/050571-1.pdf 21 Collom, Lindsey. Pinal County shelves speed-camera program. The Arizona Republic. January 22, 2009.

Evaluation of Montgomery County s Safe Speed Program
OLO Report 2010-3 September 29, 2009 20
CHAPTER IV: STATE LAW AUTHORIZING SPEED CAMERAS IN MONTGOMERY COUNTY
This chapter provides an overview of the State law that authorizes the use of automated speed monitoring systems in Montgomery County. It is organized as follows:
Section A provides a brief legislative history of the State speed camera laws; and
Section B provides an overview of the differences between the 2006 and 2009 State speed camera laws.
A. Legislative History
This section provides a brief legislative history of the State speed camera laws. In 2006, a law went into affect authorizing speed cameras only in Montgomery County. Earlier this year, the General Assembly approved, and the Governor signed, legislation to authorize the limited use of speed cameras throughout the State beginning on October 1, 2009.
Copies of the 2006 and 2009 State speed camera laws appear in Appendix A and B, respectively.
1. 2006 State Law
During the 2005 session of the Maryland General Assembly, the Montgomery County Delegation1 introduced legislation (House Bill 443) to authorize automated speed monitoring systems in Montgomery County. The General Assembly approved House Bill 443 in April 2005.
In May of 2005, Governor Ehrlich vetoed House Bill 443. In a letter informing the General Assembly of the veto, Governor Ehrlich explained that he objected to the law because it:
Allows a jurisdiction to charge, try, and convict an individual solely through the use of a photograph of a vehicle;
Classifies speeding as a civil instead of a criminal offense;
Represents a movement towards the pervasive use of cameras by the government to monitor and regulate the conduct of its people;
Applies to "residential areas" that include four- and six-lane highways;
Is a revenue raising measure motivated purely by monetary concerns;
Would negatively impact the District Court s workload; and
Authorizes the use of automated speed monitoring without complete evidence of its safety benefits.2
1 House Bill 443 was originally introduced by Delegates William Bronrott and Jennie M. Forehand. 2 Ehrlich, Robert L, Jr. Governor s Veto Message. May 20, 2005.
http://mlis.state.md.us/2005rs/veto_letters/hb0443.htm

Evaluation of Montgomery County s Safe Speed Program
OLO Report 2010-3 September 29, 2009 21
The General Assembly overrode the Governor s veto when it reconvened for its 2006 session. The law authorizing the use of speed cameras in Montgomery County went into effect in February 2006. Table 4-1 summarizes the time line for enactment of the authorizing legislation.
Table 4-1: Time Line for Enactment of State Law Authorizing the Use of Speed Monitoring Systems in Montgomery County
Event Date
House Bill 443 introduced February 2005
General Assembly passes House Bill 443 April 8, 2005
Governor Ehrlich vetoes HB 443 May 20, 2005
General Assembly overrides the 2005 gubernatorial veto; bill becomes law as Chapter 15 of the 2006 laws of Maryland
January 25, 2006
Law takes effect3 February 24, 2006
Source: Maryland Department of Legislative Services
2. 2009 State Law
During the 2009 session of the Maryland General Assembly, the State Senate, at the request of Governor O Malley, introduced Senate Bill 277 to authorize the statewide use of speed cameras in school zones and highway work zones.4 The General Assembly approved Senate Bill 277 in April 2009.5 The Governor signed Senate Bill 277 into law as Chapter 500 of the 2009 Laws of Maryland in May 2009. The law has an effective date of October 1, 2009. Table 4-2 summarizes the timeline for enactment of the 2009 State speed camera legislation.
Table 4-2: Time Line for Enactment of State Law Authorizing the Statewide Use of Speed Monitoring Systems in School Zones and Highway Work Zones
Event Date
Senate Bill 277 introduced January 2009
Senate Bill 277 passed by Maryland General Assembly April 2009
Governor signs Senate Bill 277 into law as Chapter 500 of the 2009 Laws of Maryland
May 19, 2009
Law takes effect October 1, 2009
Source: Maryland Department of Legislative Services
3 Maryland Department of Legislative Services. 2006 Chapters
2005 Overridden Vetoed Legislation. http://mlis.state.md.us/2006RS/misc/effectivedates/2006_misc.pdf
4 The sponsors of Senate Bill 277 included Senate President Thomas V. Mike Miller, Jr., and Senators James N. Robey, Jennie M. Forehand, Katherine A. Klausmeier, and Douglas J.J. Peters. 5 The General Assembly introduced two similar bills (House Bill 364 and Senate Bill 269) during the 2008 session,
but both failed to pass.

Evaluation of Montgomery County s Safe Speed Program
OLO Report 2010-3 September 29, 2009 22
B. Overview of the State Speed Camera Laws
This section provides an overview of the 2006 and 2009 State speed camera laws. Table 4-3 summarizes the major differences between the 2006 and 2009 State speed camera laws.
Table 4-3: Major Differences between the 2006 and 2009 State Speed Camera Laws
2006 Law 2009 Law
Authority to use speed cameras
Montgomery County only Statewide
Location of speed cameras
School zones; and
Residential districts
School zones;
Residential districts; (Montgomery County only); and
Highway work zones
Hours of operation No restrictions School zone cameras restricted to 6 a.m. to 8 p.m., Monday - Friday
Violation threshold At least 10 mph over posted speed limit
At least 12 mph over posted speed limit
Local authorization None required
For each new camera:
Public hearing; and
Council ordinance or resolution
Use of Revenues
Limited to related public safety purposes ; and
May not supplant existing local expenditures for the same purpose
Limited to public safety purposes
The remainder of this chapter details the provisions of the 2006 and 2009 speed camera laws. In this section, provisions of the 2009 law that differ substantially from the 2006 law appear in italics. Appendix C contains an opinion from the Office of the County Attorney regarding the impact of the 2009 statewide speed camera law on the County s Safe Speed program.
Definition. Both the 2006 and 2009 State laws both define a speed monitoring system as a device with one or more sensors producing recorded images of motor vehicles. The recorded image is a photograph showing the rear of the motor vehicle, the license plate, and at least two time-stamped images of the vehicle passing a stationary object.6
Implementation authority. The 2006 State law authorized local police departments in Montgomery County to implement automated speed enforcement programs. The law defined a local police department as the County Police Department or any municipal police department
in the County.7
6 Annotated Code of Maryland, Transportation, § 21-809(a)(4). 7 Annotated Code of Maryland, Transportation, § 21-809(a)(2).

Evaluation of Montgomery County s Safe Speed Program
OLO Report 2010-3 September 29, 2009 23
The 2009 amendment to the State law authorizes any law enforcement agency of a local political subdivision in the State to implement and administer a speed camera program. Municipalities that do not have a police force may designate an agency to implement a speed camera program for them. A county may operate speed cameras in a municipality only if it receives the approval of the State Highway Administration and provides the municipality 60 days notice to choose to implement their own speed camera program.8
Location of speed cameras. The 2006 law allowed for the use of automated speed enforcement on roads in school zones or in residential districts with a maximum speed limit of 35 miles per hour or less.9 The Transportation Article of the State Code states that the State Highway Administration (SHA) or local jurisdiction may establish a school zone within a half-mile radius of any school. The SHA or local jurisdiction can establish a school zone by posting signs that designate the area as a school zone and indicate the maximum speed limit, and the times when the school zone speed limit is in effect.10
The Transportation Article of the State Code defines a residential district as an area that:
(1) Is not a business district; and
(2) Adjoins and includes a highway where the property along the highway, for a distance of at least 300 feet, is improved mainly with residences or residences and buildings used for business.11
The 2009 State law authorizes speed cameras in school zones but not in residential districts. However, the law allows speed cameras to continue to operate in residential districts in Montgomery County.12
The 2009 State law also authorizes the use of speed cameras in highway work zones. The law states that work zone speed cameras may only be operated in highway work zones with a speed limit of 45 miles per hour or greater. State law defines a work zone as a segment of highway:
(i) that is identified as a temporary traffic control zone by traffic control devices that are placed or installed in general conformance with the state manual and specifications adopted for a uniform system of traffic control devices; and
(ii) where highway construction, repair, maintenance, utility work, or a related activity, including the placement, installation, maintenance, or removal of a work zone traffic control device, is being performed regardless of whether workers are present.13
Hours of operation. The 2006 law did not limit speed camera hours of operation. The 2009 law limits the operation of school zone speed cameras from 6:00 a.m. to 8:00 p.m., Monday through Friday.14 The 2009 law does not limit hours of operation for work zone speed cameras or residential district speed cameras located in Montgomery County.
8 Annotated Code of Maryland, Transportation, § 21-809(a)(2). 9 Annotated Code of Maryland, Transportation, § 21-809(b)(1). 10 Annotated Code of Maryland, Transportation, § 21-803.1(a) to (c). 11 Annotated Code of Maryland, Transportation, § 21-101(s). 12 Annotated Code of Maryland, Transportation, § 21-809(b)(1)(iv). 13 Annotated Code of Maryland, Transportation, § 21-810(a)(6). 14 Annotated Code of Maryland, Transportation, § 21-809(b)(1)(vi).

Evaluation of Montgomery County s Safe Speed Program
OLO Report 2010-3 September 29, 2009 24
Violation threshold. The 2006 law allowed Montgomery County (and participating County municipalities) to photograph vehicles and issue citations for vehicles that exceeded the posted speed limit by at least ten miles per hour.15 The 2009 amendment to the State law restricts photographing vehicles and issuing citations to vehicles exceeding the posted speed limit by at least 12 miles per hour.16
Local authorization. The 2009 law requires that before implementing a new speed camera program, a jurisdiction must authorize the program through local law (ordinance or resolution) after reasonable notice and a public hearing.17 However, the law exempts speed cameras in Montgomery County installed before October 1, 2009 from the authorization and notice provisions of the law.18 According to the County Attorney, each individual speed camera installed in Montgomery County after October 1 will require local authorization and a public hearing.
Warning period. Under the 2009 law, a jurisdiction must provide for a 30-day warning period for violations from the first day a speed camera is put in place.19 However, the law exempts speed cameras in Montgomery County installed before October 1, 2009 from the warning period requirement.20 According to the County Attorney, new speed cameras activated in Montgomery County after October 1, 2009 also would not be subject to the warning period provision, since these cameras would not be the first in the County.
Publication of speed camera locations. The 2009 law requires that jurisdictions publish the location of fixed speed cameras on its website and in a newspaper, and place signs in school zones indicating that speed cameras are in use.21 According to the County Attorney, the provision would apply to new speed cameras activated in the County after October 1, 2009.
Violation enforcement. Both the 2006 and 2009 laws authorize a maximum fine of $40 for a speed camera citation.22 The citation is a civil penalty issued to the vehicle owner, and is treated as a non-moving violation (similar to a parking citation). The civil penalty is not recorded on the owner s driving record by the State Motor Vehicle Administration (MVA), no license points are assigned, and insurance providers are not notified.23 However, if the penalty is not contested or paid, the law authorizes the MVA to refuse to register, refuse to transfer the registration, or suspend the registration of the owner s vehicle.24
15 Annotated Code of Maryland, Transportation, § 21-809(a)(5). 16 Annotated Code of Maryland, Transportation, § 21-809(a)(5). 17 Annotated Code of Maryland, Transportation, § 21-809(b)(1). 18 Section 7, Chapter 500, 2009 Laws of Maryland (uncodified). 19 Annotated Code of Maryland, Transportation, § 21-809(b)(1). 20 Section 7, Chapter 500, 2009 Laws of Maryland (uncodified). 21 Annotated Code of Maryland, Transportation, § 21-809(b)(1). 22 Annotated Code of Maryland, Transportation, § 21-809(c)(2). 23 Annotated Code of Maryland, Transportation, §21-809(h). 24 Annotated Code of Maryland, Transportation, § 26-305(a).

Evaluation of Montgomery County s Safe Speed Program
OLO Report 2010-3 September 29, 2009 25
Speed camera operating requirements. Both the 2006 and 2009 laws include requirements for speed monitoring system operators. Operators must:
Complete training on the operation of a speed camera;
Fill out and sign a daily set-up log; and
Perform a manufacturer-specified speed camera self-test before taking any photographs.
Operators must also ensure that each speed camera undergoes an annual calibration check, as verified by an independent calibration laboratory. 25
Administration of citations. The 2006 and 2009 laws delegate administrative authority for citation issuance, payment processing, and appeals to the County and to local police departments in the County, in coordination with the Chief Judge of the District Court.26
By law, the County must mail the citation to the registered owner (or lessee of six months or more) of the motor vehicle.27 The law requires the County to mail citations to owners of vehicles registered in Maryland no later than 14 days after the alleged violation. The County must mail citations within 30 days to owners of vehicles registered in another state.28 The citation must include:
Name and address of the registered vehicle owner;
Registration number of the motor vehicle involved;
Location of the violation;
Date and time of the violation;
Copy of the recorded image of the violation (including two time-stamped images of the vehicle passing a stationary object and one image of the license plate);
Type of violation charged and the civil penalty imposed;
Date the civil penalty must be paid; and
Statements regarding the appeal process.29
The law states that a person who receives a citation may pay the citation directly to the County s Department of Finance or choose to stand trial in District Court.
The 2009 law adds a new requirement for administration of citations. Effective October 1, 2009, a law enforcement officer, employed by or under contract with an agency, must sign the citation stating that the vehicle is in violation of the law based upon his/her inspection.30
25 Annotated Code of Maryland, Transportation, § 21-809(b)(2) to (b)(4). 26 Annotated Code of Maryland, Transportation, § 21-809(i). 27 Annotated Code of Maryland, Transportation, § 21-809(a)(3). 28 Annotated Code of Maryland, Transportation, § 21-809(d)(4). 29 Annotated Code of Maryland, Transportation, § 21-809(d)(1). 30 Annotated Code of Maryland, Transportation, § 21-809(d)(1).

Evaluation of Montgomery County s Safe Speed Program
OLO Report 2010-3 September 29, 2009 26
Legal proceedings. The 2006 and 2009 laws include similar standards for alleged violators to challenge a speed camera citation. Both laws state that a person who receives a citation may pay the citation directly to the local jurisdiction or choose to stand trial in District Court.31 If an alleged violator chooses to stand trial in District Court, and wishes to have the operator of the speed camera present, he/she must notify the Court and the State at least 20 days before the trial. By law, the recorded image or photo from a speed monitoring system is admissible in court, along with the speed monitoring system operator s training certificate and the proof of the automated enforcement system s calibration.32
In defense, the alleged violator may file an affidavit with the District Court certifying that:
The vehicle was stolen before the violation occurred; or
He/she was not the driver of the vehicle at the time of the violation.
If the vehicle was stolen, the vehicle owner must provide a police report. If the person named in the citation was not the driver, the owner must provide evidence that he/she was not operating the vehicle at the time. Under the 2006 law, the owner also had to provide the name and address of the person who was driving the vehicle. The 2009 law does not require the owner to identify the individual who was driving the vehicle at the time of violation.
Under both the 2006 and 2009 laws, if the District Court finds the person named in the citation was not the driver or receives evidence identifying the driver at the time of the violation, the Clerk of the District Court must provide the local police department with any supporting evidence. Based upon evidence received, the local police department may then issue a citation to the driver of the vehicle no later than two weeks after notification from the Court.33
Restriction on the use of recorded images. The 2006 and 2009 laws both state that the County can only use the recorded images produced by speed cameras for the administration of the speed camera program. The law restricts the public inspection and/or disclosure of these images to:
Any person issued a speed camera citation, or his/her attorney; or
A law enforcement employee or agent in an investigation or proceeding relating to the speed camera program.34
However, State law also allows for the admissibility of images from speed cameras in any other judicial proceeding, as otherwise provided by law. 35
Revenues from uncontested citations. According to both the 2006 and 2009 laws, fines and late fees from uncontested citations are paid directly to the County. The 2006 law placed two restrictions on the use of revenues generated from speed cameras.
31 Annotated Code of Maryland, Transportation, § 21-809(d)(5). 32 Annotated Code of Maryland, State Government, § 10-311(b). 33 Annotated Code of Maryland, Transportation, § 21-809(e) to (f). 34 Annotated Code of Maryland, State Government, § 10-616(o). 35 Annotated Code of Maryland, State Government, § 10-311(c).

Evaluation of Montgomery County s Safe Speed Program
OLO Report 2010-3 September 29, 2009 27
1. The 2006 law stated that: [b]eginning in fiscal year 2006 and each fiscal year thereafter,
Montgomery County shall use the revenue generated from the enforcement of speed limit laws authorized under this Act to increase local expenditures for related public safety purposes, including pedestrian safety programs.
36 The 2009 law includes a similar
provision regarding the use of speed camera revenues but strikes the word related thereby limiting use of revenues to public safety purposes. 37
2. The 2006 law further restricted the use of speed camera revenues by requiring that: [r]elated public safety expenditures required under this section shall be used to
supplement and may not supplant existing local expenditures for the same purpose. 38 The above provision does not appear in the 2009 law.
The 2009 law includes a provision regarding the use of speed camera revenues that was not included in the 2006 law. Beginning in October, the State law will limit the amount of money a jurisdiction may retain from speed camera fines and fees as follows: If, after recovering the costs of implementing and administering the speed camera program, the balance of the revenue is greater than 10% of the total revenues of the political subdivision for the fiscal year, the jurisdiction must remit the funds in excess of 10% to the Comptroller.39 The law states that the Comptroller will place these funds in the State s General Fund.
Revenues from contested citations. Both the 2006 and the 2009 laws require that violators pay court-contested citation fees to the District Court. The District Court must remit all court-contested revenue to the Comptroller for distribution into transportation-related funds.40
Fees paid to contractor. Both the 2006 and 2009 laws state that if a contractor operates a speed camera, the contractor s fee may not be contingent on the number of citations issued or paid.41
Report to the General Assembly. Both the 2006 and 2009 speed camera laws include provisions mandating reports to the General Assembly. The 2006 State law required that the Montgomery County Council report to the General Assembly on or before December 31, 2009.42 The 2009 law requires that all jurisdictions operating speed cameras must report to the Governor and General Assembly by December 31, 2013 on the effectiveness of speed monitoring systems in the respective jurisdiction.43
36 Section 2, Chapter 15, 2006 Laws of Maryland (uncodified). 37 Annotated Code of Maryland, Courts and Judicial Proceedings, § 7-302(e)(4). 38 Section 2, Chapter 15, 2006 Laws of Maryland (uncodified). 39 Annotated Code of Maryland, Courts and Judicial Proceedings, § 7-302(e)(4)(ii). 40 Annotated Code of Maryland, Courts and Judicial Proceedings, § 7-302(e)(2) to (e)(3). 41 Annotated Code of Maryland, Transportation, § 21-809(j). 42 Section 5, Chapter 15, 2006 Laws of Maryland (uncodified). 43 Section 6, Chapter 500, 2009 Laws of Maryland (uncodified).

Evaluation of Montgomery County s Safe Speed Program
OLO Report 2010-3 September 29, 2009 28
CHAPTER V: MONTGOMERY COUNTY S SAFE SPEED PROGRAM
According to best practices research, the success of speed camera programs depends on how the technology is applied and how program staff interact with local legislators, the judiciary, and most importantly the public when implementing the program.1 This chapter describes the administration and operation of Montgomery County s speed camera program, which the County started to implement shortly after the State authorizing legislation took effect in February 2006.
Section A summarizes the implementation of the County s Safe Speed program; and
Section B provides a summary of a Safe Speed citation process.
For information about the speed camera programs operated by the municipalities of Rockville, Gaithersburg, Takoma Park, and Chevy Chase Village, see Chapter VII.
A. Implementation of the County s Safe Speed Program
This section provides details on how the County implemented the Safe Speed program, including the vendor contract; site selection process; public awareness campaign; training of speed camera operators; and speed camera deployment.
1. Contract for Services
In August 2006, the County Government issued a Request for Proposal (RFP) for the speed camera equipment and Safe Speed program services. In February 2007, the County awarded the contract to Affiliated Computer Services State and Local Solutions, Inc. (ACS). The initial contract was for a term of two years; in February 2009, the County renewed its contract with ACS for another two years (until February 2011). The contract requires ACS to:
Purchase, install, and maintain the speed camera equipment;
Process citations and payments; and
Conduct public outreach and customer service functions.
In addition, ACS must maintain an automated reporting system capable of providing a range of ad hoc, monthly, quarterly, and annual reports for the County about the program.
Speed camera equipment and maintenance. ACS is responsible for the acquisition and installation of all speed cameras and other necessary equipment for operation. ACS contract:
Specifies the information that speed cameras must be able to record;
Requires bi-annual independent certification of all program equipment; and
Requires that the contractor train speed camera operators on the operation and testing of the speed cameras.
1 Turner, Shawn and Amy Polk. Overview in Automated Enforcement in Transportation. ITE Journal. June 1998.

Evaluation of Montgomery County s Safe Speed Program
OLO Report 2010-3 September 29, 2009 29
Under the terms of the contract, ACS owns all of the speed camera equipment used in the County; and is responsible for the permitting, construction, utility costs, and maintenance. The County can request ACS to relocate up to six fixed speed cameras each year. ACS must repair or replace a broken fixed speed camera within 24 hours of notification, or face financial penalties of $2,000 per day of downtime. ACS must repair or replace a mobile speed camera within four hours of notification, or face financial penalties of $100 per hour of downtime.
Services for processing, production, and support of citations. The Montgomery County Police Department is responsible for the final authorization of all speed camera citations; however, the contractor is responsible for all processing services. Specifically, under the terms of the contract with the County, ACS staff:
Assemble the legally-required components of the citation;
Retrieve vehicle registration information;
Provide a preliminary review of the digital photograph and related information before it is submitted for MCPD review;
Print and mail MCPD-approved warning notices or citations;
Mail other correspondence, such as returned checks and notices of non-payment;
Collect, process, and track citation payments;
Provide District Court support services, including scheduling and tracking of hearings, preparation of dispositions, and provide expert witness testimony in court if requested;
Forward citations after a transfer of liability to a person other than the vehicle owner; and
Store all information for a minimum of one year.
Customer service and public outreach. ACS is also responsible for many of the customer service components of the speed camera program. This includes:
Operating a bilingual customer service telephone line to answer questions about the program; and
Responding to inquiries and resolving complaints.
The contractor is also responsible for conducting public outreach activities, such as the ongoing speed camera media campaign aimed at residents and visitors to the County. ACS assisted in the creation of the Safe Speed content for the County s website, and created a training and informational video. The contractor also demonstrates the use and operation of speed camera equipment for the District Court and the public.
Payment terms of contract. The current cost of the contract is a rate of $16.25 per paid citation or $18,000 per month, whichever is greater.2
2 Montgomery County Government. Contract #7474000045-AA. Office of Procurement. August 2006.

Evaluation of Montgomery County s Safe Speed Program
OLO Report 2010-3 September 29, 2009 30
The 2006 State law provides that if a contractor operates a speed camera, the contractor s fee may not be contingent on the number of citations issued or paid. 3 According to a March 2008
opinion from the Attorney General of Maryland s Counsel to the General Assembly, the County complies with this provision of the State law. The opinion stated that since County employees operate the speed cameras systems, the prohibition on contingent-based pricing simply does not apply (see Appendix E).4
2. Site Assessment and Selection
The Police Department s speed camera site selection process involved extensive data collection and consultation with representatives from the community, as well as other government agencies. MCPD estimated that the ongoing site selection process requires about four weeks, from site identification to camera deployment.
Involvement of community. In the spring of 2006, MCPD established the Citizens Advisory Board for Traffic Issues (CABTI). CABTI members included pedestrian, bicycle, and traffic safety advocates, representatives from each of the County s Regional Service Centers citizen advisory boards, and other members from the community. To begin the process, MCPD identified more than 300 roadway segments as potential enforcement sites. Over a period of several months, MCPD and CABTI members quantitatively assessed and prioritized roadways in the County that met the eligibility requirements for speed camera enforcement (as defined in the State law).
Roadway site survey. CABTI assisted MCPD in evaluating roadways based on six weighted risk factors listed in Table 5-1 (page 31). The Police Department collected baseline speed and
traffic data, and surveyed each of the eligible roadways to gather data for the first five risk factors. Police officers from the six police districts provided information for the final risk factor, expressions of concern regarding the endangerment histories of each roadway.
Through discussion and analysis of the roadway risk factors, CABTI assisted in the prioritization of eligible roadways for enforcement.
In February 2008, CABTI reconvened to review and evaluate the data for potential additional speed camera locations. CABTI again assisted in the recommendation and prioritization of recommended roads for the placement of speed cameras.
Final decision on speed camera locations. After receiving input from CABTI, MCPD made final decisions on if and where the speed cameras will be located. MCPD checked with the County s Department of Transportation and the State Highway Administration to ensure that speed limits on the targeted roadways had been recently verified, and that construction or traffic calming was not planned in the near future. Next, MCPD inspected the site for possible interferences with the effective operation of a speed camera. Finally, MCPD decided which sites would be enforced by fixed speed cameras and which would be enforced by mobile speed cameras.
3 Annotated Code of Maryland, Transportation, § 21-809(j). 4 Friedman, Dan. Attorney General of Maryland, Office of the Counsel to the General Assembly. Letter to Delegate
Brian J. Feldman. March 5, 2008.

Evaluation of Montgomery County s Safe Speed Program
OLO Report 2010-3 September 29, 2009 31
MCPD plans to continue to use a similar process including participation of CABTI and the community at large to identify potential future enforcement sites.
Table 5-1: Roadway Risk Factors used in MCPD Speed Camera Site Selection
Roadway Risk Factor Components Weighting
1 Speed Endangerment Percent of vehicles in excess of ten miles per hour of the speed limit.
25%
2 Accident Endangerment Annual number of property damage, personal injury, and fatal automobile collisions (within ½ mile).
25%
3 Traffic Volume Average number of vehicles on the roadway per hour on weekdays (non-rush hour and rush hour) and on weekends.
15%
4 Pedestrian Proximity
Proximity (within ½ mile) of areas frequented by pedestrians, such as bus stops, schools, parks, playgrounds, community centers, religious facilities, or crosswalks.
20%
5 Roadway/Site Design Design characteristics, such as grade and road type. (Roadways that are major arteries or are on a downhill grade do not receive points.)
10%
6 Endangerment History Expressions of concern submitted to police districts by the public within the last five years.
5%
- Total --- 100% Source: MCPD
Appendix F includes a more detailed explanation of the site selection process.
3. Public Awareness Campaign
In March 2007, the County launched its first speed camera public awareness and education campaign. The publicity was part of a larger Street Smart Pedestrian Safety campaign, which emphasized the dangers of speeding and included information on the Safe Speed program, pedestrian safety, and the existing red light camera enforcement program.5 The County coordinated the outreach effort with the City of Rockville, City of Gaithersburg, Chevy Chase Village, the Insurance Institute for Highway Safety (IIHS).
5 Leggett, Isiah. Fiscal Year 2007 Annual Report. Memorandum. September 28, 2007.

Evaluation of Montgomery County s Safe Speed Program
OLO Report 2010-3 September 29, 2009 32
Since March 2007, the County s Safe Speed public awareness and education campaign has included a range of one-time and ongoing activities:
Press conferences The County held press conferences with participating jurisdictions at the start of the 30-day warning period informing the public on the use of speed cameras, and a second press conference when speed camera enforcement began.
Brochures and informational materials The County published brochures on how the program works and distributed flyers educating the public on the dangers of speeding.
Photo Enforced signs The County posted Photo Enforced signs in speed camera enforcement zones, as well as signs advising motorists of speed camera enforcement posted on major roadways entering the County.
Safe Speed logo
MCPD created the Safe Speed program s logo for public brand recognition (Exhibit 5-1). The logo is visible on the side of the mobile speed camera vans.
Exhibit 5-1: County Safe Speed Program Logo
Website The Safe Speed website provides information about the program. The site also shows the locations of roadways under mobile and fixed speed camera enforcement.
Customer service The contractor responds to calls and emails, and directs more complicated calls from the public about the Safe Speed program to MCPD.
Warning citations The County issued warning citations for speed violations during the first two months of the program to inform drivers of the new automated speed enforcement.
5. Training of Speed Camera Operators
State law requires speed camera operators to be trained by the manufacturer of the speed camera equipment. The equipment manufacturer (Gatso USA, Inc.) provides system training. The training involves classroom and field work for about four days to satisfy the legal requirements on setting up, testing, and using the speed cameras. In addition, speed camera operators receive ongoing training throughout their employment.

Evaluation of Montgomery County s Safe Speed Program
OLO Report 2010-3 September 29, 2009 33
All speed camera operators receive a certificate of completion upon finishing system certification, which is kept on file with MCPD. The County uses these certificates as evidence of the operators training in District Court when alleged violators contest speed camera citations.
6. Deployment of Speed Cameras
The Montgomery County s Safe Speed program uses speed cameras to photograph vehicles traveling 11 or more miles per hour above the speed limit on selected residential streets or school zones with a maximum speed limit of 35 miles per hour. MCPD deploys both marked mobile speed camera vans and fixed speed camera units. As of October 1, 2009, this threshold at which speed cameras may photograph vehicles will increase from 10 to 12 miles per hour, as per the 2009 State law regarding speed cameras (see page 24).
Warning period. MCPD began using speed cameras to monitor the speeds of motor vehicles on March 12, 2007. As previously mentioned, the program began with a 30-day warning period, which was subsequently extended for three additional weeks. During the warning period, motorists received warnings if they were photographed exceeding the speed limit by 10 miles per hour in the enforcement zones. MCPD reports that during this period, it issued over 7,500 warnings to vehicles photographed by speed cameras. On May 2, 2007, the County began mailing $40 civil citations to owners of vehicles traveling 11 or more miles per hour above the speed limit.
Table 5-2 shows the number of fixed and mobile speed camera enforcement locations in residential districts and school zones, as of June 2009.
Table 5-2: County Speed Camera Enforcement Sites, June 2009
Enforcement Area Fixed Speed Camera
Mobile Speed Camera
Total Sites
Residential District 38 51 89
School Zone 22 8 30
Total 60 59 119 Source: MCPD
Appendix I includes a list of the fixed and speed camera enforcement areas in the County.
Mobile speed cameras. The initial speed camera enforcement consisted of six mobile cameras deployed to designated speed enforcement zones in residential areas and school zones across the County. As of June 2009, the program s mobile speed camera units rotate among about 60 designated speed enforcement zones; eight of which are in school zones. These mobile speed cameras are positioned in marked vans staffed by radar-certified police employees operating from approximately 6 a.m. to 9 p.m., Monday through Saturday.
Currently, MCPD uses mobile speed cameras to supplement fixed speed camera enforcement. MCPD rotates mobile speed cameras among the enforcement locations based on recent speed data. MCPD locates mobile speed cameras at high priority sites several times a week, and lower

Evaluation of Montgomery County s Safe Speed Program
OLO Report 2010-3 September 29, 2009 34
priority sites only a few times a month. Technicians rotate the vans among 10-12 locations each day, staying for 45 to 50 minutes at each site, depending on weather and traffic flow. Once data shows that speeds have slowed at a given site, MCPD may choose to only spot check enforce that site for period of time.
Fixed speed cameras. In late September 2007, the County installed the first fixed speed camera. As of June 2009, the County operates 60 fixed speed cameras at 38 sites around the County; 22 of which are in school zones. The fixed speed cameras operate continuously, but require staff to download the data from the 30 speed cameras installed in FY08 six days a week. For the 30 cameras installed in FY09, operators can perform these operations remotely from the ATEU garage.
Site assessment. MCPD periodically assesses speed camera enforcement sites by examining roadway volume, speed, collision, and citation data. If data collected show a change in driver behavior over time, MCPD may decide to alter deployment rotations for mobile speed cameras, or even remove a fixed speed camera. For example, after an 18 month period, MCPD removed the fixed speed camera sites on Montgomery Village Avenue in July 2009 after data showed a sustained change in driver behavior. It should be noted that MCPD continues to monitor roadway data for sites that have been taken out of deployment to determine if speed cameras need to be re-deployed at that location.
B. Safe Speed Citation Process
This section provides a summary of the Safe Speed program citation and appeal process.
1. Detection of Violation
Before speed cameras detect violations, operators set up the system by calibrating and testing the camera. For mobile speed cameras, operators perform the set-up process before they begin detecting violations at each enforcement site. For fixed speed cameras, operators calibrate and test the equipment at the fixed pole site six days a week.
Once operational, the speed cameras track vehicle counts of every motor vehicle that passes, but only photograph vehicles traveling 11 or more miles per hour over the speed limit; vehicles traveling below this speed are not photographed. In accordance with State law, the speed cameras photograph recorded images of the rear of a vehicle.6
The cameras take at least two time-stamped photographs of the vehicle passing a stationary object. For mobile speed cameras, a road cone serves as the stationary object; for fixed speed cameras, progression lines on the roadway serve this purpose. The speed cameras take photographs of the rear of the moving vehicle and the vehicle s license plate; the vehicle s driver is not photographed.
6 The law authorizes speed cameras to photograph vehicles traveling at least 10 miles per hour over the speed limit, but the County enforces at 11 miles per hour over the speed limit; allowing an extra mile margin of error.

Evaluation of Montgomery County s Safe Speed Program
OLO Report 2010-3 September 29, 2009 35
2. Violation Review and Processing
Once violations are detected and photographed, the contractor performs an initial event review
of the images. If the images are clear and meet the legal criteria for a violation, the contractor sends the vehicle s registration information to the Maryland Motor Vehicle Administration (MVA) to determine the vehicle s registered owner.7 MCPD reports that, on average, it takes about two days for the MVA to process a State of Maryland license plate, and two to three weeks to process an out-of-state license plate.
After conducting the initial review and receiving registration data from the MVA, the contractor prepares the violation information for MCPD approval. As shown in Table 5-3, since the program began issuing citations in May 2007, MCPD has rejected almost 275,000 violations. The contractor (ACS) has thrown out about 80% (216,000) of the total rejected violations in this initial review stage.
The most common reasons for rejecting a violation have been: an unclear/obstructed license plate (30%); multiple vehicles in the photograph (14%); no information on the vehicle at the MVA (11%); and an expired violation, which means MCPD did not mail the citation by the statutory deadline (11%).
Table 5-3: Reasons Speed Camera Violations Have Been Rejected, May 2007 to June 2009
Reason for Rejection Violation
Rejected by Contractor
Violation Rejected
by MCPD
Total Rejected
Percent
Unclear/obstructed license plate 78,963
2,283
81,246
30%
Multiple vehicles in the photograph 36,803
1,851
38,654
14%
No information at MVA 29,648
0
29,648
11%
Expired violation* 1,763
27,488
29,251
11%
No violation occurred/operator error 23,266
1,602
24,868
9%
Rental vehicle 9,204
13,607
22,811
8%
Temporary tag 12,436
19
12,455
5%
Bad/dark photograph 2,142
3,728
5,870
2%
Emergency vehicle on a call 3,828
1,607
5,435
2%
Dealer tag 2,872
1,859
4,731
2%
No rear license plate 4,169
0
4,169
2%
Other** 10,813
2,758
13,571
5%
Total 215,907
56,802
272,709
100%
Source: MCPD * A violation expires if the citation is not mailed by the statutory deadline (see footnote 8 on the next page). ** Other category includes reasons such as power interruption; damaged license plate; stationary object not visible;
vehicle obstructed; equipment malfunction; and failure to match the vehicle to the license plate.
7 The legal definition for a recorded image of a speed monitoring system appears on page 22.

Evaluation of Montgomery County s Safe Speed Program
OLO Report 2010-3 September 29, 2009 36
After MCPD approves the violation, the contractor prints a copy of the citation for final MCPD review. Upon final approval, the contractor mails the citation to the vehicle s owner (or lessee of six months) within the timeframe required by State law, or the citation is thrown out.8 MCPD reports that the average time it takes to process a violation and mail the citation to the vehicle s owner is 10-13 days; this time frame holds true for both in-state and out-of-state license plates.
3. Options for Persons Issued a Citation
As detailed on each citation, a person issued a citation may choose whether to waive his/her right to a hearing and pay the $40 citation (an admission of guilt), or contest the citation in Maryland District Court. If an owner does not either pay the citation or indicate that he/she wishes to contest the citation within 30 days, MCPD sends a second notice and adds a $25 late fee to the citation. If the citation is not paid or contested after 60 days, MCPD sends a notice stating that if the citation is not paid, or contested within 90 days, the State MVA may flag the registration. The MVA may refuse to renew or suspend a flagged motor vehicle s registration. To release the MVA flag, a person must pay a $20 administrative fee to the County and a $30 fee to the MVA.
4. Payment of Citation
If an alleged violator chooses to pay the citation s $40 civil penalty, he/she admits guilt and waives the right to a hearing. The Safe Speed program enables people to pay through a variety of methods, including by mail, online, by phone, or in person in Rockville.
Table 5-5 shows the various methods people have chosen to pay speed camera citations since the beginning of the program. From FY07-FY09, almost all of the payments have been received either by mail (66%) or by through the Safe Speed website (24%).
Table 5-4: Methods of Paying Speed Camera Citations, FY07-FY09
Method of Payment Transactions9
Amount Percent
Mail 455,191
$20,040,590
66%
Web-based 168,554
$7,781,079
24%
Phone 46,487
$2,327,830
7%
Walk-in 18,918
$1,160,891
3%
Total 689,150
$31,310,391
100%
Source: MCPD
The State law treats the payment of a speed camera citation like a parking violation. The payment of a speed camera citation will not result in the State MVA recording points on the owner s driving record, nor will it be reported to insurance providers.
8 The State law requires the County to mail citations to owners no later than two weeks (14 calendar days) after the alleged violation. The County must mail the citation within 30 days if the vehicle is registered in another state.
9 A single citation may have multiple transactions, including a citation payment, late fee, etc.

Evaluation of Montgomery County s Safe Speed Program
OLO Report 2010-3 September 29, 2009 37
Once an alleged violator pays the speed camera citation, the County processes and verifies the payment, and the account is closed. All revenue from uncontested County citations goes into the County s General Fund and must be used for public safety purposes, as detailed in Chapter IV. The County processes all uncontested revenue from municipal citations, and transfers it to the respective municipality in a lump sum payment each month, as detailed in Chapter VII.10
5. Contested Citation
As mentioned above, a vehicle owner receiving a citation can opt to contest it. If an alleged violator chooses to contest a speed camera citation, he/she must do so within 30 days receiving it. The citation provides two boxes for the alleged violator to indicate his/her reasoning for contesting the citation:
My vehicle was stolen; or
I do contest and elect a hearing.
Stolen vehicle. If the owner s vehicle was stolen at the time of the violation, he/she must provide a police report certifying that the vehicle or license plate was stolen. If MCPD determines that the supporting evidence is valid, the account is closed and the citation is voided.
Hearing. If the vehicle owner requests a hearing, the County sends a notice of the location, time, and date of the hearing. The District Court schedules about 100 to 200 speed camera citation hearings in a single morning session for the County usually once each month. Through FY08 and FY09, the County had to schedule two hearing sessions in a single month only five times.
At the hearing, the County provides the evidence of the violation -- the operator s training certificate plus proof that the operator calibrated and set up the speed camera properly. If the person who received the citation was not driving the vehicle at the time of the violation, he/she must provide evidence that he/she was not operating the vehicle at the time.
After the County and vehicle owner present evidence to the District Court judge, the judge renders a decision. The District Court judge can:
Find the person not guilty of the violation;
Transfer the liability of the citation from the owner of the vehicle to another person;
Find the person guilty of the violation; or
Find the person guilty, but lower the fine associated with the citation.
Table 5-5 on the following page shows that of the over 740,000 Safe Speed citations mailed to owners from FY07-FY09, less than one percent (3,098 citations) was appealed in Maryland District Court. During this period, the District Court found that almost all persons (99.7%) contesting the citations guilty of violating the law.
10 See Chapter VII for details on the memorandum of understanding between the County and municipalities regarding the processing and disbursal of speed camera revenue.

Evaluation of Montgomery County s Safe Speed Program
OLO Report 2010-3 September 29, 2009 38
Table 5-5: Montgomery County Safe Speed Citations Appealed in District Court, FY07-FY09
Year Total
Citations Issued
Scheduled Hearings to
Appeal Citation
Percent Contested
Found Not Guilty
Conviction Rate
FY07 9,985
0 0.0% 0 ---
FY08 259,205
1,379 0.5% 4 99.7%
FY09 473,280
1,719 0.4% 6 99.7% Total 742,470
3,098 0.4% 10 99.7% Source: MCPD
According to MCPD, the District Court dismissed these citations for one of the following reasons:
Tree branches covered the posted speed limit sign and/or there was no visible speed sign;
Driver was taking a passenger to the emergency room;
Violator requested the Technician to be present at the hearing and Technician was not available; and
Driver was getting out of the way for an emergency vehicle.
MCPD attributes the high conviction rate to the coordination with the District Court in the Safe Speed program s early implementation stage. When the program began, MCPD demonstrated the speed camera technology for the District Court judges, received approval on the appearance and content of speed camera citations, and prepare a standard evidentiary package for all court hearings.
Transfer of liability. If the District Court transfers the liability of the citation from the owner of the vehicle to an identified driver, the clerk of the court will forward any supporting evidence and identification to the County. Based upon the information received, MCPD may then issue a citation to the person identified within two weeks of the Court notification.
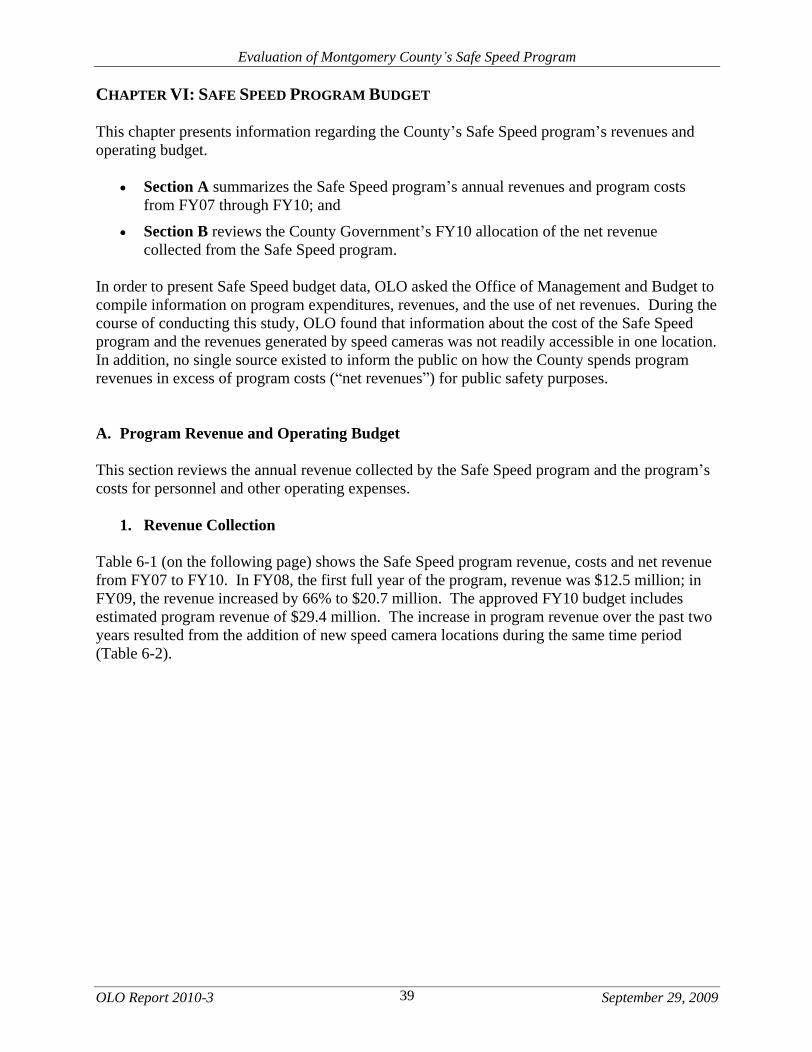
Evaluation of Montgomery County s Safe Speed Program
OLO Report 2010-3 September 29, 2009 39
CHAPTER VI: SAFE SPEED PROGRAM BUDGET
This chapter presents information regarding the County s Safe Speed program s revenues and operating budget.
Section A summarizes the Safe Speed program s annual revenues and program costs from FY07 through FY10; and
Section B reviews the County Government s FY10 allocation of the net revenue collected from the Safe Speed program.
In order to present Safe Speed budget data, OLO asked the Office of Management and Budget to compile information on program expenditures, revenues, and the use of net revenues. During the course of conducting this study, OLO found that information about the cost of the Safe Speed program and the revenues generated by speed cameras was not readily accessible in one location. In addition, no single source existed to inform the public on how the County spends program revenues in excess of program costs ( net revenues ) for public safety purposes.
A. Program Revenue and Operating Budget
This section reviews the annual revenue collected by the Safe Speed program and the program s costs for personnel and other operating expenses.
1. Revenue Collection
Table 6-1 (on the following page) shows the Safe Speed program revenue, costs and net revenue from FY07 to FY10. In FY08, the first full year of the program, revenue was $12.5 million; in FY09, the revenue increased by 66% to $20.7 million. The approved FY10 budget includes estimated program revenue of $29.4 million. The increase in program revenue over the past two years resulted from the addition of new speed camera locations during the same time period (Table 6-2).

Evaluation of Montgomery County s Safe Speed Program
OLO Report 2010-3 September 29, 2009 40
Table 6-1: Safe Speed Program Revenue and Expenses, FY07-FY10 ($ in 000s)
FY071 FY08 FY09 FY10 Revenue/Cost Budget Actual Budget Actual Budget2 Estimate3 Budget
Citations 3,377
378
8,800
11,697
14,400
19,101
28,798
Late Fees 20
1
50
704
300
1,361
310
Other Fees* 20
- 75
64
75
285
245
Total Revenue $3,417
$379
$8,925
$12,464
$14,775
$20,747
$29,352
Personnel Costs 0
109
1,228
933
1,334
1,168
1,940
Operating Expenses 0
165
2,093
4,268
7,875
7,483
11,259
Capital Outlay Vehicles 0
0
0
0
41
41
0
Total Program Costs $0
$274
$3,321
$5,201
$9,250
$8,692
$13,199
Net Revenue $3,417
$105
$5,604
$7,263
$5,525
$12,055
$16,153
Source: OMB; Numbers may not sum to totals due to rounding. * Other Fees includes flagging fees, court payments, and non-sufficient funds (NSF) fees.
As shown in Exhibit 6-1, in FY09, the revenue from Safe Speed citations was $19.0 million, over 90% of the program s revenue. Late fees contributed another $1.4 million (7%).
Exhibit 6-1: Safe Speed Revenue by Type, FY09
Other Fees*1%
Citation Fees92%
Late Fees7%
Source: OMB
As stated in Chapter V, the Safe Speed program started in FY07 with 22 mobile speed camera enforcement sites. By FY09, the program had expanded to 59 mobile speed camera enforcement sites and 60 fixed speed camera enforcement sites.4 Table 6-2 (page 41) shows the amount of speed camera revenue collected by month from March 2007 to June 2009. The increase in monthly citation revenue corresponds with the increase in speed camera enforcement sites, and, to a greater extent, an increase in fixed speed camera sites.
1 FY07 reflects partial year budget data since the County s Safe Speed program began issuing citations in May 2007. 2 FY09 budgeted revenues are those included in the originally approved FY09 Operating Budget. FY09 budgeted expenditures include cost of expansion approved as a supplemental appropriation in June 2009. 3 As of September 2009. 4 A fixed camera enforcement site represents one camera facing one direction. In many locations, two fixed cameras are co-located but face opposite directions. In such a case, these two cameras are considered as two enforcement sites.

Evaluation of Montgomery County s Safe Speed Program
OLO Report 2010-3 September 29, 2009 41
The Safe Speed program did not bring in any revenue during the warning period (March and April 2007). In the first four months of enforcement, when the County deployed only mobile speed cameras, revenues increased from about $28,000 in May to $298,000 in August 2007. After the next four months, as fixed speed cameras were installed and activated, monthly revenue reached over $1 million in December 2007.
Table 6-2: Monthly Speed Camera Revenue, March 2007 June 2009
Fiscal Year
Month Monthly
Revenue* ($ in 000s)
Cumulative Mobile Speed Cameras Sites
Cumulative Fixed Speed
Cameras Sites
Cumulative Speed Cameras
Sites Active March $0 0 0 0
April $0 18 0 18
May $28 18 0 18
June $351 22 0 22
FY07
FY07 Total $379 22 0 22 July $221 22 0 22
August $298 22 0 22
September $72 22 2 24
October $318 22 4 26
November $619 22 8 30
December $1,024 22 11 33
January $1,124 25 15 40
February $1,265 25 22 47
March $1,368 41 29 70
April $1,585 42 29 71
May $1,557 43 29 72
June $3,014 43 30 73
FY08
FY08 Total $12,464 43 30 73 July $1,730 43 30 73
August $1,455 43 30 73
September $1,486 43 30 73
October $1,133 43 30 73
November $913 45 30 75
December $1,027 47 37 84
January $1,188 48 45 93
February $1,542 53 48 101
March $2,389 55 48 103
April $2,198 55 59 114
May $2,313 59 60 119
June $4,880 59 60 119
FY09
FY09 Total* $20,747 59 60 119 Total $331,590 59 60 119
Source: MCPD; OMB Note: Numbers may not sum to totals due to rounding. OMB reports that the June totals for each year include year-end accounting differences. *OMB reports that the FY09 total includes an FY08 year-end adjustment of -$1,508,604.

Evaluation of Montgomery County s Safe Speed Program
OLO Report 2010-3 September 29, 2009 42
2. Safe Speed Program Expenditures
Table 6-3 shows the operating budget and expenditures of the Safe Speed program. In FY08, the first full year of the program, the operating budget was $5.2 million. In FY09, the estimated program operating budget increased to $8.7 million, and the approved FY10 budget for the Safe Speed program is $13.2 million.
Table 6-3: Safe Speed Operating Budget and Expenditures, FY07-FY10 ($ in 000s)
FY07 FY08 FY09 FY10 Operating Cost
Budget
Actual
Budget Actual Budget5 Estimate
Budget Operating Expenses $0
$165
$2,093
$4,269
$7,875
$7,525
$11,259
Contract with vendor 0
120
2,000
4,216
7,782
7,380
11,106
Public awareness materials 0
15
50
6
50
46
50
Fixed speed camera sites costs 0
11
30
3
30
28
30
Other 0
19
13
43
13
71
74
Personnel Costs $0
$109
$1,228
$933
$1,334
$1,167
$1,940
Total $0
$274
$3,321
$5,201
$9,250
$8,692
$13,199
Source: OMB Note: Numbers may not sum to totals due to rounding. Other category includes building space rental costs, motor pool chargebacks, telephone charges, and office supplies.
In FY10, operating expenses represent 85% percent ($11.3 million) of the program s total operating budget. The County s contract with the speed camera vendor (Affiliated Computer Services State and Local Solutions, Inc.) explains 84% of the Safe Speed s budgeted program costs. MCPD s personnel costs account for another 15% percent ($1.9 million) of the program budget. Other operating expenses, such as public awareness materials, fixed speed camera site costs, and outside printing, have comprised less than two percent of the operating budget each year.
According to MCPD, the contract with the speed camera vendor primarily explains the difference between budgeted and actual expenditures each year. As stated earlier, the current cost of the contract is a rate of $16.25 per paid citation. If the number of paid citations varies from the estimated number of citations in the budget, the actual cost will be different.
Staffing. The Safe Speed program is organizationally located within the Automated Traffic Enforcement Unit (ATEU) in the Montgomery County Police Department s (MCPD) Traffic Division. ATEU also manages the County s Red Light Enforcement program. Exhibit 6-2 (page 43) shows the organizational location of ATEU within the Police Department.
5 The Safe Speed program s FY09 budget includes a $1.9 million supplemental appropriation approved by Council Resolution No. 16-1036. The supplemental also included $41,250 for the Motor Pool Non-Departmental Account.
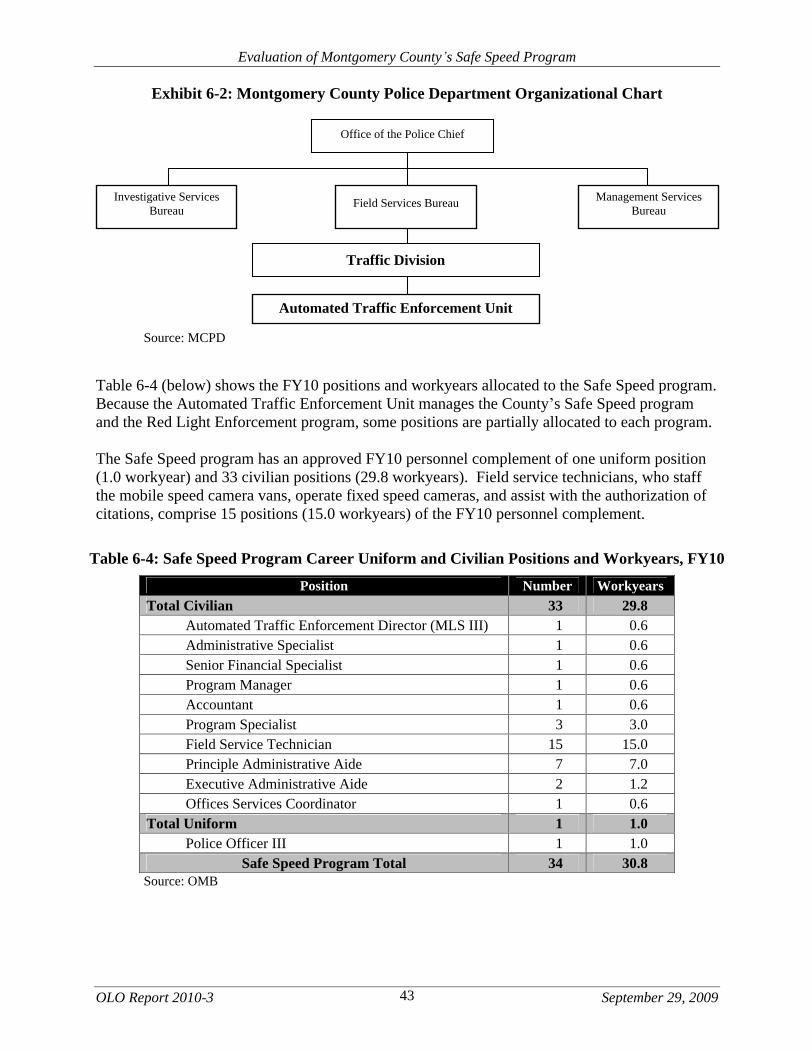
Evaluation of Montgomery County s Safe Speed Program
OLO Report 2010-3 September 29, 2009 43
Exhibit 6-2: Montgomery County Police Department Organizational Chart
Source: MCPD
Table 6-4 (below) shows the FY10 positions and workyears allocated to the Safe Speed program. Because the Automated Traffic Enforcement Unit manages the County s Safe Speed program and the Red Light Enforcement program, some positions are partially allocated to each program.
The Safe Speed program has an approved FY10 personnel complement of one uniform position (1.0 workyear) and 33 civilian positions (29.8 workyears). Field service technicians, who staff the mobile speed camera vans, operate fixed speed cameras, and assist with the authorization of citations, comprise 15 positions (15.0 workyears) of the FY10 personnel complement.
Table 6-4: Safe Speed Program Career Uniform and Civilian Positions and Workyears, FY10
Position Number Workyears Total Civilian 33 29.8
Automated Traffic Enforcement Director (MLS III) 1 0.6 Administrative Specialist 1 0.6 Senior Financial Specialist 1 0.6 Program Manager 1 0.6 Accountant 1 0.6 Program Specialist 3 3.0 Field Service Technician 15 15.0 Principle Administrative Aide 7 7.0 Executive Administrative Aide 2 1.2 Offices Services Coordinator 1 0.6
Total Uniform 1 1.0 Police Officer III 1 1.0
Safe Speed Program Total 34 30.8 Source: OMB
Traffic Division
Automated Traffic Enforcement Unit
Investigative Services Bureau
Management Services Bureau
Field Services Bureau
Office of the Police Chief
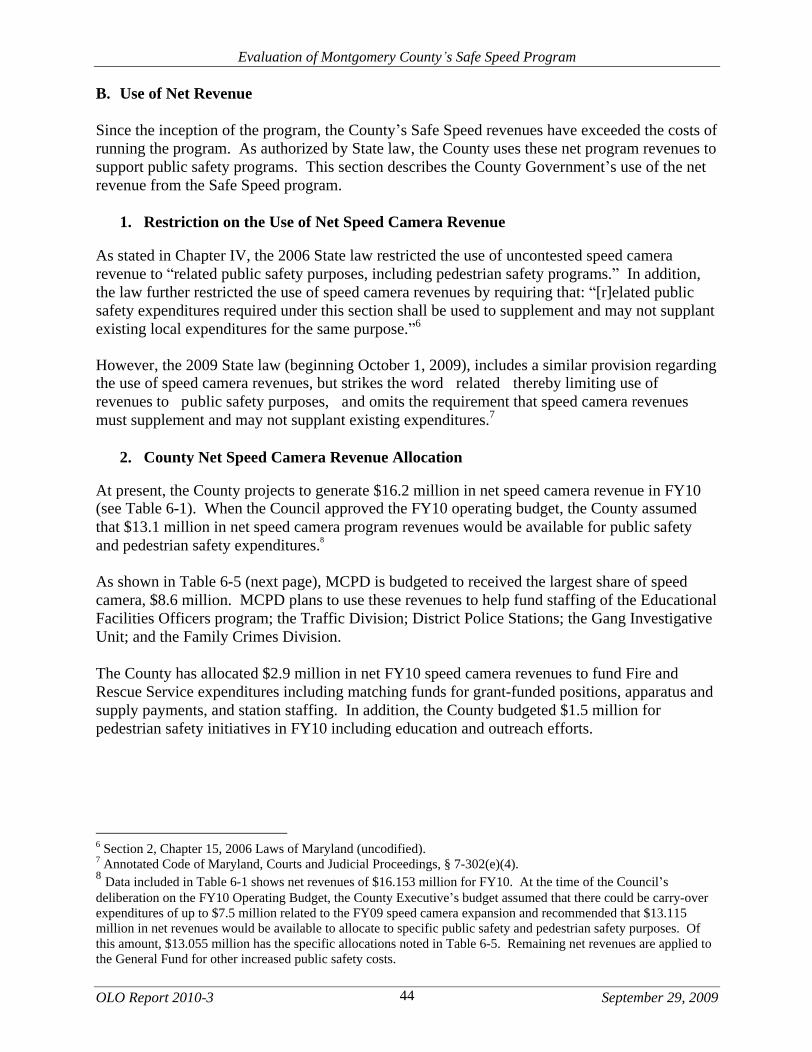
Evaluation of Montgomery County s Safe Speed Program
OLO Report 2010-3 September 29, 2009 44
B. Use of Net Revenue
Since the inception of the program, the County s Safe Speed revenues have exceeded the costs of running the program. As authorized by State law, the County uses these net program revenues to support public safety programs. This section describes the County Government s use of the net revenue from the Safe Speed program.
1. Restriction on the Use of Net Speed Camera Revenue
As stated in Chapter IV, the 2006 State law restricted the use of uncontested speed camera revenue to related public safety purposes, including pedestrian safety programs. In addition, the law further restricted the use of speed camera revenues by requiring that: [r]elated public safety expenditures required under this section shall be used to supplement and may not supplant existing local expenditures for the same purpose. 6
However, the 2009 State law (beginning October 1, 2009), includes a similar provision regarding the use of speed camera revenues, but strikes the word related thereby limiting use of revenues to public safety purposes, and omits the requirement that speed camera revenues must supplement and may not supplant existing expenditures.7
2. County Net Speed Camera Revenue Allocation
At present, the County projects to generate $16.2 million in net speed camera revenue in FY10 (see Table 6-1). When the Council approved the FY10 operating budget, the County assumed that $13.1 million in net speed camera program revenues would be available for public safety and pedestrian safety expenditures.8
As shown in Table 6-5 (next page), MCPD is budgeted to received the largest share of speed camera, $8.6 million. MCPD plans to use these revenues to help fund staffing of the Educational Facilities Officers program; the Traffic Division; District Police Stations; the Gang Investigative Unit; and the Family Crimes Division.
The County has allocated $2.9 million in net FY10 speed camera revenues to fund Fire and Rescue Service expenditures including matching funds for grant-funded positions, apparatus and supply payments, and station staffing. In addition, the County budgeted $1.5 million for pedestrian safety initiatives in FY10 including education and outreach efforts.
6 Section 2, Chapter 15, 2006 Laws of Maryland (uncodified). 7 Annotated Code of Maryland, Courts and Judicial Proceedings, § 7-302(e)(4). 8 Data included in Table 6-1 shows net revenues of $16.153 million for FY10. At the time of the Council s deliberation on the FY10 Operating Budget, the County Executive s budget assumed that there could be carry-over expenditures of up to $7.5 million related to the FY09 speed camera expansion and recommended that $13.115 million in net revenues would be available to allocate to specific public safety and pedestrian safety purposes. Of this amount, $13.055 million has the specific allocations noted in Table 6-5. Remaining net revenues are applied to the General Fund for other increased public safety costs.

Evaluation of Montgomery County s Safe Speed Program
OLO Report 2010-3 September 29, 2009 45
Table 6-5: Allocation of FY10 Net Speed Camera Revenue ($ in 000s)
Expenditure FY10 Budget
Montgomery County Police Department
Educational Facilities Officers program in County public schools (31 positions) $3,414
Traffic Division alcohol enforcement and traffic collision reconstruction expenditures 1,919
District Stations' Community Policing Officers (12 positions) 1,358
Gang Investigative Unit (five positions) 566
Family Crimes Division investigators (three positions) 494
Continued evening operating hours at the Bethesda and Gaithersburg police stations 316
January 2010 recruit class (47 candidates) 252
Police Officer to certify speed camera citations prior to issuance (mandated by State Law) 113
Exercise and training administrator 105
Planning for implementation of installing video cameras in police patrol cars 100
MCPD Total $8,637
Montgomery County Fire and Rescue Service
Lease payment and basic life support supplies for 14 EMS units $622
County portion of 2007 and 2009 SAFER Grants for 12 positions; no Federal funds in FY12 813
Electronic patient care reporting technology, maintenance, and support 580
Milestone fire station staffing 414
Civilianize code enforcement positions (five positions) 197
Fire apparatus payments 132
Overtime for additional driver training instruction 96
Operating Expenses for supplies at Kingsview and Milestone Fire Stations 90
MCFRS Total $2,944
Pedestrian Safety Initiative
High Incidence Area9 Actions program to monitor pedestrians perceptions of safety $600
Implementation of County Safe Routes to Schools pedestrian safety measures 333
Enhanced police enforcement in County High Incidence Areas 250
County-wide pedestrian safety education and outreach campaign 150
Data analyst for police 72
Reassessment of pedestrian signal timing 62
Engineer for pedestrian safety projects in High Incidence Areas 5
Pedestrian Safety Initiative Total $1,472
Total Allocated Net Revenue $13,05310
Source: OMB Note: Numbers may not sum to totals due to rounding.
9 High Incidence Areas (HIA) are locations in the County where vehicle and pedestrian collisions are clustered; located mostly in commercial areas, along transit corridors, and near high-density residential neighborhoods with high traffic volume and a significant number of pedestrians.
10 See footnote 8 on page 44.
Evaluation of Montgomery County s Safe Speed Program
OLO Report 2010-3 September 29, 2009
46
CHAPTER VII: MUNICIPAL SPEED CAMERA PROGRAMS IN THE COUNTY
This chapter provides an overview of the four municipal speed camera programs in the County.
Section A summarizes the implementation of municipal speed camera programs in conjunction with the County s Safe Speed program; and
Section B describes the four municipal speed camera programs operating in the County.
A. Municipal Speed Camera Program Implementation
Four municipalities in the County operate speed camera programs under the same 2006 State law that authorizes the County s Safe Speed program:
City of Rockville;
City of Gaithersburg;
Chevy Chase Village; and
City of Takoma Park.
According to the Montgomery County Police Department (MCPD), consistency among the jurisdictions in the County operating a speed camera program is important. While the municipalities separately operate speed camera programs, the County coordinates with and provides support to each municipality in order to make all the speed camera programs in the County as identical in operation as possible.
Contract for services. In 2007, the City of Rockville, City of Gaithersburg, and Chevy Chase Village joined the County s contract with Affiliated Computer Services State and Local Solutions, Inc. (the speed camera contractor). The City of Takoma Park signed a contract with ACS in September 2008. In March 2009, Chevy Chase Village negotiated a separate contract with ACS for a fixed price of $37,000 per month per fixed speed camera.
1. Public Awareness and Outreach
In March 2007, three municipalities entered into a coordinated public outreach campaign with the County s program, as described on pages 31-32.1 The campaign disseminated information about the program and enforcement locations in newsletters, press releases, and on municipal websites. The municipal programs adopted the same Safe Speed logo as the County s program, and display similar Photo Enforced signs on either side of automated speed enforcement sites. As described later in this chapter, the municipalities have engaged in additional public outreach activities.
1 The City of Takoma Park was not a part of the initial public outreach, since the City did not have a speed camera program until April 2009.
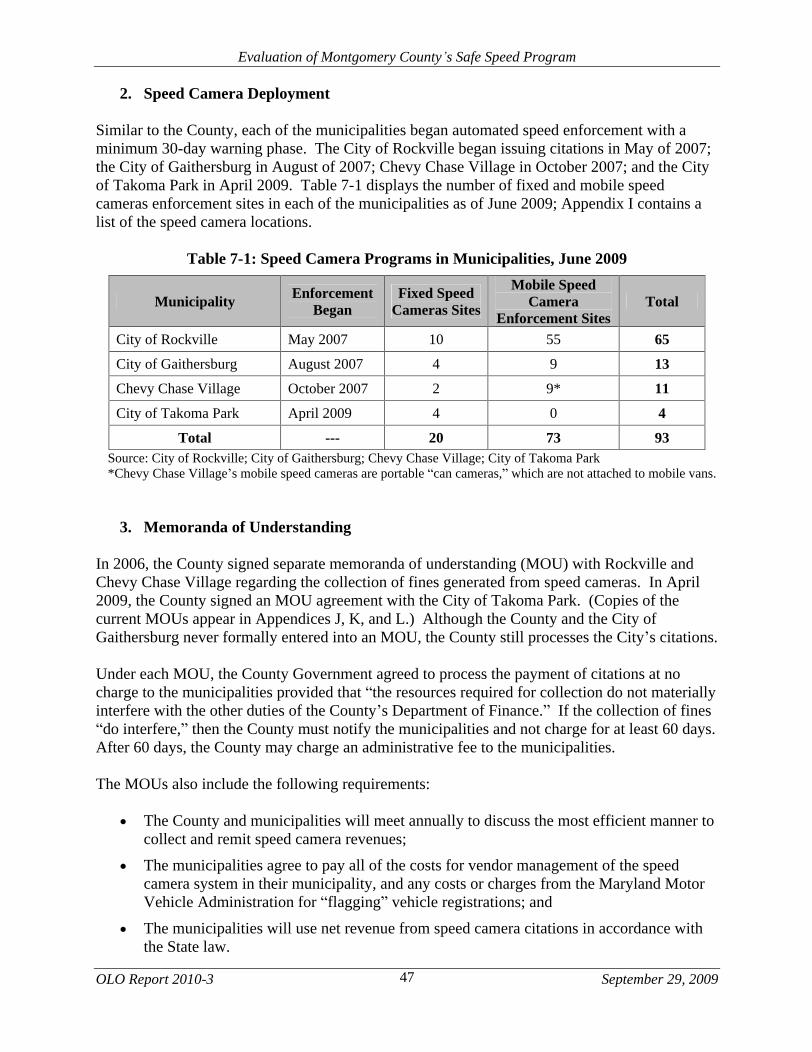
Evaluation of Montgomery County s Safe Speed Program
OLO Report 2010-3 September 29, 2009
47
2. Speed Camera Deployment
Similar to the County, each of the municipalities began automated speed enforcement with a minimum 30-day warning phase. The City of Rockville began issuing citations in May of 2007; the City of Gaithersburg in August of 2007; Chevy Chase Village in October 2007; and the City of Takoma Park in April 2009. Table 7-1 displays the number of fixed and mobile speed cameras enforcement sites in each of the municipalities as of June 2009; Appendix I contains a list of the speed camera locations.
Table 7-1: Speed Camera Programs in Municipalities, June 2009
Municipality Enforcement
Began Fixed Speed
Cameras Sites
Mobile Speed Camera
Enforcement Sites Total
City of Rockville May 2007 10 55 65
City of Gaithersburg August 2007 4 9 13
Chevy Chase Village October 2007 2 9* 11
City of Takoma Park April 2009 4 0 4
Total --- 20 73 93 Source: City of Rockville; City of Gaithersburg; Chevy Chase Village; City of Takoma Park *Chevy Chase Village s mobile speed cameras are portable can cameras, which are not attached to mobile vans.
3. Memoranda of Understanding
In 2006, the County signed separate memoranda of understanding (MOU) with Rockville and Chevy Chase Village regarding the collection of fines generated from speed cameras. In April 2009, the County signed an MOU agreement with the City of Takoma Park. (Copies of the current MOUs appear in Appendices J, K, and L.) Although the County and the City of Gaithersburg never formally entered into an MOU, the County still processes the City s citations.
Under each MOU, the County Government agreed to process the payment of citations at no charge to the municipalities provided that the resources required for collection do not materially interfere with the other duties of the County s Department of Finance. If the collection of fines do interfere, then the County must notify the municipalities and not charge for at least 60 days.
After 60 days, the County may charge an administrative fee to the municipalities.
The MOUs also include the following requirements:
The County and municipalities will meet annually to discuss the most efficient manner to collect and remit speed camera revenues;
The municipalities agree to pay all of the costs for vendor management of the speed camera system in their municipality, and any costs or charges from the Maryland Motor Vehicle Administration for flagging vehicle registrations; and
The municipalities will use net revenue from speed camera citations in accordance with the State law.

Evaluation of Montgomery County s Safe Speed Program
OLO Report 2010-3 September 29, 2009
48
Payment processing. Table 7-2 shows that from FY07-FY09, the County processed $15.9 million in speed camera fines, fees, and penalties for the four municipalities with speed camera programs. During this period, Chevy Chase Village generated almost half of the total municipal citation revenue processed by the County ($7.6 million); the City of Rockville generated 38% ($6.1 million).
Table 7-2: Payments Processed by MCPD for Municipalities, FY07-FY09 ($ in 000s)
Municipality FY07 FY08 FY09 Total FY07-FY09
Percent
City of Rockville $82
$3,512
$2,511
$6,105
38%
City of Gaithersburg $0
$1,163
$443
$1,605
10%
Chevy Chase Village $0
$2,877
$4,689
$7,566
48%
City of Takoma Park $0
$0
$620
$620
4%
Total $82
$7,551
$8,263
$15,896
100%
Source: MCPD
Status of MOUs between the County and municipalities. In July 2009, MCPD initiated discussions with each of the municipalities regarding the MOU agreements. The purpose of the discussion is to renegotiate the agreement regarding the processing of fines from municipal speed camera programs. MCPD staff report that the revised MOU will include similar provisions as the previous MOU, but require municipalities to pay a reasonable administrative fee to the County for collecting and remitting of municipal speed camera citation fines, fees, and/or penalties.
B. Municipal Speed Camera Program Descriptions
This section provides additional information about each of the four municipal speed camera programs operating in the County.
1. City of Rockville
The City of Rockville s speed camera program began in May 2007. The stated goal of the Rockville Safe Speed program is to reduce the number of speeders on local roads in an effort to increase public and pedestrian safety.2 City of Rockville staff measure the success of the program by looking at data on overall vehicle speeds, the number of vehicles speeding, and the number of speeding-related accidents.
Site selection. In 2006, the City of Rockville selected speed camera sites using an analysis of eligible roads. Rockville staff worked with a Citizens Advisory Committee to analyze 50 residential roadways, as identified through speed surveys performed by the City s Traffic and Transportation Division. The criteria for selecting sites for fixed and mobile cameras included a
2 City of Rockville. Speed Cameras in Rockville. 2009. http://www.rockvillemd.gov/police/speedcameras.htm

Evaluation of Montgomery County s Safe Speed Program
OLO Report 2010-3 September 29, 2009
49
roadway s proximity to schools, parks and crosswalks; the presence of a sidewalk; and the number of speeding concerns expressed by residents. From this process, Rockville determined the locations for fixed and mobile speed cameras sites.
In fall 2008, Rockville selected a second set of sites based upon citizen complaints, speed surveys, and previous citation issuance.
Public Awareness and Outreach. In addition to the outreach that the County and all the municipalities provide (described above), the City of Rockville:
Publicizes the weekly mobile deployment schedule of enforcement locations on the Police Department website;
Provides information on the local Rockville Channel; and
Emails information via neighborhood, civic and homeowner s association mailing lists.
Rockville staff report that coordination with the County has worked very well.
Program overview. The City of Rockville s Safe Speed Program is operated by the Photo Enforcement Unit, which is overseen by a Police Captain. In FY09, the City s Safe Speed expenditures were $1.8 million, with about $1.3 million allocated for the cost of Rockville s contract with the vendor.
The FY09 Safe Speed operating budget included a civilian supervisor (0.5 position), and four civilian photo technicians, who approve both red light and speed camera citations. In addition, the FY09 operating budget also included two new sworn police officers for traffic enforcement, and a half position of a civil engineer to assist in sidewalk and pedestrian walkway design. The civil engineer will also act as a pedestrian safety consultant to assess the City of Rockville's inventory and condition of sidewalks and crosswalks.
An initial 50-day warning period for the Safe Speed program began in March 2007, and the City of Rockville began issuing citations in May 2007. Table 7-3 (page 50) shows the number of City of Rockville speed camera enforcement sites, as of June 2009. Rockville also issues warnings for two weeks each time the City activates a new speed camera enforcement site.
Rockville deploys mobile speed cameras for about 18 hours a day, Monday through Saturday. As the number of violations decreases at mobile speed camera enforcement sites, the City rotates the mobile cameras among the enforcement locations on a weekly basis. Rockville typically operates mobile speed cameras at one location for a three-hour period before rotating to a new site.

Evaluation of Montgomery County s Safe Speed Program
OLO Report 2010-3 September 29, 2009
50
Table 7-3: City of Rockville Speed Camera Enforcement Sites, June 2009
Enforcement Area Fixed Speed Camera
Mobile Speed Camera
Total
Residential District 6 54 60
School Zone 4 1 5
Total 10 55 65 Source: City of Rockville
Program outcomes. In July 2009, Rockville staff reviewed the City s Safe Speed program based on 20 months of speed, citation, and collision data for speed camera sites. City staff analyzed the monthly data for each camera from the first full month a speed camera site was operational to April 2009 (the last full month of data). The data showed that:
The average speeds of vehicles decreased by 12% at fixed sites, with post-implementation average speeds below the posted speed limit at all fixed sites;
Only 1% of vehicles passing by the fixed speed cameras exceeded the speed limit by more than 11 miles per hour;
The total number of monthly citations decreased by 86%; and
The number of collisions within a half-mile of all speed camera sites decreased by 35%, compared to the year prior to the implementation of the program.3
In addition, the City found that after an initial peak at the start of the program, the number of citations flattens out after experiencing a steadily decline. In September 2007, the City issued over 3,000 citations a month from fixed speed camera sites, but issued about 400 in April 2009. Rockville staff note that while the City uses speed cameras to supplement traditional speed enforcement, the program has freed up officers to address other problems such as high-incident roadways not covered by the law.
Rockville staff report that of the 148,000 citations issued between May 2007 and April 2009, less than one percent were contested in District Court; one individual appealed the issuance of a speed camera citation to Circuit Court.
Allocation of net revenue. In FY07, the City of Rockville established the Speed Camera Fund, which is a special revenue fund used to track revenues and expenses associated with the City's speed camera program. Rockville staff report that the City intends to spend all net speed camera revenues to enhance traffic and pedestrian safety programs and capital projects. Table 7-4 on the next page shows how the City of Rockville used speed camera net revenue of $1.5 million in the FY09 Capital Improvements Program (CIP).
3 According to the City of Rockville, there were 68 collisions from May 2006 to April 2007, and 44 collisions from May 2008 to April 2009.

Evaluation of Montgomery County s Safe Speed Program
OLO Report 2010-3 September 29, 2009
51
Table 7-4: City of Rockville FY09 Expenditures of FY09 Net Safe Speed Revenue
Expenditure Amount ($ in 000s) Pedestrian bikeway system improvements $1,010
Pedestrian safety $320
Vehicles for City use* $105
Street lighting improvements $100
Total $1,535 Source: City of Rockville *Includes one police vehicle for traffic enforcement and one truck for signal and traffic light repair.
2. City of Gaithersburg
The City of Gaithersburg s speed camera program began in August 2007. The stated goal of the Gaithersburg Safe Speed program is to reduce speeding on streets in residential areas and near schools to prevent injuries and fatalities among pedestrians and motorists.4
Site selection. The City of Gaithersburg used a number of factors to select speed camera enforcement sites, including collision and citation history, complaints from the public, and proximity to pedestrian-heavy areas (e.g., parks, bus stops, etc.). The City s Police Department then conducted a traffic survey, and presented the data to the Police Chief s Advisory Council for input. The City Manager used the Police Department s and Advisory Council s input to make a final decision on enforcement locations.
Public Awareness and Outreach. In addition to the outreach that the County and all the municipalities provide (described above), the City of Gaithersburg:
Solicits input on speed camera locations using community-based emails;
Places variable electronic message signs at speed camera enforcement sites prior to enforcement;
Obtains feedback from the public at Mayor and Council meetings, and quarterly Council and the Community meetings;
Demonstrates how the technology works at National Night Out; and
Leaves the door open on mobile speed camera units to enable interaction with the community while deployed.
In the spring of 2008, the City of Gaithersburg raised the speed limit at the Watkins Mill speed camera enforcement site from 25 to 35 miles per hour. City staff made this change in response to public confusion regarding the speed limit on that roadway.
4 City of Gaithersburg. Safe Speed Program. 2009. http://www.gaithersburgmd.gov/poi/default.asp?POI_ID=1433&TOC=107;85;1433;

Evaluation of Montgomery County s Safe Speed Program
OLO Report 2010-3 September 29, 2009
52
Program overview. The City of Gaithersburg operates four fixed speed cameras and rotates one mobile speed camera among nine enforcement sites. The Safe Speed program is staffed by two part-time civilians, and supervision of the program has been assigned as an additional duty of a full-time Police Lieutenant. Program expenditures, not including the contract with the vendor, are approximately $70,000 each year.
The initial 30-day warning period for the Safe Speed program began in July 2007, and the City began issuing citations in August 2007. Table 7-5 shows the number of City of Gaithersburg speed camera enforcement sites, as of June 2009. Gaithersburg also issues warnings for 14 to 30 days each time the City activates a new speed camera enforcement site.
Table 7-5: City of Gaithersburg Speed Camera Enforcement Sites, June 2009
Enforcement Area Fixed Speed Camera Sites
Mobile Speed Camera Sites
Total
Residential District 2 7 9
School Zone 2 2 4
Total 4 9 13 Source: City of Gaithersburg
Gaithersburg staff report that the City is planning on deploying mobile can cameras, similar to the speed cameras used by Chevy Chase Village. Gaithersburg staff also stated that the speed cameras are used as an additional tool in speed enforcement, as the Police will continue to enforce speed limits using traditional hand-held radar or laser devices.
Program outcomes. Gaithersburg Police stated that there has been a reduction in speeds and collisions in the three locations where speed cameras have been operational for at least one calendar year. Table 7-6 shows the annual speed and collision data at these locations, as reported by Gaithersburg staff.
Table 7-6: City of Gaithersburg Speeds and Collisions at Three Speed Camera Sites
85th Percentile Speed (MPH)
Collisions Location Direction Speed
Limit
2007 2008
% Change
2007 2008
% Change
Eastbound 25 38 29 -24% West Deer Park Rd.
Westbound
25 38 33 -13% 12 9 -25%
Eastbound 25 37 30 -19% Quince Orchard Blvd.
Westbound
25 38 29 -24% 23 22 -4%
Eastbound 35 44 40 -9% Watkins Mill Rd.
Westbound
35 46 40 -13% 27 23 -15%
Source: City of Gaithersburg
In July 2007, Gaithersburg initially issued about 4,500 speed camera citations each month, but currently issues only about 1,500 citations each month. The City anticipates a significant reduction in revenue over time due to the success of the program in reducing the number of speeding violations at speed camera enforcement sites.

Evaluation of Montgomery County s Safe Speed Program
OLO Report 2010-3 September 29, 2009
53
Allocation of net revenue. According to Gaithersburg staff, the City intends to spend net speed camera revenues only on one-time public safety expenditures. In FY09, the City spent $316,000 to install sidewalks and traffic calming measures. Gaithersburg also spent $37,000 on police initiatives, such as accident reconstruction equipment, digital cameras, and traffic vests. The FY10 budget includes expenditures of net speed camera revenue to enhance crime prevention initiatives, roadway and sidewalk improvements, and pedestrian safe haven areas.
3. Chevy Chase Village
The Chevy Chase Village speed camera program began in October 2007. The goal of the Village s Safe Speed program is to reduce speeding on residential streets and near schools in an effort to prevent injuries and fatalities among pedestrians and motorists.5
Site selection. In 2007, the Chevy Chase Village Police Department selected streets for the Safe Speed program that met the standards set by the State law. To select specific enforcement locations, the Village utilized criteria such as collision data, speeding complaints from the public, and roadway design to select the locations.
Public Awareness and Outreach. In addition to the outreach that the County and all the municipalities provide (discussed above), Chevy Chase Village publicizes information about its speed camera program and enforcement locations through the local news media. While the Village has not done formal polling of residents, staff state that requests for additional locations and general support for the program are expressed at public hearings and communications sent to the Village Police Department.
Program overview. Chevy Chase Village operates two fixed speed cameras and rotates two portable can speed cameras among nine enforcement sites. The portable can speed cameras are mobile speed cameras shaped like a filing cabinet, and can be moved among enforcement sites throughout the municipality.
The Village s Safe Speed program is operated by three civilians: one full-time, and two part-time. In addition, 11 sworn police officers staff the program on a rotating basis. The program s FY08 budget was $1.3 million, with $1.1 million paid to the vendor.
The Village began issuing citations in October 2007 after an initial 30-day warning period. Table 7-7 shows the number of Village speed camera enforcement sites, as of June 2009. Both fixed sites and four of the nine portable enforcement sites are located on Connecticut Avenue.
Table 7-7: Chevy Chase Village Speed Camera Enforcement Sites, June 2009
Enforcement Area Fixed Speed Camera Sites
Mobile Speed Camera Sites Total
Residential District 2 7* 9
School Zone 0 2* 2
Total 2 9 11 Source: Chevy Chase Village *Chevy Chase Village s mobile speed cameras are portable can cameras, which are not attached to vans.
5 Chevy Chase Village. Safe Speed Program. 2009. http://www.ccvillage.org/layout.cfm?cat=4&subcat=359&cc=2

Evaluation of Montgomery County s Safe Speed Program
OLO Report 2010-3 September 29, 2009
54
Village staff stated that the speed cameras are an additional tool available to police, and that officers will continue to enforce speed limits using other hand-held radar or laser devices.
Program outcomes. In November 2008, Chevy Chase Village staff evaluated the program using 12 months of daily and monthly speed, citation, and collision data for speed camera sites (for all speed cameras operational since November 2007). During this period, the data showed:
The average speeds of vehicles decreased by 13% at enforcement sites;
The number of vehicles traveling more than 20-29 miles per hour above the speed limit decreased between 46-92%;
The total number of daily citations decreased between 46-85%; and
The number of collisions within a half-mile of all speed camera sites decreased by 34%, compared to the year prior to the implementation of the program.6
In addition, the Village found the speed camera violations tend to be clustered between the hours of 8 a.m. and 9 p.m.
Allocation of net revenue. Chevy Chase Village staff stated that the Village intends to spend net speed camera revenues only on one-time public safety expenditures. The Village is allocating net speed camera revenue on two projects, which are currently in the design phase:
$1.2 million pedestrian walkway along Brookville Road where a sidewalk currently does not exist; construction is planned for fall 2009; and
$4.6 million replacement of energy-efficient bulbs in streetlights, and new streetlights where additional lighting is needed; construction is planned for spring 2010.
The Village has also spent $18,000 on vehicles and equipment, and is currently conducting feasibility studies to install emergency phones in public spaces and video security systems.
4. City of Takoma Park
The City of Takoma Park s speed camera program began in April 2009. The goal of the Takoma Park speed camera program is to reduce speeding and collisions within the municipality.
Site selection. The site selection process began in 2007 when the City of Takoma Park Mayor and Council requested that the Police Department explore the Speed Camera Program. The City conducted initial traffic surveys in August 2007 on streets near schools within the City s borders, and conducted additional surveys in October 2007 to get a more accurate picture of speed conditions when school was back in session. In March 2008, the Takoma Park City Council installed fixed cameras on Ethan Allen Avenue and New Hampshire Avenue.
6 According to Chevy Chase Village, there were 67 collisions in the year prior to enforcement, and 44 collisions after speed camera enforcement.
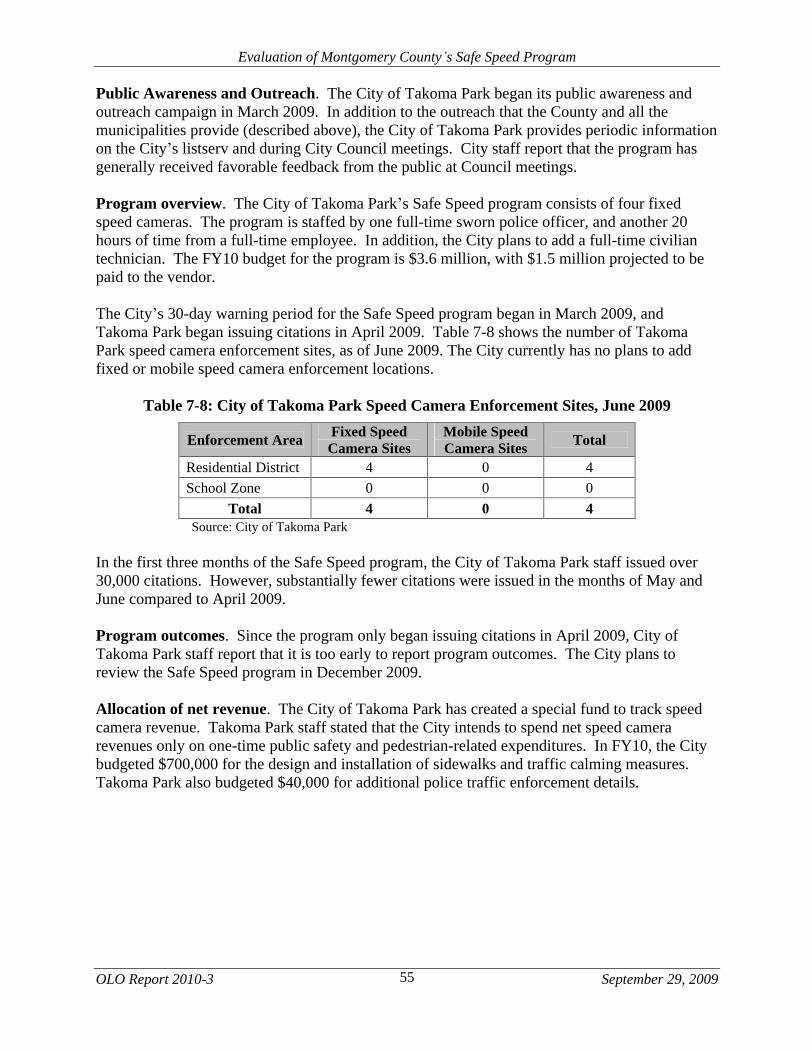
Evaluation of Montgomery County s Safe Speed Program
OLO Report 2010-3 September 29, 2009
55
Public Awareness and Outreach. The City of Takoma Park began its public awareness and outreach campaign in March 2009. In addition to the outreach that the County and all the municipalities provide (described above), the City of Takoma Park provides periodic information on the City s listserv and during City Council meetings. City staff report that the program has generally received favorable feedback from the public at Council meetings.
Program overview. The City of Takoma Park s Safe Speed program consists of four fixed speed cameras. The program is staffed by one full-time sworn police officer, and another 20 hours of time from a full-time employee. In addition, the City plans to add a full-time civilian technician. The FY10 budget for the program is $3.6 million, with $1.5 million projected to be paid to the vendor.
The City s 30-day warning period for the Safe Speed program began in March 2009, and Takoma Park began issuing citations in April 2009. Table 7-8 shows the number of Takoma Park speed camera enforcement sites, as of June 2009. The City currently has no plans to add fixed or mobile speed camera enforcement locations.
Table 7-8: City of Takoma Park Speed Camera Enforcement Sites, June 2009
Enforcement Area Fixed Speed Camera Sites
Mobile Speed Camera Sites Total
Residential District 4 0 4
School Zone 0 0 0
Total 4 0 4 Source: City of Takoma Park
In the first three months of the Safe Speed program, the City of Takoma Park staff issued over 30,000 citations. However, substantially fewer citations were issued in the months of May and June compared to April 2009.
Program outcomes. Since the program only began issuing citations in April 2009, City of Takoma Park staff report that it is too early to report program outcomes. The City plans to review the Safe Speed program in December 2009.
Allocation of net revenue. The City of Takoma Park has created a special fund to track speed camera revenue. Takoma Park staff stated that the City intends to spend net speed camera revenues only on one-time public safety and pedestrian-related expenditures. In FY10, the City budgeted $700,000 for the design and installation of sidewalks and traffic calming measures. Takoma Park also budgeted $40,000 for additional police traffic enforcement details.
Evaluation of Montgomery County s Safe Speed Program
OLO Report 2010-3 September 29, 2009
56
CHAPTER VIII: SPEED CAMERAS, DRIVER BEHAVIOR, AND ROADWAY SAFETY
This chapter presents quantitative measures of trends in driver behavior and roadway safety along road segments where MCPD has placed speed cameras. The measures presented in this chapter include data from speed cameras operated by MCPD.1 In addition, unless otherwise noted, OLO limited its analysis to data from speed cameras that had been operational for at least one year.
Section A summarizes the major findings of this chapter;
Section B presents data on the number of citations generated by the Safe Speed program;
Section C presents data on changes in vehicle speeds that occurred in the year after the activation of fixed speed cameras;
Section D presents data on reported collisions near speed camera locations; and
Section E discusses the relationship between traffic volume and the rate of speed camera violations and collisions.
Note on Interpreting the Data
This chapter reviews data on changes in driver behavior and roadway safety that coincided with the implementation of the Safe Speed program. Factors other than speed cameras, such as weather conditions, roadway conditions, and traffic volumes, may also have influenced the data trends presented in this chapter. Therefore, while the data show a correlation between implementation of the Safe Speed program and changes in driver behavior and roadway safety, OLO cannot assert that the program was the sole cause for these changes.
1 The measures presented in this chapter exclude data from speed camera programs managed by the municipalities in the County.

Evaluation of Montgomery County s Safe Speed Program
OLO Report 2010-3 September 29, 2009
57
A. Summary of Major Findings
As detailed in the sections below, OLO s data analysis produced the following findings.
Citations Issued
During FY09, the MCPD Safe Speed program generated 473,000 citations.
Without exception, the number of citations generated by each fixed speed camera declined precipitously within the first year after activation. For all fixed speed cameras, the number of citations issued per month decreased an average of 78% after one year of operation.
From May 2007 through June 2009, about two-thirds of speed camera citations were issued for vehicles that received one citation during that period. Only two percent of vehicles received more than five citations during this time frame.
Effective October 2009, State law will limit the operation of school zone speed cameras to the hours of 6:00 a.m. to 8:00 p.m., Monday through Friday. From May 2007 to May 2009, 53% of citations generated by fixed speed cameras in school zones were for violations that occurred during these hours; the other 47% were for violations that occurred between 8:00 p.m. and 6:00 a.m. on weekdays and on weekends.
Vehicle Speeds
One year after camera activation, vehicle speeds passing fixed speed camera sites declined by an average of six percent.
One year after camera activation, both the number of vehicles traveling above the speed limit and the number of vehicles exceeding the speed limit by 11 or more miles per hour declined by about 50% at fixed camera sites.
To comply with the new State law that takes effect on October 1, 2009, MCPD will have to raise its speed camera violation threshold from 11 to 12 miles per hour above the speed limit. Since program inception, about 32% of all MCPD Safe Speed citations were for vehicles measured at exactly 11 miles per hour above the posted speed limit.
Vehicle Collisions
The annual number of collisions within a half mile of a speed camera site decreased by 28% in the 12 months after speed camera activation as compared to the annual number for the previous four years. Collisions involving an injury or fatality declined by 39% compared to the pre-program rate.
The annual number of rear-end collisions in the vicinity of speed cameras decreased by 18% in the 12 months after speed camera activation.
While the overall rate of collisions declined in the first year following activation of speed cameras, collisions involving pedestrians and bicycles did not experience a parallel decrease.

Evaluation of Montgomery County s Safe Speed Program
OLO Report 2010-3 September 29, 2009
58
B. Citations
As detailed in Chapter V (page 35), after the County Police and its contractor verify that the photographic evidence of a speeding violation meets legal criteria, the Maryland Motor Vehicle Administration is asked to identify the owner of the vehicle. Upon receipt of registration information, the Police approve the issuance and mailing of a citation to the vehicle owner. This section presents data on the number of citations generated by the MCPD Safe Speed program.
1. Number of Citations Issued
From the inception of the Safe Speed program in May 2007 through the end of FY09, MCPD issued more than 742,000 citations. More than half of these violations occurred during the most recent fiscal year (FY09).
2. Citation Trends
OLO reviewed historic data on the number of citations issued during the first year after the activation of fixed speed cameras.2 The data offer a strong indication that drivers adjust their speed (i.e., slow down) after receiving a citation. Without exception, the number of citations generated by each fixed speed camera dropped precipitously one year after activation.
While a large range exists in the volume of citations generated by individual speed cameras, all experienced a large drop in activity one year after being activated. For example, the most prolific generator of citations, the speed camera in the 4600 block of eastbound Randolph Road, produced 11,659 citations during November 2007, its first full month of operation. One year later, in November 2008, that same camera generated 2,383 citations, an 80% reduction from the amount produced the previous November.
A similar pattern shows up at camera sites that generate a relatively smaller number of citations. For example, the speed camera in the 14000 block of southbound Dufief Mill Road produced 344 citations in January 2008, the smallest number for the first full month of any fixed camera site. In January 2009, the same Dufief Mill Road speed camera generated 92 citations, a 73% reduction from the previous January.
For the first 28 speed cameras installed by MCPD3, the number of citations issued per month decreased by an average of 78% after one year of operation. In other words, the number of citations generated by a speed camera decreased by 78% from the first full month of operation compared to the same month one year later. Table 8-1 on the next page shows that citations generated by individual speed cameras declined by a range of 63% to 93% after one year of camera activation.
2 This analysis does not include data on citation trends for mobile speed camera sites. MCPD varies the number of hours per month it deploys mobile speed cameras at different locations. As a result, a comparison of the number of citations issued per month at mobile speed camera locations would not be meaningful because the number of hours of operation differed from month to month.
3 For this analysis, OLO collected data from the first 28 fixed speed cameras installed by the MCPD. For each of these cameras, at least 13 months of post-activation data was available. OLO excluded from this analysis any fixed camera which had not been in operation for at least 13 months prior to the writing of this report.

Evaluation of Montgomery County s Safe Speed Program
OLO Report 2010-3 September 29, 2009
59
Table 8-1: First Year Reductions in Monthly Citations Generated by Fixed Speed Cameras4
Percent Reduction in
Citations Camera with Greatest 12-Month Reduction (Woodfield Road, 24200 block southbound)
93%
Camera with Lowest 12-Month Reduction (Montgomery Village Avenue, 18600 block northbound)
63%
Average (mean) Reduction (all cameras) 78%
Source: MCPD, OLO
The data consistently show that the number of citations per month generated by fixed speed cameras decreases steadily over time. Exhibit 8-1 displays the average percent change in the number of citations issued per month during the first year after camera activation.
Exhibit 8-1: Average Percent Change in Speed Camera Citations Issued per Month (first 28 fixed speed cameras installed by MCPD)
-48%-55%
-61% -60%
-68%-72%
-76% -77% -78% -78%
-40%
-22%
-100%
-80%
-60%
-40%
-20%
0%
20%
40%
1 2 3 4 5 6 7 8 9 10 11 12
Month After Installation
Per
cent
Cha
nge
in N
umbe
r of
Cit
atio
ns/M
onth
Baseline (first full month of camera operation)
Source: MCPD, OLO
In sum, citation trend data support the premise that speed cameras influence driver behavior and result in substantially fewer vehicles driving 11 or more miles per hour above the speed limit.
4 This table compares the 1st and 13th full months of camera operation. For example, OLO compared the number of citations issued by a camera in January 2008 (the first full month of operation for that camera) with citations issues in January 2009 (the 13th full month of operation).

Evaluation of Montgomery County s Safe Speed Program
OLO Report 2010-3 September 29, 2009
60
3. Multiple Citations to Same Vehicle Owner
Data on the number of citations issued per vehicle offer additional insight into the question of whether drivers modify their behavior after the activation of speed cameras. At the request of OLO, MCPD sorted all speed camera citations issued between May 2007 and June 2009 by vehicle. Table 8-2 shows how many citations were issued during this time period by the number of citations per vehicle.
Table 8-2: Speed Camera Citations Issued Per Vehicle May 2007 through June 2009
Number of Citations Issued to a Vehicle
Number of Vehicles
Percent of Vehicles
1 357,968 67.3%
2 100,756 18.9%
3 38,079 7.2%
4 16,692 3.1%
5 8,102 1.5%
6 4,277 0.8%
7 2,376 0.4%
8 1,405 0.3%
9 762 0.1%
10 540 0.1%
11-15 899 0.2%
16-20 163 0.03%
21-30 58 0.01%
> 30 7 0.001%
Totals 532,084 100.0%
Source: MCPD, OLO
Of the more than half a million discrete vehicles identified on speed camera citations between May 2007 and June 2009, two-thirds (67.3%) were vehicles that received one citation during that period. Only two percent of vehicles received more than five citations during this same time frame. In other words, very few drivers repeatedly pass speed cameras at excessive speed (11 or more miles per hour above the limit) after receiving a violation. These data suggest that for most drivers, the $40 fine effectively deters future speeding in speed camera enforcement locations.

Evaluation of Montgomery County s Safe Speed Program
OLO Report 2010-3 September 29, 2009
61
4. Distribution of Citations by Time of Day and Day of Week
The 2006 State law authorizing the County to employ speed cameras does not place any restrictions on the time of day or day of week that the cameras operate. As discussed in Chapter V, MCPD currently operates fixed speed cameras 24 hours a day, seven days week. MCPD deploy mobile speed cameras from approximately 6 a.m. to 9 p.m., Monday through Saturday.
The number of citations generated by speed cameras fluctuates by time of day and day of week. To understand the temporal variation of speed camera activity, OLO requested that MCPD provide fixed speed camera citation data sorted by time of day and day of week.5
Time of Day: The volume of citations generated by fixed speed cameras varies by hour of the day. As shown in Exhibit 8-2, speed cameras produce the largest number of citations during the mid-day hours (9am to 3pm).
Exhibit 8-2: Distribution of Fixed Speed Camera Citations by Hour of Day May 2007 through May 2009
0.0%
1.0%
2.0%
3.0%
4.0%
5.0%
6.0%
7.0%
8.0%
9.0%
12am 2a
m
4am
6am
8am
10am
12pm 2p
m
4pm
6pm
8pm
10pm
Time of Day
Per
cent
of
Cit
atio
ns
Source: MCPD, OLO
5 MCPD does not uniformly deploy mobile speed cameras at all hours and on all days. Therefore, OLO excluded data from mobile speed cameras from the presentation of citations by time of day and day of week.

Evaluation of Montgomery County s Safe Speed Program
OLO Report 2010-3 September 29, 2009
62
Day of Week: The volume of citations generated by fixed speed cameras also varies by day of the week. As shown in Exhibit 8-3, a larger number of speeding violations occur on Saturday and Sunday (16-18%) compared to each of the five weekdays (12-14%).
Exhibit 8-3: Distribution of Fixed Speed Camera Citations by Day of Week May 2007 through May 2009
0.0%
2.0%
4.0%
6.0%
8.0%
10.0%
12.0%
14.0%
16.0%
18.0%
20.0%
Sunday Monday Tuesday Wednesday Thursday Friday Saturday
Per
cent
of
Tot
al C
itat
ions
Source: MCPD

Evaluation of Montgomery County s Safe Speed Program
OLO Report 2010-3 September 29, 2009
63
School Zone Time Limitation: Of the 60 fixed speed cameras currently operated by MCPD, 22 are located in school zones. At present, fixed speed cameras in school zones operate 24 hours a day, seven days a week. As noted in Chapter IV, effective October 1, 2009, State law will limit the operation of school zone speed cameras from 6:00 a.m. to 8:00 p.m., Monday through Friday. In the opinion of the County Attorney, school zone speed cameras installed before October 2009 will be subject to the operating hour limitations set forth in State law (see Appendix C).
As shown in Exhibit 8-4, slightly more than half (53%) of the citations generated by fixed speed cameras located in school zones were for violations that occurred between 6:00 a.m. to 8:00 p.m. on weekdays. The remaining 47% were for violations that occurred between 8:00 p.m. and 6:00 a.m. on weekdays and on weekends.
Exhibit 8-4: Weekday, Weeknight, and Weekday School Zone Citations Fixed Speed Cameras, May 2007 through May 2009
Weekends, 36.3%
M - F (8pm to 6am) 10.4%
M - F (6am to 8pm) 53.3%
Source: MCPD
Had the 2006 authorizing legislation limited operating hours of automated enforcement in school zones, these speed cameras would have generated almost one half fewer citations. These off hour school zone citations represent about 11% of all MCPD speed camera citations issued between May 2007 and May 2009.
Evaluation of Montgomery County s Safe Speed Program
OLO Report 2010-3 September 29, 2009
64
C. Vehicle Speeds
As discussed in Chapter II, the National Highway Traffic Safety Administration (NHTSA) has identified speeding as one of the most prevalent factors contributing to traffic collisions, injuries, and fatalities. This section presents data on changes in vehicle speeds that occurred in the year after the activation of fixed speed cameras.
Speed cameras measure the speeds of all passing vehicles (including vehicles traveling below the violation speed), but only photographs those vehicles exceeding the speed limit by 11 miles per hour or more. Data collected by speed cameras present useful indications of travel speed trends from the time a camera became operational. OLO notes that insufficient data exist on vehicle speeds from the time period before
camera installation to conduct a meaningful comparison of speeds before and after program implementation.
1. Average Speeds
Speed camera programs aim to increase public safety through the reduction of driving speeds. One way to measure the effect of speed cameras is to track changes in the average driving speeds in the enforcement area. For the purpose of this report, average speed is the mean speed of all vehicles (during all hours of the day) at the time these vehicles pass the camera.
OLO reviewed average speed data collected during the year after the activation of fixed speed cameras operated by MCPD.6 These data indicate that average driving speeds decline in the area of speed cameras after activation of the cameras. Exhibit 8-5 on the following page displays the average percent change in average driving speeds during the first year after camera activation.7
6 This presentation of average speeds excludes mobile speed camera locations. As MCPD relocates mobile cameras to different locations on an irregular schedule, speed readings from these devises provide incomplete data sets for any specific enforcement location.
7 For this analysis, OLO collected data from the first 28 fixed speed cameras installed by the MCPD. For each of these cameras, at least 13 months of post-activation data was available. OLO excluded from this analysis any fixed camera which had not been in operation for at least 13 months prior to the writing of this report.

Evaluation of Montgomery County s Safe Speed Program
OLO Report 2010-3 September 29, 2009
65
Exhibit 8-5: Percent Change in Average Driving Speeds
at Fixed Speed Camera Locations
-2%-3%
-3%-4% -4%
-5%-5% -6% -6% -6% -6% -6%
-15%
-10%
-5%
0%
5%
1 2 3 4 5 6 7 8 9 10 11 12
Month After Installation
Per
cent
Cha
nge
in A
vera
ge S
peed
Baseline (first full month of camera operation)
Source: MCPD, OLO
For fixed speed cameras, the average speed of vehicles passing the site declined by an average of six percent one year after activation. At 40 miles per hour, a decline of six percent equates to a 2.4 miles per hour reduction in average speed. Table 8-3 shows the range of reductions in average speeds experienced during the first year after camera activation.
Table 8-3: First Year Reductions in Average Driving Speeds at Fixed Speed Camera Locations8
Percent Reduction
Camera with Greatest 12-Month Reduction (Randolph Road, 3300 block eastbound)
11%
Camera with Lowest 12-Month Reduction (Fisher Avenue, 19400 block southbound)
1%
Average (mean) Reduction: all cameras 6%
Source: MCPD, OLO
8 This table compares the 1st and 13th full months of camera operation. For example, OLO compared the average speed of vehicles passing by a camera in January 2008 (the first full month of operation for that camera) with average speed of vehicles passing the same camera in January 2009 (the 13th full month of operation).

Evaluation of Montgomery County s Safe Speed Program
OLO Report 2010-3 September 29, 2009
66
2. Excessive Speed
Average speed trend data provide information on the collective behavior of drivers but do not describe the conduct of individual drivers, particularly those who travel well above the speed limit. To learn more about the relationship between speed cameras and speeding, OLO measured changes in the percent of vehicles traveling at excessive speeds during the year after installation of fixed speed cameras. For the purpose of this report, the term excessive speed is defined as travel at 11 or more miles per hour above the posted speed limit.
During the first full month after camera activation, more than one-quarter of vehicles passed fixed speed camera sites traveling above the speed limit. About one out of every 50 vehicles (2%), passed the camera at 11 or more miles per hour above the speed limit. One year later, the percent of vehicles exceeding the speed limit at camera sites was cut in half. Specifically, after a full year of camera operation, the percent of vehicles traveling above the speed limit decreased to about 13% with less than one percent traveling at an excessive speed (11 or more miles per hour above the speed limit).
The decrease in the percent of vehicles traveling above the speed limit provides further evidence of the effect of speed cameras on driver behavior. Table 8-4 shows the percent of vehicles traveling above the speed limit during the first and 13th full months after camera activation.9
Table 8-4: Vehicle Speeds Passing Fixed Speed Camera Sites: First and Thirteenth Full Months After Camera Activation
Percent of Vehicles Passing Camera Site Traveling:
First Month After Activation
13th Month After Activation
At or Below Speed Limit 73% 87%
1 to 10 Miles Per Hour Above Speed Limit
25% 13%
11+ Miles Per Hour Above Speed Limit
2% <1%
Automated enforcement appears to have reduced vehicle speeds at all locations. Each fixed speed camera site studied by OLO experienced a decline in excessive speeding of at least 50%. In some locations, the effect was even greater. For example, in March 2008, about 1.8% of drivers passed the newly installed speed camera in the 14400 block of westbound Richter Farm Road at 11 or more miles per hour above the posted 35 mile per hour speed limit. One year later, in March 2009, only 0.2% of drivers passed the same camera at 11 or more miles per hour above the speed limit, a nearly 90% reduction in vehicles traveling at excessive speed.
9 For this analysis, OLO collected data from the first 28 fixed speed cameras installed by the MCPD. For each of these cameras, at least 13 months of post-activation data was available. OLO excluded from this analysis any fixed camera which had not been in operation for at least 13 months prior to the writing of this report.

Evaluation of Montgomery County s Safe Speed Program
OLO Report 2010-3 September 29, 2009
67
3. Violation Threshold
The 2006 State law authorized Montgomery County to issue speed camera citations for vehicles exceeding the posted speed limit by at least ten miles per hour. As a matter of practice, MCPD calibrated its speed cameras to generate citations for vehicles traveling 11 or more miles per hour above the speed limit. The new State law authorizing speed cameras Statewide permits an enforcement agency to issue speed camera citations for vehicles that exceed the speed limit by at least 12 miles per hour. As noted in Chapter IV, to comply with the new State law that takes effect on October 1, 2009, MCPD will have to raise its speed camera violation threshold from 11 to 12 miles per hour above the speed limit.
The change in violation threshold could have a dramatic impact on the number of citations generated by County speed cameras. Since program inception, 32% of all MCPD Safe Speed citations were for vehicles measured at 11 miles per hour above the posted speed limit. Had the 2006 authorizing legislation set a 12 mile per hour threshold, the MCPD Safe Speed program would have generated nearly a third fewer citations over the program s life to date.
Exhibit 8-6: Percent of MCPD Speed Camera Citations by Miles per Hour above the Posted Speed Limit
Source: MCPD, OLO
The percent of citations issued for vehicles traveling exactly 11 miles per hour over the speed limit remained mostly constant at individual speed cameras over the course of time. Even when the total number of citations dropped in the first months after camera activation, the proportion of violations at the 11 mile per hour level did not vary significantly.
11 mph over speed limit
32%
12+ mph over speed limit
68%

Evaluation of Montgomery County s Safe Speed Program
OLO Report 2010-3 September 29, 2009
68
D. Vehicle Collisions
The County Police maintain records of collisions that require response or intervention by a police officer. MCPD categorizes reported vehicle collisions into one of three categories:
Property Damage Only: collision that involved damage to a vehicle or other property, but did not result in any injury or fatality.
Injury: collision that resulted in an injury to a vehicle s driver, passenger, or pedestrian (may also involve property damage).
Fatality: collision that resulted in the death of a vehicle s driver or passenger (may also involve injury and property damage).
MCPD does not write a report for motor vehicle collisions where there are no injuries and where the vehicles can be safely driven away from the scene. Instead, a police officer responding to the collision checks license status, aids in the exchange of information, and clears the road.10 This section presents data on reported collisions near speed camera locations.
1. Number of Vehicle Collisions
OLO examined records of all reported vehicle collisions that occurred near speed camera locations that had been active at least 12 months. For these 28 fixed and 40 mobile speed camera locations, OLO tabulated the number of reported collisions within a half mile of each speed camera location11 that occurred during the four years immediately prior to activation of each speed cameras and during the first year after camera activation. Exhibits 8 7a, 8-7b, 8-8a, and 8-8b on the following pages show the results of this tabulation in two groups:
Collisions involving property damage only near fixed and mobile speed camera sites; and
Collisions that resulted in an injury or fatality near fixed and mobile speed camera sites.
10 Montgomery County Police Department. MCPD Directive, Function Code 1021. June 28, 2002. 11 OLO limited this calculation to collisions that occurred on the same roadway as a speed camera location but
excluded collisions within a half mile of a speed camera site that took place on a different roadway.

Evaluation of Montgomery County s Safe Speed Program
OLO Report 2010-3 September 29, 2009
69
Exhibit 8-7: Number of Collisions per Year: Property Damage Only
8-7a. Within ½ Mile of Fixed Speed Camera Sites
167173
166 163
134
0
20
40
60
80
100
120
140
160
180
200
37 to 48 MonthsBefore Camera
Activation
25 to 36 MonthsBefore Camera
Activation
13 to 24 MonthsBefore Camera
Activation
0 to 12 MonthsBefore Camera
Activation
0 to 12 MonthsAfter Camera
Activation
Cam
era
Act
ivat
ion
8-7b Within ½ Mile of Mobile Speed Camera Sites
86
93
67
93
69
0
10
20
30
40
50
60
70
80
90
100
37 to 48 MonthsBefore Camera
Activation
25 to 36 MonthsBefore Camera
Activation
13 to 24 MonthsBefore Camera
Activation
0 to 12 MonthsBefore Camera
Activation
0 to 12 MonthsAfter Camera
Activation
Cam
era
Act
ivat
ion
Source: MCPD, OLO

Evaluation of Montgomery County s Safe Speed Program
OLO Report 2010-3 September 29, 2009
70
Exhibit 8-8: Number of Collisions per Year: Involving Injury or Fatality
8-8a.Within ½ Mile of Fixed Speed Camera Sites
136
152
126 130
93
0
20
40
60
80
100
120
140
160
37 to 48 MonthsBefore Camera
Activation
25 to 36 MonthsBefore Camera
Activation
13 to 24 MonthsBefore Camera
Activation
0 to 12 MonthsBefore Camera
Activation
0 to 12 MonthsAfter Camera
Activation
Cam
era
Act
ivat
ion
8-8b.Within ½ Mile of Mobile Speed Camera Sites
76
68
77
57
33
0
10
20
30
40
50
60
70
80
90
37 to 48 MonthsBefore Camera
Activation
25 to 36 MonthsBefore Camera
Activation
13 to 24 MonthsBefore Camera
Activation
0 to 12 MonthsBefore Camera
Activation
0 to 12 MonthsAfter Camera
Activation
Cam
era
Act
ivat
ion
Source: MCPD, OLO
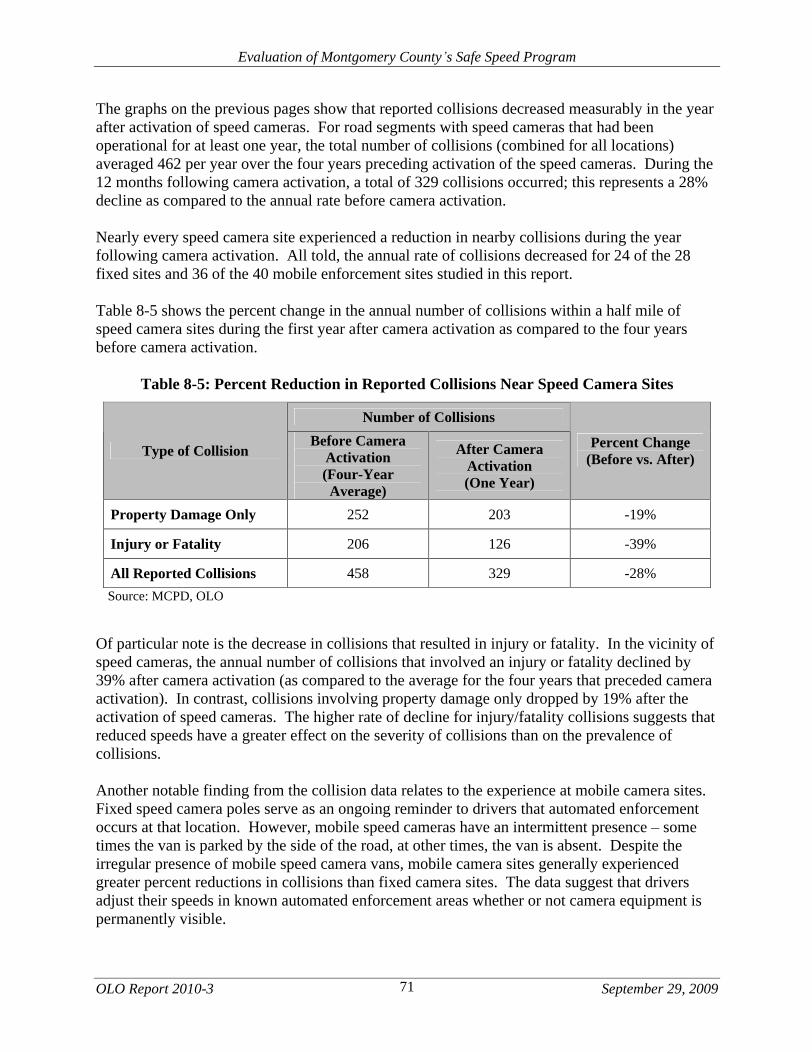
Evaluation of Montgomery County s Safe Speed Program
OLO Report 2010-3 September 29, 2009
71
The graphs on the previous pages show that reported collisions decreased measurably in the year after activation of speed cameras. For road segments with speed cameras that had been operational for at least one year, the total number of collisions (combined for all locations) averaged 462 per year over the four years preceding activation of the speed cameras. During the 12 months following camera activation, a total of 329 collisions occurred; this represents a 28% decline as compared to the annual rate before camera activation.
Nearly every speed camera site experienced a reduction in nearby collisions during the year following camera activation. All told, the annual rate of collisions decreased for 24 of the 28 fixed sites and 36 of the 40 mobile enforcement sites studied in this report.
Table 8-5 shows the percent change in the annual number of collisions within a half mile of speed camera sites during the first year after camera activation as compared to the four years before camera activation.
Table 8-5: Percent Reduction in Reported Collisions Near Speed Camera Sites
Number of Collisions
Type of Collision Before Camera
Activation (Four-Year Average)
After Camera Activation (One Year)
Percent Change (Before vs. After)
Property Damage Only 252 203 -19%
Injury or Fatality 206 126 -39%
All Reported Collisions 458 329 -28%
Source: MCPD, OLO
Of particular note is the decrease in collisions that resulted in injury or fatality. In the vicinity of speed cameras, the annual number of collisions that involved an injury or fatality declined by 39% after camera activation (as compared to the average for the four years that preceded camera activation). In contrast, collisions involving property damage only dropped by 19% after the activation of speed cameras. The higher rate of decline for injury/fatality collisions suggests that reduced speeds have a greater effect on the severity of collisions than on the prevalence of collisions.
Another notable finding from the collision data relates to the experience at mobile camera sites. Fixed speed camera poles serve as an ongoing reminder to drivers that automated enforcement occurs at that location. However, mobile speed cameras have an intermittent presence
some times the van is parked by the side of the road, at other times, the van is absent. Despite the irregular presence of mobile speed camera vans, mobile camera sites generally experienced greater percent reductions in collisions than fixed camera sites. The data suggest that drivers adjust their speeds in known automated enforcement areas whether or not camera equipment is permanently visible.

Evaluation of Montgomery County s Safe Speed Program
OLO Report 2010-3 September 29, 2009
72
2. Collisions Involving Fatalities
A small number of the collisions in the injury/fatality category involved fatalities. In the four years prior to camera activation, the County experienced an average of two fatal collisions per year in the vicinity of future MCPD speed camera sites. Three collisions resulting in a fatality occurred in the year after camera activation. OLO notes that the number of events in this category is too small to draw any definitive conclusions about the relationship between speed cameras and the prevalence of fatal collisions.
3. Rear-End Collisions
As discussed earlier in this chapter, the advent of automated speed enforcement in the County has coincided with a reduction in average vehicle speeds passing speed cameras. While national studies have found that slower vehicle speeds reduce the total number of collisions (see Chapter II), OLO sought to assess whether speed cameras are associated with an increase in rear-end collisions resulting from drivers suddenly decreasing speed before passing a camera. For the purpose of this report, a rear-end collision is defined as an incident reported to the police in which one vehicle makes contact with the rear of another vehicle and which results in property damage, injury, and/or fatality.
OLO counted the number of reported rear-end collisions within a half mile of each speed camera location that occurred during the four years immediately prior to activation of each speed cameras and during the first year after camera activation. Exhibits 8-9 and 8-10 on the following page show the number of rear-end collisions that occurred in the vicinity of fixed and mobile camera sites, respectively.

Evaluation of Montgomery County s Safe Speed Program
OLO Report 2010-3 September 29, 2009
73
Exhibit 8-9: Rear-End Collisions per Year Within ½ Mile of Fixed Speed Camera Sites
116 119
102 105
85
0
20
40
60
80
100
120
140
37 to 48 MonthsBefore Camera
Activation
25 to 36 MonthsBefore Camera
Activation
13 to 24 MonthsBefore Camera
Activation
0 to 12 MonthsBefore Camera
Activation
0 to 12 MonthsAfter Camera
Activation
Cam
era
Act
ivat
ion
Exhibit 8-10: Rear-End Collisions per Year Within ½ Mile of Mobile
Speed Camera Sites
3840
35
4037
0
5
10
15
20
25
30
35
40
45
37 to 48 MonthsBefore Camera
Activation
25 to 36 MonthsBefore Camera
Activation
13 to 24 MonthsBefore Camera
Activation
0 to 12 MonthsBefore Camera
Activation
0 to 12 MonthsAfter Camera
Activation
Cam
era
Act
ivat
ion
Source: MCPD, OLO
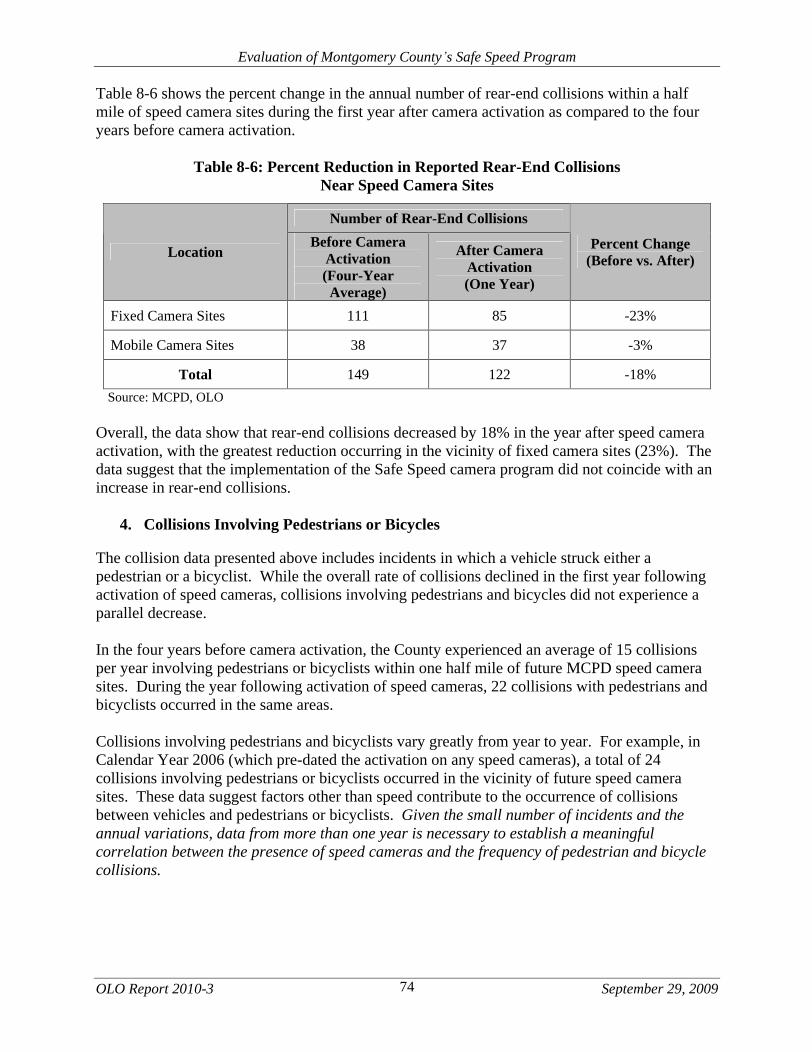
Evaluation of Montgomery County s Safe Speed Program
OLO Report 2010-3 September 29, 2009
74
Table 8-6 shows the percent change in the annual number of rear-end collisions within a half mile of speed camera sites during the first year after camera activation as compared to the four years before camera activation.
Table 8-6: Percent Reduction in Reported Rear-End Collisions Near Speed Camera Sites
Number of Rear-End Collisions
Location Before Camera
Activation (Four-Year Average)
After Camera Activation (One Year)
Percent Change (Before vs. After)
Fixed Camera Sites 111 85 -23%
Mobile Camera Sites 38 37 -3%
Total 149 122 -18%
Source: MCPD, OLO
Overall, the data show that rear-end collisions decreased by 18% in the year after speed camera activation, with the greatest reduction occurring in the vicinity of fixed camera sites (23%). The data suggest that the implementation of the Safe Speed camera program did not coincide with an increase in rear-end collisions.
4. Collisions Involving Pedestrians or Bicycles
The collision data presented above includes incidents in which a vehicle struck either a pedestrian or a bicyclist. While the overall rate of collisions declined in the first year following activation of speed cameras, collisions involving pedestrians and bicycles did not experience a parallel decrease.
In the four years before camera activation, the County experienced an average of 15 collisions per year involving pedestrians or bicyclists within one half mile of future MCPD speed camera sites. During the year following activation of speed cameras, 22 collisions with pedestrians and bicyclists occurred in the same areas.
Collisions involving pedestrians and bicyclists vary greatly from year to year. For example, in Calendar Year 2006 (which pre-dated the activation on any speed cameras), a total of 24 collisions involving pedestrians or bicyclists occurred in the vicinity of future speed camera sites. These data suggest factors other than speed contribute to the occurrence of collisions between vehicles and pedestrians or bicyclists. Given the small number of incidents and the annual variations, data from more than one year is necessary to establish a meaningful correlation between the presence of speed cameras and the frequency of pedestrian and bicycle collisions.

Evaluation of Montgomery County s Safe Speed Program
OLO Report 2010-3 September 29, 2009
75
E. Changes in Traffic Volume
As mentioned in the introduction to this chapter, multiple factors influence changes in the number of speed cameras citations or collision over time. One such factor is traffic volume (that is, the number of vehicles that pass speed camera sites in a given amount of time). An increase or decrease in the number of vehicles traveling along a road could explain, in part, variations in monthly rate of speed camera violations or collisions.
As detailed earlier in this chapter, the monthly rates of speed camera citations and vehicle collisions both dropped significantly during the year after camera activation. OLO sought to understand whether these reductions could be attributed to a decrease in traffic volume on roadways with speed cameras.
OLO compared the volume of traffic passing in front of fixed speed cameras during their first full month of operation against the traffic volume one year later.12 This analysis found that the combined traffic volume for these fixed sites decreased by about four percent over the year following camera installation. Two factors may have contributed to this decline in traffic volume:
The fixed cameras studied in this analysis were all activated between September 2007 and April 2008, which coincided with an economic downturn and sharp increases in gasoline prices. These factors led to a general reduction in vehicle miles traveled throughout the country. The State Highway Administration reports that vehicle miles traveled in Maryland decreased by about two percent from the first quarter (January through March) of 2008 to the first quarter of 2009.13
Driver behavior could also explain part of the reduction in traffic volumes at speed camera sites. Some drivers may have selected alternative routes in order to avoid speed camera locations.
However, as traffic volumes were down by only four percent in the first year of camera activation, driver route selection cannot be the primary cause for the sharp declines in citations (-78%) and collisions (-28%) that occurred during the first year after camera activation.
12 For this analysis, OLO collected data from the first 28 fixed speed cameras installed by the MCPD. For each of these cameras, at least 13 months of post-activation data was available. OLO excluded from this analysis any fixed camera which had not been in operation for at least 13 months prior to the writing of this report.
13 Maryland Department of Transportation, State Highway Administration, Estimated Vehicle Miles Traveled Distribution, June 2009.

Evaluation of Montgomery County s Safe Speed Program
OLO Report 2010-3 September 29, 2009 76
CHAPTER IX: PUBLIC OPINION REGARDING SPEED CAMERAS
This chapter summarizes the findings of public opinion surveys designed to measure driver attitudes about automated speed enforcement.
Section A summarizes the findings of national surveys on speed cameras and presents survey results from three jurisdictions;
Section B reviews available data on local public opinion about speed cameras; and
Section C summarizes the feedback received from two advisory bodies in the County.
A. Public Awareness and Support of Speed Cameras
Researchers have found that public education and awareness of automated speed enforcement are important to the success and can "make or break" a program.1 This section summarizes survey research on public awareness and support of speed cameras.
1. Nationwide Surveys
A 2002 National Highway Traffic Safety Administration nationwide survey of drivers age 16 or older examined the public s general awareness and perceptions of automated photo enforcement. The survey found that of the 4,000 respondents:
82% had heard of automated photo enforcement devices that do not require police officers to stop and ticket drivers;
78% believed that automated photo enforcement is a good idea to identify vehicles speeding in a school zone;
68% supported the identification of vehicles going more than 20 miles per hour over the speed limit;
63% felt it would be very acceptable to use speed cameras in locations where there had been many collisions;
56% felt speed camera programs should take a picture of the front of the vehicle so the specific driver can be identified, while 32% drivers thought photos should be taken only of the rear license plate; and
41% felt that violators should be fined, while 41% felt that violators should receive both a fine and points on his/her driver s license.2
The Insurance Research Council (IRC) conducted a nationwide survey of 1,005 persons in December 2006. The IRC survey found that 60% of respondents at least somewhat favor the use of speed cameras that photograph the license plates of vehicles traveling far in excess of a speed limit, with 31% strongly favoring speed cameras; an increase from a similar 2001 poll (52%).3
1 Turner, Shawn and Amy Polk. Overview in Automated Enforcement in Transportation. ITE Journal. June 1998. 2 National Highway Traffic Safety Administration. National Survey of Speeding and Unsafe Driving Attitudes and
Behavior: 2002. Department of Transportation. 2002. 3 Insurance Research Council. Public Support for Automated Traffic Enforcement is Strong and Growing
Findings From a New IRC Study. July 19, 2007. http://www.ircweb.org/news/20070719.pdf

Evaluation of Montgomery County s Safe Speed Program
OLO Report 2010-3 September 29, 2009 77
2. Case Studies of Public Opinion on Speed Cameras
Public opinion surveys from other jurisdictions show a majority of those polled view speeding as a problem and support the use of speed cameras. Table 9-1 (below) summarizes the results of three surveys of speed camera programs in the United States.
Table 9-1: Case Studies of Speed Camera Public Opinion
Scottsdale, Arizona
A 2006 survey by Behavior Research Center Inc. interviewed 407 residents of Scottsdale. The survey found that 70% of Scottsdale residents supported the City s speed camera program. A majority of respondents agreed that speeding is a serious problem.4
A 2006 IIHS telephone survey of 300 Scottsdale drivers showed that 77% of drivers supported the use of speed cameras on Loop 101 during the speed camera enforcement period.5
Charlotte, North Carolina
A 2004 University of North Carolina at Charlotte poll found a 67% acceptance rate of the speed camera program. The poll also found that 70% of respondents believed speeding was a major problem contributing to collisions along roadways. 6
Washington, DC
A 2002 IIHS telephone survey of 500 Washington, DC residents found that 51% of drivers favored speed cameras. The survey also found that support was higher among those who had not received a citation (64%) than those who had (44%). Support was also higher among drivers who said speeding was a problem (59%) than among those who said it was not (35%).7
4 City of Scottsdale, Arizona. Loop 101 Photo Enforcement. Behavior Research Center Inc. City Council Report. January 16, 2007.
5 Retting, Richard, Sergey Kyrychenko, and Anne McCartt. Evaluation of Automated Speed Enforcement on Loop 101 Freeway in Scottsdale, Arizona. Insurance Institute for Highway Safety. January 2008.
6 Cunningham, Christopher, Joseph Hummer and Jae-Pil Moon. An Evaluation of the Safety Affects of Speed Enforcement Cameras in Charlotte, NC. North Carolina State University. October 2005.
7 Retting, Richard and Charles Farmer. Evaluation of Speed Camera Enforcement in the District of Columbia. Insurance Institute for Highway Safety. November 12, 2002.

Evaluation of Montgomery County s Safe Speed Program
OLO Report 2010-3 September 29, 2009 78
B. Local Public Opinion
This section summarizes local public opinion about speed camera programs.
1. Public Opinion in the Mid-Atlantic Region
In 2006, the American Automobile Association (AAA) Mid-Atlantic conducted a telephone survey of 1,000 licensed drivers in the region, including 250 in Maryland. The survey results showed that:
66% of drivers felt that cameras are at least somewhat effective in combating aggressive driving;
71% of drivers felt that all counties in Maryland should be allowed to use speed cameras;
74% of drivers felt police should use speed cameras on neighborhood streets and in school zones; and
57% of drivers wanted to see speed cameras used on highways and major roads in Maryland.
8
As stated in Chapter IV, the Maryland General Assembly passed legislation earlier this year to authorize speed cameras statewide in school zones and highway work zones.
2. Montgomery County Resident Survey
In January 2008, the Insurance Institute for Highway Safety (IIHS) released an independent study of the County s speed monitoring program. IIHS research design included two components: (1) an analysis of vehicle speeds in enforcement zones; and (2) a resident survey on the general awareness and public opinion of the speed camera program in Montgomery County. IIHS surveyed a sample of 800 County residents, 18 years or older and licensed to drive.
The survey was conducted six month before (fall 2006) the County launched the Safe Speed program, and repeated six months after (November 2007). Before speed camera enforcement began, the IIHS survey asked drivers:
If speeding is a problem on residential streets;
If they favor/would favor the use of cameras to enforce laws against speeding on residential streets in Montgomery County; and
If speed cameras are currently in use.
After the program began, IIHS expanded the survey to ask questions such as whether knowing about speed cameras had caused respondents to reduce their speeds when traveling on residential streets in the County.9
8 AAA Mid-Atlantic. Legislative Issue Polls: Maryland. 2007. http://www.aaamidatlantic.com/PGA/LegPolls 9 Retting, Richard A., Charles M. Farmer, and Anne T. McCartt. Evaluation of Automated Speed Enforcement in
Montgomery County, Maryland. Insurance Institute for Highway Safety. January 2008.

Evaluation of Montgomery County s Safe Speed Program
OLO Report 2010-3 September 29, 2009 79
Follow-up Survey. IIHS conducted a follow-up study on Montgomery County s Safe Speed program in 2009. The study included a resident survey on the general awareness and public opinion of the speed camera program 18 months after speed camera enforcement (November 2008). According to IIHS, the complete study will be released in the fall of 2009.
Table 9-2 (below) summarizes IIHS major survey findings of the 2008 and 2009 studies.
Table 9-2: Summary of IIHS Resident Survey Findings
Survey Question Initial 6 Months Before
During 6 Months After
Follow-Up 18 Months After
Is speeding a problem on residential streets?
74% 74% 70%
Support Do you favor the use of cameras to enforce laws against speeding on residential streets?
58% 62% 64%
Awareness Are speed cameras currently in use in Montgomery County?
32% 60% 74%
Behavioral Change
Have speed cameras caused you to reduce your speed when traveling on residential streets?
N/A 57% 72%
Should the program be expanded to major arteries streets?
N/A 62% 61% Expansion of
Program Should the program be expanded to interstate highways?
N/A 47% 38%
Source: IIHS, 2008 and 2009
Of the 245 drivers who stated in the 2008 study that they opposed speed cameras, 34% stated that they were opposed to surveillance cameras in general, and 45% stated that they were only opposed to speed cameras. The survey found that opposition to speed cameras was higher among males and younger drivers (ages 18-34).
C. Comments from County Advisory Bodies
OLO solicited feedback on the Safe Speed program from two advisory bodies in the County:
Citizens Advisory Board for Traffic Issues; and
Pedestrian and Traffic Safety Advisory Committee.
This section summarizes the feedback received from these County advisory bodies.
Citizens Advisory Board for Traffic Issues. As stated in Chapter V, the members of the Citizens Advisory Board for Traffic Issues (CABTI) provide public input in the speed camera site selection process. CABTI is made up of pedestrian, bicycle, and traffic safety advocates, representatives from each of the County s Regional Service Centers citizen advisory boards, and other members from the community.

Evaluation of Montgomery County s Safe Speed Program
OLO Report 2010-3 September 29, 2009 80
CABTI stated that among burglaries and thefts, vehicle speeds and traffic safety are major public safety concerns in the community. CABTI members generally support automated speed enforcement as a means of reducing speeding, and expressed that a speed camera citation is somewhat of a bargain compared to a speeding citation issued by a patrol officer. While CABTI members stated that they observed reduced vehicle speeds in speed camera enforcement locations, some members perceived vehicles increasing speeds after leaving an enforcement location, and that some traffic has shifted to different routes to avoid the speed cameras.
Although CABTI members stated that they are aware of the speed camera locations in the County and how the program works, they stated that there are numerous areas of misinformation regarding the program in their respective communities, including:
How sites are selected and how the program works;
The dedicated uses of speed camera net revenue for public and pedestrian safety; and
Program results, such as data on speeds and collisions at enforcement locations.
CABTI members felt that increasing public awareness on these topics and improving the Safe Speed website would help address misunderstanding in the County about the program.
Pedestrian and Traffic Safety Advisory Committee. The Pedestrian and Traffic Safety Advisory Committee (PTSAC) advises the County Executive, Council, and other elected officials in the areas of pedestrian and bicycle safety and access. PTSAC is made up of volunteers from the public, and government agency representatives, all appointed by the County Executive.
PTSAC members stated that major public safety concerns in their respective communities include: pedestrian and bicycle safety; distracted drivers; stop sign and red light running; and speeding. PTSAC members generally understood how the program worked, and support automated speed enforcement as a means of reducing speeding, but some members expressed dissatisfaction with enforcement sites that are located on downhill roadways. Further, PTSAC members offered suggestions for improving the Safe Speed program, including:
Increasing education in how sites are selected and how the program works;
Increasing education and awareness of speed camera locations;
Continuing the involvement of the public in the program;
Continuing to ensure that speed limit and speed camera warning signs are visible; and
Assessing the engineering of roadways under speed camera enforcement to assure that speed limits are set properly and safety measures exist for all modes of travel.
PTSAC members also stated that MCPD should periodically supplement the Safe Speed program with actual police presence and should issue warnings to pedestrians that violate traffic laws.
Evaluation of Montgomery County s Safe Speed Program
OLO Report 2010-3 September 29, 2009 81
CHAPTER X: FINDINGS
This chapter summarizes the findings of the Office of Legislative Oversight s (OLO) evaluation of Montgomery County s Safe Speed program. The organization of OLO s findings parallels the organization of the report. In sum, the County s Safe Speed program has been implemented in compliance with State law. In addition, there is substantial quantitative evidence that both speeding and collisions have declined in the vicinity of speed camera enforcement sites since the inception of the program.
OVERVIEW OF AUTOMATED SPEED ENFORCEMENT
Finding #1: The primary objectives of a speed camera program are to deter speeding, to provide safer and more consistent speed enforcement, and to relieve the burden on limited police resources.
Speed cameras detect the speed of motor vehicles using radar or laser, and photograph vehicles exceeding a preset speed enforcement threshold. According to the research, jurisdictions implement speed camera programs:
To deter speeding and change driver behavior through the ability to detect and record multiple speeding violations per minute.
To consistently enforce speed limit laws on roads where traffic stops may be infeasible, dangerous, or cause congestion.
To allow law enforcement officials to efficiently enforce traffic laws while continuing to devote time to other demands. In addition, speed camera programs are typically violator-funded, which reduces or avoids the need for additional public resources.
Finding #2: National research organizations report that higher vehicle speeds are associated with increased risks of collisions and more severe pedestrian injuries.
According to the National Highway Traffic Safety Administration (NHTSA), lower vehicle speeds decrease both the likelihood of a collision, and the severity of injuries in cases that involve a pedestrian collision. NHTSA reports that during 2007, speeding was a contributing factor in 31% of all fatal collisions in the United States, and 35% of all fatal collisions in the State of Maryland.
In addition to increasing the risk of automobile collisions, speeding also contributes to more pedestrian injuries and fatalities. The Insurance Institute for Highway Safety (IIHS) reports that the risk of death for a pedestrian struck by a vehicle increases as vehicle speeds increase. For example, the risk of death for a pedestrian struck by a vehicle traveling at 20 mph is 5%; the risk of death increases to about 80% for a vehicle traveling at 40 mph.

Evaluation of Montgomery County s Safe Speed Program
OLO Report 2010-3 September 29, 2009 82
Finding #3: A federal review of speed camera program studies found that speed cameras
reduce the frequency of collisions.
NHTSA analyzed 13 empirical studies of speed camera programs. Each of the studies found significant reductions in collisions since the implementation of speed camera programs. Specifically, the implementation of speed camera programs was associated with a 20% to 25% reduction in collision resulting in injuries at fixed camera sites, and a 21% to 51% reduction in collisions resulting in injuries at mobile sites.
Finding #4: Objections to speed cameras include privacy and due process concerns, and the perception that the goal of a speed camera program is to raise revenue rather than increase safety.
Across the country, speed camera programs often engender complaints from some members of the community. One commonly voiced objection is that speed cameras infringe upon individual civil liberties. Opponents argue that:
Speed cameras invade personal privacy, especially when photos are taken of the vehicle s driver.
Speed cameras violate a person s right to due process; citations are a trial by camera, automatically presuming that the driver committed the offense.
Speed cameras have the potential to raise a significant amount of revenue through the collection of fines. This fact often leads to questions related to whether the goal of speed camera programs is to generate revenue or to increase safety. This revenue objection can become increasingly prevalent in communities where speed cameras are perceived to be covertly placed, or are located on roadways that are perceived as being safe to speed.
Other objections to speed cameras include the belief that there is a weak connection between speed limits and public safety; and that drivers approaching a speed camera may focus extra attention to the speedometer and less attention to the road ahead.
SPEED CAMERAS IN OTHER JURISDICTIONS
Finding #5: Montgomery County is among 48 jurisdictions in 11 states and the District of Columbia that have implemented speed camera programs.
While automated speed enforcement is used in about 75 countries, the number of jurisdictions using speed cameras in the United States remains relatively limited. According to the Insurance Institute for Highway Safety (IIHS), 48 jurisdictions in 11 states and the District of Columbia currently operate speed camera programs. Most of the jurisdictions identified began implementing speed camera programs in the past decade; the oldest program began in 1987.

Evaluation of Montgomery County s Safe Speed Program
OLO Report 2010-3 September 29, 2009 83
Finding #6: Jurisdictions implement speed camera programs in different ways.
Although state laws usually regulate local speed camera programs, most jurisdictions have some degree of local autonomy in implementing these programs. A review of the jurisdictions in the United States with speed camera programs shows implementation variations, including:
Characteristics of roadways eligible for speed camera enforcement;
The type of photograph taken (front or rear view of vehicle);
The person (driver or owner) responsible for the citation;
The level of penalty (fixed vs. graduated), including whether points are issued on the driving record;
The threshold speed over the posted limit at which a citation is issued; and
The extent to which program operations are contracted out.
LAW AUTHORIZING SPEED CAMERAS IN MONTGOMERY COUNTY
Finding #7: A new State speed camera law will change how the County operates the Safe Speed program.
In 2006, a State law went into affect authorizing the use of speed cameras only in Montgomery County. On October 1, 2009, a new State law will go into effect authorizing the limited use of speed cameras throughout the State. Three provisions of the 2009 State law will have notable impact on the County s Safe Speed program.
Hours of operation. The 2006 law did not limit speed camera hours of operation. The 2009 law limits the operation of school zone speed cameras from 6 a.m. to 8 p.m. on weekdays.
Violation threshold. The 2006 law allowed the County to issue citations for vehicles that exceeded the speed limit by at least ten miles per hour. The 2009 law restricts automated speed enforcement to vehicles exceeding the posted speed limit by at least 12 miles per hour.
Local authorization. The 2009 law will require that the Council authorize each individual new speed camera installed in the County after October 1, 2009.
The table on the next page summarizes the major differences between the 2006 and 2009 State speed camera laws.

Evaluation of Montgomery County s Safe Speed Program
OLO Report 2010-3 September 29, 2009 84
Major Differences between the 2006 and 2009 State Speed Camera Laws
2006 Law 2009 Law
Authority to use speed cameras
Montgomery County only Statewide
Location of speed cameras
School zones; and
Residential districts
School zones;
Residential districts;
(Montgomery County only); and
Highway work zones
Hours of operation No restrictions School zone cameras restricted to 6 a.m. to 8 p.m., Monday - Friday
Violation threshold At least 10 mph over posted speed limit
At least 12 mph over posted speed limit
Local authorization None required
For each new camera:
Public hearing; and
Council ordinance or resolution
Use of Revenues
Limited to related public safety purposes ; and
May not supplant existing local expenditures for the same purpose
Limited to public safety purposes
THE COUNTY S SAFE SPEED PROGRAM
Montgomery County began implementing the Safe Speed program shortly after the State authorizing legislation took effect in February 2006. The program uses speed cameras to photograph vehicles traveling 11 or more miles per hour above the speed limit on selected residential streets or school zones with a maximum speed limit of 35 miles per hour.
Finding #8: The County s Safe Speed program expanded from 18 mobile speed camera sites in May 2007 to 60 fixed and 59 mobile enforcement sites in June 2009.
The County s Safe Speed program uses a combination of fixed speed cameras and mobile speed camera vans. At the start of the program in May 2007, MCPD deployed mobile speed cameras to 18 enforcement sites in the County. The first fixed speed cameras were installed in September 2007. At present, the Safe Speed program operates at 60 fixed and 59 mobile enforcement sites.
MCPD rotates mobile speed cameras among enforcement locations from approximately 6 a.m. to 9 p.m., Monday through Saturday. Fixed speed cameras operate 24 hours a day, seven days a week. The State law authorizing the County Safe Speed program allows camera sites in residential districts and designated school zones. Currently, 22 fixed and eight mobile camera sites are located in school zones.

Evaluation of Montgomery County s Safe Speed Program
OLO Report 2010-3 September 29, 2009 85
County Speed Camera Enforcement Sites, June 2009
Enforcement Area Fixed Speed Camera
Mobile Speed Camera
Total Sites
Residential District 38 51 89
School Zone 22 8 30
Total 60 59 119 Source: MCPD
Finding #9: MCPD has implemented the Safe Speed program in compliance with the State law s requirements.
The 2006 State law authorizing speed cameras in the County includes provisions that govern the administration and operation of the speed camera program. As mandated by State law, MCPD:
Deploys speed cameras to photograph vehicles traveling at least ten miles per hour above the speed limit in selected school zones or residential streets with a maximum speed limit of 35 miles per hour.
Calibrates and tests speed cameras before operators begin detecting violations.
Record at least two time-stamped photographs of the rear of a vehicle in violation passing a stationary object.
Issues a $40 speed camera fine, which is treated as a non-moving violation and is not reported to insurance providers.
Allows a person issued a citation to contest the violation in District Court.
The 2006 State law provides that if a contractor operates a speed camera, the contractor s fee may not be contingent on the number of citations issued or paid. The County pays a contractor
$16.25 for each paid citation. According to an opinion from the Attorney General of Maryland s Counsel to the General Assembly, since County employees operate the speed camera systems, the prohibition on contingent-based pricing does not apply.
Finding #10: The County launched an ongoing public awareness and education campaign for the Safe Speed program, and involves representatives from the community in the site selection process.
In March 2007, the County launched a speed camera public awareness and education campaign. The County coordinated the campaign with the City of Rockville, City of Gaithersburg, Chevy Chase Village, and the Insurance Institute for Highway Safety. The County s ongoing public awareness and education campaign has consisted of press releases; informational materials; Photo Enforced warning signs; a website; a customer service telephone line; and warning
citations at the beginning of the program.

Evaluation of Montgomery County s Safe Speed Program
OLO Report 2010-3 September 29, 2009 86
The Police Department s speed camera site selection process involved data collection and consultation with representatives from the community. In the spring of 2006, MCPD solicited the participation of the community by forming the Citizens Advisory Board for Traffic Issues (CABTI). After receiving input from CABTI, the Police Department made the final decision on if and where the speed cameras will be located, as well as the sites enforced by either fixed or mobile speed cameras. MCPD plans to continue to solicit the participation of CABTI and the community at large to identify potential future enforcement sites.
SAFE SPEED PROGRAM BUDGET
Finding #11: Increases in program revenue primarily corresponded to the addition of new speed camera enforcement sites, from $12.5 million in FY08 to $18.6 million in FY09 to a budgeted $29.4 million in FY10.
In FY08, the first full year of the program, revenue was $12.5 million; in FY09, the revenue increased by 66% to $20.7 million. The approved FY10 budget includes estimated program revenue of $29.4 million.
Safe Speed Program Revenue, FY07-10 ($ in 000s)
FY07 FY08 FY09 FY10 Revenue Budget Actual Budget Actual Budget Estimate Budget
Citations 3,377
378
8,800
11,697
14,400
19,101
28,798
Late Fees 20
1
50
704
300
1,361
310
Other Fees* 20
- 75
64
75
288
245
Total Revenue $3,417
$379
$8,925
$12,464
$14,775
$20,747
$29,352
Source: OMB Note: Numbers may not sum to totals due to rounding. * Other Fees includes flagging fees, court payments, and non-sufficient funds (NSF) fees.
The increase in the amount of monthly citation revenue primarily corresponded with the increase in speed camera enforcement sites, and, to a greater extent, fixed speed cameras. The Safe Speed program has grown from 22 mobile speed camera enforcement sites in FY07 to 59 mobile and 60 fixed speed camera enforcement sites16 in FY09. In the first four months of enforcement, when the County deployed only mobile speed cameras, revenues increased from $28,000 in May to $298,000 million in August 2007. After the next four months, as fixed speed cameras were installed and activated, monthly revenue reached over $1 million in December 2007.
16 A fixed camera enforcement site represents one camera facing one direction. In many locations, two fixed cameras are co-located but face opposite directions. In such a case, these two cameras are considered as two enforcement sites.

Evaluation of Montgomery County s Safe Speed Program
OLO Report 2010-3 September 29, 2009 87
Finding #12: The FY10 budget for the Safe Speed program is $13.2 million; the contract
with the vendor accounts for 84% of the program s budget.
In FY08, the first full year of the Safe Speed program, the operating budget was $4.5 million. In FY09, the program budget almost doubled to $8.9 million. The approved FY10 budget for the Safe Speed program is $13.2 million.
Safe Speed Operating Costs, FY07-FY10 ($ in 000s)
FY07 FY08 FY09 FY10 Operating Cost
Budget
Actual
Budget Actual Budget Estimate
Budget Operating Expenses $0
$165
$2,093
$4,2692
$7,875
$7,525
$11,259
Contract with vendor 0
120
2,000
4,216
7,782
7,380
11,106
Public awareness materials 0
15
50
6
50
46
50
Fixed speed camera sites costs 0
11
30
3
30
28
30
Other 0
19
13
43
13
71
74
Personnel Costs $0
$109
$1,228
$933
$1,334
$1,167
$1,940
Total $0
$8
$3,321
$5,201
$9,250
$8,692
$13,199
Source: OMB Note: Numbers may not sum to totals due to rounding. Other category includes building space rental costs, motor pool chargebacks, telephone charges, and office supplies.
In FY10, operating expenses represent 85% ($11.3 million) of the Safe Speed program s total operating budget. MCPD s personnel costs account for the other 15% ($1.9 million) of the program s operating budget. The Safe Speed program has an approved FY10 personnel complement of one uniform position (1.0 workyear) and 33 civilian positions (29.8 workyears).
The cost of the County s contract with the speed camera vendor (Affiliated Computer Services State and Local Solutions, Inc.) is a rate of $16.25 per paid citation. This contract explains 84% of Safe Speed program s FY10 budgeted operating costs. According to MCPD, variability in the number of annual citations primarily explains the difference between budgeted and actual expenditures each year.
Finding #13: For FY10, the County allocated $13.1 million of Safe Speed net revenue for MCPD, Fire and Rescue Service, and pedestrian safety initiatives.
When the Council approved the FY10 operating budget, the County assumed that $13.1 million in net speed camera program revenues would be available for public safety and pedestrian safety expenditures. MCPD is budgeted to receive the largest share of speed camera, $8.6 million. MCPD plans to use these revenues to help fund staffing of the Educational Facilities Officers program; the Traffic Division; District Police Stations; the Gang Investigative Unit; and the Family Crimes Division.
The County has allocated $2.9 million in net FY10 speed camera revenues to fund Fire and Rescue Service expenditures including matching funds for grant-funded positions, apparatus and supply payments, and station staffing. In addition, the County budgeted $1.5 million for pedestrian safety initiatives in FY10 including education and outreach efforts.
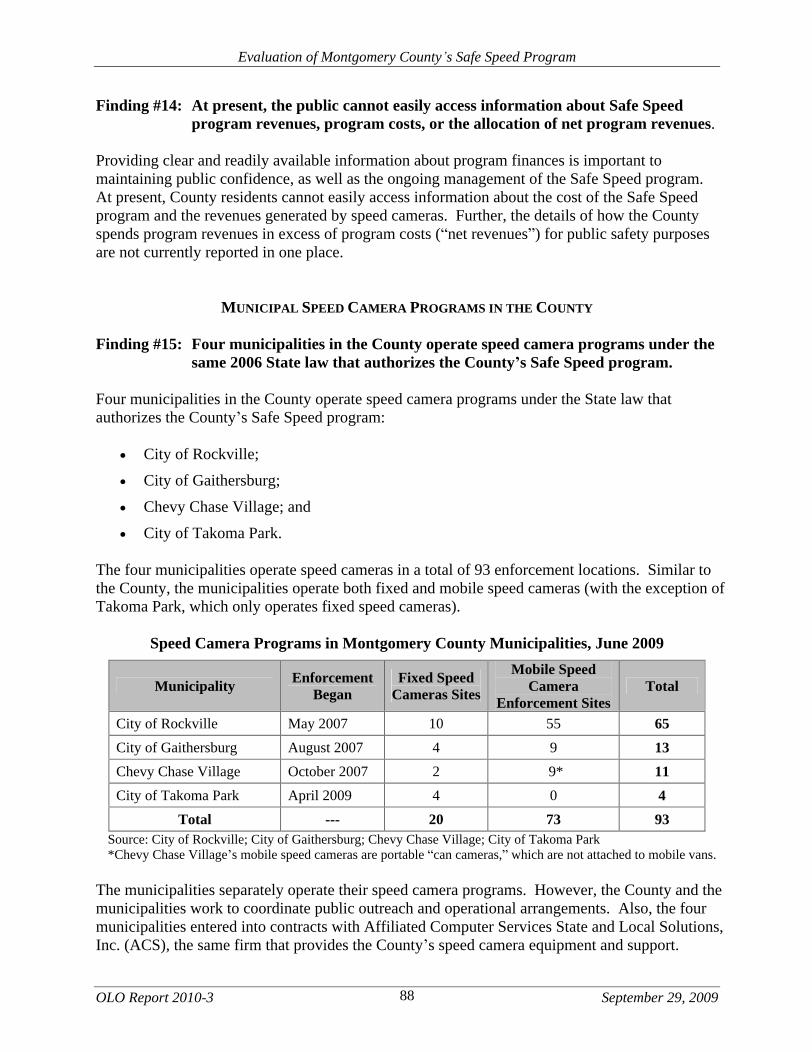
Evaluation of Montgomery County s Safe Speed Program
OLO Report 2010-3 September 29, 2009 88
Finding #14: At present, the public cannot easily access information about Safe Speed
program revenues, program costs, or the allocation of net program revenues.
Providing clear and readily available information about program finances is important to maintaining public confidence, as well as the ongoing management of the Safe Speed program. At present, County residents cannot easily access information about the cost of the Safe Speed program and the revenues generated by speed cameras. Further, the details of how the County spends program revenues in excess of program costs ( net revenues ) for public safety purposes are not currently reported in one place.
MUNICIPAL SPEED CAMERA PROGRAMS IN THE COUNTY
Finding #15: Four municipalities in the County operate speed camera programs under the same 2006 State law that authorizes the County s Safe Speed program.
Four municipalities in the County operate speed camera programs under the State law that authorizes the County s Safe Speed program:
City of Rockville;
City of Gaithersburg;
Chevy Chase Village; and
City of Takoma Park.
The four municipalities operate speed cameras in a total of 93 enforcement locations. Similar to the County, the municipalities operate both fixed and mobile speed cameras (with the exception of Takoma Park, which only operates fixed speed cameras).
Speed Camera Programs in Montgomery County Municipalities, June 2009
Municipality Enforcement
Began Fixed Speed
Cameras Sites
Mobile Speed Camera
Enforcement Sites Total
City of Rockville May 2007 10 55 65
City of Gaithersburg August 2007 4 9 13
Chevy Chase Village October 2007 2 9* 11
City of Takoma Park April 2009 4 0 4
Total --- 20 73 93 Source: City of Rockville; City of Gaithersburg; Chevy Chase Village; City of Takoma Park *Chevy Chase Village s mobile speed cameras are portable can cameras, which are not attached to mobile vans.
The municipalities separately operate their speed camera programs. However, the County and the municipalities work to coordinate public outreach and operational arrangements. Also, the four municipalities entered into contracts with Affiliated Computer Services State and Local Solutions, Inc. (ACS), the same firm that provides the County s speed camera equipment and support.

Evaluation of Montgomery County s Safe Speed Program
OLO Report 2010-3 September 29, 2009 89
Finding #16: Under the County s current memoranda of understanding (MOU) with the
municipalities, the County processes fines, fees, and penalties from municipal speed camera citations at no charge.
In 2006, the County signed separate memoranda of understanding (MOU) with the City of Rockville and Chevy Chase Village governing the collection of fines, fees, and penalties generated from speed cameras. In April 2009, the County signed a similar MOU with the City of Takoma Park.
From FY07-FY09, the County processed $15.9 million in speed camera fines, fees, and penalties for the four municipalities. As part of each MOU, the County Government agreed to process the payment of citations at no charge to the municipalities provided that the resources required for collection do not materially interfere with the other duties of the County s Department of Finance. The County has not entered into an MOU with the City of Gaithersburg but still processes the City s citations at no charge.
Payments Processed by MCPD for Municipalities, FY07-FY09 ($ in 000s)
Municipality FY07 FY08 FY09 Total FY07-FY09 Percent
City of Rockville $82
$3,512
$2,511
$6,105
38%
City of Gaithersburg $0
$1,163
$443
$1,605
10%
Chevy Chase Village $0
$2,877
$4,689
$7,566
48%
City of Takoma Park $0
$0
$620
$620
4%
Total $82
7,551
$8,263
$15,896
100%
Source: MCPD
In July 2009, MCPD initiated discussions with each of the municipalities to renegotiate the processing of speed camera fines, fees, and penalties. MCPD staff report that the revised MOU will include similar provisions as the previous MOU, but will require municipalities to pay a reasonable administrative fee to the County for collecting and remitting of municipal speed
camera citation fines, fees, and/or penalties.
MEASURES OF DRIVER BEHAVIOR AND ROADWAY SAFETY
Note on Interpreting the Data
This report reviews data on changes in driver behavior and roadway safety that coincided with the implementation of the Safe Speed program. Factors other than speed cameras, such as weather conditions, roadway conditions, and traffic volumes, may also have influenced the data trends presented. Therefore, while the data show a correlation between implementation of the Safe Speed program and changes in driver behavior and roadway safety, OLO cannot assert that the program was the sole cause for these changes.

Evaluation of Montgomery County s Safe Speed Program
OLO Report 2010-3 September 29, 2009 90
Finding #17: The number of citations generated by a speed cameras drops precipitously
within the first year of activation.
At all fixed speed camera locations that have been active for at least twelve months, the number of citations issued per month decreased sharply within one year after camera activation. On average, the number of citations generated by speed cameras decreased by 78% from the first full month of operation compared to the same month a year later. This trend supports the premise that speed cameras influence driver behavior.
Finding #18: During the first two years of the Safe Speed program, two-thirds of speed camera citations were issued to vehicles that received only a single citation.
Of the more than half a million vehicles identified on speed camera citations between May 2007 and June 2009, about two-thirds (67.3%) were vehicles that received only a single citation during that period. Only two percent of vehicles received more than five citations during the same time frame. These data suggest that for most drivers, the $40 fine effectively deters future speeding in speed camera enforcement locations.
Finding #19: Slightly more than half of the school zone speed camera citations were for violations that occurred between 6:00 a.m. to 8:00 p.m. on weekdays
Of the 60 fixed speed cameras currently operated by MCPD, 22 are located in school zones. At present, fixed speed cameras in school zones operate 24 hours a day, seven days a week. Effective October 1, 2009, State law will limit the operation of school zone speed cameras from 6:00 a.m. to 8:00 p.m., Monday through Friday. In the opinion of the County Attorney, school zone speed cameras installed before October 2009 will be subject to the more restrictive operating hour limitations set forth in State law.
About 53% of the citations generated by fixed speed cameras located in school zones were for violations that occurred between 6:00 a.m. to 8:00 p.m. on weekdays. The other 47% were for violations that occurred outside of these hours.
Had the 2006 authorizing legislation limited the operating hours of automated enforcement in school zones, these speed cameras would have generated almost one half fewer citations. These off hour school zone citations represent about 11% of the total citations (from all speed
cameras) issued between May 2007 and May 2009.

Evaluation of Montgomery County s Safe Speed Program
OLO Report 2010-3 September 29, 2009 91
Finding #20: After one year of automated enforcement, the speed of vehicles passing the
camera sites declined by an average of six percent.
Average speed data collected during the year after the activation of fixed speed cameras indicate that average driving speeds decline in the area of speed cameras after activation of the cameras. For fixed speed cameras installed by MCPD, the average speed of vehicles passing the site declined by an average of about six percent one year after activation. At 40 miles per hour, a decline of six percent equates to a 2.4 miles per hour reduction in average speed.
Finding #21: After one year of automated enforcement, the percent of vehicles exceeding the speed limit when passing camera sites was cut in half.
During the first full month after camera activation, more than one-quarter of vehicles passed fixed speed camera sites traveling above the speed limit. About one out of every 50 vehicles (2%), passed the camera at 11 or more miles per hour above the speed limit. One year later, about half as many vehicles exceeded the speed limit at camera sites. After a full year of camera operation, the percent of vehicles traveling above the speed limit decreased to about 13% with less than one percent of vehicles traveling at an excessive speed (11 or more miles per hour above the speed limit).
Vehicle Speeds Passing Fixed Speed Camera Sites: First and Thirteenth Full Months after Camera Activation
Percent of Vehicles Passing Camera Site:
First Month After Activation
Thirteenth Month After Activation
At or Below Speed Limit 73% 87%
1 to 10 Miles Per Hour Above Speed Limit
25% 13%
11+ Miles Per Hour Above Speed Limit
2% <1%
Finding #22: Since program inception, about 32 percent of speed camera citations were for vehicles measured at exactly 11 miles per hour above the posted speed limit.
Since the inception of the Safe Speed program, MCPD had calibrated its speed cameras to generate citations for vehicles traveling 11 or more miles per hour above the speed limit. To comply with the new State law that takes effect in October, MCPD will have to raise its speed camera violation threshold from 11 to 12 miles per hour above the speed limit. From May 2007 through May 2009, about 32 percent of Safe Speed citations were for vehicles measured at exactly 11 miles per hour above the posted speed limit.
If a similar percent of vehicles pass speed cameras at exactly 11 miles per hour above the speed limit after October, the program will generate about one third fewer citations than projected. As a result, the County will need to revise downward its earlier estimate of FY10 Safe Speed net revenue by up to $4 million.

Evaluation of Montgomery County s Safe Speed Program
OLO Report 2010-3 September 29, 2009 92
Finding #23: Total reported collisions within half mile of speed camera sites decreased by
28% in the year after camera activation; collisions involving an injury or fatality declined by 39% after program implementation.
The Police Department maintains records of collisions that require response or intervention by a police officer ( reported collisions ). An annual average of 462 reported collisions occurred within one half mile of camera sites during the four years preceding activation of the speed cameras. During the 12 months following camera activation, a total of 329 reported collisions occurred in the same locations, a 28% decline as compared to the pre-activation annual rate.
Percent Reduction in Reported Collisions near Speed Camera Sites
Number of Collisions
Type of Collision Before Camera
Activation (Four-Year Average)
After Camera Activation (One Year)
Percent Change (Before vs. After)
Property Damage Only 252 203 -19%
Injury or Fatality 206 126 -39%
All Reported Collisions 458 329 -28%
Source: MCPD, OLO
In the vicinity of speed cameras, the annual number of reported collisions that involved an injury or fatality declined by 39% after camera activation (as compared to the average for the four years that preceded camera activation). In contrast, reported collisions involving property damage only dropped by 19% after the activation of speed cameras. The higher rate of decline for injury/fatality collisions suggests that reduced speeds may have a greater effect on the severity of collisions than on the prevalence of collisions.
Finding #24: Implementation of the Safe Speed camera program did not coincide with an increase in rear-end collisions.
A common concern raised about automated enforcement is that speed cameras could lead to an increase in rear-end collisions as a result of drivers suddenly decreasing speed before passing a camera site. For all speed cameras that have been active for at least one year, the combined number of rear-end collisions occurring with one half mile of the site decreased by 18% in the year after speed camera activation as compared to the annual average for the four years immediately prior to activation.

Evaluation of Montgomery County s Safe Speed Program
OLO Report 2010-3 September 29, 2009 93
Finding #25: Collisions in the vicinity of speed cameras involving a pedestrian or bicyclist
vehicle increased in the year after speed camera activation.
While the overall rate of collisions declined in the first year following activation of speed cameras, collisions involving pedestrians and bicycles did not experience a parallel decrease. In the four years prior to camera activation, the County experienced an average of 15 collisions per year involving pedestrians or bicyclists within one half mile of future MCPD speed camera sites. During the year following activation of speed cameras, 22 collisions with pedestrians and bicyclists occurred in the vicinity of speed cameras.
PUBLIC OPINION REGARDING SPEED CAMERAS
Finding #26: In national surveys, a majority of drivers support the use of speed cameras.
A 2002 National Highway Traffic Safety Administration nationwide survey found that 78% of drivers viewed automated photo enforcement as a good way to identify vehicles speeding in a school zone; 68% of drivers expressed support for using speed cameras to identify vehicles traveling more than 20 miles per hour over the speed limit; and 63% supported the use of speed cameras in locations where there have been many collisions.
In addition, a 2006 nationwide survey by the Insurance Research Council found that 60% of respondents at least somewhat favor the use of speed cameras, with 31% strongly favoring the use of speed cameras.
Finding #27: A majority of County drivers surveyed stated that speeding is a problem and support the use of speed cameras.
The Insurance Institute for Highway Safety (IIHS) conducted a public opinion survey of County drivers six month before, six months after, and 18 months after the County launched the Safe Speed program. After 18 months of the County s speed camera enforcement, IIHS found:
70% of survey respondents agreed with the statement that speeding was a problem on residential streets.
64% of survey respondents supported the use of speed cameras on residential streets; an increase from the survey before enforcement began (58%).
72% of survey respondents who were aware of the speed camera program said that it had caused them to reduce their vehicle speeds.

Evaluation of Montgomery County s Safe Speed Program
OLO Report 2010-3 September 29, 2009 94
CHAPTER XI: RECOMMENDATIONS
There is substantial quantitative evidence that both speeding and collisions declined in the vicinity of speed camera enforcement locations since the inception of the Safe Speed program. While the program appears to have achieved its goal of increasing roadway safety, the Office of Legislative Oversight (OLO) recommends a number of further refinements to improve the County s automated speed enforcement, particularly in light of the recent changes in State law.
Recommendation #1: Ensure that public outreach and community involvement remain core aspects of the speed camera program.
A 2009 poll by the Insurance Institute for Highway Safety found that 64% of County residents support the use of speed cameras. Best practices research confirms that continued outreach and community involvement are essential to maintaining public support for the Safe Speed program.
The County designed and implemented a publicity campaign to educate the public on the purpose of the Safe Speed program and the location of enforcement zones. The County s ongoing efforts to maintain public awareness of speed cameras include: press releases; distribution of informational materials; Photo Enforced warning signs; a Safe Speed program website; and a dedicated customer service telephone line.
In addition, since 2006, the County has sought public input on speed camera site selection from the Citizens Advisory Board for Traffic Issues. The County also receives community input and feedback via the Safe Speed program website and the customer service telephone line.
OLO recommends the Council employ its oversight role to ensure continued public outreach and involvement in the speed camera program, specifically:
Ongoing outreach to inform residents of the purpose of the Safe Speed program and the location of enforcement areas;
Increased visibility of speed limit and speed camera warning signs;
Ongoing assessment of roadway design to assure that speed limits in speed camera enforcement zones are properly established;
Continued consultation with citizen advisory bodies about the locations of new enforcement zones; and
Publication of information about Safe Speed program expenditures, revenues, and use of net revenues (see next recommendation).

Evaluation of Montgomery County s Safe Speed Program
OLO Report 2010-3 September 29, 2009 95
Recommendation #2: Require that revenue and expenditure data related to the Safe
Speed program are readily accessible to the public on the County s website and in annual budget documents.
Providing clear and readily available information about program finances is important to maintaining public confidence, as well as the ongoing management of the Safe Speed program.
At present, County residents cannot easily access information about the cost of the Safe Speed program and the revenues generated by speed cameras. Further, the details of how the County spends program revenues in excess of program costs ( net revenues ) for public safety purposes are not currently reported in one place.
In order to maintain public confidence in the program, the Council should require that information on Safe Speed program expenditures, revenues, and the use of net revenues appear on the Safe Speed website and in future annual budget documents.
Recommendation #3: Request that the Executive revise agreements with municipalities to recover the County s full cost for collecting and processing speed camera fines, fees, and penalties.
In 2006, the County signed separate memoranda of understanding (MOU) with the City of Rockville and Chevy Chase Village governing the collection of fines, fees, and penalties generated from speed cameras. In April 2009, the County signed a similar MOU with the City of Takoma Park. As part of each MOU, the County Government agreed to process the payment of citations at no charge to the municipalities. The County has not entered into an MOU with the City of Gaithersburg but still processes the City s citations at no charge.
In July 2009, MCPD initiated discussions with the municipalities regarding the processing of speed camera fines, fees, and penalties. MCPD staff report that the revised MOU will include similar provisions as the previous MOU, but will require municipalities to pay an administrative fee to the County for collecting and remitting of municipal speed camera citation fines, fees, and/or penalties.
OLO recommends the Council ask the Executive to negotiate memoranda of understanding that require that either:
1. Municipalities process their own speed camera fines, fees, and penalties; or
2. The County recovers the full cost for collecting and processing speed camera fines, fees, and penalties for the municipalities.

Evaluation of Montgomery County s Safe Speed Program
OLO Report 2010-3 September 29, 2009 96
Recommendation #4: Provide policy guidance to the Executive on operational and
public outreach issues resulting from the new State requirement limiting the operating hours of school zone speed cameras.
MCPD currently operates fixed speed cameras 24/7, and deploys mobile speed cameras from approximately 6 a.m. to 9 p.m., Monday through Saturday. At present, 22 of the County s 60 fixed speed camera sites and eight of the 59 mobile speed camera sites are located in school zones. Effective October 1, 2009, State law will limit the operation of school zone speed cameras from 6 a.m. to 8 p.m., Monday through Friday. As a result, the County will have different hours of operation for cameras in residential districts (which are not affected by the time limitations) than for cameras located in school zones.
The Council should discuss the operational and related public outreach issues resulting from the new State requirement limiting the hours of school zone speed cameras. Specifically, the Council should consider the trade-off between:
The public confusion that would result from different operating hours for residential district and school zone speed cameras; and
The public safety consequences of limiting all speed camera operating hours (including those in residential zones) to 6 a.m. to 8 p.m., Monday through Friday.
Following consideration of the above trade-off, the Council should provide guidance to the Executive on the appropriate response to the new State limit on school zone speed camera operating hours.
Recommendation #5: Request that the Executive monitor driving speeds and collision rates to determine whether the restricted speed camera hours affect roadway safety.
Effective October 1, 2009, State law will restrict the operation of school zone speed cameras to the hours of 6 a.m. to 8 p.m., Monday through Friday. However, evidence exists that speeding occurs outside of these hours. In the more than two year history of the Safe Speed program, nearly half of all citations generated by school zone speed cameras were for violations that occurred on weekends or between 8 p.m. and 6 a.m. on weekdays.
The prohibition against using speed cameras to enforce speed limits in school zones during overnight hours and on weekends could prompt some motorists to drive at increased speeds in enforcement zones. OLO recommends the Council request that the Executive monitor driving speeds and collision rates to determine whether the restricted speed camera hours affect roadway safety both when speed cameras are operational and when they are shut off.

Evaluation of Montgomery County s Safe Speed Program
OLO Report 2010-3 September 29, 2009 97
Recommendation #6: Ask that the Executive adjust Safe Speed revenue projections to
account for changes in State law and identify budget modifications necessitated by reduced projected program revenue.
Operational changes mandated by the new State law could significantly reduce the number of citations issued and the amount of revenue generated by the Safe Speed program. Under the new State law:
MCPD must raise the violation threshold from 11 to 12 miles per hour above the speed limit. If the proportion of drivers traveling at exactly 11 miles per hour above the speed limit remains consistent with past trends, then the program would generate nearly a third fewer citations per camera than previously anticipated.
MCPD s operation of school zone speed cameras is limited to 6 a.m. to 8 p.m., Monday through Friday. If past trends hold, school zone camera citations could fall nearly 50% below projections.
These two changes could have a profound and unanticipated impact on Safe Speed revenues. All told, the new State law could reduce the number of speed camera citations and program revenue by about 40% below previous projections. A reduction of this magnitude could result in an FY10 shortfall of up to $5 million in the County General Fund.
OLO recommends the Council ask the Executive to adjust FY10 Safe Speed revenue projections to account for changes in State law. The Council should further request that the Executive identify budget modifications necessitated by reduced program revenues.
Recommendation #7: Decide which portions of this evaluation should become the Council s report to the General Assembly on the effectiveness of speed monitoring systems in Montgomery County.
The 2006 State law mandates that the County Council report to the General Assembly on the effectiveness of speed monitoring systems in Montgomery County by December 31, 2009.
As part of the FY10 OLO work program, the Council directed OLO to prepare a report that describes the Safe Speed program, evaluates program administration, and measures the effect of speed cameras on vehicle speeds and collisions. Consistent with the project scope in the approved work program, the report prepared by OLO includes information over and above the State-mandated reporting requirement. As such, the Council must decide which elements of this report should be included in the report to the General Assembly.
OLO recommends that the Council direct this Office to prepare a memorandum report on behalf of the Council that summarizes the major findings of: Chapter V (overview of the Safe Speed program; Chapter VI (overview of Safe Speed program budget); Chapter VIII (relationship between speed cameras, driver behavior, and roadway safety); and Chapter IX (public opinion). OLO will consult with the Executive Branch when preparing this memorandum report to the General Assembly.

Evaluation of Montgomery County s Safe Speed Program
OLO Report 2010-3 September 29, 2009
98
CHAPTER XII: AGENCY COMMENTS ON FINAL DRAFT
The Office of Legislative Oversight circulated a final draft of this report to the Chief Administrative Officer for Montgomery County. Copies were also shared with Police Department, Office of the County Attorney, and Office of Management and Budget staff who had worked with OLO throughout the study period. OLO s final report incorporates the technical comments and corrections provided by agency staff.
OLO appreciates the time taken by Executive Branch staff to review the draft report and provide comments. The written comments from the Chief Administrative Officer (CAO) are included in their entirety, beginning on the next page.


