evaluation of - muskie school of public service - university of maine
TRANSCRIPT

Evaluation ofAlpha One Independent Living Center's
Home to the CommunityDemonstration Program
June, 2001
Paul J. Saucier, M.A.Elise J. Bolda, Ph.D.
Mark F. Richards, B.S.Robert G. Keith, Ph.D.
Conducted with a grant from ThBuilding Health Systems
e Robert Wood Johnson Foundation through itsfor People with Chronic Illness Program

Comments and questions about this report may be directed to Paul Saucier or Elise Boldaat the Muskie School:
[email protected]@usm.maine.edu
Questions about the Home to the Community program may be directed to Dennis Fitzgibbons atAlpha One Independent Living Center:

Muskie School of Public Service i
Contents
Charts................................................................................................................................. ii
Executive Summary .......................................................................................................... 1
Background ................................................................................................................ 1
Evaluation Approach and Limitations ....................................................................... 1
Findings...................................................................................................................... 2
Lessons and Implications........................................................................................... 3
Terms Used in this Report ............................................................................................... 5
I. Background ............................................................................................................... 7
II. Evaluation Approach and Limitations.................................................................... 8
A. Approach in General ............................................................................................ 8
B. Data Sources and Collection................................................................................ 8
C. Limitations ......................................................................................................... 10
III. Findings.................................................................................................................... 12
A. Did 40 or more participants move out of nursing homes during the project? ... 12
B. What were the notable differences between program participants and acomparison group of non-participants? ............................................................. 15
C. Did the health status of participants improve after they moved out ofnursing homes? .................................................................................................. 21
D. Was physical function maintained by participants after they moved out ofnursing homes? .................................................................................................. 26
E. Did quality of life improve for participants after they moved out ofnursing homes? .................................................................................................. 29
F. What else was learned about participants who moved out of nursing homes?.. 32
G. How did public expenditures for participants in the community compare toparticipants' public expenditures in nursing homes? ......................................... 36
H. Did the attitudes of key nursing home staff about the ability of people withdisabilities to leave nursing homes change over the life of the project? ........... 38
I. Did the project have a lasting impact on public policy? .................................... 40
IV. Lessons and Implications ....................................................................................... 41
V. Summary.................................................................................................................. 42
Appendix A. List of Data Instruments......................................................................... 43

ii Muskie School of Public Service
Charts
Chart 1. Number of People in Various Program Categories..........................................14
Chart 2. Age Distribution...............................................................................................16
Chart 3. Admission Characteristics ...............................................................................16
Chart 4. Presence of Selected Conditions......................................................................17
Chart 5. Mobility............................................................................................................18
Chart 6. Eating and Dressing .........................................................................................18
Chart 7. Communication and Interactions .....................................................................19
Chart 8. Length of Stay in Nursing Home.....................................................................19
Chart 9. Able to be More Independent in Daily Activities............................................20
Chart 10. Selected Outcomes...........................................................................................20
Chart 11. Open Sores or Ulcers .......................................................................................22
Chart 12. Seven or More Medications or Urinary Tract Infection ..................................22
Chart 13. Self-Rated Health.............................................................................................23
Chart 14. Satisfaction with Health...................................................................................23
Chart 15. Pain (N=12)......................................................................................................24
Chart 16. Depression & Antidepressant Use ...................................................................24
Chart 17. "Downhearted and Blue" .................................................................................25
Chart 18. Sleep Patterns...................................................................................................25
Chart 19. Independence in Activities of Daily Living.....................................................27
Chart 20. Need Extensive or Total Assistance with Mobility .........................................27
Chart 21. Performance of Household Chores ..................................................................28
Chart 22. Active Homemaking for 21 or More Hours per Week ....................................28
Chart 23. Sense of Privacy...............................................................................................30
Chart 24. Life Control......................................................................................................30
Chart 25. Choice of Workers and Schedules ...................................................................31
Chart 26. Number of Movers with Medicaid Claims in 1st Year Post-move,by Category of Service.....................................................................................33
Chart 27. Days Enrolled in HTC Prior to Move (N=26) .................................................34
Chart 28. Living Arrangements of Movers (N=26).........................................................34
Chart 29. Housing Subsidy ..............................................................................................35
Chart 30. Average Monthly Medicaid Expenditures per Mover (for Moverswith Pre- & Post-move Claims ........................................................................37
Chart 31. Average Monthly Public Service Expenditures (for Movers withOther Public Service Expenditures).................................................................37
Chart 32. Selected Pre and Post Responses of Nursing Home Staff RegardingHypothetical HTC Participant..........................................................................39

Muskie School of Public Service 1
Executive Summary
Background
In March, 1997, Alpha One Independent Living Center began a statewide nursing hometransition project in Maine named Home to the Community, funded by The Robert WoodJohnson Foundation through its Building Health Systems for People with Chronic IllnessProgram. The Muskie School of Public Service at the University of Southern Maine wasawarded a grant by The Robert Wood Johnson Foundation to conduct an evaluation ofthe program. This report presents the findings from the evaluation.
The primary goal of Home to the Community was to assist 40 adults under 60 years ofage to move out of Maine nursing homes over a 3-year period. Two years into the project,lower than projected program participation led to a decision to remove the age cap (whichopened the program to adults of all ages) and to extend the program an additional year,through February, 2001.
Alpha One hypothesized that participants who moved would maintain function whileenjoying improved health and quality of life, and that public expenditures would be nogreater in the community than they were in the nursing home. Alpha One would identifypotential participants, provide life skills training to them while still in the nursing home,and help arrange the housing and services they would need to self-direct their supports inthe community.
Evaluation Approach and Limitations
The evaluation had several components and relied on multiple data sources, includingnursing home resident assessments (Minimum Data Set, MDS), community serviceconsumer assessments (Medical Eligibility Determination, MED), in-person participantsurveys, a survey of nursing home staff, Medicaid claims, Alpha One project forms(including intake forms and progress notes), and key informant interviews with Stateofficials and Alpha One staff. Changes in the health status, physical functioning andquality of life of participants were measured over time using a pre/post design with acomparison group. Although a wealth of information was collected regarding eachperson in the project, a significant limitation of the evaluation is the small number ofproject participants.
2 Muskie School of Public Service
Findings
The answers to the following evaluation questions are summarized here and addressedfurther in the report.
1. Did 40 or more participants move out of nursing homes during the life of the project?
26 program participants moved out of nursing homes between March 1,1997 and October 31, 2000. Alpha One provided services to an additional24 participants who did not move.
2. What were notable differences between program participants and a comparisongroup of non-participants?
Participants who moved were more mobile, were more likely to eatindependently, were less likely to be incontinent, had good expressive andreceptive communication skills, had shorter nursing home stays, and weremore likely to believe they could be more independent in the performanceof daily activities.
3. Did the health status of participants improve after they moved out of nursing homes?
Health indicators were mixed but overall, a greater number of indicatorsimproved than declined.
4. Was physical function maintained by participants after they moved out of nursinghomes?
Functioning was maintained over time. Almost all measures of physicalfunction showed little or no change over time.
5. Did quality of life improve for participants after they moved out of nursing homes?
Quality of life improved, with most indicators showing improvement or nochange.
6. How did public expenditures for participant services in the community compare topublic expenditures for participants’ nursing home care?
Public expenditures decreased when participants moved into thecommunity. Medicaid expenditures decreased in the first year of
Muskie School of Public Service 3
community living, and fell further in the second year. Other publicexpenditures included housing subsidies, transportation, food assistanceand fuel assistance. These went up in the community but were more thanoffset by Medicaid savings. A limitation of the expenditure study is thatMedicare claims data were not available. At least 10 of the participantswho moved were known to be Medicare beneficiaries.
7. Did the attitudes of key nursing home staff about the ability of people with disabilitiesto leave nursing homes change over the life of the project?
Surveys of directors of nursing and social services directors in nursinghomes in 1997 compared with surveys in 2000 did not find any significantchanges in attitudes toward independent living.
8. Did the project have a lasting impact on public policy?
Although Maine Medicaid policy has not changed to allow for fullreimbursement of the nursing home transition activities provided in thisdemonstration program, there is some evidence that the program hasinfluenced public policy. Most notably, the prior approval process fordurable medical equipment was streamlined to ensure timely delivery ofwheelchairs and other equipment to movers. As a very early nursinghome transition project that pre-dated federally-sponsored programs in 12states, Home to the Community may have had an influence on federaldemonstrations and recent federal policy clarification in this area.
Lessons and Implications
A number of lessons may be gleaned from Home to the Community to inform policymakers and program designers. They include the following:
• The likelihood that someone will move out of a nursing home is related to the lengthof time the person has been in the nursing home;
• Availability of affordable and accessible housing is critical;
• Current federal Medicaid reimbursement policy for transition services falls short forsome potential movers;
• The consumer-directed services model offered in Home to the Community appearedto work well for those who enrolled in the program, but it limits the target group forsuch programs;
• A nursing home transition program is more likely to enjoy a high participation rate ifthe program is well integrated into a State’s existing long term care entry andreassessment mechanisms;

4 Muskie School of Public Service
• Identification of participants is easier when a state initiates a project and can shareconfidential consumer information with its project contractors; and
• Nursing home staff should be engaged in transition projects.
These lessons are discussed further in the report.

Muskie School of Public Service 5
Terms Used in this Report
Alpha One Independent Living Center (or Alpha One). Alpha One is Maine’s onlyIndependent Living Center and provides Independent Living Skills (ILS) servicesstatewide. Alpha One is the agency that designed and administered the Home to theCommunity demonstration program.
Nursing Home Transition Program. A program designed to assist nursing homeresidents to move to more integrated settings. Home to the Community is a nursing hometransition program.
Home to the Community (HTC). Home to the Community is the name of thedemonstration program that was evaluated.
Participant. A person who enrolled at any time in Alpha One’s Home to the Communityproject. Participants include those who moved into the community (movers) and thosewho stayed in the nursing home.
Mover. A participant who moved out of a nursing home while enrolled in Home to theCommunity.
Comparison Group. Nursing home residents in the Target Group, excluding Home tothe Community participants (who moved or did not move).
Target Group. The universe of Maine nursing home residents who met the initialcriteria established by Alpha One for the Home to the Community program. Initial criteriawere:
• 18-59* years old;• Acting as own guardian;• No terminal prognosis; and• In a nursing home for at least 30 days.
*The upper age limit of 59 was eliminated at the end of Year 2 in response to lower-than-projected participation.
A Note on the Quotations
The quotations that appear in boxes throughout this report are all from Home to theCommunity participants. They were taken from responses to open-ended surveyquestions.


Muskie School of Public Service 7
I. Background
In March, 1997, Alpha One Independent Living Center launched Home to theCommunity, a statewide nursing home transition program in Maine. Funded by TheRobert Wood Johnson Foundation through its Building Health Systems for People withChronic Illness Program, the program’s goal was to assist forty (40) people between theages of 18 and 59 move out of nursing homes.1 The Muskie School of Public Service atthe University of Southern Maine was awarded a grant by The Robert Wood JohnsonFoundation to conduct an evaluation of the program. This report presents the findingsfrom the evaluation.
Home to the Community was designed to capitalize on Alpha One’s long history ofproviding independent living services and peer support to people with disabilities inMaine. Using its statewide network of professionals and peers, Alpha One used grantsupport to identify nursing home residents who met the program criteria and to provideindependent living services to them while they were in the nursing home and after theymoved. Services provided included independent living skills training, identification andadaptation of accessible housing, and peer support. Also important was pre-moveprocurement of durable medical equipment, such as power wheelchairs. Alpha One hadidentified “Catch 22” Medicaid reimbursement policies that typically did not allowreimbursement for these services and equipment unless a consumer was already living inthe community. Alpha One sought to demonstrate that providing the services andequipment to nursing home residents would enable them to move out. If thedemonstration were successful, it would convince policy makers to change Medicaidreimbursement policy and make the approach sustainable after the grant period.
Since Home to the Community started in 1997, nursing home transition projects havebeen initiated in several other states. Beginning in 1998, the federal Health CareFinancing Administration and the Office of the Assistant Secretary for Planning andEvaluation within the federal Department of Health and Human Services have awardednursing home transition grants to 12 states, targeting a variety of population groups.2 Thefederal agencies intend to award additional nursing home transition grants as part of amulti-pronged initiative to assist states with disability and long term care systemimprovements in light of the Olmstead decision. The Health Care FinancingAdministration has also been working to clarify the federal limits of Medicaid policy as itrelates to nursing home transition services.
1 The upper age limit of 59 was eliminated at the end of Year 2 in response to lower-than-projectedparticipation.
2 Projects have been funded in Arkansas, Colorado, Florida, New Hampshire, New Jersey, Pennsylvania,Rhode Island, Texas, Vermont and Wisconsin.

8 Muskie School of Public Service
II. Evaluation Approach and Limitations
A. Approach in General
The evaluation was designed to assess whether or not a series of outcomes predicted byAlpha One at the beginning of the project were achieved. These included the following:
• At least forty (40) participants would move out of nursing homes during the project;
• Health status of participants would improve after they moved out of nursing homes;
• Functional status of participants would be maintained by participants after theymoved out of nursing homes;
• Quality of life would improve for participants after they moved out of nursing homes;
• Public expenditures for participants in the community would be no greater thanexpenditures for their care in nursing homes;
• Greater awareness would be achieved among key nursing home staff about the abilityof people with disabilities to move out of nursing homes; and
• The project would have a lasting impact on public policy.
To describe participant outcomes and changes in their health status, physical function andquality of life, we used a pre/post design with a comparison group. An analysis ofMaine’s nursing home resident assessment data from the federally mandated MinimumData Set (MDS) at the start of the project identified 201 people in Maine nursing homeswho fit the program criteria established by Alpha One. The comparison group wascomprised of those who met the original program criteria but did not become HTCparticipants.
B. Data Sources and Collection
In order to minimize the intrusiveness and costs of data collection, existing data sourceswere used when possible. Maine’s long term care system uses comparable items onautomated assessment instruments used to describe nursing home residents’ needs(Minimum Data Set, or MDS) and for determining eligibility for nursing home orcommunity-based long term care services (Medical Eligibility Determination, or MED).A supplemental tool was created for use with existing assessment instruments to obtaindata on other health and related items of interest for this evaluation.
The assessment tools do not include quality of life indicators, so we developed aparticipant survey that focused primarily on quality of life. This instrument drew heavilyon the instrument development work of Phillip Beatty at the National RehabilitationHospital Research Center and included concepts developed by James Conroy at theCenter for Outcome Analysis.
Muskie School of Public Service 9
To assess public expenditures, we used a combination of Medicaid claims and, formovers, a separate consumer expenditure survey that asked participants to provide aninventory of their non-Medicaid public subsidies and services including housingsubsidies, transportation, food stamps and fuel assistance. We also asked them to reportearned income so that income and payroll taxes could be estimated and applied to offsetpublic expenditures as applicable.
Nursing home resident assessment data were collected and reported by facility stafffollowing routine reporting requirements. Monitoring the timeliness and reliability ofthese data are a function of the quality assurance program of Maine’s nursing home casemix reimbursement system under Medicaid.
Medical Eligibility Determination (MED) assessments for nursing facility andcommunity-based long term care services are conducted under contract with the State ofMaine. Two statewide contractors conduct in-person assessments. Alpha One is thestatewide contractor for persons seeking or receiving support for self-directed servicesunder the Medicaid Home and Community-based Waiver for Adults with Disabilities.All MED data, and supplemental health and related item questions for this evaluationwere collected from assessments conducted by Alpha One.
Participant surveys for quality of life information were conducted in-person by theevaluation team’s interviewer (a single individual throughout the 4 year period). Tomaximize the likelihood of participation, we offered a $25 gift certificate to L.L. Bean ora supermarket chain for each interview. (Our concerns of intrusiveness notwithstanding,every Home to the Community participant agreed to take part in the evaluation). In-personinterviews were conducted with participants:
• at the time of enrollment in HTC;• prior to moving out of the nursing home;• 2 weeks following move to the community;• 3 months post-move;• 9 months post-move;• 1 year post-move;• 18 months post-move;• 2 years post-move;• 30 months post-move; and• 3 years post-move.
For annual participant financial surveys, participants were mailed the survey andprovided with suggestions on how to obtain needed information. The interviewerreviewed responses with participants during the annual in-person interviews. Review ofthese data suggest that participants were able to gather and report public expenditureswith the guidance provided.
To assess whether the project influenced the attitudes of nursing home staff towardindependent living, we conducted a pre/post mail survey of social service directors and
10 Muskie School of Public Service
directors of nursing in all Maine nursing homes. The survey was first administered in1997, the first year of the project, and again in 2000, near the end of the program.
Finally, to determine whether or not the program had an impact on public policy, weasked Alpha One to provide a list of targeted policy barriers when the program began in1997. At the end of the program in 2001, we asked them to provide a self-assessment oftheir progress in addressing those barriers. We then conducted key informant interviewswith State officials and reviewed State and federal documents to verify that certainpolicies had changed or not changed over the life of the project.
Before beginning the evaluation, we met with two groups of consumers who had livedthrough transitions to independent living. We asked what they had experienced atvarious points in their transitions, what factors had been most important to them, andwhat changes they had noticed in themselves. We also elicited their reactions to apreliminary list of indicators and proposed data collection approaches to ensure that thecontent of our evaluation was relevant to consumers and the process not overly intrusive.
The meetings influenced our approach in several ways:
• We changed our consumer interview schedule to add an interview when movers hadbeen in the community for two (2) weeks. This was described to us as a difficultperiod, during which indicators might be likely to worsen. We had planned toconduct our first interview at the 3-month mark;
• We were encouraged to conduct in-person surveys, despite their intrusiveness.Consumers felt strongly that the challenge of completing a phone or mail surveywould be too great, and that results could be compromised if personal attendants orothers assisted in the survey;
• Consumers identified control and privacy as their major quality of life concerns. Wewere able to discuss with them quality of life indicators and fine tune our selections;and
• Consumers identified directors of nursing and social service directors as the mostlikely nursing home staff to influence a person’s move to the community. Wedecided to target our nursing home survey at those individuals rather thanadministrators.
C. Limitations
While the findings offer an interesting picture of how participants and expenditureschanged over time in the Home to the Community program, the numbers are too small togeneralize the findings with confidence.
The public expenditure portion of the evaluation suffers from an additional limitation.Although ten (10) movers received Medicare services during this period (identified byMedicare crossover claims in the Medicaid claims file), Medicare claims data were not

Muskie School of Public Service 11
available for the evaluation. Thus, a significant public expenditure is excluded from theanalysis. The results should be of interest nonetheless to state policy makers, since theprimary state cost (Medicaid) is captured in the analysis. We were also able to capturehousing subsidy information, which is the largest and arguably the most important publicsubsidy in the community after Medicaid and Medicare.

12 Muskie School of Public Service
III. Findings
A. Did 40 or more participants move out of nursing homes during theproject?
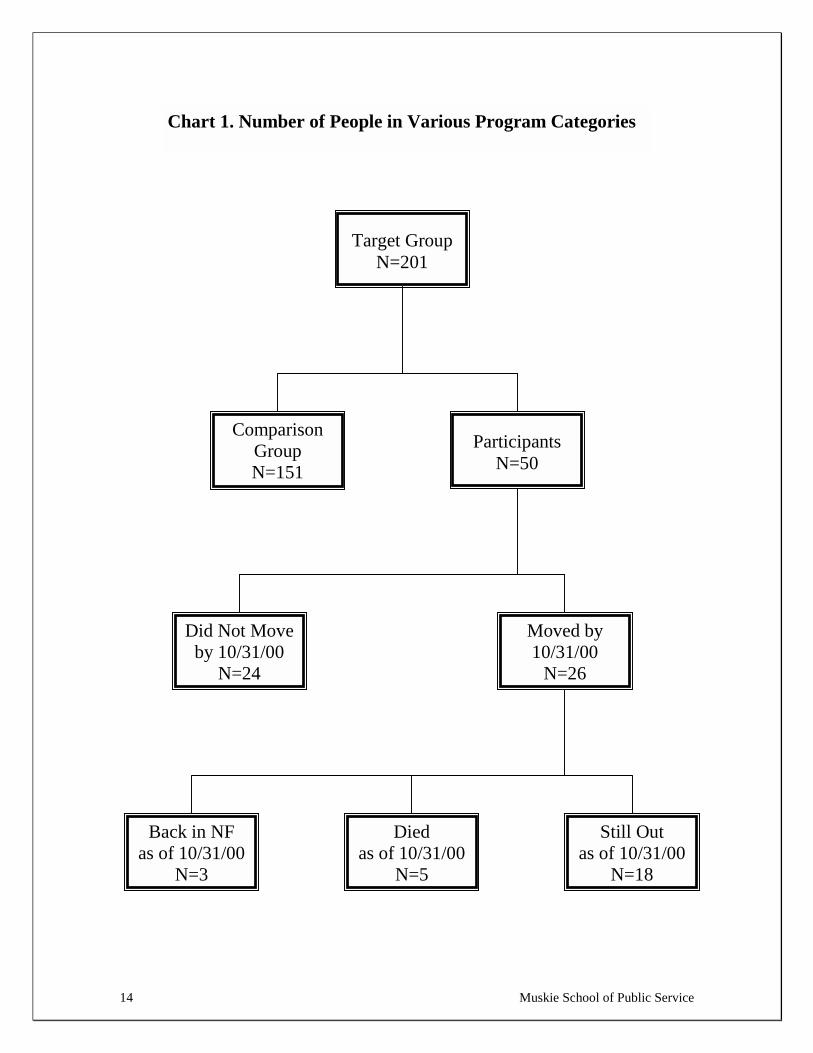
Chart 1 provides the numbers of people in various program categories, with the 201people in the original target group at the top of the chart. From the program start inMarch, 1997 through the end of the evaluation period (October 31, 2000), 26 Home to theCommunity participants moved out of nursing homes. During the same period, AlphaOne provided services in nursing homes to an additional 24 participants who did notmove (non-movers).
The target group was identified by the evaluators through analysis of Maine’s nursinghome resident assessment data files. The assessment files were used to select all nursinghome residents who met Alpha One’s program criteria at the beginning of the project.Those criteria were:
• At least 18 and no older than 59 years;• Acting as own guardian;• No terminal prognosis; and• In a nursing home for at least 30 days.
The project had been planned originally to last three years. About halfway into theprogram Alpha One recognized that it was not meeting its projections and made twoprogram changes in response. The age maximum of 59 was eliminated to allow olderpeople to participate, and the program was extended by 1 year.
Three features of the Home to the Community model were undoubtedly factors in theprogram’s struggle with participant recruitment.
• The contractor that conducts medical eligibility assessments and provides choicecounseling to consumers in Maine’s single entry point long term care system was notformally part of the project. Alpha One familiarized that agency with the Home to theCommunity program but did not receive any referrals. In contrast, the modeldeveloped in Colorado used the single entry point agency as a key contractor, payingthem a supplemental fee for each person who moved out of nursing homes. In theColorado program, 68 people moved in the first year.3
• Related to the previous point, Home to the Community was a project initiated byAlpha One. Unlike the initiatives that have followed in other states, Home to theCommunity was not a state-sponsored initiative, and Alpha One was not conductingthe program as an agent of the State. Because Alpha One was not acting on theState’s behalf, it could not have access to the names and locations of the target group
3 Colorado Department of Health Care Policy and Financing. The Deinstitutionalization Pilot ProjectEvaluation and Report. November, 1998.

Muskie School of Public Service 13
members. The State authorized two blind mailings to target group members (inwhich Alpha One’s marketing material was mailed for them but names and addresseswere not shared), but Alpha One reported that they had no response from the directmail efforts.
• A third feature of the program that may have made recruitment challenging was theconsumer-directed services model being offered by Alpha One. There may have beeneligible nursing home residents who did not want to self-direct their care but wouldhave enrolled had traditional services been offered, including residential care options.Again, the Colorado project offers a contrast. Nearly two-thirds of those who movedin the first year of the Colorado project moved to an assisted living facility.
Finally, the numbers should be placed in context. Maine is a small state that has hadconsiderable success in reducing its nursing home population over the last several years.The same program in a larger state or a state with a relatively larger nursing homepopulation would have had a larger target group. Despite their lack of direct access to thetarget group, Alpha One provided services to 50 people, equivalent to 25% of the originaltarget group of 201 people, and helped 13% (26) move into the community.
14 Muskie School of Public Service
Did Not Moveby 10/31/00
N=24
Moved by10/31/00
N=26
Back in NFas of 10/31/00
N=3
Diedas of 10/31/00
N=5
Still Outas of 10/31/00
N=18
Target GroupN=201
ComparisonGroupN=151
ParticipantsN=50
Chart 1. Number of People in Various Program Categories

Muskie School of Public Service 15
B. What were the notable differences between program participants and acomparison group of non-participants?
Charts 2 through 10 compare the characteristics of the participants with those of thecomparison group. Most of the data are taken from nursing home resident assessments(MDS). Although the program had 26 movers, most of the following charts report dataon 24 movers. MDS assessments were not available for two participants.
Given that the two groups combined comprise the target group for Home to theCommunity, this comparison provides clues as to the type of person who would enroll inthis voluntary program. Relative to the comparison group, participants:
• had shorter stays in the nursing home;• were more likely to believe they could be more independent in daily activities;• were more likely to have diabetes or depression;• were less likely to have short-term memory problems or incontinence;• were more likely to understand and be understood by others; and• were more likely to be comfortable initiating activities.
Participants had higher rates of discharges from nursing homes, lower rates ofreadmission to a nursing home, and lower death rates than members of the comparisongroup.
The analysis also compares those participants who moved with those who did not move.Compared to non-movers, movers:
• had shorter nursing home stays;• were more independent in eating and dressing;• were less likely to have been admitted from an acute care facility; and• were less likely to need assistance with mobility.
“A nursing home, for my age group,is not where I want to be.
I’ve been here 7 months now.”

16 ie School of Public Service
0%
5%
10%
15%
20%
25%
30%
35%
40%
45%
50%
0-20 21-30 31-40 41-50 51-60 61+Age
Comparison Group (N=151)HTC Movers (N=26)HTC No Move (N=24)
5% 33%
54%
Fac.ever Married
Comparison Group (N=149)HTC No Move (N=24)HTC Movers (N=24)
• The age distribution for movers and comparison groupmembers was very similar.
• The largest cluster for these 2 groups was in the 51 to 60 yearage range.
• Interestingly, participant non-movers were slightly youngerthan movers. Most non-movers were in the 31 to 50 year agerange.
• It is not surprising that older people did not enroll, since theinitial program criteria had a maximum age of 59.
n group members ore nursing home
portionately fromy was not specified
er been married, not increase the
Chart 2. Age Distribution teristics
Musk
• Movers were less likely than comparisonon-movers to have been admitted to thfrom an acute care facility.
• Movers may have been admitted disprorehabilitation hospitals, but that categorin our data.
• Movers were also less likely to have evsuggesting that presence of a spouse didlikelihood of moving.
50%
3
46%
25%
0%
10%
20%
30%
40%
50%
60%
Admitted from Acute N
Chart 3. Admission Charac
17 Muskie School of Public Service
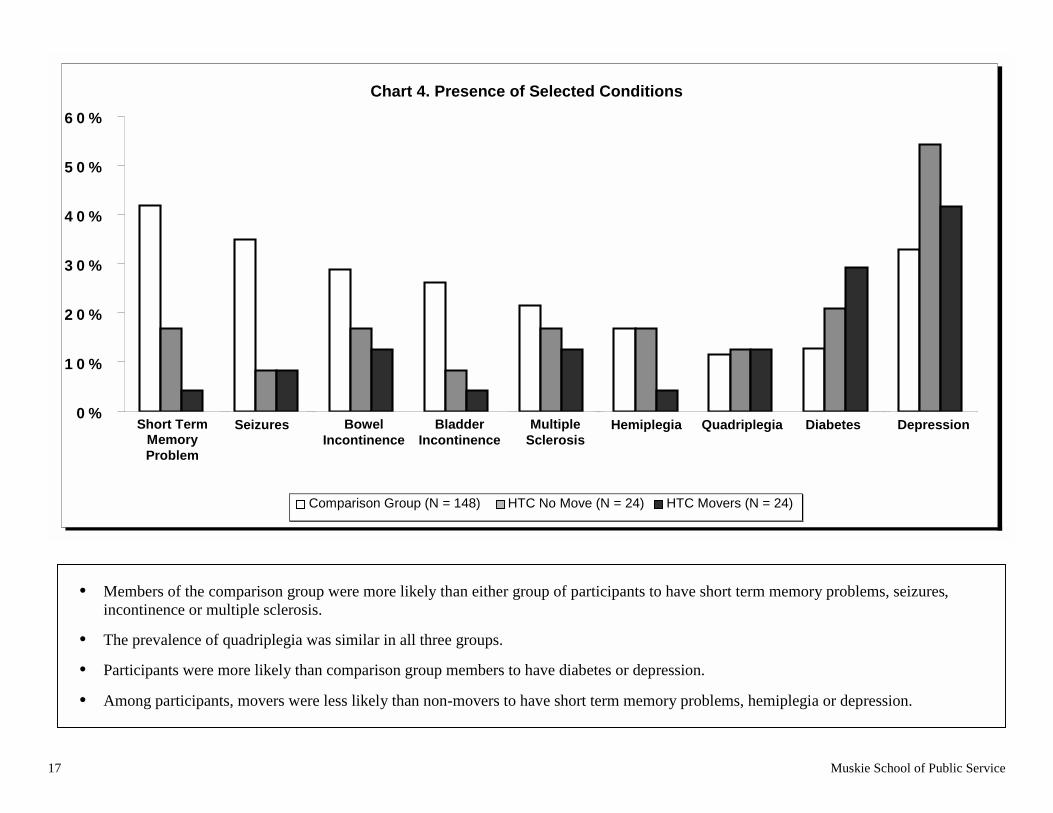
• Members of the comparison group were more likely than either group of participants to have short term memory problems, seizures,incontinence or multiple sclerosis.
• The prevalence of quadriplegia was similar in all three groups.
• Participants were more likely than comparison group members to have diabetes or depression.
• Among participants, movers were less likely than non-movers to have short term memory problems, hemiplegia or depression.
0 %
1 0 %
2 0 %
3 0 %
4 0 %
5 0 %
6 0 %
Short Term
Mem. P
rob.
Seizures
Bowel Incontinence
Bladder Incontinence
Multiple Sclerosis
Hemiplegia
Quadriplegia
Diabetes
Depression
Chart 4. Presence of Selected Conditions
Short TermMemoryProblem
Seizures BowelIncontinence
BladderIncontinence
MultipleSclerosis
Hemiplegia Quadriplegia Diabetes Depression
Comparison Group (N = 148) HTC No Move (N = 24) HTC Movers (N = 24)

18
0%
10%
20%
30%
40%
50%
60%
70%
80%
90%
Indepen.Bed Mobility
Ext. Assist.Bed Mobility
Ext. Assist.Transfers
TotalDepend.
Locomotion
Wheels Self
Comparison Group (N=149) HTC No Move (N=24)
HTC Movers (N=24)
• Movers were most likely to be independent in bed mobility.
• Non-movers were most likely to require extensiveassistance with bed mobility and transfers.
• Movers were more likely to wheel themselves and lesslikely to be dependent in locomotion than the other 2groups.
0
10
20
30
40
50
60
70
80
Chart 5. Mobility Dressing
%
%
%
%
%
%
%
%
Chart 6. Eating and
%Independent
EatingM echanicallyA ltered D iet
Extensive Assist.D ressing
C om parison G roup (N =149) H TC N o M ove (N =24)
Muskie School of Public Service
• More movers were independent in eating than either non-movers or comparison group members.
• Movers were less likely to have mechanically altered dietsthan either non-movers or comparison group members.
• Non-movers were more likely than either movers orcomparison group members to need extensive assistancewith dressing.
H TC M overs (N=24)

19 kie School of Public Service
• Participants, particularly movers, were best able to makethemselves understood and to understand others and weremore comfortable in their interactions with others.
• Participants were more at ease with self-initiated activity.
• While these characteristics may be indicators of success atindependent living, they may also suggest that people hadto have good communication skills to enroll in the program.They may have had to overcome barriers in order to contactAlpha One.
0%
10%
20%
30%
40%
50%
60%
70%
80%
90%
100%
Makes SelfUnderstood
UnderstandsOthers
At EaseInteracting
At Ease DoingSelf-Initiated
Activity
Comparison Group (N=148) HTC No Move (N=24)HTC Movers (N=24)
1,416
1,844
544
845
258351
0
200
400
600
800
1,000
1,200
1,400
1,600
1,800
2,000
Median Days inNursing Home
Average Days inNursing Home
Comparison Group (N=151) HTC No Move (N=24)
HTC Movers (N=26)
Chart 7. Communication and Interactions Chart 8. Length of Stay in Nursing Home
stays than members, movers had shorter
ption of policyy becomes less likelyme for a long period
Mus
• Participants had shorter nursing home of the comparison group. Furthermorestays than non-movers.
• This supports the longstanding presummakers that transition to the communitwhen people have been in a nursing hoof time.
20
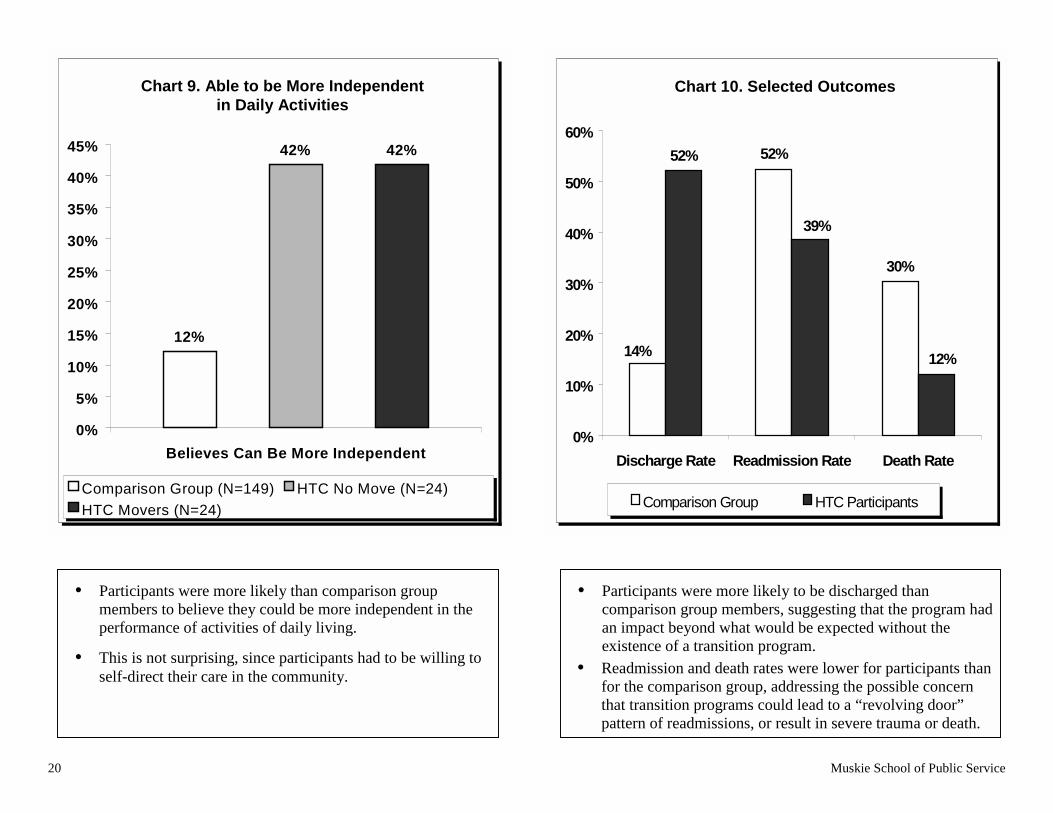
• Participants were more likely than comparison groupmembers to believe they could be more independent in theperformance of activities of daily living.
• This is not surprising, since participants had to be willing toself-direct their care in the community.
•
•
30%
9%
12%
0%
10%
20%
30%
40%
50%
60%
12%
42% 42%
0%
5%
10%
15%
20%
25%
30%
35%
40%
45%
Believes Can Be More Independent
Comparison Group (N=149) HTC No Move (N=24)
HTC Movers (N=24)
Chart 9. Able to be More Independentin Daily Activities
Outcomes
52%52%
14%
3
Chart 10. Selected
Discharge Rate Readmission Rate Death Rate
Muskie School of Public Service
Participants were more likely to be discharged thancomparison group members, suggesting that the program hadan impact beyond what would be expected without theexistence of a transition program.
Readmission and death rates were lower for participants thanfor the comparison group, addressing the possible concernthat transition programs could lead to a “revolving door”pattern of readmissions, or result in severe trauma or death.
Comparison Group HTC Participants

Muskie School of Public Service 21
C. Did the health status of participants improve after they moved out ofnursing homes?
The health status indicators reported in Charts 11 through 18 are taken from communitylong term care assessments (MED) and the consumer survey developed and administeredfor the evaluation. They include indicators of physical and mental health that wereidentified by consumers as having particular relevance to them. Sleep patterns arereported here, but might also have been appropriately reported with the quality of lifeindicators (E).
The indicators are mixed, with some showing improvement, others suggesting declineand still others showing no change over time. In the aggregate, however, this group ofhealth indicators seems to paint a positive picture. Of the 16 indicators reported, 7suggest improving health, 6 show no change, and only 3 suggest health decline.
We report the percentage of movers who experienced each indicator. We have multipleyears of data only for those who moved early in the program, so the number ofparticipants drops dramatically after the first year. Accordingly, we have chosen to focuson the first year of community living.
As the consumers in our pre-evaluation focus groups had predicted, the 2-week postmove time frame does appear to be a time of sudden and significant change, but notalways in the direction predicted by our focus group participants. Whereas they hadlabeled this time “hell week” and associated it with declining well-being, many of theindicators show just the opposite. Some movers apparently experienced a suddenimprovement upon leaving the nursing home, possibly as part of an initial euphoria, onlyto lose some or all of the improvement in the subsequent months.
“Just get healthy, physically and mentally.That’s it! You need [your health] to move on.”
“Let the doctors live in here for a couple of weeksbefore they say we have to stay here.”

22
• The percentage of movers with pressure ulcers and opensores or lesions increased immediately following discharge,decreased at the 3-month point, then increased to at orbelow pre-move levels at the 1-year point.
•
•
0%
5%
10%
15%
20%
25%
30%
35%
40%
Pre-m ove(N=18)
2 W ks Out(N=19)
3 Months Out(N=20)
1 Yr Out(N=15)
Open sores/lesions Pressure ulcers
1
2
3
4
5
6
7
8
Chart 11. Open Sores or Ulcers or More Medications Tract Infection
0%
0%
0%
0%
0%
0%
0%
0%
0%
Chart 12. Sevenor Urinary
Muskie School of Public Service
The percentage of movers with 7 or more medications wentup initially (at 2 weeks), then fell and was slightly belowthe pre-move level at the 1-year mark.
Presence of urinary tract infection (UTI) had the oppositepattern (it decreased initially, then rose), but was also lowerthan the pre-move level at the end of year 1.
P re-m o ve(N =19)
2 W ks O u t(N =19)
3 M o n th sO u t (N =20 )
1 Y r O u t(N =15)
7 o r m o re m eds U T I
23 Muskie School of Public Service
0%
5%
10%
15%
20%
25%
Pre-move(N=26)
2 Wks Out(N=23)
3 Months Out(N=21)
1 Yr Out(N=15)
Very Satisfied Very Dissatisfied
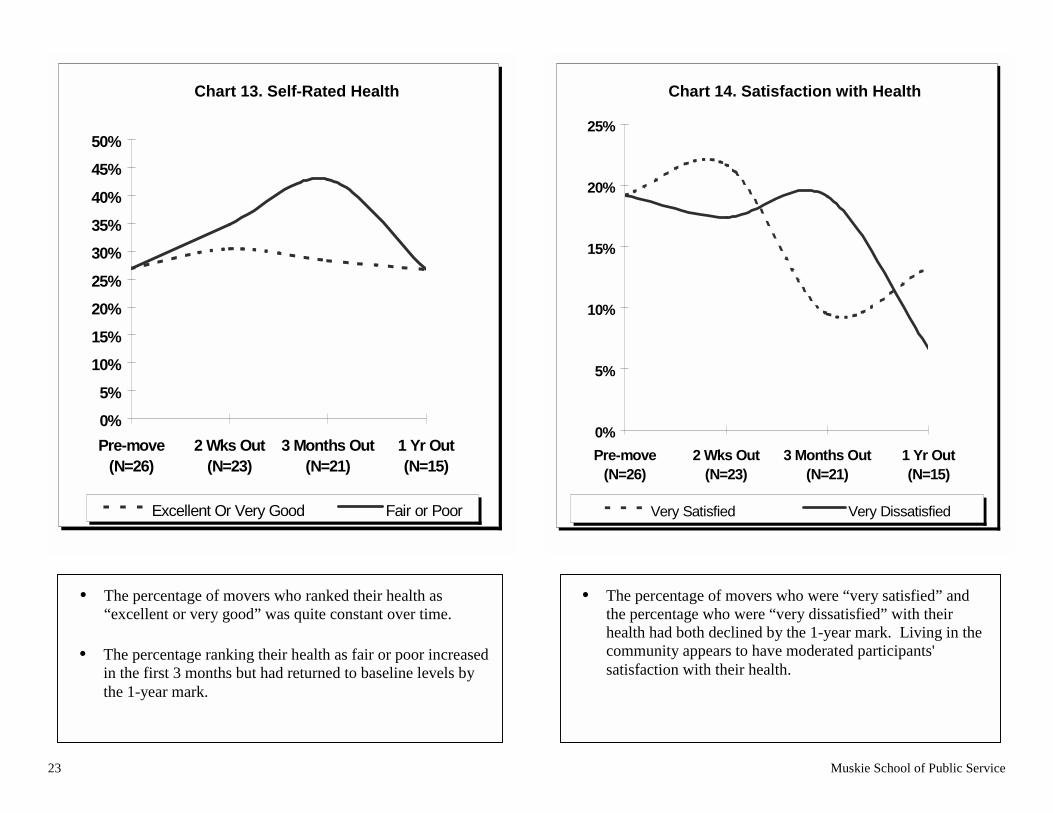
• The percentage of movers who ranked their health as“excellent or very good” was quite constant over time.
• The percentage ranking their health as fair or poor increasedin the first 3 months but had returned to baseline levels bythe 1-year mark.
• The percentage of movers who were “very satisfied” andthe percentage who were “very dissatisfied” with theirhealth had both declined by the 1-year mark. Living in thecommunity appears to have moderated participants'satisfaction with their health.
0%
5%
10%
15%
20%
25%
30%
35%
40%
45%
50%
Pre-move(N=26)
2 Wks Out(N=23)
3 Months Out(N=21)
1 Yr Out(N=15)
Excellent Or Very Good Fair or Poor
Chart 13. Self-Rated Health Chart 14. Satisfaction with Health

24
• This chart includes only those who were in the community fora full year to minimize distortion due to change in group size.
• While there is a reduction in reported pain at the 3-monthpoint, both indicators of pain are higher at 1-year than at pre-move.
• Changes in medication regimen and increased physicalactivity are possible explanations for this observation.
•
•
•
0%
5%
10%
15%
20%
25%
30%
35%
40%
45%
50%
Months 1 Yr Out0%
5%
10%
15%
20%
25%
30%
35%
40%
45%
Pre-move 2 Wks Out 3 Months Out 1 Yr Out
Have Joint Pain Have Daily Pain
Chart 15. Pain (N=12) pression &sant Use
Pre-move 2 Wks Out 3
Chart 16. DeAntidepres
Muskie School of Public Service
After an initial increase, the percentage of movers withdepression at the 1-year mark was close to pre-move levels.
Use of antidepressants decreased steadily during the first year.
Together, these indicators may suggest that some pre-moveuse of antidepressants was unnecessary, or that decliningdepression resulted in less use of antidepressants in thecommunity.
(N=19*) (N=19) Out (N=20) (N=15)
*N=20 for Depression
Depression Rec. Antidepress.
25 Muskie School of Public Service
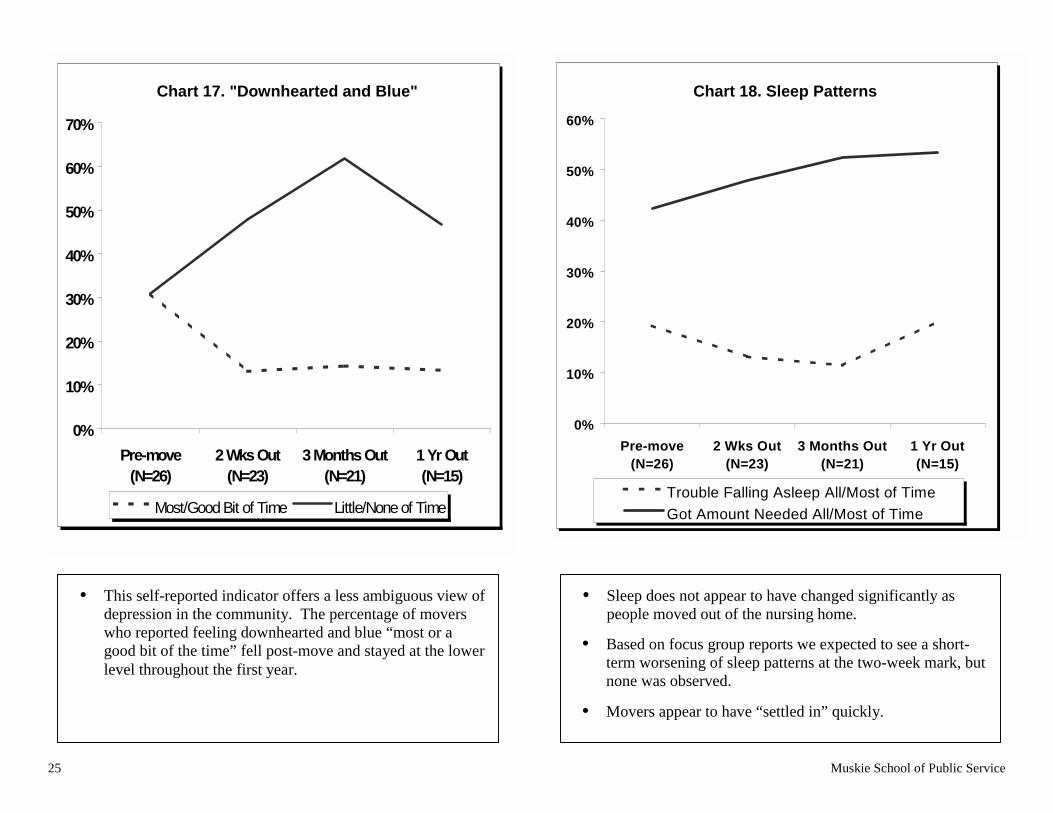
• This self-reported indicator offers a less ambiguous view ofdepression in the community. The percentage of moverswho reported feeling downhearted and blue “most or agood bit of the time” fell post-move and stayed at the lowerlevel throughout the first year.
0%
10%
20%
30%
40%
50%
60%
70%
Pre-move(N=26)
2 Wks Out(N=23)
3 Months Out(N=21)
1 Yr Out(N=15)
Most/Good Bit of Time Little/None of Time
• Sleep does not appear to have changed significantly aspeople moved out of the nursing home.
• Based on focus group reports we expected to see a short-term worsening of sleep patterns at the two-week mark, butnone was observed.
• Movers appear to have “settled in” quickly.
0%
10%
20%
30%
40%
50%
60%
Pre-move(N=26)
2 Wks Out(N=23)
3 Months Out(N=21)
1 Yr Out(N=15)
Trouble Falling Asleep All/Most of Time
Got Amount Needed All/Most of Time
Chart 17. "Downhearted and Blue" Chart 18. Sleep Patterns
26 Muskie School of Public Service
D. Was physical function maintained by participants after they moved outof nursing homes?
With a few exceptions (bed mobility and homemaking) the indicators in Charts 19through 22 suggest little or no change in physical function over time.
Indicators of functional capacity, including activities of daily living and instrumentalactivities of daily living were collected in much the same way as the health indicators inthe previous section. These data are from the community long term care assessment data(MED), and the consumer survey developed and administered for the evaluation.
It should be noted that some indicators of function are highly dependent on environment.For example, movers in this study dramatically increased the amount of time spent onhomemaking activities, but that very likely is because they did not need to performhomemaking in the nursing home. In other words, an increase in activity does notnecessarily suggest enhanced physical ability, but may instead reflect changingopportunities and priorities.
As with the previous health indicators, we are reporting the percentage of movers whoexperienced the particular indicator at the time intervals shown.
“When you have a dream, go for it.Don’t let your disability stop you. It hasn’t been
smooth sailing, but that’s the way life is.”
“Right now, I’m looking for help.There just isn’t anybody. People I interview are not
happy with the pay.”
27 Muskie School of Public Service
0%
10%
20%
30%
40%
50%
60%
70%
80%
Pre-move(N=18)
2 Wks Out(N=19)
3 MonthsOut (N=20)
1 Yr Out(N=15)
Dress Independently Eat IndependentlyToilet Independently
0%
10%
20%
30%
40%
50%
60%
70%
80%
Pre-m ove(N=18)
2 W ks Out(N=19)
3 M onthsOut (N=20)
1 Yr O ut(N=15)
Needs Extensive or Total Assistance-Bed M obility
Needs Extensive or Total Assistance-Transfers
Needs Extensive or Total Assistance-Locom otion
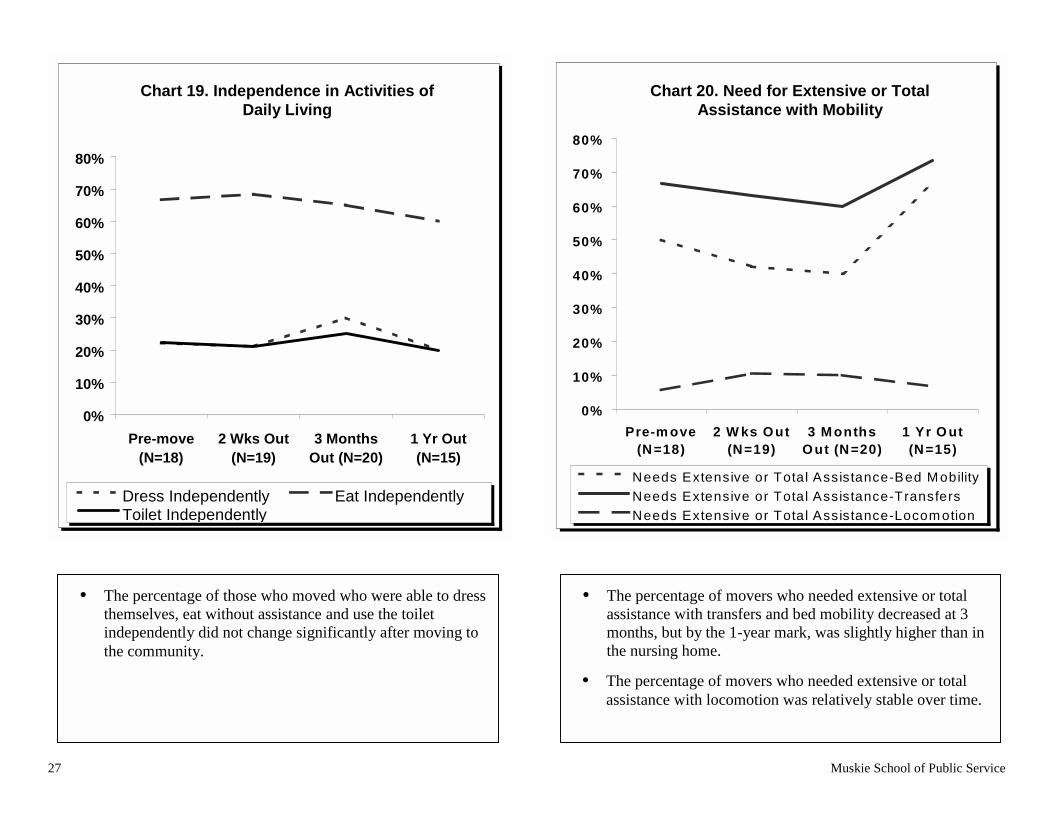
• The percentage of movers who needed extensive or totalassistance with transfers and bed mobility decreased at 3months, but by the 1-year mark, was slightly higher than inthe nursing home.
• The percentage of movers who needed extensive or totalassistance with locomotion was relatively stable over time.
• The percentage of those who moved who were able to dressthemselves, eat without assistance and use the toiletindependently did not change significantly after moving tothe community.
Chart 19. Independence in Activities ofDaily Living
Chart 20. Need for Extensive or TotalAssistance with Mobility

28 Muskie School of Public Service
0%
10%
20%
30%
40%
50%
60%
70%
80%
90%
100%
P re -m o ve(N =18)
2 W ks O u t(N =19)
3 M o n th sO u t
(N =20)
1 Y r O u t(N =15)
Independen t M ea l P repIndependen t U se o f P honeIndependen t F inance M anagem en tIndependen t Laundry
0%
5%
10%
15%
20%
25%
Pre-m ove(N=26)
2 W ksOut
3 MonthsOut
1 Yr O ut(N=15)
*includes parenting, housekeeping, food prep
• By the end of Year 1, participation in homemaking for 21or more hours a week was reported by more than one fifthof those who moved out of nursing homes.
• Increases in homemaking activity are probably related moreto changing opportunities than to changing function.
• There was very little change over time in the percentage ofmovers who independently prepared meals, used the phone,managed personal finances, or did laundry (chores referredto as instrumental activities of daily living).
• Presumably, personal attendants replaced nursing homestaff in assisting movers with many of these tasks.
Chart 21. Performance ofHousehold Chores
Chart 22. Active Homemaking* for 21or More Hours per Week

Muskie School of Public Service 29
E. Did quality of life improve for participants after they moved out of nursinghomes?
With a few exceptions, this evaluation suggests improved quality of life for movers. Of the 8quality of life measures reported in Charts 23 through 25, 5 showed improvement and 3 wereunchanged following moves.
Interestingly, movers did not feel increased control over work, socialization or familyrelationships. None of the movers had obtained paid employment within the study period, whichmay explain their feelings of having no greater control over that area of life. Similarly, controlover socialization did not increase for movers. This is not surprising in the short run, given themove from a group living situation, where others are in immediate proximity, to independentliving, most often in a private home or apartment. An important quality of life question thatrequires a longer study period is whether socialization increases over long periods of time in thecommunity, or whether isolation is a long term challenge for people living independently.
Quality of life measures were selected with input from consumers and collected through in-person interviews.4
“Just getting home, being home, is very satisfying. Youdon’t have to answer to people.
I have more control of my life at home.”
4 Phillip Beatty of the National Rehabilitation Hospital Research Center and James Conroy of the Center forOutcome Analysis provided helpful guidance and shared quality of life indicators that were adapted for our survey.

(N=26) (N=23)ths Out
(N=21)1 Yr Out
(N=15)
Material Comforts Health, Personal Safety
Socializing Work at Job/Home
0%
20%
40%
60%
80%
100%
120%
Pre-move(N=26)
2 Wks Out(N=23)
3 MonthsOut (N=21)
1 Yr Out(N=15)
Chart 23. Sense of Privacy ntrol
30
• Nearly 100% of movers reported that they had enoughprivacy in the community immediately following theirmoves.
• About 60% of movers reported having enough privacy in thenursing home.
Enough Not Enough
0%
10%
20%
30%
40%
50%
60%
70%
80%
90%
Pre-move 2 Wks Out 3 Mon
Chart 24. Life Co
Muskie School of Public Service
Family Rela.
• The percentage of movers who reported having “complete”or “a lot” of control over material comforts and health andpersonal safety increased in the community.
• Reported level of control over socializing was quiteconstant over time.
• Control over family relationships and work increased forthe first 3 months in the community, but had fallen back tonear nursing home levels by the 1-year mark.

31 Muskie School of Public Service
• The percentage of movers who exercised choice over workers and schedules increased immediately followingthe move and throughout the first year in the community.
• This is related to the consumer-directed services model at the heart of Home to the Community. Had moversbeen going to alternative residential care settings or receiving traditional home care services, they may nothave had as much control in these areas.
0 %
1 0 %
2 0 %
3 0 %
4 0 %
5 0 %
6 0 %
7 0 %
8 0 %
9 0 %
1 0 0 %
P r e - m o v e( N = 2 6 )
2 W k s O u t( N = 2 3 )
3 M o n t h s O u t( N = 2 1 )
1 Y r O u t( N = 1 5 )
Chart 25. Choice of Workers and Schedules
Chose Workers Able to Change Anything About Schedule

32 Muskie School of Public Service
F. What else was learned about participants who moved out of nursinghomes?
Charts 26 through 29 present additional information about movers that may be of interestto policy makers and program designers.
Medicaid claims were found for 16 of the 26 movers, fewer than anticipated. This isprobably explained by loss of Medicaid eligibility following moves due to lower medicalexpenses available for spend-down calculations. Among movers who did have Medicaidclaims, the categories of service accessed by the greatest number of movers wereprescription drugs, home- and community-based waiver services, Medicare crossoverclaims, transportation, and durable medical equipment and supplies.
Nearly three-quarters of movers were enrolled in Home to the Community for 180 days orless before moving out of the nursing home. This length of program participation (180days) is a significant time frame to examine because federal Medicaid policy wasrecently clarified to allow states the option of reimbursing certain case managementservices for up to 180 days prior to a move out of a nursing home.5 The remainingquarter of movers were enrolled in Home to the Community for more than 180 days. Thetransition services they received from Alpha One would not have been fully reimbursedunder current federal Medicaid policy. As reported earlier in this paper, non-movers hada longer length of stay in the nursing home than movers. If transition programs are tosuccessfully target people with longer nursing home stays, reimbursement policy mayneed to be extended beyond the 180 days currently available under federal Medicaidpolicy.
Most movers lived alone in apartments or houses when they left the nursing home.Though this might not be expected with other population groups, it is not a surprisingfinding for this program, since Home to the Community is a consumer-directed servicesmodel targeted at younger adults with disabilities.
Two-thirds of movers had housing subsidies. Accessible and affordable housing isclearly critical to the success of transition programs. This finding supports the federalgovernment’s emphasis on housing as a critical component of nursing home transitionprograms.6
“Try to find a house before you move out. It’s hard.I found out the first time.”
5 Health Care Financing Administration, Center for Medicaid and State Operations. Olmstead Update No.3. (July 25, 2000).6 See HCFA's "Systems Change Grants for Community Living" (April 30, 2001).

33 Muskie School of Public Service
0
2
4
6
8
1 0
1 2
1 4
1 6
1 8
Any M
edica
id
Presc
. Dru
gs
HCBS Wai
ver
Med
icare
Cro
ssov
er
Tran
spor
tat
DME/ S
uppl
ies
Home
Hea
lth
Physic
ian
Hospi
tal
Lab
Nursin
g Fa
c.
• The left-most bar represents the 16 movers w edicaid claim during the first year post-move.
• Following their move, fewer than half of mov ith Medicaid claims used home health, physician, hospital, lab or nursing facilityservices billed directly to Medicaid. These low-u categories are services frequently covered by Medicare, and may have been usedby dually eligible movers and billed to Medicare en movers had Medicare crossover claims (fourth bar from left).
• Interestingly, 6 of the 16 movers covered by Med aid while living in the community did not receive services billed under the Home-and Community-based Waiver program.
Chart 26. Number Movers with Medicaid Claims in 1st YearPost ove, by Category of Service
AnyMedicaid
PrescriptionDrugs
HCBSWaiver
MedicareCrossover
DME/Supplies
HospitalTransportation PhysicianHomeHealth
Lab NursingFacility
se. T
ic
ith a M
ers w
ion
of-m
34 Muskie School of Public Service
+
50%
23%
12%
15%
90 days or fewer
91-180 days
181-365 days
366+ days
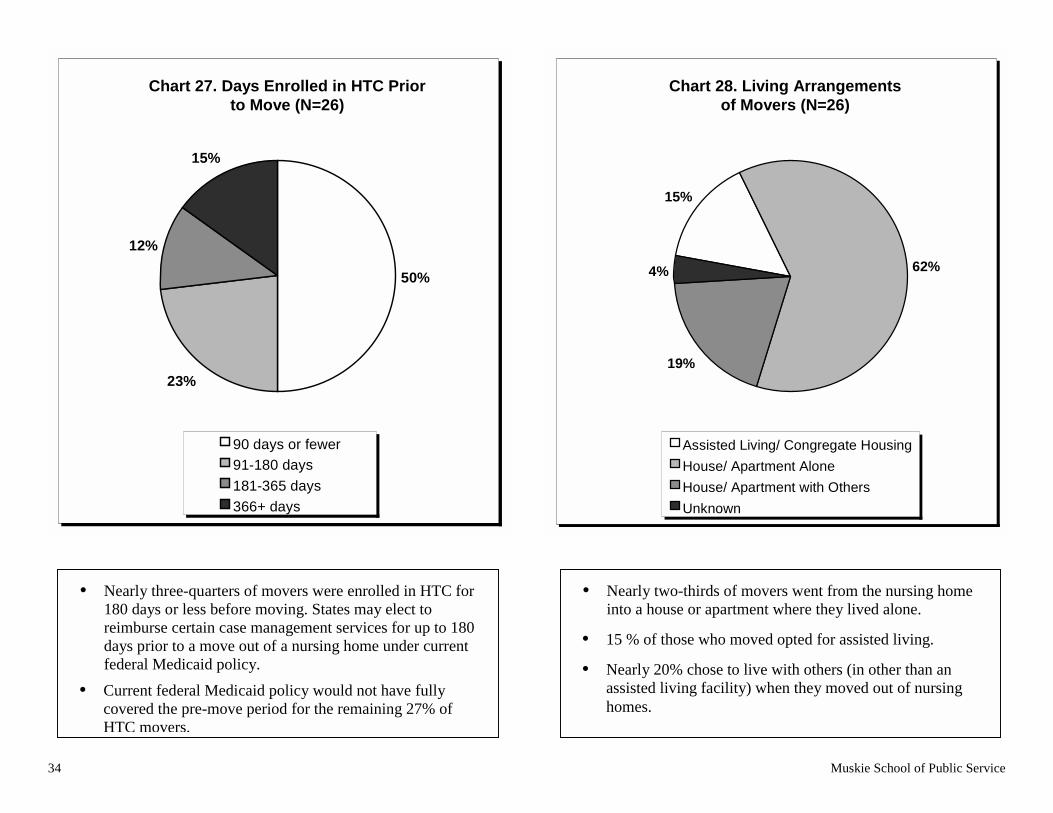
• Nearly three-quarters of movers were enrolled in HTC for180 days or less before moving. States may elect toreimburse certain case management services for up to 180days prior to a move out of a nursing home under currentfederal Medicaid policy.
• Current federal Medicaid policy would not have fullycovered the pre-move period for the remaining 27% ofHTC movers.
• from the nursing homeey lived alone.
• r assisted living.
• ers (in other than anmoved out of nursing
15%
62%
19%
4%
Assisted Living/ Congregate Housing
House/ Apartment Alone
House/ Apartment with Others
Unknown
Chart 27. Days Enrolled in HTC Priorto Move (N=26)
Chart 28. Living Arrangementsof Movers (N=26)
Nearly two-thirds of movers went into a house or apartment where th
15 % of those who moved opted fo
Nearly 20% chose to live with othassisted living facility) when they homes.

35 Muskie School of Public Service
1 0
5
0
2
4
6
8
1 0
1 2
H o u s in g S u b s id y N o H o u s in g S u b s id y
No
. Par
tici
pan
ts
• Of the 15 people who completed the financial survey at the 1-year mark, 10 hada housing subsidy.
• Housing subsidies were generally easier for participants to obtain than accessiblehousing units.
Chart 29. Housing Subsidy

36 Muskie School of Public Service
G. How did public expenditures for participants in the communitycompare to participants' public expenditures in nursing homes?
Charts 30 and 31 provide information regarding certain public expenditures forparticipants. For this small group of people, the combined public expenditures ofMedicaid, housing, transportation, food assistance and fuel assistance were lower in thecommunity than Medicaid expenditures in the nursing home prior to moving.
Although Medicaid claims were available on more than 16 people for the pre-moveperiod, we are reporting for the 16 movers who had both pre- and post-move claims. Wefelt this was important to ensure a fair comparison of public expenditures between thenursing home and community services. Medicaid expenditures for participants decreasedin the first year out of the nursing home, and decreased further in the second year. Only 7of the 16 participants with pre- and post-move Medicaid claims were out of the nursinghome for a full second year, so the average expenditure for the second year describes avery small group of movers.
Financial surveys were conducted annually in the community to determine what otherpublic services movers were receiving, and whether they were receiving earned incomethat might have resulted in payment of offsetting taxes. Other public expenditures werecalculated for housing, transportation food assistance and fuel assistance.
Although at least 10 movers are known to have been Medicare beneficiaries (through thepresence of Medicare crossover claims in their Medicaid files), Medicare data were notavailable for this evaluation. This is a serious limitation, since Medicare expenditures fordually eligible beneficiaries (eligible for both Medicare and Medicaid) with long termcare needs tend to be higher in community settings than in nursing homes.
“Affordable housing is a very big plus.When I moved out, nobody warned me about theamount of money I would be sinking into laundry.
$20 per month is a lot for someone on afixed income.”

$4,405
$3,522
$2,811
$-
$500
$1,000
$1,500
$2,000
$2,500
$3,000
$3,500
$4,000
$4,500
$5,000
year prior to move(N=16)
1st year aftermove (N=16)
2nd year aftermove (N=7)
$5,741$4,626
$2,859
$561
$553
$-
$1,000
$2,000
$3,000
$4,000
$5,000
$6,000
$7,000
year prior to move(N=10)
1st year aftermove (N=10)
2nd year aftermove (N=6)
*Other Public Service Expenditures includes housing, transportation, food, and fuel assistance.
Chart 30. Average Monthly MedicaidExpenditures per Mover (for Movers
with Pre- & Post-move Claims
Chart 31. Average Monthly PublicService Expenditures (for Movers withOther Public Service* Expenditures)
37 Muskie School of Public Service
• Average monthly Medicaid expenditures per moverdecreased from $4,405/month pre-move to $3,522/month inthe first year that movers lived in the community.
• Average monthly Medicaid expenditures per moverdecreased further in the second year (to $2,811/month),though data were available on fewer people.
• When Other Public Service Expenditures (housing,transportation, food and fuel) were added to Medicaid,community expenditures were still lower than nursinghome expenditures.
• Average Medicaid costs are higher for this subset of movers(those who had other Public Service Expenditures) than forall movers with Medicaid claims, shown on Chart 30.
Ave. Medicaid per month Ave. Medicaid/mo. Ave. Other Public Service* Expenditures/mo.
38 Muskie School of Public Service
H. Did the attitudes of key nursing home staff about the ability of peoplewith disabilities to leave nursing homes change over the life of theproject?
In order to determine whether the attitudes of key nursing home staff toward independentliving changed during the project, we administered a pre/post mail survey at thebeginning and end of the program. We found no significant changes in attitudes towardthe ability of people with disabilities to leave nursing homes and establish independentliving arrangements.
In consumer focus groups held before the evaluation began, consumers who had lived innursing homes identified the directors of nursing (DONs) and the social services directors(SSDs) as the staff most likely to influence moves to independent living. Accordingly,we chose to survey those groups in all Maine nursing homes.
Responses did not change significantly over time, and the responses of DONs and SSDswere quite similar. We did not find any differences between nursing homes with Hometo the Community participants and those with no participants. We also did not find anysignificant differences between nursing homes in urban areas and those in rural areas.
Although the responses of nursing home staff were more conservative regardingindependent living than the actual experiences of Home to the Community participants,the survey responses suggested an openness to independent living when appropriatecommunity supports are available. The gulf between nursing home staff and advocates ofindependent living may not be as wide as popularly believed. It may be fruitful fortransition program designers to engage nursing home staff in program design andoperation.
“Maintain contact with staff, both in the nursingfacility and at Alpha One…It’s good to have
someone to give you a hand.Find someone you can trust.”

39 Muskie School of Public Service
Nearly half of the respondents felt that a hypothetical HTC participant described in both a pre and post survey:
• would require 24-hour-a-day care in a community setting; and
• was likely to succeed with the appropriate supports.
Nearly two-thirds of survey respondents felt that the participant:
• would need 1 to 6 months of life skills training before moving; and
• would have higher expenditures in the community than in the nursing home.
0%
10%
20%
30%
40%
50%
60%
70%
80%
N eed s 24-h o u rC are in C o m m un ity
N eed s 1-6 m o s.S k ills T ra in in g
P re-m o ve
S u ccess L ike lyw ith S u p p o rts
C o m m u n ity C o stG reater th an
N u rs in g H o m e
D irec to r o f N u rs ing P re D irec to r o f N u rs ing P os tD irec to r o f S oc ia l S erv ices P re D irec to r o f S oc ia l S erv ices P os t
Chart 32. Selected Pre and Post Responses of Nursing HomeStaff Regarding Hypothetical HTC Participant
40 Muskie School of Public Service
I. Did the project have a lasting impact on public policy?
To determine whether or not the program had an impact on public policy, we askedAlpha One staff to provide a list of targeted policy barriers when the program began in1997. At the end of the program in 2001, we asked them to provide a self-assessment ofprogress in addressing those barriers. We then conducted key informant interviews withState officials and reviewed State and federal documents to verify that certain policieshad changed or not changed over the life of the project.
Although Maine Medicaid policy has not changed to allow for explicit reimbursement ofthe nursing home transition activities provided in this demonstration program, there issome evidence that the program has influenced public policy in Maine and nationally.
• DME Prior Approval. Most tangibly, the Medicaid prior approval process fordurable medical equipment was streamlined to ensure timely delivery of wheelchairsand other equipment to people moving out of nursing homes. This was doneadministratively as a result of discussions between the Maine Department of HumanServices and Alpha One;
• Influence on National Demonstrations. As a very early nursing home transitionproject, Home to the Community may have had an influence on federaldemonstrations in this area. For example, the Health Care FinancingAdministration’s 2001 “Systems Change Grants for Community Living” includesadditional nursing home transition grant opportunities, and specifically createsopportunities for states to partner with Independent Living Centers;
• Clarification of HCFA Policy. Although Maine Medicaid still does not covernursing home transition services explicitly, there is evidence that the MaineDepartment of Human Services supports the program concept. In response to AlphaOne’s request to cover the service, DHS asked the Health Care FinancingAdministration for guidance on coverage. It may have been Maine’s inquiry thattriggered a clarification to be issued by HCFA in Olmstead Update No. 3 (July 25,2000). In that letter, HCFA clarifies that transition services could be provided in theform of targeted case management or Home- and Community-Based Services CaseManagement for up to 180 days before discharge from the nursing home. The MaineDepartment of Human Services subsequently declined to support a bill before theMaine Legislature in 2001 that would have authorized Medicaid funding fortransition services, but the Department’s opposition was related to a large deficit inthe State’s Medicaid budget, rather than opposition to the concept. The Departmentconsistently opposed all proposals before the Legislature that would have created newcategories of Medicaid reimbursable services; and
• Housing Inventory. Alpha One is working with Maine State Housing Authority toimprove the availability of accessible housing in Maine. Together, the agencies arecreating an inventory of accessible housing that will provide a baseline for futureexpansion efforts.

Muskie School of Public Service 41
IV. Lessons and Implications
A number of lessons may be gleaned from Home to the Community to inform policymakers and program designers. They include the following key areas.
• The likelihood that someone will move out of a nursing home is related to the lengthof time the person has been in the nursing home. Movers in Home to the Communityhad significantly fewer days in the nursing home than non-movers. While targetingtransition services to people with shorter length of stay raises valid equity concerns,policy makers and program designers should be aware that time appears to be acritical factor in transition programs.
• Availability of affordable and accessible housing is critical. After Medicaid, housingsubsidy was the form of public support used by most participants. The averagemonthly housing subsidy was $510.
• Current federal Medicaid reimbursement policy for transition services falls short forsome potential movers. Current federal policy allows, at the option of states,reimbursement of transition services under case management reimbursementcategories for up to 180 days prior to a move out of a nursing home. While nearlythree-quarters of movers were enrolled in Home to the Community for 180 days orless before moving out of the nursing home, the remaining quarter of movers wereenrolled for more than 180 days and would have exhausted their benefits.
• The consumer-directed services model offered in Home to the Community appearedto work well for those who enrolled in the program, but it limits the target group forsuch programs. Those who do not wish to direct their own care are not attracted tothis program model. If states want to serve larger and more diverse targetpopulations, they should consider offering a choice of transition program models toconsumers.
• A nursing home transition program is more likely to enjoy a high participation rate ifthe program is well integrated into a State’s existing long term care entry andreassessment mechanisms. Doing so makes it very easy to identify and discussoptions with members of the target group. For example, county single-entry pointagencies were key players in Colorado’s project, and participation was relativelyhigh.
• Related to the previous lesson, identification of participants is easier when a stateinitiates a project and can share confidential consumer information with its projectcontractors. In Home to the Community, Alpha One undertook the projectindependent of the State with grant funding. Because it was not acting as an agent ofthe State, Alpha One did not have direct access to the target group.
• Nursing home staff should be engaged in transition projects. Our survey of keynursing home staff and comments from participants suggest that nursing home staffcould provide very beneficial support to potential movers if engaged in transitionefforts.
42 Muskie School of Public Service
V. Summary
Following participant moves, changes in health status were somewhat mixed but showedgreater improvement than decline on balance. Two health status indicators of particularinterest suggested improvement. Urinary Tract Infections were less frequent; and use ofanti-depressants was lower with no increase in diagnosed depression. These are bothareas associated with avoidable decline in health and physical function. Conversely, self-reports of pain increased following moves. Increased pain may be attributed to changesin medication, changes in movers’ preferences for more frequent medication, or increasedphysical activity.
For the most part, physical function did not change when participants moved to thecommunity. One indicator that showed a dramatic increase, the number of hours spent onhomemaking, probably reflects changing opportunities and priorities in the communityrather than changes in function.
Perhaps most importantly, movers’ reports of improved quality of life were sharp withregard to 3 measures: privacy, choice of workers and schedule control. These indicatorsof quality of life were identified as important to consumers during pre-evaluationmeetings.
Finally, compared with pre-move Medicaid expenditures, public expenditures for carewere lower for participants after they moved out of nursing homes. This conclusion doesnot consider Medicare expenditures, however. To fully capture and compare the publiccost of nursing home residence and community living, Medicare claims data are essential.Nonetheless, from the vantage point of state policy makers with state budgetresponsibilities, it appears that a nursing home transition program can be a cost-effectivestrategy that makes community living options available to certain nursing home residents.
As previously noted, the findings from this evaluation are severely limited by the smallnumber of movers and relatively short period of post-move observation. A longerobservation period in future evaluations of this nature may provide additional insightregarding longer-term or “steady state” levels of homemaking involvement, employment,and socialization.

Muskie School of Public Service 43
Appendix A. List of Data Sources
Data used in this evaluation came from the following sources. Copies of instruments areavailable on request from the Muskie School of Public Service, University of SouthernMaine.
Quality of Life Indicators• In-person Consumer Survey• Minimum Data Set (MDS), versions + and 2.0
Health and Mental Health Status Indicators• In-person Consumer Survey• Participant Progress Notes• Medical Eligibility Determination (MED)• Minimum Data Set (MDS), versions + and 2.0• Medicaid Claims Data
Physical Function Indicators• In-person Consumer Survey• Participant Progress Notes• Minimum Data Set (MDS), versions + and 2.0• Medical Eligibility Determination (MED)
Public Expenditures• Medicaid Claims Data• Participant Financial Survey
Attitudes of Nursing Home Staff• Nursing Home Staff Survey
Policy Impact• Key Informant Interviews• Document Review
EDMUND S. MUSKIE SCHOOL OF PUBLIC SERVICE educates leaders, informs public policy,and broadens civic participation. The School links scholarship with practice to improvethe lives of people of all ages, in every county of Maine, and in every state in the nation.
EDMUND S. MUSKIE SCHOOL OF PUBLIC SERVICE TELEPHONE (207) 780-443096 Falmouth Street TTY (207) 780-5646PO Box 9300 FAX (207-4417Portland, Maine 04104-9300
www.muskie.usm.maine.edu
UNIVERSITY OF A member of the University of Maine system
Southern Maine