evaluation of offline tandem and online solid-phase extraction
TRANSCRIPT

U.S. Department of the InteriorU.S. Geological Survey
Scientific Investigations Report 2007–5021
Prepared in cooperation with theU.S. Geological Survey Toxic Substances Hydrology Program and theU.S. Environmental Protection Agency
Evaluation of Offline Tandem and Online Solid-PhaseExtraction with Liquid Chromatography/ElectrosprayIonization-Mass Spectrometry for Analysis of Antibioticsin Ambient Water and Comparison to an IndependentMethod


Evaluation of Offline Tandem and Online Solid-Phase Extraction with Liquid Chromatography/ Electrospray Ionization-Mass Spectrometry for Analysis of Antibiotics in Ambient Water and Comparison to an Independent Method
By M.T. Meyer, E.A. Lee, G.M. Ferrell, J.E. Bumgarner, and Jerry Varns
Prepared in cooperation with the U.S. Geological Survey Toxic Substances Hydrology Program and the U.S. Environmental Protection Agency
Scientific Investigations Report 2007–5021
U.S. Department of the InteriorU.S. Geological Survey

U.S. Department of the InteriorDIRK KEMPTHORNE, Secretary
U.S. Geological SurveyMark D. Myers, Director
U.S. Geological Survey, Reston, Virginia: 2007
For product and ordering information: World Wide Web: http://www.usgs.gov/pubprod Telephone: 1-888-ASK-USGS
For more information on the USGS--the Federal source for science about the Earth, its natural and living resources, natural hazards, and the environment: World Wide Web: http://www.usgs.gov Telephone: 1-888-ASK-USGS
Any use of trade, product, or firm names is for descriptive purposes only and does not imply endorsement by the U.S. Government.
Although this report is in the public domain, permission must be secured from the individual copyright owners to reproduce any copyrighted materials contained within this report.
Suggested citation:Meyer, M.T., Lee, E.A., Ferrell, G.F., Bumgarner, J.E., and Varns, Jerry, 2007, Evaluation of offline tandem and online solid-phase extraction with liquid chromatography/electrospray ionization-mass spectrometry for analysis of antibiot-ics in ambient water and comparison to an independent method: U.S. Geological Survey Scientific Investigations Report 2007–5021, 28 p.
Front cover: Photographs showing offline tandem solid-phase extraction (left) and online-solid-phase extraction (right) set up for water samples.
Back cover: Photographs showing two liquid chromatographs/mass spectrometers used to analyze antibiotics.

iii
ContentsAbstract ............................................................................................................................................................. 1Introduction....................................................................................................................................................... 1Acknowledgments ........................................................................................................................................... 2Experimental Section ...................................................................................................................................... 3
Materials .................................................................................................................................................. 3Sample Collection ................................................................................................................................... 3
OfflineTandem Solid-Phase Extraction ......................................................................................................... 3Sample Preparation ................................................................................................................................ 3Sample Analysis ...................................................................................................................................... 6
Online Solid-Phase Extraction ....................................................................................................................... 8Sample Preparation ................................................................................................................................ 8Sample Analysis ...................................................................................................................................... 8
Evaluation of Analytical Methods for Analysis of Antibiotics .................................................................. 10Offline Tandem Solid-Phase Extraction ............................................................................................... 10Online Solid-Phase Extraction .............................................................................................................. 14
Comparison of Offline Tandem and Online Solid-Phase Extraction and an Independent Method .... 19Conclusions....................................................................................................................................................... 25References Cited.............................................................................................................................................. 25
Figures 1. Photographs showing solid-phase extraction apparatus and setup for extraction of
antibiotics ......................................................................................................................................... 5 2–5. Selected ion-monitoring chromatograms of: 2. An extracted sample spiked at 0.20 microgram per liter for offline tandem solid-
phase extraction method used in analysis of sulfonamide-macrolide and quinolone-tetracycline antibiotics ...................................................................................... 13
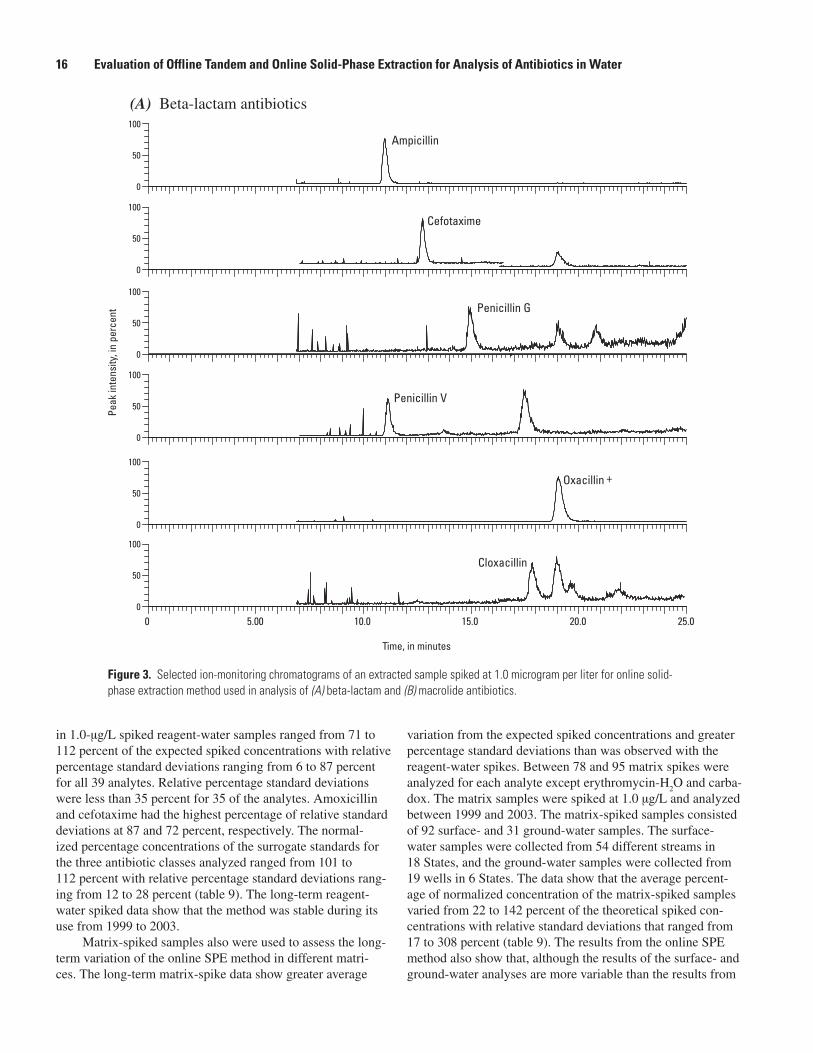
3. An extracted sample spiked at 1.0 microgram per liter for online solid-phase extraction method used in analysis of beta-lactam and macrolide antibiotics .......... 16
4. An extracted sample spiked at 1.0 microgram per liter for online solid-phase extraction method used in analysis of sulfonamide and quinolone antibiotics .......... 18
5. An extracted sample spiked at 1.0 microgram per liter for online solid-phase extraction method used in analysis of tetracycline antibiotics ..................................... 20
6. Graphs showing regression relations between sample concentrations determined using offline tandem solid-phase extraction (SPE) method, online SPE method, and M3 pharmaceutical method for analysis of sulfamethoxazole and trimethoprim ...................... 24
Tables 1. Antibiotics selected for study, their molecular weight, Chemical Abstract Service
number, and general human and animal usage ........................................................................ 4 2. Mobile-phase composition and gradient for sulfonamide-macrolide and quinolone-
tetracycline liquid chromatography/mass spectrometry analysis ......................................... 6 3. List of base peak and confirming ions for antibiotic mass spectral analysis for offline
tandem solid-phase extraction method ...................................................................................... 7

iv
4. List of base peak and confirming ions for antibiotic mass spectral analysis for online solid-phase extraction method ..................................................................................................... 9
5. Proportions of blank solution to working standard mix used to prepare standard solutions ........................................................................................................................................... 11
6. Solutions for online solid-phase extraction instrument and high-performance/liquid chromatograph ................................................................................................................................ 11
7. Flow rates and mobile-phase composition for analysis by online solid-phase extraction method .............................................................................................................................................. 12
8. Summary of recovery of antibiotics from fortified reagent-water solutions and average percentage variation of analyzed concentration of reagent-water and matrix spikes to their theoretical spiked concentrations for offline tandem solid-phase extraction method .............................................................................................................................................. 15
9. Summary of average percentage of normalized concentration of spiked reagent-water and matrix samples for online solid-phase extraction method ............................................... 21
10. Comparison of concentrations in 44 surface-water samples analyzed using three analytical methods ......................................................................................................................... 22
v
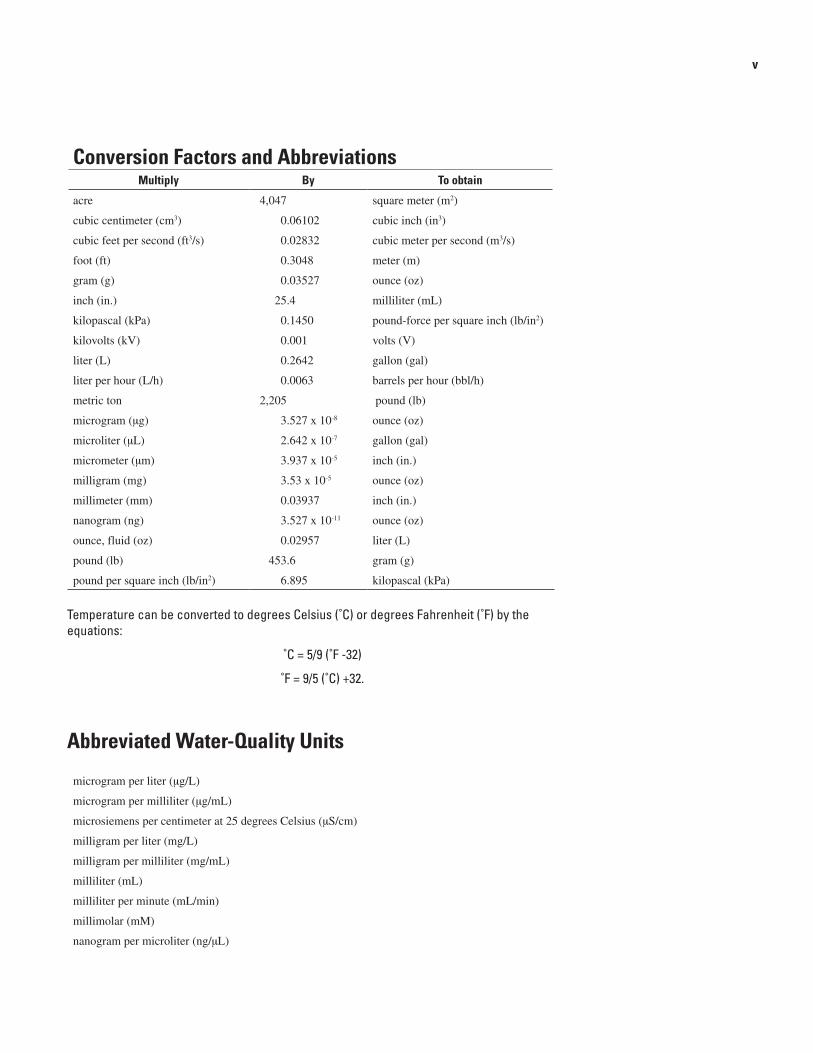
Conversion Factors and AbbreviationsMultiply By To obtain
acre 4,047 square meter (m2)
cubic centimeter (cm3) 0.06102 cubic inch (in3)
cubic feet per second (ft3/s) 0.02832 cubic meter per second (m3/s)
foot (ft) 0.3048 meter (m)
gram (g) 0.03527 ounce (oz)
inch (in.) 25.4 milliliter (mL)
kilopascal (kPa) 0.1450 pound-force per square inch (lb/in2)
kilovolts (kV) 0.001 volts (V)
liter (L) 0.2642 gallon (gal)
liter per hour (L/h) 0.0063 barrels per hour (bbl/h)
metric ton 2,205 pound (lb)
microgram (µg) 3.527 x 10⁻⁸ ounce (oz)
microliter (µL) 2.642 x 10⁻⁷ gallon (gal)
micrometer (µm) 3.937 x 10⁻⁵ inch (in.)
milligram (mg) 3.53 x 10⁻⁵ ounce (oz)
millimeter (mm) 0.03937 inch (in.)
nanogram (ng) 3.527 x 10⁻¹¹ ounce (oz)
ounce, fluid (oz) 0.02957 liter (L)
pound (lb) 453.6 gram (g)
pound per square inch (lb/in2) 6.895 kilopascal (kPa)
Temperature can be converted to degrees Celsius (˚C) or degrees Fahrenheit (˚F) by the equations:
˚C = 5/9 (˚F -32)
˚F = 9/5 (˚C) +32.
Abbreviated Water-Quality Units
microgram per liter (µg/L)
microgram per milliliter (µg/mL)
microsiemens per centimeter at 25 degrees Celsius (µS/cm)
milligram per liter (mg/L)
milligram per milliliter (mg/mL)
milliliter (mL)
milliliter per minute (mL/min)
millimolar (mM)
nanogram per microliter (ng/µL)

vi
Other Abbreviations or Acronyms Used in this ReportACE automated cartridge exchange
ACN acetonitrile
ACS American Chemical Society
AFO animal feeding operation
AR antibiotic resistant
BLM beta lactams-macrolides
C18
carbon-18
CAFO confined animal feeding operation
CAS Chemical Abstract Service
CCV continuing calibration verification
EDTA ethylene diamine tetraacetic acid
ESI electrospray ionization
HLB hydrophilic-lipophilic balance cartridge
HPD high-pressure dispenser
HPLC high-performance liquid chromatography
kV kilovolts
LC/ESI-MS liquid chromatography/electrospray ionization-mass spectrometry
LC/MS/MS liquid chromatography/mass spectrometry/mass spectrometry
LOQ limit of quantitation
M3 Cahill and others (2004) pharmaceutical method
MCX mixed-mode HLB cation exchange cartridge
min minutes
OGRL Organic Geochemistry Research Laboratory (Lawrence, Kansas)
R2 correlation coefficient
RSD relative standard deviation
SIM selected-ion monitoring
SPE solid-phase extraction
SQ sufonamides-quinolines
TET tetracyclines
USEPA U.S. Environmental Protection Agency
USGS U.S. Geological Survey
cc cubic centimeter
n number of samples
V volts
w/V weight to volts
± plus or minus
> greater than
% percent

AbstractThis report describes the performance of an offline tan-
dem solid-phase extraction (SPE) method and an online SPE method that use liquid chromatography/mass spectrometry for the analysis of 23 and 35 antibiotics, respectively, as used in several water-quality surveys conducted since 1999. In the offline tandem SPE method, normalized concentrations for the quinolone, macrolide, and sulfonamide antibiotics in spiked environmental samples averaged from 81 to 139 percent of the expected spiked concentrations. A modified standard-addition technique was developed to improve the quantitation of the tetracycline antibiotics, which had “apparent” concentrations that ranged from 185 to 1,200 percent of their expected spiked concentrations in matrix-spiked samples. In the online SPE method, normalized concentrations for the quinolone, macro-lide, sulfonamide, and tetracycline antibiotics in matrix-spiked samples averaged from 51 to 142 percent of their expected spiked concentrations, and the beta-lactam antibiotics in matrix-spiked samples averaged from 22 to 76 percent of their expected spiked concentration.
Comparison of 44 samples analyzed by both the offline tandem SPE and online SPE methods showed 50 to 100 per-cent agreement in sample detection for overlapping analytes and 68 to 100 percent agreement in a presence-absence comparison for all analytes. The offline tandem and online SPE methods were compared to an independent method that contains two overlapping antibiotic compounds, sulfamethoxa-zole and trimethoprim, for 96 and 44 environmental samples, respectively. The offline tandem SPE showed 86 and 92 per-cent agreement in sample detection and 96 and 98 percent
agreement in a presence-absence comparison for sulfamethox-azole and trimethoprim, respectively. The online SPE method showed 57 and 56 percent agreement in sample detection and 72 and 91 percent agreement in presence-absence compari-son for sulfamethoxazole and trimethoprim, respectively. A linear regression with an R2 of 0.91 was obtained for trim-ethoprim concentrations, and an R2 of 0.35 was obtained for sulfamethoxazole concentrations determined from samples analyzed by the offline tandem SPE and online SPE methods.
Linear regressions of trimethoprim and sulfamethoxa-zole concentrations determined from samples analyzed by the offline tandem SPE method and the independent M3 phar-maceutical method yielded R2 of 0.95 and 0.87, respectively. Regressed comparison of the offline tandem SPE method to the online SPE and M3 methods showed that the online SPE method gave higher concentrations for sulfamethoxazole and trimethoprim than were obtained from the offline tandem SPE or M3 methods.
IntroductionAntibiotics are used extensively in human health and
agriculture. In agriculture, antibiotics are used primarily in large animal feeding operations (AFOs), but they also are used in aquaculture and to control fungi in fruit orchards (McManus and others, 2002). Although increased prevalence of antibi-otic resistant (AR) infections has been attributed primarily to the overprescription of antibiotics and the unwillingness of a substantial number of patients to complete the prescription cycle (Tenover and Hughes, 1996; Cole and others, 2003), there is increasing concern that the routine use of subtherapeu-tic levels of antibiotics in confined animal feeding operations (CAFOs) could generate strains of pathogenic AR bacteria and AR-resistant human infections (Harrison and Lederberg, 1998; Molbak and others, 1999; Smith and others, 1999). There also is uncertainty as to whether the transport of antibiotics, along
Evaluation of Offline Tandem and Online Solid-Phase Extraction with Liquid Chromatography/Electrospray Ionization-Mass Spectometry for Analysis of Antibiotics in Ambient Water and Comparison to an Independent Method
By M.T. Meyer1, E.A. Lee2, G.F. Ferrell3, J.E. Bumgarner4, and Jerry Varns4
1U.S. Geological Survey, Lawrence, Kansas.
2U.S. Geological Survey, Lawrence, Kansas, retired.
3U.S. Geological Survey, Raleigh, North Carolina.
4U.S. Environmental Protection Agency, Raleigh, North Carolina, retired.

with other pharmaceuticals, in surface water and ground water from urban and agricultural sources has deleterious effects on water quality (Levy, 1998a).
Data on the annual amount of antibiotics produced in the United States and the percentage of the antibiotics associ-ated with various human and agricultural uses are sparse. In general, annual production of antibiotics in the United States is about 23,000 metric tons (Levy, 1998b). Estimates of the percentage of antibiotics used for human treatment range from less than 50 to 65 percent, whereas estimates on the amount of antibiotics administered to livestock range from 10 to more than 50 percent (Mellon and others, 2001; Animal Health Institute, 2002). A substantial portion of the antibiotics admin-istered to humans or animals is excreted in the active form (Elmund and others, 1971; Feinman and Matheson, 1978; Alcock and others, 1999), and abiotic processes also may revert a portion of the pharmaceutical metabolites back to the parent form (Langhammer and Buening-Pfaue, 1989). In this report, the term metabolite refers to direct and indirect biotic and abiotic degradation products of a parent antibiotic.
A wide range of pharmaceutical compounds are trans-ported into surface and ground water from human and agri-cultural sources in Europe and the United States (Holm and others, 1995; Buser and others, 1998; Roloff, 1998; Ternes, 1998; Campagnolo and others, 2002; Kolpin and others, 2002). Because of the diversity of antibiotic usage, several sources can transport antibiotics to surface and ground water. These include discharge of treated wastewater, permitted and nonpermitted discharge of raw sewage, unsaturated zone trans-port and surface runoff from land-applied waste from human and agricultural sources, leakage and flooding from large waste-storage ponds and pits in CAFOs, and leakage from septic systems. Determination of whether a relation between AR bacterial populations, or human and ecosystem health, and the occurrence of antibiotics in surface and ground water are important areas of research (Meyer, 2004). The development of analytical methods capable of identifying and quantifying low concentrations of pharmaceutical compounds in surface and ground water is an essential component in addressing this problem.
Although many methods have been developed for the analysis of antibiotics in food, serum, and urine over the last two decades, only since the late 1990s have researchers begun to develop a range of sensitive methods to study pharmaceu-ticals, including antibiotics, in environmental samples. For example, Hirsch and others (1998) used lypholization and liquid chromatography/tandem mass spectrometry (LC/MS/MS) to analyze for compounds from the beta lactam, mac-rolide, sulfonamide, and tetracycline classes of antibiotics in surface water. They also tested a C
18 solid-phase extraction
(SPE) method for the analysis of multiple classes of antibi-otics. Lindsey and others (2001) used the Waters (Milford,
Massachusetts) Oasis hydrophilic-lipophilic balance (HLB) SPE cartridge and an LC/MS method to analyze sulfonamide and tetracycline antibiotics in surface water. Other methods published since 2000 have used various SPE extraction methodologies and LC/MS/MS. Most of the methods for analysis of antibiotics in water by SPE and LC/MS/MS or LC/MS were developed by Meyer and others (2000), Bruno and others (2001), Golet and others (2001), Ternes and others (2001), Zhu and others (2001), Christian and others (2003), Grant and others (2003), Loffler and Ternes (2003), Reverte and others (2003), Snow and others (2003), Turiel and others (2003), and Cahill and others (2004).
This report describes and compares two independently developed antibiotic methods: (1) an offline tandem-SPE, LC/electrospray-ionization (ESI) MS method, and (2) an online single-pass SPE LC/ESI-MS method of which both were used to examine the occurrence, fate, and transport of human and agriculturally used antibiotics in surface and ground water. The offline tandem SPE method of analysis for antibiotics was used from 1999 to 2003 to analyze more than 1,000 surface- and ground-water samples from national stream-water reconnaissance studies, watershed and field-scale studies on antibiotic and antibiotic-resistant bacterial transport from urban and agricultural sources in multiple States, and wastewater outfall transport studies. The online SPE method of analysis for antibiotics was used from 2000 to 2003 to analyze more than 500 samples from similar studies. A suite of antibiotic compounds (table 1) used for human health, the health and management of agricultural livestock, and veteri-nary medicine was selected for study. The goals of developing these methods were: (1) to examine the occurrence of antibiot-ics in surface water downstream from large CAFOs (results in Meyer and others, 2000; Campagnolo and others, 2002); (2) to examine the occurrence of antibiotics in susceptible water-sheds on a national scale (Kolpin and others, 2002); and (3) to assess whether selected antibiotic compounds can be useful discriminators of contaminant sources. Samples analyzed by these two methods also were compared with the same samples analyzed by an independently developed SPE LC/ESI-MS method that has two commonly detected antibiotic compounds that overlap with the two methods described in this report.
AcknowledgmentsThis study was supported by the U.S. Geological Survey,
Toxic Substances Hydrology Program; U.S. Environmental Protection Agency (USEPA), Interagency Agreement (IAG) DW14938589-01-0; and the USEPA Office of Research and Development through the Regional Applied Research Effort (RARE). The authors also wish to acknowledge the analytical assistance of Joel Daughtridge, USEPA (retired).
� Evaluation of Offline Tandem and Online Solid-Phase Extraction for Analysis of Antibiotics in Water

Experimental Section
Materials
The antibiotic compounds analyzed by the offline tandem SPE and online SPE-LC/MS methods, their molecular weight, Chemical Abstract Service numbers, and general animal and human usage are shown in table 1. The analytical standards for amoxicillin, ampicillin, carbadox, cefotaxime, chlortetra-cycline, cloxacillin, demeclocyline, doxycycline, enrofloxa-cin, erythromycin, flumequine, lincomycin, lomefloxacin, minocycline, norfloxacin, ofloxacin, oxacillin, oxolinic acid, oxytetracycline, penicillin G, penicillin V, roxithromycin, sulfachlorpyridazine, sulfadiazine, sulfadimethoxine, sulfa-merazine, sulfamethazine, sulfamethizole, sulfamethoxazole, sulfathiazole, tetracycline, trimethoprim, tylosin, and vir-giniamycin, and surrogate standards meclocycline, nalidixic acid, and oleandomycin were obtained from Sigma Aldrich (St. Louis, Missouri); ciprofloxacin from Research Diagnos-tics (Flanders, New Jersey) and Fluka (Switzerland); clina-floxacin from Axxora (San Diego, California); ormetoprim from Alpharma Inc. (Fort Lee, New Jersey); sarafloxacin from Abbott Laboratories (Shawnee Mission, Kansas); sulfametha-zine-13C
6 and erythromycin-13C
1 (surrogate standards) from
Cambridge Isotopes (Andover, Massachusetts); terbuthylazine (internal standard) from Supelco (Bellefonte, Pennsylvania); and simetone (internal standard) from the U.S. Environmental Protection Agency (USEPA) repository. The purity of all the standards was greater than 90 percent, except for chlortetracy-cline (75 percent) and tetracycline (80 percent). Because of the lack of stable isotope labeled antibiotic standards, unlabeled antibiotics that either were not registered for use or are low-use antibiotics in the United States were chosen for use as sur-rogate standards. Acetic acid, ammonium acetate, ammonium formate, formic acid, Na
2-EDTA, and Na-hydroxide were
all American Chemical Society (ACS) certified. Acetonitrile and methanol were high-performance liquid chromatography (HPLC) grade.
Sample Collection
Water samples were collected using established U.S. Geological Survey (USGS) protocols (Shelton and Capel, 1994). All water samples were filtered in the field or in the laboratory using baked (450 ˚C for 8 hours), 0.7-µm glass-fiber filters and stored in 125-mL or 1-L amber, glass bottles. For the offline tandem SPE method, all samples were shipped overnight to the USGS, North Carolina Water Science Center, Raleigh, North Carolina (1998–2000), or the Florida Inte-grated Science Center, Ocala Water Quality and Research Laboratory, Ocala, Florida (2000–03). For the online SPE method, all samples were shipped overnight to the USGS, Kansas Water Science Center, Organic Geochemistry Research Laboratory (OGRL), Lawrence, Kansas. All samples were logged in and stored at 4 ˚C until they were prepared for
extraction. Samples generally were extracted within 14 days after they were received at the laboratory.
Offline Tandem Solid-Phase Extraction
Sample Preparation
For the offline tandem SPE method, individual 1-mg/mL stock solutions of each analyte were prepared in methanol or reagent-grade water with 20 mM ammonia acetate, pH 5.6 standard units and stored at -10 ˚C. An antibiotic stan-dard mix solution containing 2.5 ng/µL of each analyte and a surrogate standard mix containing 2.5 ng/µL sulfamethazine-13C
6, erythromycin-13C
1, and meclocycline were prepared in
20 mM ammonia acetate, pH 5.6 standard units. A 10-ng/µL internal standard solution of terbuthylazine was prepared in methanol. All solutions were stored in amber glass bottles at –10 ˚C. Acetonitrile and methanol were HPLC grade from Fisher (Pittsburgh, Pennsylvania). Ammonia hydroxide and Na
2-EDTA were ACS certified. Erythromycin and erythro-
mycin-13C1 were converted to erythromycin-H
2O and erythro-
mycin-13C1-H
2O by acidifying the fortified standard solutions
and samples to pH 3.0 standard units with (H2SO
4) prior to
extraction. Reagent-grade water was generated using a deion-ized water system with two mixed-bed resins and one activated carbon cartridge following treatment using a Barnstead or Mil-lipore cartridge water treatment with ultraviolet disinfection and 0.2-µm filtration.
For the offline tandem SPE method, antibiotic com-pounds were extracted from water samples using a tandem SPE procedure. This SPE method used a Waters Oasis HLB and mixed-mode cation exchange (MCX) (6 cc, 200 mg) SPE cartridges conditioned with 2 mL reagent water, 2 mL metha-nol, 2 mL methanol with 5 percent ammonia hydroxide, 2 mL reagent water, and 2 mL pH 3.0 standard units (H
2SO
4) reagent
water. Aliquots (500 mL) of each water sample were prepared in 500-mL baked, glass amber bottles for extraction by adding 5 mL of a 0.1-mg/mL solution of Na
2-EDTA and adjusting the
pH to 3.0 using concentrated H2SO
4. Each sample then was
spiked with 50 µL of the 2.5-ng/µL surrogate standard mix. The MCX cartridges then were connected into the valves of a 24-port vacuum rack, and the HLB cartridges were attached to the top of the MCX cartridges using large-volume SPE adapters (fig. 1) with the tubing nuts bored out to 3/8 in. to accept the tip of the SPE cartridge. A large-volume sampling line was connected to the HLB cartridge, and the sample passed through the HLB and MCX cartridges with a vacuum of 20 mm Hg. The HLB and MCX cartridges for each sample then were rinsed individually with 2 mL reagent water. For the elution step of the method, the HLB and MCX SPE cartridges were stacked in reverse order with the MCX stacked on top of the HLB cartridge. First, the HLB cartridge was attached to a vacuum rack with disposable Teflon sleeves and loaded with 2 mL methanol. Then, the MCX cartridge was attached to the
Offline Tandem Solid-Phase Extraction �

� Evaluation of Offline Tandem and Online Solid-Phase Extraction for Analysis of Antibiotics in Water
Table 1. Antibiotics selected for study, their molecular weight, Chemical Abstract Service number, and general human and animal usage.
CompoundMolecular weight
(grams)Chemical Abstract
Service numberGeneral human and
animal usage
Beta lactams
Amoxicillin 365.4 26787–78–01 human, cats, cattle
Ampicillin 349.4 69–53–4 dogs, cats, cattle, human
Cefotaxime 477.4 64485–93–4 human
Cloxacillin 475.9 7081–44–9 human, cattle
Oxacillin 401.4 7204–38–2 cattle, human
Penicillin G 356.4 69–57–8 human, swine, cattle
Penicillin V 350.4 87–08–1 human
Macrolides
Erythromycin 735.9 114–07–8 humans, poultry, swine
Erythromycin-H2O 715.5 114–07–8 erythromycin degradate
Roxithromycin 837.1 80214–83–1 humans
Tylosin 916.1 1401–69–0 chickens, swine, cattle
Virginiamycin 525.6 21411–53–0 poultry, swine, cattle
Quinolones
Ciprofloxacin 331.4 85721–33–1 human, swine, chickens
Clinafloxacin 365.8 105956–97–6 human
Enrofloxacin 359.4 93106–60–6 cattle, swine, poultry, dogs, cats
Flumequine 261.3 42835–25–6 cattle, swine, chickens, fish
Lomefloxacin 351.3 98079–51–7 human
Norfloxacin 319.3 70458–96–7 human, poultry
Ofloxacin 361.4 82419–36–1 poultry, human
Oxolinic acid 261.2 14698–29–4 cattle, swine, chickens, fish
Sarafloxacin 385.4 98105–99–8 poultry, fish
Sulfonamides
Sulfachloropyrizadine 284.7 80–32–0 swine, calves, dogs
Sulfadiazine 250.3 68–35–9 horses, humans
Sulfadimethoxine 310.3 122–11–2 fish, poultry
Sulfamerazine 264.3 127–79–7 fish, poultry
Sulfamethazine 283.5 57–68–1 swine, cattle
Sulfamethizole 270.3 144–82–1 dogs, cats
Sulfamethoxazole 253.3 723–46–6 human
Sulfathiazole 255.3 72–14–0 swine
Tetracyclines
Chlorotetracycline 515.3 57–62–5 swine, poultry, cattle, sheep, ducks
Demeclocycline 501.3 127–33–3 human, cattle
Doxycycline 480.9 564–25–0 human, dog
Minocycline 493.9 10118–90–8 human, cattle
Oxytetracycline 496.9 79–57–2 poultry, fish, swine, cattle, sheep, bees, lobsters
Tetracycline 480.9 60–54–8 humans, dogs, cattle
Others
Carbadox 262.2 1789875 swine
Lincomycin 406.5 154–21–2 poultry, swine
Ormetoprim 274.3 6981–18–6 fish, poultry
Trimethoprim 290.3 738–70–5 human, dogs, horses

top of the HLB cartridge and also loaded with 2 mL methanol. The cartridges then were eluted into a 15-mL glass, conical-bottom test tube. Both cartridges were eluted with additional 2- x 3-mL aliquots of methanol followed by the elution of the MCX cartridge separately to prevent the complete elution of all the humic substances adsorbed to the HLB cartridge with 2 mL of a 5-percent ammonia hydroxide-methanol solution. The sample eluate then was spiked with 50 µL of the 10-ng/µL
terbuthylazine internal standard solution. Sample eluates were vortexed and evaporated at 50 ˚C under a gentle stream of nitrogen (15 lb/in2) to a volume of approximately 20 µL using a Zymark TurboVap (Hopkinton, Massachusetts). Three hun-dred microliters (300 µL) of 20 mM ammonia acetate reagent water (pH 5.6 standard units) then were added to the sample eluate, vortexed, and transferred to a glass chromatography vial. The sample eluates were stored at –10 ˚C until analysis.
(A) Solid-phase extraction setup for water samples
(B) Solid-phase elution setup for extracted water samples
Mixed-mode cation exchange solid-phaseextraction cartridge (MCX)
Oasis hydrolphilic-lipophilic balancesolid-phase extraction cartridge (HLB)
Elution vacuum rack with disposableteflon sleeves
Elution test tube
Mixed-mode cation exchange solid-phase extraction cartridge (MCX)
SPE adapter
SPE adapter
Oasis hydrolphilic-lipophilic balance solid-phase extraction cartridge (HLB)
Solid phase extraction adapter and sample tube
Figure 1. Solid-phase extraction apparatus and setup for extraction of antibiotics.
Offline Tandem Solid-Phase Extraction �
Sample sets consisted of 10 water samples, a matrix-spiked sample, a duplicate water sample, two fortified reagent-water samples, and two reagent-water blanks.
Sample Analysis
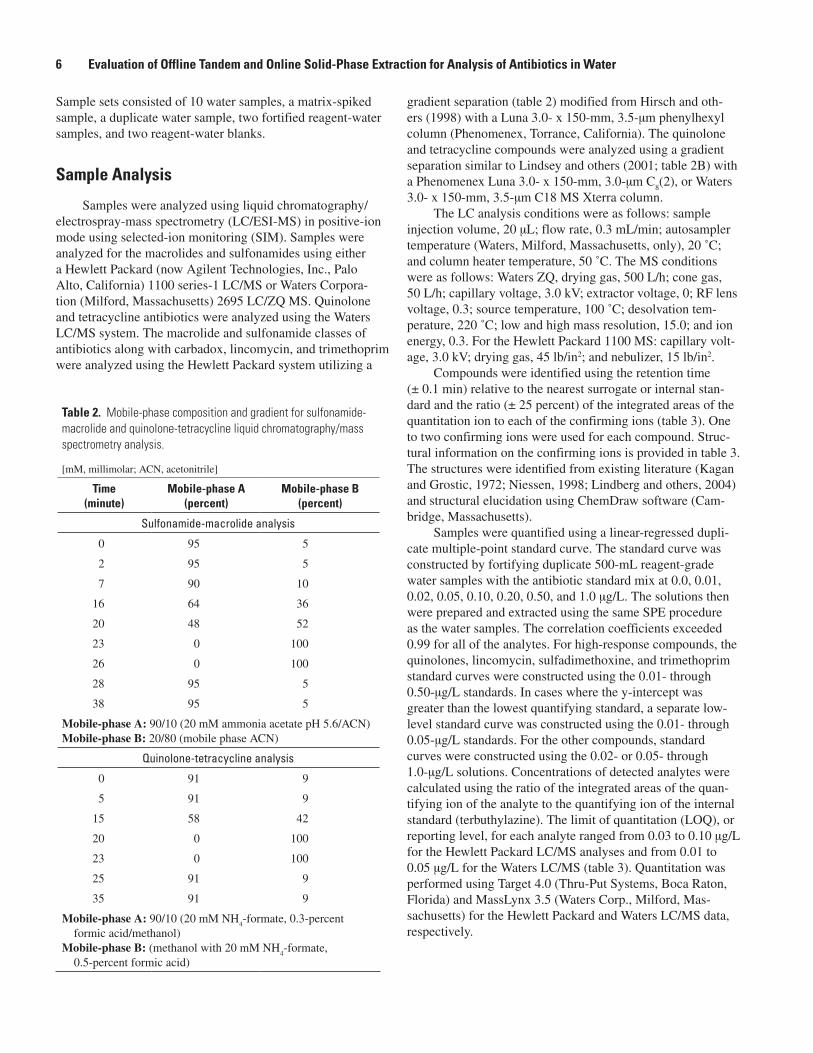
Samples were analyzed using liquid chromatography/electrospray-mass spectrometry (LC/ESI-MS) in positive-ion mode using selected-ion monitoring (SIM). Samples were analyzed for the macrolides and sulfonamides using either a Hewlett Packard (now Agilent Technologies, Inc., Palo Alto, California) 1100 series-1 LC/MS or Waters Corpora-tion (Milford, Massachusetts) 2695 LC/ZQ MS. Quinolone and tetracycline antibiotics were analyzed using the Waters LC/MS system. The macrolide and sulfonamide classes of antibiotics along with carbadox, lincomycin, and trimethoprim were analyzed using the Hewlett Packard system utilizing a
gradient separation (table 2) modified from Hirsch and oth-ers (1998) with a Luna 3.0- x 150-mm, 3.5-µm phenylhexyl column (Phenomenex, Torrance, California). The quinolone and tetracycline compounds were analyzed using a gradient separation similar to Lindsey and others (2001; table 2B) with a Phenomenex Luna 3.0- x 150-mm, 3.0-µm C
8(2), or Waters
3.0- x 150-mm, 3.5-µm C18 MS Xterra column.The LC analysis conditions were as follows: sample
injection volume, 20 µL; flow rate, 0.3 mL/min; autosampler temperature (Waters, Milford, Massachusetts, only), 20 ˚C; and column heater temperature, 50 ˚C. The MS conditions were as follows: Waters ZQ, drying gas, 500 L/h; cone gas, 50 L/h; capillary voltage, 3.0 kV; extractor voltage, 0; RF lens voltage, 0.3; source temperature, 100 ˚C; desolvation tem-perature, 220 ˚C; low and high mass resolution, 15.0; and ion energy, 0.3. For the Hewlett Packard 1100 MS: capillary volt-age, 3.0 kV; drying gas, 45 lb/in2; and nebulizer, 15 lb/in2.
Compounds were identified using the retention time (± 0.1 min) relative to the nearest surrogate or internal stan-dard and the ratio (± 25 percent) of the integrated areas of the quantitation ion to each of the confirming ions (table 3). One to two confirming ions were used for each compound. Struc-tural information on the confirming ions is provided in table 3. The structures were identified from existing literature (Kagan and Grostic, 1972; Niessen, 1998; Lindberg and others, 2004) and structural elucidation using ChemDraw software (Cam-bridge, Massachusetts).
Samples were quantified using a linear-regressed dupli-cate multiple-point standard curve. The standard curve was constructed by fortifying duplicate 500-mL reagent-grade water samples with the antibiotic standard mix at 0.0, 0.01, 0.02, 0.05, 0.10, 0.20, 0.50, and 1.0 µg/L. The solutions then were prepared and extracted using the same SPE procedure as the water samples. The correlation coefficients exceeded 0.99 for all of the analytes. For high-response compounds, the quinolones, lincomycin, sulfadimethoxine, and trimethoprim standard curves were constructed using the 0.01- through 0.50-µg/L standards. In cases where the y-intercept was greater than the lowest quantifying standard, a separate low-level standard curve was constructed using the 0.01- through 0.05-µg/L standards. For the other compounds, standard curves were constructed using the 0.02- or 0.05- through 1.0-µg/L solutions. Concentrations of detected analytes were calculated using the ratio of the integrated areas of the quan-tifying ion of the analyte to the quantifying ion of the internal standard (terbuthylazine). The limit of quantitation (LOQ), or reporting level, for each analyte ranged from 0.03 to 0.10 µg/L for the Hewlett Packard LC/MS analyses and from 0.01 to 0.05 µg/L for the Waters LC/MS (table 3). Quantitation was performed using Target 4.0 (Thru-Put Systems, Boca Raton, Florida) and MassLynx 3.5 (Waters Corp., Milford, Mas-sachusetts) for the Hewlett Packard and Waters LC/MS data, respectively.
Table �. Mobile-phase composition and gradient for sulfonamide-macrolide and quinolone-tetracycline liquid chromatography/mass spectrometry analysis.
[mM, millimolar; ACN, acetonitrile]
Time (minute)
Mobile-phase A(percent)
Mobile-phase B(percent)
Sulfonamide-macrolide analysis
0 95 5
2 95 5
7 90 10
16 64 36
20 48 52
23 0 100
26 0 100
28 95 5
38 95 5
Mobile-phase A: 90/10 (20 mM ammonia acetate pH 5.6/ACN)Mobile-phase B: 20/80 (mobile phase ACN)
Quinolone-tetracycline analysis
0 91 9
5 91 9
15 58 42
20 0 100
23 0 100
25 91 9
35 91 9
Mobile-phase A: 90/10 (20 mM NH4-formate, 0.3-percent
formic acid/methanol)Mobile-phase B: (methanol with 20 mM NH
4-formate,
0.5-percent formic acid)
� Evaluation of Offline Tandem and Online Solid-Phase Extraction for Analysis of Antibiotics in Water

Tabl
e �.
Lis
t of b
ase
peak
and
con
firm
ing
ions
for a
ntib
iotic
mas
s sp
ectra
l ana
lysi
s fo
r offl
ine
tand
em s
olid
-pha
se e
xtra
ctio
n m
etho
d.
[LC
/MS,
liqu
id c
hrom
atog
raph
y/m
ass
spec
trom
etry
; M+
H, m
olec
ular
plu
s hy
drog
en; µ
g/L
, mic
rogr
ams
per
liter
; --,
not
det
erm
ined
]
Com
poun
d
Hew
lett
Pack
-ar
d LC
/MS
repo
rtin
g le
vel
(µg/
L)
Wat
ers
LC/M
Sre
port
ing
leve
l(µ
g/L)
Qua
ntita
tion
ion
Qua
ntita
tion
ion
frag
men
tCo
nfir
min
g io
n 1
Conf
irm
ing
ion
1 fr
agm
ent,
re
fere
nce
Conf
irm
ing
ion
�Co
nfir
min
g io
n �
frag
men
t, re
fere
nce
Mac
rolid
esE
ryth
rom
ycin
-H2O
0.05
0.02
716.
5M
+H
558.
5M
-des
osam
ine-
H2O
+H
,115
8.1
deso
sam
ine+
H,1
Rox
ithro
myc
in.0
5.0
283
7.7
M+
H67
9.4
M-d
esos
amin
e+H
,115
8.1
deso
sam
ine+
H,1
Tylo
sin
.05
.02
916.
6M
+H
772.
4--
174.
1M
-4,5
-Dim
etho
xy-2
-met
hyl-
tetr
ahyd
ro-p
yran
-3-o
l-H
Quin
olon
esC
ipro
flox
acin
--.0
133
2.1
M+
H28
8.2
M-C
O2+
H,2
231.
1M
-H2O
-N-m
ethy
lpyr
rolid
ine,
3
Enr
oflo
xaci
n--
.01
360.
3M
+H
316.
1M
-CO
2+H
,234
2.1
M-H
2O-N
-met
hylp
yrro
lidin
e,3
Nor
flox
acin
--.0
132
0.1
M+
H27
6.1
M-C
O2+
H,2
231.
1M
-H2O
-N-m
ethy
lpyr
rolid
ine,
3
Sara
flox
acin
--.0
138
6.1
M+
H34
2.1
M-C
O2+
H,2
299.
3M
-H2O
-N-m
ethy
lpyr
rolid
ine,
3
Sulfo
nam
ides
Sulf
achl
orop
yriz
adin
e.1
0.0
528
5.1
M+
H15
6.0
NH
2C6H
5SO
2,328
7.1
Chl
orin
e 37
isot
ope
Sulf
adim
etho
xine
.05
.02
311.
1M
+H
156.
0N
H2C
6H5S
O2,3
245.
1M
-H2S
O2
Sulf
amer
azin
e.0
5.0
226
5.1
M+
H15
6.0
NH
2C6H
5SO
2,310
8.1
amin
ophe
nyl,3
Sulf
amet
hazi
ne.0
5.0
227
9.1
M+
H15
6.0
NH
2C6H
5SO
2,318
6.1
CH
3OC
4N2N
H2S
O2,3
Sulf
amet
hizo
le.1
0.0
527
1.0
M+
H15
6.0
NH
2C6H
5SO
2,310
8.1
amin
ophe
nyl,3
Sulf
amet
hoxa
zole
.10
.05
254.
1M
+H
156.
0N
H2C
6H5S
O2,3
108.
1am
inop
heny
l,3
Sulf
athi
azol
e.1
0.0
525
6.0
M+
H15
6.0
NH
2C6H
5SO
2,310
8.1
amin
ophe
nyl,3
Tetra
cycl
ines
Chl
orot
etra
cycl
ine
--.0
547
9.2
M+
H48
1.2
Chl
orin
e 37
isot
ope
462.
2M
-NH
3+H
,1
Dem
eclo
cycl
ine
--.0
546
5.2
M+
H44
8.1
M-N
H3+
H,2
430.
0M
-H2O
-NH
3+H
,1
Dox
ycyc
line
--.0
544
5.2
M+
H42
8.2
M-N
H3+
H,2
----
Min
ocyc
line
--.0
545
8.2
M+
H44
1.1
M-N
H3+
H,2
352.
1--
Oxy
tetr
acyc
line
--.0
546
1.2
M+
H42
6.2
M-H
2O-N
H3+
H,1
443.
3M
-NH
3+H
,2
Tetr
acyc
line
--.0
544
5.1
M+
H42
8.2
M-N
H3+
H,3
410.
1M
-H2O
-NH
3+H
,1
Othe
rsC
arba
dox
.10
.05
231.
1M
-OC
H2
263.
0M
+H
----
Lin
com
ycin
.05
.02
407.
3M
+H
126.
21-
Met
hyl-
3-pr
opyl
-pyr
rolid
in,4
----
Tri
met
hopr
im.0
3.0
229
1.1
M+
H23
0.2
M-2
(CH
3O)+
H,2
--M
-tri
met
hoxy
phen
yl,1
Surr
ogat
e an
d in
tern
al s
tand
ards
Sulf
amet
hazi
ne-13
C6
----
285.
0M
+H
186.
1--
284.
1--
Ery
thro
myc
in-13
C1-
H2O
----
717.
5M
+H
559.
5--
159.
1--
Mec
locy
clin
e--
--47
7.2
M+
H47
9.2
--46
0.2
--Te
rbut
hyla
zine
----
230.
0M
+H
232.
0--
174.
0--
1 Hir
sch
and
othe
rs (
1998
).2 L
indb
erg
and
othe
rs (
2004
).3 N
iess
en (
1998
).4 K
agan
and
Gro
stic
(19
72).
Offline Tandem Solid-Phase Extraction �

Online Solid-Phase Extraction
Sample Preparation
For the online SPE method, 1 mg/mL stock solutions of each analyte were prepared in methanol or 50/50 methanol with 0.1 M Na-hydroxide for the quinolones. Antibiotics were analyzed in three groups—the beta lactams-macrolides (BLM) along with carbadox, lincomycin, ormetoprim, and trim-ethoprim; quinolones-sulfonamides (SQ); and tetracyclines (TET) (table 4). A separate 1.0-ng/µL standard mix and surro-gate standard mix containing the appropriate analytes for each analysis group were used. The surrogate standard for the BLM group was oleandomycin, for the SQ group it was 13C
6-sulfa-
methazine and nalidixic acid, and for the TET group the surro-gate standard was meclocycline. A 1-ng/mL working standard mix for each antibiotic group was made by diluting 123 µL of the standard mix for the appropriate group into 123 mL of reagent-grade water in a 125-mL baked, amber glass bottle. A working surrogate standard mix for each antibiotic group was prepared by diluting 500 µL of the surrogate standard mix for the appropriate group into 75 g of reagent-grade water for the BLM and SQ groups and 65 g of reagent-grade water plus 10 mL of a 5-percent EDTA solution for the TET group in a 125-mL baked, amber glass bottle. The working internal standard mix (simetone) was prepared by diluting the 1.23-ng/µL internal standard mix 20:1 for the BLM and SQ groups and 40:1 for the TET groups to a final volume of 2 mL in reagent-grade water. A matrix-spike solution was prepared for each antibiotic group by diluting the 1.0-ng/µL standard mix 10:1 to a final volume of 1 mL in reagent-grade water in a 2-mL glass chromatography vial.
Water samples were prepared by pipetting 10-mL sample aliquots into 10-mL glass vials (Chromocol/SunSri, Wilm-ington, North Carolina). A duplicate sample and matrix-spike sample also were prepared for each set of 10 samples. Blanks solutions were prepared by adding 10 mL of reagent-grade water into 10-mL glass vials. Matrix-spiked samples were prepared by adding 50 µL of the matrix-spike solution to each of the designated samples. Standard solutions were prepared at concentrations of 0.05, 0.10, 0.20, 0.50, and 1.0 µg/L using the volumes of reagent-grade water and working antibiotic working standard mix listed in table 5. Reagent-grade water continuing calibration verification (CCV) samples were prepared at 1.0 µg/L. Working surrogate standard mix for the appropriate group (750 µL) was added to all the samples, stan-dards, and blanks. The 10-mL vials then were capped, mixed, and stored at 2-4 ˚C until analysis.
A full sample run consisted of a five-point standard curve, five reagent-water blanks, two 1.0-µg/L CCVs, four duplicate samples, four 1.0-µg/L matrix-spike samples, and 40 environmental samples. A duplicate sample, a matrix spike, and a blank were placed after every 10 environmental samples, and in addition, a 1.0-µg/L CCV sample was placed
after every 20 environmental samples. Just prior to analysis the sample vials were loaded onto the online SPE instrument (Spark-Holland, Netherlands). The prepared samples in the 10-mL vials were placed in 31 of the 32 sample positions in the autosampler tray. Ten milliliters (10 mL) of the appropriate modifier solution (table 6) were added to a 10-mL glass vial and placed in the 32nd position of the autosampler. Table 6 also shows the solutions used for the high-pressure dispenser (HPD) of the online SPE instrument for each of the three anti-biotic groups. HLB Prospekt SPE cartridges (Waters, Milford, Massachusetts) were used for the BLM and SQ analyses; the glyphosate, mixed-mode SPE cartridge (proprietary, Spark-Holland, Netherlands) was used for the TET analysis. The NaOH-EDTA solution (table 6) was used to rinse and deac-tivate the sample lines on the HPD. The SPE cartridges were prepared in the loading clamp on the automated cartridge exchange (ACE) unit by rinsing with 1 mL of acetonitrile (ACN) and 1 mL of reagent-grade water. Just prior to sample loading the autosampler added 250 µL of the modifier solution to the sample vial and then mixed the sample by aspirating and dispensing 5 mL of the sample two times. Then 10 mL of the prepared sample were pumped from the sample vial and pushed through the SPE cartridge by the HPD. The cartridge then was transferred to the elution clamp of the ACE.
Sample Analysis
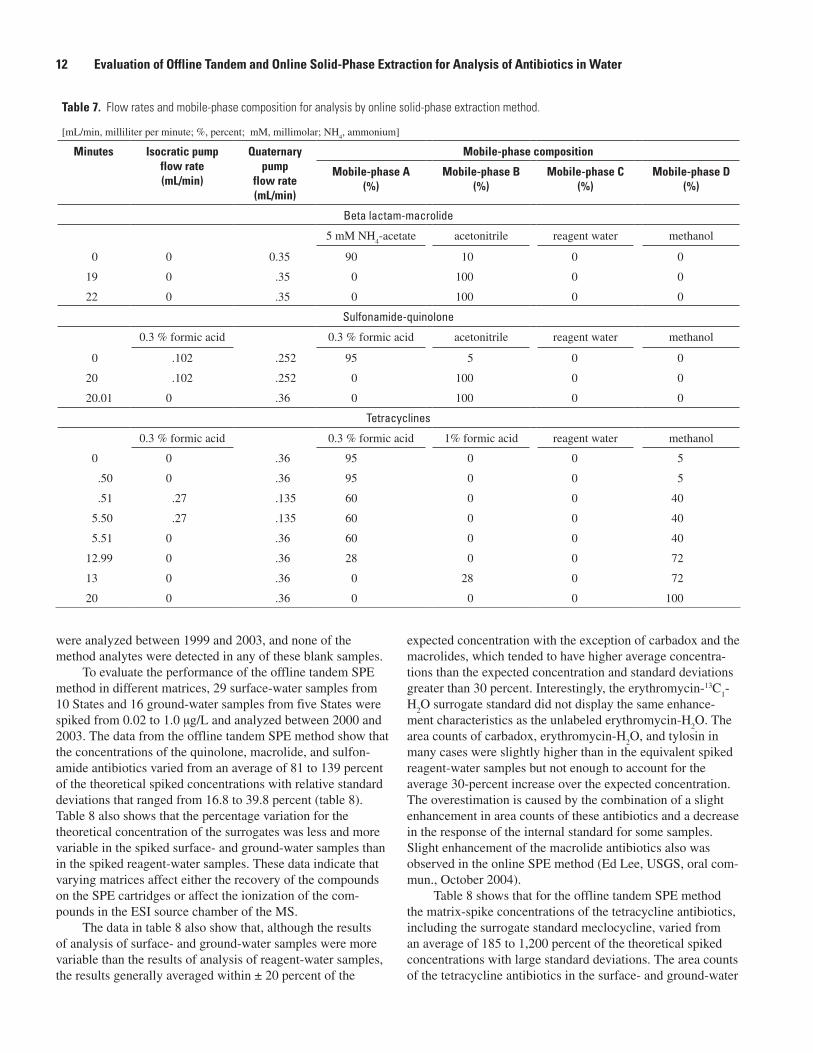
Sample analyses were performed using LC/ESI-MS in positive-ion mode using selected-ion monitoring on the Agilent 1100 LC and Model D LC/MSD Mass Spectrom-eter. After the cartridge was placed in the elution clamp, the compounds were eluted by the HPD with 750 µL of acetoni-trile as the LC binary pump, mobile-phase mixture was routed through the SPE cartridge. An isocratic pump was used to add aqueous solution to dilute out the organic solvent from the binary mobile phase to focus the compounds on the head of the LC column. The flow rates and mobile-phase composition for each of the antibiotic groups are shown in table 7. The LC autosampler injected 20 µL of the working internal standard solution as soon as the SPE cartridge elution was started. The compounds for all three antibiotic groups were separated on a 150- X 3.0-mm Luna C
18 (2) LC column with 30-µm station-
ary phase at a temperature of 50 °C. The mass spectrometer conditions were as follows for the Hewlett Packard 1100 MS: capillary voltage, 3.0 kV; drying gas, 45 lb/in2; and nebulizer, 15 lb/in2.
Compounds were identified using the retention time (±0.1 min) relative to the nearest surrogate or internal standard and the ratio (± 25 percent) of the integrated areas of the quan-titation ion to each of the confirming ions (table 4). One to two confirming ions were used for each compound. Structural information on the confirming ions is provided in table 4. The structures were identified from existing literature (Kagan and Grostic, 1972; Niessen, 1998; Lindberg and others, 2004) and structural elucidation using ChemDraw software (Cambridge, Massachusetts).
� Evaluation of Offline Tandem and Online Solid-Phase Extraction for Analysis of Antibiotics in Water

Table �. List of base peak and confirming ions for antibiotic mass spectral analysis for online solid-phase extraction method.
[LC/MS, liquid chromatography/mass spectrometry; M+H, molecular plus hydrogen; µg/L, micrograms per liter; --, not determined]
Compounds
Hewlett PackardLC/MS
reporting level(µg/L)
Quantitationion
Quantitaton ion
fragment
Confirmingion 1
Confirming ion 1fragment, reference
Confirmingion �
Confirming ion �
fragment, reference
Beta lactams
Amoxicillin 0.20 366 M+H 349 -- -- --
Ampicillin .10 350 M+H 106 -- 160 --
Cefotaxime .10 456 M+H 396 -- -- --
Cloxacillin .10 436 M+H 438 -- -- --
Oxacillin .10 402 M+H 160 -- -- --
Penicillin G .10 335 M+H 160 -- -- --
Penicillin V .10 351 M+H 160 -- -- --
Macrolides
Erythromycin-H2O .05 716 M+H 558 -- 158 --
Erythromycin .05 734 M+H 576 -- 158 --
Roxithromycin .05 837 M+H 679 -- 158 --
Tylosin .05 916 M+H 174 -- -- --
Virginiamycin .05 526 M+H 508 -- 548 --
Quinolines
Ciprofloxacin .05 332 M+H 314 M+H-18 -- --
Clinafloxacin .05 366 M+H 368 chlorine 37 isotope -- --
Flumequine .05 262 M+H 244 M+H-18 -- --
Lomefloxacin .05 352 M+H 334 M+H-18 -- --
Norfloxacin .05 320 M+H 302 M+H-18 -- --
Ofloxacin .05 362 M+H 318 M+H-18 -- --
Oxolinic Acid .05 262 M+H 244 M+H-18 -- --
Sarafloxacin .05 386 M+H 368 M+H-18 -- --
Sulfonamides
Sulfachloropyridazine .05 285 M+H 156 NH2C
6H
5SO
2,1 -- --
Sulfadiazine .05 251 M+H 156 NH2C
6H
5SO
2,1 -- --
Sulfadimethoxine .05 311 M+H 156 NH2C
6H
5SO
2,1 -- --
Sulfamerazine .05 265 M+H 156 NH2C
6H
5SO
2,1 -- --
Sulfamethazine .05 279 M+H 156 NH2C
6H
5SO
2,1 -- --
Sulfamethoxazole .05 254 M+H 156 NH2C
6H
5SO
2,1 -- --
Sulfathiazole .05 256 M+H 156 NH2C
6H
5SO
2,1 -- --
Tetracyclines
Anhydro-chlorotetracycline .10 461 M+H 444 -- -- --
Anhydro-tetracycline .10 427 M+H 410 -- -- --
Chlorotetracycline .10 479 M+H 481 chlorine 37 isotope -- --
Demeclocycline .10 465 M+H 448 M-NH3+H,2 -- --
Doxycycline .10 445 M+H 428 M-NH3+H,2 -- --
Epi-chlorotetracycline .10 479 M+H 481 chlorine 37 isotope -- --
Online Solid-Phase Extraction �
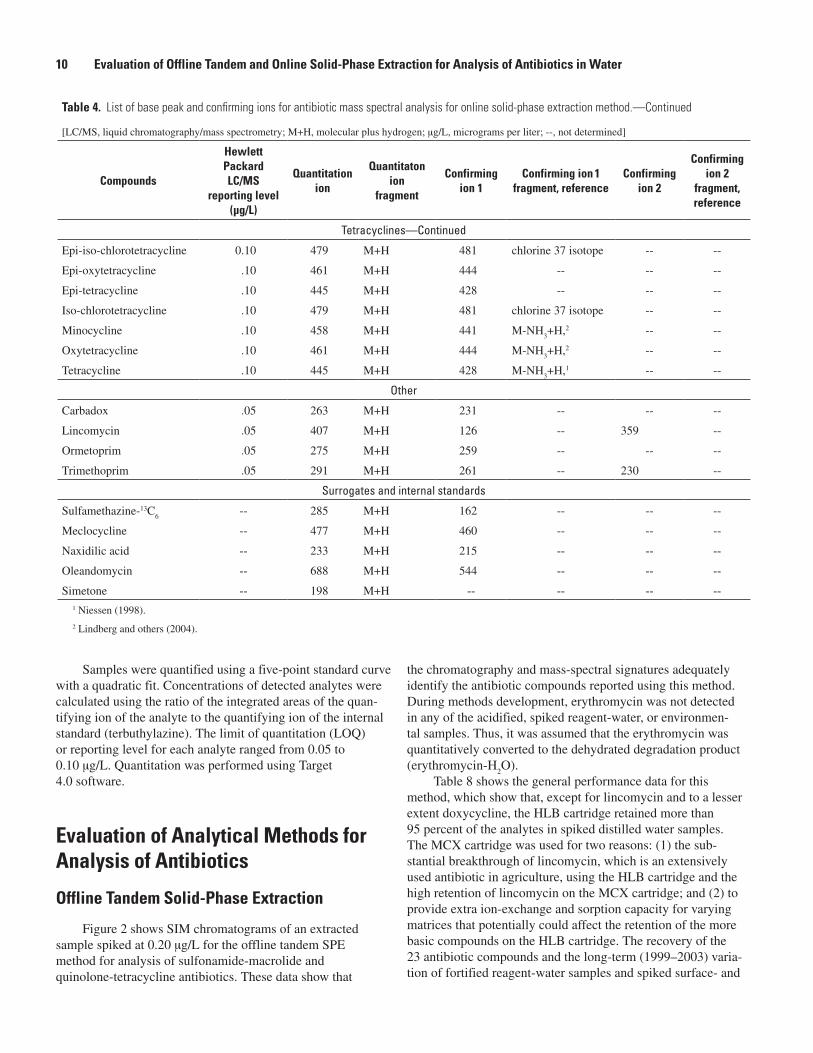
Samples were quantified using a five-point standard curve with a quadratic fit. Concentrations of detected analytes were calculated using the ratio of the integrated areas of the quan-tifying ion of the analyte to the quantifying ion of the internal standard (terbuthylazine). The limit of quantitation (LOQ) or reporting level for each analyte ranged from 0.05 to 0.10 µg/L. Quantitation was performed using Target 4.0 software.
Evaluation of Analytical Methods for Analysis of Antibiotics
Offline Tandem Solid-Phase Extraction
Figure 2 shows SIM chromatograms of an extracted sample spiked at 0.20 µg/L for the offline tandem SPE method for analysis of sulfonamide-macrolide and quinolone-tetracycline antibiotics. These data show that
the chromatography and mass-spectral signatures adequately identify the antibiotic compounds reported using this method. During methods development, erythromycin was not detected in any of the acidified, spiked reagent-water, or environmen-tal samples. Thus, it was assumed that the erythromycin was quantitatively converted to the dehydrated degradation product (erythromycin-H
2O).
Table 8 shows the general performance data for this method, which show that, except for lincomycin and to a lesser extent doxycycline, the HLB cartridge retained more than 95 percent of the analytes in spiked distilled water samples. The MCX cartridge was used for two reasons: (1) the sub-stantial breakthrough of lincomycin, which is an extensively used antibiotic in agriculture, using the HLB cartridge and the high retention of lincomycin on the MCX cartridge; and (2) to provide extra ion-exchange and sorption capacity for varying matrices that potentially could affect the retention of the more basic compounds on the HLB cartridge. The recovery of the 23 antibiotic compounds and the long-term (1999–2003) varia-tion of fortified reagent-water samples and spiked surface- and
Table �. List of base peak and confirming ions for antibiotic mass spectral analysis for online solid-phase extraction method.—Continued
[LC/MS, liquid chromatography/mass spectrometry; M+H, molecular plus hydrogen; µg/L, micrograms per liter; --, not determined]
Compounds
Hewlett PackardLC/MS
reporting level(µg/L)
Quantitationion
Quantitaton ion
fragment
Confirmingion 1
Confirming ion 1fragment, reference
Confirmingion �
Confirming ion �
fragment, reference
Tetracyclines—Continued
Epi-iso-chlorotetracycline 0.10 479 M+H 481 chlorine 37 isotope -- --
Epi-oxytetracycline .10 461 M+H 444 -- -- --
Epi-tetracycline .10 445 M+H 428 -- -- --
Iso-chlorotetracycline .10 479 M+H 481 chlorine 37 isotope -- --
Minocycline .10 458 M+H 441 M-NH3+H,2 -- --
Oxytetracycline .10 461 M+H 444 M-NH3+H,2 -- --
Tetracycline .10 445 M+H 428 M-NH3+H,1 -- --
Other
Carbadox .05 263 M+H 231 -- -- --
Lincomycin .05 407 M+H 126 -- 359 --
Ormetoprim .05 275 M+H 259 -- -- --
Trimethoprim .05 291 M+H 261 -- 230 --
Surrogates and internal standards
Sulfamethazine-13C6
-- 285 M+H 162 -- -- --
Meclocycline -- 477 M+H 460 -- -- --
Naxidilic acid -- 233 M+H 215 -- -- --
Oleandomycin -- 688 M+H 544 -- -- --
Simetone -- 198 M+H -- -- -- --1 Niessen (1998).
2 Lindberg and others (2004).
10 Evaluation of Offline Tandem and Online Solid-Phase Extraction for Analysis of Antibiotics in Water
ground-water samples from their theoretical spiked concentra-tions also are shown in table 8.
The recovery of each antibiotic compound was deter-mined for the offline tandem SPE method by regressing 20 extracted spiked reagent-water samples against a duplicate external multipoint standard curve. The standard solutions were fortified, in duplicate, at 0.05, 0.1, and 1.0 µg/L; seven samples were spiked at 0.20 µg/L, and seven others were spiked at 0.50 µg/L. The recoveries were calcu-lated by regressing the data for each analyte from the extracted samples against the external standard curve. Matrix effects of pharmaceuticals in different solvent systems have been reported previously (Vargo and Whichman, 2003). To mini-mize potential matrix effects that may confuse recovery calcu-lations, the external standards were made by adding the same solvents and volumes used to elute the SPE cartridges to test tubes. The solutions were spiked with same amount of antibi-otic-, surrogate-, and internal-standard solutions as were used to generate the extracted standard curves. The spiked solutions then were evaporated to approximately 20 µL and brought to a
final volume of 320 µL using the same procedure as described for the offline tandem SPE extracted samples.
The mean recovery of each compound ranged from 86 to 116 percent (table 8), and the relative standard deviation ranged from 4.6 to 16.7 percent. Variation between the slopes of the internal and external standard curves for each com-pound was similar to the recovery data in table 8. The aver-age difference between the slopes of the internal and external curves for each antibiotic was 4.9 ± 11.6 percent. These data show that the recoveries are suitable for quantitative analyses. The recoveries for the classes of antibiotics reported for this method are similar to recoveries of other SPE-LC/MS methods (Hirsch and others, 1998; Lindsey and others, 2001) used for antibiotic analysis.
Other compounds that were initially incorporated into the offline tandem SPE method in 1998 included ivermectin, roxarsone, spectinomycin, vancomycin, and virginiamycin. They are not reported herein because the recoveries were less than 30 percent and the LOQs generally were greater than 0.20 µg/L. Of these five compounds, only virginiamycin was detected in any environmental sample collected between 1998 and 2000. Ivermectin, roxarsone, spectinomycin, and vanco-mycin were removed from the method in 2000.
The long-term performance of the offline tandem SPE method was evaluated by normalizing the analyzed concentra-tion of spiked reagent-water samples analyzed between 1999 and 2003 to their theoretical spiked concentrations (table 8). The reagent-grade water samples for the offline tandem SPE method were spiked at concentrations between 0.02 and 1.0 µg/L. For the offline tandem SPE method, the aver-age concentration of each antibiotic varied between 95 and 106 percent of the theoretical spiked concentration, and the relative standard deviations varied from 8.2 to 20.1 percent. The reagent-grade water spike data show that the performance of the offline tandem SPE method was relatively stable over several years. In addition, more than 200 reagent-water blanks
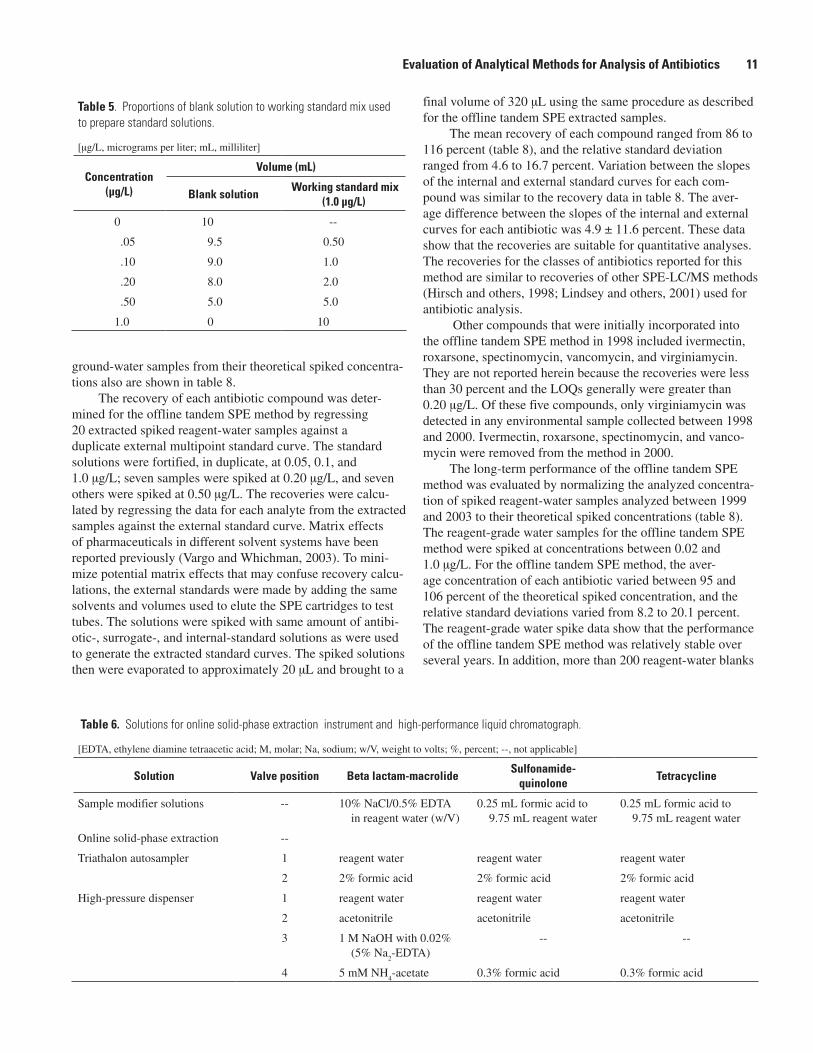
Table �. Proportions of blank solution to working standard mix used to prepare standard solutions.
[µg/L, micrograms per liter; mL, milliliter]
Concentration (µg/L)
Volume (mL)
Blank solution Working standard mix
(1.0 µg/L)
0 10 --
.05 9.5 0.50
.10 9.0 1.0
.20 8.0 2.0
.50 5.0 5.0
1.0 0 10
Table �. Solutions for online solid-phase extraction instrument and high-performance liquid chromatograph.
[EDTA, ethylene diamine tetraacetic acid; M, molar; Na, sodium; w/V, weight to volts; %, percent; --, not applicable]
Solution Valve position Beta lactam-macrolideSulfonamide-
quinoloneTetracycline
Sample modifier solutions -- 10% NaCl/0.5% EDTA in reagent water (w/V)
0.25 mL formic acid to 9.75 mL reagent water
0.25 mL formic acid to 9.75 mL reagent water
Online solid-phase extraction --
Triathalon autosampler 1 reagent water reagent water reagent water
2 2% formic acid 2% formic acid 2% formic acid
High-pressure dispenser 1 reagent water reagent water reagent water
2 acetonitrile acetonitrile acetonitrile
3 1 M NaOH with 0.02% (5% Na
2-EDTA)
-- --
4 5 mM NH4-acetate 0.3% formic acid 0.3% formic acid
Evaluation of Analytical Methods for Analysis of Antibiotics 11
were analyzed between 1999 and 2003, and none of the method analytes were detected in any of these blank samples.
To evaluate the performance of the offline tandem SPE method in different matrices, 29 surface-water samples from 10 States and 16 ground-water samples from five States were spiked from 0.02 to 1.0 µg/L and analyzed between 2000 and 2003. The data from the offline tandem SPE method show that the concentrations of the quinolone, macrolide, and sulfon-amide antibiotics varied from an average of 81 to 139 percent of the theoretical spiked concentrations with relative standard deviations that ranged from 16.8 to 39.8 percent (table 8). Table 8 also shows that the percentage variation for the theoretical concentration of the surrogates was less and more variable in the spiked surface- and ground-water samples than in the spiked reagent-water samples. These data indicate that varying matrices affect either the recovery of the compounds on the SPE cartridges or affect the ionization of the com-pounds in the ESI source chamber of the MS.
The data in table 8 also show that, although the results of analysis of surface- and ground-water samples were more variable than the results of analysis of reagent-water samples, the results generally averaged within ± 20 percent of the
expected concentration with the exception of carbadox and the macrolides, which tended to have higher average concentra-tions than the expected concentration and standard deviations greater than 30 percent. Interestingly, the erythromycin-13C
1-
H2O surrogate standard did not display the same enhance-
ment characteristics as the unlabeled erythromycin-H2O. The
area counts of carbadox, erythromycin-H2O, and tylosin in
many cases were slightly higher than in the equivalent spiked reagent-water samples but not enough to account for the average 30-percent increase over the expected concentration. The overestimation is caused by the combination of a slight enhancement in area counts of these antibiotics and a decrease in the response of the internal standard for some samples. Slight enhancement of the macrolide antibiotics also was observed in the online SPE method (Ed Lee, USGS, oral com-mun., October 2004).
Table 8 shows that for the offline tandem SPE method the matrix-spike concentrations of the tetracycline antibiotics, including the surrogate standard meclocycline, varied from an average of 185 to 1,200 percent of the theoretical spiked concentrations with large standard deviations. The area counts of the tetracycline antibiotics in the surface- and ground-water
Table �. Flow rates and mobile-phase composition for analysis by online solid-phase extraction method.
[mL/min, milliliter per minute; %, percent; mM, millimolar; NH4, ammonium]
Minutes Isocratic pumpflow rate(mL/min)
Quaternary pump
flow rate(mL/min)
Mobile-phase composition
Mobile-phase A(%)
Mobile-phase B(%)
Mobile-phase C(%)
Mobile-phase D(%)
Beta lactam-macrolide
5 mM NH4-acetate acetonitrile reagent water methanol
0 0 0.35 90 10 0 0
19 0 .35 0 100 0 0
22 0 .35 0 100 0 0
Sulfonamide-quinolone
0.3 % formic acid 0.3 % formic acid acetonitrile reagent water methanol
0 .102 .252 95 5 0 0
20 .102 .252 0 100 0 0
20.01 0 .36 0 100 0 0
Tetracyclines
0.3 % formic acid 0.3 % formic acid 1% formic acid reagent water methanol
0 0 .36 95 0 0 5
.50 0 .36 95 0 0 5
.51 .27 .135 60 0 0 40
5.50 .27 .135 60 0 0 40
5.51 0 .36 60 0 0 40
12.99 0 .36 28 0 0 72
13 0 .36 0 28 0 72
20 0 .36 0 0 0 100
1� Evaluation of Offline Tandem and Online Solid-Phase Extraction for Analysis of Antibiotics in Water

samples were, in general, substantially higher than in equiva-lently spiked reagent-grade water samples. These data indicate that the ionization of the tetracycline antibiotics can be enhanced substantially in this particular method. Lindsey and others (2001) also observed enhanced ionization for the tetra-cycline class of antibiotics. The large standard deviations also demonstrate that the degree to which these compounds were affected was matrix dependent. Because the range of variabil-ity for the individual compounds was different, they could not be normalized to the surrogate standard for quantitation.
Tetracycline antibiotics readily form chelate complexes with metal ions and also sorb to proteins and silanol groups (Zia and Price, 1976; Ishino and others, 1981; Lee and Everett, Jr., 1981; VanBogert and Kroon, 1981). EDTA is a strong chelating agent that is added to the water samples to prevent tetracyclines from binding to divalent metals and the func-tional groups on the SPE cartridge during extraction. Because of their complexing characteristics, tetracyclines were detected rarely in surface or ground water, and therefore, it would have been an inefficient use of time and resources to perform standard addition on every sample. Thus, a modified standard-
addition technique was tested for tetracyclines on 10 of the spiked sample extracts. Two 100-µL aliquots of the sample extract were pipetted into 2-mL chromatography vials with 200-µL glass inserts. Ten microliters (10 µL) of a 10-ng/µL standard mix in 20 mM NH
4-acetate (pH 5.6 standard units)
were pipetted into one vial, and 10 µL of 20 mM NH4-acetate
(pH 5.6) were pipetted into the other vial to keep the extract volumes and sample matrix the same. The samples then were reanalyzed, and the tetracycline antibiotics quantified using standard addition:
Cws
= ((Rus
/(Rs-R
us)) x C
s)*(V
se/V
ws), (1)
where Cws
is the concentration of the analyte in the extracted water sample in nanograms per milliliter;
R (response) is the area of the analyte divided by the area of the internal standard;
Rus
is the response of the unspiked sample analyte;
Rs is the response of the spiked analyte;
100
50
05.00 10.0 15.0 20.0 25.0 30.0
Sulfamethizole
Sulfathiazole
Sulfamerazine
Carbadox
Lincomycin
Trimethoprim
SulfamethazineSulfamethazine-13C6
Sulfamethoxazole
Sulfadimethoxine
Etythromycin-H2OEtythromycin-H2O-13C1
Tylosin
Roxithromycin
Terbuthylazine
Virginiamycin
(A) Sulfonamide and macrolide antibiotics
Sulfachloro-pyradizine
Peak
inte
nsity
, in
perc
ent
Time, in minutes
Figure �. Selected ion-monitoring chromatograms of an extracted sample spiked at 0.20 microgram per liter for offline tandem solid-phase extrac-tion method used in analysis of (A) sulfonamide-macrolide and (B) quinolone-tetracycline antibiotics.
Evaluation of Analytical Methods for Analysis of Antibiotics 1�

Cs is the concentration of the spiked
analyte in the sample extract in nanograms per microliter;
Vse is the volume of the sample extract in
microliters; and V
ws is the volume of the water sample in
milliliters.Table 8 shows that the modified standard addition
brought the analyzed concentrations within an average of 84 to 95 percent of theoretical spiked concentrations and that the standard deviations ranged from 12.4 to 19.2 percent. This technique allowed for samples to be analyzed without extract-ing an extra spiked sample for quantitation. Furthermore, the sample extract only needed to be divided into aliquots, spiked, and rerun if one of the problematic analytes was detected. The data in table 8 show that the offline tandem SPE method is rel-atively robust in a wide variety of surface-water and ground-
water matrices. These data also indicate that, to the extent that compounds are available, stable, isotope-labeled compounds would be beneficial to provide more robust quantitation when using the ESI source.
Online Solid-Phase Extraction
Figures 3 through 5 show SIM chromatograms of an extracted sample spiked at 1.0 µg/L for the online SPE method used for the analysis of beta lactam-macrolide, sulfonamides-quinolone, and tetracycline antibiotics. These data show that the chromatography and mass-spectral signatures adequately identify the antibiotic compounds reported using this method.
A summary of the performance of the online SPE method from 1999 to 2003 for spiked reagent-water and spiked environmental samples is shown in table 9. The normalized percentage variation of the concentration of all the analytes
8.00 9.00 10.0 11.0 12.0 13.0
Peak
inte
nsity
, in
perc
ent
14.0 15.0 16.0 17.0 18.0 19.0 20.0 21.0 22.0 23.0 24.0 25.0
Time, in minutes
100
0
100
0
100
0
100
0
100
0
100
0
100
0
100
0
Tetracycline
Oxytetracycline
Demeclocycline
(B) Quinolone and tetracycline antibiotics
Chlorotetracycline
Doxycycline
Minocycline
Meclocycline
Terbuthylazine
CiprofloxacinNorfloxacin
EnrofloxacinSarafloxacin
Figure �. Selected ion-monitoring chromatograms of an extracted sample spiked at 0.20 microgram per liter for offline tandem solid-phase extraction method used in analysis of (A) sulfonamide-macrolide and (B) quinolone-tetracycline antibiotics.—Continued
1� Evaluation of Offline Tandem and Online Solid-Phase Extraction for Analysis of Antibiotics in Water
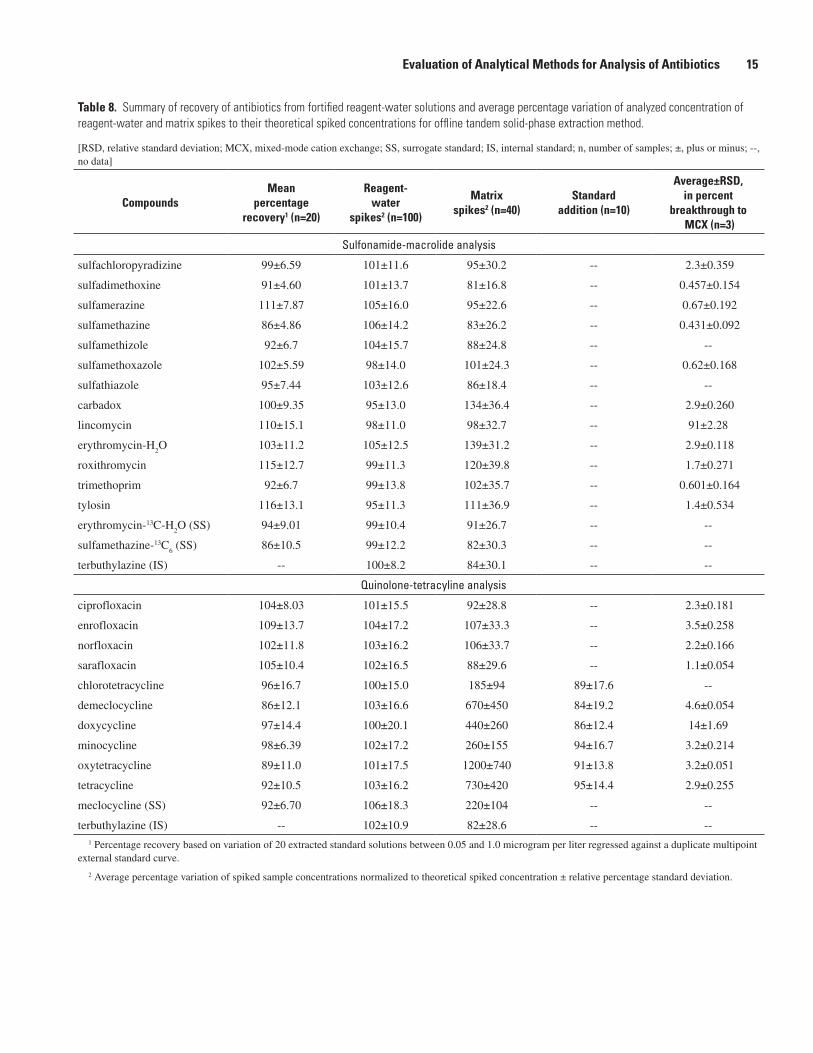
Table �. Summary of recovery of antibiotics from fortified reagent-water solutions and average percentage variation of analyzed concentration of reagent-water and matrix spikes to their theoretical spiked concentrations for offline tandem solid-phase extraction method.
[RSD, relative standard deviation; MCX, mixed-mode cation exchange; SS, surrogate standard; IS, internal standard; n, number of samples; ±, plus or minus; --, no data]
CompoundsMean
percentagerecovery1 (n=�0)
Reagent-water
spikes� (n=100)
Matrixspikes� (n=�0)
Standardaddition (n=10)
Average±RSD,in percent
breakthrough to MCX (n=�)
Sulfonamide-macrolide analysis
sulfachloropyradizine 99±6.59 101±11.6 95±30.2 -- 2.3±0.359
sulfadimethoxine 91±4.60 101±13.7 81±16.8 -- 0.457±0.154
sulfamerazine 111±7.87 105±16.0 95±22.6 -- 0.67±0.192
sulfamethazine 86±4.86 106±14.2 83±26.2 -- 0.431±0.092
sulfamethizole 92±6.7 104±15.7 88±24.8 -- --
sulfamethoxazole 102±5.59 98±14.0 101±24.3 -- 0.62±0.168
sulfathiazole 95±7.44 103±12.6 86±18.4 -- --
carbadox 100±9.35 95±13.0 134±36.4 -- 2.9±0.260
lincomycin 110±15.1 98±11.0 98±32.7 -- 91±2.28
erythromycin-H2O 103±11.2 105±12.5 139±31.2 -- 2.9±0.118
roxithromycin 115±12.7 99±11.3 120±39.8 -- 1.7±0.271
trimethoprim 92±6.7 99±13.8 102±35.7 -- 0.601±0.164
tylosin 116±13.1 95±11.3 111±36.9 -- 1.4±0.534
erythromycin-13C-H2O (SS) 94±9.01 99±10.4 91±26.7 -- --
sulfamethazine-13C6 (SS) 86±10.5 99±12.2 82±30.3 -- --
terbuthylazine (IS) -- 100±8.2 84±30.1 -- --
Quinolone-tetracyline analysis
ciprofloxacin 104±8.03 101±15.5 92±28.8 -- 2.3±0.181
enrofloxacin 109±13.7 104±17.2 107±33.3 -- 3.5±0.258
norfloxacin 102±11.8 103±16.2 106±33.7 -- 2.2±0.166
sarafloxacin 105±10.4 102±16.5 88±29.6 -- 1.1±0.054
chlorotetracycline 96±16.7 100±15.0 185±94 89±17.6 --
demeclocycline 86±12.1 103±16.6 670±450 84±19.2 4.6±0.054
doxycycline 97±14.4 100±20.1 440±260 86±12.4 14±1.69
minocycline 98±6.39 102±17.2 260±155 94±16.7 3.2±0.214
oxytetracycline 89±11.0 101±17.5 1200±740 91±13.8 3.2±0.051
tetracycline 92±10.5 103±16.2 730±420 95±14.4 2.9±0.255
meclocycline (SS) 92±6.70 106±18.3 220±104 -- --
terbuthylazine (IS) -- 102±10.9 82±28.6 -- --1 Percentage recovery based on variation of 20 extracted standard solutions between 0.05 and 1.0 microgram per liter regressed against a duplicate multipoint
external standard curve.
2 Average percentage variation of spiked sample concentrations normalized to theoretical spiked concentration ± relative percentage standard deviation.
Evaluation of Analytical Methods for Analysis of Antibiotics 1�
in 1.0-µg/L spiked reagent-water samples ranged from 71 to 112 percent of the expected spiked concentrations with relative percentage standard deviations ranging from 6 to 87 percent for all 39 analytes. Relative percentage standard deviations were less than 35 percent for 35 of the analytes. Amoxicillin and cefotaxime had the highest percentage of relative standard deviations at 87 and 72 percent, respectively. The normal-ized percentage concentrations of the surrogate standards for the three antibiotic classes analyzed ranged from 101 to 112 percent with relative percentage standard deviations rang-ing from 12 to 28 percent (table 9). The long-term reagent- water spiked data show that the method was stable during its use from 1999 to 2003.
Matrix-spiked samples also were used to assess the long-term variation of the online SPE method in different matri-ces. The long-term matrix-spike data show greater average
variation from the expected spiked concentrations and greater percentage standard deviations than was observed with the reagent-water spikes. Between 78 and 95 matrix spikes were analyzed for each analyte except erythromycin-H
2O and carba-
dox. The matrix samples were spiked at 1.0 µg/L and analyzed between 1999 and 2003. The matrix-spiked samples consisted of 92 surface- and 31 ground-water samples. The surface-water samples were collected from 54 different streams in 18 States, and the ground-water samples were collected from 19 wells in 6 States. The data show that the average percent-age of normalized concentration of the matrix-spiked samples varied from 22 to 142 percent of the theoretical spiked con-centrations with relative standard deviations that ranged from 17 to 308 percent (table 9). The results from the online SPE method also show that, although the results of the surface- and ground-water analyses are more variable than the results from
Ampicillin
Cefotaxime
Penicillin G
"
+
"
Penicillin V
Oxacillin
Cloxacillin
5.00 10.0 15.0 20.0 25.00
Time, in minutes
100
50
0
100
50
0
100
50
0
100
50
0
100
50
0
100
50
0
Peak
inte
nsity
, in
perc
ent
(A) Beta-lactam antibiotics
Figure �. Selected ion-monitoring chromatograms of an extracted sample spiked at 1.0 microgram per liter for online solid-phase extraction method used in analysis of (A) beta-lactam and (B) macrolide antibiotics.
1� Evaluation of Offline Tandem and Online Solid-Phase Extraction for Analysis of Antibiotics in Water

the reagent-water analyses, most of the compounds averaged within ±30 percent of the expected concentration with the exceptions of amoxicillin, ampicillin, cefotaxime, penicillin G, roxithromycin, tylosin, and all the tetracycline compounds except anhydro-tetracycline. Roxithromycin and tylosin had the highest percentage of normalized concentrations at 139 and 142 percent, respectively, and amoxicillin, ampicillin, cefotaxime, and anhydro-chlortetracycline had the lowest at 22, 42, 38, and 51 percent, respectively. Amoxicillin, mino-cycline, and tetracycline had the highest relative percentage standard deviations at 308, 111, and 130 percent, respectively. Erythromycin-H
2O was not evaluated in these samples as it
was added to the method in 2003, just before the method was transferred to the LC/triple quadrupole MS/MS. The percent-age of normalized concentrations of the surrogate standards in water samples ranged from 94 to 130 percent, and the relative percentage standard deviations ranged from 34 to 40 percent. Also, none of the method analytes were detected in the 125 reagent-water blanks analyzed using the online SPE method.
The online SPE antibiotic data for the matrix-spiked surface- and ground-water samples were more variable than the data for the spiked reagent-water samples (table 9). This also was observed for the offline tandem SPE method data. These data indicate that varying matrices affect either the
Figure �. Selected ion-monitoring chromatograms of an extracted sample spiked at 1.0 microgram per liter for online solid-phase extraction method used in analysis of (A) beta-lactam and (B) macrolide antibiotics.—Continued
Evaluation of Analytical Methods for Analysis of Antibiotics 1�
Spectinomycin++
Lincomycin
Trimethoprim
Erythromycin
Tylosin
Roxithromycin
Oleandomycin
++
5.00 10.0 15.0 20.0 25.00
Time, in minutes
100
50
0
100
50
0
100
50
0
100
50
0
100
50
0
100
50
0
Peak
inte
nsity
, in
perc
ent
100
50
0
(B) Macrolide antibiotics

recovery of the compounds on the SPE cartridges or affect the ionization of the compounds in the ESI source chamber of the MS. Several researchers have reported signal suppression and less frequently signal enhancement from matrix effects in electrospray ionization (Buhrman and others, 1996; Barnes and others, 1997; Choi and others, 1999, 2001a,b; Dijkman and others, 2001; Pascoe and others, 2001; Reemtsma, 2001, 2002; Zrostlikova and others, 2002; Hajslova and Zrostlikova, 2003). Thus, it is likely that much of the increased variation in the matrix-spiked samples was due to “matrix” effects. Varying matrices concentrated during the SPE process can affect the efficiency with which an individual compound is ionized in the electrospray source. Ionization suppression or enhancement does not usually affect each compound equally. In addition, apparent enhancements can occur when an internal standard is more suppressed than the analyte to which
it is used to normalize. However, these data do not exclude the possibility that the recovery of the analytes in varying matrices can be responsible, at least to some degree, for some of the increased variation in the matrix-spiked samples. For the beta-lactam antibiotics, some of the increased variation in the average percentage of normalized concentrations also may be due to degradation. The beta-lactams have labile structures, and amoxicillin can readily degrade even under laboratory conditions. For example, Cahill and others (2004) observed poor recoveries for amoxicillin and speculated that it was due to degradation.
The reagent-water spikes from the offline tandem SPE and online SPE methods show that they had acceptable perfor-mance during the time periods that they were used. Although the matrix-spiked sample data from both methods showed increased variability relative to the reagent-water spikes, the
Sulfamethazine
Sulfachloropyradizine
Sulfathiazole
Sulfamerazine
Sulphamethoxazole
Sulfamethoxine
Sulfamethazine-13C6
5.00 10.0 15.0 20.0 25.00
Time, in minutes
100
50
0
100
50
0
100
50
0
100
50
0
100
50
0
100
50
0
Peak
inte
nsity
, in
perc
ent
(A) Sulfonamide antibiotics
Figure �. Selected ion-monitoring chromatograms of an extracted sample spiked at 1.0 microgram per liter for online solid-phase extraction method used in analysis of (A) sulfonamide and (B) quinolone antibiotics.
1� Evaluation of Offline Tandem and Online Solid-Phase Extraction for Analysis of Antibiotics in Water

data also indicate that, for most of the analytes, the methods performed adequately for a wide variety of environmental samples. These data also show that matrix effects can be a sub-stantial issue with LC/MS applications and is an issue that has not been adequately addressed in the literature. The matrix-spike data also suggest that, for specific studies in which concentration differences between samples are important, it may be preferable to use matrix-matched standard curves or multiple-point standard addition to increase the precision and accuracy of the method for that particular study.
Comparison of Offline Tandem and Online Solid-Phase Extraction and an Independent Method
The two independently developed single quadrupole LC/MS methods also were assessed for comparability in over-lapping data sets and compared with a third, independently developed solid-phase extraction single quadrupole LC/MS method that contained two environmentally important antibi-otics that overlapped with the offline tandem SPE and online
Sarafloxacin
Clinfloxacin
Oxalinic acid Flumequine
Norfloxacin
Ciprofloxacin
Lomefloxacin
Ofloxacin
Nalidixic acid (surrogate)
5.00 10.0 15.0 20.0 25.00
Time, in minutes
100
50
0
100
50
0
100
50
0
100
50
0
100
50
0
100
50
0
Peak
inte
nsity
, in
perc
ent
100
50
0
100
50
0
(B) Quinolone antibiotics
Figure �. Selected ion-monitoring chromatograms of an extracted sample spiked at 1.0 microgram per liter for online solid-phase extrac-tion method used in analysis of (A) sulfonamide and (B) quinolone antibiotics.—Continued
Comparison of Offline Tandem and Online Solid-Phase Extraction and an Independent Method 1�

SPE methods. Ninety-six samples from three studies (Barnes and others, 2004; Stackelberg and others, 2004; Glassmeyer and others, 2005) were analyzed using the offline tandem SPE method and an independent SPE-LC/MS method for phar-maceuticals (Cahill and others, 2004; M3 method) devel-oped at the USGS Methods Development Program, National Water-Quality Laboratory in Lakewood, Colorado. Forty-four samples from one of the studies also were analyzed using the offline tandem SPE and online SPE antibiotic methods as well as the M3 method. The three studies used in the compari-sons included a ground-water reconnaissance of a landfill for five monitoring wells completed in a leachate plume from a municipal landfill (Barnes and others, 2004, five samples), a
study of the occurrence of pharmaceuticals from multiple sam-plings through a drinking-water plant in New Jersey includ-ing raw, settled, filtered, and finished water (Stackelberg and others, 2004, 47 samples), and a USEPA-USGS study (Glass-meyer and others, 2005) that sampled at one site upstream and three sites downstream from wastewater-treatments plants on 11 streams (44 samples) to assess persistence of wastewater contaminants in surface water.
The M3 method had two overlapping compounds (sulfamethoxazole and trimethoprim) with the offline tan-dem SPE and online SPE methods. Sulfamethoxazole and trimethoprim were the only antibiotics detected in any of the samples from the three studies using all three methods.
Meclocycline (surrogate)
Demeclocycline
Tetracycline Doxycycline
Tetracycline-H2O
Oxytetracycline
Chlorotetracycline-H2O
Chlorotetracycline
Minocycline
5.00 10.0 15.0 20.0 25.00
Time, in minutes
100
50
0
100
50
0
100
50
0
100
50
0
100
50
0
100
50
0
Peak
inte
nsity
, in
perc
ent
100
50
0
Figure �. Selected ion-monitoring chromatograms of an extracted sample spiked at 1.0 microgram per liter for online solid-phase extraction method used in analysis of tetracycline antibiotics.
�0 Evaluation of Offline Tandem and Online Solid-Phase Extraction for Analysis of Antibiotics in Water
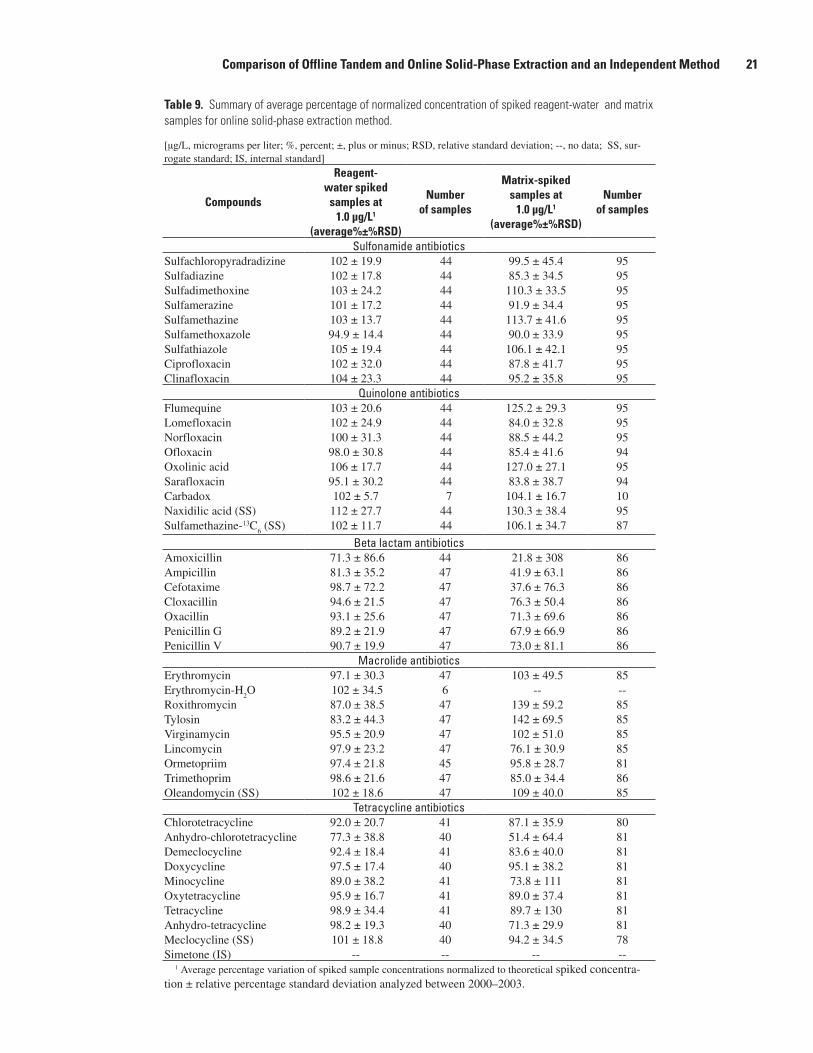
Table �. Summary of average percentage of normalized concentration of spiked reagent-water and matrix samples for online solid-phase extraction method.
[µg/L, micrograms per liter; %, percent; ±, plus or minus; RSD, relative standard deviation; --, no data; SS, sur-rogate standard; IS, internal standard]
Compounds
Reagent-water spiked
samples at1.0 µg/L1
(average%±%RSD)
Numberof samples
Matrix-spiked samples at
1.0 µg/L1
(average%±%RSD)
Numberof samples
Sulfonamide antibioticsSulfachloropyradradizine 102 ± 19.9 44 99.5 ± 45.4 95Sulfadiazine 102 ± 17.8 44 85.3 ± 34.5 95Sulfadimethoxine 103 ± 24.2 44 110.3 ± 33.5 95Sulfamerazine 101 ± 17.2 44 91.9 ± 34.4 95Sulfamethazine 103 ± 13.7 44 113.7 ± 41.6 95Sulfamethoxazole 94.9 ± 14.4 44 90.0 ± 33.9 95Sulfathiazole 105 ± 19.4 44 106.1 ± 42.1 95Ciprofloxacin 102 ± 32.0 44 87.8 ± 41.7 95Clinafloxacin 104 ± 23.3 44 95.2 ± 35.8 95
Quinolone antibioticsFlumequine 103 ± 20.6 44 125.2 ± 29.3 95Lomefloxacin 102 ± 24.9 44 84.0 ± 32.8 95Norfloxacin 100 ± 31.3 44 88.5 ± 44.2 95Ofloxacin 98.0 ± 30.8 44 85.4 ± 41.6 94Oxolinic acid 106 ± 17.7 44 127.0 ± 27.1 95Sarafloxacin 95.1 ± 30.2 44 83.8 ± 38.7 94Carbadox 102 ± 5.7 7 104.1 ± 16.7 10Naxidilic acid (SS) 112 ± 27.7 44 130.3 ± 38.4 95Sulfamethazine-13C
6 (SS) 102 ± 11.7 44 106.1 ± 34.7 87
Beta lactam antibioticsAmoxicillin 71.3 ± 86.6 44 21.8 ± 308 86Ampicillin 81.3 ± 35.2 47 41.9 ± 63.1 86Cefotaxime 98.7 ± 72.2 47 37.6 ± 76.3 86Cloxacillin 94.6 ± 21.5 47 76.3 ± 50.4 86Oxacillin 93.1 ± 25.6 47 71.3 ± 69.6 86Penicillin G 89.2 ± 21.9 47 67.9 ± 66.9 86Penicillin V 90.7 ± 19.9 47 73.0 ± 81.1 86
Macrolide antibioticsErythromycin 97.1 ± 30.3 47 103 ± 49.5 85Erythromycin-H
2O 102 ± 34.5 6 -- --
Roxithromycin 87.0 ± 38.5 47 139 ± 59.2 85Tylosin 83.2 ± 44.3 47 142 ± 69.5 85Virginamycin 95.5 ± 20.9 47 102 ± 51.0 85Lincomycin 97.9 ± 23.2 47 76.1 ± 30.9 85Ormetopriim 97.4 ± 21.8 45 95.8 ± 28.7 81Trimethoprim 98.6 ± 21.6 47 85.0 ± 34.4 86Oleandomycin (SS) 102 ± 18.6 47 109 ± 40.0 85
Tetracycline antibioticsChlorotetracycline 92.0 ± 20.7 41 87.1 ± 35.9 80Anhydro-chlorotetracycline 77.3 ± 38.8 40 51.4 ± 64.4 81Demeclocycline 92.4 ± 18.4 41 83.6 ± 40.0 81Doxycycline 97.5 ± 17.4 40 95.1 ± 38.2 81Minocycline 89.0 ± 38.2 41 73.8 ± 111 81Oxytetracycline 95.9 ± 16.7 41 89.0 ± 37.4 81Tetracycline 98.9 ± 34.4 41 89.7 ± 130 81Anhydro-tetracycline 98.2 ± 19.3 40 71.3 ± 29.9 81Meclocycline (SS) 101 ± 18.8 40 94.2 ± 34.5 78Simetone (IS) -- -- -- --
1 Average percentage variation of spiked sample concentrations normalized to theoretical spiked concentra-tion ± relative percentage standard deviation analyzed between 2000–2003.
Comparison of Offline Tandem and Online Solid-Phase Extraction and an Independent Method �1

Table 10. Comparison of concentrations in 44 surface-water samples analyzed using three analytical methods.
[SPE-LC/MS, solid-phase extraction liquid chromatography/mass spectrometry; <, less than indicated method reporting limits]
Sample number
Concentration, in micrograms per liter
Sulfamethoxazole Trimethoprim
Offline tandem solid-phase extraction
Online solid-phase
extraction
Pharmaceuti-cal SPE-LC/MS
(M� method)
Offline tandem solid-phase extraction
Online solid-phase extrac-
tion
Pharmaceuti-cal SPE-LC/MS
(M� method)
1 <0.05 <0.05 <0.023 <0.01 <0.05 <0.014
2 .08 <.05 .07 <.01 <.05 <.014
3 .04 <.05 .03 <.01 <.05 <.014
4 <.05 <.05 .01 <.01 <.05 <.014
5 <.05 <.05 <.023 <.01 <.05 <.014
6 .25 .29 .11 .05 <.05 .04
7 .02 <.05 .07 .01 <.05 .01
8 .02 <.05 .03 .01 <.05 .01
9 <.05 <.05 <.023 <.01 <.05 <.014
10 <.05 <.05 <.023 <.01 <.05 <.014
11 .18 .51 .20 .04 <.05 .04
12 .08 <.05 .10 .02 <.05 .02
13 .13 <.05 .16 .02 <.05 .03
14 <.05 <.05 <.023 <.01 <.05 <.014
15 <.05 <.05 <.023 <.01 <.05 <.014
16 <.05 <.05 <.023 <.01 <.05 <.014
17 <.05 <.05 <.023 <.01 <.05 <.014
18 <.05 <.05 .16 <.01 <.05 .10
19 <.05 <.05 <.023 .01 <.05 .02
20 .02 <.05 .02 .01 <.05 .01
21 <.05 <.05 <.023 <.01 <.05 <.014
22 .11 <.05 .07 .04 <.05 .03
23 <.05 <.05 <.023 <.01 <.05 <.014
24 <.05 <.05 <.023 <.01 <.05 <.014
25 <.05 <.05 <.023 <.01 <.05 <.014
26 .07 <.05 .18 <.01 <.05 <.014
27 .05 <.05 .04 <.01 <.05 <.014
28 .02 <.05 .02 <.01 <.05 <.014
29 <.05 <.05 <.023 <.01 <.05 <.014
30 .53 1.39 .62 .40 .57 .40
�� Evaluation of Offline Tandem and Online Solid-Phase Extraction for Analysis of Antibiotics in Water

Sulfamethoxazole was detected in 24, 13, and 30 of the samples, and trimethoprim in 23, 6, and 25 of the samples for the offline tandem SPE, online SPE, and M3 methods, respectively, in the USEPA-USGS study (table 10). The reporting levels for the offline tandem SPE method were 0.05 and 0.01 µg/L; online SPE method, 0.05 and 0.05 µg/L; and M3 method, 0.023 and 0.014 µg/L, for sulfamethoxazole and trimethoprim, respectively. Two of the 30 sulfamethoxa-zole detections reported by the M3 method were five or more times less than the reporting level and were not detected by the offline tandem SPE method. The offline tandem SPE method agreed with 24 of 28 (86 percent) of the sulfamethoxazole detections using the M3 method and 23 of 25 (92 percent) of the trimethoprim detections. Seven of the 30 sulfamethoxazole and 16 of the 25 trimethoprim detections using the M3 method were less than the reporting level of the online SPE method. The online SPE method agreed with 13 of 23 (57 percent) of the sulfamethoxazole detections using the M3 method and 5 of 9 (56 percent) of the trimethoprim detections. Also, two of the trimethoprim detections using the M3 method that were less than the reporting level of the online SPE method were detected at concentrations greater than the reporting level using the online SPE method. Five of the 24 sulfamethoxazole and 15 of the 23 trimethoprim detections using the offline tandem SPE method were less than the reporting level of the
online SPE method. The online SPE method agreed with 11 of 19 (58 percent) of the sulfamethoxazole detections using the offline tandem SPE method and 4 of 8 (50 percent) of the trimethoprim detections. Also, there were four trimethoprim detections using the offline tandem SPE method that were less than the reporting level of the online SPE method but were detected at greater than the reporting level using the online SPE method, and there were two sulfamethoxazole detections using the online SPE method that were not detected using the offline tandem SPE method.
These data indicate that the detection frequencies of the offline tandem SPE and M3 methods for sulfamethoxazole and trimethoprim were similar and that the detection frequency of the online SPE method was 50 to 60 percent that of the offline tandem SPE and M3 methods when adjusted for differences in reporting levels. These data also show that many of the analyte detections using the offline tandem SPE and online SPE meth-ods were near the reporting levels of the online SPE method (table 10). It may be that antibiotics analyzed using the online SPE method were detected in several of the samples, but they were detected at less than the method reporting level.
The overall agreement between the offline tandem SPE and M3 methods (96 samples) for sulfamethoxazole and trimethoprim was 96 and 98 percent, respectively, when considering the number of detections and nondetections
Table 10. Comparison of concentrations in 44 surface-water samples analyzed using three analytical methods.—Continued
[SPE-LC/MS, solid-phase extraction liquid chromatography/mass spectrometry; <, less than indicated method reporting limits]
Sample number
Concentration, in micrograms per liter
Sulfamethoxazole Trimethoprim
Offline tandem solid-phase extraction
Online solid-phase
extraction
Pharmaceuti-cal SPE-LC/MS
(M� method)
Offline tandem solid-phase extraction
Online solid-phase extrac-
tion
Pharmaceuti-cal SPE-LC/MS
(M� method)
31 0.79 0.72 0.84 0.55 0.55 0.45
32 .39 <.05 .31 .08 .13 .09
33 <.05 <.05 <.023 .01 <.05 .01
34 .29 .36 .32 .01 <.05 .03
35 .08 <.05 .10 .01 <.05 .01
36 .09 .15 .09 .01 <.05 .02
37 <.05 <.05 .10 <.01 <.05 .02
38 .23 .58 .10 .03 .18 .02
39 .21 .49 .14 .02 .19 .05
40 .20 .48 .19 .02 .14 .04
41 .45 .93 .58 .21 <.05 .14
42 .15 .76 .36 .05 <.05 .14
43 <.05 1.14 .23 .08 <.05 .08
44 <.05 .92 .21 .05 <.05 .06
Comparison of Offline Tandem and Online Solid-Phase Extraction and an Independent Method ��

of the overlapping analytes from each method. The overall agreement between the online SPE and M3 methods for the 44 samples from Glassmeyer and others (2005) was 72 and 91 percent and between the online SPE and offline tandem SPE methods was 68 and 91 percent for sulfamethoxazole and trimethoprim, respectively, when considering the number of detections and nondetections of the overlapping analytes from each method. In addition, there was 100 percent agreement between the online SPE and offline tandem SPE methods for all of the other overlapping analytes, which were all nondetec-tions. The data from the surface-water reconnaissance study of Kolpin and others (2002) also show that the detection fre-quency between the offline tandem SPE, online SPE, and M3 methods for sulfamethoxazole and trimethoprim were similar when the differences in the reporting levels between the meth-ods were taken into account.
The relation of the analyte concentrations between meth-ods also was examined. Linear regression was used to assess whether the determined analyte concentrations were similar between the offline tandem SPE, online SPE, and M3 methods (fig. 6). Samples in which sulfamethoxazole and trimethoprim were detected by both the offline tandem SPE and M3 meth-ods and the online SPE and M3 methods were analyzed. The correlation coefficient (R2) between the offline tandem SPE and M3 methods for sulfamethoxazole was 0.87 with a slope of 1.04. The R2 between the offline tandem SPE and online SPE methods for sulfamethoxazole was 0.35 with a slope of 0.98, and the scatter clearly indicates that the concentrations of several samples were higher when the online SPE method of analysis was used than when the offline tandem SPE method was used. A similar result was obtained in a regression of data for the online SPE and M3 methods (not shown). These data also indicate that for several samples, the online SPE method provided concentrations two to four times higher than were obtained by the offline tandem SPE or M3 methods (fig. 6). For trimethoprim, the R2 between the offline tandem SPE and M3 methods and the offline tandem SPE and online SPE methods were 0.95 and 0.91, respectively (fig. 6). The slopes were approximately 0.85 for both methods. The regressed data indicate that the slopes of the offline tandem SPE rela-tion between the online SPE and M3 methods are sufficiently parallel over the concentration range displayed for both sulfamethoxazole and trimethoprim to suggest that the online SPE method has a high bias relative to both the offline tandem SPE and M3 methods. Comparison of the distance between the slopes indicate that the online SPE method has positive regressed bias of approximately 0.3 and 0.13 µg/L for sulfa-methoxazole and trimethoprim, respectively, compared to the M3 and online SPE methods. The regressed data also indicate that the offline tandem SPE and M3 methods provided similar concentration data and had similar low y-intercepts.
These data show that the offline tandem SPE and M3 methods provided well-correlated regressed relations with slopes near unity and very low y-intercepts for sulfa-methoxaole and trimethoprim. These data also show that the online SPE method provided a good regressed relation for
(B) Trimethoprim
y = 0.8447x + 0.0119R 2 = 0.9504
y = 0.8561x + 0.1364R 2 = 0.9119
0
0.20
0.40
0.60
0.80
0 0.20 0.40 0.60 0.80
Tandem SPE method, in micrograms per liter
M3 concentration
Online SPE concentration
Linear relation between offline tandem SPE and online SPE methods
Linear relation between offline tandem SPE and M3 methods
(A) Sulfamethoxazole
y = 1.0399x + 0.0048R2 = 0.8705
y = 0.9774x + 0.306R2 = 0.3461
0
0.20
0.40
0.60
0.80
1.00
1.20
1.40
1.60
0 0.20 0.40 0.60 0.80 1.00
Conc
entra
tions
det
erm
ined
usi
ng o
nlin
e SP
E an
d M
3 m
etho
ds, i
n m
icro
gram
s pe
r lite
r
EXPLANATION
Figure �. Regression relations between sample concentrations deter-mined using offline tandem solid-phase extraction (SPE) method, online SPE method, and M3 pharmaceutical method for analysis of (A) sulfa-methoxazole and (B) trimethoprim.
�� Evaluation of Offline Tandem and Online Solid-Phase Extraction for Analysis of Antibiotics in Water

trimethoprim and a poor relation for sulfamethoxazole with high y-intercepts and also displayed a high bias relative to the offline tandem SPE and M3 methods. The data also show that for sulfamethoxazole more scatter was observed between the offline tandem SPE and online SPE methods than was observed between the tandem SPE and M3 methods.
ConclusionsThe offline tandem SPE method of analysis for anti-
biotics was used from 1999 to 2003 to analyze more than 1,000 surface- and ground-water samples from national stream-water reconnaissance studies, watershed and field-scale studies of antibiotic and antibiotic-resistant bacterial transport from urban and agricultural sources in multiple States, and wastewater outfall transport studies. The online SPE method of analysis for antibiotics was used from 2000 to 2003 to ana-lyze more than 500 samples from similar studies.
The cumulative data from these studies show that the recoveries for most antibiotics in environment samples were within acceptable (greater than 60 percent) limits for quantita-tive analysis. The spiked reagent-water data showed that the offline tandem SPE and online SPE methods were stable dur-ing the course of their use. The application and variability of these methods for the analysis of multiple classes of antibiot-ics were demonstrated for a variety of surface- and ground-water samples. The data from the offline tandem SPE method indicate that the tetracycline antibiotics were subject to substantial matrix effects. A modified standard-addition tech-nique allowed for the tetracyclines to be quantitated without extracting a spiked duplicate sample with every sample to be analyzed. The matrix-spiked data from the online SPE method also showed that some of the beta-lactam and tetracycline antibiotics could have high variability. None of the analytes were detected in any of the reagent-water blanks for the offline tandem SPE and online SPE methods during their use.
Comparison of the online SPE and offline tandem SPE for 44 to 96 samples, respectively, with an independently developed pharmaceutical method (M3) with overlapping compounds indicated agreements of 50 to 92 percent in sample detection and 72 to 98 percent in presence-absence comparison. Finally, regressed compound concentrations between methods indicated well-correlated relations between all three methods for trimethoprim and between the tandem SPE and M3 methods for sulfamethoxazole. The data also show that the online SPE method tended to have higher con-centrations than the offline tandem SPE and M3 methods for both sulfamethoxazole and trimethoprim.
References Cited
Alcock, R.E., Sweetman, A., and Jones, K.C., 1999, Assess-ment of organic contaminant fate in waste water treatment plants, I—Selected compounds and physicochemical prop-erties: Chemosphere, v. 38, p. 2247–2262.
Animal Health Institute, 2002, Keep animals healthy: Informa-tion available on the Web, accessed September 8, 2006, at http//www.ahi.org/antibioticsDebate/index.asp
Barnes, K.A., Fussell, R.J., Startin, J.R., Pegg, M.K., Thorpe, S.A., and Reynolds, S.L., 1997, High-performance liquid chromatography/atmospheric pressure chemical ionization mass spectrometry with ionization polarity switching for the determination of selected pesticides: Rapid Communica-tions in Mass Spectrometry, v. 11, p. 117–123.
Barnes, K.K., Christenson, S.C., Kolpin, D.W., Focazio, M.J., Furlong, E.T., Zaugg, S.D., Meyer, M.T., and Barber, L.B., 2004. Pharmaceuticals and other organic wastewater contaminants within a leachate plume downgradient of a municipal landfill: Ground Water Monitoring and Remedia-tion, v. 24, no. 2, p. 119–120.
Bruno, F., Curini, R., Di Corcia, A., Nazzari, M., and Samperi, R., 2001, Method development for measuring trace levels of penicillins in aqueous environmental samples: Rapid Com-munication in Mass Spectrometry, v. 15, p. 1391–1400.
Buhrman, D.L., Price, P.I., and Rudewicz, P.J., 1996, Quantita-tion of SR 27417 in human plasma using electrospray liquid chromatography-tandem mass spectrometry—a study of ion suppression: Journal of the American Society for Mass Spectrometry, v. 7, p. 1099–1105.
Buser, H.R., Tehobald, N., and Muller, M.D., 1998, Occur-rence of the pharmaceutical drug clofibric acid and the herbicide mecoprop in various Swiss Lakes and in the North Sea: Environmental Science & Technology, v. 32, p. 188–192.
Cahill, J.D., Furlong, E.T., Burkhardt, M.R., Kolpin, D., and Anderson L.G., 2004, Determination of pharmaceutical compound in surface- and ground-water samples by solid-phase extraction and high-performance liquid chromatogra-phy-electrospray ionization mass spectrometry: Journal of Chromatography A, v. 1041, p. 171–180.
Campagnolo, E.R., Johnson, K.R., Karpati, A., Rubin, C.S., Kolpin, D.W., Meyer, M.T., Esteban, J.E., Currier R.W., Smith, K., Thu, K.M., and McGeehin, M., 2002, Antimicro-bial residues in animal waste and water resources proximal to large-scale swine and poultry feeding operations: Science of the Total Environment, v. 299, p. 89–95.
References Cited ��
Choi, B.K., Gusev, A.I., and Hercules, D.M., 1999, Postcol-umn introduction of an internal standard for quantitative LC-MS analysis: Analytical Chemistry, v. 71, p. 4107–4110.
Choi, B.K., Hercules, D.M., and Gusev, A.I., 2001a, Effect of liquid chromatography separation of complex matri-ces on liquid chromatography-tandem mass spectrometry signal suppression: Journal of Chromatography A, v. 907, p. 337–342.
Choi, B.K., Hercules, D.M., and Gusev, A.I., 2001b, LC-MS/MS signal suppression effects in the analysis of pesticides in complex environmental matrices: Fresenius’ Journal of Analytical Chemistry, v. 369, p. 370–377.
Christian, T., Schneider, R.J., Farber, H.A., Skutlarek, D., Meyer, M.T., and Goldbach, H.E., 2003, Determination of antibiotic residues in manure, soil, and surface waters: Acta Hydrochimica et Hydrobiologica, v. 31, p. 743–756.
Cole, E.C., Addison, R.M., Rubino, J.R., Leese, K.E., Dulaney, P.D., Newell, M.S., Wilkins, J., Gaber, D.J., Win-einger, T., and Criger, D.A., 2003, Investigation of antibiotic and antibacterial agent cross-resistance in target bacteria from homes of antibacterial product users and nonusers: Journal of Applied Microbiology, v. 95, p. 664–676.
Djikman, E., Mooibroek, D., Hoogerbrugge, R., Hogendoorn, E., Sancho, J.V., Pozo, O., and Hernandez, F., 2001, Study of matrix effects on the direct trace analysis of acidic pesti-cides in water using various liquid chromatographic modes coupled to tandem mass spectrometric detection: Journal of Chromatography A, v. 926, p. 113–125.
Elmund, G.K., Morrison, S.M., Grand, D.W., and Nevins, M.P., 1971, Role of excreted chlortetracycline in modify-ing the decomposition process in feedlot waste: Bulletin of Environmental Contaminant Toxicology, v. 6, p. 129–132.
Feinman, S.E., and Matheson, J.C., 1978, Environmental impact statement—subtherapeutic antibacterial agents in animal feeds: Washington D.C., Food and Drug Administra-tion Department of Health, Education, and Welfare Report, 372 p.
Glassmeyer, S.T., Furlong, E.T., Kolpin, D.W., Cahill, J.D., Zaugg, S.D., Werner, S.L., Meyer, M.T.,and Kryak, D.D., 2005, Transport of chemical and microbial compounds from known wastewater discharges — potential for use as indica-tors of human fecal contamination: Environmental Science & Technology, v. 39, p. 5157–5169.
Golet, E.M., Alder, A.C., Hartmann, A., Ternes, T.A., and Giger, W., 2001, Trace determination of fluoroquinolone antibacterial agents in urban wastewater by solid-phase extraction and liquid chromatography with fluorescence detection: Analytical Chemistry, v. 73, p. 3632–3638.
Grant, G.A., Frison, S.L., and Sporns, P., 2003, A sensitive method for detection of sulfamethazine and N4-acetylsul-famethazine residues in environmental samples using solid phase immunoextraction coupled with MALDI-TOF MS: Journal of Agriculture and Food Chemistry, v. 51, p. 5367–5375.
Hajslova, Jana, and Zrostlikova, Jitka, 2003, Matrix effects in (ultra) trace analysis of pesticide residues in food and biotic matrices: Journal of Chromatography A, v. 1000, p. 181–197.
Harrison, P.F., and Lederberg, J., 1998, Antimicrobial resis-tance—issues and options: Washington, D.C., Forum on Emerging Infections, Division of Health Sciences Policy, Institute of Medicine, National Academy Press, 32 p.
Hirsch, R., Ternes, T.A., Haberer, K., Mehlich, A., Ballwanz, F., and Kratz, K.L., 1998, Determination of antibiotics in different water compartments via liquid chromatography-electrospray tandem mass spectrometry: Journal of Chroma-tography A, v. 815, p. 213–223.
Holm, J.V., Rugge, K., Bjerg, P.L., and Christensen, T.H., 1995, Occurrence and distribution of pharmaceutical compounds in the groundwater downgradient of a landfill (Grindsted, Denmark): Environmental Science & Technol-ogy, v. 29, p. 1415–1420.
Ishino, M., Skaguchi, T., Morimoto, I., and Okitsu, T., 1981, Coordination of tetracyclines to Cu2+ in an acidic solution: Yakugaku Zasshi, v. 101, p. 118–124.
Kagan, F., and Grostic, M.F., 1972, Mass spectra of lincomy-cin, lincomycin analogs and degradation products: Organic Mass Spectrometry, v. 6, p. 1217–1223.
Kolpin, D.W., Furlong, F.T., Meyer, M.T., Thurman, E.M., Zaugg, S.D., Barber, L.B., and Buxton, H.T., 2002, Pharma-ceuticals, hormones, and other organic wastewater con-taminants in U.S. streams, 1999–2000—a national recon-naissance: Environmental Science & Technology, v. 36, p. 1202–1211.
Langhammer, J.P., and Buening-Pfaue, H., 1989, Are veteri-nary medicines causing environmental risks?: H. Wissen-schaft und Umwelt, v. 10, p. 14–20.
Lee, J.Y., and Everett, G.W., Jr., 1981, Binding of Mn(II) by tetracycline—a carbon-13 NMR spin-lattice relaxation study: Journal of American Chemical Society, v. 103, p. 5221–5225.
Levy, S.B., 1998a, Multidrug resistance—a sign of the times: New England Journal of Medicine, v. 338, p. 1376–1378.
Levy, S.B., 1998b, The challenge of antibiotic resistance—cer-tain bacterial infections now defy all antibiotics: Scientific American, v. 278, p. 46–53.
�� Evaluation of Offline Tandem and Online Solid-Phase Extraction for Analysis of Antibiotics in Water

Lindberg, R., Per-Ake, Jarnheimer, Olsen, B., Johansson, M., and Tyskline, M., 2004, Determination of antibiotic substances in hospital sewage water using solid phase extraction and liquid chromatography/mass spectrometry and group analogue internal standards: Chemosphere, v. 57, p. 1479–1488.
Lindsey, M.E., Meyer, M.T., and Thurman, E.M., 2001, Anal-ysis of trace levels of sulfonamide and tetracycline antimi-crobials in groundwater and surface water using solid-phase extraction and liquid chromatography/mass spectrometry: Analytical Chemistry, v. 74, p. 4640–4646.
Loffler, D., and Ternes, T.A., 2003, Determination of acidic pharmaceuticals, antibiotics and ivermectin in river sedi-ment using liquid chromatography-tandem mass spectrom-etry: Journal of Chromatography A, v. 1021, p. 133.
McManus, P.S., Stockwell, V.O., Sundin, G.W., and Jones, A.L., 2002, Antibiotic use in plant agriculture: Annual Review of Phytopathology, v. 40, p. 443–465.
Mellon, M., Benbrook, C., and Benbrook, K.L., 2001, Hoggin it—estimates of antimicrobial abuse in livestock: Cam-bridge, Massachusetts, Union of Concerned Scientists, p. 1–108.
Meyer, M.T., 2004, Pharmaceuticals in the environment—sources, fate, effects, and risks, in Kummerer, K., ed., Pharmaceuticals in the Environment: Berlin, Springer-Verlag, p. 155–161.
Meyer, M.T., Bumgarner, J.E., Varns, J.L., Daughtridge, J.V., Thurman, E.M., and Hostetler, K.A., 2000, Use of radioim-munoassay as a screen for antibiotics in confined animal feeding operations and confirmation by liquid chromatogra-phy/mass spectrometry: Science of the Total Environment, v. 248, p. 181–188.
Molbak, K., Baggesen, D.L., Aarestrup, F.M., Ebbesen, J.M., Engberg, J., Frydendahl, K., Gerner-Smidt, P., Peterson, A.M., and Weener, H.C., 1999, An outbreak of multi-drug-resistant, quinolone-resistant salmonella enterica serotype typhimurium DT104: New England Journal of Medicine, v. 341, p. 1420–1425.
Niessen, W.M.A., 1998, Analysis of antibiotics by liquid chro-matography-mass spectrometry: Journal of Chromatography A, v. 812, p. 53–75.
Pascoe, Rob, Foley, J.P., and Gusev, A.I., 2001, Reduction in matrix-related signal suppression effects in electrospray ionization mass spectrometry using on-line two-dimen-sional liquid chromatography: Analytical Chemistry, v. 73, p. 6014–6023.
Reemtsma, Thorsten, 2001, The use of liquid chromatography-atmospheric pressure ionization-mass spectrometry in water analysis, part II—obstacles: Trends in Analytical Chemistry, v. 20, p. 533–542.
Reemtsma, Thorsten, 2002, Liquid chromatography-mass spectrometry and strategies for trace-level analysis of polar organic pollutants: Journal of Chromatography A, v. 973, p. 13–26.
Reverte, S., Borrull, F., Pocurull, E., and Marce, R.M., 2003, Determination of antibiotic compounds in water by solid-phase extraction-high performance chromatography-(elec-trospray) mass spectrometry: Journal of Chromatography A, v. 1010, p. 225–232.
Roloff, J., 1998, Drugged waters—does it matter that pharma-ceuticals are turning up in water supplies?: Science News, v. 153, p. 187–189.
Shelton, L.R., and Capel, P.D., 1994, Field guide for collect-ing and processing stream-water samples for the National Water-Quality Assessment Program: U.S. Geological Sur-vey Open-File Report 94–455, 50 p.
Smith, K.E., Besser, J.M., Hedberg, C.W., Leano, F.T., Bender, J.B., Wicklund, J.H., Johnson, B.P., Moore, K.A., and Osterholm, M.T., 1999, Quinolone-resistant campylobacter jejuni infections in Minnesota, 1992–1998: New England Journal of Medicine, v. 340, p. 1525–1532.
Snow, D.D., Cassada, D.A., Monson, S.J., Zhu, J., Spalding, R.F., Ferrer, I., and Thurman, E.M., eds., 2003, Liquid chro-matography/mass spectrometry, MS/MS and time of flight MS analysis of emerging contaminants: Washington, D.C., American Chemical Society, 161 p.
Stackelberg, P.E., Furlong E.T., Meyer M.T., Zaugg S.D., Henderson A.K., and Reissman D.B., 2004, Persistence of pharmaceutical compounds and other organic wastewater contaminants in a conventional drinking-water-treatment plant: Science of the Total Environment, v. 329, p. 99–113.
Tenover, F.C., and Hughes, J.M., 1996, The challenges of emerging infectious diseases—development and spread of multiply-resistant bacterial pathogens: Journal of American Medical Association, v. 275, p. 295–299.
Ternes, T.A., 1998, Occurrence of drugs in German sewage treatment plants and rivers: Water Research, v. 32, p. 3245–3260.
Ternes, T.A., Bonerz, M., and Schmidt, T., 2001, Determina-tion of neutral pharmaceuticals in wastewater and rivers by liquid chromatography-electrospray tandem mass spectrom-etry: Journal of Chromatography A, v. 938, p. 175–185.
References Cited ��
Turiel E., Bordin G., Rodríguez A.R., 2003, Trace enrichment of (fluoro)quinolone antibiotics in surface waters by solid-phase extraction and their determination by liquid chroma-tography-ultraviolet detection: Journal of Chromatography A, v. 1008, p. 145–156.
VanBogert, C.D., and Kroon, A.M., 1981, Fluorometric deter-mination of tetracyclines in small blood and tissue samples: Journal of Pharmaceutical Sciences, v. 70, p. 186–189.
Vargo, J.D., and Wichman, M., 2003, Factors affecting enhancement and suppression of analyte signal for the analysis of pharmaceuticals and antibiotics in surface waters by LC/MS/MS, in Proceedings of 3rd International Confer-ence on Pharmaceuticals and Endocrine Disrupting Chemi-cals in Water, Minneapolis, Minnesota, March 19–21, 2003: National Ground Water Association, CD.
Prepared by Lawrence Publishing Service Center.Edited by Lanna Combs.Graphics by Jeff Hartley and Mike Kemppainen.Layout and design by Kristi Hartley.
For more information concerning the research described in this report, contact:
U.S. Geological Survey4821 Quail Crest PlaceLawrence, KS 66049(785) 842-9909http://ks.water.usgs.gov
Zhu, J., Snow, D.D., Cassada, D.A., Monson S.J., and Spald-ing, R.F., 2001, Analysis of oxytetracycline, tetracycline, and chlortetracycline in water using solid-phase extraction and liquid chromatography-tandem mass spectrometry: Journal of Chromatography A, v. 928, p. 177–186.
Zia, H., and Price, J.C., 1976, Binding study of tetracyclines to human serum albumin using difference spectrophotometry: Journal of Pharmaceutical Science, v. 65, p. 226–230.
Zrostlikova, Jitka, Hajslova, Jana, Poustka, Jan, and Begany, Pavel, 2002, Alternative calibration approaches to compen-sate the effect of co-extracted matrix components in liquid chromatography-electrospray ionization tandem mass spec-trometry analysis of pesticide residues in plant materials: Journal of Chromatography A, v. 973, p. 13–26.
�� Evaluation of Offline Tandem and Online Solid-Phase Extraction for Analysis of Antibiotics in Water


Meyer and others—
Evaluation of Offline Tandem
and Online Solid-Phase Extraction w
ith Liquid Chromatography/Electrospray Ionization-M
ass Spectrometry
for Analysis of A
ntibiotics in Am
bient Water and Com
parison to an Independent Method—
Scientific Investigations Report 2007–5021
Printed on recycled paper