evaluation of plc programme provision - solas.ie · evaluation of plc programme provision seamus...
TRANSCRIPT
EVALUATION OF PLC PROGRAMME PROVISION SEAMUS McGUINNESS, ADELE BERGIN, ELISH KELLY, SELINA McCOY, EMER SMYTH, DOROTHY WATSON AND ADELE WHELAN
RESEARCH SERIES NUMBER 61 January 2018
EVIDENCE FOR POLICY

EVALUATION OF PLC PROGRAMME PROVISION
Seamus McGuinness, Adele Bergin, Elish Kelly, Selina McCoy, Emer Smyth,
Dorothy Watson, Adele Whelan
January 2018
RESEARCH SERIES
NUMBER 61
Available to download from www.esri.ie
© The Economic and Social Research Institute Whitaker Square, Sir John Rogerson’s Quay, Dublin 2
ISBN 978 0 7070 0 0428 0
ABOUT THE ESRI
The mission of the Economic and Social Research Institute is to advance evidence-
based policymaking that supports economic sustainability and social progress in
Ireland. ESRI researchers apply the highest standards of academic excellence to
challenges facing policymakers, focusing on 12 areas of critical importance to
21st Century Ireland.
The Institute was founded in 1960 by a group of senior civil servants led by
Dr T.K. Whitaker, who identified the need for independent and in-depth research
analysis to provide a robust evidence base for policymaking in Ireland.
Since then, the Institute has remained committed to independent research and
its work is free of any expressed ideology or political position. The Institute
publishes all research reaching the appropriate academic standard,
irrespective of its findings or who funds the research.
The quality of its research output is guaranteed by a rigorous peer review process.
ESRI researchers are experts in their fields and are committed to producing work
that meets the highest academic standards and practices.
The work of the Institute is disseminated widely in books, journal articles and
reports. ESRI publications are available to download, free of charge, from its
website. Additionally, ESRI staff communicate research findings at regular
conferences and seminars.
The ESRI is a company limited by guarantee, answerable to its members and
governed by a Council, comprising 14 members who represent a cross-section of
ESRI members from academia, civil services, state agencies, businesses and civil
society. The Institute receives an annual grant-in-aid from the Department of
Public Expenditure and Reform to support the scientific and public interest
elements of the Institute’s activities; the grant accounted for an average of 30 per
cent of the Institute’s income over the lifetime of the last Research Strategy. The
remaining funding comes from research programmes supported by government
departments and agencies, public bodies and competitive research programmes.
Further information is available at www.esri.ie.
THE AUTHORS
Seamus McGuinness is a Research Professor, Adele Bergin is a Senior Research
Officer, Elish Kelly is a Senior Research Officer, Selina McCoy is an Associate
Research Professor, Emer Smyth is a Research Professor, Dorothy Watson is an
Associate Research Professor and Adele Whelan is a Research Officer at the ESRI.
All members of the research team have adjunct research positions at Trinity
College Dublin.
ACKNOWLEDGEMENTS
We would like to thank Fiona Hartley, Bryan Fields, Derek Walsh, Barry Ryan and
Sue Hickey from SOLAS for their active engagement with the project. We are
grateful to members of the PLC Evaluation Advisory Committee, the Department
of Education and Skills, Education and Training Boards personnel, PLC providers,
principals, learners and other key stakeholders who gave their time to engage in
the project. We would also like to thank our ESRI colleague, Helen Russell, and
Jim Gallacher of the Glasgow Caledonian University who reviewed an earlier draft
and provided useful comments. Finally, our thanks go to the Director of the ESRI
and two internal ESRI referees for their suggestions and contributions to this
report.
The paper has been accepted for publication by the Institute, which does not itself take institutional
policy positions. All ESRI Research Series reports are peer reviewed. The authors are solely responsible
for the content and the views expressed.

FOREWORD
Each year, further education and training (FET) is a very positive experience for
many thousands of individuals across the country. It encompasses both a field of
education and training and a distinct sector within that field. It has many and
diverse purposes. Its very diversity and that of its learners is one of its key
strengths.
There is a myriad of reasons why individuals choose to engage in FET. Some have
aspirations to get a job, others to go to third-level education, still others to improve
their reading and writing skills. Many see the personal and social benefits of re-
engaging in learning after a long absence. The FET sector has set out its vision for
the future in the Further Education and Training Strategy 2014–2019.
If we are to succeed in this vision and keep FET accessible, effective and relevant
to meet the aspirations of learners, then it needs to continuously adapt and
improve. The FET sector and the high quality of its provision should be synonymous
irrespective of where, when and how it is undertaken. It should also be backed up
by evidence.
The national Post-Leaving Certificate (PLC) programme, more commonly known as
‘PLC courses’, is a well-known, well regarded and trusted FET brand. It has a proud
history of delivering ‘in-demand’ employer skills and at the same time enabling
others to achieve their ambition of attending third-level education. Evidence
shows that the higher the education and training undertaken, the greater the
chances of finding a job.
The Irish Government has set out a new strategy to ensure that we have the skills
as a nation to become even more competitive and to ensure that all citizens can
benefit from the opportunities that this will undoubtedly present. FET has a central
role to play in this new skills strategy and in that regard the national PLC
programme is a key pillar within FET.
However, a disruptive economic and social landscape and fast moving
developments, for example in digital technology, green energy and
communications, together with the need to demonstrate value for money means
that there are very high expectations in relation to all FET programmes and
services. People rightly expect FET to enable and empower them to manage and
take advantage of these developments, while funders need to be assured that this
money is spent wisely to optimise outcomes for learners.

This report by the ESRI was commissioned by SOLAS and was prepared during a
time of unprecedented change within the FET sector. Notwithstanding the priority
to get the newly established SOLAS and the Education and Training Boards (ETB)
up and running as quickly as possible, both maintained a clear focus on the
importance of finding out how best to improve FET programmes and services so
that under the newly restructured FET banner, higher quality learning experiences
and better outcomes for all learners can become a reality. Having a reliable and
informed evidence base on what is working well and what needs improvement is
a good starting point.
This report adds significantly to the FET evidence base by providing a wealth of
insights in respect of the many benefits for learners associated with participating
in the national PLC programme. It also identifies areas where improvements to PLC
are essential if they are to become more effective, responsive and efficient. With
over 30,000 places, the national PLC programme represents just over half of all
SOLAS-funded, full-time FET provision offered by the ETB sector. A report of this
nature is essential for SOLAS to help it make well informed and balanced decisions
with regard to how best to improve FET overall and the national PLC programme
more specifically.
Given the centrality of the national PLC programme within FET, it is essential
therefore that everybody is clear on the purpose of the PLC programme, that this
purpose is not only appropriate for today but is future proofed to take account of
new and emerging developments. This report underlines the importance of
measuring the success of the national PLC programme and in particular the quality
of the learning experience and the subsequent outcomes for PLC learners on the
basis of how well this purpose has been served. We need not only to meet but to
exceed the expectations of PLC learners.
In response to the findings of the ESRI evaluation, SOLAS submitted to the Minister
for Education and Skills a comprehensive set of recommendations for his
consideration to improve the national PLC programme. SOLAS now intends to
establish a programme improvement implementation group that will report
regularly to the SOLAS Board and to the Minister on how well improvements to the
national PLC programme are being implemented and the resultant impact of these
improvements.
SOLAS appreciates the substantial assistance it received from many organisations
and individuals during the course of this evaluation. Members of the SOLAS PLC
Evaluation Advisory Committee provided very helpful advice, insights and support.
The Department of Education and Skills, Education and Training Boards personnel,
PLC providers, policymakers, social partners, advocacy personnel and learners

facilitated and shared their valuable experiences and perspectives. To all of them I
convey the appreciation of SOLAS and the personal thanks of the Research and
Evaluation project team in SOLAS.
____________________________________________
Paul O’TooleChief Executive OfficerSOLAS
Table of contents|i
TABLE OF CONTENTS
Abbreviations ................................................................................................................................. vi
Executive summary ....................................................................................................................... viii
Chapter 1: Introduction ................................................................................................................ 1
1.1 Background and introduction ............................................................................................. 1
1.2 Outline of report ................................................................................................................. 3
1.3 Historical context ................................................................................................................ 3
1.4 Recent developments ......................................................................................................... 6
1.5 Background information on PLC ......................................................................................... 8
Chapter 2: PLC provision: Patterns from administrative data ....................................................... 10
2.1 Introduction ........................................................................................................................ 10
2.2 Patterns of provision ........................................................................................................... 10
2.3 Summary and conclusions .................................................................................................. 18
Chapter 3: Evidence from survey of principals: Resources, objectives and outcomes .................. 20
3.1 Introduction ........................................................................................................................ 20
3.2 Descriptive analysis ............................................................................................................. 21
3.3 Econometric analysis ........................................................................................................... 32
3.4 Qualitative responses .......................................................................................................... 34
3.4.1 Providers’ perspectives on the advantages of PLC provision ................................. 34
3.4.2 Principals’ perspectives on future challenges for PLC provision ............................ 37
3.5 Summary and conclusions .................................................................................................. 40
Chapter 4: Evidence from survey of learners: Measuring the impacts of PLC provision ............... 41
4.1 Introduction ........................................................................................................................ 41
4.2 Survey of learners ............................................................................................................... 42
4.3 Descriptive analysis ............................................................................................................. 44
4.4 Econometric analysis ........................................................................................................... 49
4.5 Summary and conclusions .................................................................................................. 64
Chapter 5: Evidence from survey of learners: Student perceptions .............................................. 66
5.1 Introduction ........................................................................................................................ 66
5.2 Conceptualising post-school pathways ............................................................................... 67
5.3 Profile of PLC participants ................................................................................................... 69
5.4 Post-School objectives and PLC entry ................................................................................. 70
5.5 Experience of PLC and higher education courses ............................................................... 73

ii|Evaluation of PLC programme provision
5.6 Reflections on pathways taken ........................................................................................... 84
5.6.1 Reflections on post-school choices ........................................................................ 84
5.6.2 Life satisfaction, perceived social inclusion and financial wellbeing ..................... 89
5.7 Summary and conclusions .................................................................................................. 94
Chapter 6: Summary and implications for policy ........................................................................... 97
6.1 Introduction ........................................................................................................................ 97
6.2 The goals of PLC provision .................................................................................................. 97
6.3 Availability of PLC provision ................................................................................................ 100
6.4 Labour market responsiveness of PLC provision ................................................................ 101
6.4.1 Provision and labour market demand .................................................................... 101
6.4.2 Employer engagement among providers ............................................................... 102
6.4.3 Employment outcomes among learners ................................................................ 103
6.5 Progession to further learning ............................................................................................ 104
6.6 PLC provision and social inclusion ....................................................................................... 105
6.7 Learner satisfaction with PLC provision .............................................................................. 105
6.8 Issues for policy development ........................................................................................... 106
REFERENCES ................................................................................................................................... 108
APPENDIX A: Additional data ....................................................................................................... 111
APPENDIX B: Note on sampling and weighting for the survey of PLC leavers ............................... 125
APPENDIX C: Consultation workshops ........................................................................................... 130
APPENDIX D: Questionnaire for survey of school and PLC leavers ................................................ 142
APPENDIX E: Questionnaire for survey of PLC providers ............................................................... 157
Lists of tables and figures|iii
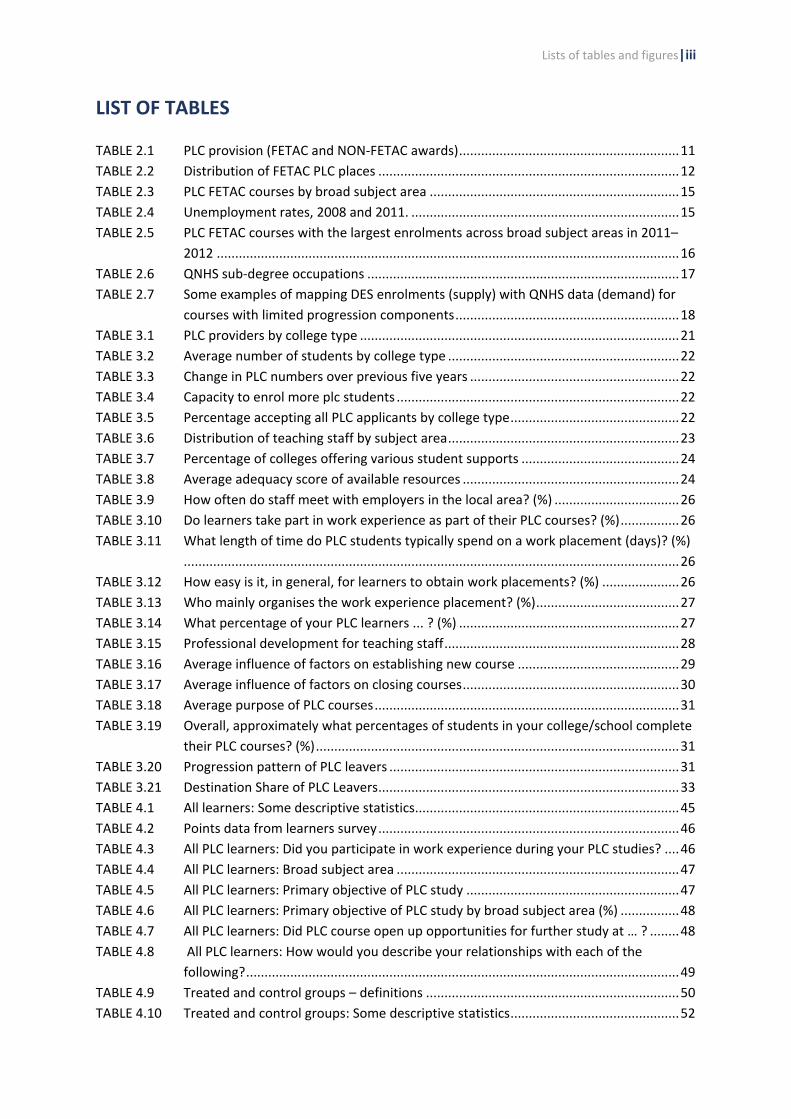
LIST OF TABLES
TABLE 2.1 PLC provision (FETAC and NON-FETAC awards) ............................................................ 11
TABLE 2.2 Distribution of FETAC PLC places .................................................................................. 12
TABLE 2.3 PLC FETAC courses by broad subject area .................................................................... 15
TABLE 2.4 Unemployment rates, 2008 and 2011. ......................................................................... 15
TABLE 2.5 PLC FETAC courses with the largest enrolments across broad subject areas in 2011–
2012 .............................................................................................................................. 16
TABLE 2.6 QNHS sub-degree occupations ..................................................................................... 17
TABLE 2.7 Some examples of mapping DES enrolments (supply) with QNHS data (demand) for
courses with limited progression components ............................................................. 18
TABLE 3.1 PLC providers by college type ....................................................................................... 21
TABLE 3.2 Average number of students by college type ............................................................... 22
TABLE 3.3 Change in PLC numbers over previous five years ......................................................... 22
TABLE 3.4 Capacity to enrol more plc students ............................................................................. 22
TABLE 3.5 Percentage accepting all PLC applicants by college type .............................................. 22
TABLE 3.6 Distribution of teaching staff by subject area ............................................................... 23
TABLE 3.7 Percentage of colleges offering various student supports ........................................... 24
TABLE 3.8 Average adequacy score of available resources ........................................................... 24
TABLE 3.9 How often do staff meet with employers in the local area? (%) .................................. 26
TABLE 3.10 Do learners take part in work experience as part of their PLC courses? (%) ................ 26
TABLE 3.11 What length of time do PLC students typically spend on a work placement (days)? (%)
....................................................................................................................................... 26
TABLE 3.12 How easy is it, in general, for learners to obtain work placements? (%) ..................... 26
TABLE 3.13 Who mainly organises the work experience placement? (%) ....................................... 27
TABLE 3.14 What percentage of your PLC learners ... ? (%) ............................................................ 27
TABLE 3.15 Professional development for teaching staff ................................................................ 28
TABLE 3.16 Average influence of factors on establishing new course ............................................ 29
TABLE 3.17 Average influence of factors on closing courses ........................................................... 30
TABLE 3.18 Average purpose of PLC courses ................................................................................... 31
TABLE 3.19 Overall, approximately what percentages of students in your college/school complete
their PLC courses? (%) ................................................................................................... 31
TABLE 3.20 Progression pattern of PLC leavers ............................................................................... 31
TABLE 3.21 Destination Share of PLC Leavers .................................................................................. 33
TABLE 4.1 All learners: Some descriptive statistics ........................................................................ 45
TABLE 4.2 Points data from learners survey .................................................................................. 46
TABLE 4.3 All PLC learners: Did you participate in work experience during your PLC studies? .... 46
TABLE 4.4 All PLC learners: Broad subject area ............................................................................. 47
TABLE 4.5 All PLC learners: Primary objective of PLC study .......................................................... 47
TABLE 4.6 All PLC learners: Primary objective of PLC study by broad subject area (%) ................ 48
TABLE 4.7 All PLC learners: Did PLC course open up opportunities for further study at … ? ........ 48
TABLE 4.8 All PLC learners: How would you describe your relationships with each of the
following? ...................................................................................................................... 49
TABLE 4.9 Treated and control groups – definitions ..................................................................... 50
TABLE 4.10 Treated and control groups: Some descriptive statistics .............................................. 52

iv|Evaluation of PLC programme provision
TABLE 4.11 Treated and control groups: Some descriptive statistics for 2012 and 2015 ............... 53
TABLE 4.12 Employed in 2015: Estimated impact relative to direct labour market entrants ......... 57
TABLE 4.13 Employed in 2015: Estimated impact relative to leaving certificate students who
progressed straight to higher education ...................................................................... 57
TABLE 4.14 Progression to higher education: Summary of estimates ............................................. 57
TABLE 4.15 Incidence of underskilling ............................................................................................. 58
TABLE 4.16 Wages in current job (incl. two mills ratios; child & parental degree excl.) ................. 61
TABLE 4.17 Occupational distribution of individuals with a PLC qualification (%) .......................... 63
TABLE 4.18 Unemployment rates by educational attainment: 2006 and 2009 (Q2) ...................... 63
TABLE 4.19 Wages: Summary of estimates ..................................................................................... 64
TABLE 5.1 Profiling pathway groups .............................................................................................. 70
TABLE 5.2 Main factor in post-school decision-making ................................................................. 71
TABLE 5.3 Main plan on leaving school ......................................................................................... 71
TABLE 5.4 Support services accessed during PLC/higher education studies (%) ........................... 78
TABLE 5.5 How much more likely are leavers taking different pathways to feel they did not get
the post-school choices they had planned? (odds ratios) ............................................ 87
TABLE 5.6 How much more likely are leavers taking different pathways to regret the choice
made on leaving school? (odds ratios) ......................................................................... 89
TABLE 5.7 How much more likely are leavers taking different pathways to be in the group least
satisfied with life? (odds ratios) .................................................................................... 91
TABLE 5.8 How much more likely are leavers taking different pathways to be in the group least
socially included? (odds ratios) ..................................................................................... 92
TABLE 5.9 How much more likely are leavers taking different pathways to experience difficulty in
making ends meet? (odds ratios) .................................................................................. 94
TABLE A1 QNHS sub-degree occupations in other category ....................................................... 111
TABLE A2 General PLC fields of study ......................................................................................... 112
TABLE A3: Job-Specific PLC fields of study ................................................................................... 113
TABLE A4: Employed after 5 years: Summary of estimates I ....................................................... 113
TABLE A5: Employed after 5 years: Summary of estimates II ...................................................... 114
TABLE A6: Progression to higher education: Summary of estimates ........................................... 114
TABLE A7: Employed after 3 years: Summary of estimates I ....................................................... 115
TABLE A8: Employed after 3 years: Summary of estimates II ...................................................... 115
TABLE A9: Job Satisfaction: Summary of estimates ..................................................................... 116
TABLE A10: Underskilling: Summary of estimates ......................................................................... 116
TABLE A11: Severe Underskilling: Summary of estimates ............................................................. 117
TABLE A12: Overskilling: Summary of estimates ........................................................................... 117
TABLE A13: First stage probit model for participating in a PLC course (relative to LC students who
directly entered the labour market) ........................................................................... 118
TABLE A14: First stage probit model for participating in a PLC course (relative to LC students who
directly entered HE) .................................................................................................... 118
TABLE A15: Employed in 2015: Estimated impact for plc learners who completed their course
relative to direct labour market entrants ................................................................... 119
TABLE A16: Progression to higher education: Estimated Impact for PLC Learners who completed
their course ................................................................................................................. 119

Lists of tables and figures|v
Table A17 Logistic regression: Probability of being in group who did not get what they planned
on leaving school (odds ratios) ................................................................................... 120
Table A18 Logistic regression: Probability of being in group who regret choice made on leaving
school (odds ratios) ..................................................................................................... 121
Table A19 Logistic regression: Probability of being in group who are least satisfied with their life
(odds ratios; bottom quintile on satisfaction with everyday life) ............................... 122
Table A20 Logistic regression: Probability of being in group who are least socially included (odds
ratios; bottom quintile on social inclusion) ................................................................ 123
Table A21 Logistic regression: Probability of being in group who experience difficulty making
ends meet (odds ratios) .............................................................................................. 124
Table B.1: Sampling fraction by stratification group (%) ............................................................. 126
Table B.2: Response rate by stratification group ......................................................................... 127
Table B.3: Population distribution, sample distribution and weight by stratification group ...... 128
Table B.4: Population distribution and sample distribution of DEIS school and school type by
stratification group (%) ............................................................................................... 129
LIST OF FIGURES
FIGURE 2.1 How does the ratio of enrolments vary compared to the HP deprivation index (2011–
2012)? ........................................................................................................................... 13
FIGURE 4.1 Wage data in survey ...................................................................................................... 60
FIGURE 5.1 Source of advice on post-school choices by main pathway (%) ................................... 72
FIGURE 5.2 Time spent (hours per week) on course of studies (%) ................................................ 74
FIGURE 5.3 Percentage reporting difficulty was a major or moderate problem for them in their
first year of PLC study ................................................................................................... 75
FIGURE 5.4 Percentage reporting difficulty was a major or moderate problem for them in their
first year of higher education study .............................................................................. 76
FIGURE 5.5 Sources of funding while on PLC or higher education course (%) ................................ 77
FIGURE 5.6 Experience of teaching and learning in PLC and higher education courses (%
agree/strongly agree).................................................................................................... 80
FIGURE 5.7 Supports and services in PLC and higher education (% agree/strongly agree) ............ 81
FIGURE 5.8 Frequency of experience of workplace learning on PLC course (%) ............................. 82
FIGURE 5.9 Frequency of experience of workplace learning on higher education course (%) ....... 83
FIGURE 5.10 Extent to which skills and competencies have been achieved by all learners (%) ....... 84
FIGURE 5.11 Did leavers get to do what they planned after leaving school? (%) ............................. 85
FIGURE 5.12 Would leavers take the same pathway again? (%) ....................................................... 88
FIGURE 5.13 Satisfaction with life: Percentage in the least and most satisfied quintiles ................. 90
FIGURE 5.14 Perceived Social Inclusion: Percentage in the highest and lowest quintiles (most and
least socially included) .................................................................................................. 92
FIGURE 5.15 Ability to make ends meet for leaver households (%) .................................................. 94

vi|Abbreviations
ABBREVIATIONS
AEO Adult Education Organisers
BTEA Back to Education Allowance
CPD Continuous professional development
CSO Central Statistics Office
DES Department of Education and Skills
DSP Department of Social Protection
EEC European Economic Community
EOS Educational Opportunities Scheme
ESF European Social Fund
ETB Education and Training Boards
ETBI Education and Training Boards Ireland
FET Further education and training
FETAC Further Education and Training Awards Council
HE Higher education
HETAC Higher Education and Training Awards Council
HP Haase Pratchke (Deprivation Index)
IUQB Irish Universities Quality Board
LC Leaving Certificate
LCA Leaving Certificate Applied
LCVP Leaving Certificate Vocational Programme
LMJ Labour market justification
NALA National Adult Literacy Agency
NCSE National Council for Special Education
NCVA National Council for Vocational Awards
NES National Employment Survey
NFQ National Framework of Qualifications
NQAI National Qualifications Authority of Ireland
NQF National Qualifications Framework
OLS Ordinary least squares
PLC Post-Leaving Certificate
PSM Propensity score matching
PPPDB Post-Primary Pupil Database

Evaluation of PLC programme provision |vii
QNHS Quarterly National Household Survey
QQI Quality and Qualifications Ireland
SEN Special educational need
SIAC Strategy Implementation Advisory Committee
STEM Science, technology, engineering and maths
SUSI Student Universal Support Ireland
VEC Vocational Educational Committees
VET Vocational education and training
VPT Vocational Preparation and Training
VTOS Vocational Training Opportunities Scheme
viii|Executive summary
EXECUTIVE SUMMARY
Post-Leaving Certificate (PLC) courses represent the largest component of full-time
further education and training (FET) provision in Ireland, with over 32,000 learners
enrolled in such courses in 2015–2016. Recent research on the FET sector as a
whole highlighted concerns around its structures and responsiveness to labour
market conditions, among other issues (McGuinness et al., 2014). The SOLAS FET
Strategy (2014) subsequently pointed to the need for a stronger evidence base in
order to inform future policy development in the sector. This study, commissioned
by SOLAS, provides a more detailed evaluation of PLC provision. In order to
undertake a comprehensive evaluation, our approach has been to combine a
variety of research modes in order to examine the underlying processes,
experiences and outcomes of PLC provision. This involved three complementary
research strands. Firstly, a desk-based analysis of administrative data was used to
document the type of provision in terms of field of study and the distribution of
PLC places across the country. Secondly, a survey of PLC principals was carried out
in order to explore their perceptions of goals, adequacy of existing facilities and
the benefits and challenges of PLC provision. Thirdly, a survey of PLC and Leaving
Certificate leavers was conducted to assess their labour market outcomes as well
as their experiences while taking PLC and higher education courses. Together,
these strands provide comprehensive evidence to inform the future development
of the sector.
What follows is a summary of the main findings.
PLC PROVISION
• There is a substantial amount of heterogeneity in the regional distribution of PLC places.
• The central goals of PLC provision include transitions to employment and vocational
preparation for young people. Given this, we might expect PLC programmes to be
targeted towards younger people who have a greater need for supports. However, the
evidence shows that young people from disadvantaged regions, who have the highest
risk of unemployment, do not have higher-than-average access to PLC programmes.
LABOUR MARKET RESPONSIVENESS OF PLC PROVISION
• The composition of PLC provision remained relatively stable and the level of enrolments
increased during a period in which both the level and composition of labour market
Evaluation of PLC programme provision |ix
demand changed dramatically.1 This suggests that, contrary to what is implied by the
Conditions of Approval, PLC provision does not appear to be highly responsive to changing
labour market conditions and shocks.2
• Decisions around course provision and closure tends to be heavily driven by student
demand, with less weight given to employer requirements, government objectives or
national forecasting.
• The sector generally appears to be poorly connected to the requirements of the labour
market and much more needs to be done to ensure that course provision is both
reflective of and responsive to labour demand, specifically for vocational labour, for those
who have recently qualified.
• PLC principals view provision as fulfilling a range of roles, with labour market, lifelong
learning, progression to higher education and social inclusion all appearing to have equal
weight.
• The distribution of teacher qualifications maps relatively closely to the aggregate
enrolments data by subject area; regarding the latter, 52 per cent were in the arts and
social science, 12 per cent were in STEM, 17 per cent in services, and 18 per cent in
agriculture. Differences that do exist between the distribution in teacher qualification
and student enrolments by subject area may be explained by differences in class size.
LEARNER CHARACTERISTICS
• Overall, participants in PLC programmes are disproportionately female, from less
educated backgrounds, are more likely to be older and have children, and have greater
special educational needs (SEN) prevalence rates than their counterparts enrolling
directly in higher education.
• The majority (62 per cent) of PLC leavers are in the 200–400 points bands while the
majority of the Leaving Certificate group (63 per cent) are in the 300–500 bands, so PLC
learners have lower-than-average qualifications at Leaving Certificate level. This may
reflect the fact that a higher proportion of the Leaving Certificate cohort went directly to
higher education.
1 The Great Recession had a dramatic effect on employment in all sectors, but the largest employment losses were in Construction and Services (Bergin, Kelly and McGuinness, 2012).
2 The PLC Conditions of approval (DES, 2012) include “In approving courses the Department has regard to ensuring appropriate provision on a geographic basis” and “Providers must include a Labour Market Justification (LMJ) with applications for all new courses, showing: (i) How the course provision meets with Government policy; (ii) What particular skill gaps or areas of skill growth, both locally and nationally, the course will address; and (iii) Specific data and information on progression options, local agreements with employers, information on outcomes for previous learners.”

x|Executive summary
LEARNER EXPERIENCES
• PLC learners were asked about their primary objective for PLC study: 39 per cent reported
that their main objective was to get a job immediately after the PLC course and a similar
percentage reported that their main objective was to get a place on a higher education
programme. Just under 20 per cent citied personal development as the key motivating
factor for pursuing a PLC course.
• According to the PLC respondents, just over 70 per cent of learners undertook work
experience during their PLC studies.
• Financial challenges constituted the single greatest difficulty for both PLC and higher
education students, but the two groups differed somewhat in terms of the sources of
funding they drew upon to meet college costs. Partly reflecting the differing age and
socio-economic profile of the two groups, higher education students were more likely to
receive direct and indirect support from their families; they were also more likely to be
in paid employment. By contrast, greater caring responsibilities among the PLC group
restricted their employment opportunities.
• PLC students reported that they were largely satisfied with the relevance of course design
and the vast majority felt their teachers/tutors had the required knowledge. However,
they were less positive about the prominence of workplace learning in their course (as
were higher education participants), particularly regarding the opportunity to acquire
work-related knowledge and skills and the opportunity to apply their learning in the
workplace.
• In reflecting on choices made, PLC courses are still seen as a compromise, in a context of
not achieving sufficient grades to pursue higher education, highlighting the continued
lower status of further education in Ireland.
• Dissatisfaction levels with guidance counselling supports at second level were high for all
groups of leavers; this is a key factor in school leavers later regretting their post-school
choices.
• Differences across leavers in terms of the post-school options they pursued also emerge
in relation to life satisfaction, measures of social inclusion and financial wellbeing. PLC
participants fare less well, and second-level grades play a central role in shaping young
peoples’ opportunities to pursue post-school pathways that will maximise their potential
for personal fulfilment and achievement. Family circumstances also play an important
role in understanding wellbeing and particularly financial insecurity – those with children
experience much greater challenges in this regard and this explains much of the
difference between the leaver groups.
LEARNER OUTCOMES
• In order to assess the employment and educational outcomes of PLC leavers, this group
was compared to a group of Leaving Certificate leavers who were similar in characteristics

Evaluation of PLC programme provision |xi
but who entered the labour market directly upon leaving school. The difference between
the two groups is referred to as the counterfactual impact.
• In terms of employment outcomes, the estimated counterfactual impact of PLC provision
shows that, by 2015, PLC participants were 16 per cent more likely to be in employment
relative to similar individuals who entered the labour market directly on completion of
their Leaving Certificate. We find that the employment effects are greater for PLC
learners in more job-specific, rather than general, PLC programmes.
• In terms of progressing to higher education, the counterfactual impact reveals that PLC
learners are 27 per cent more likely to advance to higher education, relative to similar
individuals who entered the labour market directly on completion of their Leaving
Certificate. The estimated counterfactual impacts on various measures of job quality,
such as job satisfaction or level of skill match with the current job, showed no significant
differences between the PLC learners and similar individuals who entered the labour
market directly on completion of their Leaving Certificate. The incidence of underskilling
(that is, the current job demanding more knowledge and skills than the respondent could
offer) across various groups is somewhat surprising. Generally, we might expect
underskilling rates to be highest for those with Leaving Certificate or higher education, as
these qualifications may not be occupationally specific in nature. Instead, however, we
found higher rates of underskilling among the PLC group. We should treat these results
with some caution as we are capturing effects right at the onset of the respondents’
careers and, therefore, cannot rule out the possibility of other differences between the
groups emerging over time.
ISSUES FOR POLICY DEVELOPMENT
• The findings of this study point to the positive role played by PLC provision in providing
educational opportunities for a diverse group of learners and in enhancing their access
to employment and higher education. However, the findings also highlight a number of
challenges for policy development in the PLC sector.
• Learners are almost equally divided between those taking PLC courses for skill formation
(and hence employment access) and those taking them for progression to higher
education. However, principals see courses as addressing multiple goals, suggesting
greater potential for clarity around the orientation and purpose of specific courses.
• There is a need for greater responsiveness of job-specific PLC courses to changing labour
market conditions in terms of the types of courses offered. Provision is currently
constrained by legacy issues, including the skillset of existing staff, with relatively little
input of information on skill gaps and employer demand. There is also evidence of a need
for a greater focus on skill formation within some employment-oriented courses,
adapting course content to focus on employability and integrating work experience
placements into the learning experience for all learners.

xii|Executive summary
• PLC courses are offered across very different settings, with smaller institutions less likely
to provide the full range of student supports and larger institutions operating under
resource constraints relative to student numbers. There would appear to be scope to link
smaller providers into local or regional networks, perhaps through the ETB, to facilitate
access to specialist supports and to support engagement with employers. While good
practice appears to have emerged in certain areas, there are undoubted challenges in
building up sustained employer engagement and recognition of qualifications in the
absence of a strong tradition of such involvement (see Raffe, 2015, on challenges in the
British context).
• The issue of the appropriate level of funding to provide a varied learning experience and
appropriate supports for a diverse group of learners merits further investigation,
especially given that PLC courses are run using a slightly enhanced second-level funding
model that may not take adequate account of the range of facilities and supports
required.
• Finally, PLC provision cannot be seen in isolation from the broader educational system.
The role of school-based guidance emerges as important in facilitating access to
appropriate courses. Low take-up of guidance within PLC provision may be impacting on
awareness of the potential pathways (education and employment) subsequently open to
learners, an issue that merits further research. More fundamentally, there appear to be
persistent difficulties, from the learner perspective at least, in the perceived status of PLC
courses vis-à-vis higher education, which raise challenges in creating a valued pathway
catering for a range of learners.
Introduction|1
CHAPTER 1
Introduction
1.1 BACKGROUND AND INTRODUCTION
This report provides a formal evaluation of Ireland’s Post-Leaving
Certificate (PLC) programme. The evaluation relies primarily on three
research strands:
(i) desk-based analysis;
(ii) a survey of PLC principals; and
(iii) a survey of learners.3
Workshops with key stakeholders were also organised to supplement the
analysis.
A comprehensive dataset on PLC provision does not exist. Therefore, there
are no comprehensive measures of key variables that track participants
and outcomes over time, such as enrolments, completion rates, levels of
accreditation and progression. Furthermore, at the school/college level no
information is available on factors such as the planning process, structure
of delivery and teacher provision. This is why, in order to undertake a
comprehensive evaluation, our approach has been to combine a variety of
research modes in order to examine the underlying processes, experiences
and outcomes. Each research strand provides a different contribution to
the overall evaluation. For example, the PLC learner survey captures
information at an individual level, allowing an evaluation of the
experiences and outcomes of PLC learners. The survey of principals
provides insights from a different perspective, containing information on
the factors driving provision and how work-related learning is embedded
into the different courses, thus allowing an evaluation of the processes
underlying PLC provision.
The desk-based element includes a historical overview of policy
developments and their impact on PLC provision, as well as a profile of
current PLC programme provision disaggregated over course type,
geographical location and level of deprivation. The survey of PLC principals
provides information on the structure of PLC provider institutions,
3 Throughout the report, we use the terms ‘learner’ and ‘leaver’ interchangeably.

2| Evaluation of PLC programme provision
including college type, composition of teachers and tutors, and the nature
and level of supports. The survey also explores perceptions of the roles of
PLC programmes, factors influencing course closures and openings, and
progression rates at college level.4 Finally, the PLC leaver survey provides
the main evidence base for the evaluation of outcomes and consists of the
following key components:
• descriptive evidence of PLC participants, including age, gender, previous
education level, socio-economic background, take-up of learner supports, as well
as reflections on the guidance process and quality of experiences;
• a comprehensive analysis of learner experiences and outcomes, including
multivariate estimates of the counterfactual impact of PLC provision relative to a
number of comparison groups on a number of key pathways, such as
employment and progression to higher education, as well as other outcomes
including wages, and an examination of key indicators of quality of employment,
such as job satisfaction and mismatch;5 and
• an assessment of learner experiences with respect to access to relevant work
experience, skill formation, views on the learning process and guidance
arrangements.
Based on all of the above findings, the report makes a series of
recommendations that address:
• improving the effectiveness and quality of PLCs;
• identifying the most suitable structure for the delivery of PLC programmes;
• optimising progression to both employment/self-employment and further
study/higher education;
• improving social inclusion;
• improving cost-effectiveness;
• ensuring geographical spread and diversity of programmes; and
• improving teaching and learning supports.
4 These inputs will include such factors as: PLC Conditions of approval; the use of labour market intelligence
and occupational forecasting; structure of local, regional and national labour market demand; and employer inputs.
5 Comparison groups include: all Leaving Certificate school leavers; Leaving Certificate school leavers wno went straight to the labour market; and Leaving Certificate school leavers who went straight to higher education (all of whom constitute the counterfactual).

Introduction|3
1.2 OUTLINE OF REPORT
The report is structured as follows. The remainder of Chapter 1 describes
the historical context and background information on PLC programmes in
Ireland. Chapter 2 examines the pattern of enrolments, using
administrative data over two separate time periods (2008–2009 and 2011–
2012). Chapter 3 presents results of the survey of PLC principals on a range
of issues, including structure, size and composition of PLC colleges, the
perceived role of PLC programmes, resources available for PLC provision
and progression patterns. Chapter 4 examines results of the survey of
learners, providing a descriptive discussion of the main characteristics of
respondents before progressing to estimate the impact of PLC provision on
a series of outcome measures. Chapter 5 examines learners’ perceptions
with respect to access to relevant work experience, skill formation, views
on the learning process and guidance arrangements. Chapter 6 concludes
with a summary of the key findings and a consideration of implications for
policy.
1.3 HISTORICAL CONTEXT
In Ireland, vocational education developed relatively late, largely because
of delayed industrialisation, the low status of manual work and the
emphasis of Church-run schools on providing an academic education
(Coolahan, 1981). This context meant that Ireland lacked the structured
involvement of employers in education/training institutions evident in
some other European countries. Despite some technical education
initiatives in the early part of the twentieth century, the main framework
for vocational education and training (VET) was provided by the 1930
Vocational Education Act, which established 38 Vocational Educational
Committees (VECs) whose schools provided two-year, full-time
‘continuation education’, designed to prepare young people for the labour
market, alongside evening courses (‘technical education’) designed to
improve the skills of those already employed. Initially focused on practical
skills, with different course content for male and female students, the
1930s saw a broadening of provision to include other subjects, such as
religious education and the Irish language. In 1947, standardised
certification in the form of the Group Certificate was introduced for these
continuation courses, but this was seen as of lower status than the
Intermediate Certificate qualifications offered in voluntary secondary
schools.
The 1950s saw increasing criticism of vocational education, with concerns
expressed about schools losing out as a result of competition from
4| Evaluation of PLC programme provision
secondary schools, a lack of qualified staff and the absence of transfer to
further education. The reform of the Intermediate Certificate in 1966 was
an attempt to provide a more comprehensive curriculum in both
vocational and secondary schools. Many VECs adopted a community
college model in the 1970s, reflecting their role in providing adult and
further education as well as ‘traditional’ second-level education. Towards
the end of the 1970s, VECs appointed Adult Education Organisers (AEOs)
to coordinate adult education provision.
The European Economic Community was very influential in shaping VET in
Ireland (Coolahan, 1981; O’Sullivan, 2005). The European Social Fund (ESF)
provided funding for the establishment of pre-employment courses in over
120 schools in 1977. These courses were targeted at post-junior cycle
students and aimed to provide social, general and technical education
combined with work experience. They were initially confined to vocational
and community or comprehensive schools but were redeveloped as
Vocational Preparation and Training (VPT) courses, VPT1 and VPT2, in 1984
and were extended to voluntary secondary schools (NESC, 1993). The
programmes consisted of vocational studies, work experience and general
studies. A second year was added to the courses in 1985 and these VPT2
courses became commonly known as PLC courses. These courses were
primarily designed to provide vocational education in order to facilitate
young people’s transition to employment. However, commentators (see,
for example, McNamara, 1990) pointed to the facts that the skills in
question were not defined and that the evidence had not been provided
to show that these skills were in short supply or that such shortages caused
high unemployment levels (McNamara, 1990, p.163).
The Educational Opportunities Scheme (EOS) was introduced on a pilot
basis in 1986 to provide one-year, full-time education for those aged over
24 years who had been unemployed for a year or more. It was
reconstituted as the Vocational Training Opportunities Scheme (VTOS) in
1989, with ESF funding, and broadened to include those over 21 years.
Currently, VTOS is provided full-time and delivered to students either
generally attending a further education college or a PLC college in
dispersed mode (‘Dispersed VTOS’) or in core groups (‘Core VTOS’). Core
VTOS refers to those who usually attend a stand-alone course at a VTOS
centre or adult education centre. Dispersed VTOS provision is for VTOS
students participating within groups that are pursuing full-time courses
within other programmes recognised and resourced by the Department of
Education and Skills.
Growing participation rates in this sector led to the establishment in 1991
Introduction|5
of the National Council for Vocational Awards (NCVA) to provide
certification. It used a modular framework, integrating general studies and
vocational modules with a focus on the development of personal and
interpersonal skills (Trant, 2002). However, barriers to progress included
lack of resources, rigid teaching contracts (reflecting second-level teaching
structures), lack of progression routes and, more importantly, the
continued low status of vocational education (Trant, 2002; Granville,
2003). The 1999 Qualifications Act established the National Qualifications
Authority of Ireland (NQAI) and subsumed the NCVA into the Further
Education and Training Awards Council (FETAC) as well as the FÁS and CERT
certification systems: the new qualifications framework covered all
qualifications, including vocational awards. In 2012, Quality and
Qualifications Ireland (QQI) was established as a new integrated agency,
replacing FETAC, the Higher Education and Training Awards Council
(HETAC), the National Qualifications Authority (NQAI) and the Irish
Universities Quality Board (IUQB). QQI is responsible for the maintenance,
development and review of the National Framework of Qualifications
(NFQ).
As well as changes in the qualifications framework, there have been
significant changes in the institutional context within which (most) PLC
courses are offered. In 2013, the 33 VECs were dissolved and replaced by
16 Education and Training Boards (ETBs). The ETBs were established under
and governed according to the Education and Training Boards Act 2013.
Each ETB is a statutory body with its own corporate status, with
responsibility for education and training, youth work and a range of other
statutory functions. While most PLC courses are offered in stand-alone
further education colleges run by the ETB or other ETB schools/colleges
(see Chapter 2), many voluntary secondary schools continue to offer PLC
courses.
Despite its growing importance, the PLC sector has not been subject to a
good deal of policy analysis or empirical research. Hannan et al. (1998)
raised issues of fragmentation and rigidity in the system of vocational
education in Ireland. The authors argued for more strategic concentration
on PLC level expansion in a restricted range of subjects, in particular, to
address the variable regional coverage of short cycle third-level provision
(ibid., p.135). The authors also noted the tendency for institutes of
technology to shift away from shorter certificate and diploma courses
designed to provide middle-level technical skills for regional labour
markets, and towards more degree-level provision (a process termed
‘academic drift’), which was likely to make PLC providers even more crucial
as a source of vocational labour. To address the information gap, the (then)

6| Evaluation of PLC programme provision
Department of Education and Science commissioned a review of provision,
which came to be known as the ‘McIver Report’ (McIver Consulting, 2003).
Based on a survey of providers and further consultation with stakeholders,
the report pointed to significant challenges for the sector given high levels
of demand in the context of inadequate funding and facilities. The
continued operation of PLC provision within the second-level system was
seen as posing particular difficulties in securing greater status for, and
recognition of, the sector. The recommendations of the report were not
implemented.
The McIver Report had focused on institutional factors but subsequent
research by Hannan et al. (2003) and Watson, McCoy and Gorby (2006)
provided new evidence on learner experiences and outcomes. These
studies highlighted the growing importance of the sector as a pathway to
second-chance education for adult learners. The results showed that those
who participated in PLC courses were less likely to be unemployed one
year after completion of the course, compared to those who entered the
labour market directly after the Leaving Certificate (Watson et al., 2006).
PLC participants were also found to be in higher status jobs than Leaving
Certificate leavers five to six years after programme completion (Hannan
et al., 2003). In contrast to the positive employment effects, participants
in PLC courses were less likely to progress to further study than other
school leavers of similar characteristics (in terms of age, gender, Leaving
Certificate performance and social background). In other words, PLC
courses were found to be an alternative, rather than a route, to third-level
education. The extent to which these patterns hold a decade later is
examined later in this report.
1.4 RECENT DEVELOPMENTS
On 1 July 2013, the 33 VECs were dissolved and replaced by 16 ETBs. The
ETBs were established under and governed according to the Education and
Training Boards Act 2013. Each ETB is a statutory body with its own
corporate status, with responsibility for education and training, youth
work and a range of other statutory functions. ETBs manage and operate
second-level schools, further education colleges, community national
schools and a range of adult and further education centres delivering
education and training programmes. The Irish Vocational Educational
Authority changed its name to Education and Training Boards Ireland
(ETBI).
The new configuration paved the way for the establishment of SOLAS, the
dissolution of FÁS and the transfer of its training functions to the newly
Introduction|7
formed ETBs. A year prior to these developments, on 1 January, 2012,
operational responsibility for FÁS Community Employment and FÁS
Employment Services transferred to the Department of Social Protection
(DSP) although FÁS continued to provide ongoing support to DSP during
2012, in order to ensure continuity of service, systems support and
payments to participants of Community Employment and other schemes.
FÁS was dissolved and SOLAS was formally established in October 2013
following the enactment of the Further Education and Training Act 2013.
The 14-month period that followed saw immense change to both the
policies and structures of the FET sector in Ireland. The new authority
brought together the (previously separate) FET areas and was given a very
clear mission by the Minister for Education and Skills:
SOLAS will be tasked with ensuring the provision of 21st century
high quality further education and training programmes which
are responsive to the needs of learners and the requirements of a
changed and changing economy.
At the time of its establishment, all former FÁS training operations
transferred to SOLAS. This included over 850 staff and 19 training centres.
On 1 January 2014, seven former FÁS training centres, including 426 staff
and their related training activity, transferred from SOLAS to four newly
established ETBs. The remaining 12 training centres, including over 434
staff, subsequently transferred to eight ETBs, in July 2014. The transfers
included budget, personnel, buildings, responsibility for contracted
training and funding for community training centres, local training
initiatives and specialist training provision in their respective regions.
Three key documents published by SOLAS in the first half of 2014 provide
the first insight into what the sector delivers on an annual basis and the
direction in which it is moving.
• The Further Education and Training Strategy 2014–2019 provides a
roadmap for the FET sector up to 2019. It was prepared by SOLAS and
approved by the Minister for Education and Skills.
• SOLAS Corporate Plan 2014–2017 outlines how SOLAS intends to
deliver on its commitments in the Further Education and Training
Strategy.
• The Further Education and Training Services Plan 2014 provides, for
the first time, an overview of provision from the FET sector. It makes

8| Evaluation of PLC programme provision
provision for 22,000+ courses for around 340,000 learners, of whom
approximately 90,000 would be unemployed new entrants.
The establishment of the National Apprenticeship Council in 2014 by the
Minister for Education and Skills, on 18 November 2014, signalled the next
phase in the implementation of recommendations from the review of the
Irish apprenticeship system that was conducted by the Department of
Education and Skills (DES) and published earlier that year. The Council was
tasked with the expansion of the apprenticeship system into new sectors
of the economy.
In 2015, the DES also initiated the establishment of a network of regional
skills fora. There are nine regional skills fora organised around the eight
nomenclature of territorial units for statistics (NUTS) 3 regions, with the
border region divided into two. Each regional skills forum consists of
representatives of all DES-overseen education and training providers in the
region, namely, universities, institutes of technology, ETBs, Skillnets and
local regional employer representatives and industry development
agencies. A new national skills strategy – Ireland’s National Skills Strategy
2025 – was published by the DES in 2016.
The FET Strategy Implementation Advisory Committee (SIAC), which is
chaired by the DES and supported and hosted by SOLAS, oversees the
implementation of the new FET strategy. Its membership comprises
representatives of a number of lead partner organisations, such as QQI,
ETBI, Aontas and NALA, as well as SOLAS. Of the 51 actions set out in the
detailed FET Strategy Implementation Plan, 23 are assigned to SOLAS. One
of these actions is to conduct a schedule of FET programme evaluations
over the lifetime of the FET strategy. The ESRI was commissioned by SOLAS
to undertake an evaluation of the national PLC programme in the autumn
of 2015.
1.5 BACKGROUND INFORMATION ON PLC
The Post-Leaving Certificate (PLC) represents the cornerstone of further
education and training (FET) in Ireland. In 2011, in the VEC sector, PLC
enrolments accounted for over 50 per cent of FET enrolments, comprising
Introduction|9
over 80 per cent of full-time enrolments (McGuinness et al., 2014).6 During
2014, there were 32,544 PLC places available, at an estimated direct cost
of €169 million (SOLAS, 2014), implying a direct cost per PLC student of
approximately €5,200 (SOLAS Finance Department).7, 8 Approximately 95
per cent of PLC places were located within the ETB sector during 2014, with
the remaining five per cent of places offered by voluntary secondary and
community and comprehensive schools.9
The central objective of PLC programmes is to provide specific vocational
skills to learners, with programmes directly related to areas of labour
demand.10 PLC programmes provide wide-ranging alternatives for
learners: in the region of 2,500 named courses in over 60 subject areas are
currently available. In addition to providing a viable alternative to third-
level education for school leavers, PLC programmes also constitute an
important route back into education for adult learners and provide up-
skilling opportunities for unemployed learners seeking a route back into
employment. Recent data indicate that 51 per cent of PLC enrolments
were aged 21 or over in 2011 (Department of Education and Skills).11 PLC
qualifications form part of the National Qualifications Framework (NQF)
and facilitate progression to higher study for many learners. Given the
importance of PLC programmes across a range of dimensions of Irish
society, it is critical that any evaluation is based on rigorous research that
takes account of provider and learner perspectives and assesses learner
outcomes relative to comparable groups without PLC qualifications.
6 These figures refer to full-time equivalent (FTE) enrolments from the Department of Education and Skills
(DES) in 2011. FÁS’ training centres comprised the other large provider of FET. However, the FET sector includes many other, typically smaller, providers (see McGuinness et al., 2014 for a comprehensive list).
7 The first figure excludes any capital cost allocation. 8 The €5,200 figure consists of €150 million for PLC teacher costs, €4 million for PLC standard student caption
and €15 million in grant support to PLC students (Source: private communication with SOLAS). 9 In terms of the FET sector as a whole, in 2011 VECs provided full- and part-time programmes. Full-time
programmes included PLC courses, the Vocational Training Opportunity Scheme (VTOS), and Youthreach. Part-time programmes provided were: the Back to Education Initiative (BTEI); community education; adult literacy; intensive tuition in adult basic education (ITABE), and English for speakers of other languages (ESOL). In 2012, FÁS vocational training included apprenticeships, traineeships, specific skills training, and vocational training. These courses vary by duration (see McGuinness et al., 2014, for a complete discussion).
10 PLC providers must provide a labour market justification for all new courses before they can be approved (National Development Plan 2007–2013). Among other things, providers must demonstrate how the course aligns with Government policy and addresses skills gaps at either the local or national level.
11 Data received from the DES in relation to a previous ESRI study on FET. The data also indicate that 61 per cent of PLC enrolments in 2011 were female.
10|PLC provision: Patterns from administrative data
CHAPTER 2
PLC provision: Patterns from administrative data
2.1 INTRODUCTION
In order to provide a detailed evaluation of PLC provision, it is first
necessary to analyse the administrative data available in order to
document the type of provision in terms of field of study and the
distribution of PLC places across the country. This initial desk-based
research element helped to inform the surveys of PLC principals and PLC
and Leaving Certificate leavers, which are discussed in subsequent
chapters. The main findings from this chapter show that there is a
substantial amount of heterogeneity in the regional distribution of PLC
places and that young people from disadvantaged regions, with the
highest risk of unemployment, do not have higher-than-average access to
such vocational educational programmes.
Contextual information on the size and composition of PLC provision in
Ireland is available from the Department of Education and Skills (DES)
enrolments data. As previously pointed out by McGuinness et al. (2014),
data provision in the area for this time period is poor and no reliable
microdata exist that allow for the accurate measurement of completion
rates, attainment levels and progression patterns.12 In this section, we
examine the pattern of PLC enrolments disaggregated over geographical
region, subject area and county deprivation level. In order to draw further
insights, we then categorise PLC courses into two subsets: (i) those with a
strong general component (i.e. not specifically related to a particular
occupation or job); and (ii) those with a strong labour market component
that facilitates direct labour market entry. Finally, we examine the
alignment between PLC courses that have a strong labour market
component, using data from the Quarterly National Household Survey
(QNHS) to estimate the demand for sub-degree newly qualified entrants
to the labour market.
2.2 PATTERNS OF PROVISION
Our enrolment data are analysed over two separate time periods: 2008–
12 Currently, SOLAS are working to improve data provision as part of their Further Education and Training (FET)
Strategy by introducing a learner’s database and a course database. The Programme and Learner Support System (PLSS) project is being developed by SOLAS and ETBI and involves three strands, namely, the National Programme Database (NPD), Course Calendar Scheduling System CCSS, and the Learner Database. The first two strands have been developed and rolled out to all ETBs. The Learner Database has been piloted in Limerick/Clare ETB and is scheduled to be rolled out to all ETBs in 2017.

Evaluation of PLC programme provision |11
2009 and 2011–2012. These periods partly reflect data availability, but
they also relate to different points in the economic cycle. The information
from 2008–2009 relates to the height of the crisis period and while that
from 2011–2012 relates to the beginning of the recovery period. Table 2.1
shows the distribution of PLC awards by awarding bodies (FETAC and non-
FETAC). Total enrolments increased by just over 4,000 (13 per cent)
between 2008–2009 and 2011–2012, with the enrolment growth mostly
related to a growth in FETAC enrolments. Non-FETAC enrolments, which
include providers such as City and Guilds and EDEXCEL, grew marginally
over the period; however, the total share declined from 18 per cent to 16
per cent. Given the nature of the DES data, it is only feasible for us to focus
subsequently on enrolments by FETAC awarding bodies. It is not clear
whether the shift from non-FETAC to FETAC awards is part of a longer-term
trend. However, it is potentially a matter for concern given the high regard
that employers have for such non-FETAC awards (McGuinness et al., 2014).
TABLE 2.1 PLC PROVISION (FETAC AND NON-FETAC AWARDS)
Awarding body 2008–2009 2011–2012
Freq. % Freq. %
FETAC 26,552 82.3 30,423 83.6
Non-FETAC 5,716 17.7 5,973 16.4
Total 32,268 100.0 36,393 100.0
Source: DES enrolments data
We next examine the distribution of FETAC PLC places at county level. The
distribution is expressed by share of total enrolments divided by
population share.13 This allows us to assess the extent to which PLC
enrolments lie above or below the expected level given the county’s
population. Specifically, a ratio greater than one indicates a higher density
of enrolments relative to what might be expected for the given population.
Table 2.2 indicates that there is a substantial amount of heterogeneity in
the regional distribution of PLC places. For instance, in 2008–2009 the
number of available PLC places in Offaly was approximately 12 per cent of
what might be expected given the population; conversely, in Carlow, Cavan
and Sligo, it was at least double, given their respective populations. There
was some movement in the geographical distribution of places between
2008–2009 and 2011–2012: specifically, the ratio for Kilkenny, Laois,
Leitrim and Longford increased significantly, while the largest falls were
13 PLC provision encompasses vocational education for young people as well as second chance education for
older learners so the full population is the appropriate reference group.

12| PLC provision: Patterns from administrative data
experienced in Monaghan and Wexford. It is unclear what drove the
movements between 2008 and 2011. However, one would expect they
may primarily be related to the opening and closure of colleges or courses
rather than population changes.
TABLE 2.2 DISTRIBUTION OF FETAC PLC PLACES
# PLC county Ratio 2008–2009 Ratio 2011–2012
1 Carlow 2.58 2.44
2 Cavan 2.42 2.48
3 Clare 0.28 0.35
4 Cork 1.43 1.47
5 Donegal 0.17 0.20
6 Dublin 1.09 1.07
7 Galway 1.12 1.16
8 Kerry 0.71 0.63
9 Kildare 0.24 0.36
10 Kilkenny 0.70 0.92
11 Laois 0.75 1.04
12 Leitrim 0.41 0.62
13 Limerick 1.21 1.10
14 Longford 1.00 1.39
15 Louth 1.56 1.66
16 Mayo 0.86 0.97
17 Meath 0.44 0.36
18 Monaghan 1.15 0.64
19 Offaly 0.12 0.11
20 Roscommon 0.20 0.23
21 Sligo 2.20 2.04
22 Tipperary 0.89 0.92
23 Waterford 1.19 1.34
24 Westmeath 1.13 1.13
25 Wexford 0.80 0.42
26 Wicklow 0.88 0.87
Source: DES enrolments data and CSO population data
It is not clear what determines the wide variation in the distribution of PLC
places shown in Table 2.2. Variations could be related to national policy,
for example, where places have been allocated to areas with high levels of
unemployment or social disadvantage. Alternatively, the variations could
reflect legacy effects: places exist in areas where they have always existed.
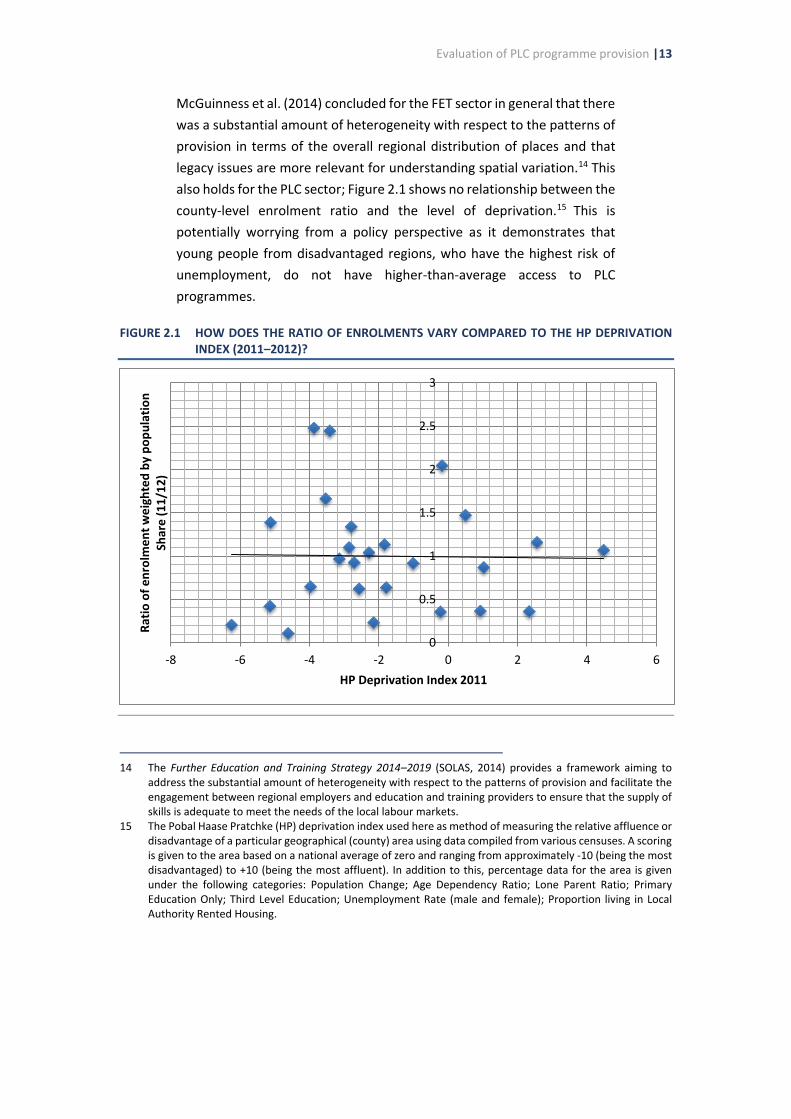
Evaluation of PLC programme provision |13
McGuinness et al. (2014) concluded for the FET sector in general that there
was a substantial amount of heterogeneity with respect to the patterns of
provision in terms of the overall regional distribution of places and that
legacy issues are more relevant for understanding spatial variation.14 This
also holds for the PLC sector; Figure 2.1 shows no relationship between the
county-level enrolment ratio and the level of deprivation.15 This is
potentially worrying from a policy perspective as it demonstrates that
young people from disadvantaged regions, who have the highest risk of
unemployment, do not have higher-than-average access to PLC
programmes.
FIGURE 2.1 HOW DOES THE RATIO OF ENROLMENTS VARY COMPARED TO THE HP DEPRIVATION INDEX (2011–2012)?
14 The Further Education and Training Strategy 2014–2019 (SOLAS, 2014) provides a framework aiming to
address the substantial amount of heterogeneity with respect to the patterns of provision and facilitate the engagement between regional employers and education and training providers to ensure that the supply of skills is adequate to meet the needs of the local labour markets.
15 The Pobal Haase Pratchke (HP) deprivation index used here as method of measuring the relative affluence or disadvantage of a particular geographical (county) area using data compiled from various censuses. A scoring is given to the area based on a national average of zero and ranging from approximately -10 (being the most disadvantaged) to +10 (being the most affluent). In addition to this, percentage data for the area is given under the following categories: Population Change; Age Dependency Ratio; Lone Parent Ratio; Primary Education Only; Third Level Education; Unemployment Rate (male and female); Proportion living in Local Authority Rented Housing.
0
0.5
1
1.5
2
2.5
3
-8 -6 -4 -2 0 2 4 6
Rat
io o
f e
nro
lme
nt
we
igh
ted
by
po
pu
lati
on
Sh
are
(1
1/1
2)
HP Deprivation Index 2011

14| PLC provision: Patterns from administrative data
Sources: DES enrolments data, CSO population data and the Haase Pratchke (HP) index.
We next attempt to assess the degree to which PLC programmes are
distributed by field of study and how these fields relate to the structure of
the labour market. The rationale for this approach is that the conditions
for approval for PLC programmes specifically state that programmes must
be labour market relevant or have a progression element.16 Table 2.3
aggregates the enrolments data for 2008 and 2011 using the statistical
field of study categories adopted by the Irish Central Statistics Office (CSO).
Enrolments in education, social sciences, business, law and general
programmes account for between 50 and 60 per cent of total enrolments
in both periods. Agriculture, veterinary, health and welfare are typically
just below 20 per cent of enrolments, while enrolments in service sector
subjects account for approximately 15 per cent of the total. Finally,
science, maths, computing, engineering, manufacturing and construction
account for the smallest share, at about 10 per cent of the total. The
relative proportion in each broad subject area appears to have remained
relatively stable over the period, despite the labour market undergoing a
substantial economic shock, which will have affected both the level and
composition of labour demand. During this time period, the
unemployment rate increased dramatically, from six per cent to just under
15 per cent (Table 2.4). Given that the composition has remained relatively
stable, and the level of enrolments has increased during a period in which
both the level and composition17 of labour market demand changed
dramatically, it seems that, contrary to what is implied by the Conditions
of Approval for PLC provision, the supply of places is not highly responsive
to changing labour market conditions and shocks.18
16 The Conditions of Approval state, ‘the Post Leaving Certificate (PLC) programme is a self-contained whole-
time learning experience designed to provide successful participants with specific vocational skills to enhance their prospects of securing lasting, full-time employment or progression to other studies’. Course approval does not carry forward from year to year. Providers submit all courses they intend to run for approval regardless of whether they have previously been approved.
17 The Great Recession had a dramatic effect on employment in all sectors, but the largest employment losses were in construction and services (Bergin, Kelly and McGuinness, 2012).
18 The PLC Conditions of approval document (DES, 2012) includes the following statements: ‘In approving courses the Department has regard to ensuring appropriate provision on a geographic basis’ and ‘Providers must include a Labour Market Justification (LMJ) with applications for all new courses, showing: (i) How the course provision meets with Government policy; (ii) What particular skill gaps or areas of skill growth, both locally and nationally, the course will address; and (ii) Specific data and information on progression options, local agreements with employers, information on outcomes for previous learners.

Evaluation of PLC programme provision |15
TABLE 2.3 PLC FETAC COURSES BY BROAD SUBJECT AREA
Broad subject
area PLC FETAC courses
Enrolments
2008–2009 (%)
Enrolments
2011–2012 (%)
1 General programmes or humanities and arts
19 19
2 Education, social sciences, business, law
41 33
3
Science, maths, computing, engineering, manufacturing, construction
9 12
4 Agriculture, veterinary, health and welfare
17 18
5 Services (e.g. hairdressing, fitness)
14 17
TOTAL 100 100 N. 26,552 30,423
Source: DES enrolments data and CSO population data
TABLE 2.4 UNEMPLOYMENT RATES, 2008 AND 2011
Year Unemployment rates (%)
2008 6.4
2011 14.6
Source: CSO QNHS
Table 2.5 provides a greater level of detail on courses with the largest
enrolments by broad course area in descending order for 2011–2012. For
instance, the largest number of enrolments were in early childhood care
and education, which would be categorised under ‘education, social
sciences, business, law’ (Number 2) in Table 2.3. These nine broad course
areas account for almost half of all enrolments during 2011–2012.19 This
gives us an indication of the composition of new (the inflow) labour supply
at the sub-degree level.
19 Due to CSO restrictions, we do not report the exact figures related to the calculations of the numbers
underpinning Table 2.6 and we are unable to report actual enrolment figures in Table 2.5.
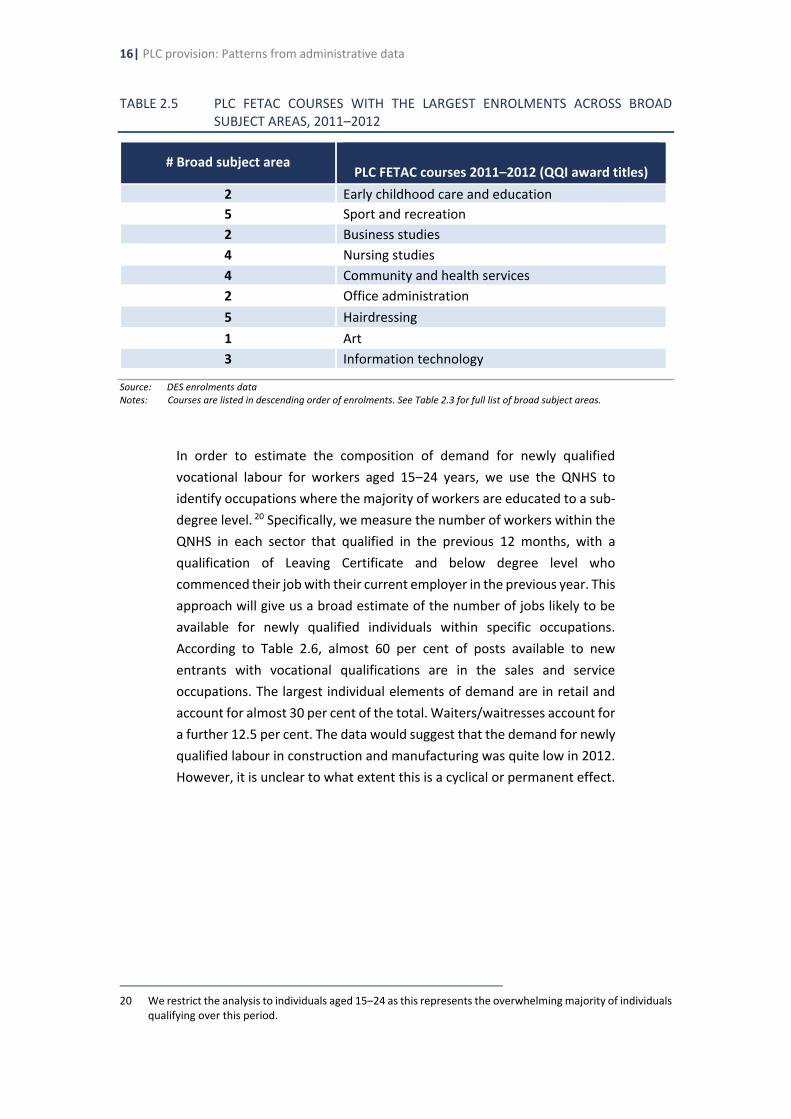
16| PLC provision: Patterns from administrative data
TABLE 2.5 PLC FETAC COURSES WITH THE LARGEST ENROLMENTS ACROSS BROAD SUBJECT AREAS, 2011–2012
# Broad subject area
PLC FETAC courses 2011–2012 (QQI award titles)
2 Early childhood care and education
5 Sport and recreation
2 Business studies
4 Nursing studies
4 Community and health services
2 Office administration
5 Hairdressing
1 Art
3 Information technology
Source: DES enrolments data Notes: Courses are listed in descending order of enrolments. See Table 2.3 for full list of broad subject areas.
In order to estimate the composition of demand for newly qualified
vocational labour for workers aged 15–24 years, we use the QNHS to
identify occupations where the majority of workers are educated to a sub-
degree level. 20 Specifically, we measure the number of workers within the
QNHS in each sector that qualified in the previous 12 months, with a
qualification of Leaving Certificate and below degree level who
commenced their job with their current employer in the previous year. This
approach will give us a broad estimate of the number of jobs likely to be
available for newly qualified individuals within specific occupations.
According to Table 2.6, almost 60 per cent of posts available to new
entrants with vocational qualifications are in the sales and service
occupations. The largest individual elements of demand are in retail and
account for almost 30 per cent of the total. Waiters/waitresses account for
a further 12.5 per cent. The data would suggest that the demand for newly
qualified labour in construction and manufacturing was quite low in 2012.
However, it is unclear to what extent this is a cyclical or permanent effect.
20 We restrict the analysis to individuals aged 15–24 as this represents the overwhelming majority of individuals
qualifying over this period.

Evaluation of PLC programme provision |17
TABLE 2.6 QNHS SUB-DEGREE OCCUPATIONS
Detailed occupation %
Sales and retail assistants, cashiers and checkout operators 28.9
Waiters and waitresses 12.5
Childminders and related occupations 5.7
Bar staff 5.3
Hairdressers, barbers, beauticians and related occupations 3.6
Cleaners and domestics 3.6
Kitchen and catering assistants 2.3
Care workers and home carers 2.2
Fishing and other elementary agriculture occupations 1.8
Elementary storage occupations 1.6
Food, drink and tobacco process operatives 1.6
Air travel assistants 1.4
Shelf fillers 1.3
Metal working production and maintenance fitters 1.3
Farmers 1.3
Other administrative occupations 1.3
Leisure and theme park attendants 1.2
Plumbers and heating and ventilating engineers 1.1
Electricians and electrical fitters 1.1
Elementary construction occupations 1.1
Receptionists 1.0
Construction operatives (NEC) 1.0
Housekeepers and related occupations 0.9
Sheet metal workers 0.8
IT user support technicians 0.7
Vehicle technicians, mechanics and electricians 0.7
Other (see Table A1 in Appendix A) 14.8
Total 100.0
Source: QNHS, 2012 Q2 microdata (CSO) Note: Individuals aged 15–24 who qualified in the last year (2011–2012) with a Leaving Certificate or PLC
qualification, and who commenced their job with their current employer in the last year (2011 or 2012). NEC = Not elsewhere classified.
In Table 2.7, we map the number of places in the largest components of
PLC provision that have a direct labour market orientation and limited
progression component at individual course level, against the estimated
number of jobs among young people in occupations specific to these
categories.21 The results clearly indicate that the annual enrolment levels
greatly exceed the number of jobs likely to be available for completers,
21 Based on the QNHS using the same approach as Table 2.6.

18| PLC provision: Patterns from administrative data
both in each given area and in any one year. For instance, the ratio of
places to jobs in hairdressing is estimated to be 2.1 rising to 3.9 for
community and health services and 4.0 for early childhood care and
education. This provides further evidence that, generally, the sector is
poorly connected to labour market needs, and that much more needs to
be done to ensure that course provision is both reflective of and
responsive to labour demand, specifically for newly qualified vocational
labour.
TABLE 2.7 SOME EXAMPLES OF MAPPING DES ENROLMENTS (SUPPLY) WITH QNHS DATA (DEMAND) FOR COURSES WITH LIMITED PROGRESSION COMPONENTS
# PLC FETAC courses
(QQI award titles)
Estimated ratio of
enrolments
to QNHS jobs
2 Early childhood care and education 4.0
4 Community and health services 3.9
5 Hairdressing 2.1
Source: QNHS 2012, Q2 Note: QNHS occupations used for matching: childminders and related occupations, nursery nurses and
assistants and play workers; care workers and home carers, nursing auxiliaries and assistants; hairdressers, barbers, beauticians and related occupations.
2.3 SUMMARY AND CONCLUSIONS
The analysis of the administrative data indicates a substantial amount of
heterogeneity in the regional distribution of PLC places. Furthermore, the
provision by county is not consistently linked to the population or
estimated demand for places. There is considerable variation across
counties in the ratio of enrolments to the total population and there is no
evidence of a relationship between the concentration of PLC places and
county-level deprivation levels. The central goals of PLC provision include
transitions to employment and vocational preparation for young people.
Given this, we might expect PLC programmes to be targeted towards
younger people who have a greater need for supports. Thus, the evidence
is potentially worrying from a policy perspective as it demonstrates that
young people from disadvantaged regions, who have the highest risk of
unemployment, do not have greater access to PLC programmes than those
in more advantaged areas. Additionally, despite considerable economic
changes, there was little change over the time period (between 2008–2009
and 2011–2012) in the concentration of PLC provision across broad subject
areas. The enrolments data suggest that the distribution of PLC places
tends to be driven by legacy issues: places exist in areas where they have
always existed, rather than because of strategic planning. With respect to
PLC provision directly linked to particular jobs and occupations, there is

Evaluation of PLC programme provision |19
evidence of substantial levels of oversupply in some areas. Consequently,
there is little evidence that the number of places and composition of
provision is reactive to changing labour market conditions.

20|Evidence from survey of principals
CHAPTER 3
Evidence from survey of principals: Resources, objectives and
outcomes
3.1 INTRODUCTION
This chapter discusses the results arising from the survey of PLC principals,
which collected information on a range of issues including structure, size,
and composition of PLC colleges; the perceived role of PLC programmes;
resources available for PLC provision; and progression patterns.22 The
survey of principals provides insights into the factors driving provision and
how work-related learning is embedded into the different courses. The
survey was conducted between September 2015 and February 2016, and
was issued to all principals: 156 in total, of whom 110 responses were
received, a survey response rate of 70 per cent. Non-reponses were higher
among the smaller schools and college providers. We estimate that the PLC
providers who did respond account for over 80 per cent of student
enrolments during 2014–2015.23
PLC principals view provision as fulfilling a range of roles, with labour
market, lifelong learning, progression to higher education and social
inclusion all appearing to have equal weight. Decisions around course
provision and closure tend to be heavily driven by student demand, with
less weight given to employer requirements, government objectives or
national forecasting. The distribution of teacher qualifications maps
relatively closely to the aggregate enrolments data, according to which 52
per were in the arts and social sciences, 12 per cent were in STEM, 17 per
cent were in services and 18 per cent were in agriculture. Differences that
do exist between the distribution of teacher qualifications and that of
student enrolments may be explained by differences in class size. Finally,
multivariate analysis reveals that the strategic direction adopted by
colleges, particularly regarding the balance between employment and
higher education-focused courses, were strongly associated with patterns
of first destinations among learners; and progression rates to higher
22 A complete version of the questionnaire is included in Appendix E. 23 The data from the survey of principals were re-weighted based on the index variable, including: size (smallest
30%, middle 40%, largest 30%) in terms of total QQI enrolees (as per data from SOLAS); region (Dublin, BMW, elsewhere); and whether any non-QQI courses are provided (as per data from SOLAS). Six cases were not on the database from SOLAS, so for the purpose of weights calculation, we treated them as small providers with no non-QQI enrolees.
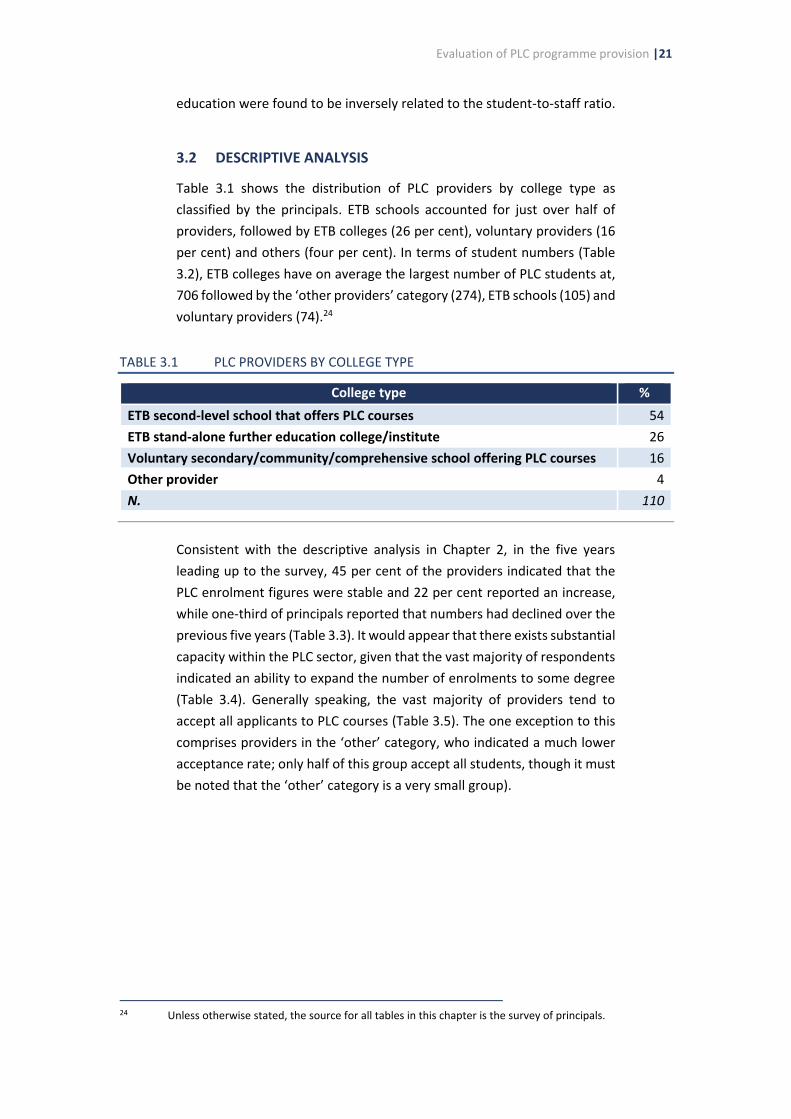
Evaluation of PLC programme provision |21
education were found to be inversely related to the student-to-staff ratio.
3.2 DESCRIPTIVE ANALYSIS
Table 3.1 shows the distribution of PLC providers by college type as
classified by the principals. ETB schools accounted for just over half of
providers, followed by ETB colleges (26 per cent), voluntary providers (16
per cent) and others (four per cent). In terms of student numbers (Table
3.2), ETB colleges have on average the largest number of PLC students at,
706 followed by the ‘other providers’ category (274), ETB schools (105) and
voluntary providers (74).24
TABLE 3.1 PLC PROVIDERS BY COLLEGE TYPE
College type %
ETB second-level school that offers PLC courses 54
ETB stand-alone further education college/institute 26
Voluntary secondary/community/comprehensive school offering PLC courses 16
Other provider 4
N. 110
Consistent with the descriptive analysis in Chapter 2, in the five years
leading up to the survey, 45 per cent of the providers indicated that the
PLC enrolment figures were stable and 22 per cent reported an increase,
while one-third of principals reported that numbers had declined over the
previous five years (Table 3.3). It would appear that there exists substantial
capacity within the PLC sector, given that the vast majority of respondents
indicated an ability to expand the number of enrolments to some degree
(Table 3.4). Generally speaking, the vast majority of providers tend to
accept all applicants to PLC courses (Table 3.5). The one exception to this
comprises providers in the ‘other’ category, who indicated a much lower
acceptance rate; only half of this group accept all students, though it must
be noted that the ‘other’ category is a very small group).
24 Unless otherwise stated, the source for all tables in this chapter is the survey of principals.
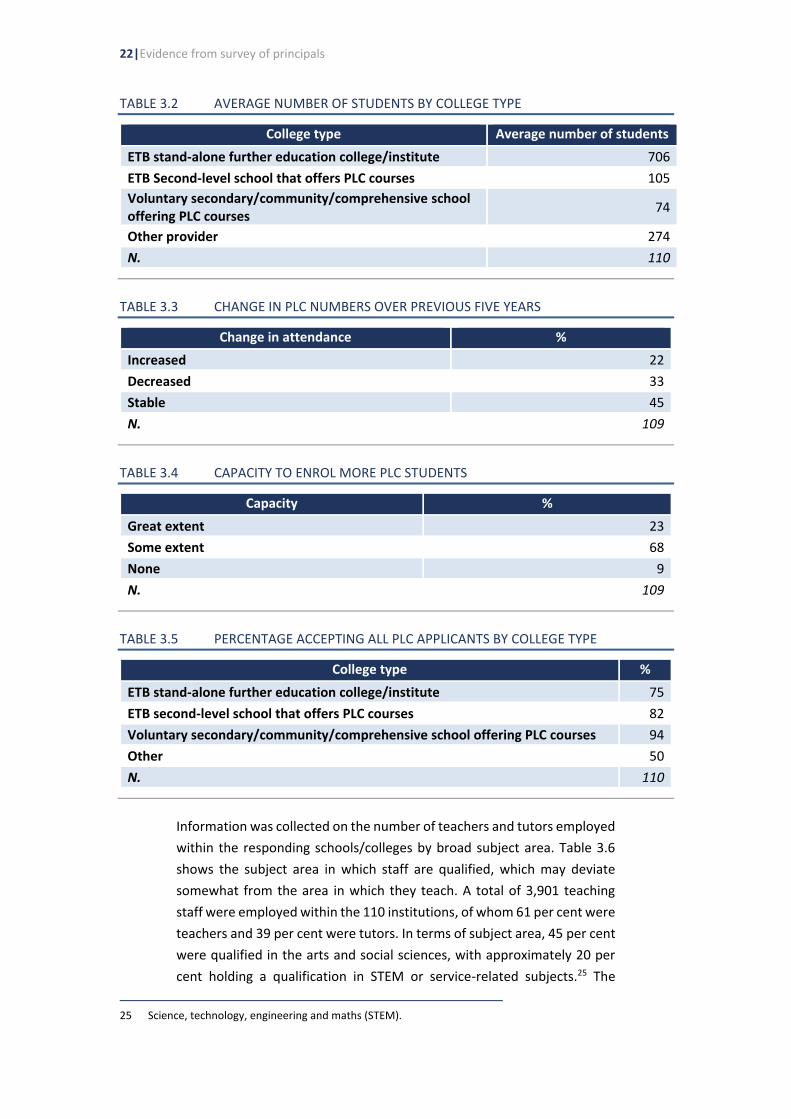
22|Evidence from survey of principals
TABLE 3.2 AVERAGE NUMBER OF STUDENTS BY COLLEGE TYPE
College type Average number of students
ETB stand-alone further education college/institute 706
ETB Second-level school that offers PLC courses 105
Voluntary secondary/community/comprehensive school offering PLC courses
74
Other provider 274
N. 110
TABLE 3.3 CHANGE IN PLC NUMBERS OVER PREVIOUS FIVE YEARS
Change in attendance %
Increased 22
Decreased 33
Stable 45
N. 109
TABLE 3.4 CAPACITY TO ENROL MORE PLC STUDENTS
Capacity %
Great extent 23
Some extent 68
None 9
N. 109
TABLE 3.5 PERCENTAGE ACCEPTING ALL PLC APPLICANTS BY COLLEGE TYPE
College type %
ETB stand-alone further education college/institute 75
ETB second-level school that offers PLC courses 82
Voluntary secondary/community/comprehensive school offering PLC courses 94
Other 50
N. 110
Information was collected on the number of teachers and tutors employed
within the responding schools/colleges by broad subject area. Table 3.6
shows the subject area in which staff are qualified, which may deviate
somewhat from the area in which they teach. A total of 3,901 teaching
staff were employed within the 110 institutions, of whom 61 per cent were
teachers and 39 per cent were tutors. In terms of subject area, 45 per cent
were qualified in the arts and social sciences, with approximately 20 per
cent holding a qualification in STEM or service-related subjects.25 The
25 Science, technology, engineering and maths (STEM).
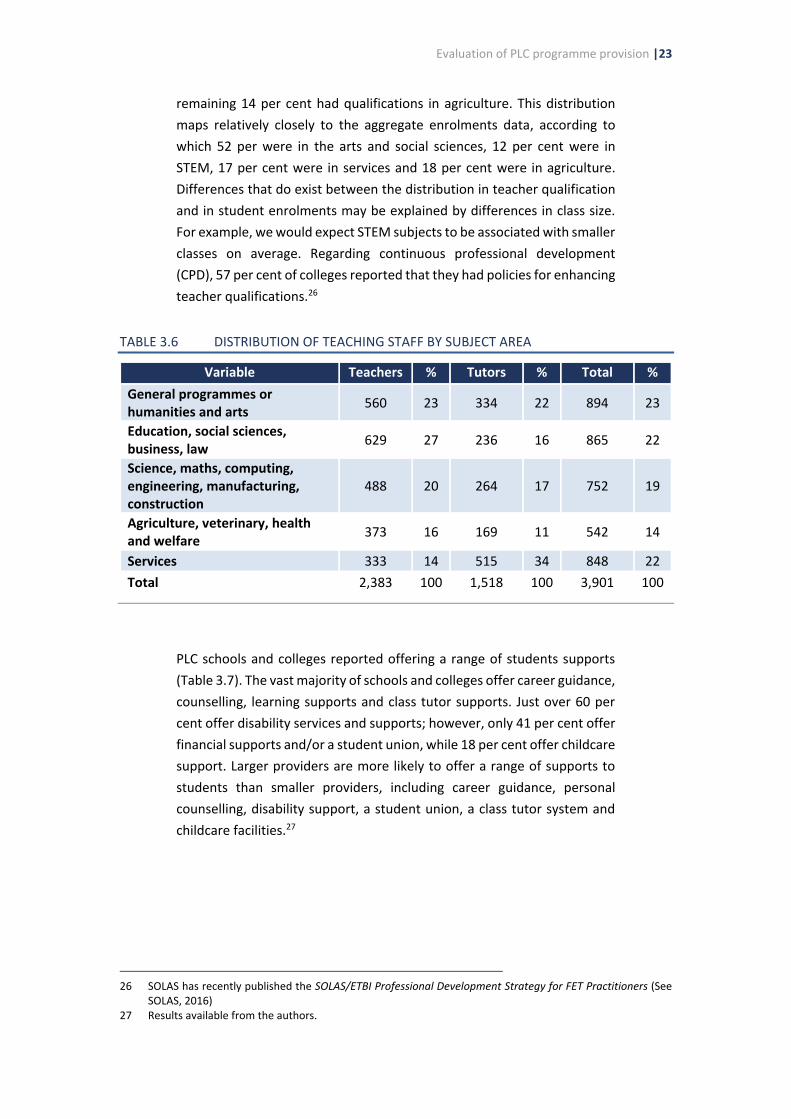
Evaluation of PLC programme provision |23
remaining 14 per cent had qualifications in agriculture. This distribution
maps relatively closely to the aggregate enrolments data, according to
which 52 per were in the arts and social sciences, 12 per cent were in
STEM, 17 per cent were in services and 18 per cent were in agriculture.
Differences that do exist between the distribution in teacher qualification
and in student enrolments may be explained by differences in class size.
For example, we would expect STEM subjects to be associated with smaller
classes on average. Regarding continuous professional development
(CPD), 57 per cent of colleges reported that they had policies for enhancing
teacher qualifications.26
TABLE 3.6 DISTRIBUTION OF TEACHING STAFF BY SUBJECT AREA
Variable Teachers % Tutors % Total %
General programmes or humanities and arts
560 23 334 22 894 23
Education, social sciences, business, law
629 27 236 16 865 22
Science, maths, computing, engineering, manufacturing, construction
488 20 264 17 752 19
Agriculture, veterinary, health and welfare
373 16 169 11 542 14
Services 333 14 515 34 848 22
Total 2,383 100 1,518 100 3,901 100
PLC schools and colleges reported offering a range of students supports
(Table 3.7). The vast majority of schools and colleges offer career guidance,
counselling, learning supports and class tutor supports. Just over 60 per
cent offer disability services and supports; however, only 41 per cent offer
financial supports and/or a student union, while 18 per cent offer childcare
support. Larger providers are more likely to offer a range of supports to
students than smaller providers, including career guidance, personal
counselling, disability support, a student union, a class tutor system and
childcare facilities.27
26 SOLAS has recently published the SOLAS/ETBI Professional Development Strategy for FET Practitioners (See
SOLAS, 2016) 27 Results available from the authors.
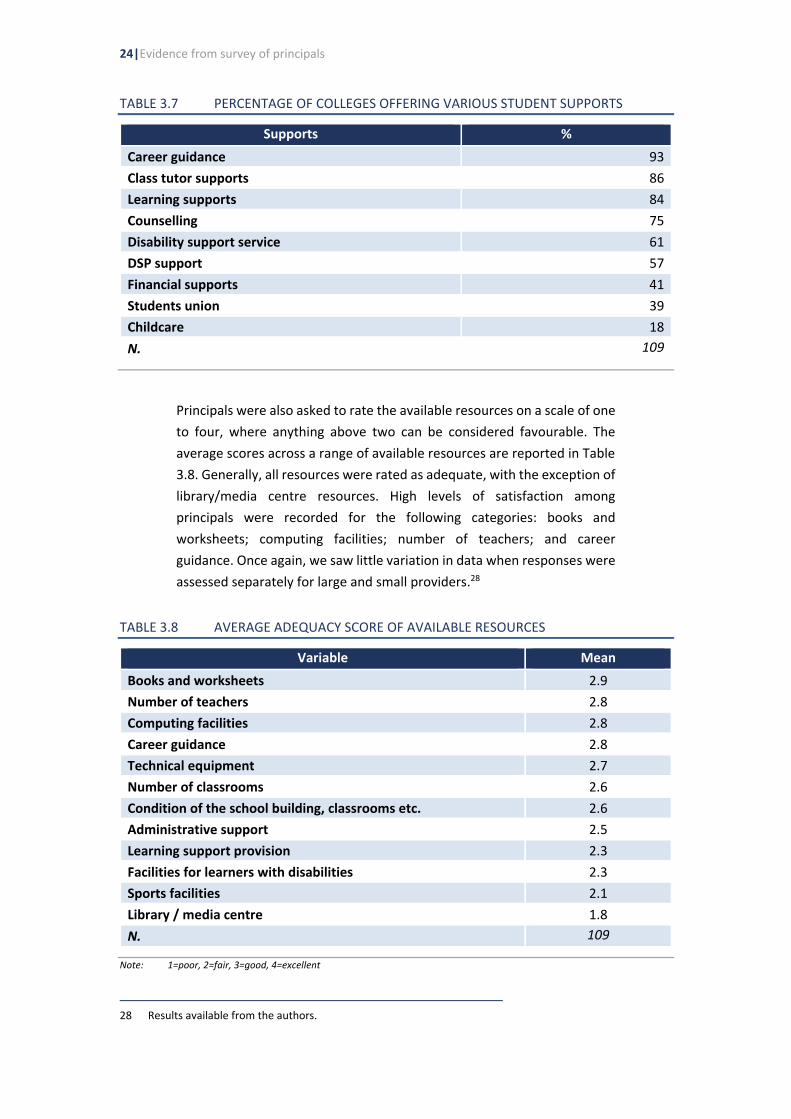
24|Evidence from survey of principals
TABLE 3.7 PERCENTAGE OF COLLEGES OFFERING VARIOUS STUDENT SUPPORTS
Supports %
Career guidance 93
Class tutor supports 86
Learning supports 84
Counselling 75
Disability support service 61
DSP support 57
Financial supports 41
Students union 39
Childcare 18
N. 109
Principals were also asked to rate the available resources on a scale of one
to four, where anything above two can be considered favourable. The
average scores across a range of available resources are reported in Table
3.8. Generally, all resources were rated as adequate, with the exception of
library/media centre resources. High levels of satisfaction among
principals were recorded for the following categories: books and
worksheets; computing facilities; number of teachers; and career
guidance. Once again, we saw little variation in data when responses were
assessed separately for large and small providers.28
TABLE 3.8 AVERAGE ADEQUACY SCORE OF AVAILABLE RESOURCES
Variable Mean
Books and worksheets 2.9
Number of teachers 2.8
Computing facilities 2.8
Career guidance 2.8
Technical equipment 2.7
Number of classrooms 2.6
Condition of the school building, classrooms etc. 2.6
Administrative support 2.5
Learning support provision 2.3
Facilities for learners with disabilities 2.3
Sports facilities 2.1
Library / media centre 1.8
N. 109
Note: 1=poor, 2=fair, 3=good, 4=excellent
28 Results available from the authors.
Evaluation of PLC programme provision |25
Regarding work placements, the level of contact with local employers was
variable, with just under 50 per cent of principals indicating that staff met
with local employers up to once a year, while the remaining 50 per cent
reported more than three meetings per year (Table 3.9). Principals
indicated that work experience and job placements were discussed at the
vast majority of meetings with employers. Consistent with the evidence
from the learners survey (see Chapter 4), work experience does not appear
to be a universal feature of PLC provision, given that 77 per cent of
principals indicated that all learners took part in work experience (Table
3.10). In terms of duration, approximately 40 per cent of principals
indicated that work experience placements typically lasted up to ten days,
with a further 37 per cent reporting an average duration of 11–20 days
(Table 3.11). Perceptions varied regarding the level of difficulty in
achieving work placements, with respondents relatively equally split
between those describing the process as ‘easy’ and ‘quite difficult’ (Table
3.12). In just under two-thirds of cases, students found their own work
placements, with course co-ordinators responsible for organising just
under one-quarter of placements (Table 3.13). In almost all cases, the
principals stated that the employer was asked for feedback on the learner,
with over 90 per cent of respondents also indicating that learners were
assessed on the basis of their placements.29 With regard to the structure
and relevance of placements, almost 87 per cent of principals indicated
that PLC leaners received relevant work experience, with approximately
one half organised on a day release basis and one half on a block release
basis (Table 3.14).30 While 56 per cent of principals indicated that students
were able to practice skills learned on the programme during work
experience to ‘a great extent’, a further 40 per cent indicated that students
had opportunities to practice skills only to ‘some extent’. Finally, just under
two-thirds of principals reported that students obtained employment
through work experience ‘to some extent’, with a further 13 per cent
indicating that students found employment in work experience companies
to ‘a great extent’.31
29 Results available from the authors. 30 Principals were asked what percentage of thir PLC learners do relevant work experience as part of their
course and so the figures reported in the table are the average responses across Principals. 31 Results available from the authors.
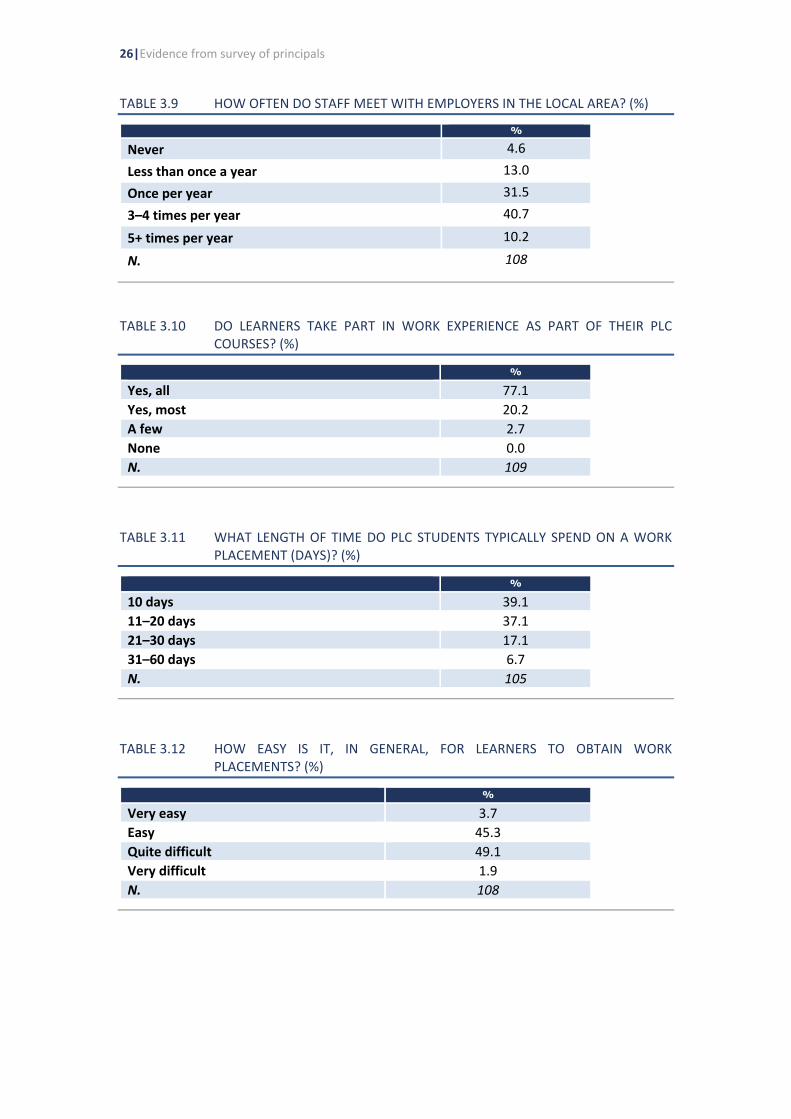
26|Evidence from survey of principals
TABLE 3.9 HOW OFTEN DO STAFF MEET WITH EMPLOYERS IN THE LOCAL AREA? (%)
%
Never 4.6
Less than once a year 13.0
Once per year 31.5
3–4 times per year 40.7
5+ times per year 10.2
N. 108
TABLE 3.10 DO LEARNERS TAKE PART IN WORK EXPERIENCE AS PART OF THEIR PLC COURSES? (%)
%
Yes, all 77.1
Yes, most 20.2
A few 2.7
None 0.0
N. 109
TABLE 3.11 WHAT LENGTH OF TIME DO PLC STUDENTS TYPICALLY SPEND ON A WORK PLACEMENT (DAYS)? (%)
%
10 days 39.1
11–20 days 37.1
21–30 days 17.1
31–60 days 6.7
N. 105
TABLE 3.12 HOW EASY IS IT, IN GENERAL, FOR LEARNERS TO OBTAIN WORK PLACEMENTS? (%)
%
Very easy 3.7
Easy 45.3
Quite difficult 49.1
Very difficult 1.9
N. 108

Evaluation of PLC programme provision |27
TABLE 3.13 WHO MAINLY ORGANISES THE WORK EXPERIENCE PLACEMENT? (%)
%
The student 63.3
The course coordinator 22.9
Someone else in the college/school 2.8
Other 11.0
N. 109
TABLE 3.14 WHAT PERCENTAGE OF YOUR PLC LEARNERS ... ? (%)
%
Get relevant work experience as part of their course
86.9
Do work experience organised on a block basis 55.0
Do work experience organised on a day release basis
51.8
N. 102
Principals were asked to detail the level and nature of available supports
for staff training and development. Table 3.15 shows that a range of
support systems were adopted in the majority of colleges; however, the
most common forms of assistance, adopted by over 80 per cent of colleges,
took the form of either professional development organised through the
ETB network or the direct provision of training. In addition, over 70 per
cent of principals also reported that staff pursuing additional training had
either their fees paid or refunded by the college. Training places were
relatively proportionately distributed across subject areas, with principals
indicating that 35 per cent of teaching staff underwent CPD during 2014–
2015 through short duration (e.g. one day) courses and 14 per cent
underwent extended training (e.g. leading to a qualification) in the same
year.32
32 Results available from the authors.
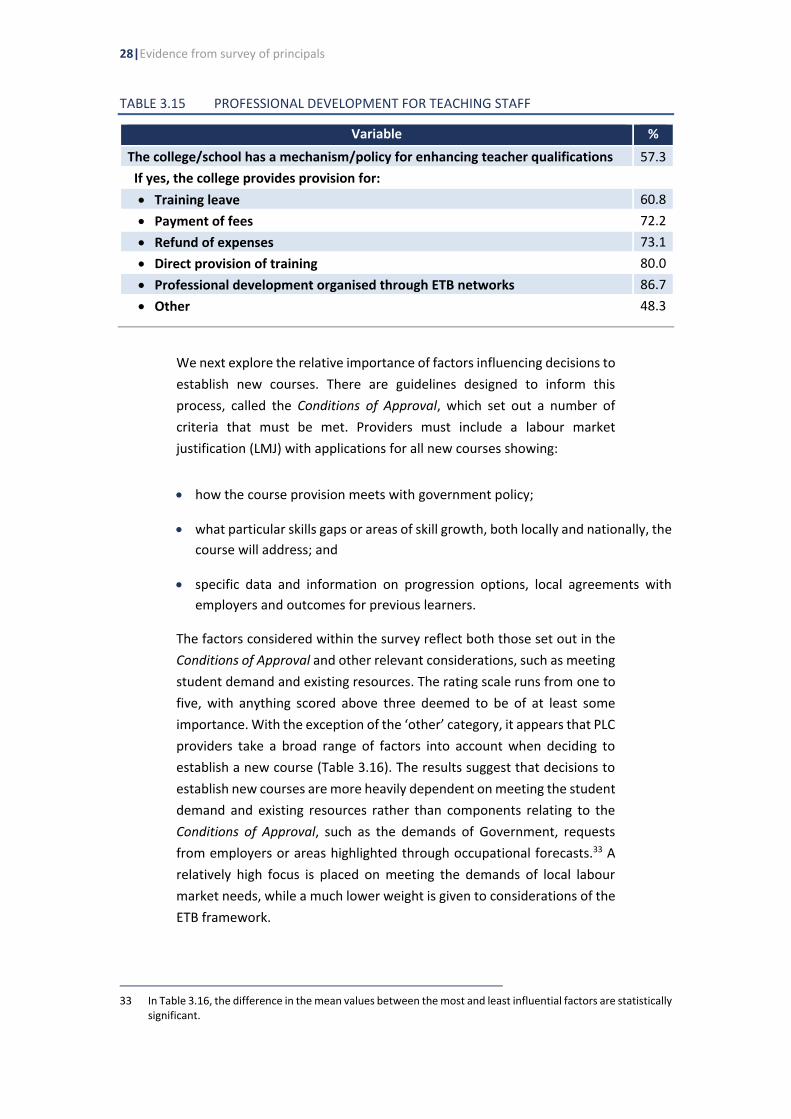
28|Evidence from survey of principals
TABLE 3.15 PROFESSIONAL DEVELOPMENT FOR TEACHING STAFF
Variable %
The college/school has a mechanism/policy for enhancing teacher qualifications 57.3
If yes, the college provides provision for:
• Training leave 60.8
• Payment of fees 72.2
• Refund of expenses 73.1
• Direct provision of training 80.0
• Professional development organised through ETB networks 86.7
• Other 48.3
We next explore the relative importance of factors influencing decisions to
establish new courses. There are guidelines designed to inform this
process, called the Conditions of Approval, which set out a number of
criteria that must be met. Providers must include a labour market
justification (LMJ) with applications for all new courses showing:
• how the course provision meets with government policy;
• what particular skills gaps or areas of skill growth, both locally and nationally, the
course will address; and
• specific data and information on progression options, local agreements with
employers and outcomes for previous learners.
The factors considered within the survey reflect both those set out in the
Conditions of Approval and other relevant considerations, such as meeting
student demand and existing resources. The rating scale runs from one to
five, with anything scored above three deemed to be of at least some
importance. With the exception of the ‘other’ category, it appears that PLC
providers take a broad range of factors into account when deciding to
establish a new course (Table 3.16). The results suggest that decisions to
establish new courses are more heavily dependent on meeting the student
demand and existing resources rather than components relating to the
Conditions of Approval, such as the demands of Government, requests
from employers or areas highlighted through occupational forecasts.33 A
relatively high focus is placed on meeting the demands of local labour
market needs, while a much lower weight is given to considerations of the
ETB framework.
33 In Table 3.16, the difference in the mean values between the most and least influential factors are statistically
significant.
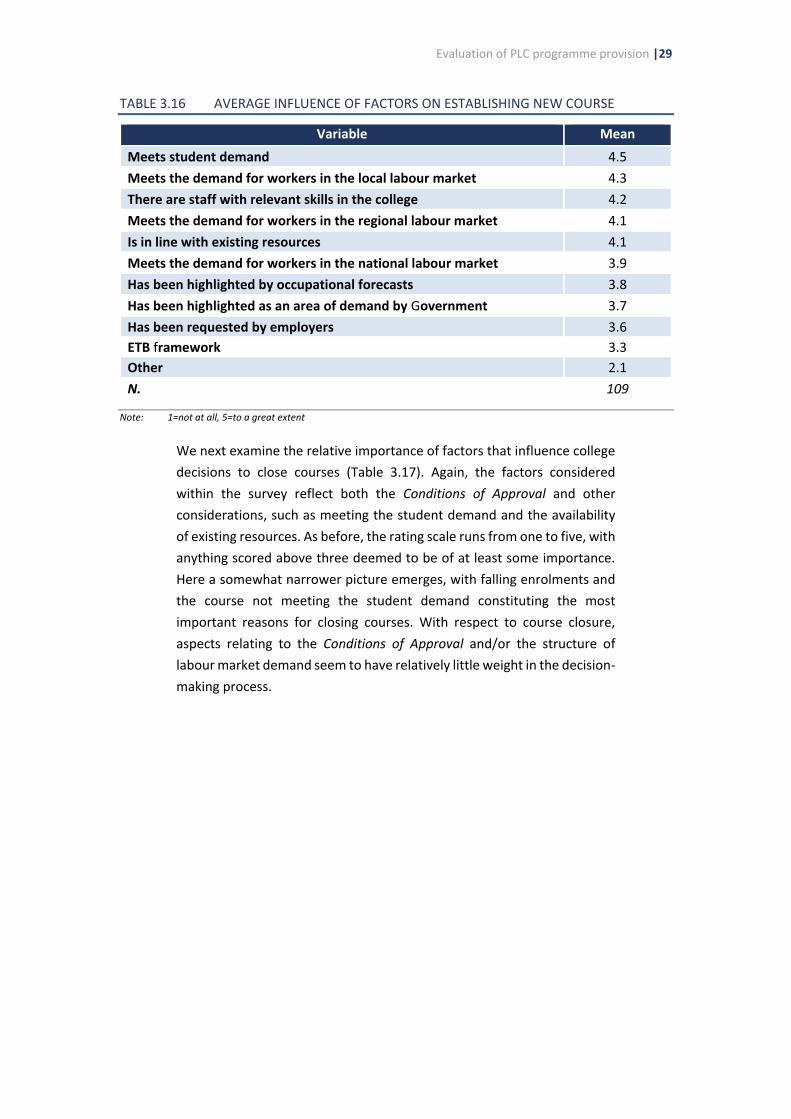
Evaluation of PLC programme provision |29
TABLE 3.16 AVERAGE INFLUENCE OF FACTORS ON ESTABLISHING NEW COURSE
Variable Mean
Meets student demand 4.5
Meets the demand for workers in the local labour market 4.3
There are staff with relevant skills in the college 4.2
Meets the demand for workers in the regional labour market 4.1
Is in line with existing resources 4.1
Meets the demand for workers in the national labour market 3.9
Has been highlighted by occupational forecasts 3.8
Has been highlighted as an area of demand by Government 3.7
Has been requested by employers 3.6
ETB framework 3.3
Other 2.1
N. 109
Note: 1=not at all, 5=to a great extent
We next examine the relative importance of factors that influence college
decisions to close courses (Table 3.17). Again, the factors considered
within the survey reflect both the Conditions of Approval and other
considerations, such as meeting the student demand and the availability
of existing resources. As before, the rating scale runs from one to five, with
anything scored above three deemed to be of at least some importance.
Here a somewhat narrower picture emerges, with falling enrolments and
the course not meeting the student demand constituting the most
important reasons for closing courses. With respect to course closure,
aspects relating to the Conditions of Approval and/or the structure of
labour market demand seem to have relatively little weight in the decision-
making process.

30|Evidence from survey of principals
TABLE 3.17 AVERAGE INFLUENCE OF FACTORS ON CLOSING COURSES
Variable Mean
Falling enrolments/undersubscribed 4.3
Course does not meet student demand 4.0
Course does not meet local labour market demand 3.5
Course not in line with existing resources 3.4
Oversupply of similar courses in adjacent colleges 3.4
Course does not meet regional labour market demand 3.3
The course does not meet national labour market demand 3.1
There are no staff with relevant skills in the college 2.9
Not highlighted as an area of demand by forecasts 2.9
Course has not been requested by employers 2.8
Not highlighted as an area of demand by Government 2.8
ETB framework 2.8
Other 1.9
N. 109
Note: 1=not at all, 5=to a great extent
In summary, decisions around course provision are most heavily related to
meeting student demand and available teaching resources rather than
responding to strategic need, whether that is related to local, regional or
national labour market factors, or government policy. This evidence from
the survey of PLC principals supports the finding from the administrative
data in Chapter 2, which also indicates a lack of responsiveness in the
sector to changing labour market needs.
It is clear that principals consider a range of factors in decisions relating to
the structuring of PLC provision. For both administrative and historical
reasons, PLC provision has been considered to fill a number of societal
roles. While the Conditions of Approval place a heavy emphasis on the
labour market aspect, PLCs are also acknowledged for their role in
facilitating progression to further and higher education, as well as
enhancing social inclusion and lifelong learning. This lack of clarity is
reflected in principals’ rating of the relative purpose of PLC courses (Table
3.18): all six options were rated with a relatively equal and high ranking,
with enabling progression to higher education given a marginally higher
ranking than other categories, while providing learners with a general
education was given a slightly lower ranking.
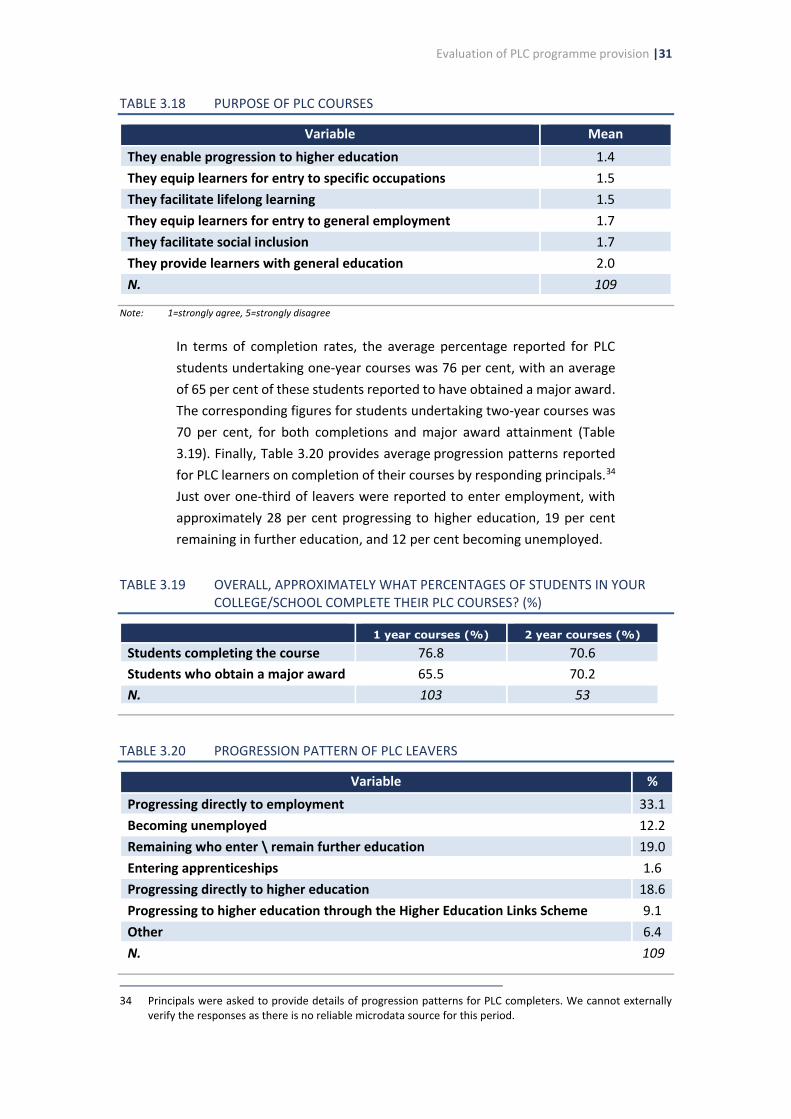
Evaluation of PLC programme provision |31
TABLE 3.18 PURPOSE OF PLC COURSES
Variable Mean
They enable progression to higher education 1.4
They equip learners for entry to specific occupations 1.5
They facilitate lifelong learning 1.5
They equip learners for entry to general employment 1.7
They facilitate social inclusion 1.7
They provide learners with general education 2.0
N. 109
Note: 1=strongly agree, 5=strongly disagree
In terms of completion rates, the average percentage reported for PLC
students undertaking one-year courses was 76 per cent, with an average
of 65 per cent of these students reported to have obtained a major award.
The corresponding figures for students undertaking two-year courses was
70 per cent, for both completions and major award attainment (Table
3.19). Finally, Table 3.20 provides average progression patterns reported
for PLC learners on completion of their courses by responding principals.34
Just over one-third of leavers were reported to enter employment, with
approximately 28 per cent progressing to higher education, 19 per cent
remaining in further education, and 12 per cent becoming unemployed.
TABLE 3.19 OVERALL, APPROXIMATELY WHAT PERCENTAGES OF STUDENTS IN YOUR COLLEGE/SCHOOL COMPLETE THEIR PLC COURSES? (%)
1 year courses (%) 2 year courses (%)
Students completing the course 76.8 70.6
Students who obtain a major award 65.5 70.2
N. 103 53
TABLE 3.20 PROGRESSION PATTERN OF PLC LEAVERS
Variable %
Progressing directly to employment 33.1
Becoming unemployed 12.2
Remaining who enter \ remain further education 19.0
Entering apprenticeships 1.6
Progressing directly to higher education 18.6
Progressing to higher education through the Higher Education Links Scheme 9.1
Other 6.4
N. 109
34 Principals were asked to provide details of progression patterns for PLC completers. We cannot externally
verify the responses as there is no reliable microdata source for this period.

32|Evidence from survey of principals
3.3 ECONOMETRIC ANALYSIS
In this section, we explore principals’ decision-making processes regarding
provision. In order to determine the extent to which reported rates of
progression vary with provider characteristics, we undertook multivariate
analysis, the results of which are reported in Table 3.21. We estimate
separate models for education progression and for employment. Later in
the report (Chapter 4), we look at objective measures of individual
outcomes. We estimate ordinary least squares (OLS) regressions, where
the dependent variables are: progression rates to employment;
unemployment; further education; apprenticeship; higher education; and
higher education links.35 The explanatory variables include: the number of
enrolments; composition of staff by subject area; course provision; the
ratio of teaching staff to students; college capacity; and factors
determining course creation and closure. Given that there was a large
number of potential explanatory variables, the small sample size created a
‘degrees of freedom’ problem, meaning that it was not feasible to include
all potential explanatory variables in a single regression. Consequently,
while key controls relating to provider size, staffing and course
composition were included in all specifications, a more experimental
approach was taken with regard to the relative importance of factors
relating to course closure and creation.36
The final models are reported in Table 3.21. There was not a huge amount
of variation in the data and statistically significant models could only be
generated for employment and higher education, suggesting that
progression rates to unemployment, further education, apprenticeship
and higher education links are largely independent of provider
characteristics. With respect to employment, the model indicates that
higher progression rates tend to be associated with providers who tend to
follow the ETB framework regarding decisions to close courses, indicating
the potential importance of responding to strategic decisions at an ETB
level. Higher levels of employment progression are also associated with a
higher (lower) share of employment-focused (progression) courses,
35 From a technical perspectivethe use of a fractional logit model may provide more accurate results; however,
the dependant variable has very few observations close to zero or 100 per cent. Fractional logit models were run as part of a sensitivity analysis and no significant changes were found.
36 This involved testing specifications with a number of combinations of the course closure and creation variables in order to detect important underlying relationships.

Evaluation of PLC programme provision |33
suggesting that some trade-off exists between the emphasis on
employment and progression in colleges, which directly impacts on
student outcomes. Colleges with higher levels of employment progression
also reported higher levels of satisfaction regarding the progression
patterns of PLC leavers, suggesting that employment progression is still
perceived as a key indicator of success among principals. Finally,
employment progression rates were higher among providers who
indicated that they were unlikely to close courses due to the existence of
similar provision in adjacent areas.37
TABLE 3.21 DESTINATION SHARE OF PLC LEAVERS
(1) (5)
VARIABLES Employment Higher education
Student-to-staff ratio -0.21 -0.81***
(0.363) (0.297)
Provider size 0–50 -6.05 -5.86
(6.166) (5.041)
Provider size 50–100 -11.24 -7.60
(7.042) (5.758)
Provider size 100–250 -2.18 -5.15
(6.339) (5.183)
Accept all students -0.24 -6.93*
(4.932) (4.033)
Share of teaching staff in arts 4.34 -6.60
(14.929) (12.207)
Share of teaching staff in social sciences 5.20 1.72
(15.163) (12.398)
Share of teaching staff in STEM 6.98 -1.22
(16.541) (13.525)
Share of teaching staff in agriculture -2.10 -11.19
(16.231) (13.272)
Higher education link, UK -6.06 2.77
(4.801) (3.926)
Satisfaction with patterns of progression 12.24** 4.40
(5.651) (4.621)
Percentage of Programmes with employment focus
0.25*** -0.13*
(0.080) (0.066)
Percentage of programmes with HE progression focus
-0.22*** 0.28***
(0.074) (0.060)
37 As mentioned in the text it was not possible to include all possible explanatory variables in the regressions.
Alternative specifications were run incorporating other variables such as whether the PLC school/college has all or most students doing work experience but no significant effects were found.

34|Evidence from survey of principals
TABLE 3.21 DESTINATION SHARE OF PLC LEAVERS (CONTD.)
(1) (5)
VARIABLES Employment Higher education
Percentage of programmes with personal development focus
-0.09 -0.10
(0.109) (0.089)
Percentage of programmes with social inclusion focus
0.01 0.00
(0.115) (0.094)
Closure of courses due to staffing issues 10.42* -12.08***
(5.289) (4.325)
Closure of courses due to adjacent colleges running similar
-14.01** -1.49
(5.453) (4.459)
Closure of courses due to ETB framework 20.67*** 4.70
(6.836) (5.589)
Constant 26.84* 28.36**
(14.502) (11.857)
Observations 105 105
R-squared 0.36 0.38
Notes: Standard errors in parentheses. *** p<0.01, ** p<0.05, * p<0.1
With regard to higher education progression, there was a significant
inverse relationship between rates of progression and the ratio of students
to teaching staff. Higher education progression was higher (lower) among
providers with a higher concentration of courses with a higher education
(employment) focus, again demonstrating the impact of strategic planning
on transition patterns. Higher education progression rates are lower where
all students are accepted onto courses, perhaps reflecting a trade-off
between a progression focus and an emphasis on social inclusion. Finally,
providers with higher progression rates in higher education were less likely
to indicate a tendency to close courses as a consequence of staff
constraints.
3.4 QUALITATIVE RESPONSES
3.4.1 Providers’ perspectives on the advantages of PLC provision
School principals were asked about the advantages of PLC provision in their
own college or school, as well as at a national level. Many of the benefits
cited related to both school and national level, and so responses to these
two questions have been analysed together. The most commonly-cited
advantage, mentioned by just under half (48 per cent) of providers, related
to the learner-centred nature of PLC provision, with small class sizes and

Evaluation of PLC programme provision |35
appropriate teaching methodologies facilitating student engagement:
Close personal attention, enhancing the learning experience and
the self-confidence of the student.
Courses are run in [a] student friendly environment where
teaching and learning are at the heart of what we do, a quality
professional and stimulating learning environment is promoted
and the values of respect, tolerance and integrity are encouraged.
A number of other advantages were each mentioned by around one-third
of providers. These included being responsive to the local community;
progression opportunities; inclusiveness; and the quality of staff. Provision
at the heart of the local community was seen as key to facilitating
educational participation among groups who might not otherwise access
such opportunities:
[The] organic development of PLC courses meant that they are
very much set locally and designed to meet needs of local
communities.
In local areas people can do nationally recognised QQI courses
without having to travel to big towns.
Courses provided to learners in their own locality so that they can
up-skill without the need to move to a main urban centre.
Local provision was also seen to facilitate links with, and respond to, local
employers:
Hands on, practical skills with good teamwork/collaboration.
Learners gain a lot of transferable skills for a much wider
employment range than their course.
One-third of providers mentioned the advantage of PLC provision in
providing progression opportunities to higher education and labour
market:
Courses equip students with the technical, social and educational
skills needed to succeed in the workplace or in higher education.
Taking a PLC course was seen as a way of easing the transition to higher
education for school leavers who might otherwise have struggled
adapting:
All students are not ready for higher education when they finish
second level. PLC is an excellent transition, learning how to learn,

36|Evidence from survey of principals
researching and writing assignments and projects as well as
developing communication skills.
Excellent stepping-stone which bridges the gap between second
level and third level. Prepares students very well for third level,
both in terms of content of programmes, and in helping students
to get into the habit of study.
Students who are too young to go to college the FETAC gives the
student a chance to gain a practical qualification.
Social inclusion was seen as a key feature of PLC provision, offering
‘second-chance’ education to adults and a pathway for young people with
very diverse backgrounds:
All of our courses are provided in a fully inclusive way. There are
no formal entry requirements, thus removing the barrier to access
that is the requirement to have the Leaving Certificate.
Give learners a second chance to do a course of study they have
the passion and aptitude for.
The way in which PLC provision catered for a very broad group of learners
at different life-cycle stages was seen as an advantage:
FE provision under the PLC programme is a highly visible, widely
understood and valued provision, providing very many
opportunities for a broad range of learners.
Great opportunity for those who mainstream education did not
suit to re-enter education. Alternative access route to third level.
Means of up-skilling for those who have been out of employment.
Staff quality was also mentioned by around one-third of providers, who
highlighted the commitment and skills of their teaching staff:
Staff [are] well qualified and work as a team.
One-fifth of providers specifically highlighted the way in which PLC
programmes could respond to the needs of local employers and contribute
to the local economy:
Links with industry to make courses relevant and enhance
employment prospects.
Providing a relative short duration vocational based education for
learners who are at a level 5 educational situation. Enhancing

Evaluation of PLC programme provision |37
standards in local services in healthcare and childcare. Providing
employers with skilled workers who have had experience.
Around one in six providers focused on the personal care and support
offered to students within PLC courses, which was seen as complementing
the learner-centred nature of educational provision:
Care given by the staff to the students, they often require a lot of
extra help in returning to education. Encouraging them to stay
and complete their courses.
Good pastoral care systems, students are mentored and
supported, confidence is built, they are nurtured and empowered
and better equipped when they then enter the higher education
sector.
Similarly, around one in six providers highlighted the nature of course
provision, both in relation to the variety of courses offered within the
sector and the existence of niche courses:
Many courses available in PLC colleges are not available in Higher
Education, such as hair dressing, beauty therapy, animal
grooming.
A small number of providers highlighted the high quality of their facilities
and their approach to assessment as the main advantages of PLC courses.
3.4.2 Principals’ perspectives on future challenges for PLC
provision
Principals were asked to identify future challenges for PLC provision in
their college or school, and at the broader national level. As before, many
of the benefits cited related to both school and national level, and so
responses to these two questions have been analysed together.
The most frequently mentioned challenge, mentioned by over half (52 per
cent) of principals, related to funding and resources. This covered a range
of issues, including the lack of funding overall, the lack of capital
investment, the approach to teacher allocation and the lack of CPD for
teachers.
Staffing allocation is very inadequate considering the varied and
diverse needs of the students. Cuts in Career Guidance provision is
impacting adversely on students.

38|Evidence from survey of principals
The reduction in teacher allocation and the loss of the Guidance
provision puts a strain on the timetable for students. Mental
health issues [have] been increasing consistently for students.
Lack of teaching and other resources. We have a lot of practical
/specialist courses that require constant updating and financing
for equipment.
Lack of resources, lack of finances to improve physical buildings,
lack of staff including support staff, administration, IT technicians
etc. Support for in-service training.
Facilities – need ‘common room’, library, large hall. Resources,
teaching personnel to meet guidance/support/learning support
needs, dedicated classrooms to teach particular courses, e.g.
kitchen.
Another commonly mentioned issue (41 per cent) related to the perceived
competition between principals resulting from duplication of courses
across the further and higher education sectors:
Competition from a myriad of other suppliers to the point where
it has become ridiculous.
The attraction of students is a major factor as ITs are now
enrolling everyone irrespective of their LC or LCA and thus is
attracting larger numbers. However a very high majority of these
students drop out in the first term.
This proliferation of places led to challenges in attracting students to PLC
courses, a situation that was further exacerbated by the improving
employment situation:
Decreasing numbers and competition from private providers. Also
the provision of courses on a 12-month basis in other settings.
Enrolment continues to be an issue – find it difficult to compete
with large stand-alone PLC colleges who can provide a lot more
supports for their learners.
Improving economic conditions luring students directly to
employment. Too many level 5 and 6 courses in ITs.
Over one-fifth of principals mentioned the challenges posed by the cap on
PLC places in developing provision and responding to local needs:
Cap on numbers prevented us from running other courses when
there was a demand.

Evaluation of PLC programme provision |39
Caps on numbers and teacher allocation often create a situation
where courses cannot be offered due to lack of teaching
staff/tutors. Department of Education and Skills does not allow us
to engage in the same level of flexibility that private providers
have.
Lack of places, and lack of funding. If we had more PLC places, we
could run, and fill, other employment and progression driven
programmes, which would address a skills gap which exists in the
[region].
A similar proportion (21 per cent) highlighted the ongoing challenge for the
sector of remaining responsive to changing employment conditions and
student needs:
Identifying and facilitating courses that meet a changing
landscape.
One in six pointed to the constraints posed by offering PLC courses within
an organisational structure designed for second-level education:
The management structure is all wrong in the FE college. It is the
same as the second-level school. This is not suitable for what is
more akin to a third-level college. This needs to change. We need
a fit-for-purpose management structure.
FE remains in second-level status which is totally unsuitable for
[the] sector.
Teachers on staff don’t always have skills needed to teach new
courses.
The main challenge is without doubt having to remain within [the]
second-level provision model. This system is by far the biggest
constraint on the FE Colleges.
One-tenth of principals pointed to the need for a national vision to drive
PLC provision and greater coherence within the sector:
Structural reform of the sector is happening at a slow pace. PLC
provision seems to be lost within the conversations surrounding
the FET sector.
[There is a need for a] [c]learly defined Government policy re
further education generally.
Principals highlighted a range of other challenges, including what they saw
as a growing tendency to centralise provision, the need for financial

40|Evidence from survey of principals
support for students, issues around accreditation and the administrative
burden placed on principals.
3.5 SUMMARY AND CONCLUSIONS
The evidence from the survey of principals shows that PLC provision is seen
to fulfil a range of roles, including progression to employment, higher
education, lifelong learning and social inclusion, with principals placing
relatively equal weight on each component. There was limited evidence
that factors related to the Conditions of Approval play a major role in
establishing new courses, with falling enrolments the key factor behind
course closures. Consistent with the evidence from the survey of learners
(see Chapter 4), work experience does not appear to be a universal feature
of PLC provision, with 77 per cent of principals indicating that all learners
took part in work experience. The most commonly cited advantage of PLC
provision, mentioned by just under half (48 per cent) of principals, related
to the learner-centred nature of PLC provision, where small class sizes and
appropriate teaching methodologies facilitated student engagement. The
most frequently mentioned challenge, mentioned by over half (52 per
cent) of principals, related to funding and resources. This category covers
a range of issues, including the lack of funding overall, the lack of capital
investment, the approach to teacher allocation and the lack of CPD for
teachers.

Evidence from survey of learners: Impacts of PLC|41
CHAPTER 4
Evidence from survey of learners: Measuring the impacts of
PLC provision
4.1 INTRODUCTION
This chapter provides a descriptive analysis of the profile of PLC
participants, including age, gender, previous educational attainment and
socio-economic background. It presents a comprehensive analysis of
learner outcomes, including multivariate estimates of the counterfactual
impact of PLC provision, relative to various comparison groups, on a
number of key outcomes, including employment, progression to higher
education and wages.38 In addition, this chapter examines key indicators
of the quality of employment, such as job satisfaction and mismatch.
The majority of PLC learners were female, on average six years older than
the Leaving Certificate group and less likely to come from higher socio-
economic groups. Somewhat surprisingly, only just over 70 per cent of PLC
learners reported undertaking work experience during their programmes.
Of PLC participants, 39 per cent stated that their main reason for
undertaking a PLC was to get a job immediately, with a similar percentage
reporting that their main objective was to progress to higher education.
Personal development was the key motivating factor for 20 per cent.
In terms of employment outcomes, the estimated counterfactual impact
of PLC provision shows that, by 2015, PLC participants were 16 per cent
more likely to be in employment relative to similar individuals who entered
the labour market directly on completion of their Leaving Certificate. The
employment effects are greater for PLC learners in more job-specific
programmes than general ones. The counterfactual impact reveals that
PLC learners are 27 per cent more likely to advance to higher education
relative to similar individuals who entered the labour market directly on
completion of their Leaving Certificate. The estimated counterfactual
impacts on various measures of job quality, such as job satisfaction or level
of skill match with the current job, showed no significant differences
between the PLC learners and similar individuals who entered the labour
market directly on completion of their Leaving Certificate.
38 The Learners Survey data allows us to examine short-run wage impacts. We supplement the analysis using
National Employment Survey (NES) data to examine longer run wage impacts.

42| Evaluation of PLC programme provision
4.2 SURVEY OF LEARNERS
The main evidence on the effectiveness and impact of PLC provision comes
from a comprehensive survey of learners.39 The objective of the survey was
to collect information on school leavers, including PLC leavers, that would
allow a sufficient time lag in order to enable the short-run effects of PLC
participation to be observed on labour market outcomes relative to a
control group and individuals following other educational pathways. The
survey samples were drawn from the Department of Education and Skills
(DES) Post-Primary Pupil Database (PPPDB), following a methodology
developed for the 2006 and 2007 school leavers surveys. The PPPDB lists
all pupils in the second-level system in Ireland, which covers the PLC sector
as well. For the purposes of the sample, a school (or PLC) leaver was
defined as someone who left full-time education in an official secondary,
vocational, community or comprehensive school in the course of the
previous academic year.
The research strategy was to complete a leavers’ survey with two groups:
Leaving Certificate leavers (who left their courses in 2009) and PLC leavers
(who left their courses in 2010). Leaving Certificate leavers include those
who studied for the Leaving Certificate Applied and the Leaving Certificate
Vocational Programme, as well as the established Leaving Certificate. The
sample was drawn with the assistance of the DES. Leaving Certificate
leavers were identified by finding students in the final year (sixth year) of
the Leaving Certificate Programme in 2009 (including the established
Leaving Certificate, LCA and LCVP) who were not in the PPPDB in 2010 (i.e.
not repeating the LC and not in a PLC programme). PLC leavers were
identified by finding those who were in a PLC programme in 2010 and not
in the PPPDB in 2011: they had left the PLC programme, either having
completed or before completing the PLC course.40
A multimode approach to the fieldwork was undertaken. Respondents
could complete the questionnaire online, by post, by telephone or through
a face-to-face interview. A proxy questionnaire was developed, with a
more limited subset of questions, which could be completed by a relative
39 A complete copy of the learner questionnaire is provided in Appendix D. 40 The ESRI selected a stratified random sample, with stratification based on gender, programme type (LC, LCVP,
LCA, PLC) and, for the PLC students, whether they were under or over age 25 years on leaving the programme. The sampling fraction differed by these stratification groups, with PLC leavers and LCA leavers oversampled.
Evidence from survey of learners: Impacts of PLC |43
if the original respondent was not available.41 The survey ran from
September 2015 to February 2016. In total, 4,730 questionnaires were
issued, with 1,220 successful responses. Of the 1,220 responses, 427 were
completed by proxy and these proxy responses were evenly distributed
across the Leaving Certificate and PLC categories.42 The survey response
rate was 26 per cent, reflecting difficulties experienced during the
fieldwork.43 This lower-than-expected response rate was attributable to a
number of factors including: migration; the length of time that had lapsed
since school completion; and inaccurate address information on the
register. Both the longer time lag between the date of leaving and the
survey and the economic climate in the intervening years, which raised the
rate of out-migration, contributed to a lower response rate than had been
typical of the school leavers surveys. For the present project, the time lag
between leaving the course and interview was seven years for the Leaving
Certificate leavers and six years for the PLC leavers. This meant that a
relatively high proportion of the addresses were no longer valid. In order
to ensure the representativeness of the data and thus enable our
subsequent analysis, the captured data were weighted on the basis of
gender, programme type and, for the PLC leavers, whether they were
under or over 25 years at the time of leaving.44
In addition to a wide range of questions designed to capture information
on the key characteristics, socio-economic background and educational
experiences of respondents, the survey also collected information on a
range of objective and subjective outcomes in both 2012 and 2015.
Objective outcomes included details around employment and
unemployment history, occupation, earnings and job quality. Subjective
outcomes included how leavers reflected on their educational pathways,
the choices they had made, their satisfaction with their labour market
situation, and their expectations and plans for the future. Furthermore,
41 Only basic job charactieristics were collected in the proxy questionnaire. Therefore, a subset of this chapter,
specifically the analysis on job quality, is performed using only data from the non-proxy survey. 42 Proxy respondents, such as parents or relatives, were used as suitable substitutes if they could adequately
represent the ‘leaver’ by answering a reduced number of key questions from the survey. 43 This 26 per cent response rate can be broken down into 17 per cent for the non-proxy survey and a 9 per
cent for the proxy survey. 44 The weights reflect differences in the sampling fraction and differences in response rate. Since LCA leavers
are overrepresented in the sample (eight per cent) relative to their numbers in the population (three per cent), for instance, the weight has the effect of reducing their representation in results based on the weighted data to reflect the population distribution. For more information see Appendix B.

44| Evaluation of PLC programme provision
additional detailed information was collected from respondents who
participated in any kind of post-school education or training (including
PLCs) on aspects of their experience, such as subjects studied, perceptions
of teaching and learning, levels of accreditation, progression paths, the
nature and relevance of work placements, and the perceived quality of
their experience.45 A pilot survey was undertaken to ensure the
questionnaire was clear and that it achieved these objectives.
In identifying the post-school pathways of leavers, it emerged that a small
number of survey responses did not always match a leaver’s status,
particularly in terms of PLC participation (as recorded on the PPPDB).
Where information was inconsistent, it was necessary to make a
judgement based on the calendar information recorded in the survey to
determine the post-school educational participation of respondents. It is
interesting to note that a recent circular to schools (Circular 0063/2016)
notified schools of revised procedures for the submission of data on PLC
students by schools from the 2016–2017 academic year. Such returns are
now generated by schools from the Programme and Learner Support
System. These revised procedures will hopefully reduce the incidence of
inconsistencies in the recording of PLC participants.
4.3 DESCRIPTIVE ANALYSIS
This section discusses the main characteristics of respondents, before
estimating the impact of PLC provision on a series of outcomes relative to
both a control group and students undertaking other educational
pathways such as higher education.46 Table 4.1 provides basic descriptive
statistics for PLC learners and for Leaving Certificate learners who did not
subsequently take any further education courses. The Leaving Certificate
grouping in Table 4.1 consists of individuals who entered the labour market
directly and those who progressed directly to higher education. Table 4.1
reveals that the majority of PLC learners were female, on average six years
older than the Leaving Certificate group, and less likely to come from
higher socio-economic groups.
45 We currently do not have a datafile that matches the PLC learners to providers (and their associated school
or college). The analysis in chapters four and five is at the individual level. 46 Unless otherwise stated, the survey of learners is the source for all the tables and figures in this chapter.

Evidence from survey of learners: Impacts of PLC |45
TABLE 4.1 ALL LEARNERS: SOME DESCRIPTIVE STATISTICS
Characteristics PLC (%)
LC
(that did not take
FE) (%)
Female 62.9 48.2
Current age (in years) 31.2 24.3
Mother’s highest level of education is degree or higher
7.0 18.5
Note: LC excludes those who (i) report that they have subsequently taken a PLC course and/or (ii) who report their main status in any of September 2010, September 2012 and September 2015 as studying a further education course. Weighted data.
Table 4.2 provides information on the distribution of Leaving Certificate
points, for the entire sample and then for PLC students and the Leaving
Certificate group (who did not take further education).47,48 The table shows
that the majority (62 per cent) of PLC leavers are in the 200–400 points
band categories, while the majority of the Leaving Certificate group (63 per
cent) are in the 300–500 band categories. The difference in the points
distributions reflects the higher proportion of Leaving Certificate cohort
who went directly to higher education.
47 Of the 1,220 survey respondants, points data were available for 791 cases. Participants in the non-proxy
survey were asked if their Leaving Certificate results could be accessed from the State Examinations Commission. This resulted in information for an additional 134 cases; in total, points data were available for 998 respondants.
48 Individuals from the group may have progressed directly to higher education or the labour market.

46| Evaluation of PLC programme provision
TABLE 4.2 POINTS DATA FROM LEARNERS SURVEY
Points bands All PLC
LC
(that did not take
FE)
0-100 7.2 13.9 3.9
101–200 9.7 17.2 4.3
201–300 20.1 31.0 13.4
301–400 31.3 31.0 30.3
401–500 22.7 6.0 34.2
501–600 8.9 0.9 13.9
# 998 421 500
Note: LC excludes those who (i) report that they have subsequently taken a PLC course and/or (ii) who report their main status in any of September 2010, September 2012 and September 2015 as studying a further education course.
Note: Weighted data
According to the PLC respondents, over 70 per cent of learners undertook
work experience during their PLC studies.49 This seems somewhat unusual
given that work experience is a compulsory component of PLC courses.50
TABLE 4.3 ALL PLC LEARNERS: DID YOU PARTICIPATE IN WORK EXPERIENCE DURING YOUR PLC STUDIES?
%
Yes 71.7
No 28.3
Total 100
N 382
Note: Weighted data
Table 4.4 shows the broad fields of study reported by PLC learners. Overall,
there is a similar pattern to the administrative data reported in Chapter 2
(Table 2.3). The shares of PLC learners in services, education, social
sciences, business and law and STEM subjects are closely aligned to the
administrative data, while the share in general programmes, humanities
and arts is somewhat lower, while the share in agriculture, veterinary,
health and welfare is somewhat higher than in the administrative data.51
49 This compares to 77% of PLC principals reporting that all their learners took part in work experience as part
of their PLC courses (see Table 3.10). 50 One plausible explanation for this is that a large proportion left their course before completing the work experience component; however, when the sample is restricted to PLC learners who also report that they
have completed their course, the proportion undertaking work experience rose to only 75.8 per cent. 51 It should be noted that the data in Table 2.3 only refer to FETAC courses, while Table 4.4 includes non-FETAC
courses.
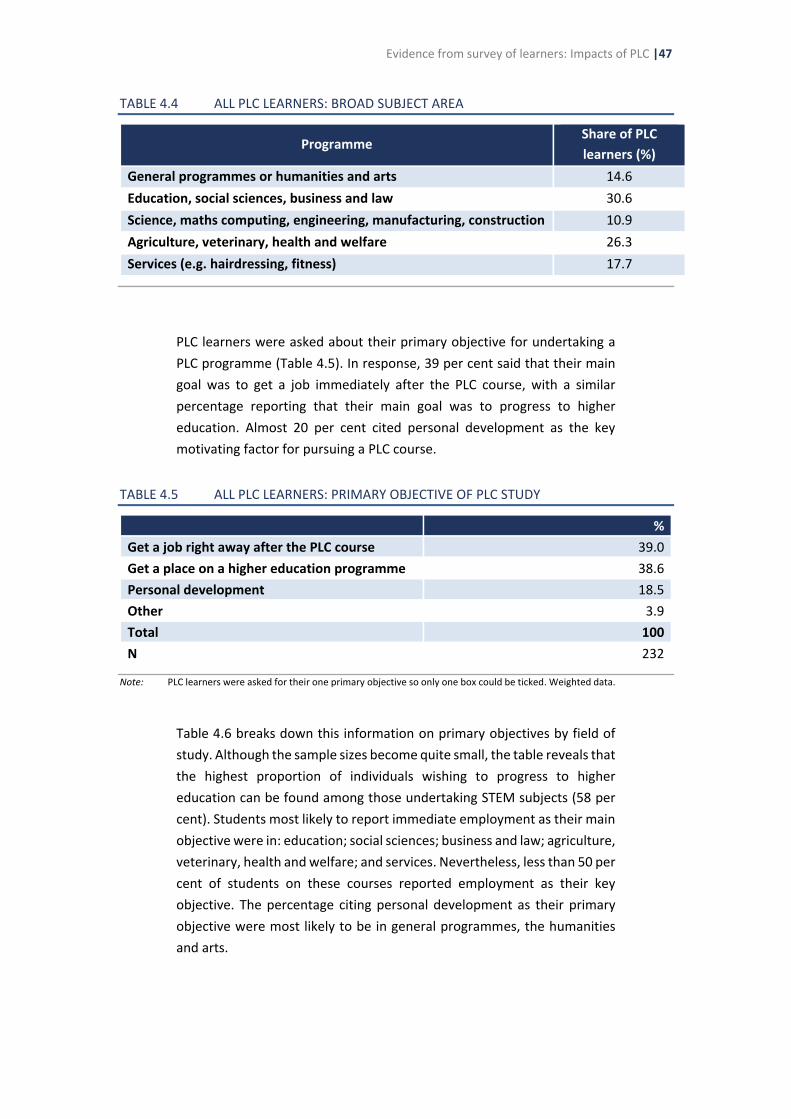
Evidence from survey of learners: Impacts of PLC |47
TABLE 4.4 ALL PLC LEARNERS: BROAD SUBJECT AREA
Programme Share of PLC
learners (%)
General programmes or humanities and arts 14.6
Education, social sciences, business and law 30.6
Science, maths computing, engineering, manufacturing, construction 10.9
Agriculture, veterinary, health and welfare 26.3
Services (e.g. hairdressing, fitness) 17.7
PLC learners were asked about their primary objective for undertaking a
PLC programme (Table 4.5). In response, 39 per cent said that their main
goal was to get a job immediately after the PLC course, with a similar
percentage reporting that their main goal was to progress to higher
education. Almost 20 per cent cited personal development as the key
motivating factor for pursuing a PLC course.
TABLE 4.5 ALL PLC LEARNERS: PRIMARY OBJECTIVE OF PLC STUDY
%
Get a job right away after the PLC course 39.0
Get a place on a higher education programme 38.6
Personal development 18.5
Other 3.9
Total 100
N 232
Note: PLC learners were asked for their one primary objective so only one box could be ticked. Weighted data.
Table 4.6 breaks down this information on primary objectives by field of
study. Although the sample sizes become quite small, the table reveals that
the highest proportion of individuals wishing to progress to higher
education can be found among those undertaking STEM subjects (58 per
cent). Students most likely to report immediate employment as their main
objective were in: education; social sciences; business and law; agriculture,
veterinary, health and welfare; and services. Nevertheless, less than 50 per
cent of students on these courses reported employment as their key
objective. The percentage citing personal development as their primary
objective were most likely to be in general programmes, the humanities
and arts.
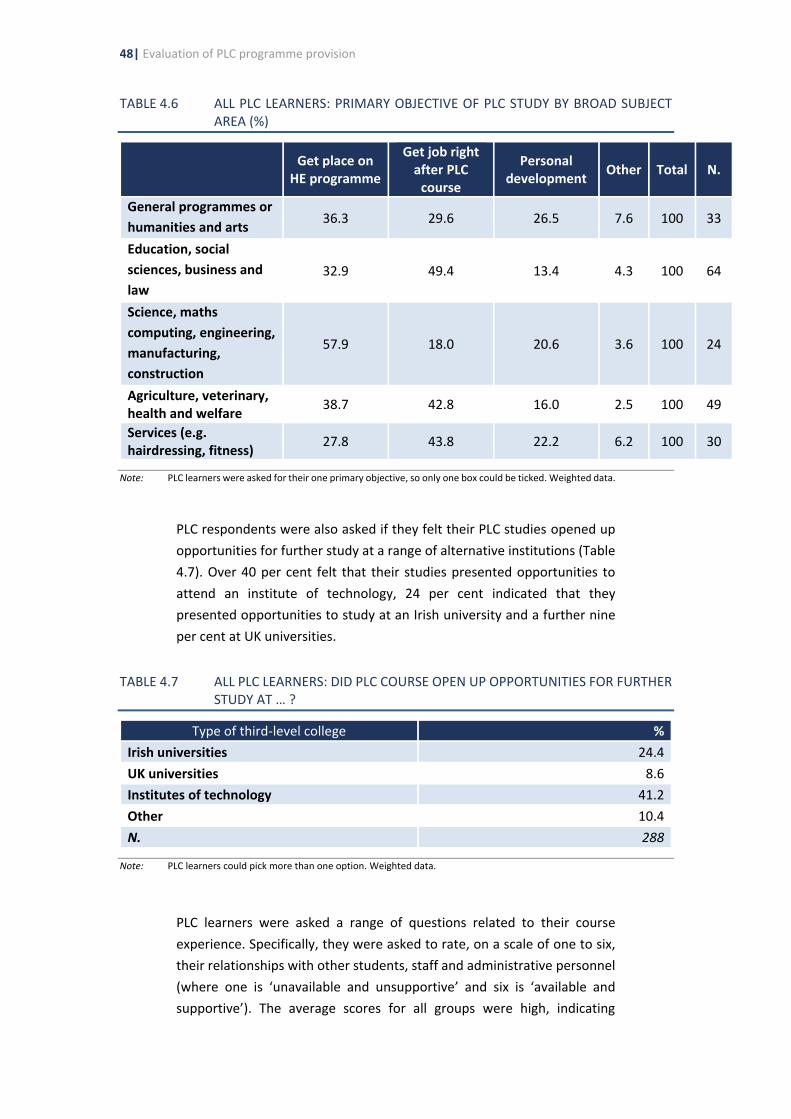
48| Evaluation of PLC programme provision
TABLE 4.6 ALL PLC LEARNERS: PRIMARY OBJECTIVE OF PLC STUDY BY BROAD SUBJECT AREA (%)
Get place on HE programme
Get job right after PLC
course
Personal development
Other Total N.
General programmes or
humanities and arts 36.3 29.6 26.5 7.6 100 33
Education, social
sciences, business and
law
32.9 49.4 13.4 4.3 100 64
Science, maths
computing, engineering,
manufacturing,
construction
57.9 18.0 20.6 3.6 100 24
Agriculture, veterinary, health and welfare
38.7 42.8 16.0 2.5 100 49
Services (e.g. hairdressing, fitness)
27.8 43.8 22.2 6.2 100 30
Note: PLC learners were asked for their one primary objective, so only one box could be ticked. Weighted data.
PLC respondents were also asked if they felt their PLC studies opened up
opportunities for further study at a range of alternative institutions (Table
4.7). Over 40 per cent felt that their studies presented opportunities to
attend an institute of technology, 24 per cent indicated that they
presented opportunities to study at an Irish university and a further nine
per cent at UK universities.
TABLE 4.7 ALL PLC LEARNERS: DID PLC COURSE OPEN UP OPPORTUNITIES FOR FURTHER STUDY AT … ?
Type of third-level college %
Irish universities 24.4
UK universities 8.6
Institutes of technology 41.2
Other 10.4
N. 288
Note: PLC learners could pick more than one option. Weighted data.
PLC learners were asked a range of questions related to their course
experience. Specifically, they were asked to rate, on a scale of one to six,
their relationships with other students, staff and administrative personnel
(where one is ‘unavailable and unsupportive’ and six is ‘available and
supportive’). The average scores for all groups were high, indicating

Evidence from survey of learners: Impacts of PLC |49
generally positive relationships, with the highest score reported for
interactions with other students, followed by teaching staff, and the
lowest score for administrative personnel (Table 4.8).
TABLE 4.8 ALL PLC LEARNERS: HOW WOULD YOU DESCRIBE YOUR RELATIONSHIPS WITH EACH OF THE FOLLOWING?
Category Average score
Other students 5.0
Teaching staff 4.8
Administrative personnel 4.4
N. 280
Note: 1 = unavailable, unsupportive, sense of alienation, 6 = available, supportive, considerate. Weighted data.
4.4 ECONOMETRIC ANALYSIS
As already stated, a key objective of our study is to assess the impact of
PLC participation on outcomes such as progression to higher education,
progression to employment and quality of employment. From a technical
prospective, the counterfactual impact of PLC provision is only truly
measured relative to individuals who had access to a PLC programme, did
not participate in it and received no further ‘treatment’ (i.e. no other
training or education exposure). Specifically, the counterfactual will most
accurately be measured by comparing the outcomes of the PLC treatment
group with the Leaving Certificate completers who entered the labour
market on completion of their studies. Within this study, the direct labour
market entrants form the principal control group against which the
effectiveness of the PLC programme is assessed. Nevertheless, while the
direct labour market entrant forms the basis of a counterfactual estimate,
comparisons between PLC entrants and those undertaking other forms of
treatments (for example, directly to higher education) are also informative
and will be investigated within this framework. We are particularly
interested in comparing the outcomes of PLC participants with those of
similar individuals who progressed directly to higher education following
completion of their Leaving Certificate.
In our assessment of the impact of the treatment, we explicitly recognise
the heterogenous nature of PLC provision. Specifically, some programmes
will tend to be directly targeted at immediate employment opportunities
and, while such programmes also facilitate progression to further study,
they can be classified as job specific in nature. The remainder of
programmes, while providing opportunities for employment and further
study, by virtue of the fact that they tend not to be targeted at specific

50| Evaluation of PLC programme provision
occupations, we classify as general.52 The distinction between job-specific
and general PLC provision is adopted for the vast bulk of our empirical
estimates. However, in some cases sufficient information was not provided
or the course title did not easily lend itself to a specific field of study for
our classification purposes. Table 4.9 describes the construction of the
various treatment and control groups. In our first treatment and control
groups, we exclude Leaving Certificate learners who subsequently took a
PLC course and/or have other further education exposure. This restriction
leaves us with 421 observations in the PLC treatment group and 500 in the
LC control group, which we consider a highly workable sample.
TABLE 4.9 TREATED AND CONTROL GROUPS – DEFINITIONS
Definitions Number
Original sample 1,220
of whom:
PLC 573
LC 647
Exclude cases where points data are not available:
PLC 421
LC 577
Exclude LC Learners with PLC and/or further education exposure: those who (i) report that they have subsequently taken a PLC course and/or (2) who report their main status in any of Sept. 2010, Sept. 2012 and Sept. 2015 as studying a further education course
PLC - Treatment group ‘ALL PLC’ 421
LC - Control group ‘ALL LC’ 500
Exclude both PLC and LC Learners with other training exposure: those who report their main status in any of September 2010, September 2012 and September 2015 as: ‘apprenticeship’ , ‘internship’, ‘other FÁS/SOLAS, Fáilte Ireland, Teagasc course’, etc. and ‘on a private training scheme’.
PLC 381
LC 464
Separate out LC Learners who went straight to HE: those who report their main status in Sept. 2010 to be higher education
PLC – Treatment group ‘PLC’ 381
52 Tables A2 and A3 in the Appendix describe the fields of study we have allocated to each category.

Evidence from survey of learners: Impacts of PLC |51
TABLE 4.9 TREATED AND CONTROL GROUPS – DEFINITIONS (CONTD.)
Definitions Number
LC – Straight to higher education – Control group ‘higher education LC’
310
LC – Rest (direct entrants to labour market) – Control group ‘LM LC’
154
Distinguish between job-specific and general PLCs: treatment group ‘PLC’ who undertook PLC programmes in more labour-market-oriented fields of study versus those who did not.
PLC – No detailed PLC course info provided 144
PLC – General - Treatment group ‘General PLC’ 136
PLC – Job Specific - Treatment group ‘JS PLC’ 101
LC – Straight to higher education – Control Group ‘higher education LC’
310
LC – Rest (Direct Entrants to Labour Market) – Control group ‘LM LC’
154
Note: LC excludes those who (i) report that they have subsequently taken a PLC course and/or (ii) who report their main status in any of September 2010, September 2012 and September 2015 as studying a further education course.
The various PLC treatment groups refer to learners who participated in PLC
courses and, for various reasons, not all of these learners will have
completed their courses and attained certification. As a robustness check,
we estimated the impact of PLC participation on some of the key outcome
variables, including only those learners who report that they completed
their PLC course. Specifically, we estimated the impact of PLC participation
on progression to employment in 2015 and progression to higher
education. The results are shown in Tables A15 and A16 in Appendix A. The
broad picture remains the same and many of the estimates are stronger
when we control for completion.
Table 4.10 provides basic descriptive information on the treatment group
and the LC group (who have not done further education). There are some
clear differences between the two groupings, suggesting a non-random
self-selection process into PLC study. Specifically, the PLC participants are
more likely to be female and older, and to have a lower points score than
those in the LC (non-further-education) group. With respect to labour
market outcomes, while the PLC group are more likely to be in
employment in 2012 and less likely to be in higher education, the rates
grow much more similar by 2015.53
53 These differences reflect the fact that a high proportion of the LC group progressed to higher education.

52| Evaluation of PLC programme provision
TABLE 4.10 TREATED AND CONTROL GROUPS: SOME DESCRIPTIVE STATISTICS
All PLC All LC
Excluding LC learners with further education exposure
Current age (years) 28.6 24.3
Proportion female (%) 65.2 48.9
Average points (00’s) (banded; 1=0-100, 2=101-200 etc.)
3.0 4.3
% in employment in 2012 42.8 24.2
% in unemployment in 2012
10.4 6.3
% in higher education in 2012
27.0 59.8
% in employment in 2015
62.6 66.0
% in unemployment in 2015
13.6 9.3
% in higher education in 2015 7.1 14.2
Note: Employment refers to paid employment or self-employment; unemployment refers to unemployed but looking for work. Weighted data.
This broad pattern – of PLC learners being more likely to be in employment
and less likely to be in higher education in 2012 than the other years – is
more pronounced when we distinguish between general and job-specific
PLCs. For example, as shown in Table 4.11, just under 36 per cent of those
in general PLCs were in employment in 2012 as opposed to over 50 per
cent of those in job-specific PLCs. By 2015, the percentage of people in
employment and in higher education in the various treatment and control
groups became comparable again.54
54 There are 573 PLC learners in the entire sample (see Table 4.9). Of these, 28 per cent were in employment
and 19 per cent were in higher education in 2010, while the comparable figures for 2012 are 42 per cent and 24% and the related figures for 2015 are 57 per cent and seven per cent.
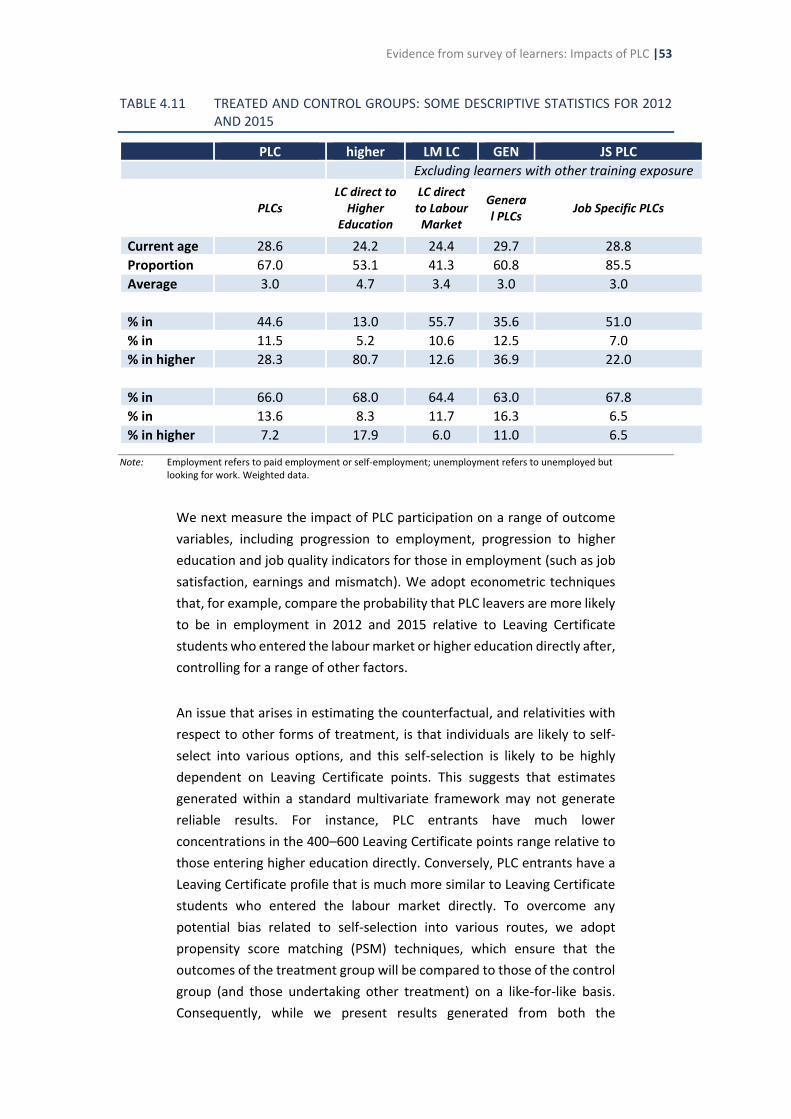
Evidence from survey of learners: Impacts of PLC |53
TABLE 4.11 TREATED AND CONTROL GROUPS: SOME DESCRIPTIVE STATISTICS FOR 2012 AND 2015
PLC higher
education
LC
LM LC GEN
PLC
JS PLC Excluding learners with other training exposure
PLCs LC direct to
Higher Education
LC direct to Labour
Market
General PLCs
Job Specific PLCs
Current age (years)
28.6 24.2 24.4 29.7 28.8
Proportion female (%)
67.0 53.1 41.3 60.8 85.5
Average points (00’s) (banded; 1=0-100, 2=101-200 etc.)
3.0 4.7 3.4 3.0 3.0
% in employment in 2012
44.6 13.0 55.7 35.6 51.0
% in unemployment in 2012
11.5 5.2 10.6 12.5 7.0
% in higher education in 2012
28.3 80.7 12.6 36.9 22.0
% in employment in 2015
66.0 68.0 64.4 63.0 67.8
% in unemployment in 2015
13.6 8.3 11.7 16.3 6.5
% in higher education in 2015
7.2 17.9 6.0 11.0 6.5
Note: Employment refers to paid employment or self-employment; unemployment refers to unemployed but looking for work. Weighted data.
We next measure the impact of PLC participation on a range of outcome
variables, including progression to employment, progression to higher
education and job quality indicators for those in employment (such as job
satisfaction, earnings and mismatch). We adopt econometric techniques
that, for example, compare the probability that PLC leavers are more likely
to be in employment in 2012 and 2015 relative to Leaving Certificate
students who entered the labour market or higher education directly after,
controlling for a range of other factors.
An issue that arises in estimating the counterfactual, and relativities with
respect to other forms of treatment, is that individuals are likely to self-
select into various options, and this self-selection is likely to be highly
dependent on Leaving Certificate points. This suggests that estimates
generated within a standard multivariate framework may not generate
reliable results. For instance, PLC entrants have much lower
concentrations in the 400–600 Leaving Certificate points range relative to
those entering higher education directly. Conversely, PLC entrants have a
Leaving Certificate profile that is much more similar to Leaving Certificate
students who entered the labour market directly. To overcome any
potential bias related to self-selection into various routes, we adopt
propensity score matching (PSM) techniques, which ensure that the
outcomes of the treatment group will be compared to those of the control
group (and those undertaking other treatment) on a like-for-like basis.
Consequently, while we present results generated from both the
54| Evaluation of PLC programme provision
multivariate and PSM approaches in Appendix A, we deem the PSM results
to be the most reliable and concentrate solely on these in the main body
of the report.55
PSM analysis involved a two-stage estimation procedure. In stage one, a
probit model assigns a probability of being assigned to the treatment
group to all respondents (both control and treatment) based on
observable characteristics. Individuals are matched on the basis of
propensity scores, the underlying rationale being that this is equivalent to
matching on observable characteristics ensuring that the treatment and
control group are very similar in all aspects relevant to assignment to the
treatment. In stage two, outcomes (such as earnings, employment and job
satisfaction) of the treatment and control groups are compared, in order
to get an estimate of the average effect of the treatment (in this case PLC
study) on the treated (PLC students). In order to ensure that our PSM
estimates are as reliable as possible, we apply a caliper approach to the
Kernel algorithm to ensure that, at the point of estimation, all observable
differences between the control and treatment groups are fully
eradicated. The first stage of the PSM estimation procedure is informative
in itself, as it reveals the key characteristics that distinguish PLC students
from those of the specific control groups (direct entrants to the labour
market and higher education).
The stage one equations show that relative to Leaving Certificate students
who entered the labour market directly, the probability of participating in
PLC study (i.e. being in the treatment group) is positively associated with
age, being female, having a lower points score and not having taken the
Leaving Certificate Applied programme.56 In addition, a proxy for social
class (whether either or both of the individual’s parents had a degree) was
included in the first stage regression but the effect was not significant. The
stage one equation for participating in a PLC programme, relative to
Leaving Certificate students who went directly to higher education, show
similar results, with age, being female and having a lower points score all
being positive factors affecting an individual’s likelihood of participating in
a PLC programme. The impact for having taken the Leaving Certificate
Applied programme is not significant in this model. Being from a higher
55 Please see Tables A13 and A14 in the Appendix for complete tabulated data. 56 This effect is only significant at the 10% level.
Evidence from survey of learners: Impacts of PLC |55
social class has a negative effect on the likelihood of participating in a PLC
programme, but this effect is only significant at the 10 per cent level.57
Turning first to employment outcomes, it is important to note that not all
PLC completers or higher education direct entrants will have finished their
studies at the end of 2012.58,59 For this reason, the estimated employment
impacts are not highly informative. Perhaps not surprisingly, no difference
was observed in the employment outcomes of either PLC participants, no
matter how they were defined, or the relevant control groups.60 Tables
4.12 and 4.13 show the results for employment outcomes in 2015 relative
to direct labour market entrants (4.12) and direct higher education
entrants (4.13). The direct labour market entrant group is used to calculate
the counterfactual estimate of PLC participation and the results show that
by 2015, PLC participants were 16 percentage points more likely to be in
employment relative to similar individuals who entered the labour market
directly on completion of their Leaving Certificate in 2009. Exploring this
result in further detail, we find that the employment effects are greater for
job-specific than general PLCs and for PLC participants who progressed
directly to the labour market rather than to higher education.
Nevertheless, given that many of the PLC cohort who progressed to higher
education will have undertaken general PLCs and were still completing
their studies in 2015, these particular estimates cannot be taken as
definitive.
It is important to note that approximately 10 per cent of the PLC sample
were in receipt of the Back to Education Allowance (BTEA). The BTEA is a
non-statutory second-chance education scheme for jobseekers that was
expanded rapidly between 2008 and 2013 as the rate of unemployment in
Ireland rose rapidly, following the onset of the well documented recession.
Individuals in receipt of the BTEA received a weekly allowance, equivalent
to jobseeker welfare payments, while pursuing a second-level qualification
(such as a PLC) or a third-level course. A recent evaluation of the BTEA
programme found that it had a highly negative impact on participants’
subsequent employment probabilities. Specifically, the results indicated
that jobseekers who commenced a second-level option BTEA claim in
September/October 2008 were between 28 and 30 percentage points less
57 See Appendix Tables A4–A12. 58 Some results on employment outcomes are available, which indicate, on the basis of PSM estimates, that,
not surprisingly, individuals pursuing general PLCs are somewhat less likely to be employed in 2012 relative to Leaving Certificate direct labour market entrants. Conversely, job-specific PLCs and, to a lesser extent, general PLC graduates are somewhat more likely to be in employment in 2012 relative to direct higher education entrants.
59 For example, a proportion of PLC completers will have progressed to higher education during this period. 60 See Appendix A for details.
56| Evaluation of PLC programme provision
likely to have left the Live Register in June 2012 relative to the control
group of claimants who did not participate in the programme. This
negative impact fell to 25 percentage points by June 2014 (Kelly et al.,
2015). The evaluation was purely quantitative and the authors could not
draw any conclusions with respect to the extent to which the negative
employment impact was being driven by issues such as the quality of
education, the effectiveness of the activation process or other factors.
Nevertheless, the results from Kelly et al. (2015) suggest that some checks
should be undertaken regarding the performance of the BTEA cohort
within the current evaluation.
As a robustness check, we re-estimate the PLC treatment effect, excluding
those on BTEA, and find that the estimated employment treatment effect
in 2015 increases from 16 to 19 per cent. Relative to the control group we
find that the individuals in receipt of the BTEA were 22 per cent less likely
to be in employment in 2015. While the control group here is somewhat
different to that used in the BTEA evaluation61, the result is highly
consistent with that study. The results of this study further suggest that
the negative aspects of the BTEA programme are unlikely to relate to the
quality or nature of the educational aspect of delivery, given the highly
positive employment impacts experienced by PLC participants not in
receipt of the BTEA.
Transitions to higher education (Table 4.14) are assessed relative to the
direct labour market entrants group only. Compared to the control group,
PLC participants were 27 percentage points more likely to have
participated in higher education by 2015. Separating the effects out by PLC
type, we find that PLC students undertaking general and job-specific PLCs
were more likely than direct labour market entrants to have undertaken
higher education by 2015, by 38 compared to 26 percentage points,
respectively. The analysis shows that PLC provision acts as an important
access platform to higher education for individuals who otherwise might
never have pursued that particular educational option.
61 In the Kelly et al. (2015) study, the control group was drawn from the Live Register and consisted of
individuals with similar characteristics to those of the BTEA participants (for instance, regarding age, previous occupation and labour market history).

Evidence from survey of learners: Impacts of PLC |57
TABLE 4.12 EMPLOYED IN 2015: ESTIMATED IMPACT RELATIVE TO DIRECT LABOUR MARKET ENTRANTS
Treatment group Control group Estimate
All PLC learners All LC 0.04
PLC LC – direct LM entrants 0.16**
PLC who went to higher education LC – direct LM entrants 0.08
PLC who did not progress to higher education
LC – direct LM entrants 0.23***
General PLCs LC – direct LM entrants 0.09
Job-specific PLCs LC – direct LM entrants 0.24**
Note: Table shows the estimated impact on the probability of being in employment in 2015 from the PSM models. Levels of significance: *** p<0.01, ** p<0.05, * p<0.10.
TABLE 4.13 EMPLOYED IN 2015: ESTIMATED IMPACT RELATIVE TO LEAVING CERTIFICATE STUDENTS WHO PROGRESSED STRAIGHT TO HIGHER EDUCATION
Treatment group Control group Estimate
PLC LC – straight to higher education
0.01
PLC who went to higher education
LC – straight to higher education
-0.08
PLC who did not progress to higher education
LC – straight to higher education
0.06
General PLCs LC – straight to higher education
-0.05
Job-specific PLCs LC – straight to higher education
-0.03
Note: Table shows the estimated impact on the probability of being in employment in 2015 from the PSM models. Levels of significance: *** p<0.01, ** p<0.05, * p<0.10.
TABLE 4.14 PROGRESSION TO HIGHER EDUCATION: SUMMARY OF ESTIMATES
Treatment group Control group PSM estimate
PLC LC – direct LM entrants 0.27***
Job-specific PLCs LC – direct LM entrants 0.26***
General PLCs LC – direct LM entrants 0.38***
Note: Progression to higher education is defined as reporting higher education to be main status in September 2010, 2012 or 2015.

58| Evaluation of PLC programme provision
For those in employment, we also examine several aspects of job quality,
including job satisfaction and level of skill utilisation. In terms of job
satisfaction, respondents were asked to rate their satisfaction with their
current work. The model results did not reveal any significant differences
in job satisfaction between the PLC treatment group and the direct labour
market control group.62 Labour market mismatch describes the situation
whereby the skill levels or education of the individual are to some degree
misaligned with the productivity requirements of their role. Individuals can
be mismatched as a consequence of being either overskilled or
underskilled relative to the requirements of their job. To capture
mismatch, respondents were asked to compare their acquired skills and
knowledge to those required for their current job. In presenting these
findings, ‘underskilling’ is defining as having too few skills relative to what
is required. The concept is analogous to that of skill gaps usually captured
in firm-level surveys. Learners were asked to rate, on a scale of one to five,
the extent to which their job demands more skills and knowledge than they
can actually offer, where one is ‘not at all’ and five is ‘to a very great
extent’. A response of four or five is deemed to be consistent with
underskilling and a response of five is deemed consistent with severe
underskilling. The incidence of underskilling is reported in Table 4.15.
TABLE 4.15 INCIDENCE OF UNDERSKILLING
% Underskilled % Severely underskilled
All PLC 34 15
ALL LC 35 15
PLC 33 16
PLC who went to higher education
31 17
PLC who did not progress to higher education
36 15
LC – direct labour market entrants
37 13
LC – straight to higher education
36 16
Note: Weighted data
62 See Table A9 in the appendix.

Evidence from survey of learners: Impacts of PLC |59
Table 4.15 shows that PLC and LC learners have similar rates of
underskilling, with around 35 per cent of respondents reporting that they
are underskilled and around 15 per cent reporting that they are severely
underskilled. The model results indicate that PLC participation has no
impact on either the probability of being underskilled or being severely
underskilled relative to Leaving Certificate students who entered the
labour market directly.63 The incidence of underskilling across various
groups is somewhat surprising. Generally, we might expect underskilling
rates to be highest for those with Leaving Certificate education and/or
higher education, as these qualifications may not be vocational in nature.
The fact that the incidence of underskilling for PLC leavers is comparable
to the rates for other groups and that, in the vocational cohort, it is higher
for those who did not progress to higher education may raise issues around
the appropriateness of skill formation within PLC programmes. This issue
requires further examination.
Returning to the question that asked learners to rate, on a scale of one to
five, the extent to which their knowledge and skills are utilised in their
work (where one is ‘not at all’ and five is ‘to a very great extent’), a
response of one or two is deemed consistent with overskilling. The model
results indicate that PLC participation has no significant effect on
overskilling relative to those who enter the labour market directly.64 We
should treat the results of both skill mismatch and job satisfaction with
caution as we are capturing these effects right at the onset of respondents’
careers and, therefore, cannot rule out the possibility of more substantial
differences between the groups emerging over time.
Finally, we attempt to use these data to assess the impact of PLC
participation on earnings. Due to data restrictions related to the smaller
sample size responding to the wage questions, we are unable to adopt a
PSM approach. As an alternative, we estimate a wage equation augmented
with a Heckman selection term to account for non-random entry to the
various educational routes.65 This allows us to examine wage impacts close
to the beginning of learners’ careers. The learners survey captures data on
individuals after five years. We supplement the analysis using data from
the National Employment Survey (NES), which allows us to examine
potential wage differences after a number of years in the labour market.
63 See Tables A10 and A11 in the appendix. 64 See Table A12 in the appendix. 65 This involves a two-stage procedure. In stage one, the probability of entering various educational routes is
modelled and from this equation an inverse mills ratio, representative of a joint conditional error term, is extracted. In the second stage, the respective mills ratios are included in a wage model to control for selection effects. The stage-one model should include at least one variable that is excluded from the second stage equation: in this instance, parental social class is used as the identifying restriction.

60| Evaluation of PLC programme provision
The wage distribution of respondents to the leavers survey is graphed in
Figure 4.1, where it appears that hourly earnings do not follow a standard
normal distribution, as they are somewhat skewed to the right. This
suggests that relatively low proportions of respondents had progressed to
a higher level of earnings at the time of the survey. This is to be expected
as a major determinant of earnings growth is labour market experience,
which is highly limited among our survey respondents given their relatively
young age. The wage equation is well specified and indicates that hourly
earnings are higher among workers who are employed full-time, located in
larger firms and who are trade union members (Table 4.16). Hourly
earnings tended to be lower among workers who were overskilled and
worked longer hours.66 However, there is limited evidence of any
substantial wage impacts related to education pathway, relative to the
reference category of direct labour market entrants: PLC completers earn
19 percentage points less than the direct labour market entrants reference
category. However, the result is statistically weak and cannot be relied
upon beyond a 10 per cent confidence level.
FIGURE 4.1 WAGE DATA IN SURVEY
Note: We constructed a gross hourly wage variable. Dropped if gross hourly wage < €5 (8 cases) and dropped if gross hourly wage > €125 (10 cases).
66 Overskilling describes a situation whereby the worker feels that many of their skills and abilities are not
required in their current job.
0.5
11
.5
Den
sity
1 2 3 4 5loggrosswagehr

Evidence from survey of learners: Impacts of PLC |61
TABLE 4.16 WAGES IN CURRENT JOB (INCLUDING TWO MILLS RATIOS; CHILD AND PARENTAL DEGREE EXCLUDED)
Coeff.
PLC -0.186*
LC direct to higher education 0.021
PLC*higher education (Interaction, PLC who progress to higher education)
0.113
BASE is LC straight to labour market
Age 0.008
Male 0.010
Married/couple/civilp -0.022
Points (banded) 0.028
Underskilled 0.023
Overskilled -0.194**
Tenure 0.013
Full-time, regular job 0.358***
Full-time, temporary job 0.416***
Public sector -0.016
Hours -0.013***
Trade union member 0.170***
Sector of Activity: (base services)
Agric 0.147
Ind 0.025
Construction -0.033
Firm Size: (base 1–9)
10–49 emp. 0.080
50–99 emp. 0.164*
100–249 emp. 0.009
250–999 emp 0.226**
1,000 plus emp. 0.199***
PLC mills ratio 0.000
LC higher education mills ratio 0.000
_cons 2.276***
It is fair to say that differences in earnings will tend to be relatively slight
at the onset of individuals’ careers, with premiums related to educational
attainment only tending to become significant after a number of years in
the labour market. In order to overcome this issue, we estimate the wage
relationship using the 2003, 2006 and 2009 waves of the National
Employment Survey (NES). The NES is a linked employer–employee survey
that facilitates consistent estimates of the PLC wage premium across the
entire population of employees in employment. Unfortunately, the post-
62| Evaluation of PLC programme provision
secondary education category used in the NES does not distinguish
apprentices from PLC qualifiers. Thus, in order to get a closer
approximation of the PLC grouping, we excluded those with a
technical/vocational qualification from the post-secondary education
category used in the NES.67 We also excluded those with a post-secondary
qualification working in craft and related occupations in the construction
sector.68 Table 4.17 details the sectoral composition of post-secondary
qualified workers, during the three time points. A good deal of volatility
was observed, particularly between 2006 and 2009, as the economy
moved from high levels of growth to recession. Over this time period, the
share of post-secondary employment in high and mid skilled occupations,
such as managerial, associate professional and craft posts, fell back
considerably, while shares employed in occupations such as personal and
protection services and ‘other’ rose considerably. During this period, the
unemployment rate among post-secondary qualifiers increased from four
to 15 per cent (Table 4.18), which was more severe than that experienced
by individuals holding either second- or third-level qualifications. The
evidence suggests that a good deal of the heavy job loss experienced by
PLC qualifiers during the recession was concentrated among those workers
who had been more successful in achieving occupational mobility during
the boom. The high relative shift in both the level and composition of PLC
workers during the downturn suggests that the returns to PLC workers are
likely to exhibit a strong cyclical component, with wage premiums (relative
to those with lower educational qualifications) likely to be lower during
recessions due to higher rates of job loss among PLC qualifiers in more
highly paid occupations.
67 Those with a technical/vocational qualification are defined as individuals who had completed an
apprenticeship, NCVA level 2/3 or equivalent. 68 Non-Irish nationals were excluded from the 2006 and 2009 models as well: it was not feasible to exclude non
Irish nationals from the 2003 model as nationality information is not available in the March 2003 NES data.

Evidence from survey of learners: Impacts of PLC |63
TABLE 4.17 OCCUPATIONAL DISTRIBUTION OF THOSE WITH PLC QUALIFICATION (%)
Occupation March 2003
October 2006
October 2009
Managers and senior administrators 6.7 10.6 7.7
Professionals 6.5 8.6 5.4
Associate professional and technical 13.8 11.6 6.7
Clerical and secretarial 16.8 13.2 20.7
Craft and related trades 13.9 18.5 8.4
Personal and protective services 9.2 10.1 14.0
Sales 7.5 8.1 10.0
Plant and machine operatives 11.1 9.6 10.4
Other 14.6 9.7 16.7
Total 100 100 100
Source: Constructed using the CSO’s NES data. Note: Individuals with a PLC qualification working in craft and related trade occupations in the construction
sector are excluded from this analysis, as are non-Irish nationals from the 2006 and 2009 data. We were unable to exclude Irish non-nationals from the NES data for March 2003; however, it was only from 2004 onwards that Ireland experienced the large inflow of immigrants.
TABLE 4.18 UNEMPLOYMENT RATES BY EDUCATIONAL ATTAINMENT: 2006, 2009 (Q2)
Educational attainment 2006 (Q2)
2009 (Q2)
Primary or below 8.3 15.3
Lower secondary 6.5 19.2
Upper secondary 4.5 13.2
Post-secondary non-tertiary 4.2 14.8
Third-level non-honours degree 3.2 8.8
Third-level higher degree or above 2.4 6.1
Source: Constructed using the CSO’s Quarterly National Household Survey (QNHS) data. Note: The rates are based on those aged 15–74 years.
We estimate the returns to PLC education, applying the same restrictions mentioned
above, on, applying the same restrictions mentioned above, by applying PSM to the
2003, 2006 and 2009 waves of the NES (Table 4.19). In this way, we again ensure
that the earnings of PLC qualifiers are compared with those of individuals with
secondary levels of schooling who are similar in all other observable ways: age,
gender, occupational status, etc. The results revealed that while PLC qualifiers
earned a wage premium of 4.4 per cent in 2003 (relative to those with Leaving
Certificate qualifications), no significant effect was detected for 2006 and 2009. The
results suggest that the long-run returns to PLC education over Leaving Certificates
will tend to be cyclical in nature, with the limited data suggesting that these will be
positive during normal periods of growth. We would expect to observe a more
substantial positive premium for PLC qualifiers who subsequently progressed to
higher education; however, this cannot at present be validated by any existing
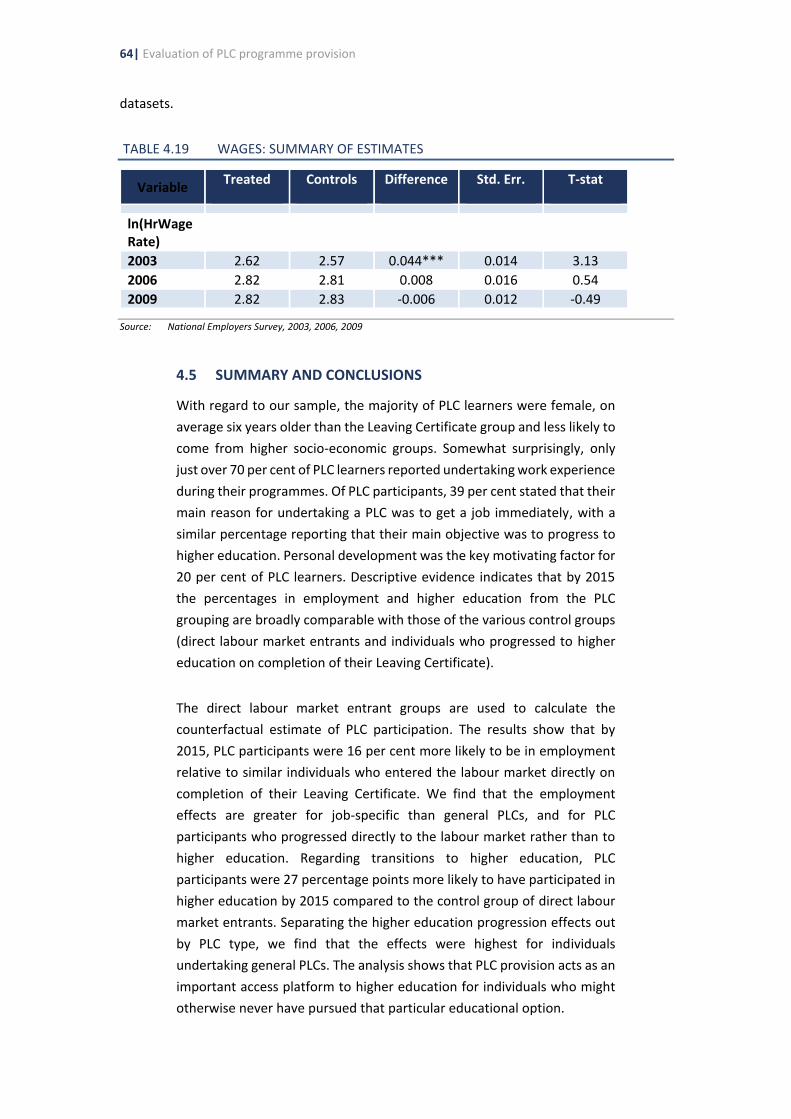
64| Evaluation of PLC programme provision
datasets.
TABLE 4.19 WAGES: SUMMARY OF ESTIMATES
Variable Treated Controls Difference Std. Err. T-stat
ln(HrWageRate)
2003 2.62 2.57 0.044*** 0.014 3.13
2006 2.82 2.81 0.008 0.016 0.54
2009 2.82 2.83 -0.006 0.012 -0.49
Source: National Employers Survey, 2003, 2006, 2009
4.5 SUMMARY AND CONCLUSIONS
With regard to our sample, the majority of PLC learners were female, on
average six years older than the Leaving Certificate group and less likely to
come from higher socio-economic groups. Somewhat surprisingly, only
just over 70 per cent of PLC learners reported undertaking work experience
during their programmes. Of PLC participants, 39 per cent stated that their
main reason for undertaking a PLC was to get a job immediately, with a
similar percentage reporting that their main objective was to progress to
higher education. Personal development was the key motivating factor for
20 per cent of PLC learners. Descriptive evidence indicates that by 2015
the percentages in employment and higher education from the PLC
grouping are broadly comparable with those of the various control groups
(direct labour market entrants and individuals who progressed to higher
education on completion of their Leaving Certificate).
The direct labour market entrant groups are used to calculate the
counterfactual estimate of PLC participation. The results show that by
2015, PLC participants were 16 per cent more likely to be in employment
relative to similar individuals who entered the labour market directly on
completion of their Leaving Certificate. We find that the employment
effects are greater for job-specific than general PLCs, and for PLC
participants who progressed directly to the labour market rather than to
higher education. Regarding transitions to higher education, PLC
participants were 27 percentage points more likely to have participated in
higher education by 2015 compared to the control group of direct labour
market entrants. Separating the higher education progression effects out
by PLC type, we find that the effects were highest for individuals
undertaking general PLCs. The analysis shows that PLC provision acts as an
important access platform to higher education for individuals who might
otherwise never have pursued that particular educational option.

Evidence from survey of learners: Impacts of PLC |65
We find no statistically significant differences between the PLC treatment
and Leaving Certificate labour market entrant control group in relation to
job satisfaction, underskilling or overskilling. Nevertheless, we should treat
these results with caution; we are capturing effects right at the onset of
respondents’ careers and, therefore, cannot rule out the possibility of
more substantial differences between the groups emerging over time.
Finally, in terms of earnings, we detected no statistically significant
differences from our survey data. In order to assess the longer-term
earnings impacts of PLC participation, we undertook an analysis using the
2003, 2006 and 2009 waves of the National Employment Survey. The
results revealed that while PLC qualifiers earned a wage premium of 4.4
per cent in 2003, no significant effect was detected for 2006 and 2009. The
results suggest that the long-run returns to PLC education over Leaving
Certificates will tend to be cyclical in nature, with the limited data
suggesting that these will be positive during normal periods of growth. We
would expect to observe a more substantial positive premium for PLC
qualifiers who subsequently progressed to higher education; however, this
cannot at present be validated by any existing datasets and, in this period
of great change, points to the need for new wage data for Ireland.

66|Evidence from survey of learners: Student perceptions
CHAPTER 5
Evidence from survey of learners: Student perceptions
5.1 INTRODUCTION
This chapter presents detailed analyses of people’s experience of PLC
programmes and how these experiences compare with those of other
learners, in particular those taking higher education courses. The results
highlight the distinct profile of PLC participants, in terms of gender, socio-
economic background, prevalence of special educational needs (SEN) and
prior educational attainment. PLC courses are quite polarised in terms of
course intensity and, in general, PLC participants do not participate in
extra-curricular clubs and societies, unlike their higher education
counterparts. In terms of the transition to PLC programmes, the single
greatest challenge students face relates to the financial demands of their
course, while the shift towards more self-directed teaching and learning
methodologies constitutes a challenge for which PLC and higher education
students alike feel ill-prepared. In reflecting on their choices, PLC
participants are less positive than their counterparts who progressed to
higher education on leaving school, reflecting the continued low status of
further education in Ireland, as well as course experiences (particularly
access to social and academic supports, the prominence of workplace
learning and access to extra-curricular pursuits).
As outlined in Chapter 4, a comprehensive survey of learners was
undertaken between September 2015 and February 2016, tracking school
leavers approximately five years post leaving school. The objective of the
survey was to provide rich insights into the experiences of leavers,
including PLC leavers, in the post-school period. The survey samples were
drawn from the Department of Education and Skills (DES) Post-Primary
Pupil Database (PPPDB), following a methodology developed for the 2006
and 2007 school leavers surveys (see McCoy et al., 2007; Byrne et al.,
2009). All data presented in this chapter have been weighted on the basis
of gender, programme type and, for the PLC leavers, whether they were
under or over 25 years at the time of leaving. As detailed in Chapter 4, a
proxy questionnaire was developed with a more limited subset of
questions, which could be completed by a relative if the original
Evaluation of PLC programme provision |67
respondent was not available.69 Of the 1,220 responses, 427 were
completed by proxy.70,71 The analysis in this chapter is predominately
based on the non-proxy survey responses.
5.2 CONCEPTUALISING POST-SCHOOL PATHWAYS
In examining the main educational choices of school leavers, this chapter
is framed within the broader concept of pathways. The concept of
‘pathways’ has been prominent in cross-national policy debates and is,
according to Raffe (2003), best presented as a metaphor, rather than a
theory or analytical tool. The concept has been used in three main ways:
• to distinguish the main types of pathways beyond compulsory schooling and into
the labour market, to compare their strengths and weaknesses, and to determine
their relative size and role in an effective transition system;
• to examine the relationships and interconnections between pathways, and to
determine how best to organise systems of pathways; and
• to analyse the relationship between pathways and the ‘navigations’ of the young
people who use them; in particular, to consider how pathways can be organised
to reflect the perspectives and priorities of individuals and to enable them to
manage and control their own itineraries (ibid, p.5).
The pathways concept was most recently applied, in an Irish context, in the
Leaving School in Ireland study (McCoy et al, 2014), in which it served as a
valuable tool for understanding the nature of social inequality in
educational outcomes, and particularly post-school outcomes. A similar
approach is taken here. In particular, this analysis compares the
experiences of participants in the two main post-school pathways, namely
higher education and PLC, with a view to assessing the strengths and
weaknesses of these settings, with a focus on the PLC setting. It also throws
light on the extent and nature of linkages across pathways, providing
evidence on the levels of flexibility and connectedness in the Irish
educational system.
Much of the analysis in this chapter differentiates learners into four main
pathway groups, based on whether they had participated in each of the
main post-school education and training settings. The main focus is on how
people experience these different settings, particularly PLC participation,
69 Only basic job charactieristics were collected in the proxy questionnaire. Therefore, a subset of this chapter,
specifically the analysis on job quality, is performed using only data from the non-proxy survey. 70 A total of 4,730 questionnarires were issued, with 1,220 successful responses. 71 Proxy respondents, such as parents or relatives, were used as suitable substitutes if they could adequately
represent the ‘leaver’ by answering a reduced number of key questions from the survey.

68| Evidence from survey of learners: Student perceptions
so the classification is based on participation and not on completion:
• PLC;
• Higher education;
• PLC and higher education (PLC and HE);
• No PLC/higher education (LM entrants).
While the bulk of the PLC and higher education group progressed from PLC
courses into higher education, this was not the case for all and some
individuals participated in higher education prior to PLC participation. For
the last group – no PLC/higher education (henceforth labelled LM entrants)
– there is no evidence of participation in either PLC or higher education
courses. These individuals may have participated in another form of post-
school education or training; however, the majority of this group entered
the labour market directly on leaving school.
While this analysis focuses on PLC participants, the relative expectations,
experiences and reflections of other pathway groups provide valuable
insights into the common and unique experiences of different groups.
This chapter presents four main themes:
• a profile of PLC participants and other post-school pathway groups;
• PLC entry, main objectives and guidance;
• experience of PLC and higher education courses; and
• reflections on the pathways taken.
As much of this chapter centres on how PLC and higher education
participants reflect on their experiences, before, during and after their
course of study, it predominantly draws on data from the non-proxy
sample. The reduced set of questions completed by proxy respondents do
not, by and large, allow any insights into subjective experiences and or
decision-making processes. Given small sample sizes, much of the analysis
presented is based on descriptive statistics. However, the final section
presents multivariate models examining differences between pathway
groups in terms of their reflections on post-school choices made, levels of
regret and overall satisfaction with life, taking account of other factors that
may influence these outcomes. Overall, the analysis provides valuable
insights into how people experience PLC courses and the extent to which
their experiences differ from those taking higher education routes. This

Evaluation of PLC programme provision |69
focus on subjective experiences provides an important complement to the
analysis of more objective labour market outcomes in Chapter 4.
5.3 PROFILE OF PLC PARTICIPANTS
Reflecting the stratified sampling approach (specifically targeting leavers
from PLC programmes), a total of 45 per cent of the sample had
participated in PLC courses, while 53 per cent had taken part in some form
of higher education (Table 5.1).72 In line with earlier research (McCoy et
al., 2010), pathways are highly gendered – with females overrepresented
among the PLC groups, while males are disproportionally more likely to be
in the LM entrants group. In terms of average age, those in the PLC groups
are typically older than those in higher education or the LM. While PLC
participants are more likely to be in relationships than those in other
pathway groups, they are also more likely to have children. Almost one-
third of the PLC group are parents, relative to less than four per cent of
their higher education counterparts. Pathways are also socially patterned,
with Table 5.1 showing wide variation in the proportions of those with
parents who have a degree-level education. Six per cent of PLC participants
have mothers with degrees, compared to nearly one-quarter of higher
education participants. It is interesting to note the largely similar
educational background of the PLC and LM entrants groups. It can also be
noted that PLC participants who subsequently progress to higher
education are typically from more highly educated backgrounds than their
counterparts who do not make this transition. The same distinction applies
in relation to Leaving Certificate performance – learners who subsequently
progress to higher education show higher points attainment than those
who do not progress (53 per cent of those progressing secure in excess of
300 points relative to 34 per cent of those who do not progress).
A total of 8.4 per cent of the leavers had a special educational need (SEN)
that affected their learning while at school, with the figure somewhat
higher for males (11.6 per cent compared to 6.7 per cent for females).
While these SEN prevalence rates are lower than estimates based on
cohort studies, they are broadly consistent with estimates based on
administrative data (see Banks and McCoy (2011) for a discussion). SEN
rates were somewhat lower among leavers progressing to higher
education (four per cent), with levels of 11 per cent and 13 per cent among
the two PLC groups.
72 Unless otherwise stated, the survey of learners is the source for all the tables and figures in this chapter.
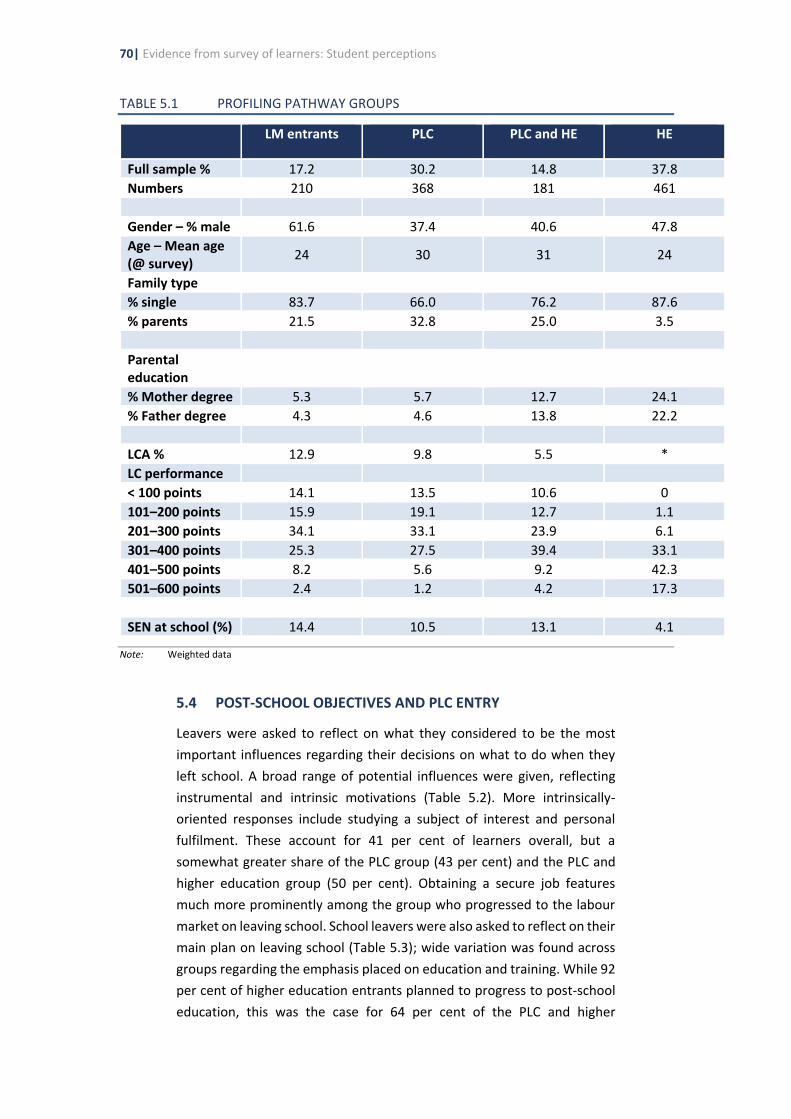
70| Evidence from survey of learners: Student perceptions
TABLE 5.1 PROFILING PATHWAY GROUPS
LM entrants PLC PLC and HE HE
Full sample % 17.2 30.2 14.8 37.8
Numbers 210 368 181 461
Gender – % male 61.6 37.4 40.6 47.8
Age – Mean age (@ survey)
24 30 31 24
Family type
% single 83.7 66.0 76.2 87.6
% parents 21.5 32.8 25.0 3.5
Parental education
% Mother degree 5.3 5.7 12.7 24.1
% Father degree 4.3 4.6 13.8 22.2
LCA % 12.9 9.8 5.5 *
LC performance
< 100 points 14.1 13.5 10.6 0
101–200 points 15.9 19.1 12.7 1.1
201–300 points 34.1 33.1 23.9 6.1
301–400 points 25.3 27.5 39.4 33.1
401–500 points 8.2 5.6 9.2 42.3
501–600 points 2.4 1.2 4.2 17.3
SEN at school (%) 14.4 10.5 13.1 4.1
Note: Weighted data
5.4 POST-SCHOOL OBJECTIVES AND PLC ENTRY
Leavers were asked to reflect on what they considered to be the most
important influences regarding their decisions on what to do when they
left school. A broad range of potential influences were given, reflecting
instrumental and intrinsic motivations (Table 5.2). More intrinsically-
oriented responses include studying a subject of interest and personal
fulfilment. These account for 41 per cent of learners overall, but a
somewhat greater share of the PLC group (43 per cent) and the PLC and
higher education group (50 per cent). Obtaining a secure job features
much more prominently among the group who progressed to the labour
market on leaving school. School leavers were also asked to reflect on their
main plan on leaving school (Table 5.3); wide variation was found across
groups regarding the emphasis placed on education and training. While 92
per cent of higher education entrants planned to progress to post-school
education, this was the case for 64 per cent of the PLC and higher

Evaluation of PLC programme provision |71
education group and just over half of the PLC and LM entrants groups.
Partly reflecting the socio-economic profile of the different groups,
securing employment featured more frequently in the plans of the PLC
groups and the group who progressed into the labour market.
TABLE 5.2 MAIN FACTOR IN POST-SCHOOL DECISION-MAKING
LM entrants PLC PLC and HE HE All
Studying subject of interest
27.2 32.8 43.6 27.8 31.5
Getting secure job/having an income
33.7 22.0 18 4.5 14.9
Personal fulfilment/interesting job
7.6 10.3 6.9 10.8 9.6
Other/no reason given
31.5 34.9 31.5 56.9 44.0
Note: Weighted data
TABLE 5.3 MAIN PLAN ON LEAVING SCHOOL
LM entrants PLC PLC and HE HE All
Education/training
50.5 53.1 64.1 91.5 71.1
Job 39.8 33.5 30.5 4.7 21.4
Other 9.7 13.4 5.4 3.8 7.5 Note: Weighted data
Research has highlighted the centrality of guidance and preparation for
(young) people – both academically and socially – to meet the demands of
post-school education (McCoy et al., 2014, p.195). Leavers were asked if
they had received any advice on potential post-school options from a
range of key sources – guidance counsellors, teachers, family members
and people working or studying in an area of interest. As shown in Figure
5.1, guidance counsellors constituted the most frequently cited source of
advice, followed closely by mothers. Those who progressed to higher
education were more likely to have received advice from their guidance
counsellor, a parent or teacher than those in the other pathway groups.
Overall, just half of leavers were satisfied with the advice available at
school on potential post-school options, with 31 per cent dissatisfied and
18 per cent very dissatisfied with advice available. School leavers who
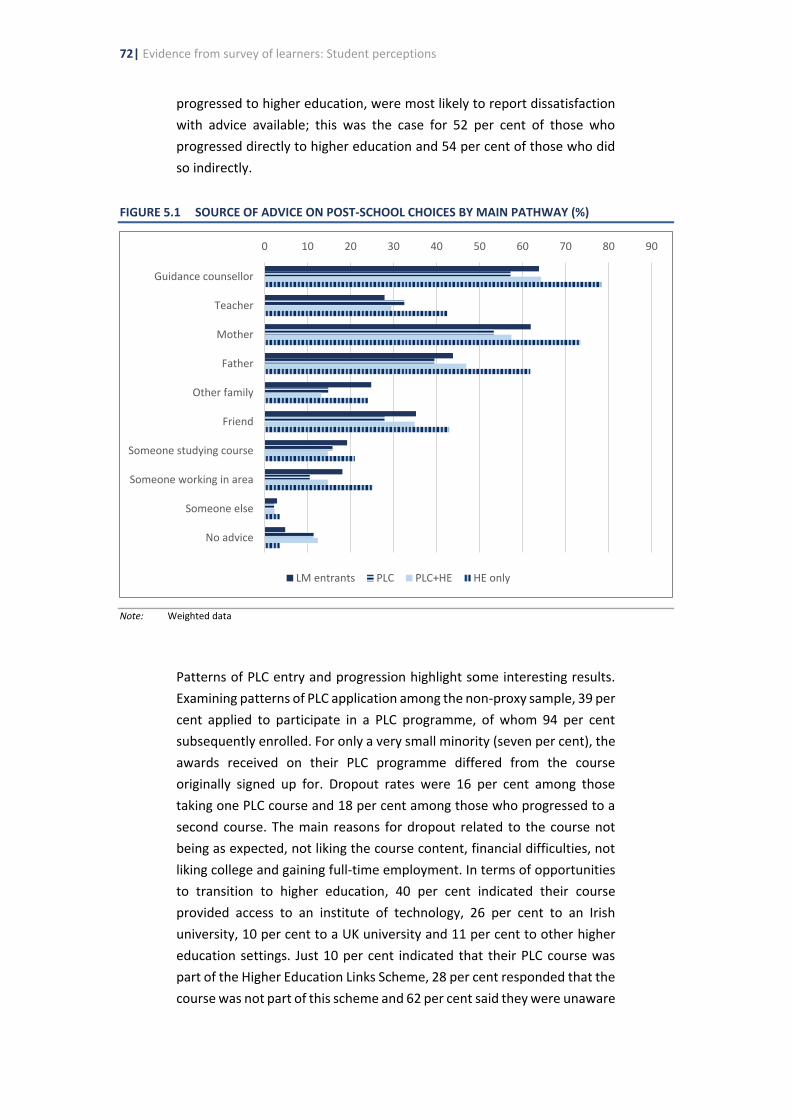
72| Evidence from survey of learners: Student perceptions
progressed to higher education, were most likely to report dissatisfaction
with advice available; this was the case for 52 per cent of those who
progressed directly to higher education and 54 per cent of those who did
so indirectly.
FIGURE 5.1 SOURCE OF ADVICE ON POST-SCHOOL CHOICES BY MAIN PATHWAY (%)
Note: Weighted data
Patterns of PLC entry and progression highlight some interesting results.
Examining patterns of PLC application among the non-proxy sample, 39 per
cent applied to participate in a PLC programme, of whom 94 per cent
subsequently enrolled. For only a very small minority (seven per cent), the
awards received on their PLC programme differed from the course
originally signed up for. Dropout rates were 16 per cent among those
taking one PLC course and 18 per cent among those who progressed to a
second course. The main reasons for dropout related to the course not
being as expected, not liking the course content, financial difficulties, not
liking college and gaining full-time employment. In terms of opportunities
to transition to higher education, 40 per cent indicated their course
provided access to an institute of technology, 26 per cent to an Irish
university, 10 per cent to a UK university and 11 per cent to other higher
education settings. Just 10 per cent indicated that their PLC course was
part of the Higher Education Links Scheme, 28 per cent responded that the
course was not part of this scheme and 62 per cent said they were unaware
0 10 20 30 40 50 60 70 80 90
Guidance counsellor
Teacher
Mother
Father
Other family
Friend
Someone studying course
Someone working in area
Someone else
No advice
LM entrants PLC PLC+HE HE only

Evaluation of PLC programme provision |73
(presumably of this scheme). Of leavers progressed to higher education,
47 cent per cent were enabled by their PLC course to gain advanced entry
to higher education (such as entering at second year).
5.5 EXPERIENCE OF PLC AND HIGHER EDUCATION COURSES
The learners survey provides valuable insights into school leavers’
experiences of post-school education, across a range of dimensions. These
include the intensity of their course, the extent to which they experienced
difficulties, the nature of support services available, the way in which they
funded their studies, their experience of teaching and learning, workplace
learning opportunities offered and the extent to which they developed a
range of skills and competencies. For the most part, similar questions were
asked in relation to both PLC and higher education participation, so it is
possible to compare student experience across these two distinct sectors.
As shown in Figure 5.2, PLC course intensity appears somewhat more
polarised than is the case for higher education courses – greater
proportions of PLC participants spend both few hours and many hours in
class contact time (lectures/tutorials): over one-fifth of PLC participants
spend less than nine hours per week in class, while 35 per cent spend in
excess of 30 hours per week in class. Much greater proportions of higher
education participants spend 10–19 or 20–29 hours per week in class (in
total 64 per cent compared to 42 per cent of PLC participants). However,
taking account of time spent on study, assignments and projects, higher
education courses appear more time-intensive than PLC courses. Almost
half of PLC course participants spend less than nine hours per week on such
outside class coursework, compared to 30 per cent of higher education
participants, the bulk of whom spend in excess of 20 hours on such
activities. Participation in sports, clubs and societies appears more
prevalent among higher education students – over 70 per cent spend at
least one hour per week engaging in such college activities, while nearly 60
per cent of PLC students do not participate at all. A total of 60 per cent of
PLC participants reported spending between one and five hours travelling
to/from their course per week; travel time was even longer for a further
one-quarter of PLC participants. Nearly 40 per cent of higher education
participants reported spending more than six hours per week travelling
to/from their college.
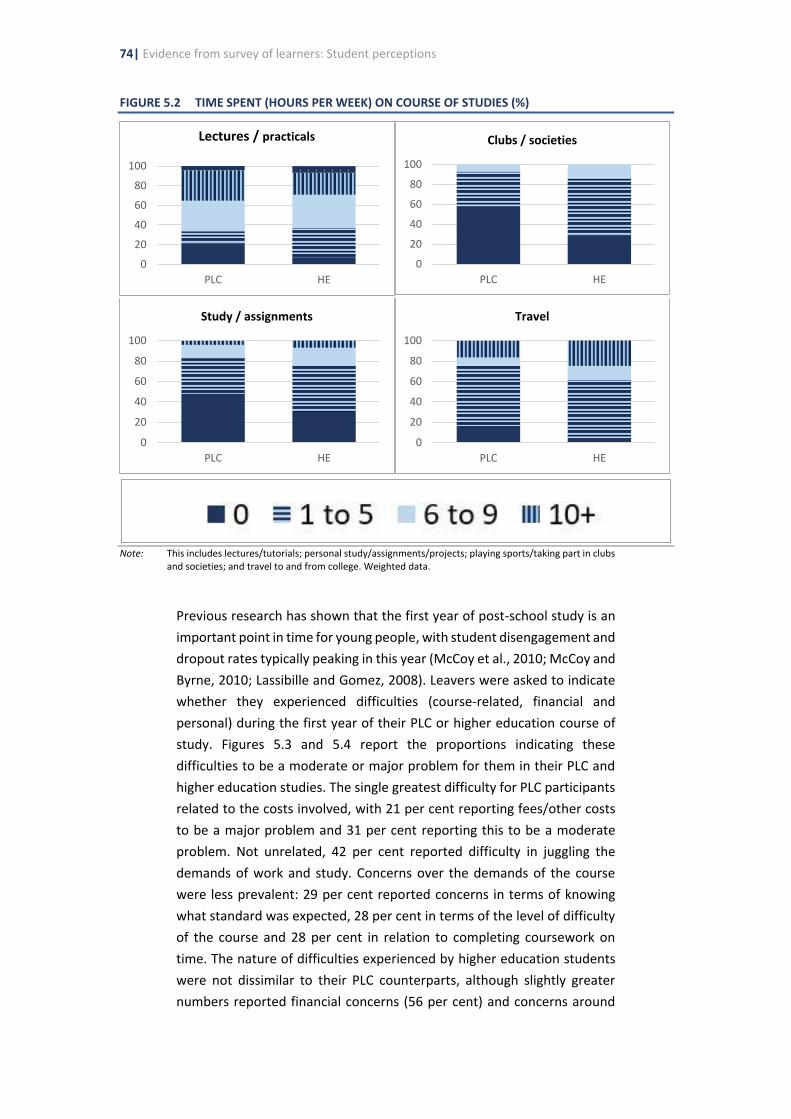
74| Evidence from survey of learners: Student perceptions
FIGURE 5.2 TIME SPENT (HOURS PER WEEK) ON COURSE OF STUDIES (%)
Note: This includes lectures/tutorials; personal study/assignments/projects; playing sports/taking part in clubs and societies; and travel to and from college. Weighted data.
Previous research has shown that the first year of post-school study is an
important point in time for young people, with student disengagement and
dropout rates typically peaking in this year (McCoy et al., 2010; McCoy and
Byrne, 2010; Lassibille and Gomez, 2008). Leavers were asked to indicate
whether they experienced difficulties (course-related, financial and
personal) during the first year of their PLC or higher education course of
study. Figures 5.3 and 5.4 report the proportions indicating these
difficulties to be a moderate or major problem for them in their PLC and
higher education studies. The single greatest difficulty for PLC participants
related to the costs involved, with 21 per cent reporting fees/other costs
to be a major problem and 31 per cent reporting this to be a moderate
problem. Not unrelated, 42 per cent reported difficulty in juggling the
demands of work and study. Concerns over the demands of the course
were less prevalent: 29 per cent reported concerns in terms of knowing
what standard was expected, 28 per cent in terms of the level of difficulty
of the course and 28 per cent in relation to completing coursework on
time. The nature of difficulties experienced by higher education students
were not dissimilar to their PLC counterparts, although slightly greater
numbers reported financial concerns (56 per cent) and concerns around
0
20
40
60
80
100
PLC HE
Lectures / practicals
0
20
40
60
80
100
PLC HE
Clubs / societies
0
20
40
60
80
100
PLC HE
Study / assignments
0
20
40
60
80
100
PLC HE
Travel
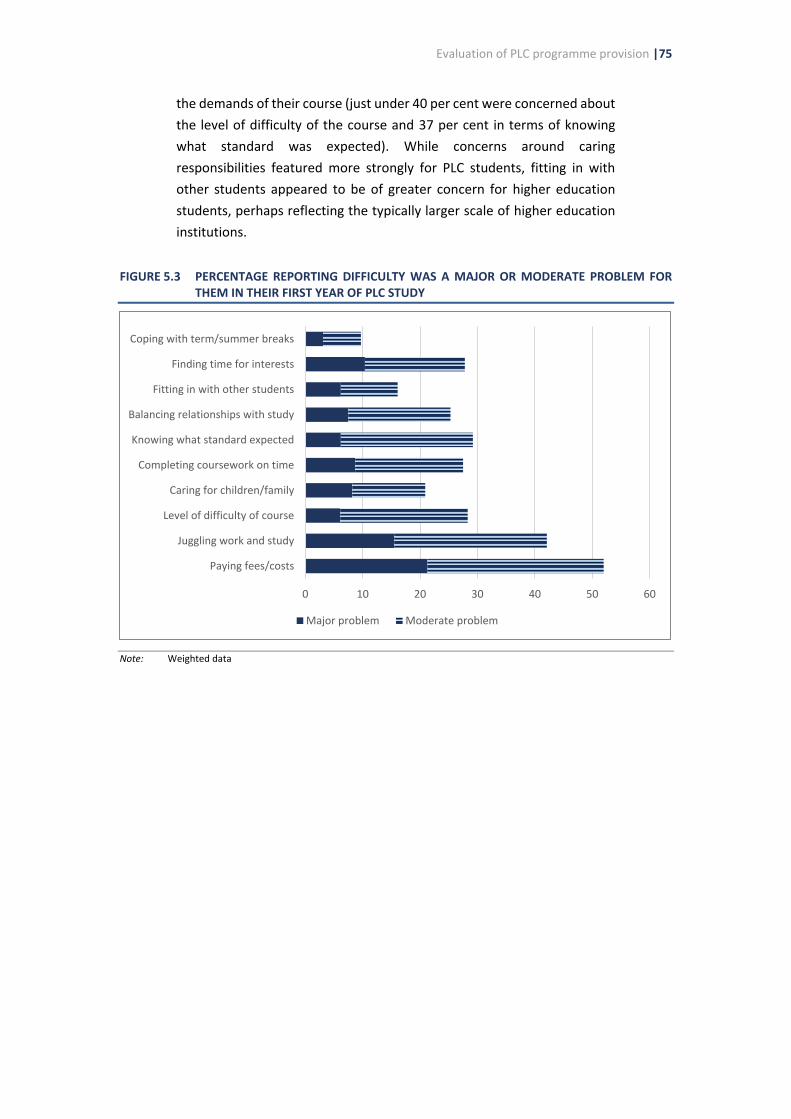
Evaluation of PLC programme provision |75
the demands of their course (just under 40 per cent were concerned about
the level of difficulty of the course and 37 per cent in terms of knowing
what standard was expected). While concerns around caring
responsibilities featured more strongly for PLC students, fitting in with
other students appeared to be of greater concern for higher education
students, perhaps reflecting the typically larger scale of higher education
institutions.
FIGURE 5.3 PERCENTAGE REPORTING DIFFICULTY WAS A MAJOR OR MODERATE PROBLEM FOR THEM IN THEIR FIRST YEAR OF PLC STUDY
Note: Weighted data
0 10 20 30 40 50 60
Paying fees/costs
Juggling work and study
Level of difficulty of course
Caring for children/family
Completing coursework on time
Knowing what standard expected
Balancing relationships with study
Fitting in with other students
Finding time for interests
Coping with term/summer breaks
Major problem Moderate problem
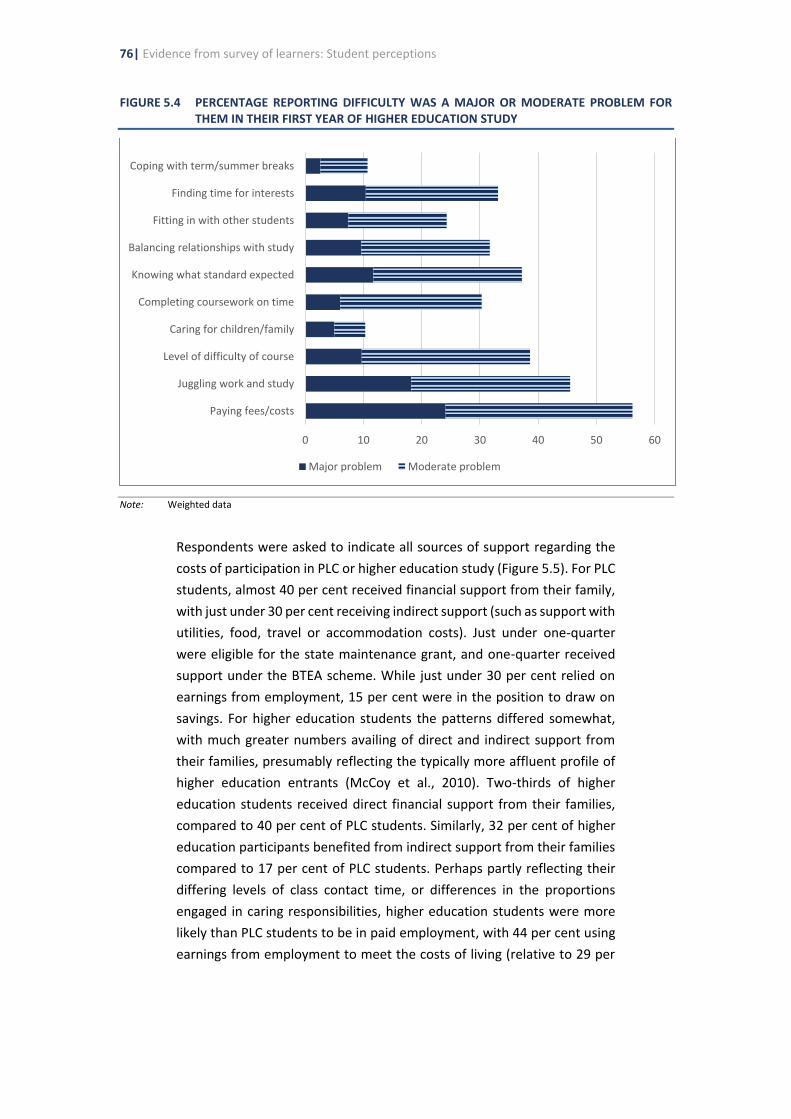
76| Evidence from survey of learners: Student perceptions
FIGURE 5.4 PERCENTAGE REPORTING DIFFICULTY WAS A MAJOR OR MODERATE PROBLEM FOR THEM IN THEIR FIRST YEAR OF HIGHER EDUCATION STUDY
Note: Weighted data
Respondents were asked to indicate all sources of support regarding the
costs of participation in PLC or higher education study (Figure 5.5). For PLC
students, almost 40 per cent received financial support from their family,
with just under 30 per cent receiving indirect support (such as support with
utilities, food, travel or accommodation costs). Just under one-quarter
were eligible for the state maintenance grant, and one-quarter received
support under the BTEA scheme. While just under 30 per cent relied on
earnings from employment, 15 per cent were in the position to draw on
savings. For higher education students the patterns differed somewhat,
with much greater numbers availing of direct and indirect support from
their families, presumably reflecting the typically more affluent profile of
higher education entrants (McCoy et al., 2010). Two-thirds of higher
education students received direct financial support from their families,
compared to 40 per cent of PLC students. Similarly, 32 per cent of higher
education participants benefited from indirect support from their families
compared to 17 per cent of PLC students. Perhaps partly reflecting their
differing levels of class contact time, or differences in the proportions
engaged in caring responsibilities, higher education students were more
likely than PLC students to be in paid employment, with 44 per cent using
earnings from employment to meet the costs of living (relative to 29 per
0 10 20 30 40 50 60
Paying fees/costs
Juggling work and study
Level of difficulty of course
Caring for children/family
Completing coursework on time
Knowing what standard expected
Balancing relationships with study
Fitting in with other students
Finding time for interests
Coping with term/summer breaks
Major problem Moderate problem

Evaluation of PLC programme provision |77
cent of PLC students).73 Higher education students were also more likely to
draw on savings to meet costs. It can also be noted that receipt of the state
maintenance grant was more prevalent among higher education students,
with 38 per cent receiving support compared to 24 per cent of PLC
students, though a smaller share of higher education students were
enrolled on the BTEA programme.
FIGURE 5.5 SOURCES OF FUNDING WHILE ON PLC OR HIGHER EDUCATION COURSE (%)
Note: Weighted data
Respondents were asked to indicate whether they had accessed a range of
student supports during the course of their PLC and higher education
studies. This included career guidance, counselling, learning supports,
childcare and disability support services (Table 5.4). Just over one-third of
PLC participants had accessed career guidance supports, somewhat lower
than the figure for higher education students (39 per cent). Chapter 3
showed that career guidance is provided in 93 per cent of PLC centres
(school or college), according to principal reports. The finding that just one-
third of PLC participants report having accessed this support suggests that
either students are not availing of career guidance that is provided, the
support is not accessible (e.g. through limited hours available), or they are
not satisfied with the nature of the service provided. Counselling services
were accessed by 10 and 13 per cent of PLC and higher education
participants. Despite considerably higher SEN prevalence levels among PLC
participants (see Table 5.1), a comparable number of PLC and higher
73 As noted in Table 5.1, a significant share those who participated in PLC courses have children – between 25
and 33 per cent, compared to just four per cent of those who participated solely in higher education.
0 10 20 30 40 50 60 70
Money from family
Indirect support from family
Earnings from employment
State grant
VTOS
BTEA
Other social welfare
Bank loan
Savings
HE PLC
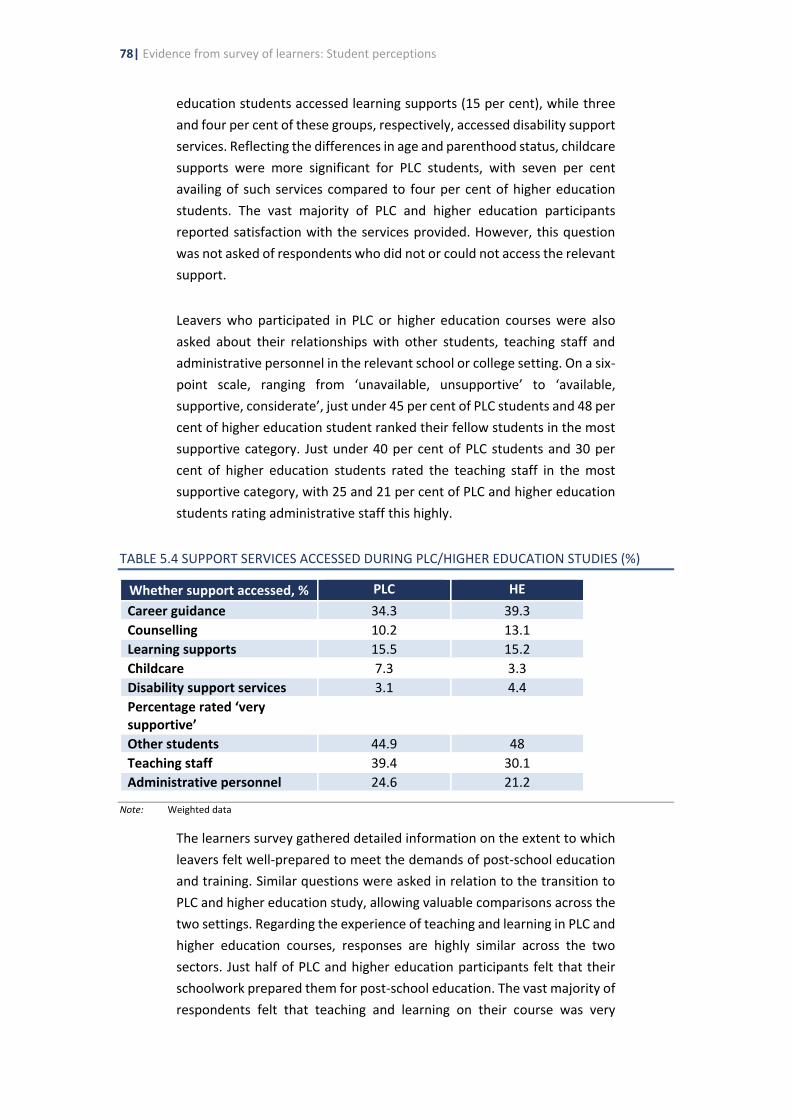
78| Evidence from survey of learners: Student perceptions
education students accessed learning supports (15 per cent), while three
and four per cent of these groups, respectively, accessed disability support
services. Reflecting the differences in age and parenthood status, childcare
supports were more significant for PLC students, with seven per cent
availing of such services compared to four per cent of higher education
students. The vast majority of PLC and higher education participants
reported satisfaction with the services provided. However, this question
was not asked of respondents who did not or could not access the relevant
support.
Leavers who participated in PLC or higher education courses were also
asked about their relationships with other students, teaching staff and
administrative personnel in the relevant school or college setting. On a six-
point scale, ranging from ‘unavailable, unsupportive’ to ‘available,
supportive, considerate’, just under 45 per cent of PLC students and 48 per
cent of higher education student ranked their fellow students in the most
supportive category. Just under 40 per cent of PLC students and 30 per
cent of higher education students rated the teaching staff in the most
supportive category, with 25 and 21 per cent of PLC and higher education
students rating administrative staff this highly.
TABLE 5.4 SUPPORT SERVICES ACCESSED DURING PLC/HIGHER EDUCATION STUDIES (%)
Whether support accessed, % PLC HE
Career guidance 34.3 39.3
Counselling 10.2 13.1
Learning supports 15.5 15.2
Childcare 7.3 3.3
Disability support services 3.1 4.4
Percentage rated ‘very supportive’
Other students 44.9 48
Teaching staff 39.4 30.1
Administrative personnel 24.6 21.2
Note: Weighted data
The learners survey gathered detailed information on the extent to which
leavers felt well-prepared to meet the demands of post-school education
and training. Similar questions were asked in relation to the transition to
PLC and higher education study, allowing valuable comparisons across the
two settings. Regarding the experience of teaching and learning in PLC and
higher education courses, responses are highly similar across the two
sectors. Just half of PLC and higher education participants felt that their
schoolwork prepared them for post-school education. The vast majority of
respondents felt that teaching and learning on their course was very
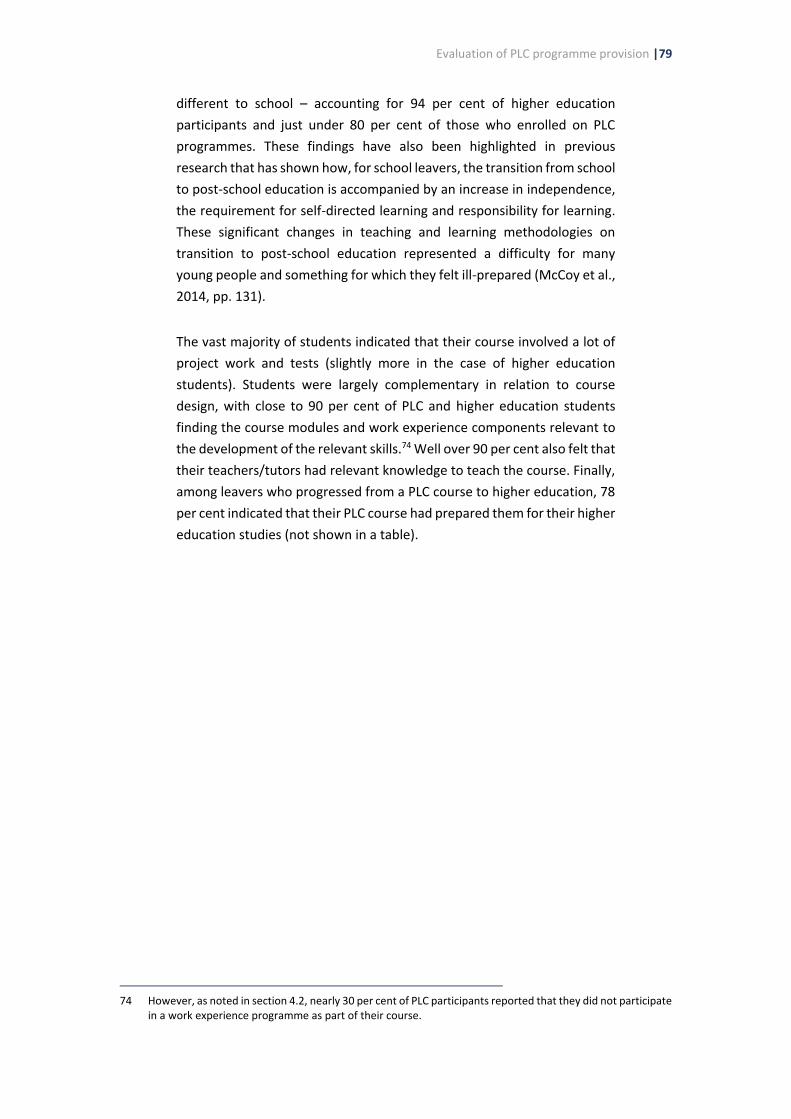
Evaluation of PLC programme provision |79
different to school – accounting for 94 per cent of higher education
participants and just under 80 per cent of those who enrolled on PLC
programmes. These findings have also been highlighted in previous
research that has shown how, for school leavers, the transition from school
to post-school education is accompanied by an increase in independence,
the requirement for self-directed learning and responsibility for learning.
These significant changes in teaching and learning methodologies on
transition to post-school education represented a difficulty for many
young people and something for which they felt ill-prepared (McCoy et al.,
2014, pp. 131).
The vast majority of students indicated that their course involved a lot of
project work and tests (slightly more in the case of higher education
students). Students were largely complementary in relation to course
design, with close to 90 per cent of PLC and higher education students
finding the course modules and work experience components relevant to
the development of the relevant skills.74 Well over 90 per cent also felt that
their teachers/tutors had relevant knowledge to teach the course. Finally,
among leavers who progressed from a PLC course to higher education, 78
per cent indicated that their PLC course had prepared them for their higher
education studies (not shown in a table).
74 However, as noted in section 4.2, nearly 30 per cent of PLC participants reported that they did not participate
in a work experience programme as part of their course.
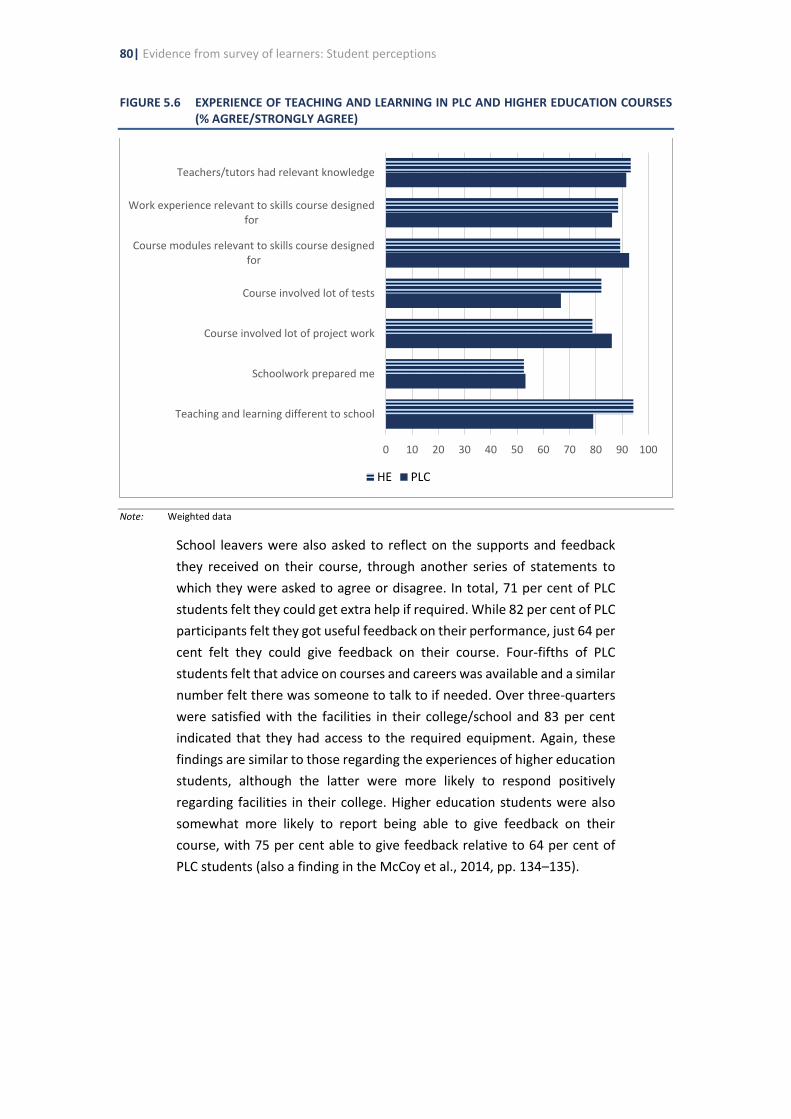
80| Evidence from survey of learners: Student perceptions
FIGURE 5.6 EXPERIENCE OF TEACHING AND LEARNING IN PLC AND HIGHER EDUCATION COURSES (% AGREE/STRONGLY AGREE)
Note: Weighted data
School leavers were also asked to reflect on the supports and feedback
they received on their course, through another series of statements to
which they were asked to agree or disagree. In total, 71 per cent of PLC
students felt they could get extra help if required. While 82 per cent of PLC
participants felt they got useful feedback on their performance, just 64 per
cent felt they could give feedback on their course. Four-fifths of PLC
students felt that advice on courses and careers was available and a similar
number felt there was someone to talk to if needed. Over three-quarters
were satisfied with the facilities in their college/school and 83 per cent
indicated that they had access to the required equipment. Again, these
findings are similar to those regarding the experiences of higher education
students, although the latter were more likely to respond positively
regarding facilities in their college. Higher education students were also
somewhat more likely to report being able to give feedback on their
course, with 75 per cent able to give feedback relative to 64 per cent of
PLC students (also a finding in the McCoy et al., 2014, pp. 134–135).
0 10 20 30 40 50 60 70 80 90 100
Teaching and learning different to school
Schoolwork prepared me
Course involved lot of project work
Course involved lot of tests
Course modules relevant to skills course designedfor
Work experience relevant to skills course designedfor
Teachers/tutors had relevant knowledge
HE PLC

Evaluation of PLC programme provision |81
FIGURE 5.7 SUPPORTS AND SERVICES IN PLC AND HIGHER EDUCATION (% AGREE/STRONGLY AGREE)
Note: Weighted data
As shown in Chapter 4, just under three-quarters of PLC students
participated in a work experience programme as part of their course.75 This
chapter presents additional insights, gained through their responses to a
series of statements regarding work-related knowledge and skill formation
or employability in their course. Respondents were asked to indicate the
frequency with which different aspects of workplace learning, such as
exploring how to apply their learning in the workplace, occurred
(never/very little, sometimes, often/very often). One-quarter of the PLC
cohort said they acquired work-related knowledge and skills ‘never’ or
‘very little’ while on their course (Figure 5.8). In contrast, just under half
believed they gained such skills ‘often’ or ‘very often’. Responses in
relation to industry placement or work experience were less positive, with
37 per cent indicating they never or rarely gained such opportunities while
on their PLC programme. While 43 per cent said they frequently explored
how to apply their learning in the workplace, again a sizeable percentage
(27 per cent) did not believe they had this opportunity. Further, just under
one-third indicated that learning on their course did not contribute to their
employability and 37 per cent rarely, if ever, gained the opportunity to
combine classroom-based learning with workplace experience while on
75 This question was not asked in relation to higher education courses.
0 10 20 30 40 50 60 70 80 90 100
I could get extra help if needed
I could get advice on courses/careers
I got useful feedback on performance
I could give feedback on course
There was someone to talk to if needed
Facilities in college were good
I had access to equipment needed
HE PLC

82| Evidence from survey of learners: Student perceptions
their PLC course.
For higher education students, similar concerns arose around workplace
learning and employability (Figure 5.9). Just under one-quarter of higher
education participants felt they did not get the opportunity to acquire
work-related knowledge and skills. Among PLC students, 37 per cent did
not benefit from industry placement or work experience opportunities on
their course, compared to 44 per cent of higher education participants.
However, higher education students appear more positive about their
learning contributing to their employability – with 58 per cent indicating
this occurred frequently on their course compared to 38 per cent of their
PLC counterparts. A sizeable 40 per cent of higher education students felt
that over the course of their studies they rarely had the opportunity to
combine classroom-based learning with work experience.
FIGURE 5.8 FREQUENCY OF EXPERIENCE OF WORKPLACE LEARNING ON PLC COURSE (%)
Note: Weighted data
0% 10% 20% 30% 40% 50% 60% 70% 80% 90% 100%
Classroom based learning combined with workplaceexperience
Learning on course contributed to employability
Explored how to apply your learning in workplace
Industry placement/work experience
Acquired work-related knowledge/skills
Never/very little Sometimes (Very) often

Evaluation of PLC programme provision |83
FIGURE 5.9 FREQUENCY OF EXPERIENCE OF WORKPLACE LEARNING ON HIGHER EDUCATION COURSE (%)
Note: Weighted data
Finally, respondents were asked to assess the extent to which they had
acquired a range of skills and competencies, by the time the survey was
being conducted. These skills could have been acquired at any point,
including during second-level education, post-school education or in the
labour market. Overall, learners were most positive about their ICT skills,
with 58 per cent indicating they had gained these skills to ‘a great extent’.
Almost half of respondents were highly positive about their written and
oral communication skills. In line with earlier research (McCoy et al., 2014,
p.158), leavers were least positive about their ability to write/speak in a
foreign language – almost 70 per cent are highly critical of their skills in this
domain. The majority of respondents were somewhat positive about their
ability to perform well under pressure, while over half felt they were able
to work well with others to ‘a great extent’. In excess of 60 per cent were
somewhat positive regarding both their ability to come up with new
ideas/solutions and the analytical skills they had gained. Additional
analyses examined the extent to which pathway groups differ in their self-
assessed skills and competencies. For the most part, responses do not vary
across the groups, despite wide differences in education duration. Those
who had participated in higher education were slightly more positive about
their written communication, oral communication and computer skills, but
the differences are not substantial. Females emerged as being more
positive across all domains, as did leavers from more highly educated
backgrounds.
0% 10% 20% 30% 40% 50% 60% 70% 80% 90% 100%
Classroom based learning combined withworkplace experience
Learning on course contributed to employability
Explored how to apply your learning in workplace
Industry placement/work experience
Acquired work-related knowledge/skills
Never/very little Sometimes (Very) often

84| Evidence from survey of learners: Student perceptions
FIGURE 5.10 EXTENT TO WHICH SKILLS AND COMPETENCIES HAVE BEEN ACHIEVED BY ALL LEARNERS (%)
Note: Weighted data
5.6 REFLECTIONS ON PATHWAYS TAKEN
5.6.1 Reflections on post-school choices
This final section examines subjective dimensions of young people’s
outcomes, including decision making, wellbeing and satisfaction with life
five to six years after leaving school or a PLC programme. These areas,
crucial to an in-depth assessment of the PLC programme, have received
much less attention in the international and national literature, as
compared to the educational and labour market trajectories of young
people. The section begins with an examination of decision making and
goal realisation among the school leavers, followed by an analysis of social
inclusion, financial wellbeing and satisfaction with life (in section 5.6.2).
International research has highlighted that not all young people realise
their aspirations, and outcomes reflect a complex set of interactions
relating to individual, institutional and structural factors. Hodkinson and
Sparkes (1997), for example, argues that decision making results from the
ways opportunities are structured differently for individuals, reflecting the
availability of different forms of capital. Similarly, Frigo et al. (2007) argue
that decision-making styles vary from careful gathering of information and
weighing up options to acting on intuition. However, they highlight
economic/instrumental rationality models (decision making as a rational
process) and structuralist models (decisions as the result of external
forces) as key to understanding decision-making processes among young
people. Respondents were asked whether they got to do what they
0% 10% 20% 30% 40% 50% 60% 70% 80% 90% 100%
Written communication skills
Oral communication skills
Using computers/internet
Analytical skills
Perform well under pressure
Work well with others
Come up with new ideas/solutions
Write/speak foreign language
Knowledge of field of study/work
Not at all/very little Some Great extent

Evaluation of PLC programme provision |85
planned after leaving school. Overall, 15 per cent of school leavers did not
get to do what they had planned, with the figure somewhat higher for
males (19 per cent, compared to 13 per cent for females). Goal realisation
is also strongly differentiated by social background. Figure 5.11 shows
results according to post-school pathway, with wide differences across the
groups apparent. School leavers who pursued PLC courses were least
satisfied in terms of goal realisation – less than 40 per cent felt they
achieved their plans. Those who progressed to higher education are most
likely to have achieved their goals (71 per cent), while the bulk of school
leavers who progressed to higher education via PLC courses do not feel
they achieved their goals fully (24 per cent did not achieve their goals and
a further 34 per cent only partly achieved their goals). Among those
entering the labour market, 48 per cent report realised their goals,
although nearly one-third reported compromising their goals; in other
words, realising their them ‘to some extent’. Interestingly, the majority of
PLC entrants who applied to (but did not enrol in) higher education felt
they did not realise their goals.
FIGURE 5.11 DID LEAVERS GET TO DO WHAT THEY PLANNED AFTER LEAVING SCHOOL? (%)
Note: Weighted data
Further analyses were undertaken to explore the simultaneous effects of
post-school pathway, social background factors and Leaving Certificate
performance on whether young people reported realising the plans they
had made while at school, allowing a more like-for-like comparison across
the pathway groups. Those who had not realised their plans are contrasted
against those who had (partly or fully) secured their preferred outcome. In
0
10
20
30
40
50
60
70
80
90
100
LM entrants PLC PLC+HE HE only
Yes To some extent No

86| Evidence from survey of learners: Student perceptions
Table 5.5, we present odds ratio results where the outcome of the model
is binary (not achieving goals versus achieving goals). An odds ratio of
greater than one indicates an increase in the probability of not achieving
goals, while an odds ratio of lower than one indicates a reduced probability
of not achieving goals. Table 5.5 shows the summary results for the
influence of main pathway, gender, social background and educational
achievement on goal realisation. The full set of results is shown in Table
A17 in Appendix A.
Model 1 shows the impact of the main pathway taken on young people
reflecting that they did not realise their goals. In line with the descriptive
results, young people who pursued PLC courses are most likely to report
not realising their goals – they are nearly six times more likely to indicate
this than those who progressed to higher education on leaving school.
Those who enrolled on PLC and higher education courses are 4.7 times
more likely to not realise their goals, while entrants to the labour market
are nearly five times more likely to not realise their goals. Overall, males
are 1.7 times more likely to not realise their goals than their female peers.
Model 2 takes into account a range of individual and family background
factors (family type, parenthood, presence of a SEN and parental
educational level), as these may underlie lower goal realisation for some
groups. The results show that presence of a SEN while at school and having
a child (at the time of the survey) are both associated with not achieving
goals. Each of the pathway groups (‘PLC’, ‘PLC and higher education’ and
‘LM entrants’) remain significantly more likely to not achieve their goals
even when we take account of these individual and family characteristics,
although the magnitude of the effect is somewhat reduced. In other
words, all else being equal, young people who progressed to PLC
programmes are four times more likely to not achieve their goals than
those who progressed to higher education.
Model 3 takes account of the impact of academic achievement on realising
post-school plans. Not surprisingly, given the centrality of grades in terms
of access to higher education, in particular, higher-performing leavers are
significantly less likely to not realise their goals. The differences across the
pathway groups become insignificant once we take account of educational
achievement. Thus, PLC students are less likely to have achieved their goals
because of their lower Leaving Certificate grades. In line with earlier
research (McCoy et al., 2014, pp. 100), higher grades facilitate access to
preferred post-school routes. PLC courses appear to have been a
compromise in a context of not achieving adequate grades to pursue
higher education, highlighting the continued lower status of PLC

Evaluation of PLC programme provision |87
programmes in the Irish system (McGuiness et al., 2014, pp. 39).
TABLE 5.5 HOW MUCH MORE LIKELY ARE LEAVERS TAKING DIFFERENT PATHWAYS TO FEEL THEY DID NOT GET THE POST-SCHOOL CHOICES THEY HAD PLANNED? (ODDS RATIOS)
Model 1
(Pathway and
gender)
Model 2 (Add
controls for family
background)
Model 3 (Add
controls for LC
points)
Higher education
(ref.) 1.000 1.000 1.000
PLC 5.568 4.059 n.s.
PLC + HE 4.701 3.725 n.s.
LM entrants 4.979 3.835 n.s.
Male 1.691 1.788 1.593
Notes: n.s. = not statistically significant. See Appendix Table A1.17 for the full model. All figures shown differ significantly
from the reference group (ref.). Non-proxy sample only.
School leavers were also asked whether they would take the same
pathway if they were free to choose again.76 Overall, one-third of school
leavers said they regret the choices they made, with somewhat higher
levels of regret among males. School leavers who had not realised their
goals were also more likely to say they would not pursue the same route.
Clear differences were evident across the pathway groups, with young
people pursuing PLC courses more likely to regret the pathway chosen,
either partly or entirely (Figure 5.12). In total, 45 per cent of PLC
participants would not take the same pathway again and 43 per cent of
those who pursued PLC and higher education courses would not make the
same decisions. Nearly one-quarter of higher education entrants would
not take the same pathway.
Multivariate modelling was used to examine the simultaneous impact of a
range of factors on regretting the pathway chosen on leaving school.
Respondents who would not take the same route again are contrasted
against those who would choose the same pathway again, either partly or
entirely (Table 5.6; full results reported in Table A18 in Appendix A). In
keeping with the descriptive results, there are significant differences
across the pathway groups in Model 1, with the PLC groups nearly three
76 The question asked, ‘Looking back, if you were free to choose again, would you take the same pathway
(education, training or job)?’ Respondents could respond ‘yes’, ‘to some extent’ or ‘no’.

88| Evidence from survey of learners: Student perceptions
times more likely to regret their pathway decisions. Over and above the
effect of individual social background (Model 2), the PLC and ‘PLC and
higher education’ groups are 2.2 and 2.4 times more likely to regret their
choices, compared with those who progressed directly to higher
education. Model 3 takes account of educational achievement; here,
again, educational qualifications operate as a means of securing preferred
outcomes. There are no longer significant differences across the pathway
groups in terms of regret with post-school decisions. In other words,
greater regret among the PLC groups is largely explained by their Leaving
Certificate performance not being sufficiently high to allow access to
higher education.
Additional analyses examined the role of guidance received at school on
decision-making and regret. The results show that young people who
express dissatisfaction with the guidance available while at school are
significantly more likely to regret their choices on leaving school.
FIGURE 5.12 WOULD LEAVERS TAKE THE SAME PATHWAY AGAIN? (%)
Note: Weighted data
0
10
20
30
40
50
60
70
80
90
100
LM entrants PLC PLC+HE HE only
Yes To some extent No
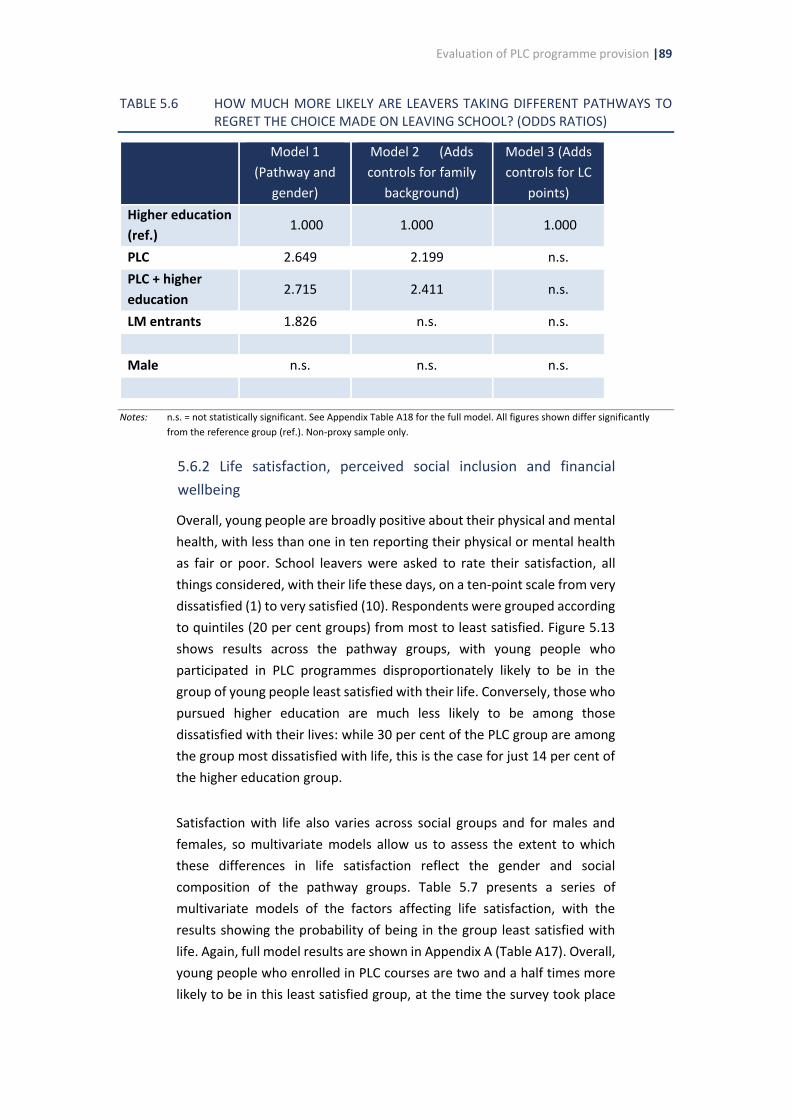
Evaluation of PLC programme provision |89
TABLE 5.6 HOW MUCH MORE LIKELY ARE LEAVERS TAKING DIFFERENT PATHWAYS TO REGRET THE CHOICE MADE ON LEAVING SCHOOL? (ODDS RATIOS)
Model 1
(Pathway and
gender)
Model 2 (Adds
controls for family
background)
Model 3 (Adds
controls for LC
points)
Higher education
(ref.) 1.000 1.000 1.000
PLC 2.649 2.199 n.s.
PLC + higher
education 2.715 2.411 n.s.
LM entrants 1.826 n.s. n.s.
Male n.s. n.s. n.s.
Notes: n.s. = not statistically significant. See Appendix Table A18 for the full model. All figures shown differ significantly
from the reference group (ref.). Non-proxy sample only.
5.6.2 Life satisfaction, perceived social inclusion and financial
wellbeing
Overall, young people are broadly positive about their physical and mental
health, with less than one in ten reporting their physical or mental health
as fair or poor. School leavers were asked to rate their satisfaction, all
things considered, with their life these days, on a ten-point scale from very
dissatisfied (1) to very satisfied (10). Respondents were grouped according
to quintiles (20 per cent groups) from most to least satisfied. Figure 5.13
shows results across the pathway groups, with young people who
participated in PLC programmes disproportionately likely to be in the
group of young people least satisfied with their life. Conversely, those who
pursued higher education are much less likely to be among those
dissatisfied with their lives: while 30 per cent of the PLC group are among
the group most dissatisfied with life, this is the case for just 14 per cent of
the higher education group.
Satisfaction with life also varies across social groups and for males and
females, so multivariate models allow us to assess the extent to which
these differences in life satisfaction reflect the gender and social
composition of the pathway groups. Table 5.7 presents a series of
multivariate models of the factors affecting life satisfaction, with the
results showing the probability of being in the group least satisfied with
life. Again, full model results are shown in Appendix A (Table A17). Overall,
young people who enrolled in PLC courses are two and a half times more
likely to be in this least satisfied group, at the time the survey took place
90| Evidence from survey of learners: Student perceptions
(five to six years after leaving school), compared to those who progressed
to higher education. Those who did not pursue higher education or PLC
courses are also disproportionately more likely to be in the least satisfied
group.
Even controlling for individual family circumstances and social background
characteristics (Model 2), PLC participants are more dissatisfied with their
lives, as recorded at the time of the survey. Relative to higher education
entrants, all other pathway groups are twice as likely to be among the least
satisfied group. It is interesting to note that those who are parents and
those who experienced a SEN while at school are also more likely to be
dissatisfied with their lives.
As in previous analysis, the final model takes account of educational
performance in predicting dissatisfaction with life. Those who achieved
higher Leaving Certificate grades have a lower risk of being in the group
dissatisfied with life (results for the 401–500 and 501–600 groups are just
outside statistical significance). Once again, when we take account of
grades, differences across the pathway groups are no longer significant.
Performance at second level clearly plays a central role in shaping life
opportunities and in enabling access to the post-school educational
pathways, particularly higher education, which maximises young peoples’
life satisfaction and fulfilment.
FIGURE 5.13 SATISFACTION WITH LIFE: PERCENTAGE IN THE LEAST AND MOST SATISFIED QUINTILES
Note: Weighted data
0
5
10
15
20
25
30
35
LM entrants PLC PLC+HE HE only
Most satisfied quintile Least satisfied quintile

Evaluation of PLC programme provision |91
TABLE 5.7 HOW MUCH MORE LIKELY ARE LEAVERS TAKING DIFFERENT PATHWAYS TO BE IN THE GROUP LEAST SATISFIED WITH LIFE? (ODDS RATIOS)
Model 1
(Pathway and
gender)
Model 2 (Adds
controls for family
background)
Model 3 (Adds
controls for LC
points)
Higher education
(ref.) 1.000 1.000 1.000
PLC 2.510 2.131 n.s.
PLC + higher
education 2.310 2.035 n.s.
LM entrants 2.511 2.033 n.s.
Male n.s. n.s. n.s.
Notes: n.s. = not statistically significant. See Appendix Table A19 for the full model. All figures shown differ significantly
from the reference group (ref.). Non-proxy sample only.
The survey of leavers taps into two other important dimensions of quality
of life: social inclusion and financial security. Respondents were asked a
series of questions regarding their feelings of self-worth and participation
in society. Responses to these items combine to produce a global measure
of social inclusion (with high reliability, alpha .79).77 The items included:
• I generally feel that what I do in life is worthwhile;
• I feel left out of society;
• Life has become so complicated today that I almost can’t find my way;
• I feel that the value of what I do is not recognised by others; and
• Some people look down on me because of my life situation or income.
Responses are differentiated into those in the lowest and highest quintiles
– that is, those who are least and most socially included. Among school
leavers who pursued PLC qualifications, 30 per cent fall in the least socially
included quintile, compared to 15 per cent of higher education
participants. While 25 per cent of higher education participants fare well
in terms of this measure of social inclusion, this is the case for just 19 and
13 per cent of the PLC and PLC&higher education groups. Those who did
not pursue either higher education or PLC course fall close to the overall
average in terms of social inclusion.
77 These items are drawn from Eurofound’s European Quality of Life Survey (2015).
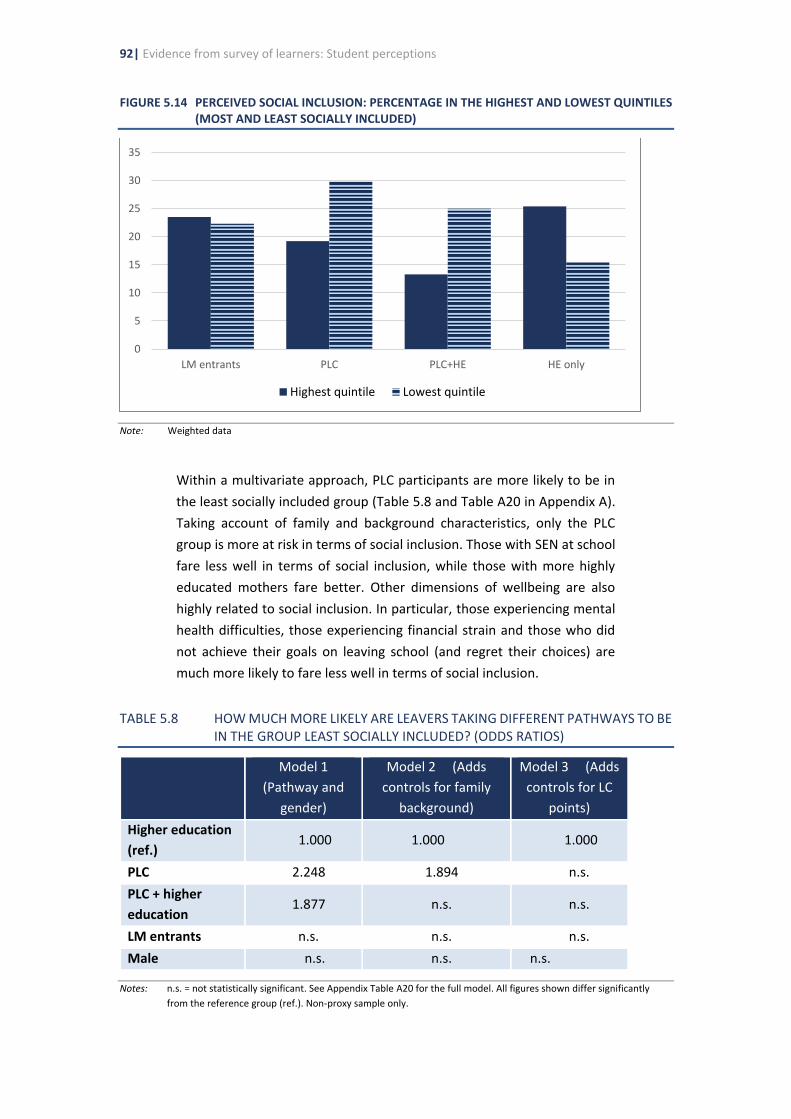
92| Evidence from survey of learners: Student perceptions
FIGURE 5.14 PERCEIVED SOCIAL INCLUSION: PERCENTAGE IN THE HIGHEST AND LOWEST QUINTILES (MOST AND LEAST SOCIALLY INCLUDED)
Note: Weighted data
Within a multivariate approach, PLC participants are more likely to be in
the least socially included group (Table 5.8 and Table A20 in Appendix A).
Taking account of family and background characteristics, only the PLC
group is more at risk in terms of social inclusion. Those with SEN at school
fare less well in terms of social inclusion, while those with more highly
educated mothers fare better. Other dimensions of wellbeing are also
highly related to social inclusion. In particular, those experiencing mental
health difficulties, those experiencing financial strain and those who did
not achieve their goals on leaving school (and regret their choices) are
much more likely to fare less well in terms of social inclusion.
TABLE 5.8 HOW MUCH MORE LIKELY ARE LEAVERS TAKING DIFFERENT PATHWAYS TO BE IN THE GROUP LEAST SOCIALLY INCLUDED? (ODDS RATIOS)
Model 1
(Pathway and
gender)
Model 2 (Adds
controls for family
background)
Model 3 (Adds
controls for LC
points)
Higher education
(ref.) 1.000 1.000 1.000
PLC 2.248 1.894 n.s.
PLC + higher
education 1.877 n.s. n.s.
LM entrants n.s. n.s. n.s.
Male n.s. n.s. n.s.
Notes: n.s. = not statistically significant. See Appendix Table A20 for the full model. All figures shown differ significantly
from the reference group (ref.). Non-proxy sample only.
0
5
10
15
20
25
30
35
LM entrants PLC PLC+HE HE only
Highest quintile Lowest quintile

Evaluation of PLC programme provision |93
Recent research has highlighted the impact of financial wellbeing on
broader socio-emotional wellbeing and quality of life (Watson et al., 2014).
Further, earlier analysis (section 5.5) revealed that financial pressures
constituted the single biggest difficulty facing young people during the
course of their post-school studies. Respondents were asked about the
extent to which their household is able to make ends meet (at the time of
the survey), with possible responses ranging from ‘very easily’ to ‘with
great difficulty’. Overall, 14 per cent of respondents indicated they
experienced (great) difficulty in making ends meet. Results were again
strongly differentiated according to post-school pathway, with the PLC
groups more likely to report experiencing financial difficulty. While one-
third of higher education participants and 36 per cent of labour market
entrants reported relative ease in terms of making ends meet, this was the
case for 18 and 23 per cent of the PLC groups. One in five PLC participants
report (great) financial difficulties, and an additional one-third report
‘some difficulty’ in making ends meet. This compares to less than 30 per
cent of higher education entrants reporting any level of difficulty in
meeting current living costs. Given the findings in Chapter 4 that showed
similar employment chances and wage levels, these findings may reflect
additional caring responsibilities and perhaps part-time employment
among the PLC groups.
Multivariate models allow a greater understanding of the factors shaping
financial insecurity. As shown in Table 5.9 and Table A21 in Appendix A,
again PLC participants do less well (Model 1) than their counterparts who
progressed to higher education on leaving school. However, much of this
difference is accounted for by family circumstances. Respondents with
children are significantly more likely to experience difficulty in making ends
meet. Further analysis also shows that failure to achieve post-school goals
and regret at decisions made play an important role in understanding
financial insecurity, at least in the five to six years post leaving school/PLC
programmes.

94| Evidence from survey of learners: Student perceptions
FIGURE 5.15 ABILITY TO MAKE ENDS MEET FOR LEAVER HOUSEHOLDS (%)
Note: Weighted data
TABLE 5.9 HOW MUCH MORE LIKELY ARE LEAVERS TAKING DIFFERENT PATHWAYS TO EXPERIENCE DIFFICULTY IN MAKING ENDS MEET? (ODDS RATIOS)
Model 1
(Pathway and
gender)
Model 2 (Adds
controls for family
background)
Model 3 (Adds
controls for LC
points)
Higher education
(ref.) 1.000 1.000 1.000
PLC 3.054 n.s. n.s.
PLC + HE 3.938 2.350 n.s.
LM entrants 2.719 n.s. n.s.
Male n.s. n.s. n.s.
Notes: n.s. = not statistically significant. See Appendix Table A21 for the full model. All figures shown differ significantly
from the reference group (ref.). Non-proxy sample only.
5.7 SUMMARY AND CONCLUSIONS
This chapter has looked at how school leavers participating in PLC
programmes experience these programmes and how their educational
experiences compare with other groups, particularly those taking higher
education courses. Participants in PLC programmes are disproportionately
female and from less educated backgrounds. They are also more likely to
have experienced a SEN while at school than their counterparts directly
0
10
20
30
40
50
60
70
80
90
100
LM entrants PLC PLC+HE HE only
(Very) easily Fairly easily Some difficulty With (great) difficulty

Evaluation of PLC programme provision |95
enrolling in higher education. It is interesting to note that students who
successfully progress from PLC to higher education programmes of study
are typically from more highly educated backgrounds and have themselves
received higher grades in the Leaving Certificate examination than those
who do not progress. In terms of plans on leaving school, just half of the
PLC group from this survey planned on pursuing education/training, while
those enrolling in higher education were more definite in their plans for
further study. This likely reflects the greater emphasis placed on higher
education opportunities and application processes within second-level
schools (McCoy et al., 2014). However, dissatisfaction levels with guidance
counselling supports at second level were high for all pathway groups.
Such dissatisfaction is a key factor in school leavers later reflecting with
regret on their post-school choices.
The survey gathered valuable information on PLC students’ experiences
across a range of aspects of their programmes of study, including course
intensity, transition difficulties, meeting the costs of education
participation, academic and social supports available and teaching and
learning approaches. Course intensity varied widely among PLC
participants, with considerable numbers spending either fewer or more
hours than average in class. Most likely reflecting the school-based nature
of much PLC provision, the vast majority of PLC students do not participate
in sports/clubs or societies, unlike their higher education counterparts. PLC
students were also less likely to access career guidance supports and
counselling supports. Despite considerably higher SEN prevalence rates
among PLC entrants, proportions accessing learning supports and disability
support services were comparable (at 15 and three to four per cent,
respectively). PLC students were more likely than higher education
students to rate their teachers as highly supportive/available, although
both PLC and higher education students were generally less positive about
administrative staff.
The single greatest difficulty faced on transition to PLC study related to the
financial aspects of studying. Such concerns also arose among higher
education participants, but the two groups of students (PLC and higher
education) differed somewhat in terms of the sources of funding in
meeting college costs. Partly reflecting the differing socio-economic profile
of the two groups, higher education students were more likely to receive
direct and indirect support from their families. However, higher education
students were also more likely to be in receipt of the state maintenance
grant. PLC students were more likely to be in receipt of the BTEA and less
likely to be in paid employment. Beyond the financial demands of (full-
time) study, concerns around the academic demands of their course also

96| Evidence from survey of learners: Student perceptions
arose among PLC students, but these were less prevalent than among
higher education respondents. Overall, and in line with earlier research
(McCoy et al., 2014), the significant changes in teaching and learning
methodologies that accompanied the transition to post-school education
(PLC and higher education), particularly the shift towards more
independent learning approaches, represented a difficulty for many and
something for which they felt ill-prepared.
PLC students reported that they were largely satisfied with the relevance
of course design and the vast majority felt their teachers/tutors had the
required knowledge. It is also interesting that the vast majority of those
progressing to higher education felt their PLC course prepared them for it.
However, for both PLC and higher education students, responses were less
positive in relation to the prominence of workplace learning in their
course. One-quarter of PLC participants acquired work-related skills
‘never’ or ‘very little’, while over one-third did not gain industry placement
or work experience opportunities. In addition, one-third indicated that
learning on their course did not contribute to their employability.
The final section provides some important insights into the lives and
reflections of young people who pursued different pathways on leaving
school. Perhaps reflecting the experiences of PLC students, particularly in
relation to the range of supports available, the prominence of workplace
learning on their courses and access to extra-curricular clubs and societies,
PLC participants are less positive in their reflections than their
counterparts who progressed to higher education on leaving school. For
many, PLC courses are still seen as a compromise, in a context of not
achieving adequate grades to pursue higher education, highlighting the
continued lower status of further education in Ireland (McGuinness et al.,
2014). Similar findings emerge in relation to life satisfaction, measures of
social inclusion and financial wellbeing. PLC participants fare less well, and
second-level grades play a central role in shaping young peoples’
opportunities to pursue post-school pathways that will maximise
opportunities for personal fulfilment and achievement. Additionally,
family circumstances play an important role in understanding wellbeing
and particularly financial insecurity – those with children experience much
greater challenges in this regard and this explains much of the difference
between the pathway groups.

Summary and implications for policy|97
CHAPTER 6
Summary and implications for policy
6.1 INTRODUCTION
Post-Leaving Certificate (PLC) courses represent the largest component of
full-time further education and training (FET) provision in Ireland, with
over 32,000 learners enrolled in such courses in 2015–2016. Recent
research on the FET sector as a whole highlighted concerns around its
structures and responsiveness to labour market conditions, among other
issues (McGuinness et al., 2014). The SOLAS FET Strategy (2014)
subsequently pointed to the need for a stronger evidence base in order to
inform future policy development in the sector. This study, commissioned
by SOLAS, provides a more detailed evaluation of PLC provision. In doing
so, it draws on three complementary research strands. Firstly, desk-based
analysis of administrative data was carried out to document the type of
provision in terms of field of study and the distribution of PLC places across
the country. Secondly, a new survey of PLC principals was conducted in
order to explore principals’ perceptions of goals, adequacy of existing
facilities and the benefits and challenges of PLC provision. Thirdly, a new
survey of PLC and Leaving Certificate leavers was conducted to assess their
labour market outcomes as well as their experiences while taking PLC and
higher education courses. Together, these strands provide comprehensive
evidence to inform the future development of the sector.
This chapter outlines the main findings and discusses their implications for
policy.
6.2 THE GOALS OF PLC PROVISION
The development of vocational education in Ireland was initially slow,
largely because of late industrialisation (Coolahan, 1981). Because of this,
the tradition of structured involvement of employers in education and
training provision found in some other European countries, such as
Germany and the Netherlands, did not emerge in the Irish context.78 This
has had significant implications for Ireland’s vocational education and
training (VET) sector.
From the 1970s onwards, Ireland’s membership of the European
78 For an overview of differential institutional relations between education and labour market systems, see
Müller and Gangl (2003).
98| Evaluation of PLC programme provision
Community had a highly influential impact on VET in Ireland (Coolahan,
1981; O’Sullivan, 2005). The European Social Fund (ESF) provided funding
for the establishment of pre-employment courses in over 120 schools in
1977. These courses were targeted at post-junior cycle students and aimed
to provide social, general and technical education combined with work
experience. Initially confined to vocational and
community/comprehensive schools, they were redeveloped as Vocational
Preparation and Training (VPT) courses (VPT1 and VPT2) in 1984 and
extended to voluntary secondary schools (NESC, 1993). A second year was
added to these courses in 1985 and VPT2 courses became commonly
known as PLC courses. These courses were designed to provide vocational
education to facilitate the transition to employment for young people by
‘bridging the gap between the values and experiences normally part of
traditional education and those current in the world of work (Department
of Education, 1984, p. 5). However, commentators (e.g. McNamara, 1990)
have highlighted the lack of clarity around the skills to be fostered and the
relationship between the courses offered and labour market demand.
An important feature to note, and one that received a good deal of
discussion in an earlier review of PLC provision (McIver Consulting, 2003),
is the fact that PLC courses continue to be provided within second-level
school structures. This approach developed because of the initial focus of
pre-employment courses on providing alternative pathways for at-risk
young people, but has not changed despite the shift towards provision for
those who have already completed the Leaving Certificate (and indeed,
towards providing for older adults). A number of stand-alone further
education colleges have emerged, while in other ETB colleges and
voluntary secondary schools PLC students are taught in the same building
as younger people taking regular junior and senior cycle courses. An
enhanced capitation grant (reduced in 2011 and 2014) is payable to all PLC
students to cover the cost of equipment, materials and general running
expenses, but otherwise PLC providers are governed by second-level
structures in terms of teacher contracts and length of the school year.
Qualification specifications for PLC (as well as other further education)
teachers and tutors are set by the Teaching Council in a parallel process to
that used for primary and second-level teachers.
The numbers taking part in PLC courses doubled over the period 1984–
1985 to 2015–2016 (DES Statistical Reports, various years). Furthermore,
the remit of provision changed over time, with PLC courses becoming an
increasingly important route for second-chance education for adults
(Watson et al., 2006). Those aged 21 years or over made up only 4.5 per
cent of PLC participants in 1988–1989 but this had increased dramatically

Summary and implications for policy |99
to 45 per cent by 2015–2016. From the start, PLC students were
predominantly female in profile, largely reflecting the dominance of
commercial and secretarial courses in the early years of the programme
(Lewis and Kellaghan, 1987). However, male participation has increased in
relative terms over time, rising from 28 per cent in 2000 to 40 per cent in
2016 (DES Statistical Database). The remit of PLC courses has changed in
other respects too. While initially developed as a route into employment,
and therefore largely as an alternative to third-level education, PLC
courses have increasingly become a route into higher education for a
significant number. For example, in 2016, around one-fifth of applicants
through the CAO process presented QQI or FETAC qualifications. The use
of vocational qualifications as a route to accessing higher education is
common in many other countries (see, for example, Moodie and
Wheelehan, 2009, on Australia), though some countries, most notably
Scotland, have adopted a different model by allowing students to embark
on higher education courses within further education colleges (Gallacher,
2009).
As a result of these changes over time, PLC courses now can be seen as
fulfilling a number of functions: vocational preparation for young people;
social inclusion and second-chance education for older adults; and a
progression route into higher education. This diversity of functions is not
unique to the Irish context, with much international literature on further
education discussing potentially competing goals and blurred boundaries
between further education and other forms of education provision (see,
for example, Avis, 2009; Gallacher, 2006). The multiple goals of PLC
provision were echoed in the survey responses of principals who saw PLC
courses in general as fulfilling a range of roles, including progression to
employment, progression to higher education, lifelong learning and social
inclusion, with principals placing relatively equal weight on each
component. There was no evidence, from the survey data at least, that
principals viewed these goals as competing. Thus, when asked about the
focus of courses in their institution, there was no evidence of a trade-off
between focusing on labour-market-oriented courses as opposed to
education-oriented courses, with principals likely to mention that courses
were addressing multiple goals. This contrasted somewhat with the views
of learners, who were more likely to indicate a primary rationale for taking
a PLC course, with some differences in the profiles of learners taking
courses for labour market, progression or personal development reasons.
In particular, those whose mothers had degrees and those with higher
Leaving Certificate grades were more likely to take a PLC as a route into
higher education while older learners and, to some extent, women were
less likely to emphasise educational progression opportunities. These

100| Evaluation of PLC programme provision
findings have important implications for policy, suggesting that while the
PLC sector as a whole can fulfil multiple goals, there are important
distinctions between courses focused primarily on the transition to
employment and those focused on progression to further learning. These
distinctions have consequences for information and guidance aimed at
potential entrants as well as for course content and delivery.
6.3 AVAILABILITY OF PLC PROVISION
Analyses of administrative data indicate a substantial amount of
heterogeneity in the regional distribution of PLC places. There is
considerable variation across counties in the ratio of enrolments to the
total population and no evidence of a relationship between the
concentration of PLC places and county-level deprivation levels. Thus,
young people from disadvantaged regions, who have the highest risk of
unemployment, do not have greater access to vocational educational
programmes than those in more advantaged areas. Furthermore, there
has been little change over time (between 2008–2009 and 2011–2012) in
the concentration of PLC provision. The enrolments data suggest that the
distribution of PLC places tends to be driven by legacy issues rather than
strategic planning, with little evidence that the number of places and
composition of provision is reactive to changing labour market conditions,
an issue explored in greater detail below.
PLC courses are offered in a range of settings, including stand-alone further
education colleges, ETB schools and colleges, community/comprehensive
schools, and voluntary secondary schools. As a result, the average number
of learners varies significantly across settings. Larger providers are more
likely to offer a range of supports to students than smaller providers,
including career guidance, personal counselling, disability support, a
student union, a class tutor system and childcare facilities. Interestingly,
however, principals in smaller institutions express greater satisfaction with
services for students (with the exception of technical and computer
facilities), suggesting that while larger colleges are more likely to have
certain facilities, they are seen as insufficient for the number of learners
enrolled. These patterns were echoed in the qualitative responses by
providers, over half of whom highlighted challenges relating to lack of
funding and resources. Variation in the provision and resourcing of student
services is likely to have important consequences for learners. While there
may be logistical difficulties in smaller providers offering the full range of
student support services, there is potential to perhaps access services
centrally through the local ETB, for example. Findings from the survey of
principals suggest that dissatisfaction with services for students appears to

Summary and implications for policy |101
be driven by lack of funding and resource constraints. The sector’s reliance
on a second-level funding model may create potential constraints on
providing the kinds of supports needed for adult learners. It highlights the
need to re-evaluate whether the existing enhanced per capita allocation
for PLC students is sufficient to facilitate provision of the range of services
and supports appropriate to specialised skills development among adult
learners. Of particular concern is the finding that only one-third of PLC
learners reported having had access to career guidance during their
course. This appears to suggest a gap in provision. The extent to which
guidance is offered informally by PLC staff rather than through formal
guidance provision would merit further investigation.
6.4 LABOUR MARKET RESPONSIVENESS OF PLC PROVISION
International research has found that young people who have taken VET
tend to make a smoother transition into employment and are less likely to
experience (prolonged spells of) unemployment than those who have
attained academic or general qualifications (Müller and Gangl, 2003). The
nature of such education is crucial, with courses that have closer linkages
to the labour market leading to better labour market outcomes because of
the occupationally specific skills they provide (CEDEFOP, 2013; de Lange et
al., 2014). In such contexts, employer buy-in regarding course design and
content in institution-based systems or providing employment experience
in dual systems is found to have a decisive influence on the success of VET,
ensuring its responsiveness to potentially changing labour market
conditions. The existence of VET qualifications is not sufficient to enhance
the transition to employment unless these underlying institutional
structures are in place (Raffe, 2015). Similarly, where VET fails to keep pace
with changing employment structures, as was the case in the rapid
transformation of eastern European economies in the post-socialist
period, those with VET qualifications tend to fare very poorly on the labour
market (Kogan et al., 2011).
The study findings provide insights into the extent to which PLC provision
is responsive to the labour market from a number of perspectives: the
nature of the match (or mismatch) between provision and labour market
demand at the aggregate level; labour market linkages at the level of PLC
providers and courses; and employment outcomes among individual
course participants.
6.4.1 Provision and labour market demand
The fact that the composition of PLC provision has remained relatively
102| Evaluation of PLC programme provision
stable and the enrolments have increased during a period in which both
the level and composition of labour market demand changed dramatically
suggests that PLC provision does not appear to be highly responsive to
changing labour market conditions and shocks. Data from the Quarterly
National Household Survey (QNHS) were used to estimate the composition
of demand for newly qualified vocational labour. Almost 60 per cent of the
jobs available for these new entrants were in sales and services. Mapping
enrolments and potential job opportunities for three employment-
oriented fields (early childhood care and education, community and health
services, and hairdressing) indicated an oversupply of leavers with
qualifications in these areas.
6.4.2 Employer engagement among providers
Survey data from principals offer more detailed insights into some of the
factors shaping this mismatch. The Conditions of Approval guidelines set
out criteria to be used in deciding to offer a new PLC course, with these
criteria focusing on meeting government policy, addressing skill gaps or
areas of skill growth, and employer demand or progression opportunities.
In practice, principals rate student demand and having staff with the
relevant skills as influential factors in establishing a new course. While they
also point to the role of local and regional labour market demand, they are
less likely to refer to employer demand or occupational forecasts. Similarly,
when it comes to discontinuing courses, principals are more responsive to
falling enrolments and student perceptions than to labour market factors.
These patterns suggest that, contrary to the Conditions of Approval
guidelines, course provision is strongly influenced by (lack of) student
demand rather than being directly responsive to labour market conditions.
Legacy issues appear to play an important role, with existing staff skill sets
and (perceived) student demand shaping the courses being offered. There
is considerable potential to provide more systematic information on local
and regional skill needs through the network of regional skills fora being
created to help shape and reshape the kinds of courses provided. The
findings also point towards the importance of continuous professional
development (CDP) for existing staff in facilitating principals in adapting
course offerings to meet labour market need. The majority (71 per cent) of
principals report having at least one teacher who teaches both PLC and
junior or senior cycle students; this may act as a constraint on making
significant adaptations to course content.
Employer engagement at the local level also emerges as crucial. Half of
principals report that their staff meet with local employers at least three
times a year. However, logistical constraints mean that larger providers
Summary and implications for policy |103
have more frequent contact with local employers, with one-fifth of small
providers meeting with employers less than once a year (or never). There
is perhaps potential for ETBs to act as a conduit for a greater linkage
between employers and smaller providers at the local level. A further
avenue for employer engagement is through work experience placements,
which provide vocational skills for learners but which may also encourage
employers to recruit from PLC courses. It is of concern that over one-fifth
of PLC learners report not having taken part in a work experience
placement during the course of their studies. The fact that this pattern did
not differ by learners’ original rationale for entering the course (to get a
job or to progress to higher education) or by whether they subsequently
went into the labour market or on to higher education raises concerns
about labour market linkages on some courses. This finding is reinforced
by evidence from principals, over three-quarters of whom indicate that not
all learners take part in work experience. Concerns about labour market
linkage are underlined by learner responses in relation to the employment
orientation of their course, with almost one-third feeling that their
learning did not contribute to their employability and one-quarter
considering that they did not acquire job-related knowledge and skills.
These perceptions did not differ between those who went on to higher
education and those who went directly into the labour market, suggesting
a need to revisit course content to enhance learner employability,
especially on courses designed to be oriented towards employment.
6.4.3 Employment outcomes among learners
Principals reported that on completing their courses, just over one-third of
leavers from their institution entered employment, with approximately 28
per cent progressing to higher education, 19 per cent remaining in further
education, and 12 per cent becoming unemployed. The survey of learners
provides more detailed evidence on labour market outcomes among those
who had taken PLC courses, comparing them with a control group of those
who had taken the Leaving Certificate and progressed directly into the
labour market. Thirty-nine per cent of PLC learners had taken the course
with the aim of obtaining a job straight away. After three years, no
significant differences were observed in the employment chances for PLC
and Leaving Certificate labour market entrants. In contrast, in 2015 (after
five years) the PLC treatment group were, on average, 16 per cent more
likely to be in employment compared to the Leaving Certificate direct
labour market entrants. This effect seems to be driven by the 24 per cent
advantage among those who had taken more job-specific PLCs relative to
the direct labour market entrants.

104| Evaluation of PLC programme provision
As well as looking at employment chances, analyses were conducted to
assess job quality among the different leaver groups. The estimated
counterfactual impacts on various measures of job quality, such as job
satisfaction or level of skill match with the current job, showed no
significant differences between the PLC and Leaving Certificate groups. The
incidence of underskilling (that is, the current job demanding more
knowledge and skills than the respondent could offer) across various
groups is somewhat surprising. Generally, we might expect underskilling
rates to be highest for those with Leaving Certificate or higher education,
as these qualifications may not be occupationally specific in nature. The
fact that the incidence of underskilling for PLC leavers is comparable to the
rates for other groups, viewed in conjunction with the findings on
employability, highlights the need to review course content and delivery
methods, especially on employment-related courses, to ensure that they
further enhance labour market preparation.
In terms of the wage impacts of PLC participation, we find little evidence
of variations in earnings by level of acquired education, not surprising
given the early stages of the employment career. In order to estimate the
longer-run effects of PLC participation, wage returns were estimated using
various waves of the National Employment Survey. The returns to PLC
education reveal that while PLC qualifiers earned a wage premium of 4.4
per cent in 2003, no significant difference was detected in 2006 and 2009.
The results suggest that the long-run returns to PLC education over Leaving
Certificate qualifications will tend to be cyclical in nature, with the limited
data suggesting that these will be positive during normal periods of
growth.
6.5 PROGESSION TO FURTHER LEARNING
Thirty-nine per cent of the PLC learners had taken their course in order to
get a place on a higher education programme: employment and
progression orientations were equally prevalent among the learner group.
Four in ten participants saw their course as opening up opportunities for
further study at institutes of technology, while only one-quarter saw it as
providing opportunities to study at university. Of those who had intended
to go on to higher education, two-thirds actually did so. Those who did not
make the transition tended to have lower Leaving Certificate grades. It is
also interesting to note that one-third of those who entered a PLC course
intending to get a job immediately after completing the course went on to
take a higher education course, suggesting that the experience of studying
at PLC level may reorient some learners towards further learning
opportunities.
Summary and implications for policy |105
In terms of the estimated counterfactual impact, PLC learners are 27 per
cent more likely to progress to higher education than the direct labour
market entrants control group with similar characteristics (such as points
score, gender and age). This impact is highly significant, with a stronger
effect found for those PLC learners in more general rather than job-specific
programmes. Thus, PLC courses appear to facilitate progression to higher
education for a group of people who would likely not participate
otherwise. The accounts of principals also highlight the role of PLC courses
in acting as a stepping-stone towards higher education, by enhancing
learner confidence and providing the skills to manage the transition. At the
same time, it is worth noting that courses do not seem to serve as a
stepping-stone in the same way for those with lower Leaving Certificate
grades, though the numbers in the study sample are too small to be
definitive.
6.6 PLC PROVISION AND SOCIAL INCLUSION
As indicated above, one of the goals of PLC provision is to facilitate social
inclusion. PLC learners are more likely to be from less educated family
backgrounds, are more likely to be older and have children, and have
greater SEN prevalence rates than their counterparts directly enrolling in
higher education. In terms of the distribution of Leaving Certificate points,
the majority (62 per cent) of PLC leavers are in the 200–400 points band
while the majority of the Leaving Certificate group (63 per cent), most of
whom went on to higher education, are in the 300–500 band. Thus, PLC
provision tends to provide access to post-school educational opportunities
for a more socially diverse group. Given the role of PLC provision in
facilitating access to higher education and employment (see above),
courses appear to be playing a role in enhancing social inclusion. In keeping
with national enrolment data (see above), PLC participants in the survey
are disproportionately female. Although there has been a reduction in the
female-intensity of take-up over time, there may be a case for looking at
the courses on offer, in order to provide VET opportunities for men. There
may also be value in addressing potential gender stereotyping in course
entry through guidance at the school level.
6.7 LEARNER SATISFACTION WITH PLC PROVISION
Previous sections of this chapter have focused largely on the objective
outcomes for PLC leavers. The survey data also provided very detailed
information on learner perceptions of PLC provision, an important
evidence base for policy development. In keeping with earlier research
(McCoy et al., 2014), the majority of PLC students reported a mismatch
106| Evaluation of PLC programme provision
between the types of teaching and learning experienced at second-level
education and at PLC level, with around half feeling their schoolwork had
not prepared them for this transition. Learners were largely satisfied with
the relevance of course design and the vast majority felt their teachers and
tutors had the required knowledge and were supportive. However, they
were less positive about the prominence of workplace learning in their
course (see above).
In reflecting on the choices made, almost half of all learners surveyed
indicated that they did not get to do what they planned on leaving school
or only did so ‘to some extent’. In addition, one-third of learners overall
said they would not take the same pathway again, while a further 30 per
cent would only do so to some extent. Those who had taken PLC courses,
regardless of whether they went on to higher education or not, were more
likely to indicate that they had not secured the outcome they wanted and
would have taken a different pathway (echoing McCoy et al.’s 2014
findings on an earlier cohort of leavers). Thus, PLC courses appear to be
seen as a compromise, in a context of not achieving the required grades to
pursue higher education, highlighting the continued lower status of further
education in Ireland. Dissatisfaction with guidance within second-level
education emerged as a key factor among school leavers who later
reflected with regret on their post-school choices.
Differences across learners also emerge in relation to life satisfaction and
financial wellbeing. PLC participants fare less well, with lower levels of life
satisfaction and greater dissatisfaction with their financial situation.
Second-level grades are found to play a central role in shaping young
people’s opportunities on leaving school, which, in turn, influence the
extent to which they can maximise their potential for personal fulfilment
and achievement. Family circumstances also play an important role in
understanding wellbeing, particularly financial insecurity; those with
children experience far greater challenges in this regard and this factor
explains much of the difference between the PLC group and others. Earlier
analyses pointed to the lack of a significant difference between those with
second-level and PLC qualifications, in terms of wage levels. However, the
family circumstances, and more disadvantaged profile of this group,
appear to lead to greater financial difficulties.
6.8 ISSUES FOR POLICY DEVELOPMENT
The study findings point to the positive role played by PLC provision in
providing educational opportunities for a diverse group of learners and in
enhancing their access to employment and higher education. However,

Summary and implications for policy |107
the findings also highlight a number of challenges for policy development
in the PLC sector. Firstly, learners are almost equally divided between
those taking a PLC course for skill formation (and hence employment
access) and those taking one in order to progress to higher education.
From the point of view of PLC principals, PLC courses address multiple
goals, suggesting the potential for greater clarity around the orientation
and purpose of specific courses.
Secondly, there is a need for job-specific PLC courses to be more
responsive to changing labour market conditions in terms of the types of
courses offered. Provision is currently constrained by legacy issues, which
includes the skill sets of existing staff, with relatively little input of
information on skill gaps and employer demand. There is also evidence of
a need for a greater focus on skill formation within some employment-
oriented courses; such course content needs to be adapted to focus on
employability and to integrate work experience placements into the
learning experience for all learners.
Thirdly, PLC courses are offered across very different settings, with smaller
institutions less likely to provide the full range of student supports and
larger institutions operating under resource constraints relative to student
numbers. There would appear to be scope to link smaller providers into
local or regional networks, perhaps through the ETB, to facilitate access to
specialist supports and to support engagement with employers. While
good practice appears to have emerged in certain areas, clear challenges
present in building up sustained employer engagement and recognition of
qualifications in the absence of a strong tradition of such involvement (see
Raffe, 2015, on challenges in the British context). The issue of the
appropriate level of funding to provide a varied learning experience and
appropriate supports for a diverse group of learners merits further
investigation, especially given that PLC courses are run using a slightly
enhanced second-level funding model, which may not take adequate
account of the range of facilities and supports required. Finally, PLC
provision cannot be seen in isolation from the broader educational system.
The role of school-based guidance emerges as important in facilitating
access to appropriate courses. Low take-up of guidance within PLC
provision may be impacting on awareness of the potential pathways
(education and employment) subsequently open to learners, an issue that
merits further research. More fundamentally, there appear to be
persistent difficulties, from the learner perspective at least, regarding the
perceived status of PLC courses vis-à-vis higher education, an issue that
presents challenges in creating a valued pathway catering for a range of
learners.
108|References
REFERENCES
Avis, J. (2009). ‘Further education: policy hysteria, competitiveness and performativity’. British Journal of Sociology of Education, Vol. 30, No. 5, 653–662.
Banks, J. and S. McCoy (2011). A study on the prevalence of special educational needs, ESRI and NCSE, Dublin.
Bergin, A., E. Kelly and S. McGuinness (2012). ‘Explaining changes in earnings and labour costs during the recession’, ESRI Economic Renewal Series 009, ESRI, Dublin.
Byrne, D., S. McCoy and D. Watson (2009). School leavers’ survey report 2007, ESRI and Department of Education and Science, Dublin.
CEDEFOP (2013). labour market outcomes of vocational education in Europe, CEDEFOP, Luxembourg.
Coolahan, J. (1981). Irish education: History and structure, IPA, Dublin.
De Lange, M., M. Gesthuizen and M.H. Wolbers (2014). ‘Youth labour market integration across Europe: The impact of cyclical, structural, and institutional characteristics’. European Societies, Vol. 16, No. 2, pp. 194–212.
Department of Education (1984). Vocational preparation programme, Department of Education, Dublin.
Department of Education and Skills (2012). PLC conditions of approval, Department of Education and Skills, Dublin.
FETAC (2005). Further education and training in Ireland – A quantitative analysis of the sector, FETAC, Dublin.
Frigo, T., J. Bryce, M. Anderson and P. McKenzie (2007). Australian young people, their families and post-school plans: A research review, Australian Council for Educational Research Report, Camberwell, Victoria.
Gallacher, J. (2006). ‘Blurring the boundaries or creating diversity? The contribution of the further education colleges to higher education in Scotland’. Journal of further and higher education, Vol. 30, No. 1, pp. 43–58.
Gallacher, J. (2009). ‘Higher education in Scotland’s colleges: A distinctive tradition?’ Higher Education Quarterly, Vol. 6, No.4, pp. 384–401.
Granville, G. (2003). ‘“Stop making sense”: Chaos and coherence in the formulation of the Irish qualifications framework’. Journal of Education and Work, Vol. 1, No. 3, 259–270.
Hannan, D.F., B. McCabe and S. McCoy (1998). Trading qualifications for jobs: Overeducation and the Irish youth labour market, ESRI General Research Series, ESRI, Dublin.

Evaluation of PLC programme provision |109
Hannan, D.F., S. McCoy and A. Doyle (2003). Expanding post-school learning opportunities: Nature and effects of growth in post-school education/training in the 1990s, ESRI, Dublin.
Hodkinson, P and A.C. Sparkes (1997). ‘Careership: A sociological theory of career decision-making’. British Journal of Sociology of Education, Vol. 18, No. 1, pp. 29–44.
Kelly, E., S. McGuinness and J.R. Walsh (2015). An evaluation of the Back to Education Allowance, ESRI Research Series Number 47, ESRI, Dublin.
Kis, V. (2010). Learning for jobs. OECD reviews of vocational education and training: Ireland, OECD, Paris.
Kogan, I., C. Noelke and M. Gebel (eds.) (2011). Making the transition: Education and labour market entry in Central and Eastern Europe, Stanford University Press, Stanford.
Lassibille, G. and L.N. Gomez (2008). ‘Why do higher education students drop out? Evidence from Spain’, Education Economics, Vol. 16, No. 1.
Lewis, M. and T. Kellaghan (1987). ‘Vocationalism in Irish second-level education’. Irish Journal of Education, Vol. 21, No. 1, pp. 5–35.
McCoy, S. and D. Byrne (2010). ‘Non-progression among higher education new entrants: A multivariate analysis’, chapter 6 in Mooney, O., V. Patterson, M. O’Connor and A. Chantler (eds), A study of progression in Irish higher education, HEA, Dublin.
McCoy, S. and E. Smyth (2003). ‘Educational expenditure: Implications for equality’, in Callan, T., A. Doris and D. McCoy (eds), Budget Perspectives 2004, ESRI and the Foundation for Fiscal Studies, Dublin.
McCoy, S., D. Byrne, P.J. O’Connell, E. Kelly and C. Doherty (2010). Hidden disadvantage? A study of the low participation in higher education by the non-manual group, HEA, Dublin.
McCoy, S., E. Kelly and D. Watson (2007). School leavers’ survey report 2006, ESRI and Department of Education and Science, Dublin.
McCoy, S., E. Smyth, D. Watson and M. Darmody (2014). Leaving school in Ireland: A longitudinal study of post-school transitions, ESRI Research Series No. 36, ESRI, Dublin.
McGuinness, S., A. Bergin, E. Kelly, S. McCoy, E. Smyth, A. Whelan and J. Banks (2014). Further education and training in Ireland: Past, present and future, ESRI Research Series No. 35, ESRI, Dublin.
McIver Consulting (2003). Report of the Steering Group to the PLC Review Established by the Department of Education and Science, Department of Education and Science and National Development Plan, Dublin.
McNamara, G. (1990). ‘European rhetoric and national reality: A study of policy and practice in the vocational preparation and training programme in Ireland’, Curriculum, Vol. 1, No. 3, pp. 162–169.

110|References
Moodie, G., and L. Wheelahan (2009). ‘The significance of Australian vocational education institutions in opening access to higher education’. Higher Education Quarterly, Vol. 6, No. 4, pp. 356–370.
Müller, W. and M. Gangl (2003). Transitions from education to work in Europe: The integration of youth into EU labour markets, Oxford University Press, Oxford.
NESC (1993). Education and training policies for economic and social development, NESC, Dublin.
O’Sullivan, D. (2005). Cultural politics and irish education since the 1950s, IPA, Dublin.
Raffe, D. (2015). ‘First count to five: Some principles for the reform of vocational qualifications in England’, Journal of Education and Work, Vol. 2, No.2, pp. 147–164.
Raffe, D. (2003). ‘Pathways linking education and work: A review of concept, research and policy debates’. Journal of Youth Studies, Vol. 6, No. 1, pp. 3–19.
SOLAS (2014). Further education and training strategy 2014–2019, SOLAS, Dublin.
SOLAS (2016). Further education and training professional development strategy 2017–2019, SOLAS, Dublin.
Trant, M.L. (2002). ‘The quest for an inclusive curriculum and assessment culture: The National Council for Vocational Awards 1991–2001’, Irish Educational Studies, Vol. 21, No. 1, pp. 19–32.
Watson, D., S. McCoy and S. Gorby (2006). The Post-Leaving Certificate sector in Ireland: A multivariate analysis of educational and employment outcomes, ESRI and Department of Education and Science, Dublin.
Watson, D., B. Maître, C.T. Whelan and J. Williams (2014). Growing Up in Ireland: Dynamics of child economic vulnerability and socio-emotional development – An analysis of the first two waves of the Growing Up in Ireland study, ESRI, Dublin.
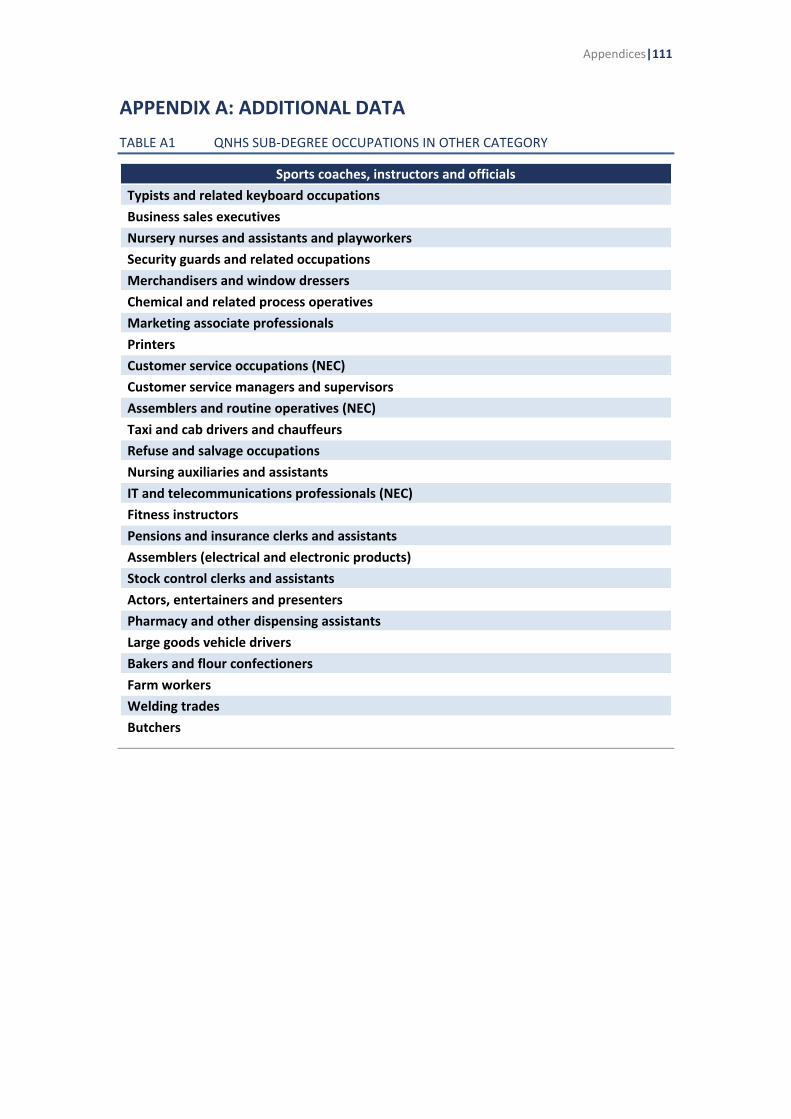
Appendices|111
APPENDIX A: ADDITIONAL DATA
TABLE A1 QNHS SUB-DEGREE OCCUPATIONS IN OTHER CATEGORY
Sports coaches, instructors and officials
Typists and related keyboard occupations
Business sales executives
Nursery nurses and assistants and playworkers
Security guards and related occupations
Merchandisers and window dressers
Chemical and related process operatives
Marketing associate professionals
Printers
Customer service occupations (NEC)
Customer service managers and supervisors
Assemblers and routine operatives (NEC)
Taxi and cab drivers and chauffeurs
Refuse and salvage occupations
Nursing auxiliaries and assistants
IT and telecommunications professionals (NEC)
Fitness instructors
Pensions and insurance clerks and assistants
Assemblers (electrical and electronic products)
Stock control clerks and assistants
Actors, entertainers and presenters
Pharmacy and other dispensing assistants
Large goods vehicle drivers
Bakers and flour confectioners
Farm workers
Welding trades
Butchers
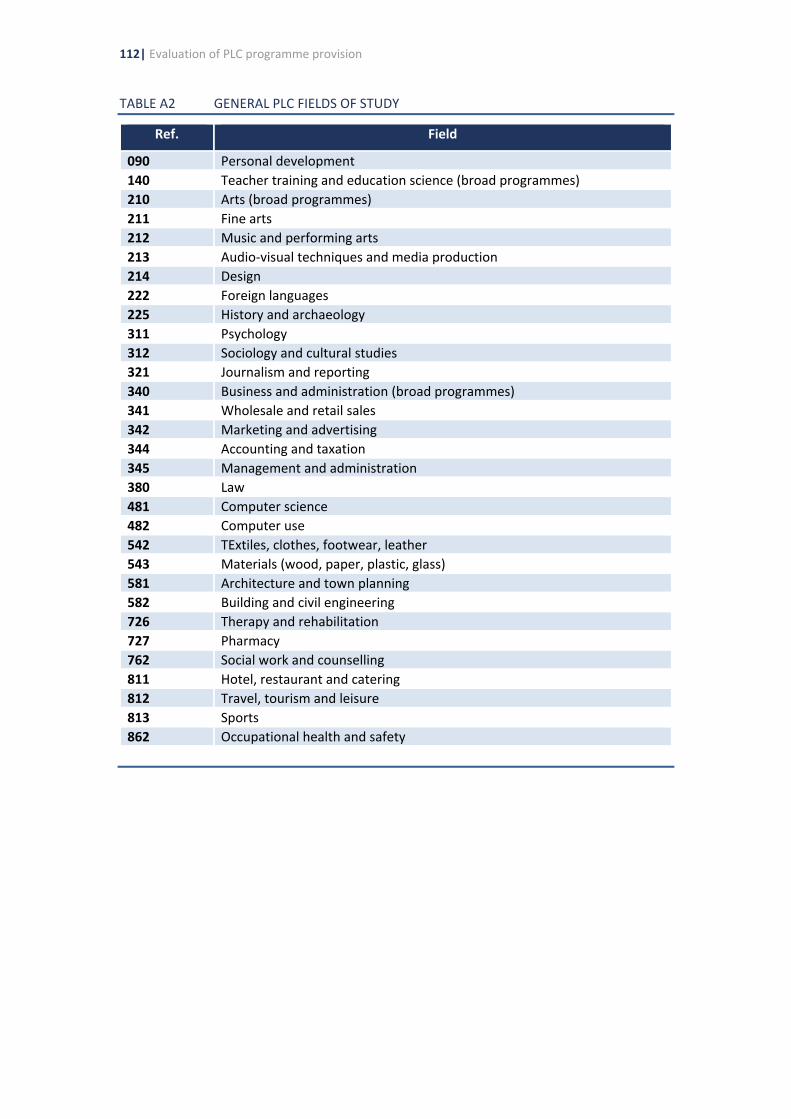
112| Evaluation of PLC programme provision
TABLE A2 GENERAL PLC FIELDS OF STUDY
Ref. Field
090 Personal development
140 Teacher training and education science (broad programmes)
210 Arts (broad programmes)
211 Fine arts
212 Music and performing arts
213 Audio-visual techniques and media production
214 Design
222 Foreign languages
225 History and archaeology
311 Psychology
312 Sociology and cultural studies
321 Journalism and reporting
340 Business and administration (broad programmes)
341 Wholesale and retail sales
342 Marketing and advertising
344 Accounting and taxation
345 Management and administration
380 Law
481 Computer science
482 Computer use
542 TExtiles, clothes, footwear, leather
543 Materials (wood, paper, plastic, glass)
581 Architecture and town planning
582 Building and civil engineering
726 Therapy and rehabilitation
727 Pharmacy
762 Social work and counselling
811 Hotel, restaurant and catering
812 Travel, tourism and leisure
813 Sports
862 Occupational health and safety

Appendices|113
TABLE A3: JOB-SPECIFIC PLC FIELDS OF STUDY
Ref. Field
215 Craft skills
346 Secretarial and office work
520 Engineering and engineering trades (broad programmes)
521 Mechanics and metal work
523 Electronics and automation
525 Motor vehicles, ships and aircraft
540 Manufacturing and processing (broad programmes)
620 Agriculture, forestry and fishery (broad programmes)
621 Crop and livestock production
622 Horticulture
641 Veterinary
720 Health (broad programmes)
723 Nursing and caring
761 Childcare and youth services
815 Hair and beauty services
850 Security services (broad programmes)
861 Protection of persons and property
TABLE A4: EMPLOYED AFTER 5 YEARS: SUMMARY OF ESTIMATES I
Treatment group Control group Estimate S.E. p value
Probit All PLC All LC 0.01 0.039 0.840
PSM- caliper width est’r
All PLC All LC 0.04 0.060 0.490
Probit PLC LC – direct LM entrants
0.07 0.054 0.161
PSM- caliper width est’r
PLC LC – direct LM entrants
0.16 0.066 0.014
Probit PLC LC – straight to higher education
0.03 0.050 0.607
PSM- caliper width est’r
PLC LC – straight to higher education
0.01 0.078 0.920

114| Evaluation of PLC programme provision
TABLE A5: EMPLOYED AFTER 5 YEARS: SUMMARY OF ESTIMATES II
Treatment
group Control group Estimate S.E. p value
Probit LM PLCs LC – direct LM entrants
0.15 0.075 0.051
PSM– caliper width est’r
LM PLCs LC – direct LM entrants
0.24 0.099 0.015
Probit LM PLCs LC – straight to higher education
0.01 0.075 0.888
PSM– caliper width est’r
LM PLCs LC – straight to higher education
–0.03 0.099 0.795
Probit General PLCs LC – direct LM entrants
0.05 0.067 0.464
PSM– caliper width est’r
General PLCs LC – direct LM entrants
0.09 0.087 0.318
Probit General PLCs LC – straight to higher education
–0.07 0.070 0.288
PSM– caliper width est’r
General PLCs LC – straight to higher education
–0.05 0.085 0.516
TABLE A6: PROGRESSION TO HIGHER EDUCATION: SUMMARY OF ESTIMATES
Treatment
group Control group Estimate S.E. p value
Probit All PLC All LC –0.22 0.042 0.000
PSM– caliper width est’r
All PLC All LC –0.12 0.059 0.047
Probit PLC LC – direct LM entrants
0.26 0.040 0.000
PSM– caliper width est’r
PLC LC – direct LM entrants
0.27 0.050 0.000
Probit LM PLCs LC – direct LM entrants
0.25 0.065 0.000
PSM– caliper width est’r
LM PLCs LC – direct LM entrants
0.26 0.078 0.001
Probit Progression PLCs
LC – direct LM entrants
0.35 0.058 0.000
PSM– caliper width est’r
Progression PLCs
LC – direct LM entrants
0.38 0.070 0.000
Note: Progression to higher education is defined as reporting higher education to be main status in September 2010, 2012 or 2015.
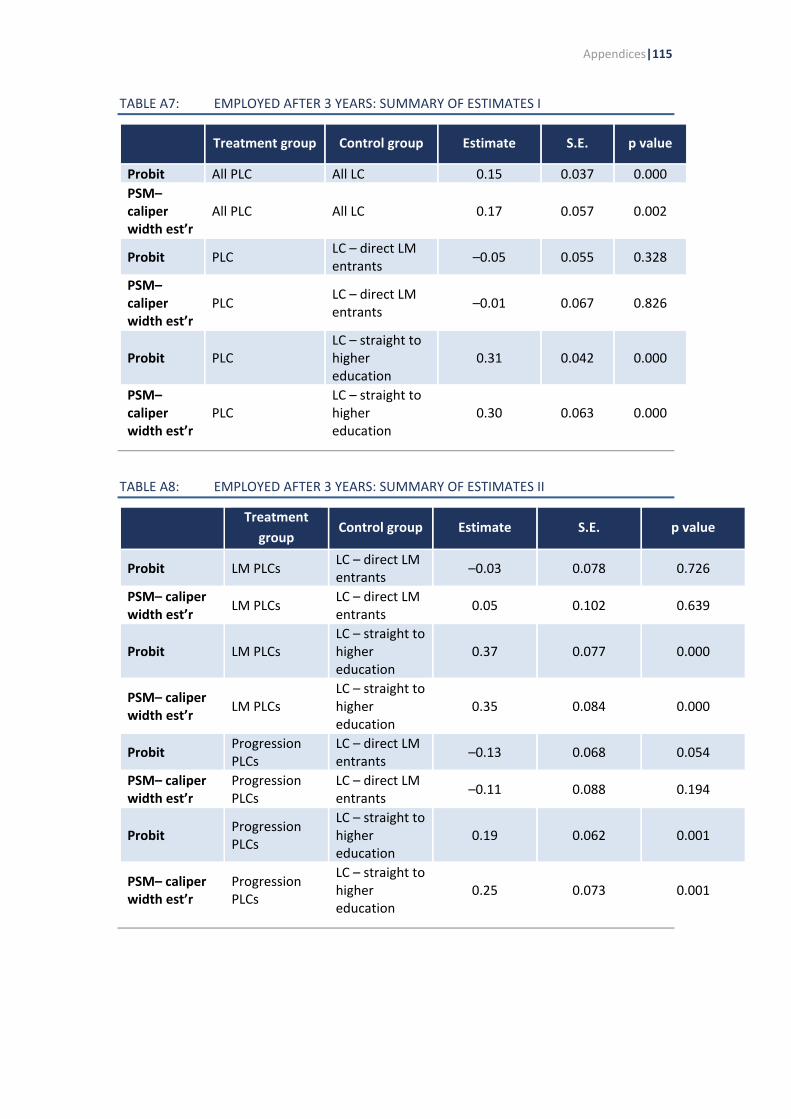
Appendices|115
TABLE A7: EMPLOYED AFTER 3 YEARS: SUMMARY OF ESTIMATES I
Treatment group Control group Estimate S.E. p value
Probit All PLC All LC 0.15 0.037 0.000
PSM– caliper width est’r
All PLC All LC 0.17 0.057 0.002
Probit PLC LC – direct LM entrants
–0.05 0.055 0.328
PSM– caliper width est’r
PLC LC – direct LM entrants
–0.01 0.067 0.826
Probit PLC LC – straight to higher education
0.31 0.042 0.000
PSM– caliper width est’r
PLC LC – straight to higher education
0.30 0.063 0.000
TABLE A8: EMPLOYED AFTER 3 YEARS: SUMMARY OF ESTIMATES II
Treatment
group Control group Estimate S.E. p value
Probit LM PLCs LC – direct LM entrants
–0.03 0.078 0.726
PSM– caliper width est’r
LM PLCs LC – direct LM entrants
0.05 0.102 0.639
Probit LM PLCs LC – straight to higher education
0.37 0.077 0.000
PSM– caliper width est’r
LM PLCs LC – straight to higher education
0.35 0.084 0.000
Probit Progression PLCs
LC – direct LM entrants
–0.13 0.068 0.054
PSM– caliper width est’r
Progression PLCs
LC – direct LM entrants
–0.11 0.088 0.194
Probit Progression PLCs
LC – straight to higher education
0.19 0.062 0.001
PSM– caliper width est’r
Progression PLCs
LC – straight to higher education
0.25 0.073 0.001
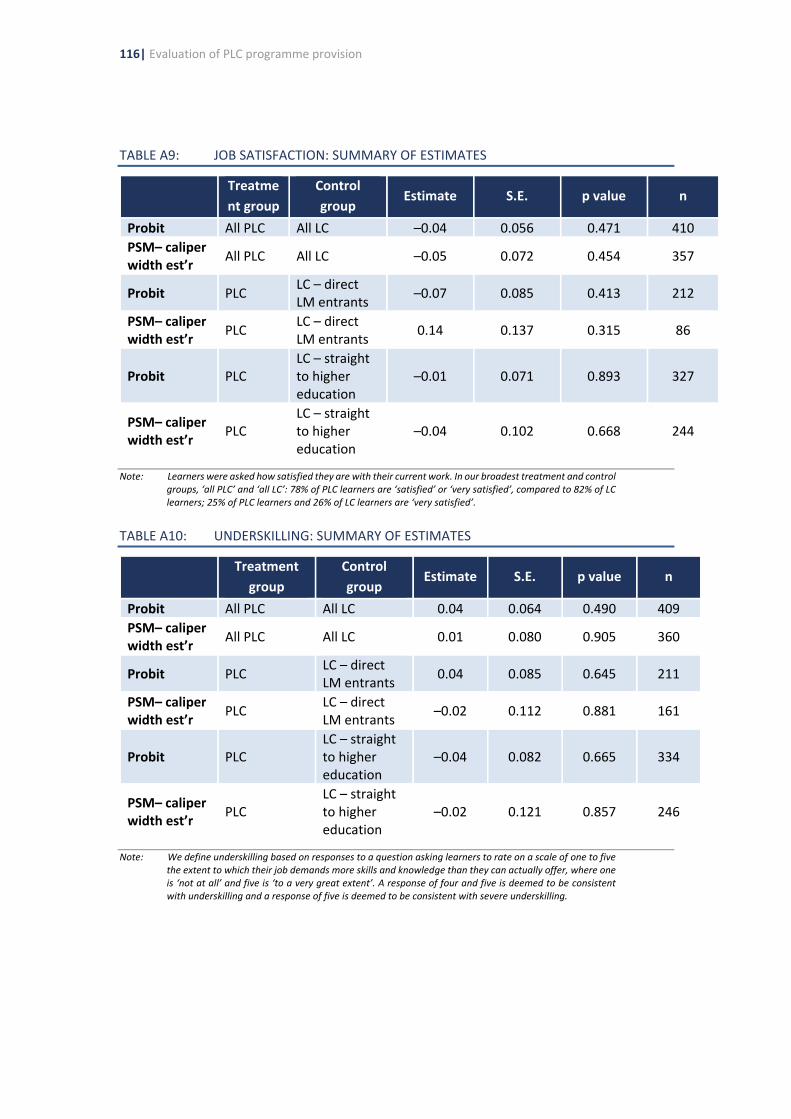
116| Evaluation of PLC programme provision
TABLE A9: JOB SATISFACTION: SUMMARY OF ESTIMATES
Treatme
nt group
Control
group Estimate S.E. p value n
Probit All PLC All LC –0.04 0.056 0.471 410
PSM– caliper width est’r
All PLC All LC –0.05 0.072 0.454 357
Probit PLC LC – direct LM entrants
–0.07 0.085 0.413 212
PSM– caliper width est’r
PLC LC – direct LM entrants
0.14 0.137 0.315 86
Probit PLC LC – straight to higher education
–0.01 0.071 0.893 327
PSM– caliper width est’r
PLC LC – straight to higher education
–0.04 0.102 0.668 244
Note: Learners were asked how satisfied they are with their current work. In our broadest treatment and control groups, ‘all PLC’ and ‘all LC’: 78% of PLC learners are ‘satisfied’ or ‘very satisfied’, compared to 82% of LC learners; 25% of PLC learners and 26% of LC learners are ‘very satisfied’.
TABLE A10: UNDERSKILLING: SUMMARY OF ESTIMATES
Treatment
group
Control
group Estimate S.E. p value n
Probit All PLC All LC 0.04 0.064 0.490 409
PSM– caliper width est’r
All PLC All LC 0.01 0.080 0.905 360
Probit PLC LC – direct LM entrants
0.04 0.085 0.645 211
PSM– caliper width est’r
PLC LC – direct LM entrants
–0.02 0.112 0.881 161
Probit PLC LC – straight to higher education
–0.04 0.082 0.665 334
PSM– caliper width est’r
PLC LC – straight to higher education
–0.02 0.121 0.857 246
Note: We define underskilling based on responses to a question asking learners to rate on a scale of one to five the extent to which their job demands more skills and knowledge than they can actually offer, where one is ‘not at all’ and five is ‘to a very great extent’. A response of four and five is deemed to be consistent with underskilling and a response of five is deemed to be consistent with severe underskilling.

Appendices|117
TABLE A11: SEVERE UNDERSKILLING: SUMMARY OF ESTIMATES
Treatment
group
Control
group Estimate S.E. p value n
Probit All PLC All LC 0.04 0.041 0.274 409
PSM– caliper width est’r
All PLC All LC –0.03 0.061 0.596 354
Probit PLC LC – direct LM entrants
0.05 0.031 0.113 187
PSM– caliper width est’r
PLC LC – direct LM entrants
–0.03 0.076 0.690 161
Probit PLC LC – straight to higher education
0.04 0.048 0.345 334
PSM– caliper width est’r
PLC LC – straight to higher education
–0.13 0.094 0.157 253
Note: We define underskilling based on responses to a question asking learners to rate on a scale of one to five the extent to which their job demands more skills and knowledge than they can actually offer, where one is ‘not at all’ and five is ‘to a very great extent’. A response of four and five is deemed to be consistent with underskilling and a response of five is deemed to be consistent with severe underskilling.
TABLE A12: OVERSKILLING: SUMMARY OF ESTIMATES
Treatment
group
Control
group Estimate S.E. p value n
Probit All PLC All LC 0.01 0.032 0.767 402
PSM– caliper width est’r
All PLC All LC 0.02 0.047 0.675 356
Probit PLC LC – direct LM entrants
0.04 0.031 0.276 164
PSM– caliper width est’r
PLC LC – direct LM entrants
0.05 0.047 0.273 165
Probit PLC LC – straight to higher education
–0.03 0.040 0.382 329
PSM– caliper width est’r
PLC LC – straight to higher education
0.02 0.078 0.826 247
Note: We define overskilling based on responses to a question asking learners to rate on a scale of one to five the extent to which their knowledge and skills are utilised in their work, where one is ‘not at all’ and five is ‘to a very great extent’. A response of one or two is deemed to be consistent with overskilling. In our broadest treatment and control groups, ‘ALL PLC’ and ‘ALL LC’: 7% of PLC learners and 9% of LC learners are classified as overskilled.

118| Evaluation of PLC programme provision
TABLE A13: FIRST STAGE PROBIT MODEL FOR PARTICIPATING IN A PLC COURSE (RELATIVE TO LC STUDENTS WHO DIRECTLY ENTERED THE LABOUR MARKET)
Coefficient Standard Error P>Z
Current age (yrs) 0.198 0.037 0.00
Male –0.481 0.134 0.00
Points (banded) –0.117 0.062 0.06
Took LC Applied –0.978 0.230 0.00
Either parent has a
degree 0.043 0.188 0.82
Constant –3.670 0.932 0.00
Observations 492
Pseudo R2 0.1649
TABLE A14: FIRST STAGE PROBIT MODEL FOR PARTICIPATING IN A PLC COURSE (RELATIVE TO LC STUDENTS WHO DIRECTLY ENTERED HE)
Coefficient Standard Error P>Z
Current age (yrs) 0.330 0.049 0.00
Male –0.493 0.136 0.00
Points (banded) –0.935 0.075 0.00
Took LC Applied 0.608 0.718 0.40
Either parent has a
degree –0.274 0.153 0.07
Constant –4.083 1.221 0.00
Observations 658
Pseudo R2 0.4664
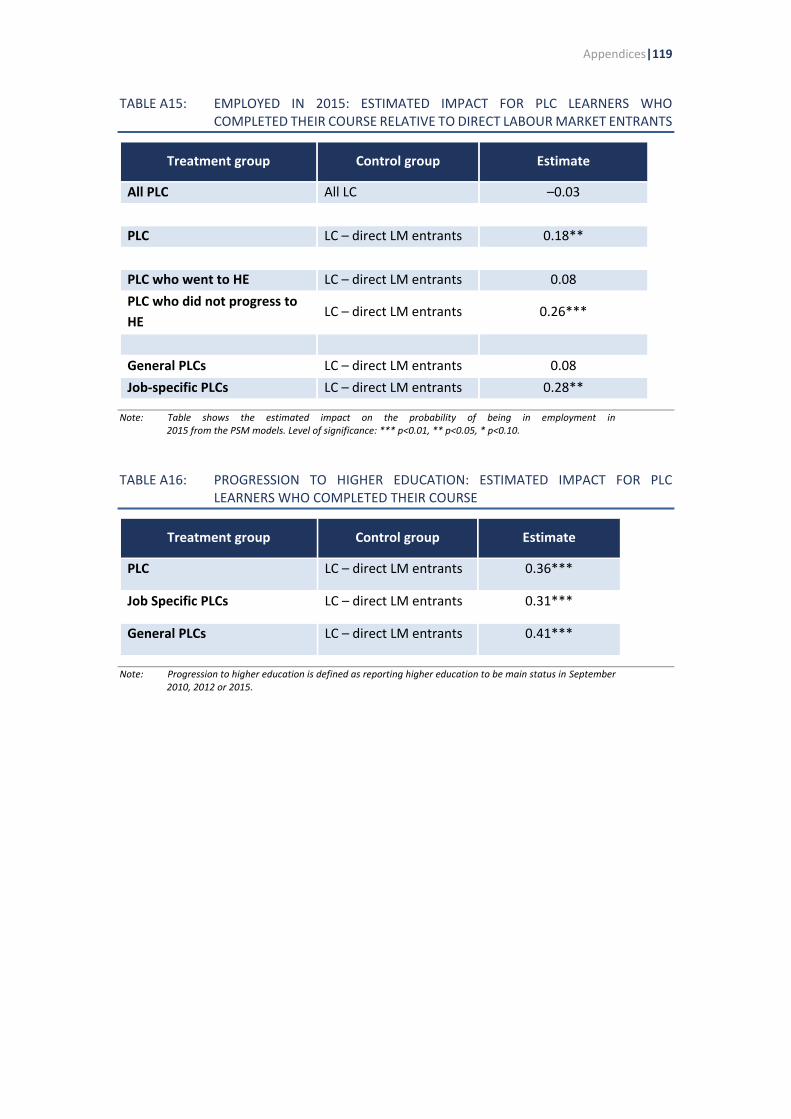
Appendices|119
TABLE A15: EMPLOYED IN 2015: ESTIMATED IMPACT FOR PLC LEARNERS WHO COMPLETED THEIR COURSE RELATIVE TO DIRECT LABOUR MARKET ENTRANTS
Treatment group Control group Estimate
All PLC All LC –0.03
PLC LC – direct LM entrants 0.18**
PLC who went to HE LC – direct LM entrants 0.08
PLC who did not progress to
HE LC – direct LM entrants 0.26***
General PLCs LC – direct LM entrants 0.08
Job-specific PLCs LC – direct LM entrants 0.28**
Note: Table shows the estimated impact on the probability of being in employment in 2015 from the PSM models. Level of significance: *** p<0.01, ** p<0.05, * p<0.10.
TABLE A16: PROGRESSION TO HIGHER EDUCATION: ESTIMATED IMPACT FOR PLC LEARNERS WHO COMPLETED THEIR COURSE
Treatment group Control group Estimate
PLC LC – direct LM entrants 0.36***
Job Specific PLCs LC – direct LM entrants 0.31***
General PLCs LC – direct LM entrants 0.41***
Note: Progression to higher education is defined as reporting higher education to be main status in September 2010, 2012 or 2015.
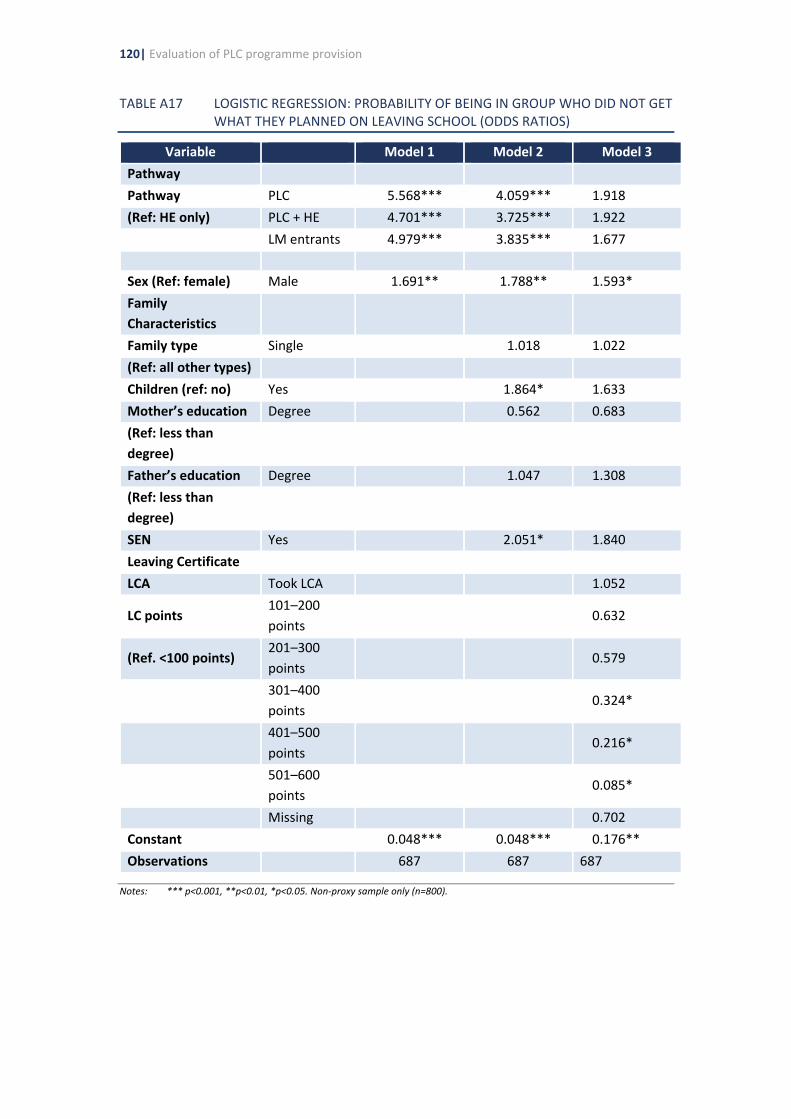
120| Evaluation of PLC programme provision
TABLE A17 LOGISTIC REGRESSION: PROBABILITY OF BEING IN GROUP WHO DID NOT GET WHAT THEY PLANNED ON LEAVING SCHOOL (ODDS RATIOS)
Variable Model 1 Model 2 Model 3
Pathway
Pathway PLC 5.568*** 4.059*** 1.918
(Ref: HE only) PLC + HE 4.701*** 3.725*** 1.922
LM entrants 4.979*** 3.835*** 1.677
Sex (Ref: female) Male 1.691** 1.788** 1.593*
Family
Characteristics
Family type Single 1.018 1.022
(Ref: all other types)
Children (ref: no) Yes 1.864* 1.633
Mother’s education Degree 0.562 0.683
(Ref: less than
degree)
Father’s education Degree 1.047 1.308
(Ref: less than
degree)
SEN Yes 2.051* 1.840
Leaving Certificate
LCA Took LCA 1.052
LC points 101–200
points 0.632
(Ref. <100 points) 201–300
points 0.579
301–400
points 0.324*
401–500
points 0.216*
501–600
points 0.085*
Missing 0.702
Constant 0.048*** 0.048*** 0.176**
Observations 687 687 687
Notes: *** p<0.001, **p<0.01, *p<0.05. Non-proxy sample only (n=800).

Appendices|121
TABLE A18 LOGISTIC REGRESSION: PROBABILITY OF BEING IN GROUP WHO REGRET CHOICE MADE ON LEAVING SCHOOL (ODDS RATIOS)
Variable Model 1 Model 2 Model 3
Pathway
Pathway PLC 2.649*** 2.199*** 1.583
(Ref: HE only) PLC + HE 2.715*** 2.411*** 1.760
LM entrants 1.826* 1.625 1.333
Sex (Ref: female) Male 1.245 1.323 1.258
Family
characteristics
Family type Single 0.884 0.860
(Ref: all other
types)
Children (ref: no) Yes 1.459 1.490
Mother’s
education Degree 0.575 0.587
(Ref: less than
degree)
Father’s education Degree 1.260 1.277
(Ref: less than
degree)
SEN Yes 1.029 1.007
Leaving Certificate
LCA Took LCA 0.620
LC points 101–200 points 1.061
(Ref. <100 points) 201–300 points 1.075
301–400 points 0.810
401–500 points 0.573
501–600 points 0.402
Missing 0.774
Constant 0.258*** 0.295*** 0.479
Observations 687 687 687
Note: *** p<0.001, **p<0.01, *p<0.05. Non-proxy sample only.

122| Evaluation of PLC programme provision
TABLE A19 LOGISTIC REGRESSION: PROBABILITY OF BEING IN GROUP WHO ARE LEAST SATISFIED WITH THEIR LIFE (ODDS RATIOS; BOTTOM QUINTILE ON SATISFACTION WITH EVERYDAY LIFE)
Variable Model 1 Model 2 Model 3
Pathway
Pathway PLC 2.510*** 2.131** 1.625
(Ref: HE only) PLC + HE 2.310** 2.035** 1.589
LM entrants 2.511** 2.033* 1.556
Sex (Ref: female) Male 1.408 1.382 1.299
Family
characteristics
Family type Single 1.568 1.672
(Ref: all other types)
Children (ref: no) Yes 1.476* 1.284
Mother’s education Degree 0.484 0.518
(Ref: less than
degree)
Father’s education Degree 1.208 1.355
(Ref: less than
degree)
SEN Yes 2.231** 2.195**
Leaving Certificate
LCA Took LCA 0.601
LC points 101 – 200
points 0.453
(Ref. <100 points) 201–300
points 0.524
301–400
points 0.303**
401–500
points 0.414
501–600
points 0.317
Missing 0.775
Constant 0.136*** 0.097*** 0.245*
Observations 687 687 687
Note: *** p<0.001, **p<0.01, *p<0.05. Non-proxy sample only.

Appendices|123
TABLE A20 LOGISTIC REGRESSION: PROBABILITY OF BEING IN GROUP LEAST SOCIALLY INCLUDED (ODDS RATIOS; BOTTOM QUINTILE ON SOCIAL INCLUSION)
Variable Model 1 Model 2 Model 3
Pathway
Pathway PLC 2.248*** 1.894* 1.479
(Ref: HE only) PLC + HE 1.877** 1.652 1.312
LM entrants 1.401 1.164 0.990
Sex (Ref: female) Male 1.197 1.197 1.143
Family
characteristics
Family type Single 1.177 1.131
(Ref: all other types)
Children (ref: no) Yes 1.406 1.440
Mother’s education Degree 0.517* 0.513*
(Ref: less than
degree)
Father’s education Degree 1.296 1.317
(Ref: less than
degree)
SEN Yes 1.814* 1.815*
Leaving Certificate
LCA Took LCA 0.579
LC points 101–200
points 0.928
(Ref. <100 points) 201–300
points 0.786
301–400
points 0.565
401–500
points 0.454
501–600
points 0.662
Missing 0.545
Constant 0.170*** 0.153*** 0.293*
Observations 534 534 534
Notes: *** p<0.001, **p<0.01, *p<0.05. Non-proxy sample only.

124| Evaluation of PLC programme provision
TABLE A21 LOGISTIC REGRESSION: PROBABILITY OF BEING IN GROUP WHO EXPERIENCE DIFFICULTY MAKING ENDS MEET (ODDS RATIOS)
Variable Model 1 Model 2 Model 3
Pathway
Pathway PLC 3.054*** 1.319 0.876
(Ref: higher
education only) PLC + HE 3.938*** 2.350* 1.738
LM entrants 2.719** 1.470 0.738
Sex (Ref: female) Male 0.686 0.815 0.735
Family
characteristics
Family type Single 0.904 0.899
(Ref: all other types)
Children (ref: no) Yes 4.298*** 3.915***
Mother’s education Degree 0.380* 0.428
(Ref: less than
degree)
Father’s education Degree 0.459 0.547
(Ref: less than
degree)
SEN Yes 1.501 1.442
Leaving Certificate
LCA Took LCA 0.882
LC points 101–200
points 0.272*
(Ref. <100 points) 201–300
points 0.369
301–400
points 0.179**
401–500
points 0.207*
501–600
points 0.324
Missing 0.492
Constant 0.127*** 0.166*** 0.709
Observations 506 506 506
Notes: *** p<0.001, **p<0.01, *p<0.05. Non-proxy sample only.
Appendices|125
APPENDIX B: NOTE ON SAMPLING AND WEIGHTING FOR THE SURVEY OF PLC LEAVERS:
1.1 SAMPLING STRATEGY
The goal was to complete a survey of two groups of leavers: Leaving
Certificate leavers (who left in 2009) and PLC leavers (who left in 2010).
The Leaving Certificate leavers group included those who studied for the
Leaving Certificate Applied, the Leaving Certificate Vocational Programme
and the established Leaving Certificate.
The sampling was accomplished with the assistance of the Department of
Education and Science. The sampling frame was the Post-Primary Pupil
Database (PPPDB), a listing of all pupils in the second-level system in
Ireland, which also covers the Post-Leaving Certificate (PLC) sector. Leaving
Certificate leavers are identified by finding students in the second year of
the Leaving Certificate Programme in 2009 (including the established
Leaving Certificate, LCA and LCVP) who were not in the PPPDB in 2010 (i.e.
not repeating the Leaving Certificate and not in a PLC programme). PLC
leavers were identified by finding those who were in a PLC programme in
2010 and not in the PPPDB in 2010 (or left the PLC programme, either
having completed or before completing the PLC course).
The DES provided the ESRI with an anonymised database of leavers for the
two groups. The database contained a record for each leaver showing:
• a unique ID number assigned by the DES;
• programme type (Leaving Certificate, LCA, LCVP,PLC);
• programme year (e.g. first, second or third year of the programme);
• school type (secondary, vocational, C&C);
• DEIS status;
• sex of student; and
• year of birth.
The ESRI selected a stratified random sample with stratification based on
gender, programme type (Leaving Certificate, LCVP, LCA, PLC) and, for the
PLC students, whether they were under or over age 25 on leaving the
programme. The sampling fraction differed by these stratification groups,
with PLC leavers and LCA leavers oversampled, as shown in Table B.1.

126| Evaluation of PLC programme provision
TABLE B.1: SAMPLING FRACTION BY STRATIFICATION GROUP (%)
Stratum Sampling fraction
110 male, LC, all ages 4.8
120 male, LCVP, all ages 4.8
130 male, LCA, all ages 16.3
140 male, PLC, under 25 9.0
141 male, PLC, over 25 9.0
210 female, LC, all ages 5.0
220 female, LCVP, all ages 5.0
230 female, LCA, all ages 16.3
240 female, PLC, under 25 9.0
241 female, PLC, over 25 9.0
Sampled leavers offered the chance to opt out
The ESRI selected the sample and returned the unique ID numbers to the
DES. The DES attached the contact details from the PPPDB. The ESRI (and
our partner research organisation, Amárach) printed the letters (on DES
letterhead). The Department then sent a letter to each sampled leaver
informing them of the survey and offering them the chance to opt out.
The letter contained a tear-off section with the unique ID number so that
any leaver choosing to opt out could be removed from the sample before
contact details were released. The leavers were also afforded the
opportunity to opt out online using the unique ID number.
We allowed two weeks for a response from students.
Contact details released to the ESRI and Amárach
Having removed the details of any individuals who opted out, the contact
information for the remaining sampled leavers was released by the DES to
the ESRI so that the fieldwork could be conducted.
Response rates
Table B.2 shows the response rates by each of the eight strata. The
response rate was higher among Leaving Certificate leavers (especially the
LCA and LCVP) than among PLC leavers. The PLC leavers under the age of
25 had a higher response rate than those over age 25. This was partly a
result of prioritising the younger PLC leavers and the LCA leavers in the
fieldwork, as these groups were particularly important to evaluating the
impact of the PLC programme.
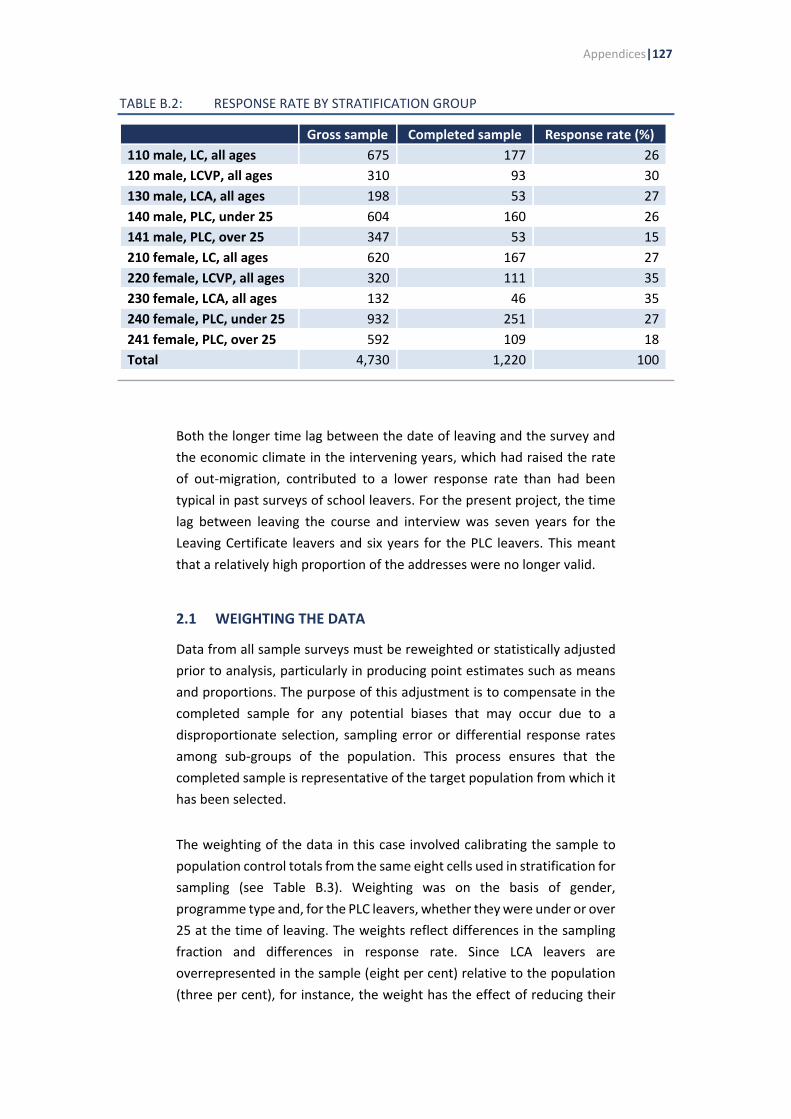
Appendices|127
TABLE B.2: RESPONSE RATE BY STRATIFICATION GROUP
Gross sample Completed sample Response rate (%)
110 male, LC, all ages 675 177 26
120 male, LCVP, all ages 310 93 30
130 male, LCA, all ages 198 53 27
140 male, PLC, under 25 604 160 26
141 male, PLC, over 25 347 53 15
210 female, LC, all ages 620 167 27
220 female, LCVP, all ages 320 111 35
230 female, LCA, all ages 132 46 35
240 female, PLC, under 25 932 251 27
241 female, PLC, over 25 592 109 18
Total 4,730 1,220 100
Both the longer time lag between the date of leaving and the survey and
the economic climate in the intervening years, which had raised the rate
of out-migration, contributed to a lower response rate than had been
typical in past surveys of school leavers. For the present project, the time
lag between leaving the course and interview was seven years for the
Leaving Certificate leavers and six years for the PLC leavers. This meant
that a relatively high proportion of the addresses were no longer valid.
2.1 WEIGHTING THE DATA
Data from all sample surveys must be reweighted or statistically adjusted
prior to analysis, particularly in producing point estimates such as means
and proportions. The purpose of this adjustment is to compensate in the
completed sample for any potential biases that may occur due to a
disproportionate selection, sampling error or differential response rates
among sub-groups of the population. This process ensures that the
completed sample is representative of the target population from which it
has been selected.
The weighting of the data in this case involved calibrating the sample to
population control totals from the same eight cells used in stratification for
sampling (see Table B.3). Weighting was on the basis of gender,
programme type and, for the PLC leavers, whether they were under or over
25 at the time of leaving. The weights reflect differences in the sampling
fraction and differences in response rate. Since LCA leavers are
overrepresented in the sample (eight per cent) relative to the population
(three per cent), for instance, the weight has the effect of reducing their

128| Evaluation of PLC programme provision
representation in results based on the weighted data to reflect the
population distribution.
TABLE B.3: POPULATION DISTRIBUTION, SAMPLE DISTRIBUTION AND WEIGHT BY STRATIFICATION GROUP
Population distribution
Completed sample
distribution Weight
110 male, LC, all ages 20% 15% 1.40
120 male, LCVP, all ages 9% 8% 1.23
130 male, LCA, all ages 2% 4% 0.40
140 male, PLC, under 25 10% 13% 0.74
141 male, PLC, over 25 6% 4% 1.29
210 female, LC, all ages 18% 14% 1.32
220 female, LCVP, all ages 9% 9% 1.02
230 female, LCA, all ages 1% 4% 0.31
240 female, PLC, under 25 15% 21% 0.73
241 female, PLC, over 25 10% 9% 1.07
The weighted data were checked to ensure that the completed sample
distributions matched the population distributions by school type
attended and by whether the school was DEIS or non-DEIS. This was done
within three broad groups: Leaving Certificate leavers, PLC leavers under
age 25 and PLC leavers over age 25. As shown in Table B.4, the match was
very close. The population and weighted sample distributions across the
groups by DEIS and school type are within one percentage point of each
other. This indicates that the adjustment by stratum was all that was
needed to recalibrate the sample prior to analysis – no additional
adjustment by school type or DEIS status was needed.

Appendices|129
TABLE B.4: POPULATION DISTRIBUTION AND SAMPLE DISTRIBUTION OF DEIS SCHOOL AND SCHOOL TYPE BY STRATIFICATION GROUP (%)
Sample
distribution (weighted)
Population distribution
Difference
DEIS status
Non-DEIS 1 LC 50 50 1 2 PLC under 35 17 16 0 3 PLC over 25 8 9 -1
DEIS 1 LC 10 11 -1 2 PLC under 35 8 8 0
3 PLC over 25 7 6 1
Total 100 100
School type
C&C 1 LC 10 10 0 2 PLC under 35 1 1 0 3 PLC over 25 0 1 0
Secondary 1 LC 37 37 1 2 PLC under 35 1 1 0 3 PLC over 25 0 1 0
Vocational 1 LC 13 13 -1 2 PLC under 35 24 23 0 3 PLC over 25 14 14 0
Total 100 100
Note: The weights as described in Table B.3 have been applied to the sample figures.

130| Evaluation of PLC programme provision
APPENDIX C: CONSULTATION WORKSHOPS
This synthesis of consultative workshops was compiled by SOLAS. A series
of consultation workshops was conducted as a complementary strand of
research to this evaluation.
The consultative strand of the research consisted of four half-day
workshops designed to gather qualitative data from participants based on
findings from the first three strands of the research.79 The workshops were
held over a four day period, 23–26 February 2016.
The first workshop was confined to the CEOs of the 16 ETBs and was held
in the offices of Education and Training Boards Ireland (ETBI). Eleven CEOs
attended. The remaining three workshops were held in the ‘Clock Tower’
building, in the offices of the Department of Education and Skills. In total,
participants attended the Clock Tower workshops, which was in line with
the target. They included a wide cross-section of interested parties,
including representatives from all ETBs, government departments, state
agencies, employer representative groups, teacher unions, third-level
institutions, employers as well as other bodies linked to adult learning.
The ESRI made a comprehensive presentation on their initial findings from
the desk-based research, the survey of PLC college/school principals and
the survey of learners. The workshop participants were asked to consider
and present their views on the ESRI findings in relation to:
• geographic spread of PLC courses;
• capacity of PLC provision to respond to changes in the economy and labour
market;
• the range of fields of learning covered by the PLC programme;
• demand from employers for PLC graduates (sub-degree qualifications);
• the aim of the PLC programme;
• factors influencing the introduction of new courses and termination of others;
• teacher and tutor qualifications; and
79 The ESRI emphasised that the results were preliminary at the stage the workshops were held and may change
when all of the field work is completed. At that point, the data sets of both the survey of learners and the survey of principals surveys were incomplete.
Appendices|131
• constraints in responding to future needs.
They were also asked to comment on what they regarded as positive and
negative elements of the findings and, on the basis of the findings, to
suggest improvements to the PLC programme.
In order to facilitate participant feedback process, delegates were divided
into six roundtable discussion groups to consider the ESRI initial findings.
A spokesperson from each group presented feedback, which was recorded
on flipcharts.
The views expressed are presented below, together with the comments on
positive and negative elements of the research findings and suggested
improvements. It is noteworthy that certain recurring issues were
emphasised in the feedback across a wide range of the themes. These
issues included: teacher contracts, the second-level model in which the
programme operates, subject matter expertise, the ‘cap’ on PLC places,
funding for equipment, and curriculum and award constraints.
In each of the sections below, a short introduction or summary of the
relevant research finding is followed by a bulleted list of the most common
views expressed at the workshops.
Geographic spread of PLC courses
Relevant finding from the research: The distribution of PLC courses
nationally follows no discernible pattern and that provision does not
appear to be reactive to economic needs. The data also shows that the
distribution remained relatively static between 2008 and 2011.
• This is mainly a legacy issue and can be explained by the historical build-up of
numbers. It is often driven by the need to re-orientate the school, based on
changes in second-level enrolment numbers.
• Some colleges are turning people away because of the ‘cap’, which can limit
expansion of provision, while some PLC colleges have been taking increased
numbers above the ‘cap’.
• Provision is often driven by teacher skill sets.
• Provision per county needs to be looked at in the overall context of what is being
provided more generally in the county by way of further education and training
(FET) (e.g. training centres, institutes of technology etc.). Some institutes of
technology have developed Level 5 courses aimed at the same cohort as the PLC
target group.

132| Evaluation of PLC programme provision
• Since 2010 there has been an improvement in the spread and rationalisation of
courses. However, there is still a need for better coordination and planning.
• Access can be a problem in some rural areas (transport issues). Should we have
large PLC centres localised or mixed provision?
• While the provision appears to be correct (per head of population) in the greater
Dublin area, the spread is not proportional in the rest of the country based on
population trends.
• A forecasting model such as that used for school provision should be considered
for the allocation of places. It was suggested that the ‘cap’ on places be reviewed
to allow underserved areas to increase provision. ETBs need to internally review
their allocation of places on a geographic basis and increase the flexibility in the
use of buildings/infrastructure, especially between PLC colleges/schools and
training centres.
Capacity of PLC provision to respond to changes in the economy
and labour market
Some of the discussion around capacity fits more appropriately under
different theme headings and is therefore reported on under the relevant
theme heading.
• The system is based on a second-level model which cannot respond effectively to
labour market needs.
• The academic year is restrictive – a continuous intake cycle is needed rather than
the academic year model which currently applies.
• There is a significant lack of resources with regard to capital equipment.
• Teacher contracts which are based on the second-level model are an issue –
third-level courses are not subject to this constraint. Currently one year + one day
contracts lead to a permanent contract. There is a need to acknowledge the need
for different types of teaching and training staff. Contracts need to reflect this
reality.
• Greater flexibility is needed in terms of curriculum design and the time taken to
approve a course. A move towards delegated authority for award development
would increase response time.
• Decisions to run courses are based on enrolment numbers only – cannot be
labour market driven because of this.
• Greater links with industry are needed and employers should be consulted more
on skill shortages.

Appendices|133
• Consideration should be given to the development of competency based centres
that employers would have confidence in.
• The low pay rates that apply in certain occupations can act as a disincentive for
learners to engage in certain courses.
• Requirements under Section 30 of the Teaching Council Act are negatively
impacting on the capacity to recruit suitable teaching staff, especially in the high
skilled industry areas.
• PLCs can break the cycle of educational disadvantage and unemployment for
many individuals.
• PLCs may not be serving the needs of immigrants to allow them to integrate fully
into Irish society.
Theme 3 – Range of fields of learning covered by PLC
Relevant finding from the research: The desk-based research indicates
that there is a heavy emphasis, within PLC provision, on certain areas such
as early childhood care and education, community and health services, and
hairdressing. The research also shows that the vast majority of awards
made during 2009 (70 per cent) and 2012(84 per cent) were FETAC awards.
• Teaching Council requirements are seen to limit the range of provision on offer.
• Provision is driven by staff capability rather than market needs in many instances.
• Student demand is another factor that influences provision.
• STEM subjects are a major challenge for many students, particularly for those
who did not take these subjects in school. As a result they need initial guidance
on what will be expected from them before they take on these subjects at PLC
level.
• The range of fields covered by PLC provision is more extensive than the survey
indicates. Fields of learning do not always represent the complexity of provision.
• The same fields of learning are offered in PLC as in institutes of technology.
• The range of provision could also be influenced by policy issues such as the
current requirement for FETAC qualifications for those working in childcare.
• A wider range of qualifications could be offered by utilising other awarding
bodies (non-QQI); this would also facilitate a move towards a shorter
qualification period.
• QQI awards do not always reflect the skills that are needed in the labour market.

134| Evaluation of PLC programme provision
• Good PLC pathway linkages exist with institutes of technology but not with
employers (in the same way as the linkages that exist in apprenticeship).
• PLC s should focus more on technology-based sectors.
• Moving some PLC provision into training centres would improve integration of
training centre resources with further education colleges and facilitate a broader
range of provision.
• It should be acknowledged that PLC to higher education progression routes and
employment outcomes are not mutually exclusive.
Theme 4 – Demand from employers for PLC graduates (sub-degree
qualifications)
Relevant finding from the research: Limited relationship between PLC
provision and skill demand in the labour market. Based on the research
findings it is unclear in many instances that the emphasis of provision
coincides with labour demand.
• During the feedback session it was pointed out that the term sub-degree is
inappropriate and considered to be pejorative.
• The majority view is that there is a strong employer demand for PLC graduates.
• There is a large demand for PLC graduates. Level 7 and Level 8 qualifications are
not always suited to employer needs and in many cases lead to over-qualification.
• Opportunities for PLC will improve as the economy grows.
• Employer demand varies geographically; this is not reflected in the survey data.
• Replacement of old jobs will still be significant in the future as half of them will
be in the mid to low skill categories – areas of particular relevance for FET.
• Meeting demand from employers only can result in narrowly-based courses,
which restrict learner mobility.
• The issue of work experience during PLC courses is a concern. There are
difficulties in getting work experience. Some kind of support infrastructure was
suggested as a means to assist learners to secure work experience.
• The PLC is an accessible form of education, which can lead to progression.
• It is relatively easy to tailor a PLC course to meet a particular need (easier than a
degree-level course).
• Employers are now looking for employees with Level 5 and Level 6 qualifications,
which could reduce churn in the labour market.

Appendices|135
Theme 5 – Aim of the PLC programme
The views expressed on the aims and objectives of the programme were
wide ranging and in many cases overlapped with the other themes which
formed part of the overall discussion. The discussion included observations
on the DES’ Conditions of Approval (2012) as well as commentary on
specific aims of particular PLC courses and the fitness for purpose of such
courses. The main issues to emerge in the feedback are outlined below.
• The notion of progression to higher education is a relatively new development in
the aim for PLC. Social inclusion is also regarded as a very important aim of the
programme, more so in recent years. The aims of PLC need to be kept broad.80
• There is a mismatch between DES and DSP objectives for the programme –
education/activation into employment.
• The value of PLC and its place in the larger context of education need to be
clarified.
• It is difficult to change the aims of the PLC programme. ‘A broad brush approach
is better.’ There is a need to review the relevance of programmes. In many cases,
labour market demand does not necessarily mean that learners will want to do
courses that address such demands.
• There is a requirement to offer QQI awards and follow those award
specifications, even though they do not necessarily reflect the skills needed in the
labour market. The UCD Horizons model would be a better option but FET does
not have the facilities to do this.
• Many students need further general education after leaving school and this is
provided by the PLC programme. Many school leavers enrolling in a PLC course
need another year to mature (especially if they have not completed a transition
year). Students who undertake a PLC course learn to take responsibility for their
own work and to complete assignments and demonstrate skills. This improves
their outcomes when they progress to higher education.
• Institutes of technology are clamouring for agreement with PLC colleges to
ensure a supply of Level 5 students for their courses. ‘If we want a job market
focus for PLCs, then there is a tension between these two supply issues.’
Theme 6 – Factors influencing introduction of new courses and
termination of others
Relevant finding from the research: Decisions in relation to providing new
80 In the survey, PLC learners were asked about their primary objective for undertaking a PLC programme: 39
per cent said that their main goal was to get a job immediately after the PLC course, and a similar percentage reported that their main goal was to progress to higher education. Almost 20 per cent cited personal development as the key motivating factor for pursuing a PLC course.
136| Evaluation of PLC programme provision
PLC courses and terminating ‘old’ courses tend to be driven by student
demand, with less weight given to employer requirements, government
objectives or national forecasting.
• Demand from companies to set up courses to meet a specific need can leave a
college with a course, a teacher and no demand after the initial need is met. This
is problematic.
• In some instances it is only possible to introduce a new course when a staff
member retires because of the nature of teacher contracts. Even though this can
be lead to the introduction of a new course, it is also restrictive.
• The current practice is mainly based on student demand and existing student
footfall rather than labour market demand. This is the most significant cultural
change required in this regard. The new DES Regional Skills Fora is seen as a
positive measure to inform future course provision/development.
• There is a long development period in relation to new certification; it can take a
few years to one to develop. This is another factor. Third party certification
bodies such as CIDESCO are not QQI approved.
• There is little engagement with the DSP in relation to new PLCs and the DSP
referral process introduces further complications.
• Getting a critical mass of students to engage in a new course can be difficult.
• The degree to which new courses can be introduced and others terminated is
limited by a variety of factors such as the ‘cap’ on places, second-level teacher
contracts. Moreover, the availability of course-specific physical resources can
prevent or delay the introduction of new courses.
• Strategic partnerships with industry could be useful. There is a need to ‘sweat the
assets, through a combination of measures – employer resources and continuous
intake’.
Theme 7 – Teacher and tutor qualifications
Relevant finding from the research: PLC teacher and tutor initial
qualifications are as follows: 45 per cent in the arts and social sciences; 22
per cent in services; 19 per cent in STEM; and 14 per cent in agriculture. Is
this structure likely to be a constraint in responding to future changing
needs?
• The requirements under Section 30 of the Teaching Council Act are seen as a
major challenge.
• There is a need for more people from industry to be engaged in teaching. ‘The
system does not allow for the voice of industry’. A new model to staff the

Appendices|137
teaching of PLCs is required. The core skills of teachers could be supplemented
by people working within the relevant field. It is very difficult to attract teachers
for certain disciplines, such as nursing, veterinary, architecture and ICT, who can
comply with the regulations of the Teaching Council.
• There is a need for more continuing professional development (CDP) for
teachers. Former FÁS instructors cannot teach in further education colleges – this
needs to be addressed.
• PLC teachers comprise a mix of secondary school teachers and industry experts
who in some cases are only qualified one level up from the level they are
teaching. There is a need for subject matter expertise but also for a minimum
teaching qualification.
• History shows that teachers have always been flexible in relation to moving
between disciplines. Very few are still working in their original fields. Funding
would help in encouraging teachers to engage in CPD. Qualification allowances
for teachers no longer exist.
Theme 8 – Constraints in responding to future needs
• Capital investment is a major constraint. Sharing facilities with training centres
could assist in this regard.
• The current funding model for the PLC programme, which is based on second-
level provision, the second-level teacher contract arrangement and the
requirements of Section 30 of the Teaching Council Act are all impacting
negatively on responsiveness.
• ‘The failure of DSP referral protocol to function in terms of PLC is an issue.’ ‘DSP,
ETBs and SOLAS are constraints in themselves as they are not fully bedded down
yet.’
• Decision making has been removed from college level to a central ETB level,
resulting in a lack of responsiveness.
• Availability of accurate information on employer needs is an issue. Ongoing
analysis is required, based on longitudinal surveys. A lot of information available
on employers’ needs is not based on hard information. It is mostly based on
roundtable discussions.
• Esteem of PLC courses by parents and society is an issue. It is largely considered
a form of second chance education. ‘A lot of further education students expect
to progress to higher education, is this realistic?’ There is a guidance issue in this
regard.
• The successes of PLC courses are not well advertised. Development of a ‘skills
passport’ for PLC learners should be considered.
138| Evaluation of PLC programme provision
• Level 6 higher education awards and Level 6 further education awards are not
seen as equal. The credit values are different for each. This needs to be addressed
as it can impact on progression.
• Lack of childcare support for participants is a constraint. Support exists for other
similar FET programmes but not for PLCs – ‘hard to explain this away’. Likewise,
special needs are not funded adequately.
• Institutes of technology develop Level 5 and Level 6 programmes when their own
numbers drop. This has an impact on PLC provision.
• The limited award titles from QQI also pose a constraint.
• The geographic spread within ETBs themselves is an issue. Transport
infrastructure restricts access for some people.
• New QQI validation requirements will impact in a negative way on the desire to
provide new programmes.
• The QQI brand is a concern as it is not widely recognised by employers in the
same way as C&G, ITEC etc.
• Until recently, guidance training did not include FET provision; the focus was
mainly on the CAO route.
Theme 9 - Positive and Negative elements of the findings
Positive elements of the findings
• High progression and employment rates were achieved.
• A large percentage (37 per cent) of PLC learners achieved 300–400 CAO points,
which indicates that PLC was a first choice for many students.
• A relatively high percentage of PLC leavers became self-employed compared to
Leaving Certificate leavers.
• Local arrangements are in place for progression in the fields of learning on offer.
• The range of fields of learning on offer is responsive to learner demand.
• The diversity in age among PLC learners shows flexibility within the system.
• Positive student experiences emerged, with high satisfaction rates.
• The PLC programme provides a non-traditional route for access to higher
education.
• There is a good balance between learners’ and employers’ needs.
• There are high retention rates in higher education following progression.

Appendices|139
• It provides a holistic approach to education with a rounded experience.
• It seems that after five years there is a positive correction for social disadvantage
arising from PLC participation (bridging the gap).
• The PLC programme is good for social cohesion; it helps to retain training and
jobs in the local labour market.
Negative elements of the findings
• A high proportion of students did not engage in work experience.
• There is a mismatch between supply and labour market demand, with oversupply
in certain areas.
• Additional supports are required (such as childcare and transport).
• Staffing structures/contracts can be of indefinite duration.
• The proportion of courses without employment outcomes is a concern.
• There are limited links to employers.
• Participation is mainly female, which relates to the type of courses on offer.
• Courses can be accessed without suitability/aptitude testing.
• Counterfactual data would be useful.
• The survey response rates were low.
Suggested improvements to the PLC programme
A wide range of improvements were proposed based on the research
findings and the direct experiences of the workshop participants, the most
significant of which are outlined below.
• CPD: A comprehensive CPD programme to retrain teachers in other fields of
learning is required. CPD should take three forms: subject matter; pedagogy; and
change of vocational area. The former FÁS approach could inform this process. A
one-year period for retraining over a 40 year career should be regarded as a
worthwhile investment. The notion of moving teachers between provision types
should be explored (e.g. from PLC to Youthreach to adult education). It must be
recognised that many courses need teaching staff with vocational qualifications.
• Contracts: There is a need to look at the teacher contract to make it more
appropriate to current needs in FET. A move away from the teacher allocation
model to a pay/non-pay model, to include administration and guidance services,
which have now begun moving towards mentoring, would be more appropriate.
A review of the application of Section 30 of the Teaching Council Act to the PLC
sector should also be undertaken.
140| Evaluation of PLC programme provision
• Continuous intake: Break from the traditional school calendar. Continuous intake
and other more flexible forms of delivery are required, including modular
provision.
• Targets/linkages: Set national targets for progression and employment with
improved industry links. Sectoral leadership on skills is an issue: ‘There is no go
to body for employers like CERT for liaison.’ A greater understanding of industry
needs would assist in improving provision. More detailed occupational profiles
would assist in this regard.
• Funding: Develop an integrated funding model with student supports built in. The
silo type model in use at the moment can include up to 17 different budgets
across FET.
• Awards: There are restrictions imposed by QQI awards, such as the protracted
time to validate awards. Recognition of industry/vendor qualifications within
major awards would help to improve the provision. The QQI award in work
experience only attracts 15 credits. This needs to be revisited in the context of
credit value, how it is assessed, as well as employer and learner expectations
about work experience.
• Name of PLC: Consideration should be given to changing the name ‘Post-Leaving
Certificate’, since many students have not completed a Leaving Certificate. The
PLC programme does not constitute one single programme, as the Leaving
Certificate does, and should not be described in this way. It is very diverse with
different pillars within the programme. It needs to be rebranded.
• Guidance: There is a need for improved guidance, with an emphasis on adult
guidance requirements, in order to create better awareness of what is on offer
in the sector. A significant proportion of PLC students do not come from second-
level education. Guidance counsellors should be informed about FET provision as
part of their training. Second-level schools should be better informed regarding
PLC provision; however, career guidance is not getting the support it needs.
Standard eligibility criteria are also needed for entry to the programmes.
• Integration: It should be recognised that HR/IR issues arise regarding the
integration of FET provision.
• Pathways: Progression from further education to higher education is overly
complicated and needs to be simplified. Some form of standardisation of
progression pathways should be developed.
• Structures: A middle management structure was suggested together with
dedicated staff for employer engagement and work placement/experience.
• Supports: SUSI supports to PLC students are less than those provided to third-
level students. Notwithstanding a similar maintenance allowance, a third-level
student will be supported for the full registration fee (€3,000+), while a PLC

Appendices|141
student will only be exempted from the €200 levy. A typical PLC course will have
additional charges of €300–€500, which may mean that, for a SUSI grant
recipient, a PLC course will be more expensive than a third-level course.
• Social welfare recipients: There are inconsistencies for social welfare recipients
choosing a PLC course rather than a course in an ETB training centre. Unless on
VTOS, the PLC student is required to pay the course levy (€200). Participants on
attending a training centre course will not incur costs.

142| Evaluation of PLC programme provision
APPENDIX D: QUESTIONNAIRE FOR SURVEY OF SCHOOL AND PLC LEAVERS
PIN No.
Thank you for agreeing to participate in our survey. All of the information provided is
confidential and will not be disclosed to anyone outside the ESRI. The reports we produce
deal only with general results. Individual information is not reported. You do not need to
answer any particular question if you do not wish to.
SECTION A: PERSONAL REFLECTIONS
A1. Are you male or female? Male ........ 1 Female...... 2
A2. What is your date of birth? / / (dd/mm/yr)
A3. When did you leave school? _____ Month _____ Year
A4. All things considered, how satisfied would you say you are with your life these days? Please tell me on a scale of 1 to 10, where 1 means very dissatisfied and 10 means very satisfied. (Please tick one box)
Very dissatisfied Very satisfied
1 2 3 4 5 6 7 8 9 10
A5. How frequently do you do each of the following? (Please tick one box on each line)
Every day
or almost every day
At least
once a week
One to
three times a month
Less
often
Never
Take part in sports or physical exercise 1 2 3 4 5
Use the Internet other than for work 1 2 3 4 5
Attend religious services, apart from weddings, funerals or christenings
1 2 3 4 5
Participate in social activities of a club, society, or an association
1 2 3 4 5
Do unpaid voluntary work for a community, educational, cultural, sporting or other association
1 2 3 4 5
A6. Below is a list of skills and competences. To what extent do you think you have the following competences at the moment? (Please tick one box on each line)
Not To a great at all extent
1 Good written communication skills 1 2 3 4 5
2 Good oral communication skills 1 2 3 4 5
3 Ability to use computers and the internet 1 2 3 4 5
4 Analytical skills 1 2 3 4 5
5 Ability to perform well under pressure 1 2 3 4 5
6 Ability to work well with others 1 2 3 4 5
7 Ability to come up with new ideas and solutions 1 2 3 4 5
8 Ability to write and speak in a foreign language(s) 1 2 3 4 5
9 Knowledge of the field in which you are studying or working 1 2 3 4 5

Appendices|143
A7. To what extent do you agree/disagree with the following statements? (Please tick one box on each line)
Strongly Agree
Agree Neither agree nor disagree
Disagree Strongly disagree
I generally feel that what I do in life is worthwhile
1 2 3 4 5
I feel left out of society 1 2 3 4 5
Life has become so complicated today that I almost can’t find my way
1 2 3 4 5
I feel that the value of what I do is not recognised by others
1 2 3 4 5
Some people look down on me because of
my job situation or income 1 2 3 4 5
A8. How would you rate your health overall?
Excellent Very good Good Fair Poor
1 2 3 4 5
A9. How would you rate your mental health overall?
Excellent Very good Good Fair Poor
1 2 3 4 5
A10. Do you have any chronic (long‐standing) physical or mental health problem, illness or disability? By chronic (long‐ standing) I mean illnesses or health problems which have lasted, or are expected to last, for 6 months or more.
Yes......... 1 Go to A11 No........ 2 Go to B1
A11. Are you limited in your daily activities by this physical or mental health problem, illness or disability?
Yes, severely Yes, to some
extent
No
1 2 3
SECTION B: CURRENT SITUATION
B1. What is/was your main status in each of these three periods: September 2010, September
2012 and September 2015? (Please tick one box only in each column.)
Sept 2010 Sept 2012 Sept 2015
In paid employment 1 1 1
Self-employment 2 2 2
Unemployed and looking for work 3 3 3
Unemployed and not looking for work 4 4 4
Studying Higher Education course 5 5 5
Studying Further Education course e.g. PLC 6 6 6
Apprenticeship 7 7 7
Internship 8 8 8
Other FÁS/Solas, Fáilte Ireland, Teagasc course etc. 9 9 9
On a private Training Scheme 10 10 10
Engaged in home duties 11 11 11
Unable to work due to permanent disability or illness 12 12 12
Taking a year out or travelling 13 13 13
Other, please specify ________________________ 14 14 14
B2. Have you ever participated in the following programmes/schemes? (Tick all that apply)
Vocational Training Opportunities Scheme (VTOS) 1
Back to Education Allowance (BTEA) 2
Springboard Course 3
JobBridge Internship 4
Momentum 5

144| Evaluation of PLC programme provision
Skillnets 6
Youthreach 7
Not Applicable 8
B3. Could you tell me the highest level of education you have completed?
Primary or below 1
Lower Secondary (Junior/Inter Cert or equiv) 2
Upper Secondary (Leaving Cert or equiv) 3
Post-Secondary Non-Tertiary (e.g. PLC) 4
Non-Degree (Certificate/Diploma) 5
Ordinary Degree 6
Honours Degree 7
Masters 8
Other (please specify):________________ 9
B4. Since the age of 18, please indicate the total time you have spent in each of the following activities?
Years Months
In employment (full-time/part-time), self-employment or farming
Unemployed (and seeking work)
Ill/disabled and outside labour force
On home duties/ Caring for children
In full-time education
Other (please specify):_________________
B5. Which of the following best describes your current marital status?
Single 1 Living as a couple 3
Married 2 Divorced/Widowed/Separated 5
Civil Partnership 3
B6. Do you have any children? Yes ....... 1 No ......... 2 B7. Which of the following best describes your living situation in September 2012 and 2015?
Sept 2012 Sept 2015
Lodgings/digs 1 1
With parents/relatives 2 2
College residence on/off campus 3 3
Rented house/flat 4 4
Own household 5 5
Other (please specify ________________) 6 6
B8. A household may have different sources of income and more than one household member may contribute to it. Thinking of your household’s total monthly income: is your household able to make ends meet … ?
Very easily Easily Fairly easily
With some difficulty
With difficulty
With great difficulty
1 2 3 4 5 6

Appendices|145
SECTION C: SECOND LEVEL ATTAINMENT
C1. What programme were you taking in your last year at second-level school or Youthreach where
applicable? (Please tick one box only. Do not include PLC or other Further Education courses, if taken.)
Leaving Certificate 1
Leaving Certificate Applied Programme 2
Leaving Certificate Vocational Programme (includes link modules) 3
Junior Certificate 4
Other (please specify) ______________________________ 5
C2. (a) At this last examination, what subjects did you sit for, what level paper did you take and
what grades did you get?
Subject Level Grade (b) If you sat the Leaving Certificate Applied: __________________ ____________ ______ (i) Did you receive: [Tick one only] __________________ ____________ _____ Pass 1
__________________ ____________ _____ Merit 2 __________________ ____________ _____ Distinction 3
__________________ ____________ _____ Fail 4 __________________ ____________ _____ Record of experience 5
__________________ ____________ _____ (ii) Vocational Specialisms taken __________________ ____________ _____ __________________________ __________________ ____________ _____ _______________
__________________ ____________ _____ (iii) Languages Taken __________________ ____________ _____ _______________ _______________
(c) If you cannot provide complete details on subject level and grade on last examination sat in Question C3 (a) or (b) above, perhaps you can complete the following: (i) how many honours and pass subjects you sat for in your last examination; (ii) of these, in how many did you achieve an A, B or C; a D; or an
E, F or NG?
LEVEL
No. of Subjects
No. of A,B,C’s
No. of D’s
No. of E,F or NG’s
Honours Subjects
Pass Subjects
(d) What points were you awarded in your Leaving Certificate? ______ (if applicable)
LEAVING CERT, LEAVING CERT VOCATIONAL OR LEAVING CERT APPLIED RESULTS
We are interested in finding out how students get on in the Leaving Certificate exams. This is very important as it means we can discover what helps students do well at school in order to improve the school system. If you have not been able to provide full details of your subject, levels, and grades, we would be very grateful if you could give us permission to access your exam results from the State Examinations Commission. The
information will be completely confidential. You will not be identified in any way. We are only interested in overall patterns not in individual students or schools.
C3. (e) If you AGREE that we can access your Leaving Certificate exam results, please tick the box ‘YES’: Yes..... 1 No...... 2
We are interested in finding out how those who attended different types of schools and colleges are getting on today. We would be very grateful if you could give us permission to access information on the school or college you attended from the Post-Primary Pupil Database maintained by the Department of Education and Skills. The information would include the school roll number and school type. The information is confidential
and we will not identify you or your school in any of our publications.
C4. If you AGREE that we can obtain this information, please tick the box ‘YES’:
Yes..... 1 No...... 2

146| Evaluation of PLC programme provision
C5. Did you experience any particular special educational need or disability that affected your learning while at school? Yes..... 1 Go to C6 No...... 2 Go to D1
C6. If Yes, did you have this special educational need or disability formally assessed?
Yes..... 1 No...... 2
SECTION D: PERSONAL REFLECTIONS ON SCHOOL EXPERIENCES
D1. Thinking back to your last year in school (not including any PLC or other Further Education
courses you may have taken), when you were deciding what to do after you left school:
(a) Did you get any advice from any of the following people? (Please tick all that apply in column A.)
(b) Of those who gave you advice, who do you think was the most help to you in deciding what to do
after you left school? (Tick one box only in column B.)
A. Any Advice Tick all that apply
B. Most Helpful Tick One
Career guidance counsellor in school 1 1 Another teacher in school 2 2 Mother 3 3
Father 4 4 Other family member (please specify _____________) 5 5 Friend(s) 6 6
Someone studying the course 7 7 Someone working in the area 8 8 Someone else (specify __________________) 9 9
Received no advice 10 10 Other source (please specify _________________) 11 11
D2. How satisfied were you with the information you received at school on the different options
open to you on leaving school?
Very satisfied Satisfied Dissatisfied Very dissatisfied
1 2 3 4
D3. Which of the following were the most important influences in making your decision about
what you would do when you left school? Please select your top 3 in order, where 1 is the most important influence, 2 is the second most important and 3 is the third most important influence.
Studying a subject I am interested in Being able to get a secure job
Having an income (any job) Being able to get an interesting job What school personnel advised me to do (teachers, guidance counsellor) What my friends or family advised me to do
What my friends were doing What my siblings/family member had done/were doing Personal fulfilment
None of the above
D4. What did you plan to do immediately on leaving school? (Please tick one box)
Go on to a post-school education or training course 1 Get a job 2
Travel/ take time-out 3
Take on caring responsibilities at home 4 Other, please specify ___________________________________ 5
D5. Did you get to do what you planned after leaving school?
Yes To some extent No
1 2 3
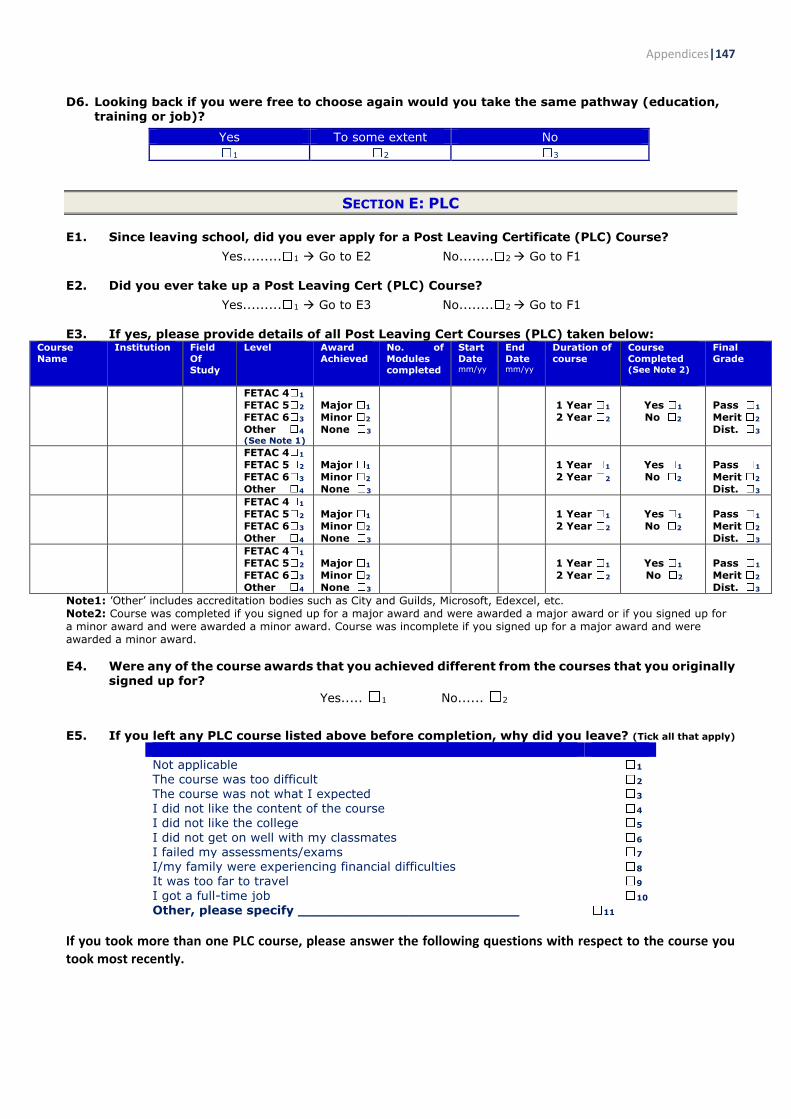
Appendices|147
D6. Looking back if you were free to choose again would you take the same pathway (education, training or job)?
Yes To some extent No
1 2 3
SECTION E: PLC
E1. Since leaving school, did you ever apply for a Post Leaving Certificate (PLC) Course?
Yes......... 1 Go to E2 No........ 2 Go to F1
E2. Did you ever take up a Post Leaving Cert (PLC) Course?
Yes......... 1 Go to E3 No........ 2 Go to F1
E3. If yes, please provide details of all Post Leaving Cert Courses (PLC) taken below: Course Name
Institution Field Of Study
Level
Award Achieved
No. of Modules completed
Start Date mm/yy
End Date mm/yy
Duration of course
Course Completed (See Note 2)
Final Grade
FETAC 4 1
FETAC 5 2
FETAC 6 3
Other 4
(See Note 1)
Major 1
Minor 2
None 3
1 Year 1
2 Year 2
Yes 1
No 2
Pass 1
Merit 2
Dist. 3
FETAC 4 1
FETAC 5 2
FETAC 6 3
Other 4
Major 1
Minor 2
None 3
1 Year 1
2 Year 2
Yes 1
No 2
Pass 1
Merit 2
Dist. 3
FETAC 4 1
FETAC 5 2
FETAC 6 3
Other 4
Major 1
Minor 2
None 3
1 Year 1
2 Year 2
Yes 1
No 2
Pass 1
Merit 2
Dist. 3
FETAC 4 1
FETAC 5 2
FETAC 6 3
Other 4
Major 1
Minor 2
None 3
1 Year 1
2 Year 2
Yes 1
No 2
Pass 1
Merit 2
Dist. 3
Note1: ’Other’ includes accreditation bodies such as City and Guilds, Microsoft, Edexcel, etc.
Note2: Course was completed if you signed up for a major award and were awarded a major award or if you signed up for
a minor award and were awarded a minor award. Course was incomplete if you signed up for a major award and were
awarded a minor award.
E4. Were any of the course awards that you achieved different from the courses that you originally signed up for?
Yes..... 1 No...... 2
E5. If you left any PLC course listed above before completion, why did you leave? (Tick all that apply)
Not applicable 1 The course was too difficult 2
The course was not what I expected 3 I did not like the content of the course 4 I did not like the college 5
I did not get on well with my classmates 6 I failed my assessments/exams 7 I/my family were experiencing financial difficulties 8 It was too far to travel 9
I got a full-time job 10 Other, please specify __________________________ 11
If you took more than one PLC course, please answer the following questions with respect to the course you took most recently.

148| Evaluation of PLC programme provision
E6. In taking the PLC course (your most recent, if more than one), did you hope it would help you ...
(Please tick your one primary objective) Tick one primary reason Get a place on a Higher Education programme 1 Get a job right away after the PLC course 2
Personal Development 3
Other, please specify ___________________________________
4
E7. Did your PLC course open up opportunities for further study at.. (Tick all that apply)
Irish Universities 1 Institutes of Technology 3
UK Universities 2 Other (please specify):______________ 4
E8. Was your PLC course part of a HE Links Scheme? Yes......... 1 No........ 2 Don’t know........ 3
E9. Did your PLC course entitle you to advanced entry into a Higher Education course (e.g. direct
entry to second year)? Yes......... 1 No........ 2
E10. Did you receive any type of grant to cover such expenses as fees or maintenance? Yes......... 1 No........ 2
E11. If yes, did you receive any of the following supports/schemes?
Vocational Training Opportunities Scheme (VTOS) Yes/No
Back to Education Allowance (BTEA) Yes/No
E12. During your PLC studies, did you access any of the following student supports? If so, how
satisfied were you with the service provided?
Tick one Yes No
Very satisfied
Satisfied
Dissatisfied
Very dissatisfied
Career Guidance 1 2 1 2 3 4
Counselling 1 2 1 2 3 4
Learning Supports 1 2 1 2 3 4
Childcare 1 2 1 2 3 4
Disability Support Service 1 2 1 2 3 4
E13. Did you participate in work experience during your PLC studies? Yes.... 1 No...... 2
E14. If yes, how long did your work experience last? _________________ (number of weeks) E15. During term-time, how many HOURS PER WEEK do/did you spend on the following activities?
(Please enter the total number of hours over the whole week including the weekend)
No. of Hours per Week
Lectures/Tutorials/Practical etc _______ hrs/wk Personal Study, doing assignments/project work at home _______ hrs/wk Playing sports/taking part in clubs and societies _______ hrs/wk Travelling between accommodation and college (to & from) _______ hrs/wk
E16. How did your overall result compare to that of other students that completed your study programme?
1
Much lower than average
2 3 4 5
Much higher than average
6
Cannot tell
1 2 3 4 5 6
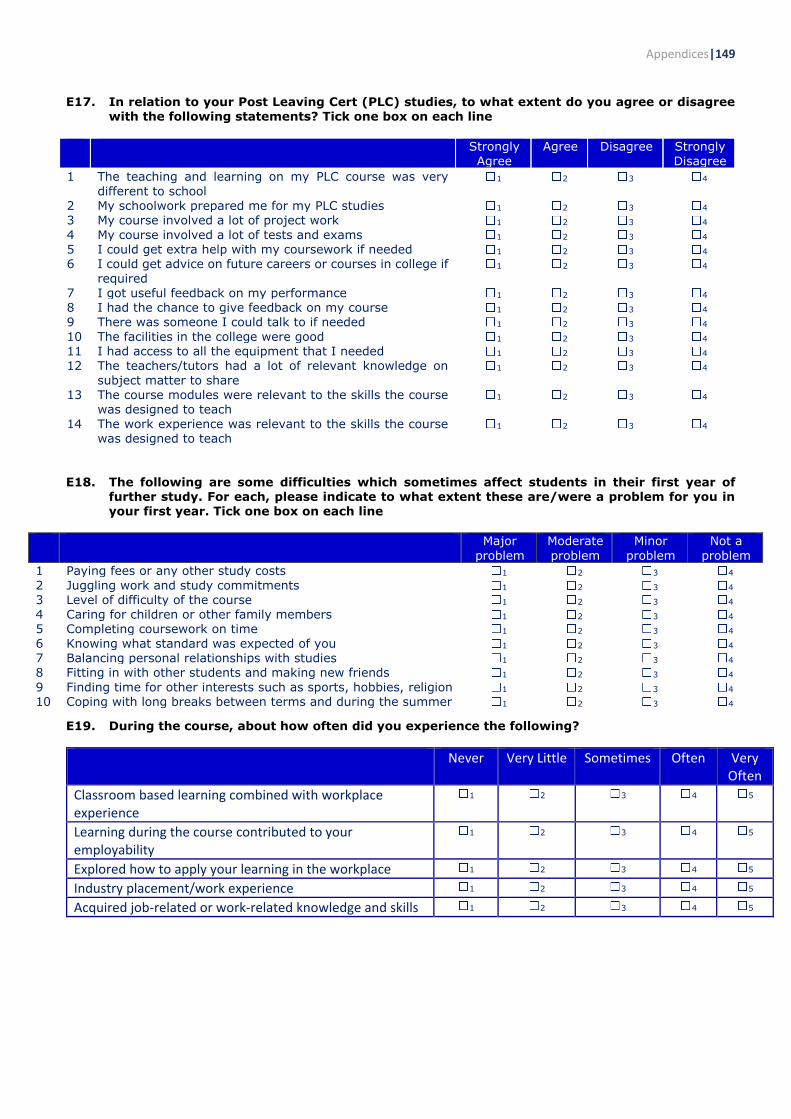
Appendices|149
E17. In relation to your Post Leaving Cert (PLC) studies, to what extent do you agree or disagree with the following statements? Tick one box on each line
Strongly
Agree
Agree Disagree Strongly
Disagree
1 The teaching and learning on my PLC course was very
different to school 1 2 3 4
2 My schoolwork prepared me for my PLC studies 1 2 3 4 3 My course involved a lot of project work 1 2 3 4
4 My course involved a lot of tests and exams 1 2 3 4 5 I could get extra help with my coursework if needed 1 2 3 4 6 I could get advice on future careers or courses in college if
required 1 2 3 4
7 I got useful feedback on my performance 1 2 3 4 8 I had the chance to give feedback on my course 1 2 3 4 9 There was someone I could talk to if needed 1 2 3 4
10 The facilities in the college were good 1 2 3 4 11 I had access to all the equipment that I needed 1 2 3 4 12 The teachers/tutors had a lot of relevant knowledge on
subject matter to share 1 2 3 4
13 The course modules were relevant to the skills the course was designed to teach
1 2 3 4
14 The work experience was relevant to the skills the course was designed to teach
1 2 3 4
E18. The following are some difficulties which sometimes affect students in their first year of further study. For each, please indicate to what extent these are/were a problem for you in your first year. Tick one box on each line
Major
problem
Moderate
problem
Minor
problem
Not a
problem
1 Paying fees or any other study costs 1 2 3 4
2 Juggling work and study commitments 1 2 3 4 3 Level of difficulty of the course 1 2 3 4 4 Caring for children or other family members 1 2 3 4 5 Completing coursework on time 1 2 3 4
6 Knowing what standard was expected of you 1 2 3 4 7 Balancing personal relationships with studies 1 2 3 4 8 Fitting in with other students and making new friends 1 2 3 4
9 Finding time for other interests such as sports, hobbies, religion 1 2 3 4 10 Coping with long breaks between terms and during the summer 1 2 3 4
E19. During the course, about how often did you experience the following?
Never Very Little Sometimes Often Very Often
Classroom based learning combined with workplace experience
1 2 3 4 5
Learning during the course contributed to your employability
1 2 3 4 5
Explored how to apply your learning in the workplace 1 2 3 4 5
Industry placement/work experience 1 2 3 4 5
Acquired job-related or work-related knowledge and skills 1 2 3 4 5

150| Evaluation of PLC programme provision
E20. How would you describe your relationships with each of the following? (Please tick one box on each line)
1
Unavailable, unsupportive, sense
of alienation
2 3 4 5
6
Available, supportive, considerate
Other Students 1 2 3 4 5 6
Teaching Staff 1 2 3 4 5 6
Administrative Personnel 1 2 3 4 5 6
E21. How do/did you fund your studies during your Post Leaving Cert Course (PLC)?
Tick all that apply
Money from your family 1
Indirect support from your family (e.g. food, accommodation) 2
Earnings from employment 3
A State grant 4
Vocational Training Opportunities Scheme (VTOS) 5
Back to Education Allowance (BTEA) 6
Other Social welfare payment 7
A bank loan 8
Savings 9
Employer assistance 10
The Fund for Students with Disabilities 11
Other, please specify ____________________________ 12
SECTION F: HIGHER EDUCATION
F1. Since leaving school, did you ever apply for a Higher Education Course (HE) Course? ........
Yes......... 1 Go to F2 No........ 2 Go to G1
F2. Since leaving school, did you ever take a Higher Education Course (HE)?
Yes......... 1 Go to F3 No........ 2 Go to G1
F3. If yes, please provide details of all Higher Education courses below: Course Name Institution Field of
Study
Level (6,
7, 8 or 9)
Start
Date mm/yy
End
Date mm/yy
Completed
(Tick one) Yes No
Overall
Grade
1 2
1 2
1 2
1 2 F4. If you left any Higher Education course before completion, why did you leave? (Tick all that apply)
Not applicable 1
The course was too difficult 2 The course was not what I expected 3 I did not like the content of the course 4 I did not like the college 5
I did not get on well with my classmates 6 I failed my exams 7 I/my family were experiencing financial difficulties 8
It was too far to travel 9 I got a full-time job 11 Other, please specify __________________________ 12
If you took more than one HE course, please answer the following questions with respect to the one you took most recently.

Appendices|151
F5. Did you receive any of the following types of grant to cover such expenses as fees or maintenance?
F6. How do you rate your overall grade compared to other students that graduated from your study programme?
1 Much lower than average
2 3 4 5 Much higher than average
6 Cannot tell
1 2 3 4 5 6
F7. During your Higher Education studies, did you access any of the following student supports? If so, how satisfied were you with the service provided?
Please Tick one
Yes No
Very satisfied
Satisfied
Dissatisfied
Very dissatisfied
Career Guidance 1 2 1 2 3 4
Counselling 1 2 1 2 3 4
Learning Supports 1 2 1 2 3 4
Childcare 1 2 1 2 3 4
Disability Support Service 1 2 1 2 3 4
F8. During term-time, how many HOURS PER WEEK do/did you spend on the following activities? (Please enter the total hours over the whole week including the weekend.)
No. of Hours per Week
Lectures/Tutorials/Practicals etc. _______ hrs/wk
Personal Study, doing assignments/project work at home _______ hrs/wk
Playing sports/taking part in clubs and societies _______ hrs/wk
Travelling between accommodation and college (to & from) _______ hrs/wk
F9. In relation to your Higher Education (HE) studies, to what extent do you agree or disagree with the following statements? (Please tick one box on each line)
Strongly
Agree
Agree Disagree Strongly
Disagree
Not
Applicable
1 The teaching and learning on my course was very different to school
1 2 3 4
2 My schoolwork prepared me for my HE studies 1 2 3 4 3 My PLC studies prepared me for my HE studies 1 2 3 4 5 4 I studied the course I wanted in the Institution of my
choice 1 2 3 4
5 My course involved a lot of project work 1 2 3 4 6 My course involved a lot of tests and exams 1 2 3 4 7 I could get extra help with my coursework if needed 1 2 3 4
8 I could get advice on future careers or courses in college if required
1 2 3 4
9 I got useful feedback on my performance 1 2 3 4
10 I had the chance to give feedback on my course 1 2 3 4 11 There was someone I could talk to if needed 1 2 3 4 12 The facilities in the college were good 1 2 3 4 13 I had access to all the equipment that I needed 1 2 3 4
14 The teachers/tutors had a lot of relevant knowledge on subject matter to share
1 2 3 4
15 The course modules were relevant to the skills the
course was designed to teach 1 2 3 4
16 The work experience was relevant to the skills the course was designed to teach
1 2 3 4 5
Yes No Back to Education Allowance (BTEA) 1 2
Springboard 1 2
Higher Education Grant (SUSI) 1 2
The Fund for Students with Disabilities 1 2
The Student Assistance Fund 1 2

152| Evaluation of PLC programme provision
F10. The following are some difficulties which sometimes affect students in their first year of further study. For each, please indicate to what extent these are/were a problem for you in your first year. (Please tick one box on each line)
Major
problem
Moderate
problem
Minor
problem
Not a
problem
1 Paying fees or any other study costs 1 2 3 4
2 Juggling work and study commitments 1 2 3 4 3 Level of difficulty of the course 1 2 3 4 4 Caring for children or other family members 1 2 3 4
5 Completing coursework on time 1 2 3 4 6 Knowing what standard was expected of you 1 2 3 4 7 Balancing personal relationships with studies 1 2 3 4
8 Fitting in with other students and making new friends 1 2 3 4 9 Finding time for other interests such as sports, hobbies,
religion 1 2 3 4
10 Coping with long breaks between terms and during the
summer 1 2 3 4
F11. How would you describe your relationships with each of the following (Please tick one box on each line): 1
Unavailable, unsupportive, sense of
alienation
2 3 4 5
6 Available, supportive,
considerate
Other Students 1 2 3 4 5 6
Teaching Staff 1 2 3 4 5 6
Administrative Personnel 1 2 3 4 5 6
F12. During the course, about how often did you do the following? 1
Never
2
Very Little
3
Sometimes
4
Often
5
Very Often
Classroom based learning combined with workplace experience
1 2 3 4 5
Learning during the course improved your knowledge and skills that contributed to your employability
1 2 3 4 5
Explored how to apply your learning in the
workplace 1 2 3 4 5
Industry placement / work experience 1 2 3 4 5
Acquiring job-related or work-related knowledge and skills
1 2 3 4 5
F13. How do/did you fund your studies during your Higher Education studies (HE)? Tick all that apply
Money from your family 1
Indirect support from your family (e.g. food, accommodation) 2
Earnings from employment 3
A State grant 4
Back to Education Allowance 5
Other Social welfare payment 6
A bank loan 7
Savings 8
Employer assistance 9
Other, please specify ____________________________ 10

Appendices|153
SECTION G: POST-SCHOOL TRANSITIONS – OTHER COURSES/TRAINING
G1. Since leaving school, did you ever apply for an apprenticeship or any course such as FAS Specific Skills Training (SST), Traineeship etc. Yes......... 1 Go to G2 No........ 2 Go to H1
G2. Since leaving school, did you ever take an apprenticeship/ FAS Specific Skills Training Course, Traineeship or any other course?
Yes......... 1 Go to G3 No........ 2 Go to H1
G3. If yes, please provide details of all apprenticeship/SST or any other course below: Course Name /Apprenticeship Title
Institution/ Employer
Field of Study
Level Start Date
End Date
Completed (Tick one) Yes No
Overall Grade
1 2
1 2
1 2
1 2
SECTION H: CURRENT JOB
H1. Did you hold a job last week, even for a short time?
Yes......... 1 Go to H2 No........ 2 Go to I1
H2. In relation to this job, how would you describe it?
Regular, full-time ........................... 1
Temporary, full-time ....................... 2 Regular, part-time .......................... 3
Temporary, part-time ..................... 4
H3. When did you take up this job? Month _____________ Year____________
H4. In relation to this job, what is your occupation? (Please write in the job title and describe the nature of the work done.)
_________________________________________________________________________________ H5. What is the nature of the business carried out by your employer (or yourself, if you are self-employed)? (Please describe the process carried out, and the end-product, if any)
_________________________________________________________________________________ H6. What is the usual number of hours (per week) you work in this job? __________ hours
H7. Do you work in the public or private sector?
Public sector Private sector, not for profit
Private sector, for Profit
Other, please specify
1 2 3 4
__________________________ H8. How many people work in your organisation and, if applicable, your own location? (Please tick one box in column A and, if there is more than one branch or outlet, one box in column B)
Number of people Total Organisation Your Location
1-9 1 1 10-49 2 2 50-99 3 3
100-249 4 4
250-999 5 5 1000 or more 6 6 Not Applicable 7
H9. In relation to this job, how much do you usually earn per week OR per month? (to nearest €)
Per week Or Per month
Gross (before deductions) Net (take-home pay) Gross (before deductions) Net (take-home pay)

154| Evaluation of PLC programme provision
H10. Did you receive any training in this job? Yes ...... 1 No 2
H11. To what extent are your knowledge and skills utilized in this work? (Please answer on a scale from 1 to 5, where 1 means ‘Not at all’ and 5 means ‘To a very great extent.)
1
Not at all
2 3 4 5
To a very great extent
1 2 3 4 5 H12. To what extent does your current work demand more knowledge and skills than you can actually offer? (Please answer on a scale from 1 to 5, where 1 means ‘Not at all’ and 5 means ‘To a very great extent.)
1 Not at all
2 3 4 5 To a very great extent
1 2 3 4 5
H13. What type of education do you feel is most appropriate for this work?
Postgraduate 1 Leaving Certificate 5 Bachelor 2 Junior Certificate 6
PLC 3 Other (Please specify):______________________ 7 Apprenticeship 4
H14. (b) What field of study do you feel is most appropriate for this work?
My field of study is the only possible/the best field for this area of work 1 Some other fields could also prepare people for this area of work 2
Another field of study would have been more useful 3 The field of study does not matter very much for my area of work 4
Other, please specify:______________________________ 5
3.1 H15. How satisfied are you with your current work?
Very dissatisfied Dissatisfied Satisfied Very Satisfied
1 2 3 4
4.1 H16. How secure do you feel your job is?
Very secure Fairly Secure Insecure Very insecure
1 2 3 4
5.1 H17. Are you a member of a trade union? Yes ...... 1 No 2
SECTION I: JOB IN SEPTEMBER 2012
6.1 I1. WERE YOU IN FULLTIME EDUCATION IN SEPTEMBER 2012
Yes......... 1 Go to J1 No........ 2 Go to I2
7.1 I2. WERE YOU EMPLOYED IN THE SAME JOB BY THE SAME EMPLOYER IN SEPTEMBER 2012 AS YOU ARE NOW
(SEPTEMBER 2015)?
Yes......... 1 Go to J1 No........ 2 Go to I3
I3. DID YOU HOLD A JOB IN SEPTEMBER 2012, EVEN FOR A SHORT TIME?
Yes......... 1 Go to I4 No........ 2 Go to J1
I4. IN RELATION TO THIS JOB, HOW WOULD YOU DESCRIBE IT? Regular, full-time ........................... 1
Temporary, full-time ....................... 2 Regular, part-time .......................... 3
Temporary, part-time ..................... 4
I5. When did you take up this job? Month _____________ Year____________ In relation to this job, what was your occupation? (Please write in the job title and describe the nature of the work done.)
_______________________________________________________________________

Appendices|155
I6. What was the nature of the business carried out by your employer (or yourself, if you are self-employed)? (Please describe the process carried out, and the end-product, if any)
_______________________________________________________________________
I7. What was the usual number of hours (per week) you work in this job? _________ hours I8. Did you work in the public or private sector?
Public sector Private sector, not for profit
Private sector, for Profit
Other, please specify
1 2 3 4 __________________________
I9. How many people worked in your organisation and, if applicable, your own location? (Please tick one box in column A and, if there is more than one branch or outlet, one box in column B)
Number of people Total Organisation Your Location
1-9 1 1
10-49 2 2 50-99 3 3 100-249 4 4
250-999 5 5 1000 or more 6 6 Not Applicable 7
I10. In relation to this job, how much did you usually earn per week OR per month? (to nearest €)
Per week Or Per month
Gross (before deductions) Net (take-home pay) Gross (before deductions) Net (take-home pay)
I11. DID YOU RECEIVE ANY TRAINING IN THIS JOB? ....................... YES 1 ............... NO 2
I12. To what extent were your knowledge and skills utilized in this work? (Please answer on a scale from 1 to 5, where 1 means ‘Not at all’ and 5 means ‘To a very great extent.)
1 Not at all
2 3 4 5 To a very great extent
1 2 3 4 5
I13. To what extent did this work demand more knowledge and skills than you could actually offer? Please answer on a scale from 1 to 5, where 1 means ‘Not at all’ and 5 means ‘To a very great extent.
1 Not at all
2 3 4 5 To a very great extent
1 2 3 4 5
I14. (a) What type of education do you feel is most appropriate for this work?
Postgraduate 1 Leaving Certificate 5 Bachelor 2 Junior Certificate 6
PLC 3 Other (Please specify):______________________ 7
Apprenticeship 4
I15. (b) What field of study do you feel is most appropriate for this work?
My field of study is the only possible/the best field for this area of work 1
Some other fields could also prepare people for this area of work 2 Another field of study would have been more useful 3 The field of study does not matter very much for my area of work 4
Other, please specify:______________________________ 5

156| Evaluation of PLC programme provision
I16. How satisfied were you with this work? Very dissatisfied Dissatisfied Satisfied Very Satisfied
1 2 3 4
I17. How secure did you feel your job was? Very secure Fairly Secure Insecure Very insecure
1 2 3 4
8.1 I18. Were you a member of a trade union? Yes 1 ........................................................ No 2
SECTION J: FAMILY BACKGROUND
The following are some questions about you and your family. The information is needed so that we can look at the experiences of people in different situations. I would like to repeat that the information you provide will be treated in the strictest confidence.
J1. Which of the following best describes (a) your Father’s current situation (b) your Mother’s current situation with regard to employment? (Tick one box in each column)
Father Mother
At work as an employee 1 1
At work as an employer 2 2
Self-employed without employees 3 3
Unemployed 4 4
Retired 5 5
Engaged on home duties 6 6
Unable to work due to disability 7 7
Other 8 8
J2. (a) What is (or was) your father’s main occupation? ___________________________________
(If farmer or relative assisting, state acreage or hectares farmed) (b) What is (or was) your mother’s main occupation? _________________________________ J3. Could you tell me the highest level of education reached by your (a) father and (b) mother:
Father Mother
Primary or below 1 1
Lower Secondary (Junior/Inter Cert or equiv) 2 2
Upper Secondary (Leaving Cert or equiv) 3 3
Post-Secondary Non-Tertiary (e.g. PLC) 4 4
Non-Degree (Certificate/Diploma) 5 5
Degree or Higher 6 6
Don’t know 7 7
J4. Are you a member of the Traveller Community? Yes......... 1 No.......... 2
J5. (a) Was your mother born in Ireland? Yes......... 1 No.......... 2
(b) Was your father born in Ireland? Yes......... 1 No.......... 2
J6. (a) Is the address on accompanying letter still your main address? Yes...... 1 No....... 2
(b) If No, where are you now living? Ireland....... 1 Abroad....... 2
If Ireland, County: ____________ If abroad, Country: _______________ Could you please provide us with your phone number or email address: we will need contact
details in the event you are a winner in the prize draw. Phone number: ___________________ Email Address: ______________________
May we contact you at a future date to invite you to answer some follow up questions?
Yes......... 1 No..........
Thank you very much for your co-operation.

157| Evaluation of PLC programme provision
APPENDIX E: QUESTIONNAIRE FOR SURVEY OF PLC PROVIDERS
SURVEY OF PLC PROVIDERS 2015
PIN No.
Thank you for agreeing to participate in our survey. All of the information provided is confidential. Your
identity will not be disclosed to anyone outside the ESRI. The reports we produce deal only with general
results. Individual college information is not reported. You do not need to answer any particular question if
you do not wish to.
SECTION A: DETAIL OF COLLEGE STRUCTURE AND SIZE
A1. How would you best describe your college/institution?
ETB Stand-alone Further Education College/Institute 1
ETB Second-level school which offers PLC courses 2
Voluntary secondary/community/comprehensive school offering PLC courses 3
Other (please specify:______________________________________________) 4
A2. (a) How many PLC students (full-time) are currently registered in your college? _____
(b) Over the past five years, has the number of PLC students coming to this school….
Increased Decreased Remained Fairly Stable
1 2 3
(c) To what extent does your college have the capacity to enrol more PLC students?
Yes, to a great extent Yes, to some extent No, not at all
1 2 3
A3. (a) Are all of the people who apply for PLC courses in this college generally accepted?
(b) If no, what criteria are used to admit learners [Please tick all that apply]?
Having a Leaving Certificate 1
Leaving Certificate grades 2
Performance in interview 3
Written application 4
Date of application 5
Recognition of prior learning (RPL) 6
Ability to pay fee 7
VTOS eligibility 8
Other, please specify: _________________________________ 9
A4. How has the cap impacted on the PLC provision in your school/college over the past five years?
Not at
all
To a Great
Extent
Has limited our ability to meet the demand for places 1 2 3 4 5
Has limited the range of courses offered 1 2 3 4 5
Has reduced our ability to respond to labour market gaps/needs 1 2 3 4 5
Has impacted on funding for supports/staff 1 2 3 4 5
Has impacted on the quality of provision 1 2 3 4 5
Yes No
1 2
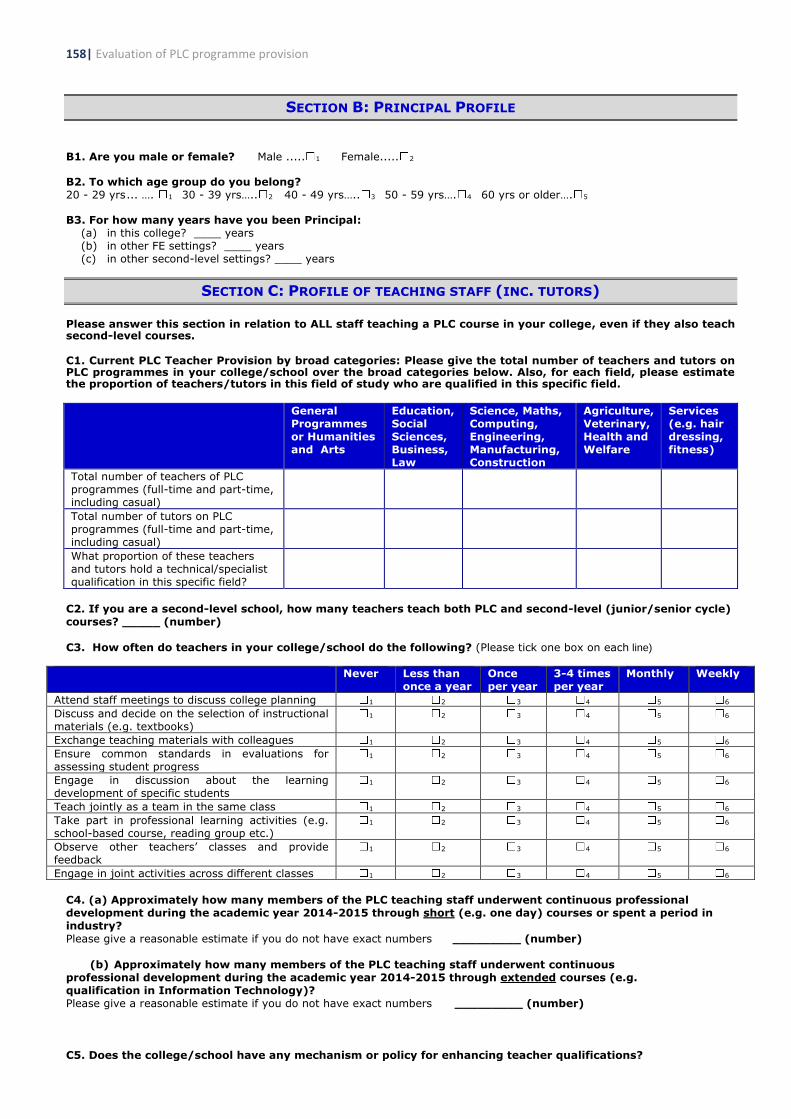
158| Evaluation of PLC programme provision
SECTION B: PRINCIPAL PROFILE
B1. Are you male or female? Male ..... 1 Female..... 2
B2. To which age group do you belong?
20 - 29 yrs ... …. 1 30 - 39 yrs….. 2 40 - 49 yrs….. 3 50 - 59 yrs…. 4 60 yrs or older…. 5
B3. For how many years have you been Principal:
(a) in this college? ____ years
(b) in other FE settings? ____ years
(c) in other second-level settings? ____ years
SECTION C: PROFILE OF TEACHING STAFF (INC. TUTORS)
Please answer this section in relation to ALL staff teaching a PLC course in your college, even if they also teach second-level courses.
C1. Current PLC Teacher Provision by broad categories: Please give the total number of teachers and tutors on PLC programmes in your college/school over the broad categories below. Also, for each field, please estimate the proportion of teachers/tutors in this field of study who are qualified in this specific field.
General
Programmes
or Humanities
and Arts
Education,
Social
Sciences,
Business,
Law
Science, Maths,
Computing,
Engineering,
Manufacturing,
Construction
Agriculture,
Veterinary,
Health and
Welfare
Services
(e.g. hair
dressing,
fitness)
Total number of teachers of PLC
programmes (full-time and part-time,
including casual)
Total number of tutors on PLC
programmes (full-time and part-time,
including casual)
What proportion of these teachers
and tutors hold a technical/specialist
qualification in this specific field?
C2. If you are a second-level school, how many teachers teach both PLC and second-level (junior/senior cycle)
courses? _____ (number)
C3. How often do teachers in your college/school do the following? (Please tick one box on each line)
Never Less than
once a year
Once
per year
3-4 times
per year
Monthly Weekly
Attend staff meetings to discuss college planning 1 2 3 4 5 6
Discuss and decide on the selection of instructional
materials (e.g. textbooks) 1 2 3 4 5 6
Exchange teaching materials with colleagues 1 2 3 4 5 6
Ensure common standards in evaluations for
assessing student progress 1 2 3 4 5 6
Engage in discussion about the learning
development of specific students 1 2 3 4 5 6
Teach jointly as a team in the same class 1 2 3 4 5 6
Take part in professional learning activities (e.g.
school-based course, reading group etc.) 1 2 3 4 5 6
Observe other teachers’ classes and provide
feedback 1 2 3 4 5 6
Engage in joint activities across different classes 1 2 3 4 5 6
C4. (a) Approximately how many members of the PLC teaching staff underwent continuous professional
development during the academic year 2014-2015 through short (e.g. one day) courses or spent a period in
industry?
Please give a reasonable estimate if you do not have exact numbers _________ (number)
(b) Approximately how many members of the PLC teaching staff underwent continuous
professional development during the academic year 2014-2015 through extended courses (e.g.
qualification in Information Technology)?
Please give a reasonable estimate if you do not have exact numbers _________ (number)
C5. Does the college/school have any mechanism or policy for enhancing teacher qualifications?

Appendices|159
If ‘yes’, does it include provision for:
Tick one box on each line Yes No
Training Leave 1 2
Payment of Fees 1 2
Refund of Expenses 1 2
Direct Provision of Training 1 2
Professional development organised through ETB networks 1 2
Other (please specify:_______________________) 1 2
SECTION D: SERVICES AND RESOURCES FOR STUDENTS
D1. In your college/school, do your students have access to the following supports?
If Yes, please indicate approximately how many students avail of these supports.
Tick one
No Yes
If Yes, how many students avail of these?
Career Guidance 1 2
Personal Counselling 1 2
Learning Supports 1 2
Childcare 1 2
Disability Support Service 1 2
Financial Support (other than SUSI grant) 1 2
Students Union 1 2
Class Tutor Support 1 2
DSP Support 1 2
D2. How adequate to the needs of the college/school and the students are the college’s resources in each of
the following areas?
Poor Fair Good Excellent
Number of teachers 1 2 3 4
Number of classrooms 1 2 3 4
Books and worksheets 1 2 3 4
Computing facilities 1 2 3 4
Technical equipment 1 2 3 4
Sports facilities 1 2 3 4
Library / Media centre 1 2 3 4
Learning support provision 1 2 3 4
Administrative support 1 2 3 4
Condition of the school building, classrooms etc. 1 2 3 4
Facilities for learners with disabilities 1 2 3 4
Career Guidance 1 2 3 4
SECTION E: COURSE PLANNING
E1. Please give the title of any new courses that received approval in the last five years under the following broad categories below:
General
Programmes or
Humanities and
Arts
Education, Social
Sciences,
Business, Law
Science, Maths,
Computing, Engineering,
Manufacturing,
Construction
Agriculture,
Veterinary,
Health and
Welfare
Services (e.g.
hair dressing,
fitness)
Yes No
1 2
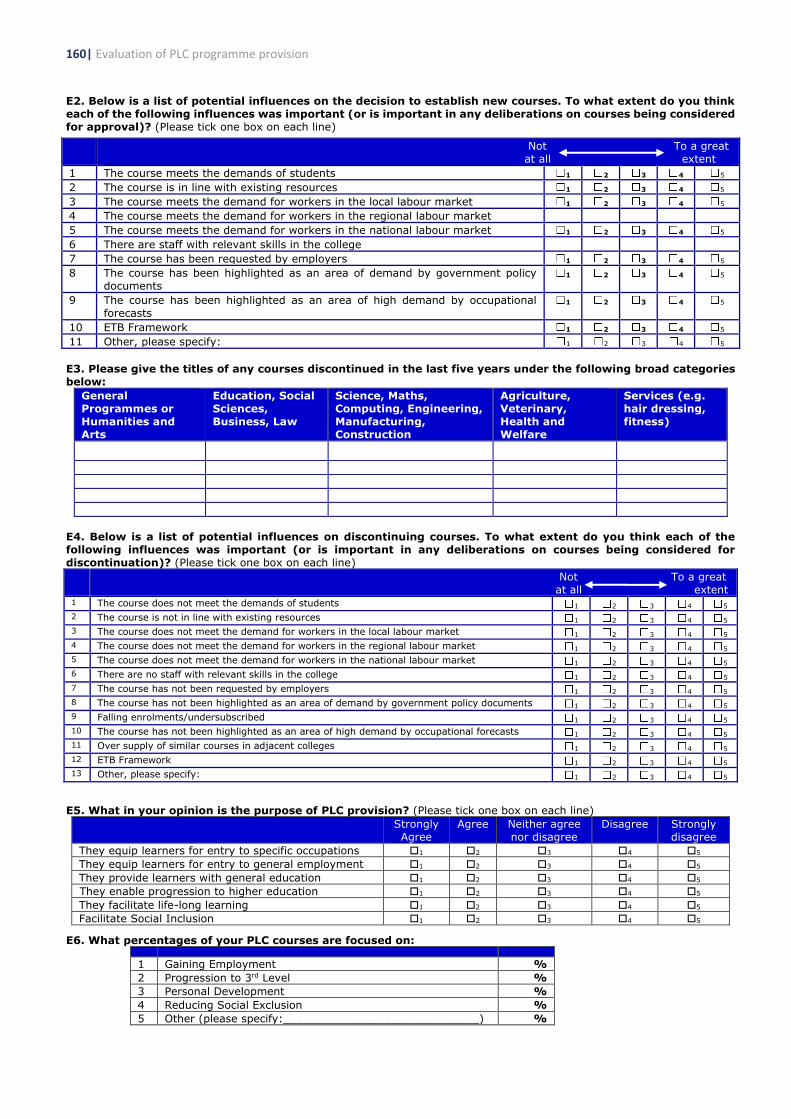
160| Evaluation of PLC programme provision
E2. Below is a list of potential influences on the decision to establish new courses. To what extent do you think
each of the following influences was important (or is important in any deliberations on courses being considered
for approval)? (Please tick one box on each line)
Not To a great
at all extent
1 The course meets the demands of students 1 2 3 4 5
2 The course is in line with existing resources 1 2 3 4 5
3 The course meets the demand for workers in the local labour market 1 2 3 4 5
4 The course meets the demand for workers in the regional labour market
5 The course meets the demand for workers in the national labour market 1 2 3 4 5
6 There are staff with relevant skills in the college
7 The course has been requested by employers 1 2 3 4 5
8 The course has been highlighted as an area of demand by government policy
documents 1 2 3 4 5
9 The course has been highlighted as an area of high demand by occupational
forecasts 1 2 3 4 5
10 ETB Framework 1 2 3 4 5
11 Other, please specify: 1 2 3 4 5
E3. Please give the titles of any courses discontinued in the last five years under the following broad categories
below:
General
Programmes or
Humanities and
Arts
Education, Social
Sciences,
Business, Law
Science, Maths,
Computing, Engineering,
Manufacturing,
Construction
Agriculture,
Veterinary,
Health and
Welfare
Services (e.g.
hair dressing,
fitness)
E4. Below is a list of potential influences on discontinuing courses. To what extent do you think each of the
following influences was important (or is important in any deliberations on courses being considered for
discontinuation)? (Please tick one box on each line)
Not To a great
at all extent 1 The course does not meet the demands of students 1 2 3 4 5 2 The course is not in line with existing resources 1 2 3 4 5 3 The course does not meet the demand for workers in the local labour market 1 2 3 4 5 4 The course does not meet the demand for workers in the regional labour market 1 2 3 4 5 5 The course does not meet the demand for workers in the national labour market 1 2 3 4 5 6 There are no staff with relevant skills in the college 1 2 3 4 5 7 The course has not been requested by employers 1 2 3 4 5 8 The course has not been highlighted as an area of demand by government policy documents 1 2 3 4 5 9 Falling enrolments/undersubscribed 1 2 3 4 5 10 The course has not been highlighted as an area of high demand by occupational forecasts 1 2 3 4 5 11 Over supply of similar courses in adjacent colleges 1 2 3 4 5 12 ETB Framework 1 2 3 4 5 13 Other, please specify: 1 2 3 4 5
E5. What in your opinion is the purpose of PLC provision? (Please tick one box on each line)
Strongly
Agree
Agree Neither agree
nor disagree
Disagree Strongly
disagree
They equip learners for entry to specific occupations 1 2 3 4 5
They equip learners for entry to general employment 1 2 3 4 5
They provide learners with general education 1 2 3 4 5
They enable progression to higher education 1 2 3 4 5
They facilitate life-long learning 1 2 3 4 5
Facilitate Social Inclusion 1 2 3 4 5
E6. What percentages of your PLC courses are focused on:
1 Gaining Employment %
2 Progression to 3rd Level %
3 Personal Development %
4 Reducing Social Exclusion %
5 Other (please specify:_____________________________) %

Appendices|161
E7. (a) How often would you or your staff meet with employers in the local area?
Never 1
Less than once a year 2
Once per year 3
3-4 times per year 4
5+ times per year 5
(b) If so, in relation to which issues do you have contact with local employers?
Tick all that apply
Work experience placements 1
Job Placement 2
Planning new courses 3
Deciding whether to keep running specific courses 4
Input into specific courses 5
Running mock interviews 6
Develop/modify curriculum 7
Other (please specify)______________ 8
E8. (a) Do learners take part in work experience as part of their PLC course?
Yes, all….. 1 Yes, most ….. 2 A few ….. 3 None ….. 4 [If none, skip to Section F]
(b) What length of time do they typically spend on a work experience placement? ____ days
(c) Who mainly organises the work experience placement? (Please tick one)
The student 1
The course coordinator 2
Someone else in the college/school 3
Other (Please specify: _____________________________) 4
(d) In general, how easy is it for learners to obtain placements?
Very easy ....... …. 1 Easy….. 2 Quite difficult….. 3 Very difficult…. 4
(e) Is the employer asked for feedback on the learner?
(f) Are learners assessed on the basis of their placement?
Yes, all placements…. 1 Yes, some placements….. 2 No ... 3
(g) What percentage of your PLC learners:
1 Get relevant work experience as part of their course %
2 Do work experience organised on a block basis %
3 Do work experience organised on a day release basis %
(h) Is there a requirement that students can practise the skills learned on the programme during their work
experience?
Not at all Very Little To Some Extent To a Great Extent
1 2 3 4
(i) To what extent do students subsequently obtain employment in the companies where they did their
work experience?
Not at all Very Little To Some Extent To a Great Extent
1 2 3 4
SECTION F: COMPLETION, CERTIFICATION AND OUTCOMES
F1. Overall, approximately what percentages of students in your college/school complete their PLC courses?
1 year courses 2 year courses
Percentage of students completing the course % %
Percentage of students who obtain a major award % %
F2. In your opinion, what are the main reasons for students not completing their course?
Yes No
1 2
[If never, skip to Question E8]

162| Evaluation of PLC programme provision
F3. In your opinion, what are the main reasons for students not obtaining a major award, even if
they complete the course?
F4. Does your college/school track the destinations of PLC leavers?
Yes ….. 1 Go to F5 No ….. 2 Go to F6
F5. Please provide details of the progression pattern of PLC completers:
1 Percentage progressing directly to employment %
2 Percentage becoming unemployed %
3 Percentage remaining who enter \ remain FE %
4 Percentage entering apprenticeships %
5 Percentage progressing directly to HE %
6 Percentage progressing to HE through Higher Education links scheme %
7 Percentage in other (please specify:___________________________) %
F6. (a) Does your college/school have links with particular third-level institutions? (Tick all that apply)
University in Ireland 1 Institutes of Technology in Ireland 3
UK University 2 No, none 4
(b) If so, please name the third-level universities or institutions below.
(b) How satisfied are you with progression opportunities for PLC leavers into higher education?
Very Satisfied Satisfied Dissatisfied Very Dissatisfied
1 2 3 4
Please give reasons for your answer.
SECTION G: ISSUES FOR THE PLC SECTOR
G1. What do you think are the main advantages to how PLC courses are run in your college/ school?
G2. What do you think are the main advantages of how PLC courses are run nationally?
G3. What do you think are the main challenges for the future of provision in your college/ school?
G4. What do you think are the main challenges for the future of PLC provision nationally?

Appendices|163
G5. Is there anything else that you would like to add regarding PLC provision?
THANK YOU

Whitaker Square, Sir John Rogerson’s Quay, Dublin 2Telephone +353 1 863 2000 Email [email protected] www.esri.ieTwitter @ESRIDublinISBN 978-0-7070-0428-0