evaluation of potential treatments to reduce foaming from
TRANSCRIPT

An ASABE Meeting Presentation
DOI: https://doi.org/10.13031/aim.201700573
Paper Number: 1700573
Evaluation of Potential Treatments to Reduce Foaming from
Swine Manures
C.J. Polson1 & D.S. Andersen1
1. Iowa State University, Agricultural and Biosystems Engineering, 3348 Elings Hall, Ames Iowa 50011
Written for presentation at the
2017 ASABE Annual International Meeting
Sponsored by ASABE
Spokane, Washington
July 16-19, 2017
ABSTRACT. Foam formation on the surface of deep pit swine manure storages poses a safety concern for both humans and
animals. Although current research has provided significant insight into both the causes and mechanisms of foam formation,
thus far few practical, easily implemented treatment practices are available to help mitigate manure foaming. Thus, the
purpose of these experiments were to better understand the causes of foam formation, the mechanisms of foam development
and stabilization, and determine the effectiveness of Narasin, Manure Magic, and other physical, chemical, and biological
manure treatments to reduce foaming in deep pit swine manure storages. Our first experiment was designed to evaluate if
different feed components induced foaming properties in the manure and a follow-up incubation study to evaluate if there
were difference preferences for conversion to methane from carbohydrate, protein, and fats between foaming and non-
foaming manures. In general, our results showed that easily degradable organic carbon induced microbial activity and
results in grater foaming capacity and foam stability, but the effect was generally short lived. In terms of substrate preference
or results showed that foaming manures showed high affinity for all carbon substrates tested but no difference between
substrates was seen. Our second study focused on if manure additives could alter either the methane production rate,
foaming capacity, or foam stability. These results gave important insights into the mechanisms of foam formation in that the
inclusion of tannin instantly and significantly caused induced foam stability, while the decomposition of soybean oil induced
foaming after several weeks. In particular, these results showed that fine particles that interact with proteins can induce
stability within the foam and appeared to demonstrate that similar types of compounds can be synthesized by the
decomposition of oils. Our last two experiments focused specifically on developing and evaluating foam mitigation
strategies. These tests were conducted at the field- and lab-scale; our results failed to show significant difference in the lab-
scale, presumably because microbial activity (based on methane production rates) was low for all tests. At the field-scale
experiment we found that treatment with Narasin or Manure Magic reduced both methane production rate and foam stability.
Our results indicated that Narasin reduced volatile solids destruction while Manure Magic increased solids destruction.
Finally, microbial sequencing data indicated that our Manure Magic treatment significantly altered the microbial community
away from that of our foaming control barn, but not when the manure wasn’t foaming.
Keywords. Swine manure, foaming, methane production, manure treatments
The authors are solely responsible for the content of this meeting presentation. The presentation does not necessarily reflect the official position of the American Society of Agricultural and Biological Engineers (ASABE), and its printing and distribution does not constitute an endorsement of views
which may be expressed. Meeting presentations are not subject to the formal peer review process by ASABE editorial committees; therefore, they are
not to be presented as refereed publications. Publish your paper in our journal after successfully completing the peer review process. See www.asabe.org/JournalSubmission for details. Citation of this work should state that it is from an ASABE meeting paper. EXAMPLE: Author’s Last
Name, Initials. 2017. Title of presentation. ASABE Paper No. ---. St. Joseph, MI.: ASABE. For information about securing permission to reprint or
reproduce a meeting presentation, please contact ASABE at www.asabe.org/permissions (2950 Niles Road, St. Joseph, MI 49085-9659 USA).

ASABE 2017 Annual International Meeting Page 1
Introduction
The Midwestern United States is responsible for more than 50% of pork produced in the U.S. Finishing swine operations
in this region typically utilize deep-pits to store manure produced until land application can occur. Deep-pit manure storages
are located within the swine production building, beneath a slatted floor on which the pigs are raised. This allows the manure
to fall through slatted floors into the storage below, where it is held for up to a year before being utilized as crop nutrients.
These manure storage systems were adopted by producers in the late 1970s and today represent more than 50% of swine
finishing operations in the U.S. (Key et al., 2011). Even though these systems improve nutrient content and manageability
of the stored manure, there are concerns that have than arisen since their implementation.
In 2009, swine producers began observing a brown, viscous foam forming on the manure surface in their deep-pit
storages. Foam production in deep-pit manure storages has significant implications on facility management and safety and
is a serious concern for Midwestern U.S. pork producers. The accumulation of foam can significantly reduce the volume of
the manure storage, causing producers to seek alternative acres for application during untimely seasonal windows to prevent
the overflow of storages. As deep-pit storages are anaerobic environments the breakdown of organic matter in swine manure
will occur. This decomposition produces biogas (i.e., methane, carbon dioxide, and hydrogen sulfide). When foam is present,
it traps these gases, storing hydrogen sulfide and methane; a major safety concern for animals and farm employees (Moody
et al., 2009). This has resulted in increased occurrences of poisoned swine and flash fires at facilities where foam is present,
disturbed, and then a spark occurs. Thus, determining the root cause of manure foam in these systems is necessary to develop
mitigation options.
The inputs to deep pit manure storages consists of animal feces and urine, wasted feed and water, and wash waters
generated from cleaning between groups of animals. This creates a well-established link between feed composition and the
physical and chemical characteristics of the manure (Kerr et al., 2006; Jarret et al., 2011; Trabue and Kerr, 2014). Van
Weelden (2016) found that this was also true for properties of manures thought to be related to foam formation, where they
reported that manures from pigs fed varying sources and levels of carbohydrate or proteins resulted in manure with different
microbial community structures, different methane production characteristics, and different capacities to form and stabilize
foam.
The results from those diet trials, along with results from their analysis of manures from foaming and non-foaming
commercial production facilities (Van Weelden et al., 2015) helped provide direction for the experiments discussed in this
manuscript. In brief, they showed: a) foaming manures make methane at faster rates than their non-foaming counterparts,
b) foam stability was drastically different between foaming and non-foaming manures with fine, protein rich particles
appearing to be important in the stabilization of the foam bubble structure, c) foaming barns have lower concentrations of
volatile fatty acids and higher surface tension, d) a microbial produced polyliposaccharide appears to be interacting with the
foam to form the bubble stabilization structure, and e) significant microbial community differences can be seen between
foaming and non-foaming manures. Taken together, these results indicated that the microbial community in foaming
manures appears to be more active than non-foaming manures as a greater amount of the manure substrates have been
converted to methane, which then appears to be adjusting physical properties of surface tension and the amount of fine
particles.
As methane production appears to be such a critical component of foam formation it is suggested that mitigation of this
enhanced methane production may be a critical means of reducing foam formation. Many techniques have been developed
to mitigate methane emission from manures including frequent manure removal from the floor or pen, the adoption of an
anaerobic digestion system (Clemens et al., 2006), or covering the manure and capturing the emitted gas (Clemens and
Ahlgrimm, 2001). Though different techniques have been developed, there is still a demand for new, cost-effective
technologies that can aid in control of methane emissions. One approach that has received attention includes the use of
dietary manipulation to increase digestibility of feedstuffs, and as a result limit organic matter in the excrement, resulting in
decreased potential for conversion to methane. Another approach based on diet manipulation is the use of feed additives to
inhibit methanogenesis during digestion and improve animal performance (Johnson and Johnson, 1995; Benchaar et al.,
2001).
Although not verified, similar approaches might have the potential to reduce gas production from manure storage pits.
One product that has been tested in the lab setting for its potential to reduce gas production from swine manure is tannins
(Whitehead et al., 2012). Similarly, others have recommended the use of monensin as a pit additive to reduce foaming
(Clanton, 2012). However, monensin has been reported to be toxic to pigs so its use in swine facilities is a risky proposition.
Monensin is an ionophore, a lipid-soluble molecule that transports ions across cell membranes. These compounds are
thought to promote animal growth by manipulating microbial flora, which can impact methane production. Another
ionophore, narasin, is safe for swine and approved as a swine feed additive.
Thus, as a result, four studies where undertaken here, these included: 1) direct addition of feed products to manure to
evaluate if any enhanced foaming characteristic, 2) a lab study incubation where a slew of treatments, either focused on
reducing methane production via inhibition or microbial community change or alternatively focusing on reducing foam
stability through either protein removal or surface tension evaluation was conducted, 3) a lab study of an inophore, a

ASABE 2017 Annual International Meeting Page 2
lactobacillus, and a bacillus bacteria added separately or in combination to manure, and then finally 4) a barn-scale
evaluation of treatment bacillus bacteria addition and ionophores treatment to evaluate field scale effects.
Materials and Methonds
Study Desings
Feed Component Additive Study
A study was conducted at the Iowa State University Swine Research Facility to observe the effects addition of various
feed components (DDGS, Wheat mids, Soybean hulls, and corn oil) had on the ability of a sample to produce foam (foaming
capacity) and stabilize foam (foam stability). In this study, manure produced fed a corn diet with DDGS was collected in a
single tank. Then, about 6000 grams of manure was distributed into 64 buckets and mixed with various types of feed as
described in table 1. The order of additives shown in table 1 was repeated for each set of eight buckets to give eight repetitions
of each mixture.
Two different grind sizes (Course - 700 µm and Fine 350 µm) were evaluated for all the fiber products evaluated. Either
200 grams of fiber product or 30 grams of the corn oil were added to eight of the buckets of each treatment. Once added all
samples were mixed and allowed to ferment for varying lengths of times before being sampled. Buckets 1-24 were sampled
after 7 days, buckets 25-48 were sampled after 14 days, and buckets 49-64 were sampled after 21 days. All buckets were
mixed every seven days to suspend and solids that had settled in the manure. Once sampled, the manure mixtures were
tested with the foaming capacity and stability apparatus.
The foaming capacity and stability apparatus used in this study, as well as the parameters used to evaluate the foaming
characteristics of swine manure, were adapted from a number of other studies, including Ross et al. (1992), Bindal et al.
(2002), Bamforth (2004), and Hutzler (2011). Air was passed through an in-line gas regulator (Restek Model 21666) directly
into a 2-inch diameter clear PVC column. The flow rate of air through the column was measured and controlled with a
variable area flow meter (Dwyer RMA-SSV). For the purposes of this experiment, it was determined that a flow rate of 200
cubic centimeters per minute (0.0033 L/s) was appropriate based on preliminary trials. In order to conduct the foaming
capacity experiment, a sample volume of approximately 300 mL was poured into the column and the initial level was
recorded based on measuring tape placed on the columns. The sample was then aerated through a cylindrical air stone at
0.0033 L/s until a steady state height was reached or the foam layer reached the maximum height of the column. The time
of aeration was recorded along with the height of foam produced and the level of the foam-liquid interface. A foaming
capacity index was calculated as the height of foam produced divided by the initial level and multiplied by a factor of 100.
Table 1. Additive types with corresponding labels used for each of the three trials.
Bucket Additive Amount Added to Bucket
1 None (Control) -
2 Fine Ground DDGS 200 g
3 Course Ground DDGS 200 g
4 Fine Ground Wheat Midds 200 g
5 Course Ground Wheat Midds 200 g
6 Fine Ground Soybean Hulls 200 g
7 Course Ground Soybean Hulls 200 g
8 Corn Oil 30 g
Once all samples were mixed into the 5-gallon buckets, they were allowed to ferment for varying lengths of times before
being sampled. Buckets 1-24 were sampled after 7 days, buckets 25-48 were sampled after 14 days, and buckets 49-64 were
sampled after 21 days. Once sampled, the manure mixtures were tested with the foaming capacity and stability apparatus.
Statistical analysis was performed using JMP Pro 10. Fixed factors were established according to the diet type associated
with each sample and the trial period. For the bucket additive study, fixed factors included the mixture type as well as the
fermentation time in days.
In a similar follow-up study manure was obtained from five commercial production facilities, three of which were
foaming and two which weren’t during manure sampling collection. Approximately 100-ml of manure from each of the was
placed into six glass containers following the MPR procedure discussed in detail in the evaluation methods. To give of these
bottles different substrates were added (estimated to be approximately 1 g available COD) was added. Substrate added
included sugar, soluble fiber, protein, soybean hulls, and corn oil; this was an addition of 1, 0.9, 0.83, 2.51, and 0.37 grams
of sugar, fiber, protein, soy hulls, and corn oil respectively which based on measured COD values was 1.2, 1.0, 1.1, 1.8, and
0.77 grams of COD added). This test was conducted to determine if foaming microbial communities responded differently
than non-foaming microbial communities. Data was assessed as cumulative methane production per gram of COD added
and a comparison between foaming and non-foaming manures for every day methane was measured. Methane production

ASABE 2017 Annual International Meeting Page 3
measurements were recorded on days 3, 7, 11, 16, 20, 25, 30, 37, 42, 47, 54, 65, 72, and 80 of the incubation.
Methane production was corrected for the residual amount of methane made by the control without additive amendment
at each point in time so the amount of methane produced represents the volume of methane produced per added gram of
COD. Statistical analysis was conducted by evaluating cumulative methane production with factors of surface texture
(foaming vs. non-foaming) and additive type (Fiber, oil, protein, sugar, soybean hulls) with the analysis run by measurement
date to handle the repeated measures aspect of the design.
Manure Foaming Product Evaluation
As producers are interested in potential cures for foaming an assortment of potential treatments were evaluated, these
included a control, tannins (0.5%), course biochar (1%), humic substances (1%), foam buster [soybean oil] (1%), free fatty
acids (1%), acetic acid (3 mL/L), ammonium hydroxide (33 mL/L), sodium hydroxide (1%), Narasin (1.5 mg/L), spent hops
(2 g/L), diluted control (added 33 mL/L DI water), fine biochar (0.5%), and soluable fiber (0.5%).acetic acid, addition was
evaluated. Each treatment was added to 9 vials of manure from two different sites. These treatments were selected with the
intention of providing information on specific mechanisms either related to foam or the prevention of foam. As shown in
Van Weelden et al. (2016) methane production appears to be important to contributing to the formation of foam. Thus eight
of the treatments focused on evaluating how altering this parameter impacted the methane production rate and foaming
capacity and stability of the manure. Three of the treatments, Narasin, tannins, and the spent hops were added with the
intention of inhibiting or discouraging methane production. Four of the treatments (foam buster, free fatty acids, acetic acid,
and humic substances) were added with the intention of initially inhibiting methane production but with the understanding
that these could serve eventually serve as substrates. Finally, one treatment, the soluble fiber, was added with the intention
of encouraging methane production.
Similarly, several treatments were targeted at modifying pH, these included addition of acetic acid, ammonia hydroxide,
and sodium hydroxide. According to Van Weelden et al. (2016) the pH of foaming manure was slightly more basic than its
non-foaming counterpart and this was mainly due to acetic acid accumulation. Although two treatments to make the manure
more basic might seem counter intuitive, further investigation had shown that proteins were important for stabilizing the
foam and it is believed that the pH treatment has the potential to denature the proteins and thus reduce foam stability. Finally,
two biochars of fine and course particle size were added as we had seen that fine particles were causing foam stabilization
and provided a particle which could be added to evaluate this effect.
Finally, one treatment was a simple water addition to serve as a negative control to treatments where water was added,
but also to evaluate if it was possible that knocking down foam with sprinkler water, while removing foam in the short term,
actually encouraged grater foam production.
Lab Incuation of Specific Foam Mitigation Products
Based on the previous study and increased analysis of microbial data and its link to manure characteristics, we proceeded
with an additional study focused on four potential treatments: Manure Magic addition, lactobacillus addition, Narasin
treatment, Narasin treatment with Manure Magic, and Narasin treatment with the lactobacillus addition, as compared to the
control. Given the results of the first additive study, a previous Narasin treatment study reported by Reagen et al. (2015), an
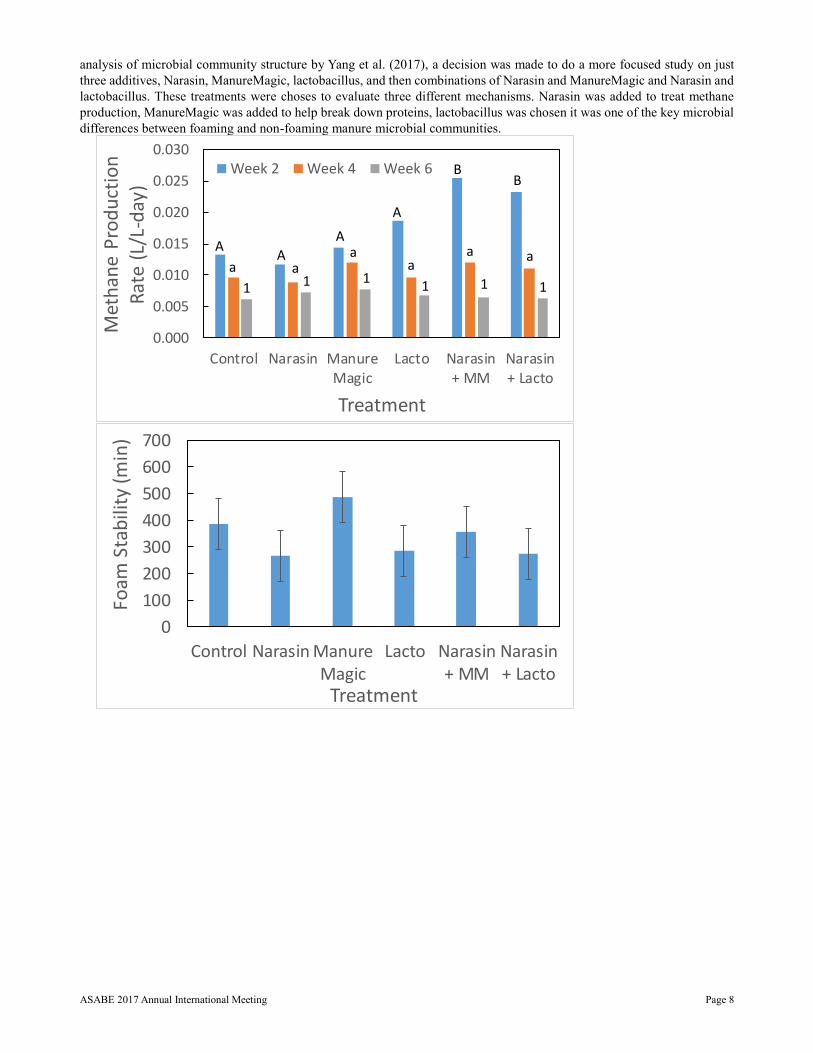
analysis of microbial community structure by Yang et al. (2017), a decision was made to do a more focused study on just
three additives, Narasin, ManureMagic, lactobacillus, and then combinations of Narasin and ManureMagic and Narasin and
lactobacillus. These treatments were choses to evaluate three different mechanisms. Narasin was added to treat methane
production, ManureMagic was added to help break down proteins, lactobacillus was chosen it was one of the key microbial
differences between foaming and non-foaming manure microbial communities. In this study nine different vials of manure
were treated with each of the products. Every two weeks the amount of methane produced by the vial was measured and
three of the vials destructively sampled to evaluate the foaming capacity and stability of the manure.
Field Evaluation of Foam Mitigation Products
As a compliment to these lab-scale investigations a field-scale experiment was also conducted. This experiment was
conducted at a 1200-head swine finishing facility in North Central Iowa. The barn is uses a single feed system and is operated
as an all-in, all-out facility so pigs and diet are consistent across the barn. However, the pit is divided into four parts allowing
separate treatment of the manure inside.
As a part of this study pit 1 and 2 were left as controls, pit 3 was treated with Narasin, and pit 4 was treated with Manure
Magic. Pit 3 was treated with 7.0 kg narasin (3.5kg in each side) on 5/16/16 and 4.0kg narasin (2 kg in each side) on 12/04/16.
Pit 4 was treated with 1.4kg manure magic (0.7kg in each side) on 5/16/16 and 6kg manure magic (3kg in each side) on
12/04/16. The initial treatment occurred after manure pump-out in the spring with the second treatment occurring several
months after fall manure removal.

ASABE 2017 Annual International Meeting Page 4
Figure 1. Deep pit swine barn in north east Iowa where the manure samples for this study were taken. This facility is a deep pit swine
finishing facility with two pump puts on each of the 4 pits with five tunnel fans on the west side.
Manure samples were taken from each pit on the following dates: 5/16/16, 5/31/16, 6/14/16, 6/27/16, 7/11/16, 7/25/16,
8/8/2016, 8/21/2016, 9/3/2016, 9/14/2016, 10/1/2016, 10/16/2016, 11/12/2016, 12/4/2016, 12/28/2016, 2/3/2017,
2/18/2017, 3/29/2017, 4/12/2017, 4/26/2017, 5/12/2017. These manure samples were tested for Total and Volatile Solids,
methane production rate, foaming capacity, and foam stability after every collection. In addition, 30 mL from each sample
were placed in centrifuge tube and then placed in a freezer for future DNA extraction and microbial analysis. During every
site visit NH3 and H2S concentrations in the pit exhaust air were monitored using a Draiger meter. The amount of foam on
the surface of the manure during each site visit was also recorded.
Evaluation Methods
Total Solids and Volatile solids
The total solids and volatile solids contents of manure samples were tested according to the Standard Methods for the
Examination of Water and Wastewater 2540B and 2540E (APHA, 2000). Approximately 30 mL of a manure sample was
poured into a pre-weighed porcelain dish after thorough mixing. After obtaining the weight of the full crucible, the sample
was dried in a 104°C oven for approximately 24 hours. After drying the sample was weighed again. The percent of total
solids was determined by equation 1 below.
%total solids =weight of dried sample and dish − weight of crucible
weight of wet sample and dish − weight of cricible∗ 100
After obtaining the dried weight of the sample, the crucible with the dried contents was placed in a muffle furnace at
550°C for approximately 8 hours. Once cooled, the final weight of the ash and crucible was obtained, and the volatile solids
content was determined by equation 2.
%volatile solids =weight of dried sample and dish − weight of ash and dish
weight of wet sample and dish − weight of cricible∗ 100
Methane Production Rate
The methane production rate test was loosely inspired by the biochemical methane production potential tests of Moody
et al. (2011a) and Owen et al. (1979), the anaerobic toxicity assay of Moody et al. (2011b), and its development and use is
fully detailed in Andersen et al. (2015). Briefly, 100 grams of manure was poured into a clear, 250 mL graduated glass serum
bottle (Wheaton Science Products No.:223950). The exact volume of these serum bottles was recorded using a water
displacement method; based on measurements in the AWML this volume was approximately 283.33 mL. The exact mass of
manure added to the bottle was recorded (difference in mass between the empty bottle and the mass of the manure and the
bottle, graduated marks on the bottle side are used to estimate 100 mL while adding the manure). A sleeve stopper septum
(Sigma-Aldrich Z564729) was then placed on top of the bottle to seal it from the atmosphere. The bottle was placed on a
laboratory counter and incubated at room temperature. Biogas production was measured periodically by inserting the needle
of a glass, gas-tight syringe (Micro-Mate interchangeable hypodermic Syringe 50cc Lock Tip, Popper & Sons, Inc. New
Hyde Park, New York) into the sleeve septum. When inserted, pressure in the bottle displaced the wetted barrel of the
syringe. The volume of biogas extracted was read from graduated markings on the syringe body. The volume and time at
which the sample was collected was then recorded and the biogas injected into an infrared gas analyzer (NDIR-CH4
Gasanalyzer University Kiel, Germany) to obtain the methane content.
These bottles were weighed before and after the 100 mL samples were added. After weighing the bottles the second time,

ASABE 2017 Annual International Meeting Page 5
septa (Sigma-Aldrich Z564729) were placed on the bottles to make them air tight. These bottles were then set aside out of
the sun for about two weeks. After about two weeks the volume of biogas produced was measured using a syringe (Micro-
Mate interchangeable hypodermic Syringe 50cc Lock Tip, Popper & Sons, Inc. New Hyde Park, New York) and the
concentration of methane in the biogas was also tested using a gas analyzer (NDIR-CH4 Gasanalyzer University Kiel,
Germany).
MPR =methane percent(%)
100%∗
biogas produced(mL) + head space(mL) ∗ ρmanure (g
mL)
time(days) ∗ mass manure sample(g)
Foaming Capacity and Stability
The foaming capacity and stability apparatus used in this study, as well as the parameters used to evaluate the foaming
characteristics of swine manure, were adapted from several other studies, including Ross et al. (1992), Bindal et al. (2002),
Bamforth (2004), and Hutzler (2011) and a complete description of how this test was implemented is available in Van Weelen
et al. (2013). Briefly, air was passed through an in-line gas regulator (Restek Model 21666) directly into a 2-inch diameter
clear PVC column. The flow rate of air through the column was measured and controlled with a variable area flow meter
(Dwyer RMA-SSV). For the purposes of this experiment, it was determined that a flow rate of 200 cubic centimeters per
minute (0.0033 L/s) was appropriate based on preliminary trials. In order to conduct the foaming capacity experiment, a
sample volume of approximately 300 mL was poured into the column and the initial level was recorded based on measuring
tape placed on the columns. The sample was then aerated through a cylindrical air stone at 0.0033 L/s until a steady state
height was reached or the foam layer reached the maximum height of the column. The time of aeration was recorded along
with the height of foam produced and the level of the foam-liquid interface. A foaming capacity index was calculated as the
height of foam produced divided by the initial manure level and multiplied by a factor of 100. The foam stability
measurement occurred immediately after the foaming capacity was determined. Once aeration ceased, the final height of
foam became the initial level recorded at time zero. Once this level was established, the descending height of the foam was
recorded at expanding time intervals. Simultaneously, the ascending level of the foam-liquid interface was recorded at the
same time intervals. The descending height of foam was normalized to percent of initial foam height and plotted as a function
of time. A first-order exponential decay model fit the data well in most cases. The half-life of the foam was determined with
equation 5 as a measure of the foam stability.
foaming capacity =steady state height − initial height
initial height∗ 100%
t1
2
=ln(2)
decay coefficient k (1)
Results and Discussion
Feed Component Additive Study
One of the consistent hypothesis suggested for causes for the formation of foam has been to suggest that changes in the
way pigs are fed has led to this issue, either expecting a direct feed component to be the cause or a microbial bi-product
produced via its decomposition. To more strongly evaluate this possibility four feed components were evaluated, with
different grind sizes used to test the fiber sources (DDGS, soy hulls, and wheat mids) and then corn oil as the 4th options. As
an effort to generate foam differing carbohydrate sources and particle sizes were added directly to the manure to provide
readily available carbon and to evaluate if the decomposition of these substances caused formation of a surfactant that could
lead to foam formation or stabilization. The data on foaming capacity indicated that incubation length was not significant (p
= 0.5779), but that both the additive (p < 0.0001), and incubation length by additive interaction were (p = 0.0179). In this
case the interaction was mostly due to the soybean fiber (both fine and course ground) which showed a decreasing foaming
capacity with time, and the DDGS additives with had greater foaming capacities in the 2nd and 3rd weeks of incubation, as
compared to the controls and other additives which maintained relatively consistent foaming capacities throughout. As a
results this data is summarized in two ways, first the overall means for foaming capacity are provided in figure 1a; however,
due to the interaction, the impact on incubation time on foaming capacity is shown for several select additives in figure 1b.
The main effects indicated that the control, or no additive, had the largest foaming capacity with both soybean hull treatments
also having the next highest foaming capacities. The interaction by time graph indicated ground soybean hulls initially had
the highest foaming capacity but with longer incubations times this capacity decreased. A contrast statement testing
differences between finely ground and coarsely ground additions indicated no difference in foaming capacity (p = 0.2765);
however, in the case of soyhulls the finer grinding resulting in a larger response to foaming capacity. It is believed in large
part these results were driven by production of long-chain free fatty acids, their destruction SCFA, and their eventual
decomposition as soyhulls are the most available of the added substrates. In this study, corn oil resulted in reduced foaming
capacity throughout the incubation period used.

ASABE 2017 Annual International Meeting Page 6
(a) (b)
Figure 2. Impact of carbohydrate source and particle size on additive (a) and the interaction of carbohydrate source and particle size with
incubation time (b). Error bars represent the standard error of the mean. Means not connected with the same letter are different at α =
0.05. CNT-Control, CO-Corn Oil, F-DDGS – Finely ground DDGS, F
Finally, analysis of foam stability indicated that incubation length (p = 0.0004), additive (p < 0.0001), and the incubation
length by additive factor (p < 0.0001) were all significant. In generally the results can be summarized into two groups: 1)
foam stability was greatest in the finely ground soybean hull diet at day 7 at 33 minutes followed by the course ground
soybean hulls at 24 minutes, all other incubation lengths by additive combinations had similar half-lives of 0-5 minutes.
The differences in the behavior of the control mixture, the soybean hull mixture, and other samples provoke some
hypotheses with respect to a foaming mechanism. In particular, the efficiency of fermentation of the different additives, or
lack thereof, may have directly affected the foaming characteristics of the sample. In the case of the soybean hull mixture,
the initial spike of the foaming capacity followed by a gradual decline by week may reflect the relatively high cellulose
composition of soybean hulls, which are more readily digested by the microbial population. In fact, this elevated microbial
response to the additive addition could have led to the accumulation of some “biosurfactant” as described by Ganidi et al.
(2009). This latter hypothesis may also support the increasing foaming trend in the control diet as the weeks progressed if
the control diet was less quickly utilized by the bacteria in the bucket.
The second portion of this study took a more detailed look at the impact different potential feed components had on
methane production, comparing foaming and non-foaming manures to evaluate if they responded differently to different
ingredients. In this study, no impact of the additive or additive x surface interactions were seen. Major differences were seen
between foaming and non-foaming manures, but this followed similar trends for all of the components tested, thus it
wouldn’t appear that foaming manure microbial communities show an affinity for substrates that non-foaming manures do
not, but rather the foaming community is more adapt at converting all of the added components into methane. The foaming
manures generated approximately 350 mL CH4 per gram of COD added while the non-foaming manures only generated
approximately 40 mL CH4 per gram of COD (figure 3). In theory, approximately 350 mL of methane should have been
generated per gram of COD destroyed, thus it would appear that over the 80-day hydraulic retention time used in this study
foaming manures were capable of converting almost all of the potential COD added into methane.
Figure 3. Methane production from foaming and non-foaming manure per gram of chemical oxygen demand added.
0
50
100
150
200
250
300
350
400
7 14 21
Foa
min
g C
ap
aci
ty I
nd
ex
Fermentation Time (Days)
Control Ground Soybean Hulls
Unground Soybean Hulls Ground DDGS
Unground DDGS
BC
AA
BCDCD
DE
AB
DEDE
F F
CDE
EF
DEFEF
0
100
200
300
400
0 20 40 60 80
Met
hae
n P
rod
uct
ion
(ml C
H4/g
C
OD
)
Incubation Days
Foaming Non-foaming

ASABE 2017 Annual International Meeting Page 7
Manure Foaming Product Evaluation
Foaming capacity and foam half-life measurements were almost always low with the exception of a few treatments. The
addition of tannins caused stable foam to form, this was at first surprising and unexpected; however, tannins have been
shown to interact with proteins and it is believed that the addition of tannins provided something of the appropriate particle
size that could interact with proteins in the manure to form a stable, merengue like structure. The initial foam stability then
slowly decreased over the next four weeks of incubation. As a contrast to this, the foam buster (soybean oil) and free fatty
acid both gained foam stability over the course of the incubation. As a whole this would seem to indicate that something
about the decomposition of oils leads foam stability, supporting the results from the first feed component experiment.
However, based on the substrate addition experiment, if this is microbial exudate it may not be dependent on the type of
carbon source as no preference was seen between different carbon sources.
Figure 4. Foam-half life as a function of product addition and incubation time. Error bars represent a standard error of
the mean.
In terms methane production rate, six of the treatments caused reduced methane production rates as compared to the
controls upon treatment. These were the addition of water, sodium hydroxoid, inophore (Narasin), then the addition of
acetate, foam buster, and humic substances. After two weeks of incubation only four products showed reduced methane
production rates these were tannins, humic substances, and foam buster. Thus only the oil products appeared to inhibit
methane production consistently. However, over the course of the incubation
Figure 5. Methane production rate response to treatment, error bars represent the standard error of the mean.
Lab Incuation of Specific Foam Mitigation Products
Given the results of the first additive study, a previous Narasin treatment study reported by Reagen et al. (2015), an
0
500
1000
1500
2000
2500
Foam
Hal
f Li
fe(m
inu
tes) Week 0
Week 2
Week 4
0
0.02
0.04
0.06
0.08
0.1
0.12
0.14
Ac B C CW FB FFA H HS ION Na NH T
Met
han
e P
rod
uct
ion
Rat
e(L
/L-d
ay)
Treatment
Initial 2 Weeks
ASABE 2017 Annual International Meeting Page 8
analysis of microbial community structure by Yang et al. (2017), a decision was made to do a more focused study on just
three additives, Narasin, ManureMagic, lactobacillus, and then combinations of Narasin and ManureMagic and Narasin and
lactobacillus. These treatments were choses to evaluate three different mechanisms. Narasin was added to treat methane
production, ManureMagic was added to help break down proteins, lactobacillus was chosen it was one of the key microbial
differences between foaming and non-foaming manure microbial communities.
0.000
0.005
0.010
0.015
0.020
0.025
0.030
Control Narasin ManureMagic
Lacto Narasin+ MM
Narasin+ Lacto
Met
han
e P
rod
uct
ion
R
ate
(L/L
-day
)
Treatment
Week 2 Week 4 Week 6
AA
A
BB
aa
aa a
1 1 11 1 1
a
A
0
100
200
300
400
500
600
700
Control Narasin ManureMagic
Lacto Narasin+ MM
Narasin+ Lacto
Foam
Sta
bili
ty (m
in)
Treatment

ASABE 2017 Annual International Meeting Page 9
Field Evaluation of Foam Mitigation Products
This data was taken from a facility that had a history of foaming, but at the beginning of the experiment there was no
foam in the facility. We began collecting and testing samples on May 5th 2016 and continued taking samples about once
every two weeks till May 12th 2017. We first witnessed an accumulation of foam on February 3rd 2017. From that time on
we were able to see that the control pits definitely had a greater accumulation of foam than the treated pits with a maximum
of 41cm on both of the control pits and a maximum of 10cm on both treated pits. Thus would seem to indicate that while
the treatments were not able to completely eliminate the occurrence of foam, both reduced its severity (figure 8).
Figure 8. Foam height in the barn for control (CNT), Manure Magic (MM), and Narasin (NAR).
A statistical difference between total solids content of control pit (CNT=6.19%) and the two treated pits (NAR=4.69%,
MM=4.15%) with no significant difference between the two treated pits was found. Data from Van Weelden et al. (2015)
had previously indicated that foaming barns (at the surface) had higher solid content than non-foaming barns; however, they
were unable to state whether this was caused by the foam suspending particles to the surface similar to what occurs in a
dissolved air floatation system or the higher solids content was a driver of foam formation. Again we have a similar issue
here but our data would suggest that the higher solids content of the control pits occurred prior to the occurrence of foam.
As we had limited replication in this study (only control pit replicates) it is possible that the higher solids content was due
to some factor other than treatment. To help better evaluate if this was the case we also looked at other solids characteristics
such as the volatile solids (primarily organic matter) and fixed solids (primarily dissolved salts). The control pits had a
significantly higher volatile solids content (CNT=4.70%) than the pit treated with Manure Magic (MM=2.98%) while the
pit treated with Narasin (NAR=3.51%) was not statistically different than either pit. Although it was not statistically different
we saw a higher percentage of fixed in the control pit (CNT=1.65%, NAR=1.18%, MM=1.17%). This difference could
indicate that there was more dilution water entering the treated pits, but the lack of statistical significance would seem to
indicate that the solids differences is primarily due to the treatment effects. That is, if these fixed solids are treated as a tracer
0
100
200
300
400
500
600
700
2 4 6
Foam
Sta
bili
ty (m
in)
Week
A
AB
B

ASABE 2017 Annual International Meeting Page 10
of the manure the lack of differences between pits would suggest that differences in volatile solids and total solids, which
can both be impacted by treatment, is presumably due to the actual treatments applied. If the fixed solids are used as a co-
variate in the statistical analysis, as an effort to account for different dilution water entering each pit, the volatile solids
contents of the manure would have been CNT=4.7%, NAR=4.9%, MM=4.2%. This trend would be more towards what was
expected as the work of Reagen et al. (2014) suggested that treatment with Narasin reduced volatile solids destruction while
the product Manure Magic is sold as an additive to remove volatile solids from the manure. Another way of visualizing this
effect is to plot the volatility (percent of solids that are volatile). When viewed this way we find that the CNT = 74.11%,
NAR= 74.53%, MM=70.44%) with all three being statistically different from each other. This would seem to indicate that
Narasin reduced the destruction of volatile solids, while Manure Magic enhanced solids destruction.
(a) (b)
Figure 9. (a) Total Solids (TS) Volatile Solids (VS) and Fixed Solids, for control (CNT), Manure Magic (MM), and Narasin (NAR). (b)
Volatility for control (CNT), Manure Magic (MM), and Narasin (NAR). Error bars represent the standard error of the mean (SEM).
Different letters represent a statistical difference of α > 0.05.
The methane production rate (MPR) of the control pits (CNT = 0.10 L CH4/L-day) was significantly higher than both
treated pits (NAR = 0.075 L CH4/L-day, MM = 0.0697 L CH4/L-day). According to Van Weelden et al. (2015), the methane
production rate was one of the biggest differences between foaming and non-foaming manures, with foaming manures
averaging around 0.15 L CH4/L-day and non-foaming manures around 0.05 L CH4/L-day. In the case of Narasin treatment,
the reduction was anticipated as that is what Reagen et al. (2014) found when she dosed Narasin into manure in a lab setting.
The methane reduction when the manure was treated with Manure Magic was unexpected as this product is designed to
enhance solids breakdown which presumably would mean conversion to carbon dioxide and methane for the destruction of
organic carbon compounds, however, despite the fact that we found lower solids content in the manure we recorded lower
methane production rates from this manure. In either case, it would appear that both treatments were effective in reducing
the amount of methane produced by the manure.
Figure 10. Methane Production Rate (MPR) for control (CNT), Manure Magic (MM), and Narasin (NAR). Error bars represent the
standard error of the mean (SEM). Different letters represent a statistical difference of α > 0.05.
In terms of foaming capacity and stability, while Van Weelden et al. (2015) found differences between these parameters
in foaming and non-foaming barns, they noted a clearer distinction for foam stability. Our results here would mirror that as

ASABE 2017 Annual International Meeting Page 11
no difference in foaming capacity of the control barn was found as compared to the treated barns. Moreover, the control
manures trended lower (CNT=195.9%) than the two treated barns (NAR=231.0%, MM=236.5).
However, the control pits did have a significantly higher foaming stability (CNT=11.0min) than both treated pits
(NAR=4.0min, MM=3.1min) however the Narasin treated pit and the Manure Magic treated pit did not have a statistical
difference. It should be noted that while the stability shown in figure 11 b is relatively low at only 11 minutes, samples prior
to foaming exhibited no stability, greatly reducing the overall average.
(a) (b)
Figure 11. (a) Foaming Capacity for control (CNT), Manure Magic (MM), and Narasin (NAR). (b) Foaming Stability for control (CNT),
Manure Magic (MM), and Narasin (NAR). Error bars represent the standard error of the mean (SEM). Different letters represent a statistical
difference of α > 0.05.
A correlation analysis was also used to evaluate if any of the parameters we measured were correlated. In this case, the
methane production rate was not correlated to both the total or volatile solids content, but was correlated to higher foaming
capacities. However, we did find that foam stability was correlated with higher solids content (both total and volatile solids)
which supports the mechanism proposed in our introduction that some solid particles, presumably find solids are helping
stabilize the foam.
Table 2. Correlation matrix for Foaming Capacity (FC), Foaming Stability (FS), Methane Production Rate (MPR), Total Solids (TS), and
Volatile Solids (VS). Bold indicates a statistical correlation of p≤±0.05.
FC FS MPR TS VS
FC -0.4058 -0.3894 -0.4311 -0.4237
FS 0.1117 0.4398 0.4018
MPR 0.0849 0.0933
TS 0.988
VS
As mentioned, microbial communities were also measured. At this time, we have measured microbial communities from
the pits treated with Manure Magic and one of the control pits. Microbial communities were similar from the beginning of
the study through October when the manure was agitated and pumped out. At that time, we saw a microbial community
change, but the two pits remained similar. More product was added to the treated pit in December, at which point the
microbial communities diverged (Figure 12), with the treated pit not foaming and the control pit foaming. Overall, this data
meshes with the chemical and physical data we measured that showed differences in solids content, methane production
rate, and foam stability between the treated and control manure pits.

ASABE 2017 Annual International Meeting Page 12
Figure 12. (a), Ammonia readings for control (CNT), Manure Magic (MM), and Narasin (NAR). (b) Hydrogen Sulfide readings for control
(CNT), Manure Magic (MM), and Narasin (NAR). Error bars represent the standard error of the mean (SEM). Different letters represent a
statistical difference of p < 0.05.
In addition to these foaming properties, we also monitored both ammonia and hydrogen sulfide concentrations in the air
exhausted from the pit fans. In-barn air quality and barn emissions are of interest for animal health and barn odor. Air quality
data was taken from the pit fans for the duration of the experiment (Fig. 13). This data shows that each pit was statistically
different NH3 concentration in the barn air (CNT=11.2PPM, NAR=10.7PPM, and MM=7.3PPM) and statistically different
in H2S concentration (CNT=0.65PPM, NAR=0.89PPM, MM=0.71PPM). In this case the hydrogen sulfide and ammonia
concentrations are inverses of each other, which would seem to indicate these differences are most likely due to a pH effect,
presumably that the control barns are more basic than either the Narasin or Manure Magic treated barns.
(a) (b)
Figure 13. (a), Ammonia readings for control (CNT), Manure Magic (MM), and Narasin (NAR). (b) Hydrogen Sulfide readings for control
(CNT), Manure Magic (MM), and Narasin (NAR). Error bars represent the standard error of the mean (SEM). Different letters represent a
statistical difference of p < 0.05.
Conclusions
Overall the results of these studies support the work of Van Weelden et al. (2015, 2016) on difference between foaming
and non-foaming manures. The treatment practices evaluated here showed high variability in the lab setting, often giving
some signs of potential foam reduction either via reduced foam stability or methane production rate, but typically never
giving clear statistical differences, generally do to the low number of statistical replicates often used as well as the variability
among replicates. Overall, we found that adding any type of foodstuff to foaming manure increased methane production
rates and the added COD was quickly converted into methane, but we did not find any evidence for preference to a specific
substrate. In our second study our wide assortment of treatment practices we failed to find a substance that consistently
removed both methane production, foaming capacity, and foam stability. However, we did identify several substances that
led to enhanced foam stability. Specifically, our work demonstrated that tannins instantly increased foam stability,
presumably because these tannins were able to interact with proteins in the manure and were of the correct particle size to
provide a stabilizing backbone to the foam structure, again fitting with what Van Weelden et al. (2015, 2015) had shown
about foam. We also saw that the decomposition of oils could result in a similar natural phenomena of foam stabilization. In

ASABE 2017 Annual International Meeting Page 13
our final studies on Narasin, Manure Magic, and Lactobacillius, we saw indications of positive impacts of treatment reducing
foaming characteristics at the lab scale, but it wasn’t until we attempted this study at the field-scale that statically significant
differences occurred. We found that treatment with Manure Magic reduced solids content, methane production rate, foam
stability, and resulted in an altered microbial community, Treatment with Narasin resulted in greater solids content, but also
reduced methane production rate, foam stability, and reduced the actual occurrence of foam on the manure.
References
Andersen, D.S., Van Weelden, M.B., Trabue, S.L., & Pepple, L.M. 2015. Lab-assay for estimating methane emissions from deep-pit swine
manure storages. J. Environ. Management 159, 18-26. Doi: 10.1016/j/jenvman.2015.05.003.
Benchaar, C., C. Pomar, and J. Chiquette. 2001. Evaluation of dietary strategies to reduce methane production in ruminants: A modeling
approach. Can. J. Anim. Sci. 81: 563-574.
Clanton, C. 2012. MPB Research Grant Final Report.
http://www.mnpork.com/FileLibrary/States/MN/MPB%20Research/Reducing%20Deep%20PitFoamingAdditionSodiumMonensinPolo
xalene.pdf
Clemens, J., M. Trimborn, P. Weiland, and B. Amon. 2006. Mitigation of greenhouse gas emissions by anaerobic digestion of cattle slurry.
Agriculture, Ecosystems, & Environment 112)2_: 171-177.
Clemens, J. and H.J. Ahlgrimm. 2001. Greenhouse gases from animal husbandry: mitigation options. Nutrient Cycling in Agroecosystems
60(1): 287-300.
Jarret, G., Cozannet, P., Martinez, J., & Dourmad, J.Y. 2011. Effect of different quality wheat dried distiller’s grain solubles (DDGS) in pig
diets on composition of excreta and methane production from faeces and slurry. Livest. Sci. 140(1-3), 275-282. Doi: 10.1016/j.
livsci.2011.04.006.
Johnson, K.A. and D.E. Johnson. 1995. Methane emissions form cattle. J. Anim. Sci. 73: 2483-2492.
Kerr, B.J., Ziemer, C.J., Trabue, S.L., Crouse, J.D., & Parkin, T.B. 2006. Manure composition of swine as affected by dietary protein and
cellulose concentrations. J. Anim. Sci. 84(6), 1584-1592.
Key, N., McBride, W.D., Ribaudo, M., & S. Sneeringer. 2011 .Trends and developments in hog manure management: 1998-2009. EIB-81.
U. S. Dept. of Agriculture, Econ. Res. Serv.
Moody, L., R. Burns, and R. Muhlbauer. 2009. Deep pit swine facility flash fires and explosions: sources, occurrences, factors, and
management. National Pork Board. http://www.pork.org/filelibrary/NPB_Deep_Pit_Fires_Literature%20Review.pdf
Moody, L., R. Burns, G. Bishop, S.Sell, and R. Spajic. 2011a. Using biochemical methane potential assyas to aid in co-substrate selection
for co-digestion. Applied Eng. Agric. 27(3): 433-439.
Moody, L.B., R.T. Burns, S.T. Sell, and G. Bishop. 2011b. Using anaerobic toxicity assays to aid in co-substrate selection for co-digestion.
Applied Eng. In Agric. 27(3): 441-447.
Owen, W., D. Stuckey, J. Healy Jr., L. Young, and P. McCarty. 1979. Bioassay for monitoring biochemical methane potential and anaerobic
toxicity. Water Res. 13: 485-492.
Trabue, S. & Kerr, B. 2014. Emissions of greenhouse gases, ammonia, and hydrogen sulfide from pigs fed standard diets and diets
supplemented with dried distillers grains with soluble. J. Environ. Quality 43, 1176-1186. Doi:10. 2134/jeq2013. 05. 0207.
Van Weelden, M. B., Andersen, D.S., Trabue, S.L., Kerr, B.J., Rosentrater, K.A., & Pepple, L.M. 2015. An evaluation of the
physicochemical and biological characteristics of foaming swine manure. Trans. ASABE 58, 1299-1307.
Van Weelden, M.B., D.S. Andersen, K.A. Rosentrater, S.L. Trabue, and B.J. Kerr. 2013. Three-phase foam analysis and the development of
a lab-scale foaming capacity and stability test for swine manures. ASABE Paper No. 131594433.
Whitehead, T.R., C. Spence, and M.A. Cotta. 2013. Inhibition of hydrogen sulfide, methane, and total gas production and sulfate-reducing
bacteria in in vitro swine manure by tannins, with focus on condensed quebracho tannins. Appl. Microbial. Biotechnol. 97: 8403-8409.