evaluation of resistance increase and speed loss of a ship...
TRANSCRIPT

Available online at www.sciencedirect.com
Journal of Ocean Engineering and Science 1 (2016) 212–218 www.elsevier.com/locate/joes
Evaluation of resistance increase and speed loss of a ship in wind
and waves
Shaoze Luo
a , b , c , ∗, Ning Ma
a , b , c , e , Yoshiaki Hirakawa
d , e
a School of Naval Architecture, Ocean and Civil Engineering, Shanghai Jiao Tong University, China b State Key Laboratory of Ocean Engineering, Shanghai Jiao Tong University, China
c Collaborative Innovation Center for Advanced Ship and Deep-Sea Exploration, Shanghai, China d Sea & Air Control System Laboratory, Yokohama National University, Yokohama, Japan
e Institute of Advanced Sciences, Yokohama, Japan
Received 14 December 2015; received in revised form 7 April 2016; accepted 12 April 2016 Available online 27 April 2016
Abstract
Given the indication of the IMO’s intent to the application of the EEDI and EEOI, the complete and precise total resistance of a ship and induced speed loss in wind and wave is primarily required. This paper proposed a practicable method to evaluate the total resistance in seaway. Besides the still water resistance, the added resistance due to waves is computed using panel method and the wind resistance is obtained using CFD with the verification of an open wind test and statistical formula. The speed loss is acquired in consideration of the matching of the hull, engine and propeller. A hull optimization method is consequently presented based on the proper resistance evaluation approach. The approach is validated available and the total resistance of a ship could be reduced after hull optimization. © 2016 Shanghai Jiaotong University. Published by Elsevier B.V. This is an open access article under the CC BY-NC-ND license ( http://creativecommons.org/licenses/by-nc-nd/4.0/ ).
Keywords: Speed loss; Resistance increase; Wind; Wave; Hull form optimization.
a
c
l
Z
s
o
p
T
t
t
F
e
t
1. Introduction
On the background of increasing focus on the reduction ofthe fuel consumption and demand of energy saving, there is astrong requirement for the complete and accurate evaluationof the resistance increase and speed loss of a ship in seawayinstead of the previous simple power estimation in calm water.For this reason, the wind and waves factors contributing tospeed loss should be properly considered.
The ship during voyage at actual sea will encounter ex-ternal weather loads and thus causes the resistance increase,which result in speed reduction if the power never changes, oralternatively, requires an adequate power increasing in orderto maintain a certain speed. It is of great importance to give
∗ Corresponding author at: School of Naval Architecture, Ocean and Civil Engineering, Shanghai Jiao Tong University, China.
E-mail address: [email protected] (S. Luo).
t
o
w
s
http://dx.doi.org/10.1016/j.joes.2016.04.001 2468-0133/© 2016 Shanghai Jiaotong University. Published by Elsevier B.V. This( http://creativecommons.org/licenses/by-nc-nd/4.0/ ).
valid estimation of added resistance considering a given seaondition.
Many studies concerning the added resistance and speedoss have been carried out in these years. Sverre Steen andhenju Chuang [14] have provided a method to measure thepeed loss from model test and demonstrate the importancef friction correction. Journée [8] has developed a computerrogram to calculate speed and behavior of ship in seaway.wo factors including the natural speed reduction and volun-
ary speed reduction are considered. Full comparison betweenwo methods of added resistance evaluation, one developed byaltinsen, and the other by Salvesen, is performed by Matuljat al. [12, 11] . Pérez Arribas [1] also validated some predic-ion method against the experimental results of the seakeepingests and made conclusions about the range of the applicationf these theories.
This paper defines the total resistance into three parts, stillater resistance, added resistance due to waves and wind re-
istance. Each is evaluated with different methods. What is
is an open access article under the CC BY-NC-ND license

S. Luo et al. / Journal of Ocean Engineering and Science 1 (2016) 212–218 213
m
h
p
a
o
t
f
a
2
d
r
a
i
w
t
i
2
a
T
p
p
H
d
�
�
h
p
t
a
2
o
s
s
a
w
r
c
C
Fig. 1. Container layouts on the deck.
Fig. 2. Coefficient comparison in layouts.
c
C
s
t
a
c
p
r
w
w
l
N
r
a
s
d
a
w
s
ore, a critical analysis and comparison for the wind loadsas been carried out with statistical, computational and ex-erimental data. Therefore, the resistance increase is predictednd the speed loss is gained in consideration of the interactionf the hull, engine and propeller in seaway. To obtain a bet-er performance of a ship in wind and waves, the speed lossactor and EEOI as objectives are optimized using NSGA-IIlgorithm.
. Methods
The added resistance, according to the load components, isivided into two parts, i.e. the wind resistance and the addedesistance due to waves. In this paper, the ship is assumeddvancing in head waves and the added resistance in wavess calculated with three dimensional panel method while theind resistance is analyzed in several ways including statis-
ical formulation, full CFD computation and open wind testn towing tank.
.1. Wave added resistance
The resistance increase in regular waves is calculated withnalytical method developed by Chen [2] and Newman [13] .he estimation in irregular waves is based on the linear hy-othesis for the ship’s response as well as the superpositionrinciple for the components of waves and resistance spectra.ere the added wave resistance is approximated as second or-er drift force in head wave. The mean added wave resistanceR AW
would be as follows:
R AW
= 2
∫ ∞
0
R AW
( ω e )
ς
2 a
S ς ( ω e ) d ω e (1)
With S ς ( ω e ) the wave spectrum, ς a the significant waveeight, ω e the encountering frequency.
Chen’s method includes the first-order and second-orderotential theory of wave radiation and diffraction as well ashe elimination of irregular frequencies, which is somehowccurate enough for engineering application.
.2. Wind resistance
Fujiwara [5] has developed a new estimation method basedn physical component models of the wind loads acting onhips, and this method is later modified for new ship formsuch as large containerships. The modified method is moreccurate in wind loads estimation of containership comparedith Isherwood’s [7] empirical formulas analyzed from a wide
ange of merchant ships. The longitudinal wind drag coeffi-ient C x then could be calculated from:
x ( �A ) = C LF cos �A
+ C X LI ( sin �A − 1
2
sin �A cos 2 �A ) sin �A
+ C ALF sin �A cos 2 �A
+
A RC
A
( C D1 cos 2 �A + C D2 sin �A cos �A ) (2)
ODWith �A the angle of attack, C LF the lift force part, C X LI
aused by the linear potential theory, and additional force X LI caused by the 3-dimensional flow effect. A RC
corre-ponds to the lack part area in the lateral projected area onhe deck’s fully imaged containers A OD
. C D 1 and C D 2 are thedditional coefficients.
For more detailed and precise results, the author hasarried out an open wind test in towing tank. The windrofile was studied and compared with other experimentesults to validate the feasibility of the open wind test beforeind drag of a scale model in different container layoutsas measured. The series of the experiment with container
ayouts in Fig. 1 have been carried out in in Yokohamaational University (hereafter simply YNU). The experiment
esults of the wind resistance coefficients in different layoutre displayed in Fig. 2.
Computational calculation is also performed based on theame cases. The Realizable κ- ε turbulence model and stan-ard wall function are adopted and the local refinement ispplied to the region near the containers. Second order up-ind difference scheme is used for relatively accurate and
table results.

214 S. Luo et al. / Journal of Ocean Engineering and Science 1 (2016) 212–218
Fig. 3. Speed loss coefficient with wind resistance.
Fig. 4. Speed loss coefficient without wind resistance.
3
m
f
r
b
S
W
f
p
φ
∑
t
[
A
c(
s
t
a
3
o
S
From a series of container layout cases, the difference ofthe wind drag force has been analyzed and simulated by CFD.It is proved that 1) open wind test is an effective measurementthough it is simple; 2) through cross validation, the resultsare proved credible and CFD has the priority of the moredetailed fluid field information and higher precision; 3) thewind drag can be reduced through configuration optimization.Through different methods, the wind resistance coefficients byCFD method is chosen to be applied in the evaluation of theresistance increase and optimal layout of the containers wouldbe adopted during the optimization.
2.3. Speed loss
IMO proposed the EEDI/EEOI regulation, but no speci-fied procedure for calculation of the speed loss coefficient isissued. There are several methods [9] nowadays to analyzethe speed loss coefficient. One method is the widely usedNMRI approach, where coefficient f w
is defined as the ratioof the speed in sea condition ( V w
) to the reference speedin calm water ( V ref ). Both speeds are defined at P EEDI (75%MCR) and EEDI draft. Another method by FENG [4] takesinto account the energy transmission among hull, engine andpropeller as well as the hydrodynamic interaction, whichmay better guarantee the navigation performance of the shipin seaway. It is obvious that the speed loss coefficient isremarkably different whether the wind resistance is takeninto account ( Figs. 3 and 4 ).
3. Optimization
The total resistance that takes account the resistance in-crease for a specific sea state condition has been estimatedby means of the above theories. Given the information of theengine and propeller, the speed loss coefficient could be com-puted through the NMRI approach or hull-engine-propeller(H.E.P.) matching method. Based on the Energy EfficiencyDesign Index formula recommended by IMO [6] , the shipspeed performance could be further evaluated.
.1. Hull form transformation
For the purpose of ship performance optimization, a localodification of hull surface is applied by using radial basis
unction. The transformation can be easily achieved by ar-anging control nodes around the ship hull [10] . The radialasis function describes the surface as follows:
(X ) =
N ∑
j=1
λ j φ( ∥∥X − X j
∥∥) + p(X ) (3)
here X = ( x , y , z ) is the node on surface, φ is the basisunction. Here Wedndland’s C2 function with compact sup-ort is chosen.
( ‖ X
‖ ) = (1 − ‖ X
‖ ) 4 (4
‖ X
‖ + 1) (4)
Additional boundary condition is set:
N
j=1
λ j p( X j ) = 0, j = 1 , . . . , N (5)
The linear polynomial to recover the translation and rota-ion is defined as follows,
p(X ) = c 1 + c 2 x + c 3 y + c 4 z (6)
Thus the values λ = [ λ1 , λ2 , ..., λN ] T and c = c 1 , c 2 , c 3 , c 4 ] T can be obtained by solving the system.nd the hull surface can be modified if different f is
hosen.
f
0
)
=
(
P
P
T 0
) (
λ
c
)
(7)
Figs. 5 and 6 show the control nodes distribution on thehip model. The fixed nodes are used to maintain the rest ofhe hull form that tends to be same with the origin; the mov-ble nodes are spread around the bow for local modification.
.2. Optimization algorithm
The performance optimization can be seen as a multiple-bjective optimization problem. In this paper, Non-dominatedorting Genetic Algorithm II is employed to globally search

S. Luo et al. / Journal of Ocean Engineering and Science 1 (2016) 212–218 215
Fig. 5. Distribution of the fixed control nodes on the hull surface.
Fig. 6. Movable control nodes used as design variables.
Fig. 7. Flow chart of optimization.
t
a
p
i
j
o
t
N
t
v
Table 1 Variables and constraints.
ID Lower limit Upper limit
(Disp −Disp 0 )/Disp 0 −4% 4%
( B m −B m 0 )/ B m 0 −1% 1%
P m 1 : (fx, fy, fz) ( −0.05, 0, −0.05) (0.05, 0, 0.05) P m 2-6 : (fx, fy, fz) (0, −0.05, 0) (0, 0.05, 0) P f : (fx, fy, fz) (0, 0, 0) (0, 0, 0)
Table 2 Information of 3100TEU containership.
Loa/m B/m Design draft/m
Displacement/t Service speed/kn CSR/kW
214.2 32.2 11.9 54621.8 22.5 28,728
Fig. 8. Total resistance predicted in BF6.
oa
4
4
t
b
t
e
i
r
t
t
s
o
a
4
r
c
0
t
he Pareto solutions. The NSGA-II method ( 3 ) is able to find much better spread of the solution and convergence in mostroblems. In this case, the hull form is optimized with EEDIndex and weather speed loss coefficient as optimization ob-ectives and less change in displacement as a constraint. Theptimization flow chart is shown in Fig. 7 . It is noted thathe wind resistance optimization module is independent ofSGA-II optimization loop since the computational calcula-
ion by CFD is rather time consuming. Table 1 gives theariants and constraints in optimization procedure.
Here in Table 1 , Disp 0 /Disp; the displacement before /afterptimization, B m
/ B m 0 ; breadth before/after optimization. P m
nd P f mean movable and fixed control points, respectively.
. Results
.1. Total resistance
In this study, a conventional 3100TEU containership isaken as an initial hull, major information is presented in Ta-le 2 . The representative sea condition are granted level 6 onhe Beaufort Scale. The resistance component of the contain-rship including the resistance increase in seaway is shownn Fig. 8 . It results that the major contribution to the totalesistance is due to the resistance in calm water. The con-ribution due to weather condition amounts to 16.7% of theotal resistance at design speed, which indicates that the re-istance increase cannot be neglected and the real speed lossf the ship advancing in seaway should be properly treatednd covered.
.2. Optimization
The layout of the containers on the deck is rearranged toeduce the wind resistance in seaway. The wind resistanceoefficient of the optimal solution, layout 8, declines from.8041 to 0.6181, a decrease of 23.1 percent, compared withhat of the original layout (see layout 4 in Fig. 1 ). It is
216 S. Luo et al. / Journal of Ocean Engineering and Science 1 (2016) 212–218
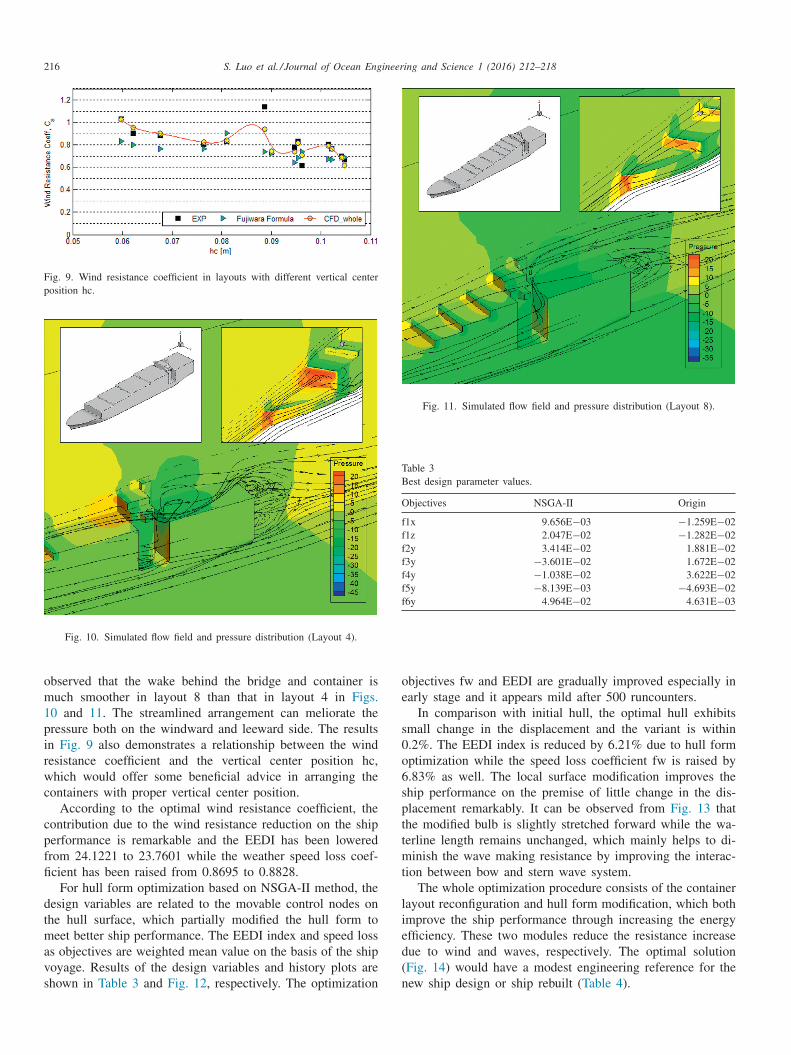
Fig. 9. Wind resistance coefficient in layouts with different vertical center position hc.
Fig. 10. Simulated flow field and pressure distribution (Layout 4).
Fig. 11. Simulated flow field and pressure distribution (Layout 8).
Table 3 Best design parameter values.
Objectives NSGA-II Origin
f1x 9 .656E −03 −1 .259E −02 f1z 2 .047E −02 −1 .282E −02 f2y 3 .414E −02 1 .881E −02 f3y −3 .601E −02 1 .672E −02 f4y −1 .038E −02 3 .622E −02 f5y −8 .139E −03 −4 .693E −02 f6y 4 .964E −02 4 .631E −03
o
e
s
0
o
6
s
p
t
t
m
t
l
i
e
d
(
n
observed that the wake behind the bridge and container ismuch smoother in layout 8 than that in layout 4 in Figs.10 and 11 . The streamlined arrangement can meliorate thepressure both on the windward and leeward side. The resultsin Fig. 9 also demonstrates a relationship between the windresistance coefficient and the vertical center position hc,which would offer some beneficial advice in arranging thecontainers with proper vertical center position.
According to the optimal wind resistance coefficient, thecontribution due to the wind resistance reduction on the shipperformance is remarkable and the EEDI has been loweredfrom 24.1221 to 23.7601 while the weather speed loss coef-ficient has been raised from 0.8695 to 0.8828.
For hull form optimization based on NSGA-II method, thedesign variables are related to the movable control nodes onthe hull surface, which partially modified the hull form tomeet better ship performance. The EEDI index and speed lossas objectives are weighted mean value on the basis of the shipvoyage. Results of the design variables and history plots areshown in Table 3 and Fig. 12 , respectively. The optimization
bjectives fw and EEDI are gradually improved especially inarly stage and it appears mild after 500 runcounters.
In comparison with initial hull, the optimal hull exhibitsmall change in the displacement and the variant is within.2%. The EEDI index is reduced by 6.21% due to hull formptimization while the speed loss coefficient fw is raised by.83% as well. The local surface modification improves thehip performance on the premise of little change in the dis-lacement remarkably. It can be observed from Fig. 13 thathe modified bulb is slightly stretched forward while the wa-erline length remains unchanged, which mainly helps to di-
inish the wave making resistance by improving the interac-ion between bow and stern wave system.
The whole optimization procedure consists of the containerayout reconfiguration and hull form modification, which bothmprove the ship performance through increasing the energyfficiency. These two modules reduce the resistance increaseue to wind and waves, respectively. The optimal solution Fig. 14 ) would have a modest engineering reference for theew ship design or ship rebuilt ( Table 4 ).

S. Luo et al. / Journal of Ocean Engineering and Science 1 (2016) 212–218 217
Fig. 12. Objectives history Plots (Up: EEDI; Down: fw).
Fig. 13. Hull form optimization (side view).
5
i
i
p
Fig. 14. EEDI and fw optimization results.
Table 4 Optimization objectives comparison.
Objectives NSGA-II Rwind opt Origin
EEDI/g (t nm) −1 22 .2613 23 .7601 24 .1221 �EEDI/% −6 .213 −1 .500 (EEDI −EEDI 0 )/ EEDI 0 /% −7 .714 −1 .500 Fw 0 .9422 0 .8828 0 .8695 �fw/% 6 .832 1 .530 (fw −fw 0 )/ fw 0 /% 8 .361 1 .530 Disp/t 54716 .1 54621 .8 54621 .8 (Disp −Disp 0 )/Disp 0 /% 0 .173 –
w
i
t
e
o
c
t
e
a
s
s
b
w
A
R
h
t
a
S
f0
R
. Conclusion
Total resistance of a containership including the resistancencrease due to wind and wave which cannot be neglectedn seaway is calculated. Furthermore, a practicable method isroposed to estimate the added resistance due to waves and
ind resistance, so that the speed loss can be evaluated by us-ng either NMRI approach or H.E.P. method. It is proved thathe computational method is a simple and accurate method tovaluate the wind resistance, and it is validated by means ofpen wind test in towing tank.
To achieve better ship performance, the hull surface is lo-ally modified by using radial basis function interpolation inotal resistance evaluation loops. The EEDI and speed loss co-fficient are optimized as objectives while the control nodesround surface are set as design parameters. Optimal Paretoolution can be obtained by NSGA-II algorithm. It demon-trates that the ship performance in seaway has a potential toe optimized once the resistance increase and speed loss areell evaluated.
cknowledgments
The author wishes to much appreciate Prof. Y. HI-AKAWA from Yokohama National University for invaluableelp with the open wind test in YNU’s towing tank. Alsohanks Mr. H. TAKAYAMA for the expertise assistance anddvice in the experiment.
upplementary materials
Supplementary material associated with this article can beound, in the online version, at doi:10.1016/j.joes.2016.04. 01 .
eferences
[1] F. Pérez Arribas , Ocean Eng. 34 (7) (2007) 946–955 . [2] Xiao-Bo Chen , in: Proceedings of Keynote Lecture of 6th International
Conference on HydroDynamics, Perth, Australia, 2004 .

218 S. Luo et al. / Journal of Ocean Engineering and Science 1 (2016) 212–218
[[[
[
[
[3] Kalyanmoy Deb , et al. , IEEE Trans. Evol. Comput. 6 (2) (2002)182–197 .
[4] Pei-Yuan Feng , Ning Ma , Gu Xie-Chong , J. Shanghai Jiaotong Univ.46 (8) (2012) 1248–1262 .
[5] Toshifumi Fujiwara , et al. , in: Proceedings of the Nineteenth Interna-tional Offshore and Polar Engineering Conference, International Societyof Offshore and Polar Engineers, 2009 .
[6] IMO , Guidelines on the method of calculation of the attained energyefficiency design index (EEDI) for new ships, Report No. IMO MEPC66, 2014, 3–5 .
[7] Isherwood, R. M (1973). Wind Resistance of Merchant Ships. RINASupplementary Papers 115.
[8] J.M. J Journée , Prediction of Speed and Behaviour of a Ship in aSea-Way, Delft University of Technology, 1976 .
[9] Kim, Yonghwan, Dominic Hudson, and Pepijn de Jong (2014). "Sea-keeping Committee."
10] Hyunyul Kim , Chi Yang , J. Hydrodyn. Ser. B 22 (5) (2010) 520–525 . 11] Dunja Matulja , et al. , Brodogradnja 62 (3) (2011) 259–264 . 12] Matulja, Dunja, and Jasna Prpi ́c-Orši ́c (2010). Methods for Estimation
of Ships Added Resistance in Regular Waves. Simpozij Sorta 2010.Hrvatska znanstvena bibliografija i MZOS-Svibor.
13] J. N Newman , in: Proceedings of the 23rd International ConferenceOffshore Mechanics & Arctic Engineering, Vancouver, Canada, 2004 .
14] Sverre Steen , Zhenju Chuang , in: Proceedings of the third InternationalSymposium on Marine Propulsors, smp’13, 2013 .