evaluation of safety exclusion zone for lng bunkering ... · established method of lng bunkering is...
TRANSCRIPT
1
Evaluation of Safety Exclusion Zone for LNG
Bunkering Station on LNG-Fuelled Ships
Byongug Jeong a,*, Byung Suk Lee a, Peilin Zhou a, Seung-man Hab
a Department of Naval Architecture, Ocean and Marine Engineering, University of
Strathclyde, 100 Montrose Street, Glasgow, G4 0LZ, UK
bKorean Resister of Shipping, 36 Myeongji Ocean city 9-ro, Gangseo-gu, Busan, 46762,
Republic of Korea
*corresponding author e-mail: [email protected], phone: +44(0)7425694809
ABSTRACT
With increasing interests in using LNG as a marine fuel, safety issues for LNG bunkering
have brought about global discussion on establishing a safety exclusion zone around LNG
bunkering areas. However, international consensus has yet to be reached in determining
an appropriate extent of the zone to ensure safe LNG bunkering.
The purpose of this study is to identify potential risks of LNG bunkering and to present a
statistical method for determining the safe exclusion zone around LNG bunkering station
with the help of a purpose-built computer program, Integrated Quantitative Risk
Assessment (IQRA).
A probabilistic risk assessment approach was adopted in this study to determine the safety
exclusion zone for two case ships: one, a 300,000 DWT very large ore carrier (VLOC)
and the other a 32,000 DWT bulk carrier. The results are then compared with those
obtained by a deterministic approach and the discrepancies are discussed.
It was found from this study that the frequency of bunkering is one of the key factors in
determining the extent of safety exclusion zone. Thus a somewhat surprising result of 36
m radius safety exclusion zone for the 32,000 DWT bulk carrier compared to 6.4 m radius
for the 300,000 DWT VLOC was obtained.
It was also found that the deterministic approach produced a much more extensive safety
exclusion zone for the 300,000 DWT VLOC subjected to infrequent large scale LNG
bunkering operations compared to the probabilistic approach, while it was reasonably
consistent with the probabilistic approach for the 32,000 DWT bulk carrier which uses
frequent small scale bunkering.
Keywords: quantitative risk assessment, LNG-fuelled Ship, LNG bunkering, safety
exclusion zone
2
1. Introduction
For ships using LNG as a fuel, LNG bunkering is an unavoidable process. The most
established method of LNG bunkering is to transfer LNG from an LNG terminal to a
receiving ship in a similar way as LNG cargo is loaded. However, lack of terminal
infrastructure has encouraged several alternative methods to emerge, such as using LNG
tank lorries, LNG feeder ships or portable LNG tanks [1][2]. Since 2000 when the
world’s first LNG-fuelled ship, the MV Glutra, was put into service, small to medium
scale LNG bunkering has taken place using some of these alternative methods by a total
of 48 LNG-fuelled ships [3][4].
LNG bunkering requires careful attention to safe operations as it entails potential risks
pertaining directly to the cryogenic liquid transfer and vapour returns, much more so than
the conventional liquid fuel bunkering. According to a report of Norwegian Maritime
Authority [5], four accidents associated with LNG spill have been reported – one of
which led to an injury of a crew member on his hands and legs due to cryogenic burn.
Moreover, in large scale LNG bunkering operations for large ocean going ships,
significant uncertainties associated with massive accidental LNG release are present. In
view of the possibly catastrophic consequence of such accidents, the risks associated with
LNG bunkering merits careful studies.
It is not surprising, therefore, that several studies ([6] – [9]) related to the safety of using
LNG as a marine fuel have been reported. An information document to the IMO’s CCC
Sub-Committee [10] addressed the explosion risk at an LNG bunkering station,
presenting a result of computer simulation that showed the impact of an instantaneous
explosion from a massive concentration of LNG vapour gas, using a CFD Code
(FLACS)1. DNV [3] has conducted a site-specific quantitative risk assessment of LNG
bunkering in an effort to determine a safe distance for passing ships at the Port of
Rotterdam. However, the findings of these studies were too site-specific to be translated
into general regulations directly. Moreover, current international/local regulations and
rules concerning the safety in LNG bunkering are limited to operational guidelines,
lacking quantified requirements.
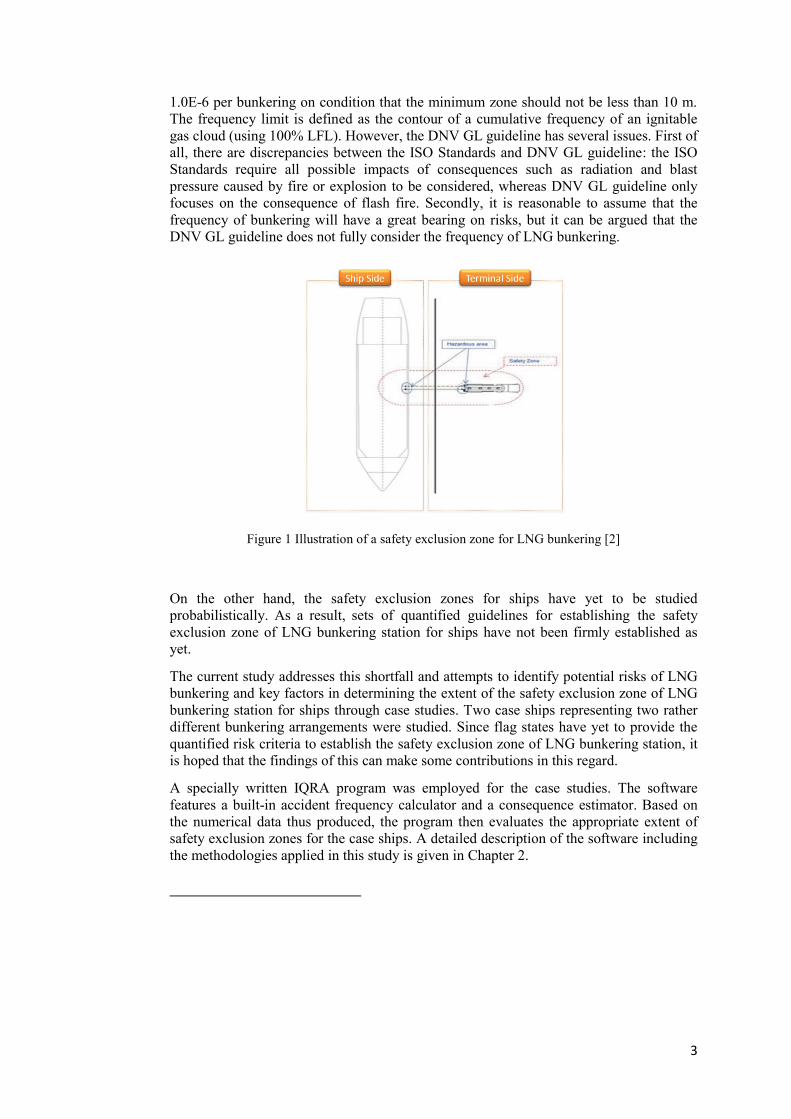
On the other hand, ISO/TS 18683 [2] recommends establishing a safety exclusion zone
around the LNG bunkering station access to which is to be restricted to all non-essential
personnel during bunkering so as to minimise the probability of ignition and the threat to
human lives in the event of an accident. Such a safety exclusion zone encompassing the
supply point on the terminal side and the bunkering station on the ship is illustrated in
Figure 1. This standard allows the extent of the safety exclusion zone to be determined
either deterministically based on the worst case scenario or probabilistically using
quantitative risk assessment.
In certain cases safety exclusion zone determined through a deterministic method may
turn out to be impracticably large, because such a method is usually based on an extreme
event regardless of the probability of its occurrence. The determination of the ‘extreme’
event is somewhat arbitrary as well.
DNV GL [11] has conducted a case study for proposed LNG bunkering ports in USA,
estimating safety exclusion zones for the LNG terminals. However, since it focused on
site-specific scenarios obtained from hazard identification, the findings may have limited
general applicability.
Nevertheless, DNV GL [12] has developed a guideline for LNG bunkering facilities,
which recommend establishing the safety exclusion zone under the frequency limit of
1 Flame Acceleration Simulator (FLACS), Ver.10.0, GexCon, Bergen, Norway
3
1.0E-6 per bunkering on condition that the minimum zone should not be less than 10 m.
The frequency limit is defined as the contour of a cumulative frequency of an ignitable
gas cloud (using 100% LFL). However, the DNV GL guideline has several issues. First of
all, there are discrepancies between the ISO Standards and DNV GL guideline: the ISO
Standards require all possible impacts of consequences such as radiation and blast
pressure caused by fire or explosion to be considered, whereas DNV GL guideline only
focuses on the consequence of flash fire. Secondly, it is reasonable to assume that the
frequency of bunkering will have a great bearing on risks, but it can be argued that the
DNV GL guideline does not fully consider the frequency of LNG bunkering.
Figure 1 Illustration of a safety exclusion zone for LNG bunkering [2]
On the other hand, the safety exclusion zones for ships have yet to be studied
probabilistically. As a result, sets of quantified guidelines for establishing the safety
exclusion zone of LNG bunkering station for ships have not been firmly established as
yet.
The current study addresses this shortfall and attempts to identify potential risks of LNG
bunkering and key factors in determining the extent of the safety exclusion zone of LNG
bunkering station for ships through case studies. Two case ships representing two rather
different bunkering arrangements were studied. Since flag states have yet to provide the
quantified risk criteria to establish the safety exclusion zone of LNG bunkering station, it
is hoped that the findings of this can make some contributions in this regard.
A specially written IQRA program was employed for the case studies. The software
features a built-in accident frequency calculator and a consequence estimator. Based on
the numerical data thus produced, the program then evaluates the appropriate extent of
safety exclusion zones for the case ships. A detailed description of the software including
the methodologies applied in this study is given in Chapter 2.
4
2. Methodologies
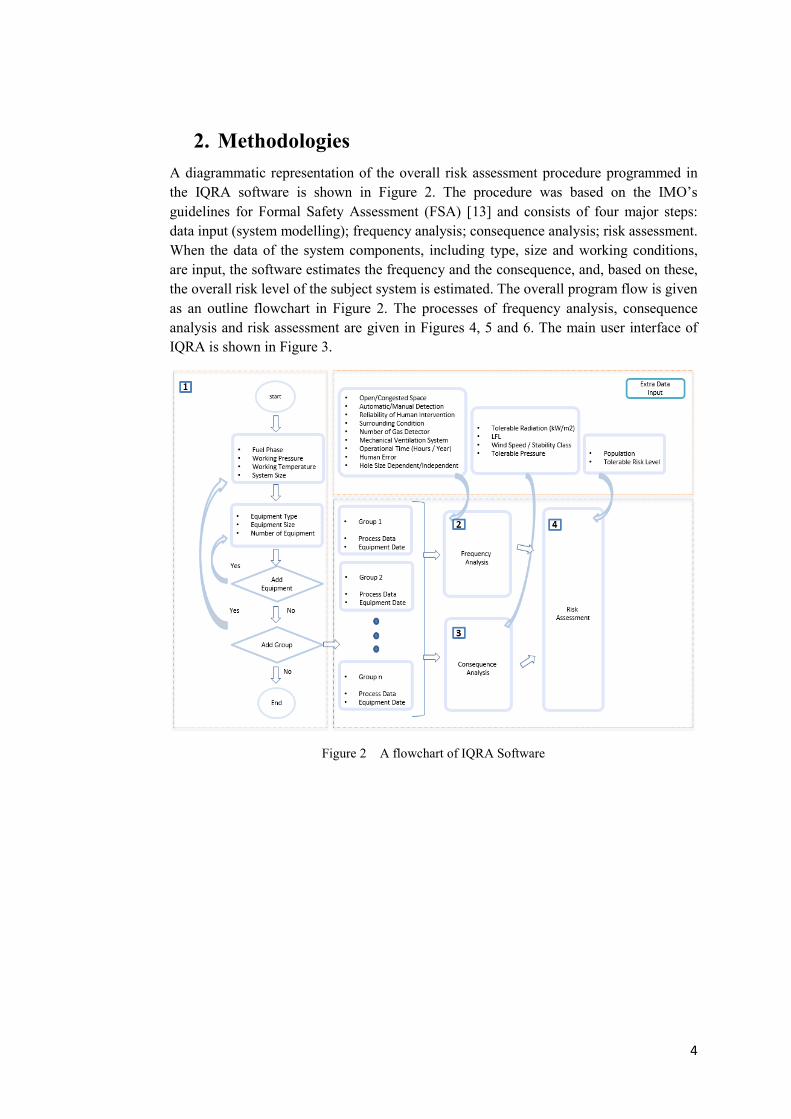
A diagrammatic representation of the overall risk assessment procedure programmed in
the IQRA software is shown in Figure 2. The procedure was based on the IMO’s
guidelines for Formal Safety Assessment (FSA) [13] and consists of four major steps:
data input (system modelling); frequency analysis; consequence analysis; risk assessment.
When the data of the system components, including type, size and working conditions,
are input, the software estimates the frequency and the consequence, and, based on these,
the overall risk level of the subject system is estimated. The overall program flow is given
as an outline flowchart in Figure 2. The processes of frequency analysis, consequence
analysis and risk assessment are given in Figures 4, 5 and 6. The main user interface of
IQRA is shown in Figure 3.
Figure 2 A flowchart of IQRA Software
5
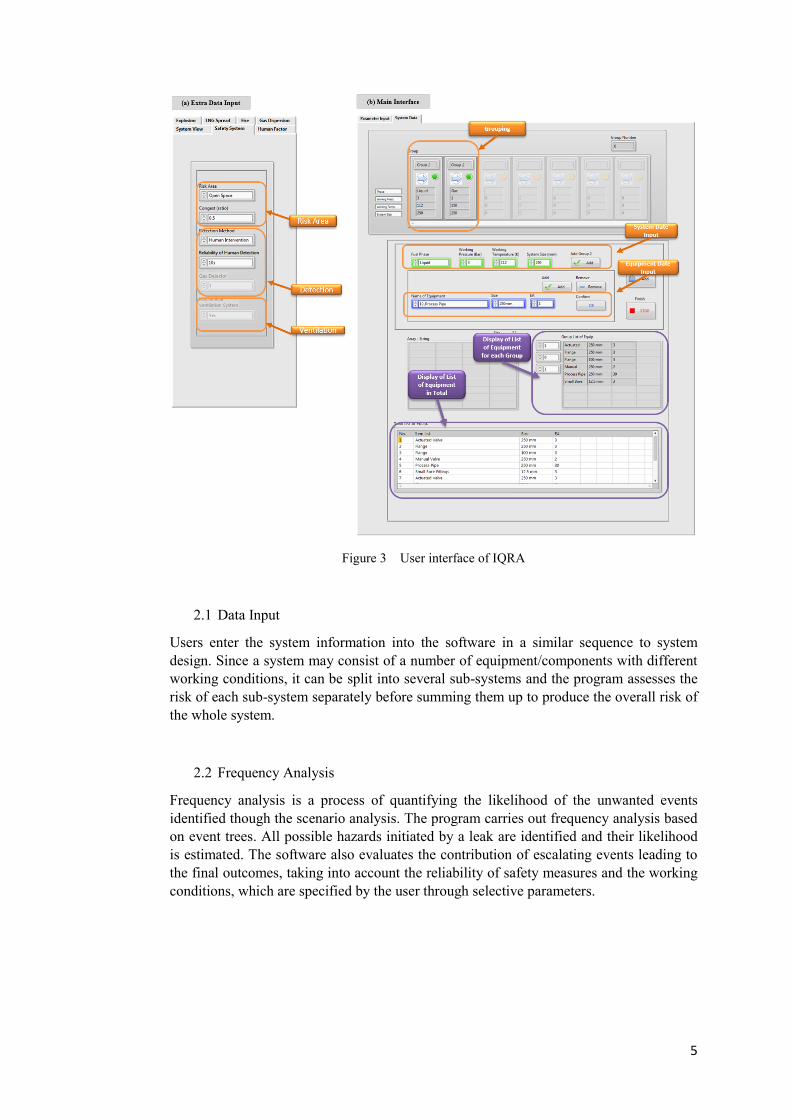
Figure 3 User interface of IQRA
2.1 Data Input
Users enter the system information into the software in a similar sequence to system
design. Since a system may consist of a number of equipment/components with different
working conditions, it can be split into several sub-systems and the program assesses the
risk of each sub-system separately before summing them up to produce the overall risk of
the whole system.
2.2 Frequency Analysis
Frequency analysis is a process of quantifying the likelihood of the unwanted events
identified though the scenario analysis. The program carries out frequency analysis based
on event trees. All possible hazards initiated by a leak are identified and their likelihood
is estimated. The software also evaluates the contribution of escalating events leading to
the final outcomes, taking into account the reliability of safety measures and the working
conditions, which are specified by the user through selective parameters.

6
Figure 4 An example event tree for frequency analysis
Spilled LNG will undergo several physical processes simultaneously, such as pool
formation, spread and boil-off. However, the final outcome can be diverse, depending on
the nature of the leak and functioning of safety measures. Figure 3 shows an event tree of
a series of accidental scenarios programmed in the software. Immediate ignition is
assumed to be associated with jet fire (for gas release) and pool fire (for liquid release)
whereas delayed ignition leads to other types of outcome. A leak of liquid fuel forms a
liquid pool, possibly leading to a pool fire if ignited. Where the concentration of leaked
material is between LFL and UFL (5%~15%), it is assumed that delayed ignition leads to
a flash fire. A leak of liquid fuel forms a liquid pool, possibly leading to a pool fire if
ignited. An explosion is likely to occur where gas is sufficiently enclosed, while a pool
fire (which is only associated with liquid leak) and flash fire may occur in open
conditions [14]. For open spaces, the frequency of each hazard is calculated as follows:
FJet Fire = FInitial Leak × PImm. Ignition
FPool Fire = FInitial_Leak × PImm. Ignition
FFlash Fire = FInitial_Leak × PLate_Isolated_Leak × PSuc. Ven. × PDel. Ignition × PNot Congested
FExplosion = FInitial_Leak × PLate_Isolated_Leak × PSuc. Ven. × PDel. Ignition × PCongested
Where
F : Frequency (/year)
P : Probability
Since the bunkering systems are arranged in an open space for both case ships, leak is
more likely to be detected by personnel than gas detection devices. Therefore, the
7
probability of the full leak scenario is directly related to the probability of failure in watch
keeping. An ignition results in several types of fire (flash, pool and jet) and explosion
scenarios.
Using the ‘Extra Data Input’ tab shown in Figure 3, probable conditions of risk area and
safety measures can be specified. In an open space, it is plausible that a fuel leak, either
of liquid or gas, is detected by personnel while, in a confined space, gas detectors can be
used. In addition, it can also distribute the congestion ratio of surrounding conditions and
the effectiveness of ventilation system for confined spaces can be considered through this
tab.
(a) Initial Leak Frequency
For the causes of initial leak, the software focuses on internally induced events, especially
equipment failures. The DNV Leak Frequency Datasheets contain 17 types of LNG equipment and various
leak hole sizes: 3mm, 10mm, 50mm, 150mm and full (over 150 mm) [7]. Several failure
databases are contained in the software, but the DNV frequency failure datasheets for
LNG process equipment were used in this study as the database is commonly used for
investigating hydrocarbon release including LNG.
The IQRA estimates the leak frequency of each piece of equipment and component using
the built-in database in accordance with its size and annual operating time for various
leak hole sizes in consideration. These frequencies are then summed to obtain the total
leak frequency of LNG bunkering system.
(b) Probability of late isolated leak / Ventilation Failure
The full leak scenario represents a situation where the safety devices fail or appropriate
actions are not taken to shut off the leak. To calculate the reliability of the safety
measures including human factors, the software adopts generic failure data associated
with safety system malfunctions and human errors from various sources such as KletzT
[15], ORADA [16], EPRI [17], and CCPS [18]. It is assumed that limited leak scenarios,
where safety systems function correctly, do not lead to adverse consequences. Natural
dispersion takes place in open spaces, but the availability of mechanical ventilation
system and the probability of its failure must be considered for confined spaces.
(c) Probability of Immediate Ignition and Delayed Ignition
Several models of ignition probability have so far been developed by various authors. For
rigorous approaches, the default of this program for immediate ignition is the Dutch
model [3], while for delayed ignition the Cox model [19] (PDI) is used by default as those
models have relatively higher ignition probabilities than other models. The probability of
immediate ignition according to the Dutch model is shown in Table 1 and the Cox model
for delayed ignition is given by Eq. (1).
Table 1 Probability of Immediate Ignition
Leak Rate ( leakQ ) Immediate ignition
probability
< 10 kg/s 0.02
10 ~ 100 kg/s 0.04

8
> 100kg/s 0.09
0.64150.0158DI leakP Q (1)
2.3 Consequence Analysis
The process of consequence analysis is outlined in Figure A4, showing the methods used
in consequence modelling: calculation of liquid and gas release rate, modelling of LNG
pool spread and evaporation, fires and explosion with respect to particular leak sizes.
Figure 5 Layout for consequence analysis
(a) Leak Rate
Leak hole size as well as system conditions are used as the parameters to calculate the
leak rate (kg/s) of the fluid. For liquid leak model, the initial leak rate of LNG is
calculated based on the classical work of Bernoulli’s equation. For gas leak model, the
mass rate for sonic or subsonic discharges from a leak hole is calculated by means of the
continuity equation and the law of ideal gases for an isentropic expansion. For both
models, the discharge coefficient is set to 0.61 for default [20-22].
(b) LNG Spread/Evaporation
9
The Software adopts the pool spread model by Briscoe and Shaw [23] in conjunction with
vaporization models of either 1-D conduction model of Carslaw and Jaeger [24] based on
Fourier’s law or film boiling model of Klimenko [25] based on Newton’s law of cooling.
For the present study, film boiling model was applied. Heat transfer by convection from
ambient air or radiation is not included in this model, as this is assumed to be negligibly
small.
(c) Jet Fire Model
The software calculates the length of jet fires using several semi-empirical models: Cook
model [26], Mannan model [27] and Spouge model [28], all of which are based on the
fact that the characteristics and impact of jet fires depend on the fuel composition, release
conditions and release rate. Present study adopted Cook model to estimate the impact of
jet fire. In addition, the jet fire radius at each length point is calculated with API RP 521
flare model [27]. The emissive power of a jet fire ranges from 50 to 220kW/m2 and the
impact of fire radiation can be assumed to be critical on any personnel working within the
predicted length of the fire [29].
(d) Flash Fire (Dispersion Model)
In order to estimate flash fire ranges, the software adopts Gaussian gas dispersion models
by predicting dispersion effect and the gas concentration [30]. Regarding the selection of
coefficients applying to the dispersion models, two different methods - Briggs
coefficients [31] or Van Buijtenen coefficients [32] – can be applied in this Software. For
the current study, Briggs coefficients model was applied.
(e) Explosion Model
The software functions with three simplified empirical models (TNT equivalence model
[33], TNO multi-energy [33-34] and Baker-Strehlow-Tang (BST) models [33][35]) to
assess the magnitude of overpressure caused by explosion. TNT equivalence model uses
empirical explosion efficiency having a range of 0.01 to 0.1 while TNO multi-energy
model has various TNO numbers from 1 to 10 and BST numbers are set up with range
between 0.037 and 5.2 [33][36]. All these parameters can be selected by the user. The
present study adopted TNO model with TNO 7 which is widely acknowledged model for
investigating LNG explosion [33].
(f) Pool Fire Model
The average visible plume length in relation to the diameter of a fire is estimated by
means of the flame model derived by Thomas [37]. In addition, for calculating the mass
burning rate, it adopts the correlation of Nedelka [38] or uses the mean value of 0.14
kg/m2s [33] as default.
The radiation effect on personnel for a tilted flame by wind effect is estimated together
with the view factors for vertical and horizontal receiving surfaces given by Hoftijzer [39]
and Ramiro and Aisa [32].
10
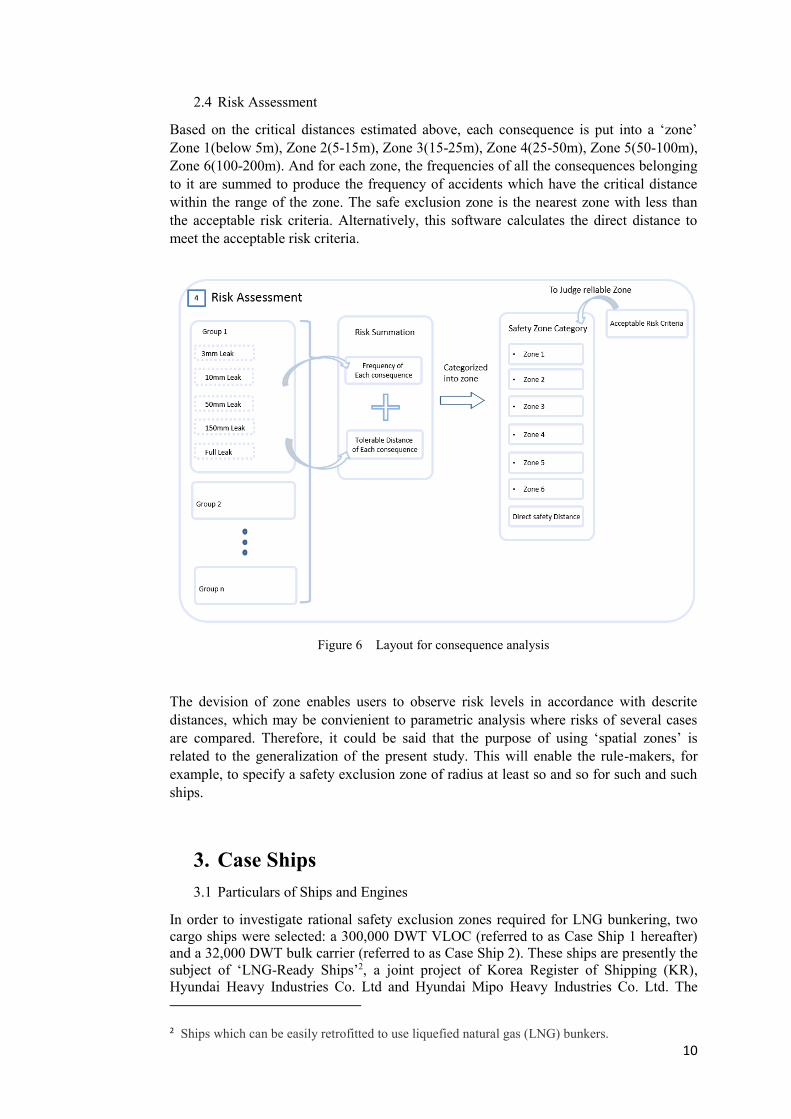
2.4 Risk Assessment
Based on the critical distances estimated above, each consequence is put into a ‘zone’
Zone 1(below 5m), Zone 2(5-15m), Zone 3(15-25m), Zone 4(25-50m), Zone 5(50-100m),
Zone 6(100-200m). And for each zone, the frequencies of all the consequences belonging
to it are summed to produce the frequency of accidents which have the critical distance
within the range of the zone. The safe exclusion zone is the nearest zone with less than
the acceptable risk criteria. Alternatively, this software calculates the direct distance to
meet the acceptable risk criteria.
Figure 6 Layout for consequence analysis
The devision of zone enables users to observe risk levels in accordance with descrite
distances, which may be convienient to parametric analysis where risks of several cases
are compared. Therefore, it could be said that the purpose of using ‘spatial zones’ is
related to the generalization of the present study. This will enable the rule-makers, for
example, to specify a safety exclusion zone of radius at least so and so for such and such
ships.
3. Case Ships
3.1 Particulars of Ships and Engines
In order to investigate rational safety exclusion zones required for LNG bunkering, two
cargo ships were selected: a 300,000 DWT VLOC (referred to as Case Ship 1 hereafter)
and a 32,000 DWT bulk carrier (referred to as Case Ship 2). These ships are presently the
subject of ‘LNG-Ready Ships’2, a joint project of Korea Register of Shipping (KR),
Hyundai Heavy Industries Co. Ltd and Hyundai Mipo Heavy Industries Co. Ltd. The
2 Ships which can be easily retrofitted to use liquefied natural gas (LNG) bunkers.
11
main engines were modified to dual fuel and the LNG fuel system was designed in
accordance with the IGF Code, class rules and other relevant guidelines in cooperation
with KR. Table 1 summarizes general specifications and operational profiles of the case
ships.
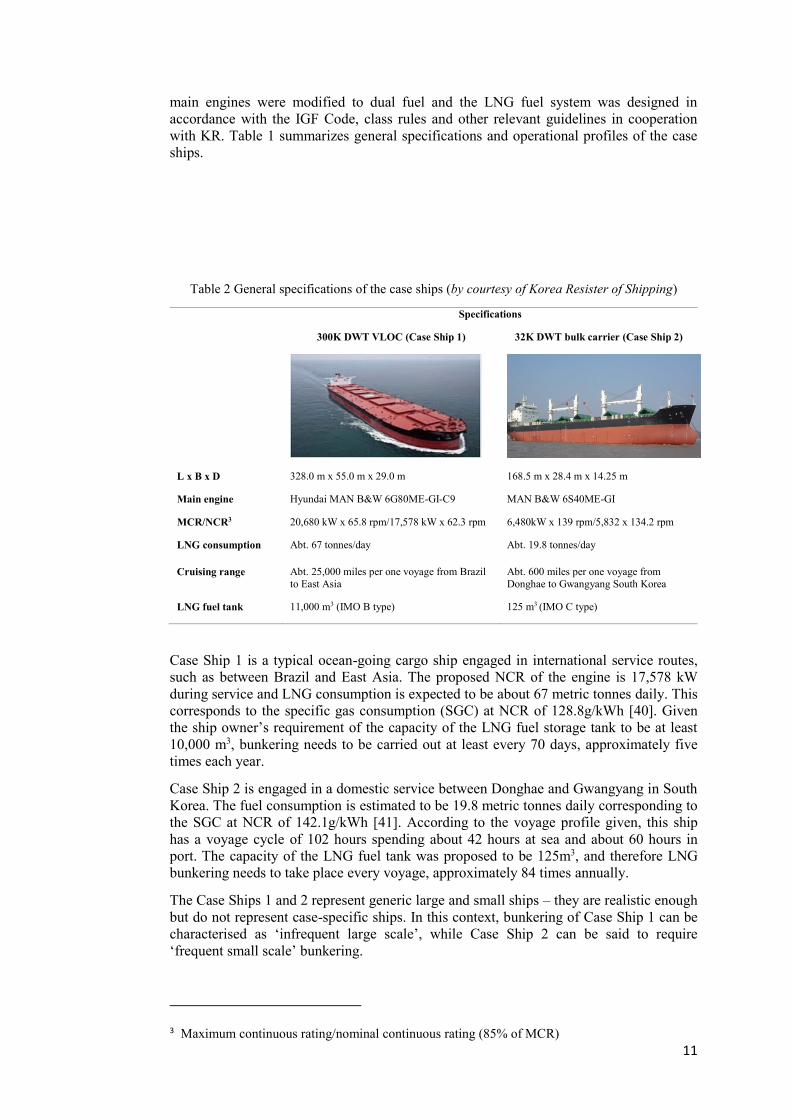
Table 2 General specifications of the case ships (by courtesy of Korea Resister of Shipping)
Specifications
300K DWT VLOC (Case Ship 1) 32K DWT bulk carrier (Case Ship 2)
L x B x D 328.0 m x 55.0 m x 29.0 m 168.5 m x 28.4 m x 14.25 m
Main engine Hyundai MAN B&W 6G80ME-GI-C9 MAN B&W 6S40ME-GI
MCR/NCR3 20,680 kW x 65.8 rpm/17,578 kW x 62.3 rpm 6,480kW x 139 rpm/5,832 x 134.2 rpm
LNG consumption Abt. 67 tonnes/day Abt. 19.8 tonnes/day
Cruising range Abt. 25,000 miles per one voyage from Brazil
to East Asia
Abt. 600 miles per one voyage from
Donghae to Gwangyang South Korea
LNG fuel tank 11,000 m3 (IMO B type) 125 m3 (IMO C type)
Case Ship 1 is a typical ocean-going cargo ship engaged in international service routes,
such as between Brazil and East Asia. The proposed NCR of the engine is 17,578 kW
during service and LNG consumption is expected to be about 67 metric tonnes daily. This
corresponds to the specific gas consumption (SGC) at NCR of 128.8g/kWh [40]. Given
the ship owner’s requirement of the capacity of the LNG fuel storage tank to be at least
10,000 m3, bunkering needs to be carried out at least every 70 days, approximately five
times each year.
Case Ship 2 is engaged in a domestic service between Donghae and Gwangyang in South
Korea. The fuel consumption is estimated to be 19.8 metric tonnes daily corresponding to
the SGC at NCR of 142.1g/kWh [41]. According to the voyage profile given, this ship
has a voyage cycle of 102 hours spending about 42 hours at sea and about 60 hours in
port. The capacity of the LNG fuel tank was proposed to be 125m3, and therefore LNG
bunkering needs to take place every voyage, approximately 84 times annually.
The Case Ships 1 and 2 represent generic large and small ships – they are realistic enough
but do not represent case-specific ships. In this context, bunkering of Case Ship 1 can be
characterised as ‘infrequent large scale’, while Case Ship 2 can be said to require
‘frequent small scale’ bunkering.
3 Maximum continuous rating/nominal continuous rating (85% of MCR)
12
3.2 Fuel System Design
The basic features of the LNG fuel systems and LNG bunkering systems were designed
in accordance with the engine maker’s specifications and the operational profile of the
case ships.
(a) Case Ship 1
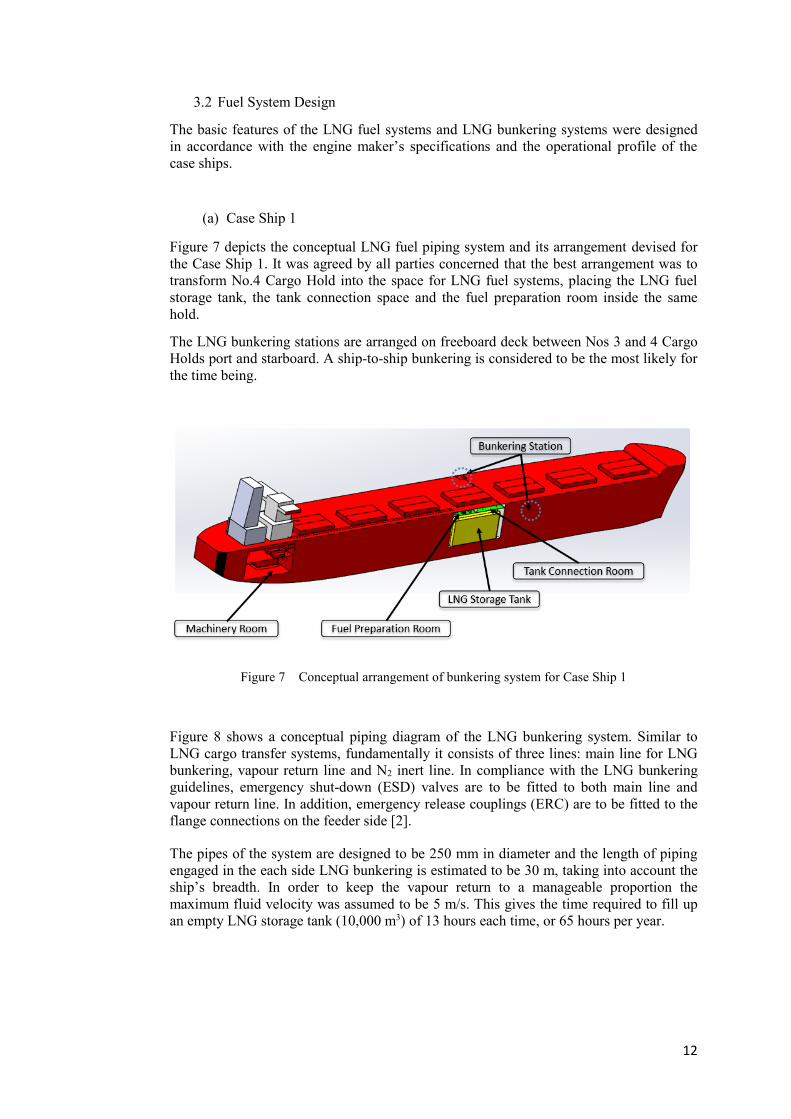
Figure 7 depicts the conceptual LNG fuel piping system and its arrangement devised for
the Case Ship 1. It was agreed by all parties concerned that the best arrangement was to
transform No.4 Cargo Hold into the space for LNG fuel systems, placing the LNG fuel
storage tank, the tank connection space and the fuel preparation room inside the same
hold.
The LNG bunkering stations are arranged on freeboard deck between Nos 3 and 4 Cargo
Holds port and starboard. A ship-to-ship bunkering is considered to be the most likely for
the time being.
Figure 7 Conceptual arrangement of bunkering system for Case Ship 1
Figure 8 shows a conceptual piping diagram of the LNG bunkering system. Similar to
LNG cargo transfer systems, fundamentally it consists of three lines: main line for LNG
bunkering, vapour return line and N2 inert line. In compliance with the LNG bunkering
guidelines, emergency shut-down (ESD) valves are to be fitted to both main line and
vapour return line. In addition, emergency release couplings (ERC) are to be fitted to the
flange connections on the feeder side [2].
The pipes of the system are designed to be 250 mm in diameter and the length of piping
engaged in the each side LNG bunkering is estimated to be 30 m, taking into account the
ship’s breadth. In order to keep the vapour return to a manageable proportion the
maximum fluid velocity was assumed to be 5 m/s. This gives the time required to fill up
an empty LNG storage tank (10,000 m3) of 13 hours each time, or 65 hours per year.
13
Figure 8 Conceptual design of bunkering system for Case Ship 1
(b) Case Ship 2
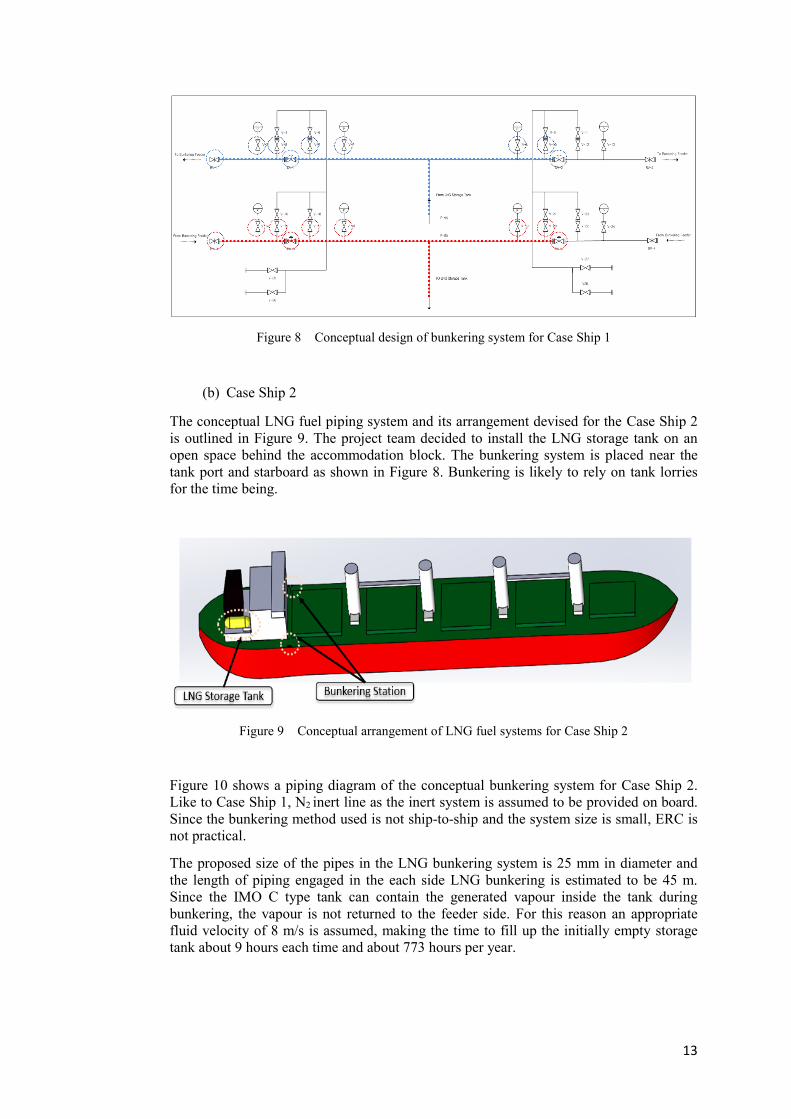
The conceptual LNG fuel piping system and its arrangement devised for the Case Ship 2
is outlined in Figure 9. The project team decided to install the LNG storage tank on an
open space behind the accommodation block. The bunkering system is placed near the
tank port and starboard as shown in Figure 8. Bunkering is likely to rely on tank lorries
for the time being.
Figure 9 Conceptual arrangement of LNG fuel systems for Case Ship 2
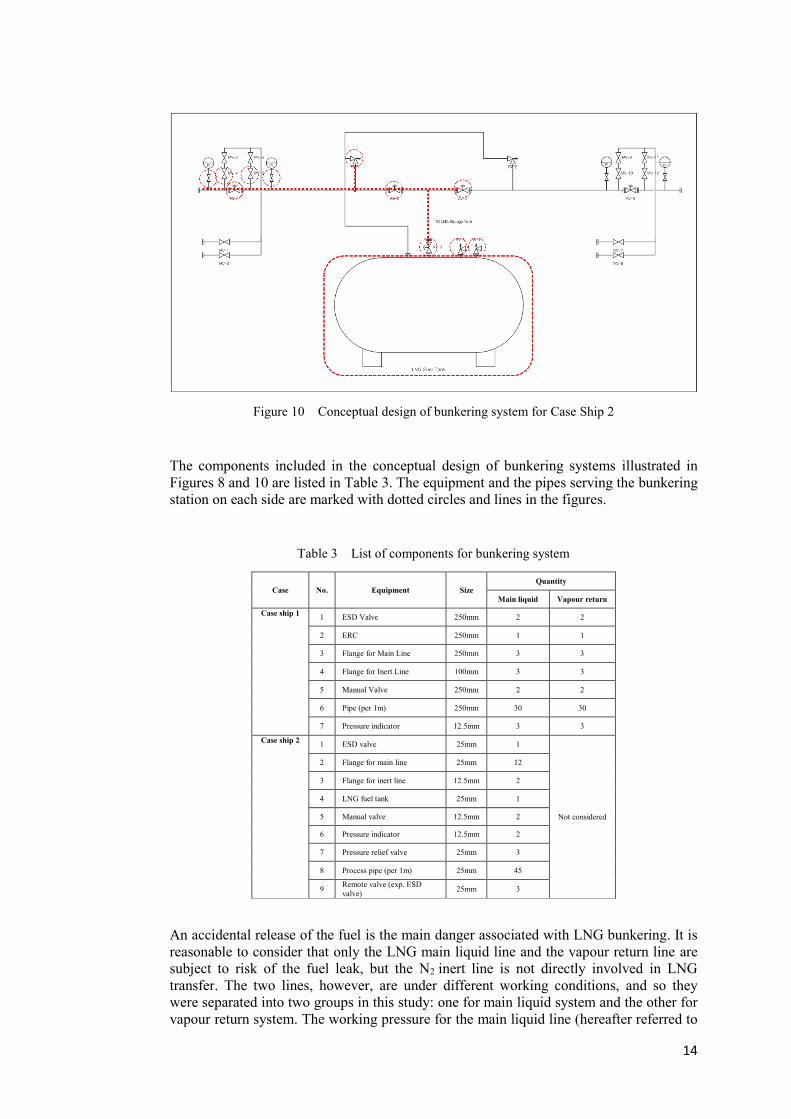
Figure 10 shows a piping diagram of the conceptual bunkering system for Case Ship 2.
Like to Case Ship 1, N2 inert line as the inert system is assumed to be provided on board.
Since the bunkering method used is not ship-to-ship and the system size is small, ERC is
not practical.
The proposed size of the pipes in the LNG bunkering system is 25 mm in diameter and
the length of piping engaged in the each side LNG bunkering is estimated to be 45 m.
Since the IMO C type tank can contain the generated vapour inside the tank during
bunkering, the vapour is not returned to the feeder side. For this reason an appropriate
fluid velocity of 8 m/s is assumed, making the time to fill up the initially empty storage
tank about 9 hours each time and about 773 hours per year.
14
Figure 10 Conceptual design of bunkering system for Case Ship 2
The components included in the conceptual design of bunkering systems illustrated in
Figures 8 and 10 are listed in Table 3. The equipment and the pipes serving the bunkering
station on each side are marked with dotted circles and lines in the figures.
Table 3 List of components for bunkering system
Case No. Equipment Size Quantity
Main liquid Vapour return
Case ship 1 1 ESD Valve 250mm 2 2
2 ERC 250mm 1 1
3 Flange for Main Line 250mm 3 3
4 Flange for Inert Line 100mm 3 3
5 Manual Valve 250mm 2 2
6 Pipe (per 1m) 250mm 30 30
7 Pressure indicator 12.5mm 3 3
Case ship 2 1 ESD valve 25mm 1
Not considered
2 Flange for main line 25mm 12
3 Flange for inert line 12.5mm 2
4 LNG fuel tank 25mm 1
5 Manual valve 12.5mm 2
6 Pressure indicator 12.5mm 2
7 Pressure relief valve 25mm 3
8 Process pipe (per 1m) 25mm 45
9 Remote valve (exp. ESD
valve) 25mm 3
An accidental release of the fuel is the main danger associated with LNG bunkering. It is
reasonable to consider that only the LNG main liquid line and the vapour return line are
subject to risk of the fuel leak, but the N2 inert line is not directly involved in LNG
transfer. The two lines, however, are under different working conditions, and so they
were separated into two groups in this study: one for main liquid system and the other for
vapour return system. The working pressure for the main liquid line (hereafter referred to

15
as Group 1) was assumed to be 3 bar(g) while that of the vapour return (hereafter referred
to as Group 2) to be 1 bar(g) for both case ships. The working temperature of LNG
flowing through the main line was assumed to be 112K whereas that of the vapour return
was set to be 123K [3]. It is reiterated here that Case Ship 2 does not require a vapour
return line.
4. Risk Analysis
4.1 Frequency Analysis
Figure 11 illustrates the calculated results. For Case Ship 1, Groups 1 and 2 are identical
and consequently the initial fuel leak frequency is also the same. On the other hand, Case
Ship 2 appears to have a higher leak frequency compared to Case Ship 1 due to the higher
frequency of bunkering. It also shows that the occurrence of small leakage holes is more
frequent than larger ones in both cases.
Figure 11 Leak frequency of proposed LNG bunkering system
A ‘late isolated leak’ scenario was defined as an isolation action not taken immediately
(with probability of 0.1) [15]. In this study the maximum time to recognise and isolate the
leak ‘immediately’ is 10 seconds, and thus a ‘limited leak’ with less than 10 seconds
duration was assumed not to constitute an ‘accident’. DNVGL [20], for example uses 30
seconds to define limited leaks, and therefore the 10 seconds criterion used in this study is
much shorter than that.
Safety measures are provided to ensure that, as long as they work effectively, all target
accidents can be either prevented or contained with no serious consequence. For LNG
bunkering in an open space, watch-keeping is the only practical safety measure that can
be provided (since gas detectors will be ineffectual in such circumstances), and therefore
the scenario of ‘limited fuel leak’ represents the situation in which the watch-keeper takes
an appropriate action immediately to stop the leak. This means that we could assume that
90% of initial liquid fuel leak does not lead to an ‘accident’ as the leak can be contained
to a ‘limited leak’ which was supposed to pose no danger.
According to IGF Code, Classification rules, ISO standards and other guidelines
associated with LNG bunkering, ventilation in open space is ‘natural’ and not mechanical.
Therefore, there is no probability of the ventilation failing. In this particular instance,
given the fact that on-board LNG bunkering stations are situated in the open deck, namely
the freeboard deck, albeit with some structures in the vicinity, we are indeed dealing with
open spaces.
Surrounding condition, whether congested or open, is another important factor as it
determines types of final accidents: fire or explosion. The usual structures near on-board
bunkering stations include hatch coamings and covers, other pipes, cranes and so on with
16
large variations between ships. However it is generally reasonable to consider that the
surrounding conditions are closer to ‘open’ than ‘congested’. After some discussion with
ship designers and a classification society (Korean Register of Shipping), it was advised
that 20% of occupancy ratio appears reasonable. In addition, it was decided to investigate
how much this factor affects the final outcome. 10% and 50% in addition to the 20% were
used in a sensitivity analysis.
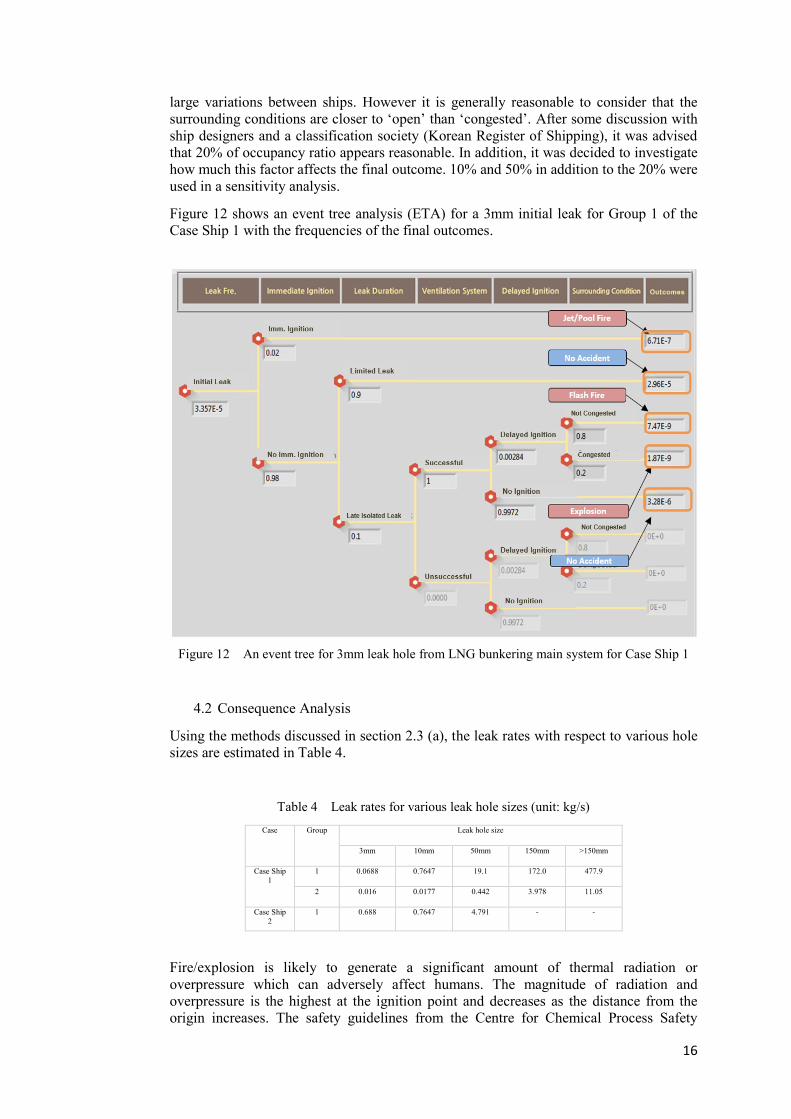
Figure 12 shows an event tree analysis (ETA) for a 3mm initial leak for Group 1 of the
Case Ship 1 with the frequencies of the final outcomes.
Figure 12 An event tree for 3mm leak hole from LNG bunkering main system for Case Ship 1
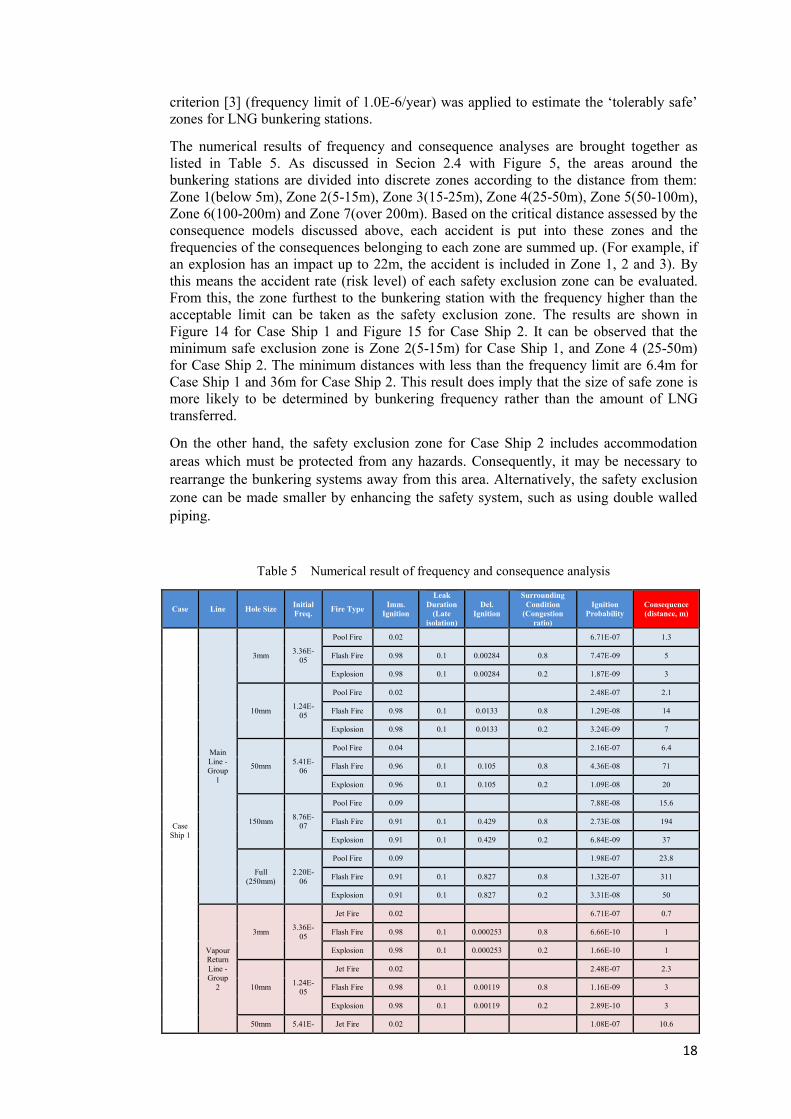
4.2 Consequence Analysis
Using the methods discussed in section 2.3 (a), the leak rates with respect to various hole
sizes are estimated in Table 4.
Table 4 Leak rates for various leak hole sizes (unit: kg/s)
Case Group Leak hole size
3mm 10mm 50mm 150mm >150mm
Case Ship
1
1 0.0688 0.7647 19.1 172.0 477.9
2 0.016 0.0177 0.442 3.978 11.05
Case Ship
2
1 0.688 0.7647 4.791 - -
Fire/explosion is likely to generate a significant amount of thermal radiation or
overpressure which can adversely affect humans. The magnitude of radiation and
overpressure is the highest at the ignition point and decreases as the distance from the
origin increases. The safety guidelines from the Centre for Chemical Process Safety

17
(CCPS) [42] define critical thermal radiation at 37.5 kW/m2 and critical overpressure at 1
bar(g), representing values exposure to which causes 100% fatality to a person. Based on
this, the case study analyses critical distances using the safety parameters of radiation and
overpressure. In addition, the length of jet fire and Lower Flammable Level (LFL) of
methane (5% by volume) is considered to be the critical distance for the jet fire and flash
fire respectively. For producing a generic understanding, a neutral weather condition with
a wind speed of 5 m/s is assumed [3]. Less than 100% fatality does not imply absolute
safety. This point is discussed later in this paper.
An example of critical distance of each consequence with respect to each representative
leak hole size is featured in Figure 13. These results confirm that the impact of
consequences has a direct correlation with leak rate of the fuel, and that the critical
distance determined purely by the impact of accidents is, not surprisingly, much more
extensive for a large scale LNG bunkering operation than a smaller one.
Figure 13 Example of critical distance for Group 1 for Case Ship 1
4.3 Risk Assessment
Risk is defined as the product of the probability of occurrence of an accident and its
consequence which is usually expressed in terms of lives lost and injuries caused or
financial losses suffered. However, the current case is independent of demographical
conditions, and another relevant factor has to be found for establishing the safety
exclusion zone. In this study it was decided to use the risk acceptance criteria (acceptable
accident rate) for this purpose. Since presently there is no agreed probabilistic risk criteria
available for LNG bunkering, as a purpose of observing severe condition, the Dutch risk
18
criterion [3] (frequency limit of 1.0E-6/year) was applied to estimate the ‘tolerably safe’
zones for LNG bunkering stations.
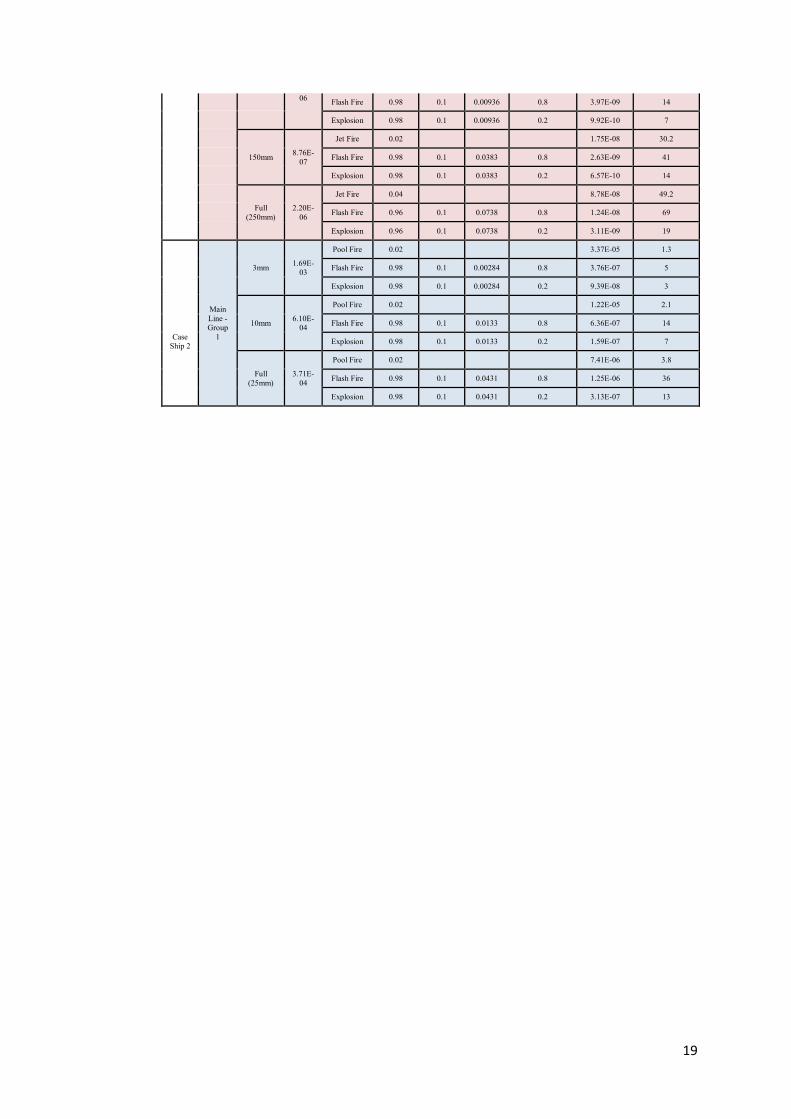
The numerical results of frequency and consequence analyses are brought together as
listed in Table 5. As discussed in Secion 2.4 with Figure 5, the areas around the
bunkering stations are divided into discrete zones according to the distance from them:
Zone 1(below 5m), Zone 2(5-15m), Zone 3(15-25m), Zone 4(25-50m), Zone 5(50-100m),
Zone 6(100-200m) and Zone 7(over 200m). Based on the critical distance assessed by the
consequence models discussed above, each accident is put into these zones and the
frequencies of the consequences belonging to each zone are summed up. (For example, if
an explosion has an impact up to 22m, the accident is included in Zone 1, 2 and 3). By
this means the accident rate (risk level) of each safety exclusion zone can be evaluated.
From this, the zone furthest to the bunkering station with the frequency higher than the
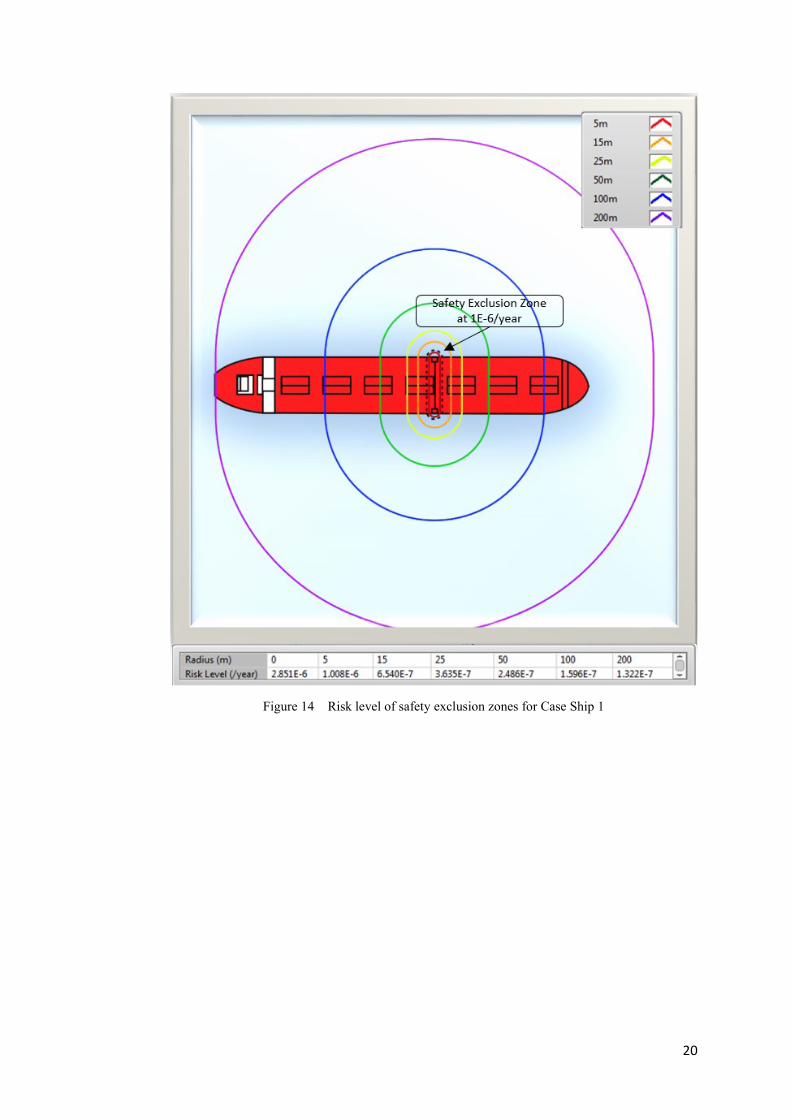
acceptable limit can be taken as the safety exclusion zone. The results are shown in
Figure 14 for Case Ship 1 and Figure 15 for Case Ship 2. It can be observed that the
minimum safe exclusion zone is Zone 2(5-15m) for Case Ship 1, and Zone 4 (25-50m)
for Case Ship 2. The minimum distances with less than the frequency limit are 6.4m for
Case Ship 1 and 36m for Case Ship 2. This result does imply that the size of safe zone is
more likely to be determined by bunkering frequency rather than the amount of LNG
transferred.
On the other hand, the safety exclusion zone for Case Ship 2 includes accommodation
areas which must be protected from any hazards. Consequently, it may be necessary to
rearrange the bunkering systems away from this area. Alternatively, the safety exclusion
zone can be made smaller by enhancing the safety system, such as using double walled
piping.
Table 5 Numerical result of frequency and consequence analysis
Case Line Hole Size Initial
Freq. Fire Type
Imm.
Ignition
Leak
Duration
(Late
isolation)
Del.
Ignition
Surrounding
Condition
(Congestion
ratio)
Ignition
Probability
Consequence
(distance, m)
Case
Ship 1
Main
Line -
Group
1
3mm 3.36E-
05
Pool Fire 0.02
6.71E-07 1.3
Flash Fire 0.98 0.1 0.00284 0.8 7.47E-09 5
Explosion 0.98 0.1 0.00284 0.2 1.87E-09 3
10mm 1.24E-
05
Pool Fire 0.02
2.48E-07 2.1
Flash Fire 0.98 0.1 0.0133 0.8 1.29E-08 14
Explosion 0.98 0.1 0.0133 0.2 3.24E-09 7
50mm 5.41E-
06
Pool Fire 0.04
2.16E-07 6.4
Flash Fire 0.96 0.1 0.105 0.8 4.36E-08 71
Explosion 0.96 0.1 0.105 0.2 1.09E-08 20
150mm 8.76E-
07
Pool Fire 0.09
7.88E-08 15.6
Flash Fire 0.91 0.1 0.429 0.8 2.73E-08 194
Explosion 0.91 0.1 0.429 0.2 6.84E-09 37
Full
(250mm)
2.20E-
06
Pool Fire 0.09
1.98E-07 23.8
Flash Fire 0.91 0.1 0.827 0.8 1.32E-07 311
Explosion 0.91 0.1 0.827 0.2 3.31E-08 50
Vapour
Return
Line -
Group
2
3mm 3.36E-
05
Jet Fire 0.02
6.71E-07 0.7
Flash Fire 0.98 0.1 0.000253 0.8 6.66E-10 1
Explosion 0.98 0.1 0.000253 0.2 1.66E-10 1
10mm 1.24E-
05
Jet Fire 0.02
2.48E-07 2.3
Flash Fire 0.98 0.1 0.00119 0.8 1.16E-09 3
Explosion 0.98 0.1 0.00119 0.2 2.89E-10 3
50mm 5.41E- Jet Fire 0.02
1.08E-07 10.6
19
06 Flash Fire 0.98 0.1 0.00936 0.8 3.97E-09 14
Explosion 0.98 0.1 0.00936 0.2 9.92E-10 7
150mm 8.76E-
07
Jet Fire 0.02
1.75E-08 30.2
Flash Fire 0.98 0.1 0.0383 0.8 2.63E-09 41
Explosion 0.98 0.1 0.0383 0.2 6.57E-10 14
Full
(250mm)
2.20E-
06
Jet Fire 0.04
8.78E-08 49.2
Flash Fire 0.96 0.1 0.0738 0.8 1.24E-08 69
Explosion 0.96 0.1 0.0738 0.2 3.11E-09 19
Case
Ship 2
Main
Line -
Group
1
3mm 1.69E-
03
Pool Fire 0.02
3.37E-05 1.3
Flash Fire 0.98 0.1 0.00284 0.8 3.76E-07 5
Explosion 0.98 0.1 0.00284 0.2 9.39E-08 3
10mm 6.10E-
04
Pool Fire 0.02
1.22E-05 2.1
Flash Fire 0.98 0.1 0.0133 0.8 6.36E-07 14
Explosion 0.98 0.1 0.0133 0.2 1.59E-07 7
Full
(25mm)
3.71E-
04
Pool Fire 0.02
7.41E-06 3.8
Flash Fire 0.98 0.1 0.0431 0.8 1.25E-06 36
Explosion 0.98 0.1 0.0431 0.2 3.13E-07 13
20
Figure 14 Risk level of safety exclusion zones for Case Ship 1

21
Figure 15 Risk level of safety exclusion zones for Case Ship 2
It was found from this study that the frequency of bunkering is one of the key factors in
determining the extent of safety exclusion zone.
In order to evaluate the critical distance for pool fire and explosion, the original study was
conducted based on the degree of radiation and overpressure corresponding to 100%
fatalities. However, there still may be dangers outside the minimum safety exclusion zone
with perhaps less than 100% fatality. For this reason two additional cases of 50% fatality
and 10% fatality were also investigated. For radiation, 12.5 kW/m2 and 5 kW/m2, and for
overpressure, 0.3 bar(g) and 0.1 bar(g) are used for 50% and 10% fatalities,
respectively.[42][43]
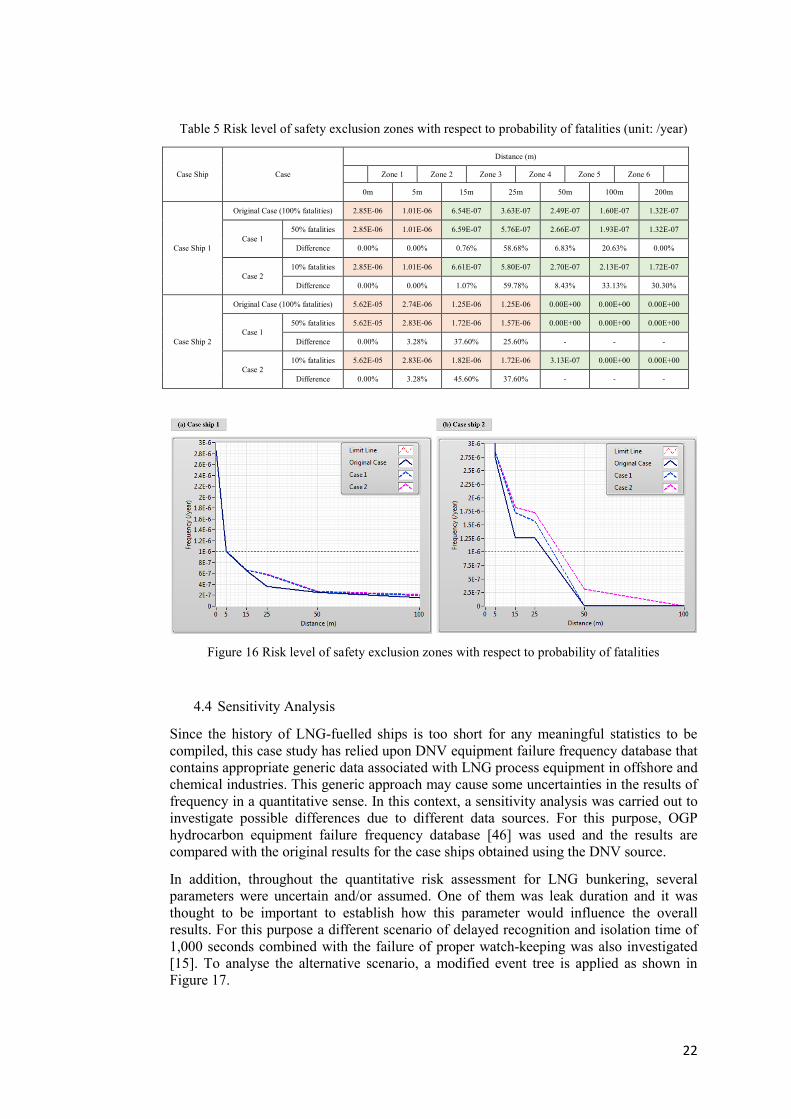
Table 5 and Figure 16 show the analysis result of alternative cases. The regions shaded
with red in Table 5 refer to the safety exclusion zones while the regions with green refer
to the acceptable zones. In Figure 16, the horizontal line represents the limit of accident
rate (1.0E-6/year) and the accident rates corresponding to each distance are drawn on the
figure. It is observed that the application of the lower probability of fatalities resulted in
the same safety exclusion zone despite slightly increased limits for both ships.
22
Table 5 Risk level of safety exclusion zones with respect to probability of fatalities (unit: /year)
Case Ship Case
Distance (m)
Zone 1 Zone 2 Zone 3 Zone 4 Zone 5 Zone 6
0m 5m 15m 25m 50m 100m 200m
Case Ship 1
Original Case (100% fatalities) 2.85E-06 1.01E-06 6.54E-07 3.63E-07 2.49E-07 1.60E-07 1.32E-07
Case 1
50% fatalities 2.85E-06 1.01E-06 6.59E-07 5.76E-07 2.66E-07 1.93E-07 1.32E-07
Difference 0.00% 0.00% 0.76% 58.68% 6.83% 20.63% 0.00%
Case 2
10% fatalities 2.85E-06 1.01E-06 6.61E-07 5.80E-07 2.70E-07 2.13E-07 1.72E-07
Difference 0.00% 0.00% 1.07% 59.78% 8.43% 33.13% 30.30%
Case Ship 2
Original Case (100% fatalities) 5.62E-05 2.74E-06 1.25E-06 1.25E-06 0.00E+00 0.00E+00 0.00E+00
Case 1
50% fatalities 5.62E-05 2.83E-06 1.72E-06 1.57E-06 0.00E+00 0.00E+00 0.00E+00
Difference 0.00% 3.28% 37.60% 25.60% - - -
Case 2
10% fatalities 5.62E-05 2.83E-06 1.82E-06 1.72E-06 3.13E-07 0.00E+00 0.00E+00
Difference 0.00% 3.28% 45.60% 37.60% - - -
Figure 16 Risk level of safety exclusion zones with respect to probability of fatalities
4.4 Sensitivity Analysis
Since the history of LNG-fuelled ships is too short for any meaningful statistics to be
compiled, this case study has relied upon DNV equipment failure frequency database that
contains appropriate generic data associated with LNG process equipment in offshore and
chemical industries. This generic approach may cause some uncertainties in the results of
frequency in a quantitative sense. In this context, a sensitivity analysis was carried out to
investigate possible differences due to different data sources. For this purpose, OGP
hydrocarbon equipment failure frequency database [46] was used and the results are
compared with the original results for the case ships obtained using the DNV source.
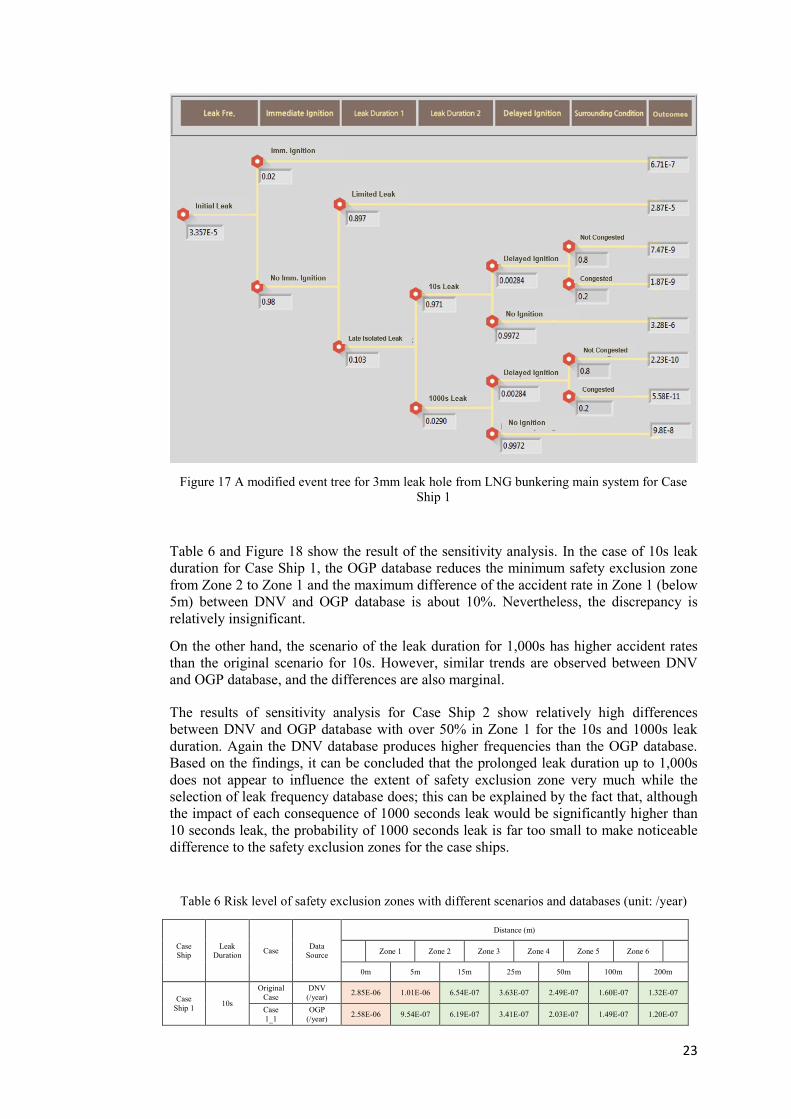
In addition, throughout the quantitative risk assessment for LNG bunkering, several
parameters were uncertain and/or assumed. One of them was leak duration and it was
thought to be important to establish how this parameter would influence the overall
results. For this purpose a different scenario of delayed recognition and isolation time of
1,000 seconds combined with the failure of proper watch-keeping was also investigated
[15]. To analyse the alternative scenario, a modified event tree is applied as shown in
Figure 17.
23
Figure 17 A modified event tree for 3mm leak hole from LNG bunkering main system for Case
Ship 1
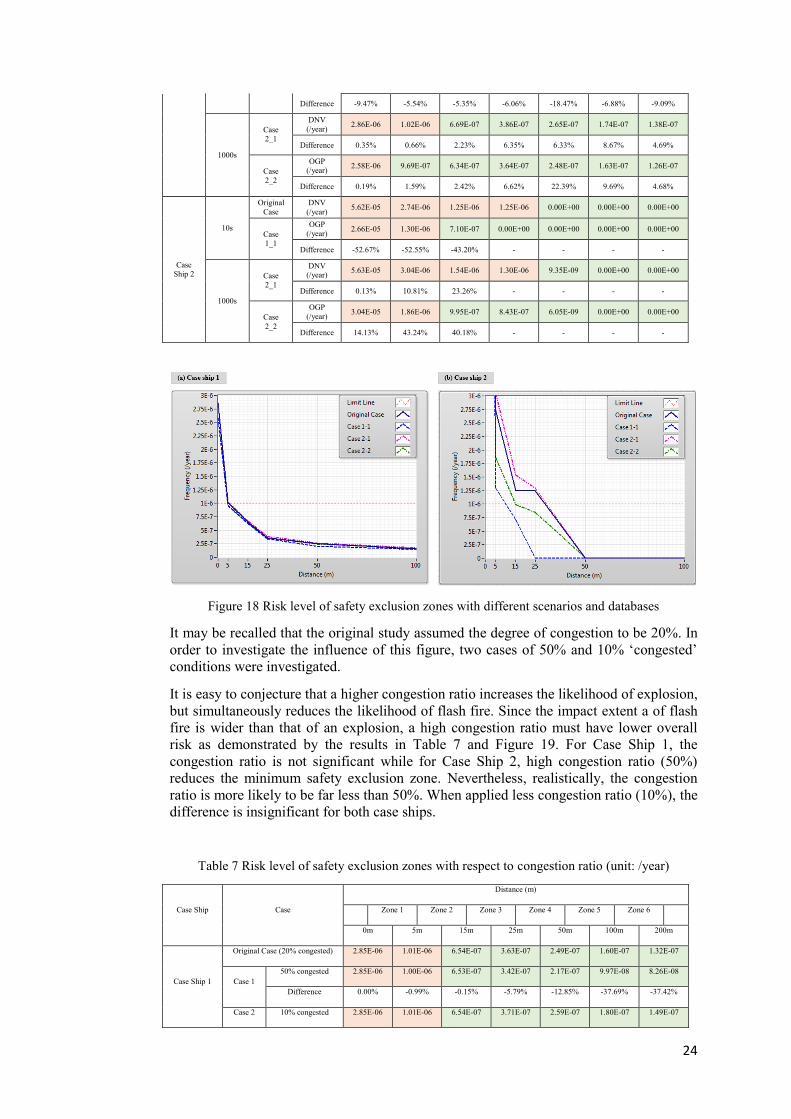
Table 6 and Figure 18 show the result of the sensitivity analysis. In the case of 10s leak
duration for Case Ship 1, the OGP database reduces the minimum safety exclusion zone
from Zone 2 to Zone 1 and the maximum difference of the accident rate in Zone 1 (below
5m) between DNV and OGP database is about 10%. Nevertheless, the discrepancy is
relatively insignificant.
On the other hand, the scenario of the leak duration for 1,000s has higher accident rates
than the original scenario for 10s. However, similar trends are observed between DNV
and OGP database, and the differences are also marginal.
The results of sensitivity analysis for Case Ship 2 show relatively high differences
between DNV and OGP database with over 50% in Zone 1 for the 10s and 1000s leak
duration. Again the DNV database produces higher frequencies than the OGP database.
Based on the findings, it can be concluded that the prolonged leak duration up to 1,000s
does not appear to influence the extent of safety exclusion zone very much while the
selection of leak frequency database does; this can be explained by the fact that, although
the impact of each consequence of 1000 seconds leak would be significantly higher than
10 seconds leak, the probability of 1000 seconds leak is far too small to make noticeable
difference to the safety exclusion zones for the case ships.
Table 6 Risk level of safety exclusion zones with different scenarios and databases (unit: /year)
Case
Ship
Leak
Duration Case
Data
Source
Distance (m)
Zone 1 Zone 2 Zone 3 Zone 4 Zone 5 Zone 6
0m 5m 15m 25m 50m 100m 200m
Case
Ship 1 10s
Original
Case
DNV
(/year) 2.85E-06 1.01E-06 6.54E-07 3.63E-07 2.49E-07 1.60E-07 1.32E-07
Case
1_1
OGP
(/year) 2.58E-06 9.54E-07 6.19E-07 3.41E-07 2.03E-07 1.49E-07 1.20E-07
24
Difference -9.47% -5.54% -5.35% -6.06% -18.47% -6.88% -9.09%
1000s
Case
2_1
DNV
(/year) 2.86E-06 1.02E-06 6.69E-07 3.86E-07 2.65E-07 1.74E-07 1.38E-07
Difference 0.35% 0.66% 2.23% 6.35% 6.33% 8.67% 4.69%
Case
2_2
OGP
(/year) 2.58E-06 9.69E-07 6.34E-07 3.64E-07 2.48E-07 1.63E-07 1.26E-07
Difference 0.19% 1.59% 2.42% 6.62% 22.39% 9.69% 4.68%
Case
Ship 2
10s
Original
Case
DNV
(/year) 5.62E-05 2.74E-06 1.25E-06 1.25E-06 0.00E+00 0.00E+00 0.00E+00
Case
1_1
OGP
(/year) 2.66E-05 1.30E-06 7.10E-07 0.00E+00 0.00E+00 0.00E+00 0.00E+00
Difference -52.67% -52.55% -43.20% - - - -
1000s
Case
2_1
DNV
(/year) 5.63E-05 3.04E-06 1.54E-06 1.30E-06 9.35E-09 0.00E+00 0.00E+00
Difference 0.13% 10.81% 23.26% - - - -
Case
2_2
OGP
(/year) 3.04E-05 1.86E-06 9.95E-07 8.43E-07 6.05E-09 0.00E+00 0.00E+00
Difference 14.13% 43.24% 40.18% - - - -
Figure 18 Risk level of safety exclusion zones with different scenarios and databases
It may be recalled that the original study assumed the degree of congestion to be 20%. In
order to investigate the influence of this figure, two cases of 50% and 10% ‘congested’
conditions were investigated.
It is easy to conjecture that a higher congestion ratio increases the likelihood of explosion,
but simultaneously reduces the likelihood of flash fire. Since the impact extent a of flash
fire is wider than that of an explosion, a high congestion ratio must have lower overall
risk as demonstrated by the results in Table 7 and Figure 19. For Case Ship 1, the
congestion ratio is not significant while for Case Ship 2, high congestion ratio (50%)
reduces the minimum safety exclusion zone. Nevertheless, realistically, the congestion
ratio is more likely to be far less than 50%. When applied less congestion ratio (10%), the
difference is insignificant for both case ships.
Table 7 Risk level of safety exclusion zones with respect to congestion ratio (unit: /year)
Case Ship Case
Distance (m)
Zone 1 Zone 2 Zone 3 Zone 4 Zone 5 Zone 6
0m 5m 15m 25m 50m 100m 200m
Case Ship 1
Original Case (20% congested) 2.85E-06 1.01E-06 6.54E-07 3.63E-07 2.49E-07 1.60E-07 1.32E-07
Case 1
50% congested 2.85E-06 1.00E-06 6.53E-07 3.42E-07 2.17E-07 9.97E-08 8.26E-08
Difference 0.00% -0.99% -0.15% -5.79% -12.85% -37.69% -37.42%
Case 2 10% congested 2.85E-06 1.01E-06 6.54E-07 3.71E-07 2.59E-07 1.80E-07 1.49E-07

25
Difference 0.00% 0.00% 0.00% 2.20% 4.02% 12.50% 12.88%
Case Ship 2
Original Case (20% congested) 5.62E-05 2.74E-06 1.25E-06 1.25E-06 0.00E+00 0.00E+00 0.00E+00
Case 1
50% congested 5.62E-05 2.60E-06 7.83E-07 7.83E-07 0.00E+00 0.00E+00 0.00E+00
Difference 0.00% -5.11% -37.36% -37.36% - - -
Case 2
10% congested 5.62E-05 2.78E-06 1.41E-06 1.41E-06 0.00E+00 0.00E+00 0.00E+00
Difference 0.00% 1.46% 12.80% 12.80% - - -
Figure 19 Risk level of safety exclusion zones with respect to congestion ratio
4.5 Parametric Analysis for Flow Rate
A flow rate is determined by the combination of the fluid velocity and the piping size.
Where the total amount of the fuel to be transferred is fixed, a higher transfer rate will
guarantee the reduction in the total time required for bunkering. Given bunkering time is
an important factor which affects the frequency of equipment failure leading to leak, a
study was undertaken to investigate how sensitive the safety exclusion zone is to varying
velocities and piping sizes.
a) Velocity
Based on the DNV Class guidelines [12], the velocity of LNG transfer should not exceed
10 m/s in order to prevent static electricity from being generated. Accordingly four cases
of differing velocities including the original one were compared: 3m/s, 5m/s 8m/s and
10m/s. The amount of LNG fuel to be shipped were kept the same as the original case
study, i.e. 10,000 m3 and 125 m3 for the Case Ships 1 and 2 respectively. The annual
bunkering time with respect to different velocity rates are summarized in Table 8 which
highlights significantly reduced annual bunkering times for higher velocities.
Table 8 Annual bunkering time for varying fluid velocity
Case
ship Parameter
Flow Rate
(m3/h)
Annual bunkering time
(hours)
Case
Ship 1
Case 1 (3m/s) 529.9 108
Original Case (5m/s) 883.1 65
Case 2 (8m/s) 1,413.0 41
Case 3 (10m/s) 1,766.3 32
Case
Ship 2
Case 1 (3m/s) 5.3 2,061
Case 2 (5m/s) 8.8 1,288
Original Case (8m/s) 14.1 773
Case 3 (10m/s) 17.7 687
26
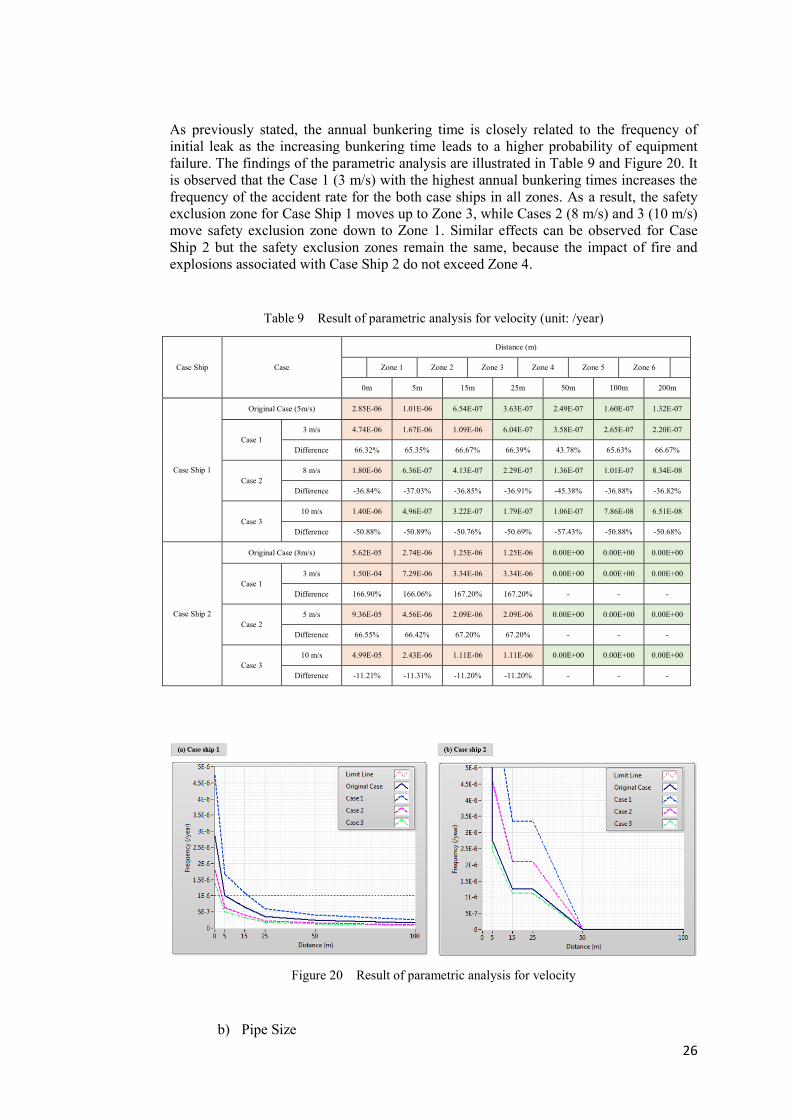
As previously stated, the annual bunkering time is closely related to the frequency of
initial leak as the increasing bunkering time leads to a higher probability of equipment
failure. The findings of the parametric analysis are illustrated in Table 9 and Figure 20. It
is observed that the Case 1 (3 m/s) with the highest annual bunkering times increases the
frequency of the accident rate for the both case ships in all zones. As a result, the safety
exclusion zone for Case Ship 1 moves up to Zone 3, while Cases 2 (8 m/s) and 3 (10 m/s)
move safety exclusion zone down to Zone 1. Similar effects can be observed for Case
Ship 2 but the safety exclusion zones remain the same, because the impact of fire and
explosions associated with Case Ship 2 do not exceed Zone 4.
Table 9 Result of parametric analysis for velocity (unit: /year)
Case Ship Case
Distance (m)
Zone 1 Zone 2 Zone 3 Zone 4 Zone 5 Zone 6
0m 5m 15m 25m 50m 100m 200m
Case Ship 1
Original Case (5m/s) 2.85E-06 1.01E-06 6.54E-07 3.63E-07 2.49E-07 1.60E-07 1.32E-07
Case 1
3 m/s 4.74E-06 1.67E-06 1.09E-06 6.04E-07 3.58E-07 2.65E-07 2.20E-07
Difference 66.32% 65.35% 66.67% 66.39% 43.78% 65.63% 66.67%
Case 2
8 m/s 1.80E-06 6.36E-07 4.13E-07 2.29E-07 1.36E-07 1.01E-07 8.34E-08
Difference -36.84% -37.03% -36.85% -36.91% -45.38% -36.88% -36.82%
Case 3
10 m/s 1.40E-06 4.96E-07 3.22E-07 1.79E-07 1.06E-07 7.86E-08 6.51E-08
Difference -50.88% -50.89% -50.76% -50.69% -57.43% -50.88% -50.68%
Case Ship 2
Original Case (8m/s) 5.62E-05 2.74E-06 1.25E-06 1.25E-06 0.00E+00 0.00E+00 0.00E+00
Case 1
3 m/s 1.50E-04 7.29E-06 3.34E-06 3.34E-06 0.00E+00 0.00E+00 0.00E+00
Difference 166.90% 166.06% 167.20% 167.20% - - -
Case 2
5 m/s 9.36E-05 4.56E-06 2.09E-06 2.09E-06 0.00E+00 0.00E+00 0.00E+00
Difference 66.55% 66.42% 67.20% 67.20% - - -
Case 3
10 m/s 4.99E-05 2.43E-06 1.11E-06 1.11E-06 0.00E+00 0.00E+00 0.00E+00
Difference -11.21% -11.31% -11.20% -11.20% - - -
Figure 20 Result of parametric analysis for velocity
b) Pipe Size
27
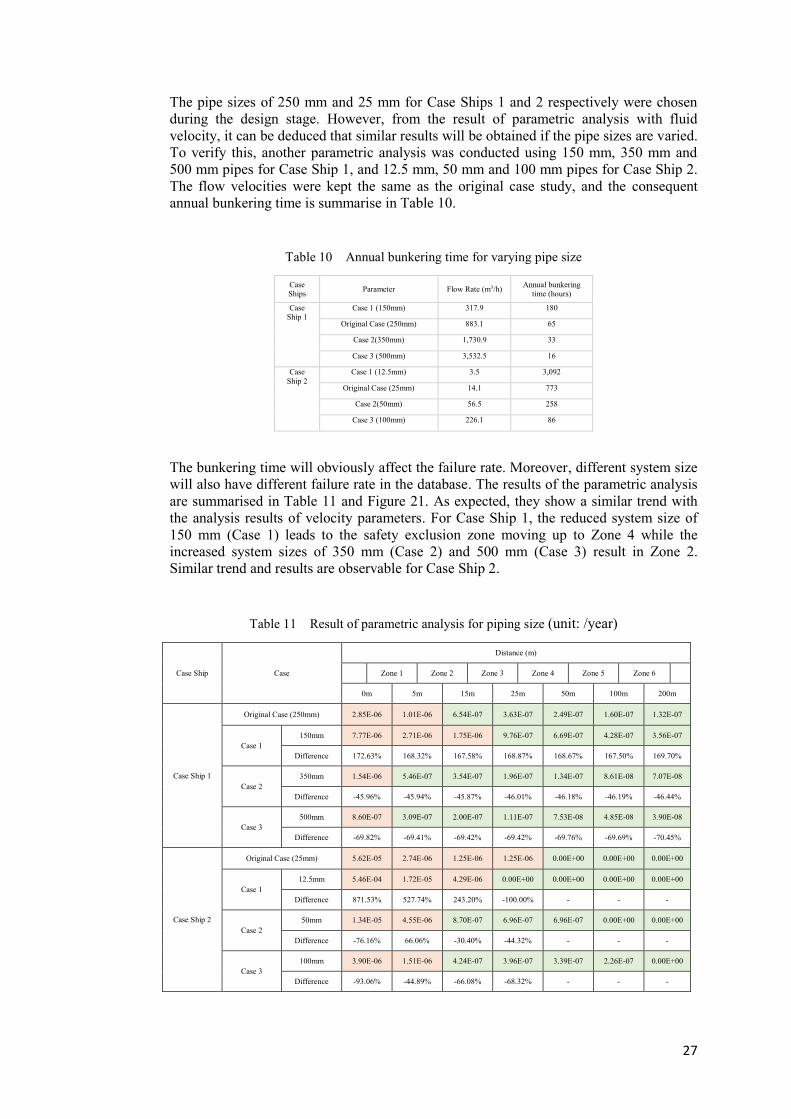
The pipe sizes of 250 mm and 25 mm for Case Ships 1 and 2 respectively were chosen
during the design stage. However, from the result of parametric analysis with fluid
velocity, it can be deduced that similar results will be obtained if the pipe sizes are varied.
To verify this, another parametric analysis was conducted using 150 mm, 350 mm and
500 mm pipes for Case Ship 1, and 12.5 mm, 50 mm and 100 mm pipes for Case Ship 2.
The flow velocities were kept the same as the original case study, and the consequent
annual bunkering time is summarise in Table 10.
Table 10 Annual bunkering time for varying pipe size
Case
Ships Parameter Flow Rate (m3/h)
Annual bunkering
time (hours)
Case
Ship 1
Case 1 (150mm) 317.9 180
Original Case (250mm) 883.1 65
Case 2(350mm) 1,730.9 33
Case 3 (500mm) 3,532.5 16
Case
Ship 2
Case 1 (12.5mm) 3.5 3,092
Original Case (25mm) 14.1 773
Case 2(50mm) 56.5 258
Case 3 (100mm) 226.1 86
The bunkering time will obviously affect the failure rate. Moreover, different system size
will also have different failure rate in the database. The results of the parametric analysis
are summarised in Table 11 and Figure 21. As expected, they show a similar trend with
the analysis results of velocity parameters. For Case Ship 1, the reduced system size of
150 mm (Case 1) leads to the safety exclusion zone moving up to Zone 4 while the
increased system sizes of 350 mm (Case 2) and 500 mm (Case 3) result in Zone 2.
Similar trend and results are observable for Case Ship 2.
Table 11 Result of parametric analysis for piping size (unit: /year)
Case Ship Case
Distance (m)
Zone 1 Zone 2 Zone 3 Zone 4 Zone 5 Zone 6
0m 5m 15m 25m 50m 100m 200m
Case Ship 1
Original Case (250mm) 2.85E-06 1.01E-06 6.54E-07 3.63E-07 2.49E-07 1.60E-07 1.32E-07
Case 1
150mm 7.77E-06 2.71E-06 1.75E-06 9.76E-07 6.69E-07 4.28E-07 3.56E-07
Difference 172.63% 168.32% 167.58% 168.87% 168.67% 167.50% 169.70%
Case 2
350mm 1.54E-06 5.46E-07 3.54E-07 1.96E-07 1.34E-07 8.61E-08 7.07E-08
Difference -45.96% -45.94% -45.87% -46.01% -46.18% -46.19% -46.44%
Case 3
500mm 8.60E-07 3.09E-07 2.00E-07 1.11E-07 7.53E-08 4.85E-08 3.90E-08
Difference -69.82% -69.41% -69.42% -69.42% -69.76% -69.69% -70.45%
Case Ship 2
Original Case (25mm) 5.62E-05 2.74E-06 1.25E-06 1.25E-06 0.00E+00 0.00E+00 0.00E+00
Case 1
12.5mm 5.46E-04 1.72E-05 4.29E-06 0.00E+00 0.00E+00 0.00E+00 0.00E+00
Difference 871.53% 527.74% 243.20% -100.00% - - -
Case 2
50mm 1.34E-05 4.55E-06 8.70E-07 6.96E-07 6.96E-07 0.00E+00 0.00E+00
Difference -76.16% 66.06% -30.40% -44.32% - - -
Case 3
100mm 3.90E-06 1.51E-06 4.24E-07 3.96E-07 3.39E-07 2.26E-07 0.00E+00
Difference -93.06% -44.89% -66.08% -68.32% - - -
28
Figure 21 Result of parametric analysis for system size
Since the case ships are constrained on a number of operating issues including voyage
profiles, it may be thought that some velocities and system sizes used for the parametric
analysis are unrealistic. Nevertheless, the findings of this parametric analysis with
varying flow rate helped conclude that bunkering frequency and time taken for the
bunkering operations are the key parameters in probabilistically determining the safety
exclusion zone. The result indicates that the most important parameter is the total
duration of the bunkering operations required. Larger pipes and higher fluid velocity
enables higher volumes to be transferred, thereby reducing the bunkering time required.
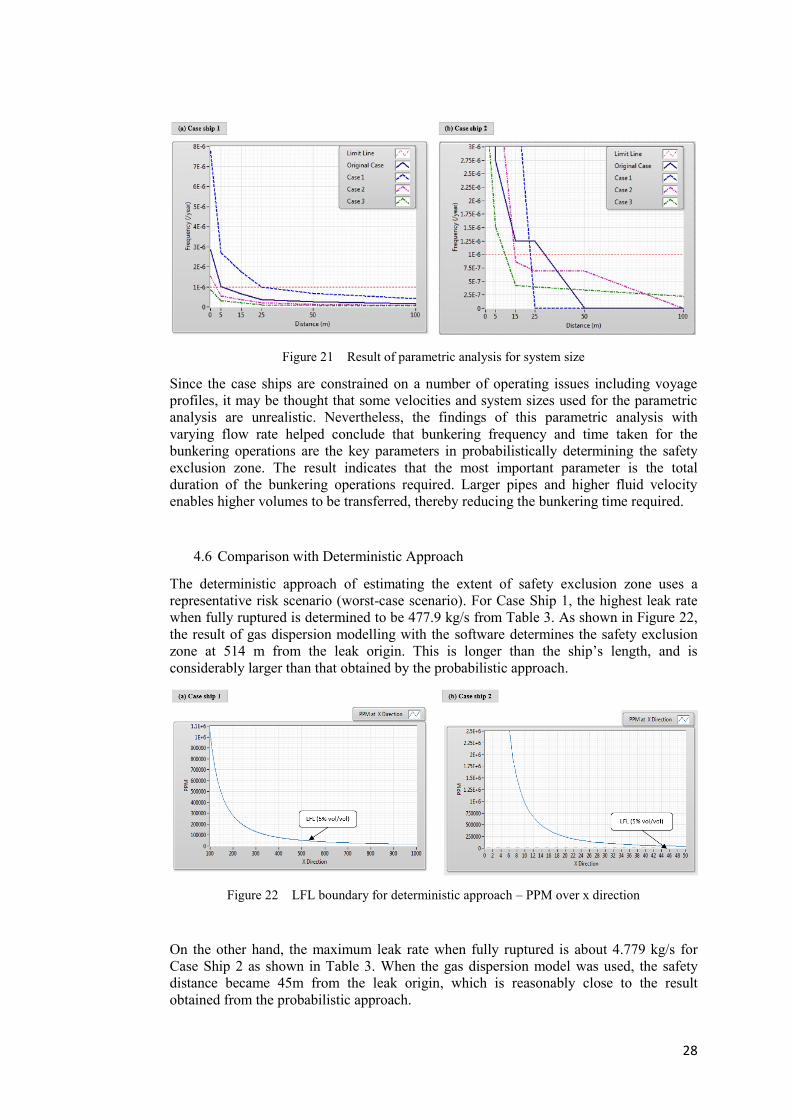
4.6 Comparison with Deterministic Approach
The deterministic approach of estimating the extent of safety exclusion zone uses a
representative risk scenario (worst-case scenario). For Case Ship 1, the highest leak rate
when fully ruptured is determined to be 477.9 kg/s from Table 3. As shown in Figure 22,
the result of gas dispersion modelling with the software determines the safety exclusion
zone at 514 m from the leak origin. This is longer than the ship’s length, and is
considerably larger than that obtained by the probabilistic approach.
Figure 22 LFL boundary for deterministic approach – PPM over x direction
On the other hand, the maximum leak rate when fully ruptured is about 4.779 kg/s for
Case Ship 2 as shown in Table 3. When the gas dispersion model was used, the safety
distance became 45m from the leak origin, which is reasonably close to the result
obtained from the probabilistic approach.
29
It is interesting to note that the Port of Gothenburg [44], which presently provides LNG
bunkering services, established safety exclusion zones depending on the ship type: 15m
for container ships and bulk carriers, 25m for other types of ships. In addition, an LNG
bunkering guideline [45] presented in Swedish Marine Technology Forum, the safety
exclusion zone was set up 10m for each side of bunkering station for a Ro-Pax vessel.
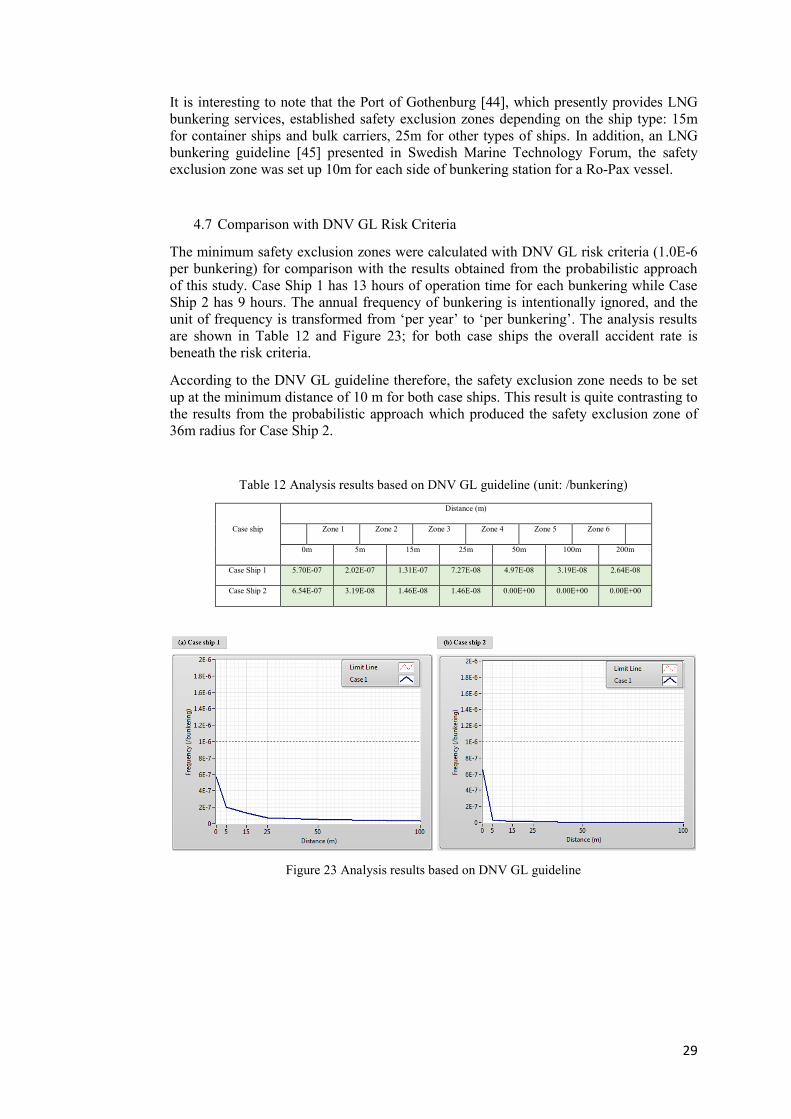
4.7 Comparison with DNV GL Risk Criteria
The minimum safety exclusion zones were calculated with DNV GL risk criteria (1.0E-6
per bunkering) for comparison with the results obtained from the probabilistic approach
of this study. Case Ship 1 has 13 hours of operation time for each bunkering while Case
Ship 2 has 9 hours. The annual frequency of bunkering is intentionally ignored, and the
unit of frequency is transformed from ‘per year’ to ‘per bunkering’. The analysis results
are shown in Table 12 and Figure 23; for both case ships the overall accident rate is
beneath the risk criteria.
According to the DNV GL guideline therefore, the safety exclusion zone needs to be set
up at the minimum distance of 10 m for both case ships. This result is quite contrasting to
the results from the probabilistic approach which produced the safety exclusion zone of
36m radius for Case Ship 2.
Table 12 Analysis results based on DNV GL guideline (unit: /bunkering)
Case ship
Distance (m)
Zone 1 Zone 2 Zone 3 Zone 4 Zone 5 Zone 6
0m 5m 15m 25m 50m 100m 200m
Case Ship 1 5.70E-07 2.02E-07 1.31E-07 7.27E-08 4.97E-08 3.19E-08 2.64E-08
Case Ship 2 6.54E-07 3.19E-08 1.46E-08 1.46E-08 0.00E+00 0.00E+00 0.00E+00
Figure 23 Analysis results based on DNV GL guideline

30
5 Discussion
The main purpose of this paper is to investigate the adequacy or otherwise of the safety
provisions contained in rules and regulations concerning the relatively new practices of
using LNG as a fuel for ships. As such, the investigation had to concentrate on typical
situations to improve our understanding of where the risk is in LNG bunkering and how
to minimise it so that the information generated can be used as a basis for future
improvement of rules and standards,
This meant that we were not dealing with specific ships, but rather typical ships.
Therefore, the so-called ‘state-of-the-art’ computational tools, such as CFD, is somewhat
unnecessary. On the other hand, it is accepted that the rules and standards may require
such tools to be used in establishing a safety exclusion zone while bunkering for each
ship. If that is the case, consequence analysis will need to use micro-scale
meteorological/geometrical models, since the impact of fires and explosion may be
affected by geometry or metrological conditions of sites.
Whilst it is accepted that the LNG leaks during bunkering can occur due to external
events, such as collision, excessive (relative) ship motions, extreme and unforeseen
weather conditions and human error, they do not help in formulating a generic safety
rules. That was why this study focussed on potential accidents associated with equipment
failure only. With more experience with LNG bunkering in the future, a more accurate
estimation of these factors may become possible in time, but at the present time there is
no data, primarily due to the brevity of LNG bunkering history.
An attempt was made to generate additional information and aid general understanding of
risks involved in LNG bunkering by carrying our rudimentary parametric analysis.
However, it may be necessary to do this in more detail using more extensive ranges of
parametric values.
6 Concluding Remarks
Using the IQRA Software, this study investigated the potential risk of LNG bunkering
and evaluated the extent of indicative safety exclusion zones for LNG bunkering station
for two contrasting case ships - one has low frequency but high consequence of risk while
the other has high frequency but low consequence of risk - based on the risk criteria of
1.0E-6 /year. The result of the study shows that the minimum safety exclusion zone is 6.4
m radius, or Zone 2 for Case Ship 1 (high consequence) while 36m radius or Zone 4 for
Case Ship 2 (high frequency).
This is opposite to what our common sense tells us, as it is, on the face of it, entirely
credible to think that a large scale LNG bunkering (high consequence of risk) needs to
have a more extensive safety exclusion zone, compared to small scale LNG bunkering
(low consequence of risk). However, the result of this study clearly indicates that
bunkering frequency and the total time taken for bunkering operations in a year are the
key parameters in determining the risk level of LNG bunkering, while consequence less
important. Larger pipes and higher fluid velocity enables higher volumes to be transferred,
thereby reducing the bunkering time required.
31
It is thought that there may be a case for making the relevant rules and regulations more
explicit and more stringent. However, as shown through sensitivity and parametric
analysis, the overall results of risk assessment for LNG bunkering is influenced by some
degree by parameters used in the analysis. It can be concluded, therefore, that the problem
requires more extensive studies and discussion to draw a consensus on the standard
database and scenarios to be used. It was also found that the safety exclusion zones set up
through deterministic approaches may be over-extensive and impractical for large scale
LNG bunkering. It is because the deterministic approach is based on the worst case
scenario regardless of the likelihood. This problem appears to be overcome through using
the probabilistic risk-based approach.
The current DNVGL guidelines specify safety exclusion zones based on risk per
bunkering operation. However, the current study showed that this is incomplete as it does
not take into account the total time the equipment and the system as a whole is used
which governs the frequency of failure. In order to rectify this problem the current paper
uses the frequency of failure ‘per year’.
For a variety of reasons IMO member states have yet to develop their own explicit
regulations concerning safety exclusion zones in LNG bunkering. The present study can
therefore be viewed as a contribution towards safer uses of LNG as a marine fuel.
Acknowledgement
The authors would like to express their gratitude to Dr. Junho Kwak (MAN Diesel &
Turbo) for his invaluable support, comments and suggestions. He has contributed
considerably to this study. In addition, we have to thank Korean Ministry of Oceans and
Fisheries for its efforts to make this paper being submitted to the CCC Sub-committee of
IMO and circulated to the member states as an information document.

32
References
1. ABS, Bunkering of Liquefied Natural Gas-fueled Marine Vessels in North America,
Houston Texas USA, 2014.
2. ISO, TS 18683: Guidelines for systems and installations for supply of LNG as fuel to
ships, Geneva Switzerland, ISO, 2015.
3. DNV, Port toolkit risk profile LNG bunkering - Port of Rotterdam, Ministry of
Infrastructure & Environment, Port of Antwerp, Port of Amsterdam and Zeeland
Seaport, Oslo Norway, 2012.
4. DNV, LNG-fuelled fleet as of March 2014, 2014.
5. Lasse K., LNG (NG) Fuelled Shipping – Experience and regulations, Norwegian
Maritime Authority, 2015
6. Germany and Norway, HAZID report, London, IMO BLG, 2012.
7. ADN Administrative Committee, Proposed text of a derogation regarding the use of
LNG, Geneva Swithland, ADN Administrative Committee, 2014.
8. ABS, Bunkering of Liquefied Natural Gas-fuelled Marine Vessels in North America,
Houston Taxas, ABS, 2014.
9. Lee, S. and S. Seo and D. Chang, ‘Fire risk comparison of fuel gas supply systems
for LNG-fuelled ships’, Natural Gas Science and Engineering, vol. 27, 2015, p.
1788-1795.
10. Republic of Korea, Explosion analysis on the bunkering station for the LNG-fuelled
ship, London UK, IMO CCC, 2015.
11. DNV GL, PP087423-4, Rev 3: Liquefied Natural Gas (LNG) Bunkering Study, Oslo
Norway, DNV GL, 2014.
12. DNV GL, Recommended practice – DNVGL-RP-0006:2014-01: Development and
operation of liquefied natural gas bunkering facilities, 2014
13. IMO, MSC/Circ.1023, MEPC/Circ.392: Guidelines for Formal Safety Assessment
(FSA) for Use in the IMO Rule-making Process, London UK, IMO, 2002.
14. Dan, S. et al., ‘Quantitative risk analysis of fire and explosion on the top-side LNG-
liquefaction process of LNG-FPSO’, Process Safety and Environmental Protection,
vol. 92, 2014, p.430-441.
15. Kletz, T., An engineer's view of human error, The institution of Chemical Engineers,
1st edn., Rugby UK, IChemE, 1991.
16. OREDA Participants, Offshore Reliability Data Volume 1 Topside Equipment, 5th
ed., Trondheim Norway, OREDA participants, 2009.
17. Electric Power Research Institute (EPRI), Advanced Light Water Reactor Utility
Requirements Document (Volume III), California USA, EPRI, 1995.
18. Center for Chemical Process Safety of the American Institute of Chemical Engineers
(CCPS), Guidelines for Process Equipment Reliability Data with Data Tables, New
York USA, CCPS, 1989.
19. Cox, A. and F. Lees and M. Ang, Classification of Hazardous Locations, Rugby UK,
IChemE, 1990.
20. DNV, failure frequency guidance: Process Equipment Leak Frequency Data for use
in QRA, Oslo Norway, 2012.
21. Crowl, D. A., and J. F. Louvar, Chemical Process Safety: Fundamentals with
Applications, New Jersey UAS, Prentice Hall, 1990.
22. John L. W. and R. M. Pitblado. LNG RISK BASED SAFETY Modeling and
Consequence Analysis, New Jersey USA, A John Wiley & Sons, INC, 2010.
23. Briscoe, F., and P.Shaw, ‘Spread and Evaporation of Liquid’, Prog. Energy Comb.
Sic., vol. 6, 1980, p. 127-140
24. Carslaw H.S and Jaeger J.C., Conduction of heat in solids, 2nd ed., USA, Oxford
University Press, 1986.
25. Klimenko, V. V. ‘Film boiling on a horizontal plate - new correlation’, International
journal of heat and mass transfer 24(1), 1981, p. 69-79.
33
26. Cook, J. and Bahrami, Z and Whitehouse, R. J., ‘A comprehensive program for
calculation of flame radiation levels’, Loss Prevention Process Ind., vol. 3, 1990, p.
150.
27. Mannan, S., Lee's Loss Prevention in the Process Industries: Hazard Identification,
Assessment and Control, 3rd ed, Burlington, MA, Elsevier Butterworth-Heinemann,
2004.
28. Spouge, J., A guide to Quantitative Risk Assessment for Offshore Installations,
Bristol, Center for Marine and Petroleum Technology, 1999.
29. Tweeddale, M., Managing Risk and Reliability of Process Plants, USA, Gulf
Professional Publishing, 2003.
30. Perkins, H. C., Air Pollution: Arizona, USA, McGRAW-HILL BOOK COMPANY,
1974
31. Briggs, G. A., Diffusion Estimation for Small Emissions, Atmospheric Turbulence
and Diffusion Laboratory, 1973.
32. Ramiro, J. M. S., and P. A. B. Aisa, Risk Analysis and Reduction in the Chemical
Process Industry, London, UK, Blackie Academic & Professional, 1998.
33. John L. W. and R. M. Pitblado. LNG RISK BASED SAFETY Modeling and
Consequence Analysis, New Jersey USA, A John Wiley & Sons, INC, 2010.
34. Frank, T., Industrial explosion prevention and protection, New York UAS, Mc
Graw-Hill, 1980.
35. Baker, W., Explosion in Air. Austin, University of Texas Press, 1973.
36. Timothy, A. and D. Jeffrey, A Systematic Method for Modelling Explosion
Overpressures, Norman, OK, Quest Consultants Inc, 2007.
37. Thomas, P., Fire Spread in wooden cribs: Part III The effect of wind, fire research
Note Nr. 600, in Fire Research Station, England UK, Boreham Wods, 1965.
38. Nedelka, D., J. Moorehouse and R.F. Tucker, The Montoir 35 m Diameter LNG Pool
Fire Experiments, Nice France, 1989.
39. Hoftijzer, G. W., Heat radiation, in Methods for the Calculation of the Physical
Effects of the Escape of Dangerous Material (Liquid and Gases), KH Vooburg, the
Netherlands, Directorate General of Labour, 1979.
40. KR, LNG Fuel-Ready Ship For VLOC, Busan South Korea, KR, 2015.
41. KR, LNG Fuel-Ready Ship For 32K bulk carrier, Busan South Korea, KR, 2016.
42. CCPS, Guideline for Chemical Process Quantitative Risk Analysis, 2nd ed, New
York USA, Wiley-AlChe, 1999.
43. OGP, Report No.434-14.1: Risk Assessment Data Directory – Vulnerability of
humans, 2010
44. Port of Gothenburg, LNG operating regulations including LNG bunkering, 2015
45. Linde Cryo AB. et al, ‘LNG ship to ship bunkering procedure’, Swedish Marine
Technology Forum, Uddevalla, 2010
46. OGP, Report No.434-1: Risk Assessment Data Directory – Process release
frequencies, 2010