evaluation of safety net care pool (sncp) financing report · evaluation of safety net care pool...
TRANSCRIPT
Evaluation of Safety Net Care Pool (SNCP) Financing Report Final Prepared for: Massachusetts Executive Office of Health and Human Services
February 1, 2016 navigant.com/healthcare
EVALUATION OF SAFETY NET CARE POOL (SNCP) FINANCING REPORT
Page 2 of 166 February 1, 2016
Table of Contents 1 Executive Summary ................................................................................................ 4
2 Introduction ............................................................................................................. 6
3 Description of Current Funding and Payment Methods .................................... 10
3.1 Introduction .................................................................................................................10
3.1.1 Safety Net Care Pool (SNCP) Program – Overview and History ..............................11
3.1.2 Delivery System Transformation Initiative (DSTI) – Overview and History ...............12
3.2 Hospital Claim, SNCP and Other Supplemental Payments .........................................15
3.2.1 SNCP Payments .....................................................................................................15
3.2.2 Claim Payments ......................................................................................................22
3.2.3 Medicaid Fee-for-Service Supplemental Payments .................................................22
3.3 Hospital Claim and Supplemental Payment Funding ...................................................26
3.3.1 Historical Mix of Funds for period July 1, 2012, through June 30, 2015 ...................26
3.3.2 Review of CMS-64 Reports .....................................................................................26
3.4 Conclusions Drawn .....................................................................................................30
4 Adequacy, and Effect on Provider Financing ..................................................... 31
4.1 Analysis of SNCP Funding Relative to Costs of Services ............................................31
4.1.1 By Hospital Comparison of Payments to Costs, before SNCP Payments ................31
4.1.2 Safety Net Care Pool (SNCP) Program ...................................................................40
4.2 Factors Contributing to Medicaid Shortfall ...................................................................44
4.2.1 Role of FFS Payment Rates and Managed Care Contracting Requirements ...........51
4.3 Conclusions Drawn .....................................................................................................52
5 Delivery System Transformation Initiative (DSTI) .............................................. 53
5.1 Amount of DSTI Payments to Participating Providers by Category .............................54
5.2 Analysis of Measurable Project Outcomes by Project .................................................56
5.3 Conclusions Drawn .....................................................................................................58
6 Factors to Consider in the SNCP Program for Future Periods ......................... 60
6.1 Conclusions Drawn .....................................................................................................68
7 Conclusion ............................................................................................................. 69
8 Appendices: ........................................................................................................... 71
8.1 Appendix A: Regulatory Summary ..............................................................................71
8.1.1 State Plans and Waivers .........................................................................................74
8.1.2 Regulations Related to Medicaid Funding ...............................................................75
8.1.3 Federal and State Authority Related to Medicaid Provider Payment ........................80
8.1.4 Text of Federal and State Citations .........................................................................86
EVALUATION OF SAFETY NET CARE POOL (SNCP) FINANCING REPORT
Page 3 of 166 February 1, 2016
8.2 Appendix B: Safety Care Pool Expenditures ...............................................................90
8.3 Appendix C: Medicaid FFS Payments and Costs ........................................................99
8.4 Appendix D: Medicaid FFS CPR to Medicare FFS CPR............................................ 105
8.5 Appendix E: Medicaid MCO Uncompensated Care Cost .......................................... 108
8.6 Appendix F: Uninsured Cost ..................................................................................... 114
8.7 Appendix G: Medicaid and Uninsured UCC by Hospital ............................................ 120
8.8 Appendix H: Medicaid and Uninsured UCC by Hospital – Gross ............................... 126
8.9 Appendix I: Age Band Distribution of HSN Surplus (Deficit) by Hospital .................... 128
8.10 Appendix J: Citizenship Distribution of HSN Surplus (Deficit) by Hospital ................. 140
8.11 Appendix K: Project Measurable Outcomes by Provider ........................................... 152
8.12 Appendix L: DSTI Initiatives – Provider Presentation ................................................ 166
EVALUATION OF SAFETY NET CARE POOL (SNCP) FINANCING REPORT
Page 4 of 166 February 1, 2016
1 Executive Summary In Massachusetts, the Executive Office for Health and Human Services (EOHHS) is responsible for administering the MassHealth 1115 Demonstration Waiver. The demonstration was initially implemented in July 1997, and has been transformed over time through amendments and renewals reflecting new priorities and the enactment of the Affordable Care Act (ACA). A key component of the demonstration is a Safety Net Care Pool (SNCP), which was first created in 2005 for the purpose of reducing the rate of uninsurance in the Commonwealth while also providing funding for uncompensated care. The SNCP currently provides uncompensated care payments to safety net providers for Medicaid and low-income, uninsured individuals. The SNCP also funds Delivery System Transformation Initiatives (DSTI) and infrastructure and capacity-building grants. In total for SFY 2015, SNCP funds distributed to hospitals and other providers totaled approximately $2.044 billion. The purpose of this report is to be responsive to one of the requirements mandated by the Centers for Medicare and Medicaid Services (CMS) for the demonstration’s 2014 renewal period, which specified that MassHealth commission a report from an independent non-governmental entity to evaluate the use of SNCP funding for the period of July 1, 2012 through June 30, 2015. In accordance with the Special Terms and Conditions specified by CMS for this renewal, this report focuses on the effect, adequacy, accountability, and sustainability of SNCP payments on provider financing. The report also addresses the effect of the ACA coverage expansion on the existing uncompensated care payments and how this affects future needs for both the uninsured and Medicaid shortfall scenarios. This evaluation includes all payments made to providers under the SNCP, including uncompensated care payments, DSTI, and Infrastructure Capacity Building grants. Generally, providers that are eligible for SNCP funding are those that offer care to a higher proportion of patients that do not have the resources to pay for their own healthcare. As such, SNCP providers tend to have a substantial share of their patient mix comprising the uninsured, Medicaid, and other patients with financial vulnerabilities. And while the Affordable Care Act (ACA) and the Commonwealth’s landmark health reform law known as Chapter 58 of the Acts of 2006 substantially reduced the number of individuals without health care benefits, there are still costs incurred by SNCP hospitals in serving the Medicaid and uninsured populations that are not fully covered by their MassHealth program payments. Our analysis shows that SNCP funding is a vital component for sustaining access to quality care in the Commonwealth for those individuals eligible for hospital services under MassHealth programs. Hospitals that are eligible for DSTI payments under the SNCP program provide services to a significant proportion of total Medicaid services delivered in the Commonwealth. Using Medicaid payments (before SNCP payments) as a way to measure proportionality, approximately 28 percent of SFY 2014 Medicaid payments were made to hospitals that participate in the DSTI program. Our study found, in the aggregate, that hospitals eligible for SNCP funding during the Financing Report review period received combined Medicaid and SNCP payments that covered approximately 91.29 percent of the costs incurred in providing services to those eligible for Medicaid services and the uninsured.1 If SNCP payments are not considered, the pay-to-cost ratio for Medicaid and uninsured services would drop to 83.92
1 Percentage is based on cost information determined for 2013 and 2014. No cost data was available for 2015 during the completion of this report. The percentage is based on net of intergovernmental transfer expenditures. The gross expenditures percentage is 95.12 percent.
EVALUATION OF SAFETY NET CARE POOL (SNCP) FINANCING REPORT
Page 5 of 166 February 1, 2016
percent.2 Clearly, the funds provided to hospitals through the SNCP program are critical to the provision of services to these populations. In addition to the need to cover underfunded services, a significant component of SNCP funds are intended to develop, implement and improve programs that support hospitals’ efforts to enhance access to high quality health care. These funds are part of MassHealth’s Delivery System Transformation Initiative (DSTI) program. Seven hospitals receive funding under the DSTI program, which is intended to fund transformational projects related to integrated service delivery, improve quality of care, promote value-based purchasing alternatives, and promote population health strategies. For the first three years of the DSTI program (SFYs 2012 through 2014), funding has been transitional in nature, providing incentives for participating hospitals to establish programs and infrastructure to further overall DSTI program goals. For two years following the initial transitional phase, a proportion of the funding under DSTI is contingent on performance under certain outcome and quality measures, affected by both facility-specific and aggregated performance measures. As part of this study, we reviewed progress reported by the DSTI hospitals relative the commitments that they made to be eligible for the DSTI funding, and generally found that the hospitals had made progress relative to their goals. Our study validates the need for ongoing support of safety net providers through SNCP funding. It is also clear that as goals are achieved and efficiencies are introduced into the system, the time is right to review the current structure of the SNCP program and make modifications which support the goals of the Commonwealth.
2 Percentage in based on net of intergovernmental transfer expenditures. The gross expenditure percentage is 85.86 percent.
EVALUATION OF SAFETY NET CARE POOL (SNCP) FINANCING REPORT
Page 6 of 166 February 1, 2016
2 Introduction In fiscal year 2013, the Medicaid and the State Children’s Health Insurance Program (CHIP) were sources of health coverage for over 80 million people, just over one quarter of the population of the United States. Those served by these programs included one-half of all children, many low-wage workers and their families, persons who have physical and mental disabilities, and seniors with Medicare. Together, the Medicaid and CHIP programs accounted for 15.1 percent, approximately $460 billion, of total U.S. health care spending. In Massachusetts, Medicaid consumed 9 percent of commonwealth general revenue, approximately $7.1 billion in state fiscal year (SFY) 2014. With federal matching funds, this resulted in almost $14.3 billion spent by the Massachusetts Medicaid program.3 Governance and financing for Medicaid programs is a shared responsibility of the federal government and the states. States that operate their Medicaid programs within federal guidelines are entitled to federal reimbursement for a share of their total program costs. States incur these costs by making payments to health care providers and managed care plans and by performing administrative tasks such as making eligibility determinations, enrolling and monitoring providers, and paying claims. They then submit quarterly expenditure reports in order to receive federal matching dollars. Part of the challenge in setting policies for Medicaid and CHIP is balancing federal and state interests. Both the federal and state governments have a financial stake in the programs and reconciling their sometimes different and conflicting priorities can be difficult, particularly when the states are trying to be responsive to the financial circumstances of their taxpayers. States are incented to maximize flow of federal funds into the state, but must do so while maintaining a balanced state budget. Medicaid and CHIP provide an important source of revenue for the health care industry that affects economic activity throughout each state. They are major sources of federal financing for costs that might otherwise be borne by state and local governments, and by individuals and providers. However, being a jointly financed program, states must increase their own contributions in order to increase the flow of federal funds. From a federal perspective, Medicare, Medicaid, the Children’s Health Insurance Program (CHIP), and Affordable Care Act marketplace subsidies — together accounted for 24 percent of the federal budget in 2014, or $836 billion. Nearly two-thirds of this amount, or $511 billion, went to Medicare, with the remainder of this amount funding the Medicaid and CHIP programs.4 However, unlike Medicare, an exclusively federal program for which a substantial portion of spending is financed by dedicated revenue sources that include payroll taxes and enrollee premiums, federal spending for Medicaid and CHIP is financed by general revenues.5 The federal government has a fiscal responsibility to control costs of the Medicaid program, much the same as the states’ fiscal responsibility. As a condition of receiving federal Medicaid funds, Section 1902 of the Social Security Act requires states to have an approved state plan on file with the Centers for Medicare and Medicaid Services (CMS), the federal agency responsible for coordinating Medicaid, which demonstrates an understanding of all federal Medicaid requirements. States are required to submit state plan amendments (SPAs) to CMS for review and approval prior to making program
3 MACPAC. Report to the Congress on Medicaid and CHIP, (March 2014), and MACStats: Medicaid and CHIP Data Book (December 2015) 4 Center on Budget and Policy Priorities. Policy Basics: Where Do Our Federal Tax Dollars Go? (March 2015) 5 MACPAC. Report to the Congress on Medicaid and CHIP, (March 2011).
EVALUATION OF SAFETY NET CARE POOL (SNCP) FINANCING REPORT
Page 7 of 166 February 1, 2016
modifications. To control costs and ensure access to quality care, CMS monitors each state Medicaid program. CMS oversees the approval of state plan amendments, waivers, and demonstrations and provides guidance to states through State Medicaid Director (SMD) and State Health Official (SHO) letters. In addition to SPAs, CMS works with state Medicaid agencies to review and approve waivers. The Social Security Act (the Act) contains multiple waiver authorities that provide states flexibility in certain areas to operate their programs outside of standard federal requirements that would otherwise apply. In particular, Section 1115 of the Act gives broad authority to the Secretary to authorize “any experimental, pilot or demonstration project likely to assist in promoting the objectives of the programs” specified in that section of the Act. Under Section 1115 research and demonstration authority, states may waive certain provisions of the Medicaid and CHIP statutes related to state program design. Provisions that may be waived under Section 1115 include Medicaid eligibility criteria, covered services, and service delivery and payment methods used by the state to administer the program. Section 1115 demonstrations include a research or evaluation component and are initially approved for five years, with potential for up to a five-year renewal term. The ability to waive certain aspects of the Medicaid statute gives states flexibility to experiment with different approaches to program operation, service delivery, and financing in terms of both program expansion and contraction, with the condition that the programs remain budget neutral. Approval of states’ waiver applications and subsequent renewals are at the discretion of the Secretary of the federal Department of Health and Human Services (HHS).6 All states operate one or more Medicaid waivers. In Massachusetts, the MassHealth 1115 Demonstration is a statewide multi-faceted health reform effort. The demonstration was initially implemented in July 1997, and has developed over time through amendments and renewals reflecting new priorities and the enactment of the Affordable Care Act (ACA). The demonstration authorizes Medicaid income eligibility for certain categorically eligible populations including pregnant women, parents or adult caretakers, infants, children and individuals with disabilities, and provides premium subsidies to qualifying individuals who are enrolled in a Qualified Health Plan (QHP) consistent with levels provided under the demonstration prior to the ACA. Additionally, the demonstration continues to support a Safety Net Care Pool (SNCP) first created in 2005 for the purpose of reducing the rate of uninsurance in the Commonwealth while also providing funding for uncompensated care. The SNCP currently provides uncompensated care payments to safety net providers for Medicaid and low-income, uninsured individuals. The SNCP also funds delivery system transformation initiatives and infrastructure and capacity-building grants. For the 2014 renewal period, CMS requires that the Commonwealth commission a report from a non-governmental entity that is independent of provider interests on Medicaid provider payments made under the SNCP. The intent of this analysis and report and the subsequent Sustainability and Delivery System Transformation Report is to recommend a strategic platform for the Commonwealth and CMS to work from regarding payments that sustainably support and align with system-wide transformation. The report will evaluate the use of SNCP funding for the period of July 1, 2012 through June 30, 2015. The subject of the report (and the hypothesis test for the SNCP component of the demonstration evaluation) must focus on the effect, adequacy, accountability, and sustainability of SNCP payments on provider financing. The report must also address the effect of the ACA coverage expansion on the existing uncompensated care payments and how this affects future needs for both the uninsured and Medicaid shortfall 6 MACPAC. Report to the Congress on Medicaid and CHIP, (March 2011).
EVALUATION OF SAFETY NET CARE POOL (SNCP) FINANCING REPORT
Page 8 of 166 February 1, 2016
scenarios. This evaluation must include all payment types under the SNCP, including uncompensated care payments, Delivery System Transformation Initiatives (DSTI), and Infrastructure Capacity Building grants. The Executive Office of Health and Human Services (EOHHS) engaged Navigant Consulting, Inc. (Navigant) to perform this study. The following elements are addressed in this report:
• A detailed description and analysis of SNCP payments to providers authorized by the Demonstration for the period of July 1, 2012, through June 30, 2015. The report will also include how the Commonwealth funds the various payments and how payments to providers correspond to amounts reported on the CMS-64 (the Commonwealth’s quarterly reports of expenditures for services authorized through the Demonstration). The report will note any gaps in payment as well as overages in the current funding structure.
• A detailed analysis of uncompensated care payments for each provider type that are attributable to each of the following:
- Uninsured individuals
- Medicaid beneficiaries
• For the amount of SNCP payments attributable to Medicaid beneficiaries, for each provider type, a comparison of the funds that are attributable, in aggregate and by age-band, to the following:
- Managed Care shortfall; and
- Fee-for-service shortfall.
• The total amount of uncompensated care (including age-banding analysis as determined appropriate) that is provided by each provider type to each of the following:
- Unqualified aliens; and
- Qualified aliens subject to a 5-year ban.
• An analysis of factors that contribute to the necessity of payments for uninsured individuals and Medicaid beneficiaries, including the following:
- The number of uninsured individuals in the Commonwealth;
- The number of Medicaid beneficiaries, including the growth of beneficiaries under Massachusetts health reform and the ACA; and
- Factors that impact access to coverage including geographic location, state of residency or homelessness rates.
• An analysis of the findings and conclusions drawn from the factors that contribute to the Medicaid shortfall, uncompensated care, and the necessity of uncompensated care payments overall as well, including the causal and solution role of fee-for-service payment rates and managed care contracting requirements.
• Amount of DSTI payments made to participating providers by project.
• Analysis of measureable project outcomes achieved by participating provider per project.
EVALUATION OF SAFETY NET CARE POOL (SNCP) FINANCING REPORT
Page 9 of 166 February 1, 2016
As an integral component of the evaluation Navigant conducted interviews with MassHealth staff and relevant stakeholders, including the seven (7) facilities receiving Delivery System Transformation Initiatives (DSTI) funding and three (3) SNCP facilities identified by the EOHHS. Insights obtained through these interviews are included in the analysis and narrative discussion provided later in this report. The remainder of this report addresses each of the elements specified above, and is organized into the following sections:
• Section 3 – Description of Current Funding and Payment Methods, where we provide general background information on the SNCP program, MassHealth funding and payments, and summary level information on the various MassHealth funding stream amounts;
• Section 4 – Adequacy, and Effect on Provider Financing, where we analyze the relationship between provider payments and costs, and describe factors that impact Medicaid shortfall amounts;
• Section 5 – Delivery System Transformation Initiative (DSTI), where we describe the DSTI component of the SNCP program, the historical payments made as a part of the program, and an analysis of the measurable outcomes achieved under the DSTI program;
• Section 6 – where we describe factors to consider as the Massachusetts SNCP program is evaluated for future periods; and
• Section 7 – where we provide a brief conclusion related to the SNCP program.
EVALUATION OF SAFETY NET CARE POOL (SNCP) FINANCING REPORT
Page 10 of 166 February 1, 2016
3 Description of Current Funding and Payment Methods
3.1 Introduction The Massachusetts Medicaid program, like most Medicaid programs in the United States is funded and disburses payments for medical care in a variety of ways. This chapter of the report documents current funding and payment mechanisms and offers a history of how these have changed in recent years. In particular, our discussion concentrates on funding and payment mechanisms used by MassHealth for hospital services, including both inpatient and outpatient services. In addition, we examine the funding and payment mechanisms related to the SNCP program, which is a component of Massachusetts’ 1115 Demonstration program, and the DSTI program, which was created as part of the SNCP program beginning in 2011. Funding for payment of hospital services provided to Medicaid recipients, including those made through the FFS and Medicaid managed care programs, and the SNCP program generally come from four sources: 1) Massachusetts state general revenue funds; 2) IGT funding from Cambridge Health Alliance; 3) revenue produced by Acute Hospital assessments and the surcharge on Hospital Services and Ambulatory Surgical Center Services payments; and 4) federal matching funds provided through CMS and CPEs.7 Generally, payments are made by MassHealth in five forms, 1) claims payments for health care services provided to Medicaid fee-for-service recipients; 2) capitation payments to Medicaid MCOs, which in turn, pay hospitals for services provided to Medicaid managed care recipients; 3) supplemental payments determined through the SNCP program; 4) incentive-based payments determined through the DSTI program, which were transitioned from supplemental payments; and 5) a variety of other periodic supplemental payments. FFS claim payments and Medicaid managed care capitation payments are both intended to compensate providers for services offered to recipients eligible for Medicaid health benefits. SNCP payments can generally be separated into two categories. The first category of payments is generally intended to offset the costs associated with uncompensated care. These payments include the following programs:
• Public Service Hospital Safety Net Care Payment • The Health Safety Net (HSN) Trust Fund • Institutions for Mental Disease • Special Population State-Owned Non-Acute Hospitals Operated by the Department of
Public Health • State-Owned Non-Acute Hospitals Operated by the Department of Mental Health
Payments under the above programs are subject to limits or cost protocol caps described later in this chapter. Other SNCP payments are explicitly non-service related incentive or grant payments, which include the following programs:
• Delivery System Transformation Initiative (DSTI) Payments • Cambridge Health Alliance Public Hospital Transformation and Incentive Initiatives8 • Infrastructure and Capacity-Building Grants
7 101 CMR 614.03(1)(a) 8 The Cambridge Health Alliance Public Hospital Transformation and Incentive Initiatives program began with Federal Fiscal Year 2015 and will be included in Financing Report for discussion on expenditures in Section 3.2.
EVALUATION OF SAFETY NET CARE POOL (SNCP) FINANCING REPORT
Page 11 of 166 February 1, 2016
Incentive-based payments made through the DSTI program are intended to assist in the “[i]dentification of community needs, health care challenges, the delivery system, payment reform, and population-focused improvements.”9
3.1.1 Safety Net Care Pool (SNCP) Program – Overview and History In April 2006, Massachusetts passed legislation10 to provide access to affordable health insurance to all Massachusetts residents. The legislation established a number of new programs intended to achieve the legislature’s overall goal of reducing the number of uninsured. The SNCP, which was one of the cornerstones of the overall health care reform effort established by the legislation, was approved by CMS on January 26, 2005. The SNCP initially established a centralized pool of money dedicated to providing health care services to uninsured and underserved state residents and established the financing for the program, which comes from various sources of state and local government funds that CMS has approved, and which are designated as eligible for federal Medicaid matching dollars. The SNCP has been an integral component of the Commonwealth’s 1115 Demonstration Waiver (Demonstration) since the July 2005 waiver extension. Initially established as a program intended to provide funding “for the provision of health care services to uninsured individuals and unreimbursed Medicaid costs, through any type of health care provider or through insurance products,”11 it has been modified to some extent with every approved Demonstration renewal since. Initial modifications focused primarily on incorporation of certain caps and sub-caps on spending under the program. For the SFY 2012-2014 1115 Demonstration extension period, in addition to certain modifications to the caps, the Delivery System Transformation Initiative (DSTI) program was introduced as component of SNCP for the first time. The DSTI program focused on transitioning funding distributed through supplemental payments to incentive-based payments. To receive incentive-based payments, providers were required to meet certain process and outcome milestones. The DSTI program is described in more detail later in this chapter. For the SFY 2012-2014 extension period (which spans two of the years specified by CMS to be the subject of this study), the Commonwealth was authorized to claim as allowable expenditures under the Demonstration (to the extent permitted under the SNCP limits) the following categories of payments and expenditures. Federally-approved payments and expenditures within these categories are specified in the Waiver documentation.
• Commonwealth Care – premium assistance under the Commonwealth Care health insurance program. (Note: this program was terminated in 2015)
• Designated State Health Programs (DSHP) – which are otherwise state-funded programs that provide health services.
• Providers – payments to providers, including but not limited to, acute hospitals and health systems, non-acute hospitals, and other providers of medical services to support uncompensated care for Medicaid FFS, Medicaid managed care, Commonwealth Care,
9 MassHealth 1115 Waiver Demonstration Approved October 30, 2014. Page 61. 10 Chapter 58 of the Acts of 2006 (Chapter 58), titled An Act Providing Access to Affordable, Quality, Accountable Health Care 11 MassHeatlh Waiver Amendment for Demonstration Period 7/1/2005-6/30/2008, approved July 26, 2006. Special Terms and Conditions (STC) #24.
EVALUATION OF SAFETY NET CARE POOL (SNCP) FINANCING REPORT
Page 12 of 166 February 1, 2016
and low-income uninsured individuals. The Commonwealth may also claim as an allowable expenditure payments not otherwise eligible for FFP that are for otherwise covered services furnished to individuals who are inpatients in an Institution for Mental Disease (IMD).
• Infrastructure and capacity-building – expenditures that support the improvement or continuation of health care services that benefit the uninsured, underinsured, and SNCP populations, such as capacity-building and infrastructure.12
With the approved SFY 2015-2019 Demonstration extension, modifications were made to the authorized expenditures under the Demonstration. Provisions related to Commonwealth Care and Temporary Coverage for individuals who were not eligible under MassHealth or Marketplace coverage were set to expire February 28, 2015. The DSHP program was extended through June 30, 2017. New provisions were also established for the DSTI program, which is described in more detail in the following section.
3.1.2 Delivery System Transformation Initiative (DSTI) – Overview and History The Massachusetts Delivery System Transformation Initiatives (DSTI) program was approved by CMS in December 2011, as a new component of the SNCP under the SFY 2012-2014 1115 Demonstration extension period. Under the DSTI program, the Commonwealth may claim as allowable expenditures under the Demonstration, to the extent permitted under the SNCP limits, incentive payments to providers for the development and implementation of certain programs that support hospitals’ efforts to enhance access to health care, improve the quality of care and the health of the patients and families they serve and the development of payment reform strategies and models. The following key elements were described as part of the December 2011 Demonstration approval documentation:
• Eligibility. The program of activity funded by the DSTI shall be based in public and private acute hospitals, with a high, documented Medicaid patient volume, that are directly responsive to the needs and characteristics of the populations and communities. Therefore, providers eligible for incentive payments are defined as public or private acute hospitals with a Medicaid payer mix more than one standard deviation above average and a commercial payer mix more than one standard deviation below average based on FY 2009 cost report data.
• Master DSTI Plan. The Commonwealth must develop and submit to CMS for approval a “master” DSTI plan, specifying details of DSTI categories (described below) and associated projects, population-focused objectives and evaluation metrics from which each eligible hospital will select to create its own plan, and funding plans.
• Hospital-specific Plans. Upon CMS approval of the Commonwealth’s master DSTI plan, each participating hospital must submit an individual DSTI plan that identifies the projects, population-focused objectives, and specific metrics adopted from the master
12 MassHealth Demonstration Approval Period: December 20, 2011 through June 30, 2014. Amended October 1, 2013.
EVALUATION OF SAFETY NET CARE POOL (SNCP) FINANCING REPORT
Page 13 of 166 February 1, 2016
DSTI plan and meets all specified requirements.
Participating hospitals must implement new, or significantly enhance existing health care initiatives. The hospital-specific DSTI plans must address all four categories (as outlined below), but each hospital is not required to select all projects within a given category. Each individual hospital DSTI plan must include a minimum number of projects selected within each category as outlined in the master DSTI plan and report on progress to receive DSTI funding. Eligibility for DSTI payments will be based on successfully meeting metrics associated with approved projects and the submission of required progress reports.
• DSTI Categories and Projects. Each participating hospital must select a minimum number of projects from each category as outlined in the master DSTI plan. Additionally, the projects must be consistent with the overarching approach of improving health care through the simultaneous pursuit of three aims: improving the experience of care, improving the health of populations, and reducing per capita costs of health care. Each project, depending on the purpose and scope of the project, may include a mix of process-oriented metrics to measure progress in the development and implementation of infrastructure and outcome metrics to measure the impact of the investment.
There are four categories for which funding authority is available under the DSTI, each of which has explicit connection to the achievement of the Three Part Aim mentioned in the preceding paragraph:
- Category 1: Development of a fully integrated delivery system. This category includes investments in projects that are the foundation of delivery system change to encompass the concepts of the patient-centered medical home (PCMH) model to increase delivery system efficiency and capacity. Examples include:
Investments in communication systems to improve data exchange with medical home sites
Integration of physical and behavioral health care
Development of integrated care networks across the continuum of care
Investment in patient care redesign efforts, such as patient navigators, alternative delivery sites, alternative office hours, etc.
- Category 2: Improved Health Outcomes and Quality. This category includes development, implementation and expansion of innovative care models which have the potential to make significant demonstrated improvements in patient experience, cost and care management. Examples include:
Implementation of Enterprise-wide Care Management or Chronic Care Management initiatives, which may include implementation and use of disease management registries

EVALUATION OF SAFETY NET CARE POOL (SNCP) FINANCING REPORT
Page 14 of 166 February 1, 2016
Improvement of care transitions, and coordination of care across inpatient, outpatient, post-acute care, and home care settings
Adoption of Process Improvement Methodologies to improve safety, quality, and efficiency
- Category 3: Ability to respond to statewide transformation to value-based purchasing and to accept alternatives to fee-for-service payments that promote system sustainability. Examples include:
Enhancement of performance improvement and reporting capabilities
Development of enhanced infrastructure and operating and systems capabilities that would support new integrated care networks and alternative payment models to manage within new delivery and payment models
Development of risk stratification capabilities/functionalities
- Category 4: Population-Focused Improvements. This category involves evaluating the investments and system changes described in categories 1, 2 and 3 through population-focused objectives. Metrics must evaluate the impact of health care delivery system and access reform measures on the quality of care delivered by participating providers. Metrics must also evaluate the impact of the payment redesign and infrastructure investments to improve areas such as cost efficiency, systems of care, and coordination of care in community settings. Metrics may vary across participating providers, but should be consistent within projects developed in the DSTI master plan to facilitate evaluation.
• DSTI Metrics and Evaluation. Each eligible provider must develop process-oriented and outcome metrics for each of the Categories 1, 2 and 3 that demonstrate clear project goals and objectives to achieve systematic progress. Examples of such project metrics may include: identification and purchase of system, programming of system, going live on a system, contracting with a payer using a bundled payment system, enrollment of a defined percentage of patients to a Medical Home model, increase by a defined amount the number of primary care clinics using a Care Management model, improve by a defined percentage of patients with self-management goals, increase by a defined amount the number of patients that have an assigned care manager team, etc.
Metrics related to Category 4 shall recognize that the population-focused objectives/projects do not guarantee outcomes, but that the objectives/projects must result in learning, adaptation and progress toward the desired impact. These metrics must quantitatively measure the impact of the projects in Categories 1, 2 and 3 (e.g. disease measurements, ER admissions, cost management, etc.) on each participating provider’s patient population.
• DSTI Payments. DSTI payments for each participating provider are contingent on that provider meeting project metrics as defined in the approved hospital-specific plans.
EVALUATION OF SAFETY NET CARE POOL (SNCP) FINANCING REPORT
Page 15 of 166 February 1, 2016
DSTI payments are not direct reimbursement for expenditures or payments for services. DSTI payments are intended to support and reward hospital systems for improvements in their delivery systems and payment models that support the simultaneous pursuit of improving the experience of care, improving the health of populations, and reducing per capita costs of health care. Further, the payments are not direct reimbursement for expenditures incurred by hospitals in implementing reforms.
DSTI payments should not be considered patient care revenue and will not be offset against other Medicaid reimbursements to hospital systems, including payments funded through approved intergovernmental transfers, or approved certified public expenditures incurred by government owned or operated hospital systems and their affiliated government entity providers for health care services, infrastructure and capacity-building, administrative activities, or other non-DSTI payment types authorized under the Demonstration and/or under the State plan.13
As a part of the Demonstration extension for SFY 2015-2019, CMS added the following new provisions to the above DSTI elements.14
• Funding At Risk for Outcomes and Quality Improvement. Funding for hospitals under DSTI will be at risk for improved performance on validated outcome or quality measures. At risk amounts will be 0 percent for SFY 2015, 10 percent for SFY 2016, and 20 percent for SFY 2017. This new accountability structure will be established on a provider-specific basis. Outcome measures will focus on assessing progress on health outcomes that result from the structural and process modifications or improvements.
• Aggregate DSTI Outcome and Quality Improvement Accountability. In addition to the at risk provider-specific provisions described above, the total available DSTI funding pool will be at risk for a five percent reduction. If the DSTI providers do not meet the required aggregate performance goals as specified by the DSTI Master Plan by the end of the three year period from SFY 2015 to 2017.
Massachusetts significantly strengthened the expectations and metrics for DSTI 2.0 (Fiscal Years 15-17). The new requirements place additional accountability on the participating hospitals to achieve measurable progress toward defined goals on a provider-specific basis.
3.2 Hospital Claim, SNCP and Other Supplemental Payments
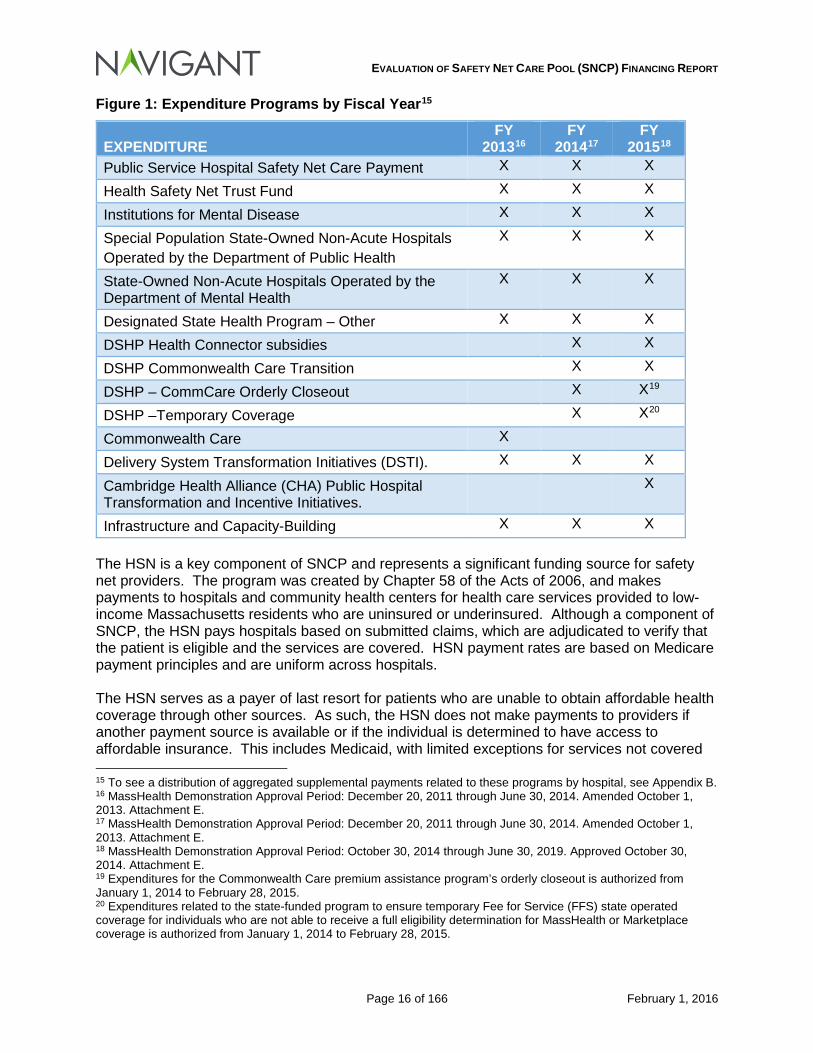
3.2.1 SNCP Payments Under the waiver Special Terms and Condition #54, this report “must include a detailed description and analysis of the Medicaid payments to providers under the SNCP (all types) and financing system for the period of July1, 2012 through June 30, 2015.” Figure 1 lists the expenditure programs authorized for payment under the 1115 Demonstration by fiscal year:
13 MassHealth Demonstration Approval Period: December 20, 2011 through June 30, 2014. Amended October 1, 2013. 14 MassHealth Demonstration Approval Period: October 30, 2014 through June 30, 2019.
EVALUATION OF SAFETY NET CARE POOL (SNCP) FINANCING REPORT
Page 16 of 166 February 1, 2016
Figure 1: Expenditure Programs by Fiscal Year15
EXPENDITURE FY
201316 FY
201417 FY
201518 Public Service Hospital Safety Net Care Payment X X X
Health Safety Net Trust Fund X X X
Institutions for Mental Disease X X X
Special Population State-Owned Non-Acute Hospitals Operated by the Department of Public Health
X X X
State-Owned Non-Acute Hospitals Operated by the Department of Mental Health
X X X
Designated State Health Program – Other X X X
DSHP Health Connector subsidies X X
DSHP Commonwealth Care Transition X X
DSHP – CommCare Orderly Closeout X X19
DSHP –Temporary Coverage X X20
Commonwealth Care X
Delivery System Transformation Initiatives (DSTI). X X X
Cambridge Health Alliance (CHA) Public Hospital Transformation and Incentive Initiatives.
X
Infrastructure and Capacity-Building X X X The HSN is a key component of SNCP and represents a significant funding source for safety net providers. The program was created by Chapter 58 of the Acts of 2006, and makes payments to hospitals and community health centers for health care services provided to low-income Massachusetts residents who are uninsured or underinsured. Although a component of SNCP, the HSN pays hospitals based on submitted claims, which are adjudicated to verify that the patient is eligible and the services are covered. HSN payment rates are based on Medicare payment principles and are uniform across hospitals. The HSN serves as a payer of last resort for patients who are unable to obtain affordable health coverage through other sources. As such, the HSN does not make payments to providers if another payment source is available or if the individual is determined to have access to affordable insurance. This includes Medicaid, with limited exceptions for services not covered 15 To see a distribution of aggregated supplemental payments related to these programs by hospital, see Appendix B. 16 MassHealth Demonstration Approval Period: December 20, 2011 through June 30, 2014. Amended October 1, 2013. Attachment E. 17 MassHealth Demonstration Approval Period: December 20, 2011 through June 30, 2014. Amended October 1, 2013. Attachment E. 18 MassHealth Demonstration Approval Period: October 30, 2014 through June 30, 2019. Approved October 30, 2014. Attachment E. 19 Expenditures for the Commonwealth Care premium assistance program’s orderly closeout is authorized from January 1, 2014 to February 28, 2015. 20 Expenditures related to the state-funded program to ensure temporary Fee for Service (FFS) state operated coverage for individuals who are not able to receive a full eligibility determination for MassHealth or Marketplace coverage is authorized from January 1, 2014 to February 28, 2015.
EVALUATION OF SAFETY NET CARE POOL (SNCP) FINANCING REPORT
Page 17 of 166 February 1, 2016
by Medicaid, gap periods, etc. Once an individual is determined eligible for HSN, providers may not bill patients for services, with the exception of coinsurance and deductible amounts post HSN adjudication. The amount allowable for reimbursement on a Health Safety Net claim is based on the following:
• Inpatient Hospital Stay – Acute Hospital claims priced in accordance with the Medicare Inpatient Prospective Payment System (IPPS) for non-psychiatric claims and the Inpatient Psychiatric Facility Prospective Payment System (IPF-PPS) for psychiatric claims for the current Fiscal Year.21
• Outpatient Primary Care – A per visit amount for each outpatient visit that exceeds $20.00 is priced based on a hospital-specific Medicare payment on account factor (PAF).22
• Outpatient Emergency Room Bad Debt – Hospital specific per visit amount is priced.
• Secondary Claims or Primary Claims Less Than $20 – Claims for visits that are less than or equal to $20.00 are priced by multiplying the Medicare payment on account factor by the billed charges.23
• Critical Access Hospitals or PPS-exempt Hospitals – A price is calculated on a per discharge payment basis for discharges occurring at Medicare Critical Access Hospitals and PPS Exempt cancer and Pediatric Hospitals.24
• Physician Services – Hospital-based physician service claims are priced according to the Medicare Physician Fee Schedule.25
• Dental Services – Claims from Acute Hospitals for outpatient dental services provided at Acute Hospitals and Hospital Licensed Health Centers are priced using the fees established in 114.3 CMR 14.00: Dental Services.26
The Health Safety Net makes additional payments to Community Health Centers, however, the focus of this financing report is related to payments made to hospitals, and as such, no further review was performed related to the Community Health Centers. The Health Safety Net Office estimates the amounts expected to be paid for HSN claims during a given year. If the amount exceeds the available funding, “the Health Safety Net Office allocates the funding in a manner that reflects each Acute Hospital's proportional Financial Requirements for Health Safety Net payments through a graduated payment system.”27 Some of these programs shown above are restricted by a specific limit outlined in the Special Terms and Conditions. These limits are as follows:
Budget Neutrality Cap. In addition to the above expenditure caps, 1115 Demonstration Waivers are subject to budget neutrality limits. The amount of expenditures spent under
21 101 CMR 614.06(2) 22 101 CMR 614.06(3) and 614.06(3)(b) 23 101 CMR 614.06(3)(f) 24 101 CMR 614.06(2)(b)(1) 25 101 CMR 614.06(4) 26 101 CMR 614.06(5) 27 101 CMR 614.00(2)(b)
EVALUATION OF SAFETY NET CARE POOL (SNCP) FINANCING REPORT
Page 18 of 166 February 1, 2016
the waiver cannot exceed the amount that the Medicaid agency would have spent in federal spending had the waiver not been in existence. The Special Terms and Conditions for MassHealth require a reduction in Safety Net Care Pool expenditures if the under the Demonstration exceed the budget neutrality limit.
Aggregate SNCP Cap. For each of the demonstration waiver periods that overlap State Fiscal Years 2013 through 2015, the Commonwealth has a cap of total spending that can be made under the Safety Net Care Pool provisions. For the period of December 20, 2011 through June 30, 2014, the total aggregate cap was $4.674 billion and must meet the budget neutrality guidelines within the Waiver Demonstration. Additionally, a portion of the cap is subject to changes in the Federal DSH allotment for the Commonwealth. The aggregate cap is reduced to $4.635 billion for the period of July 1, 2014 through June 30, 2017.
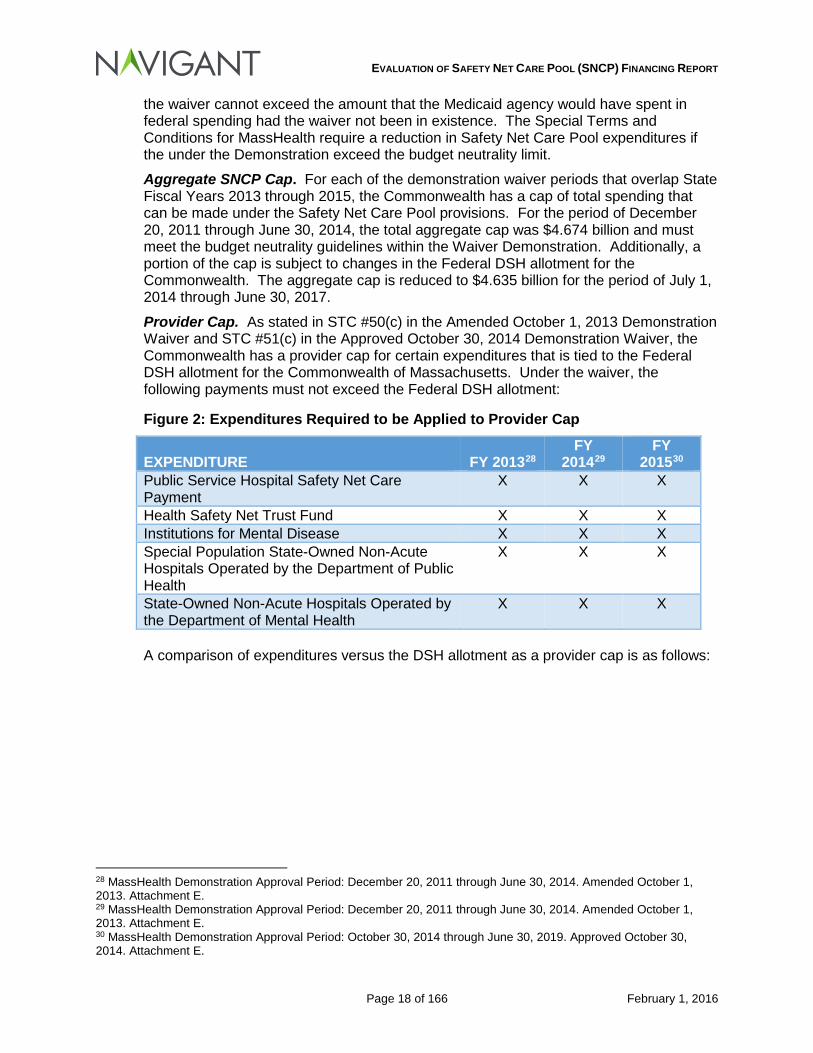
Provider Cap. As stated in STC #50(c) in the Amended October 1, 2013 Demonstration Waiver and STC #51(c) in the Approved October 30, 2014 Demonstration Waiver, the Commonwealth has a provider cap for certain expenditures that is tied to the Federal DSH allotment for the Commonwealth of Massachusetts. Under the waiver, the following payments must not exceed the Federal DSH allotment:
Figure 2: Expenditures Required to be Applied to Provider Cap
EXPENDITURE FY 201328 FY
201429 FY
201530 Public Service Hospital Safety Net Care Payment
X X X
Health Safety Net Trust Fund X X X Institutions for Mental Disease X X X Special Population State-Owned Non-Acute Hospitals Operated by the Department of Public Health
X X X
State-Owned Non-Acute Hospitals Operated by the Department of Mental Health
X X X
A comparison of expenditures versus the DSH allotment as a provider cap is as follows:
28 MassHealth Demonstration Approval Period: December 20, 2011 through June 30, 2014. Amended October 1, 2013. Attachment E. 29 MassHealth Demonstration Approval Period: December 20, 2011 through June 30, 2014. Amended October 1, 2013. Attachment E. 30 MassHealth Demonstration Approval Period: October 30, 2014 through June 30, 2019. Approved October 30, 2014. Attachment E.
EVALUATION OF SAFETY NET CARE POOL (SNCP) FINANCING REPORT
Page 19 of 166 February 1, 2016
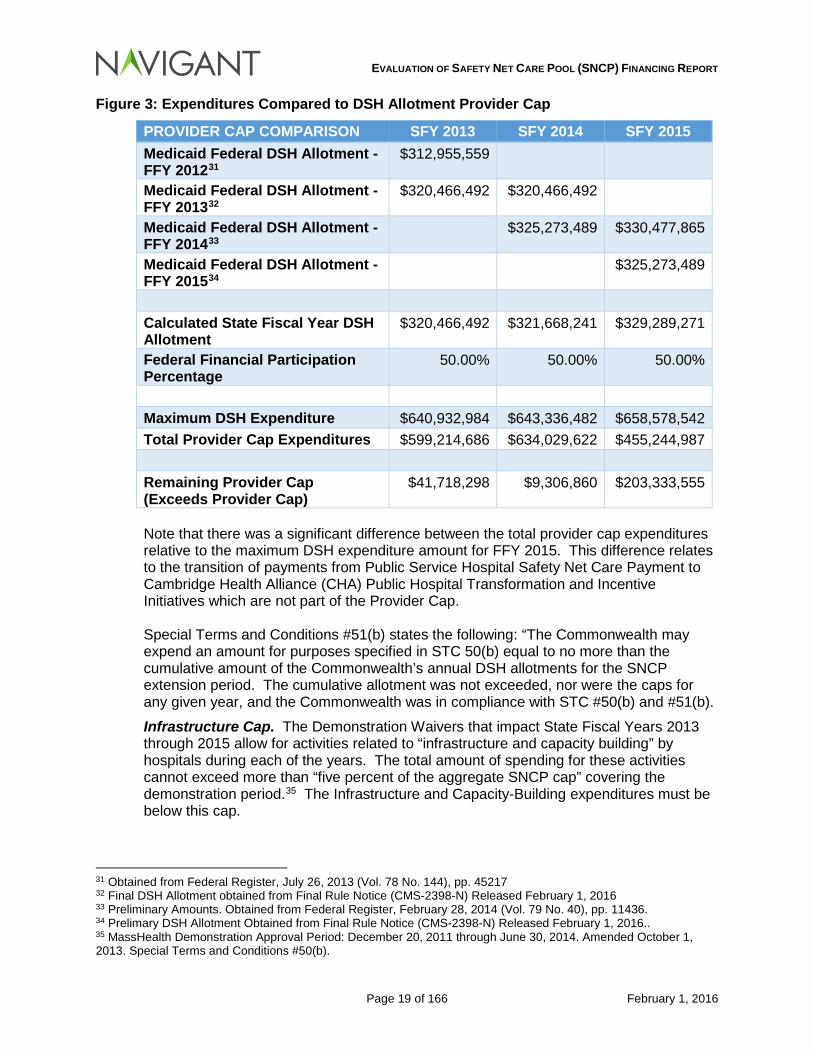
Figure 3: Expenditures Compared to DSH Allotment Provider Cap
PROVIDER CAP COMPARISON SFY 2013 SFY 2014 SFY 2015 Medicaid Federal DSH Allotment -FFY 201231
$312,955,559
Medicaid Federal DSH Allotment -FFY 201332
$320,466,492 $320,466,492
Medicaid Federal DSH Allotment -FFY 201433
$325,273,489 $330,477,865
Medicaid Federal DSH Allotment -FFY 201534
$325,273,489
Calculated State Fiscal Year DSH Allotment
$320,466,492 $321,668,241 $329,289,271
Federal Financial Participation Percentage
50.00% 50.00% 50.00%
Maximum DSH Expenditure $640,932,984 $643,336,482 $658,578,542 Total Provider Cap Expenditures $599,214,686 $634,029,622 $455,244,987 Remaining Provider Cap (Exceeds Provider Cap)
$41,718,298 $9,306,860 $203,333,555
Note that there was a significant difference between the total provider cap expenditures relative to the maximum DSH expenditure amount for FFY 2015. This difference relates to the transition of payments from Public Service Hospital Safety Net Care Payment to Cambridge Health Alliance (CHA) Public Hospital Transformation and Incentive Initiatives which are not part of the Provider Cap. Special Terms and Conditions #51(b) states the following: “The Commonwealth may expend an amount for purposes specified in STC 50(b) equal to no more than the cumulative amount of the Commonwealth’s annual DSH allotments for the SNCP extension period. The cumulative allotment was not exceeded, nor were the caps for any given year, and the Commonwealth was in compliance with STC #50(b) and #51(b).
Infrastructure Cap. The Demonstration Waivers that impact State Fiscal Years 2013 through 2015 allow for activities related to “infrastructure and capacity building” by hospitals during each of the years. The total amount of spending for these activities cannot exceed more than “five percent of the aggregate SNCP cap” covering the demonstration period.35 The Infrastructure and Capacity-Building expenditures must be below this cap.
31 Obtained from Federal Register, July 26, 2013 (Vol. 78 No. 144), pp. 45217 32 Final DSH Allotment obtained from Final Rule Notice (CMS-2398-N) Released February 1, 2016 33 Preliminary Amounts. Obtained from Federal Register, February 28, 2014 (Vol. 79 No. 40), pp. 11436. 34 Prelimary DSH Allotment Obtained from Final Rule Notice (CMS-2398-N) Released February 1, 2016.. 35 MassHealth Demonstration Approval Period: December 20, 2011 through June 30, 2014. Amended October 1, 2013. Special Terms and Conditions #50(b).
EVALUATION OF SAFETY NET CARE POOL (SNCP) FINANCING REPORT
Page 20 of 166 February 1, 2016
DSHP Cap. For each fiscal year under the various waiver demonstrations specific categories of DSHP related expenditures are subject to a dollar cap.
The amounts for the fiscal years under this review are as follows:
State Fiscal Year 2013 $310,000,000 State Fiscal Year 2014 $130,000,000 State Fiscal Year 2015 $385,000,000
The following DSHP programs are not subject to this DSHP Cap:
• DSHP – Health Connector Subsidies • DSHP – Commonwealth Care Transition • DSHP – Commonwealth Care Orderly Closeout • DSHP – Temporary Coverage
EVALUATION OF SAFETY NET CARE POOL (SNCP) FINANCING REPORT
Page 21 of 166 February 1, 2016
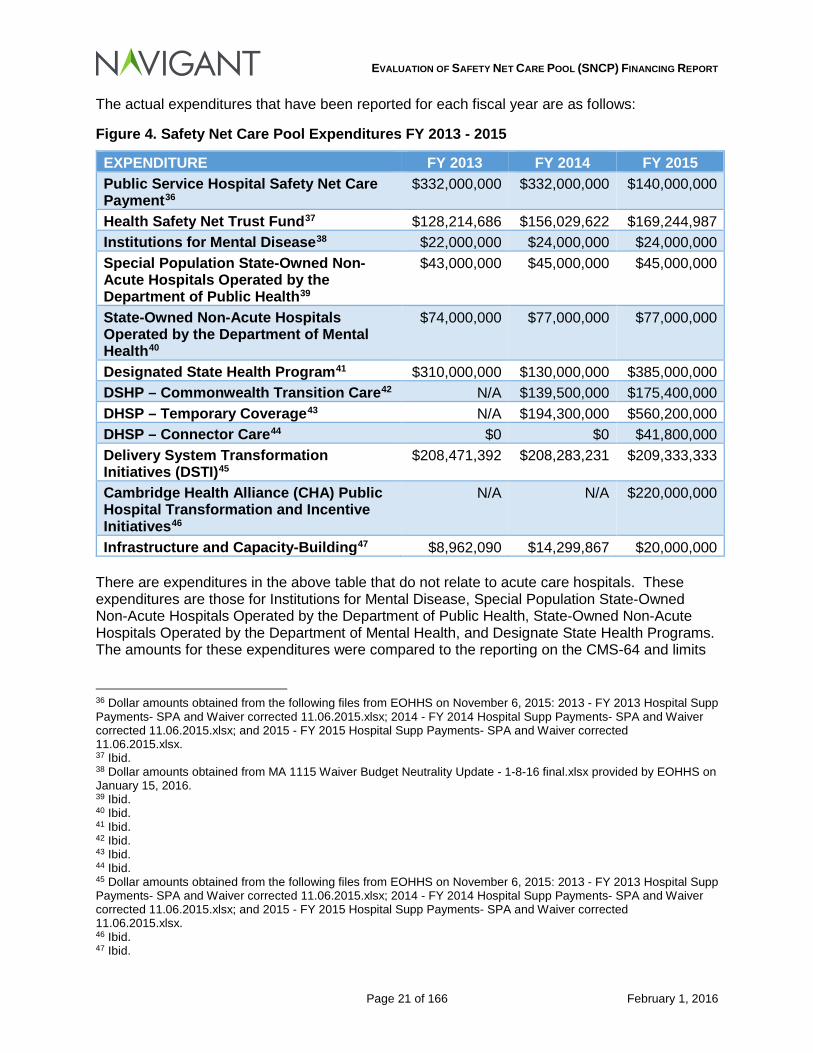
The actual expenditures that have been reported for each fiscal year are as follows:
Figure 4. Safety Net Care Pool Expenditures FY 2013 - 2015
EXPENDITURE FY 2013 FY 2014 FY 2015 Public Service Hospital Safety Net Care Payment36
$332,000,000 $332,000,000 $140,000,000
Health Safety Net Trust Fund37 $128,214,686 $156,029,622 $169,244,987 Institutions for Mental Disease38 $22,000,000 $24,000,000 $24,000,000 Special Population State-Owned Non-Acute Hospitals Operated by the Department of Public Health39
$43,000,000 $45,000,000 $45,000,000
State-Owned Non-Acute Hospitals Operated by the Department of Mental Health40
$74,000,000 $77,000,000 $77,000,000
Designated State Health Program41 $310,000,000 $130,000,000 $385,000,000 DSHP – Commonwealth Transition Care42 N/A $139,500,000 $175,400,000 DHSP – Temporary Coverage43 N/A $194,300,000 $560,200,000 DHSP – Connector Care44 $0 $0 $41,800,000 Delivery System Transformation Initiatives (DSTI)45
$208,471,392 $208,283,231 $209,333,333
Cambridge Health Alliance (CHA) Public Hospital Transformation and Incentive Initiatives46
N/A N/A $220,000,000
Infrastructure and Capacity-Building47 $8,962,090 $14,299,867 $20,000,000 There are expenditures in the above table that do not relate to acute care hospitals. These expenditures are those for Institutions for Mental Disease, Special Population State-Owned Non-Acute Hospitals Operated by the Department of Public Health, State-Owned Non-Acute Hospitals Operated by the Department of Mental Health, and Designate State Health Programs. The amounts for these expenditures were compared to the reporting on the CMS-64 and limits
36 Dollar amounts obtained from the following files from EOHHS on November 6, 2015: 2013 - FY 2013 Hospital Supp Payments- SPA and Waiver corrected 11.06.2015.xlsx; 2014 - FY 2014 Hospital Supp Payments- SPA and Waiver corrected 11.06.2015.xlsx; and 2015 - FY 2015 Hospital Supp Payments- SPA and Waiver corrected 11.06.2015.xlsx. 37 Ibid. 38 Dollar amounts obtained from MA 1115 Waiver Budget Neutrality Update - 1-8-16 final.xlsx provided by EOHHS on January 15, 2016. 39 Ibid. 40 Ibid. 41 Ibid. 42 Ibid. 43 Ibid. 44 Ibid. 45 Dollar amounts obtained from the following files from EOHHS on November 6, 2015: 2013 - FY 2013 Hospital Supp Payments- SPA and Waiver corrected 11.06.2015.xlsx; 2014 - FY 2014 Hospital Supp Payments- SPA and Waiver corrected 11.06.2015.xlsx; and 2015 - FY 2015 Hospital Supp Payments- SPA and Waiver corrected 11.06.2015.xlsx. 46 Ibid. 47 Ibid.
EVALUATION OF SAFETY NET CARE POOL (SNCP) FINANCING REPORT
Page 22 of 166 February 1, 2016
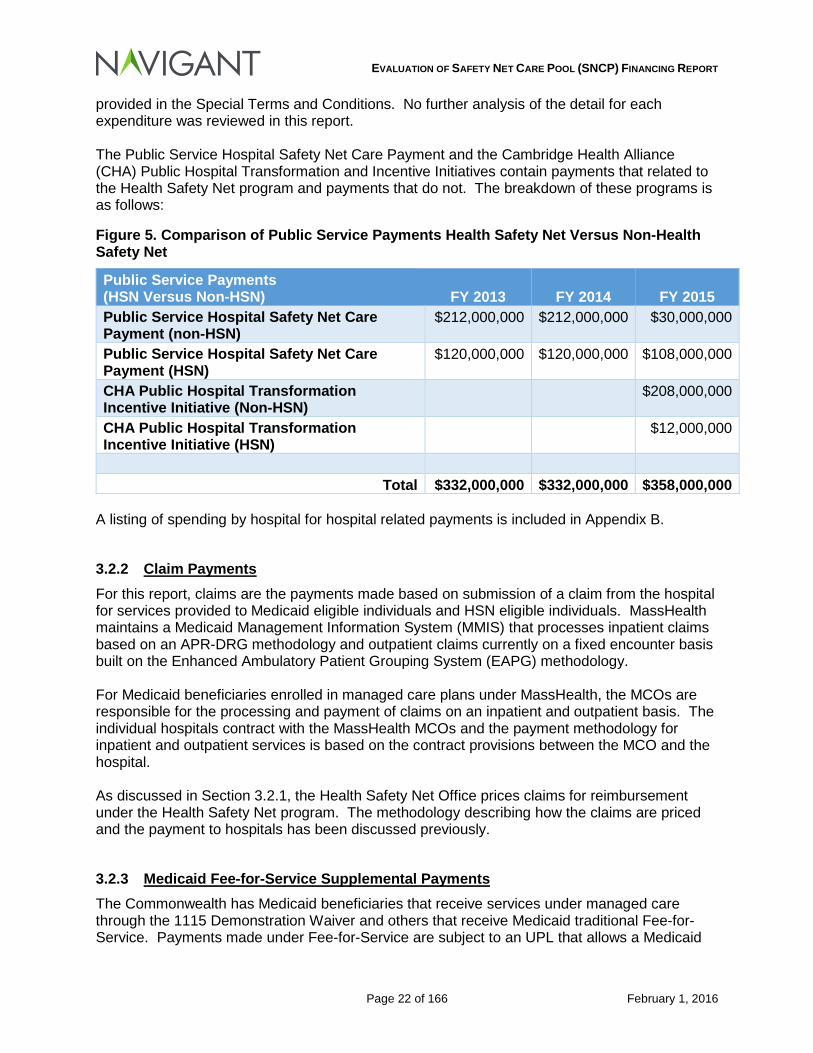
provided in the Special Terms and Conditions. No further analysis of the detail for each expenditure was reviewed in this report. The Public Service Hospital Safety Net Care Payment and the Cambridge Health Alliance (CHA) Public Hospital Transformation and Incentive Initiatives contain payments that related to the Health Safety Net program and payments that do not. The breakdown of these programs is as follows:
Figure 5. Comparison of Public Service Payments Health Safety Net Versus Non-Health Safety Net
Public Service Payments (HSN Versus Non-HSN) FY 2013 FY 2014 FY 2015 Public Service Hospital Safety Net Care Payment (non-HSN)
$212,000,000 $212,000,000 $30,000,000
Public Service Hospital Safety Net Care Payment (HSN)
$120,000,000 $120,000,000 $108,000,000
CHA Public Hospital Transformation Incentive Initiative (Non-HSN)
$208,000,000
CHA Public Hospital Transformation Incentive Initiative (HSN)
$12,000,000
Total $332,000,000 $332,000,000 $358,000,000
A listing of spending by hospital for hospital related payments is included in Appendix B.
3.2.2 Claim Payments For this report, claims are the payments made based on submission of a claim from the hospital for services provided to Medicaid eligible individuals and HSN eligible individuals. MassHealth maintains a Medicaid Management Information System (MMIS) that processes inpatient claims based on an APR-DRG methodology and outpatient claims currently on a fixed encounter basis built on the Enhanced Ambulatory Patient Grouping System (EAPG) methodology. For Medicaid beneficiaries enrolled in managed care plans under MassHealth, the MCOs are responsible for the processing and payment of claims on an inpatient and outpatient basis. The individual hospitals contract with the MassHealth MCOs and the payment methodology for inpatient and outpatient services is based on the contract provisions between the MCO and the hospital. As discussed in Section 3.2.1, the Health Safety Net Office prices claims for reimbursement under the Health Safety Net program. The methodology describing how the claims are priced and the payment to hospitals has been discussed previously.
3.2.3 Medicaid Fee-for-Service Supplemental Payments The Commonwealth has Medicaid beneficiaries that receive services under managed care through the 1115 Demonstration Waiver and others that receive Medicaid traditional Fee-for-Service. Payments made under Fee-for-Service are subject to an UPL that allows a Medicaid
EVALUATION OF SAFETY NET CARE POOL (SNCP) FINANCING REPORT
Page 23 of 166 February 1, 2016
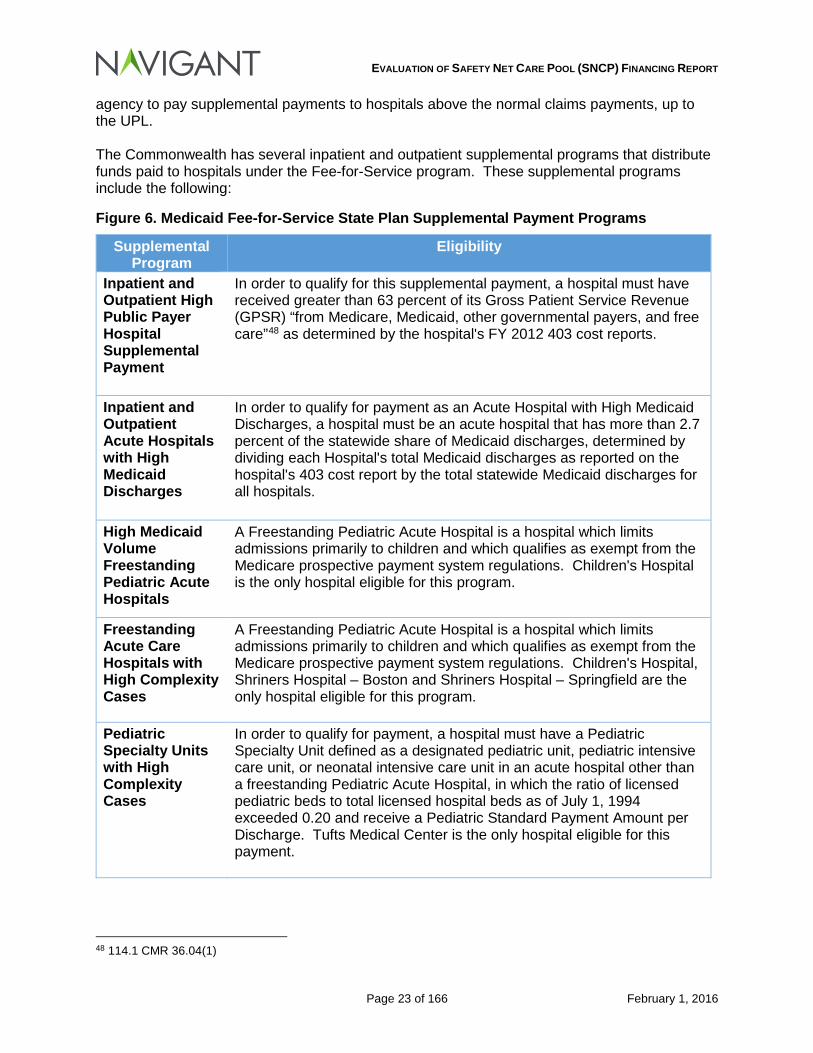
agency to pay supplemental payments to hospitals above the normal claims payments, up to the UPL. The Commonwealth has several inpatient and outpatient supplemental programs that distribute funds paid to hospitals under the Fee-for-Service program. These supplemental programs include the following:
Figure 6. Medicaid Fee-for-Service State Plan Supplemental Payment Programs
Supplemental Program
Eligibility
Inpatient and Outpatient High Public Payer Hospital Supplemental Payment
In order to qualify for this supplemental payment, a hospital must have received greater than 63 percent of its Gross Patient Service Revenue (GPSR) “from Medicare, Medicaid, other governmental payers, and free care”48 as determined by the hospital's FY 2012 403 cost reports.
Inpatient and Outpatient Acute Hospitals with High Medicaid Discharges
In order to qualify for payment as an Acute Hospital with High Medicaid Discharges, a hospital must be an acute hospital that has more than 2.7 percent of the statewide share of Medicaid discharges, determined by dividing each Hospital's total Medicaid discharges as reported on the hospital's 403 cost report by the total statewide Medicaid discharges for all hospitals.
High Medicaid Volume Freestanding Pediatric Acute Hospitals
A Freestanding Pediatric Acute Hospital is a hospital which limits admissions primarily to children and which qualifies as exempt from the Medicare prospective payment system regulations. Children's Hospital is the only hospital eligible for this program.
Freestanding Acute Care Hospitals with High Complexity Cases
A Freestanding Pediatric Acute Hospital is a hospital which limits admissions primarily to children and which qualifies as exempt from the Medicare prospective payment system regulations. Children's Hospital, Shriners Hospital – Boston and Shriners Hospital – Springfield are the only hospital eligible for this program.
Pediatric Specialty Units with High Complexity Cases
In order to qualify for payment, a hospital must have a Pediatric Specialty Unit defined as a designated pediatric unit, pediatric intensive care unit, or neonatal intensive care unit in an acute hospital other than a freestanding Pediatric Acute Hospital, in which the ratio of licensed pediatric beds to total licensed hospital beds as of July 1, 1994 exceeded 0.20 and receive a Pediatric Standard Payment Amount per Discharge. Tufts Medical Center is the only hospital eligible for this payment.
48 114.1 CMR 36.04(1)
EVALUATION OF SAFETY NET CARE POOL (SNCP) FINANCING REPORT
Page 24 of 166 February 1, 2016
Supplemental Program
Eligibility
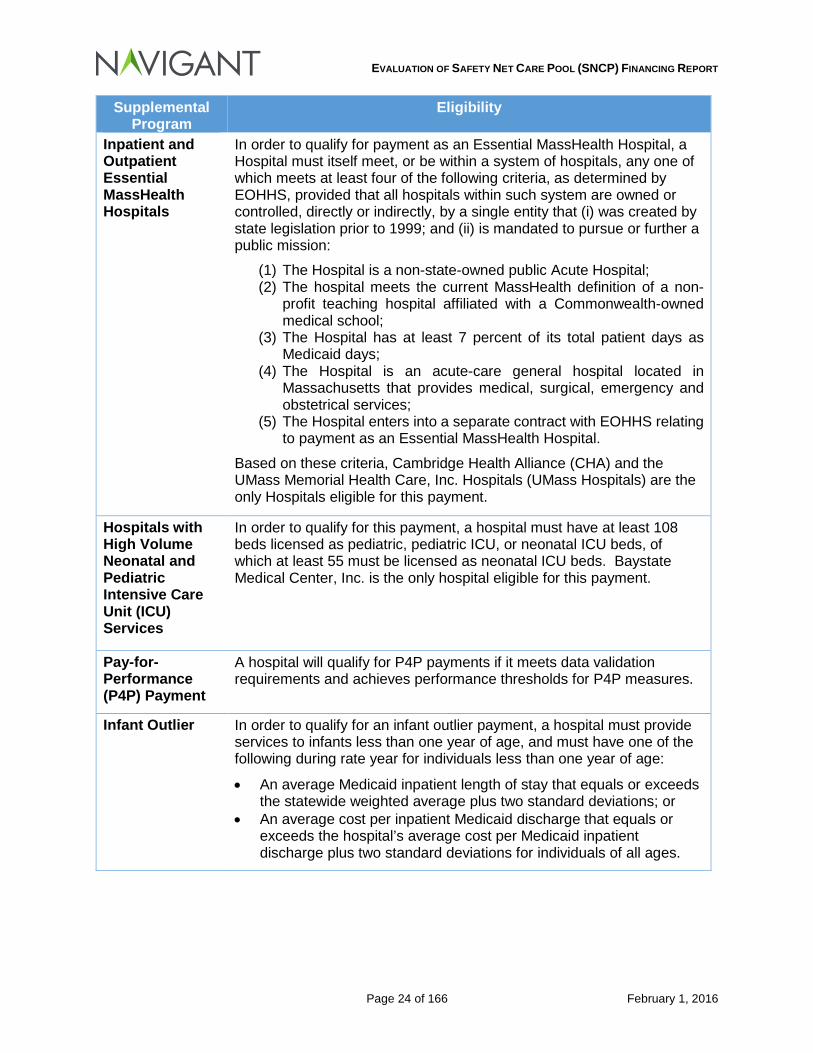
Inpatient and Outpatient Essential MassHealth Hospitals
In order to qualify for payment as an Essential MassHealth Hospital, a Hospital must itself meet, or be within a system of hospitals, any one of which meets at least four of the following criteria, as determined by EOHHS, provided that all hospitals within such system are owned or controlled, directly or indirectly, by a single entity that (i) was created by state legislation prior to 1999; and (ii) is mandated to pursue or further a public mission:
(1) The Hospital is a non-state-owned public Acute Hospital; (2) The hospital meets the current MassHealth definition of a non-
profit teaching hospital affiliated with a Commonwealth-owned medical school;
(3) The Hospital has at least 7 percent of its total patient days as Medicaid days;
(4) The Hospital is an acute-care general hospital located in Massachusetts that provides medical, surgical, emergency and obstetrical services;
(5) The Hospital enters into a separate contract with EOHHS relating to payment as an Essential MassHealth Hospital.
Based on these criteria, Cambridge Health Alliance (CHA) and the UMass Memorial Health Care, Inc. Hospitals (UMass Hospitals) are the only Hospitals eligible for this payment.
Hospitals with High Volume Neonatal and Pediatric Intensive Care Unit (ICU) Services
In order to qualify for this payment, a hospital must have at least 108 beds licensed as pediatric, pediatric ICU, or neonatal ICU beds, of which at least 55 must be licensed as neonatal ICU beds. Baystate Medical Center, Inc. is the only hospital eligible for this payment.
Pay-for-Performance (P4P) Payment
A hospital will qualify for P4P payments if it meets data validation requirements and achieves performance thresholds for P4P measures.
Infant Outlier In order to qualify for an infant outlier payment, a hospital must provide services to infants less than one year of age, and must have one of the following during rate year for individuals less than one year of age:
• An average Medicaid inpatient length of stay that equals or exceeds the statewide weighted average plus two standard deviations; or
• An average cost per inpatient Medicaid discharge that equals or exceeds the hospital’s average cost per Medicaid inpatient discharge plus two standard deviations for individuals of all ages.
EVALUATION OF SAFETY NET CARE POOL (SNCP) FINANCING REPORT
Page 25 of 166 February 1, 2016
Supplemental Program
Eligibility
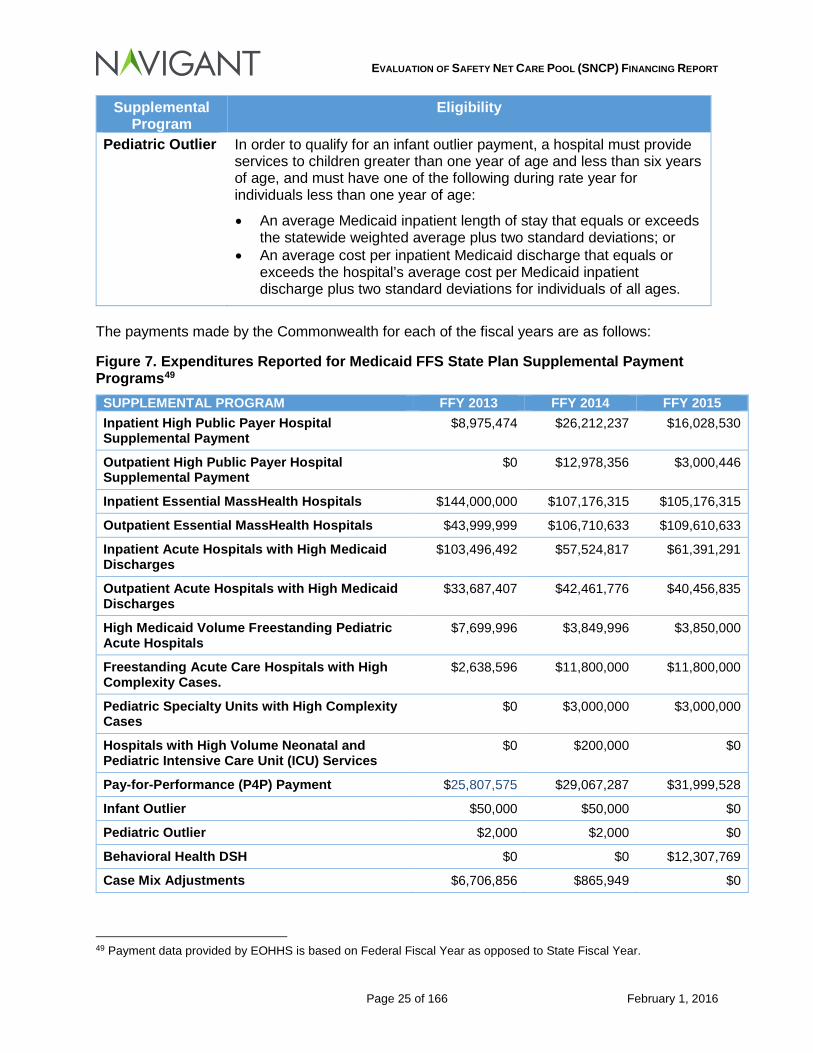
Pediatric Outlier In order to qualify for an infant outlier payment, a hospital must provide services to children greater than one year of age and less than six years of age, and must have one of the following during rate year for individuals less than one year of age:
• An average Medicaid inpatient length of stay that equals or exceeds the statewide weighted average plus two standard deviations; or
• An average cost per inpatient Medicaid discharge that equals or exceeds the hospital’s average cost per Medicaid inpatient discharge plus two standard deviations for individuals of all ages.
The payments made by the Commonwealth for each of the fiscal years are as follows:
Figure 7. Expenditures Reported for Medicaid FFS State Plan Supplemental Payment Programs49
SUPPLEMENTAL PROGRAM FFY 2013 FFY 2014 FFY 2015 Inpatient High Public Payer Hospital Supplemental Payment
$8,975,474 $26,212,237 $16,028,530
Outpatient High Public Payer Hospital Supplemental Payment
$0 $12,978,356 $3,000,446
Inpatient Essential MassHealth Hospitals $144,000,000 $107,176,315 $105,176,315
Outpatient Essential MassHealth Hospitals $43,999,999 $106,710,633 $109,610,633
Inpatient Acute Hospitals with High Medicaid Discharges
$103,496,492 $57,524,817 $61,391,291
Outpatient Acute Hospitals with High Medicaid Discharges
$33,687,407 $42,461,776 $40,456,835
High Medicaid Volume Freestanding Pediatric Acute Hospitals
$7,699,996 $3,849,996 $3,850,000
Freestanding Acute Care Hospitals with High Complexity Cases.
$2,638,596 $11,800,000 $11,800,000
Pediatric Specialty Units with High Complexity Cases
$0 $3,000,000 $3,000,000
Hospitals with High Volume Neonatal and Pediatric Intensive Care Unit (ICU) Services
$0 $200,000 $0
Pay-for-Performance (P4P) Payment $25,807,575 $29,067,287 $31,999,528
Infant Outlier $50,000 $50,000 $0
Pediatric Outlier $2,000 $2,000 $0
Behavioral Health DSH $0 $0 $12,307,769
Case Mix Adjustments $6,706,856 $865,949 $0
49 Payment data provided by EOHHS is based on Federal Fiscal Year as opposed to State Fiscal Year.
EVALUATION OF SAFETY NET CARE POOL (SNCP) FINANCING REPORT
Page 26 of 166 February 1, 2016
3.3 Hospital Claim and Supplemental Payment Funding
3.3.1 Historical Mix of Funds for period July 1, 2012, through June 30, 2015
3.3.1.1 General Revenue
The majority of payments made to hospitals under Fee for Service or through the 1115 Demonstration are made by General Funds supporting the non-federal share of the payments.
3.3.1.2 Other Funding Sources
Intergovernmental Transfers: Cambridge Health Alliance provides intergovernmental transfers for payments made to the hospital under Fee for Service supplemental payment programs. Health Safety Net Trust Funds: Based on 114.6 CMR 14.03(1)(a), the non-federal share of the health safety net trust funds can be comprised as follows:
Provider payments from the Health Safety Net Trust Fund consists of:
1. revenue produced by Hospital assessments and the Surcharge on Hospital and Ambulatory Surgical Center payments;
2. funds authorized to be transferred from the Commonwealth Care Trust Fund;
3. amounts transferred from the Uncompensated Care Trust Fund;
4. any interest on monies in the Health Safety Net Trust Fund; and
5. any additional funding made available through appropriation by the general court.
3.3.2 Review of CMS-64 Reports Medicaid agencies are required to file the CMS-64 report on a quarterly basis. This report represents the actual expenditures “for which states are entitled to federal reimbursement under Title XIX and which reconciles the monetary advance made on the basis of Form CMS-37 filed previously for the same quarter.”50 Specifically related to the MassHealth demonstration waiver, the Commonwealth has the following requirement:
The state must provide quarterly expenditure reports using Form CMS-64 to report total expenditures for services provided through this demonstration under section 1115 authority that are subject to budget neutrality. This project is approved for expenditures applicable to services rendered during the demonstration period. CMS shall provide FFP for allowable demonstration expenditures only as long as they do not exceed the pre-defined limits on the expenditures as specified in section XI of the STCs.51
The MassHealth Waiver Demonstration requires that the Commonwealth complete the 64.9 Waiver and 64.9P Waiver forms for various expenditures reported by the Commonwealth. The Waiver forms that are applicable to this report are as follows:
50 CMS-64 Quarterly Expense Report. https://www.cms.gov/Research-Statistics-Data-and-Systems/Computer-Data-and-Systems/MedicaidBudgetExpendSystem/CMS-64-Quarterly-Expense-Report.html 51 MassHealth Demonstration Approval Period: December 20, 2011 through June 30, 2014. Amended October 1, 2013. Special Terms and Conditions #62.
EVALUATION OF SAFETY NET CARE POOL (SNCP) FINANCING REPORT
Page 27 of 166 February 1, 2016
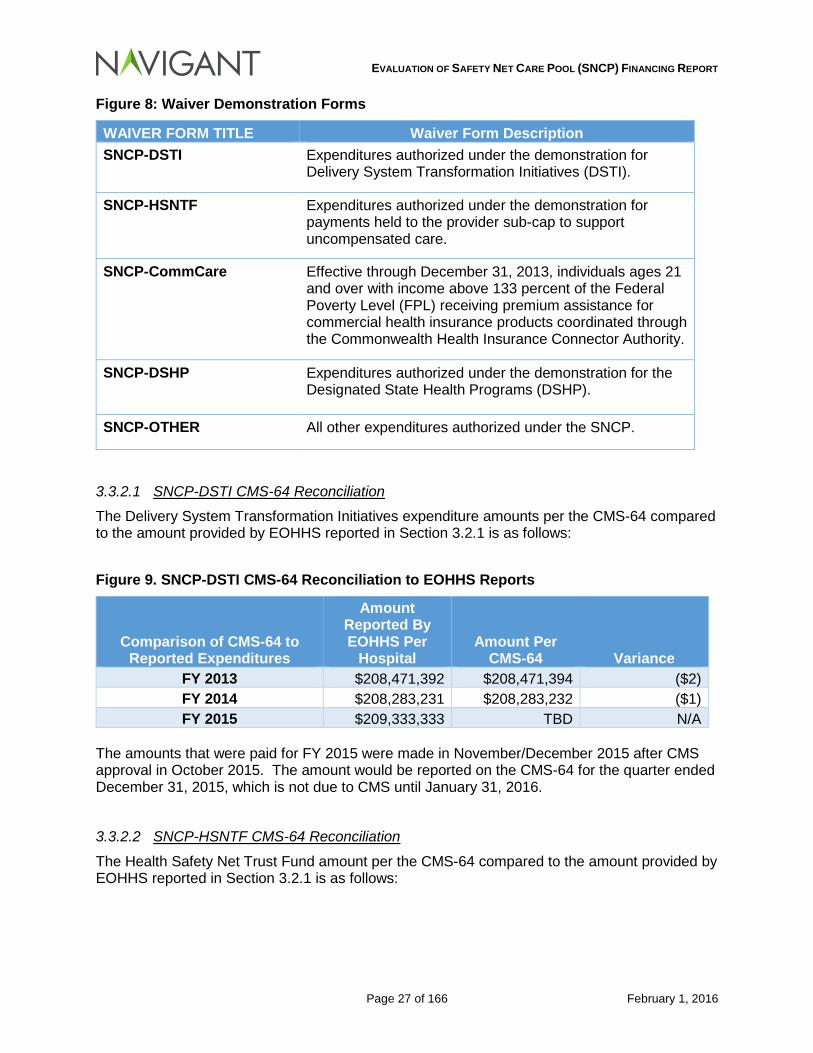
Figure 8: Waiver Demonstration Forms
WAIVER FORM TITLE Waiver Form Description SNCP-DSTI Expenditures authorized under the demonstration for
Delivery System Transformation Initiatives (DSTI).
SNCP-HSNTF Expenditures authorized under the demonstration for payments held to the provider sub-cap to support uncompensated care.
SNCP-CommCare Effective through December 31, 2013, individuals ages 21 and over with income above 133 percent of the Federal Poverty Level (FPL) receiving premium assistance for commercial health insurance products coordinated through the Commonwealth Health Insurance Connector Authority.
SNCP-DSHP Expenditures authorized under the demonstration for the Designated State Health Programs (DSHP).
SNCP-OTHER All other expenditures authorized under the SNCP.
3.3.2.1 SNCP-DSTI CMS-64 Reconciliation
The Delivery System Transformation Initiatives expenditure amounts per the CMS-64 compared to the amount provided by EOHHS reported in Section 3.2.1 is as follows:
Figure 9. SNCP-DSTI CMS-64 Reconciliation to EOHHS Reports
Comparison of CMS-64 to Reported Expenditures
Amount Reported By EOHHS Per
Hospital Amount Per
CMS-64 Variance FY 2013 $208,471,392 $208,471,394 ($2) FY 2014 $208,283,231 $208,283,232 ($1) FY 2015 $209,333,333 TBD N/A
The amounts that were paid for FY 2015 were made in November/December 2015 after CMS approval in October 2015. The amount would be reported on the CMS-64 for the quarter ended December 31, 2015, which is not due to CMS until January 31, 2016.
3.3.2.2 SNCP-HSNTF CMS-64 Reconciliation
The Health Safety Net Trust Fund amount per the CMS-64 compared to the amount provided by EOHHS reported in Section 3.2.1 is as follows:
EVALUATION OF SAFETY NET CARE POOL (SNCP) FINANCING REPORT
Page 28 of 166 February 1, 2016
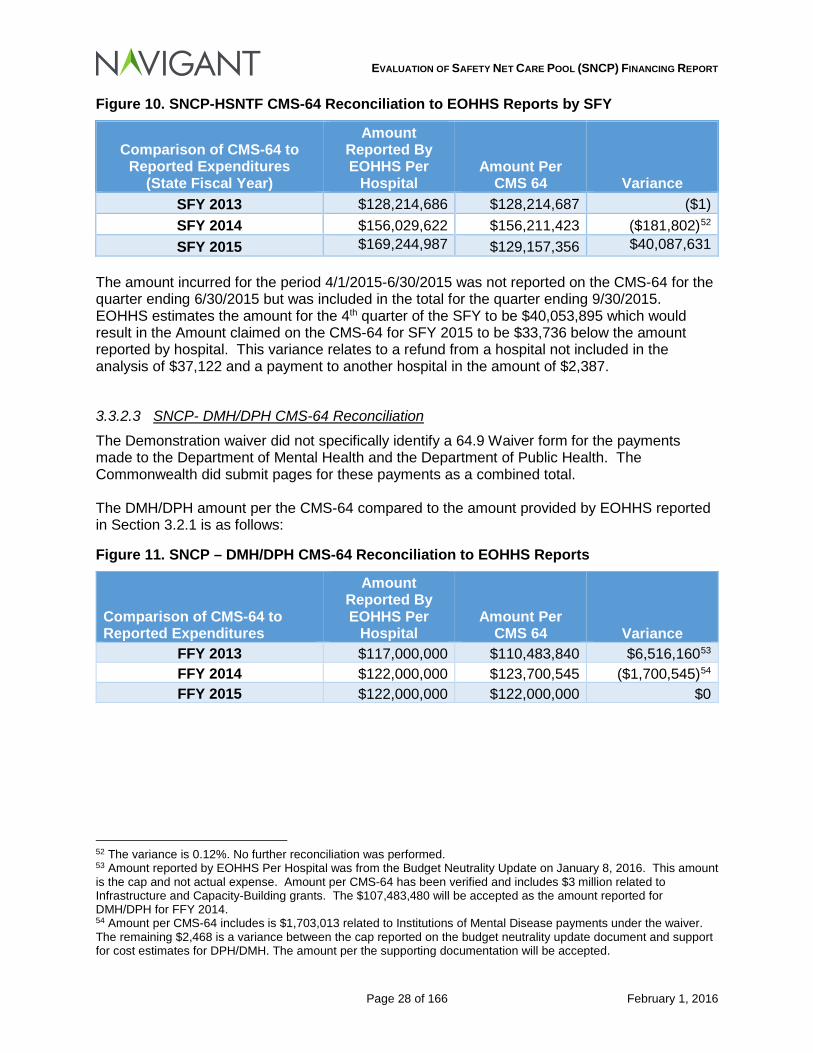
Figure 10. SNCP-HSNTF CMS-64 Reconciliation to EOHHS Reports by SFY
Comparison of CMS-64 to Reported Expenditures
(State Fiscal Year)
Amount Reported By EOHHS Per
Hospital Amount Per
CMS 64 Variance SFY 2013 $128,214,686 $128,214,687 ($1) SFY 2014 $156,029,622 $156,211,423 ($181,802)52 SFY 2015 $169,244,987 $129,157,356 $40,087,631
The amount incurred for the period 4/1/2015-6/30/2015 was not reported on the CMS-64 for the quarter ending 6/30/2015 but was included in the total for the quarter ending 9/30/2015. EOHHS estimates the amount for the 4th quarter of the SFY to be $40,053,895 which would result in the Amount claimed on the CMS-64 for SFY 2015 to be $33,736 below the amount reported by hospital. This variance relates to a refund from a hospital not included in the analysis of $37,122 and a payment to another hospital in the amount of $2,387.
3.3.2.3 SNCP- DMH/DPH CMS-64 Reconciliation
The Demonstration waiver did not specifically identify a 64.9 Waiver form for the payments made to the Department of Mental Health and the Department of Public Health. The Commonwealth did submit pages for these payments as a combined total. The DMH/DPH amount per the CMS-64 compared to the amount provided by EOHHS reported in Section 3.2.1 is as follows:
Figure 11. SNCP – DMH/DPH CMS-64 Reconciliation to EOHHS Reports
Comparison of CMS-64 to Reported Expenditures
Amount Reported By EOHHS Per
Hospital Amount Per
CMS 64 Variance FFY 2013 $117,000,000 $110,483,840 $6,516,16053 FFY 2014 $122,000,000 $123,700,545 ($1,700,545)54 FFY 2015 $122,000,000 $122,000,000 $0
52 The variance is 0.12%. No further reconciliation was performed. 53 Amount reported by EOHHS Per Hospital was from the Budget Neutrality Update on January 8, 2016. This amount is the cap and not actual expense. Amount per CMS-64 has been verified and includes $3 million related to Infrastructure and Capacity-Building grants. The $107,483,480 will be accepted as the amount reported for DMH/DPH for FFY 2014. 54 Amount per CMS-64 includes is $1,703,013 related to Institutions of Mental Disease payments under the waiver. The remaining $2,468 is a variance between the cap reported on the budget neutrality update document and support for cost estimates for DPH/DMH. The amount per the supporting documentation will be accepted.
EVALUATION OF SAFETY NET CARE POOL (SNCP) FINANCING REPORT
Page 29 of 166 February 1, 2016
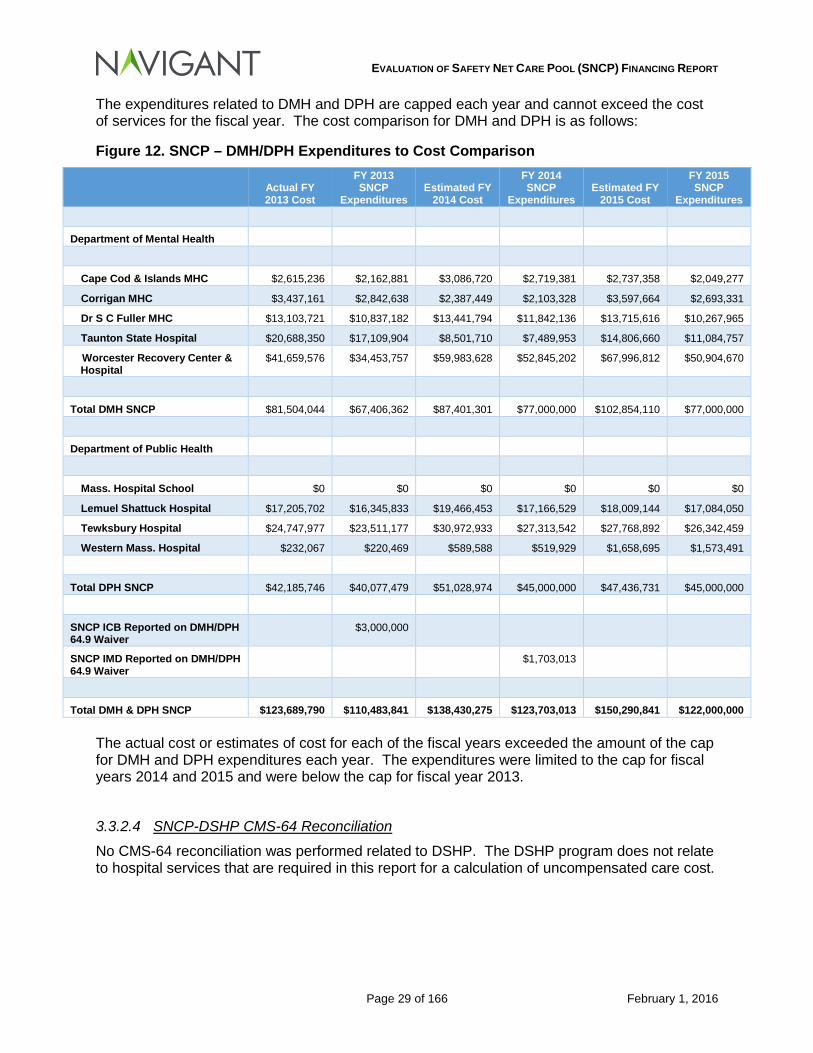
The expenditures related to DMH and DPH are capped each year and cannot exceed the cost of services for the fiscal year. The cost comparison for DMH and DPH is as follows:
Figure 12. SNCP – DMH/DPH Expenditures to Cost Comparison
Actual FY 2013 Cost
FY 2013 SNCP
Expenditures Estimated FY
2014 Cost
FY 2014 SNCP
Expenditures Estimated FY
2015 Cost
FY 2015 SNCP
Expenditures
Department of Mental Health
Cape Cod & Islands MHC $2,615,236 $2,162,881 $3,086,720 $2,719,381 $2,737,358 $2,049,277
Corrigan MHC $3,437,161 $2,842,638 $2,387,449 $2,103,328 $3,597,664 $2,693,331
Dr S C Fuller MHC $13,103,721 $10,837,182 $13,441,794 $11,842,136 $13,715,616 $10,267,965
Taunton State Hospital $20,688,350 $17,109,904 $8,501,710 $7,489,953 $14,806,660 $11,084,757
Worcester Recovery Center & Hospital
$41,659,576 $34,453,757 $59,983,628 $52,845,202 $67,996,812 $50,904,670
Total DMH SNCP $81,504,044 $67,406,362 $87,401,301 $77,000,000 $102,854,110 $77,000,000
Department of Public Health
Mass. Hospital School $0 $0 $0 $0 $0 $0
Lemuel Shattuck Hospital $17,205,702 $16,345,833 $19,466,453 $17,166,529 $18,009,144 $17,084,050
Tewksbury Hospital $24,747,977 $23,511,177 $30,972,933 $27,313,542 $27,768,892 $26,342,459
Western Mass. Hospital $232,067 $220,469 $589,588 $519,929 $1,658,695 $1,573,491
Total DPH SNCP $42,185,746 $40,077,479 $51,028,974 $45,000,000 $47,436,731 $45,000,000
SNCP ICB Reported on DMH/DPH 64.9 Waiver
$3,000,000
SNCP IMD Reported on DMH/DPH 64.9 Waiver
$1,703,013
Total DMH & DPH SNCP $123,689,790 $110,483,841 $138,430,275 $123,703,013 $150,290,841 $122,000,000 The actual cost or estimates of cost for each of the fiscal years exceeded the amount of the cap for DMH and DPH expenditures each year. The expenditures were limited to the cap for fiscal years 2014 and 2015 and were below the cap for fiscal year 2013.
3.3.2.4 SNCP-DSHP CMS-64 Reconciliation
No CMS-64 reconciliation was performed related to DSHP. The DSHP program does not relate to hospital services that are required in this report for a calculation of uncompensated care cost.
EVALUATION OF SAFETY NET CARE POOL (SNCP) FINANCING REPORT
Page 30 of 166 February 1, 2016
3.3.2.5 SNCP – CommCare CMS-64 Reconciliation
No CMS-64 reconciliation was performed related to Commonwealth Care Expenditures. The CommCare program does not relate to hospital services that are required in this report for a calculation of uncompensated care cost.
3.4 Conclusions Drawn The funding streams provided to hospitals through hospital claim, SNCP and other supplemental payment programs are numerous and complex, and the levels of funding are significant. In the next section, we make comparisons of payments made through these programs to the costs associated with services provided by hospitals, including both the MassHealth eligible populations and the uninsured populations.
EVALUATION OF SAFETY NET CARE POOL (SNCP) FINANCING REPORT
Page 31 of 166 February 1, 2016
4 Adequacy, and Effect on Provider Financing
4.1 Analysis of SNCP Funding Relative to Costs of Services
4.1.1 By Hospital Comparison of Payments to Costs, before SNCP Payments The “Safety Net Care Pool Financing Report” (Special Term and Conditions #54) requires the determination of uncompensated care cost from July 1, 2012 to June 30, 2015. Uncompensated care cost has been calculated for 2013 and 2014 based on cost reports submitted by the hospitals. Uncompensated care cost for 2015 could not be calculated because hospitals have not submitted cost reports for 2015 as of the filing of this report. In order to calculate uncompensated care cost for this report, a request was made for all Massachusetts hospitals to complete the Uniform Medicaid & Uncompensated Care Cost & Charge Report (UCCR) defined in the MassHealth SNCP Uncompensated Care Cost Limit Protocol. Hospitals were informed that if they did not submit a UCCR, that the already filed 403 cost report would be used for their facility. Some hospital financial staff felt that the UCCR would more accurately capture uncompensated care costs. Nevertheless, due to the timing of the request, not being familiar with the reporting requirements, and other factors addressed by various hospitals, only 12 of the 57 hospitals analyzed for this report submitted UCCR reports. For the hospitals that did not submit a UCCR, the hospital’s filing of the DHCFP-403 (Hospital Statement of Costs, Revenues, and Statistics) was used to determine the uncompensated care cost. The Safety Net Care Pool Financing Report (STC #54) did not detail how uncompensated care cost would be determined for Medicaid eligible individuals, individuals with services reimbursed through the Health Safety Net, or individuals otherwise uninsured. As such, the MassHealth SNCP Uncompensated Care Cost Limit Protocol and the CMS General DSH Audit Reporting Protocol were applied as guides in the determination of the uncompensated care cost. Therefore, uncompensated care costs were calculated for hospital services, hospital based physician services and ”expenditures for payments to providers is authorized under the safety net care pool to support uncompensated care for ’Medicaid FFS, Medicaid managed care, and low-income uninsured individuals.’”55 Cost were calculated for the following categories:
• Medicaid FFS • Medicaid MCO • Uninsured (Health Safety Net and Self Pay)
During 2013 and 2014, hospitals provided services to individuals under the Commonwealth Care program, and for part of 2015. Due to changes in Medicaid eligibility under the ACA, the program was no longer reimbursable under the Demonstration as of February 28, 2015. The program was terminated as of that date, with individuals transitioning to either Medicaid or Marketplace coverage based on their eligibility under the ACA. For purposes of this report, the Commonwealth Care uncompensated care costs have been included in the Medicaid Managed Care amount. In determining uncompensated care costs for this report (i.e., the difference between payments and costs), all base payments, supplemental payments and payments made under the 1115
5555 MassHealth 1115 Demonstration Waiver Approved October 30, 2014 for the period of October 30, 2014 through June 30, 2019. Attachment H Page 21.
EVALUATION OF SAFETY NET CARE POOL (SNCP) FINANCING REPORT
Page 32 of 166 February 1, 2016
Demonstration are applied to the cost of services. This approach deviates from the MassHealth SNCP Uncompensated Care Cost Limit Protocol that excludes the following payments from the determination of uncompensated care cost:
• Pay-for-performance payments made under the Medicaid state plan; • Delivery System Transformation Initiative payments made under the 1115 Demonstration; • The Cambridge Health Alliance Public Hospital Transformation and Incentive Payments
made under the 1115 Demonstration; • Infrastructure and Capacity Building Payments made under the 1115 Demonstration
These payments are included in this report because the requirements of this report state that the “evaluation must include all payment types under the SNCP, including uncompensated care payments, Delivery System Transformation Initiative and Infrastructure Capacity Building grants.”56 The amounts that will be reported in the following sections will be based on the net benefit of payments to the hospitals. Cambridge Health Alliance pays the non-Federal share of Medicaid State Plan Supplemental payments and Waiver Demonstration payments and reporting expenditures at the gross amount overstates the actual impact of payments to the hospital.
4.1.1.1 Medicaid FFS
Approximately 46 percent of the Medicaid services provided by acute hospitals in the Commonwealth were paid through the traditional Fee-for-Service methodology (interim paid claims and supplemental payments)57. Below is the comparison of Fee-for-Service claims-based payments and estimated costs; note that payment amounts shown below do not include any supplemental payments:
56 MassHealth 1115 Demonstration Waiver Approved October 30, 2014 for the period of October 30, 2014 through June 30, 2019. STC #54 Safety Net Care Pool Financing Report Page 67. 57 Based on 2014 information.
EVALUATION OF SAFETY NET CARE POOL (SNCP) FINANCING REPORT
Page 33 of 166 February 1, 2016
Figure 13. Uncompensated Cost of Care of Medicaid Fee-for-Service Before Supplemental Payments
MEDICAID FFS 2013 2014 Inpatient Cost – Hospital $904,276,169 $935,950,651 Outpatient Cost – Hospital $791,637,268 $873,607,258 Portion of Gross HSN Assessment – Hospital $15,349,696 $16,438,239
Total Cost – Hospital $1,711,263,133 $1,825,996,148 Base Payments – Hospital ($1,284,548,332) ($1,318,244,568)
Uncompensated Care Prior To Supplemental – Hospital
$426,714,801 $507,751,580
Total Cost – Physician $76,750,351 $62,780,270
Base Payments – Physician ($39,572,623) ($34,832,983) Uncompensated Care Prior To Supplemental – Physician
$37,177,728 $27,947,287
Uncompensated Care Prior To Supplemental – Hospital
$426,714,801 $507,751,580
Uncompensated Care Prior To Supplemental – Physician
$37,177,728 $27,947,287
Uncompensated Care Prior To Supplemental – Total $463,892,529 $535,698,867 To see the above information by individual hospital, please see Appendix C. Acute care hospitals incur significant uncompensated care cost prior to the payment of Medicaid supplemental payments made under the Medicaid State Plan. When comparing the supplemental payments made to hospitals to the uncompensated care cost reported above, the adjusted uncompensated care cost is as follows:
Figure 14. Uncompensated Cost of Care of Medicaid Fee-for-Service after Medicaid State Plan Supplemental Payments – Combined Hospital and Physician
MEDICAID FFS UNCOMPENSATED CARE 2013 2014 Prior To Supplemental $463,892,529 $535,698,867 Less: Supplemental Payments ($192,028,207) ($252,506,409) Net of Supplemental $271,864,323 $283,192,458
The Acute Hospitals with High Medicaid Discharges inpatient and outpatient supplemental payments High Medicaid Volume Freestanding Pediatric Acute Supplemental payments are not included in the supplemental payments listed above although they are reported in Section 3.2.3 of this report as a supplemental payment made under the State Plan. These payments relate to Health Safety Net payments made to hospitals and are included in the net patient revenue of Health Safety Net for determination of uncompensated care cost for the uninsured. One measurement of the sustainability of services provided under a health program is the percentage of cost of services that are reimbursed. CMS places an emphasis on ensuring that
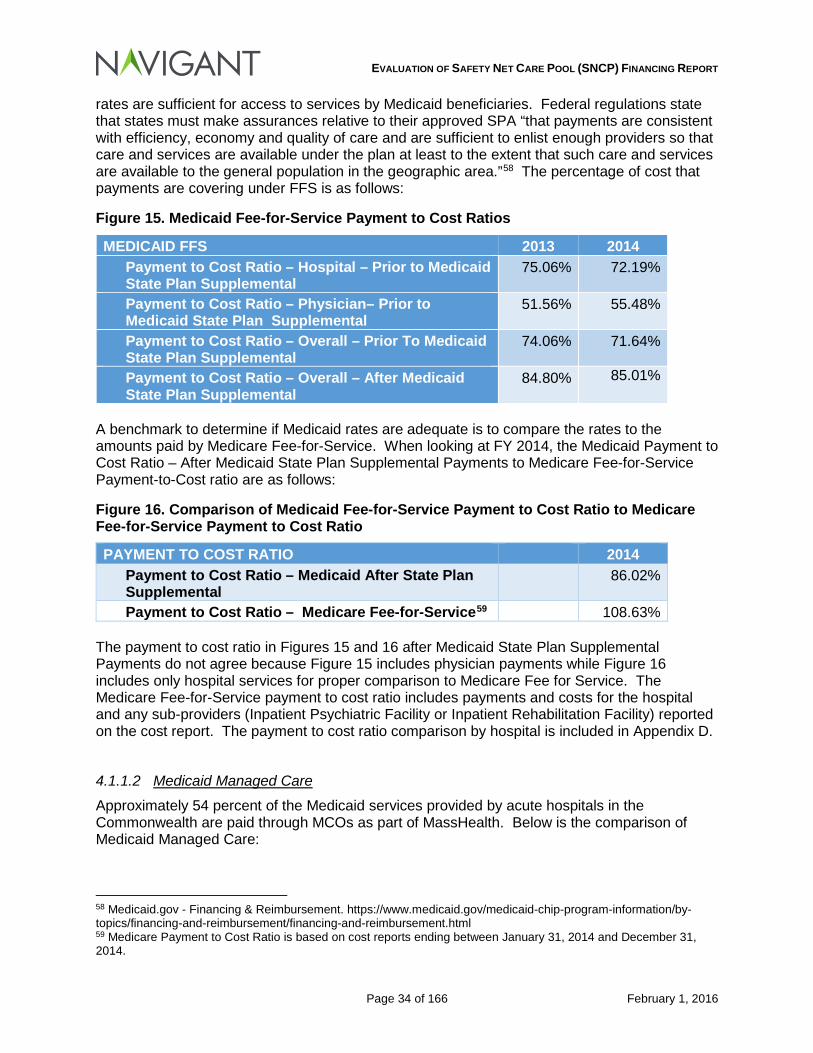
EVALUATION OF SAFETY NET CARE POOL (SNCP) FINANCING REPORT
Page 34 of 166 February 1, 2016
rates are sufficient for access to services by Medicaid beneficiaries. Federal regulations state that states must make assurances relative to their approved SPA “that payments are consistent with efficiency, economy and quality of care and are sufficient to enlist enough providers so that care and services are available under the plan at least to the extent that such care and services are available to the general population in the geographic area.”58 The percentage of cost that payments are covering under FFS is as follows:
Figure 15. Medicaid Fee-for-Service Payment to Cost Ratios
MEDICAID FFS 2013 2014 Payment to Cost Ratio – Hospital – Prior to Medicaid State Plan Supplemental
75.06% 72.19%
Payment to Cost Ratio – Physician– Prior to Medicaid State Plan Supplemental
51.56% 55.48%
Payment to Cost Ratio – Overall – Prior To Medicaid State Plan Supplemental
74.06% 71.64%
Payment to Cost Ratio – Overall – After Medicaid State Plan Supplemental
84.80% 85.01%
A benchmark to determine if Medicaid rates are adequate is to compare the rates to the amounts paid by Medicare Fee-for-Service. When looking at FY 2014, the Medicaid Payment to Cost Ratio – After Medicaid State Plan Supplemental Payments to Medicare Fee-for-Service Payment-to-Cost ratio are as follows:
Figure 16. Comparison of Medicaid Fee-for-Service Payment to Cost Ratio to Medicare Fee-for-Service Payment to Cost Ratio
PAYMENT TO COST RATIO 2014 Payment to Cost Ratio – Medicaid After State Plan Supplemental
86.02%
Payment to Cost Ratio – Medicare Fee-for-Service59 108.63% The payment to cost ratio in Figures 15 and 16 after Medicaid State Plan Supplemental Payments do not agree because Figure 15 includes physician payments while Figure 16 includes only hospital services for proper comparison to Medicare Fee for Service. The Medicare Fee-for-Service payment to cost ratio includes payments and costs for the hospital and any sub-providers (Inpatient Psychiatric Facility or Inpatient Rehabilitation Facility) reported on the cost report. The payment to cost ratio comparison by hospital is included in Appendix D.
4.1.1.2 Medicaid Managed Care
Approximately 54 percent of the Medicaid services provided by acute hospitals in the Commonwealth are paid through MCOs as part of MassHealth. Below is the comparison of Medicaid Managed Care:
58 Medicaid.gov - Financing & Reimbursement. https://www.medicaid.gov/medicaid-chip-program-information/by-topics/financing-and-reimbursement/financing-and-reimbursement.html 59 Medicare Payment to Cost Ratio is based on cost reports ending between January 31, 2014 and December 31, 2014.
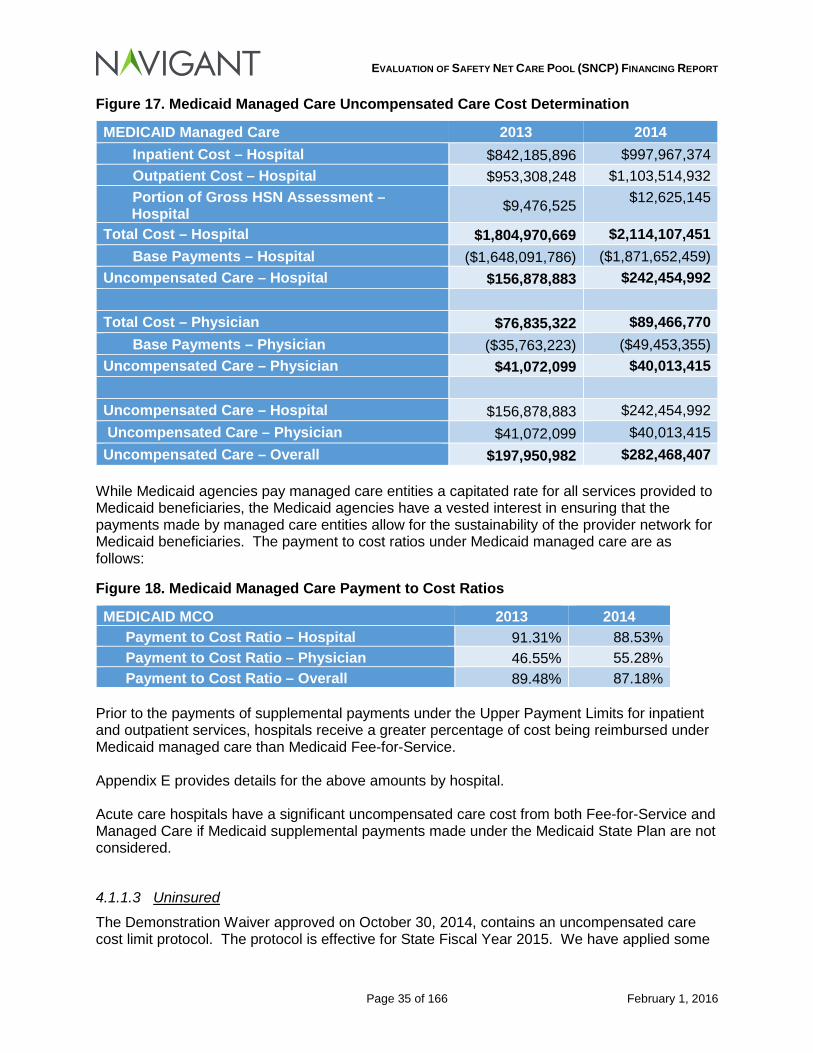
EVALUATION OF SAFETY NET CARE POOL (SNCP) FINANCING REPORT
Page 35 of 166 February 1, 2016
Figure 17. Medicaid Managed Care Uncompensated Care Cost Determination
MEDICAID Managed Care 2013 2014 Inpatient Cost – Hospital $842,185,896 $997,967,374 Outpatient Cost – Hospital $953,308,248 $1,103,514,932 Portion of Gross HSN Assessment – Hospital $9,476,525 $12,625,145
Total Cost – Hospital $1,804,970,669 $2,114,107,451 Base Payments – Hospital ($1,648,091,786) ($1,871,652,459)
Uncompensated Care – Hospital $156,878,883 $242,454,992 Total Cost – Physician $76,835,322 $89,466,770
Base Payments – Physician ($35,763,223) ($49,453,355) Uncompensated Care – Physician $41,072,099 $40,013,415 Uncompensated Care – Hospital $156,878,883 $242,454,992 Uncompensated Care – Physician $41,072,099 $40,013,415 Uncompensated Care – Overall $197,950,982 $282,468,407
While Medicaid agencies pay managed care entities a capitated rate for all services provided to Medicaid beneficiaries, the Medicaid agencies have a vested interest in ensuring that the payments made by managed care entities allow for the sustainability of the provider network for Medicaid beneficiaries. The payment to cost ratios under Medicaid managed care are as follows:
Figure 18. Medicaid Managed Care Payment to Cost Ratios
MEDICAID MCO 2013 2014 Payment to Cost Ratio – Hospital 91.31% 88.53% Payment to Cost Ratio – Physician 46.55% 55.28% Payment to Cost Ratio – Overall 89.48% 87.18%
Prior to the payments of supplemental payments under the Upper Payment Limits for inpatient and outpatient services, hospitals receive a greater percentage of cost being reimbursed under Medicaid managed care than Medicaid Fee-for-Service. Appendix E provides details for the above amounts by hospital. Acute care hospitals have a significant uncompensated care cost from both Fee-for-Service and Managed Care if Medicaid supplemental payments made under the Medicaid State Plan are not considered.
4.1.1.3 Uninsured
The Demonstration Waiver approved on October 30, 2014, contains an uncompensated care cost limit protocol. The protocol is effective for State Fiscal Year 2015. We have applied some
EVALUATION OF SAFETY NET CARE POOL (SNCP) FINANCING REPORT
Page 36 of 166 February 1, 2016
of the definitions that are included in the protocol for purposes of preparing the analyses used in this report. We have defined Uncompensated Care services as the following:60
HSN and Uninsured Care Inpatient and Outpatient Charges are defined as those charges associated with care provided by hospitals for medically necessary services, including services reasonably calculated to prevent, diagnose, prevent the worsening of, alleviate, correct, or cure conditions in the member that endanger life, cause suffering or pain, cause physical deformity or malfunction, threaten to cause or to aggravate a handicap, or result in illness or infirmity provided to:
• Individuals with no health insurance coverage;
• Low-Income Patients (under state regulation 114.6 CMR 12.03 (3) or (4) or its successor regulation) with no health insurance coverage;
• Low-Income Patients (under state regulation 114.6 CMR 12.03 (3) or (4) or its successor regulation) whose public or private health insurance plan does not cover the cost of the particular service (excluding unpaid coinsurance and/or deductible amounts); or
• Medicaid-eligible patients whose medical service is not paid by MassHealth or the Massachusetts Medicaid MCOs, SCO, ICO, PACE, PIHP or PAHP.
The estimated cost associated with these uninsured populations are as follows:
60 MassHealth 1115 Demonstration Waiver Approved October 30, 2014 for the period of October 30, 2014 through June 30, 2019. Attachment H Page 12.
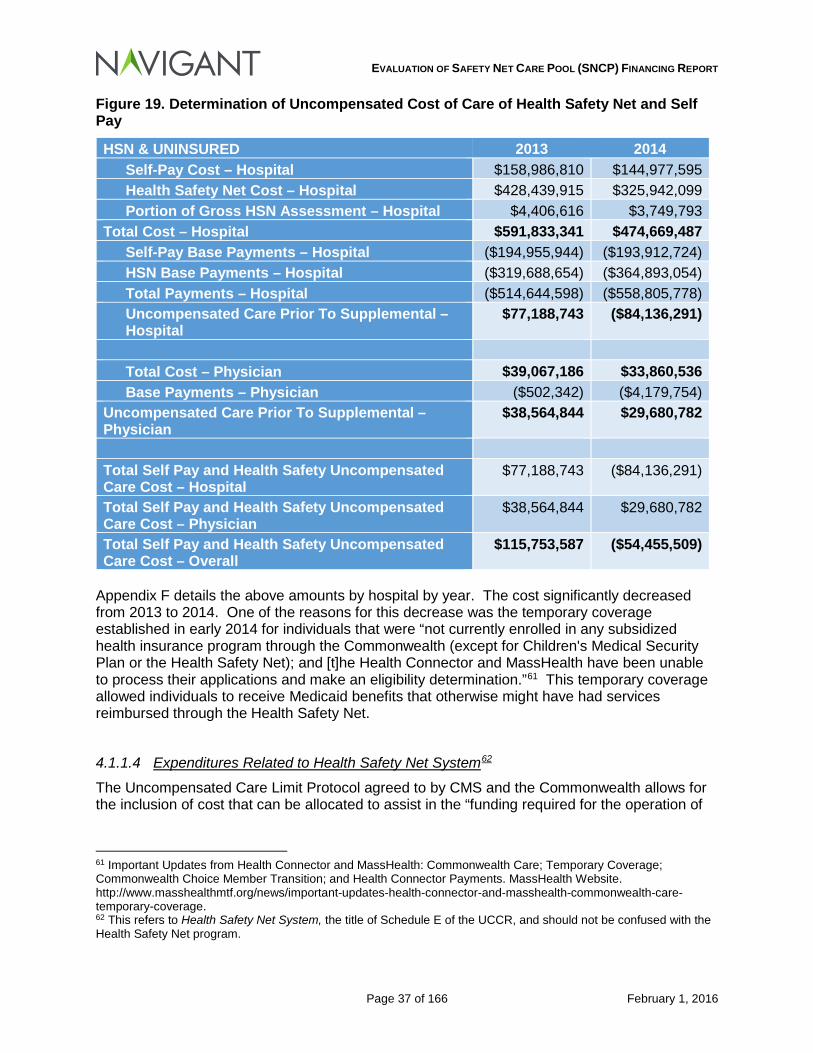
EVALUATION OF SAFETY NET CARE POOL (SNCP) FINANCING REPORT
Page 37 of 166 February 1, 2016
Figure 19. Determination of Uncompensated Cost of Care of Health Safety Net and Self Pay
HSN & UNINSURED 2013 2014 Self-Pay Cost – Hospital $158,986,810 $144,977,595 Health Safety Net Cost – Hospital $428,439,915 $325,942,099 Portion of Gross HSN Assessment – Hospital $4,406,616 $3,749,793
Total Cost – Hospital $591,833,341 $474,669,487 Self-Pay Base Payments – Hospital ($194,955,944) ($193,912,724) HSN Base Payments – Hospital ($319,688,654) ($364,893,054) Total Payments – Hospital ($514,644,598) ($558,805,778) Uncompensated Care Prior To Supplemental – Hospital
$77,188,743 ($84,136,291)
Total Cost – Physician $39,067,186 $33,860,536 Base Payments – Physician ($502,342) ($4,179,754)
Uncompensated Care Prior To Supplemental – Physician
$38,564,844 $29,680,782
Total Self Pay and Health Safety Uncompensated Care Cost – Hospital
$77,188,743 ($84,136,291)
Total Self Pay and Health Safety Uncompensated Care Cost – Physician
$38,564,844 $29,680,782
Total Self Pay and Health Safety Uncompensated Care Cost – Overall
$115,753,587 ($54,455,509)
Appendix F details the above amounts by hospital by year. The cost significantly decreased from 2013 to 2014. One of the reasons for this decrease was the temporary coverage established in early 2014 for individuals that were “not currently enrolled in any subsidized health insurance program through the Commonwealth (except for Children's Medical Security Plan or the Health Safety Net); and [t]he Health Connector and MassHealth have been unable to process their applications and make an eligibility determination.”61 This temporary coverage allowed individuals to receive Medicaid benefits that otherwise might have had services reimbursed through the Health Safety Net.
4.1.1.4 Expenditures Related to Health Safety Net System62
The Uncompensated Care Limit Protocol agreed to by CMS and the Commonwealth allows for the inclusion of cost that can be allocated to assist in the “funding required for the operation of
61 Important Updates from Health Connector and MassHealth: Commonwealth Care; Temporary Coverage; Commonwealth Choice Member Transition; and Health Connector Payments. MassHealth Website. http://www.masshealthmtf.org/news/important-updates-health-connector-and-masshealth-commonwealth-care-temporary-coverage. 62 This refers to Health Safety Net System, the title of Schedule E of the UCCR, and should not be confused with the Health Safety Net program.
EVALUATION OF SAFETY NET CARE POOL (SNCP) FINANCING REPORT
Page 38 of 166 February 1, 2016
the Safety Net Health Care System.”63 These costs include but not limited to the following items:64
• Social, Financial, Interpreter, Coordinated Care and other services for Medicaid eligible and uninsured patients
• Unreimbursed costs for Dual Eligibles
• Patient and community education programs, excluding the cost of marketing activities
• Health care for the house bound and the homeless, family planning, and pre-natal, labor, and post-natal support for at risk pregnancies
• Public Hospital Pensions and Retiree Benefits
• 340b and other pharmacy costs We conducted a review of the items submitted to ensure that duplication of expenses were not created or items specifically not allowable were not reported. Certain hospitals reported interns and residents cost and capital expenses on Schedule E. Since the UCCR uses Worksheet B Part I Column 24 from the CMS Form 2552-10 (Hospital and Hospital Health Care Complex Cost Report), the allocated cost of interns and residents and capital cost are included in determination of cost to charge ratios for the applicable cost centers. Additionally, some hospitals reported inclusion of the Gross Health Safety Net Assessment on Schedule E. The appropriate cost from the assessment has been previously calculated and excluded from this review. The UCCRs submitted by the hospitals for purposes of this report are not considered as officially submitted cost reports (i.e., not necessarily compliant with the SNCP Uncompensated Care Cost Limit Protocol). The MassHealth SNCP Uncompensated Care Cost Limit Protocol “will ensure that beginning on July 1, 2014 all provider payments for uncompensated care…will be limited on a provider-specific basis to the cost of providing Medicaid state plan services and any other additional allowable uncompensated costs of care provided to Medicaid eligible individuals and uninsured individuals, less payment received by or on behalf of such individuals for such services.”65 The UCCR is the mechanism to report such cost and will be reported on a Federal Fiscal Year (9/30). Hospitals that have a different fiscal year will need to allocate cost from the overlapping CMS 2552-10 cost reports to complete the UCCR. As such, the first official UCCR will not be submitted until at the latest May 30, 2016 as the UCCR is required to be submitted within three months of the submission of the CMS 2552-10 cost reports which would be February 29, 2016, for September 30th year-end hospitals It is recommended that EOHHS develop procedures to review Schedule E expenditures to determine if they are allowable in both the interim and final reconciliations of the UCCR. No such procedures were applied beyond the ones described in this section.
63 MassHealth 1115 Demonstration Waiver Approved October 30, 2014 for the period of October 30, 2014 through June 30, 2019. Attachment H Page 7. 64 MassHealth 1115 Demonstration Waiver amended October 1, 2013 for the Approval Period: December 20, 2011 through June 30, 2014, MassHealth STCs Appendices H-J, Page 16-18. 65 MassHealth 1115 Demonstration Waiver Approved October 30, 2014 for the period of October 30, 2014 through June 30, 2019. Page 60.
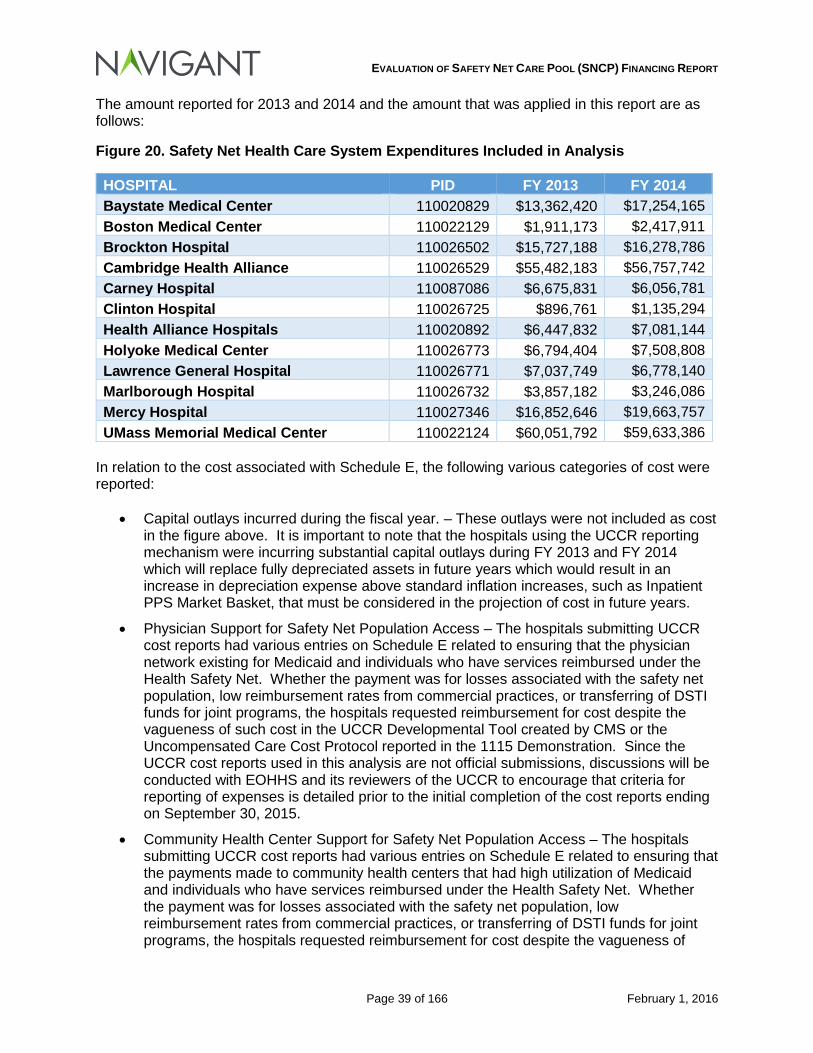
EVALUATION OF SAFETY NET CARE POOL (SNCP) FINANCING REPORT
Page 39 of 166 February 1, 2016
The amount reported for 2013 and 2014 and the amount that was applied in this report are as follows:
Figure 20. Safety Net Health Care System Expenditures Included in Analysis
In relation to the cost associated with Schedule E, the following various categories of cost were reported:
• Capital outlays incurred during the fiscal year. – These outlays were not included as cost in the figure above. It is important to note that the hospitals using the UCCR reporting mechanism were incurring substantial capital outlays during FY 2013 and FY 2014 which will replace fully depreciated assets in future years which would result in an increase in depreciation expense above standard inflation increases, such as Inpatient PPS Market Basket, that must be considered in the projection of cost in future years.
• Physician Support for Safety Net Population Access – The hospitals submitting UCCR cost reports had various entries on Schedule E related to ensuring that the physician network existing for Medicaid and individuals who have services reimbursed under the Health Safety Net. Whether the payment was for losses associated with the safety net population, low reimbursement rates from commercial practices, or transferring of DSTI funds for joint programs, the hospitals requested reimbursement for cost despite the vagueness of such cost in the UCCR Developmental Tool created by CMS or the Uncompensated Care Cost Protocol reported in the 1115 Demonstration. Since the UCCR cost reports used in this analysis are not official submissions, discussions will be conducted with EOHHS and its reviewers of the UCCR to encourage that criteria for reporting of expenses is detailed prior to the initial completion of the cost reports ending on September 30, 2015.
• Community Health Center Support for Safety Net Population Access – The hospitals submitting UCCR cost reports had various entries on Schedule E related to ensuring that the payments made to community health centers that had high utilization of Medicaid and individuals who have services reimbursed under the Health Safety Net. Whether the payment was for losses associated with the safety net population, low reimbursement rates from commercial practices, or transferring of DSTI funds for joint programs, the hospitals requested reimbursement for cost despite the vagueness of
HOSPITAL PID FY 2013 FY 2014 Baystate Medical Center 110020829 $13,362,420 $17,254,165 Boston Medical Center 110022129 $1,911,173 $2,417,911 Brockton Hospital 110026502 $15,727,188 $16,278,786 Cambridge Health Alliance 110026529 $55,482,183 $56,757,742 Carney Hospital 110087086 $6,675,831 $6,056,781 Clinton Hospital 110026725 $896,761 $1,135,294 Health Alliance Hospitals 110020892 $6,447,832 $7,081,144 Holyoke Medical Center 110026773 $6,794,404 $7,508,808 Lawrence General Hospital 110026771 $7,037,749 $6,778,140 Marlborough Hospital 110026732 $3,857,182 $3,246,086 Mercy Hospital 110027346 $16,852,646 $19,663,757 UMass Memorial Medical Center 110022124 $60,051,792 $59,633,386
EVALUATION OF SAFETY NET CARE POOL (SNCP) FINANCING REPORT
Page 40 of 166 February 1, 2016
such cost in the UCCR Developmental Tool created by CMS or the Uncompensated Care Cost Protocol reported in the 1115 Demonstration. Since the UCCR cost reports used in this analysis are not official submissions, discussions will be conducted with EOHHS and its reviewers of the UCCR to encourage that criteria for reporting of expenses is detailed prior to the initial completion of the cost reports ending on September 30, 2015.
• Medical Education Expense – Some hospitals reported cost related to the use of Medical Students from a School of Medicine. This type expense is not outlined in the UCCR Developmental Tool created by CMS or the Uncompensated Care Cost Protocol reported in the 1115 waiver demonstration. Since the UCCR cost reports used in this analysis are not official submissions, discussions will be conducted with EOHHS and its reviewers of the UCCR to encourage that criteria for reporting of expenses is detailed prior to the initial completion of the cost reports ending on September 30, 2015.
• Health care for the house bound and the homeless, family planning, and pre-natal, labor, and post-natal support for at risk pregnancies. CMS 255-10, Line 193 – The Safety Net Care Pool Uncompensated Care Cost Protocol Development Tool states the following: “These services should be included as additional allowable costs specifically because they are health care services primarily provided to Medicaid-eligible and uninsured patients, especially at safety net institutions.66” The uncertain question based on the developmental tool is whether the entire portion of the cost is allowable or the portion that relates to the Medicaid and HSN populations. Since the UCCR cost reports used in this analysis are not official submissions, discussions will be conducted with EOHHS and its reviewers of the UCCR to encourage that criteria for reporting of expenses is detailed prior to the initial completion of the cost reports ending on September 30, 2015.
4.1.2 Safety Net Care Pool (SNCP) Program
4.1.2.1 Analysis of SNCP Payments compared to Medicaid FFS and Medicaid Managed Care Uncompensated Care (Payment Shortfall) by Hospital
In Aggregate, by Hospital The total uncompensated care cost for this report prior to considering any offsets related to funding under the Safety Net Care Pool program that does not relate to the Health Safety Net program is as follows:
66 MassHealth 1115 Demonstration Waiver Approved October 1, 2013 for the period of December 20, 2011 through June 30, 2014. Attachment H Page 17.
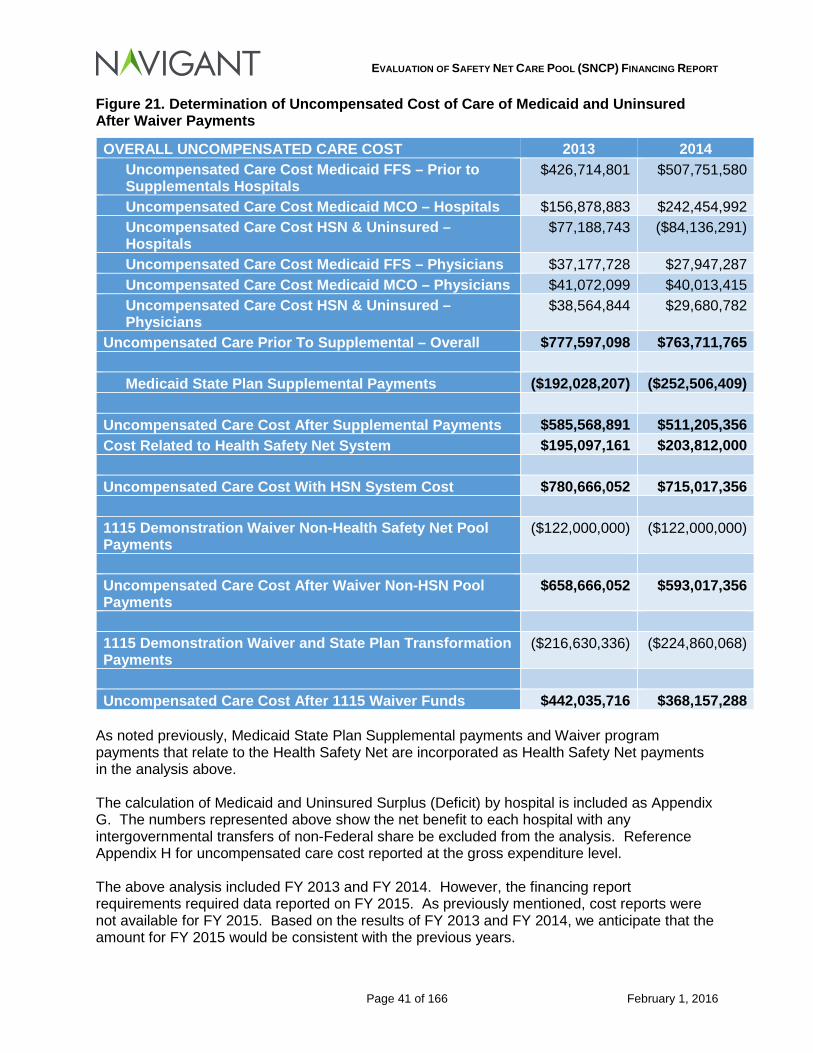
EVALUATION OF SAFETY NET CARE POOL (SNCP) FINANCING REPORT
Page 41 of 166 February 1, 2016
Figure 21. Determination of Uncompensated Cost of Care of Medicaid and Uninsured After Waiver Payments
OVERALL UNCOMPENSATED CARE COST 2013 2014 Uncompensated Care Cost Medicaid FFS – Prior to Supplementals Hospitals
$426,714,801 $507,751,580
Uncompensated Care Cost Medicaid MCO – Hospitals $156,878,883 $242,454,992 Uncompensated Care Cost HSN & Uninsured – Hospitals
$77,188,743 ($84,136,291)
Uncompensated Care Cost Medicaid FFS – Physicians $37,177,728 $27,947,287 Uncompensated Care Cost Medicaid MCO – Physicians $41,072,099 $40,013,415 Uncompensated Care Cost HSN & Uninsured – Physicians
$38,564,844 $29,680,782
Uncompensated Care Prior To Supplemental – Overall $777,597,098 $763,711,765 Medicaid State Plan Supplemental Payments ($192,028,207) ($252,506,409)
Uncompensated Care Cost After Supplemental Payments $585,568,891 $511,205,356 Cost Related to Health Safety Net System $195,097,161 $203,812,000 Uncompensated Care Cost With HSN System Cost $780,666,052 $715,017,356 1115 Demonstration Waiver Non-Health Safety Net Pool Payments
($122,000,000) ($122,000,000)
Uncompensated Care Cost After Waiver Non-HSN Pool Payments
$658,666,052 $593,017,356
1115 Demonstration Waiver and State Plan Transformation Payments
($216,630,336) ($224,860,068)
Uncompensated Care Cost After 1115 Waiver Funds $442,035,716 $368,157,288
As noted previously, Medicaid State Plan Supplemental payments and Waiver program payments that relate to the Health Safety Net are incorporated as Health Safety Net payments in the analysis above. The calculation of Medicaid and Uninsured Surplus (Deficit) by hospital is included as Appendix G. The numbers represented above show the net benefit to each hospital with any intergovernmental transfers of non-Federal share be excluded from the analysis. Reference Appendix H for uncompensated care cost reported at the gross expenditure level. The above analysis included FY 2013 and FY 2014. However, the financing report requirements required data reported on FY 2015. As previously mentioned, cost reports were not available for FY 2015. Based on the results of FY 2013 and FY 2014, we anticipate that the amount for FY 2015 would be consistent with the previous years.
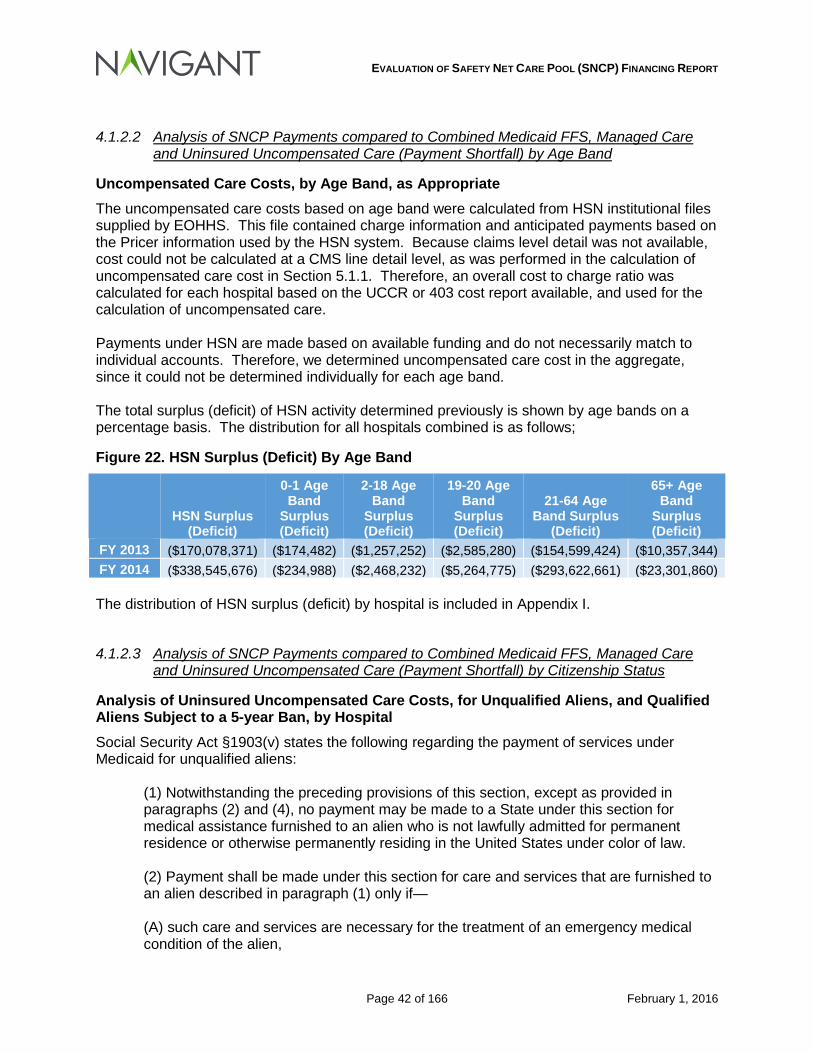
EVALUATION OF SAFETY NET CARE POOL (SNCP) FINANCING REPORT
Page 42 of 166 February 1, 2016
4.1.2.2 Analysis of SNCP Payments compared to Combined Medicaid FFS, Managed Care and Uninsured Uncompensated Care (Payment Shortfall) by Age Band
Uncompensated Care Costs, by Age Band, as Appropriate The uncompensated care costs based on age band were calculated from HSN institutional files supplied by EOHHS. This file contained charge information and anticipated payments based on the Pricer information used by the HSN system. Because claims level detail was not available, cost could not be calculated at a CMS line detail level, as was performed in the calculation of uncompensated care cost in Section 5.1.1. Therefore, an overall cost to charge ratio was calculated for each hospital based on the UCCR or 403 cost report available, and used for the calculation of uncompensated care. Payments under HSN are made based on available funding and do not necessarily match to individual accounts. Therefore, we determined uncompensated care cost in the aggregate, since it could not be determined individually for each age band. The total surplus (deficit) of HSN activity determined previously is shown by age bands on a percentage basis. The distribution for all hospitals combined is as follows;
Figure 22. HSN Surplus (Deficit) By Age Band
HSN Surplus
(Deficit)
0-1 Age Band
Surplus (Deficit)
2-18 Age Band
Surplus (Deficit)
19-20 Age Band
Surplus (Deficit)
21-64 Age Band Surplus
(Deficit)
65+ Age Band
Surplus (Deficit)
FY 2013 ($170,078,371) ($174,482) ($1,257,252) ($2,585,280) ($154,599,424) ($10,357,344) FY 2014 ($338,545,676) ($234,988) ($2,468,232) ($5,264,775) ($293,622,661) ($23,301,860) The distribution of HSN surplus (deficit) by hospital is included in Appendix I.
4.1.2.3 Analysis of SNCP Payments compared to Combined Medicaid FFS, Managed Care and Uninsured Uncompensated Care (Payment Shortfall) by Citizenship Status
Analysis of Uninsured Uncompensated Care Costs, for Unqualified Aliens, and Qualified Aliens Subject to a 5-year Ban, by Hospital Social Security Act §1903(v) states the following regarding the payment of services under Medicaid for unqualified aliens:
(1) Notwithstanding the preceding provisions of this section, except as provided in paragraphs (2) and (4), no payment may be made to a State under this section for medical assistance furnished to an alien who is not lawfully admitted for permanent residence or otherwise permanently residing in the United States under color of law. (2) Payment shall be made under this section for care and services that are furnished to an alien described in paragraph (1) only if— (A) such care and services are necessary for the treatment of an emergency medical condition of the alien,
EVALUATION OF SAFETY NET CARE POOL (SNCP) FINANCING REPORT
Page 43 of 166 February 1, 2016
(B) such alien otherwise meets the eligibility requirements for medical assistance under the State plan approved under this title (other than the requirement of the receipt of aid or assistance under title IV, supplemental security income benefits under title XVI, or a State supplementary payment), and (C) such care and services are not related to an organ transplant procedure. (3) For purposes of this subsection, the term “emergency medical condition” means a medical condition (including emergency labor and delivery) manifesting itself by acute symptoms of sufficient severity (including severe pain) such that the absence of immediate medical attention could reasonably be expected to result in— (A) placing the patient’s health in serious jeopardy, (B) serious impairment to bodily functions, or (C) serious dysfunction of any bodily organ or part. (4)(A) A State may elect (in a plan amendment under this title) to provide medical assistance under this title, notwithstanding sections 401(a), 402(b), 403, and 421 of the Personal Responsibility and Work Opportunity Reconciliation Act of 1996, to children and pregnant women who are lawfully residing in the United States (including battered individuals described in section 431(c) of such Act) and who are otherwise eligible for such assistance, within either or both of the following eligibility categories (i) Pregnant women.—Women during pregnancy (and during the 60-day period beginning on the last day of the pregnancy). (ii) Children.—Individuals under 21 years of age, including optional targeted low-income children described in section 1905(u)(2)(B). (B) In the case of a State that has elected to provide medical assistance to a category of aliens under subparagraph (A), no debt shall accrue under an affidavit of support against any sponsor of such an alien on the basis of provision of assistance to such category and the cost of such assistance shall not be considered as an unreimbursed cost. (C) As part of the State’s ongoing eligibility redetermination requirements and procedures for an individual provided medical assistance as a result of an election by the State under subparagraph (A), a State shall verify that the individual continues to lawfully reside in the United States using the documentation presented to the State by the individual on initial enrollment. If the State cannot successfully verify that the individual is lawfully residing in the United States in this manner, it shall require that the individual provide the State with further documentation or other evidence to verify that the individual is lawfully residing in the United States.
For unqualified aliens that do not meet the emergency standards under the Social Security Act providers may be eligible to receive reimbursement for services provided under the Health Safety Net if the individual meets certain income levels.
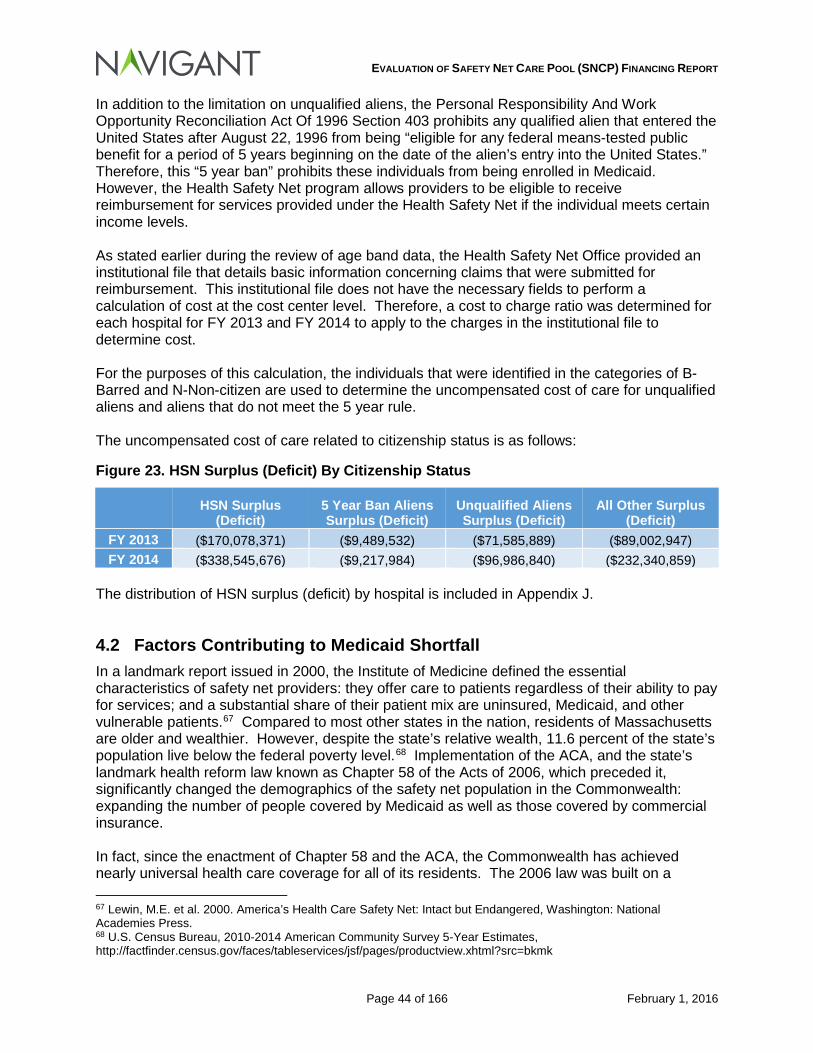
EVALUATION OF SAFETY NET CARE POOL (SNCP) FINANCING REPORT
Page 44 of 166 February 1, 2016
In addition to the limitation on unqualified aliens, the Personal Responsibility And Work Opportunity Reconciliation Act Of 1996 Section 403 prohibits any qualified alien that entered the United States after August 22, 1996 from being “eligible for any federal means-tested public benefit for a period of 5 years beginning on the date of the alien’s entry into the United States.” Therefore, this “5 year ban” prohibits these individuals from being enrolled in Medicaid. However, the Health Safety Net program allows providers to be eligible to receive reimbursement for services provided under the Health Safety Net if the individual meets certain income levels. As stated earlier during the review of age band data, the Health Safety Net Office provided an institutional file that details basic information concerning claims that were submitted for reimbursement. This institutional file does not have the necessary fields to perform a calculation of cost at the cost center level. Therefore, a cost to charge ratio was determined for each hospital for FY 2013 and FY 2014 to apply to the charges in the institutional file to determine cost. For the purposes of this calculation, the individuals that were identified in the categories of B-Barred and N-Non-citizen are used to determine the uncompensated cost of care for unqualified aliens and aliens that do not meet the 5 year rule. The uncompensated cost of care related to citizenship status is as follows:
Figure 23. HSN Surplus (Deficit) By Citizenship Status
HSN Surplus
(Deficit) 5 Year Ban Aliens Surplus (Deficit)
Unqualified Aliens Surplus (Deficit)
All Other Surplus (Deficit)
FY 2013 ($170,078,371) ($9,489,532) ($71,585,889) ($89,002,947) FY 2014 ($338,545,676) ($9,217,984) ($96,986,840) ($232,340,859)
The distribution of HSN surplus (deficit) by hospital is included in Appendix J.
4.2 Factors Contributing to Medicaid Shortfall In a landmark report issued in 2000, the Institute of Medicine defined the essential characteristics of safety net providers: they offer care to patients regardless of their ability to pay for services; and a substantial share of their patient mix are uninsured, Medicaid, and other vulnerable patients.67 Compared to most other states in the nation, residents of Massachusetts are older and wealthier. However, despite the state’s relative wealth, 11.6 percent of the state’s population live below the federal poverty level.68 Implementation of the ACA, and the state’s landmark health reform law known as Chapter 58 of the Acts of 2006, which preceded it, significantly changed the demographics of the safety net population in the Commonwealth: expanding the number of people covered by Medicaid as well as those covered by commercial insurance. In fact, since the enactment of Chapter 58 and the ACA, the Commonwealth has achieved nearly universal health care coverage for all of its residents. The 2006 law was built on a 67 Lewin, M.E. et al. 2000. America’s Health Care Safety Net: Intact but Endangered, Washington: National Academies Press. 68 U.S. Census Bureau, 2010-2014 American Community Survey 5-Year Estimates, http://factfinder.census.gov/faces/tableservices/jsf/pages/productview.xhtml?src=bkmk
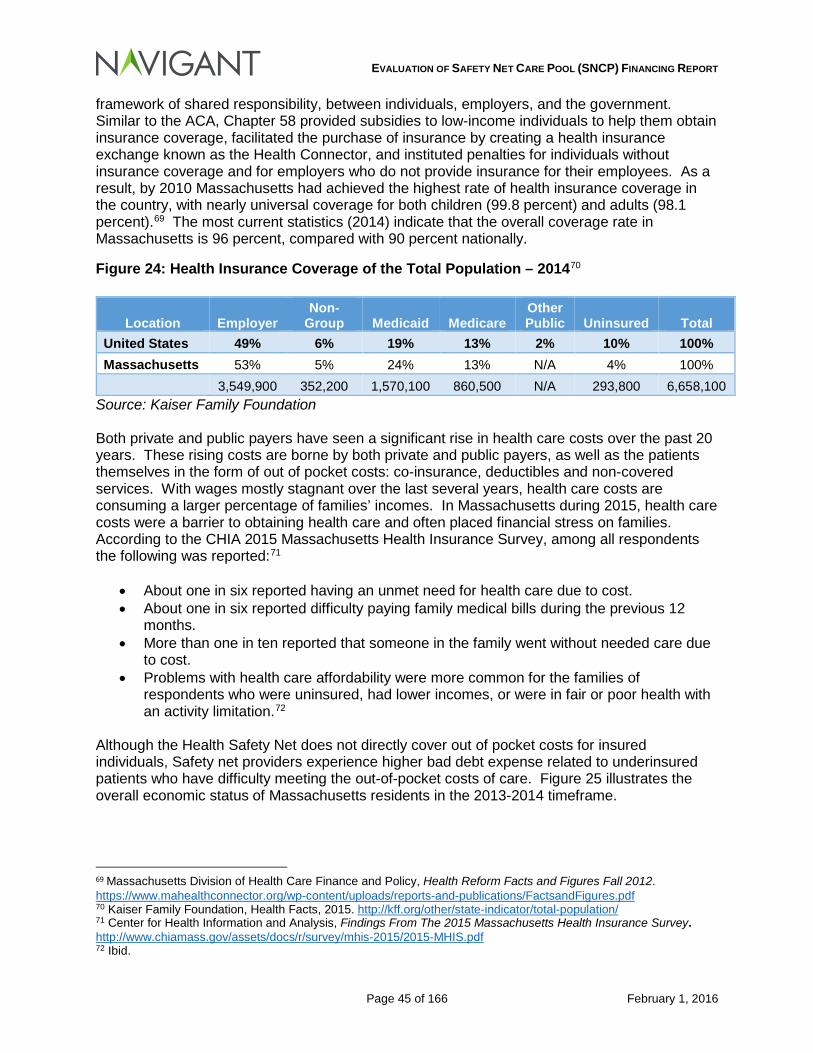
EVALUATION OF SAFETY NET CARE POOL (SNCP) FINANCING REPORT
Page 45 of 166 February 1, 2016
framework of shared responsibility, between individuals, employers, and the government. Similar to the ACA, Chapter 58 provided subsidies to low-income individuals to help them obtain insurance coverage, facilitated the purchase of insurance by creating a health insurance exchange known as the Health Connector, and instituted penalties for individuals without insurance coverage and for employers who do not provide insurance for their employees. As a result, by 2010 Massachusetts had achieved the highest rate of health insurance coverage in the country, with nearly universal coverage for both children (99.8 percent) and adults (98.1 percent).69 The most current statistics (2014) indicate that the overall coverage rate in Massachusetts is 96 percent, compared with 90 percent nationally.
Figure 24: Health Insurance Coverage of the Total Population – 201470
Source: Kaiser Family Foundation Both private and public payers have seen a significant rise in health care costs over the past 20 years. These rising costs are borne by both private and public payers, as well as the patients themselves in the form of out of pocket costs: co-insurance, deductibles and non-covered services. With wages mostly stagnant over the last several years, health care costs are consuming a larger percentage of families’ incomes. In Massachusetts during 2015, health care costs were a barrier to obtaining health care and often placed financial stress on families. According to the CHIA 2015 Massachusetts Health Insurance Survey, among all respondents the following was reported:71
• About one in six reported having an unmet need for health care due to cost. • About one in six reported difficulty paying family medical bills during the previous 12
months. • More than one in ten reported that someone in the family went without needed care due
to cost. • Problems with health care affordability were more common for the families of
respondents who were uninsured, had lower incomes, or were in fair or poor health with an activity limitation.72
Although the Health Safety Net does not directly cover out of pocket costs for insured individuals, Safety net providers experience higher bad debt expense related to underinsured patients who have difficulty meeting the out-of-pocket costs of care. Figure 25 illustrates the overall economic status of Massachusetts residents in the 2013-2014 timeframe.
69 Massachusetts Division of Health Care Finance and Policy, Health Reform Facts and Figures Fall 2012. https://www.mahealthconnector.org/wp-content/uploads/reports-and-publications/FactsandFigures.pdf 70 Kaiser Family Foundation, Health Facts, 2015. http://kff.org/other/state-indicator/total-population/ 71 Center for Health Information and Analysis, Findings From The 2015 Massachusetts Health Insurance Survey. http://www.chiamass.gov/assets/docs/r/survey/mhis-2015/2015-MHIS.pdf 72 Ibid.
Location Employer Non-
Group Medicaid Medicare Other Public Uninsured Total
United States 49% 6% 19% 13% 2% 10% 100% Massachusetts 53% 5% 24% 13% N/A 4% 100%
3,549,900 352,200 1,570,100 860,500 N/A 293,800 6,658,100
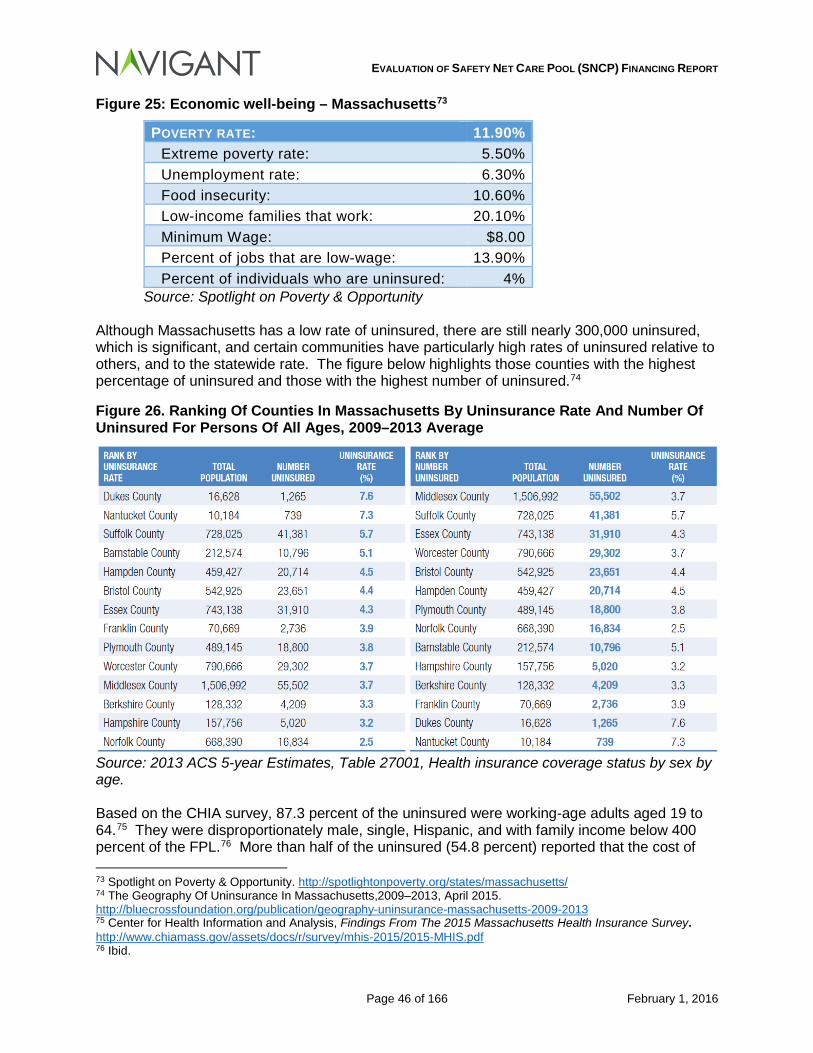
EVALUATION OF SAFETY NET CARE POOL (SNCP) FINANCING REPORT
Page 46 of 166 February 1, 2016
Figure 25: Economic well-being – Massachusetts73
POVERTY RATE: 11.90% Extreme poverty rate: 5.50% Unemployment rate: 6.30% Food insecurity: 10.60% Low-income families that work: 20.10% Minimum Wage: $8.00 Percent of jobs that are low-wage: 13.90% Percent of individuals who are uninsured: 4%
Source: Spotlight on Poverty & Opportunity Although Massachusetts has a low rate of uninsured, there are still nearly 300,000 uninsured, which is significant, and certain communities have particularly high rates of uninsured relative to others, and to the statewide rate. The figure below highlights those counties with the highest percentage of uninsured and those with the highest number of uninsured.74
Figure 26. Ranking Of Counties In Massachusetts By Uninsurance Rate And Number Of Uninsured For Persons Of All Ages, 2009–2013 Average
Source: 2013 ACS 5-year Estimates, Table 27001, Health insurance coverage status by sex by age. Based on the CHIA survey, 87.3 percent of the uninsured were working-age adults aged 19 to 64.75 They were disproportionately male, single, Hispanic, and with family income below 400 percent of the FPL.76 More than half of the uninsured (54.8 percent) reported that the cost of 73 Spotlight on Poverty & Opportunity. http://spotlightonpoverty.org/states/massachusetts/ 74 The Geography Of Uninsurance In Massachusetts,2009–2013, April 2015. http://bluecrossfoundation.org/publication/geography-uninsurance-massachusetts-2009-2013 75 Center for Health Information and Analysis, Findings From The 2015 Massachusetts Health Insurance Survey. http://www.chiamass.gov/assets/docs/r/survey/mhis-2015/2015-MHIS.pdf 76 Ibid.
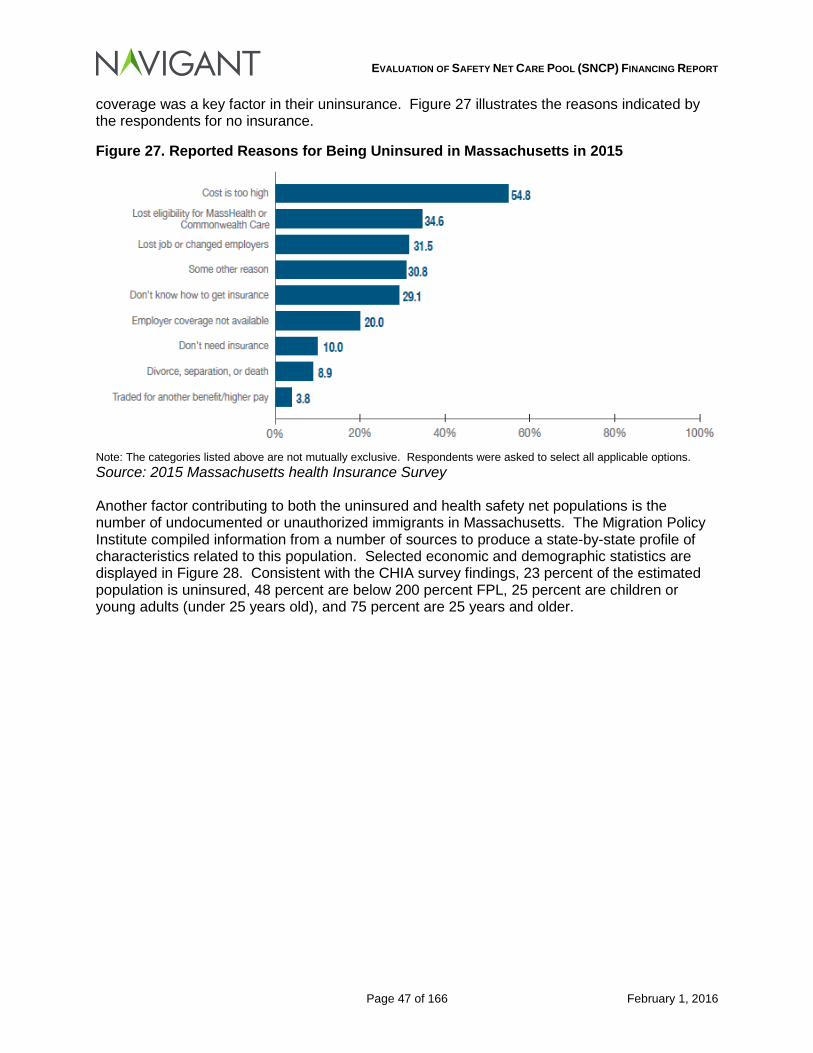
EVALUATION OF SAFETY NET CARE POOL (SNCP) FINANCING REPORT
Page 47 of 166 February 1, 2016
coverage was a key factor in their uninsurance. Figure 27 illustrates the reasons indicated by the respondents for no insurance.
Figure 27. Reported Reasons for Being Uninsured in Massachusetts in 2015
Note: The categories listed above are not mutually exclusive. Respondents were asked to select all applicable options. Source: 2015 Massachusetts health Insurance Survey Another factor contributing to both the uninsured and health safety net populations is the number of undocumented or unauthorized immigrants in Massachusetts. The Migration Policy Institute compiled information from a number of sources to produce a state-by-state profile of characteristics related to this population. Selected economic and demographic statistics are displayed in Figure 28. Consistent with the CHIA survey findings, 23 percent of the estimated population is uninsured, 48 percent are below 200 percent FPL, 25 percent are children or young adults (under 25 years old), and 75 percent are 25 years and older.
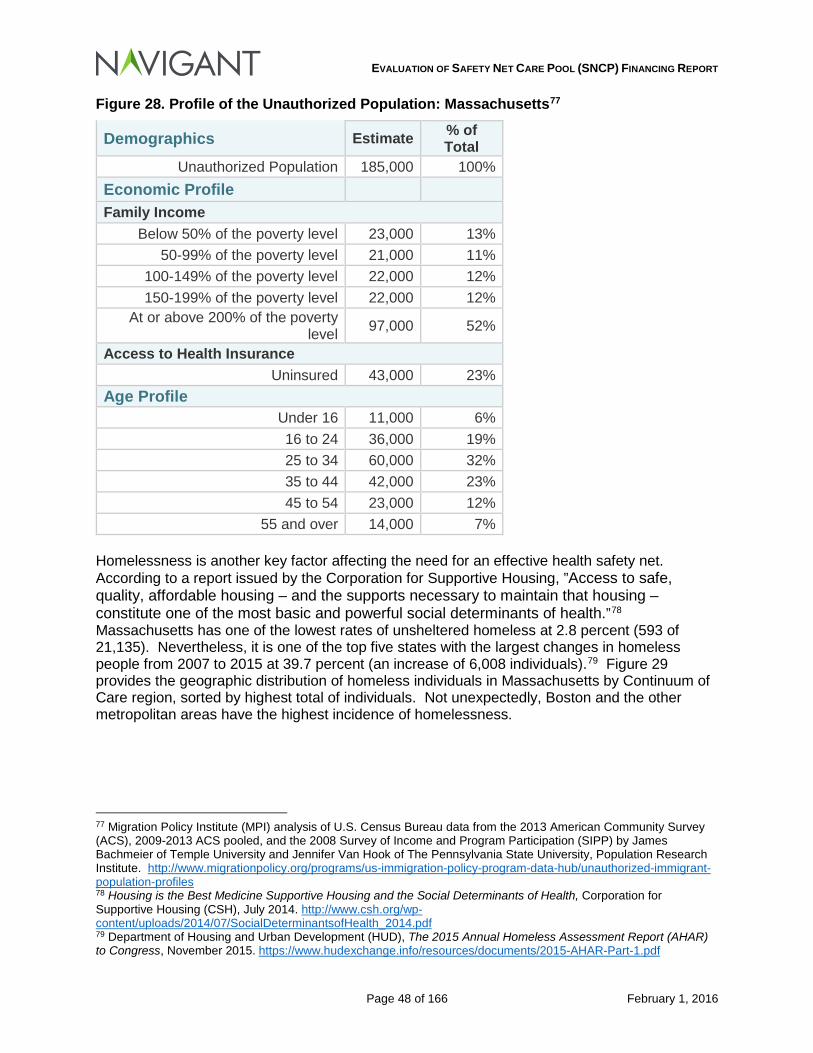
EVALUATION OF SAFETY NET CARE POOL (SNCP) FINANCING REPORT
Page 48 of 166 February 1, 2016
Figure 28. Profile of the Unauthorized Population: Massachusetts77
Demographics Estimate % of Total
Unauthorized Population 185,000 100% Economic Profile Family Income
Below 50% of the poverty level 23,000 13% 50-99% of the poverty level 21,000 11%
100-149% of the poverty level 22,000 12% 150-199% of the poverty level 22,000 12%
At or above 200% of the poverty level 97,000 52%
Access to Health Insurance Uninsured 43,000 23%
Age Profile Under 16 11,000 6% 16 to 24 36,000 19% 25 to 34 60,000 32% 35 to 44 42,000 23% 45 to 54 23,000 12%
55 and over 14,000 7% Homelessness is another key factor affecting the need for an effective health safety net. According to a report issued by the Corporation for Supportive Housing, ”Access to safe, quality, affordable housing – and the supports necessary to maintain that housing – constitute one of the most basic and powerful social determinants of health.”78 Massachusetts has one of the lowest rates of unsheltered homeless at 2.8 percent (593 of 21,135). Nevertheless, it is one of the top five states with the largest changes in homeless people from 2007 to 2015 at 39.7 percent (an increase of 6,008 individuals).79 Figure 29 provides the geographic distribution of homeless individuals in Massachusetts by Continuum of Care region, sorted by highest total of individuals. Not unexpectedly, Boston and the other metropolitan areas have the highest incidence of homelessness.
77 Migration Policy Institute (MPI) analysis of U.S. Census Bureau data from the 2013 American Community Survey (ACS), 2009-2013 ACS pooled, and the 2008 Survey of Income and Program Participation (SIPP) by James Bachmeier of Temple University and Jennifer Van Hook of The Pennsylvania State University, Population Research Institute. http://www.migrationpolicy.org/programs/us-immigration-policy-program-data-hub/unauthorized-immigrant-population-profiles 78 Housing is the Best Medicine Supportive Housing and the Social Determinants of Health, Corporation for Supportive Housing (CSH), July 2014. http://www.csh.org/wp-content/uploads/2014/07/SocialDeterminantsofHealth_2014.pdf 79 Department of Housing and Urban Development (HUD), The 2015 Annual Homeless Assessment Report (AHAR) to Congress, November 2015. https://www.hudexchange.info/resources/documents/2015-AHAR-Part-1.pdf
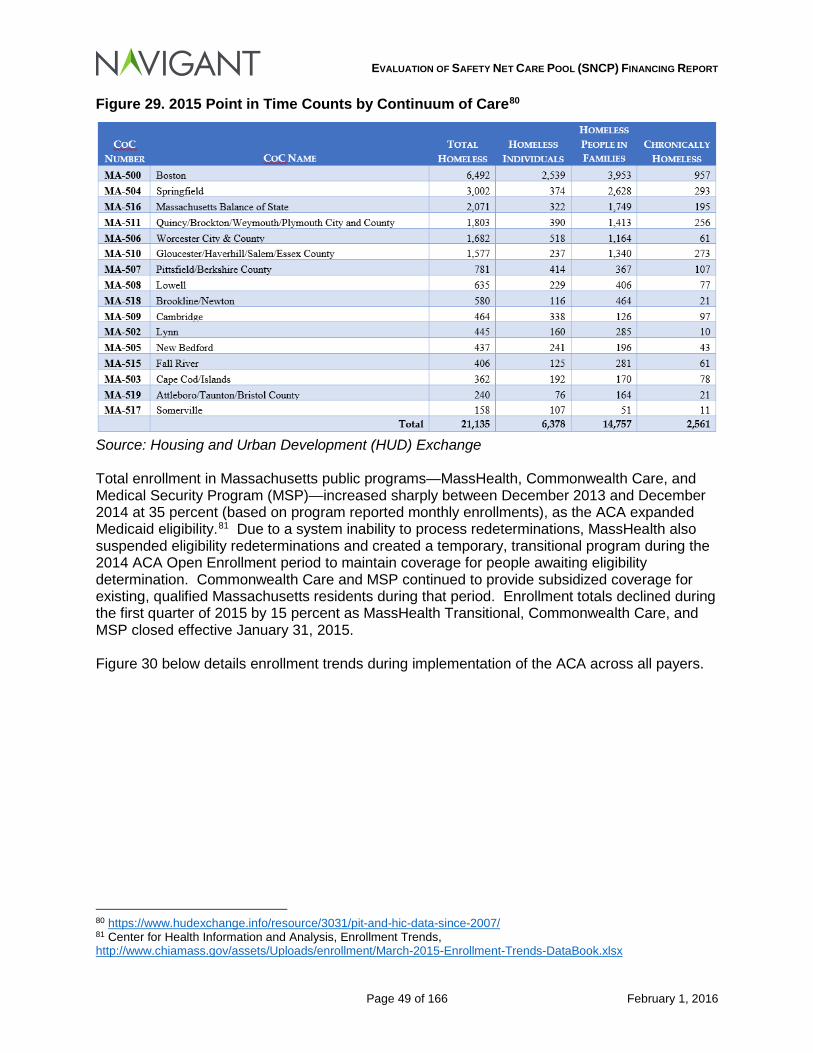
EVALUATION OF SAFETY NET CARE POOL (SNCP) FINANCING REPORT
Page 49 of 166 February 1, 2016
Figure 29. 2015 Point in Time Counts by Continuum of Care80
Source: Housing and Urban Development (HUD) Exchange Total enrollment in Massachusetts public programs—MassHealth, Commonwealth Care, and Medical Security Program (MSP)—increased sharply between December 2013 and December 2014 at 35 percent (based on program reported monthly enrollments), as the ACA expanded Medicaid eligibility.81 Due to a system inability to process redeterminations, MassHealth also suspended eligibility redeterminations and created a temporary, transitional program during the 2014 ACA Open Enrollment period to maintain coverage for people awaiting eligibility determination. Commonwealth Care and MSP continued to provide subsidized coverage for existing, qualified Massachusetts residents during that period. Enrollment totals declined during the first quarter of 2015 by 15 percent as MassHealth Transitional, Commonwealth Care, and MSP closed effective January 31, 2015. Figure 30 below details enrollment trends during implementation of the ACA across all payers.
80 https://www.hudexchange.info/resource/3031/pit-and-hic-data-since-2007/ 81 Center for Health Information and Analysis, Enrollment Trends, http://www.chiamass.gov/assets/Uploads/enrollment/March-2015-Enrollment-Trends-DataBook.xlsx
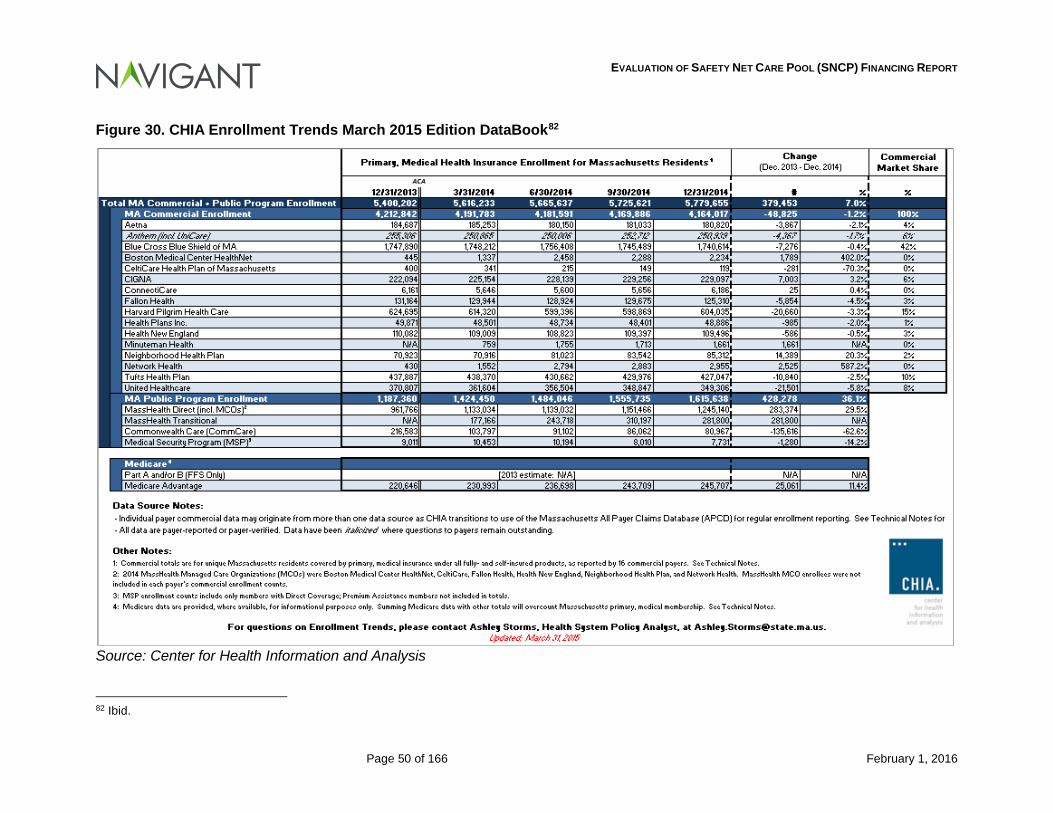
EVALUATION OF SAFETY NET CARE POOL (SNCP) FINANCING REPORT
Page 50 of 166 February 1, 2016
Figure 30. CHIA Enrollment Trends March 2015 Edition DataBook82
Source: Center for Health Information and Analysis 82 Ibid.
EVALUATION OF SAFETY NET CARE POOL (SNCP) FINANCING REPORT
Page 51 of 166 February 1, 2016
MassHealth is the predominant state-run public health insurance program for certain eligible low income residents of Massachusetts, combining Massachusetts’s Medicaid program and CHIP. With the recent economic downturn and the expansion of MassHealth enrollment, MassHealth spending in the program has increased annually. According to the September 2015 Annual Report On The Performance Of The Massachusetts Health Care System released by the Center for Health Information and Analysis (CHIA), overall spending for MassHealth in 2014 grew by $2.4 billion, an increase of 19 percent over the previous year, to $15.3 billion83. Overall membership also increased 23 percent by 4.5 million member months (about 379,000 members) during the same period.84 These increases in expenditures and membership were greater than growth in the previous year, and are associated with the implementation of the ACA. As more residents enroll, the incidence of “churning” also increases. This occurs as individuals come in and out of Medicaid, which creates gaps or interruptions in healthcare coverage. This has long been reported as a problem adversely affecting access, continuity of care, ambulatory care use and health care costs.85 During non-covered periods, these individuals tend to rely on the safety net providers for services. Loss of Medicaid enrollment can result from renewal requirements and processes that occur periodically (usually once a year), creating administrative barriers that leave some Medicaid members uninsured for some period of time despite still being eligible for Medicaid. To address this issue Massachusetts implemented Express Lane Eligibility (ELE), a streamlined Medicaid application and renewal process for MassHealth children and their parents/caregivers who also receive Supplemental Nutrition Assistance Program (SNAP) benefits. The program is intended to increase eligible children’s enrollment and retention in Medicaid and CHIP. Results of the program will be evaluated to assess the potential for expanding the streamlined renewal process to other populations, University of Massachusetts Medical School and MassHealth agencies. Initial results of the ELE implementation are promising. Even when controlling for other potential influences for loss of MassHealth eligibility, the ELE group had a statistically significant lower risk of loss of MassHealth eligibility compared to the non-ELE group. In fact, it was the strongest predictor of continuous coverage during the 90 day period following MassHealth annual review.86 All of these factors contribute to the Medicaid shortfall and reinforce the ongoing need to financially support the safety net providers.
4.2.1 Role of FFS Payment Rates and Managed Care Contracting Requirements A number of reimbursement factors influence the ability of the safety net providers to maintain financial stability in the current environment. As noted above, Medicaid expansion combined with the economic downturn increased the number of Medicaid enrollees by over 36 percent between December 2013 and December 2014. As a result, the demand for hospital services also increased, while overall hospital payment remained stable. And although service reimbursement rates are increased annually by one to two percent for inflation, costs and 83 Center for Health Information and Analysis, Performance Of The Massachusetts Health Care System Annual Report September 2015. http://www.chiamass.gov/assets/2015-annual-report/2015-Annual-Report.pdf 84 Ibid. 85 UMass Medical School Center for Health Policy and Research, MassHealth Section 1115(a) Demonstration Waiver 2011-2014 Evaluation Final Report. 86 Ibid.
EVALUATION OF SAFETY NET CARE POOL (SNCP) FINANCING REPORT
Page 52 of 166 February 1, 2016
volumes continue to increase, often by a higher percentage. The combination of rates not keeping pace with costs and a growing managed care penetration led to greater declines in total margins for safety net providers relative to non-safety net providers, despite growth in revenue during the same period. In addition, hospitals with a high percentage of Medicaid may be disadvantaged in managed care negotiations and often have to accept deep discounts to reimbursement relative to peer hospitals with lower Medicaid case mix.
4.3 Conclusions Drawn Our analysis shows that in 2013 and 2014, the two years for which data was available, there were significant shortfalls in payments relative to costs. This shortfall exists when considering the FFS, Medicaid MCO and HSN populations, individually and in the aggregate. The adequacy of payments should be a major focus of policy related to rate setting. While data is difficult to gather on a national basis for inpatient services paid by Medicaid versus Medicare, Medicaid tends to be a lower payer overall. The upper payment limit regulations for inpatient and outpatient services allow Medicaid to pay an aggregate amount that “may not exceed the amount that can reasonably be estimated would have been paid for those services under Medicare payment principles.”87 Based on information analyzed in this report, EOHHS is paying hospitals roughly 82% of what Medicare is paying based on a cost to payment ratio. While Medicare on average is paying above cost for hospitals within the Commonwealth, the benchmark to Medicare reinforces the need for some type of a safety net program for hospitals to ensure services are available to Medicaid eligible individuals and individuals with no source of third party coverage. Massachusetts has a long commitment to health coverage for all its residents resulting in arguably the highest achievable percentage of covered lives. Nevertheless, there are still residents without coverage, and a need for safety net facilities to serve the health needs of those individuals. Further, as more and more individuals access services at safety net facilities, the Medicaid payment shortfall at those facilities will continue to grow. In the next section, we describe elements of the DSTI program – a key element of the SNCP program – and how the DSTI program has supported many of the SNCP participating hospitals’ efforts to transform service delivery in Massachusetts.
87 42 CFR §447.272(a)
EVALUATION OF SAFETY NET CARE POOL (SNCP) FINANCING REPORT
Page 53 of 166 February 1, 2016
5 Delivery System Transformation Initiative (DSTI) As described in Chapter 4, the Commonwealth makes incentive payments to providers for Delivery System Transformation Initiative under the terms of the 1115 demonstration. These payments are intended for the development, implementation, and improvement of programs that support hospitals’ efforts to enhance access to health care, improve the quality of care and the health of the patients and families they serve and build the capacity to participate in payment reform strategies and models. For the first three years of the DSTI program (SFYs 2012 through 2014), funding has been transitional in nature, providing incentives for participating hospitals to establish programs and infrastructure to further overall DSTI program goals. For two years following the initial transitional phase, a proportion of the funding under DSTI is contingent on performance under certain outcome and quality measures, affected by both facility-specific and aggregated performance measures.
During the period covered by this report, the Commonwealth established the following four goals for the Demonstration:
Goal 1. Maintain near universal coverage for all residents of the Commonwealth;
Goal 2. Continue the redirection of spending from uncompensated care to insurance coverage;
Goal 3. Implement delivery system reforms that promote care coordination, person-centered care planning, wellness, chronic disease management, successful care transitions, integration of services, and measurable health outcome improvements; and
Goal 4. Advance payment reforms that will give incentives to providers to focus on quality, rather than volume, by introducing and supporting alternative payment structures that create and share savings throughout the system while holding providers accountable for quality care.
Six initiatives were implemented to advance the waiver goals:
1) Monitoring of Population-Level Measures (Goals 1 through 3); 2) Express Lane Eligibility program (Goal 1); 3) Delivery System Transformation Initiative (Goals 3 and 4); 4) Intensive Early Intervention Services for Children with Autism Spectrum Disorder
(Goal 3); 5) Patient-Centered Medical Home Initiative (Goals 3 and 4); and 6) Children’s High-Risk Asthma Bundled Payment Demonstration Program (Goals 3
and 4).
Initiative three relates to the DSTI program, and addresses Waiver Goals three and four. The providers eligible for DSTI incentive payments are defined as public or private acute hospitals with a high Medicaid payer mix and a low commercial payer mix based on the 2009 cost report data. There are seven hospitals which meet this criteria and received DSTI funds during 2012 – 2015. The seven safety net hospital systems are:
• Boston Medical Center • Cambridge Health Alliance • Holyoke Medical Center • Lawrence General Hospital • Mercy Medical Center
EVALUATION OF SAFETY NET CARE POOL (SNCP) FINANCING REPORT
Page 54 of 166 February 1, 2016
• Signature Healthcare Brockton Hospital • Steward Carney Hospital
Each of these facilities was tasked with a specific CMS-approved DSTI plan. Individual hospital DSTI plans included at least one project selected from a menu of prescribed options within the three categories established in the DSTI Master Plan:
• DSTI Category 1: Development of a Fully Integrated Delivery System. Category 1 projects employ the concepts of the patient-centered medical home (PCMH) model to increase delivery system efficiency and capacity.
• DSTI Category 2: Health Outcomes and Quality. Category 2 projects develop, implement, or expand innovative care models to improve care management and patient experience and to contain costs.
• DSTI Category 3: Ability to Respond to Statewide Transformation to Value-Based Purchasing and to Accept Alternatives to Fee-For-Service Payments that Promote System Sustainability. Category 3 projects enhance performance improvement and reporting capabilities.
DSTI also includes a fourth category, which consists of population-focused measures. The purpose of these measures is to evaluate the impact of the system changes and investments described in Categories 1-3. All DSTI hospitals were required to report on a core set of common measures. In addition, hospital-specific measures that are directly related to the projects being implemented by the hospitals were selected. As noted in Section 4 above, CMS added new provisions to the DSTI elements as part of the Demonstration extension for SFY 2015-2019:
• Funding for hospitals under DSTI will be at risk for improved performance on validated outcome or quality measures, on a provider-specific basis.
• The total available DSTI funding pool will be at risk for a five percent reduction if the
DSTI providers do not meet the required aggregate performance goals specified by the DSTI Master Plan by the end of the three year period from SFY 2015 to 2017.
5.1 Amount of DSTI Payments to Participating Providers by Category Under the requirements of the DSTI program, each hospital submitted semi-annual and annual progress reports, describing achieved progress on implementation of their approved DSTI projects. Examples of the type of projects that each hospital addressed during the demonstration period are as follows:
Boston Medical Center’s Re-Engineered Discharge Process (Project RED):
Objective: to decrease preventable hospital readmissions and returns to the emergency department by educating patients about their hospital and post-hospital care and ensuring a smooth discharge transition.
Year Two: expanded into the daily workflow of a dedicated inpatient unit, to better integrate the program and create staffing efficiencies.
EVALUATION OF SAFETY NET CARE POOL (SNCP) FINANCING REPORT
Page 55 of 166 February 1, 2016
Results: for patients enrolled in the program the readmission rate declined 27 percent, as compared to a 15 percent decline for adult medical Medicaid patients not enrolled in the program. 88
Cambridge Health Alliance (CHA) Patient-Centered Medical Home Initiative:
Objective: to advance the patient-centered medical home (PCMH) model in its primary care system, as a foundation for improving population health and panel management in alternative payment models,
Year Two: completed a gap closure plan four primary care sites, filed National Committee for Quality Assurance (NCQA) PCMH applications, and received NCQA Level 3 recognition for all four sites, bringing half of CHA primary care centers into this model.
Results: applied or re-applied for NCQA medical home status for seven primary care centers that care for 50,000 patients by the end of FY14. 89
Lawrence General Hospital’s Physician Hospital Organization (PHO) Initiative:
Objective: to bring disparate, independent physician group practices, solo practitioners, and the independent local health center together under an umbrella entity, the Physician Hospital Organization (PHO).
Results: more than 320 physicians joined the PHO, working together on clinical integration, engaging in dialogue about referral patterns, preventing “leakage” to higher cost providers, contracts, payment systems and technology initiatives.90
The figure below summarizes the annual incentive payments for FY 2012-2014 by DSTI Category. A more detailed table of the projects, milestones, associated metrics and annual funding amounts for each hospital compiled from information provided in the Demonstration Waiver 2011-2014 Evaluation Final Report91 is provided in Appendix K.
88 Massachusetts Section 1115 Demonstration Project Extension Request for SFYs 2015-2019. 89 Ibid. 90 Ibid. 91 UMass Medical School Center for Health Policy and Research, MassHealth Section 1115(a) Demonstration Waiver 2011-2014 Evaluation Final Report.
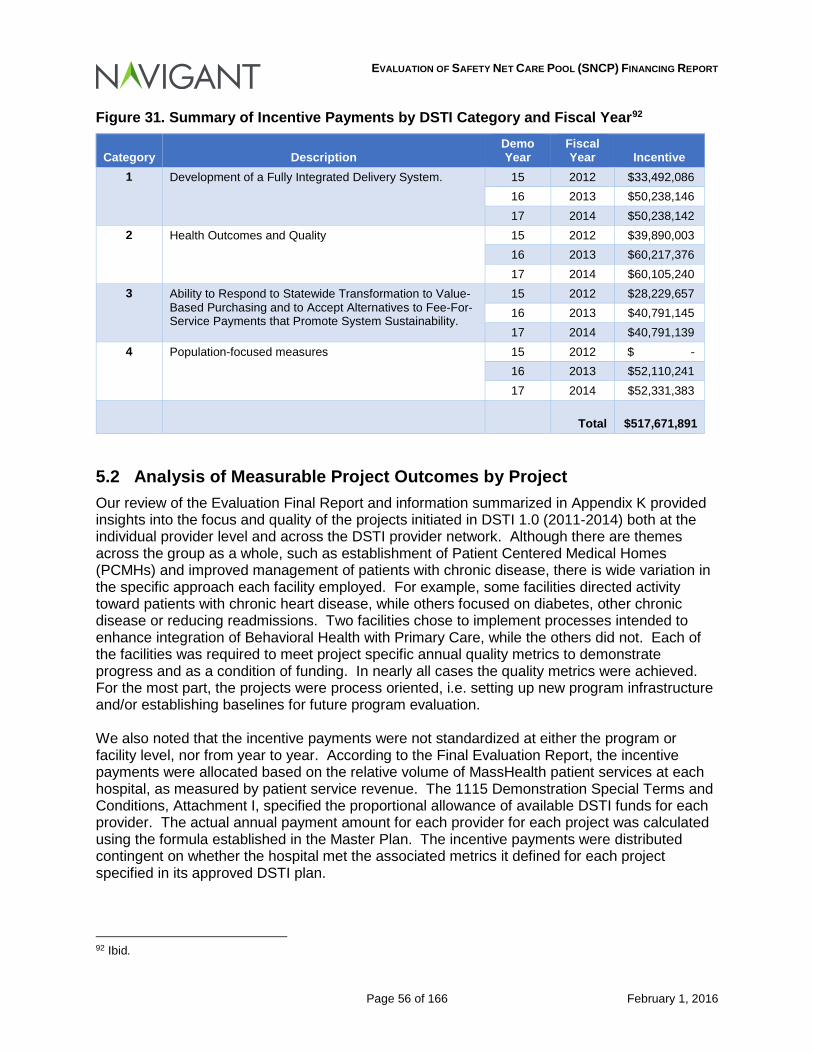
EVALUATION OF SAFETY NET CARE POOL (SNCP) FINANCING REPORT
Page 56 of 166 February 1, 2016
Figure 31. Summary of Incentive Payments by DSTI Category and Fiscal Year92
Category Description Demo Year
Fiscal Year Incentive
1 Development of a Fully Integrated Delivery System. 15 2012 $33,492,086 16 2013 $50,238,146 17 2014 $50,238,142
2 Health Outcomes and Quality 15 2012 $39,890,003 16 2013 $60,217,376 17 2014 $60,105,240
3 Ability to Respond to Statewide Transformation to Value-Based Purchasing and to Accept Alternatives to Fee-For-Service Payments that Promote System Sustainability.
15 2012 $28,229,657 16 2013 $40,791,145 17 2014 $40,791,139
4 Population-focused measures 15 2012 $ - 16 2013 $52,110,241 17 2014 $52,331,383
Total
$517,671,891
5.2 Analysis of Measurable Project Outcomes by Project Our review of the Evaluation Final Report and information summarized in Appendix K provided insights into the focus and quality of the projects initiated in DSTI 1.0 (2011-2014) both at the individual provider level and across the DSTI provider network. Although there are themes across the group as a whole, such as establishment of Patient Centered Medical Homes (PCMHs) and improved management of patients with chronic disease, there is wide variation in the specific approach each facility employed. For example, some facilities directed activity toward patients with chronic heart disease, while others focused on diabetes, other chronic disease or reducing readmissions. Two facilities chose to implement processes intended to enhance integration of Behavioral Health with Primary Care, while the others did not. Each of the facilities was required to meet project specific annual quality metrics to demonstrate progress and as a condition of funding. In nearly all cases the quality metrics were achieved. For the most part, the projects were process oriented, i.e. setting up new program infrastructure and/or establishing baselines for future program evaluation. We also noted that the incentive payments were not standardized at either the program or facility level, nor from year to year. According to the Final Evaluation Report, the incentive payments were allocated based on the relative volume of MassHealth patient services at each hospital, as measured by patient service revenue. The 1115 Demonstration Special Terms and Conditions, Attachment I, specified the proportional allowance of available DSTI funds for each provider. The actual annual payment amount for each provider for each project was calculated using the formula established in the Master Plan. The incentive payments were distributed contingent on whether the hospital met the associated metrics it defined for each project specified in its approved DSTI plan.
92 Ibid.
EVALUATION OF SAFETY NET CARE POOL (SNCP) FINANCING REPORT
Page 57 of 166 February 1, 2016
Navigant discussed progress with DSTI initiatives with each DSTI-participating hospital as part of scheduled site visits. As a follow up to those discussions, the DSTI-participating hospitals prepared a presentation with additional data and information related to the successes they achieved through the DSTI program. The report describes the program from the provider perspective. Selections from each hospital’s presentation are included in this report as Appendix L. Some highlights of the report are as follows:
• DSTI is directed toward Massachusetts safety net providers which treat high volumes of Medicaid and uninsured patients. These providers have limited capacity to make the investments required to position them well for payment reforms. The transformation to new models of care delivery require providers to make significant up-front investments in such areas as network development and management; care coordination, quality improvement and utilization management; clinical information systems; and data analytics to enhance performance measurement.
• From the provider point of view, the DSTI program is a critical tool in achieving
MassHealth sustainability, and works to improve the delivery system providing care for Medicaid and the uninsured, ultimately driving efficiency and quality outcomes. It has substantially replaced Medicaid supplemental funding which historically worked to address Medicaid payment shortfalls and uninsured care costs.
The specific projects and metrics addressed during the period are summarized by the providers in Figure 32 below.
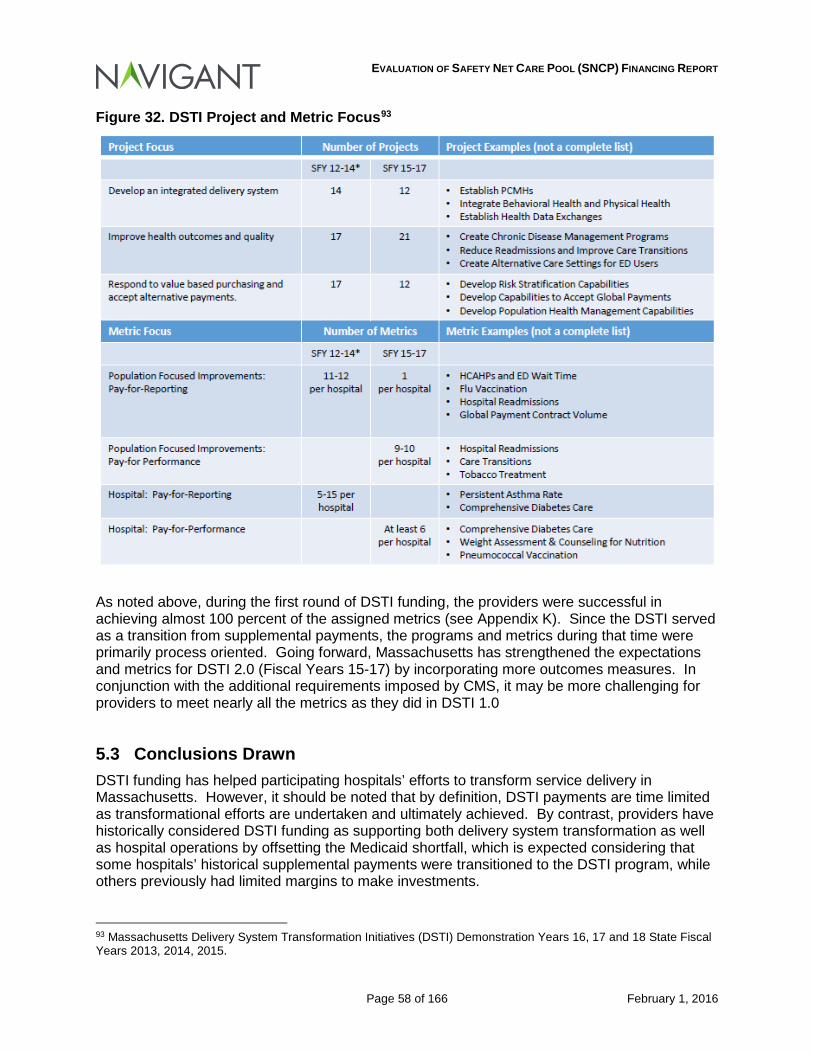
EVALUATION OF SAFETY NET CARE POOL (SNCP) FINANCING REPORT
Page 58 of 166 February 1, 2016
Figure 32. DSTI Project and Metric Focus93
As noted above, during the first round of DSTI funding, the providers were successful in achieving almost 100 percent of the assigned metrics (see Appendix K). Since the DSTI served as a transition from supplemental payments, the programs and metrics during that time were primarily process oriented. Going forward, Massachusetts has strengthened the expectations and metrics for DSTI 2.0 (Fiscal Years 15-17) by incorporating more outcomes measures. In conjunction with the additional requirements imposed by CMS, it may be more challenging for providers to meet nearly all the metrics as they did in DSTI 1.0
5.3 Conclusions Drawn DSTI funding has helped participating hospitals’ efforts to transform service delivery in Massachusetts. However, it should be noted that by definition, DSTI payments are time limited as transformational efforts are undertaken and ultimately achieved. By contrast, providers have historically considered DSTI funding as supporting both delivery system transformation as well as hospital operations by offsetting the Medicaid shortfall, which is expected considering that some hospitals’ historical supplemental payments were transitioned to the DSTI program, while others previously had limited margins to make investments. 93 Massachusetts Delivery System Transformation Initiatives (DSTI) Demonstration Years 16, 17 and 18 State Fiscal Years 2013, 2014, 2015.
EVALUATION OF SAFETY NET CARE POOL (SNCP) FINANCING REPORT
Page 59 of 166 February 1, 2016
As transformational projects are accomplished, the need for transitional payments should decline. At the same time, given the payment shortfalls identified in Section 4 of this report, it appears that support for ongoing hospital operations may continue to be necessary in some other form to assure the sustainability of safety net hospitals. In the following section, we describe some of the key factors that should be considered as EOHHS analyzes how best to restructure payments made through the SNCP program, including the DSTI component of the SNCP program.
EVALUATION OF SAFETY NET CARE POOL (SNCP) FINANCING REPORT
Page 60 of 166 February 1, 2016
6 Factors to Consider in the SNCP Program for Future Periods As a requirement of the 1115 Demonstration, EOHHS must restructure the Safety Net Care Pool by June 30, 2017. As they identify and evaluate options to restructure the program going forward, the following guiding principles should be considered:
• Distribution methods should be consistent with the efficiency, accessibility and the quality of care standards established under federal requirements.94
• Payments should be equitable, and related to the reasonable and necessary costs of services provided to patients eligible under the Medicaid program and to patients who are uninsured. In other words, payments should be made in ways to achieve some consistency when measuring pay-to-cost ratios, but at the same time, consider efficiency.
• For purposes of measuring or benchmarking payments against the costs of services, costs should be “normalized”. The “normalization” of costs for this purpose should consider differences in measureable factors that affect the costs of providing such services, which may include:
- Differences in Payer Mix and the relative difference in profit and loss by payer
- Differences in acuity of patients or intensity of services provided
- Overall Medicaid utilization
- Hospital characteristics that are consistent with the Massachusetts Medicaid mission and are integral to how services are delivered: hospitals with these characteristics may include teaching hospitals, children’s or pediatric specialty hospitals, safety-net hospitals, or rural or critical access hospitals.
• Consideration should also be given to those hospitals or service lines (pediatric, obstetric, neonatal, etc.) that have significant reliance on Medicaid funding for purposes of generating margins. In other words, consistent with the federal (a)(30)(A) access requirements, consideration should be given to hospitals or service lines that are most reliant on Medicaid funding to cover the costs of providing services.
Another factor, which is related to consideration of differences in payer mix, is the potential impact of certain hospitals’ ability to negotiate favorable rates with commercial entities. While one of EOHHS’ goals is to appropriately reimburse hospitals for the beneficiaries that are eligible for Medicaid services, a hospital’s ability to maintain its operations is vital to assure sufficient access to care for Medicaid beneficiaries. Some hospitals are more successful at negotiating contracts that can result in positive margins for services provided to individuals with commercial coverage. Those margins can be used to cover the overall costs of a hospital’s operations when public payers, such as the Medicaid and Medicare programs, may not fully fund the costs of services provided to their respective beneficiaries. As with any detailed analysis of hospitals, one item that should be considered is the efficiency of the hospitals in the delivery of services. An analysis was completed of Medicaid FFS activity for claims paid through the MMIS system on services from October 1, 2013 to September 30, 2014. A simplistic cost per discharge on the inpatient services and cost per episode on the outpatient services was calculated by taking total cost and dividing by the respective case mix indices to
94 The federal requirements that apply to payment for Medicaid services are described in U.S.C. § 1396a (a)(30)(A).
EVALUATION OF SAFETY NET CARE POOL (SNCP) FINANCING REPORT
Page 61 of 166 February 1, 2016
remove potential higher costs related to higher acuity cases. The following charts and tables (Figures 33-36) depict each hospital’s normalized cost per discharge and outpatient cost per episode as a percentage of the State-wide average cost per discharge or per episode. Nineteen hospitals of the 57 in the inpatient analysis had a cost per discharge greater than the statewide average. And, as with the inpatient cost per discharge, 19 of the 57 hospitals had a normalized outpatient cost per episode above the statewide average. Twelve of the 57 hospitals had both a normalized cost per discharge and a normalized cost per episode above the statewide average.
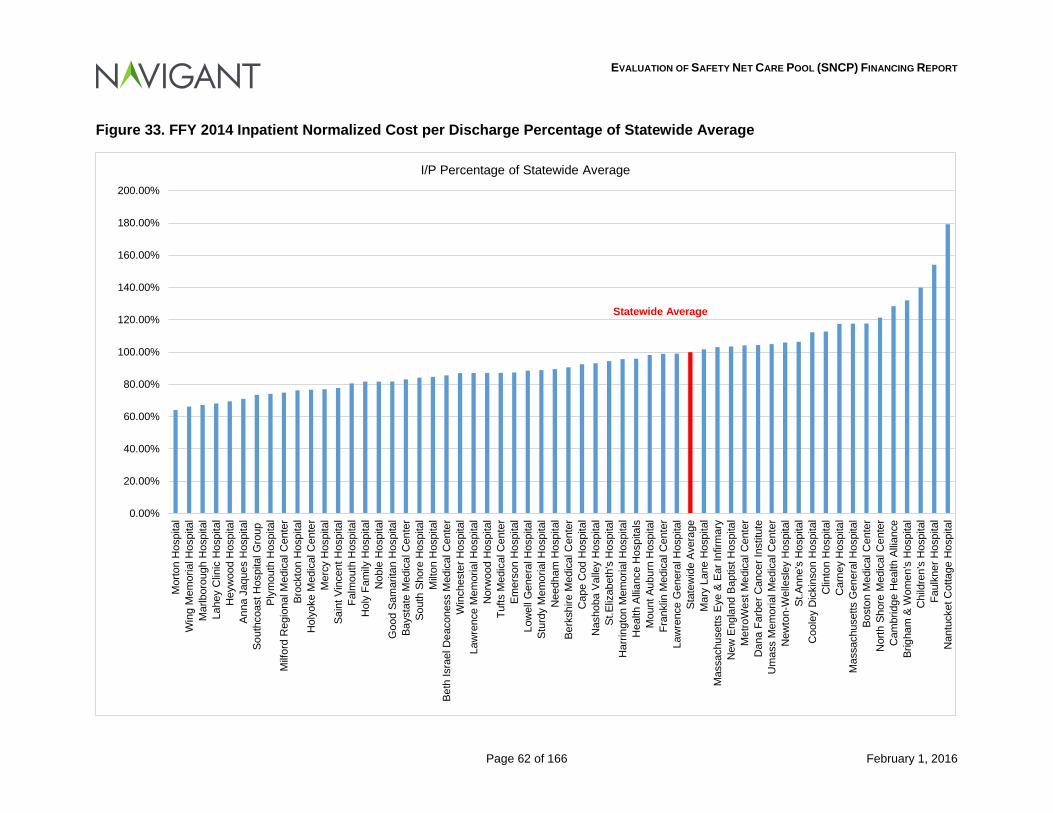
EVALUATION OF SAFETY NET CARE POOL (SNCP) FINANCING REPORT
Page 62 of 166 February 1, 2016
Figure 33. FFY 2014 Inpatient Normalized Cost per Discharge Percentage of Statewide Average
0.00%
20.00%
40.00%
60.00%
80.00%
100.00%
120.00%
140.00%
160.00%
180.00%
200.00%M
orto
n H
ospi
tal
Win
g M
emor
ial H
ospi
tal
Mar
lbor
ough
Hos
pita
lLa
hey
Clin
ic H
ospi
tal
Hey
woo
d H
ospi
tal
Anna
Jaq
ues
Hos
pita
lSo
uthc
oast
Hos
pita
l Gro
upPl
ymou
th H
ospi
tal
Milf
ord
Reg
iona
l Med
ical
Cen
ter
Broc
kton
Hos
pita
lH
olyo
ke M
edic
al C
ente
rM
ercy
Hos
pita
lSa
int V
ince
nt H
ospi
tal
Falm
outh
Hos
pita
lH
oly
Fam
ily H
ospi
tal
Nob
le H
ospi
tal
Goo
d Sa
mar
itan
Hos
pita
lBa
ysta
te M
edic
al C
ente
rSo
uth
Shor
e H
ospi
tal
Milt
on H
ospi
tal
Beth
Isra
el D
eaco
ness
Med
ical
Cen
ter
Win
ches
ter H
ospi
tal
Law
renc
e M
emor
ial H
ospi
tal
Nor
woo
d H
ospi
tal
Tufts
Med
ical
Cen
ter
Emer
son
Hos
pita
lLo
wel
l Gen
eral
Hos
pita
lSt
urdy
Mem
oria
l Hos
pita
lN
eedh
am H
ospi
tal
Berk
shire
Med
ical
Cen
ter
Cap
e C
od H
ospi
tal
Nas
hoba
Val
ley
Hos
pita
lSt
.Eliz
abet
h's
Hos
pita
lH
arrin
gton
Mem
oria
l Hos
pita
lH
ealth
Allia
nce
Hos
pita
lsM
ount
Aub
urn
Hos
pita
lFr
ankl
in M
edic
al C
ente
rLa
wre
nce
Gen
eral
Hos
pita
lSt
atew
ide
Ave
rage
Mar
y La
ne H
ospi
tal
Mas
sach
uset
ts E
ye &
Ear
Infir
mar
yN
ew E
ngla
nd B
aptis
t Hos
pita
lM
etro
Wes
t Med
ical
Cen
ter
Dan
a Fa
rber
Can
cer I
nstit
ute
Um
ass
Mem
oria
l Med
ical
Cen
ter
New
ton-
Wel
lesl
ey H
ospi
tal
St.A
nne'
s H
ospi
tal
Coo
ley
Dic
kins
on H
ospi
tal
Clin
ton
Hos
pita
lC
arne
y H
ospi
tal
Mas
sach
uset
ts G
ener
al H
ospi
tal
Bost
on M
edic
al C
ente
rN
orth
Sho
re M
edic
al C
ente
rC
ambr
idge
Hea
lth A
llian
ceBr
igha
m &
Wom
en's
Hos
pita
lC
hild
ren'
s H
ospi
tal
Faul
kner
Hos
pita
lN
antu
cket
Cot
tage
Hos
pita
l
I/P Percentage of Statewide Average
Statewide Average
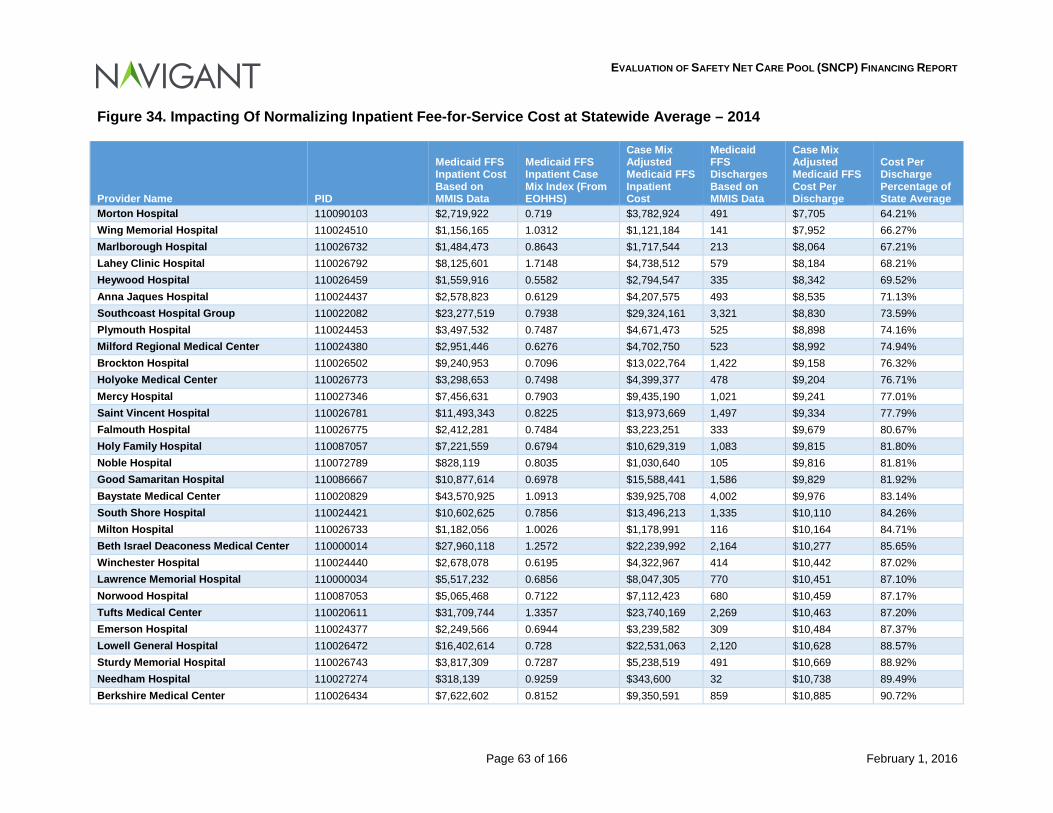
EVALUATION OF SAFETY NET CARE POOL (SNCP) FINANCING REPORT
Page 63 of 166 February 1, 2016
Figure 34. Impacting Of Normalizing Inpatient Fee-for-Service Cost at Statewide Average – 2014
Provider Name PID
Medicaid FFS Inpatient Cost Based on MMIS Data
Medicaid FFS Inpatient Case Mix Index (From EOHHS)
Case Mix Adjusted Medicaid FFS Inpatient Cost
Medicaid FFS Discharges Based on MMIS Data
Case Mix Adjusted Medicaid FFS Cost Per Discharge
Cost Per Discharge Percentage of State Average
Morton Hospital 110090103 $2,719,922 0.719 $3,782,924 491 $7,705 64.21% Wing Memorial Hospital 110024510 $1,156,165 1.0312 $1,121,184 141 $7,952 66.27% Marlborough Hospital 110026732 $1,484,473 0.8643 $1,717,544 213 $8,064 67.21% Lahey Clinic Hospital 110026792 $8,125,601 1.7148 $4,738,512 579 $8,184 68.21% Heywood Hospital 110026459 $1,559,916 0.5582 $2,794,547 335 $8,342 69.52% Anna Jaques Hospital 110024437 $2,578,823 0.6129 $4,207,575 493 $8,535 71.13% Southcoast Hospital Group 110022082 $23,277,519 0.7938 $29,324,161 3,321 $8,830 73.59% Plymouth Hospital 110024453 $3,497,532 0.7487 $4,671,473 525 $8,898 74.16% Milford Regional Medical Center 110024380 $2,951,446 0.6276 $4,702,750 523 $8,992 74.94% Brockton Hospital 110026502 $9,240,953 0.7096 $13,022,764 1,422 $9,158 76.32% Holyoke Medical Center 110026773 $3,298,653 0.7498 $4,399,377 478 $9,204 76.71% Mercy Hospital 110027346 $7,456,631 0.7903 $9,435,190 1,021 $9,241 77.01% Saint Vincent Hospital 110026781 $11,493,343 0.8225 $13,973,669 1,497 $9,334 77.79% Falmouth Hospital 110026775 $2,412,281 0.7484 $3,223,251 333 $9,679 80.67% Holy Family Hospital 110087057 $7,221,559 0.6794 $10,629,319 1,083 $9,815 81.80% Noble Hospital 110072789 $828,119 0.8035 $1,030,640 105 $9,816 81.81% Good Samaritan Hospital 110086667 $10,877,614 0.6978 $15,588,441 1,586 $9,829 81.92% Baystate Medical Center 110020829 $43,570,925 1.0913 $39,925,708 4,002 $9,976 83.14% South Shore Hospital 110024421 $10,602,625 0.7856 $13,496,213 1,335 $10,110 84.26% Milton Hospital 110026733 $1,182,056 1.0026 $1,178,991 116 $10,164 84.71% Beth Israel Deaconess Medical Center 110000014 $27,960,118 1.2572 $22,239,992 2,164 $10,277 85.65% Winchester Hospital 110024440 $2,678,078 0.6195 $4,322,967 414 $10,442 87.02% Lawrence Memorial Hospital 110000034 $5,517,232 0.6856 $8,047,305 770 $10,451 87.10% Norwood Hospital 110087053 $5,065,468 0.7122 $7,112,423 680 $10,459 87.17% Tufts Medical Center 110020611 $31,709,744 1.3357 $23,740,169 2,269 $10,463 87.20% Emerson Hospital 110024377 $2,249,566 0.6944 $3,239,582 309 $10,484 87.37% Lowell General Hospital 110026472 $16,402,614 0.728 $22,531,063 2,120 $10,628 88.57% Sturdy Memorial Hospital 110026743 $3,817,309 0.7287 $5,238,519 491 $10,669 88.92% Needham Hospital 110027274 $318,139 0.9259 $343,600 32 $10,738 89.49% Berkshire Medical Center 110026434 $7,622,602 0.8152 $9,350,591 859 $10,885 90.72%
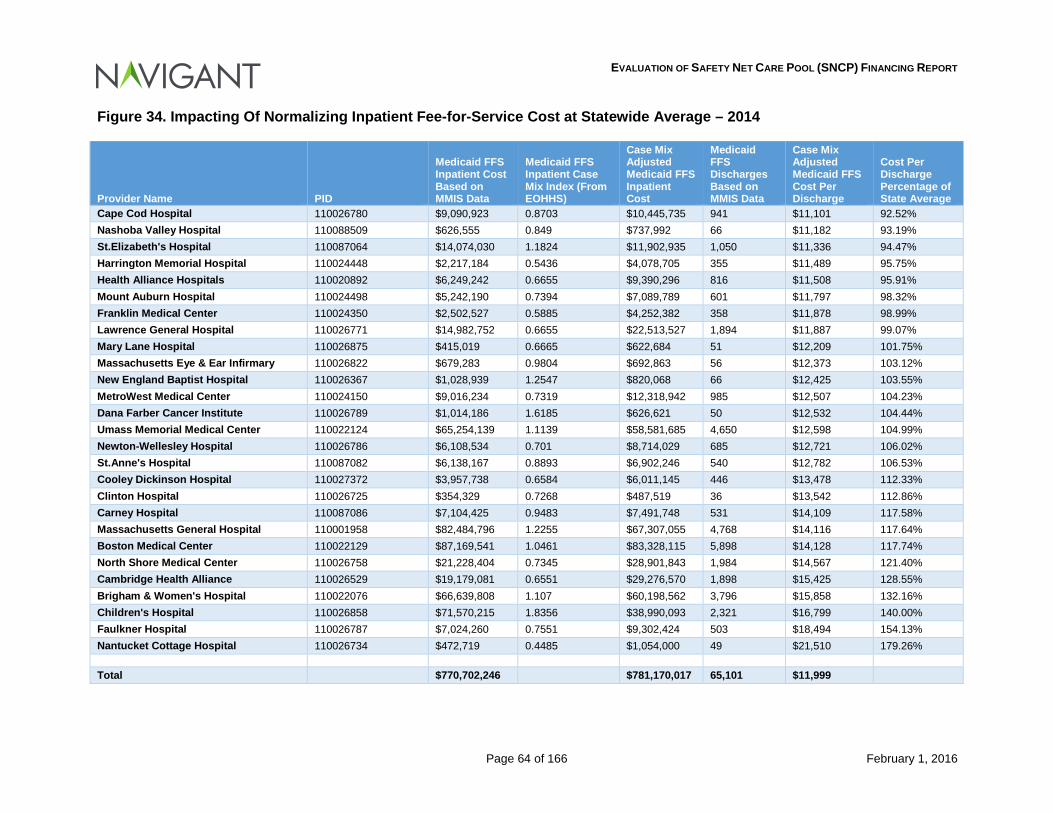
EVALUATION OF SAFETY NET CARE POOL (SNCP) FINANCING REPORT
Page 64 of 166 February 1, 2016
Figure 34. Impacting Of Normalizing Inpatient Fee-for-Service Cost at Statewide Average – 2014
Provider Name PID
Medicaid FFS Inpatient Cost Based on MMIS Data
Medicaid FFS Inpatient Case Mix Index (From EOHHS)
Case Mix Adjusted Medicaid FFS Inpatient Cost
Medicaid FFS Discharges Based on MMIS Data
Case Mix Adjusted Medicaid FFS Cost Per Discharge
Cost Per Discharge Percentage of State Average
Cape Cod Hospital 110026780 $9,090,923 0.8703 $10,445,735 941 $11,101 92.52% Nashoba Valley Hospital 110088509 $626,555 0.849 $737,992 66 $11,182 93.19% St.Elizabeth's Hospital 110087064 $14,074,030 1.1824 $11,902,935 1,050 $11,336 94.47% Harrington Memorial Hospital 110024448 $2,217,184 0.5436 $4,078,705 355 $11,489 95.75% Health Alliance Hospitals 110020892 $6,249,242 0.6655 $9,390,296 816 $11,508 95.91% Mount Auburn Hospital 110024498 $5,242,190 0.7394 $7,089,789 601 $11,797 98.32% Franklin Medical Center 110024350 $2,502,527 0.5885 $4,252,382 358 $11,878 98.99% Lawrence General Hospital 110026771 $14,982,752 0.6655 $22,513,527 1,894 $11,887 99.07% Mary Lane Hospital 110026875 $415,019 0.6665 $622,684 51 $12,209 101.75% Massachusetts Eye & Ear Infirmary 110026822 $679,283 0.9804 $692,863 56 $12,373 103.12% New England Baptist Hospital 110026367 $1,028,939 1.2547 $820,068 66 $12,425 103.55% MetroWest Medical Center 110024150 $9,016,234 0.7319 $12,318,942 985 $12,507 104.23% Dana Farber Cancer Institute 110026789 $1,014,186 1.6185 $626,621 50 $12,532 104.44% Umass Memorial Medical Center 110022124 $65,254,139 1.1139 $58,581,685 4,650 $12,598 104.99% Newton-Wellesley Hospital 110026786 $6,108,534 0.701 $8,714,029 685 $12,721 106.02% St.Anne's Hospital 110087082 $6,138,167 0.8893 $6,902,246 540 $12,782 106.53% Cooley Dickinson Hospital 110027372 $3,957,738 0.6584 $6,011,145 446 $13,478 112.33% Clinton Hospital 110026725 $354,329 0.7268 $487,519 36 $13,542 112.86% Carney Hospital 110087086 $7,104,425 0.9483 $7,491,748 531 $14,109 117.58% Massachusetts General Hospital 110001958 $82,484,796 1.2255 $67,307,055 4,768 $14,116 117.64% Boston Medical Center 110022129 $87,169,541 1.0461 $83,328,115 5,898 $14,128 117.74% North Shore Medical Center 110026758 $21,228,404 0.7345 $28,901,843 1,984 $14,567 121.40% Cambridge Health Alliance 110026529 $19,179,081 0.6551 $29,276,570 1,898 $15,425 128.55% Brigham & Women's Hospital 110022076 $66,639,808 1.107 $60,198,562 3,796 $15,858 132.16% Children's Hospital 110026858 $71,570,215 1.8356 $38,990,093 2,321 $16,799 140.00% Faulkner Hospital 110026787 $7,024,260 0.7551 $9,302,424 503 $18,494 154.13% Nantucket Cottage Hospital 110026734 $472,719 0.4485 $1,054,000 49 $21,510 179.26%
Total $770,702,246 $781,170,017 65,101 $11,999
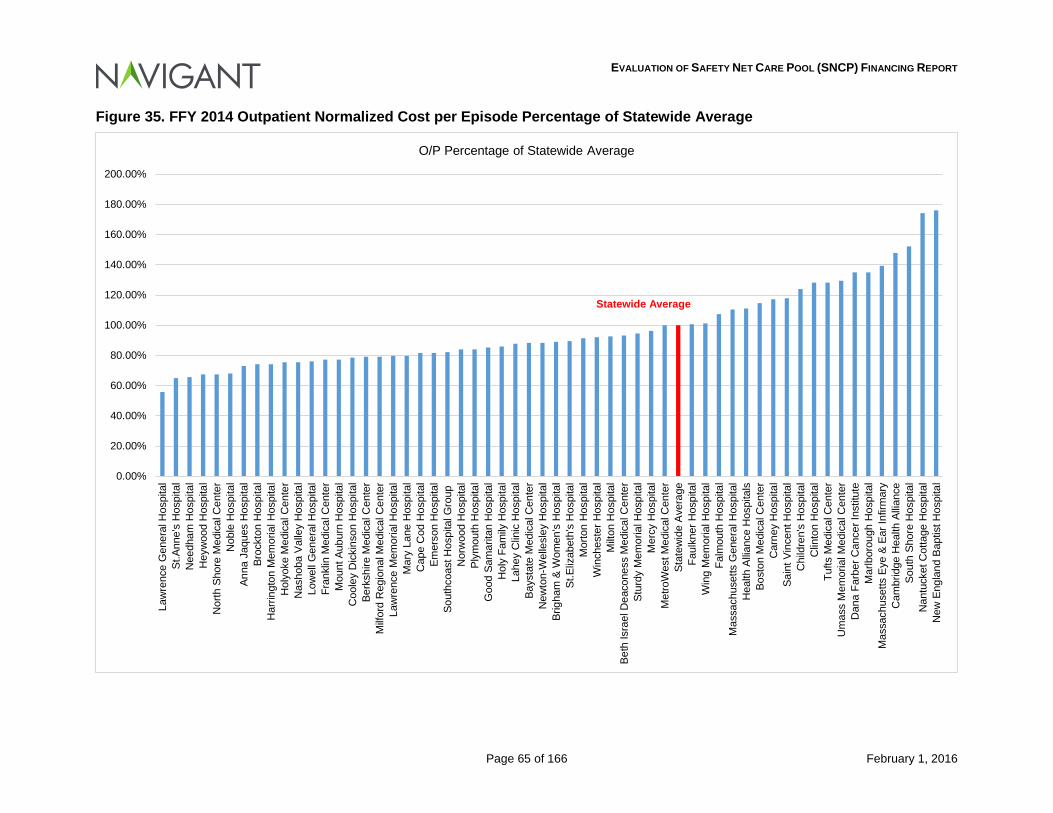
EVALUATION OF SAFETY NET CARE POOL (SNCP) FINANCING REPORT
Page 65 of 166 February 1, 2016
Figure 35. FFY 2014 Outpatient Normalized Cost per Episode Percentage of Statewide Average
0.00%
20.00%
40.00%
60.00%
80.00%
100.00%
120.00%
140.00%
160.00%
180.00%
200.00%La
wre
nce
Gen
eral
Hos
pita
lSt
.Ann
e's
Hos
pita
lN
eedh
am H
ospi
tal
Hey
woo
d H
ospi
tal
Nor
th S
hore
Med
ical
Cen
ter
Nob
le H
ospi
tal
Anna
Jaq
ues
Hos
pita
lBr
ockt
on H
ospi
tal
Har
ringt
on M
emor
ial H
ospi
tal
Hol
yoke
Med
ical
Cen
ter
Nas
hoba
Val
ley
Hos
pita
lLo
wel
l Gen
eral
Hos
pita
lFr
ankl
in M
edic
al C
ente
rM
ount
Aub
urn
Hos
pita
lC
oole
y D
icki
nson
Hos
pita
lBe
rksh
ire M
edic
al C
ente
rM
ilfor
d R
egio
nal M
edic
al C
ente
rLa
wre
nce
Mem
oria
l Hos
pita
lM
ary
Lane
Hos
pita
lC
ape
Cod
Hos
pita
lEm
erso
n H
ospi
tal
Sout
hcoa
st H
ospi
tal G
roup
Nor
woo
d H
ospi
tal
Plym
outh
Hos
pita
lG
ood
Sam
arita
n H
ospi
tal
Hol
y Fa
mily
Hos
pita
lLa
hey
Clin
ic H
ospi
tal
Bays
tate
Med
ical
Cen
ter
New
ton-
Wel
lesl
ey H
ospi
tal
Brig
ham
& W
omen
's H
ospi
tal
St.E
lizab
eth'
s H
ospi
tal
Mor
ton
Hos
pita
lW
inch
este
r Hos
pita
lM
ilton
Hos
pita
lBe
th Is
rael
Dea
cone
ss M
edic
al C
ente
rSt
urdy
Mem
oria
l Hos
pita
lM
ercy
Hos
pita
lM
etro
Wes
t Med
ical
Cen
ter
Stat
ewid
e A
vera
geFa
ulkn
er H
ospi
tal
Win
g M
emor
ial H
ospi
tal
Falm
outh
Hos
pita
lM
assa
chus
etts
Gen
eral
Hos
pita
lH
ealth
Allia
nce
Hos
pita
lsBo
ston
Med
ical
Cen
ter
Car
ney
Hos
pita
lSa
int V
ince
nt H
ospi
tal
Chi
ldre
n's
Hos
pita
lC
linto
n H
ospi
tal
Tufts
Med
ical
Cen
ter
Um
ass
Mem
oria
l Med
ical
Cen
ter
Dan
a Fa
rber
Can
cer I
nstit
ute
Mar
lbor
ough
Hos
pita
lM
assa
chus
etts
Eye
& E
ar In
firm
ary
Cam
brid
ge H
ealth
Alli
ance
Sout
h Sh
ore
Hos
pita
lN
antu
cket
Cot
tage
Hos
pita
lN
ew E
ngla
nd B
aptis
t Hos
pita
l
O/P Percentage of Statewide Average
Statewide Average
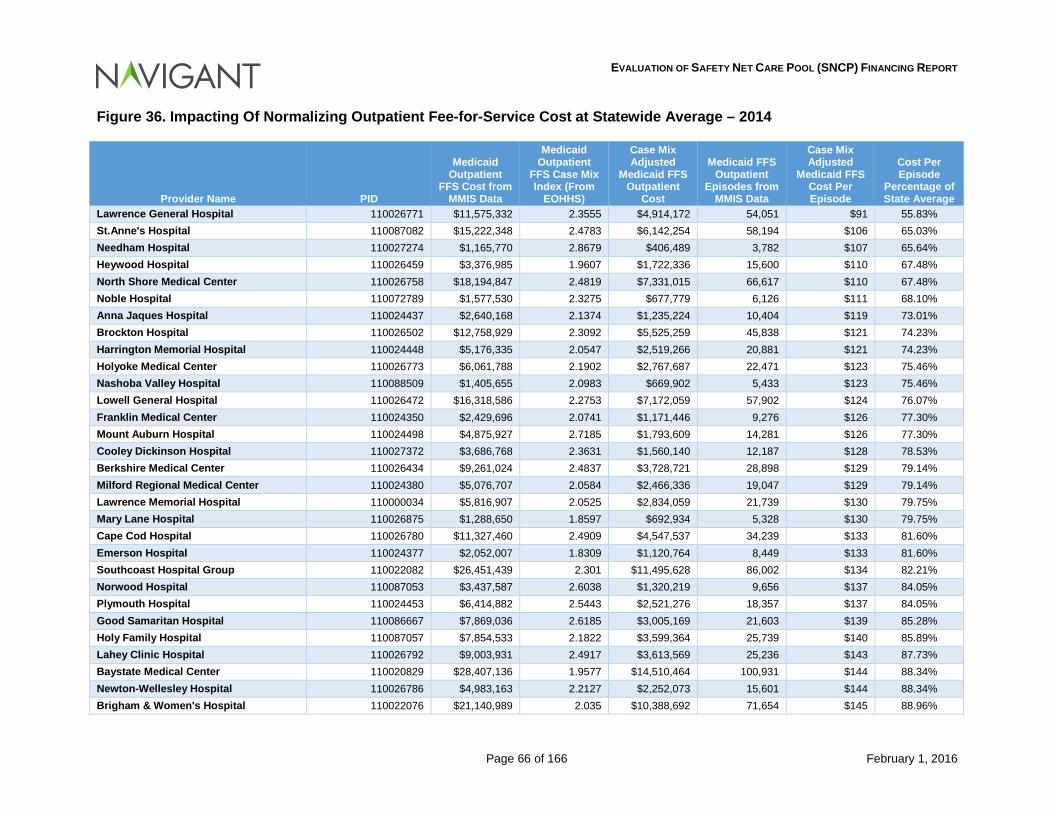
EVALUATION OF SAFETY NET CARE POOL (SNCP) FINANCING REPORT
Page 66 of 166 February 1, 2016
Figure 36. Impacting Of Normalizing Outpatient Fee-for-Service Cost at Statewide Average – 2014
Provider Name PID
Medicaid Outpatient
FFS Cost from MMIS Data
Medicaid Outpatient
FFS Case Mix Index (From
EOHHS)
Case Mix Adjusted
Medicaid FFS Outpatient
Cost
Medicaid FFS Outpatient
Episodes from MMIS Data
Case Mix Adjusted
Medicaid FFS Cost Per Episode
Cost Per Episode
Percentage of State Average
Lawrence General Hospital 110026771 $11,575,332 2.3555 $4,914,172 54,051 $91 55.83% St.Anne's Hospital 110087082 $15,222,348 2.4783 $6,142,254 58,194 $106 65.03% Needham Hospital 110027274 $1,165,770 2.8679 $406,489 3,782 $107 65.64% Heywood Hospital 110026459 $3,376,985 1.9607 $1,722,336 15,600 $110 67.48% North Shore Medical Center 110026758 $18,194,847 2.4819 $7,331,015 66,617 $110 67.48% Noble Hospital 110072789 $1,577,530 2.3275 $677,779 6,126 $111 68.10% Anna Jaques Hospital 110024437 $2,640,168 2.1374 $1,235,224 10,404 $119 73.01% Brockton Hospital 110026502 $12,758,929 2.3092 $5,525,259 45,838 $121 74.23% Harrington Memorial Hospital 110024448 $5,176,335 2.0547 $2,519,266 20,881 $121 74.23% Holyoke Medical Center 110026773 $6,061,788 2.1902 $2,767,687 22,471 $123 75.46% Nashoba Valley Hospital 110088509 $1,405,655 2.0983 $669,902 5,433 $123 75.46% Lowell General Hospital 110026472 $16,318,586 2.2753 $7,172,059 57,902 $124 76.07% Franklin Medical Center 110024350 $2,429,696 2.0741 $1,171,446 9,276 $126 77.30% Mount Auburn Hospital 110024498 $4,875,927 2.7185 $1,793,609 14,281 $126 77.30% Cooley Dickinson Hospital 110027372 $3,686,768 2.3631 $1,560,140 12,187 $128 78.53% Berkshire Medical Center 110026434 $9,261,024 2.4837 $3,728,721 28,898 $129 79.14% Milford Regional Medical Center 110024380 $5,076,707 2.0584 $2,466,336 19,047 $129 79.14% Lawrence Memorial Hospital 110000034 $5,816,907 2.0525 $2,834,059 21,739 $130 79.75% Mary Lane Hospital 110026875 $1,288,650 1.8597 $692,934 5,328 $130 79.75% Cape Cod Hospital 110026780 $11,327,460 2.4909 $4,547,537 34,239 $133 81.60% Emerson Hospital 110024377 $2,052,007 1.8309 $1,120,764 8,449 $133 81.60% Southcoast Hospital Group 110022082 $26,451,439 2.301 $11,495,628 86,002 $134 82.21% Norwood Hospital 110087053 $3,437,587 2.6038 $1,320,219 9,656 $137 84.05% Plymouth Hospital 110024453 $6,414,882 2.5443 $2,521,276 18,357 $137 84.05% Good Samaritan Hospital 110086667 $7,869,036 2.6185 $3,005,169 21,603 $139 85.28% Holy Family Hospital 110087057 $7,854,533 2.1822 $3,599,364 25,739 $140 85.89% Lahey Clinic Hospital 110026792 $9,003,931 2.4917 $3,613,569 25,236 $143 87.73% Baystate Medical Center 110020829 $28,407,136 1.9577 $14,510,464 100,931 $144 88.34% Newton-Wellesley Hospital 110026786 $4,983,163 2.2127 $2,252,073 15,601 $144 88.34% Brigham & Women's Hospital 110022076 $21,140,989 2.035 $10,388,692 71,654 $145 88.96%
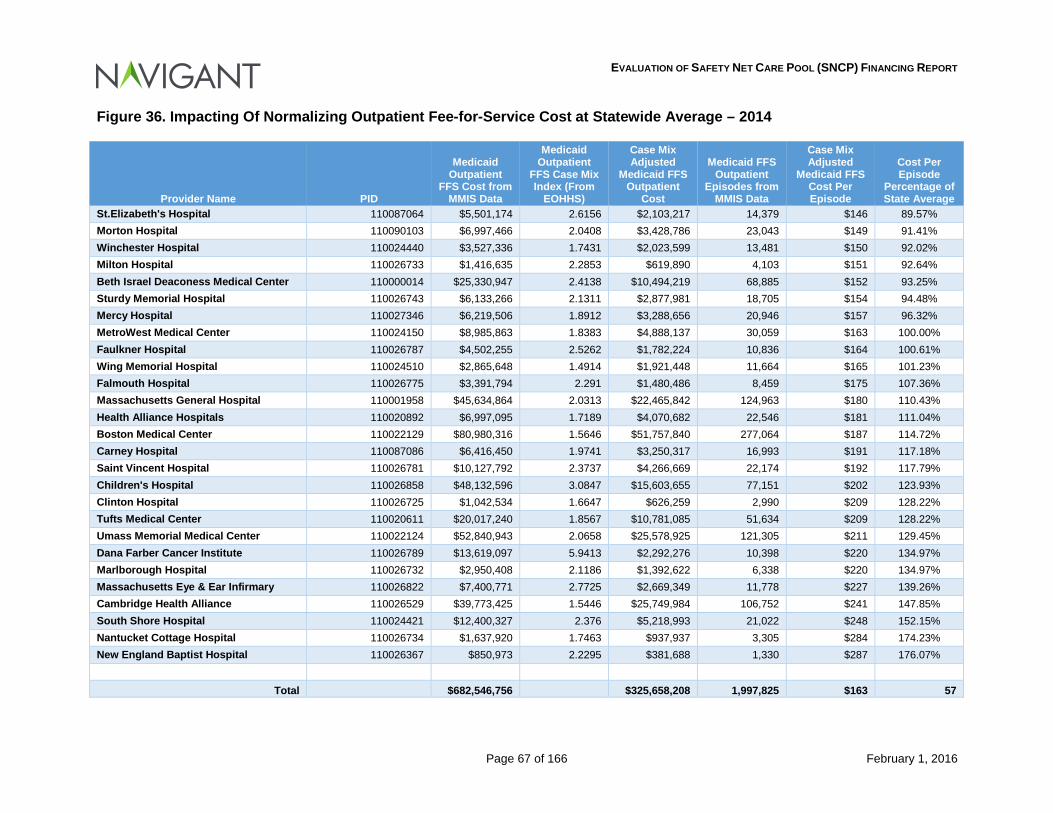
EVALUATION OF SAFETY NET CARE POOL (SNCP) FINANCING REPORT
Page 67 of 166 February 1, 2016
Figure 36. Impacting Of Normalizing Outpatient Fee-for-Service Cost at Statewide Average – 2014
Provider Name PID
Medicaid Outpatient
FFS Cost from MMIS Data
Medicaid Outpatient
FFS Case Mix Index (From
EOHHS)
Case Mix Adjusted
Medicaid FFS Outpatient
Cost
Medicaid FFS Outpatient
Episodes from MMIS Data
Case Mix Adjusted
Medicaid FFS Cost Per Episode
Cost Per Episode
Percentage of State Average
St.Elizabeth's Hospital 110087064 $5,501,174 2.6156 $2,103,217 14,379 $146 89.57% Morton Hospital 110090103 $6,997,466 2.0408 $3,428,786 23,043 $149 91.41% Winchester Hospital 110024440 $3,527,336 1.7431 $2,023,599 13,481 $150 92.02% Milton Hospital 110026733 $1,416,635 2.2853 $619,890 4,103 $151 92.64% Beth Israel Deaconess Medical Center 110000014 $25,330,947 2.4138 $10,494,219 68,885 $152 93.25% Sturdy Memorial Hospital 110026743 $6,133,266 2.1311 $2,877,981 18,705 $154 94.48% Mercy Hospital 110027346 $6,219,506 1.8912 $3,288,656 20,946 $157 96.32% MetroWest Medical Center 110024150 $8,985,863 1.8383 $4,888,137 30,059 $163 100.00% Faulkner Hospital 110026787 $4,502,255 2.5262 $1,782,224 10,836 $164 100.61% Wing Memorial Hospital 110024510 $2,865,648 1.4914 $1,921,448 11,664 $165 101.23% Falmouth Hospital 110026775 $3,391,794 2.291 $1,480,486 8,459 $175 107.36% Massachusetts General Hospital 110001958 $45,634,864 2.0313 $22,465,842 124,963 $180 110.43% Health Alliance Hospitals 110020892 $6,997,095 1.7189 $4,070,682 22,546 $181 111.04% Boston Medical Center 110022129 $80,980,316 1.5646 $51,757,840 277,064 $187 114.72% Carney Hospital 110087086 $6,416,450 1.9741 $3,250,317 16,993 $191 117.18% Saint Vincent Hospital 110026781 $10,127,792 2.3737 $4,266,669 22,174 $192 117.79% Children's Hospital 110026858 $48,132,596 3.0847 $15,603,655 77,151 $202 123.93% Clinton Hospital 110026725 $1,042,534 1.6647 $626,259 2,990 $209 128.22% Tufts Medical Center 110020611 $20,017,240 1.8567 $10,781,085 51,634 $209 128.22% Umass Memorial Medical Center 110022124 $52,840,943 2.0658 $25,578,925 121,305 $211 129.45% Dana Farber Cancer Institute 110026789 $13,619,097 5.9413 $2,292,276 10,398 $220 134.97% Marlborough Hospital 110026732 $2,950,408 2.1186 $1,392,622 6,338 $220 134.97% Massachusetts Eye & Ear Infirmary 110026822 $7,400,771 2.7725 $2,669,349 11,778 $227 139.26% Cambridge Health Alliance 110026529 $39,773,425 1.5446 $25,749,984 106,752 $241 147.85% South Shore Hospital 110024421 $12,400,327 2.376 $5,218,993 21,022 $248 152.15% Nantucket Cottage Hospital 110026734 $1,637,920 1.7463 $937,937 3,305 $284 174.23% New England Baptist Hospital 110026367 $850,973 2.2295 $381,688 1,330 $287 176.07%
Total $682,546,756 $325,658,208 1,997,825 $163 57
EVALUATION OF SAFETY NET CARE POOL (SNCP) FINANCING REPORT
Page 68 of 166 February 1, 2016
The simplistic approach to determining utilization assumes that the acuity level of cases are driven by such factors as: interns & residents teaching programs, organ transplant facility, and other paramedical education programs. More complicated scenarios could be performed by placing various weights on case mix and other cost drivers at hospitals to determine efficiency. Cost protocols allow hospitals to continue to provide services at an inefficient rate but encompassing the factors in this section and potential changes in the 1115 Demonstration going forward should force these inefficiencies in cost to be eliminated in future years. Further, as mentioned previously in Section 5 of this report, consideration should be given to the time limited and transitional nature of DSTI payments going forward. In other words, one should consider whether or not transitional payments should be continued after the investment in transformational efforts have been made, and resulting improvements to service delivery infrastructure are accomplished. Finally, EOHHS should consider the impact of service delivery models to be realized in future periods. We understand that EOHHS is considering a transition to an Accountable Care Organization (ACO) model, which may effectively achieve currently unrealized efficiencies in service delivery for Medicaid eligibles. Potential efficiencies to be gained through such a transition should also be considered when evaluating overall future funding requirements for the SNCP program.
6.1 Conclusions Drawn There are many factors that should be considered as EOHHS works to restructure the SNCP program going forward. As the factors described above are evaluated, EOHHS will need to find the appropriate balance between the federal requirements related to this program, and EOHHS’ overall program and policy objectives.
EVALUATION OF SAFETY NET CARE POOL (SNCP) FINANCING REPORT
Page 69 of 166 February 1, 2016
7 Conclusion During the period covered by this report, the Commonwealth continued progress toward achieving the four waiver goals: (1) near universal health care coverage for all residents; (2) redirection of spending from uncompensated care to insurance coverage; (3) delivery system reform that promotes patient-centered, coordinated care oriented toward wellness, chronic disease management, and positive health outcomes; and (4) payment reform that incentivizes health care quality over volume, and cost savings through the establishment of alternate payment structures.95 The use of SNCP funding was an integral component of this effort and contributed to the outcomes achieved. The analyses described in this document confirm that SNCP funding is a vital component for sustaining access to quality care in the Commonwealth for those individuals eligible for hospital services under MassHealth programs, and the need for ongoing support of safety net providers through SNCP funding. According to our findings, in the aggregate, hospitals that are eligible for DSTI payments under the SNCP program during the Financing Report review period received combined Medicaid and SNCP payments that covered approximately 91.29 percent of the costs incurred in providing services to those eligible for Medicaid services and the uninsured.96 In the absence of SNCP payments, the pay-to-cost ratio for Medicaid and uninsured services would drop to 83.92 percent.97 Clearly, the funds provided to hospitals through the SNCP program are critical to sustaining the provision of services to these populations. However, as the Commonwealth makes significant shifts in its payment and health care delivery models, it is appropriate to revisit the use of SNCP funding to ensure that it most effectively supports the goals of value based health care. It is also clear that as goals are achieved and efficiencies are introduced into the system, the time is right to review the current structure and make adjustments to the methodology to assure continued progress. The Commonwealth should also consider the transitional nature of the DSTI program. The hospitals participating in the DSTI program achieved almost 100 percent of the project goals for the first DSTI term. Funds available through the DSTI program are intended to be time limited, as the specified intent for DSTI funding is transformational. As transformations are achieved, in theory, the need for DSTI funding should change. At the same time, it appears that there is a need for ongoing support for safety net hospitals, to support their sustainability. As part of its overall transformation strategy, we understand that EOHHS is exploring introducing an ACO model and delivery system in conjunction with restructuring the SNCP funding program. We believe that there are efficiencies to be gained though the transition to this type of service delivery model, and that these efficiencies will be achieved over time. Correspondingly, while the current level of SNCP funding may have been appropriate and necessary under historical service delivery models, we believe that there will be opportunities to be less reliant on SNCP funding in future years, as EOHHS makes progress toward its accountable care model service delivery waiver goals. Moreover, new payment models present
95 MassHealth Section 1115(a) Demonstration Waiver 2011-2014 Evaluation Final Report, October 24, 2014 96 Percentage is based on cost information determined for 2013 and 2014. No cost data was available for 2015 during the completion of this report. The percentage is based on net of intergovernmental transfer expenditures. The gross expenditures percentage is 95.12 percent. 97 Percentage in based on net of intergovernmental transfer expenditures. The gross expenditure percentage is 85.86 percent.

EVALUATION OF SAFETY NET CARE POOL (SNCP) FINANCING REPORT
Page 70 of 166 February 1, 2016
opportunities for providers to not only gain efficiencies but also to capture savings achieved through better care coordination and more effective service delivery outcomes. We strongly recommend that Massachusetts continue the open dialogue with CMS and to work closely with them in partnership to design and implement a financing model that takes into consideration the factors described in Section 6 of this report.
EVALUATION OF SAFETY NET CARE POOL (SNCP) FINANCING REPORT
Page 71 of 166 February 1, 2016
8 Appendices:
8.1 Appendix A: Regulatory Summary A variety of federal and state regulations establish the requirements and provide guidelines regarding how Massachusetts Medicaid (MassHealth) may collect and distribute funds in operation of the MassHealth program. As long as a Medicaid Agency operates its program in a way that is compliant with these regulations, it is eligible to receive federal matching funds toward allowable Medicaid expenditures. Any funding or payment practices that are not compliant with these regulations may result in denial of federal financial participation for the portion of funding that is not compliant. Because of this, all options for changes in the Massachusetts Medicaid program suggested in this paper were developed with these guidelines in mind. Since the Medicaid program’s inception in 1965, flexibility in financing the non-federal share has allowed states to use local sources of health care financing while making these local funds eligible for federal match. Section 1902(a)(2) of the Social Security Act includes a provision requiring at least forty (40) percent of the “state share” to come from the state while allowing up to sixty (60) percent to come from local sources.98 The most common sources of local funding are inter-governmental transfers (IGTs), certified public expenditures (CPEs), and health care related taxes, often referred to as provider assessments. IGTs and CPEs must originate from a governmental agency such as a non-Medicaid state agency or local government such as a county or municipality. Public healthcare providers, such as county hospitals or school districts, also qualify as units of local government. Provider assessments are defined by federal statute as taxes in which at least 85 percent of the tax burden falls on health care providers.99 A 2014 report from the Government Accountability Office detailed the sources of non-federal share of Medicaid expenditures nationally for state fiscal year 2012.100 As shown in Figure 37, about 70 percent of the state share comes from state general revenue. Other sources including local governments and health care providers (through provider assessments) also contribute significant funds towards the state share of Medicaid programs.
98 The Social Security Act, Section 1902(a)(2). 99 The Social Security Act, Section 1903(w)(3)(A). 100 GAO “Medicaid Financing States’ Increased Reliance on Funds from Health Care Providers and Local Governments Warrants Improved CMS Data Collection” (GAO-14-627), Figure 1. (July 2014)

EVALUATION OF SAFETY NET CARE POOL (SNCP) FINANCING REPORT
Page 72 of 166 February 1, 2016
Figure 37. Sources of funds for the state share of Medicaid across all Medicaid programs in the United States.
Per the GAO Report, “For purposes of this report, state funds refers to state general funds and intra-agency funds, which are intra-agency payments, intra-agency transfers, and intra-agency certified public expenditures. Other sources of funds include tobacco settlement funds and state trust funds. Taxes on health care services, or the provision or payment for these services, are being reported separately as health care provider taxes.”101 A 2012 report from the Medicaid and CHIP Payment and Access Commission (MACPAC) related to this issue stated:
“At various points, particularly beginning in the early 1990s, this multi-source approach to financing has been the subject of federal scrutiny, sometimes because of evidence of state excesses (GAO 2004b, GAO 1994), and sometimes in an effort to control federal spending by limiting states’ ability to make expenditures that qualify for federal contributions.”102
In addition to traditional fee-for-service (FFS) Medicaid payments for services rendered to Medicaid recipients, two forms of supplemental payments may be made to providers: Disproportionate Share Hospital (DSH) supplemental payments and non-DSH supplemental payments.
101 Ibid. 102 MACPAC. Report to the Congress on Medicaid and CHIP. (March 2012)
EVALUATION OF SAFETY NET CARE POOL (SNCP) FINANCING REPORT
Page 73 of 166 February 1, 2016
• DSH payments are intended to make Medicaid payment adjustments for hospitals that serve a disproportionate share of low–income patients with special needs. As such, DSH funds help to cover hospital costs for Medicaid shortfall and for care of the uninsured.
o Medicaid shortfall is the difference between non-DSH Medicaid payments and hospital cost to provide care to Medicaid recipients.
o The cost of care for uninsured is defined as hospital costs to care for recipients who have no health insurance or other source of third party coverage or whose health insurance does not cover any of the services related to an entire episode of care (such as a hospital admission).
• Non-DSH supplemental payments may be distributed for a variety of reasons, most common of which are Graduate Medical Education (GME) payments, Upper Payment Limit (UPL) payments, and incentive payments.
o UPL payments offset some or all of the difference between total traditional claims-based Medicaid payments for services and the maximum payment level allowed under the Medicare Upper Payment Limit regulations for those services.
o GME payments, made to teaching hospitals, help offset hospitals’ costs for operating Graduate Medical Education programs.
o Incentive payments are made to hospitals for achieving certain incentive goals related to patient quality or access, and can be made directly by states to providers related to services provided to patients who are served through the FFS program or are enrolled with a Medicaid managed care plan.
The UPL regulations establish the maximum amounts of Medicaid payments that are eligible for federal matching funds. The maximum total payment is generally calculated as an approximation of what Medicare would pay for these same services, or as an approximation of hospital costs to provide these services following Medicare allowable cost rules. UPL regulations establish limits on the federal portion of Medicaid outlays for recipients paid under Medicaid FFS programs. In contrast, federal matching funds for Medicaid managed care programs are limited by a different set of regulations that require capitation rates paid by Medicaid to managed care organizations (MCOs) to be actuarially sound. In addition, federal regulations dictate that services covered by Medicaid managed care plans must be considered “paid in full” through the rate paid to the plan.103 Based on this regulation, non-DSH supplemental payments for services provided to Medicaid recipients are generally prohibited from being paid directly by Medicaid agencies to hospitals, unless they are explicitly approved through a waiver program, such as the Safety Net Care Pool (SNCP) program payments made to qualifying hospitals in Massachusetts. Further, Medicaid agencies are generally not allowed to dictate how Medicaid managed care plans pay for services with contracted hospitals, which also means that Medicaid agencies cannot direct the plans to pass through or otherwise distribute supplemental payments. A recent MACPAC report stated “CMS considers strategies that require MCOs to ‘pass through’ supplemental payments to contracted providers to be inconsistent with the statute that requires capitation rates to be actuarially sound.”104 Thus, traditional UPL supplemental payments are not an acceptable payment mechanism under a Medicaid managed care model.
103 Code of Federal Regulations, Title 42, Section 438.60 (October 2014) 104 MACPAC. Report to the Congress on Medicaid and CHIP. (March 2014)
EVALUATION OF SAFETY NET CARE POOL (SNCP) FINANCING REPORT
Page 74 of 166 February 1, 2016
Unlike UPL supplemental payments, states are allowed to make GME supplemental payments to hospitals in a Medicaid managed care model because they are tied to costs of maintaining Graduate Medical Education programs, not to the cost of care for Medicaid recipients. Similarly, DSH payments are allowed under both fee-for-service and Medicaid managed care programs. Federal Financial Participation (FFP) for Medicaid DSH payments is controlled by a limit that caps total FFP to each state for DSH payments at values pre-set within federal regulation.105 In recent years, states have explored alternative ways to maintain supplemental payments to hospitals when converting to capitated Medicaid managed care models. For example, the SNCP program in Massachusetts was created in 2005 for the purpose of reducing the rate of uninsurance in the Commonwealth while also providing funding for uncompensated care. The SNCP currently provides uncompensated care payments to safety net providers for Medicaid and low-income, uninsured individuals. The SNCP also funds delivery system transformation initiatives, and infrastructure and capacity-building grants.
8.1.1 State Plans and Waivers Each state operates its Medicaid program in accordance with a state plan submitted to and approved by CMS that describes the nature and scope of the program (e.g., administrative structure and operations, eligibility, covered benefits, payment methods). Section 1902 of the Social Security Act requires states to have a state plan on file with CMS as a condition of receiving federal Medicaid funds. The state plan demonstrates states’ understanding of all federal Medicaid requirements. When states make changes to the Medicaid program in areas documented in the state plan, states are required to submit state plan amendments (SPAs) to CMS for review and approval prior to making the program modifications. Included in state plans is a description of how payments are made in Medicaid fee-for-service and managed care programs The Social Security Act also contains multiple waiver authorities that provide states flexibility in certain areas by allowing them to waive certain federal requirements that would otherwise apply. For example, states can waive certain provisions of the Medicaid and CHIP statutes such as eligibility and benefits in order to explore new approaches to the delivery of and payment for health care and long-term services and supports. This flexibility has enabled states to make fundamental changes to their programs. All states operate one or more Medicaid waivers, which are generally referred to by the section of the Act granting the waiver authority. The waivers are categorized as program waivers or research and demonstration projects:
• Section 1115 gives broad authority to the Secretary to authorize “any experimental, pilot or demonstration project likely to assist in promoting the objectives of the programs” specified in that section of the Act. Under Section 1115 research and demonstration authority, states may waive certain provisions of the Medicaid and CHIP statutes related to state program design, such as eligibility criteria, covered services, and service delivery and payment methods used by the state to administer the program. Section 1115 Demonstrations include a research or evaluation component and usually are approved for a five-year period, with a potential for up to a five-year renewal period after the first five years.
105 Massachusetts receives a DSH allotment, but is not considered a DSH state as its DSH allotment is incorporated into the SNCP funding.
EVALUATION OF SAFETY NET CARE POOL (SNCP) FINANCING REPORT
Page 75 of 166 February 1, 2016
• Section 1915(b) waivers permit states to implement service delivery models (e.g., those involving primary care case management programs or managed care plans) that restrict beneficiaries’ choice of providers other than in emergency circumstances.
• Section 1915(c) of the Medicaid statute authorizes states to provide home and community-based services (HCBS) as an alternative to institutional care in nursing homes, intermediate care facilities for individuals with mental retardation (ICF-MRs), and hospitals, and to waive the statewideness requirement of who is eligible to receive HCBS services.
States have used Section 1115 authority in a variety of ways and for an array of purposes.106 In Massachusetts, an 1115 Demonstration has been in place since 1997, and has evolved over time through amendments and renewals to reflect new priorities and the enactment of the Affordable Care Act, including support of the SNCP. MassHealth may make payments directly to hospitals without the limitations typically related to hospital inpatient and outpatient UPLs, and prohibitions against making payments directly to hospitals for services provided under Medicaid managed care plans. These concepts are described in more detail later in this chapter. Regardless of the type of waiver, estimated federal spending over the period for which the waiver is in effect cannot be greater than it would have been without the waiver. Approval of states’ waiver applications is at the discretion of the Secretary of HHS.
8.1.2 Regulations Related to Medicaid Funding Medicaid programs are jointly funded by the federal government and the state government. The federal government contributes funds to each state Medicaid program using a percentage referred to as the Federal Medical Assistance Percentage (FMAP). FMAP values vary by state and are computed using a formula that takes into account the average per capita income for each state relative to the national average. Each state receives multiple FMAP values: one FMAP is assigned for the traditional Medicaid program, one for the CHIP program, and additional FMAP rates for the cost of administrating the Medicaid program and for making upgrades to the program. For states that expand Medicaid, there is also a separate FMAP for the expansion population. The average FMAP rate for Medicaid services is 57 percent, but FMAPs range from 50 percent in wealthier states up to 75 percent in states with lower per capita incomes.107 Massachusetts’ FMAP for Medicaid is 50 percent and for CHIP is 65 percent for this time period. This means for every CHIP dollar spent by the Medicaid Agency in SFY 2014/15, 35 cents come from state resources and 65 cents come from federal resources. Another way to think of this is that $1.00 in state funds in SFY 2014/15 yields $2.86 in total funds for the Medicaid program (1 / 0.35 = $2.86). For the Medicaid programs at 50 percent FMAP, every $1.00 in state funds yields $2.00 in total funds. In addition to general revenue, there are three common forms of revenue used to fund the state share of a Medicaid program. These are inter-governmental transfers, certified public expenditures, and provider taxes/assessments:
106 Ibid. 107 Across all states prior to application of enhanced rates for Medicaid expansion. http://www.medicaid.gov/Medicaid-CHIP-Program-Information
EVALUATION OF SAFETY NET CARE POOL (SNCP) FINANCING REPORT
Page 76 of 166 February 1, 2016
• Inter-governmental Transfers (IGTs) – the Medicaid statute does not define an inter-governmental transfer, but the plain meaning in the Medicaid context is a transfer of funding from a local governmental entity to the State.
• Certified Public Expenditures (CPEs) – costs incurred and certified by a public entity or governmental unit related to providing Medicaid covered services to Medicaid recipients.
• Provider Taxes/Assessments – the Medicaid statute recognizes State and/or local tax revenue as a permissible source of the non-federal share of Medicaid expenditures.
The federal and state statutes, regulations and other policies (e.g., Medicaid state plan amendments and waivers) related to each are discussed in the following sections.
8.1.2.1 Inter-governmental Transfers
Federal Authority IGTs are allowable for the purposes of funding the non-federal share based on Social Security Act Section 1903(w)(6) and 42 CFR §433.51 – “Public Funds” as the State share of financial participation, which states that “public Funds may be considered as the State's share in claiming FFP if….the public funds are appropriated directly to the State or local Medicaid agency, or are transferred from other public agencies (including Indian tribes) to the State or local agency and under its administrative control, or certified by the contributing public agency as representing expenditures eligible for FFP.” CMS requires IGTs to originate from public entities in order to be eligible for FFP. As stated in the CMS State Medicaid Directors letter entitled “SMD 14-004 – “Accountability #2: Financing and Donations” and released on May 9, 2014, funds that do not originate from a public entity are deemed “non-bona fide” and are not subject to federal matching.108 States have used IGTs for decades as a tool to fund the non-federal share of allowable Medicaid expenditures. A recent study by the GAO reports that 10.1 percent of the non-federal share of Medicaid expenditures was funded with inter-governmental transfers.109 HHS, Office of Inspector General (OIG), CMS, and the GAO have scrutinized this funding tool through the years. In 2002, the GAO stated that “IGTs are a legitimate state budget tool and not problematic in themselves … [b]ut when they are used to carry out questionable financial transactions that inappropriately shift state Medicaid costs to the federal government, they become problematic.”110 The OIG has addressed the IGT funding mechanism as well. On one occasion, the OIG stated the “use of the IGT as part of the supplemental payment program is a financing mechanism designed solely to maximize federal Medicaid reimbursements without providing either additional funds to the participating county nursing facilities or additional medical services to their Medicaid residents.”111 Nevertheless, when implemented correctly IGTs are an acceptable form of financing and effectively used by many states on a widespread basis.
108 https://www.medicaid.gov/Federal-Policy-Guidance/Downloads/SMD-14-004.pdf 109 Government Accountability Office. “States’ Increased Reliance on Funds from Health Care Providers and Local Governments Warrant Improved CMS Data Collection” (GAO-14-627), (July 2014) 110 GAO report entitled Intergovernmental Transfers Have Facilitated State Financing Schemes, (May 2004). 111 OIG report entitled “Review of Commonwealth of Pennsylvania’s Use of Intergovernmental Transfers to Finance Medicaid Supplemental Payments to County Nursing Facilities.” (A-03-00-00203), (February 9, 2001).
EVALUATION OF SAFETY NET CARE POOL (SNCP) FINANCING REPORT
Page 77 of 166 February 1, 2016
State Authority The Commonwealth of Massachusetts does not rely on the use of IGTs for Safety Net funding. However, there is one facility, Cambridge Health Alliance (CHA), that receives funds via IGT. The allowance for additional funds from local governmental entities for hospital services is described in Attachment J of the Terms and Conditions of the 1115 Waiver approval of October 2013:
“CHA will make an intergovernmental transfer of its funds to EOHHS in the amount specified by a mutually agreed timeline determined by EOHHS in consultation with CHA, and in accordance with the terms of an executed payment and funding agreement, and all applicable laws. Upon receipt of the intergovernmental transfer, EOHHS will draw the federal funding and pay both the nonfederal and federal shares of the applicable DY 15, DY 16 or DY 17 payment(s) to CHA according to a mutually agreed upon timeline determined by EOHHS in the consultation with CHA, and subject to state legislative appropriation and availability of funds, the terms of a payment and funding agreement, and all necessary approvals.”
8.1.2.2 Certified Public Expenditures
The major difference between IGTs and CPEs is that IGTs are considered a funding source while CPEs are actual expenditures resulting from providing care to patients eligible under the Medicaid program. The public provider of service certifies the uncompensated cost of services rendered to eligible individuals. The Medicaid agency records the certified expenditures and draws down the federal share of the expenditure from CMS. GAO reported that 5.4 percent of non-federal share of Medicaid expenditures for federal fiscal year 2012 was in the form of certified public expenditures.112
Federal Authority As with IGTs, CPEs are governed by Social Security Act Section 1903(w)(6) and 42 CFR §433.51 – “Public Funds.” In Massachusetts, Department of Public Health (DPH) and Department of Mental Health (DMH) hospital SNCP expenditures use CPE.
8.1.2.3 Health Care-Related Taxes
The third category of alternative funding sources for non-federal share of Medicaid expenditures is the use of health care-related taxes or assessments. GAO reported that 10.4 percent of non-federal share of Medicaid expenditures for federal fiscal year 2012 was paid for using these taxes or assessments.113
Federal Authority The federal statute governing this source of funding is Section 1903(w)(3) of the Social Security Act. 42 CFR §433.55 – “Health Care-Related Taxes Defined” establishes the regulations for health care-related taxes under the Act. This regulation allows for the use of a tax or assessment levied on health care providers as a source of funding for the non-federal share of 112 Government Accountability Office. “States’ Increased Reliance on Funds fr/om Health Care Providers and Local Governments Warrant Improved CMS Data Collection” (GAO-14-627), (July 2014). 113 Government Accountability Office. “States’ Increased Reliance on Funds from Health Care Providers and Local Governments Warrant Improved CMS Data Collection” (GAO-14-627), (July 2014)
EVALUATION OF SAFETY NET CARE POOL (SNCP) FINANCING REPORT
Page 78 of 166 February 1, 2016
expenditures. The main conditions for which a tax imposed by government can be considered a health care-related tax are addressed 42 CFR §433.55 (a) through (c) as follows:
(a) A health care-related tax is a licensing fee, assessment, or other mandatory payment that is related to — (1) Health care items or services; (2) The provision of, or the authority to provide, the health care items or services; or (3) The payment for the health care items or services.
(b) A tax will be considered to be related to health care items or services under paragraph (a)(1) of this section if at least 85 percent of the burden of the tax revenue falls on health care providers.
(c) A tax is considered to be health care related if the tax is not limited to health care items or services, but the treatment of individuals or entities providing or paying for those health care items or services is different than the tax treatment provided to other individuals or entities.
A key item in the above conditions is the 85 percent burden in paragraph (b). A tax imposed on all businesses is not considered a health care-related tax and no limitations exist on use of the funds. For example, sales tax paid by a hospital is not considered a health care-related tax. Only certain health care providers may be taxed under a health care-related tax and have the tax be permissible as a source of non-federal share of Medicaid expenditures. These classes of health care items or services are outlined in 42 CFR §433.56 – and in addition to inpatient hospital and outpatient hospital services, include many different types of typical Medicaid services. Further requirements related to a permissible health care-related tax are outlined in 42 CFR §433.68 – “Permissible health care-related taxes.” Paragraph (b) of this regulation states the following:
Subject to the limitations specified in §433.70, a State may receive, without a reduction in FFP, health care-related taxes if all of the following are met:
(1) The taxes are broad based
(2) The taxes are uniformly imposed throughout a jurisdiction; and114
114 42 CFR §433.68 Paragraph (c)(1) of the regulation defines broad based as meaning “the tax is imposed on at least all health care items or services in the class or providers of such items or services furnished by all non-federal , non-public providers in the State, and is imposed uniformly, as specified in paragraph (d) of this section.” The uniformity provision requires that the unit of government that imposes the tax applies the tax to “all items or services or providers (or all providers in a class) in the area” that the unit of government has jurisdiction. 42 CFR §433.68(c)(3) does allow for waivers to the broad based and uniformity requirements. Further explanation of the waiver process is included in Appendix A: 9.1.4 Text of Federal and State Citations.
EVALUATION OF SAFETY NET CARE POOL (SNCP) FINANCING REPORT
Page 79 of 166 February 1, 2016
(3) The tax program does not violate the hold harmless provisions One of the reasons for identifying a tax as health care-related is that the taxpayer cannot be held harmless for the tax—that is, the State cannot provide a direct or indirect guarantee that providers will receive their money back. The exception to the hold harmless provision is that “the indirect guarantee test does not apply if the tax rate falls within a “safe harbor” established under regulation” which is the 6 percent of net patient revenue described above.115 42 CFR §433.68(f) outlines how a taxpayer might be held harmless (see Appendix A: 9.1.4 Text of Federal and State Citations for additional context):
State Authority In Massachusetts, the Health Safety Net Trust Fund is established in General Law under PART I, Title XVII, Chapter 118E, Section 66, and funded by provider assessments described in Sections 67 through 69. State authority to impose a health-care related tax on hospitals to fund the Trust Fund is stated in Section 67:
(a) An acute hospital's liability to the fund shall equal the product of: (i) the ratio of its private sector charges to all acute hospitals' private sector charges; and (ii) the total acute hospital assessment amount. Annually, before October 1, the office shall establish each acute hospital's liability to the fund using the best data available, as determined by the health safety net office and shall update each acute hospital's liability to the fund as updated information becomes available. The office shall specify by regulation an appropriate mechanism for interim determination and payment of an acute hospital's liability to the fund. An acute hospital's liability to the fund shall in the case of a transfer of ownership be assumed by the successor in interest to the acute hospital.
In addition, Massachusetts General Law authorizes acute hospitals and ambulatory surgical centers to assess a “surcharge” on certain payors defined in M.G.L. PART I, Title XVII, Chapter 118E, Section 64 as follows:
. . . an individual or entity that pays for or arranges for the purchase of health care services provided by acute hospitals and ambulatory surgical center services provided by ambulatory surgical centers, as defined in this section; provided, however, that the term ''surcharge payor'' shall include a managed care organization; and provided further, that ''surcharge payor'' shall not include Title XVIII and Title XIX programs and their beneficiaries or recipients, other governmental programs of public assistance and their beneficiaries or recipients and the workers' compensation program established under chapter 152
See Appendix A: 9.1.4 Text of Federal and State Citations for the laws related to this surcharge.
115 MACPAC. “Health Care Related Taxes in Medicaid.” (August 2012)
EVALUATION OF SAFETY NET CARE POOL (SNCP) FINANCING REPORT
Page 80 of 166 February 1, 2016
8.1.3 Federal and State Authority Related to Medicaid Provider Payment The Social Security Act dictates that provider payments for Medicaid services must be adequate to ensure access to quality care for the Medicaid population but not high enough to encourage overutilization. U.S.C. § 1396a (a)(30)(A) specifies that a Medicaid state plan must “provide such methods and procedures relating to the utilization of, and the payment for, care and services available under the plan as may be necessary to safeguard against unnecessary utilization of such care and services and to assure that payments are consistent with efficiency, economy, and quality of care and are sufficient to enlist enough providers so that care and services are available under the plan at least to the extent that such care and services are available to the general population in the geographic area.” More detailed regulations exist separately for the Medicaid FFS program, which has to be documented in the State Plan, and for Medicaid managed care programs, which is documented in the State Plan or through an approved waiver. In addition, some payments (DSH and GME), are allowable in both FFS and managed care.
8.1.3.1 Fee for Service Regulatory Environment
The traditional delivery methodology for payments under a Medicaid system was a FFS model. Inpatient and outpatient hospital services under FFS typically receive payments in the following forms:
1. Claim payments for services rendered 2. Periodic or lump-sum supplemental payments received that are compliant with federal
UPL regulations 3. DSH payments subject to facility-specific DSH limits 4. GME payments (less common and also governed by UPL regulations)
Federal Authority UPL supplemental payments are most often funded by IGTs and are designed to offset some or all of the difference between total base Medicaid FFS payments for services and the maximum payment level allowed under the regulatory UPL for those services. At the federal level, the upper payment limit for inpatient hospital services is governed by 42 CFR 447.272 – “Inpatient Services: Application of Upper Payment Limits,” and outpatient hospital services fall under 42 CFR 447.321 – “Outpatient Hospital and Clinic Services: Application of Upper Payment Limits.” These regulations allow states to maximize Medicaid FFS payments to hospitals. In addition to reimbursing providers for Medicaid services, supplemental payments can be made to hospitals to allow a maximum payment that is generally calculated as an approximation of Medicare payment for these same services, or as an approximation of hospital costs to provide these services. The UPL limit is aggregated over each provider type (hospitals, nursing homes, clinics, etc…) and class (state-owned, non-state government owned, and private). State payments to any individual hospital may exceed that hospital’s upper payment limit as long as the aggregated payments to hospitals in that provider class are within the overall Medicare UPL. Also, UPL limits are calculated separately for hospital inpatient and outpatient care. The result is six UPL limits for hospital reimbursement, made up of three provider classes for two different categories
EVALUATION OF SAFETY NET CARE POOL (SNCP) FINANCING REPORT
Page 81 of 166 February 1, 2016
of service. UPL limits apply only to payments made within the parameters and authority established by each state’s State Plan, which includes FFS payments (both claim-based and supplemental payments), but in many cases does not include Medicaid managed care payments. In addition, UPL calculations apply only to Medicaid recipients. Uncompensated care payments made through approved DSH programs are not limited by UPL regulations.116 Based on recently updated regulatory changes from CMS, Medicaid agencies are required to submit UPL analyses for inpatient and outpatient hospital services reimbursement (as well as other provider types) at the beginning of each fiscal year using historical data, and are oftentimes required to submit prospective UPL analyses predicting whether or not Medicaid FFS payments, including claim and supplemental payments, will be within upper payment limits whenever submitting changes to rates or payment methods as part of a new SPA.
State Authority State laws for setting hospital inpatient FFS rates are contained in M.G.L. PART I, Title XVII, Chapter 118E, Section 13F– Contracts between acute and non-acute hospital service providers and office of Medicaid, which states that all reimbursement rates must be established by contract between the hospital and EOHHS, and rates must comply with federal statutory and regulatory requirements. See Appendix A: 9.1.4 Text of Federal and State Citations for the full text from this law. In addition, the Massachusetts Medicaid State Plan establishes FFS rate methodologies. MA-13-020 (for Inpatient services) and MA-13-021 (for Outpatient services) are excerpted below.
From MA-13-020: III Payment for Inpatient Services
A. Overview
1. Except as otherwise provided . . . fee-for-service payments for Inpatient Services provided to MassHealth Members not enrolled in an MCO will be a Hospital-specific Standard Payment Amount per Discharge (SPAD).
2. For Hospitals with Pediatric Specialty Units, payment for admissions to the Pediatric Specialty Unit for which a SPAD is otherwise payable will be made using the Pediatric SPAD.
3. Maternity cases in which delivery occurs will be paid on a SPAD basis with
one SPAD paid for the mother and one SPAD paid for the newborn.
4. Subsections C through H describe non-SPAD fee-for-service payments for psychiatric services, transfer patients, Outlier Days, Hospital-Based Physician services, Administrative Days, and Rehabilitation Unit services in Acute Hospitals. Payment for other unique circumstances is des/cribed in subsection I, and Exhibits 1 through 2. Pay-for-Performance payments are described in subsection J.
116 In contrast, DSH limits are calculated individually for each hospital and include payments and costs for care of Medicaid recipients (both FFS and managed care) plus uncompensated care.
EVALUATION OF SAFETY NET CARE POOL (SNCP) FINANCING REPORT
Page 82 of 166 February 1, 2016
5. For Inpatient Services paid on a per diem basis, MassHealth pays the lesser
of (i) the per diem rate, or (ii) 100% of the Hospital’s actual charge submitted.
From FINAL WEB Public Notice RFA Sections 2-8-FINAL(082814).doc: This is the public notice for the creation of SPA 14-024 that is effective for rate year 2015 but has not been approved by CMS. The proposed changes from MA-13-020 for rate year 2015 are as follows:
(1) In place of a hospital’s single standard payment amount per discharge (SPAD) or Pediatric SPAD, which covered the first twenty days of an admission, each Hospital will be paid an APAD, which will reflect the case weight assigned to that specific discharge and will cover the entire length of the acute stay from admission to discharge. (2) For qualifying discharges, a Hospital will also be paid a discharge-specific Outlier Payment in addition to the APAD, if certain cost thresholds are met. Outlier Payments will apply to the entire length of the acute stay and to members of all ages, rather than hospitals being paid an outlier per diem for days beyond 20 days of an admission for members under 21 only. (3) Transfer per Diem rates will now be calculated based on the APAD (and Outlier Payment, if applicable) amounts corresponding to the specific case. (4) To calculate the APAD:
The ba s e ye a r (AP AD Ba s e Ye a r) for the inpa tie nt s ta tewide operating and capital standards per discharge was updated to FFY12, and inflation applied for price changes between RY12 and RY15. The infla tion fa ctor a pplie d for price cha nge s be twe e n RY14 a nd RY15 wa s 1.611% for operating costs and 1.5% for capital costs. The 3M AP R-DRG Grouper was updated to version 30. The Ma s s He a lth DRG We ight for a s pe cific dis cha rge will be based on information included on a properly submitted claim and determined using the 3M APR-DRG Grouper and Massachusetts weights; these weights were updated using more recent MMIS claims data and all-payer hospital discharge data.
(5) The 20-day coverage limitation for members aged 21 or older will be eliminated. (6) The PPR methodology is unchanged, but the per discharge percentage payment reduction will be applied against the total case payment amount for the discharge (which would include Outlier Payments, if applicable). The adjustments also apply when calculating the transfer per diem rates and the total transfer payment cap. (7) For reported provider preventable conditions (PPCs), if non-PPC-related services are also provided during the same inpatient admission, payment will be adjusted to remove PPC-related costs/services for APAD, Outlier Payment and Transfer per Diem claims, including such claims from the same hospital for related follow-up care. (8) The non-payment method for serious reportable events (SREs) has been updated to reflect the changes to the new APAD methodology, and to clarify that non-payment for SREs also applies to administrative day (AD) per diems. (9) The median nursing facility rate utilized in the calculation of the administrative day (AD) per diem rate was updated, and an inflation update of 1.611% was applied. (10) An inflation update of 1.611% was applied to the psychiatric per diem rate. (11) The RY15 median Rehabilitation Hospital rate was used for the per diem for Acute Hospital Rehabilitation Units.
EVALUATION OF SAFETY NET CARE POOL (SNCP) FINANCING REPORT
Page 83 of 166 February 1, 2016
(12) The two hospitals first enrolled in November 2012 will be paid using the same methodology as all other hospitals.
From MA-13-021:
III Payment for Outpatient Services A. Overview
Except as otherwise provided . . . Hospitals will receive a Hospital-specific payment for each Episode, known as the Payment Amount Per Episode (PAPE). This payment methodology is applicable to all public and private providers.
Except as otherwise provided for medically necessary services to a MassHealth Standard or CommonHealth member under 21, hospitals will not be paid for Outpatient Hospital Services specified as non-payable in Subchapter 6 of the MassHealth Acute Outpatient Hospital Manual.
From FINAL WEB Public Notice RFA Sections 2-8-FINAL(082814).doc: This is the public notice for the creation of SPA 14-025 that is effective for rate year 2015 but has not been approved by CMS. The proposed changes from MA-13-021 for rate year 2015 are as follows:
(1) The RY15 PAPE is an equal blend of the Hospital’s RY14 PAPE and the preliminary RY15 PAPE calculation; provided that, no Hospital’s RY15 PAPE shall be less than 90% of its RY14 PAPE. (2) To calculate the preliminary RY15 PAPE, an inflation update of 1.611% for operating costs was applied. (3) The RY15 PAPE for the two hospitals first enrolled in November 2012 will be calculated using the same methodology as that of the other acute hospitals.
FFS payment for unique circumstances are primarily reimbursed through the use of supplemental payments, which are established in accordance with the methodologies outlined in Medicaid SPAs described and further described in Chapter 4 of this report.
8.1.3.2 Managed Care Regulatory Environment
Federal Authority Federal matching funds for Medicaid managed care programs are limited by regulations regarding capitation rates paid by Medicaid to Medicaid MCOs. Federal regulation 42 CFR §438.6(c)(2)(i) dictates that “all payments under risk contracts and all risk-sharing mechanisms in contracts must be actuarially sound.” In addition, regulation 42 CFR §438.60 dictates that services covered by Medicaid managed care plans must be considered “paid in full” through the rate paid to the plan. Based on this regulation, UPL supplemental payments made directly from a state to providers for services provided to Medicaid recipients enrolled in Medicaid managed care plans are generally not allowed. According to MACPAC, “CMS considers strategies that
EVALUATION OF SAFETY NET CARE POOL (SNCP) FINANCING REPORT
Page 84 of 166 February 1, 2016
require MCOs to ‘pass through’ supplemental payments to contracted providers to be inconsistent with the statute that requires capitation rates to be actuarially sound.”117 In recent years, states have explored alternative ways to maintain supplemental payments to hospitals when converting to capitated Medicaid managed care models. Several states are using 1115 waivers to move from Medicaid FFS to a managed care environment. In many cases, these waiver projects have included transitional payments that allow providers time to adjust to changes in Medicaid reimbursement, although there is no specific stipulation requiring transitional payments in either 42 CFR §431.400 or Section 1115 of the Act.
State Authority Massachusetts laws regarding setting hospital inpatient FFS rates (M.G.L. PART I, Title XVII, Chapter 118E, Section 13F – Contracts between acute and non-acute hospital service providers and office of Medicaid) state that the laws shall not conflict with any Medicaid managed care waivers:
Nothing in this chapter shall be construed to conflict with a waiver of otherwise applicable federal requirements which the office of Medicaid may obtain from the secretary of health and human services to implement a primary care case management system for delivering services, or to implement any other type of managed care service delivery system in which the eligible recipient is directed to obtain services exclusively from 1 provider or 1 group of providers.
Managed Care Payment is addressed in the Special Terms and Conditions of the Massachusetts 1115 Demonstration, as amended in September 2015, and excerpted below:
Managed Care Arrangements. MassHealth may implement, maintain, or modify (without amendment to the demonstration), and any managed care arrangements authorized under section 1932(a) of the Act or 42 CFR 438 et seq., including:
a) Primary Care Clinician (PCC) Plan. The PCC Plan is a primary care case
management program administered by MassHealth. In the PCC Plan, members enroll with a PCC who provides most primary and preventive care and who is responsible for providing referrals for most specialty services…
b) Enhanced Primary Care Clinician Payments. In accordance with 42 C.F.R. section
438.6(c)(5)(iv), MassHealth may establish enhanced fee-for-service rate payments or capitated rate payments to Primary Care Clinicians for coordination of the care delivered to their enrolled PCC plan members. MassHealth may also establish pay-for-performance incentives using capitated or other payment arrangements for achieving certain quality of care benchmarks, for demonstrating certain levels of improvement for selected Healthcare Effectiveness Data and Information Set (HEDIS) or other quality indicators, and for implementing practice infrastructure designed to support the delivery of high-quality health care services to enrolled members.
117 MACPAC. Report to the Congress on Medicaid and CHIP. (March 2014)
EVALUATION OF SAFETY NET CARE POOL (SNCP) FINANCING REPORT
Page 85 of 166 February 1, 2016
c) Patient Centered Medical Home Initiative (PCMHI). The PCMHI is a multi-payer
initiative to transform selected primary care practice sites into PCMHs by 2015. MassHealth is a dominant public payer in the PCMHI and is assuming the same responsibilities as other participating payers both for enrollees in its PCC Plan and those in Medicaid contracted MCOs. The PCMHI practices must meet reporting requirements on clinical and operational measures, in addition to certain benchmarks to indicated continued progress towards medical home transformation, such as obtaining National Committee for Quality Assurance (NCQA) Physician Practice Connections-Patient Centered Medicaid Home (PPC®-PCMHTM) Level One recognition. Any infrastructure support provided to Primary Care Clinicians who participate as PCMHI providers must be funded by the infrastructure and capacity-building component of the SNCP as referenced in STC 50(c). A formal evaluation of the PCMHI is also being conducted and should be included as relevant to the demonstration in draft evaluation design as per STC 90. (NOTE: This program ended in 2013)
d) MCO. MassHealth contracts with MCOs that provide comprehensive health
coverage including behavioral health services to enrollees… MassHealth members who either choose or are assigned to a health plan may transfer to another available health plan in their geographic service area at any time for any reason…
8.1.3.3 DSH Payments
Federal Authority DSH supplemental payments may be made directly from the Medicaid agency to hospitals completely independent of capitation payments made to MCOs. Total Medicaid payments to a hospital, including FFS, managed care, and DSH payments, may not exceed the hospital’s cost for care of Medicaid recipients and the uninsured. To enforce this limitation, the Medicare Prescription Drug, Improvement and Modernization Act of 2003 defined a requirement for annual auditing and standard reporting of state DSH payments in comparison to hospital costs. Section 1902(a)(13)(A)(iv) of the Social Security Act states that,
A State plan for medical assistance must provide for a public process for determination of rates of payment under the plan for hospital services, nursing facility services, and services of intermediate care facilities for the mentally retarded under which in the case of hospitals, such rates take into account (in a manner consistent with section 1923) the situation of hospitals which serve a disproportionate number of low-income patients with special needs.
Sections 1923(b) and (d) of the Social Security Act specify the requirements to qualify as a DSH hospital. Section 1923(c) – “Payment Adjustment” provides a variety of ways to calculate the allowable amount of DSH payment per hospital.
EVALUATION OF SAFETY NET CARE POOL (SNCP) FINANCING REPORT
Page 86 of 166 February 1, 2016
State Authority The DSH allotment granted to the Commonwealth is used as a provider cap for Safety Net Care Pool payments made to hospitals as described in the approved 1115 Demonstration cited below:
Under the authority of section 1115(a)(1) of the Social Security Act (the Act), the following waivers of state plan requirements contained in section 1902 of the Act are granted in order to enable the Commonwealth of Massachusetts (State/Commonwealth) to carry out the MassHealth Medicaid section 1115 demonstration.
Disproportionate Share Hospital (DSH) Requirements Section 1902(a)(13) insofar as it incorporates Section 1923 To exempt Massachusetts from making DSH payments to hospitals which qualify as a Disproportionate Share Hospital in any fiscal year in which Massachusetts is authorized to make provider payments from the Safety Net Care Pool (the amount of any DSH payments must be prorated if necessary so that DSH payments will not exceed the percentage of the DSH allotment corresponding to the percentage of the federal fiscal year for which payment of DSH payments is required).
8.1.4 Text of Federal and State Citations 42 CFR §433.68(f) – Health Care Related Tax Hold Harmless Provision:
“A taxpayer will be considered to be held harmless under a tax program if any of the following conditions applies:
(1) The State (or other unit of government) imposing the tax provides for a direct or indirect non-Medicaid payment to those providers or others paying the tax and the payment amount is positively correlated to either the tax amount or to the difference between the Medicaid payment and the tax amount. A positive correlation includes any positive relationship between these variables, even if not consistent over time.
(2) All or any portion of the Medicaid payment to the taxpayer varies based only on the tax amount, including where Medicaid payment is conditional on receipt of the tax amount.
(3) The State (or other unit of government) imposing the tax provides for any direct or indirect payment, offset, or waiver such that the provision of that payment, offset, or waiver directly or indirectly guarantees to hold taxpayers harmless for all or any portion of the tax amount. (i)(A) An indirect guarantee will be determined to exist under a two prong “guarantee”
test. If the health care-related tax or taxes on each health care class are applied at a rate that produces revenues less than or equal to 6 percent of the revenues received by the taxpayer, the tax or taxes are permissible under this test. The phrase “revenues received by the taxpayer” refers to the net patient revenue attributable to the assessed permissible class of health care items or services. However, for the period of January 1, 2008 through September 30, 2011, the applicable percentage of net patient service revenue is 5.5 percent. Compliance in State fiscal year 2008 will be evaluated from January 1, 2008 through the last day of State fiscal year 2008. Beginning with State fiscal year 2009 the 5.5 percent tax collection will be measured on an annual State fiscal year basis.
EVALUATION OF SAFETY NET CARE POOL (SNCP) FINANCING REPORT
Page 87 of 166 February 1, 2016
(B) When the tax or taxes produce revenues in excess of the applicable percentage of the revenue received by the taxpayer, CMS will consider an indirect hold harmless provision to exist if 75 percent or more of the taxpayers in the class receive 75 percent or more of their total tax costs back in enhanced Medicaid payments or other State payments. The second prong of the indirect hold harmless test is applied in the aggregate to all health care taxes applied to each class. If this standard is violated, the amount of tax revenue to be offset from medical assistance expenditures is the total amount of the taxpayers' revenues received by the State.”
M.G.L. PART I, Title XVII, Chapter 118E, Section 66 – Establishment of the Health Safety Net Trust Fund
(a) There shall be established and set up on the books of the commonwealth a fund to be known as the Health Safety Net Trust Fund, in this section and in sections 67 to 69, inclusive, called the fund, which shall be administered by the health safety net office, hereinafter the office. Expenditures from the fund shall not be subject to appropriation unless otherwise required by law. The purposes of the fund shall be to: (i) maintain a health care safety net by reimbursing hospitals and community health centers for a portion of the cost of reimbursable health services provided to low-income, uninsured or underinsured residents; (ii) support the estimated expenses of the executive office in administering the health safety net and related assessments under sections 65 to 69, inclusive; and (iii) support a portion of the costs of the Medicaid program under this chapter and the commonwealth care health insurance program under chapter 118H. The office shall administer the fund using methods, policies, procedures, standards and criteria for the proper and efficient operation of the fund and programs supported by it in a manner designed to distribute the fund resources as equitably as possible. The secretary of administration and finance, in consultation with the secretary of health and human services, shall determine annually the estimated expenses to administer the fund.
(b) The fund shall consist of: (i) all amounts paid by acute hospitals and surcharge payors under sections 67 and 68; (ii) all appropriations for the purpose of payments to acute hospitals or community health centers for health services provided to uninsured and underinsured residents; (iii) any transfers from the Commonwealth Care Trust Fund, established under section 2OOO of chapter 29; and (iv) all property and securities acquired by and through the use of monies belonging to the fund and all interest thereon. The office shall expend amounts in the fund, except for amounts transferred to the Commonwealth Care Trust Fund, for payments to hospitals and community health centers for reimbursable health services provided to uninsured and underinsured residents of the commonwealth, consistent with the requirements of this section and section 69 and the regulations adopted by the office. The office shall also annually expend monies from the fund for the expenses of the executive office, including the health safety net office under subsection (a), for the administration of the health safety net and related assessments. The office shall also expend not more than $6,000,000 annually from the fund for demonstration projects that use case management and other methods to reduce the liability of the fund to acute hospitals. Any amounts collected from surcharge payors in any year in excess of the total surcharge amount, adjusted to reflect applicable surcharge credits, shall be transferred to the General Fund to support a portion of the costs of the Medicaid program and commonwealth care health insurance program. Any annual balance remaining in
EVALUATION OF SAFETY NET CARE POOL (SNCP) FINANCING REPORT
Page 88 of 166 February 1, 2016
the fund after these payments have been made shall be transferred to the Commonwealth Care Trust Fund. All interest earned on the amounts in the fund shall be deposited or retained in the fund. The director shall from time to time requisition from the fund amounts that the director considers necessary to meet the current obligations of the office for the purposes of the fund and estimated obligations for a reasonable future period.
M.G.L. PART I, Title XVII, Chapter 118E, Section 68 – Acute Hospital and Ambulatory Surgical Center Surcharges
(a) Acute hospitals and ambulatory surgical centers shall assess a surcharge on all payments subject to surcharge as defined in section 64. The surcharge shall be distinct from any other amount paid by a surcharge payor for the services of an acute hospital or ambulatory surgical center. The surcharge amount shall equal the product of: (i) the surcharge percentage; and (ii) amounts paid for these services by a surcharge payor. The office shall calculate the surcharge percentage by dividing the total surcharge amount by the projected annual aggregate payments subject to the surcharge, excluding projected annual aggregate payments based on payments made by managed care organizations. The office shall determine the surcharge percentage before the start of each fund fiscal year and may re-determine the surcharge percentage before April 1 of each fund fiscal year if the office projects that the initial surcharge percentage established the previous October will produce less than the total surcharge amount minus $10,000,000 or more than the total surcharge amount plus $10,000,000 excluding payments made by managed care organizations. Before each succeeding October 1, the office shall re-determine the surcharge percentage incorporating any adjustments from earlier years. In each determination or redetermination of the surcharge percentage, the office shall use the best data available as determined by the office of Medicaid and may consider the effect on projected surcharge payments of any modified or waived enforcement under subsection (e). The office shall incorporate all adjustments, including, but not limited to, updates or corrections or final settlement amounts, by prospective adjustment rather than by retrospective payments or assessments.
(b) Each acute hospital and ambulatory surgical center shall bill a surcharge payor an amount equal to the surcharge described in subsection (a) as a separate and identifiable amount distinct from any amount paid by a surcharge payor for acute hospital or ambulatory surgical center services. Each surcharge payor shall pay the surcharge amount to the office for deposit in the Health Safety Net Trust Fund on behalf of said acute hospital or ambulatory surgical center. Upon the written request of a surcharge payor, the office may implement another billing or collection method for the surcharge payor; provided, however, that the office has received all information that it requests which is necessary to implement such billing or collection method; and provided further, that the office shall specify by regulation the criteria for reviewing and approving such requests and the elements of such alternative method or methods.
(c) The office shall specify by regulation appropriate mechanisms that provide for determination and payment of a surcharge payor's liability, including requirements for data to be submitted by surcharge payors, acute hospitals and ambulatory surgical centers.
EVALUATION OF SAFETY NET CARE POOL (SNCP) FINANCING REPORT
Page 89 of 166 February 1, 2016
M.G.L. PART I, Title XVII, Chapter 118E, Section 13F All rates of payment to acute hospitals and non-acute hospitals under Title XIX shall be established by contract between the provider of such hospital services and the office of Medicaid, except as provided in subsections (a) and (b), or otherwise permitted by law. All rates shall be subject to all applicable Title XIX statutory and regulatory requirements and shall include reimbursement for the reasonable cost of providing competent interpreter services under section 25J of chapter 111 or section 23A of chapter 123.
All such rates for non-acute hospitals shall be effective as of the date specified in section 13A, unless otherwise specified by law.
(a) For disproportionate share hospitals, the executive office shall establish rates that equal the financial requirements of providing care to recipients of medical assistance.
(b) The executive office, or governmental unit designated by the executive office, shall establish rates of payment which shall apply to emergency services and continuing emergency care provided in acute hospitals to medical assistance program recipients, including examination or treatment for an emergency medical condition or active labor in women or any other care rendered to the extent required by 42 USC 1395(dd), unless such services are provided under an agreement between the office of Medicaid and the acute hospital. Such rates of payment shall reflect the reasonable costs of providing such care, including the costs of providing competent interpreter services under section 25J of chapter 111 or section 23A of chapter 123 and shall take into account the characteristics of the hospital in which such care is provided, including, but not limited to, its status as a teaching hospital, specialty hospital, disproportionate share hospital, pediatric hospital, pediatric specialty unit or sole community provider.
. . .
No acute hospital may charge to a governmental unit for services provided to publicly aided patients at a rate higher than the rate payable by the office of Medicaid under Title XIX for the same service, unless such service is provided by said office under a unique arrangement such as a selective contract or a managed care contract.
(c) The executive office, or a governmental unit designated to perform ratemaking functions by the executive office, shall establish rates of payment which shall apply to community hospitals located in rural and isolated areas where access to other such providers is not reasonably available. Such hospitals, specially designated by the commonwealth as sole community providers, shall receive payment rates calculated to reflect the rural characteristics of such community hospital and the essential nature of the services provided, which rates shall not be less than 97 per cent of such hospitals' reasonable financial requirements.
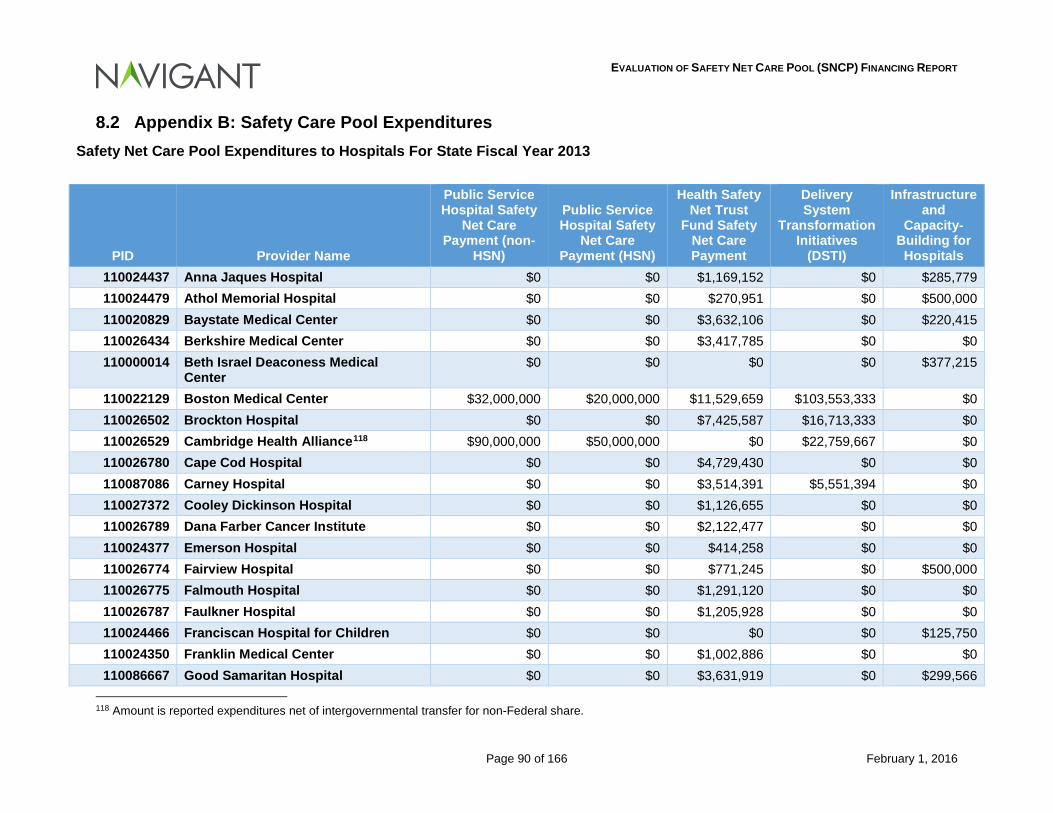
EVALUATION OF SAFETY NET CARE POOL (SNCP) FINANCING REPORT
Page 90 of 166 February 1, 2016
8.2 Appendix B: Safety Care Pool Expenditures Safety Net Care Pool Expenditures to Hospitals For State Fiscal Year 2013
PID Provider Name
Public Service Hospital Safety
Net Care Payment (non-
HSN)
Public Service Hospital Safety
Net Care Payment (HSN)
Health Safety Net Trust
Fund Safety Net Care Payment
Delivery System
Transformation Initiatives
(DSTI)
Infrastructure and
Capacity-Building for Hospitals
110024437 Anna Jaques Hospital $0 $0 $1,169,152 $0 $285,779 110024479 Athol Memorial Hospital $0 $0 $270,951 $0 $500,000 110020829 Baystate Medical Center $0 $0 $3,632,106 $0 $220,415 110026434 Berkshire Medical Center $0 $0 $3,417,785 $0 $0 110000014 Beth Israel Deaconess Medical
Center $0 $0 $0 $0 $377,215
110022129 Boston Medical Center $32,000,000 $20,000,000 $11,529,659 $103,553,333 $0 110026502 Brockton Hospital $0 $0 $7,425,587 $16,713,333 $0 110026529 Cambridge Health Alliance118 $90,000,000 $50,000,000 $0 $22,759,667 $0 110026780 Cape Cod Hospital $0 $0 $4,729,430 $0 $0 110087086 Carney Hospital $0 $0 $3,514,391 $5,551,394 $0 110027372 Cooley Dickinson Hospital $0 $0 $1,126,655 $0 $0 110026789 Dana Farber Cancer Institute $0 $0 $2,122,477 $0 $0 110024377 Emerson Hospital $0 $0 $414,258 $0 $0 110026774 Fairview Hospital $0 $0 $771,245 $0 $500,000 110026775 Falmouth Hospital $0 $0 $1,291,120 $0 $0 110026787 Faulkner Hospital $0 $0 $1,205,928 $0 $0 110024466 Franciscan Hospital for Children $0 $0 $0 $0 $125,750 110024350 Franklin Medical Center $0 $0 $1,002,886 $0 $0 110086667 Good Samaritan Hospital $0 $0 $3,631,919 $0 $299,566
118 Amount is reported expenditures net of intergovernmental transfer for non-Federal share.
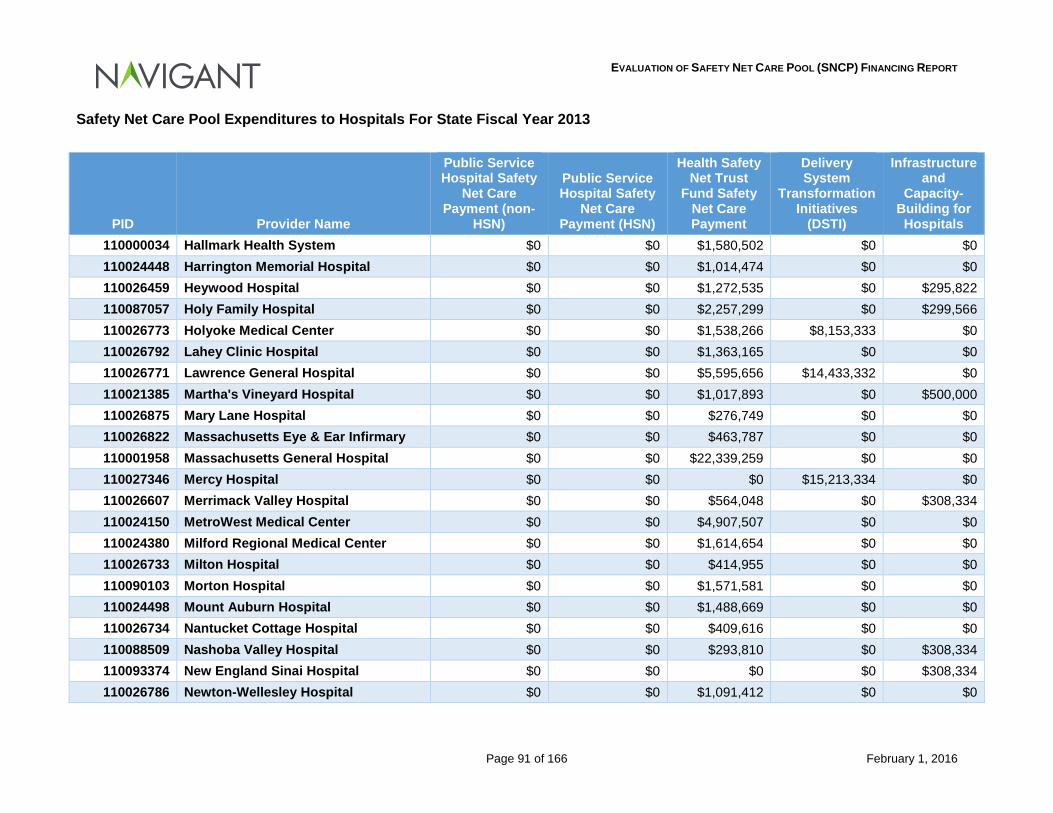
EVALUATION OF SAFETY NET CARE POOL (SNCP) FINANCING REPORT
Page 91 of 166 February 1, 2016
Safety Net Care Pool Expenditures to Hospitals For State Fiscal Year 2013
PID Provider Name
Public Service Hospital Safety
Net Care Payment (non-
HSN)
Public Service Hospital Safety
Net Care Payment (HSN)
Health Safety Net Trust
Fund Safety Net Care Payment
Delivery System
Transformation Initiatives
(DSTI)
Infrastructure and
Capacity-Building for Hospitals
110000034 Hallmark Health System $0 $0 $1,580,502 $0 $0 110024448 Harrington Memorial Hospital $0 $0 $1,014,474 $0 $0 110026459 Heywood Hospital $0 $0 $1,272,535 $0 $295,822 110087057 Holy Family Hospital $0 $0 $2,257,299 $0 $299,566 110026773 Holyoke Medical Center $0 $0 $1,538,266 $8,153,333 $0 110026792 Lahey Clinic Hospital $0 $0 $1,363,165 $0 $0 110026771 Lawrence General Hospital $0 $0 $5,595,656 $14,433,332 $0 110021385 Martha's Vineyard Hospital $0 $0 $1,017,893 $0 $500,000 110026875 Mary Lane Hospital $0 $0 $276,749 $0 $0 110026822 Massachusetts Eye & Ear Infirmary $0 $0 $463,787 $0 $0 110001958 Massachusetts General Hospital $0 $0 $22,339,259 $0 $0 110027346 Mercy Hospital $0 $0 $0 $15,213,334 $0 110026607 Merrimack Valley Hospital $0 $0 $564,048 $0 $308,334 110024150 MetroWest Medical Center $0 $0 $4,907,507 $0 $0 110024380 Milford Regional Medical Center $0 $0 $1,614,654 $0 $0 110026733 Milton Hospital $0 $0 $414,955 $0 $0 110090103 Morton Hospital $0 $0 $1,571,581 $0 $0 110024498 Mount Auburn Hospital $0 $0 $1,488,669 $0 $0 110026734 Nantucket Cottage Hospital $0 $0 $409,616 $0 $0 110088509 Nashoba Valley Hospital $0 $0 $293,810 $0 $308,334 110093374 New England Sinai Hospital $0 $0 $0 $0 $308,334 110026786 Newton-Wellesley Hospital $0 $0 $1,091,412 $0 $0
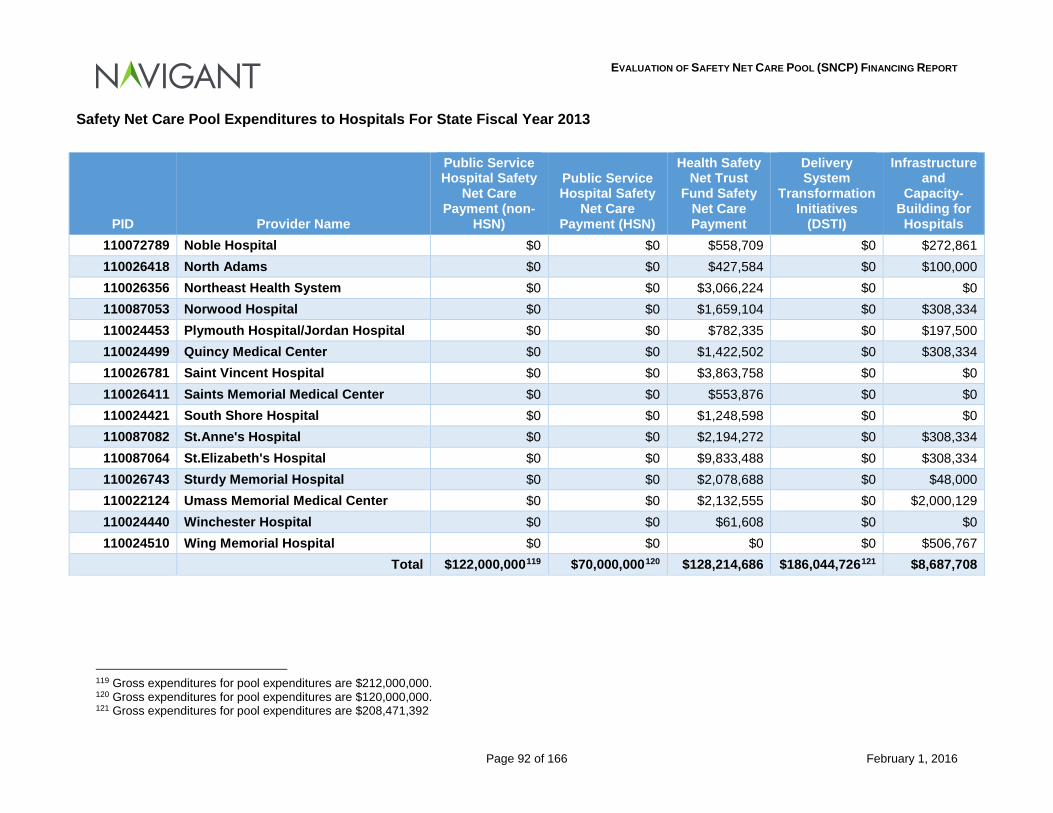
EVALUATION OF SAFETY NET CARE POOL (SNCP) FINANCING REPORT
Page 92 of 166 February 1, 2016
Safety Net Care Pool Expenditures to Hospitals For State Fiscal Year 2013
PID Provider Name
Public Service Hospital Safety
Net Care Payment (non-
HSN)
Public Service Hospital Safety
Net Care Payment (HSN)
Health Safety Net Trust
Fund Safety Net Care Payment
Delivery System
Transformation Initiatives
(DSTI)
Infrastructure and
Capacity-Building for Hospitals
110072789 Noble Hospital $0 $0 $558,709 $0 $272,861 110026418 North Adams $0 $0 $427,584 $0 $100,000 110026356 Northeast Health System $0 $0 $3,066,224 $0 $0 110087053 Norwood Hospital $0 $0 $1,659,104 $0 $308,334 110024453 Plymouth Hospital/Jordan Hospital $0 $0 $782,335 $0 $197,500 110024499 Quincy Medical Center $0 $0 $1,422,502 $0 $308,334 110026781 Saint Vincent Hospital $0 $0 $3,863,758 $0 $0 110026411 Saints Memorial Medical Center $0 $0 $553,876 $0 $0 110024421 South Shore Hospital $0 $0 $1,248,598 $0 $0 110087082 St.Anne's Hospital $0 $0 $2,194,272 $0 $308,334 110087064 St.Elizabeth's Hospital $0 $0 $9,833,488 $0 $308,334 110026743 Sturdy Memorial Hospital $0 $0 $2,078,688 $0 $48,000 110022124 Umass Memorial Medical Center $0 $0 $2,132,555 $0 $2,000,129 110024440 Winchester Hospital $0 $0 $61,608 $0 $0 110024510 Wing Memorial Hospital $0 $0 $0 $0 $506,767
Total $122,000,000119 $70,000,000120 $128,214,686 $186,044,726121 $8,687,708
119 Gross expenditures for pool expenditures are $212,000,000. 120 Gross expenditures for pool expenditures are $120,000,000. 121 Gross expenditures for pool expenditures are $208,471,392
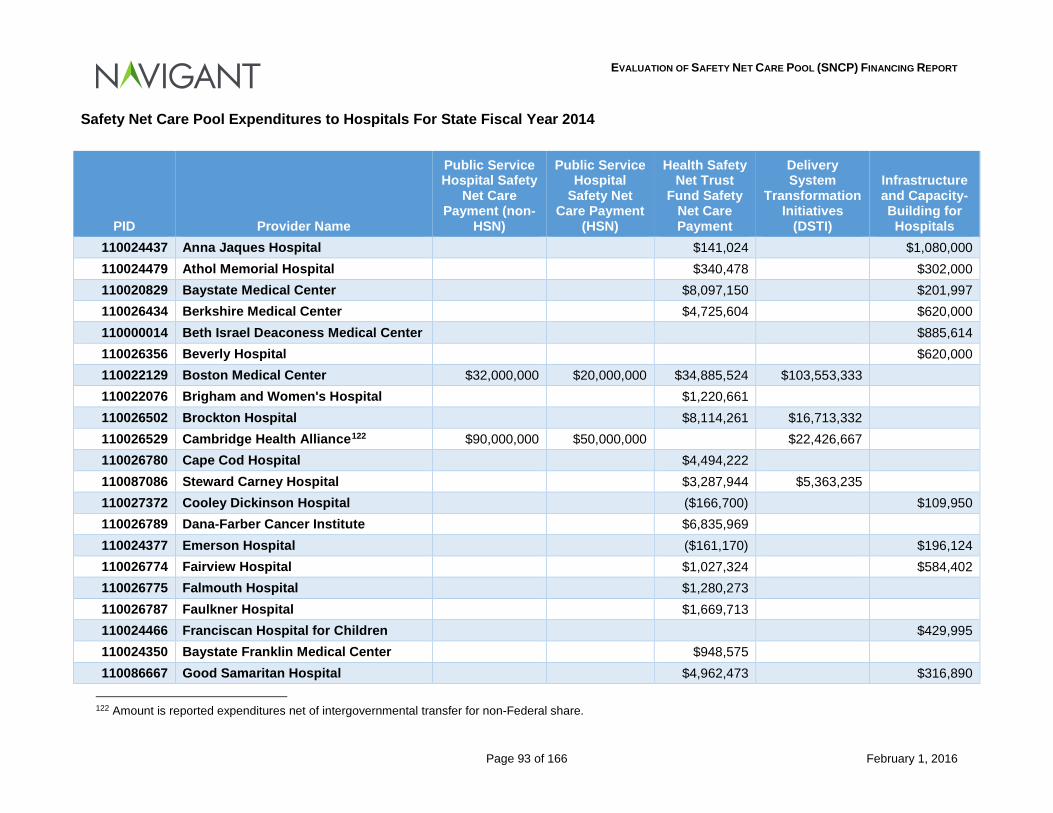
EVALUATION OF SAFETY NET CARE POOL (SNCP) FINANCING REPORT
Page 93 of 166 February 1, 2016
Safety Net Care Pool Expenditures to Hospitals For State Fiscal Year 2014
PID Provider Name
Public Service Hospital Safety
Net Care Payment (non-
HSN)
Public Service Hospital
Safety Net Care Payment
(HSN)
Health Safety Net Trust
Fund Safety Net Care Payment
Delivery System
Transformation Initiatives
(DSTI)
Infrastructure and Capacity-Building for Hospitals
110024437 Anna Jaques Hospital $141,024 $1,080,000 110024479 Athol Memorial Hospital $340,478 $302,000 110020829 Baystate Medical Center $8,097,150 $201,997 110026434 Berkshire Medical Center $4,725,604 $620,000 110000014 Beth Israel Deaconess Medical Center $885,614 110026356 Beverly Hospital $620,000 110022129 Boston Medical Center $32,000,000 $20,000,000 $34,885,524 $103,553,333 110022076 Brigham and Women's Hospital $1,220,661 110026502 Brockton Hospital $8,114,261 $16,713,332 110026529 Cambridge Health Alliance122 $90,000,000 $50,000,000 $22,426,667 110026780 Cape Cod Hospital $4,494,222 110087086 Steward Carney Hospital $3,287,944 $5,363,235 110027372 Cooley Dickinson Hospital ($166,700) $109,950 110026789 Dana-Farber Cancer Institute $6,835,969 110024377 Emerson Hospital ($161,170) $196,124 110026774 Fairview Hospital $1,027,324 $584,402 110026775 Falmouth Hospital $1,280,273 110026787 Faulkner Hospital $1,669,713 110024466 Franciscan Hospital for Children $429,995 110024350 Baystate Franklin Medical Center $948,575 110086667 Good Samaritan Hospital $4,962,473 $316,890
122 Amount is reported expenditures net of intergovernmental transfer for non-Federal share.
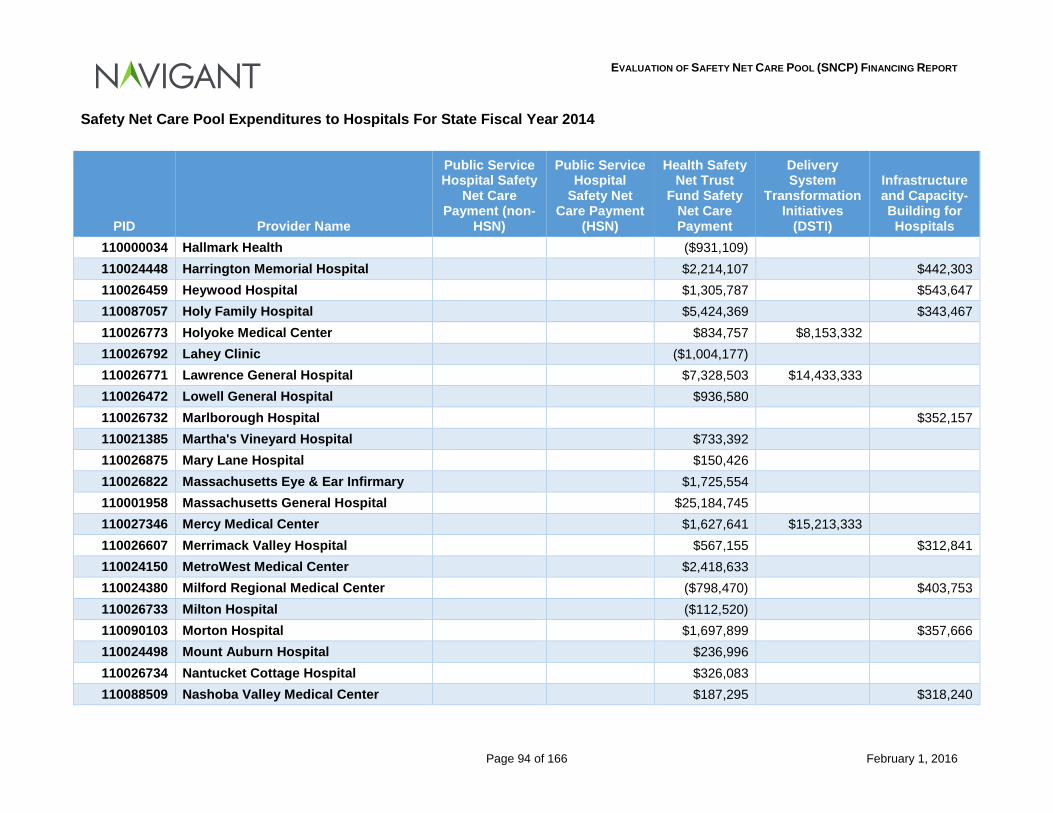
EVALUATION OF SAFETY NET CARE POOL (SNCP) FINANCING REPORT
Page 94 of 166 February 1, 2016
Safety Net Care Pool Expenditures to Hospitals For State Fiscal Year 2014
PID Provider Name
Public Service Hospital Safety
Net Care Payment (non-
HSN)
Public Service Hospital
Safety Net Care Payment
(HSN)
Health Safety Net Trust
Fund Safety Net Care Payment
Delivery System
Transformation Initiatives
(DSTI)
Infrastructure and Capacity-Building for Hospitals
110000034 Hallmark Health ($931,109) 110024448 Harrington Memorial Hospital $2,214,107 $442,303 110026459 Heywood Hospital $1,305,787 $543,647 110087057 Holy Family Hospital $5,424,369 $343,467 110026773 Holyoke Medical Center $834,757 $8,153,332 110026792 Lahey Clinic ($1,004,177) 110026771 Lawrence General Hospital $7,328,503 $14,433,333 110026472 Lowell General Hospital $936,580 110026732 Marlborough Hospital $352,157 110021385 Martha's Vineyard Hospital $733,392 110026875 Mary Lane Hospital $150,426 110026822 Massachusetts Eye & Ear Infirmary $1,725,554 110001958 Massachusetts General Hospital $25,184,745 110027346 Mercy Medical Center $1,627,641 $15,213,333 110026607 Merrimack Valley Hospital $567,155 $312,841 110024150 MetroWest Medical Center $2,418,633 110024380 Milford Regional Medical Center ($798,470) $403,753 110026733 Milton Hospital ($112,520) 110090103 Morton Hospital $1,697,899 $357,666 110024498 Mount Auburn Hospital $236,996 110026734 Nantucket Cottage Hospital $326,083 110088509 Nashoba Valley Medical Center $187,295 $318,240
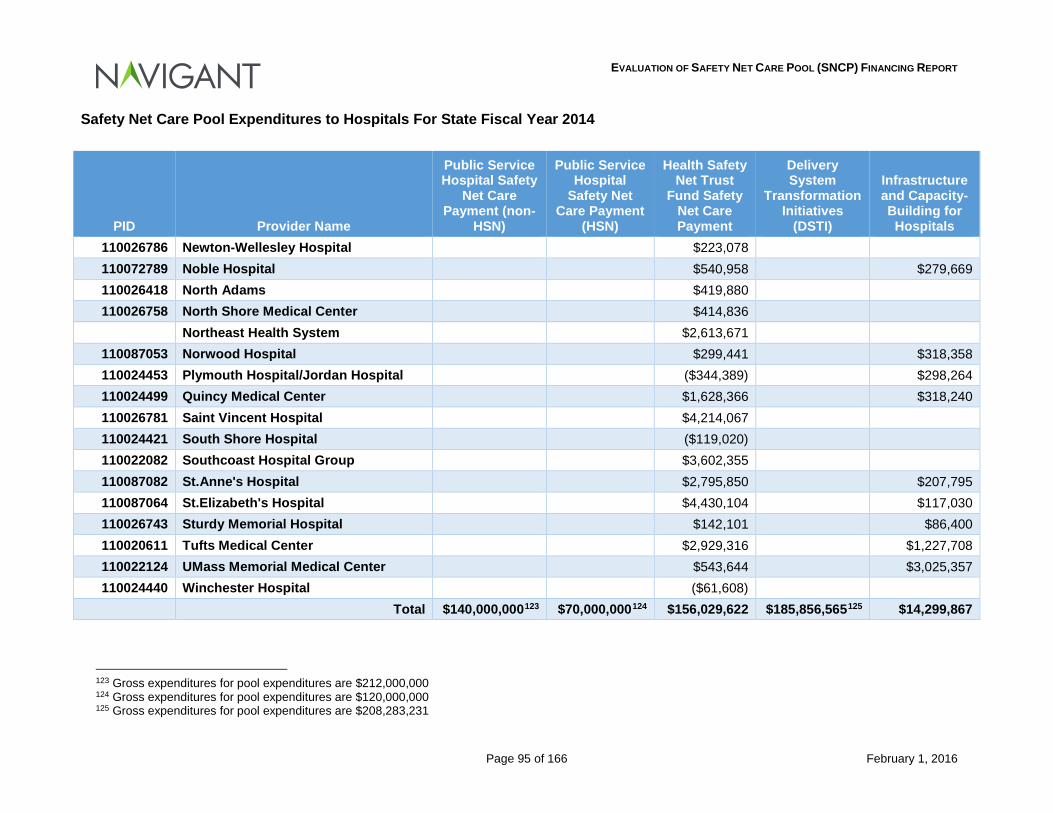
EVALUATION OF SAFETY NET CARE POOL (SNCP) FINANCING REPORT
Page 95 of 166 February 1, 2016
Safety Net Care Pool Expenditures to Hospitals For State Fiscal Year 2014
PID Provider Name
Public Service Hospital Safety
Net Care Payment (non-
HSN)
Public Service Hospital
Safety Net Care Payment
(HSN)
Health Safety Net Trust
Fund Safety Net Care Payment
Delivery System
Transformation Initiatives
(DSTI)
Infrastructure and Capacity-Building for Hospitals
110026786 Newton-Wellesley Hospital $223,078 110072789 Noble Hospital $540,958 $279,669 110026418 North Adams $419,880 110026758 North Shore Medical Center $414,836
Northeast Health System $2,613,671 110087053 Norwood Hospital $299,441 $318,358 110024453 Plymouth Hospital/Jordan Hospital ($344,389) $298,264 110024499 Quincy Medical Center $1,628,366 $318,240 110026781 Saint Vincent Hospital $4,214,067 110024421 South Shore Hospital ($119,020) 110022082 Southcoast Hospital Group $3,602,355 110087082 St.Anne's Hospital $2,795,850 $207,795 110087064 St.Elizabeth's Hospital $4,430,104 $117,030 110026743 Sturdy Memorial Hospital $142,101 $86,400 110020611 Tufts Medical Center $2,929,316 $1,227,708 110022124 UMass Memorial Medical Center $543,644 $3,025,357 110024440 Winchester Hospital ($61,608)
Total $140,000,000123 $70,000,000124 $156,029,622 $185,856,565125 $14,299,867
123 Gross expenditures for pool expenditures are $212,000,000 124 Gross expenditures for pool expenditures are $120,000,000 125 Gross expenditures for pool expenditures are $208,283,231
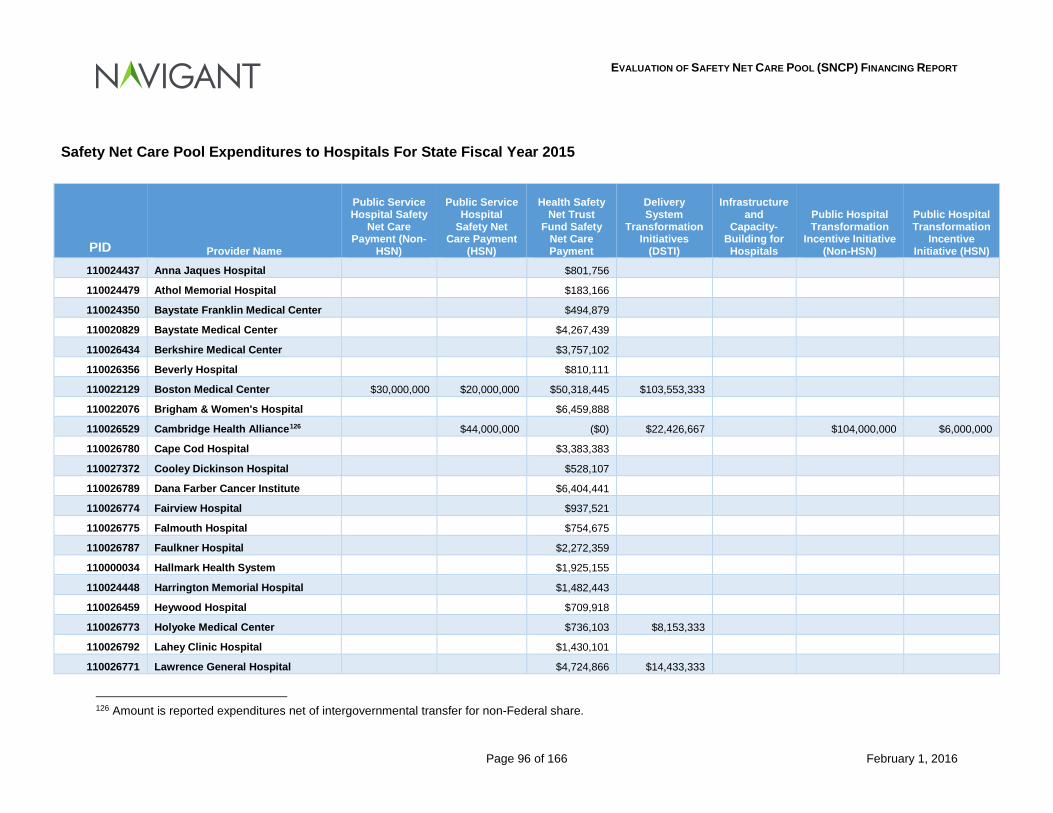
EVALUATION OF SAFETY NET CARE POOL (SNCP) FINANCING REPORT
Page 96 of 166 February 1, 2016
Safety Net Care Pool Expenditures to Hospitals For State Fiscal Year 2015
PID Provider Name
Public Service Hospital Safety
Net Care Payment (Non-
HSN)
Public Service Hospital
Safety Net Care Payment
(HSN)
Health Safety Net Trust
Fund Safety Net Care Payment
Delivery System
Transformation Initiatives
(DSTI)
Infrastructure and
Capacity-Building for Hospitals
Public Hospital Transformation
Incentive Initiative (Non-HSN)
Public Hospital Transformation
Incentive Initiative (HSN)
110024437 Anna Jaques Hospital $801,756
110024479 Athol Memorial Hospital $183,166
110024350 Baystate Franklin Medical Center $494,879
110020829 Baystate Medical Center $4,267,439
110026434 Berkshire Medical Center $3,757,102
110026356 Beverly Hospital $810,111
110022129 Boston Medical Center $30,000,000 $20,000,000 $50,318,445 $103,553,333
110022076 Brigham & Women's Hospital $6,459,888
110026529 Cambridge Health Alliance126 $44,000,000 ($0) $22,426,667 $104,000,000 $6,000,000
110026780 Cape Cod Hospital $3,383,383
110027372 Cooley Dickinson Hospital $528,107
110026789 Dana Farber Cancer Institute $6,404,441
110026774 Fairview Hospital $937,521
110026775 Falmouth Hospital $754,675
110026787 Faulkner Hospital $2,272,359
110000034 Hallmark Health System $1,925,155
110024448 Harrington Memorial Hospital $1,482,443
110026459 Heywood Hospital $709,918
110026773 Holyoke Medical Center $736,103 $8,153,333
110026792 Lahey Clinic Hospital $1,430,101
110026771 Lawrence General Hospital $4,724,866 $14,433,333
126 Amount is reported expenditures net of intergovernmental transfer for non-Federal share.
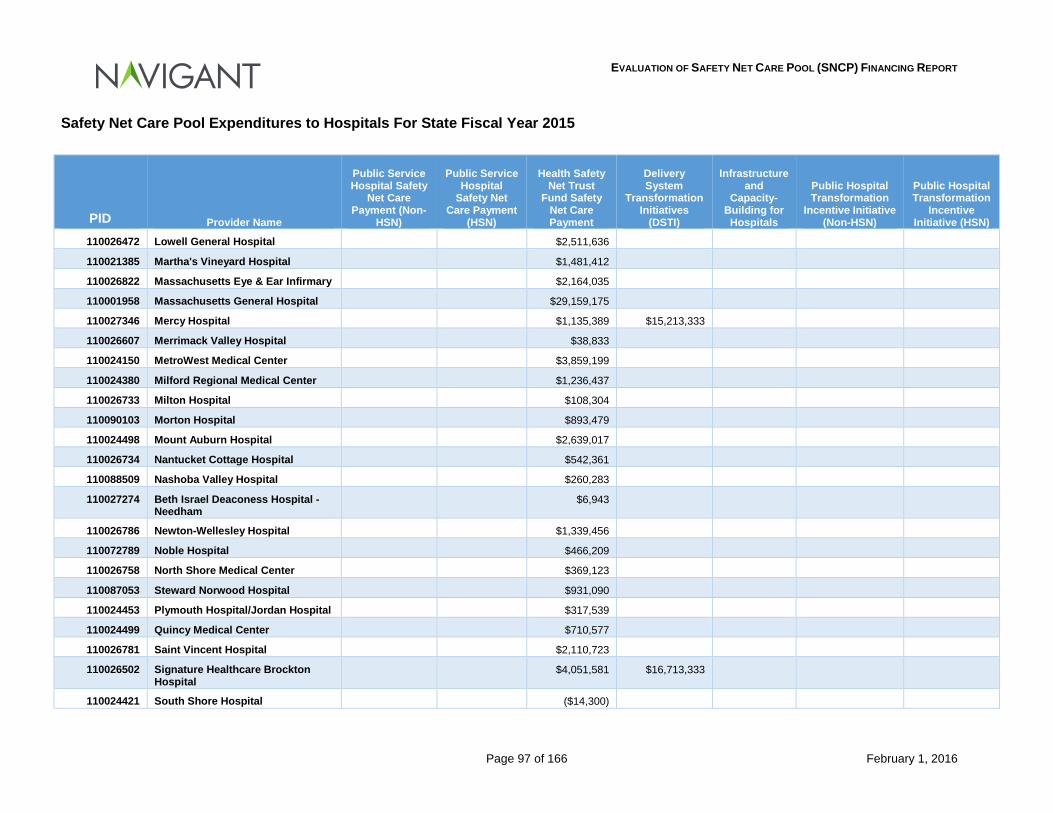
EVALUATION OF SAFETY NET CARE POOL (SNCP) FINANCING REPORT
Page 97 of 166 February 1, 2016
Safety Net Care Pool Expenditures to Hospitals For State Fiscal Year 2015
PID Provider Name
Public Service Hospital Safety
Net Care Payment (Non-
HSN)
Public Service Hospital
Safety Net Care Payment
(HSN)
Health Safety Net Trust
Fund Safety Net Care Payment
Delivery System
Transformation Initiatives
(DSTI)
Infrastructure and
Capacity-Building for Hospitals
Public Hospital Transformation
Incentive Initiative (Non-HSN)
Public Hospital Transformation
Incentive Initiative (HSN)
110026472 Lowell General Hospital $2,511,636
110021385 Martha's Vineyard Hospital $1,481,412
110026822 Massachusetts Eye & Ear Infirmary $2,164,035
110001958 Massachusetts General Hospital $29,159,175
110027346 Mercy Hospital $1,135,389 $15,213,333
110026607 Merrimack Valley Hospital $38,833
110024150 MetroWest Medical Center $3,859,199
110024380 Milford Regional Medical Center $1,236,437
110026733 Milton Hospital $108,304
110090103 Morton Hospital $893,479
110024498 Mount Auburn Hospital $2,639,017
110026734 Nantucket Cottage Hospital $542,361
110088509 Nashoba Valley Hospital $260,283
110027274 Beth Israel Deaconess Hospital - Needham
$6,943
110026786 Newton-Wellesley Hospital $1,339,456
110072789 Noble Hospital $466,209
110026758 North Shore Medical Center $369,123
110087053 Steward Norwood Hospital $931,090
110024453 Plymouth Hospital/Jordan Hospital $317,539
110024499 Quincy Medical Center $710,577
110026781 Saint Vincent Hospital $2,110,723
110026502 Signature Healthcare Brockton Hospital
$4,051,581 $16,713,333
110024421 South Shore Hospital ($14,300)
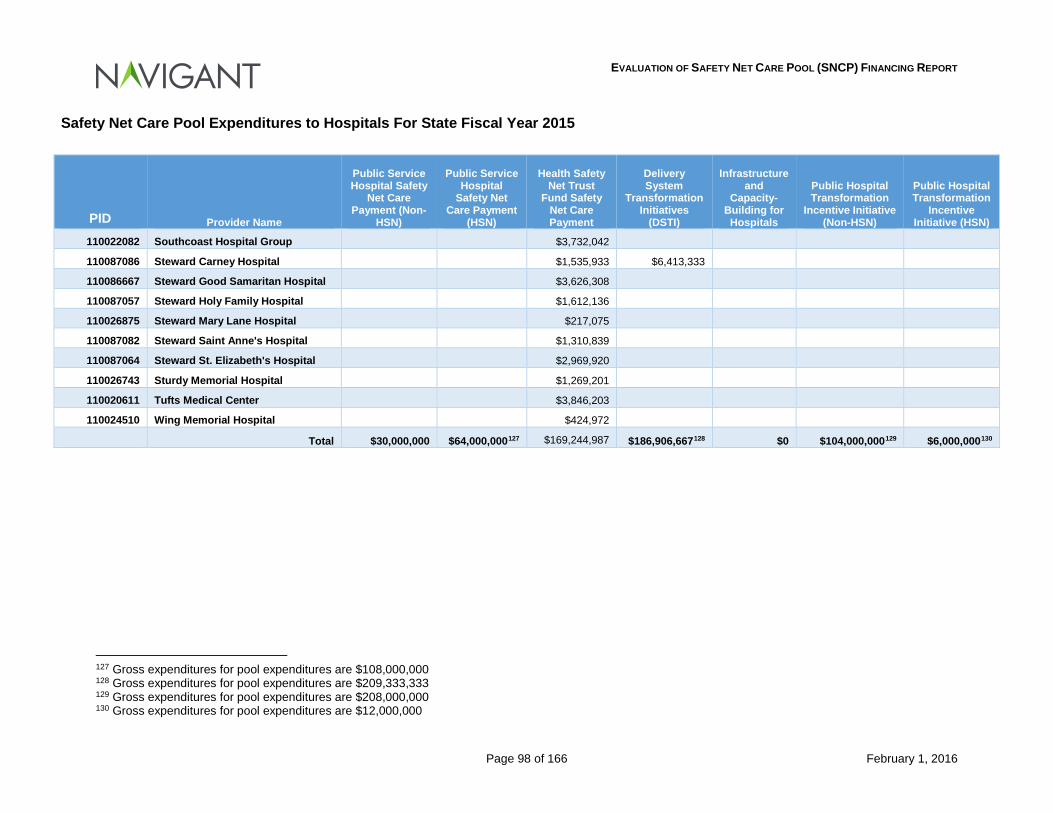
EVALUATION OF SAFETY NET CARE POOL (SNCP) FINANCING REPORT
Page 98 of 166 February 1, 2016
Safety Net Care Pool Expenditures to Hospitals For State Fiscal Year 2015
PID Provider Name
Public Service Hospital Safety
Net Care Payment (Non-
HSN)
Public Service Hospital
Safety Net Care Payment
(HSN)
Health Safety Net Trust
Fund Safety Net Care Payment
Delivery System
Transformation Initiatives
(DSTI)
Infrastructure and
Capacity-Building for Hospitals
Public Hospital Transformation
Incentive Initiative (Non-HSN)
Public Hospital Transformation
Incentive Initiative (HSN)
110022082 Southcoast Hospital Group $3,732,042
110087086 Steward Carney Hospital $1,535,933 $6,413,333
110086667 Steward Good Samaritan Hospital $3,626,308
110087057 Steward Holy Family Hospital $1,612,136
110026875 Steward Mary Lane Hospital $217,075
110087082 Steward Saint Anne's Hospital $1,310,839
110087064 Steward St. Elizabeth's Hospital $2,969,920
110026743 Sturdy Memorial Hospital $1,269,201
110020611 Tufts Medical Center $3,846,203
110024510 Wing Memorial Hospital $424,972
Total $30,000,000 $64,000,000127 $169,244,987 $186,906,667128 $0 $104,000,000129 $6,000,000130
127 Gross expenditures for pool expenditures are $108,000,000 128 Gross expenditures for pool expenditures are $209,333,333 129 Gross expenditures for pool expenditures are $208,000,000 130 Gross expenditures for pool expenditures are $12,000,000
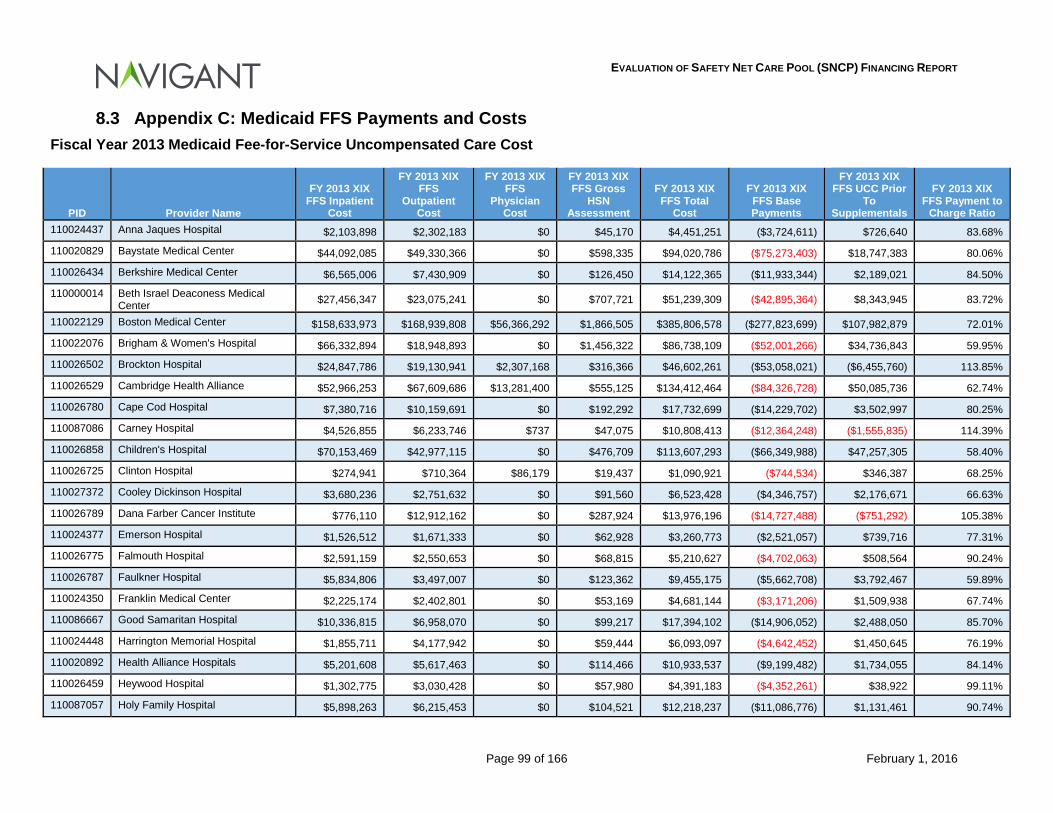
EVALUATION OF SAFETY NET CARE POOL (SNCP) FINANCING REPORT
Page 99 of 166 February 1, 2016
8.3 Appendix C: Medicaid FFS Payments and Costs Fiscal Year 2013 Medicaid Fee-for-Service Uncompensated Care Cost
PID Provider Name
FY 2013 XIX FFS Inpatient
Cost
FY 2013 XIX FFS
Outpatient Cost
FY 2013 XIX FFS
Physician Cost
FY 2013 XIX FFS Gross
HSN Assessment
FY 2013 XIX FFS Total
Cost
FY 2013 XIX FFS Base Payments
FY 2013 XIX FFS UCC Prior
To Supplementals
FY 2013 XIX FFS Payment to
Charge Ratio 110024437 Anna Jaques Hospital $2,103,898 $2,302,183 $0 $45,170 $4,451,251 ($3,724,611) $726,640 83.68%
110020829 Baystate Medical Center $44,092,085 $49,330,366 $0 $598,335 $94,020,786 ($75,273,403) $18,747,383 80.06%
110026434 Berkshire Medical Center $6,565,006 $7,430,909 $0 $126,450 $14,122,365 ($11,933,344) $2,189,021 84.50%
110000014 Beth Israel Deaconess Medical Center $27,456,347 $23,075,241 $0 $707,721 $51,239,309 ($42,895,364) $8,343,945 83.72%
110022129 Boston Medical Center $158,633,973 $168,939,808 $56,366,292 $1,866,505 $385,806,578 ($277,823,699) $107,982,879 72.01%
110022076 Brigham & Women's Hospital $66,332,894 $18,948,893 $0 $1,456,322 $86,738,109 ($52,001,266) $34,736,843 59.95%
110026502 Brockton Hospital $24,847,786 $19,130,941 $2,307,168 $316,366 $46,602,261 ($53,058,021) ($6,455,760) 113.85%
110026529 Cambridge Health Alliance $52,966,253 $67,609,686 $13,281,400 $555,125 $134,412,464 ($84,326,728) $50,085,736 62.74%
110026780 Cape Cod Hospital $7,380,716 $10,159,691 $0 $192,292 $17,732,699 ($14,229,702) $3,502,997 80.25%
110087086 Carney Hospital $4,526,855 $6,233,746 $737 $47,075 $10,808,413 ($12,364,248) ($1,555,835) 114.39%
110026858 Children's Hospital $70,153,469 $42,977,115 $0 $476,709 $113,607,293 ($66,349,988) $47,257,305 58.40%
110026725 Clinton Hospital $274,941 $710,364 $86,179 $19,437 $1,090,921 ($744,534) $346,387 68.25%
110027372 Cooley Dickinson Hospital $3,680,236 $2,751,632 $0 $91,560 $6,523,428 ($4,346,757) $2,176,671 66.63%
110026789 Dana Farber Cancer Institute $776,110 $12,912,162 $0 $287,924 $13,976,196 ($14,727,488) ($751,292) 105.38%
110024377 Emerson Hospital $1,526,512 $1,671,333 $0 $62,928 $3,260,773 ($2,521,057) $739,716 77.31%
110026775 Falmouth Hospital $2,591,159 $2,550,653 $0 $68,815 $5,210,627 ($4,702,063) $508,564 90.24%
110026787 Faulkner Hospital $5,834,806 $3,497,007 $0 $123,362 $9,455,175 ($5,662,708) $3,792,467 59.89%
110024350 Franklin Medical Center $2,225,174 $2,402,801 $0 $53,169 $4,681,144 ($3,171,206) $1,509,938 67.74%
110086667 Good Samaritan Hospital $10,336,815 $6,958,070 $0 $99,217 $17,394,102 ($14,906,052) $2,488,050 85.70%
110024448 Harrington Memorial Hospital $1,855,711 $4,177,942 $0 $59,444 $6,093,097 ($4,642,452) $1,450,645 76.19%
110020892 Health Alliance Hospitals $5,201,608 $5,617,463 $0 $114,466 $10,933,537 ($9,199,482) $1,734,055 84.14%
110026459 Heywood Hospital $1,302,775 $3,030,428 $0 $57,980 $4,391,183 ($4,352,261) $38,922 99.11%
110087057 Holy Family Hospital $5,898,263 $6,215,453 $0 $104,521 $12,218,237 ($11,086,776) $1,131,461 90.74%
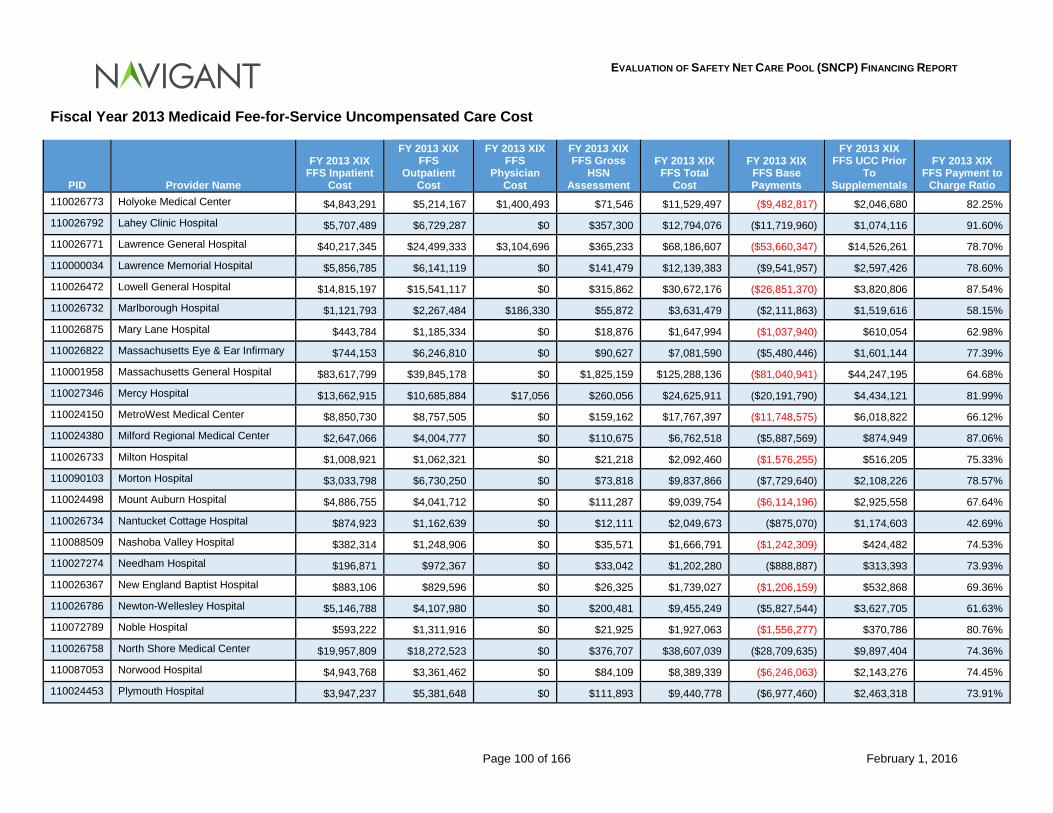
EVALUATION OF SAFETY NET CARE POOL (SNCP) FINANCING REPORT
Page 100 of 166 February 1, 2016
Fiscal Year 2013 Medicaid Fee-for-Service Uncompensated Care Cost
PID Provider Name
FY 2013 XIX FFS Inpatient
Cost
FY 2013 XIX FFS
Outpatient Cost
FY 2013 XIX FFS
Physician Cost
FY 2013 XIX FFS Gross
HSN Assessment
FY 2013 XIX FFS Total
Cost
FY 2013 XIX FFS Base Payments
FY 2013 XIX FFS UCC Prior
To Supplementals
FY 2013 XIX FFS Payment to
Charge Ratio 110026773 Holyoke Medical Center $4,843,291 $5,214,167 $1,400,493 $71,546 $11,529,497 ($9,482,817) $2,046,680 82.25%
110026792 Lahey Clinic Hospital $5,707,489 $6,729,287 $0 $357,300 $12,794,076 ($11,719,960) $1,074,116 91.60%
110026771 Lawrence General Hospital $40,217,345 $24,499,333 $3,104,696 $365,233 $68,186,607 ($53,660,347) $14,526,261 78.70%
110000034 Lawrence Memorial Hospital $5,856,785 $6,141,119 $0 $141,479 $12,139,383 ($9,541,957) $2,597,426 78.60%
110026472 Lowell General Hospital $14,815,197 $15,541,117 $0 $315,862 $30,672,176 ($26,851,370) $3,820,806 87.54%
110026732 Marlborough Hospital $1,121,793 $2,267,484 $186,330 $55,872 $3,631,479 ($2,111,863) $1,519,616 58.15%
110026875 Mary Lane Hospital $443,784 $1,185,334 $0 $18,876 $1,647,994 ($1,037,940) $610,054 62.98%
110026822 Massachusetts Eye & Ear Infirmary $744,153 $6,246,810 $0 $90,627 $7,081,590 ($5,480,446) $1,601,144 77.39%
110001958 Massachusetts General Hospital $83,617,799 $39,845,178 $0 $1,825,159 $125,288,136 ($81,040,941) $44,247,195 64.68%
110027346 Mercy Hospital $13,662,915 $10,685,884 $17,056 $260,056 $24,625,911 ($20,191,790) $4,434,121 81.99%
110024150 MetroWest Medical Center $8,850,730 $8,757,505 $0 $159,162 $17,767,397 ($11,748,575) $6,018,822 66.12%
110024380 Milford Regional Medical Center $2,647,066 $4,004,777 $0 $110,675 $6,762,518 ($5,887,569) $874,949 87.06%
110026733 Milton Hospital $1,008,921 $1,062,321 $0 $21,218 $2,092,460 ($1,576,255) $516,205 75.33%
110090103 Morton Hospital $3,033,798 $6,730,250 $0 $73,818 $9,837,866 ($7,729,640) $2,108,226 78.57%
110024498 Mount Auburn Hospital $4,886,755 $4,041,712 $0 $111,287 $9,039,754 ($6,114,196) $2,925,558 67.64%
110026734 Nantucket Cottage Hospital $874,923 $1,162,639 $0 $12,111 $2,049,673 ($875,070) $1,174,603 42.69%
110088509 Nashoba Valley Hospital $382,314 $1,248,906 $0 $35,571 $1,666,791 ($1,242,309) $424,482 74.53%
110027274 Needham Hospital $196,871 $972,367 $0 $33,042 $1,202,280 ($888,887) $313,393 73.93%
110026367 New England Baptist Hospital $883,106 $829,596 $0 $26,325 $1,739,027 ($1,206,159) $532,868 69.36%
110026786 Newton-Wellesley Hospital $5,146,788 $4,107,980 $0 $200,481 $9,455,249 ($5,827,544) $3,627,705 61.63%
110072789 Noble Hospital $593,222 $1,311,916 $0 $21,925 $1,927,063 ($1,556,277) $370,786 80.76%
110026758 North Shore Medical Center $19,957,809 $18,272,523 $0 $376,707 $38,607,039 ($28,709,635) $9,897,404 74.36%
110087053 Norwood Hospital $4,943,768 $3,361,462 $0 $84,109 $8,389,339 ($6,246,063) $2,143,276 74.45%
110024453 Plymouth Hospital $3,947,237 $5,381,648 $0 $111,893 $9,440,778 ($6,977,460) $2,463,318 73.91%
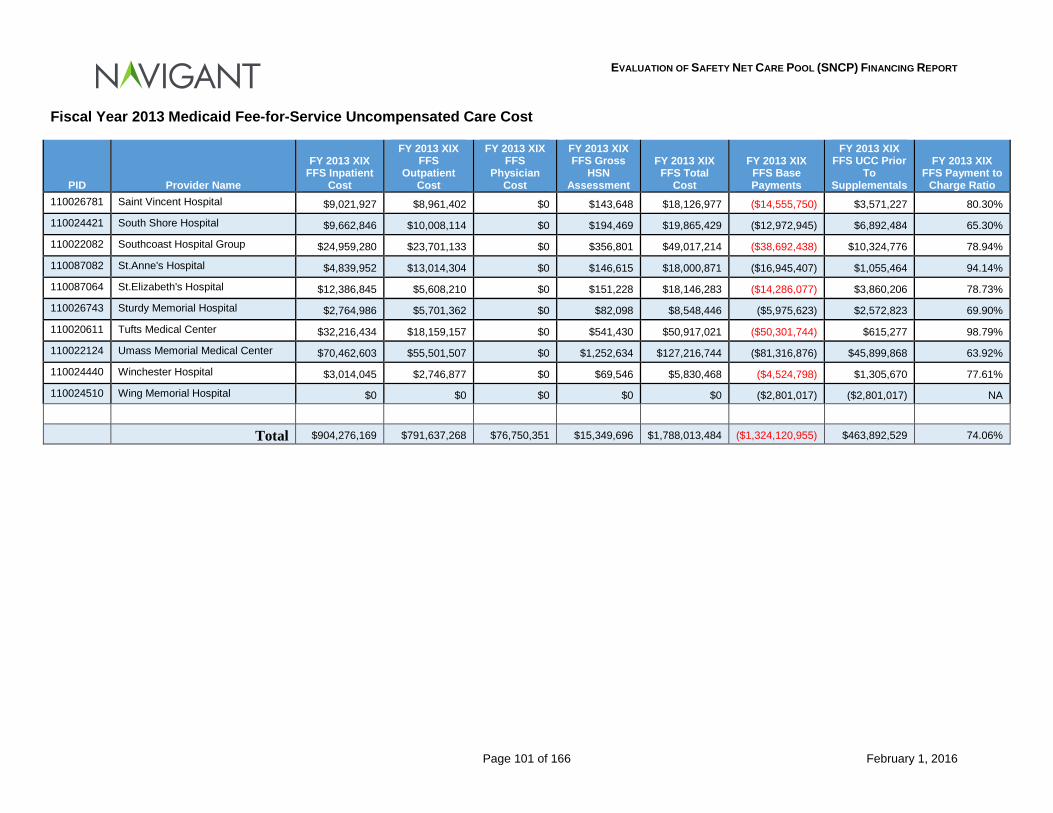
EVALUATION OF SAFETY NET CARE POOL (SNCP) FINANCING REPORT
Page 101 of 166 February 1, 2016
Fiscal Year 2013 Medicaid Fee-for-Service Uncompensated Care Cost
PID Provider Name
FY 2013 XIX FFS Inpatient
Cost
FY 2013 XIX FFS
Outpatient Cost
FY 2013 XIX FFS
Physician Cost
FY 2013 XIX FFS Gross
HSN Assessment
FY 2013 XIX FFS Total
Cost
FY 2013 XIX FFS Base Payments
FY 2013 XIX FFS UCC Prior
To Supplementals
FY 2013 XIX FFS Payment to
Charge Ratio 110026781 Saint Vincent Hospital $9,021,927 $8,961,402 $0 $143,648 $18,126,977 ($14,555,750) $3,571,227 80.30%
110024421 South Shore Hospital $9,662,846 $10,008,114 $0 $194,469 $19,865,429 ($12,972,945) $6,892,484 65.30%
110022082 Southcoast Hospital Group $24,959,280 $23,701,133 $0 $356,801 $49,017,214 ($38,692,438) $10,324,776 78.94%
110087082 St.Anne's Hospital $4,839,952 $13,014,304 $0 $146,615 $18,000,871 ($16,945,407) $1,055,464 94.14%
110087064 St.Elizabeth's Hospital $12,386,845 $5,608,210 $0 $151,228 $18,146,283 ($14,286,077) $3,860,206 78.73%
110026743 Sturdy Memorial Hospital $2,764,986 $5,701,362 $0 $82,098 $8,548,446 ($5,975,623) $2,572,823 69.90%
110020611 Tufts Medical Center $32,216,434 $18,159,157 $0 $541,430 $50,917,021 ($50,301,744) $615,277 98.79%
110022124 Umass Memorial Medical Center $70,462,603 $55,501,507 $0 $1,252,634 $127,216,744 ($81,316,876) $45,899,868 63.92%
110024440 Winchester Hospital $3,014,045 $2,746,877 $0 $69,546 $5,830,468 ($4,524,798) $1,305,670 77.61%
110024510 Wing Memorial Hospital $0 $0 $0 $0 $0 ($2,801,017) ($2,801,017) NA Total $904,276,169 $791,637,268 $76,750,351 $15,349,696 $1,788,013,484 ($1,324,120,955) $463,892,529 74.06%
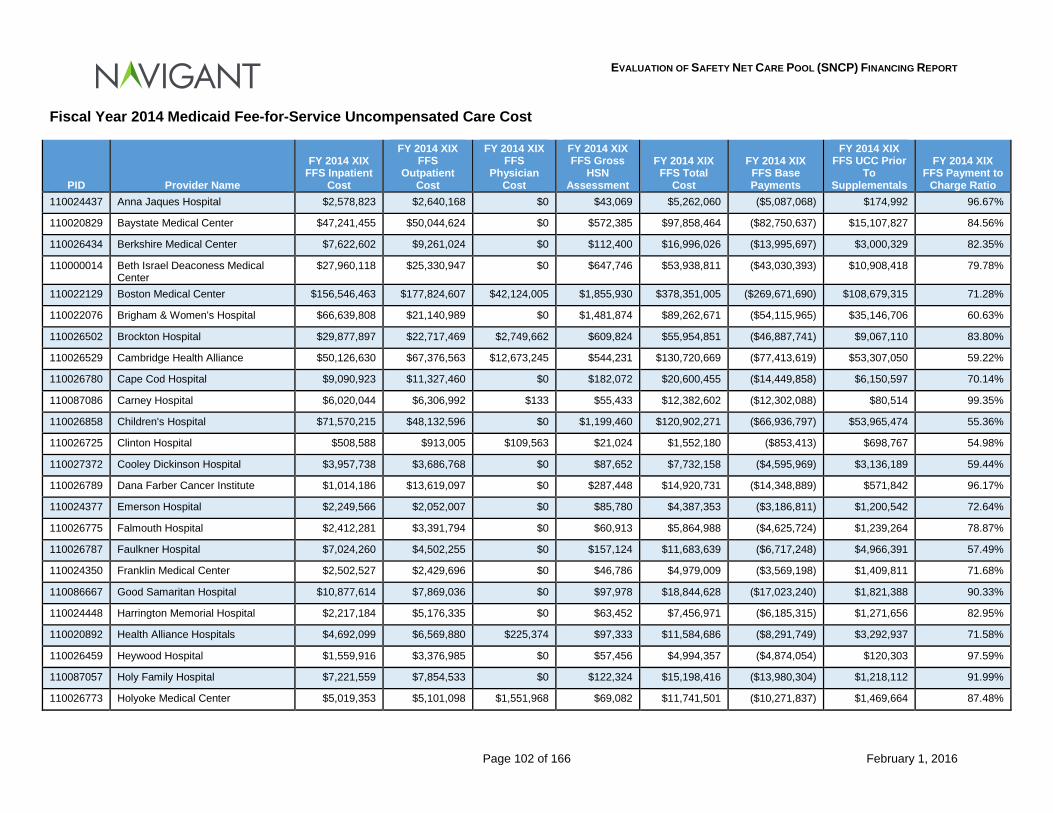
EVALUATION OF SAFETY NET CARE POOL (SNCP) FINANCING REPORT
Page 102 of 166 February 1, 2016
Fiscal Year 2014 Medicaid Fee-for-Service Uncompensated Care Cost
PID Provider Name
FY 2014 XIX FFS Inpatient
Cost
FY 2014 XIX FFS
Outpatient Cost
FY 2014 XIX FFS
Physician Cost
FY 2014 XIX FFS Gross
HSN Assessment
FY 2014 XIX FFS Total
Cost
FY 2014 XIX FFS Base Payments
FY 2014 XIX FFS UCC Prior
To Supplementals
FY 2014 XIX FFS Payment to
Charge Ratio 110024437 Anna Jaques Hospital $2,578,823 $2,640,168 $0 $43,069 $5,262,060 ($5,087,068) $174,992 96.67%
110020829 Baystate Medical Center $47,241,455 $50,044,624 $0 $572,385 $97,858,464 ($82,750,637) $15,107,827 84.56%
110026434 Berkshire Medical Center $7,622,602 $9,261,024 $0 $112,400 $16,996,026 ($13,995,697) $3,000,329 82.35%
110000014 Beth Israel Deaconess Medical Center
$27,960,118 $25,330,947 $0 $647,746 $53,938,811 ($43,030,393) $10,908,418 79.78%
110022129 Boston Medical Center $156,546,463 $177,824,607 $42,124,005 $1,855,930 $378,351,005 ($269,671,690) $108,679,315 71.28%
110022076 Brigham & Women's Hospital $66,639,808 $21,140,989 $0 $1,481,874 $89,262,671 ($54,115,965) $35,146,706 60.63%
110026502 Brockton Hospital $29,877,897 $22,717,469 $2,749,662 $609,824 $55,954,851 ($46,887,741) $9,067,110 83.80%
110026529 Cambridge Health Alliance $50,126,630 $67,376,563 $12,673,245 $544,231 $130,720,669 ($77,413,619) $53,307,050 59.22%
110026780 Cape Cod Hospital $9,090,923 $11,327,460 $0 $182,072 $20,600,455 ($14,449,858) $6,150,597 70.14%
110087086 Carney Hospital $6,020,044 $6,306,992 $133 $55,433 $12,382,602 ($12,302,088) $80,514 99.35%
110026858 Children's Hospital $71,570,215 $48,132,596 $0 $1,199,460 $120,902,271 ($66,936,797) $53,965,474 55.36%
110026725 Clinton Hospital $508,588 $913,005 $109,563 $21,024 $1,552,180 ($853,413) $698,767 54.98%
110027372 Cooley Dickinson Hospital $3,957,738 $3,686,768 $0 $87,652 $7,732,158 ($4,595,969) $3,136,189 59.44%
110026789 Dana Farber Cancer Institute $1,014,186 $13,619,097 $0 $287,448 $14,920,731 ($14,348,889) $571,842 96.17%
110024377 Emerson Hospital $2,249,566 $2,052,007 $0 $85,780 $4,387,353 ($3,186,811) $1,200,542 72.64%
110026775 Falmouth Hospital $2,412,281 $3,391,794 $0 $60,913 $5,864,988 ($4,625,724) $1,239,264 78.87%
110026787 Faulkner Hospital $7,024,260 $4,502,255 $0 $157,124 $11,683,639 ($6,717,248) $4,966,391 57.49%
110024350 Franklin Medical Center $2,502,527 $2,429,696 $0 $46,786 $4,979,009 ($3,569,198) $1,409,811 71.68%
110086667 Good Samaritan Hospital $10,877,614 $7,869,036 $0 $97,978 $18,844,628 ($17,023,240) $1,821,388 90.33%
110024448 Harrington Memorial Hospital $2,217,184 $5,176,335 $0 $63,452 $7,456,971 ($6,185,315) $1,271,656 82.95%
110020892 Health Alliance Hospitals $4,692,099 $6,569,880 $225,374 $97,333 $11,584,686 ($8,291,749) $3,292,937 71.58%
110026459 Heywood Hospital $1,559,916 $3,376,985 $0 $57,456 $4,994,357 ($4,874,054) $120,303 97.59%
110087057 Holy Family Hospital $7,221,559 $7,854,533 $0 $122,324 $15,198,416 ($13,980,304) $1,218,112 91.99%
110026773 Holyoke Medical Center $5,019,353 $5,101,098 $1,551,968 $69,082 $11,741,501 ($10,271,837) $1,469,664 87.48%
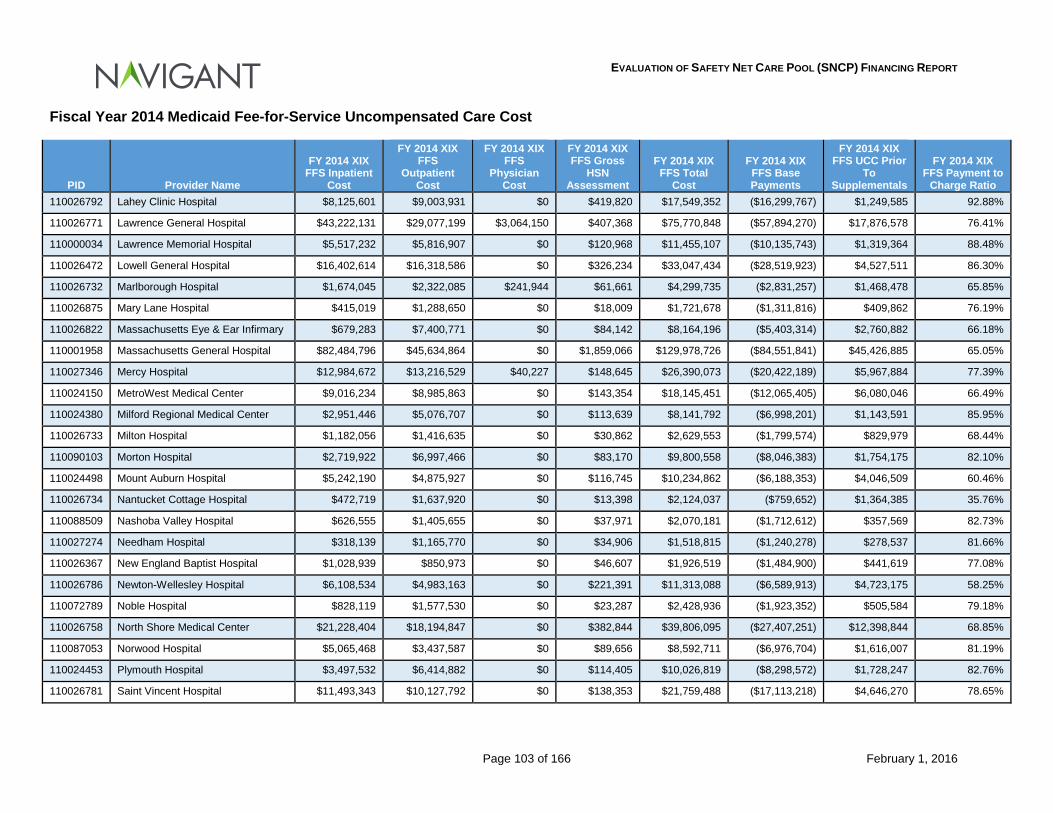
EVALUATION OF SAFETY NET CARE POOL (SNCP) FINANCING REPORT
Page 103 of 166 February 1, 2016
Fiscal Year 2014 Medicaid Fee-for-Service Uncompensated Care Cost
PID Provider Name
FY 2014 XIX FFS Inpatient
Cost
FY 2014 XIX FFS
Outpatient Cost
FY 2014 XIX FFS
Physician Cost
FY 2014 XIX FFS Gross
HSN Assessment
FY 2014 XIX FFS Total
Cost
FY 2014 XIX FFS Base Payments
FY 2014 XIX FFS UCC Prior
To Supplementals
FY 2014 XIX FFS Payment to
Charge Ratio 110026792 Lahey Clinic Hospital $8,125,601 $9,003,931 $0 $419,820 $17,549,352 ($16,299,767) $1,249,585 92.88%
110026771 Lawrence General Hospital $43,222,131 $29,077,199 $3,064,150 $407,368 $75,770,848 ($57,894,270) $17,876,578 76.41%
110000034 Lawrence Memorial Hospital $5,517,232 $5,816,907 $0 $120,968 $11,455,107 ($10,135,743) $1,319,364 88.48%
110026472 Lowell General Hospital $16,402,614 $16,318,586 $0 $326,234 $33,047,434 ($28,519,923) $4,527,511 86.30%
110026732 Marlborough Hospital $1,674,045 $2,322,085 $241,944 $61,661 $4,299,735 ($2,831,257) $1,468,478 65.85%
110026875 Mary Lane Hospital $415,019 $1,288,650 $0 $18,009 $1,721,678 ($1,311,816) $409,862 76.19%
110026822 Massachusetts Eye & Ear Infirmary $679,283 $7,400,771 $0 $84,142 $8,164,196 ($5,403,314) $2,760,882 66.18%
110001958 Massachusetts General Hospital $82,484,796 $45,634,864 $0 $1,859,066 $129,978,726 ($84,551,841) $45,426,885 65.05%
110027346 Mercy Hospital $12,984,672 $13,216,529 $40,227 $148,645 $26,390,073 ($20,422,189) $5,967,884 77.39%
110024150 MetroWest Medical Center $9,016,234 $8,985,863 $0 $143,354 $18,145,451 ($12,065,405) $6,080,046 66.49%
110024380 Milford Regional Medical Center $2,951,446 $5,076,707 $0 $113,639 $8,141,792 ($6,998,201) $1,143,591 85.95%
110026733 Milton Hospital $1,182,056 $1,416,635 $0 $30,862 $2,629,553 ($1,799,574) $829,979 68.44%
110090103 Morton Hospital $2,719,922 $6,997,466 $0 $83,170 $9,800,558 ($8,046,383) $1,754,175 82.10%
110024498 Mount Auburn Hospital $5,242,190 $4,875,927 $0 $116,745 $10,234,862 ($6,188,353) $4,046,509 60.46%
110026734 Nantucket Cottage Hospital $472,719 $1,637,920 $0 $13,398 $2,124,037 ($759,652) $1,364,385 35.76%
110088509 Nashoba Valley Hospital $626,555 $1,405,655 $0 $37,971 $2,070,181 ($1,712,612) $357,569 82.73%
110027274 Needham Hospital $318,139 $1,165,770 $0 $34,906 $1,518,815 ($1,240,278) $278,537 81.66%
110026367 New England Baptist Hospital $1,028,939 $850,973 $0 $46,607 $1,926,519 ($1,484,900) $441,619 77.08%
110026786 Newton-Wellesley Hospital $6,108,534 $4,983,163 $0 $221,391 $11,313,088 ($6,589,913) $4,723,175 58.25%
110072789 Noble Hospital $828,119 $1,577,530 $0 $23,287 $2,428,936 ($1,923,352) $505,584 79.18%
110026758 North Shore Medical Center $21,228,404 $18,194,847 $0 $382,844 $39,806,095 ($27,407,251) $12,398,844 68.85%
110087053 Norwood Hospital $5,065,468 $3,437,587 $0 $89,656 $8,592,711 ($6,976,704) $1,616,007 81.19%
110024453 Plymouth Hospital $3,497,532 $6,414,882 $0 $114,405 $10,026,819 ($8,298,572) $1,728,247 82.76%
110026781 Saint Vincent Hospital $11,493,343 $10,127,792 $0 $138,353 $21,759,488 ($17,113,218) $4,646,270 78.65%
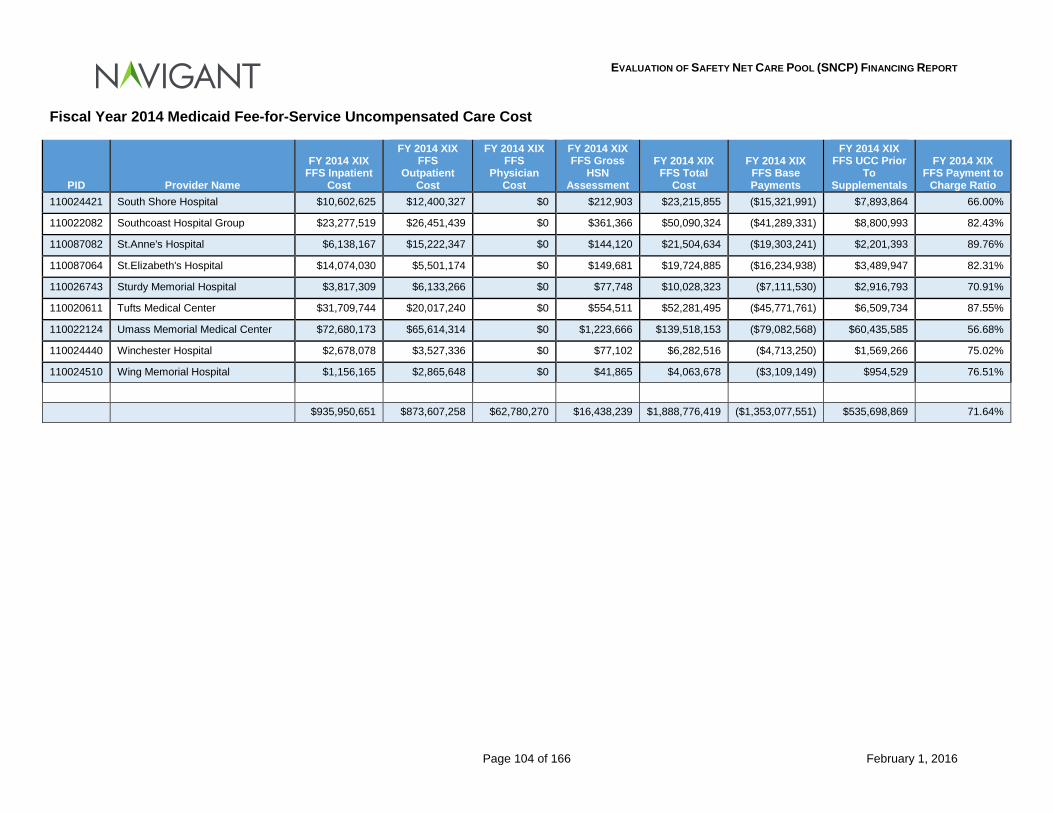
EVALUATION OF SAFETY NET CARE POOL (SNCP) FINANCING REPORT
Page 104 of 166 February 1, 2016
Fiscal Year 2014 Medicaid Fee-for-Service Uncompensated Care Cost
PID Provider Name
FY 2014 XIX FFS Inpatient
Cost
FY 2014 XIX FFS
Outpatient Cost
FY 2014 XIX FFS
Physician Cost
FY 2014 XIX FFS Gross
HSN Assessment
FY 2014 XIX FFS Total
Cost
FY 2014 XIX FFS Base Payments
FY 2014 XIX FFS UCC Prior
To Supplementals
FY 2014 XIX FFS Payment to
Charge Ratio 110024421 South Shore Hospital $10,602,625 $12,400,327 $0 $212,903 $23,215,855 ($15,321,991) $7,893,864 66.00%
110022082 Southcoast Hospital Group $23,277,519 $26,451,439 $0 $361,366 $50,090,324 ($41,289,331) $8,800,993 82.43%
110087082 St.Anne's Hospital $6,138,167 $15,222,347 $0 $144,120 $21,504,634 ($19,303,241) $2,201,393 89.76%
110087064 St.Elizabeth's Hospital $14,074,030 $5,501,174 $0 $149,681 $19,724,885 ($16,234,938) $3,489,947 82.31%
110026743 Sturdy Memorial Hospital $3,817,309 $6,133,266 $0 $77,748 $10,028,323 ($7,111,530) $2,916,793 70.91%
110020611 Tufts Medical Center $31,709,744 $20,017,240 $0 $554,511 $52,281,495 ($45,771,761) $6,509,734 87.55%
110022124 Umass Memorial Medical Center $72,680,173 $65,614,314 $0 $1,223,666 $139,518,153 ($79,082,568) $60,435,585 56.68%
110024440 Winchester Hospital $2,678,078 $3,527,336 $0 $77,102 $6,282,516 ($4,713,250) $1,569,266 75.02%
110024510 Wing Memorial Hospital $1,156,165 $2,865,648 $0 $41,865 $4,063,678 ($3,109,149) $954,529 76.51%
$935,950,651 $873,607,258 $62,780,270 $16,438,239 $1,888,776,419 ($1,353,077,551) $535,698,869 71.64%
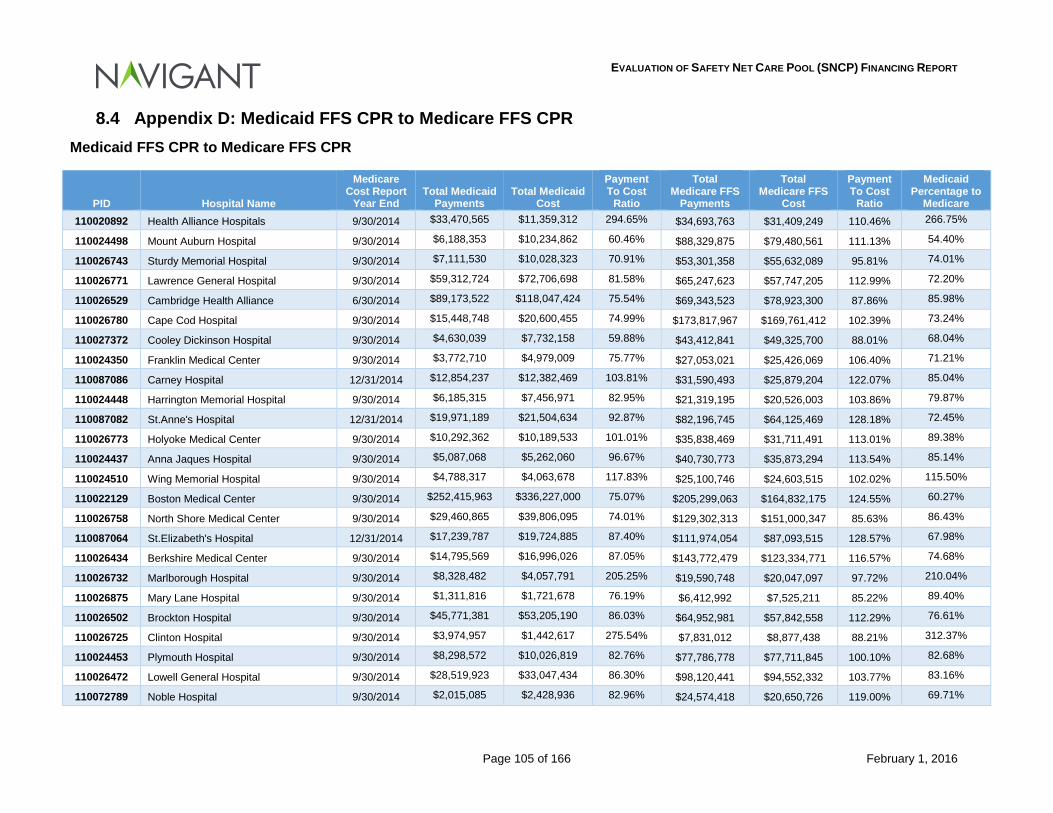
EVALUATION OF SAFETY NET CARE POOL (SNCP) FINANCING REPORT
Page 105 of 166 February 1, 2016
8.4 Appendix D: Medicaid FFS CPR to Medicare FFS CPR Medicaid FFS CPR to Medicare FFS CPR
PID Hospital Name
Medicare Cost Report
Year End Total Medicaid
Payments Total Medicaid
Cost
Payment To Cost
Ratio
Total Medicare FFS
Payments
Total Medicare FFS
Cost
Payment To Cost
Ratio
Medicaid Percentage to
Medicare 110020892 Health Alliance Hospitals 9/30/2014 $33,470,565 $11,359,312 294.65% $34,693,763 $31,409,249 110.46% 266.75%
110024498 Mount Auburn Hospital 9/30/2014 $6,188,353 $10,234,862 60.46% $88,329,875 $79,480,561 111.13% 54.40%
110026743 Sturdy Memorial Hospital 9/30/2014 $7,111,530 $10,028,323 70.91% $53,301,358 $55,632,089 95.81% 74.01%
110026771 Lawrence General Hospital 9/30/2014 $59,312,724 $72,706,698 81.58% $65,247,623 $57,747,205 112.99% 72.20%
110026529 Cambridge Health Alliance 6/30/2014 $89,173,522 $118,047,424 75.54% $69,343,523 $78,923,300 87.86% 85.98%
110026780 Cape Cod Hospital 9/30/2014 $15,448,748 $20,600,455 74.99% $173,817,967 $169,761,412 102.39% 73.24%
110027372 Cooley Dickinson Hospital 9/30/2014 $4,630,039 $7,732,158 59.88% $43,412,841 $49,325,700 88.01% 68.04%
110024350 Franklin Medical Center 9/30/2014 $3,772,710 $4,979,009 75.77% $27,053,021 $25,426,069 106.40% 71.21%
110087086 Carney Hospital 12/31/2014 $12,854,237 $12,382,469 103.81% $31,590,493 $25,879,204 122.07% 85.04%
110024448 Harrington Memorial Hospital 9/30/2014 $6,185,315 $7,456,971 82.95% $21,319,195 $20,526,003 103.86% 79.87%
110087082 St.Anne's Hospital 12/31/2014 $19,971,189 $21,504,634 92.87% $82,196,745 $64,125,469 128.18% 72.45%
110026773 Holyoke Medical Center 9/30/2014 $10,292,362 $10,189,533 101.01% $35,838,469 $31,711,491 113.01% 89.38%
110024437 Anna Jaques Hospital 9/30/2014 $5,087,068 $5,262,060 96.67% $40,730,773 $35,873,294 113.54% 85.14%
110024510 Wing Memorial Hospital 9/30/2014 $4,788,317 $4,063,678 117.83% $25,100,746 $24,603,515 102.02% 115.50%
110022129 Boston Medical Center 9/30/2014 $252,415,963 $336,227,000 75.07% $205,299,063 $164,832,175 124.55% 60.27%
110026758 North Shore Medical Center 9/30/2014 $29,460,865 $39,806,095 74.01% $129,302,313 $151,000,347 85.63% 86.43%
110087064 St.Elizabeth's Hospital 12/31/2014 $17,239,787 $19,724,885 87.40% $111,974,054 $87,093,515 128.57% 67.98%
110026434 Berkshire Medical Center 9/30/2014 $14,795,569 $16,996,026 87.05% $143,772,479 $123,334,771 116.57% 74.68%
110026732 Marlborough Hospital 9/30/2014 $8,328,482 $4,057,791 205.25% $19,590,748 $20,047,097 97.72% 210.04%
110026875 Mary Lane Hospital 9/30/2014 $1,311,816 $1,721,678 76.19% $6,412,992 $7,525,211 85.22% 89.40%
110026502 Brockton Hospital 9/30/2014 $45,771,381 $53,205,190 86.03% $64,952,981 $57,842,558 112.29% 76.61%
110026725 Clinton Hospital 9/30/2014 $3,974,957 $1,442,617 275.54% $7,831,012 $8,877,438 88.21% 312.37%
110024453 Plymouth Hospital 9/30/2014 $8,298,572 $10,026,819 82.76% $77,786,778 $77,711,845 100.10% 82.68%
110026472 Lowell General Hospital 9/30/2014 $28,519,923 $33,047,434 86.30% $98,120,441 $94,552,332 103.77% 83.16%
110072789 Noble Hospital 9/30/2014 $2,015,085 $2,428,936 82.96% $24,574,418 $20,650,726 119.00% 69.71%
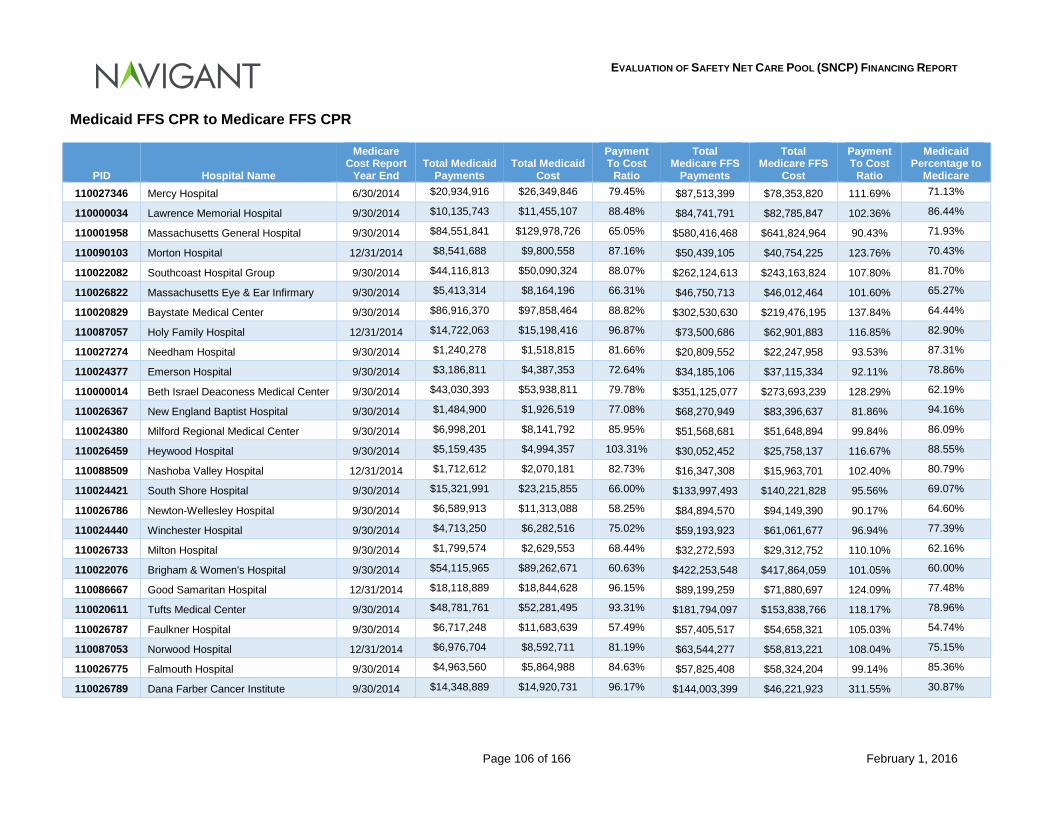
EVALUATION OF SAFETY NET CARE POOL (SNCP) FINANCING REPORT
Page 106 of 166 February 1, 2016
Medicaid FFS CPR to Medicare FFS CPR
PID Hospital Name
Medicare Cost Report
Year End Total Medicaid
Payments Total Medicaid
Cost
Payment To Cost
Ratio
Total Medicare FFS
Payments
Total Medicare FFS
Cost
Payment To Cost
Ratio
Medicaid Percentage to
Medicare 110027346 Mercy Hospital 6/30/2014 $20,934,916 $26,349,846 79.45% $87,513,399 $78,353,820 111.69% 71.13%
110000034 Lawrence Memorial Hospital 9/30/2014 $10,135,743 $11,455,107 88.48% $84,741,791 $82,785,847 102.36% 86.44%
110001958 Massachusetts General Hospital 9/30/2014 $84,551,841 $129,978,726 65.05% $580,416,468 $641,824,964 90.43% 71.93%
110090103 Morton Hospital 12/31/2014 $8,541,688 $9,800,558 87.16% $50,439,105 $40,754,225 123.76% 70.43%
110022082 Southcoast Hospital Group 9/30/2014 $44,116,813 $50,090,324 88.07% $262,124,613 $243,163,824 107.80% 81.70%
110026822 Massachusetts Eye & Ear Infirmary 9/30/2014 $5,413,314 $8,164,196 66.31% $46,750,713 $46,012,464 101.60% 65.27%
110020829 Baystate Medical Center 9/30/2014 $86,916,370 $97,858,464 88.82% $302,530,630 $219,476,195 137.84% 64.44%
110087057 Holy Family Hospital 12/31/2014 $14,722,063 $15,198,416 96.87% $73,500,686 $62,901,883 116.85% 82.90%
110027274 Needham Hospital 9/30/2014 $1,240,278 $1,518,815 81.66% $20,809,552 $22,247,958 93.53% 87.31%
110024377 Emerson Hospital 9/30/2014 $3,186,811 $4,387,353 72.64% $34,185,106 $37,115,334 92.11% 78.86%
110000014 Beth Israel Deaconess Medical Center 9/30/2014 $43,030,393 $53,938,811 79.78% $351,125,077 $273,693,239 128.29% 62.19%
110026367 New England Baptist Hospital 9/30/2014 $1,484,900 $1,926,519 77.08% $68,270,949 $83,396,637 81.86% 94.16%
110024380 Milford Regional Medical Center 9/30/2014 $6,998,201 $8,141,792 85.95% $51,568,681 $51,648,894 99.84% 86.09%
110026459 Heywood Hospital 9/30/2014 $5,159,435 $4,994,357 103.31% $30,052,452 $25,758,137 116.67% 88.55%
110088509 Nashoba Valley Hospital 12/31/2014 $1,712,612 $2,070,181 82.73% $16,347,308 $15,963,701 102.40% 80.79%
110024421 South Shore Hospital 9/30/2014 $15,321,991 $23,215,855 66.00% $133,997,493 $140,221,828 95.56% 69.07%
110026786 Newton-Wellesley Hospital 9/30/2014 $6,589,913 $11,313,088 58.25% $84,894,570 $94,149,390 90.17% 64.60%
110024440 Winchester Hospital 9/30/2014 $4,713,250 $6,282,516 75.02% $59,193,923 $61,061,677 96.94% 77.39%
110026733 Milton Hospital 9/30/2014 $1,799,574 $2,629,553 68.44% $32,272,593 $29,312,752 110.10% 62.16%
110022076 Brigham & Women's Hospital 9/30/2014 $54,115,965 $89,262,671 60.63% $422,253,548 $417,864,059 101.05% 60.00%
110086667 Good Samaritan Hospital 12/31/2014 $18,118,889 $18,844,628 96.15% $89,199,259 $71,880,697 124.09% 77.48%
110020611 Tufts Medical Center 9/30/2014 $48,781,761 $52,281,495 93.31% $181,794,097 $153,838,766 118.17% 78.96%
110026787 Faulkner Hospital 9/30/2014 $6,717,248 $11,683,639 57.49% $57,405,517 $54,658,321 105.03% 54.74%
110087053 Norwood Hospital 12/31/2014 $6,976,704 $8,592,711 81.19% $63,544,277 $58,813,221 108.04% 75.15%
110026775 Falmouth Hospital 9/30/2014 $4,963,560 $5,864,988 84.63% $57,825,408 $58,324,204 99.14% 85.36%
110026789 Dana Farber Cancer Institute 9/30/2014 $14,348,889 $14,920,731 96.17% $144,003,399 $46,221,923 311.55% 30.87%
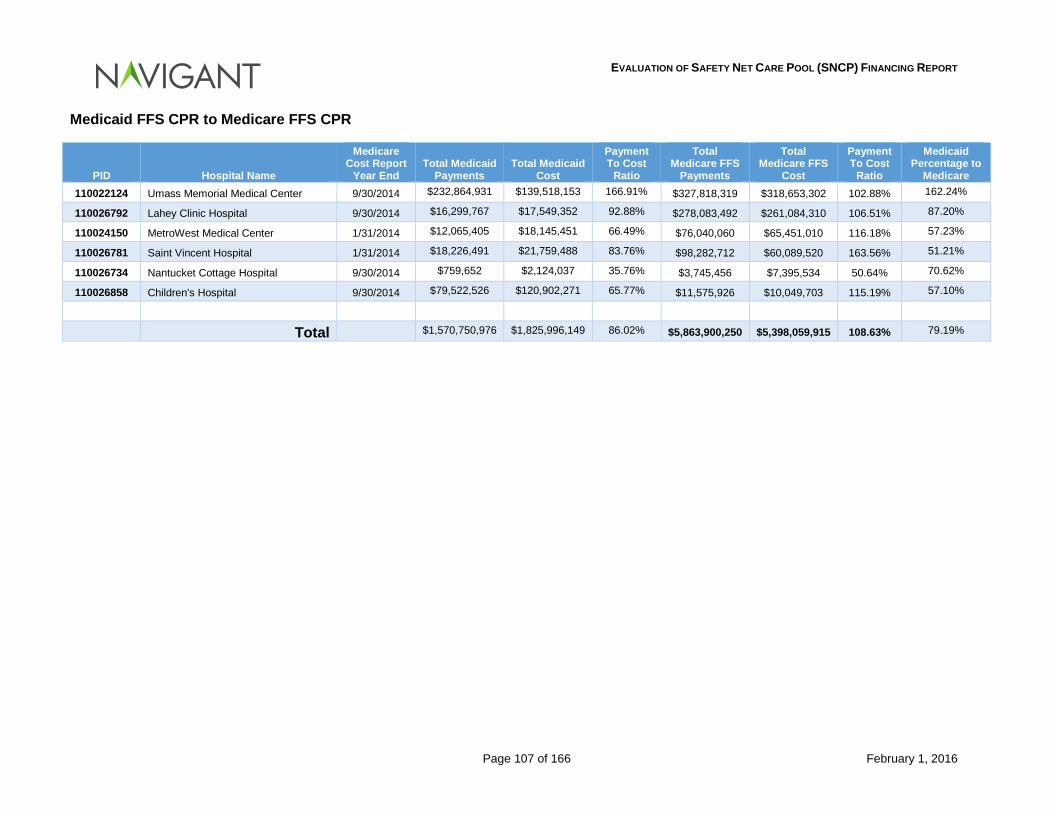
EVALUATION OF SAFETY NET CARE POOL (SNCP) FINANCING REPORT
Page 107 of 166 February 1, 2016
Medicaid FFS CPR to Medicare FFS CPR
PID Hospital Name
Medicare Cost Report
Year End Total Medicaid
Payments Total Medicaid
Cost
Payment To Cost
Ratio
Total Medicare FFS
Payments
Total Medicare FFS
Cost
Payment To Cost
Ratio
Medicaid Percentage to
Medicare 110022124 Umass Memorial Medical Center 9/30/2014 $232,864,931 $139,518,153 166.91% $327,818,319 $318,653,302 102.88% 162.24%
110026792 Lahey Clinic Hospital 9/30/2014 $16,299,767 $17,549,352 92.88% $278,083,492 $261,084,310 106.51% 87.20%
110024150 MetroWest Medical Center 1/31/2014 $12,065,405 $18,145,451 66.49% $76,040,060 $65,451,010 116.18% 57.23%
110026781 Saint Vincent Hospital 1/31/2014 $18,226,491 $21,759,488 83.76% $98,282,712 $60,089,520 163.56% 51.21%
110026734 Nantucket Cottage Hospital 9/30/2014 $759,652 $2,124,037 35.76% $3,745,456 $7,395,534 50.64% 70.62%
110026858 Children's Hospital 9/30/2014 $79,522,526 $120,902,271 65.77% $11,575,926 $10,049,703 115.19% 57.10%
Total $1,570,750,976 $1,825,996,149 86.02% $5,863,900,250 $5,398,059,915 108.63% 79.19%
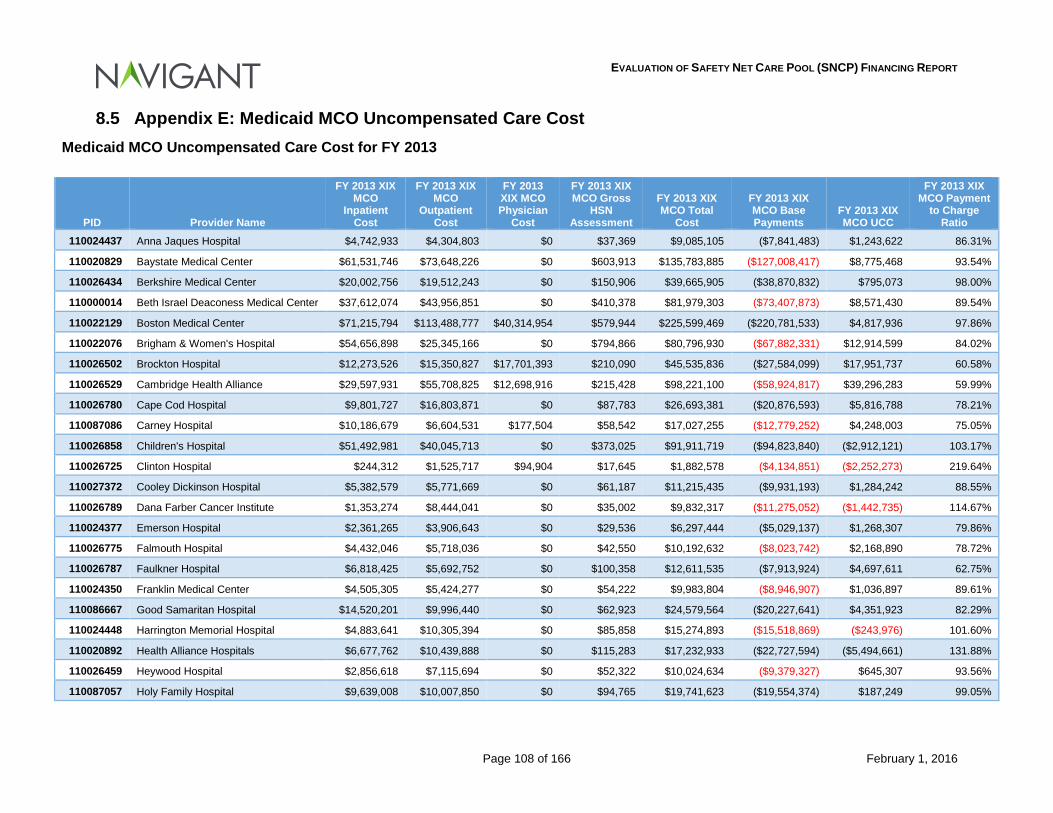
EVALUATION OF SAFETY NET CARE POOL (SNCP) FINANCING REPORT
Page 108 of 166 February 1, 2016
8.5 Appendix E: Medicaid MCO Uncompensated Care Cost Medicaid MCO Uncompensated Care Cost for FY 2013
PID Provider Name
FY 2013 XIX MCO
Inpatient Cost
FY 2013 XIX MCO
Outpatient Cost
FY 2013 XIX MCO Physician
Cost
FY 2013 XIX MCO Gross
HSN Assessment
FY 2013 XIX MCO Total
Cost
FY 2013 XIX MCO Base Payments
FY 2013 XIX MCO UCC
FY 2013 XIX MCO Payment
to Charge Ratio
110024437 Anna Jaques Hospital $4,742,933 $4,304,803 $0 $37,369 $9,085,105 ($7,841,483) $1,243,622 86.31%
110020829 Baystate Medical Center $61,531,746 $73,648,226 $0 $603,913 $135,783,885 ($127,008,417) $8,775,468 93.54%
110026434 Berkshire Medical Center $20,002,756 $19,512,243 $0 $150,906 $39,665,905 ($38,870,832) $795,073 98.00%
110000014 Beth Israel Deaconess Medical Center $37,612,074 $43,956,851 $0 $410,378 $81,979,303 ($73,407,873) $8,571,430 89.54%
110022129 Boston Medical Center $71,215,794 $113,488,777 $40,314,954 $579,944 $225,599,469 ($220,781,533) $4,817,936 97.86%
110022076 Brigham & Women's Hospital $54,656,898 $25,345,166 $0 $794,866 $80,796,930 ($67,882,331) $12,914,599 84.02%
110026502 Brockton Hospital $12,273,526 $15,350,827 $17,701,393 $210,090 $45,535,836 ($27,584,099) $17,951,737 60.58%
110026529 Cambridge Health Alliance $29,597,931 $55,708,825 $12,698,916 $215,428 $98,221,100 ($58,924,817) $39,296,283 59.99%
110026780 Cape Cod Hospital $9,801,727 $16,803,871 $0 $87,783 $26,693,381 ($20,876,593) $5,816,788 78.21%
110087086 Carney Hospital $10,186,679 $6,604,531 $177,504 $58,542 $17,027,255 ($12,779,252) $4,248,003 75.05%
110026858 Children's Hospital $51,492,981 $40,045,713 $0 $373,025 $91,911,719 ($94,823,840) ($2,912,121) 103.17%
110026725 Clinton Hospital $244,312 $1,525,717 $94,904 $17,645 $1,882,578 ($4,134,851) ($2,252,273) 219.64%
110027372 Cooley Dickinson Hospital $5,382,579 $5,771,669 $0 $61,187 $11,215,435 ($9,931,193) $1,284,242 88.55%
110026789 Dana Farber Cancer Institute $1,353,274 $8,444,041 $0 $35,002 $9,832,317 ($11,275,052) ($1,442,735) 114.67%
110024377 Emerson Hospital $2,361,265 $3,906,643 $0 $29,536 $6,297,444 ($5,029,137) $1,268,307 79.86%
110026775 Falmouth Hospital $4,432,046 $5,718,036 $0 $42,550 $10,192,632 ($8,023,742) $2,168,890 78.72%
110026787 Faulkner Hospital $6,818,425 $5,692,752 $0 $100,358 $12,611,535 ($7,913,924) $4,697,611 62.75%
110024350 Franklin Medical Center $4,505,305 $5,424,277 $0 $54,222 $9,983,804 ($8,946,907) $1,036,897 89.61%
110086667 Good Samaritan Hospital $14,520,201 $9,996,440 $0 $62,923 $24,579,564 ($20,227,641) $4,351,923 82.29%
110024448 Harrington Memorial Hospital $4,883,641 $10,305,394 $0 $85,858 $15,274,893 ($15,518,869) ($243,976) 101.60%
110020892 Health Alliance Hospitals $6,677,762 $10,439,888 $0 $115,283 $17,232,933 ($22,727,594) ($5,494,661) 131.88%
110026459 Heywood Hospital $2,856,618 $7,115,694 $0 $52,322 $10,024,634 ($9,379,327) $645,307 93.56%
110087057 Holy Family Hospital $9,639,008 $10,007,850 $0 $94,765 $19,741,623 ($19,554,374) $187,249 99.05%
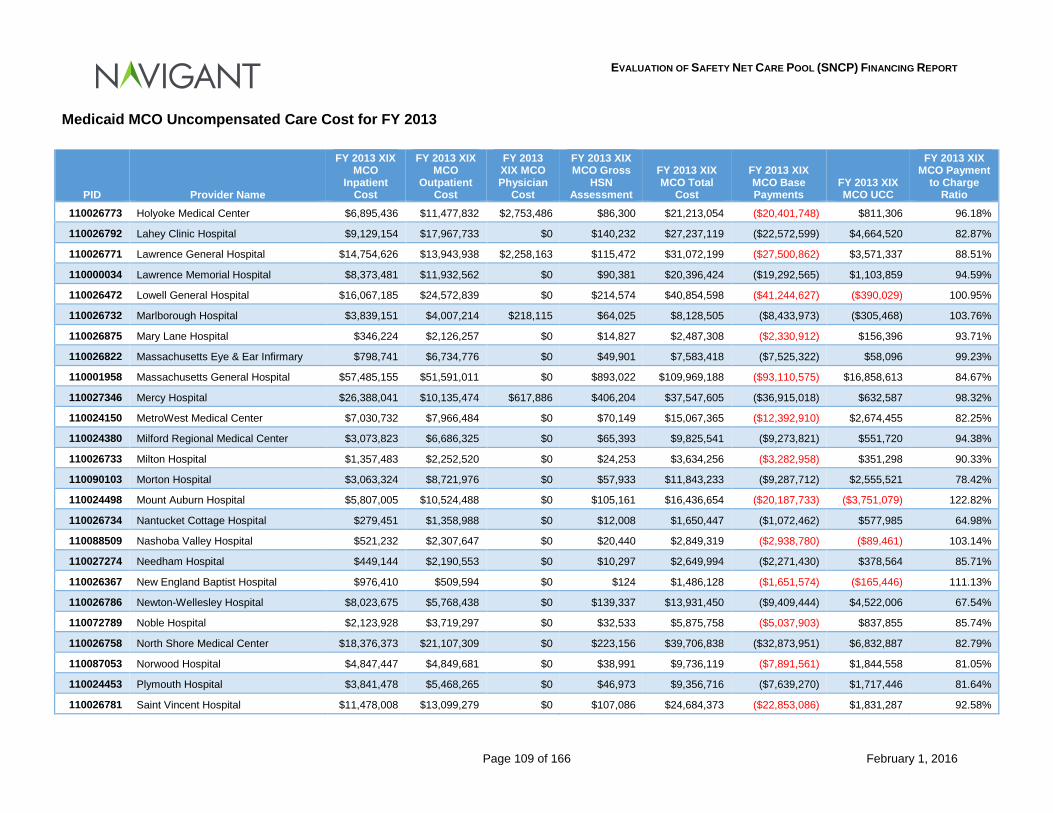
EVALUATION OF SAFETY NET CARE POOL (SNCP) FINANCING REPORT
Page 109 of 166 February 1, 2016
Medicaid MCO Uncompensated Care Cost for FY 2013
PID Provider Name
FY 2013 XIX MCO
Inpatient Cost
FY 2013 XIX MCO
Outpatient Cost
FY 2013 XIX MCO Physician
Cost
FY 2013 XIX MCO Gross
HSN Assessment
FY 2013 XIX MCO Total
Cost
FY 2013 XIX MCO Base Payments
FY 2013 XIX MCO UCC
FY 2013 XIX MCO Payment
to Charge Ratio
110026773 Holyoke Medical Center $6,895,436 $11,477,832 $2,753,486 $86,300 $21,213,054 ($20,401,748) $811,306 96.18%
110026792 Lahey Clinic Hospital $9,129,154 $17,967,733 $0 $140,232 $27,237,119 ($22,572,599) $4,664,520 82.87%
110026771 Lawrence General Hospital $14,754,626 $13,943,938 $2,258,163 $115,472 $31,072,199 ($27,500,862) $3,571,337 88.51%
110000034 Lawrence Memorial Hospital $8,373,481 $11,932,562 $0 $90,381 $20,396,424 ($19,292,565) $1,103,859 94.59%
110026472 Lowell General Hospital $16,067,185 $24,572,839 $0 $214,574 $40,854,598 ($41,244,627) ($390,029) 100.95%
110026732 Marlborough Hospital $3,839,151 $4,007,214 $218,115 $64,025 $8,128,505 ($8,433,973) ($305,468) 103.76%
110026875 Mary Lane Hospital $346,224 $2,126,257 $0 $14,827 $2,487,308 ($2,330,912) $156,396 93.71%
110026822 Massachusetts Eye & Ear Infirmary $798,741 $6,734,776 $0 $49,901 $7,583,418 ($7,525,322) $58,096 99.23%
110001958 Massachusetts General Hospital $57,485,155 $51,591,011 $0 $893,022 $109,969,188 ($93,110,575) $16,858,613 84.67%
110027346 Mercy Hospital $26,388,041 $10,135,474 $617,886 $406,204 $37,547,605 ($36,915,018) $632,587 98.32%
110024150 MetroWest Medical Center $7,030,732 $7,966,484 $0 $70,149 $15,067,365 ($12,392,910) $2,674,455 82.25%
110024380 Milford Regional Medical Center $3,073,823 $6,686,325 $0 $65,393 $9,825,541 ($9,273,821) $551,720 94.38%
110026733 Milton Hospital $1,357,483 $2,252,520 $0 $24,253 $3,634,256 ($3,282,958) $351,298 90.33%
110090103 Morton Hospital $3,063,324 $8,721,976 $0 $57,933 $11,843,233 ($9,287,712) $2,555,521 78.42%
110024498 Mount Auburn Hospital $5,807,005 $10,524,488 $0 $105,161 $16,436,654 ($20,187,733) ($3,751,079) 122.82%
110026734 Nantucket Cottage Hospital $279,451 $1,358,988 $0 $12,008 $1,650,447 ($1,072,462) $577,985 64.98%
110088509 Nashoba Valley Hospital $521,232 $2,307,647 $0 $20,440 $2,849,319 ($2,938,780) ($89,461) 103.14%
110027274 Needham Hospital $449,144 $2,190,553 $0 $10,297 $2,649,994 ($2,271,430) $378,564 85.71%
110026367 New England Baptist Hospital $976,410 $509,594 $0 $124 $1,486,128 ($1,651,574) ($165,446) 111.13%
110026786 Newton-Wellesley Hospital $8,023,675 $5,768,438 $0 $139,337 $13,931,450 ($9,409,444) $4,522,006 67.54%
110072789 Noble Hospital $2,123,928 $3,719,297 $0 $32,533 $5,875,758 ($5,037,903) $837,855 85.74%
110026758 North Shore Medical Center $18,376,373 $21,107,309 $0 $223,156 $39,706,838 ($32,873,951) $6,832,887 82.79%
110087053 Norwood Hospital $4,847,447 $4,849,681 $0 $38,991 $9,736,119 ($7,891,561) $1,844,558 81.05%
110024453 Plymouth Hospital $3,841,478 $5,468,265 $0 $46,973 $9,356,716 ($7,639,270) $1,717,446 81.64%
110026781 Saint Vincent Hospital $11,478,008 $13,099,279 $0 $107,086 $24,684,373 ($22,853,086) $1,831,287 92.58%
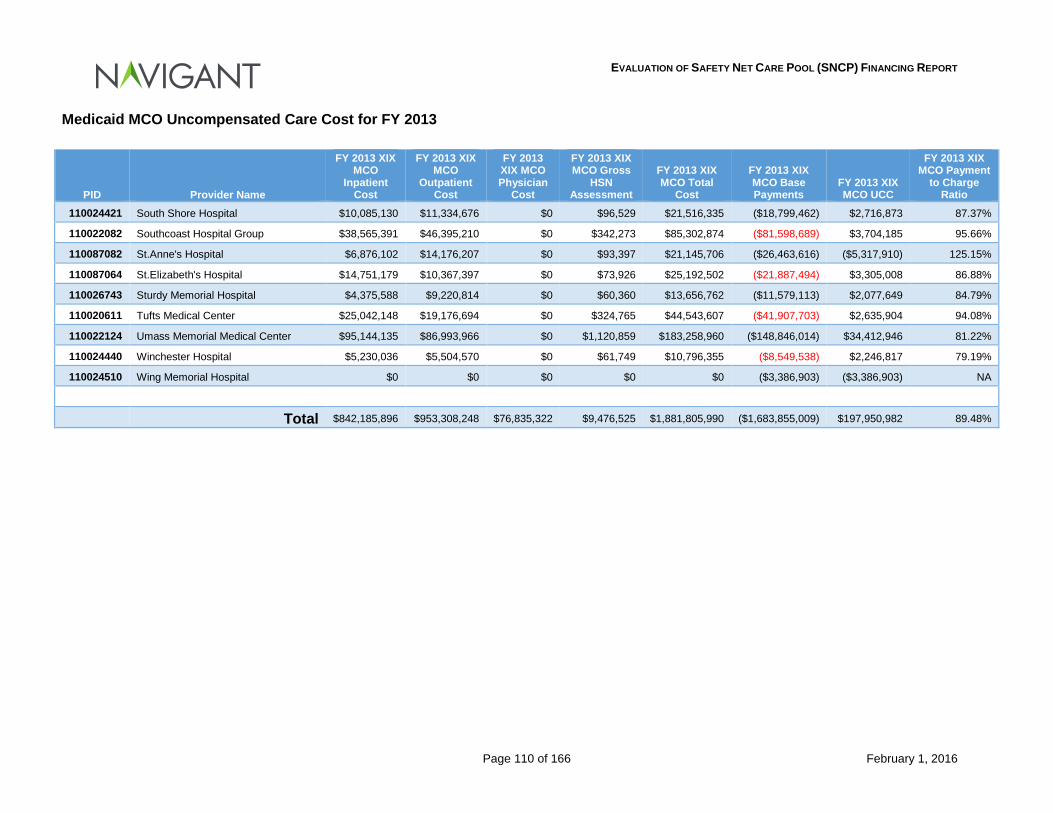
EVALUATION OF SAFETY NET CARE POOL (SNCP) FINANCING REPORT
Page 110 of 166 February 1, 2016
Medicaid MCO Uncompensated Care Cost for FY 2013
PID Provider Name
FY 2013 XIX MCO
Inpatient Cost
FY 2013 XIX MCO
Outpatient Cost
FY 2013 XIX MCO Physician
Cost
FY 2013 XIX MCO Gross
HSN Assessment
FY 2013 XIX MCO Total
Cost
FY 2013 XIX MCO Base Payments
FY 2013 XIX MCO UCC
FY 2013 XIX MCO Payment
to Charge Ratio
110024421 South Shore Hospital $10,085,130 $11,334,676 $0 $96,529 $21,516,335 ($18,799,462) $2,716,873 87.37%
110022082 Southcoast Hospital Group $38,565,391 $46,395,210 $0 $342,273 $85,302,874 ($81,598,689) $3,704,185 95.66%
110087082 St.Anne's Hospital $6,876,102 $14,176,207 $0 $93,397 $21,145,706 ($26,463,616) ($5,317,910) 125.15%
110087064 St.Elizabeth's Hospital $14,751,179 $10,367,397 $0 $73,926 $25,192,502 ($21,887,494) $3,305,008 86.88%
110026743 Sturdy Memorial Hospital $4,375,588 $9,220,814 $0 $60,360 $13,656,762 ($11,579,113) $2,077,649 84.79%
110020611 Tufts Medical Center $25,042,148 $19,176,694 $0 $324,765 $44,543,607 ($41,907,703) $2,635,904 94.08%
110022124 Umass Memorial Medical Center $95,144,135 $86,993,966 $0 $1,120,859 $183,258,960 ($148,846,014) $34,412,946 81.22%
110024440 Winchester Hospital $5,230,036 $5,504,570 $0 $61,749 $10,796,355 ($8,549,538) $2,246,817 79.19%
110024510 Wing Memorial Hospital $0 $0 $0 $0 $0 ($3,386,903) ($3,386,903) NA
Total $842,185,896 $953,308,248 $76,835,322 $9,476,525 $1,881,805,990 ($1,683,855,009) $197,950,982 89.48%
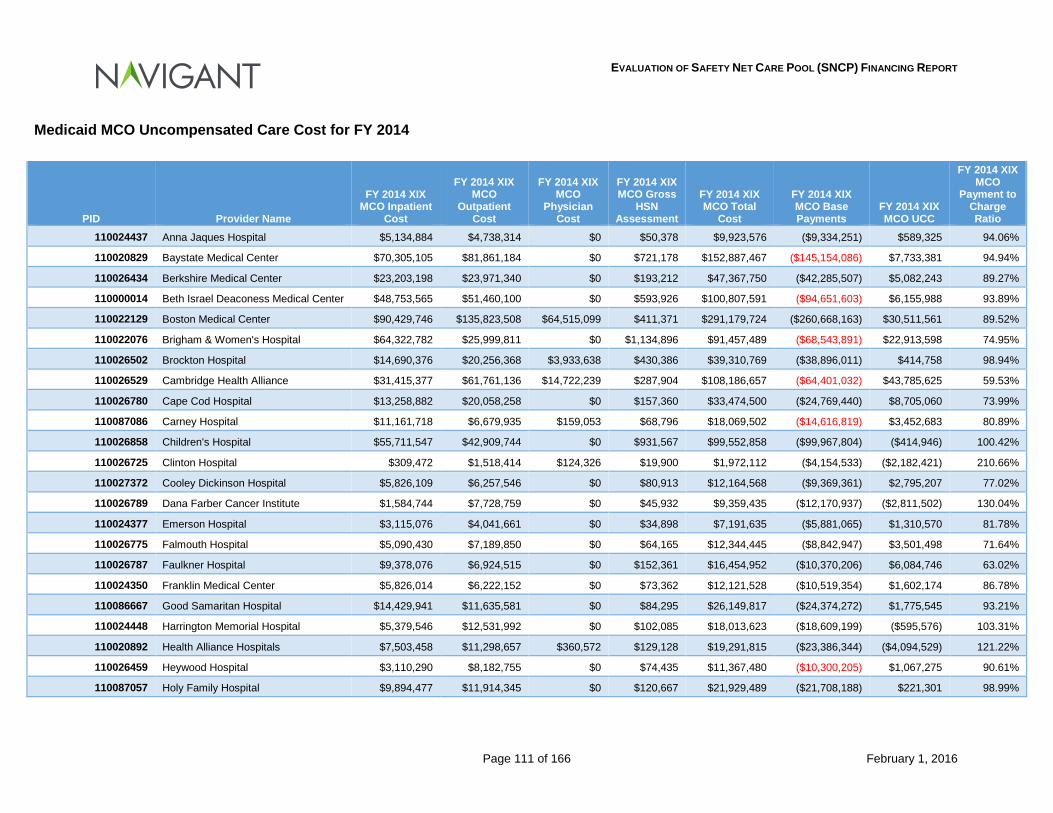
EVALUATION OF SAFETY NET CARE POOL (SNCP) FINANCING REPORT
Page 111 of 166 February 1, 2016
Medicaid MCO Uncompensated Care Cost for FY 2014
PID Provider Name
FY 2014 XIX MCO Inpatient
Cost
FY 2014 XIX MCO
Outpatient Cost
FY 2014 XIX MCO
Physician Cost
FY 2014 XIX MCO Gross
HSN Assessment
FY 2014 XIX MCO Total
Cost
FY 2014 XIX MCO Base Payments
FY 2014 XIX MCO UCC
FY 2014 XIX MCO
Payment to Charge Ratio
110024437 Anna Jaques Hospital $5,134,884 $4,738,314 $0 $50,378 $9,923,576 ($9,334,251) $589,325 94.06%
110020829 Baystate Medical Center $70,305,105 $81,861,184 $0 $721,178 $152,887,467 ($145,154,086) $7,733,381 94.94%
110026434 Berkshire Medical Center $23,203,198 $23,971,340 $0 $193,212 $47,367,750 ($42,285,507) $5,082,243 89.27%
110000014 Beth Israel Deaconess Medical Center $48,753,565 $51,460,100 $0 $593,926 $100,807,591 ($94,651,603) $6,155,988 93.89%
110022129 Boston Medical Center $90,429,746 $135,823,508 $64,515,099 $411,371 $291,179,724 ($260,668,163) $30,511,561 89.52%
110022076 Brigham & Women's Hospital $64,322,782 $25,999,811 $0 $1,134,896 $91,457,489 ($68,543,891) $22,913,598 74.95%
110026502 Brockton Hospital $14,690,376 $20,256,368 $3,933,638 $430,386 $39,310,769 ($38,896,011) $414,758 98.94%
110026529 Cambridge Health Alliance $31,415,377 $61,761,136 $14,722,239 $287,904 $108,186,657 ($64,401,032) $43,785,625 59.53%
110026780 Cape Cod Hospital $13,258,882 $20,058,258 $0 $157,360 $33,474,500 ($24,769,440) $8,705,060 73.99%
110087086 Carney Hospital $11,161,718 $6,679,935 $159,053 $68,796 $18,069,502 ($14,616,819) $3,452,683 80.89%
110026858 Children's Hospital $55,711,547 $42,909,744 $0 $931,567 $99,552,858 ($99,967,804) ($414,946) 100.42%
110026725 Clinton Hospital $309,472 $1,518,414 $124,326 $19,900 $1,972,112 ($4,154,533) ($2,182,421) 210.66%
110027372 Cooley Dickinson Hospital $5,826,109 $6,257,546 $0 $80,913 $12,164,568 ($9,369,361) $2,795,207 77.02%
110026789 Dana Farber Cancer Institute $1,584,744 $7,728,759 $0 $45,932 $9,359,435 ($12,170,937) ($2,811,502) 130.04%
110024377 Emerson Hospital $3,115,076 $4,041,661 $0 $34,898 $7,191,635 ($5,881,065) $1,310,570 81.78%
110026775 Falmouth Hospital $5,090,430 $7,189,850 $0 $64,165 $12,344,445 ($8,842,947) $3,501,498 71.64%
110026787 Faulkner Hospital $9,378,076 $6,924,515 $0 $152,361 $16,454,952 ($10,370,206) $6,084,746 63.02%
110024350 Franklin Medical Center $5,826,014 $6,222,152 $0 $73,362 $12,121,528 ($10,519,354) $1,602,174 86.78%
110086667 Good Samaritan Hospital $14,429,941 $11,635,581 $0 $84,295 $26,149,817 ($24,374,272) $1,775,545 93.21%
110024448 Harrington Memorial Hospital $5,379,546 $12,531,992 $0 $102,085 $18,013,623 ($18,609,199) ($595,576) 103.31%
110020892 Health Alliance Hospitals $7,503,458 $11,298,657 $360,572 $129,128 $19,291,815 ($23,386,344) ($4,094,529) 121.22%
110026459 Heywood Hospital $3,110,290 $8,182,755 $0 $74,435 $11,367,480 ($10,300,205) $1,067,275 90.61%
110087057 Holy Family Hospital $9,894,477 $11,914,345 $0 $120,667 $21,929,489 ($21,708,188) $221,301 98.99%
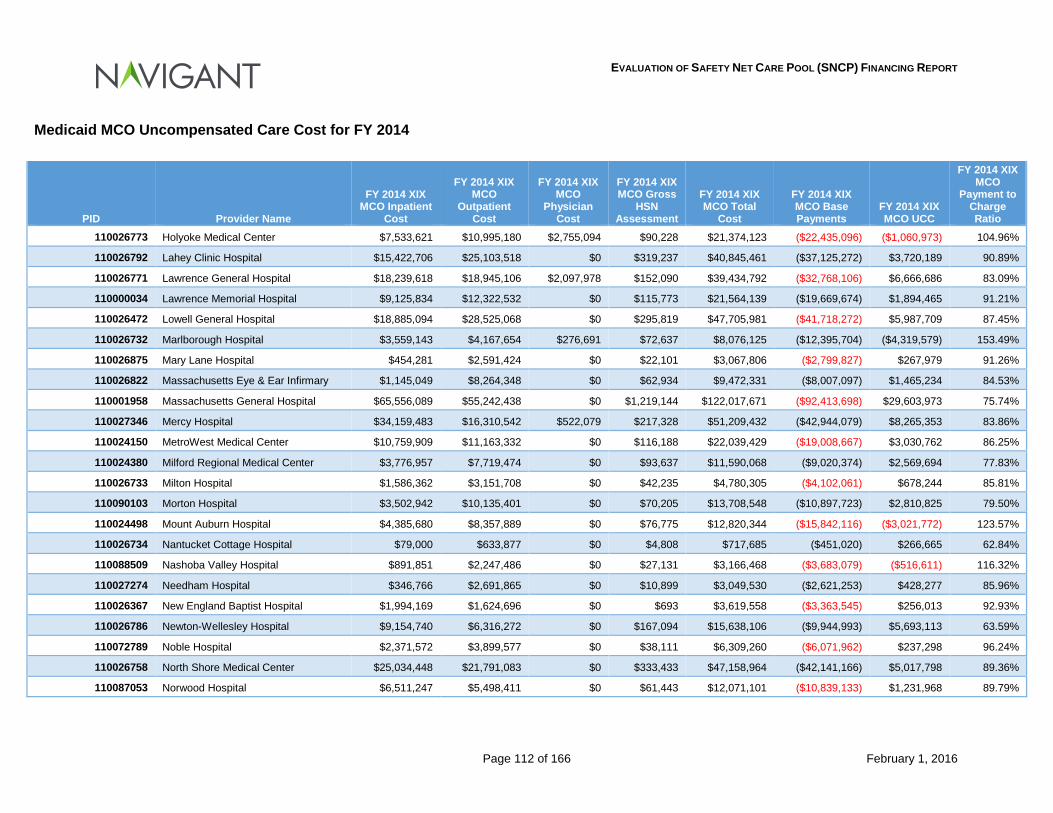
EVALUATION OF SAFETY NET CARE POOL (SNCP) FINANCING REPORT
Page 112 of 166 February 1, 2016
Medicaid MCO Uncompensated Care Cost for FY 2014
PID Provider Name
FY 2014 XIX MCO Inpatient
Cost
FY 2014 XIX MCO
Outpatient Cost
FY 2014 XIX MCO
Physician Cost
FY 2014 XIX MCO Gross
HSN Assessment
FY 2014 XIX MCO Total
Cost
FY 2014 XIX MCO Base Payments
FY 2014 XIX MCO UCC
FY 2014 XIX MCO
Payment to Charge Ratio
110026773 Holyoke Medical Center $7,533,621 $10,995,180 $2,755,094 $90,228 $21,374,123 ($22,435,096) ($1,060,973) 104.96%
110026792 Lahey Clinic Hospital $15,422,706 $25,103,518 $0 $319,237 $40,845,461 ($37,125,272) $3,720,189 90.89%
110026771 Lawrence General Hospital $18,239,618 $18,945,106 $2,097,978 $152,090 $39,434,792 ($32,768,106) $6,666,686 83.09%
110000034 Lawrence Memorial Hospital $9,125,834 $12,322,532 $0 $115,773 $21,564,139 ($19,669,674) $1,894,465 91.21%
110026472 Lowell General Hospital $18,885,094 $28,525,068 $0 $295,819 $47,705,981 ($41,718,272) $5,987,709 87.45%
110026732 Marlborough Hospital $3,559,143 $4,167,654 $276,691 $72,637 $8,076,125 ($12,395,704) ($4,319,579) 153.49%
110026875 Mary Lane Hospital $454,281 $2,591,424 $0 $22,101 $3,067,806 ($2,799,827) $267,979 91.26%
110026822 Massachusetts Eye & Ear Infirmary $1,145,049 $8,264,348 $0 $62,934 $9,472,331 ($8,007,097) $1,465,234 84.53%
110001958 Massachusetts General Hospital $65,556,089 $55,242,438 $0 $1,219,144 $122,017,671 ($92,413,698) $29,603,973 75.74%
110027346 Mercy Hospital $34,159,483 $16,310,542 $522,079 $217,328 $51,209,432 ($42,944,079) $8,265,353 83.86%
110024150 MetroWest Medical Center $10,759,909 $11,163,332 $0 $116,188 $22,039,429 ($19,008,667) $3,030,762 86.25%
110024380 Milford Regional Medical Center $3,776,957 $7,719,474 $0 $93,637 $11,590,068 ($9,020,374) $2,569,694 77.83%
110026733 Milton Hospital $1,586,362 $3,151,708 $0 $42,235 $4,780,305 ($4,102,061) $678,244 85.81%
110090103 Morton Hospital $3,502,942 $10,135,401 $0 $70,205 $13,708,548 ($10,897,723) $2,810,825 79.50%
110024498 Mount Auburn Hospital $4,385,680 $8,357,889 $0 $76,775 $12,820,344 ($15,842,116) ($3,021,772) 123.57%
110026734 Nantucket Cottage Hospital $79,000 $633,877 $0 $4,808 $717,685 ($451,020) $266,665 62.84%
110088509 Nashoba Valley Hospital $891,851 $2,247,486 $0 $27,131 $3,166,468 ($3,683,079) ($516,611) 116.32%
110027274 Needham Hospital $346,766 $2,691,865 $0 $10,899 $3,049,530 ($2,621,253) $428,277 85.96%
110026367 New England Baptist Hospital $1,994,169 $1,624,696 $0 $693 $3,619,558 ($3,363,545) $256,013 92.93%
110026786 Newton-Wellesley Hospital $9,154,740 $6,316,272 $0 $167,094 $15,638,106 ($9,944,993) $5,693,113 63.59%
110072789 Noble Hospital $2,371,572 $3,899,577 $0 $38,111 $6,309,260 ($6,071,962) $237,298 96.24%
110026758 North Shore Medical Center $25,034,448 $21,791,083 $0 $333,433 $47,158,964 ($42,141,166) $5,017,798 89.36%
110087053 Norwood Hospital $6,511,247 $5,498,411 $0 $61,443 $12,071,101 ($10,839,133) $1,231,968 89.79%
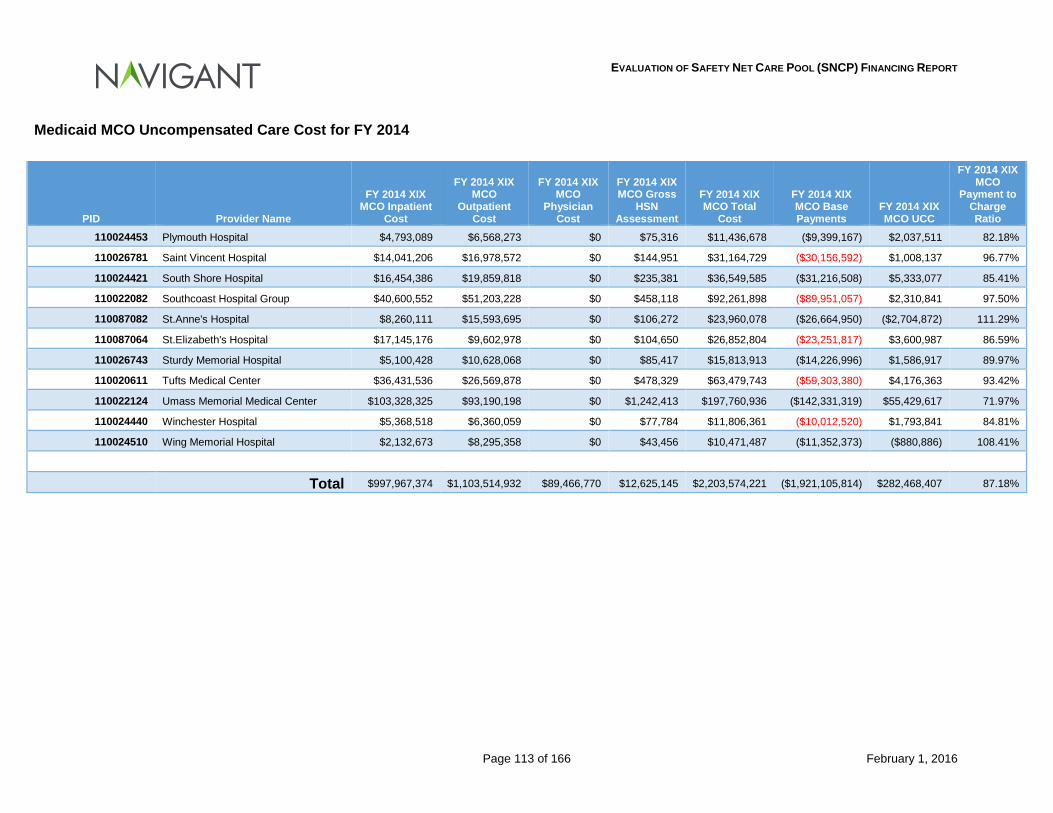
EVALUATION OF SAFETY NET CARE POOL (SNCP) FINANCING REPORT
Page 113 of 166 February 1, 2016
Medicaid MCO Uncompensated Care Cost for FY 2014
PID Provider Name
FY 2014 XIX MCO Inpatient
Cost
FY 2014 XIX MCO
Outpatient Cost
FY 2014 XIX MCO
Physician Cost
FY 2014 XIX MCO Gross
HSN Assessment
FY 2014 XIX MCO Total
Cost
FY 2014 XIX MCO Base Payments
FY 2014 XIX MCO UCC
FY 2014 XIX MCO
Payment to Charge Ratio
110024453 Plymouth Hospital $4,793,089 $6,568,273 $0 $75,316 $11,436,678 ($9,399,167) $2,037,511 82.18%
110026781 Saint Vincent Hospital $14,041,206 $16,978,572 $0 $144,951 $31,164,729 ($30,156,592) $1,008,137 96.77%
110024421 South Shore Hospital $16,454,386 $19,859,818 $0 $235,381 $36,549,585 ($31,216,508) $5,333,077 85.41%
110022082 Southcoast Hospital Group $40,600,552 $51,203,228 $0 $458,118 $92,261,898 ($89,951,057) $2,310,841 97.50%
110087082 St.Anne's Hospital $8,260,111 $15,593,695 $0 $106,272 $23,960,078 ($26,664,950) ($2,704,872) 111.29%
110087064 St.Elizabeth's Hospital $17,145,176 $9,602,978 $0 $104,650 $26,852,804 ($23,251,817) $3,600,987 86.59%
110026743 Sturdy Memorial Hospital $5,100,428 $10,628,068 $0 $85,417 $15,813,913 ($14,226,996) $1,586,917 89.97%
110020611 Tufts Medical Center $36,431,536 $26,569,878 $0 $478,329 $63,479,743 ($59,303,380) $4,176,363 93.42%
110022124 Umass Memorial Medical Center $103,328,325 $93,190,198 $0 $1,242,413 $197,760,936 ($142,331,319) $55,429,617 71.97%
110024440 Winchester Hospital $5,368,518 $6,360,059 $0 $77,784 $11,806,361 ($10,012,520) $1,793,841 84.81%
110024510 Wing Memorial Hospital $2,132,673 $8,295,358 $0 $43,456 $10,471,487 ($11,352,373) ($880,886) 108.41%
Total $997,967,374 $1,103,514,932 $89,466,770 $12,625,145 $2,203,574,221 ($1,921,105,814) $282,468,407 87.18%
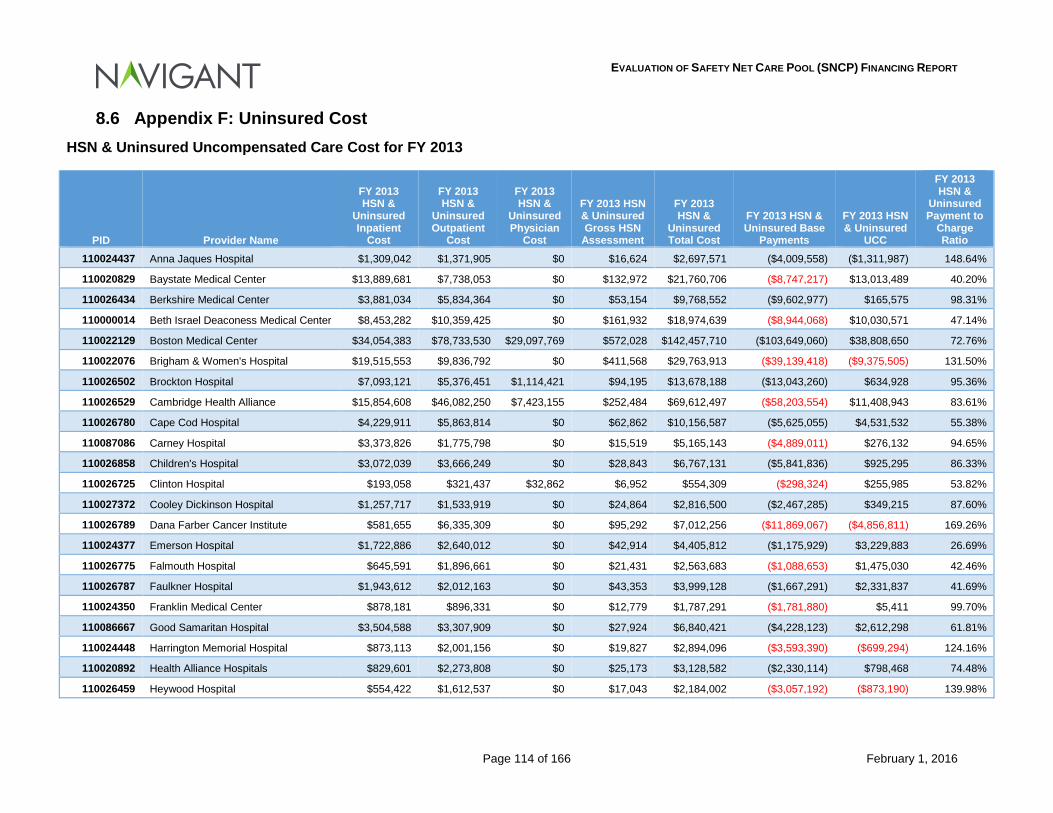
EVALUATION OF SAFETY NET CARE POOL (SNCP) FINANCING REPORT
Page 114 of 166 February 1, 2016
8.6 Appendix F: Uninsured Cost HSN & Uninsured Uncompensated Care Cost for FY 2013
PID Provider Name
FY 2013 HSN &
Uninsured Inpatient
Cost
FY 2013 HSN &
Uninsured Outpatient
Cost
FY 2013 HSN &
Uninsured Physician
Cost
FY 2013 HSN & Uninsured Gross HSN
Assessment
FY 2013 HSN &
Uninsured Total Cost
FY 2013 HSN & Uninsured Base
Payments
FY 2013 HSN & Uninsured
UCC
FY 2013 HSN &
Uninsured Payment to
Charge Ratio
110024437 Anna Jaques Hospital $1,309,042 $1,371,905 $0 $16,624 $2,697,571 ($4,009,558) ($1,311,987) 148.64%
110020829 Baystate Medical Center $13,889,681 $7,738,053 $0 $132,972 $21,760,706 ($8,747,217) $13,013,489 40.20%
110026434 Berkshire Medical Center $3,881,034 $5,834,364 $0 $53,154 $9,768,552 ($9,602,977) $165,575 98.31%
110000014 Beth Israel Deaconess Medical Center $8,453,282 $10,359,425 $0 $161,932 $18,974,639 ($8,944,068) $10,030,571 47.14%
110022129 Boston Medical Center $34,054,383 $78,733,530 $29,097,769 $572,028 $142,457,710 ($103,649,060) $38,808,650 72.76%
110022076 Brigham & Women's Hospital $19,515,553 $9,836,792 $0 $411,568 $29,763,913 ($39,139,418) ($9,375,505) 131.50%
110026502 Brockton Hospital $7,093,121 $5,376,451 $1,114,421 $94,195 $13,678,188 ($13,043,260) $634,928 95.36%
110026529 Cambridge Health Alliance $15,854,608 $46,082,250 $7,423,155 $252,484 $69,612,497 ($58,203,554) $11,408,943 83.61%
110026780 Cape Cod Hospital $4,229,911 $5,863,814 $0 $62,862 $10,156,587 ($5,625,055) $4,531,532 55.38%
110087086 Carney Hospital $3,373,826 $1,775,798 $0 $15,519 $5,165,143 ($4,889,011) $276,132 94.65%
110026858 Children's Hospital $3,072,039 $3,666,249 $0 $28,843 $6,767,131 ($5,841,836) $925,295 86.33%
110026725 Clinton Hospital $193,058 $321,437 $32,862 $6,952 $554,309 ($298,324) $255,985 53.82%
110027372 Cooley Dickinson Hospital $1,257,717 $1,533,919 $0 $24,864 $2,816,500 ($2,467,285) $349,215 87.60%
110026789 Dana Farber Cancer Institute $581,655 $6,335,309 $0 $95,292 $7,012,256 ($11,869,067) ($4,856,811) 169.26%
110024377 Emerson Hospital $1,722,886 $2,640,012 $0 $42,914 $4,405,812 ($1,175,929) $3,229,883 26.69%
110026775 Falmouth Hospital $645,591 $1,896,661 $0 $21,431 $2,563,683 ($1,088,653) $1,475,030 42.46%
110026787 Faulkner Hospital $1,943,612 $2,012,163 $0 $43,353 $3,999,128 ($1,667,291) $2,331,837 41.69%
110024350 Franklin Medical Center $878,181 $896,331 $0 $12,779 $1,787,291 ($1,781,880) $5,411 99.70%
110086667 Good Samaritan Hospital $3,504,588 $3,307,909 $0 $27,924 $6,840,421 ($4,228,123) $2,612,298 61.81%
110024448 Harrington Memorial Hospital $873,113 $2,001,156 $0 $19,827 $2,894,096 ($3,593,390) ($699,294) 124.16%
110020892 Health Alliance Hospitals $829,601 $2,273,808 $0 $25,173 $3,128,582 ($2,330,114) $798,468 74.48%
110026459 Heywood Hospital $554,422 $1,612,537 $0 $17,043 $2,184,002 ($3,057,192) ($873,190) 139.98%
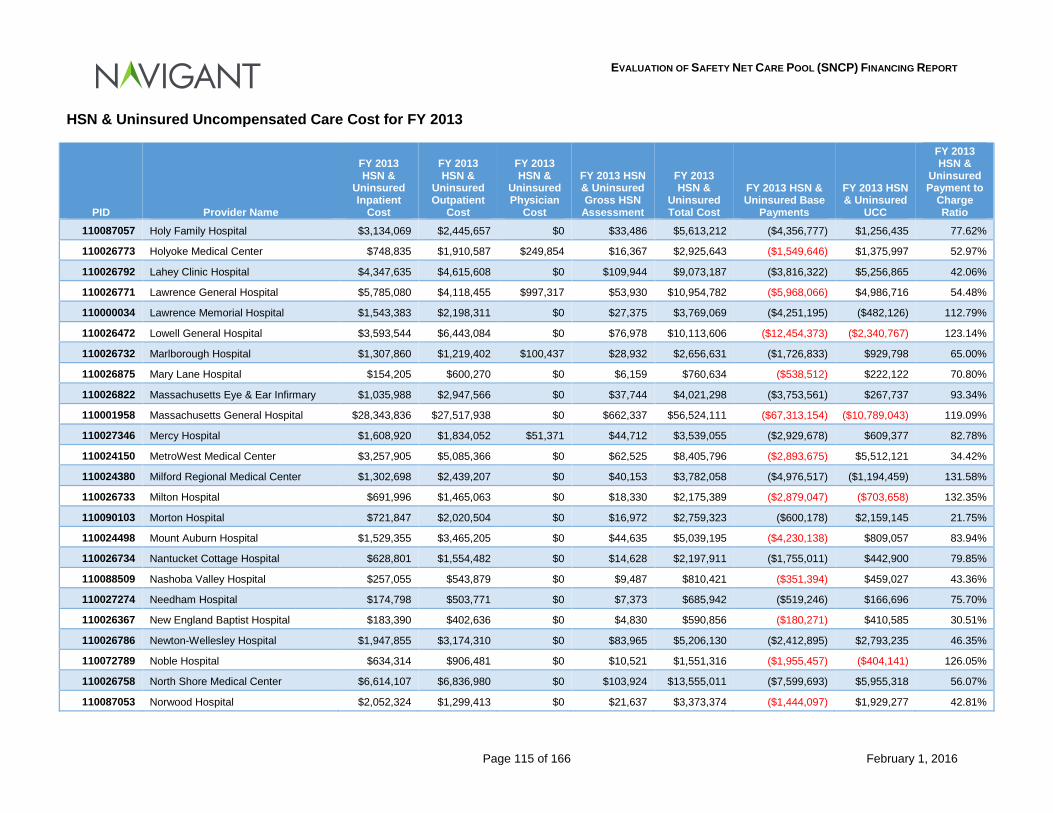
EVALUATION OF SAFETY NET CARE POOL (SNCP) FINANCING REPORT
Page 115 of 166 February 1, 2016
HSN & Uninsured Uncompensated Care Cost for FY 2013
PID Provider Name
FY 2013 HSN &
Uninsured Inpatient
Cost
FY 2013 HSN &
Uninsured Outpatient
Cost
FY 2013 HSN &
Uninsured Physician
Cost
FY 2013 HSN & Uninsured Gross HSN
Assessment
FY 2013 HSN &
Uninsured Total Cost
FY 2013 HSN & Uninsured Base
Payments
FY 2013 HSN & Uninsured
UCC
FY 2013 HSN &
Uninsured Payment to
Charge Ratio
110087057 Holy Family Hospital $3,134,069 $2,445,657 $0 $33,486 $5,613,212 ($4,356,777) $1,256,435 77.62%
110026773 Holyoke Medical Center $748,835 $1,910,587 $249,854 $16,367 $2,925,643 ($1,549,646) $1,375,997 52.97%
110026792 Lahey Clinic Hospital $4,347,635 $4,615,608 $0 $109,944 $9,073,187 ($3,816,322) $5,256,865 42.06%
110026771 Lawrence General Hospital $5,785,080 $4,118,455 $997,317 $53,930 $10,954,782 ($5,968,066) $4,986,716 54.48%
110000034 Lawrence Memorial Hospital $1,543,383 $2,198,311 $0 $27,375 $3,769,069 ($4,251,195) ($482,126) 112.79%
110026472 Lowell General Hospital $3,593,544 $6,443,084 $0 $76,978 $10,113,606 ($12,454,373) ($2,340,767) 123.14%
110026732 Marlborough Hospital $1,307,860 $1,219,402 $100,437 $28,932 $2,656,631 ($1,726,833) $929,798 65.00%
110026875 Mary Lane Hospital $154,205 $600,270 $0 $6,159 $760,634 ($538,512) $222,122 70.80%
110026822 Massachusetts Eye & Ear Infirmary $1,035,988 $2,947,566 $0 $37,744 $4,021,298 ($3,753,561) $267,737 93.34%
110001958 Massachusetts General Hospital $28,343,836 $27,517,938 $0 $662,337 $56,524,111 ($67,313,154) ($10,789,043) 119.09%
110027346 Mercy Hospital $1,608,920 $1,834,052 $51,371 $44,712 $3,539,055 ($2,929,678) $609,377 82.78%
110024150 MetroWest Medical Center $3,257,905 $5,085,366 $0 $62,525 $8,405,796 ($2,893,675) $5,512,121 34.42%
110024380 Milford Regional Medical Center $1,302,698 $2,439,207 $0 $40,153 $3,782,058 ($4,976,517) ($1,194,459) 131.58%
110026733 Milton Hospital $691,996 $1,465,063 $0 $18,330 $2,175,389 ($2,879,047) ($703,658) 132.35%
110090103 Morton Hospital $721,847 $2,020,504 $0 $16,972 $2,759,323 ($600,178) $2,159,145 21.75%
110024498 Mount Auburn Hospital $1,529,355 $3,465,205 $0 $44,635 $5,039,195 ($4,230,138) $809,057 83.94%
110026734 Nantucket Cottage Hospital $628,801 $1,554,482 $0 $14,628 $2,197,911 ($1,755,011) $442,900 79.85%
110088509 Nashoba Valley Hospital $257,055 $543,879 $0 $9,487 $810,421 ($351,394) $459,027 43.36%
110027274 Needham Hospital $174,798 $503,771 $0 $7,373 $685,942 ($519,246) $166,696 75.70%
110026367 New England Baptist Hospital $183,390 $402,636 $0 $4,830 $590,856 ($180,271) $410,585 30.51%
110026786 Newton-Wellesley Hospital $1,947,855 $3,174,310 $0 $83,965 $5,206,130 ($2,412,895) $2,793,235 46.35%
110072789 Noble Hospital $634,314 $906,481 $0 $10,521 $1,551,316 ($1,955,457) ($404,141) 126.05%
110026758 North Shore Medical Center $6,614,107 $6,836,980 $0 $103,924 $13,555,011 ($7,599,693) $5,955,318 56.07%
110087053 Norwood Hospital $2,052,324 $1,299,413 $0 $21,637 $3,373,374 ($1,444,097) $1,929,277 42.81%
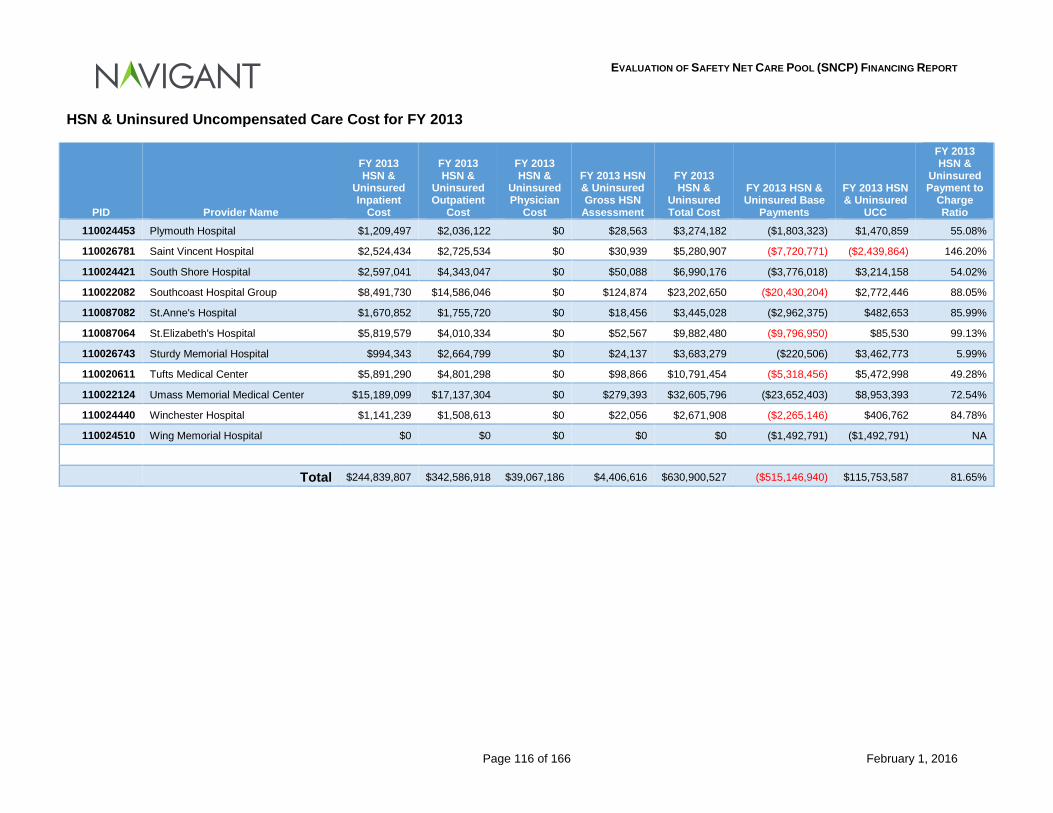
EVALUATION OF SAFETY NET CARE POOL (SNCP) FINANCING REPORT
Page 116 of 166 February 1, 2016
HSN & Uninsured Uncompensated Care Cost for FY 2013
PID Provider Name
FY 2013 HSN &
Uninsured Inpatient
Cost
FY 2013 HSN &
Uninsured Outpatient
Cost
FY 2013 HSN &
Uninsured Physician
Cost
FY 2013 HSN & Uninsured Gross HSN
Assessment
FY 2013 HSN &
Uninsured Total Cost
FY 2013 HSN & Uninsured Base
Payments
FY 2013 HSN & Uninsured
UCC
FY 2013 HSN &
Uninsured Payment to
Charge Ratio
110024453 Plymouth Hospital $1,209,497 $2,036,122 $0 $28,563 $3,274,182 ($1,803,323) $1,470,859 55.08%
110026781 Saint Vincent Hospital $2,524,434 $2,725,534 $0 $30,939 $5,280,907 ($7,720,771) ($2,439,864) 146.20%
110024421 South Shore Hospital $2,597,041 $4,343,047 $0 $50,088 $6,990,176 ($3,776,018) $3,214,158 54.02%
110022082 Southcoast Hospital Group $8,491,730 $14,586,046 $0 $124,874 $23,202,650 ($20,430,204) $2,772,446 88.05%
110087082 St.Anne's Hospital $1,670,852 $1,755,720 $0 $18,456 $3,445,028 ($2,962,375) $482,653 85.99%
110087064 St.Elizabeth's Hospital $5,819,579 $4,010,334 $0 $52,567 $9,882,480 ($9,796,950) $85,530 99.13%
110026743 Sturdy Memorial Hospital $994,343 $2,664,799 $0 $24,137 $3,683,279 ($220,506) $3,462,773 5.99%
110020611 Tufts Medical Center $5,891,290 $4,801,298 $0 $98,866 $10,791,454 ($5,318,456) $5,472,998 49.28%
110022124 Umass Memorial Medical Center $15,189,099 $17,137,304 $0 $279,393 $32,605,796 ($23,652,403) $8,953,393 72.54%
110024440 Winchester Hospital $1,141,239 $1,508,613 $0 $22,056 $2,671,908 ($2,265,146) $406,762 84.78%
110024510 Wing Memorial Hospital $0 $0 $0 $0 $0 ($1,492,791) ($1,492,791) NA
Total $244,839,807 $342,586,918 $39,067,186 $4,406,616 $630,900,527 ($515,146,940) $115,753,587 81.65%
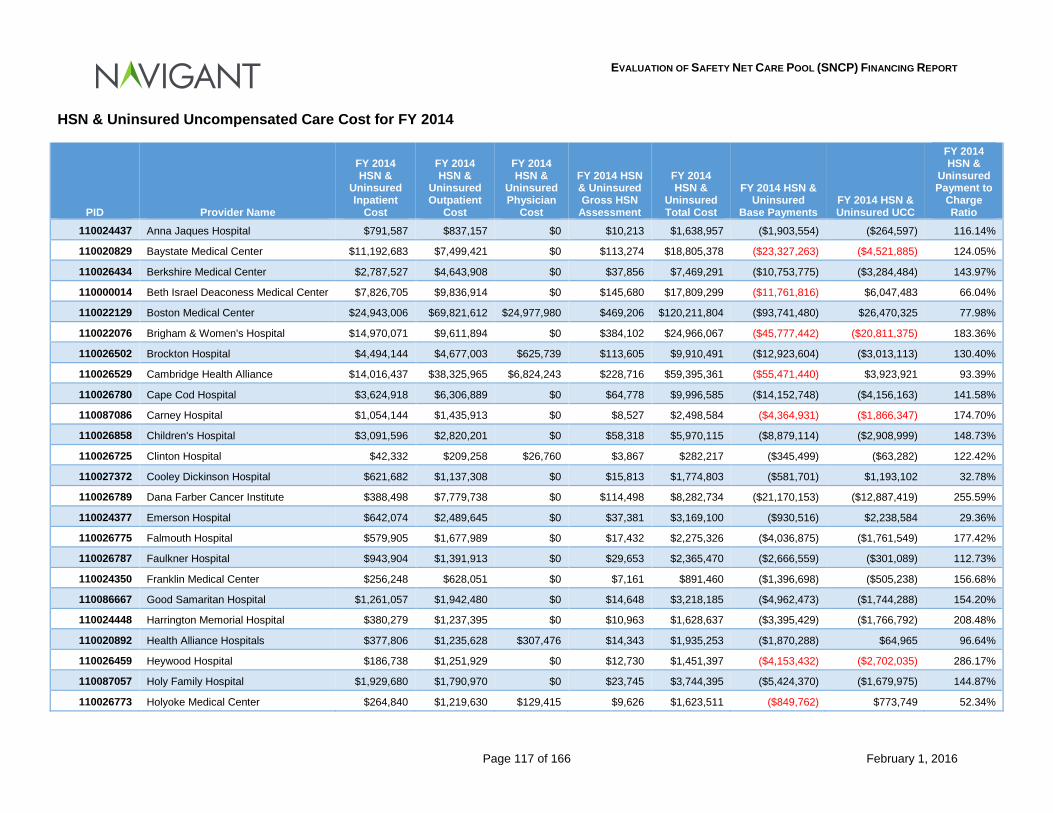
EVALUATION OF SAFETY NET CARE POOL (SNCP) FINANCING REPORT
Page 117 of 166 February 1, 2016
HSN & Uninsured Uncompensated Care Cost for FY 2014
PID Provider Name
FY 2014 HSN &
Uninsured Inpatient
Cost
FY 2014 HSN &
Uninsured Outpatient
Cost
FY 2014 HSN &
Uninsured Physician
Cost
FY 2014 HSN & Uninsured Gross HSN
Assessment
FY 2014 HSN &
Uninsured Total Cost
FY 2014 HSN & Uninsured
Base Payments FY 2014 HSN & Uninsured UCC
FY 2014 HSN &
Uninsured Payment to
Charge Ratio
110024437 Anna Jaques Hospital $791,587 $837,157 $0 $10,213 $1,638,957 ($1,903,554) ($264,597) 116.14%
110020829 Baystate Medical Center $11,192,683 $7,499,421 $0 $113,274 $18,805,378 ($23,327,263) ($4,521,885) 124.05%
110026434 Berkshire Medical Center $2,787,527 $4,643,908 $0 $37,856 $7,469,291 ($10,753,775) ($3,284,484) 143.97%
110000014 Beth Israel Deaconess Medical Center $7,826,705 $9,836,914 $0 $145,680 $17,809,299 ($11,761,816) $6,047,483 66.04%
110022129 Boston Medical Center $24,943,006 $69,821,612 $24,977,980 $469,206 $120,211,804 ($93,741,480) $26,470,325 77.98%
110022076 Brigham & Women's Hospital $14,970,071 $9,611,894 $0 $384,102 $24,966,067 ($45,777,442) ($20,811,375) 183.36%
110026502 Brockton Hospital $4,494,144 $4,677,003 $625,739 $113,605 $9,910,491 ($12,923,604) ($3,013,113) 130.40%
110026529 Cambridge Health Alliance $14,016,437 $38,325,965 $6,824,243 $228,716 $59,395,361 ($55,471,440) $3,923,921 93.39%
110026780 Cape Cod Hospital $3,624,918 $6,306,889 $0 $64,778 $9,996,585 ($14,152,748) ($4,156,163) 141.58%
110087086 Carney Hospital $1,054,144 $1,435,913 $0 $8,527 $2,498,584 ($4,364,931) ($1,866,347) 174.70%
110026858 Children's Hospital $3,091,596 $2,820,201 $0 $58,318 $5,970,115 ($8,879,114) ($2,908,999) 148.73%
110026725 Clinton Hospital $42,332 $209,258 $26,760 $3,867 $282,217 ($345,499) ($63,282) 122.42%
110027372 Cooley Dickinson Hospital $621,682 $1,137,308 $0 $15,813 $1,774,803 ($581,701) $1,193,102 32.78%
110026789 Dana Farber Cancer Institute $388,498 $7,779,738 $0 $114,498 $8,282,734 ($21,170,153) ($12,887,419) 255.59%
110024377 Emerson Hospital $642,074 $2,489,645 $0 $37,381 $3,169,100 ($930,516) $2,238,584 29.36%
110026775 Falmouth Hospital $579,905 $1,677,989 $0 $17,432 $2,275,326 ($4,036,875) ($1,761,549) 177.42%
110026787 Faulkner Hospital $943,904 $1,391,913 $0 $29,653 $2,365,470 ($2,666,559) ($301,089) 112.73%
110024350 Franklin Medical Center $256,248 $628,051 $0 $7,161 $891,460 ($1,396,698) ($505,238) 156.68%
110086667 Good Samaritan Hospital $1,261,057 $1,942,480 $0 $14,648 $3,218,185 ($4,962,473) ($1,744,288) 154.20%
110024448 Harrington Memorial Hospital $380,279 $1,237,395 $0 $10,963 $1,628,637 ($3,395,429) ($1,766,792) 208.48%
110020892 Health Alliance Hospitals $377,806 $1,235,628 $307,476 $14,343 $1,935,253 ($1,870,288) $64,965 96.64%
110026459 Heywood Hospital $186,738 $1,251,929 $0 $12,730 $1,451,397 ($4,153,432) ($2,702,035) 286.17%
110087057 Holy Family Hospital $1,929,680 $1,790,970 $0 $23,745 $3,744,395 ($5,424,370) ($1,679,975) 144.87%
110026773 Holyoke Medical Center $264,840 $1,219,630 $129,415 $9,626 $1,623,511 ($849,762) $773,749 52.34%
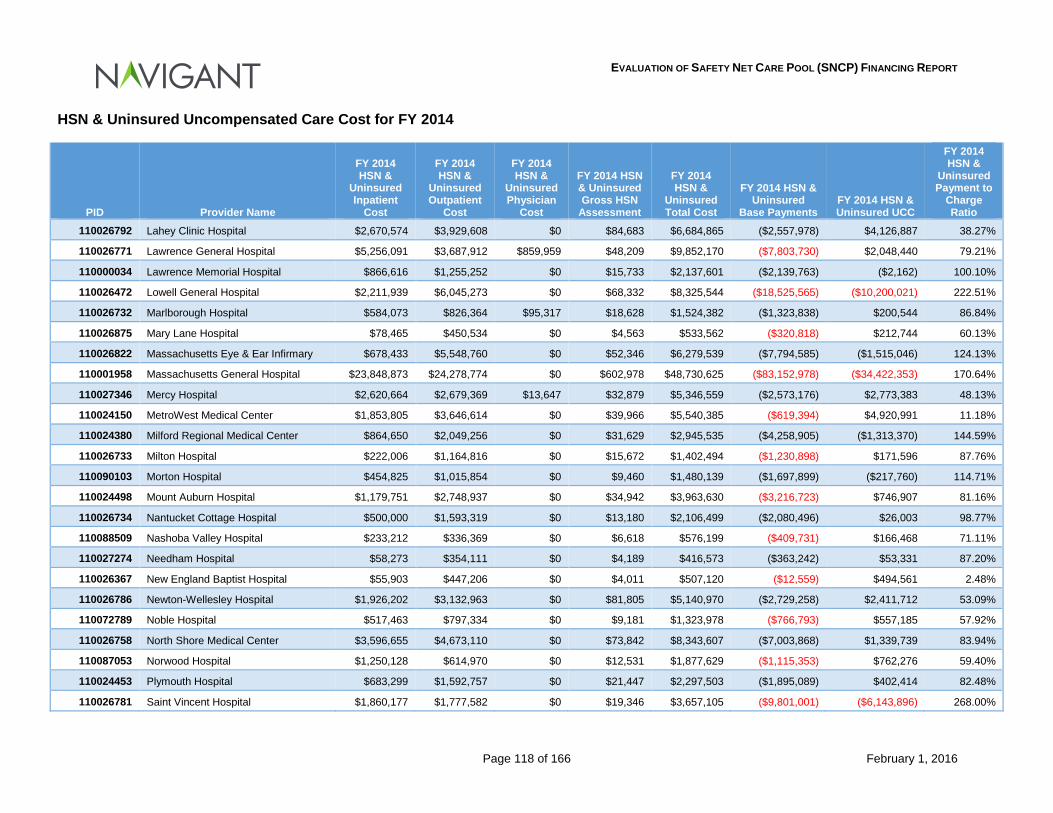
EVALUATION OF SAFETY NET CARE POOL (SNCP) FINANCING REPORT
Page 118 of 166 February 1, 2016
HSN & Uninsured Uncompensated Care Cost for FY 2014
PID Provider Name
FY 2014 HSN &
Uninsured Inpatient
Cost
FY 2014 HSN &
Uninsured Outpatient
Cost
FY 2014 HSN &
Uninsured Physician
Cost
FY 2014 HSN & Uninsured Gross HSN
Assessment
FY 2014 HSN &
Uninsured Total Cost
FY 2014 HSN & Uninsured
Base Payments FY 2014 HSN & Uninsured UCC
FY 2014 HSN &
Uninsured Payment to
Charge Ratio
110026792 Lahey Clinic Hospital $2,670,574 $3,929,608 $0 $84,683 $6,684,865 ($2,557,978) $4,126,887 38.27%
110026771 Lawrence General Hospital $5,256,091 $3,687,912 $859,959 $48,209 $9,852,170 ($7,803,730) $2,048,440 79.21%
110000034 Lawrence Memorial Hospital $866,616 $1,255,252 $0 $15,733 $2,137,601 ($2,139,763) ($2,162) 100.10%
110026472 Lowell General Hospital $2,211,939 $6,045,273 $0 $68,332 $8,325,544 ($18,525,565) ($10,200,021) 222.51%
110026732 Marlborough Hospital $584,073 $826,364 $95,317 $18,628 $1,524,382 ($1,323,838) $200,544 86.84%
110026875 Mary Lane Hospital $78,465 $450,534 $0 $4,563 $533,562 ($320,818) $212,744 60.13%
110026822 Massachusetts Eye & Ear Infirmary $678,433 $5,548,760 $0 $52,346 $6,279,539 ($7,794,585) ($1,515,046) 124.13%
110001958 Massachusetts General Hospital $23,848,873 $24,278,774 $0 $602,978 $48,730,625 ($83,152,978) ($34,422,353) 170.64%
110027346 Mercy Hospital $2,620,664 $2,679,369 $13,647 $32,879 $5,346,559 ($2,573,176) $2,773,383 48.13%
110024150 MetroWest Medical Center $1,853,805 $3,646,614 $0 $39,966 $5,540,385 ($619,394) $4,920,991 11.18%
110024380 Milford Regional Medical Center $864,650 $2,049,256 $0 $31,629 $2,945,535 ($4,258,905) ($1,313,370) 144.59%
110026733 Milton Hospital $222,006 $1,164,816 $0 $15,672 $1,402,494 ($1,230,898) $171,596 87.76%
110090103 Morton Hospital $454,825 $1,015,854 $0 $9,460 $1,480,139 ($1,697,899) ($217,760) 114.71%
110024498 Mount Auburn Hospital $1,179,751 $2,748,937 $0 $34,942 $3,963,630 ($3,216,723) $746,907 81.16%
110026734 Nantucket Cottage Hospital $500,000 $1,593,319 $0 $13,180 $2,106,499 ($2,080,496) $26,003 98.77%
110088509 Nashoba Valley Hospital $233,212 $336,369 $0 $6,618 $576,199 ($409,731) $166,468 71.11%
110027274 Needham Hospital $58,273 $354,111 $0 $4,189 $416,573 ($363,242) $53,331 87.20%
110026367 New England Baptist Hospital $55,903 $447,206 $0 $4,011 $507,120 ($12,559) $494,561 2.48%
110026786 Newton-Wellesley Hospital $1,926,202 $3,132,963 $0 $81,805 $5,140,970 ($2,729,258) $2,411,712 53.09%
110072789 Noble Hospital $517,463 $797,334 $0 $9,181 $1,323,978 ($766,793) $557,185 57.92%
110026758 North Shore Medical Center $3,596,655 $4,673,110 $0 $73,842 $8,343,607 ($7,003,868) $1,339,739 83.94%
110087053 Norwood Hospital $1,250,128 $614,970 $0 $12,531 $1,877,629 ($1,115,353) $762,276 59.40%
110024453 Plymouth Hospital $683,299 $1,592,757 $0 $21,447 $2,297,503 ($1,895,089) $402,414 82.48%
110026781 Saint Vincent Hospital $1,860,177 $1,777,582 $0 $19,346 $3,657,105 ($9,801,001) ($6,143,896) 268.00%
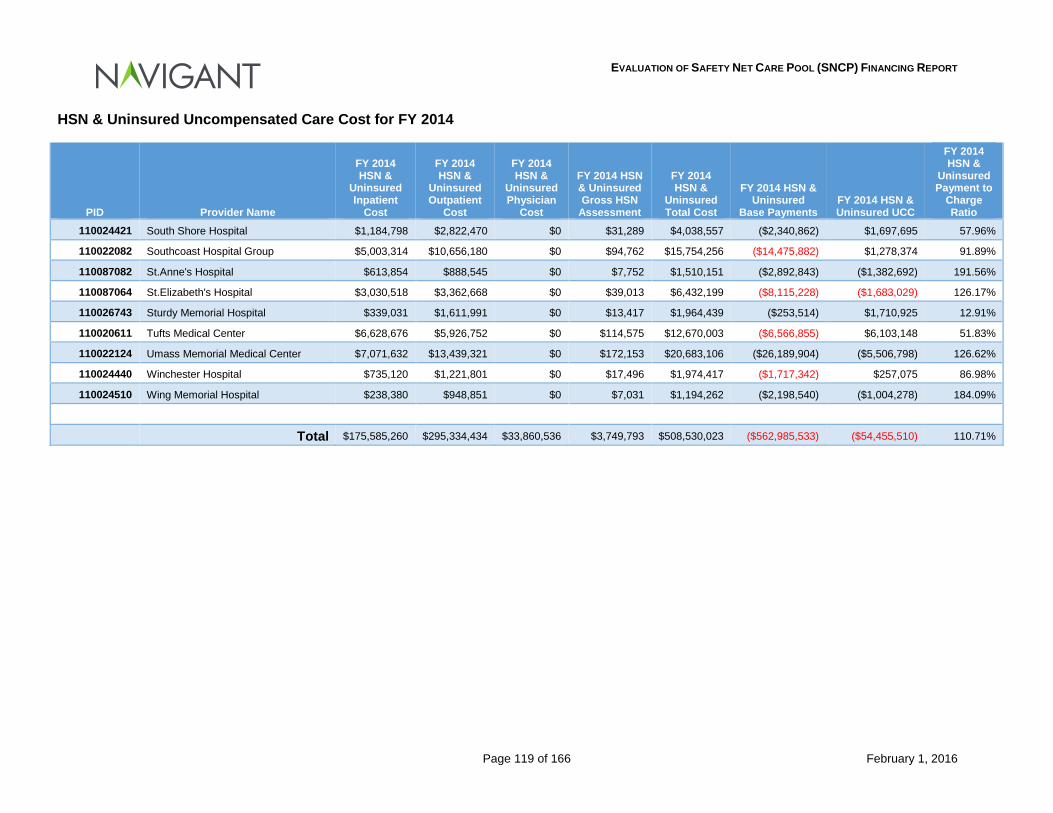
EVALUATION OF SAFETY NET CARE POOL (SNCP) FINANCING REPORT
Page 119 of 166 February 1, 2016
HSN & Uninsured Uncompensated Care Cost for FY 2014
PID Provider Name
FY 2014 HSN &
Uninsured Inpatient
Cost
FY 2014 HSN &
Uninsured Outpatient
Cost
FY 2014 HSN &
Uninsured Physician
Cost
FY 2014 HSN & Uninsured Gross HSN
Assessment
FY 2014 HSN &
Uninsured Total Cost
FY 2014 HSN & Uninsured
Base Payments FY 2014 HSN & Uninsured UCC
FY 2014 HSN &
Uninsured Payment to
Charge Ratio
110024421 South Shore Hospital $1,184,798 $2,822,470 $0 $31,289 $4,038,557 ($2,340,862) $1,697,695 57.96%
110022082 Southcoast Hospital Group $5,003,314 $10,656,180 $0 $94,762 $15,754,256 ($14,475,882) $1,278,374 91.89%
110087082 St.Anne's Hospital $613,854 $888,545 $0 $7,752 $1,510,151 ($2,892,843) ($1,382,692) 191.56%
110087064 St.Elizabeth's Hospital $3,030,518 $3,362,668 $0 $39,013 $6,432,199 ($8,115,228) ($1,683,029) 126.17%
110026743 Sturdy Memorial Hospital $339,031 $1,611,991 $0 $13,417 $1,964,439 ($253,514) $1,710,925 12.91%
110020611 Tufts Medical Center $6,628,676 $5,926,752 $0 $114,575 $12,670,003 ($6,566,855) $6,103,148 51.83%
110022124 Umass Memorial Medical Center $7,071,632 $13,439,321 $0 $172,153 $20,683,106 ($26,189,904) ($5,506,798) 126.62%
110024440 Winchester Hospital $735,120 $1,221,801 $0 $17,496 $1,974,417 ($1,717,342) $257,075 86.98%
110024510 Wing Memorial Hospital $238,380 $948,851 $0 $7,031 $1,194,262 ($2,198,540) ($1,004,278) 184.09%
Total $175,585,260 $295,334,434 $33,860,536 $3,749,793 $508,530,023 ($562,985,533) ($54,455,510) 110.71%
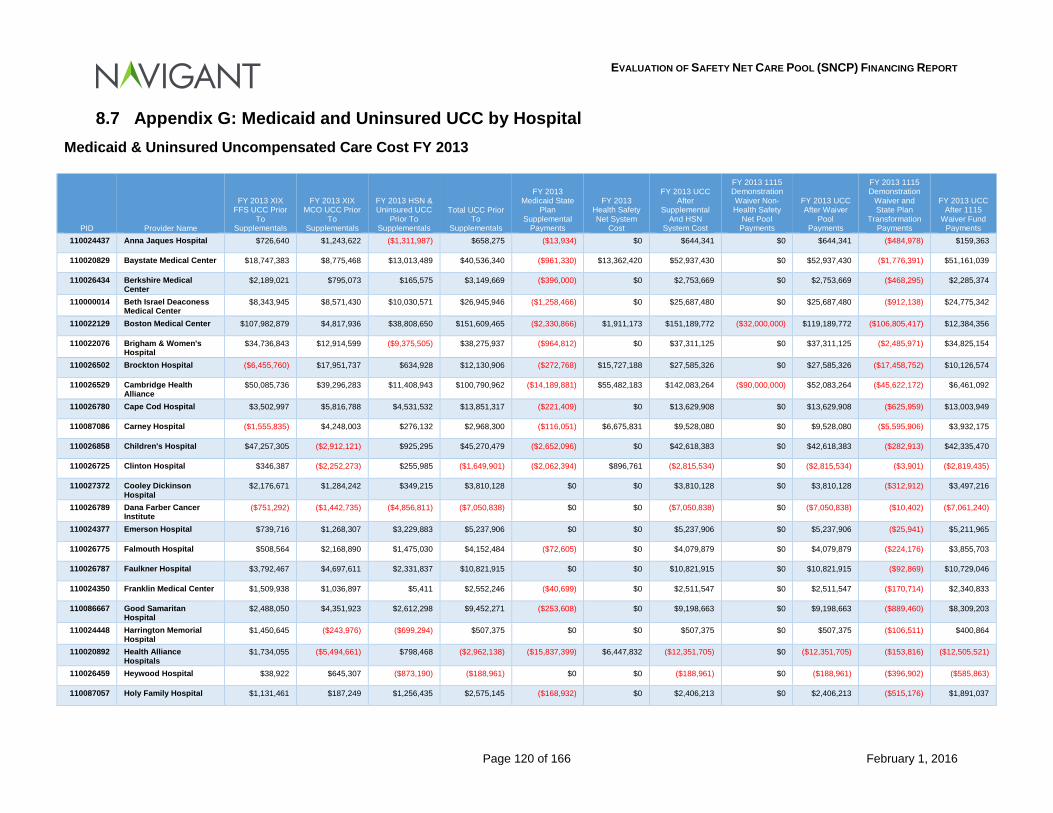
EVALUATION OF SAFETY NET CARE POOL (SNCP) FINANCING REPORT
Page 120 of 166 February 1, 2016
8.7 Appendix G: Medicaid and Uninsured UCC by Hospital Medicaid & Uninsured Uncompensated Care Cost FY 2013
PID Provider Name
FY 2013 XIX FFS UCC Prior
To Supplementals
FY 2013 XIX MCO UCC Prior
To Supplementals
FY 2013 HSN & Uninsured UCC
Prior To Supplementals
Total UCC Prior To
Supplementals
FY 2013 Medicaid State
Plan Supplemental
Payments
FY 2013 Health Safety Net System
Cost
FY 2013 UCC After
Supplemental And HSN
System Cost
FY 2013 1115 Demonstration Waiver Non-Health Safety
Net Pool Payments
FY 2013 UCC After Waiver
Pool Payments
FY 2013 1115 Demonstration
Waiver and State Plan
Transformation Payments
FY 2013 UCC After 1115
Waiver Fund Payments
110024437 Anna Jaques Hospital $726,640 $1,243,622 ($1,311,987) $658,275 ($13,934) $0 $644,341 $0 $644,341 ($484,978) $159,363
110020829 Baystate Medical Center $18,747,383 $8,775,468 $13,013,489 $40,536,340 ($961,330) $13,362,420 $52,937,430 $0 $52,937,430 ($1,776,391) $51,161,039
110026434 Berkshire Medical Center
$2,189,021 $795,073 $165,575 $3,149,669 ($396,000) $0 $2,753,669 $0 $2,753,669 ($468,295) $2,285,374
110000014 Beth Israel Deaconess Medical Center
$8,343,945 $8,571,430 $10,030,571 $26,945,946 ($1,258,466) $0 $25,687,480 $0 $25,687,480 ($912,138) $24,775,342
110022129 Boston Medical Center $107,982,879 $4,817,936 $38,808,650 $151,609,465 ($2,330,866) $1,911,173 $151,189,772 ($32,000,000) $119,189,772 ($106,805,417) $12,384,356
110022076 Brigham & Women's Hospital
$34,736,843 $12,914,599 ($9,375,505) $38,275,937 ($964,812) $0 $37,311,125 $0 $37,311,125 ($2,485,971) $34,825,154
110026502 Brockton Hospital ($6,455,760) $17,951,737 $634,928 $12,130,906 ($272,768) $15,727,188 $27,585,326 $0 $27,585,326 ($17,458,752) $10,126,574
110026529 Cambridge Health Alliance
$50,085,736 $39,296,283 $11,408,943 $100,790,962 ($14,189,881) $55,482,183 $142,083,264 ($90,000,000) $52,083,264 ($45,622,172) $6,461,092
110026780 Cape Cod Hospital $3,502,997 $5,816,788 $4,531,532 $13,851,317 ($221,409) $0 $13,629,908 $0 $13,629,908 ($625,959) $13,003,949
110087086 Carney Hospital ($1,555,835) $4,248,003 $276,132 $2,968,300 ($116,051) $6,675,831 $9,528,080 $0 $9,528,080 ($5,595,906) $3,932,175
110026858 Children's Hospital $47,257,305 ($2,912,121) $925,295 $45,270,479 ($2,652,096) $0 $42,618,383 $0 $42,618,383 ($282,913) $42,335,470
110026725 Clinton Hospital $346,387 ($2,252,273) $255,985 ($1,649,901) ($2,062,394) $896,761 ($2,815,534) $0 ($2,815,534) ($3,901) ($2,819,435)
110027372 Cooley Dickinson Hospital
$2,176,671 $1,284,242 $349,215 $3,810,128 $0 $0 $3,810,128 $0 $3,810,128 ($312,912) $3,497,216
110026789 Dana Farber Cancer Institute
($751,292) ($1,442,735) ($4,856,811) ($7,050,838) $0 $0 ($7,050,838) $0 ($7,050,838) ($10,402) ($7,061,240)
110024377 Emerson Hospital $739,716 $1,268,307 $3,229,883 $5,237,906 $0 $0 $5,237,906 $0 $5,237,906 ($25,941) $5,211,965
110026775 Falmouth Hospital $508,564 $2,168,890 $1,475,030 $4,152,484 ($72,605) $0 $4,079,879 $0 $4,079,879 ($224,176) $3,855,703
110026787 Faulkner Hospital $3,792,467 $4,697,611 $2,331,837 $10,821,915 $0 $0 $10,821,915 $0 $10,821,915 ($92,869) $10,729,046
110024350 Franklin Medical Center $1,509,938 $1,036,897 $5,411 $2,552,246 ($40,699) $0 $2,511,547 $0 $2,511,547 ($170,714) $2,340,833
110086667 Good Samaritan Hospital
$2,488,050 $4,351,923 $2,612,298 $9,452,271 ($253,608) $0 $9,198,663 $0 $9,198,663 ($889,460) $8,309,203
110024448 Harrington Memorial Hospital
$1,450,645 ($243,976) ($699,294) $507,375 $0 $0 $507,375 $0 $507,375 ($106,511) $400,864
110020892 Health Alliance Hospitals
$1,734,055 ($5,494,661) $798,468 ($2,962,138) ($15,837,399) $6,447,832 ($12,351,705) $0 ($12,351,705) ($153,816) ($12,505,521)
110026459 Heywood Hospital $38,922 $645,307 ($873,190) ($188,961) $0 $0 ($188,961) $0 ($188,961) ($396,902) ($585,863)
110087057 Holy Family Hospital $1,131,461 $187,249 $1,256,435 $2,575,145 ($168,932) $0 $2,406,213 $0 $2,406,213 ($515,176) $1,891,037
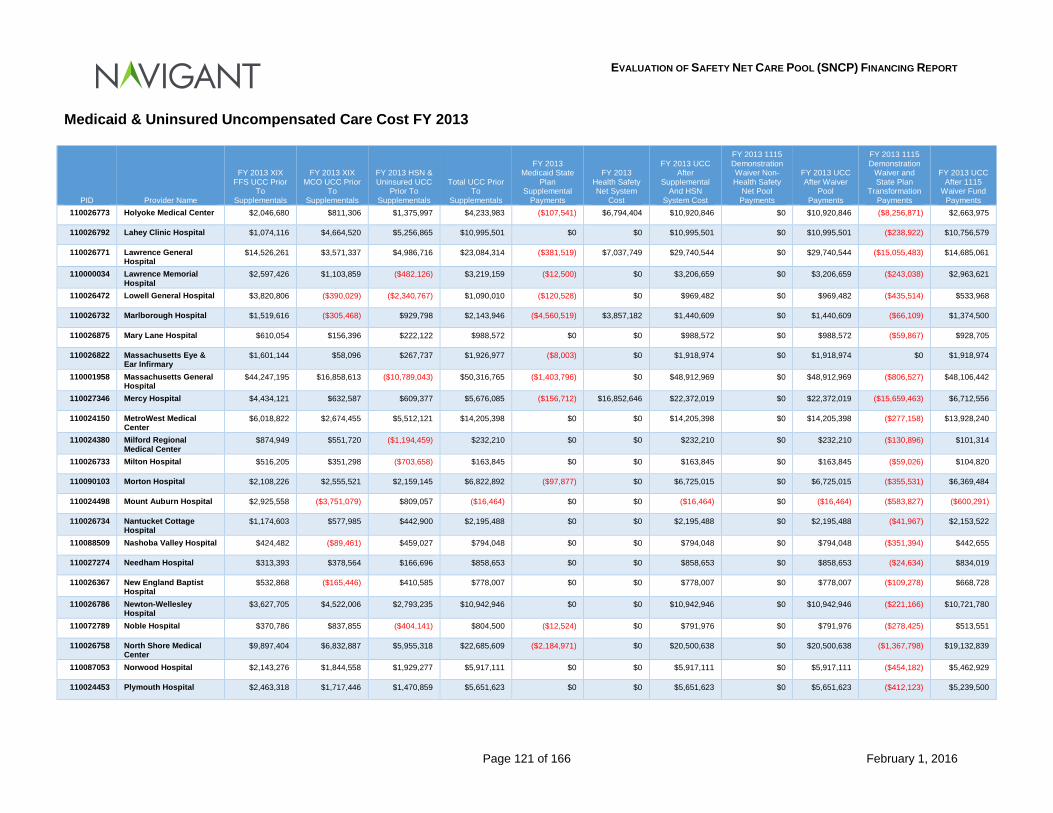
EVALUATION OF SAFETY NET CARE POOL (SNCP) FINANCING REPORT
Page 121 of 166 February 1, 2016
Medicaid & Uninsured Uncompensated Care Cost FY 2013
PID Provider Name
FY 2013 XIX FFS UCC Prior
To Supplementals
FY 2013 XIX MCO UCC Prior
To Supplementals
FY 2013 HSN & Uninsured UCC
Prior To Supplementals
Total UCC Prior To
Supplementals
FY 2013 Medicaid State
Plan Supplemental
Payments
FY 2013 Health Safety Net System
Cost
FY 2013 UCC After
Supplemental And HSN
System Cost
FY 2013 1115 Demonstration Waiver Non-Health Safety
Net Pool Payments
FY 2013 UCC After Waiver
Pool Payments
FY 2013 1115 Demonstration
Waiver and State Plan
Transformation Payments
FY 2013 UCC After 1115
Waiver Fund Payments
110026773 Holyoke Medical Center $2,046,680 $811,306 $1,375,997 $4,233,983 ($107,541) $6,794,404 $10,920,846 $0 $10,920,846 ($8,256,871) $2,663,975
110026792 Lahey Clinic Hospital $1,074,116 $4,664,520 $5,256,865 $10,995,501 $0 $0 $10,995,501 $0 $10,995,501 ($238,922) $10,756,579
110026771 Lawrence General Hospital
$14,526,261 $3,571,337 $4,986,716 $23,084,314 ($381,519) $7,037,749 $29,740,544 $0 $29,740,544 ($15,055,483) $14,685,061
110000034 Lawrence Memorial Hospital
$2,597,426 $1,103,859 ($482,126) $3,219,159 ($12,500) $0 $3,206,659 $0 $3,206,659 ($243,038) $2,963,621
110026472 Lowell General Hospital $3,820,806 ($390,029) ($2,340,767) $1,090,010 ($120,528) $0 $969,482 $0 $969,482 ($435,514) $533,968
110026732 Marlborough Hospital $1,519,616 ($305,468) $929,798 $2,143,946 ($4,560,519) $3,857,182 $1,440,609 $0 $1,440,609 ($66,109) $1,374,500
110026875 Mary Lane Hospital $610,054 $156,396 $222,122 $988,572 $0 $0 $988,572 $0 $988,572 ($59,867) $928,705
110026822 Massachusetts Eye & Ear Infirmary
$1,601,144 $58,096 $267,737 $1,926,977 ($8,003) $0 $1,918,974 $0 $1,918,974 $0 $1,918,974
110001958 Massachusetts General Hospital
$44,247,195 $16,858,613 ($10,789,043) $50,316,765 ($1,403,796) $0 $48,912,969 $0 $48,912,969 ($806,527) $48,106,442
110027346 Mercy Hospital $4,434,121 $632,587 $609,377 $5,676,085 ($156,712) $16,852,646 $22,372,019 $0 $22,372,019 ($15,659,463) $6,712,556
110024150 MetroWest Medical Center
$6,018,822 $2,674,455 $5,512,121 $14,205,398 $0 $0 $14,205,398 $0 $14,205,398 ($277,158) $13,928,240
110024380 Milford Regional Medical Center
$874,949 $551,720 ($1,194,459) $232,210 $0 $0 $232,210 $0 $232,210 ($130,896) $101,314
110026733 Milton Hospital $516,205 $351,298 ($703,658) $163,845 $0 $0 $163,845 $0 $163,845 ($59,026) $104,820
110090103 Morton Hospital $2,108,226 $2,555,521 $2,159,145 $6,822,892 ($97,877) $0 $6,725,015 $0 $6,725,015 ($355,531) $6,369,484
110024498 Mount Auburn Hospital $2,925,558 ($3,751,079) $809,057 ($16,464) $0 $0 ($16,464) $0 ($16,464) ($583,827) ($600,291)
110026734 Nantucket Cottage Hospital
$1,174,603 $577,985 $442,900 $2,195,488 $0 $0 $2,195,488 $0 $2,195,488 ($41,967) $2,153,522
110088509 Nashoba Valley Hospital $424,482 ($89,461) $459,027 $794,048 $0 $0 $794,048 $0 $794,048 ($351,394) $442,655
110027274 Needham Hospital $313,393 $378,564 $166,696 $858,653 $0 $0 $858,653 $0 $858,653 ($24,634) $834,019
110026367 New England Baptist Hospital
$532,868 ($165,446) $410,585 $778,007 $0 $0 $778,007 $0 $778,007 ($109,278) $668,728
110026786 Newton-Wellesley Hospital
$3,627,705 $4,522,006 $2,793,235 $10,942,946 $0 $0 $10,942,946 $0 $10,942,946 ($221,166) $10,721,780
110072789 Noble Hospital $370,786 $837,855 ($404,141) $804,500 ($12,524) $0 $791,976 $0 $791,976 ($278,425) $513,551
110026758 North Shore Medical Center
$9,897,404 $6,832,887 $5,955,318 $22,685,609 ($2,184,971) $0 $20,500,638 $0 $20,500,638 ($1,367,798) $19,132,839
110087053 Norwood Hospital $2,143,276 $1,844,558 $1,929,277 $5,917,111 $0 $0 $5,917,111 $0 $5,917,111 ($454,182) $5,462,929
110024453 Plymouth Hospital $2,463,318 $1,717,446 $1,470,859 $5,651,623 $0 $0 $5,651,623 $0 $5,651,623 ($412,123) $5,239,500
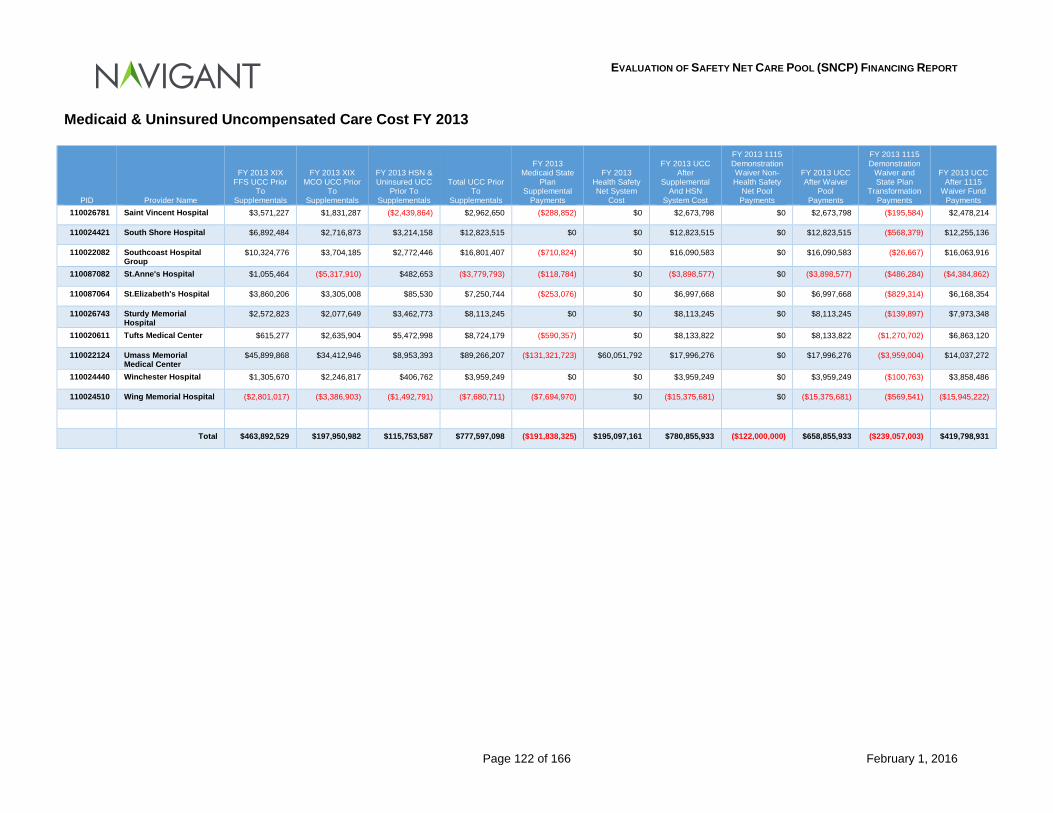
EVALUATION OF SAFETY NET CARE POOL (SNCP) FINANCING REPORT
Page 122 of 166 February 1, 2016
Medicaid & Uninsured Uncompensated Care Cost FY 2013
PID Provider Name
FY 2013 XIX FFS UCC Prior
To Supplementals
FY 2013 XIX MCO UCC Prior
To Supplementals
FY 2013 HSN & Uninsured UCC
Prior To Supplementals
Total UCC Prior To
Supplementals
FY 2013 Medicaid State
Plan Supplemental
Payments
FY 2013 Health Safety Net System
Cost
FY 2013 UCC After
Supplemental And HSN
System Cost
FY 2013 1115 Demonstration Waiver Non-Health Safety
Net Pool Payments
FY 2013 UCC After Waiver
Pool Payments
FY 2013 1115 Demonstration
Waiver and State Plan
Transformation Payments
FY 2013 UCC After 1115
Waiver Fund Payments
110026781 Saint Vincent Hospital $3,571,227 $1,831,287 ($2,439,864) $2,962,650 ($288,852) $0 $2,673,798 $0 $2,673,798 ($195,584) $2,478,214
110024421 South Shore Hospital $6,892,484 $2,716,873 $3,214,158 $12,823,515 $0 $0 $12,823,515 $0 $12,823,515 ($568,379) $12,255,136
110022082 Southcoast Hospital Group
$10,324,776 $3,704,185 $2,772,446 $16,801,407 ($710,824) $0 $16,090,583 $0 $16,090,583 ($26,667) $16,063,916
110087082 St.Anne's Hospital $1,055,464 ($5,317,910) $482,653 ($3,779,793) ($118,784) $0 ($3,898,577) $0 ($3,898,577) ($486,284) ($4,384,862)
110087064 St.Elizabeth's Hospital $3,860,206 $3,305,008 $85,530 $7,250,744 ($253,076) $0 $6,997,668 $0 $6,997,668 ($829,314) $6,168,354
110026743 Sturdy Memorial Hospital
$2,572,823 $2,077,649 $3,462,773 $8,113,245 $0 $0 $8,113,245 $0 $8,113,245 ($139,897) $7,973,348
110020611 Tufts Medical Center $615,277 $2,635,904 $5,472,998 $8,724,179 ($590,357) $0 $8,133,822 $0 $8,133,822 ($1,270,702) $6,863,120
110022124 Umass Memorial Medical Center
$45,899,868 $34,412,946 $8,953,393 $89,266,207 ($131,321,723) $60,051,792 $17,996,276 $0 $17,996,276 ($3,959,004) $14,037,272
110024440 Winchester Hospital $1,305,670 $2,246,817 $406,762 $3,959,249 $0 $0 $3,959,249 $0 $3,959,249 ($100,763) $3,858,486
110024510 Wing Memorial Hospital ($2,801,017) ($3,386,903) ($1,492,791) ($7,680,711) ($7,694,970) $0 ($15,375,681) $0 ($15,375,681) ($569,541) ($15,945,222)
Total $463,892,529 $197,950,982 $115,753,587 $777,597,098 ($191,838,325) $195,097,161 $780,855,933 ($122,000,000) $658,855,933 ($239,057,003) $419,798,931
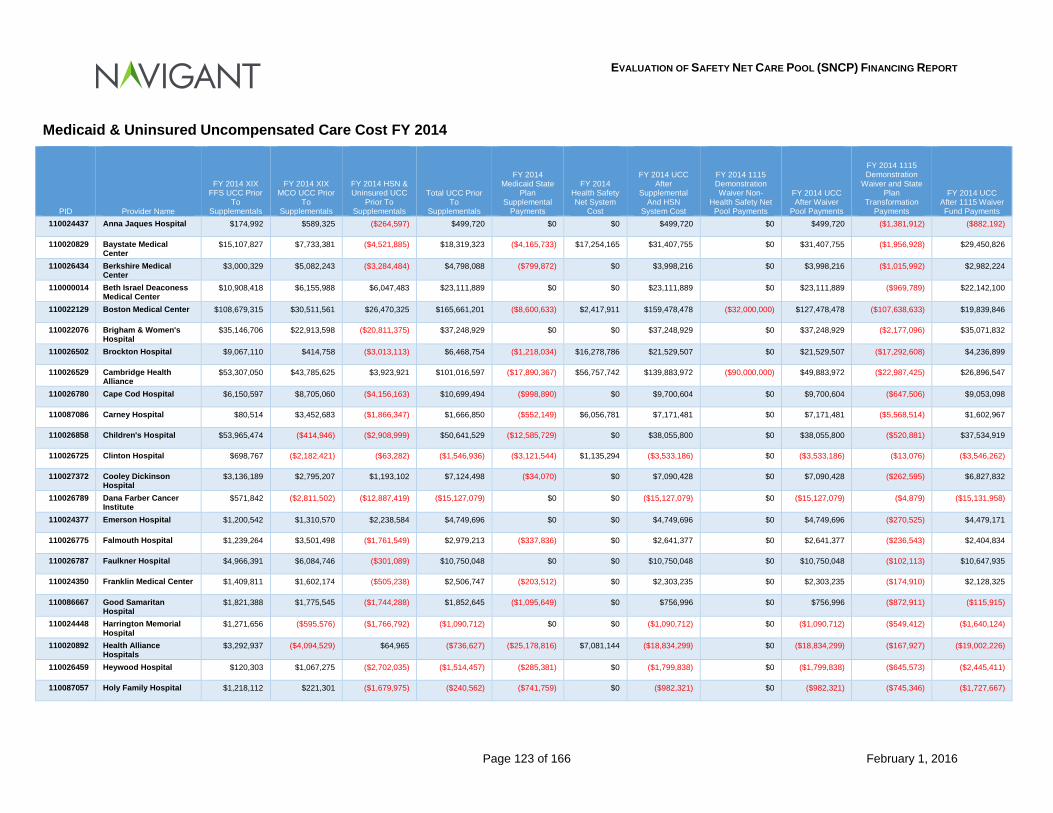
EVALUATION OF SAFETY NET CARE POOL (SNCP) FINANCING REPORT
Page 123 of 166 February 1, 2016
Medicaid & Uninsured Uncompensated Care Cost FY 2014
PID Provider Name
FY 2014 XIX FFS UCC Prior
To Supplementals
FY 2014 XIX MCO UCC Prior
To Supplementals
FY 2014 HSN & Uninsured UCC
Prior To Supplementals
Total UCC Prior To
Supplementals
FY 2014 Medicaid State
Plan Supplemental
Payments
FY 2014 Health Safety Net System
Cost
FY 2014 UCC After
Supplemental And HSN
System Cost
FY 2014 1115 Demonstration Waiver Non-
Health Safety Net Pool Payments
FY 2014 UCC After Waiver
Pool Payments
FY 2014 1115 Demonstration
Waiver and State Plan
Transformation Payments
FY 2014 UCC After 1115 Waiver Fund Payments
110024437 Anna Jaques Hospital $174,992 $589,325 ($264,597) $499,720 $0 $0 $499,720 $0 $499,720 ($1,381,912) ($882,192)
110020829 Baystate Medical Center
$15,107,827 $7,733,381 ($4,521,885) $18,319,323 ($4,165,733) $17,254,165 $31,407,755 $0 $31,407,755 ($1,956,928) $29,450,826
110026434 Berkshire Medical Center
$3,000,329 $5,082,243 ($3,284,484) $4,798,088 ($799,872) $0 $3,998,216 $0 $3,998,216 ($1,015,992) $2,982,224
110000014 Beth Israel Deaconess Medical Center
$10,908,418 $6,155,988 $6,047,483 $23,111,889 $0 $0 $23,111,889 $0 $23,111,889 ($969,789) $22,142,100
110022129 Boston Medical Center $108,679,315 $30,511,561 $26,470,325 $165,661,201 ($8,600,633) $2,417,911 $159,478,478 ($32,000,000) $127,478,478 ($107,638,633) $19,839,846
110022076 Brigham & Women's Hospital
$35,146,706 $22,913,598 ($20,811,375) $37,248,929 $0 $0 $37,248,929 $0 $37,248,929 ($2,177,096) $35,071,832
110026502 Brockton Hospital $9,067,110 $414,758 ($3,013,113) $6,468,754 ($1,218,034) $16,278,786 $21,529,507 $0 $21,529,507 ($17,292,608) $4,236,899
110026529 Cambridge Health Alliance
$53,307,050 $43,785,625 $3,923,921 $101,016,597 ($17,890,367) $56,757,742 $139,883,972 ($90,000,000) $49,883,972 ($22,987,425) $26,896,547
110026780 Cape Cod Hospital $6,150,597 $8,705,060 ($4,156,163) $10,699,494 ($998,890) $0 $9,700,604 $0 $9,700,604 ($647,506) $9,053,098
110087086 Carney Hospital $80,514 $3,452,683 ($1,866,347) $1,666,850 ($552,149) $6,056,781 $7,171,481 $0 $7,171,481 ($5,568,514) $1,602,967
110026858 Children's Hospital $53,965,474 ($414,946) ($2,908,999) $50,641,529 ($12,585,729) $0 $38,055,800 $0 $38,055,800 ($520,881) $37,534,919
110026725 Clinton Hospital $698,767 ($2,182,421) ($63,282) ($1,546,936) ($3,121,544) $1,135,294 ($3,533,186) $0 ($3,533,186) ($13,076) ($3,546,262)
110027372 Cooley Dickinson Hospital
$3,136,189 $2,795,207 $1,193,102 $7,124,498 ($34,070) $0 $7,090,428 $0 $7,090,428 ($262,595) $6,827,832
110026789 Dana Farber Cancer Institute
$571,842 ($2,811,502) ($12,887,419) ($15,127,079) $0 $0 ($15,127,079) $0 ($15,127,079) ($4,879) ($15,131,958)
110024377 Emerson Hospital $1,200,542 $1,310,570 $2,238,584 $4,749,696 $0 $0 $4,749,696 $0 $4,749,696 ($270,525) $4,479,171
110026775 Falmouth Hospital $1,239,264 $3,501,498 ($1,761,549) $2,979,213 ($337,836) $0 $2,641,377 $0 $2,641,377 ($236,543) $2,404,834
110026787 Faulkner Hospital $4,966,391 $6,084,746 ($301,089) $10,750,048 $0 $0 $10,750,048 $0 $10,750,048 ($102,113) $10,647,935
110024350 Franklin Medical Center $1,409,811 $1,602,174 ($505,238) $2,506,747 ($203,512) $0 $2,303,235 $0 $2,303,235 ($174,910) $2,128,325
110086667 Good Samaritan Hospital
$1,821,388 $1,775,545 ($1,744,288) $1,852,645 ($1,095,649) $0 $756,996 $0 $756,996 ($872,911) ($115,915)
110024448 Harrington Memorial Hospital
$1,271,656 ($595,576) ($1,766,792) ($1,090,712) $0 $0 ($1,090,712) $0 ($1,090,712) ($549,412) ($1,640,124)
110020892 Health Alliance Hospitals
$3,292,937 ($4,094,529) $64,965 ($736,627) ($25,178,816) $7,081,144 ($18,834,299) $0 ($18,834,299) ($167,927) ($19,002,226)
110026459 Heywood Hospital $120,303 $1,067,275 ($2,702,035) ($1,514,457) ($285,381) $0 ($1,799,838) $0 ($1,799,838) ($645,573) ($2,445,411)
110087057 Holy Family Hospital $1,218,112 $221,301 ($1,679,975) ($240,562) ($741,759) $0 ($982,321) $0 ($982,321) ($745,346) ($1,727,667)
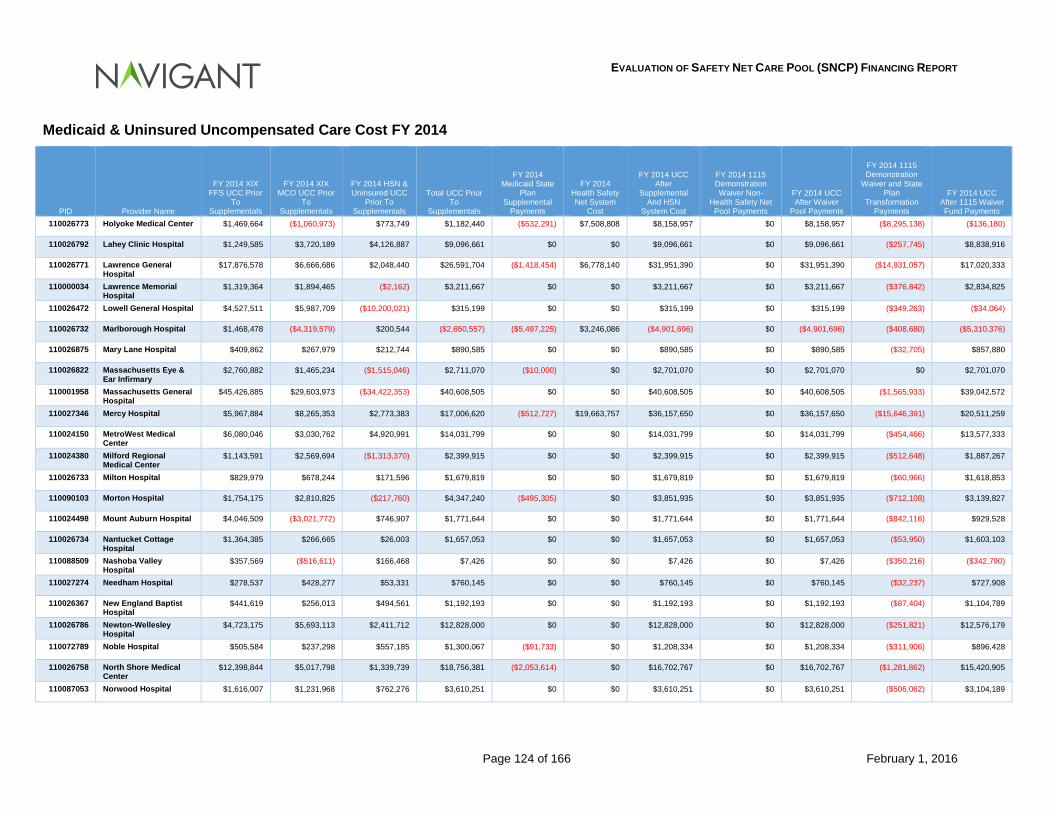
EVALUATION OF SAFETY NET CARE POOL (SNCP) FINANCING REPORT
Page 124 of 166 February 1, 2016
Medicaid & Uninsured Uncompensated Care Cost FY 2014
PID Provider Name
FY 2014 XIX FFS UCC Prior
To Supplementals
FY 2014 XIX MCO UCC Prior
To Supplementals
FY 2014 HSN & Uninsured UCC
Prior To Supplementals
Total UCC Prior To
Supplementals
FY 2014 Medicaid State
Plan Supplemental
Payments
FY 2014 Health Safety Net System
Cost
FY 2014 UCC After
Supplemental And HSN
System Cost
FY 2014 1115 Demonstration Waiver Non-
Health Safety Net Pool Payments
FY 2014 UCC After Waiver
Pool Payments
FY 2014 1115 Demonstration
Waiver and State Plan
Transformation Payments
FY 2014 UCC After 1115 Waiver Fund Payments
110026773 Holyoke Medical Center $1,469,664 ($1,060,973) $773,749 $1,182,440 ($532,291) $7,508,808 $8,158,957 $0 $8,158,957 ($8,295,138) ($136,180)
110026792 Lahey Clinic Hospital $1,249,585 $3,720,189 $4,126,887 $9,096,661 $0 $0 $9,096,661 $0 $9,096,661 ($257,745) $8,838,916
110026771 Lawrence General Hospital
$17,876,578 $6,666,686 $2,048,440 $26,591,704 ($1,418,454) $6,778,140 $31,951,390 $0 $31,951,390 ($14,931,057) $17,020,333
110000034 Lawrence Memorial Hospital
$1,319,364 $1,894,465 ($2,162) $3,211,667 $0 $0 $3,211,667 $0 $3,211,667 ($376,842) $2,834,825
110026472 Lowell General Hospital $4,527,511 $5,987,709 ($10,200,021) $315,199 $0 $0 $315,199 $0 $315,199 ($349,263) ($34,064)
110026732 Marlborough Hospital $1,468,478 ($4,319,579) $200,544 ($2,650,557) ($5,497,225) $3,246,086 ($4,901,696) $0 ($4,901,696) ($408,680) ($5,310,376)
110026875 Mary Lane Hospital $409,862 $267,979 $212,744 $890,585 $0 $0 $890,585 $0 $890,585 ($32,705) $857,880
110026822 Massachusetts Eye & Ear Infirmary
$2,760,882 $1,465,234 ($1,515,046) $2,711,070 ($10,000) $0 $2,701,070 $0 $2,701,070 $0 $2,701,070
110001958 Massachusetts General Hospital
$45,426,885 $29,603,973 ($34,422,353) $40,608,505 $0 $0 $40,608,505 $0 $40,608,505 ($1,565,933) $39,042,572
110027346 Mercy Hospital $5,967,884 $8,265,353 $2,773,383 $17,006,620 ($512,727) $19,663,757 $36,157,650 $0 $36,157,650 ($15,646,391) $20,511,259
110024150 MetroWest Medical Center
$6,080,046 $3,030,762 $4,920,991 $14,031,799 $0 $0 $14,031,799 $0 $14,031,799 ($454,466) $13,577,333
110024380 Milford Regional Medical Center
$1,143,591 $2,569,694 ($1,313,370) $2,399,915 $0 $0 $2,399,915 $0 $2,399,915 ($512,648) $1,887,267
110026733 Milton Hospital $829,979 $678,244 $171,596 $1,679,819 $0 $0 $1,679,819 $0 $1,679,819 ($60,966) $1,618,853
110090103 Morton Hospital $1,754,175 $2,810,825 ($217,760) $4,347,240 ($495,305) $0 $3,851,935 $0 $3,851,935 ($712,108) $3,139,827
110024498 Mount Auburn Hospital $4,046,509 ($3,021,772) $746,907 $1,771,644 $0 $0 $1,771,644 $0 $1,771,644 ($842,116) $929,528
110026734 Nantucket Cottage Hospital
$1,364,385 $266,665 $26,003 $1,657,053 $0 $0 $1,657,053 $0 $1,657,053 ($53,950) $1,603,103
110088509 Nashoba Valley Hospital
$357,569 ($516,611) $166,468 $7,426 $0 $0 $7,426 $0 $7,426 ($350,216) ($342,790)
110027274 Needham Hospital $278,537 $428,277 $53,331 $760,145 $0 $0 $760,145 $0 $760,145 ($32,237) $727,908
110026367 New England Baptist Hospital
$441,619 $256,013 $494,561 $1,192,193 $0 $0 $1,192,193 $0 $1,192,193 ($87,404) $1,104,789
110026786 Newton-Wellesley Hospital
$4,723,175 $5,693,113 $2,411,712 $12,828,000 $0 $0 $12,828,000 $0 $12,828,000 ($251,821) $12,576,179
110072789 Noble Hospital $505,584 $237,298 $557,185 $1,300,067 ($91,733) $0 $1,208,334 $0 $1,208,334 ($311,906) $896,428
110026758 North Shore Medical Center
$12,398,844 $5,017,798 $1,339,739 $18,756,381 ($2,053,614) $0 $16,702,767 $0 $16,702,767 ($1,281,862) $15,420,905
110087053 Norwood Hospital $1,616,007 $1,231,968 $762,276 $3,610,251 $0 $0 $3,610,251 $0 $3,610,251 ($506,062) $3,104,189
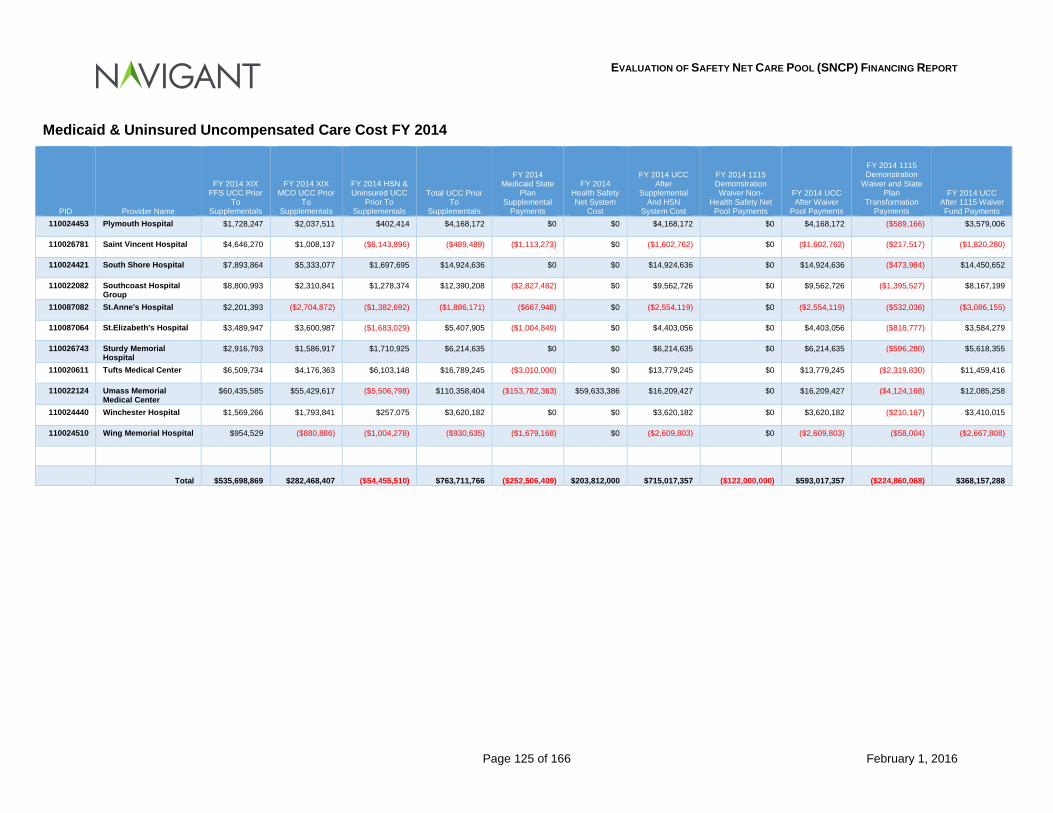
EVALUATION OF SAFETY NET CARE POOL (SNCP) FINANCING REPORT
Page 125 of 166 February 1, 2016
Medicaid & Uninsured Uncompensated Care Cost FY 2014
PID Provider Name
FY 2014 XIX FFS UCC Prior
To Supplementals
FY 2014 XIX MCO UCC Prior
To Supplementals
FY 2014 HSN & Uninsured UCC
Prior To Supplementals
Total UCC Prior To
Supplementals
FY 2014 Medicaid State
Plan Supplemental
Payments
FY 2014 Health Safety Net System
Cost
FY 2014 UCC After
Supplemental And HSN
System Cost
FY 2014 1115 Demonstration Waiver Non-
Health Safety Net Pool Payments
FY 2014 UCC After Waiver
Pool Payments
FY 2014 1115 Demonstration
Waiver and State Plan
Transformation Payments
FY 2014 UCC After 1115 Waiver Fund Payments
110024453 Plymouth Hospital $1,728,247 $2,037,511 $402,414 $4,168,172 $0 $0 $4,168,172 $0 $4,168,172 ($589,166) $3,579,006
110026781 Saint Vincent Hospital $4,646,270 $1,008,137 ($6,143,896) ($489,489) ($1,113,273) $0 ($1,602,762) $0 ($1,602,762) ($217,517) ($1,820,280)
110024421 South Shore Hospital $7,893,864 $5,333,077 $1,697,695 $14,924,636 $0 $0 $14,924,636 $0 $14,924,636 ($473,984) $14,450,652
110022082 Southcoast Hospital Group
$8,800,993 $2,310,841 $1,278,374 $12,390,208 ($2,827,482) $0 $9,562,726 $0 $9,562,726 ($1,395,527) $8,167,199
110087082 St.Anne's Hospital $2,201,393 ($2,704,872) ($1,382,692) ($1,886,171) ($667,948) $0 ($2,554,119) $0 ($2,554,119) ($532,036) ($3,086,155)
110087064 St.Elizabeth's Hospital $3,489,947 $3,600,987 ($1,683,029) $5,407,905 ($1,004,849) $0 $4,403,056 $0 $4,403,056 ($818,777) $3,584,279
110026743 Sturdy Memorial Hospital
$2,916,793 $1,586,917 $1,710,925 $6,214,635 $0 $0 $6,214,635 $0 $6,214,635 ($596,280) $5,618,355
110020611 Tufts Medical Center $6,509,734 $4,176,363 $6,103,148 $16,789,245 ($3,010,000) $0 $13,779,245 $0 $13,779,245 ($2,319,830) $11,459,416
110022124 Umass Memorial Medical Center
$60,435,585 $55,429,617 ($5,506,798) $110,358,404 ($153,782,363) $59,633,386 $16,209,427 $0 $16,209,427 ($4,124,168) $12,085,258
110024440 Winchester Hospital $1,569,266 $1,793,841 $257,075 $3,620,182 $0 $0 $3,620,182 $0 $3,620,182 ($210,167) $3,410,015
110024510 Wing Memorial Hospital $954,529 ($880,886) ($1,004,278) ($930,635) ($1,679,168) $0 ($2,609,803) $0 ($2,609,803) ($58,004) ($2,667,808)
Total $535,698,869 $282,468,407 ($54,455,510) $763,711,766 ($252,506,409) $203,812,000 $715,017,357 ($122,000,000) $593,017,357 ($224,860,068) $368,157,288
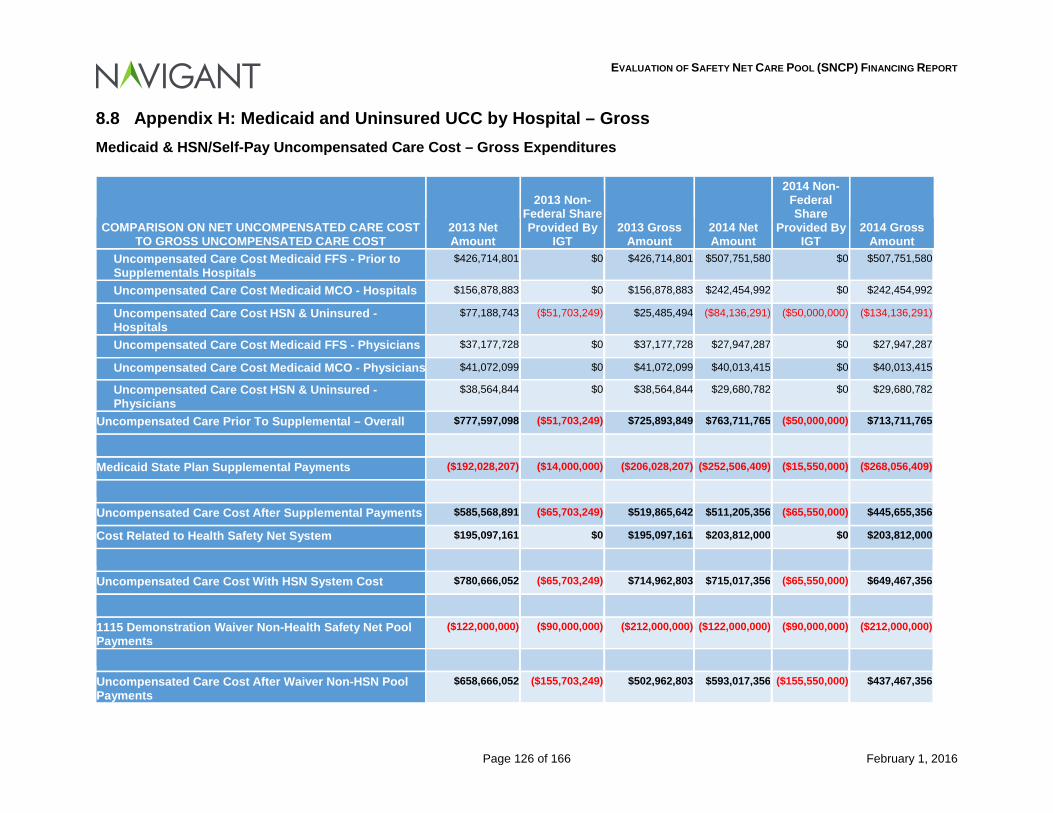
EVALUATION OF SAFETY NET CARE POOL (SNCP) FINANCING REPORT
Page 126 of 166 February 1, 2016
8.8 Appendix H: Medicaid and Uninsured UCC by Hospital – Gross Medicaid & HSN/Self-Pay Uncompensated Care Cost – Gross Expenditures
COMPARISON ON NET UNCOMPENSATED CARE COST TO GROSS UNCOMPENSATED CARE COST
2013 Net Amount
2013 Non-Federal Share Provided By
IGT 2013 Gross
Amount 2014 Net Amount
2014 Non-Federal Share
Provided By IGT
2014 Gross Amount
Uncompensated Care Cost Medicaid FFS - Prior to Supplementals Hospitals
$426,714,801 $0 $426,714,801 $507,751,580 $0 $507,751,580
Uncompensated Care Cost Medicaid MCO - Hospitals $156,878,883 $0 $156,878,883 $242,454,992 $0 $242,454,992
Uncompensated Care Cost HSN & Uninsured - Hospitals
$77,188,743 ($51,703,249) $25,485,494 ($84,136,291) ($50,000,000) ($134,136,291)
Uncompensated Care Cost Medicaid FFS - Physicians $37,177,728 $0 $37,177,728 $27,947,287 $0 $27,947,287
Uncompensated Care Cost Medicaid MCO - Physicians $41,072,099 $0 $41,072,099 $40,013,415 $0 $40,013,415
Uncompensated Care Cost HSN & Uninsured - Physicians
$38,564,844 $0 $38,564,844 $29,680,782 $0 $29,680,782
Uncompensated Care Prior To Supplemental – Overall $777,597,098 ($51,703,249) $725,893,849 $763,711,765 ($50,000,000) $713,711,765
Medicaid State Plan Supplemental Payments ($192,028,207) ($14,000,000) ($206,028,207) ($252,506,409) ($15,550,000) ($268,056,409)
Uncompensated Care Cost After Supplemental Payments $585,568,891 ($65,703,249) $519,865,642 $511,205,356 ($65,550,000) $445,655,356
Cost Related to Health Safety Net System $195,097,161 $0 $195,097,161 $203,812,000 $0 $203,812,000
Uncompensated Care Cost With HSN System Cost $780,666,052 ($65,703,249) $714,962,803 $715,017,356 ($65,550,000) $649,467,356
1115 Demonstration Waiver Non-Health Safety Net Pool Payments
($122,000,000) ($90,000,000) ($212,000,000) ($122,000,000) ($90,000,000) ($212,000,000)
Uncompensated Care Cost After Waiver Non-HSN Pool Payments
$658,666,052 ($155,703,249) $502,962,803 $593,017,356 ($155,550,000) $437,467,356
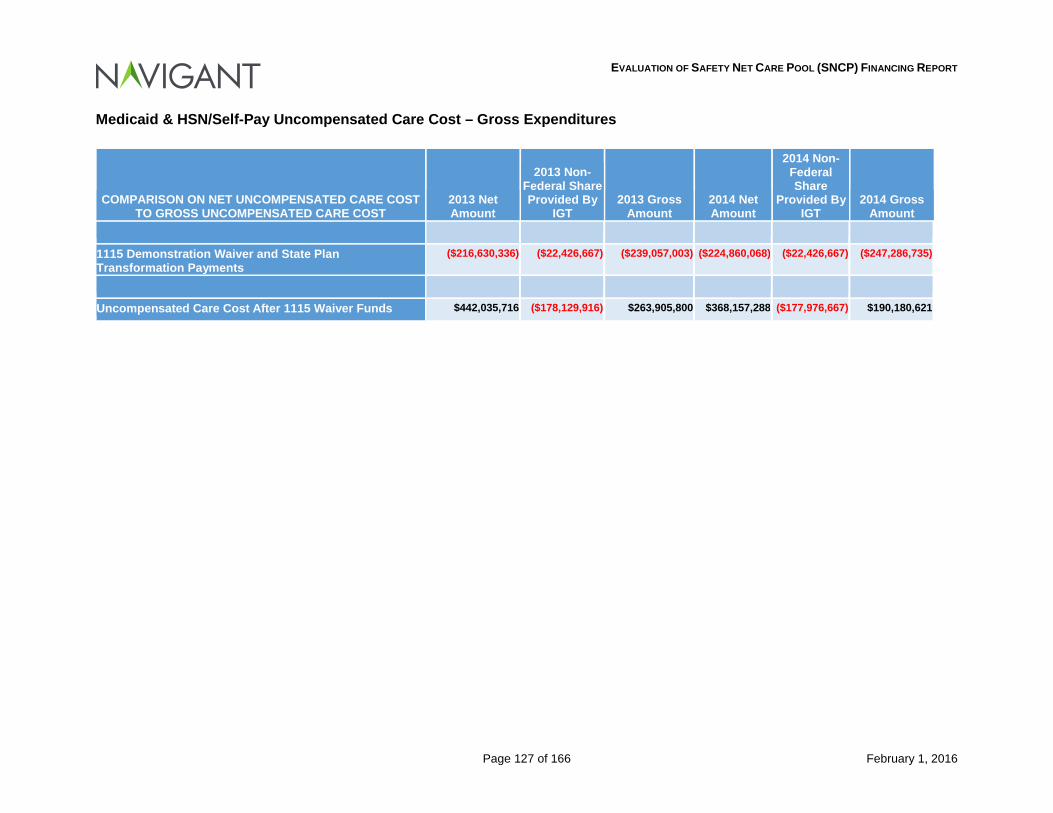
EVALUATION OF SAFETY NET CARE POOL (SNCP) FINANCING REPORT
Page 127 of 166 February 1, 2016
Medicaid & HSN/Self-Pay Uncompensated Care Cost – Gross Expenditures
COMPARISON ON NET UNCOMPENSATED CARE COST TO GROSS UNCOMPENSATED CARE COST
2013 Net Amount
2013 Non-Federal Share Provided By
IGT 2013 Gross
Amount 2014 Net Amount
2014 Non-Federal Share
Provided By IGT
2014 Gross Amount
1115 Demonstration Waiver and State Plan Transformation Payments
($216,630,336) ($22,426,667) ($239,057,003) ($224,860,068) ($22,426,667) ($247,286,735)
Uncompensated Care Cost After 1115 Waiver Funds $442,035,716 ($178,129,916) $263,905,800 $368,157,288 ($177,976,667) $190,180,621
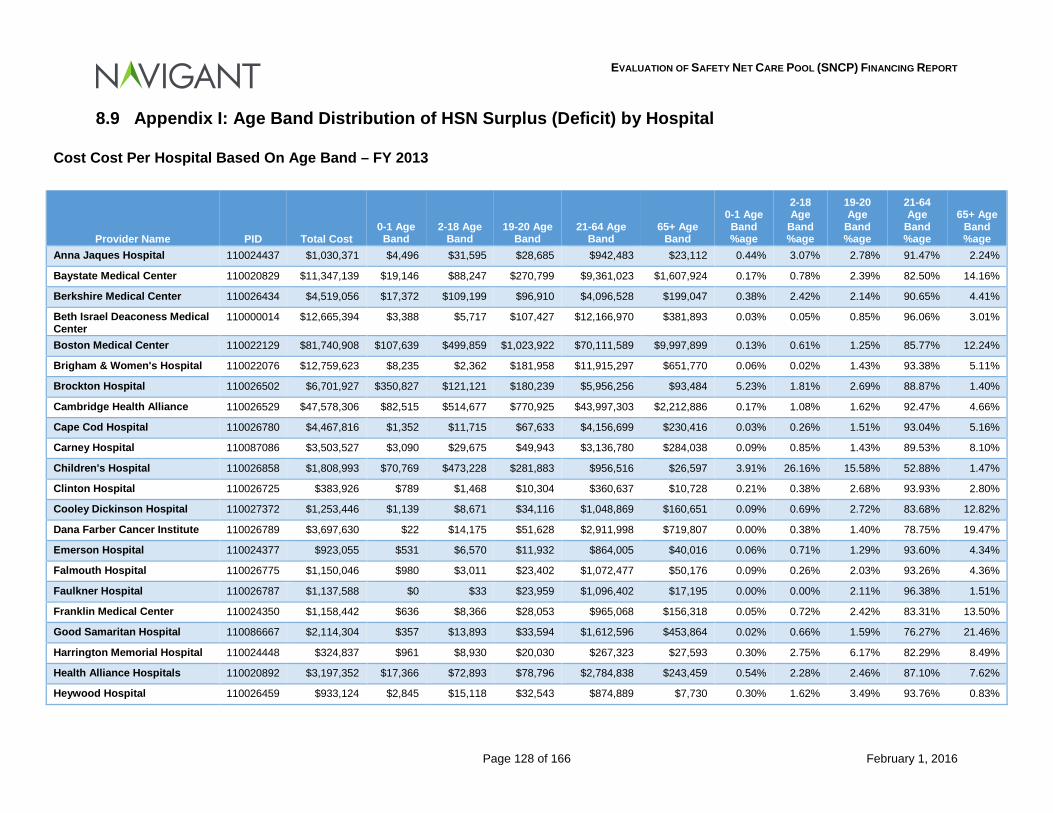
EVALUATION OF SAFETY NET CARE POOL (SNCP) FINANCING REPORT
Page 128 of 166 February 1, 2016
8.9 Appendix I: Age Band Distribution of HSN Surplus (Deficit) by Hospital
Cost Cost Per Hospital Based On Age Band – FY 2013
Provider Name PID Total Cost 0-1 Age Band
2-18 Age Band
19-20 Age Band
21-64 Age Band
65+ Age Band
0-1 Age Band %age
2-18 Age
Band %age
19-20 Age
Band %age
21-64 Age
Band %age
65+ Age Band %age
Anna Jaques Hospital 110024437 $1,030,371 $4,496 $31,595 $28,685 $942,483 $23,112 0.44% 3.07% 2.78% 91.47% 2.24%
Baystate Medical Center 110020829 $11,347,139 $19,146 $88,247 $270,799 $9,361,023 $1,607,924 0.17% 0.78% 2.39% 82.50% 14.16%
Berkshire Medical Center 110026434 $4,519,056 $17,372 $109,199 $96,910 $4,096,528 $199,047 0.38% 2.42% 2.14% 90.65% 4.41%
Beth Israel Deaconess Medical Center
110000014 $12,665,394 $3,388 $5,717 $107,427 $12,166,970 $381,893 0.03% 0.05% 0.85% 96.06% 3.01%
Boston Medical Center 110022129 $81,740,908 $107,639 $499,859 $1,023,922 $70,111,589 $9,997,899 0.13% 0.61% 1.25% 85.77% 12.24%
Brigham & Women's Hospital 110022076 $12,759,623 $8,235 $2,362 $181,958 $11,915,297 $651,770 0.06% 0.02% 1.43% 93.38% 5.11%
Brockton Hospital 110026502 $6,701,927 $350,827 $121,121 $180,239 $5,956,256 $93,484 5.23% 1.81% 2.69% 88.87% 1.40%
Cambridge Health Alliance 110026529 $47,578,306 $82,515 $514,677 $770,925 $43,997,303 $2,212,886 0.17% 1.08% 1.62% 92.47% 4.66%
Cape Cod Hospital 110026780 $4,467,816 $1,352 $11,715 $67,633 $4,156,699 $230,416 0.03% 0.26% 1.51% 93.04% 5.16%
Carney Hospital 110087086 $3,503,527 $3,090 $29,675 $49,943 $3,136,780 $284,038 0.09% 0.85% 1.43% 89.53% 8.10%
Children's Hospital 110026858 $1,808,993 $70,769 $473,228 $281,883 $956,516 $26,597 3.91% 26.16% 15.58% 52.88% 1.47%
Clinton Hospital 110026725 $383,926 $789 $1,468 $10,304 $360,637 $10,728 0.21% 0.38% 2.68% 93.93% 2.80%
Cooley Dickinson Hospital 110027372 $1,253,446 $1,139 $8,671 $34,116 $1,048,869 $160,651 0.09% 0.69% 2.72% 83.68% 12.82%
Dana Farber Cancer Institute 110026789 $3,697,630 $22 $14,175 $51,628 $2,911,998 $719,807 0.00% 0.38% 1.40% 78.75% 19.47%
Emerson Hospital 110024377 $923,055 $531 $6,570 $11,932 $864,005 $40,016 0.06% 0.71% 1.29% 93.60% 4.34%
Falmouth Hospital 110026775 $1,150,046 $980 $3,011 $23,402 $1,072,477 $50,176 0.09% 0.26% 2.03% 93.26% 4.36%
Faulkner Hospital 110026787 $1,137,588 $0 $33 $23,959 $1,096,402 $17,195 0.00% 0.00% 2.11% 96.38% 1.51%
Franklin Medical Center 110024350 $1,158,442 $636 $8,366 $28,053 $965,068 $156,318 0.05% 0.72% 2.42% 83.31% 13.50%
Good Samaritan Hospital 110086667 $2,114,304 $357 $13,893 $33,594 $1,612,596 $453,864 0.02% 0.66% 1.59% 76.27% 21.46%
Harrington Memorial Hospital 110024448 $324,837 $961 $8,930 $20,030 $267,323 $27,593 0.30% 2.75% 6.17% 82.29% 8.49%
Health Alliance Hospitals 110020892 $3,197,352 $17,366 $72,893 $78,796 $2,784,838 $243,459 0.54% 2.28% 2.46% 87.10% 7.62%
Heywood Hospital 110026459 $933,124 $2,845 $15,118 $32,543 $874,889 $7,730 0.30% 1.62% 3.49% 93.76% 0.83%
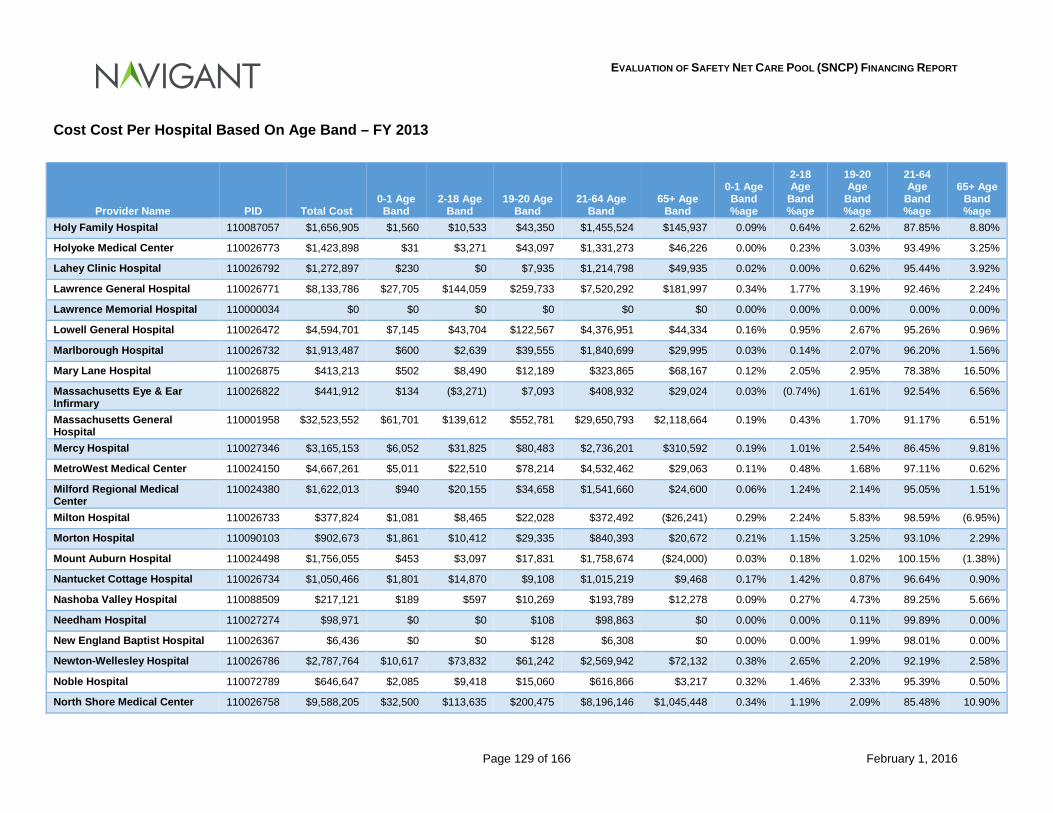
EVALUATION OF SAFETY NET CARE POOL (SNCP) FINANCING REPORT
Page 129 of 166 February 1, 2016
Cost Cost Per Hospital Based On Age Band – FY 2013
Provider Name PID Total Cost 0-1 Age Band
2-18 Age Band
19-20 Age Band
21-64 Age Band
65+ Age Band
0-1 Age Band %age
2-18 Age
Band %age
19-20 Age
Band %age
21-64 Age
Band %age
65+ Age Band %age
Holy Family Hospital 110087057 $1,656,905 $1,560 $10,533 $43,350 $1,455,524 $145,937 0.09% 0.64% 2.62% 87.85% 8.80%
Holyoke Medical Center 110026773 $1,423,898 $31 $3,271 $43,097 $1,331,273 $46,226 0.00% 0.23% 3.03% 93.49% 3.25%
Lahey Clinic Hospital 110026792 $1,272,897 $230 $0 $7,935 $1,214,798 $49,935 0.02% 0.00% 0.62% 95.44% 3.92%
Lawrence General Hospital 110026771 $8,133,786 $27,705 $144,059 $259,733 $7,520,292 $181,997 0.34% 1.77% 3.19% 92.46% 2.24%
Lawrence Memorial Hospital 110000034 $0 $0 $0 $0 $0 $0 0.00% 0.00% 0.00% 0.00% 0.00%
Lowell General Hospital 110026472 $4,594,701 $7,145 $43,704 $122,567 $4,376,951 $44,334 0.16% 0.95% 2.67% 95.26% 0.96%
Marlborough Hospital 110026732 $1,913,487 $600 $2,639 $39,555 $1,840,699 $29,995 0.03% 0.14% 2.07% 96.20% 1.56%
Mary Lane Hospital 110026875 $413,213 $502 $8,490 $12,189 $323,865 $68,167 0.12% 2.05% 2.95% 78.38% 16.50%
Massachusetts Eye & Ear Infirmary
110026822 $441,912 $134 ($3,271) $7,093 $408,932 $29,024 0.03% (0.74%) 1.61% 92.54% 6.56%
Massachusetts General Hospital
110001958 $32,523,552 $61,701 $139,612 $552,781 $29,650,793 $2,118,664 0.19% 0.43% 1.70% 91.17% 6.51%
Mercy Hospital 110027346 $3,165,153 $6,052 $31,825 $80,483 $2,736,201 $310,592 0.19% 1.01% 2.54% 86.45% 9.81%
MetroWest Medical Center 110024150 $4,667,261 $5,011 $22,510 $78,214 $4,532,462 $29,063 0.11% 0.48% 1.68% 97.11% 0.62%
Milford Regional Medical Center
110024380 $1,622,013 $940 $20,155 $34,658 $1,541,660 $24,600 0.06% 1.24% 2.14% 95.05% 1.51%
Milton Hospital 110026733 $377,824 $1,081 $8,465 $22,028 $372,492 ($26,241) 0.29% 2.24% 5.83% 98.59% (6.95%)
Morton Hospital 110090103 $902,673 $1,861 $10,412 $29,335 $840,393 $20,672 0.21% 1.15% 3.25% 93.10% 2.29%
Mount Auburn Hospital 110024498 $1,756,055 $453 $3,097 $17,831 $1,758,674 ($24,000) 0.03% 0.18% 1.02% 100.15% (1.38%)
Nantucket Cottage Hospital 110026734 $1,050,466 $1,801 $14,870 $9,108 $1,015,219 $9,468 0.17% 1.42% 0.87% 96.64% 0.90%
Nashoba Valley Hospital 110088509 $217,121 $189 $597 $10,269 $193,789 $12,278 0.09% 0.27% 4.73% 89.25% 5.66%
Needham Hospital 110027274 $98,971 $0 $0 $108 $98,863 $0 0.00% 0.00% 0.11% 99.89% 0.00%
New England Baptist Hospital 110026367 $6,436 $0 $0 $128 $6,308 $0 0.00% 0.00% 1.99% 98.01% 0.00%
Newton-Wellesley Hospital 110026786 $2,787,764 $10,617 $73,832 $61,242 $2,569,942 $72,132 0.38% 2.65% 2.20% 92.19% 2.58%
Noble Hospital 110072789 $646,647 $2,085 $9,418 $15,060 $616,866 $3,217 0.32% 1.46% 2.33% 95.39% 0.50%
North Shore Medical Center 110026758 $9,588,205 $32,500 $113,635 $200,475 $8,196,146 $1,045,448 0.34% 1.19% 2.09% 85.48% 10.90%
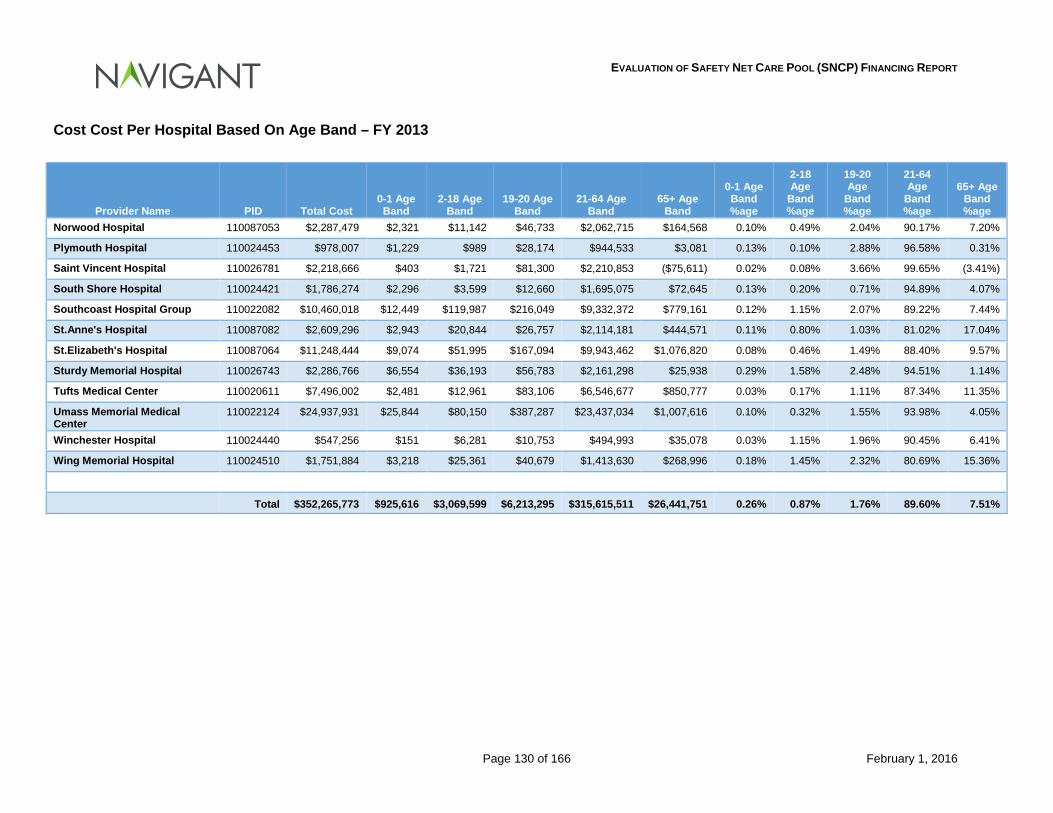
EVALUATION OF SAFETY NET CARE POOL (SNCP) FINANCING REPORT
Page 130 of 166 February 1, 2016
Cost Cost Per Hospital Based On Age Band – FY 2013
Provider Name PID Total Cost 0-1 Age Band
2-18 Age Band
19-20 Age Band
21-64 Age Band
65+ Age Band
0-1 Age Band %age
2-18 Age
Band %age
19-20 Age
Band %age
21-64 Age
Band %age
65+ Age Band %age
Norwood Hospital 110087053 $2,287,479 $2,321 $11,142 $46,733 $2,062,715 $164,568 0.10% 0.49% 2.04% 90.17% 7.20%
Plymouth Hospital 110024453 $978,007 $1,229 $989 $28,174 $944,533 $3,081 0.13% 0.10% 2.88% 96.58% 0.31%
Saint Vincent Hospital 110026781 $2,218,666 $403 $1,721 $81,300 $2,210,853 ($75,611) 0.02% 0.08% 3.66% 99.65% (3.41%)
South Shore Hospital 110024421 $1,786,274 $2,296 $3,599 $12,660 $1,695,075 $72,645 0.13% 0.20% 0.71% 94.89% 4.07%
Southcoast Hospital Group 110022082 $10,460,018 $12,449 $119,987 $216,049 $9,332,372 $779,161 0.12% 1.15% 2.07% 89.22% 7.44%
St.Anne's Hospital 110087082 $2,609,296 $2,943 $20,844 $26,757 $2,114,181 $444,571 0.11% 0.80% 1.03% 81.02% 17.04%
St.Elizabeth's Hospital 110087064 $11,248,444 $9,074 $51,995 $167,094 $9,943,462 $1,076,820 0.08% 0.46% 1.49% 88.40% 9.57%
Sturdy Memorial Hospital 110026743 $2,286,766 $6,554 $36,193 $56,783 $2,161,298 $25,938 0.29% 1.58% 2.48% 94.51% 1.14%
Tufts Medical Center 110020611 $7,496,002 $2,481 $12,961 $83,106 $6,546,677 $850,777 0.03% 0.17% 1.11% 87.34% 11.35%
Umass Memorial Medical Center
110022124 $24,937,931 $25,844 $80,150 $387,287 $23,437,034 $1,007,616 0.10% 0.32% 1.55% 93.98% 4.05%
Winchester Hospital 110024440 $547,256 $151 $6,281 $10,753 $494,993 $35,078 0.03% 1.15% 1.96% 90.45% 6.41%
Wing Memorial Hospital 110024510 $1,751,884 $3,218 $25,361 $40,679 $1,413,630 $268,996 0.18% 1.45% 2.32% 80.69% 15.36%
Total $352,265,773 $925,616 $3,069,599 $6,213,295 $315,615,511 $26,441,751 0.26% 0.87% 1.76% 89.60% 7.51%
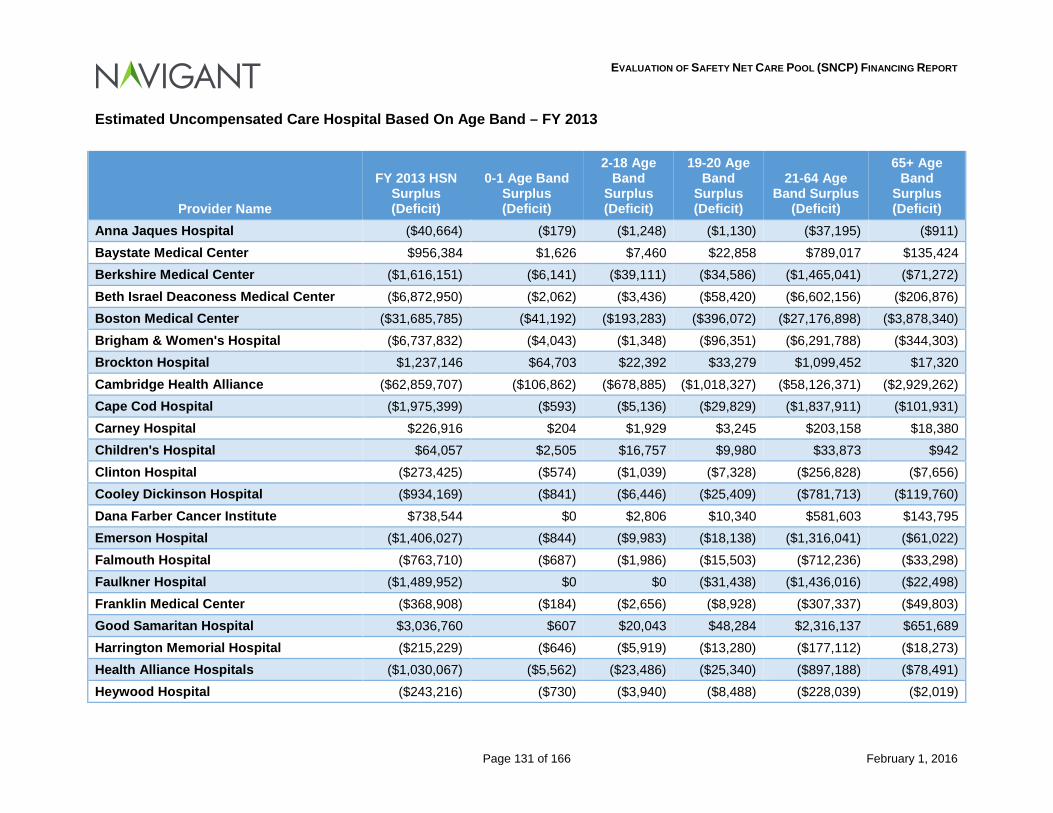
EVALUATION OF SAFETY NET CARE POOL (SNCP) FINANCING REPORT
Page 131 of 166 February 1, 2016
Estimated Uncompensated Care Hospital Based On Age Band – FY 2013
Provider Name
FY 2013 HSN Surplus (Deficit)
0-1 Age Band Surplus (Deficit)
2-18 Age Band
Surplus (Deficit)
19-20 Age Band
Surplus (Deficit)
21-64 Age Band Surplus
(Deficit)
65+ Age Band
Surplus (Deficit)
Anna Jaques Hospital ($40,664) ($179) ($1,248) ($1,130) ($37,195) ($911) Baystate Medical Center $956,384 $1,626 $7,460 $22,858 $789,017 $135,424 Berkshire Medical Center ($1,616,151) ($6,141) ($39,111) ($34,586) ($1,465,041) ($71,272) Beth Israel Deaconess Medical Center ($6,872,950) ($2,062) ($3,436) ($58,420) ($6,602,156) ($206,876) Boston Medical Center ($31,685,785) ($41,192) ($193,283) ($396,072) ($27,176,898) ($3,878,340) Brigham & Women's Hospital ($6,737,832) ($4,043) ($1,348) ($96,351) ($6,291,788) ($344,303) Brockton Hospital $1,237,146 $64,703 $22,392 $33,279 $1,099,452 $17,320 Cambridge Health Alliance ($62,859,707) ($106,862) ($678,885) ($1,018,327) ($58,126,371) ($2,929,262) Cape Cod Hospital ($1,975,399) ($593) ($5,136) ($29,829) ($1,837,911) ($101,931) Carney Hospital $226,916 $204 $1,929 $3,245 $203,158 $18,380 Children's Hospital $64,057 $2,505 $16,757 $9,980 $33,873 $942 Clinton Hospital ($273,425) ($574) ($1,039) ($7,328) ($256,828) ($7,656) Cooley Dickinson Hospital ($934,169) ($841) ($6,446) ($25,409) ($781,713) ($119,760) Dana Farber Cancer Institute $738,544 $0 $2,806 $10,340 $581,603 $143,795 Emerson Hospital ($1,406,027) ($844) ($9,983) ($18,138) ($1,316,041) ($61,022) Falmouth Hospital ($763,710) ($687) ($1,986) ($15,503) ($712,236) ($33,298) Faulkner Hospital ($1,489,952) $0 $0 ($31,438) ($1,436,016) ($22,498) Franklin Medical Center ($368,908) ($184) ($2,656) ($8,928) ($307,337) ($49,803) Good Samaritan Hospital $3,036,760 $607 $20,043 $48,284 $2,316,137 $651,689 Harrington Memorial Hospital ($215,229) ($646) ($5,919) ($13,280) ($177,112) ($18,273) Health Alliance Hospitals ($1,030,067) ($5,562) ($23,486) ($25,340) ($897,188) ($78,491) Heywood Hospital ($243,216) ($730) ($3,940) ($8,488) ($228,039) ($2,019)
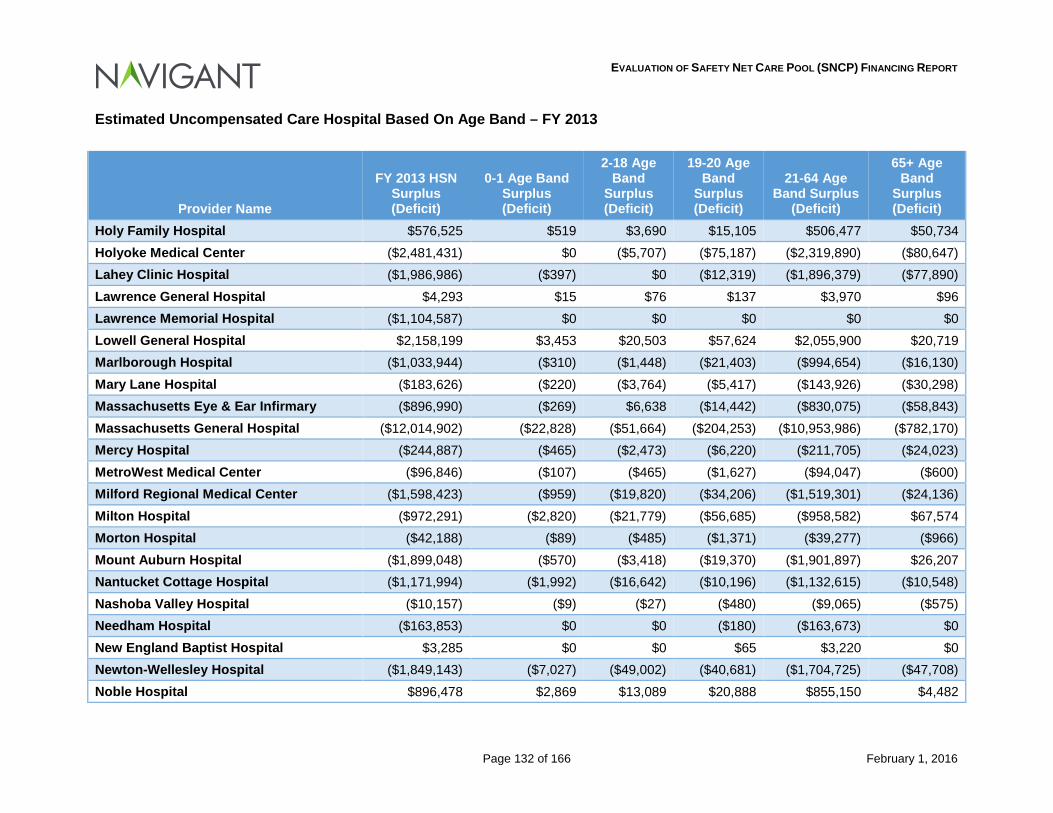
EVALUATION OF SAFETY NET CARE POOL (SNCP) FINANCING REPORT
Page 132 of 166 February 1, 2016
Estimated Uncompensated Care Hospital Based On Age Band – FY 2013
Provider Name
FY 2013 HSN Surplus (Deficit)
0-1 Age Band Surplus (Deficit)
2-18 Age Band
Surplus (Deficit)
19-20 Age Band
Surplus (Deficit)
21-64 Age Band Surplus
(Deficit)
65+ Age Band
Surplus (Deficit)
Holy Family Hospital $576,525 $519 $3,690 $15,105 $506,477 $50,734 Holyoke Medical Center ($2,481,431) $0 ($5,707) ($75,187) ($2,319,890) ($80,647) Lahey Clinic Hospital ($1,986,986) ($397) $0 ($12,319) ($1,896,379) ($77,890) Lawrence General Hospital $4,293 $15 $76 $137 $3,970 $96 Lawrence Memorial Hospital ($1,104,587) $0 $0 $0 $0 $0 Lowell General Hospital $2,158,199 $3,453 $20,503 $57,624 $2,055,900 $20,719 Marlborough Hospital ($1,033,944) ($310) ($1,448) ($21,403) ($994,654) ($16,130) Mary Lane Hospital ($183,626) ($220) ($3,764) ($5,417) ($143,926) ($30,298) Massachusetts Eye & Ear Infirmary ($896,990) ($269) $6,638 ($14,442) ($830,075) ($58,843) Massachusetts General Hospital ($12,014,902) ($22,828) ($51,664) ($204,253) ($10,953,986) ($782,170) Mercy Hospital ($244,887) ($465) ($2,473) ($6,220) ($211,705) ($24,023) MetroWest Medical Center ($96,846) ($107) ($465) ($1,627) ($94,047) ($600) Milford Regional Medical Center ($1,598,423) ($959) ($19,820) ($34,206) ($1,519,301) ($24,136) Milton Hospital ($972,291) ($2,820) ($21,779) ($56,685) ($958,582) $67,574 Morton Hospital ($42,188) ($89) ($485) ($1,371) ($39,277) ($966) Mount Auburn Hospital ($1,899,048) ($570) ($3,418) ($19,370) ($1,901,897) $26,207 Nantucket Cottage Hospital ($1,171,994) ($1,992) ($16,642) ($10,196) ($1,132,615) ($10,548) Nashoba Valley Hospital ($10,157) ($9) ($27) ($480) ($9,065) ($575) Needham Hospital ($163,853) $0 $0 ($180) ($163,673) $0 New England Baptist Hospital $3,285 $0 $0 $65 $3,220 $0 Newton-Wellesley Hospital ($1,849,143) ($7,027) ($49,002) ($40,681) ($1,704,725) ($47,708) Noble Hospital $896,478 $2,869 $13,089 $20,888 $855,150 $4,482
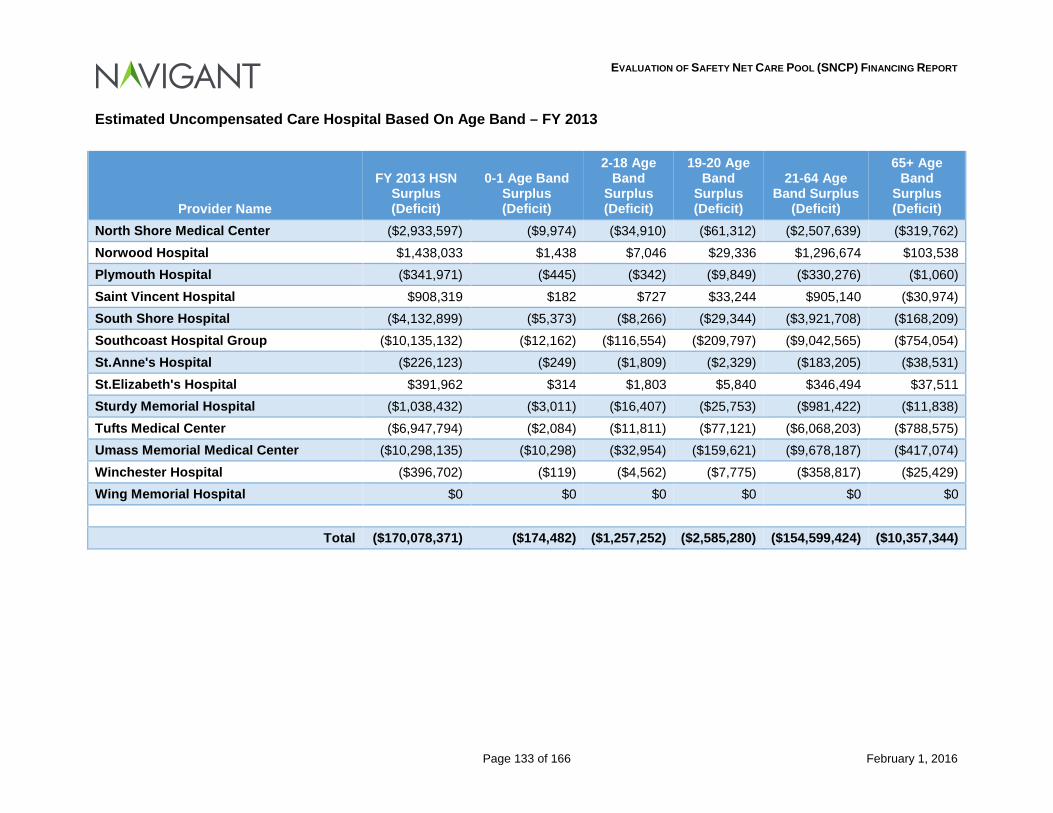
EVALUATION OF SAFETY NET CARE POOL (SNCP) FINANCING REPORT
Page 133 of 166 February 1, 2016
Estimated Uncompensated Care Hospital Based On Age Band – FY 2013
Provider Name
FY 2013 HSN Surplus (Deficit)
0-1 Age Band Surplus (Deficit)
2-18 Age Band
Surplus (Deficit)
19-20 Age Band
Surplus (Deficit)
21-64 Age Band Surplus
(Deficit)
65+ Age Band
Surplus (Deficit)
North Shore Medical Center ($2,933,597) ($9,974) ($34,910) ($61,312) ($2,507,639) ($319,762) Norwood Hospital $1,438,033 $1,438 $7,046 $29,336 $1,296,674 $103,538 Plymouth Hospital ($341,971) ($445) ($342) ($9,849) ($330,276) ($1,060) Saint Vincent Hospital $908,319 $182 $727 $33,244 $905,140 ($30,974) South Shore Hospital ($4,132,899) ($5,373) ($8,266) ($29,344) ($3,921,708) ($168,209) Southcoast Hospital Group ($10,135,132) ($12,162) ($116,554) ($209,797) ($9,042,565) ($754,054) St.Anne's Hospital ($226,123) ($249) ($1,809) ($2,329) ($183,205) ($38,531) St.Elizabeth's Hospital $391,962 $314 $1,803 $5,840 $346,494 $37,511 Sturdy Memorial Hospital ($1,038,432) ($3,011) ($16,407) ($25,753) ($981,422) ($11,838) Tufts Medical Center ($6,947,794) ($2,084) ($11,811) ($77,121) ($6,068,203) ($788,575) Umass Memorial Medical Center ($10,298,135) ($10,298) ($32,954) ($159,621) ($9,678,187) ($417,074) Winchester Hospital ($396,702) ($119) ($4,562) ($7,775) ($358,817) ($25,429) Wing Memorial Hospital $0 $0 $0 $0 $0 $0
Total ($170,078,371) ($174,482) ($1,257,252) ($2,585,280) ($154,599,424) ($10,357,344)
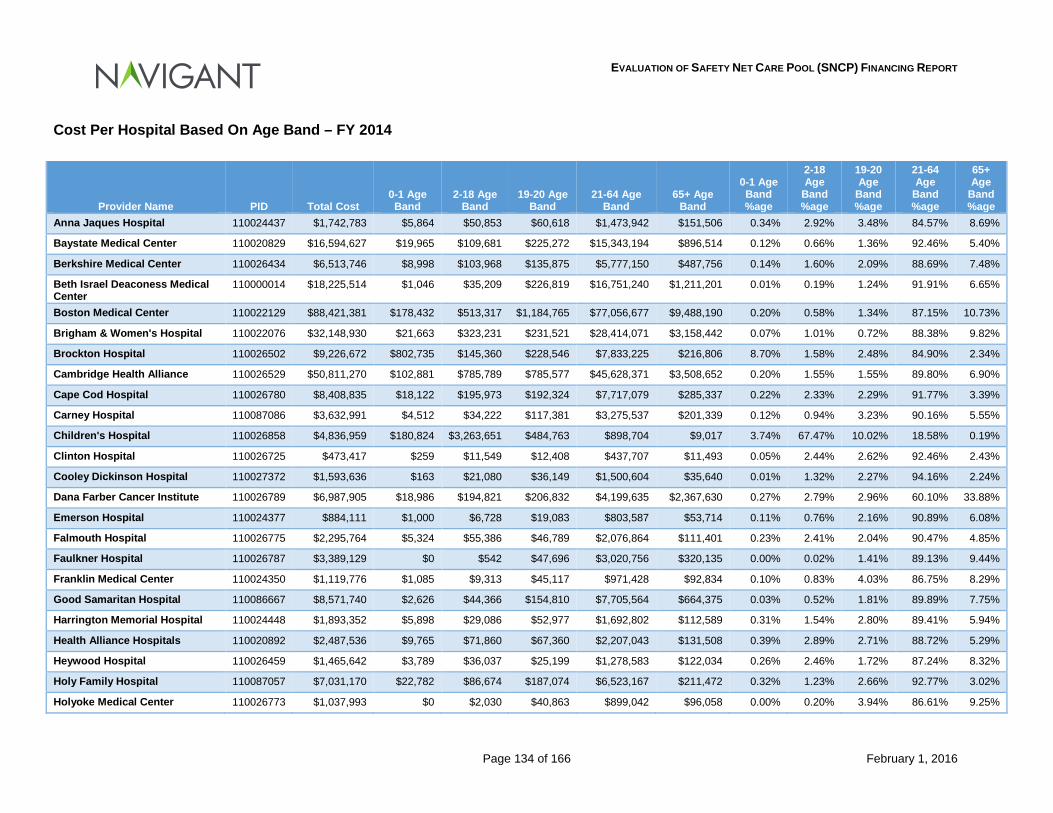
EVALUATION OF SAFETY NET CARE POOL (SNCP) FINANCING REPORT
Page 134 of 166 February 1, 2016
Cost Per Hospital Based On Age Band – FY 2014
Provider Name PID Total Cost 0-1 Age Band
2-18 Age Band
19-20 Age Band
21-64 Age Band
65+ Age Band
0-1 Age Band %age
2-18 Age
Band %age
19-20 Age
Band %age
21-64 Age
Band %age
65+ Age
Band %age
Anna Jaques Hospital 110024437 $1,742,783 $5,864 $50,853 $60,618 $1,473,942 $151,506 0.34% 2.92% 3.48% 84.57% 8.69%
Baystate Medical Center 110020829 $16,594,627 $19,965 $109,681 $225,272 $15,343,194 $896,514 0.12% 0.66% 1.36% 92.46% 5.40%
Berkshire Medical Center 110026434 $6,513,746 $8,998 $103,968 $135,875 $5,777,150 $487,756 0.14% 1.60% 2.09% 88.69% 7.48%
Beth Israel Deaconess Medical Center
110000014 $18,225,514 $1,046 $35,209 $226,819 $16,751,240 $1,211,201 0.01% 0.19% 1.24% 91.91% 6.65%
Boston Medical Center 110022129 $88,421,381 $178,432 $513,317 $1,184,765 $77,056,677 $9,488,190 0.20% 0.58% 1.34% 87.15% 10.73%
Brigham & Women's Hospital 110022076 $32,148,930 $21,663 $323,231 $231,521 $28,414,071 $3,158,442 0.07% 1.01% 0.72% 88.38% 9.82%
Brockton Hospital 110026502 $9,226,672 $802,735 $145,360 $228,546 $7,833,225 $216,806 8.70% 1.58% 2.48% 84.90% 2.34%
Cambridge Health Alliance 110026529 $50,811,270 $102,881 $785,789 $785,577 $45,628,371 $3,508,652 0.20% 1.55% 1.55% 89.80% 6.90%
Cape Cod Hospital 110026780 $8,408,835 $18,122 $195,973 $192,324 $7,717,079 $285,337 0.22% 2.33% 2.29% 91.77% 3.39%
Carney Hospital 110087086 $3,632,991 $4,512 $34,222 $117,381 $3,275,537 $201,339 0.12% 0.94% 3.23% 90.16% 5.55%
Children's Hospital 110026858 $4,836,959 $180,824 $3,263,651 $484,763 $898,704 $9,017 3.74% 67.47% 10.02% 18.58% 0.19%
Clinton Hospital 110026725 $473,417 $259 $11,549 $12,408 $437,707 $11,493 0.05% 2.44% 2.62% 92.46% 2.43%
Cooley Dickinson Hospital 110027372 $1,593,636 $163 $21,080 $36,149 $1,500,604 $35,640 0.01% 1.32% 2.27% 94.16% 2.24%
Dana Farber Cancer Institute 110026789 $6,987,905 $18,986 $194,821 $206,832 $4,199,635 $2,367,630 0.27% 2.79% 2.96% 60.10% 33.88%
Emerson Hospital 110024377 $884,111 $1,000 $6,728 $19,083 $803,587 $53,714 0.11% 0.76% 2.16% 90.89% 6.08%
Falmouth Hospital 110026775 $2,295,764 $5,324 $55,386 $46,789 $2,076,864 $111,401 0.23% 2.41% 2.04% 90.47% 4.85%
Faulkner Hospital 110026787 $3,389,129 $0 $542 $47,696 $3,020,756 $320,135 0.00% 0.02% 1.41% 89.13% 9.44%
Franklin Medical Center 110024350 $1,119,776 $1,085 $9,313 $45,117 $971,428 $92,834 0.10% 0.83% 4.03% 86.75% 8.29%
Good Samaritan Hospital 110086667 $8,571,740 $2,626 $44,366 $154,810 $7,705,564 $664,375 0.03% 0.52% 1.81% 89.89% 7.75%
Harrington Memorial Hospital 110024448 $1,893,352 $5,898 $29,086 $52,977 $1,692,802 $112,589 0.31% 1.54% 2.80% 89.41% 5.94%
Health Alliance Hospitals 110020892 $2,487,536 $9,765 $71,860 $67,360 $2,207,043 $131,508 0.39% 2.89% 2.71% 88.72% 5.29%
Heywood Hospital 110026459 $1,465,642 $3,789 $36,037 $25,199 $1,278,583 $122,034 0.26% 2.46% 1.72% 87.24% 8.32%
Holy Family Hospital 110087057 $7,031,170 $22,782 $86,674 $187,074 $6,523,167 $211,472 0.32% 1.23% 2.66% 92.77% 3.02%
Holyoke Medical Center 110026773 $1,037,993 $0 $2,030 $40,863 $899,042 $96,058 0.00% 0.20% 3.94% 86.61% 9.25%
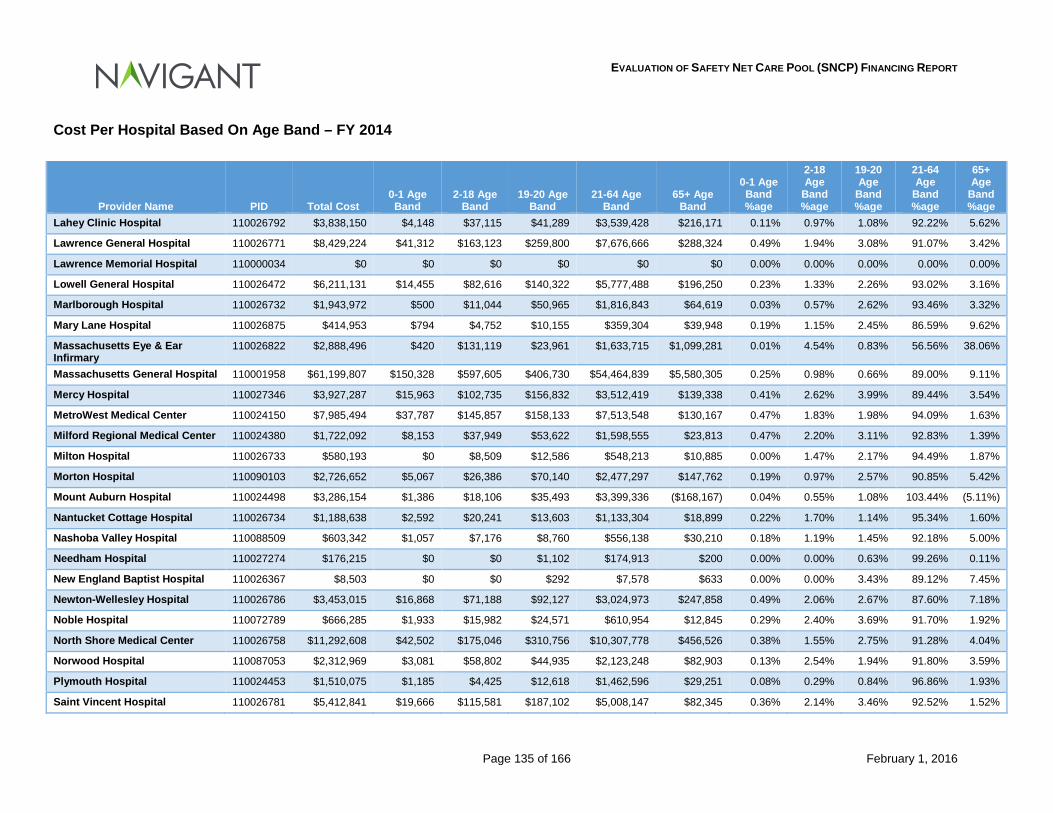
EVALUATION OF SAFETY NET CARE POOL (SNCP) FINANCING REPORT
Page 135 of 166 February 1, 2016
Cost Per Hospital Based On Age Band – FY 2014
Provider Name PID Total Cost 0-1 Age Band
2-18 Age Band
19-20 Age Band
21-64 Age Band
65+ Age Band
0-1 Age Band %age
2-18 Age
Band %age
19-20 Age
Band %age
21-64 Age
Band %age
65+ Age
Band %age
Lahey Clinic Hospital 110026792 $3,838,150 $4,148 $37,115 $41,289 $3,539,428 $216,171 0.11% 0.97% 1.08% 92.22% 5.62%
Lawrence General Hospital 110026771 $8,429,224 $41,312 $163,123 $259,800 $7,676,666 $288,324 0.49% 1.94% 3.08% 91.07% 3.42%
Lawrence Memorial Hospital 110000034 $0 $0 $0 $0 $0 $0 0.00% 0.00% 0.00% 0.00% 0.00%
Lowell General Hospital 110026472 $6,211,131 $14,455 $82,616 $140,322 $5,777,488 $196,250 0.23% 1.33% 2.26% 93.02% 3.16%
Marlborough Hospital 110026732 $1,943,972 $500 $11,044 $50,965 $1,816,843 $64,619 0.03% 0.57% 2.62% 93.46% 3.32%
Mary Lane Hospital 110026875 $414,953 $794 $4,752 $10,155 $359,304 $39,948 0.19% 1.15% 2.45% 86.59% 9.62%
Massachusetts Eye & Ear Infirmary
110026822 $2,888,496 $420 $131,119 $23,961 $1,633,715 $1,099,281 0.01% 4.54% 0.83% 56.56% 38.06%
Massachusetts General Hospital 110001958 $61,199,807 $150,328 $597,605 $406,730 $54,464,839 $5,580,305 0.25% 0.98% 0.66% 89.00% 9.11%
Mercy Hospital 110027346 $3,927,287 $15,963 $102,735 $156,832 $3,512,419 $139,338 0.41% 2.62% 3.99% 89.44% 3.54%
MetroWest Medical Center 110024150 $7,985,494 $37,787 $145,857 $158,133 $7,513,548 $130,167 0.47% 1.83% 1.98% 94.09% 1.63%
Milford Regional Medical Center 110024380 $1,722,092 $8,153 $37,949 $53,622 $1,598,555 $23,813 0.47% 2.20% 3.11% 92.83% 1.39%
Milton Hospital 110026733 $580,193 $0 $8,509 $12,586 $548,213 $10,885 0.00% 1.47% 2.17% 94.49% 1.87%
Morton Hospital 110090103 $2,726,652 $5,067 $26,386 $70,140 $2,477,297 $147,762 0.19% 0.97% 2.57% 90.85% 5.42%
Mount Auburn Hospital 110024498 $3,286,154 $1,386 $18,106 $35,493 $3,399,336 ($168,167) 0.04% 0.55% 1.08% 103.44% (5.11%)
Nantucket Cottage Hospital 110026734 $1,188,638 $2,592 $20,241 $13,603 $1,133,304 $18,899 0.22% 1.70% 1.14% 95.34% 1.60%
Nashoba Valley Hospital 110088509 $603,342 $1,057 $7,176 $8,760 $556,138 $30,210 0.18% 1.19% 1.45% 92.18% 5.00%
Needham Hospital 110027274 $176,215 $0 $0 $1,102 $174,913 $200 0.00% 0.00% 0.63% 99.26% 0.11%
New England Baptist Hospital 110026367 $8,503 $0 $0 $292 $7,578 $633 0.00% 0.00% 3.43% 89.12% 7.45%
Newton-Wellesley Hospital 110026786 $3,453,015 $16,868 $71,188 $92,127 $3,024,973 $247,858 0.49% 2.06% 2.67% 87.60% 7.18%
Noble Hospital 110072789 $666,285 $1,933 $15,982 $24,571 $610,954 $12,845 0.29% 2.40% 3.69% 91.70% 1.92%
North Shore Medical Center 110026758 $11,292,608 $42,502 $175,046 $310,756 $10,307,778 $456,526 0.38% 1.55% 2.75% 91.28% 4.04%
Norwood Hospital 110087053 $2,312,969 $3,081 $58,802 $44,935 $2,123,248 $82,903 0.13% 2.54% 1.94% 91.80% 3.59%
Plymouth Hospital 110024453 $1,510,075 $1,185 $4,425 $12,618 $1,462,596 $29,251 0.08% 0.29% 0.84% 96.86% 1.93%
Saint Vincent Hospital 110026781 $5,412,841 $19,666 $115,581 $187,102 $5,008,147 $82,345 0.36% 2.14% 3.46% 92.52% 1.52%
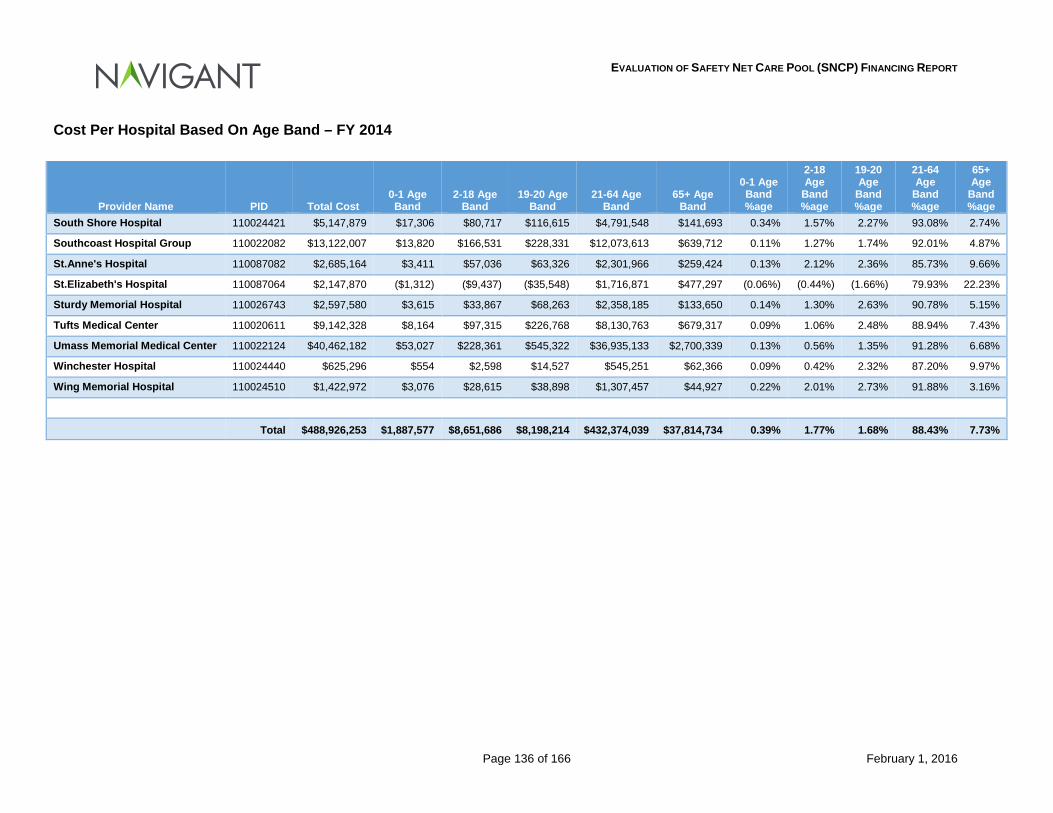
EVALUATION OF SAFETY NET CARE POOL (SNCP) FINANCING REPORT
Page 136 of 166 February 1, 2016
Cost Per Hospital Based On Age Band – FY 2014
Provider Name PID Total Cost 0-1 Age Band
2-18 Age Band
19-20 Age Band
21-64 Age Band
65+ Age Band
0-1 Age Band %age
2-18 Age
Band %age
19-20 Age
Band %age
21-64 Age
Band %age
65+ Age
Band %age
South Shore Hospital 110024421 $5,147,879 $17,306 $80,717 $116,615 $4,791,548 $141,693 0.34% 1.57% 2.27% 93.08% 2.74%
Southcoast Hospital Group 110022082 $13,122,007 $13,820 $166,531 $228,331 $12,073,613 $639,712 0.11% 1.27% 1.74% 92.01% 4.87%
St.Anne's Hospital 110087082 $2,685,164 $3,411 $57,036 $63,326 $2,301,966 $259,424 0.13% 2.12% 2.36% 85.73% 9.66%
St.Elizabeth's Hospital 110087064 $2,147,870 ($1,312) ($9,437) ($35,548) $1,716,871 $477,297 (0.06%) (0.44%) (1.66%) 79.93% 22.23%
Sturdy Memorial Hospital 110026743 $2,597,580 $3,615 $33,867 $68,263 $2,358,185 $133,650 0.14% 1.30% 2.63% 90.78% 5.15%
Tufts Medical Center 110020611 $9,142,328 $8,164 $97,315 $226,768 $8,130,763 $679,317 0.09% 1.06% 2.48% 88.94% 7.43%
Umass Memorial Medical Center 110022124 $40,462,182 $53,027 $228,361 $545,322 $36,935,133 $2,700,339 0.13% 0.56% 1.35% 91.28% 6.68%
Winchester Hospital 110024440 $625,296 $554 $2,598 $14,527 $545,251 $62,366 0.09% 0.42% 2.32% 87.20% 9.97%
Wing Memorial Hospital 110024510 $1,422,972 $3,076 $28,615 $38,898 $1,307,457 $44,927 0.22% 2.01% 2.73% 91.88% 3.16%
Total $488,926,253 $1,887,577 $8,651,686 $8,198,214 $432,374,039 $37,814,734 0.39% 1.77% 1.68% 88.43% 7.73%
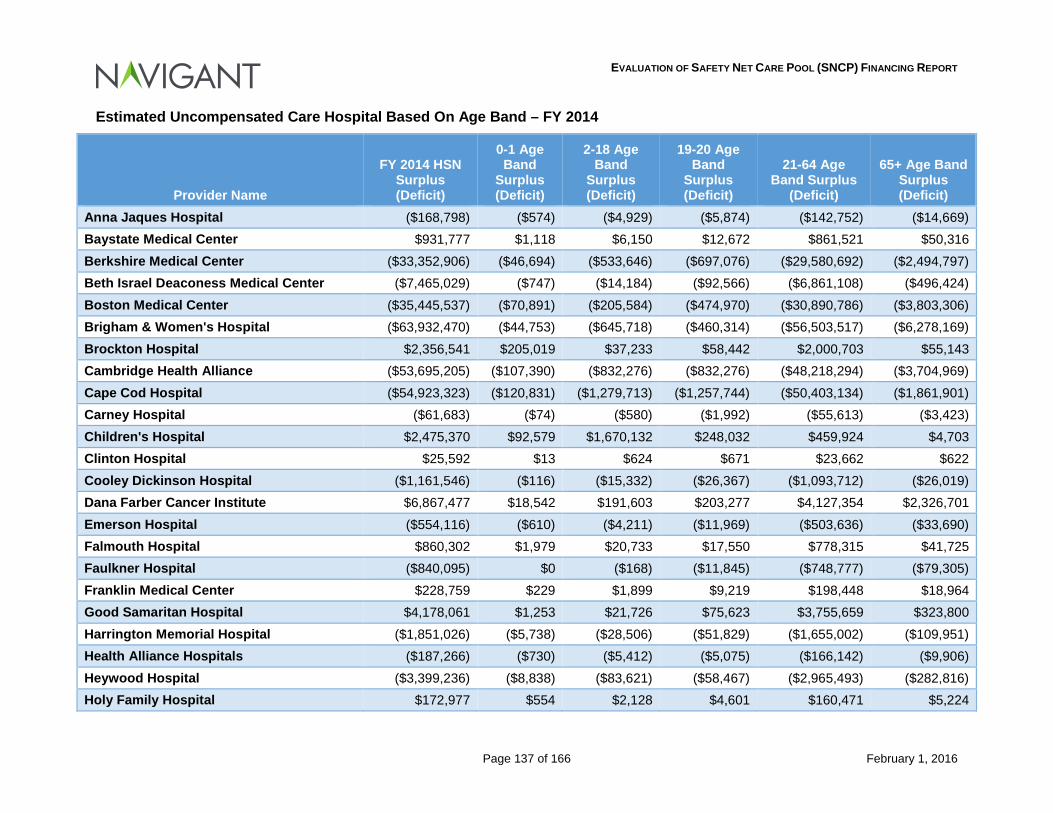
EVALUATION OF SAFETY NET CARE POOL (SNCP) FINANCING REPORT
Page 137 of 166 February 1, 2016
Estimated Uncompensated Care Hospital Based On Age Band – FY 2014
Provider Name
FY 2014 HSN Surplus (Deficit)
0-1 Age Band
Surplus (Deficit)
2-18 Age Band
Surplus (Deficit)
19-20 Age Band
Surplus (Deficit)
21-64 Age Band Surplus
(Deficit)
65+ Age Band Surplus (Deficit)
Anna Jaques Hospital ($168,798) ($574) ($4,929) ($5,874) ($142,752) ($14,669) Baystate Medical Center $931,777 $1,118 $6,150 $12,672 $861,521 $50,316 Berkshire Medical Center ($33,352,906) ($46,694) ($533,646) ($697,076) ($29,580,692) ($2,494,797) Beth Israel Deaconess Medical Center ($7,465,029) ($747) ($14,184) ($92,566) ($6,861,108) ($496,424) Boston Medical Center ($35,445,537) ($70,891) ($205,584) ($474,970) ($30,890,786) ($3,803,306) Brigham & Women's Hospital ($63,932,470) ($44,753) ($645,718) ($460,314) ($56,503,517) ($6,278,169) Brockton Hospital $2,356,541 $205,019 $37,233 $58,442 $2,000,703 $55,143 Cambridge Health Alliance ($53,695,205) ($107,390) ($832,276) ($832,276) ($48,218,294) ($3,704,969) Cape Cod Hospital ($54,923,323) ($120,831) ($1,279,713) ($1,257,744) ($50,403,134) ($1,861,901) Carney Hospital ($61,683) ($74) ($580) ($1,992) ($55,613) ($3,423) Children's Hospital $2,475,370 $92,579 $1,670,132 $248,032 $459,924 $4,703 Clinton Hospital $25,592 $13 $624 $671 $23,662 $622 Cooley Dickinson Hospital ($1,161,546) ($116) ($15,332) ($26,367) ($1,093,712) ($26,019) Dana Farber Cancer Institute $6,867,477 $18,542 $191,603 $203,277 $4,127,354 $2,326,701 Emerson Hospital ($554,116) ($610) ($4,211) ($11,969) ($503,636) ($33,690) Falmouth Hospital $860,302 $1,979 $20,733 $17,550 $778,315 $41,725 Faulkner Hospital ($840,095) $0 ($168) ($11,845) ($748,777) ($79,305) Franklin Medical Center $228,759 $229 $1,899 $9,219 $198,448 $18,964 Good Samaritan Hospital $4,178,061 $1,253 $21,726 $75,623 $3,755,659 $323,800 Harrington Memorial Hospital ($1,851,026) ($5,738) ($28,506) ($51,829) ($1,655,002) ($109,951) Health Alliance Hospitals ($187,266) ($730) ($5,412) ($5,075) ($166,142) ($9,906) Heywood Hospital ($3,399,236) ($8,838) ($83,621) ($58,467) ($2,965,493) ($282,816) Holy Family Hospital $172,977 $554 $2,128 $4,601 $160,471 $5,224
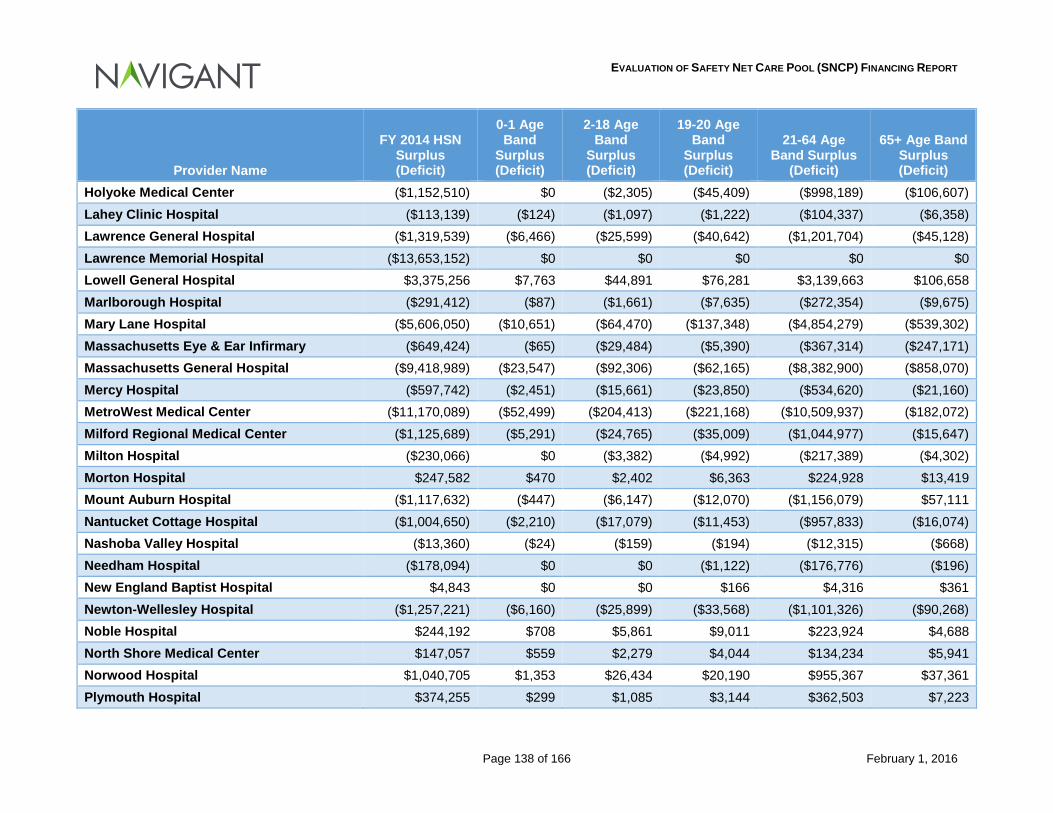
EVALUATION OF SAFETY NET CARE POOL (SNCP) FINANCING REPORT
Page 138 of 166 February 1, 2016
Provider Name
FY 2014 HSN Surplus (Deficit)
0-1 Age Band
Surplus (Deficit)
2-18 Age Band
Surplus (Deficit)
19-20 Age Band
Surplus (Deficit)
21-64 Age Band Surplus
(Deficit)
65+ Age Band Surplus (Deficit)
Holyoke Medical Center ($1,152,510) $0 ($2,305) ($45,409) ($998,189) ($106,607) Lahey Clinic Hospital ($113,139) ($124) ($1,097) ($1,222) ($104,337) ($6,358) Lawrence General Hospital ($1,319,539) ($6,466) ($25,599) ($40,642) ($1,201,704) ($45,128) Lawrence Memorial Hospital ($13,653,152) $0 $0 $0 $0 $0 Lowell General Hospital $3,375,256 $7,763 $44,891 $76,281 $3,139,663 $106,658 Marlborough Hospital ($291,412) ($87) ($1,661) ($7,635) ($272,354) ($9,675) Mary Lane Hospital ($5,606,050) ($10,651) ($64,470) ($137,348) ($4,854,279) ($539,302) Massachusetts Eye & Ear Infirmary ($649,424) ($65) ($29,484) ($5,390) ($367,314) ($247,171) Massachusetts General Hospital ($9,418,989) ($23,547) ($92,306) ($62,165) ($8,382,900) ($858,070) Mercy Hospital ($597,742) ($2,451) ($15,661) ($23,850) ($534,620) ($21,160) MetroWest Medical Center ($11,170,089) ($52,499) ($204,413) ($221,168) ($10,509,937) ($182,072) Milford Regional Medical Center ($1,125,689) ($5,291) ($24,765) ($35,009) ($1,044,977) ($15,647) Milton Hospital ($230,066) $0 ($3,382) ($4,992) ($217,389) ($4,302) Morton Hospital $247,582 $470 $2,402 $6,363 $224,928 $13,419 Mount Auburn Hospital ($1,117,632) ($447) ($6,147) ($12,070) ($1,156,079) $57,111 Nantucket Cottage Hospital ($1,004,650) ($2,210) ($17,079) ($11,453) ($957,833) ($16,074) Nashoba Valley Hospital ($13,360) ($24) ($159) ($194) ($12,315) ($668) Needham Hospital ($178,094) $0 $0 ($1,122) ($176,776) ($196) New England Baptist Hospital $4,843 $0 $0 $166 $4,316 $361 Newton-Wellesley Hospital ($1,257,221) ($6,160) ($25,899) ($33,568) ($1,101,326) ($90,268) Noble Hospital $244,192 $708 $5,861 $9,011 $223,924 $4,688 North Shore Medical Center $147,057 $559 $2,279 $4,044 $134,234 $5,941 Norwood Hospital $1,040,705 $1,353 $26,434 $20,190 $955,367 $37,361 Plymouth Hospital $374,255 $299 $1,085 $3,144 $362,503 $7,223
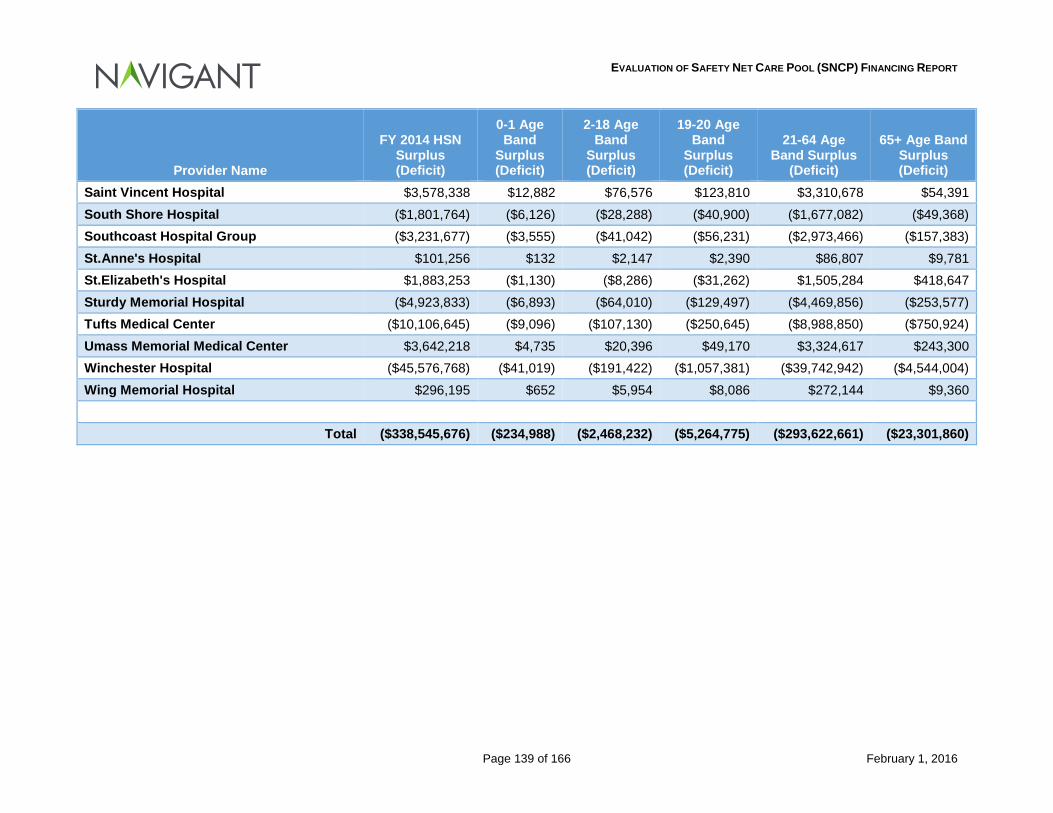
EVALUATION OF SAFETY NET CARE POOL (SNCP) FINANCING REPORT
Page 139 of 166 February 1, 2016
Provider Name
FY 2014 HSN Surplus (Deficit)
0-1 Age Band
Surplus (Deficit)
2-18 Age Band
Surplus (Deficit)
19-20 Age Band
Surplus (Deficit)
21-64 Age Band Surplus
(Deficit)
65+ Age Band Surplus (Deficit)
Saint Vincent Hospital $3,578,338 $12,882 $76,576 $123,810 $3,310,678 $54,391 South Shore Hospital ($1,801,764) ($6,126) ($28,288) ($40,900) ($1,677,082) ($49,368) Southcoast Hospital Group ($3,231,677) ($3,555) ($41,042) ($56,231) ($2,973,466) ($157,383) St.Anne's Hospital $101,256 $132 $2,147 $2,390 $86,807 $9,781 St.Elizabeth's Hospital $1,883,253 ($1,130) ($8,286) ($31,262) $1,505,284 $418,647 Sturdy Memorial Hospital ($4,923,833) ($6,893) ($64,010) ($129,497) ($4,469,856) ($253,577) Tufts Medical Center ($10,106,645) ($9,096) ($107,130) ($250,645) ($8,988,850) ($750,924) Umass Memorial Medical Center $3,642,218 $4,735 $20,396 $49,170 $3,324,617 $243,300 Winchester Hospital ($45,576,768) ($41,019) ($191,422) ($1,057,381) ($39,742,942) ($4,544,004) Wing Memorial Hospital $296,195 $652 $5,954 $8,086 $272,144 $9,360
Total ($338,545,676) ($234,988) ($2,468,232) ($5,264,775) ($293,622,661) ($23,301,860)
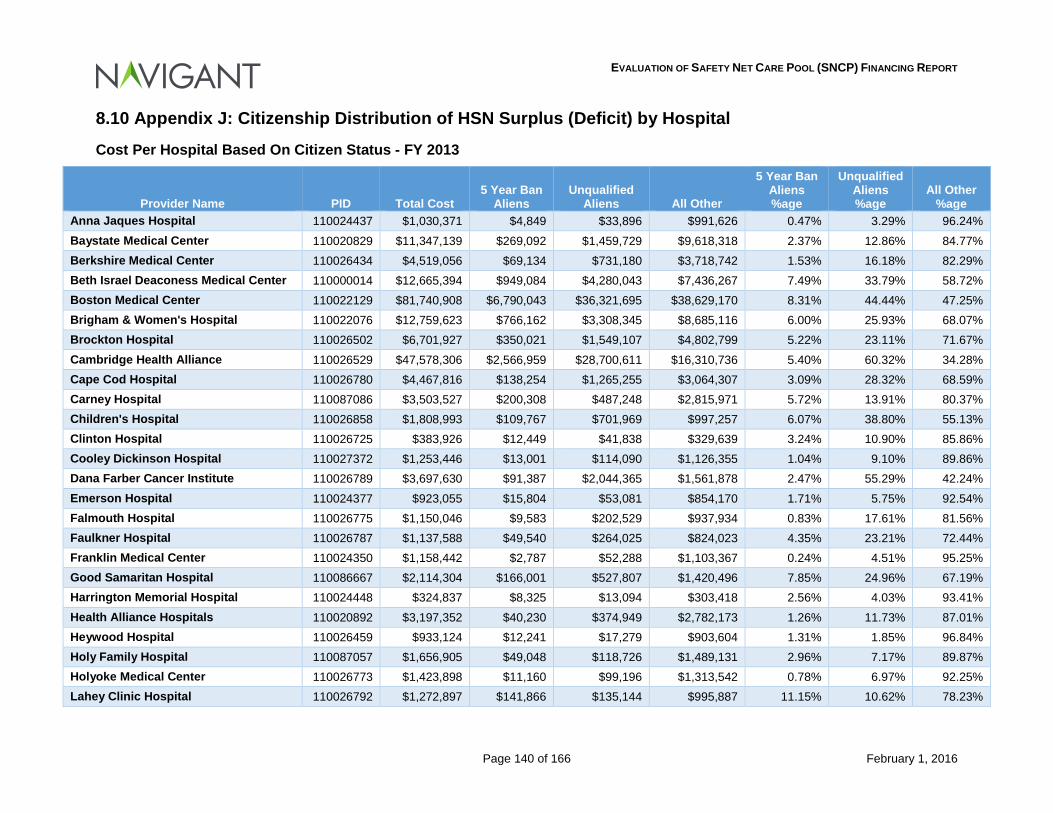
EVALUATION OF SAFETY NET CARE POOL (SNCP) FINANCING REPORT
Page 140 of 166 February 1, 2016
8.10 Appendix J: Citizenship Distribution of HSN Surplus (Deficit) by Hospital
Cost Per Hospital Based On Citizen Status - FY 2013
Provider Name PID Total Cost 5 Year Ban
Aliens Unqualified
Aliens All Other
5 Year Ban Aliens %age
Unqualified Aliens %age
All Other %age
Anna Jaques Hospital 110024437 $1,030,371 $4,849 $33,896 $991,626 0.47% 3.29% 96.24% Baystate Medical Center 110020829 $11,347,139 $269,092 $1,459,729 $9,618,318 2.37% 12.86% 84.77% Berkshire Medical Center 110026434 $4,519,056 $69,134 $731,180 $3,718,742 1.53% 16.18% 82.29% Beth Israel Deaconess Medical Center 110000014 $12,665,394 $949,084 $4,280,043 $7,436,267 7.49% 33.79% 58.72% Boston Medical Center 110022129 $81,740,908 $6,790,043 $36,321,695 $38,629,170 8.31% 44.44% 47.25% Brigham & Women's Hospital 110022076 $12,759,623 $766,162 $3,308,345 $8,685,116 6.00% 25.93% 68.07% Brockton Hospital 110026502 $6,701,927 $350,021 $1,549,107 $4,802,799 5.22% 23.11% 71.67% Cambridge Health Alliance 110026529 $47,578,306 $2,566,959 $28,700,611 $16,310,736 5.40% 60.32% 34.28% Cape Cod Hospital 110026780 $4,467,816 $138,254 $1,265,255 $3,064,307 3.09% 28.32% 68.59% Carney Hospital 110087086 $3,503,527 $200,308 $487,248 $2,815,971 5.72% 13.91% 80.37% Children's Hospital 110026858 $1,808,993 $109,767 $701,969 $997,257 6.07% 38.80% 55.13% Clinton Hospital 110026725 $383,926 $12,449 $41,838 $329,639 3.24% 10.90% 85.86% Cooley Dickinson Hospital 110027372 $1,253,446 $13,001 $114,090 $1,126,355 1.04% 9.10% 89.86% Dana Farber Cancer Institute 110026789 $3,697,630 $91,387 $2,044,365 $1,561,878 2.47% 55.29% 42.24% Emerson Hospital 110024377 $923,055 $15,804 $53,081 $854,170 1.71% 5.75% 92.54% Falmouth Hospital 110026775 $1,150,046 $9,583 $202,529 $937,934 0.83% 17.61% 81.56% Faulkner Hospital 110026787 $1,137,588 $49,540 $264,025 $824,023 4.35% 23.21% 72.44% Franklin Medical Center 110024350 $1,158,442 $2,787 $52,288 $1,103,367 0.24% 4.51% 95.25% Good Samaritan Hospital 110086667 $2,114,304 $166,001 $527,807 $1,420,496 7.85% 24.96% 67.19% Harrington Memorial Hospital 110024448 $324,837 $8,325 $13,094 $303,418 2.56% 4.03% 93.41% Health Alliance Hospitals 110020892 $3,197,352 $40,230 $374,949 $2,782,173 1.26% 11.73% 87.01% Heywood Hospital 110026459 $933,124 $12,241 $17,279 $903,604 1.31% 1.85% 96.84% Holy Family Hospital 110087057 $1,656,905 $49,048 $118,726 $1,489,131 2.96% 7.17% 89.87% Holyoke Medical Center 110026773 $1,423,898 $11,160 $99,196 $1,313,542 0.78% 6.97% 92.25% Lahey Clinic Hospital 110026792 $1,272,897 $141,866 $135,144 $995,887 11.15% 10.62% 78.23%
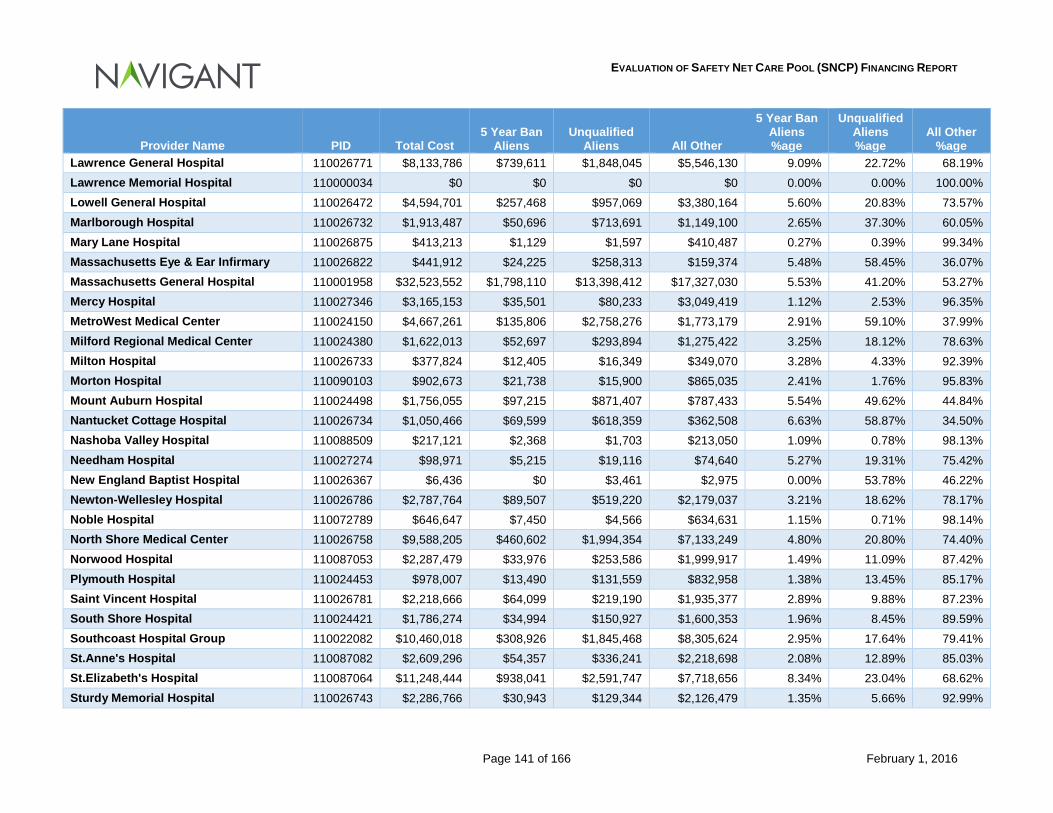
EVALUATION OF SAFETY NET CARE POOL (SNCP) FINANCING REPORT
Page 141 of 166 February 1, 2016
Provider Name PID Total Cost 5 Year Ban
Aliens Unqualified
Aliens All Other
5 Year Ban Aliens %age
Unqualified Aliens %age
All Other %age
Lawrence General Hospital 110026771 $8,133,786 $739,611 $1,848,045 $5,546,130 9.09% 22.72% 68.19% Lawrence Memorial Hospital 110000034 $0 $0 $0 $0 0.00% 0.00% 100.00% Lowell General Hospital 110026472 $4,594,701 $257,468 $957,069 $3,380,164 5.60% 20.83% 73.57% Marlborough Hospital 110026732 $1,913,487 $50,696 $713,691 $1,149,100 2.65% 37.30% 60.05% Mary Lane Hospital 110026875 $413,213 $1,129 $1,597 $410,487 0.27% 0.39% 99.34% Massachusetts Eye & Ear Infirmary 110026822 $441,912 $24,225 $258,313 $159,374 5.48% 58.45% 36.07% Massachusetts General Hospital 110001958 $32,523,552 $1,798,110 $13,398,412 $17,327,030 5.53% 41.20% 53.27% Mercy Hospital 110027346 $3,165,153 $35,501 $80,233 $3,049,419 1.12% 2.53% 96.35% MetroWest Medical Center 110024150 $4,667,261 $135,806 $2,758,276 $1,773,179 2.91% 59.10% 37.99% Milford Regional Medical Center 110024380 $1,622,013 $52,697 $293,894 $1,275,422 3.25% 18.12% 78.63% Milton Hospital 110026733 $377,824 $12,405 $16,349 $349,070 3.28% 4.33% 92.39% Morton Hospital 110090103 $902,673 $21,738 $15,900 $865,035 2.41% 1.76% 95.83% Mount Auburn Hospital 110024498 $1,756,055 $97,215 $871,407 $787,433 5.54% 49.62% 44.84% Nantucket Cottage Hospital 110026734 $1,050,466 $69,599 $618,359 $362,508 6.63% 58.87% 34.50% Nashoba Valley Hospital 110088509 $217,121 $2,368 $1,703 $213,050 1.09% 0.78% 98.13% Needham Hospital 110027274 $98,971 $5,215 $19,116 $74,640 5.27% 19.31% 75.42% New England Baptist Hospital 110026367 $6,436 $0 $3,461 $2,975 0.00% 53.78% 46.22% Newton-Wellesley Hospital 110026786 $2,787,764 $89,507 $519,220 $2,179,037 3.21% 18.62% 78.17% Noble Hospital 110072789 $646,647 $7,450 $4,566 $634,631 1.15% 0.71% 98.14% North Shore Medical Center 110026758 $9,588,205 $460,602 $1,994,354 $7,133,249 4.80% 20.80% 74.40% Norwood Hospital 110087053 $2,287,479 $33,976 $253,586 $1,999,917 1.49% 11.09% 87.42% Plymouth Hospital 110024453 $978,007 $13,490 $131,559 $832,958 1.38% 13.45% 85.17% Saint Vincent Hospital 110026781 $2,218,666 $64,099 $219,190 $1,935,377 2.89% 9.88% 87.23% South Shore Hospital 110024421 $1,786,274 $34,994 $150,927 $1,600,353 1.96% 8.45% 89.59% Southcoast Hospital Group 110022082 $10,460,018 $308,926 $1,845,468 $8,305,624 2.95% 17.64% 79.41% St.Anne's Hospital 110087082 $2,609,296 $54,357 $336,241 $2,218,698 2.08% 12.89% 85.03% St.Elizabeth's Hospital 110087064 $11,248,444 $938,041 $2,591,747 $7,718,656 8.34% 23.04% 68.62% Sturdy Memorial Hospital 110026743 $2,286,766 $30,943 $129,344 $2,126,479 1.35% 5.66% 92.99%
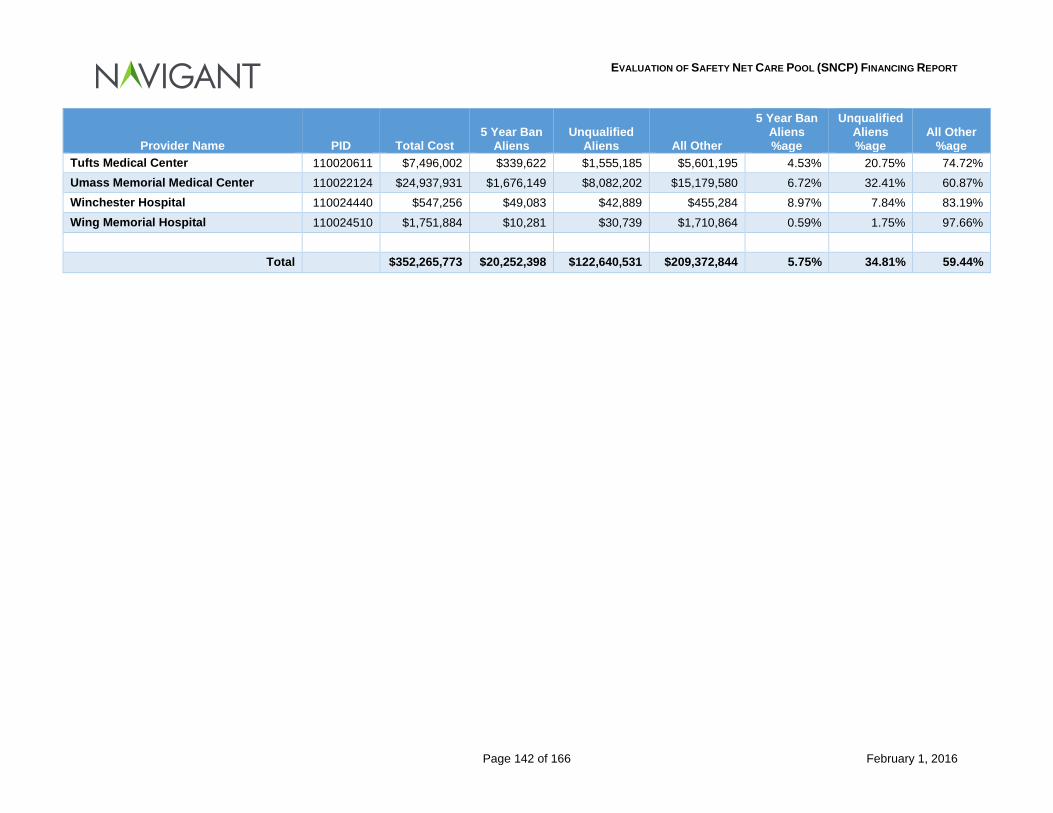
EVALUATION OF SAFETY NET CARE POOL (SNCP) FINANCING REPORT
Page 142 of 166 February 1, 2016
Provider Name PID Total Cost 5 Year Ban
Aliens Unqualified
Aliens All Other
5 Year Ban Aliens %age
Unqualified Aliens %age
All Other %age
Tufts Medical Center 110020611 $7,496,002 $339,622 $1,555,185 $5,601,195 4.53% 20.75% 74.72% Umass Memorial Medical Center 110022124 $24,937,931 $1,676,149 $8,082,202 $15,179,580 6.72% 32.41% 60.87% Winchester Hospital 110024440 $547,256 $49,083 $42,889 $455,284 8.97% 7.84% 83.19% Wing Memorial Hospital 110024510 $1,751,884 $10,281 $30,739 $1,710,864 0.59% 1.75% 97.66%
Total $352,265,773 $20,252,398 $122,640,531 $209,372,844 5.75% 34.81% 59.44%
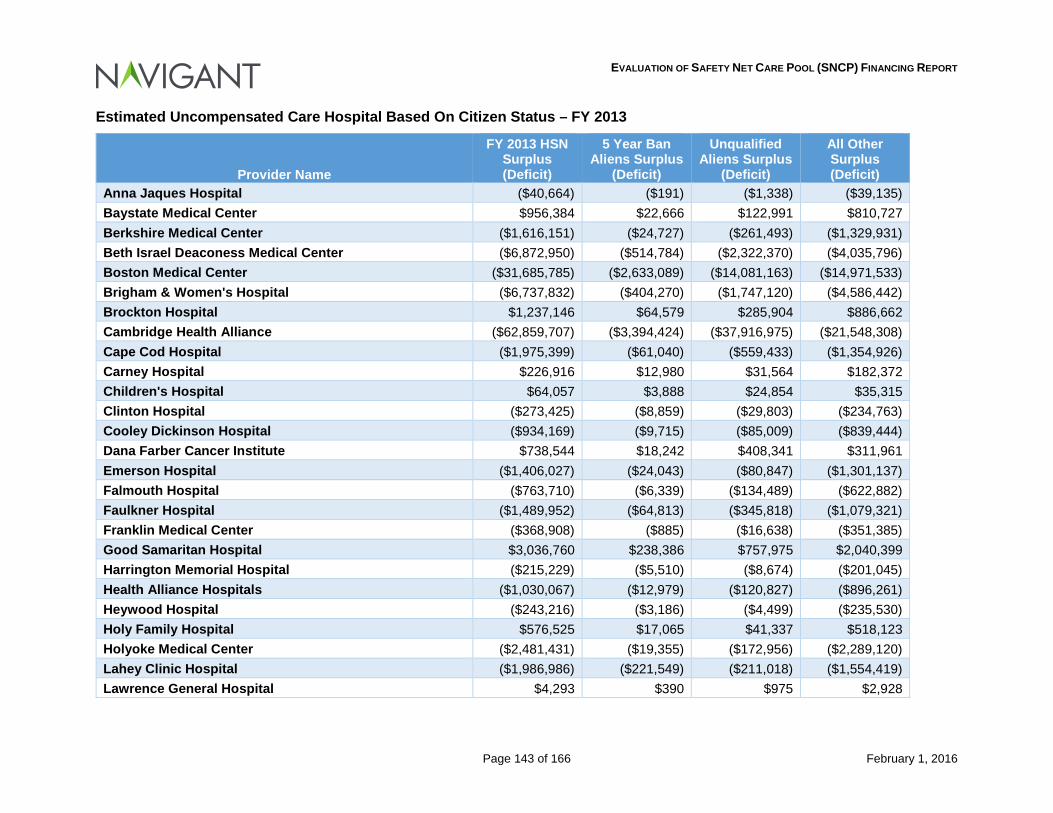
EVALUATION OF SAFETY NET CARE POOL (SNCP) FINANCING REPORT
Page 143 of 166 February 1, 2016
Estimated Uncompensated Care Hospital Based On Citizen Status – FY 2013
Provider Name
FY 2013 HSN Surplus (Deficit)
5 Year Ban Aliens Surplus
(Deficit)
Unqualified Aliens Surplus
(Deficit)
All Other Surplus (Deficit)
Anna Jaques Hospital ($40,664) ($191) ($1,338) ($39,135) Baystate Medical Center $956,384 $22,666 $122,991 $810,727 Berkshire Medical Center ($1,616,151) ($24,727) ($261,493) ($1,329,931) Beth Israel Deaconess Medical Center ($6,872,950) ($514,784) ($2,322,370) ($4,035,796) Boston Medical Center ($31,685,785) ($2,633,089) ($14,081,163) ($14,971,533) Brigham & Women's Hospital ($6,737,832) ($404,270) ($1,747,120) ($4,586,442) Brockton Hospital $1,237,146 $64,579 $285,904 $886,662 Cambridge Health Alliance ($62,859,707) ($3,394,424) ($37,916,975) ($21,548,308) Cape Cod Hospital ($1,975,399) ($61,040) ($559,433) ($1,354,926) Carney Hospital $226,916 $12,980 $31,564 $182,372 Children's Hospital $64,057 $3,888 $24,854 $35,315 Clinton Hospital ($273,425) ($8,859) ($29,803) ($234,763) Cooley Dickinson Hospital ($934,169) ($9,715) ($85,009) ($839,444) Dana Farber Cancer Institute $738,544 $18,242 $408,341 $311,961 Emerson Hospital ($1,406,027) ($24,043) ($80,847) ($1,301,137) Falmouth Hospital ($763,710) ($6,339) ($134,489) ($622,882) Faulkner Hospital ($1,489,952) ($64,813) ($345,818) ($1,079,321) Franklin Medical Center ($368,908) ($885) ($16,638) ($351,385) Good Samaritan Hospital $3,036,760 $238,386 $757,975 $2,040,399 Harrington Memorial Hospital ($215,229) ($5,510) ($8,674) ($201,045) Health Alliance Hospitals ($1,030,067) ($12,979) ($120,827) ($896,261) Heywood Hospital ($243,216) ($3,186) ($4,499) ($235,530) Holy Family Hospital $576,525 $17,065 $41,337 $518,123 Holyoke Medical Center ($2,481,431) ($19,355) ($172,956) ($2,289,120) Lahey Clinic Hospital ($1,986,986) ($221,549) ($211,018) ($1,554,419) Lawrence General Hospital $4,293 $390 $975 $2,928
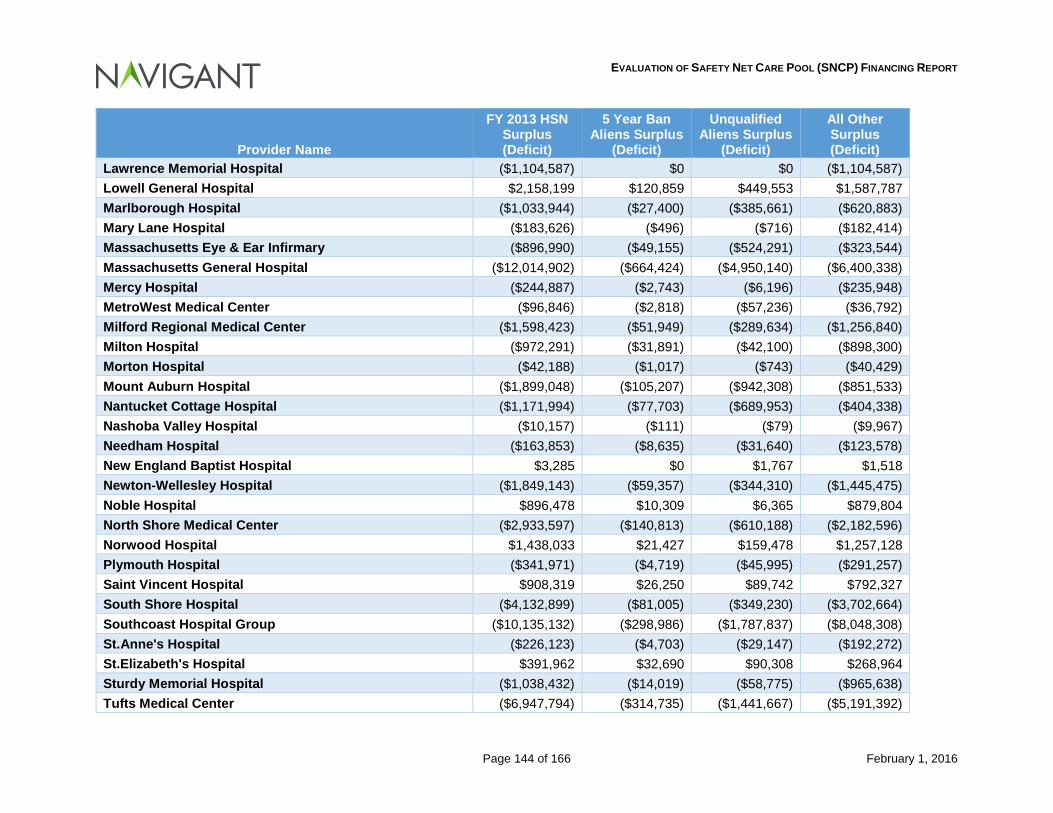
EVALUATION OF SAFETY NET CARE POOL (SNCP) FINANCING REPORT
Page 144 of 166 February 1, 2016
Provider Name
FY 2013 HSN Surplus (Deficit)
5 Year Ban Aliens Surplus
(Deficit)
Unqualified Aliens Surplus
(Deficit)
All Other Surplus (Deficit)
Lawrence Memorial Hospital ($1,104,587) $0 $0 ($1,104,587) Lowell General Hospital $2,158,199 $120,859 $449,553 $1,587,787 Marlborough Hospital ($1,033,944) ($27,400) ($385,661) ($620,883) Mary Lane Hospital ($183,626) ($496) ($716) ($182,414) Massachusetts Eye & Ear Infirmary ($896,990) ($49,155) ($524,291) ($323,544) Massachusetts General Hospital ($12,014,902) ($664,424) ($4,950,140) ($6,400,338) Mercy Hospital ($244,887) ($2,743) ($6,196) ($235,948) MetroWest Medical Center ($96,846) ($2,818) ($57,236) ($36,792) Milford Regional Medical Center ($1,598,423) ($51,949) ($289,634) ($1,256,840) Milton Hospital ($972,291) ($31,891) ($42,100) ($898,300) Morton Hospital ($42,188) ($1,017) ($743) ($40,429) Mount Auburn Hospital ($1,899,048) ($105,207) ($942,308) ($851,533) Nantucket Cottage Hospital ($1,171,994) ($77,703) ($689,953) ($404,338) Nashoba Valley Hospital ($10,157) ($111) ($79) ($9,967) Needham Hospital ($163,853) ($8,635) ($31,640) ($123,578) New England Baptist Hospital $3,285 $0 $1,767 $1,518 Newton-Wellesley Hospital ($1,849,143) ($59,357) ($344,310) ($1,445,475) Noble Hospital $896,478 $10,309 $6,365 $879,804 North Shore Medical Center ($2,933,597) ($140,813) ($610,188) ($2,182,596) Norwood Hospital $1,438,033 $21,427 $159,478 $1,257,128 Plymouth Hospital ($341,971) ($4,719) ($45,995) ($291,257) Saint Vincent Hospital $908,319 $26,250 $89,742 $792,327 South Shore Hospital ($4,132,899) ($81,005) ($349,230) ($3,702,664) Southcoast Hospital Group ($10,135,132) ($298,986) ($1,787,837) ($8,048,308) St.Anne's Hospital ($226,123) ($4,703) ($29,147) ($192,272) St.Elizabeth's Hospital $391,962 $32,690 $90,308 $268,964 Sturdy Memorial Hospital ($1,038,432) ($14,019) ($58,775) ($965,638) Tufts Medical Center ($6,947,794) ($314,735) ($1,441,667) ($5,191,392)
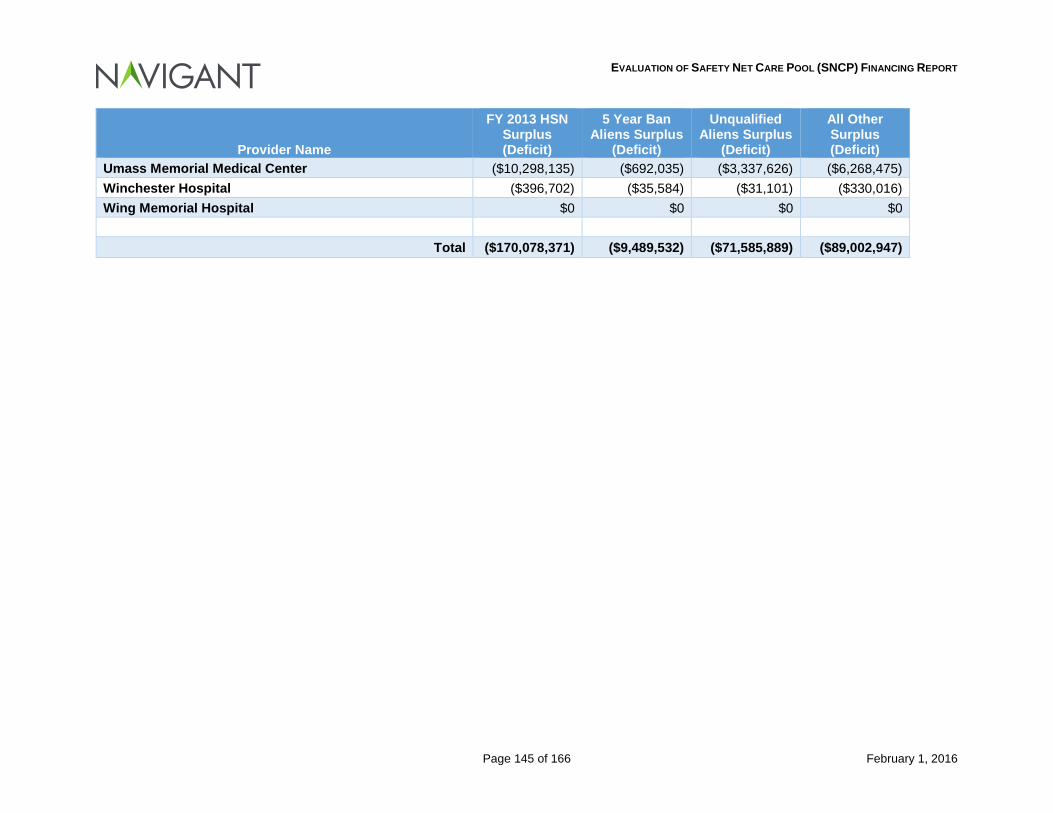
EVALUATION OF SAFETY NET CARE POOL (SNCP) FINANCING REPORT
Page 145 of 166 February 1, 2016
Provider Name
FY 2013 HSN Surplus (Deficit)
5 Year Ban Aliens Surplus
(Deficit)
Unqualified Aliens Surplus
(Deficit)
All Other Surplus (Deficit)
Umass Memorial Medical Center ($10,298,135) ($692,035) ($3,337,626) ($6,268,475) Winchester Hospital ($396,702) ($35,584) ($31,101) ($330,016) Wing Memorial Hospital $0 $0 $0 $0
Total ($170,078,371) ($9,489,532) ($71,585,889) ($89,002,947)
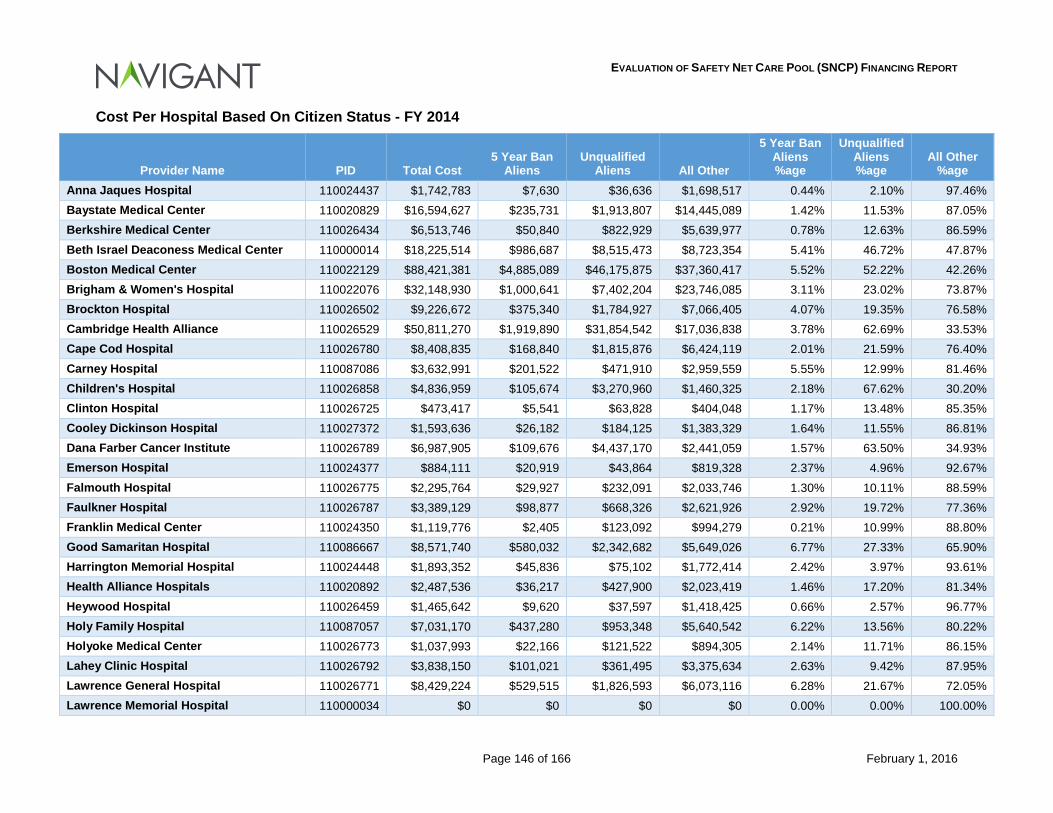
EVALUATION OF SAFETY NET CARE POOL (SNCP) FINANCING REPORT
Page 146 of 166 February 1, 2016
Cost Per Hospital Based On Citizen Status - FY 2014
Provider Name PID Total Cost 5 Year Ban
Aliens Unqualified
Aliens All Other
5 Year Ban Aliens %age
Unqualified Aliens %age
All Other %age
Anna Jaques Hospital 110024437 $1,742,783 $7,630 $36,636 $1,698,517 0.44% 2.10% 97.46% Baystate Medical Center 110020829 $16,594,627 $235,731 $1,913,807 $14,445,089 1.42% 11.53% 87.05% Berkshire Medical Center 110026434 $6,513,746 $50,840 $822,929 $5,639,977 0.78% 12.63% 86.59% Beth Israel Deaconess Medical Center 110000014 $18,225,514 $986,687 $8,515,473 $8,723,354 5.41% 46.72% 47.87% Boston Medical Center 110022129 $88,421,381 $4,885,089 $46,175,875 $37,360,417 5.52% 52.22% 42.26% Brigham & Women's Hospital 110022076 $32,148,930 $1,000,641 $7,402,204 $23,746,085 3.11% 23.02% 73.87% Brockton Hospital 110026502 $9,226,672 $375,340 $1,784,927 $7,066,405 4.07% 19.35% 76.58% Cambridge Health Alliance 110026529 $50,811,270 $1,919,890 $31,854,542 $17,036,838 3.78% 62.69% 33.53% Cape Cod Hospital 110026780 $8,408,835 $168,840 $1,815,876 $6,424,119 2.01% 21.59% 76.40% Carney Hospital 110087086 $3,632,991 $201,522 $471,910 $2,959,559 5.55% 12.99% 81.46% Children's Hospital 110026858 $4,836,959 $105,674 $3,270,960 $1,460,325 2.18% 67.62% 30.20% Clinton Hospital 110026725 $473,417 $5,541 $63,828 $404,048 1.17% 13.48% 85.35% Cooley Dickinson Hospital 110027372 $1,593,636 $26,182 $184,125 $1,383,329 1.64% 11.55% 86.81% Dana Farber Cancer Institute 110026789 $6,987,905 $109,676 $4,437,170 $2,441,059 1.57% 63.50% 34.93% Emerson Hospital 110024377 $884,111 $20,919 $43,864 $819,328 2.37% 4.96% 92.67% Falmouth Hospital 110026775 $2,295,764 $29,927 $232,091 $2,033,746 1.30% 10.11% 88.59% Faulkner Hospital 110026787 $3,389,129 $98,877 $668,326 $2,621,926 2.92% 19.72% 77.36% Franklin Medical Center 110024350 $1,119,776 $2,405 $123,092 $994,279 0.21% 10.99% 88.80% Good Samaritan Hospital 110086667 $8,571,740 $580,032 $2,342,682 $5,649,026 6.77% 27.33% 65.90% Harrington Memorial Hospital 110024448 $1,893,352 $45,836 $75,102 $1,772,414 2.42% 3.97% 93.61% Health Alliance Hospitals 110020892 $2,487,536 $36,217 $427,900 $2,023,419 1.46% 17.20% 81.34% Heywood Hospital 110026459 $1,465,642 $9,620 $37,597 $1,418,425 0.66% 2.57% 96.77% Holy Family Hospital 110087057 $7,031,170 $437,280 $953,348 $5,640,542 6.22% 13.56% 80.22% Holyoke Medical Center 110026773 $1,037,993 $22,166 $121,522 $894,305 2.14% 11.71% 86.15% Lahey Clinic Hospital 110026792 $3,838,150 $101,021 $361,495 $3,375,634 2.63% 9.42% 87.95% Lawrence General Hospital 110026771 $8,429,224 $529,515 $1,826,593 $6,073,116 6.28% 21.67% 72.05% Lawrence Memorial Hospital 110000034 $0 $0 $0 $0 0.00% 0.00% 100.00%
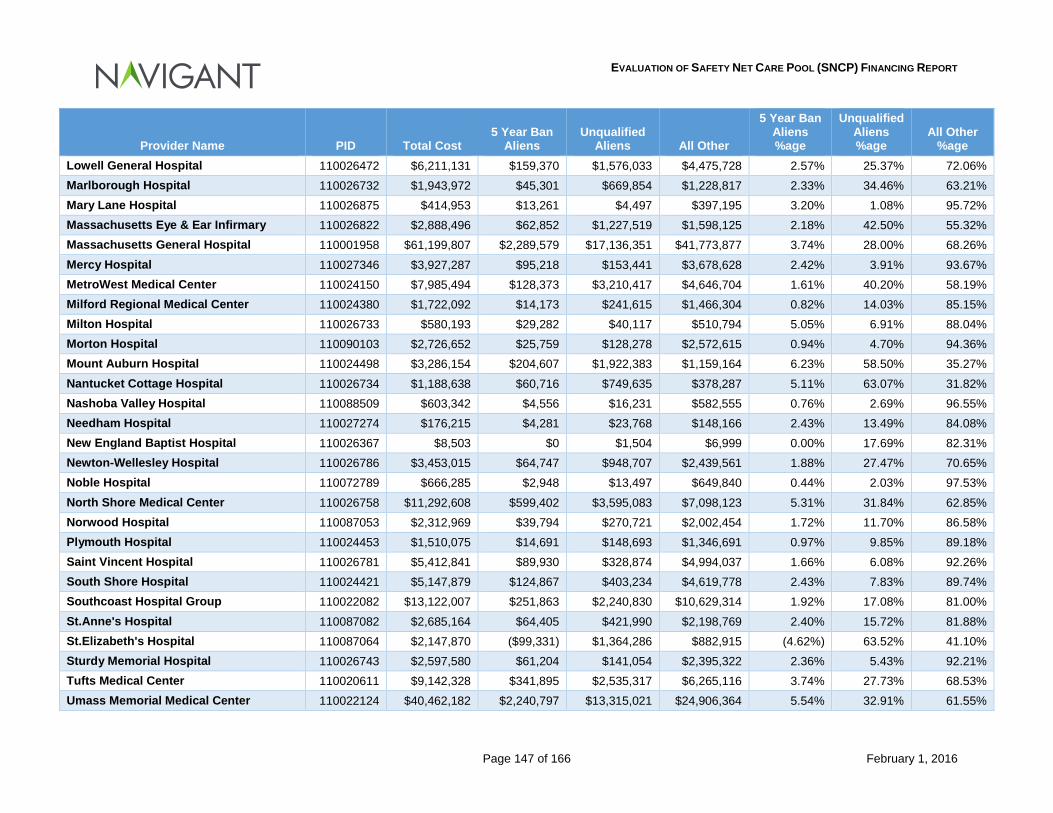
EVALUATION OF SAFETY NET CARE POOL (SNCP) FINANCING REPORT
Page 147 of 166 February 1, 2016
Provider Name PID Total Cost 5 Year Ban
Aliens Unqualified
Aliens All Other
5 Year Ban Aliens %age
Unqualified Aliens %age
All Other %age
Lowell General Hospital 110026472 $6,211,131 $159,370 $1,576,033 $4,475,728 2.57% 25.37% 72.06% Marlborough Hospital 110026732 $1,943,972 $45,301 $669,854 $1,228,817 2.33% 34.46% 63.21% Mary Lane Hospital 110026875 $414,953 $13,261 $4,497 $397,195 3.20% 1.08% 95.72% Massachusetts Eye & Ear Infirmary 110026822 $2,888,496 $62,852 $1,227,519 $1,598,125 2.18% 42.50% 55.32% Massachusetts General Hospital 110001958 $61,199,807 $2,289,579 $17,136,351 $41,773,877 3.74% 28.00% 68.26% Mercy Hospital 110027346 $3,927,287 $95,218 $153,441 $3,678,628 2.42% 3.91% 93.67% MetroWest Medical Center 110024150 $7,985,494 $128,373 $3,210,417 $4,646,704 1.61% 40.20% 58.19% Milford Regional Medical Center 110024380 $1,722,092 $14,173 $241,615 $1,466,304 0.82% 14.03% 85.15% Milton Hospital 110026733 $580,193 $29,282 $40,117 $510,794 5.05% 6.91% 88.04% Morton Hospital 110090103 $2,726,652 $25,759 $128,278 $2,572,615 0.94% 4.70% 94.36% Mount Auburn Hospital 110024498 $3,286,154 $204,607 $1,922,383 $1,159,164 6.23% 58.50% 35.27% Nantucket Cottage Hospital 110026734 $1,188,638 $60,716 $749,635 $378,287 5.11% 63.07% 31.82% Nashoba Valley Hospital 110088509 $603,342 $4,556 $16,231 $582,555 0.76% 2.69% 96.55% Needham Hospital 110027274 $176,215 $4,281 $23,768 $148,166 2.43% 13.49% 84.08% New England Baptist Hospital 110026367 $8,503 $0 $1,504 $6,999 0.00% 17.69% 82.31% Newton-Wellesley Hospital 110026786 $3,453,015 $64,747 $948,707 $2,439,561 1.88% 27.47% 70.65% Noble Hospital 110072789 $666,285 $2,948 $13,497 $649,840 0.44% 2.03% 97.53% North Shore Medical Center 110026758 $11,292,608 $599,402 $3,595,083 $7,098,123 5.31% 31.84% 62.85% Norwood Hospital 110087053 $2,312,969 $39,794 $270,721 $2,002,454 1.72% 11.70% 86.58% Plymouth Hospital 110024453 $1,510,075 $14,691 $148,693 $1,346,691 0.97% 9.85% 89.18% Saint Vincent Hospital 110026781 $5,412,841 $89,930 $328,874 $4,994,037 1.66% 6.08% 92.26% South Shore Hospital 110024421 $5,147,879 $124,867 $403,234 $4,619,778 2.43% 7.83% 89.74% Southcoast Hospital Group 110022082 $13,122,007 $251,863 $2,240,830 $10,629,314 1.92% 17.08% 81.00% St.Anne's Hospital 110087082 $2,685,164 $64,405 $421,990 $2,198,769 2.40% 15.72% 81.88% St.Elizabeth's Hospital 110087064 $2,147,870 ($99,331) $1,364,286 $882,915 (4.62%) 63.52% 41.10% Sturdy Memorial Hospital 110026743 $2,597,580 $61,204 $141,054 $2,395,322 2.36% 5.43% 92.21% Tufts Medical Center 110020611 $9,142,328 $341,895 $2,535,317 $6,265,116 3.74% 27.73% 68.53% Umass Memorial Medical Center 110022124 $40,462,182 $2,240,797 $13,315,021 $24,906,364 5.54% 32.91% 61.55%
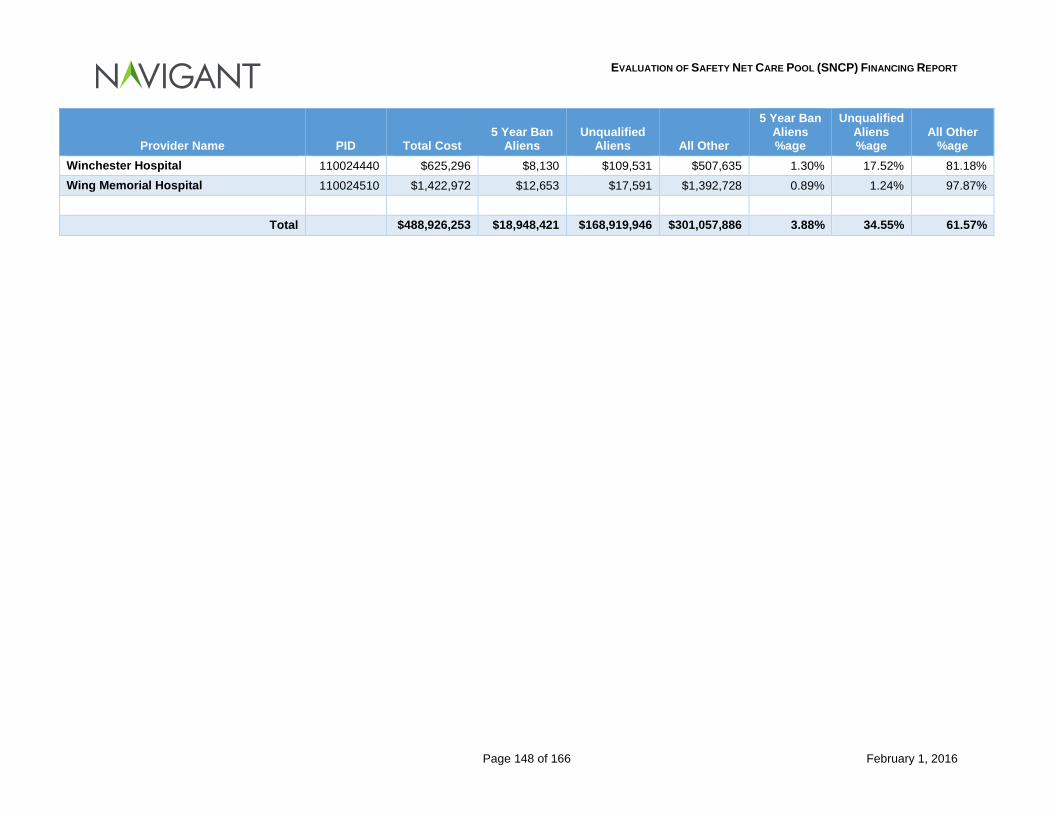
EVALUATION OF SAFETY NET CARE POOL (SNCP) FINANCING REPORT
Page 148 of 166 February 1, 2016
Provider Name PID Total Cost 5 Year Ban
Aliens Unqualified
Aliens All Other
5 Year Ban Aliens %age
Unqualified Aliens %age
All Other %age
Winchester Hospital 110024440 $625,296 $8,130 $109,531 $507,635 1.30% 17.52% 81.18% Wing Memorial Hospital 110024510 $1,422,972 $12,653 $17,591 $1,392,728 0.89% 1.24% 97.87%
Total $488,926,253 $18,948,421 $168,919,946 $301,057,886 3.88% 34.55% 61.57%
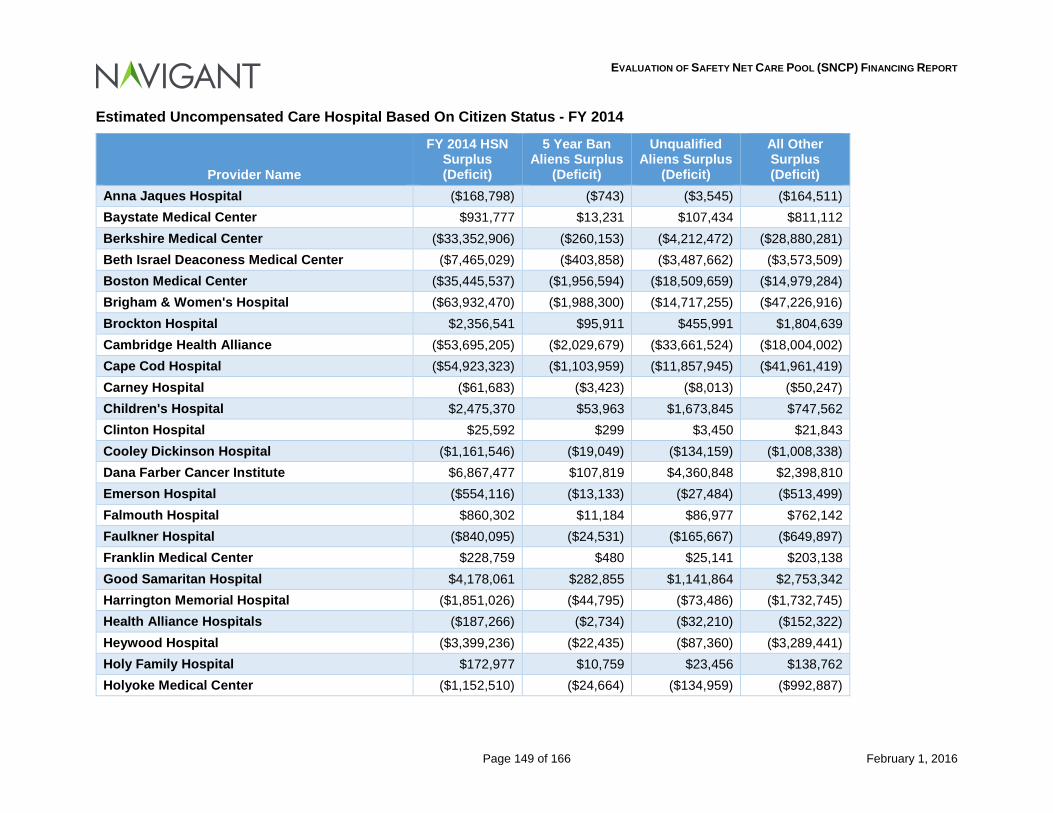
EVALUATION OF SAFETY NET CARE POOL (SNCP) FINANCING REPORT
Page 149 of 166 February 1, 2016
Estimated Uncompensated Care Hospital Based On Citizen Status - FY 2014
Provider Name
FY 2014 HSN Surplus (Deficit)
5 Year Ban Aliens Surplus
(Deficit)
Unqualified Aliens Surplus
(Deficit)
All Other Surplus (Deficit)
Anna Jaques Hospital ($168,798) ($743) ($3,545) ($164,511) Baystate Medical Center $931,777 $13,231 $107,434 $811,112 Berkshire Medical Center ($33,352,906) ($260,153) ($4,212,472) ($28,880,281) Beth Israel Deaconess Medical Center ($7,465,029) ($403,858) ($3,487,662) ($3,573,509) Boston Medical Center ($35,445,537) ($1,956,594) ($18,509,659) ($14,979,284) Brigham & Women's Hospital ($63,932,470) ($1,988,300) ($14,717,255) ($47,226,916) Brockton Hospital $2,356,541 $95,911 $455,991 $1,804,639 Cambridge Health Alliance ($53,695,205) ($2,029,679) ($33,661,524) ($18,004,002) Cape Cod Hospital ($54,923,323) ($1,103,959) ($11,857,945) ($41,961,419) Carney Hospital ($61,683) ($3,423) ($8,013) ($50,247) Children's Hospital $2,475,370 $53,963 $1,673,845 $747,562 Clinton Hospital $25,592 $299 $3,450 $21,843 Cooley Dickinson Hospital ($1,161,546) ($19,049) ($134,159) ($1,008,338) Dana Farber Cancer Institute $6,867,477 $107,819 $4,360,848 $2,398,810 Emerson Hospital ($554,116) ($13,133) ($27,484) ($513,499) Falmouth Hospital $860,302 $11,184 $86,977 $762,142 Faulkner Hospital ($840,095) ($24,531) ($165,667) ($649,897) Franklin Medical Center $228,759 $480 $25,141 $203,138 Good Samaritan Hospital $4,178,061 $282,855 $1,141,864 $2,753,342 Harrington Memorial Hospital ($1,851,026) ($44,795) ($73,486) ($1,732,745) Health Alliance Hospitals ($187,266) ($2,734) ($32,210) ($152,322) Heywood Hospital ($3,399,236) ($22,435) ($87,360) ($3,289,441) Holy Family Hospital $172,977 $10,759 $23,456 $138,762 Holyoke Medical Center ($1,152,510) ($24,664) ($134,959) ($992,887)
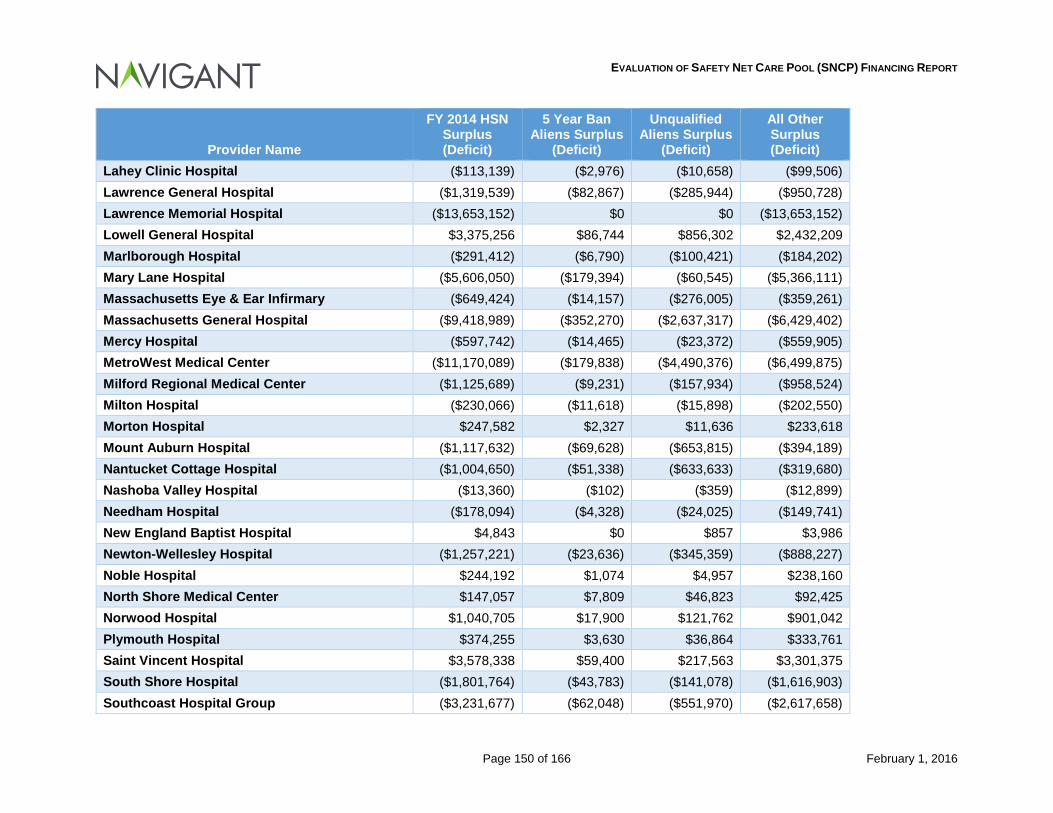
EVALUATION OF SAFETY NET CARE POOL (SNCP) FINANCING REPORT
Page 150 of 166 February 1, 2016
Provider Name
FY 2014 HSN Surplus (Deficit)
5 Year Ban Aliens Surplus
(Deficit)
Unqualified Aliens Surplus
(Deficit)
All Other Surplus (Deficit)
Lahey Clinic Hospital ($113,139) ($2,976) ($10,658) ($99,506) Lawrence General Hospital ($1,319,539) ($82,867) ($285,944) ($950,728) Lawrence Memorial Hospital ($13,653,152) $0 $0 ($13,653,152) Lowell General Hospital $3,375,256 $86,744 $856,302 $2,432,209 Marlborough Hospital ($291,412) ($6,790) ($100,421) ($184,202) Mary Lane Hospital ($5,606,050) ($179,394) ($60,545) ($5,366,111) Massachusetts Eye & Ear Infirmary ($649,424) ($14,157) ($276,005) ($359,261) Massachusetts General Hospital ($9,418,989) ($352,270) ($2,637,317) ($6,429,402) Mercy Hospital ($597,742) ($14,465) ($23,372) ($559,905) MetroWest Medical Center ($11,170,089) ($179,838) ($4,490,376) ($6,499,875) Milford Regional Medical Center ($1,125,689) ($9,231) ($157,934) ($958,524) Milton Hospital ($230,066) ($11,618) ($15,898) ($202,550) Morton Hospital $247,582 $2,327 $11,636 $233,618 Mount Auburn Hospital ($1,117,632) ($69,628) ($653,815) ($394,189) Nantucket Cottage Hospital ($1,004,650) ($51,338) ($633,633) ($319,680) Nashoba Valley Hospital ($13,360) ($102) ($359) ($12,899) Needham Hospital ($178,094) ($4,328) ($24,025) ($149,741) New England Baptist Hospital $4,843 $0 $857 $3,986 Newton-Wellesley Hospital ($1,257,221) ($23,636) ($345,359) ($888,227) Noble Hospital $244,192 $1,074 $4,957 $238,160 North Shore Medical Center $147,057 $7,809 $46,823 $92,425 Norwood Hospital $1,040,705 $17,900 $121,762 $901,042 Plymouth Hospital $374,255 $3,630 $36,864 $333,761 Saint Vincent Hospital $3,578,338 $59,400 $217,563 $3,301,375 South Shore Hospital ($1,801,764) ($43,783) ($141,078) ($1,616,903) Southcoast Hospital Group ($3,231,677) ($62,048) ($551,970) ($2,617,658)
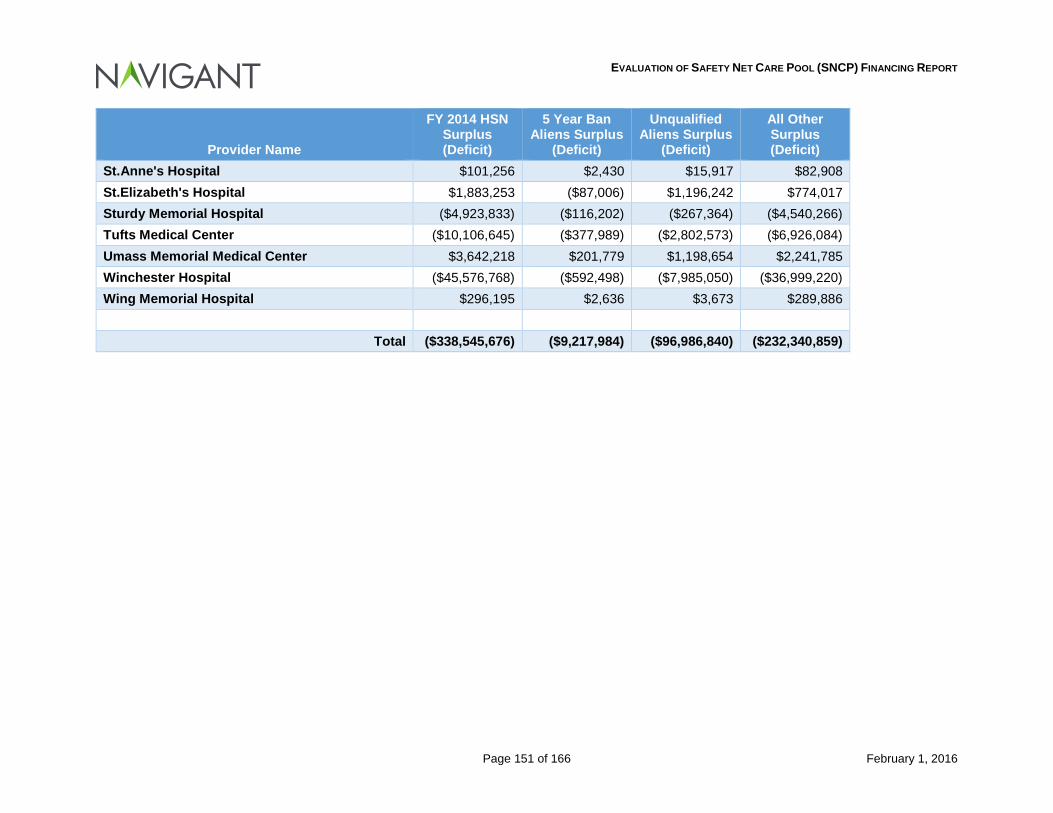
EVALUATION OF SAFETY NET CARE POOL (SNCP) FINANCING REPORT
Page 151 of 166 February 1, 2016
Provider Name
FY 2014 HSN Surplus (Deficit)
5 Year Ban Aliens Surplus
(Deficit)
Unqualified Aliens Surplus
(Deficit)
All Other Surplus (Deficit)
St.Anne's Hospital $101,256 $2,430 $15,917 $82,908 St.Elizabeth's Hospital $1,883,253 ($87,006) $1,196,242 $774,017 Sturdy Memorial Hospital ($4,923,833) ($116,202) ($267,364) ($4,540,266) Tufts Medical Center ($10,106,645) ($377,989) ($2,802,573) ($6,926,084) Umass Memorial Medical Center $3,642,218 $201,779 $1,198,654 $2,241,785 Winchester Hospital ($45,576,768) ($592,498) ($7,985,050) ($36,999,220) Wing Memorial Hospital $296,195 $2,636 $3,673 $289,886
Total ($338,545,676) ($9,217,984) ($96,986,840) ($232,340,859)
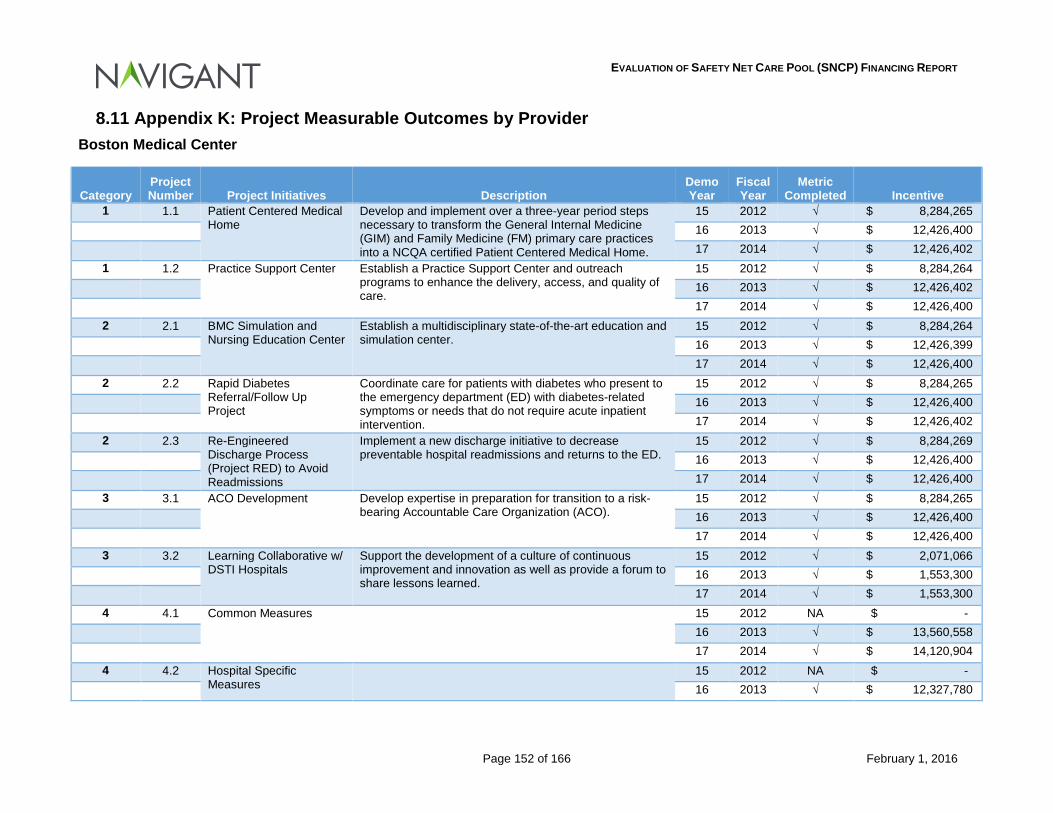
EVALUATION OF SAFETY NET CARE POOL (SNCP) FINANCING REPORT
Page 152 of 166 February 1, 2016
8.11 Appendix K: Project Measurable Outcomes by Provider Boston Medical Center
Category Project Number Project Initiatives Description
Demo Year
Fiscal Year
Metric Completed Incentive
1 1.1 Patient Centered Medical Home
Develop and implement over a three-year period steps necessary to transform the General Internal Medicine (GIM) and Family Medicine (FM) primary care practices into a NCQA certified Patient Centered Medical Home.
15 2012 √ $ 8,284,265 16 2013 √ $ 12,426,400 17 2014 √ $ 12,426,402 1 1.2 Practice Support Center Establish a Practice Support Center and outreach
programs to enhance the delivery, access, and quality of care.
15 2012 √ $ 8,284,264 16 2013 √ $ 12,426,402 17 2014 √ $ 12,426,400 2 2.1 BMC Simulation and
Nursing Education Center Establish a multidisciplinary state-of-the-art education and simulation center.
15 2012 √ $ 8,284,264 16 2013 √ $ 12,426,399 17 2014 √ $ 12,426,400 2 2.2 Rapid Diabetes
Referral/Follow Up Project
Coordinate care for patients with diabetes who present to the emergency department (ED) with diabetes-related symptoms or needs that do not require acute inpatient intervention.
15 2012 √ $ 8,284,265 16 2013 √ $ 12,426,400 17 2014 √ $ 12,426,402 2 2.3 Re-Engineered
Discharge Process (Project RED) to Avoid Readmissions
Implement a new discharge initiative to decrease preventable hospital readmissions and returns to the ED.
15 2012 √ $ 8,284,269 16 2013 √ $ 12,426,400 17 2014 √ $ 12,426,400 3 3.1 ACO Development Develop expertise in preparation for transition to a risk-
bearing Accountable Care Organization (ACO). 15 2012 √ $ 8,284,265
16 2013 √ $ 12,426,400 17 2014 √ $ 12,426,400 3 3.2 Learning Collaborative w/
DSTI Hospitals Support the development of a culture of continuous improvement and innovation as well as provide a forum to share lessons learned.
15 2012 √ $ 2,071,066 16 2013 √ $ 1,553,300 17 2014 √ $ 1,553,300 4 4.1 Common Measures 15 2012 NA $ - 16 2013 √ $ 13,560,558 17 2014 √ $ 14,120,904 4 4.2 Hospital Specific
Measures 15 2012 NA $ -
16 2013 √ $ 12,327,780
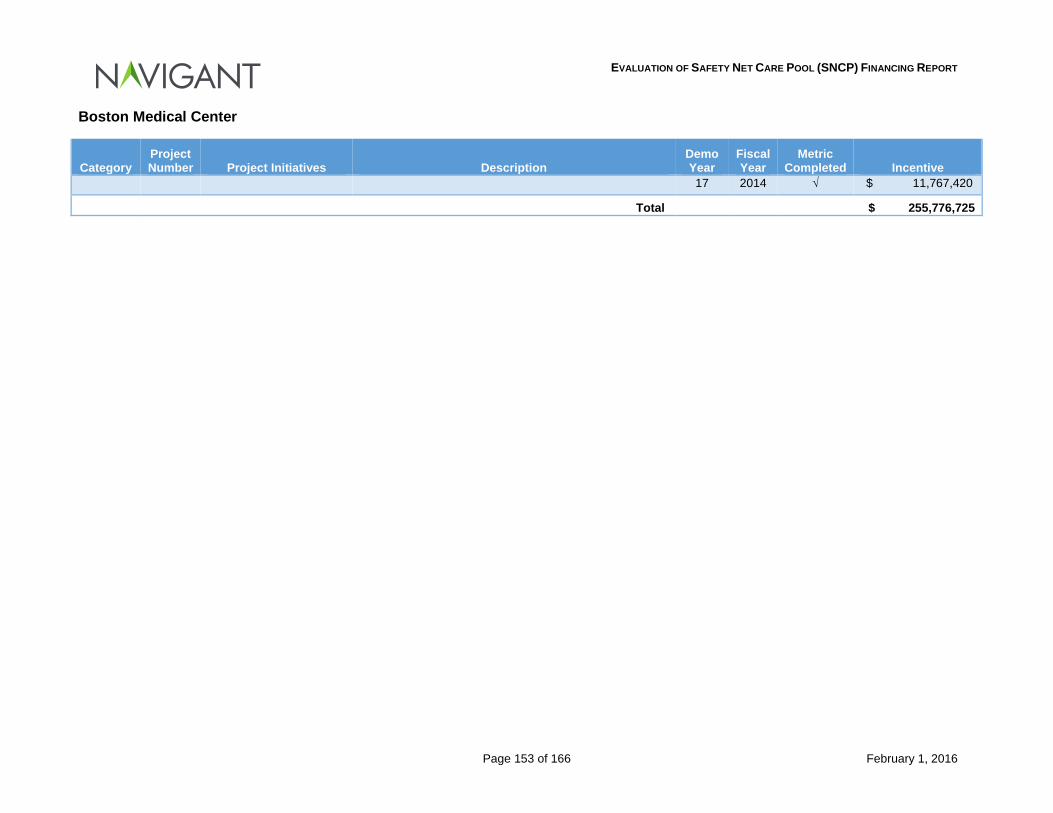
EVALUATION OF SAFETY NET CARE POOL (SNCP) FINANCING REPORT
Page 153 of 166 February 1, 2016
Boston Medical Center
Category Project Number Project Initiatives Description
Demo Year
Fiscal Year
Metric Completed Incentive
17 2014 √ $ 11,767,420
Total $ 255,776,725
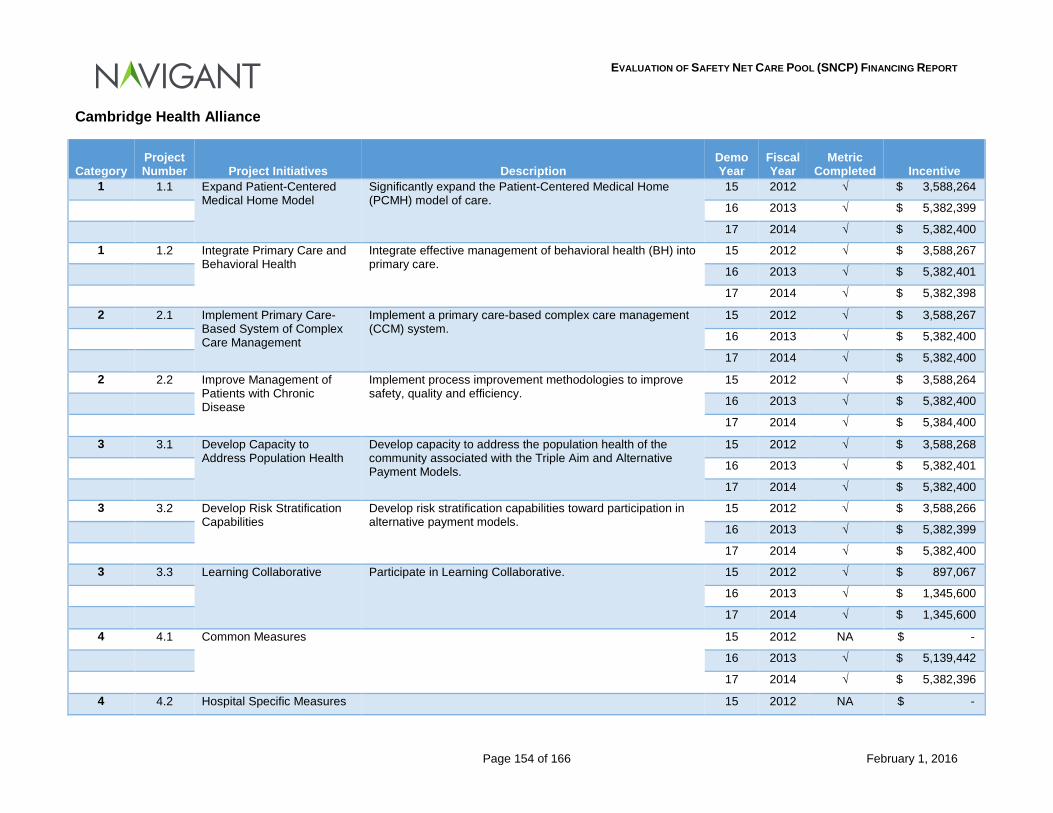
EVALUATION OF SAFETY NET CARE POOL (SNCP) FINANCING REPORT
Page 154 of 166 February 1, 2016
Cambridge Health Alliance
Category Project Number Project Initiatives Description
Demo Year
Fiscal Year
Metric Completed Incentive
1 1.1 Expand Patient-Centered Medical Home Model
Significantly expand the Patient-Centered Medical Home (PCMH) model of care.
15 2012 √ $ 3,588,264
16 2013 √ $ 5,382,399
17 2014 √ $ 5,382,400
1 1.2 Integrate Primary Care and Behavioral Health
Integrate effective management of behavioral health (BH) into primary care.
15 2012 √ $ 3,588,267
16 2013 √ $ 5,382,401
17 2014 √ $ 5,382,398
2 2.1 Implement Primary Care-Based System of Complex Care Management
Implement a primary care-based complex care management (CCM) system.
15 2012 √ $ 3,588,267
16 2013 √ $ 5,382,400
17 2014 √ $ 5,382,400
2 2.2 Improve Management of Patients with Chronic Disease
Implement process improvement methodologies to improve safety, quality and efficiency.
15 2012 √ $ 3,588,264
16 2013 √ $ 5,382,400
17 2014 √ $ 5,384,400
3 3.1 Develop Capacity to Address Population Health
Develop capacity to address the population health of the community associated with the Triple Aim and Alternative Payment Models.
15 2012 √ $ 3,588,268
16 2013 √ $ 5,382,401
17 2014 √ $ 5,382,400
3 3.2 Develop Risk Stratification Capabilities
Develop risk stratification capabilities toward participation in alternative payment models.
15 2012 √ $ 3,588,266
16 2013 √ $ 5,382,399
17 2014 √ $ 5,382,400
3 3.3 Learning Collaborative Participate in Learning Collaborative. 15 2012 √ $ 897,067
16 2013 √ $ 1,345,600
17 2014 √ $ 1,345,600
4 4.1 Common Measures 15 2012 NA $ -
16 2013 √ $ 5,139,442
17 2014 √ $ 5,382,396
4 4.2 Hospital Specific Measures 15 2012 NA $ -
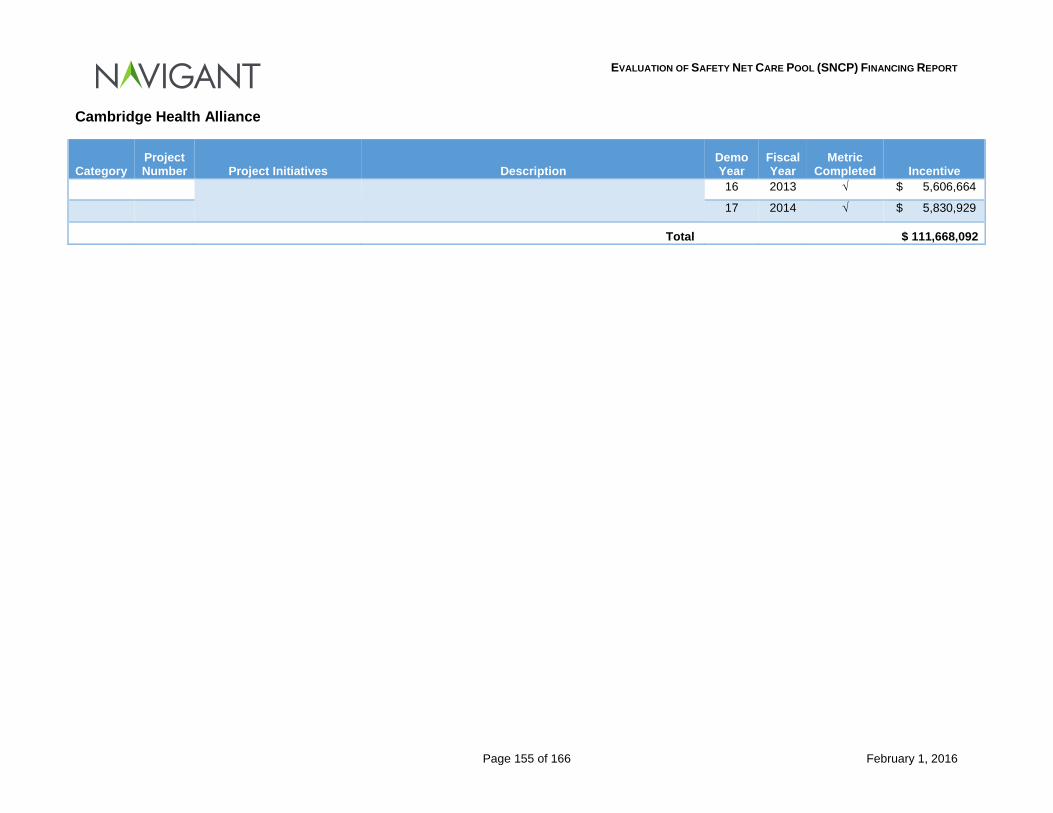
EVALUATION OF SAFETY NET CARE POOL (SNCP) FINANCING REPORT
Page 155 of 166 February 1, 2016
Cambridge Health Alliance
Category Project Number Project Initiatives Description
Demo Year
Fiscal Year
Metric Completed Incentive
16 2013 √ $ 5,606,664
17 2014 √ $ 5,830,929
Total $ 111,668,092
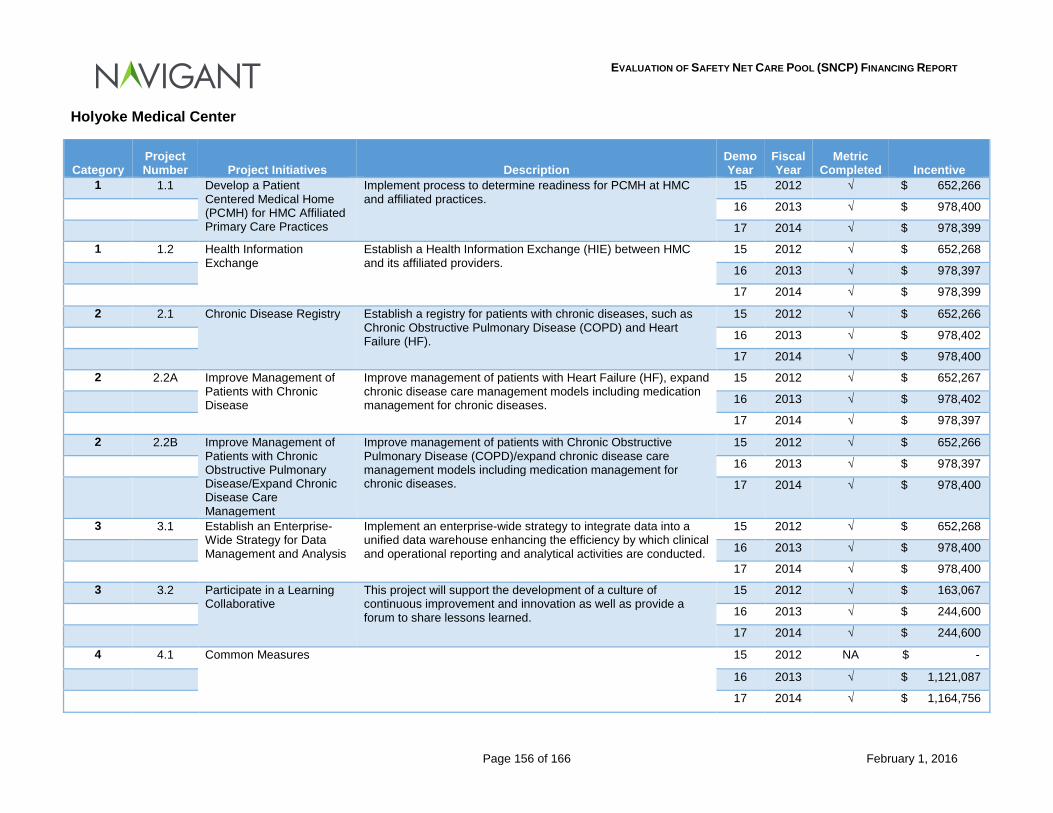
EVALUATION OF SAFETY NET CARE POOL (SNCP) FINANCING REPORT
Page 156 of 166 February 1, 2016
Holyoke Medical Center
Category Project Number Project Initiatives Description
Demo Year
Fiscal Year
Metric Completed Incentive
1 1.1 Develop a Patient Centered Medical Home (PCMH) for HMC Affiliated Primary Care Practices
Implement process to determine readiness for PCMH at HMC and affiliated practices.
15 2012 √ $ 652,266
16 2013 √ $ 978,400
17 2014 √ $ 978,399
1 1.2 Health Information Exchange
Establish a Health Information Exchange (HIE) between HMC and its affiliated providers.
15 2012 √ $ 652,268
16 2013 √ $ 978,397
17 2014 √ $ 978,399
2 2.1 Chronic Disease Registry Establish a registry for patients with chronic diseases, such as Chronic Obstructive Pulmonary Disease (COPD) and Heart Failure (HF).
15 2012 √ $ 652,266
16 2013 √ $ 978,402
17 2014 √ $ 978,400
2 2.2A Improve Management of Patients with Chronic Disease
Improve management of patients with Heart Failure (HF), expand chronic disease care management models including medication management for chronic diseases.
15 2012 √ $ 652,267
16 2013 √ $ 978,402
17 2014 √ $ 978,397
2 2.2B Improve Management of Patients with Chronic Obstructive Pulmonary Disease/Expand Chronic Disease Care Management
Improve management of patients with Chronic Obstructive Pulmonary Disease (COPD)/expand chronic disease care management models including medication management for chronic diseases.
15 2012 √ $ 652,266
16 2013 √ $ 978,397
17 2014 √ $ 978,400
3 3.1 Establish an Enterprise-Wide Strategy for Data Management and Analysis
Implement an enterprise-wide strategy to integrate data into a unified data warehouse enhancing the efficiency by which clinical and operational reporting and analytical activities are conducted.
15 2012 √ $ 652,268
16 2013 √ $ 978,400
17 2014 √ $ 978,400
3 3.2 Participate in a Learning Collaborative
This project will support the development of a culture of continuous improvement and innovation as well as provide a forum to share lessons learned.
15 2012 √ $ 163,067
16 2013 √ $ 244,600
17 2014 √ $ 244,600
4 4.1 Common Measures 15 2012 NA $ -
16 2013 √ $ 1,121,087
17 2014 √ $ 1,164,756
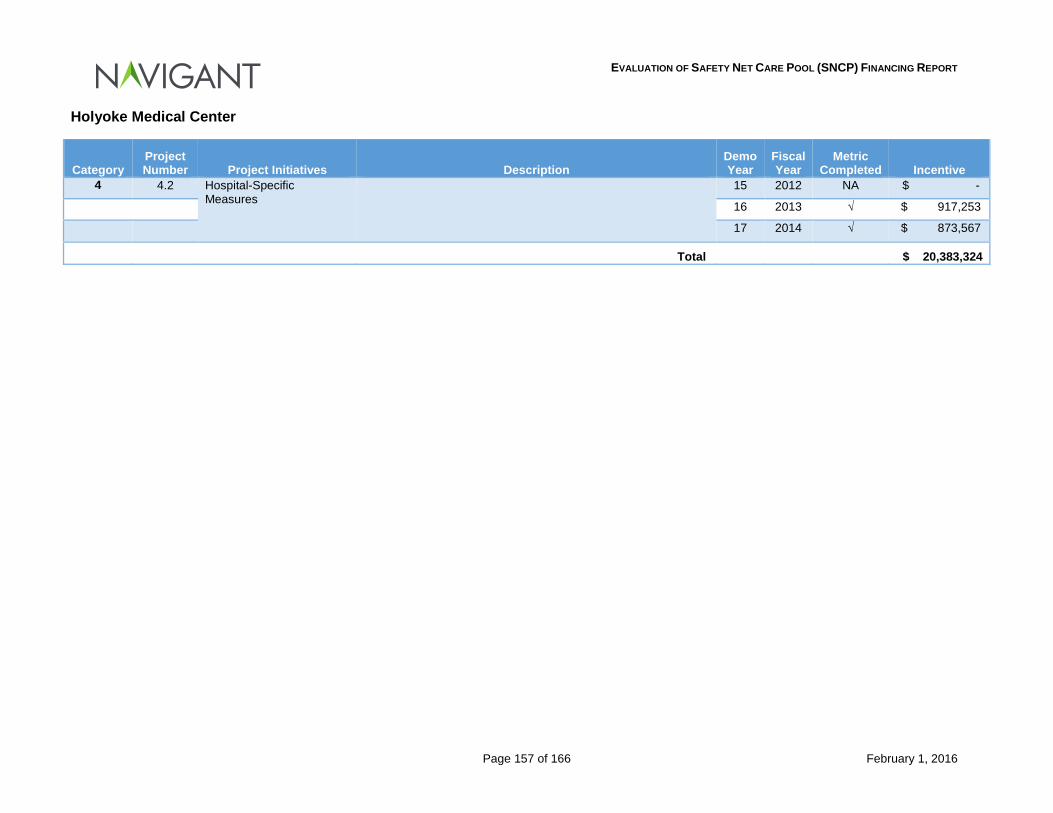
EVALUATION OF SAFETY NET CARE POOL (SNCP) FINANCING REPORT
Page 157 of 166 February 1, 2016
Holyoke Medical Center
Category Project Number Project Initiatives Description
Demo Year
Fiscal Year
Metric Completed Incentive
4 4.2 Hospital-Specific Measures
15 2012 NA $ -
16 2013 √ $ 917,253
17 2014 √ $ 873,567
Total $ 20,383,324
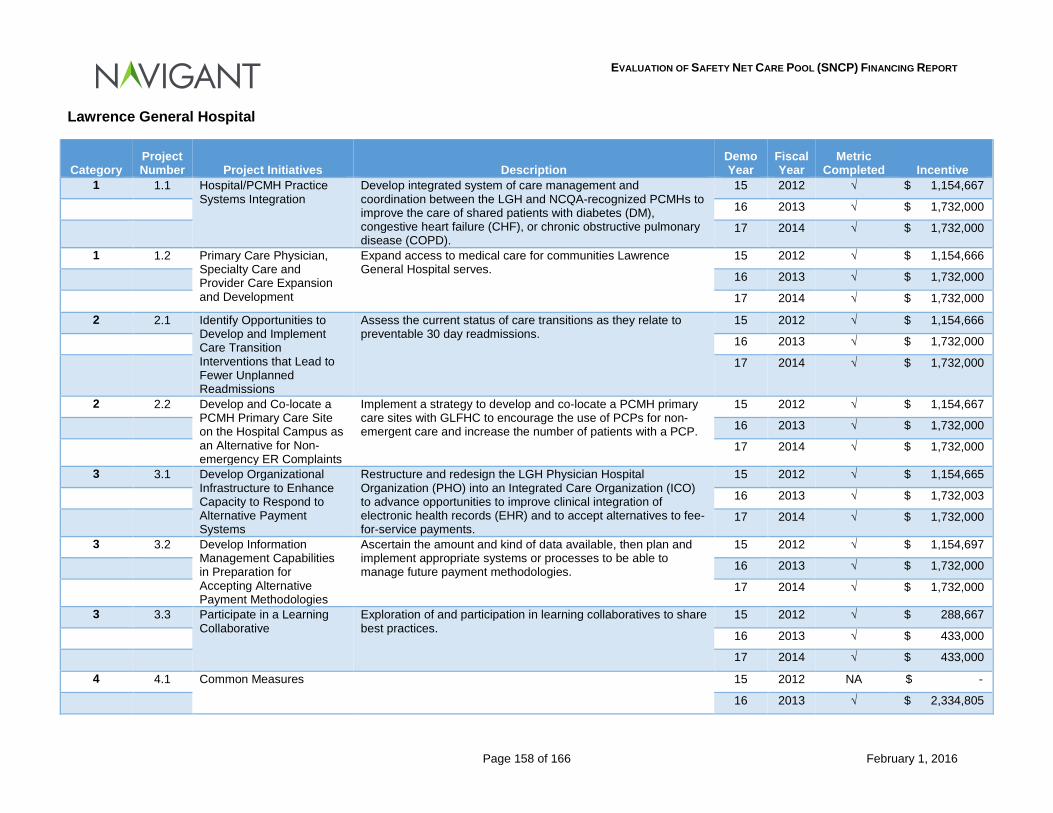
EVALUATION OF SAFETY NET CARE POOL (SNCP) FINANCING REPORT
Page 158 of 166 February 1, 2016
Lawrence General Hospital
Category Project Number Project Initiatives Description
Demo Year
Fiscal Year
Metric Completed Incentive
1 1.1 Hospital/PCMH Practice Systems Integration
Develop integrated system of care management and coordination between the LGH and NCQA-recognized PCMHs to improve the care of shared patients with diabetes (DM), congestive heart failure (CHF), or chronic obstructive pulmonary disease (COPD).
15 2012 √ $ 1,154,667
16 2013 √ $ 1,732,000
17 2014 √ $ 1,732,000
1 1.2 Primary Care Physician, Specialty Care and Provider Care Expansion and Development
Expand access to medical care for communities Lawrence General Hospital serves.
15 2012 √ $ 1,154,666
16 2013 √ $ 1,732,000
17 2014 √ $ 1,732,000
2 2.1 Identify Opportunities to Develop and Implement Care Transition Interventions that Lead to Fewer Unplanned Readmissions
Assess the current status of care transitions as they relate to preventable 30 day readmissions.
15 2012 √ $ 1,154,666
16 2013 √ $ 1,732,000
17 2014 √ $ 1,732,000
2 2.2 Develop and Co-locate a PCMH Primary Care Site on the Hospital Campus as an Alternative for Non-emergency ER Complaints
Implement a strategy to develop and co-locate a PCMH primary care sites with GLFHC to encourage the use of PCPs for non-emergent care and increase the number of patients with a PCP.
15 2012 √ $ 1,154,667
16 2013 √ $ 1,732,000
17 2014 √ $ 1,732,000
3 3.1 Develop Organizational Infrastructure to Enhance Capacity to Respond to Alternative Payment Systems
Restructure and redesign the LGH Physician Hospital Organization (PHO) into an Integrated Care Organization (ICO) to advance opportunities to improve clinical integration of electronic health records (EHR) and to accept alternatives to fee-for-service payments.
15 2012 √ $ 1,154,665
16 2013 √ $ 1,732,003
17 2014 √ $ 1,732,000
3 3.2 Develop Information Management Capabilities in Preparation for Accepting Alternative Payment Methodologies
Ascertain the amount and kind of data available, then plan and implement appropriate systems or processes to be able to manage future payment methodologies.
15 2012 √ $ 1,154,697
16 2013 √ $ 1,732,000
17 2014 √ $ 1,732,000
3 3.3 Participate in a Learning Collaborative
Exploration of and participation in learning collaboratives to share best practices.
15 2012 √ $ 288,667
16 2013 √ $ 433,000
17 2014 √ $ 433,000
4 4.1 Common Measures 15 2012 NA $ -
16 2013 √ $ 2,334,805
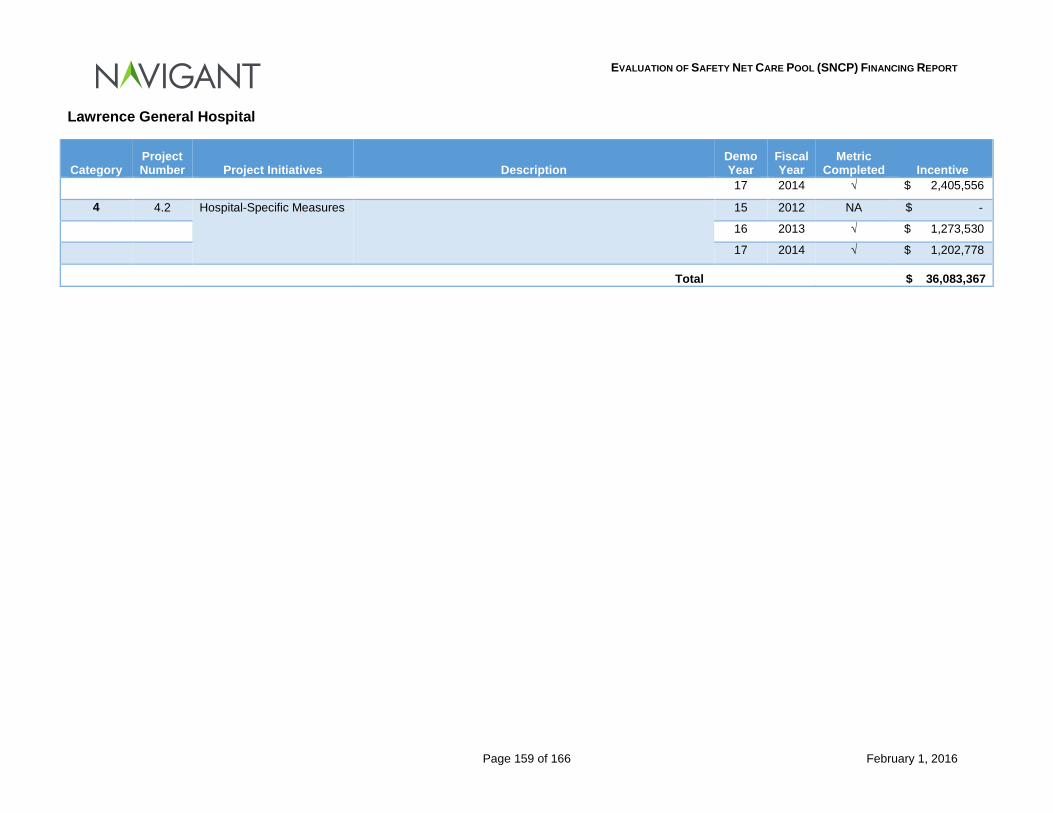
EVALUATION OF SAFETY NET CARE POOL (SNCP) FINANCING REPORT
Page 159 of 166 February 1, 2016
Lawrence General Hospital
Category Project Number Project Initiatives Description
Demo Year
Fiscal Year
Metric Completed Incentive
17 2014 √ $ 2,405,556
4 4.2 Hospital-Specific Measures 15 2012 NA $ -
16 2013 √ $ 1,273,530
17 2014 √ $ 1,202,778
Total $ 36,083,367
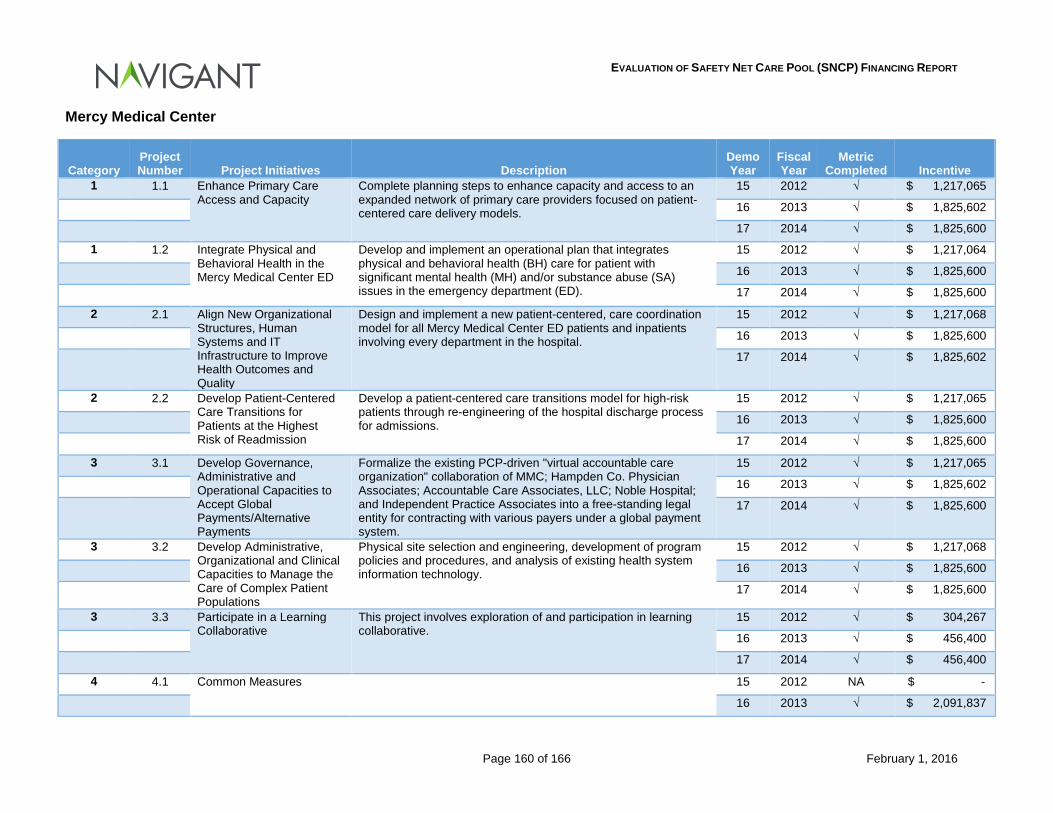
EVALUATION OF SAFETY NET CARE POOL (SNCP) FINANCING REPORT
Page 160 of 166 February 1, 2016
Mercy Medical Center
Category Project Number Project Initiatives Description
Demo Year
Fiscal Year
Metric Completed Incentive
1 1.1 Enhance Primary Care Access and Capacity
Complete planning steps to enhance capacity and access to an expanded network of primary care providers focused on patient-centered care delivery models.
15 2012 √ $ 1,217,065
16 2013 √ $ 1,825,602
17 2014 √ $ 1,825,600
1 1.2 Integrate Physical and Behavioral Health in the Mercy Medical Center ED
Develop and implement an operational plan that integrates physical and behavioral health (BH) care for patient with significant mental health (MH) and/or substance abuse (SA) issues in the emergency department (ED).
15 2012 √ $ 1,217,064
16 2013 √ $ 1,825,600
17 2014 √ $ 1,825,600
2 2.1 Align New Organizational Structures, Human Systems and IT Infrastructure to Improve Health Outcomes and Quality
Design and implement a new patient-centered, care coordination model for all Mercy Medical Center ED patients and inpatients involving every department in the hospital.
15 2012 √ $ 1,217,068
16 2013 √ $ 1,825,600
17 2014 √ $ 1,825,602
2 2.2 Develop Patient-Centered Care Transitions for Patients at the Highest Risk of Readmission
Develop a patient-centered care transitions model for high-risk patients through re-engineering of the hospital discharge process for admissions.
15 2012 √ $ 1,217,065
16 2013 √ $ 1,825,600
17 2014 √ $ 1,825,600
3 3.1 Develop Governance, Administrative and Operational Capacities to Accept Global Payments/Alternative Payments
Formalize the existing PCP-driven "virtual accountable care organization" collaboration of MMC; Hampden Co. Physician Associates; Accountable Care Associates, LLC; Noble Hospital; and Independent Practice Associates into a free-standing legal entity for contracting with various payers under a global payment system.
15 2012 √ $ 1,217,065
16 2013 √ $ 1,825,602
17 2014 √ $ 1,825,600
3 3.2 Develop Administrative, Organizational and Clinical Capacities to Manage the Care of Complex Patient Populations
Physical site selection and engineering, development of program policies and procedures, and analysis of existing health system information technology.
15 2012 √ $ 1,217,068
16 2013 √ $ 1,825,600
17 2014 √ $ 1,825,600
3 3.3 Participate in a Learning Collaborative
This project involves exploration of and participation in learning collaborative.
15 2012 √ $ 304,267
16 2013 √ $ 456,400
17 2014 √ $ 456,400
4 4.1 Common Measures 15 2012 NA $ -
16 2013 √ $ 2,091,837
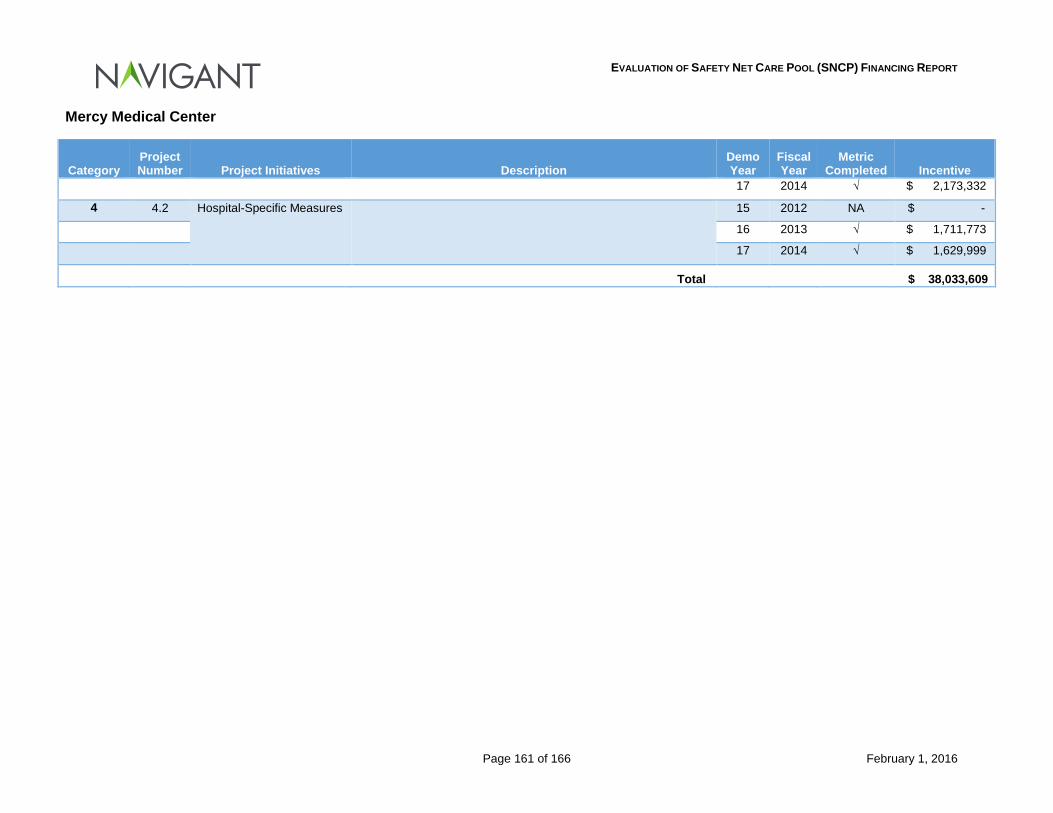
EVALUATION OF SAFETY NET CARE POOL (SNCP) FINANCING REPORT
Page 161 of 166 February 1, 2016
Mercy Medical Center
Category Project Number Project Initiatives Description
Demo Year
Fiscal Year
Metric Completed Incentive
17 2014 √ $ 2,173,332
4 4.2 Hospital-Specific Measures 15 2012 NA $ -
16 2013 √ $ 1,711,773
17 2014 √ $ 1,629,999
Total $ 38,033,609
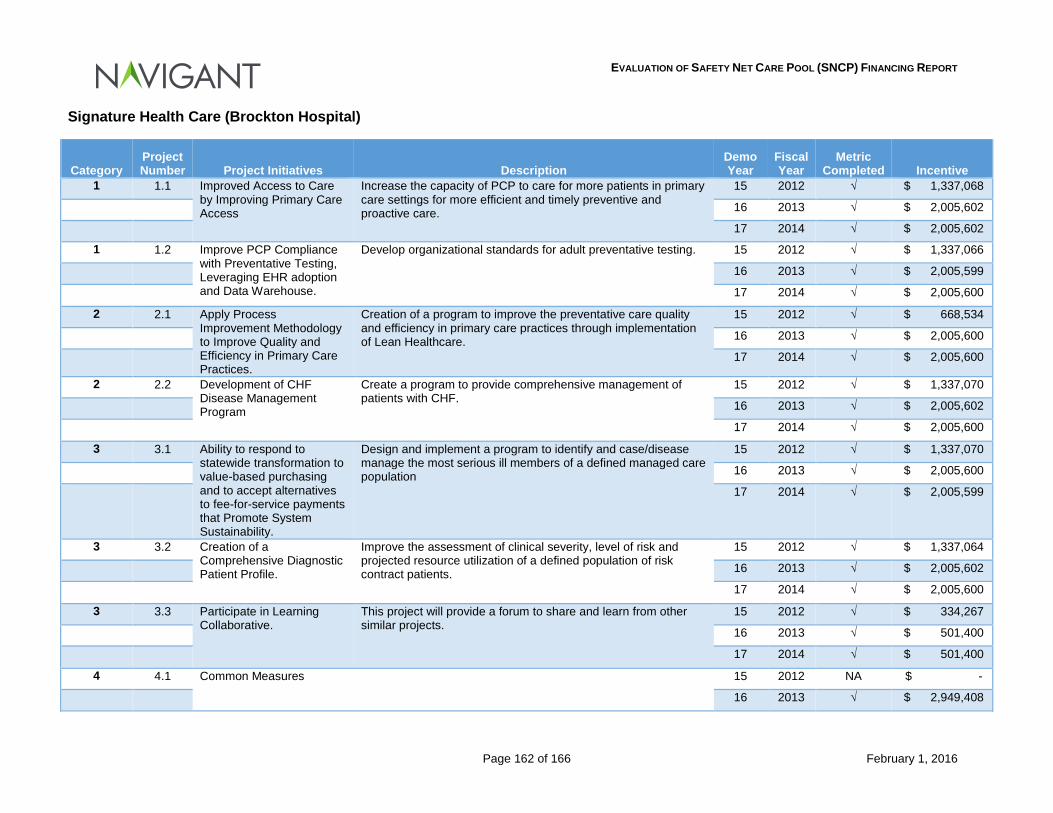
EVALUATION OF SAFETY NET CARE POOL (SNCP) FINANCING REPORT
Page 162 of 166 February 1, 2016
Signature Health Care (Brockton Hospital)
Category Project Number Project Initiatives Description
Demo Year
Fiscal Year
Metric Completed Incentive
1 1.1 Improved Access to Care by Improving Primary Care Access
Increase the capacity of PCP to care for more patients in primary care settings for more efficient and timely preventive and proactive care.
15 2012 √ $ 1,337,068
16 2013 √ $ 2,005,602
17 2014 √ $ 2,005,602
1 1.2 Improve PCP Compliance with Preventative Testing, Leveraging EHR adoption and Data Warehouse.
Develop organizational standards for adult preventative testing. 15 2012 √ $ 1,337,066
16 2013 √ $ 2,005,599
17 2014 √ $ 2,005,600
2 2.1 Apply Process Improvement Methodology to Improve Quality and Efficiency in Primary Care Practices.
Creation of a program to improve the preventative care quality and efficiency in primary care practices through implementation of Lean Healthcare.
15 2012 √ $ 668,534
16 2013 √ $ 2,005,600
17 2014 √ $ 2,005,600
2 2.2 Development of CHF Disease Management Program
Create a program to provide comprehensive management of patients with CHF.
15 2012 √ $ 1,337,070
16 2013 √ $ 2,005,602
17 2014 √ $ 2,005,600
3 3.1 Ability to respond to statewide transformation to value-based purchasing and to accept alternatives to fee-for-service payments that Promote System Sustainability.
Design and implement a program to identify and case/disease manage the most serious ill members of a defined managed care population
15 2012 √ $ 1,337,070
16 2013 √ $ 2,005,600
17 2014 √ $ 2,005,599
3 3.2 Creation of a Comprehensive Diagnostic Patient Profile.
Improve the assessment of clinical severity, level of risk and projected resource utilization of a defined population of risk contract patients.
15 2012 √ $ 1,337,064
16 2013 √ $ 2,005,602
17 2014 √ $ 2,005,600
3 3.3 Participate in Learning Collaborative.
This project will provide a forum to share and learn from other similar projects.
15 2012 √ $ 334,267
16 2013 √ $ 501,400
17 2014 √ $ 501,400
4 4.1 Common Measures 15 2012 NA $ -
16 2013 √ $ 2,949,408
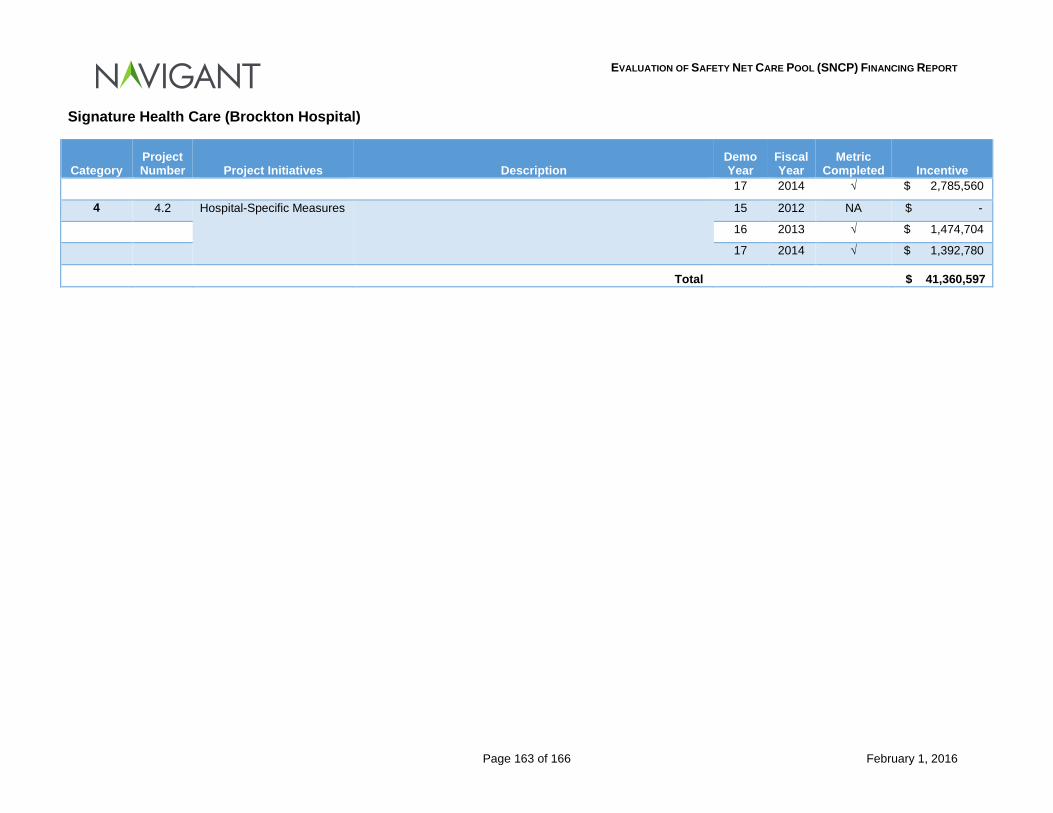
EVALUATION OF SAFETY NET CARE POOL (SNCP) FINANCING REPORT
Page 163 of 166 February 1, 2016
Signature Health Care (Brockton Hospital)
Category Project Number Project Initiatives Description
Demo Year
Fiscal Year
Metric Completed Incentive
17 2014 √ $ 2,785,560
4 4.2 Hospital-Specific Measures 15 2012 NA $ -
16 2013 √ $ 1,474,704
17 2014 √ $ 1,392,780
Total $ 41,360,597
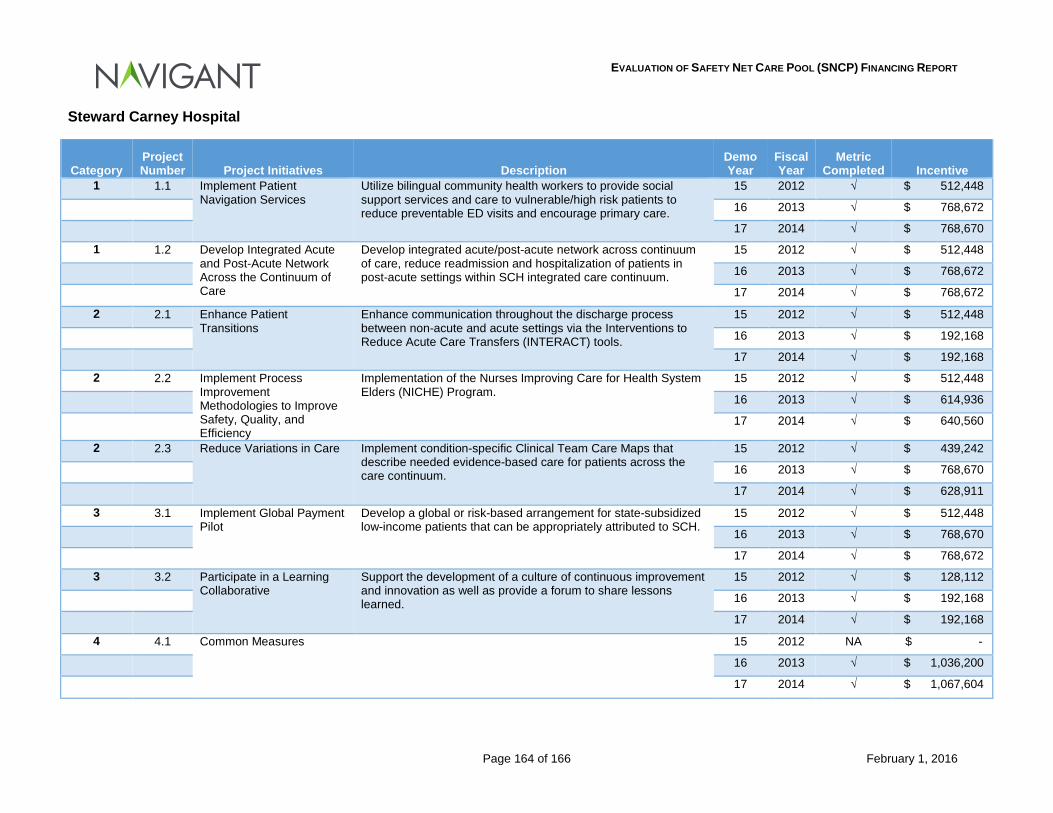
EVALUATION OF SAFETY NET CARE POOL (SNCP) FINANCING REPORT
Page 164 of 166 February 1, 2016
Steward Carney Hospital
Category Project Number Project Initiatives Description
Demo Year
Fiscal Year
Metric Completed Incentive
1 1.1 Implement Patient Navigation Services
Utilize bilingual community health workers to provide social support services and care to vulnerable/high risk patients to reduce preventable ED visits and encourage primary care.
15 2012 √ $ 512,448
16 2013 √ $ 768,672
17 2014 √ $ 768,670
1 1.2 Develop Integrated Acute and Post-Acute Network Across the Continuum of Care
Develop integrated acute/post-acute network across continuum of care, reduce readmission and hospitalization of patients in post-acute settings within SCH integrated care continuum.
15 2012 √ $ 512,448
16 2013 √ $ 768,672
17 2014 √ $ 768,672
2 2.1 Enhance Patient Transitions
Enhance communication throughout the discharge process between non-acute and acute settings via the Interventions to Reduce Acute Care Transfers (INTERACT) tools.
15 2012 √ $ 512,448
16 2013 √ $ 192,168
17 2014 √ $ 192,168
2 2.2 Implement Process Improvement Methodologies to Improve Safety, Quality, and Efficiency
Implementation of the Nurses Improving Care for Health System Elders (NICHE) Program.
15 2012 √ $ 512,448
16 2013 √ $ 614,936
17 2014 √ $ 640,560
2 2.3 Reduce Variations in Care Implement condition-specific Clinical Team Care Maps that describe needed evidence-based care for patients across the care continuum.
15 2012 √ $ 439,242
16 2013 √ $ 768,670
17 2014 √ $ 628,911
3 3.1 Implement Global Payment Pilot
Develop a global or risk-based arrangement for state-subsidized low-income patients that can be appropriately attributed to SCH.
15 2012 √ $ 512,448
16 2013 √ $ 768,670
17 2014 √ $ 768,672
3 3.2 Participate in a Learning Collaborative
Support the development of a culture of continuous improvement and innovation as well as provide a forum to share lessons learned.
15 2012 √ $ 128,112
16 2013 √ $ 192,168
17 2014 √ $ 192,168
4 4.1 Common Measures 15 2012 NA $ -
16 2013 √ $ 1,036,200
17 2014 √ $ 1,067,604
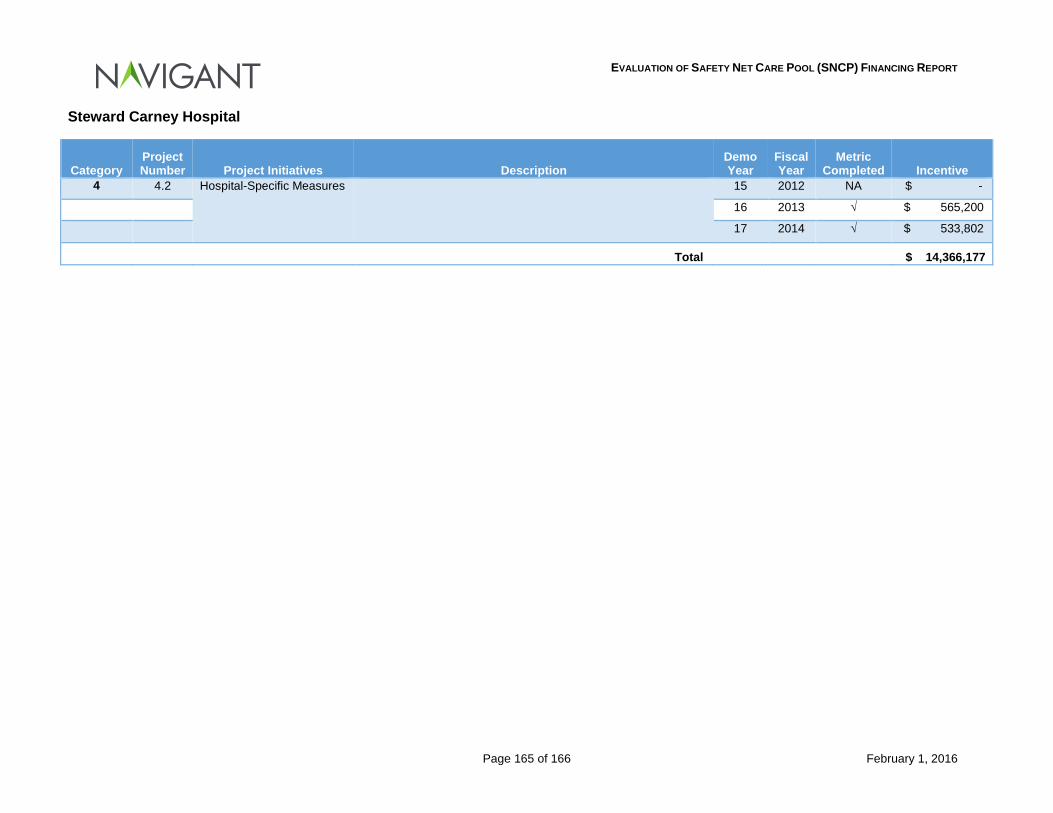
EVALUATION OF SAFETY NET CARE POOL (SNCP) FINANCING REPORT
Page 165 of 166 February 1, 2016
Steward Carney Hospital
Category Project Number Project Initiatives Description
Demo Year
Fiscal Year
Metric Completed Incentive
4 4.2 Hospital-Specific Measures 15 2012 NA $ -
16 2013 √ $ 565,200
17 2014 √ $ 533,802
Total $ 14,366,177
EVALUATION OF SAFETY NET CARE POOL (SNCP) FINANCING REPORT
Page 166 of 166 February 1, 2016
8.12 Appendix L: DSTI Initiatives – Provider Presentation (Insert Provider Presentation here)
Draft 12/22/2015 1
Massachusetts Delivery System Transformation Initiatives (DSTI)
Demonstration Years 16, 17 and 18 State Fiscal Years 2013, 2014, 2015
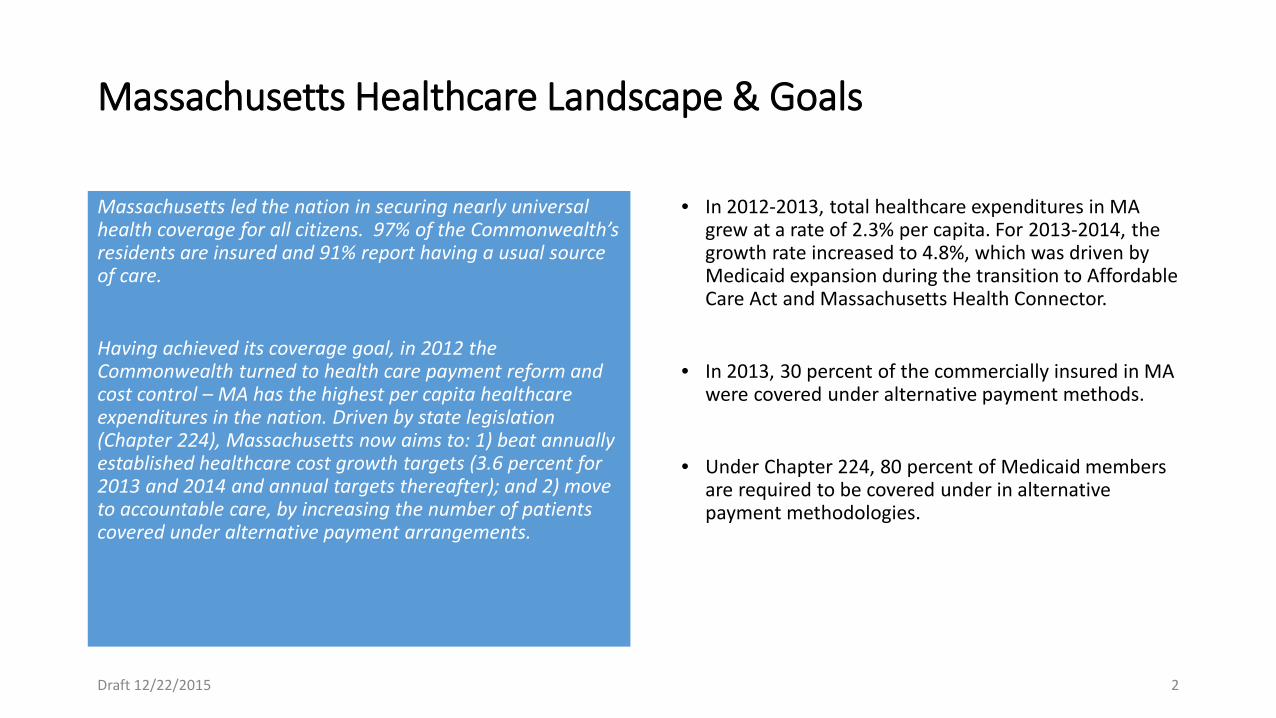
Massachusetts Healthcare Landscape & Goals
Massachusetts led the nation in securing nearly universal health coverage for all citizens. 97% of the Commonwealth’s residents are insured and 91% report having a usual source of care.
Having achieved its coverage goal, in 2012 the Commonwealth turned to health care payment reform and cost control – MA has the highest per capita healthcare expenditures in the nation. Driven by state legislation (Chapter 224), Massachusetts now aims to: 1) beat annually established healthcare cost growth targets (3.6 percent for 2013 and 2014 and annual targets thereafter); and 2) move to accountable care, by increasing the number of patients covered under alternative payment arrangements.
• In 2012-2013, total healthcare expenditures in MA grew at a rate of 2.3% per capita. For 2013-2014, the growth rate increased to 4.8%, which was driven by Medicaid expansion during the transition to Affordable Care Act and Massachusetts Health Connector.
• In 2013, 30 percent of the commercially insured in MA were covered under alternative payment methods.
• Under Chapter 224, 80 percent of Medicaid members are required to be covered under in alternative payment methodologies.r
Draft 12/22/2015 2
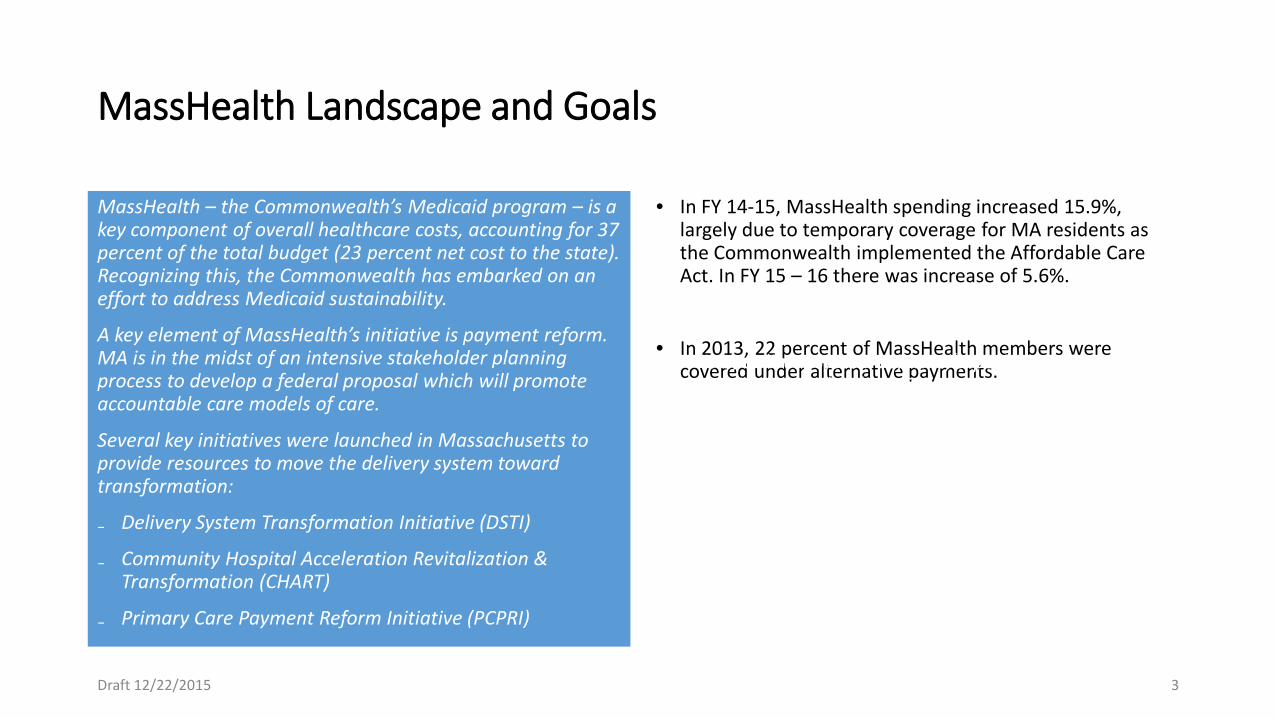
MassHealth Landscape and Goals
MassHealth – the Commonwealth’s Medicaid program – is a key component of overall healthcare costs, accounting for 37 percent of the total budget (23 percent net cost to the state). Recognizing this, the Commonwealth has embarked on an effort to address Medicaid sustainability.
A key element of MassHealth’s initiative is payment reform. MA is in the midst of an intensive stakeholder planning process to develop a federal proposal which will promote accountable care models of care.
Several key initiatives were launched in Massachusetts to provide resources to move the delivery system toward transformation:
₋ Delivery System Transformation Initiative (DSTI)
₋ Community Hospital Acceleration Revitalization & Transformation (CHART)
₋ Primary Care Payment Reform Initiative (PCPRI)
• Healthcare Innovation Investment Program
• In FY 14-15, MassHealth spending increased 15.9%, largely due to temporary coverage for MA residents as the Commonwealth implemented the Affordable Care Act. In FY 15 – 16 there was increase of 5.6%.
• In 2013, 22 percent of MassHealth members were covered under alternative payments.
Draft 12/22/2015 3
• And, delivery system reforms/experimentation are ripe in the market (e.g., 7 Pioneer ACOs are in Massachusetts).
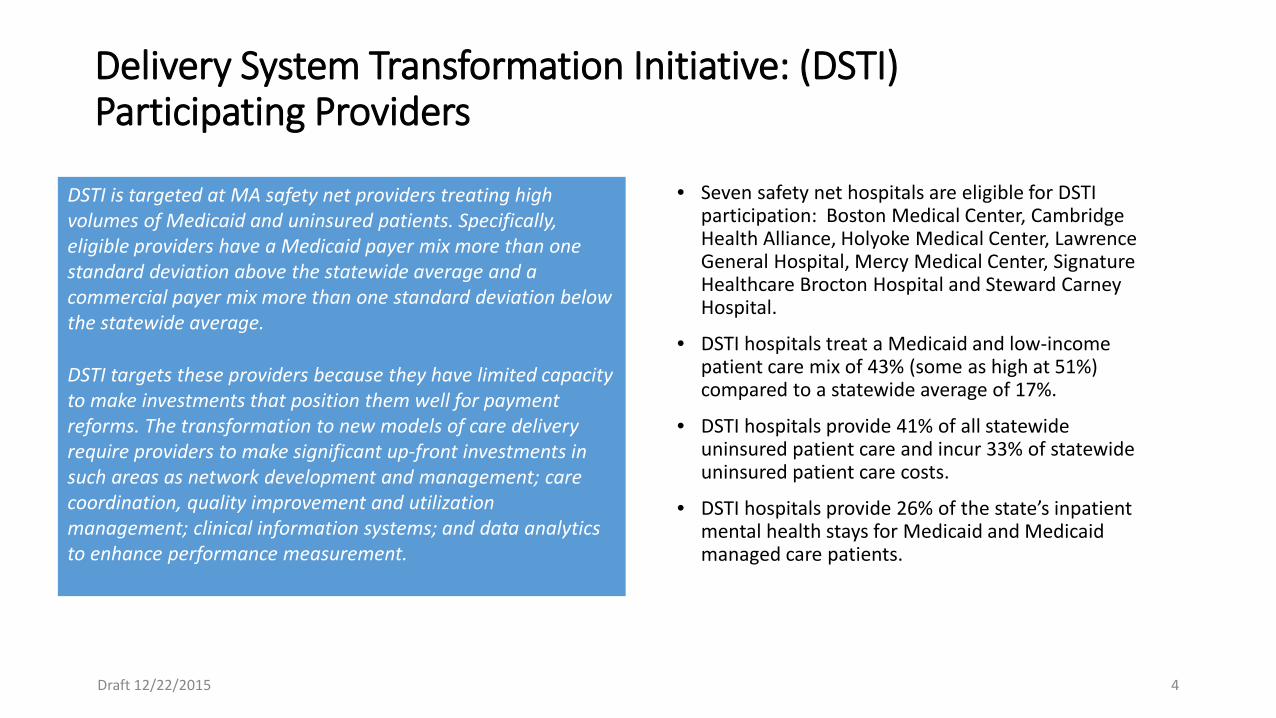
Delivery System Transformation Initiative: (DSTI) Participating Providers
• Seven safety net hospitals are eligible for DSTI
participation: Boston Medical Center, Cambridge Health Alliance, Holyoke Medical Center, Lawrence General Hospital, Mercy Medical Center, Signature Healthcare Brocton Hospital and Steward Carney Hospital.
• DSTI hospitals treat a Medicaid and low-income patient care mix of 43% (some as high at 51%) compared to a statewide average of 17%.
• DSTI hospitals provide 41% of all statewide uninsured patient care and incur 33% of statewide uninsured patient care costs.
• DSTI hospitals provide 26% of the state’s inpatient mental health stays for Medicaid and Medicaid managed care patients.
DSTI is targeted at MA safety net providers treating high volumes of Medicaid and uninsured patients. Specifically, eligible providers have a Medicaid payer mix more than one standard deviation above the statewide average and a commercial payer mix more than one standard deviation below the statewide average.
DSTI targets these providers because they have limited capacity to make investments that position them well for payment reforms. The transformation to new models of care delivery require providers to make significant up-front investments in such areas as network development and management; care coordination, quality improvement and utilization management; clinical information systems; and data analytics to enhance performance measurement.
Draft 12/22/2015 4
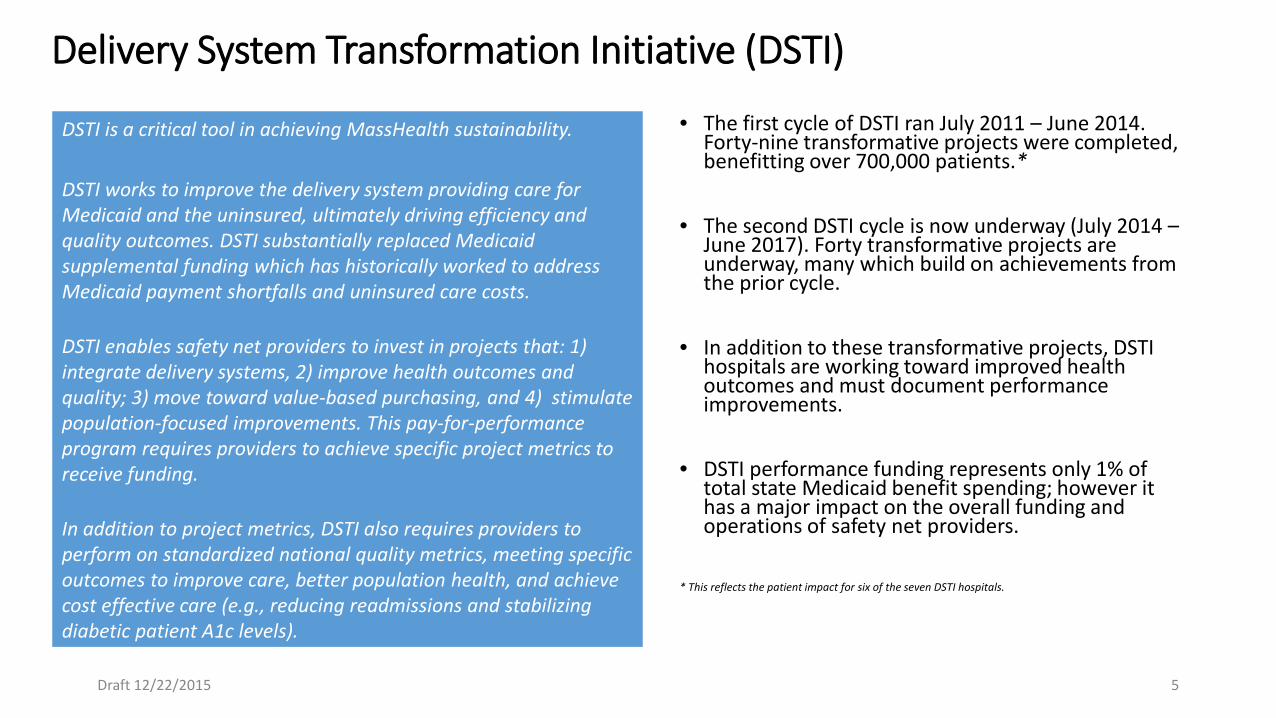
Delivery System Transformation Initiative (DSTI)
DSTI is a critical tool in achieving MassHealth sustainability.
DSTI works to improve the delivery system providing care for Medicaid and the uninsured, ultimately driving efficiency and quality outcomes. DSTI substantially replaced Medicaid supplemental funding which has historically worked to address Medicaid payment shortfalls and uninsured care costs.
DSTI enables safety net providers to invest in projects that: 1) integrate delivery systems, 2) improve health outcomes and quality; 3) move toward value-based purchasing, and 4) stimulate population-focused improvements. This pay-for-performance program requires providers to achieve specific project metrics to receive funding.
In addition to project metrics, DSTI also requires providers to perform on standardized national quality metrics, meeting specific outcomes to improve care, better population health, and achieve cost effective care (e.g., reducing readmissions and stabilizing diabetic patient A1c levels).
• The first cycle of DSTI ran July 2011 – June 2014. Forty-nine transformative projects were completed, benefitting over 700,000 patients.*
• The second DSTI cycle is now underway (July 2014 –
June 2017). Forty transformative projects are underway, many which build on achievements from the prior cycle.
• In addition to these transformative projects, DSTI hospitals are working toward improved health outcomes and must document performance improvements.
• DSTI performance funding represents only 1% of total state Medicaid benefit spending; however it has a major impact on the overall funding and operations of safety net providers.
* This reflects the patient impact for six of the seven DSTI hospitals.
Draft 12/22/2015 5
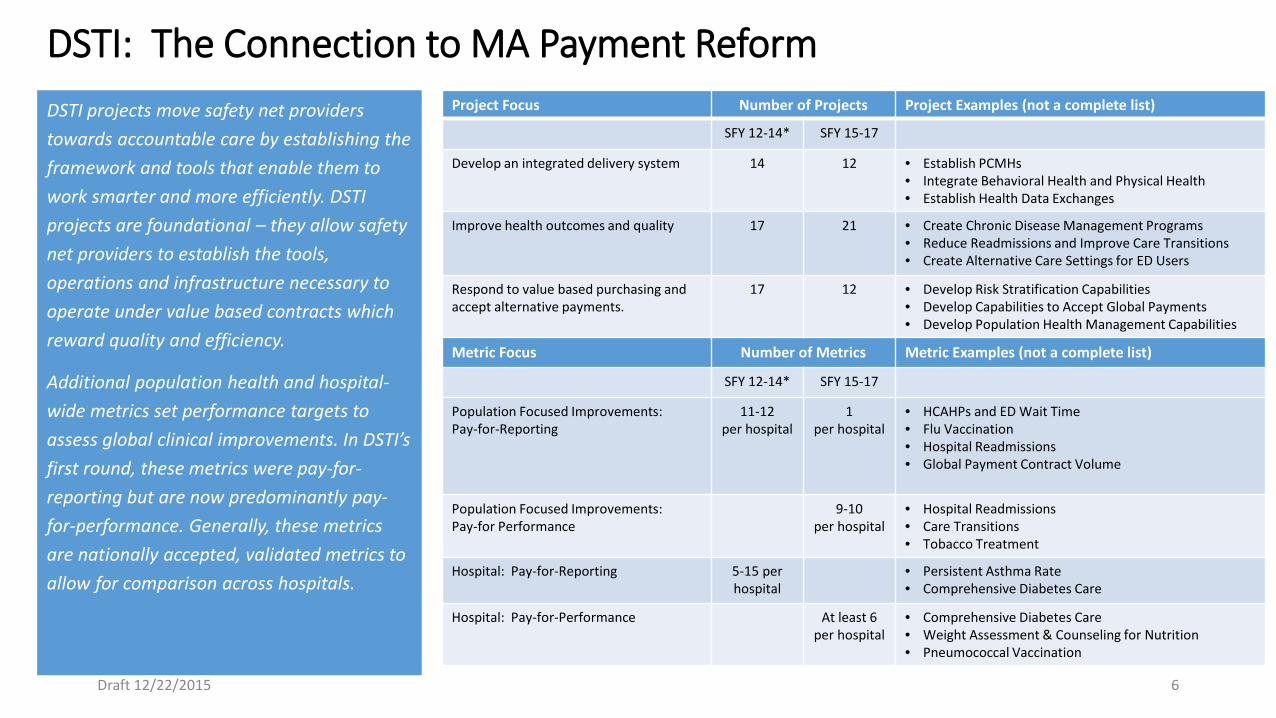
DSTI: The Connection to MA Payment Reform
DSTI projects move safety net providers towards accountable care by establishing the framework and tools that enable them to work smarter and more efficiently. DSTI projects are foundational – they allow safety net providers to establish the tools, operations and infrastructure necessary to operate under value based contracts which reward quality and efficiency.
Additional population health and hospital-wide metrics set performance targets to assess global clinical improvements. In DSTI’s first round, these metrics were pay-for-reporting but are now predominantly pay-for-performance. Generally, these metrics are nationally accepted, validated metrics to allow for comparison across hospitals.
Project Focus Number of Projects Project Examples (not a complete list)
SFY 12-14* SFY 15-17
Develop an integrated delivery system 14 12 • Establish PCMHs • Integrate Behavioral Health and Physical Health • Establish Health Data Exchanges
Improve health outcomes and quality 17 21 • Create Chronic Disease Management Programs • Reduce Readmissions and Improve Care Transitions • Create Alternative Care Settings for ED Users
Respond to value based purchasing and accept alternative payments.
17 12 • Develop Risk Stratification Capabilities • Develop Capabilities to Accept Global Payments • Develop Population Health Management Capabilities
Metric Focus Number of Metrics Metric Examples (not a complete list)
SFY 12-14* SFY 15-17
Population Focused Improvements: Pay-for-Reporting
11-12 per hospital
1 per hospital
• HCAHPs and ED Wait Time • Flu Vaccination • Hospital Readmissions • Global Payment Contract Volume
Population Focused Improvements: Pay-for Performance
9-10 per hospital
• Hospital Readmissions • Care Transitions • Tobacco Treatment
Hospital: Pay-for-Reporting 5-15 per hospital
• Persistent Asthma Rate • Comprehensive Diabetes Care
Hospital: Pay-for-Performance At least 6 per hospital
• Comprehensive Diabetes Care • Weight Assessment & Counseling for Nutrition • Pneumococcal Vaccination
Draft 12/22/2015 6
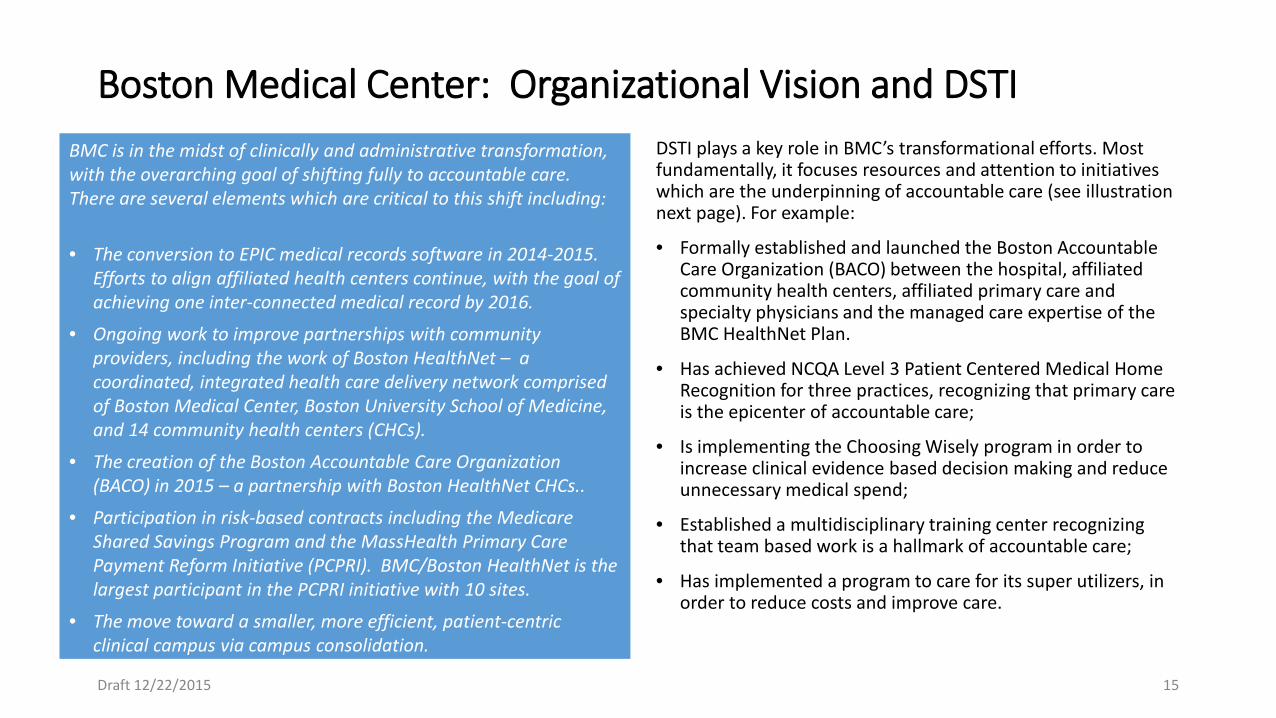
Boston Medical Center: Organizational Vision and DSTI BMC is in the midst of clinically and administrative transformation, with the overarching goal of shifting fully to accountable care. There are several elements which are critical to this shift including:
• The conversion to EPIC medical records software in 2014-2015. Efforts to align affiliated health centers continue, with the goal of achieving one inter-connected medical record by 2016.
• Ongoing work to improve partnerships with community providers, including the work of Boston HealthNet – a coordinated, integrated health care delivery network comprised of Boston Medical Center, Boston University School of Medicine, and 14 community health centers (CHCs).
• The creation of the Boston Accountable Care Organization (BACO) in 2015 – a partnership with Boston HealthNet CHCs..
• Participation in risk-based contracts including the Medicare Shared Savings Program and the MassHealth Primary Care Payment Reform Initiative (PCPRI). BMC/Boston HealthNet is the largest participant in the PCPRI initiative with 10 sites.
• The move toward a smaller, more efficient, patient-centric clinical campus via campus consolidation.
DSTI plays a key role in BMC’s transformational efforts. Most fundamentally, it focuses resources and attention to initiatives which are the underpinning of accountable care (see illustration next page). For example:
• Formally established and launched the Boston Accountable Care Organization (BACO) between the hospital, affiliated community health centers, affiliated primary care and specialty physicians and the managed care expertise of the BMC HealthNet Plan.
• Has achieved NCQA Level 3 Patient Centered Medical Home Recognition for three practices, recognizing that primary care is the epicenter of accountable care;
• Is implementing the Choosing Wisely program in order to increase clinical evidence based decision making and reduce unnecessary medical spend;
• Established a multidisciplinary training center recognizing that team based work is a hallmark of accountable care;
• Has implemented a program to care for its super utilizers, in order to reduce costs and improve care.
Draft 12/22/2015 15
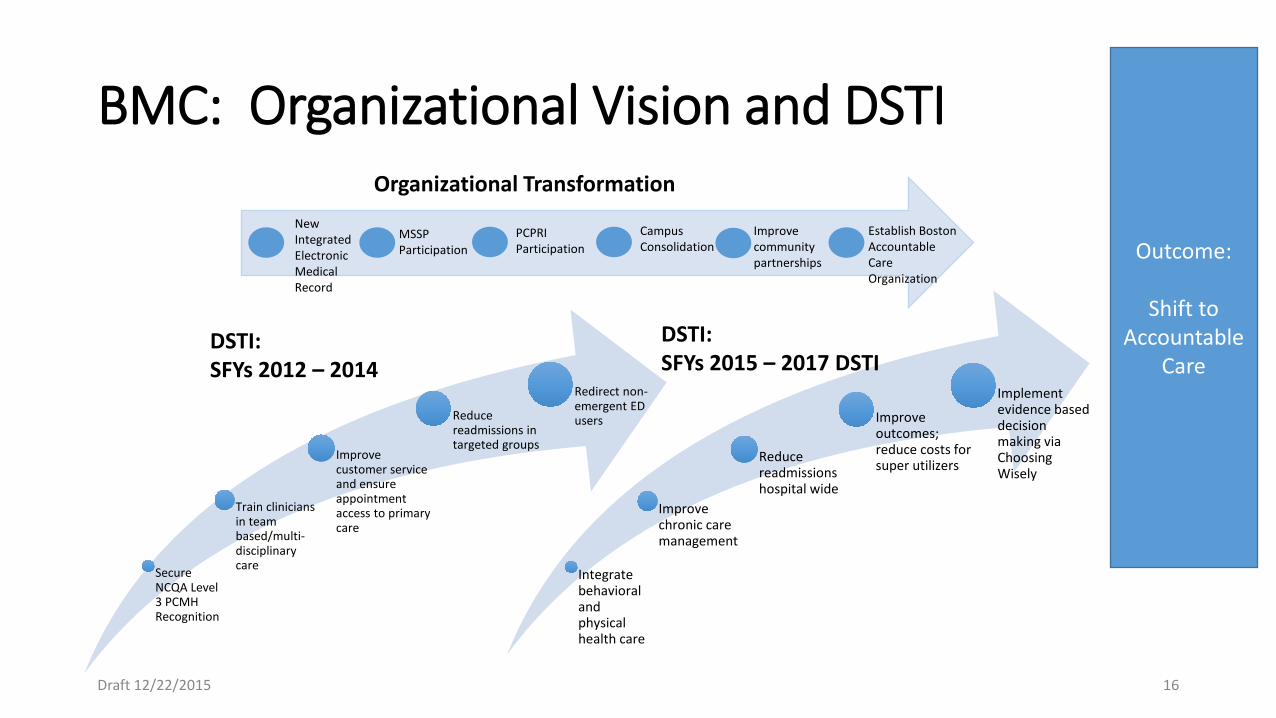
BMC: Organizational Vision and DSTI
Secure NCQA Level 3 PCMH Recognition
Train clinicians in team based/multi-disciplinary care
Improve customer service and ensure appointment access to primary care
Reduce readmissions in targeted groups
Redirect non-emergent ED users
Integrate behavioral and physical health care
Improve chronic care management
Reduce readmissions hospital wide
Improve outcomes; reduce costs for super utilizers
Implement evidence based decision making via Choosing Wisely
DSTI: SFYs 2012 – 2014
DSTI: SFYs 2015 – 2017 DSTI
Outcome:
Shift to Accountable
Care
Organizational Transformation New Integrated Electronic Medical Record
MSSP Participation
PCPRI Participation
Campus Consolidation
Improve community partnerships
Establish Boston Accountable Care Organization
Draft 12/22/2015 16
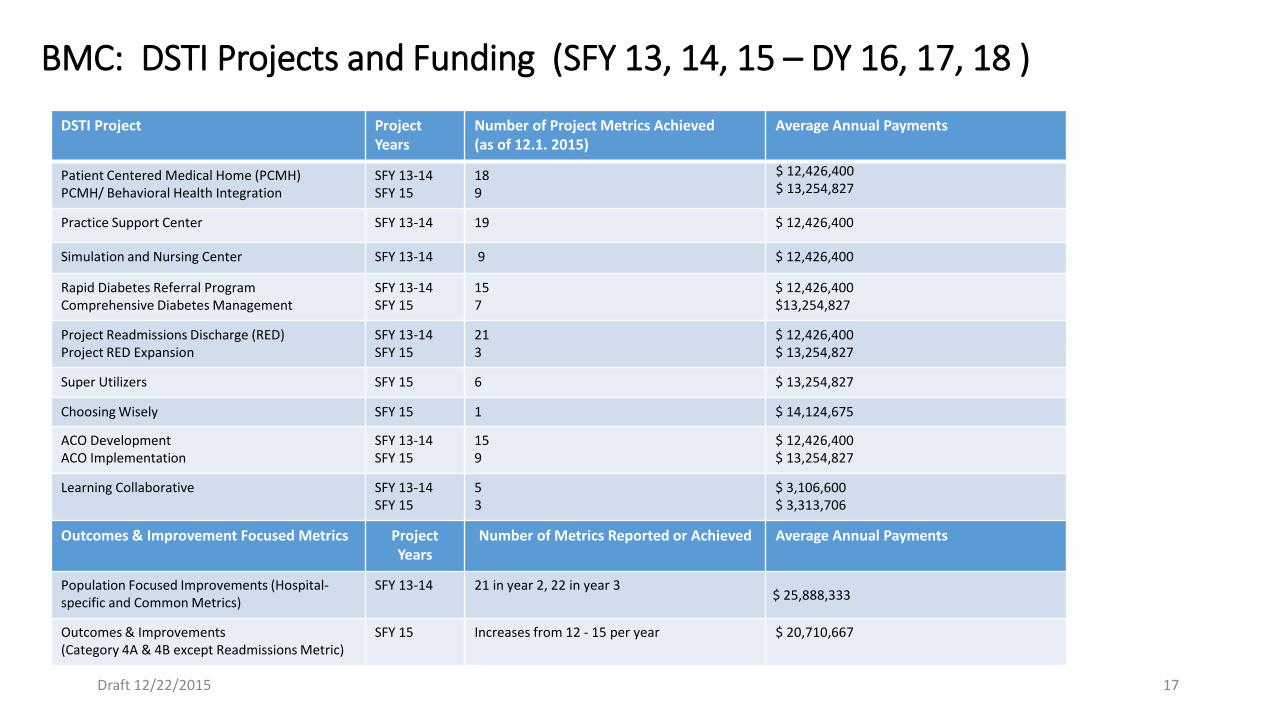
BMC: DSTI Projects and Funding (SFY 13, 14, 15 – DY 16, 17, 18 )
DSTI Project Project Years
Number of Project Metrics Achieved (as of 12.1. 2015)
Average Annual Payments
Patient Centered Medical Home (PCMH) PCMH/ Behavioral Health Integration
SFY 13-14 SFY 15
18 9
$ 12,426,400 $ 13,254,827
Practice Support Center SFY 13-14 19 $ 12,426,400
Simulation and Nursing Center SFY 13-14 9 $ 12,426,400
Rapid Diabetes Referral Program Comprehensive Diabetes Management
SFY 13-14 SFY 15
15 7
$ 12,426,400 $13,254,827
Project Readmissions Discharge (RED) Project RED Expansion
SFY 13-14 SFY 15
21 3
$ 12,426,400 $ 13,254,827
Super Utilizers SFY 15 6 $ 13,254,827
Choosing Wisely SFY 15 1 $ 14,124,675
ACO Development ACO Implementation
SFY 13-14 SFY 15
15 9
$ 12,426,400 $ 13,254,827
Learning Collaborative SFY 13-14 SFY 15
5 3
$ 3,106,600 $ 3,313,706
Outcomes & Improvement Focused Metrics Project Years
Number of Metrics Reported or Achieved Average Annual Payments
Population Focused Improvements (Hospital-specific and Common Metrics)
SFY 13-14 21 in year 2, 22 in year 3 $ 25,888,333
Outcomes & Improvements (Category 4A & 4B except Readmissions Metric)
SFY 15 Increases from 12 - 15 per year $ 20,710,667
Draft 12/22/2015 17
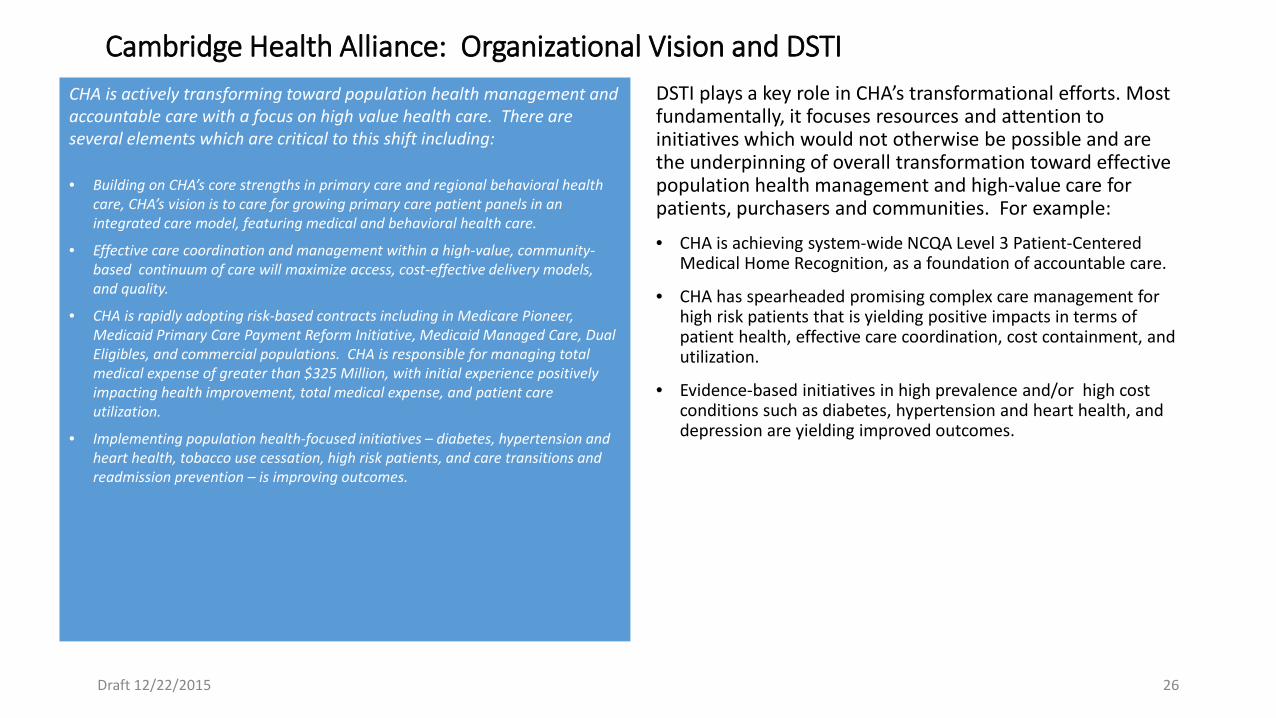
Cambridge Health Alliance: Organizational Vision and DSTI CHA is actively transforming toward population health management and accountable care with a focus on high value health care. There are several elements which are critical to this shift including:
• Building on CHA’s core strengths in primary care and regional behavioral health care, CHA’s vision is to care for growing primary care patient panels in an integrated care model, featuring medical and behavioral health care.
• Effective care coordination and management within a high-value, community-based continuum of care will maximize access, cost-effective delivery models, and quality.
• CHA is rapidly adopting risk-based contracts including in Medicare Pioneer, Medicaid Primary Care Payment Reform Initiative, Medicaid Managed Care, Dual Eligibles, and commercial populations. CHA is responsible for managing total medical expense of greater than $325 Million, with initial experience positively impacting health improvement, total medical expense, and patient care utilization.
• Implementing population health-focused initiatives – diabetes, hypertension and heart health, tobacco use cessation, high risk patients, and care transitions and readmission prevention – is improving outcomes.
DSTI plays a key role in CHA’s transformational efforts. Most fundamentally, it focuses resources and attention to initiatives which would not otherwise be possible and are the underpinning of overall transformation toward effective population health management and high-value care for patients, purchasers and communities. For example:
• CHA is achieving system-wide NCQA Level 3 Patient-Centered Medical Home Recognition, as a foundation of accountable care.
• CHA has spearheaded promising complex care management for high risk patients that is yielding positive impacts in terms of patient health, effective care coordination, cost containment, and utilization.
• Evidence-based initiatives in high prevalence and/or high cost conditions such as diabetes, hypertension and heart health, and depression are yielding improved outcomes.
Draft 12/22/2015 26
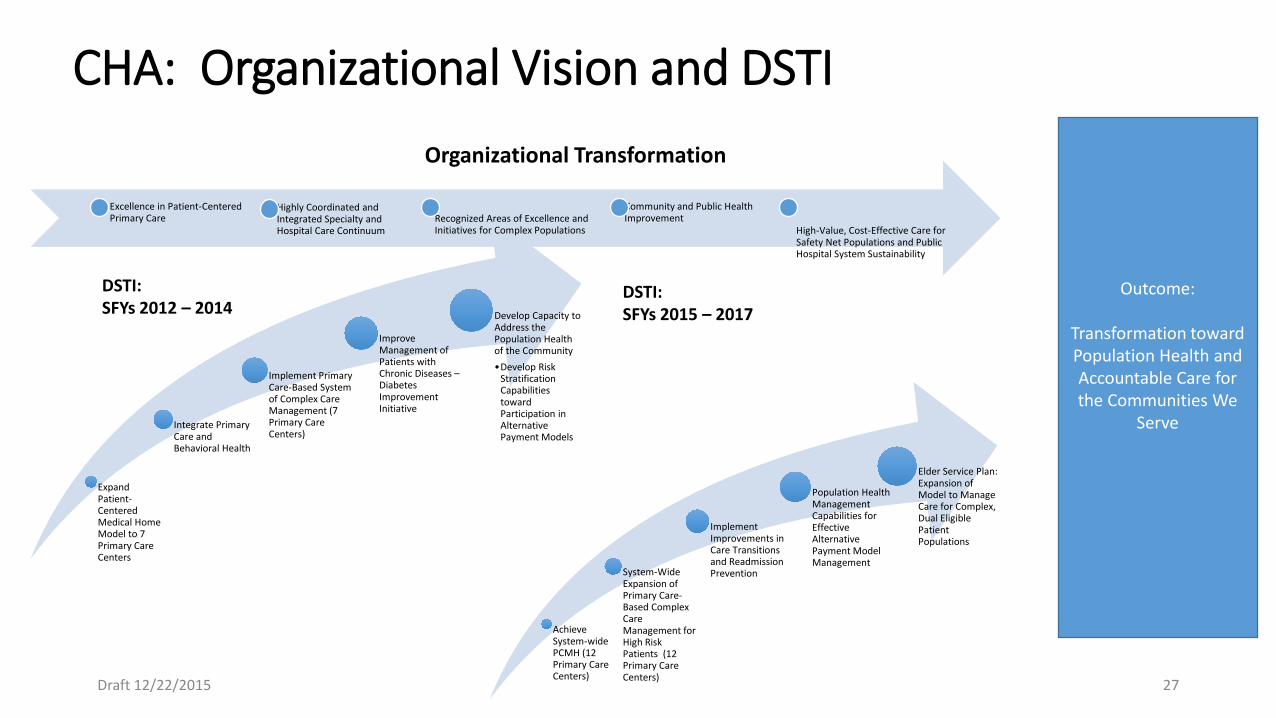
CHA: Organizational Vision and DSTI
Expand Patient-Centered Medical Home Model to 7 Primary Care Centers
Integrate Primary Care and Behavioral Health
Implement Primary Care-Based System of Complex Care Management (7 Primary Care Centers)
Improve Management of Patients with Chronic Diseases – Diabetes Improvement Initiative
Develop Capacity to Address the Population Health of the Community •Develop Risk
Stratification Capabilities toward Participation in Alternative Payment Models
Achieve System-wide PCMH (12 Primary Care Centers)
System-Wide Expansion of Primary Care-Based Complex Care Management for High Risk Patients (12 Primary Care Centers)
Implement Improvements in Care Transitions and Readmission Prevention
Population Health Management Capabilities for Effective Alternative Payment Model Management
Elder Service Plan: Expansion of Model to Manage Care for Complex, Dual Eligible Patient Populations
DSTI: SFYs 2012 – 2014
DSTI: SFYs 2015 – 2017
Outcome:
Transformation toward Population Health and Accountable Care for the Communities We
Serve
Organizational Transformation
Draft 12/22/2015 27
Excellence in Patient-Centered Primary Care
Highly Coordinated and Integrated Specialty and Hospital Care Continuum
Recognized Areas of Excellence and Initiatives for Complex Populations
Community and Public Health Improvement
High-Value, Cost-Effective Care for Safety Net Populations and Public Hospital System Sustainability
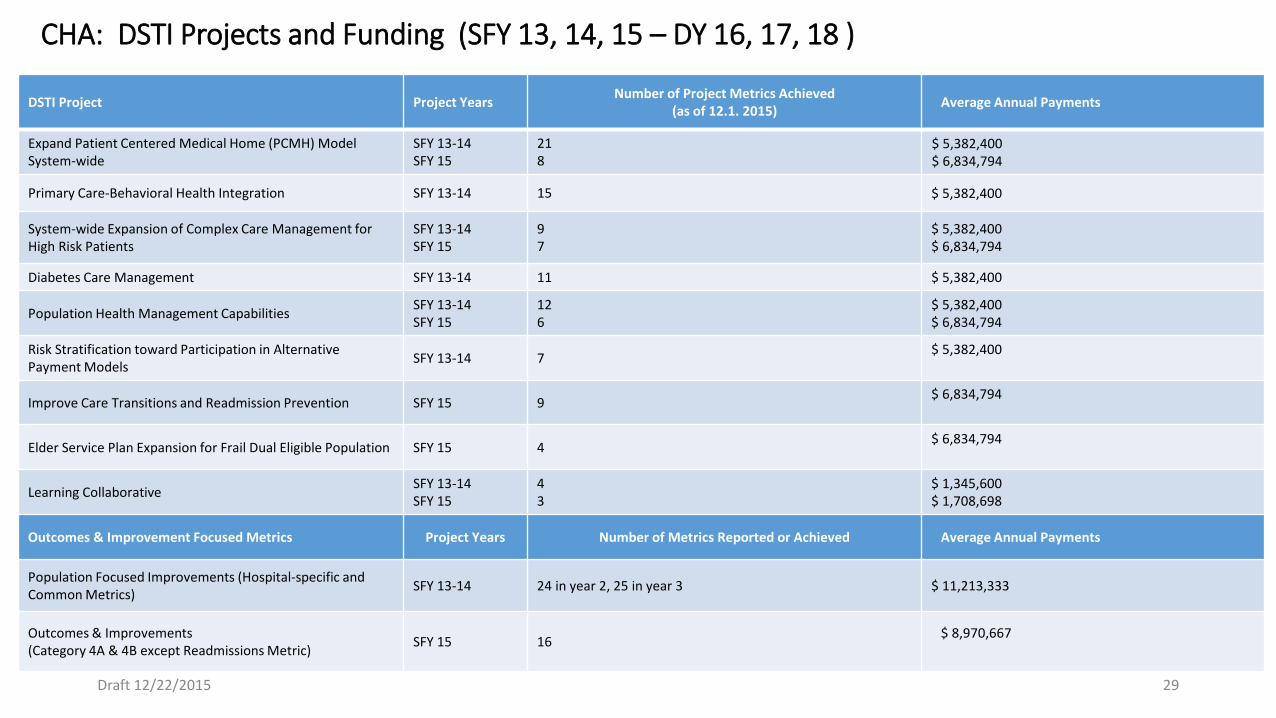
CHA: DSTI Projects and Funding (SFY 13, 14, 15 – DY 16, 17, 18 )
DSTI Project Project Years Number of Project Metrics Achieved (as of 12.1. 2015) Average Annual Payments
Expand Patient Centered Medical Home (PCMH) Model System-wide
SFY 13-14 SFY 15
21 8
$ 5,382,400 $ 6,834,794
Primary Care-Behavioral Health Integration SFY 13-14 15 $ 5,382,400
System-wide Expansion of Complex Care Management for High Risk Patients
SFY 13-14 SFY 15
9 7
$ 5,382,400 $ 6,834,794
Diabetes Care Management SFY 13-14 11 $ 5,382,400
Population Health Management Capabilities SFY 13-14 SFY 15
12 6
$ 5,382,400 $ 6,834,794
Risk Stratification toward Participation in Alternative Payment Models SFY 13-14 7 $ 5,382,400
Improve Care Transitions and Readmission Prevention SFY 15 9 $ 6,834,794
Elder Service Plan Expansion for Frail Dual Eligible Population SFY 15 4 $ 6,834,794
Learning Collaborative SFY 13-14 SFY 15
4 3
$ 1,345,600 $ 1,708,698
Outcomes & Improvement Focused Metrics Project Years Number of Metrics Reported or Achieved Average Annual Payments
Population Focused Improvements (Hospital-specific and Common Metrics) SFY 13-14 24 in year 2, 25 in year 3 $ 11,213,333
Outcomes & Improvements (Category 4A & 4B except Readmissions Metric) SFY 15 16 $ 8,970,667
Draft 12/22/2015 29
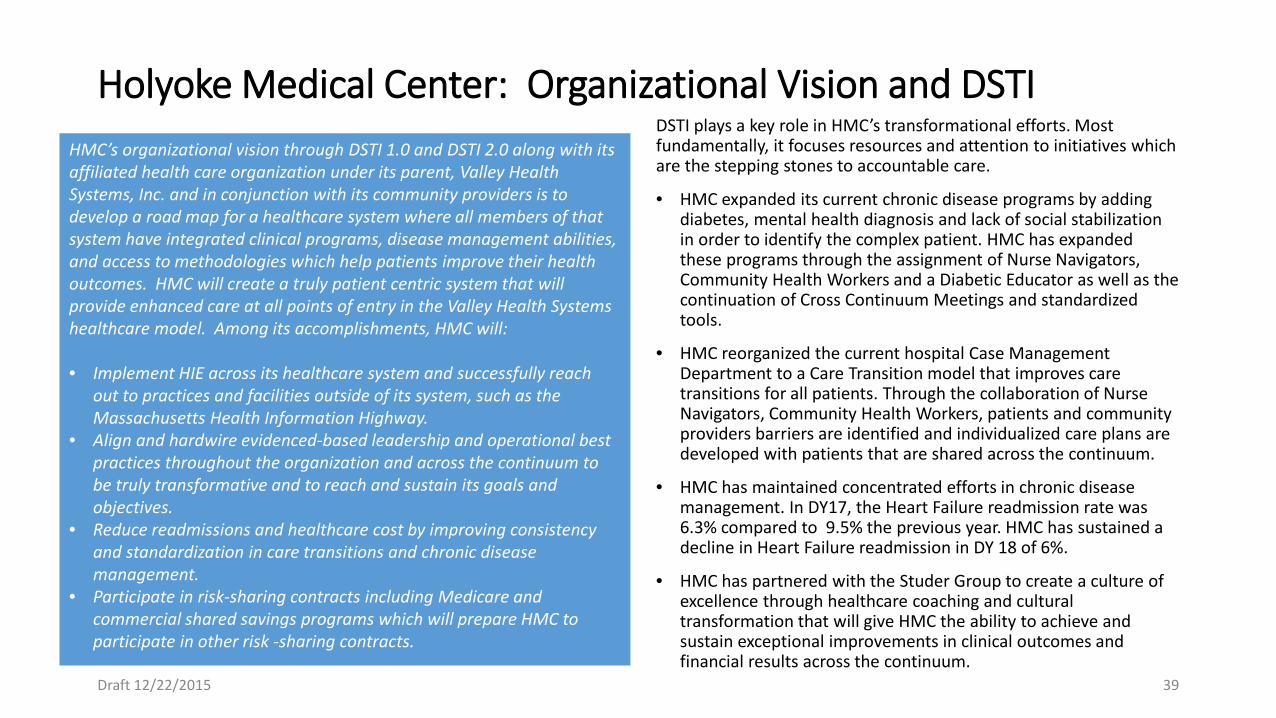
Holyoke Medical Center: Organizational Vision and DSTI HMC’s organizational vision through DSTI 1.0 and DSTI 2.0 along with its affiliated health care organization under its parent, Valley Health Systems, Inc. and in conjunction with its community providers is to develop a road map for a healthcare system where all members of that system have integrated clinical programs, disease management abilities, and access to methodologies which help patients improve their health outcomes. HMC will create a truly patient centric system that will provide enhanced care at all points of entry in the Valley Health Systems healthcare model. Among its accomplishments, HMC will: • Implement HIE across its healthcare system and successfully reach
out to practices and facilities outside of its system, such as the Massachusetts Health Information Highway.
• Align and hardwire evidenced-based leadership and operational best practices throughout the organization and across the continuum to be truly transformative and to reach and sustain its goals and objectives.
• Reduce readmissions and healthcare cost by improving consistency and standardization in care transitions and chronic disease management.
• Participate in risk-sharing contracts including Medicare and commercial shared savings programs which will prepare HMC to participate in other risk -sharing contracts.
DSTI plays a key role in HMC’s transformational efforts. Most fundamentally, it focuses resources and attention to initiatives which are the stepping stones to accountable care.
• HMC expanded its current chronic disease programs by adding diabetes, mental health diagnosis and lack of social stabilization in order to identify the complex patient. HMC has expanded these programs through the assignment of Nurse Navigators, Community Health Workers and a Diabetic Educator as well as the continuation of Cross Continuum Meetings and standardized tools.
• HMC reorganized the current hospital Case Management Department to a Care Transition model that improves care transitions for all patients. Through the collaboration of Nurse Navigators, Community Health Workers, patients and community providers barriers are identified and individualized care plans are developed with patients that are shared across the continuum.
• HMC has maintained concentrated efforts in chronic disease management. In DY17, the Heart Failure readmission rate was 6.3% compared to 9.5% the previous year. HMC has sustained a decline in Heart Failure readmission in DY 18 of 6%.
• HMC has partnered with the Studer Group to create a culture of excellence through healthcare coaching and cultural transformation that will give HMC the ability to achieve and sustain exceptional improvements in clinical outcomes and financial results across the continuum.
Draft 12/22/2015 39
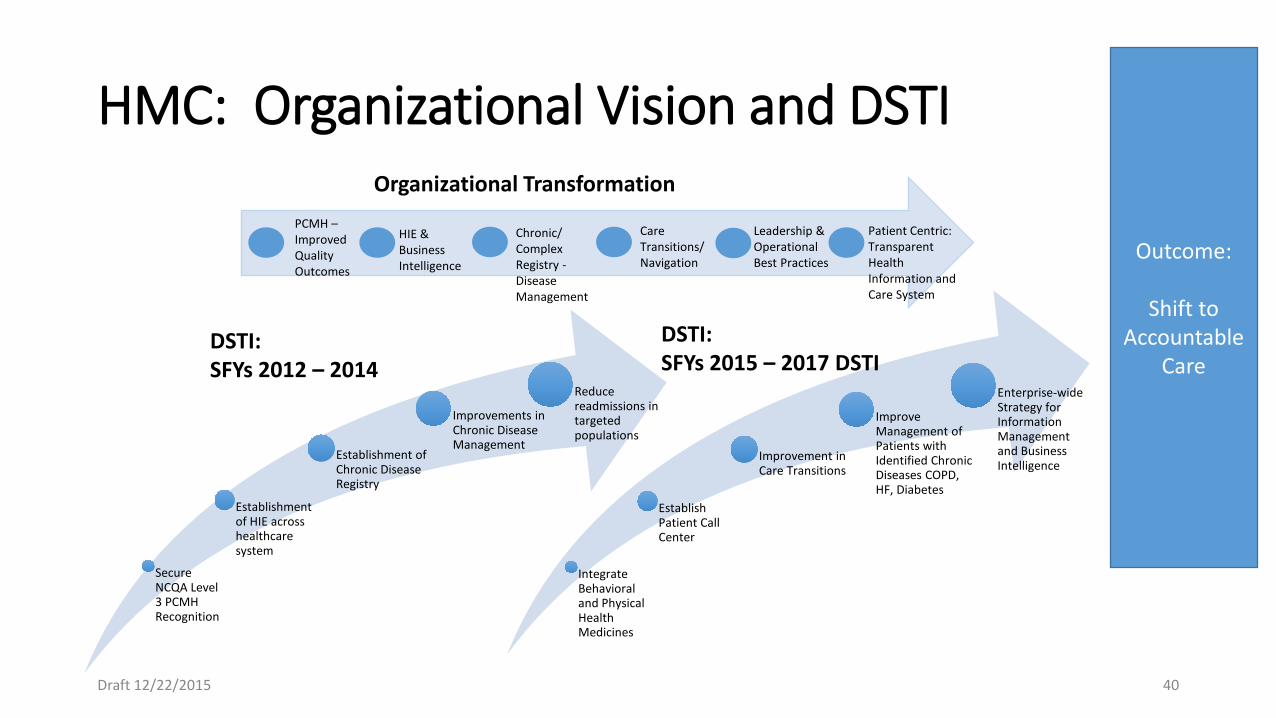
HMC: Organizational Vision and DSTI
Secure NCQA Level 3 PCMH Recognition
Establishment of HIE across healthcare system
Establishment of Chronic Disease Registry
Improvements in Chronic Disease Management
Reduce readmissions in targeted populations
Integrate Behavioral and Physical Health Medicines
Establish Patient Call Center
Improvement in Care Transitions
Improve Management of Patients with Identified Chronic Diseases COPD, HF, Diabetes
Enterprise-wide Strategy for Information Management and Business Intelligence
DSTI: SFYs 2012 – 2014
DSTI: SFYs 2015 – 2017 DSTI
Outcome:
Shift to Accountable
Care
Organizational Transformation PCMH – Improved Quality Outcomes
HIE & Business Intelligence
Chronic/ Complex Registry - Disease Management
Care Transitions/ Navigation
Leadership & Operational Best Practices
Patient Centric: Transparent Health Information and Care System
Draft 12/22/2015 40
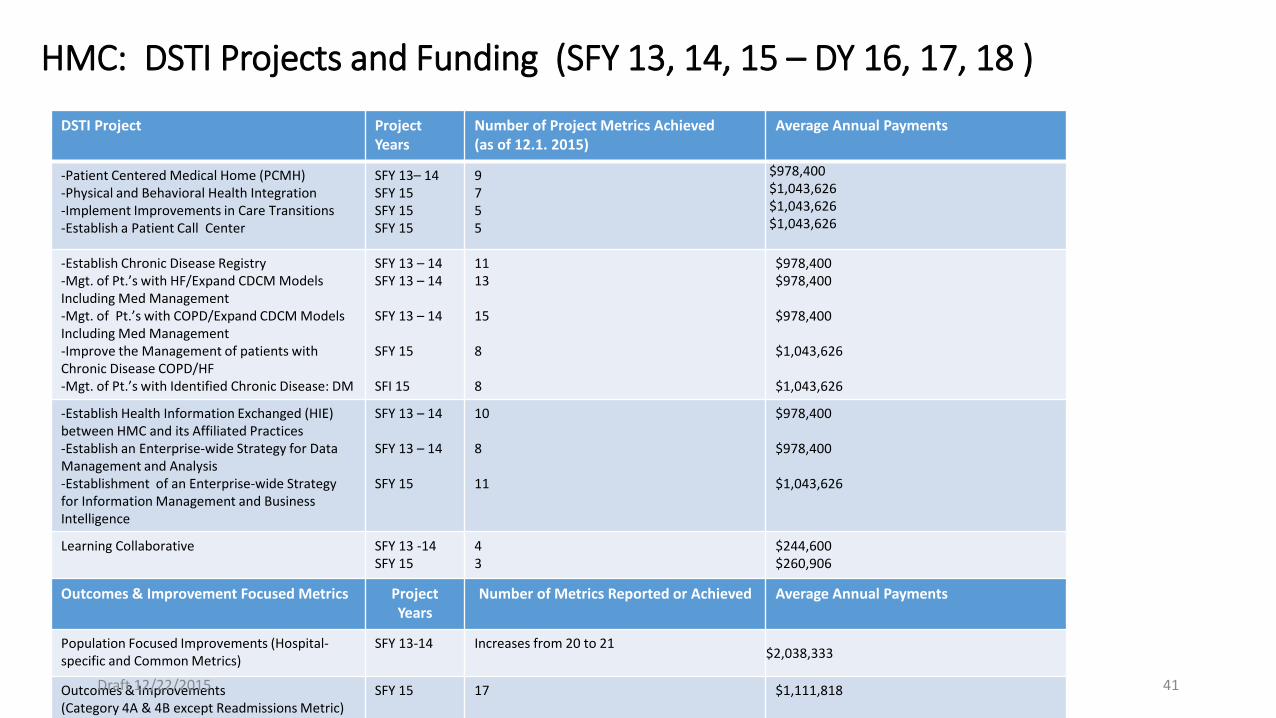
HMC: DSTI Projects and Funding (SFY 13, 14, 15 – DY 16, 17, 18 )
DSTI Project Project Years
Number of Project Metrics Achieved (as of 12.1. 2015)
Average Annual Payments
-Patient Centered Medical Home (PCMH) -Physical and Behavioral Health Integration -Implement Improvements in Care Transitions -Establish a Patient Call Center
SFY 13– 14 SFY 15 SFY 15 SFY 15
9 7 5 5
$978,400 $1,043,626 $1,043,626 $1,043,626
-Establish Chronic Disease Registry -Mgt. of Pt.’s with HF/Expand CDCM Models Including Med Management -Mgt. of Pt.’s with COPD/Expand CDCM Models Including Med Management -Improve the Management of patients with Chronic Disease COPD/HF -Mgt. of Pt.’s with Identified Chronic Disease: DM
SFY 13 – 14 SFY 13 – 14 SFY 13 – 14 SFY 15 SFI 15
11 13 15 8 8
$978,400 $978,400 $978,400 $1,043,626 $1,043,626
-Establish Health Information Exchanged (HIE) between HMC and its Affiliated Practices -Establish an Enterprise-wide Strategy for Data Management and Analysis -Establishment of an Enterprise-wide Strategy for Information Management and Business Intelligence
SFY 13 – 14 SFY 13 – 14 SFY 15
10 8 11
$978,400 $978,400 $1,043,626
Learning Collaborative SFY 13 -14 SFY 15
4 3
$244,600 $260,906
Outcomes & Improvement Focused Metrics Project Years
Number of Metrics Reported or Achieved Average Annual Payments
Population Focused Improvements (Hospital-specific and Common Metrics)
SFY 13-14 Increases from 20 to 21 $2,038,333
Outcomes & Improvements (Category 4A & 4B except Readmissions Metric)
SFY 15 17 $1,111,818 Draft 12/22/2015 41
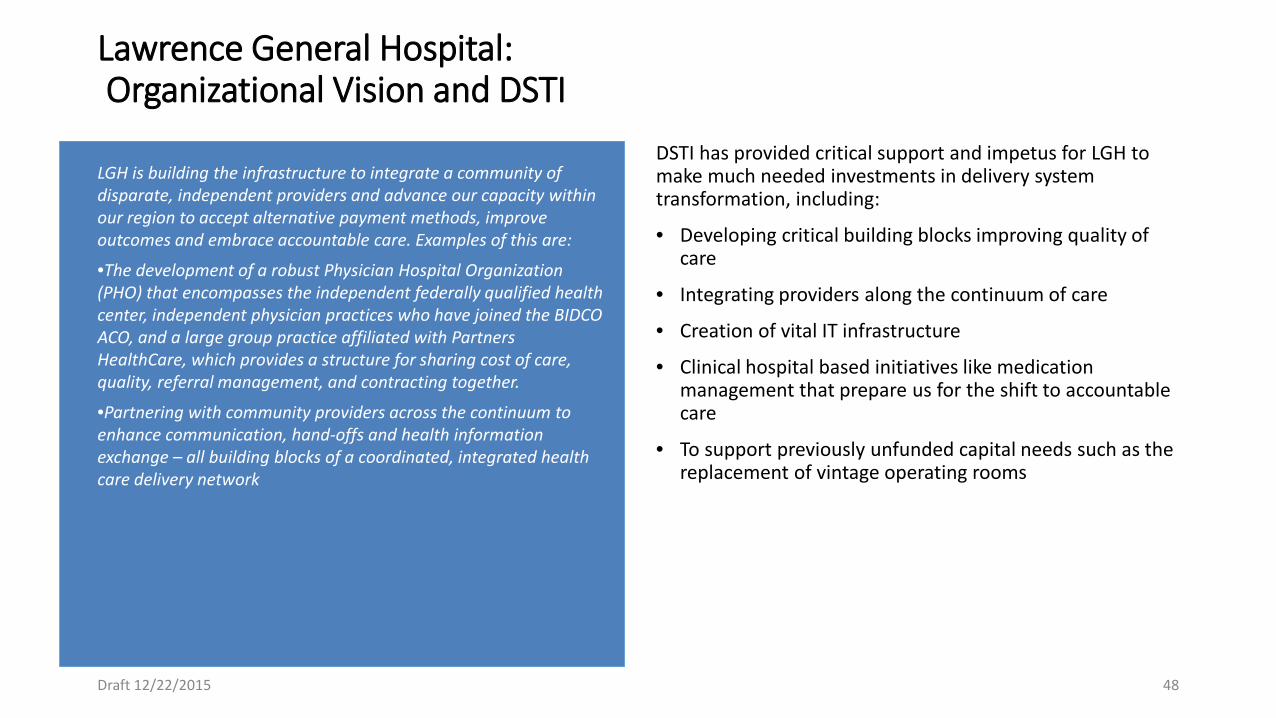
Lawrence General Hospital: Organizational Vision and DSTI
DSTI has provided critical support and impetus for LGH to make much needed investments in delivery system transformation, including:
• Developing critical building blocks improving quality of care
• Integrating providers along the continuum of care
• Creation of vital IT infrastructure
• Clinical hospital based initiatives like medication management that prepare us for the shift to accountable care
• To support previously unfunded capital needs such as the replacement of vintage operating rooms
Draft 12/22/2015 48
LGH is building the infrastructure to integrate a community of disparate, independent providers and advance our capacity within our region to accept alternative payment methods, improve outcomes and embrace accountable care. Examples of this are:
•The development of a robust Physician Hospital Organization (PHO) that encompasses the independent federally qualified health center, independent physician practices who have joined the BIDCO ACO, and a large group practice affiliated with Partners HealthCare, which provides a structure for sharing cost of care, quality, referral management, and contracting together.
•Partnering with community providers across the continuum to enhance communication, hand-offs and health information exchange – all building blocks of a coordinated, integrated health care delivery network
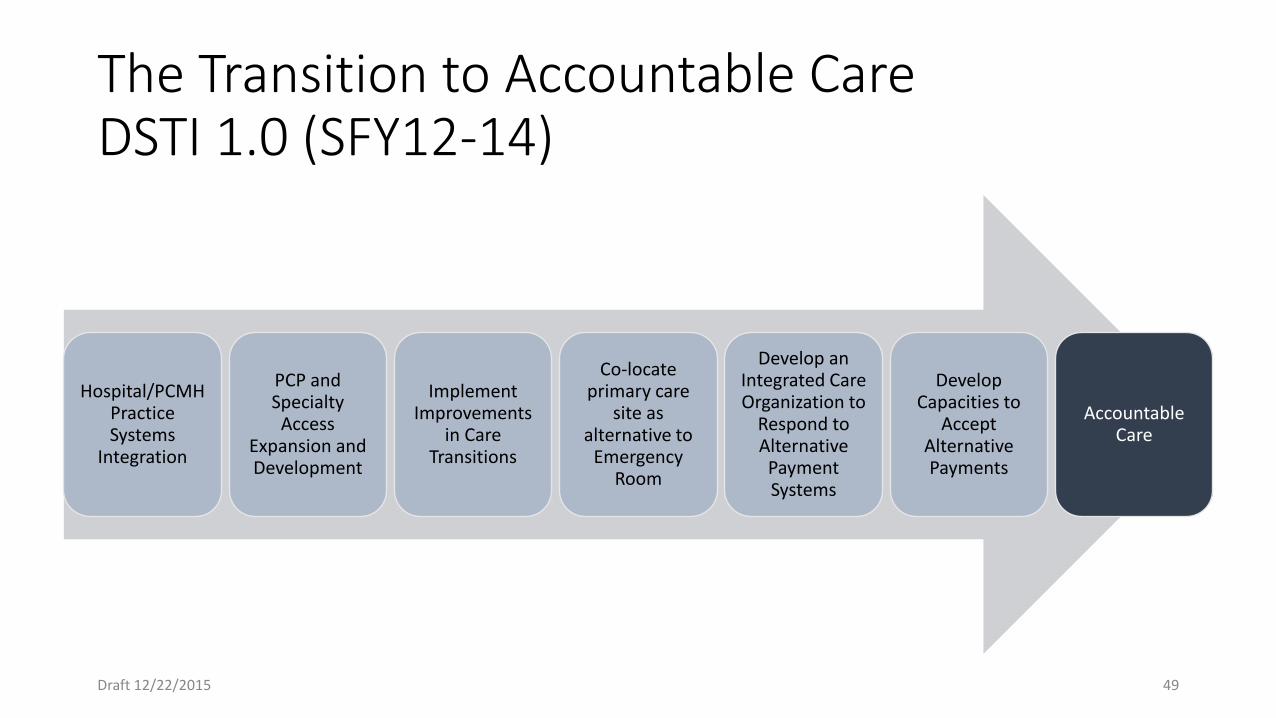
The Transition to Accountable Care DSTI 1.0 (SFY12-14)
Hospital/PCMH Practice Systems
Integration
PCP and Specialty
Access Expansion and Development
Implement Improvements
in Care Transitions
Co-locate primary care
site as alternative to
Emergency Room
Develop an Integrated Care Organization to
Respond to Alternative
Payment Systems
Develop Capacities to
Accept Alternative Payments
Accountable Care
Draft 12/22/2015 49
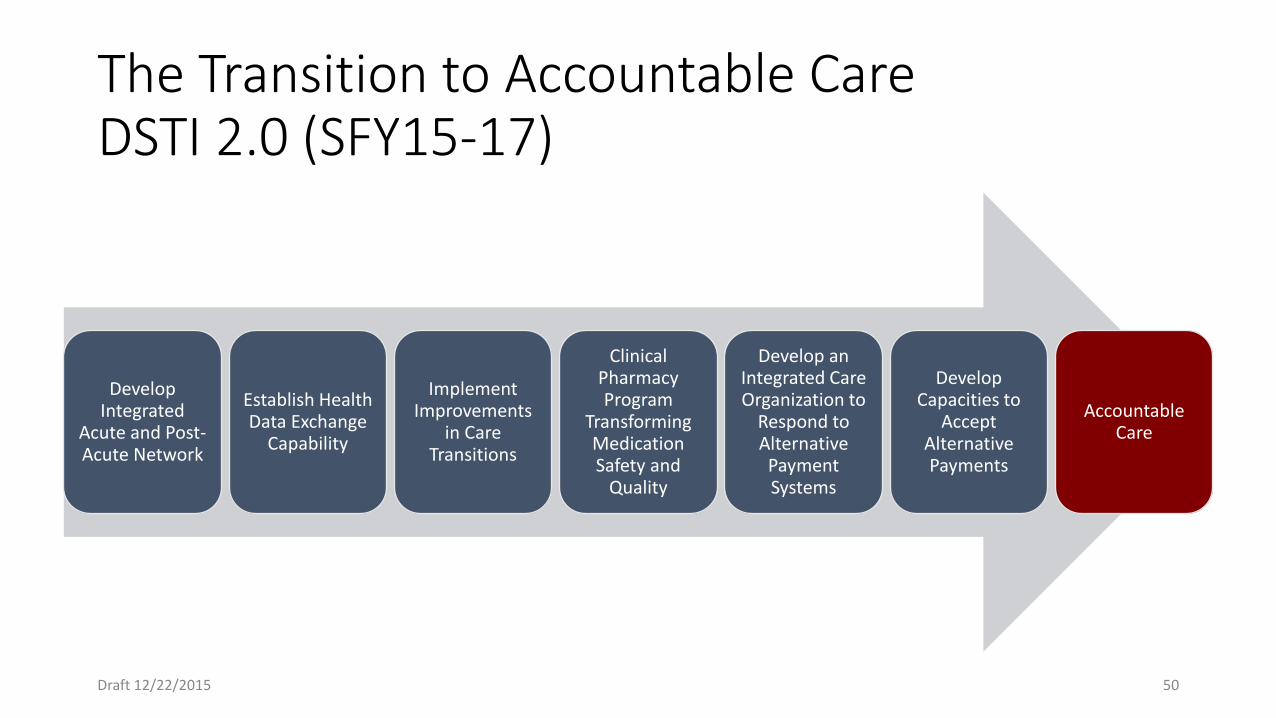
The Transition to Accountable Care DSTI 2.0 (SFY15-17)
Develop Integrated
Acute and Post-Acute Network
Establish Health Data Exchange
Capability
Implement Improvements
in Care Transitions
Clinical Pharmacy Program
Transforming Medication Safety and
Quality
Develop an Integrated Care Organization to
Respond to Alternative
Payment Systems
Develop Capacities to
Accept Alternative Payments
Accountable Care
Draft 12/22/2015 50
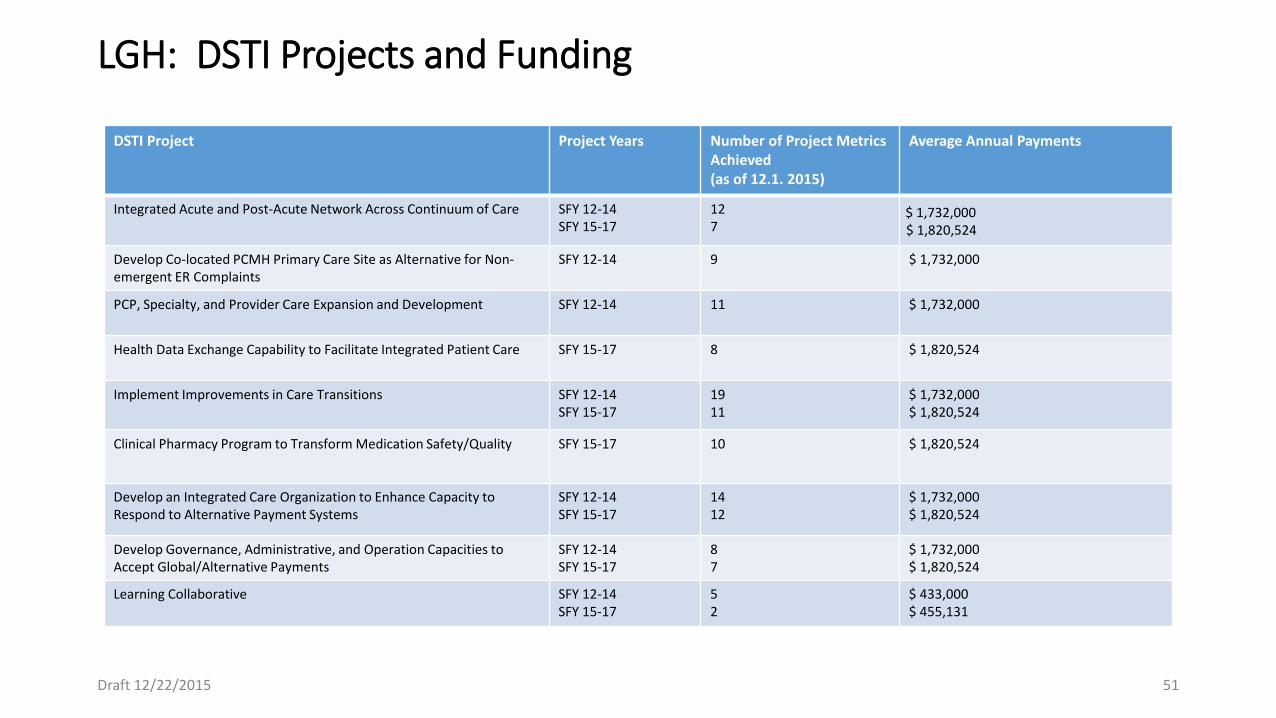
LGH: DSTI Projects and Funding
DSTI Project Project Years Number of Project Metrics Achieved (as of 12.1. 2015)
Average Annual Payments
Integrated Acute and Post-Acute Network Across Continuum of Care SFY 12-14 SFY 15-17
12 7
$ 1,732,000 $ 1,820,524
Develop Co-located PCMH Primary Care Site as Alternative for Non-emergent ER Complaints
SFY 12-14
9 $ 1,732,000
PCP, Specialty, and Provider Care Expansion and Development SFY 12-14
11 $ 1,732,000
Health Data Exchange Capability to Facilitate Integrated Patient Care SFY 15-17 8 $ 1,820,524
Implement Improvements in Care Transitions SFY 12-14 SFY 15-17
19 11
$ 1,732,000 $ 1,820,524
Clinical Pharmacy Program to Transform Medication Safety/Quality SFY 15-17 10 $ 1,820,524
Develop an Integrated Care Organization to Enhance Capacity to Respond to Alternative Payment Systems
SFY 12-14 SFY 15-17
14 12
$ 1,732,000 $ 1,820,524
Develop Governance, Administrative, and Operation Capacities to Accept Global/Alternative Payments
SFY 12-14 SFY 15-17
8 7
$ 1,732,000 $ 1,820,524
Learning Collaborative SFY 12-14 SFY 15-17
5 2
$ 433,000 $ 455,131
Draft 12/22/2015 51
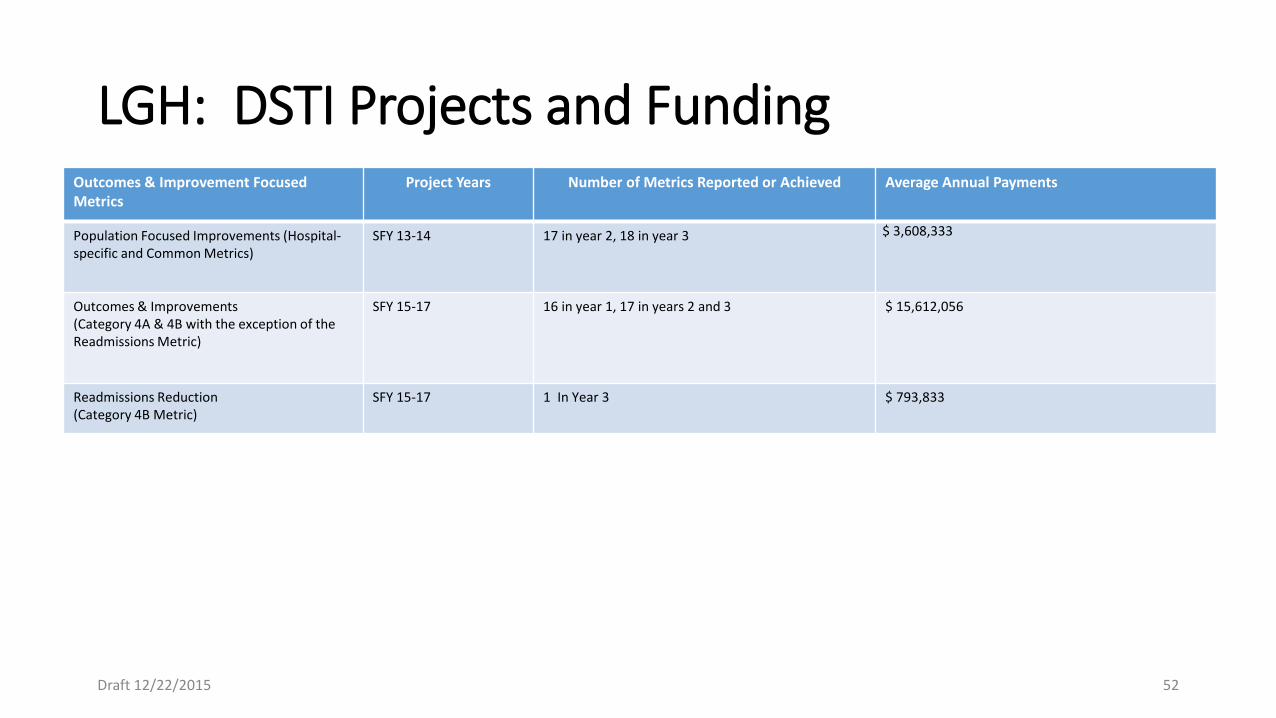
LGH: DSTI Projects and Funding Outcomes & Improvement Focused Metrics
Project Years Number of Metrics Reported or Achieved Average Annual Payments
Population Focused Improvements (Hospital-specific and Common Metrics)
SFY 13-14 17 in year 2, 18 in year 3 $ 3,608,333
Outcomes & Improvements (Category 4A & 4B with the exception of the Readmissions Metric)
SFY 15-17 16 in year 1, 17 in years 2 and 3 $ 15,612,056
Readmissions Reduction (Category 4B Metric)
SFY 15-17
1 In Year 3 $ 793,833
Draft 12/22/2015 52

Mercy Medical Center : Organizational Vision and DSTI
Enhance primary care capacity and access
Integrate physical and behavioral health in Mercy Medical Center ED
Transform acute care hospital care management and care coordination by reconfiguring “silos” of departments into care coordination “hubs”
Create patient-centered care transitions for patients at the highest risk of readmissions
Develop capacities to accept global payments
Integrate BH and physical health for pts. with serious mental illness
Transform care at behavioral health hospital by applying “hub” model that reconfigures “silos”
Develop alternate care delivery for “high utilizer” ED patients seeking non-emergent care.
Create ACO and Clinically-Integrated, Network with physician groups and hospitals
Integrate behavioral health and physical health for dual-eligible, complex patient population in PACE program
DSTI: SFYs 2012 – 2014
DSTI: SFYs 2015 – 2017 DSTI
Outcome:
Shift to Accountable
Care
Organizational Transformation Transformed hospital- wide care management and care coordination with Care Logistics™
Integrated BH and physical health in ED psychiatric hospital and PACE program
Expanded primary care capacity and access on hospital campus
Strengthened Partnerships with community-based BH organizations
Created patient-centered care transitions for patients at the highest risk of readmission
Established new ACO, Clinically-Integrated Network and PACE program
61 Draft 12/22/2015
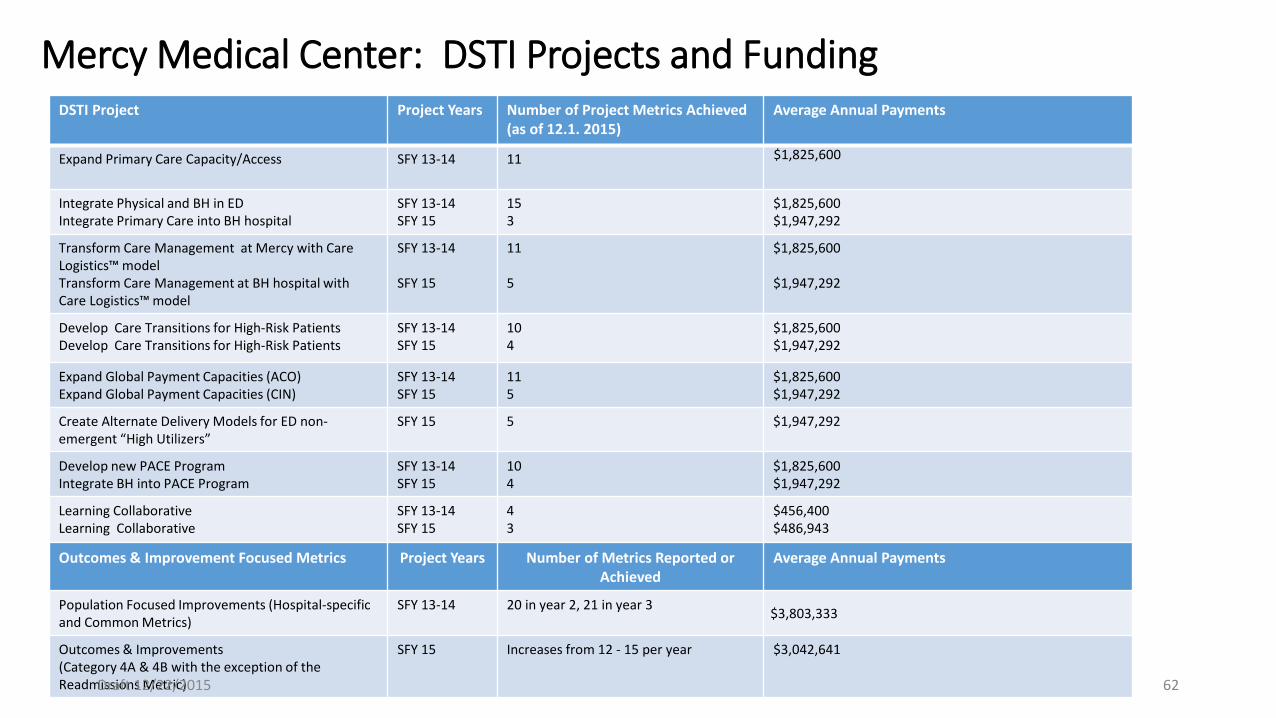
Mercy Medical Center: DSTI Projects and Funding DSTI Project Project Years Number of Project Metrics Achieved
(as of 12.1. 2015) Average Annual Payments
Expand Primary Care Capacity/Access SFY 13-14 11 $1,825,600
Integrate Physical and BH in ED Integrate Primary Care into BH hospital
SFY 13-14 SFY 15
15 3
$1,825,600 $1,947,292
Transform Care Management at Mercy with Care Logistics™ model Transform Care Management at BH hospital with Care Logistics™ model
SFY 13-14 SFY 15
11 5
$1,825,600 $1,947,292
Develop Care Transitions for High-Risk Patients Develop Care Transitions for High-Risk Patients
SFY 13-14 SFY 15
10 4
$1,825,600 $1,947,292
Expand Global Payment Capacities (ACO) Expand Global Payment Capacities (CIN)
SFY 13-14 SFY 15
11 5
$1,825,600 $1,947,292
Create Alternate Delivery Models for ED non-emergent “High Utilizers”
SFY 15 5 $1,947,292
Develop new PACE Program Integrate BH into PACE Program
SFY 13-14 SFY 15
10 4
$1,825,600 $1,947,292
Learning Collaborative Learning Collaborative
SFY 13-14 SFY 15
4 3
$456,400 $486,943
Outcomes & Improvement Focused Metrics Project Years Number of Metrics Reported or Achieved
Average Annual Payments
Population Focused Improvements (Hospital-specific and Common Metrics)
SFY 13-14 20 in year 2, 21 in year 3 $3,803,333
Outcomes & Improvements (Category 4A & 4B with the exception of the Readmissions Metric)
SFY 15 Increases from 12 - 15 per year $3,042,641
62 Draft 12/22/2015
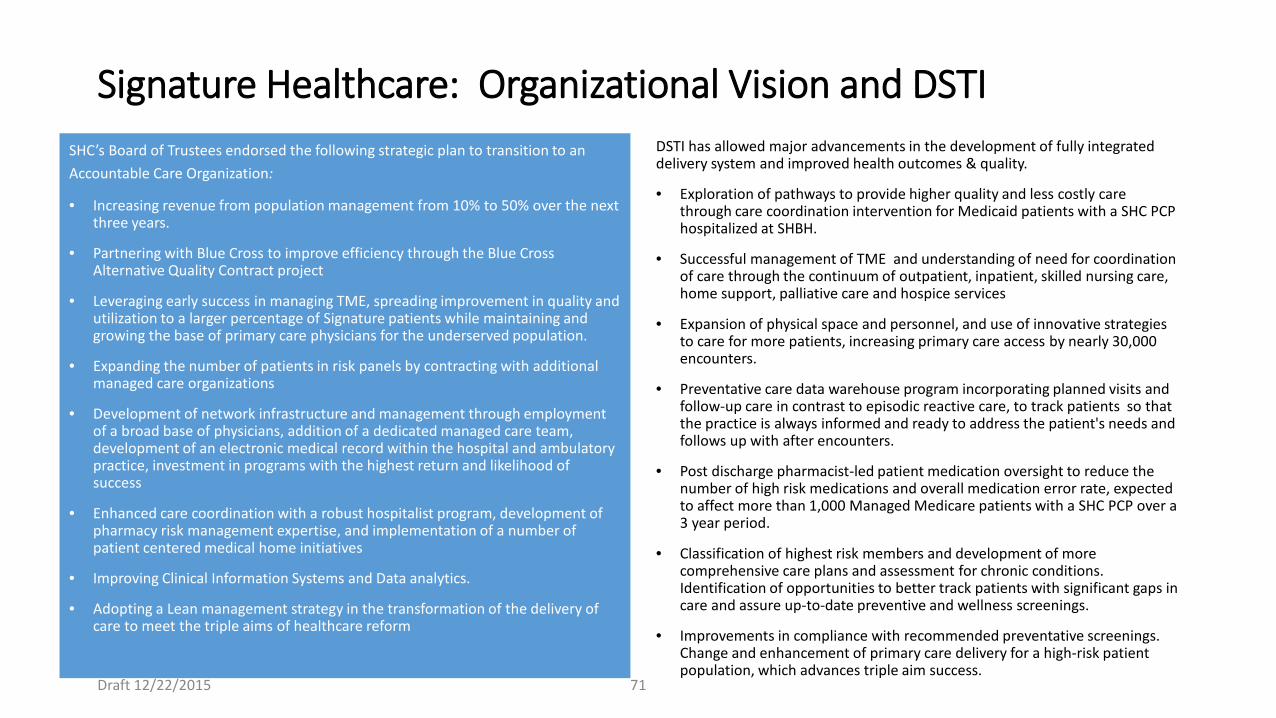
Signature Healthcare: Organizational Vision and DSTI SHC’s Board of Trustees endorsed the following strategic plan to transition to an Accountable Care Organization:
• Increasing revenue from population management from 10% to 50% over the next three years.
• Partnering with Blue Cross to improve efficiency through the Blue Cross Alternative Quality Contract project
• Leveraging early success in managing TME, spreading improvement in quality and utilization to a larger percentage of Signature patients while maintaining and growing the base of primary care physicians for the underserved population.
• Expanding the number of patients in risk panels by contracting with additional managed care organizations
• Development of network infrastructure and management through employment of a broad base of physicians, addition of a dedicated managed care team, development of an electronic medical record within the hospital and ambulatory practice, investment in programs with the highest return and likelihood of success
• Enhanced care coordination with a robust hospitalist program, development of pharmacy risk management expertise, and implementation of a number of patient centered medical home initiatives
• Improving Clinical Information Systems and Data analytics.
• Adopting a Lean management strategy in the transformation of the delivery of care to meet the triple aims of healthcare reform
DSTI has allowed major advancements in the development of fully integrated delivery system and improved health outcomes & quality.
• Exploration of pathways to provide higher quality and less costly care through care coordination intervention for Medicaid patients with a SHC PCP hospitalized at SHBH.
• Successful management of TME and understanding of need for coordination of care through the continuum of outpatient, inpatient, skilled nursing care, home support, palliative care and hospice services
• Expansion of physical space and personnel, and use of innovative strategies to care for more patients, increasing primary care access by nearly 30,000 encounters.
• Preventative care data warehouse program incorporating planned visits and follow-up care in contrast to episodic reactive care, to track patients so that the practice is always informed and ready to address the patient's needs and follows up with after encounters.
• Post discharge pharmacist-led patient medication oversight to reduce the number of high risk medications and overall medication error rate, expected to affect more than 1,000 Managed Medicare patients with a SHC PCP over a 3 year period.
• Classification of highest risk members and development of more comprehensive care plans and assessment for chronic conditions. Identification of opportunities to better track patients with significant gaps in care and assure up-to-date preventive and wellness screenings.
• Improvements in compliance with recommended preventative screenings. Change and enhancement of primary care delivery for a high-risk patient population, which advances triple aim success.
71
Draft 12/22/2015
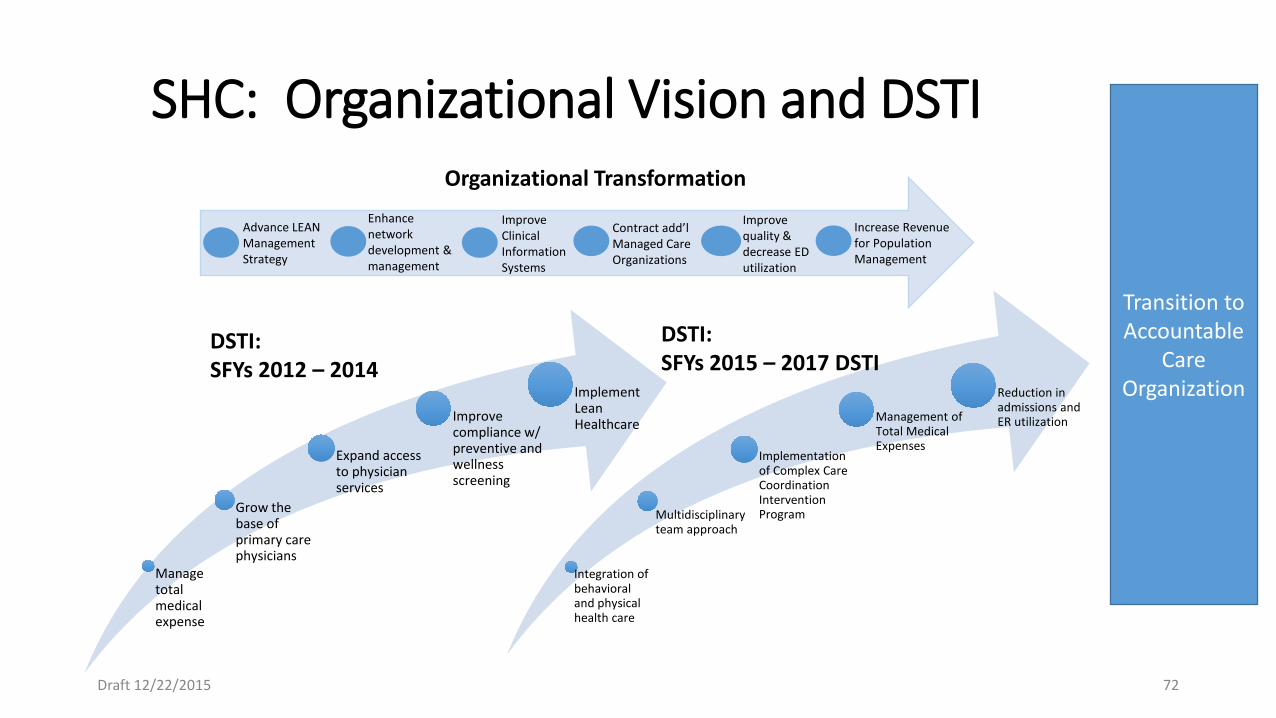
SHC: Organizational Vision and DSTI
Manage total medical expense
Grow the base of primary care physicians
Expand access to physician services
Improve compliance w/ preventive and wellness screening
Implement Lean Healthcare
Integration of behavioral and physical health care
Multidisciplinary team approach
Implementation of Complex Care Coordination Intervention Program
Management of Total Medical Expenses
Reduction in admissions and ER utilization
DSTI: SFYs 2012 – 2014
DSTI: SFYs 2015 – 2017 DSTI
Transition to Accountable
Care Organization
Organizational Transformation
Increase Revenue for Population Management
Improve quality & decrease ED utilization
Improve Clinical Information Systems
Enhance network development & management
Contract add’l Managed Care Organizations
Advance LEAN Management Strategy
Draft 12/22/2015 72
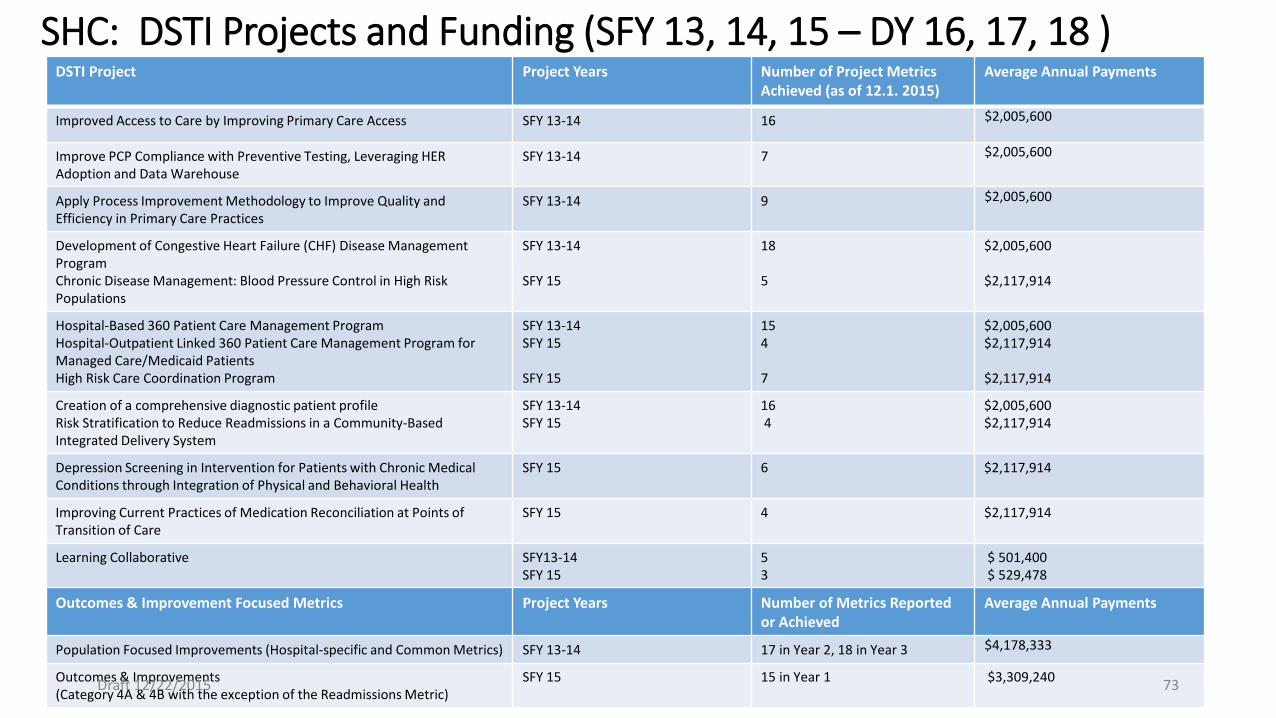
SHC: DSTI Projects and Funding (SFY 13, 14, 15 – DY 16, 17, 18 ) DSTI Project Project Years Number of Project Metrics
Achieved (as of 12.1. 2015) Average Annual Payments
Improved Access to Care by Improving Primary Care Access SFY 13-14 16 $2,005,600
Improve PCP Compliance with Preventive Testing, Leveraging HER Adoption and Data Warehouse
SFY 13-14 7 $2,005,600
Apply Process Improvement Methodology to Improve Quality and Efficiency in Primary Care Practices
SFY 13-14 9 $2,005,600
Development of Congestive Heart Failure (CHF) Disease Management Program Chronic Disease Management: Blood Pressure Control in High Risk Populations
SFY 13-14 SFY 15
18 5
$2,005,600 $2,117,914
Hospital-Based 360 Patient Care Management Program Hospital-Outpatient Linked 360 Patient Care Management Program for Managed Care/Medicaid Patients High Risk Care Coordination Program
SFY 13-14 SFY 15 SFY 15
15 4 7
$2,005,600 $2,117,914 $2,117,914
Creation of a comprehensive diagnostic patient profile Risk Stratification to Reduce Readmissions in a Community-Based Integrated Delivery System
SFY 13-14 SFY 15
16 4
$2,005,600 $2,117,914
Depression Screening in Intervention for Patients with Chronic Medical Conditions through Integration of Physical and Behavioral Health
SFY 15
6 $2,117,914
Improving Current Practices of Medication Reconciliation at Points of Transition of Care
SFY 15
4 $2,117,914
Learning Collaborative SFY13-14 SFY 15
5 3
$ 501,400 $ 529,478
Outcomes & Improvement Focused Metrics Project Years Number of Metrics Reported or Achieved
Average Annual Payments
Population Focused Improvements (Hospital-specific and Common Metrics) SFY 13-14 17 in Year 2, 18 in Year 3 $4,178,333
Outcomes & Improvements (Category 4A & 4B with the exception of the Readmissions Metric)
SFY 15 15 in Year 1 $3,309,240 Draft 12/22/2015 73
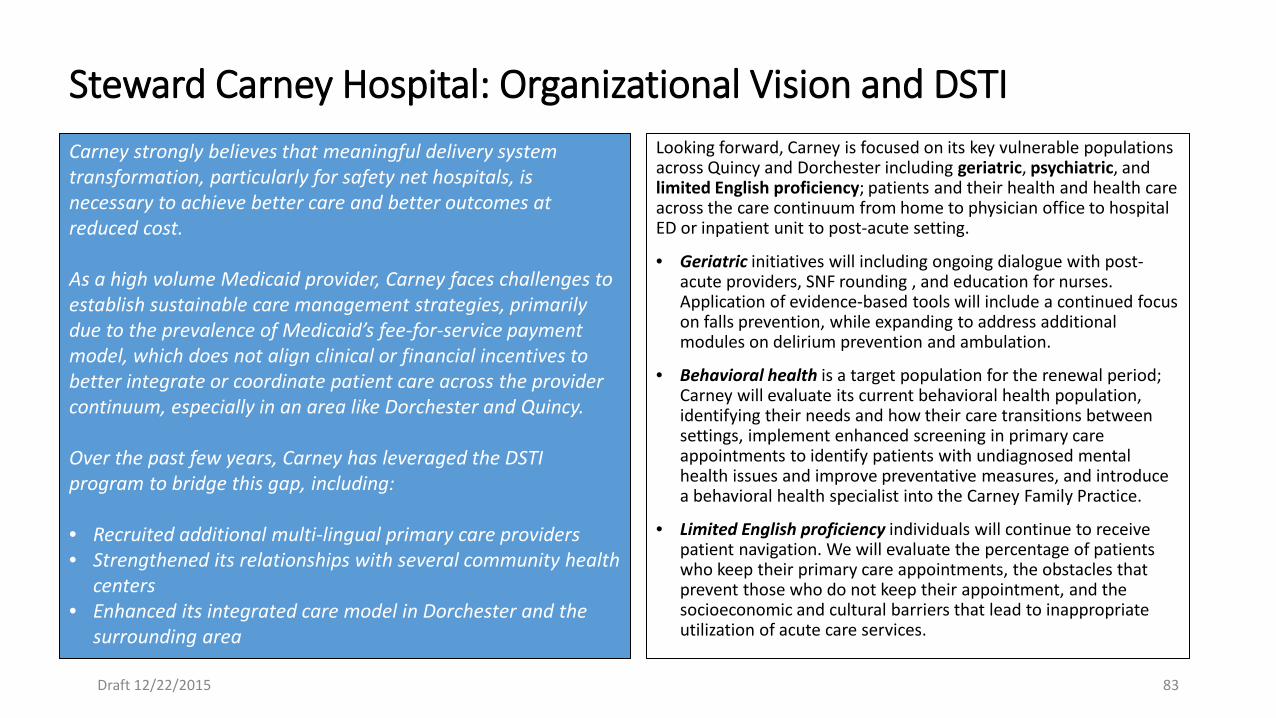
Steward Carney Hospital: Organizational Vision and DSTI Carney strongly believes that meaningful delivery system transformation, particularly for safety net hospitals, is necessary to achieve better care and better outcomes at reduced cost. As a high volume Medicaid provider, Carney faces challenges to establish sustainable care management strategies, primarily due to the prevalence of Medicaid’s fee-for-service payment model, which does not align clinical or financial incentives to better integrate or coordinate patient care across the provider continuum, especially in an area like Dorchester and Quincy. Over the past few years, Carney has leveraged the DSTI program to bridge this gap, including: • Recruited additional multi-lingual primary care providers • Strengthened its relationships with several community health
centers • Enhanced its integrated care model in Dorchester and the
surrounding area
Looking forward, Carney is focused on its key vulnerable populations across Quincy and Dorchester including geriatric, psychiatric, and limited English proficiency; patients and their health and health care across the care continuum from home to physician office to hospital ED or inpatient unit to post-acute setting.
• Geriatric initiatives will including ongoing dialogue with post-acute providers, SNF rounding , and education for nurses. Application of evidence-based tools will include a continued focus on falls prevention, while expanding to address additional modules on delirium prevention and ambulation.
• Behavioral health is a target population for the renewal period; Carney will evaluate its current behavioral health population, identifying their needs and how their care transitions between settings, implement enhanced screening in primary care appointments to identify patients with undiagnosed mental health issues and improve preventative measures, and introduce a behavioral health specialist into the Carney Family Practice.
• Limited English proficiency individuals will continue to receive patient navigation. We will evaluate the percentage of patients who keep their primary care appointments, the obstacles that prevent those who do not keep their appointment, and the socioeconomic and cultural barriers that lead to inappropriate utilization of acute care services.
Draft 12/22/2015 83
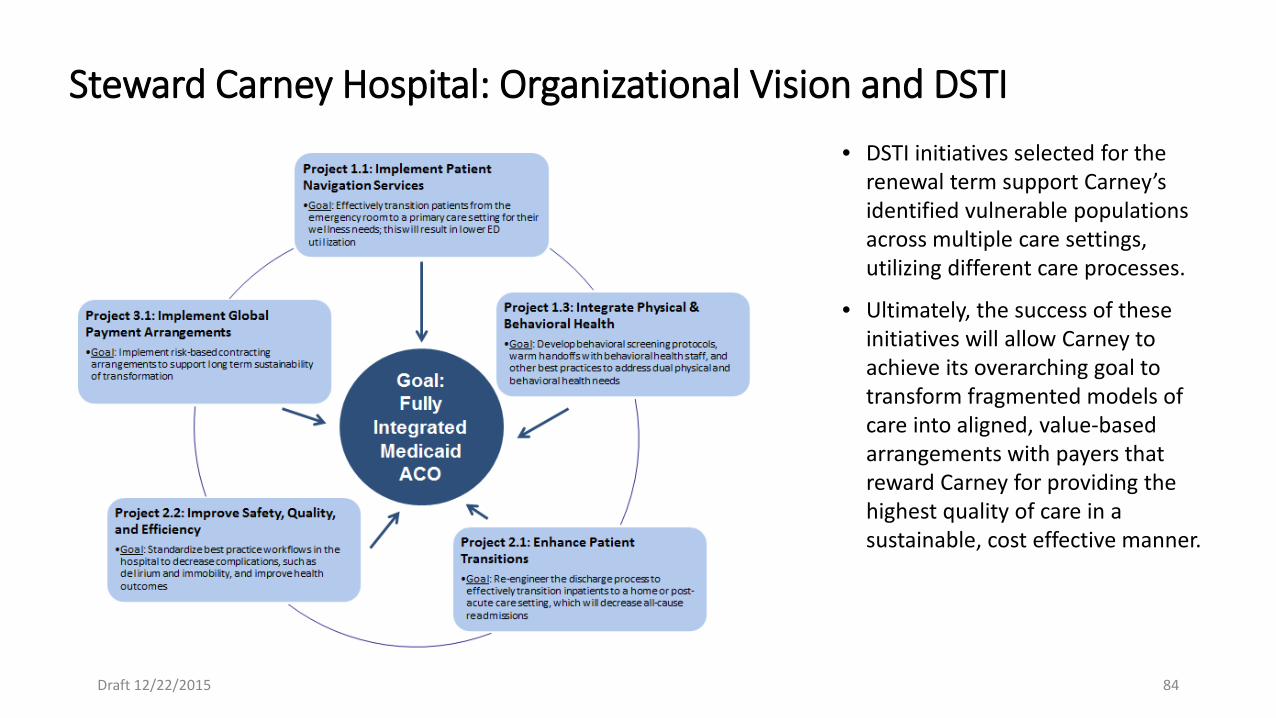
Draft 12/22/2015 84
• DSTI initiatives selected for the renewal term support Carney’s identified vulnerable populations across multiple care settings, utilizing different care processes.
• Ultimately, the success of these initiatives will allow Carney to achieve its overarching goal to transform fragmented models of care into aligned, value-based arrangements with payers that reward Carney for providing the highest quality of care in a sustainable, cost effective manner.
Steward Carney Hospital: Organizational Vision and DSTI
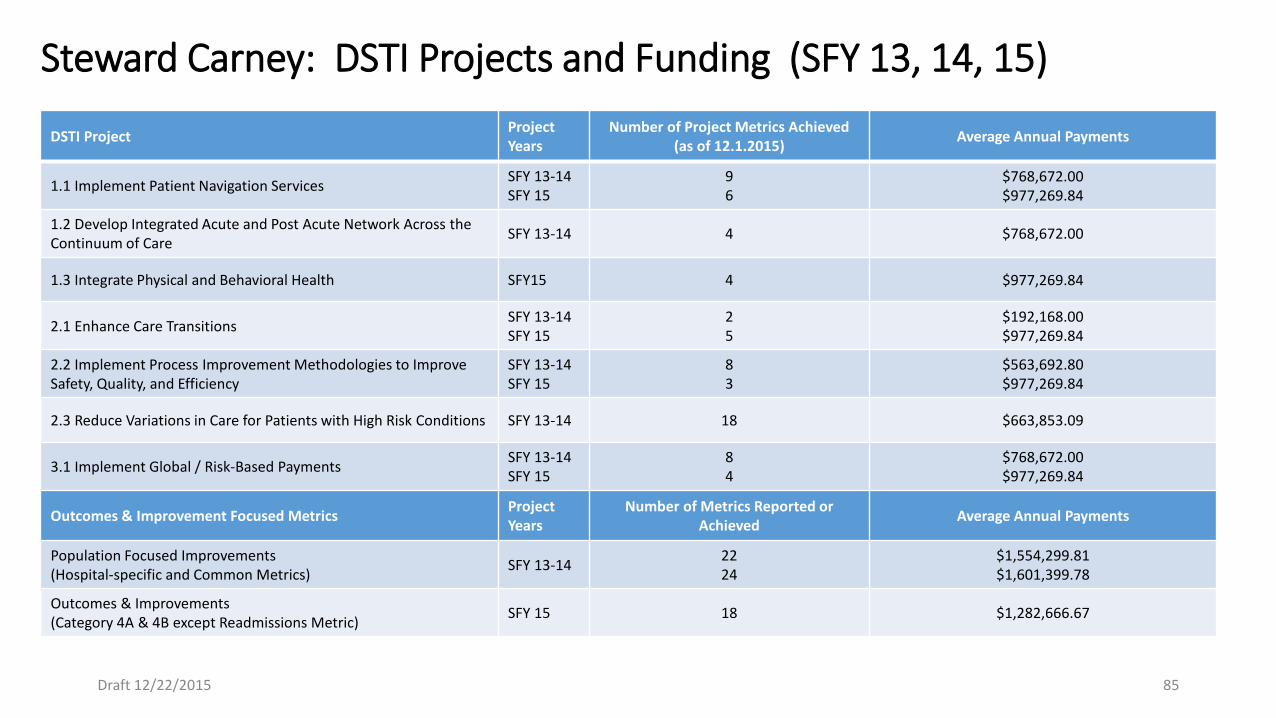
Steward Carney: DSTI Projects and Funding (SFY 13, 14, 15)
DSTI Project Project Years
Number of Project Metrics Achieved (as of 12.1.2015) Average Annual Payments
1.1 Implement Patient Navigation Services SFY 13-14 SFY 15
9 6
$768,672.00 $977,269.84
1.2 Develop Integrated Acute and Post Acute Network Across the Continuum of Care SFY 13-14 4 $768,672.00
1.3 Integrate Physical and Behavioral Health SFY15 4 $977,269.84
2.1 Enhance Care Transitions SFY 13-14 SFY 15
2 5
$192,168.00 $977,269.84
2.2 Implement Process Improvement Methodologies to Improve Safety, Quality, and Efficiency
SFY 13-14 SFY 15
8 3
$563,692.80 $977,269.84
2.3 Reduce Variations in Care for Patients with High Risk Conditions SFY 13-14 18 $663,853.09
3.1 Implement Global / Risk-Based Payments SFY 13-14 SFY 15
8 4
$768,672.00 $977,269.84
Outcomes & Improvement Focused Metrics Project Years
Number of Metrics Reported or Achieved Average Annual Payments
Population Focused Improvements (Hospital-specific and Common Metrics) SFY 13-14 22
24 $1,554,299.81 $1,601,399.78
Outcomes & Improvements (Category 4A & 4B except Readmissions Metric) SFY 15 18 $1,282,666.67
Draft 12/22/2015 85