evaluation of screening devices for identifying learning disabilities in
TRANSCRIPT

THE STATE UNIVERSITY of NEW YORK University Center for Academic and Workforce Development
Evaluation of screening devices for identifying learning disabilities
in low-income Spanish-speaking adults
A report to the State of New York
David A. Abwender State University of New York, Brockport
Department of Psychology
version 5.2 February 2005

i
Contents
I. Acknowledgements ii II. Executive Summary iii III. Introduction 1 IV. Methods 5
• Characteristics of the sample 5 • Procedures 8 • Instruments 10
o Sensory and Cultural Experiences Survey 10 o Selección Inicial 10 o NEUROPSI 10 o Adult Learning Disabilities Screen 11 o Cooper Screening of Information Processing 12 o Test of Nonverbal Intelligence – 3 (TONI-3) 12 o Woodcock-Muñoz Language Survey 12 o Batería Woodcock-Muñoz-Revisada (Batería –R) 13
• Evaluation of Screening Tests: Overview 14
V. Results 18
• Selección Inicial 18 • NEUROPSI 21 • Adult Learning Disabilities Screen 24 • Cooper Screening of Information Processing 28 • Identification of items for a composite screen 31
VI. Qualitative Perspectives on the Project 34
• Spanish language project 34 • English language project 37
VII. Summary, Discussion, Conclusions, and Recommendations 39
• Review of Diagnostic Accuracy of 4 Screening Tests plus Composite 39 • Practical Issues 42 • Recommendations 43
VIII. References 45 IX. Appendices 47

ii
Acknowledgements
Appreciation is expressed to the following for their valuable roles in the initiation, conduct, and completion of this project:
• The Learning Disabilities Association of Western New York, Buffalo, NY • LDA Life and Learning Services, Rochester, NY • The University of Kansas Center for Research on Learning • The New York State Department of Labor • The Research Foundation of the State University of New York • The many community, health, educational, and governmental agencies that provided support
and assistance with referrals, and • The hundreds of Spanish-speaking adults who participated in this project
Sponsoring Agency University Center for Academic and Workforce Development (UCAWD) The SUNY University Center for Academic and Workforce Development provided funding for the completion of this project, which had begun in 2001 as a federally funded, seven-state effort. Appreciating the value of seeing this project through to completion, the NYS Department of Labor was able to coordinate with UCAWD to fund a sub-allocation to the Research Foundation of SUNY, SUNY College at Brockport.

iii
Executive Summary The 2000 San Antonio conference led to the identification of four existing tests that might have value, in whole or in part, as screens for identifying learning disability (LD)1 among Spanish-speaking adults in the U.S. In April, 2000 a work group met in San Antonio, Texas to discuss issues related to Spanish-speaking adults who are at risk for having learning disabilities (LD). The resulting report, Learning disabilities and Spanish-speaking adult populations: The beginning of a process (U.S. Department of Education, 2000), recommended four existing screening instruments for field testing, with the expectation that one or more (in whole or in part) would prove useful as a component of the diagnostic process for identifying LD in Spanish-speaking adults. This report details the results of the field testing, and offers recommendations regarding the diagnostic process based on these findings. A great deal of research and practice focuses on LD among children and adolescents, yet there is little need to offer an extensive rationale for why the issue of LD is important among adults, too. Since the implementation of the Personal Responsibility and Work Opportunity Reconciliation Act, researchers, social policy analysts, and TANF program administrators have focused increased attention on individual obstacles that have proved to be an impediment for many clients who are attempting to make the transition from welfare to work. More recently, the issue of learning disabilities has been highlighted by representatives from the federal government as well as by agencies in a number of states. According to recent data provided by the U.S. Department of Labor, perhaps 50-80% of adults with severe literacy problems possess undetected or untreated learning disabilities. Moreover, it is suspected that the prevalence of LD among TANF recipients may be much higher than among the general population. Accordingly, such covert disabilities are often found to be poorly understood by welfare to work or other vocational/job training policies and programs. There is now a process in place for identifying adults who have learning disabilities, a process sufficiently mature to have resulted in the development and implementation of quick, user-friendly screening devices that can be administered by non-mental health professional (e.g., front-line social service workers). Screening devices are critical in the overall diagnostic process: Because the time and expense of full diagnostic testing is so great, and resources for it so limited, screening is a necessary first step to identify those persons who are most likely to have LD (and thereby identify those persons at whom scarce diagnostic resources should be directed). However, all of these screens are in English. The need for alternate language tests is great, and perhaps nowhere is it greater than among Spanish speakers, by virtue of their rapidly growing numbers in the U.S. population. There is now an extensive all-in-one battery of tests in Spanish (the Batería Woodcock-Muñoz – Revisida) suitable for the diagnosis of conditions such as LD across a broad range of ages. There is not yet, however,
1 In this report the term “learning disability” refers to a heterogeneous groups of disorders manifested by significant impairments in the acquisition and use of reading, writing, speaking, listening, mathematical, or reasoning skills, as defined by the National Joint Committee on Learning Disabilities (NJCLD; 1994). As described further below, a clear distinction is to be made between the specific impairments associated with LD and the more general intellectual impairments associated with conditions such as mental retardation.

iv
a suitable screening test for LD among Spanish-speaking adults, a gaping hole in the overall diagnostic process noted by participants in the San Antonio conference. This, in essence, is the rationale for the present project, as summarized in the San Antonio conference report, Learning disabilities and Spanish-speaking adult populations: The beginning of a process (U.S. Dept. of Education, 2000): to identify a suitable screening test for LD that can serve as a key early component of the overall process of identifying and managing disabilities that interfere with educational and occupational functioning. The Current Project As originally proposed, seven states (Arizona, California, Massachusetts, New Mexico, New York, Texas, and Virginia) would participate in data collection, each contributing ~200 individuals randomly selected from adult education programs, and ~100 individuals known to have LD. Each participant would be administered the four candidate screens along with several other measures (of health status, acculturation, etc.) by “local activity coordinators.” Each participant would also receive a full diagnostic assessment, in Spanish, from local diagnosticians. The data were to be analyzed at the University of Kansas to determine which, if any, of the screens best predicted the results of the diagnostic assessment. As is turned out, the procedures actually employed differed in several respects. First, the target population from which participants were recruited changed from being primarily adult education to low income (e.g., TANF eligible), without regard for any a priori knowledge of diagnoses. Of note, while this approach does not necessarily yield a more representative or a less representative sample of the population of Spanish-speaking adults in the U.S., it does seem to have led to the enrollment of significant numbers of participants with general intellectual limitations, such as mental retardation (MR) or marginal intellectual function (MIF).2 Because either a specific learning disability or a more general intellectual disability is likely to create a significant impediment to finding or keeping a job, it seemed appropriate to evaluate the screens’ ability to identify persons with either or both of these problems. It was also pragmatic, since none of the screens showed any ability to differentially identify (i.e., distinguish between) persons with LD and those with MR/MIF. Individuals with LD and/or MR/MIF are henceforth referred to as having learning needs (LN). Second, because of a lack of Spanish-speaking diagnosticians, local activity coordinators administered (and scored) both the screens and the diagnostic assessments. Non-Spanish-speaking diagnosticians then interpreted the results of the diagnostic assessment, remaining blind to the data derived from the screens, and rendered their diagnostic impressions. Finally, only three states produced any data at all, and only one (New York) made a commitment to see the project through to conclusion. At the end of the project’s federal funding period, the University of Kansas investigators declined to pursue additional data collection, and when New York State’s Department of Labor made the decision to continue data collection in New York, directorship of the project transferred to the State University of New York, College at Brockport.
2 The term “marginal intellectual function” is somewhat informal, and is often considered roughly synonymous with terms like “borderline MR” that refer to situations in which cognitive limitations are present but full diagnostic criteria for MR (e.g., intellectual function in the bottom ~2% compared to age peers; deficits in adaptive function) are not met.

v
The following four tests, identified by participants in the San Antonio conference as being good prospects for a Spanish-language screen for LD, were investigated in this project: 1. Selección Inicial (Spanish translation) The Selección Inicial, from Southwest College in California, is a checklist format, subjective self-report questionnaire that requires “Yes” or “No” responses to 22 items that tap into performance of scholastic-type activities in school (e.g., “Math tests were easy for me.”), home (e.g., “My important paperwork at home is well organized.”), and work (e.g., “It is easy to read and fill out forms for work.”) environments. It is extremely quick (<5 minutes administration time) and simple to administer, and can even be administered in group-testing sessions. Each item endorsement indicative of problematic performance receives a score of 1 point, so the possible total ranges from 0-22, with higher scores indexing greater difficulties. 2. NEUROPSI The NEUROPSI is a brief neuropsychological test battery developed in Spanish with an eye toward use with persons of limited educational background. It assesses, at least in a cursory fashion, all of the major domains of higher cognitive functions, including reading comprehension, writing to dictation, and simple arithmetic. For these reasons it appears initially to be a strong candidate instrument for identification of LD in the target population. Each of the NEUROPSI’s eight subsections consists of multiple items. The scores for the NEUROPSI subsections can be totaled to yield an overall score (range of possible scores is 0-130, with higher scores indicative of more intact function). The NEUROPSI is the only one of the four candidate screens that has been the subject of research reports appearing in peer-reviewed journals. None of the extant research using the NEUROPSI has given any hint of its validity as a tool for identifying the presence of LD, however. 3. Adult Learning Disabilities Screen (Spanish translation) This test is essentially a direct translation of the English-language ALDS. It consists of a series of interview and self-report items. Part 1 requires the examinee to read 25 descriptive statements (e.g., “I am a good speller.”) and respond to each by selecting one response choice on a 5-point scale (e.g., strongly disagree, disagree, undecided, agree, strongly agree). These 25 items form seven subscales (“clusters”). Part 2 contains 19 questions about psychiatric and academic history (e.g., “Do you remember having learning or achievement difficulties?”) that examinees read and answer by selecting Yes or No. Six subscales (“clusters”) are formed from these 19 items, with one item contributing to two subscales. Part 1 scores (derived from examinees’ responses through a sequence of numerical conversions) above a pre-specified cut-off value indicate the possibility of LD; summed Part 2 scores (also derived through a series of numerical conversions) below a different pre-specified cut-off value indicate the possibility of LD. Administration time depends on how quickly the examinee responds to the self-report items, but should be ~15 minutes. This instrument has not been used in any peer-reviewed research appearing in the scientific literature (at least as far as this author was able to determine), and the test manual itself gives no information at all on the properties of the ALDS.

vi
4. Cooper Screening of Information Processing (Spanish translation) The translated version of the Cooper screen (Cooper, 2000) used in this study consists of both self-report items (as in the Selección Inicial and ALDS) and performance items (as in the NEUROPSI). All of the 12 areas explored by this screen are directly relevant to the assessment of LD (unlike, say, the NEUROPSI which is a general measure of cognitive function. The scoring system for the Cooper is quite involved, requiring differential weighting of its 12 subsection scores and a peculiar adjustment to the total score based on responses to a set of general vocabulary items (i.e., measuring participants’ ability to define words). The Cooper has a pre-established cut-off score of 75, with scores above this level indicative of LD. Diagnosis of Learning Needs The diagnoses of interest, LD and MR/MIF, were made by diagnosticians using data from the Test of Nonverbal Intelligence (TONI-3) and Batería Woodcock-Muñoz – Revisida. These are the “gold standard” assessments that often form the basis of a full diagnostic work-up. The TONI-3 uses a multiple choice, matrix completion format to test intelligence. In this format, each test item consists of an array of visual stimuli (e.g., three squares) with one missing, along with several response choices (e.g., circle, square, triangle); the examinee must select the response that correctly completes the matrix (e.g., square, in this example). The test instructions can be pantomimed, and examinees respond by pointing to their answer choices, thus circumventing the need for any use of language at all. The TONI-3 is an adequate measure of intelligence, and although it fails to tap into numerous specific aspects of intelligence, including obviously anything verbal, TONI-3 scores correlate well with scores from broader, omnibus tests of intelligence. The Batería Woodcock-Muñoz-Revisada (Batería –R) is the analogous Spanish-language edition of the Woodcock-Johnson Psychoeducational Battery-Revised (WJ-R). It can be used to determine the presence of discrepancies between cognitive aptitudes or potentials and achievement in academic skills. These discrepancies, if large enough, are suggestive of LD. Ideally, a screening test would provide the identical diagnostic result for each examinee as the full-blown diagnostic work-up would. If the diagnostic decision is dichotomous (disorder present vs. disorder absent), the value of the screen can be summarized in terms of its diagnostic accuracy (also known as hit rate), defined as the percentage of cases in which the screen’s diagnostic prediction matches the actual diagnosis. It is also useful to know the screen’s sensitivity (the percentage of cases with the disorder who are correctly identified by the screen as having the disorder) and its specificity (the percentage of cases without the disorder who are correctly identified by the screen as not having the disorder). A screen with low sensitivity will mis-identify many persons who have the disorder as being free of it (i.e., false negatives), and likewise a screen with low specificity will mis-identify many persons free of the disorder as having it (i.e., false positives). While these are not the only indices of the usefulness of a screen, they provide crucial information about how well the screen serves as a stand-in for the full diagnostic evaluation. Findings A total of 762 Spanish-speaking adults participated (218 from California, 515 from New York, and 26 from Virginia). All were Hispanic, and most were low income (most were receiving TANF), but beyond that there was a fair degree of variability in demographics (e.g., country of birth, age,

vii
education level). Recruitment of participants often followed a “snowball” sampling approach, in which participants spread the word to other potential participants, resulting in a decidedly non-random (and potentially non-representative) sample of Spanish-speaking adults. This is crucial to bear in mind when evaluating the findings. For example, LD was diagnosed in 11% of the sample (a figure not terribly discrepant from prevalence figures in mainstream U.S. samples), but MR/MIF was evident in ~48% of the sample (a figure vastly higher than prevalence figures from mainstream U.S. samples); because the sampling was non-random it is impossible to know if the MR/MIF figure accurately represents the true rate of MR/MIF among low income Spanish-speaking adults in the U.S.3 None of the four candidate screens identified at the 2000 San Antonio conference stood head-and-shoulders above the rest. A fifth screen was composed by selecting promising items from the four candidate screens (using statistical regression procedures on one half of the data set, randomly selected, and cross-validating it on the other half of the data set). As summarized in the following table, the results were roughly similar for the four screens, with the sample composite screen outperforming all of them by a small margin. It is important to note that the results shown for the four candidate screens were optimized, obtained by making some significant alteration in the scoring procedures. Use of standard scoring procedures would have led to much weaker results. It is also important to bear in mind that the diagnostic criterion being predicted is the presence vs. absence of learning needs (LN), defined as LD and/or intellectual limitation (i.e., MR or MIF). Test Optimal Diagnostic Accuracy Rates Overall Accuracy Sensitivity Specificity Selección Inicial 68% 71% 63% NEUROPSI 75% 77% 73% ALDS 71% 71% 71% Cooper 74% 84% 60% Composite 76% 82% 68% Despite the undeniable advantages associated with its quickness and ease of administration and scoring, the Selección Inicial did not fare especially well in these analyses. Better than two out of every three individuals with LN were correctly identified as such, although almost one out of every three persons with no diagnosis was misidentified as having LN. A sizable percentage of all persons screened might be referred for additional testing unnecessarily, which is significant when considering that the majority of all persons screened will be referred for additional testing. Since the percentage of persons with LN in this population appears to be so high, and the associated expense of full diagnostic testing for them so great, finding a screening test that doesn’t needlessly refer so many non-LN examinees for testing (i.e., one with higher specificity) would appear to be of great practical importance. The NEUROPSI, an important candidate screen because it was developed in Spanish, has previously shown itself to be useful in the identification of brain damage. Both the administration
3 In fact, it would be frankly incorrect to attempt to use the present data to make any inferences about the prevalence of any disorders. This study simply was not designed in such a way as to provide anywhere near a meaningful estimate of how common LD, MR/MIF, mental illness, or any other condition is. This is not to say that the prevalence of these conditions in the present sample of participants fails to reflect the true (i.e., population) prevalences, and in fact the rates at which these disorders appeared in the present study may track the population rates quite closely.

viii
and the scoring of the test items are considerably more difficult, time-consuming (e.g., at least a 25-30 minute administration time for a competent examiner, with as much time also needed for scoring), and demanding of training/practice than is the Selección Inicial. It is probably not the best stand-alone screening test for identifying persons in the target population who have learning needs. Use of the entire NEUROPSI, while affording notably better prediction than the Selección Inicial, is difficult to recommend at a practical level because of the administration and scoring time (easily up to 60’ for each examination), as well as the need for fairly extensive training and practice in test administration which likely would need to be overseen by a professional psychologist. Additionally, the need to provide and maintain large quantities of physical testing materials (e.g., spiral bound cardstock test stimuli, which are reusable but subject to damage, wear, and misplacement) presents another impediment to recommendation of the NEUROPSI. Still, results of the analyses seem to confirm the idea that some, but not all, of the NEUROPSI items do an adequate job of discriminating between participants with LN and those without LN, and its development in Spanish (as opposed to translation) gives it a significant advantage over its competitors. The ALDS is second in user-friendliness to the Selección Inicial. It does, however, have a much more complicated scoring system that could easily lead to mistakes in the hands of under-trained or careless administrators. On the other hand it is even more likely that administration and or scoring problems would appear with either the NEUROPSI or the Cooper. One of the most noteworthy problems with the Spanish version of the ALDS is its very low sensitivity when using the original scoring procedures. Clearly these procedures need to be adjusted for the population under present study, but even then it was not possible to obtain diagnostic accuracy rates much above 70%. The established scoring system for the ALDS does weight certain groups of items differentially, but those weights are evidently not optimal in the current target population. An additional problem for the Spanish ALDS is the irrelevance of several items to Spanish-speakers in the U.S. For example, several items on the Self-Rating Scales (Part 1) ask about ease of reading medicine labels and household bills; given that these are presented almost exclusively in English in the U.S., a Spanish speaker with limited English skills answering the items honestly would respond in a way that makes him/her appear learning disabled. The ALDS still has a great deal of promise. If some of the remaining issues of item translation and content are addressed, and a new scoring system is developed, the ALDS may be a suitable Spanish language screen. The Cooper is, along with the NEUROPSI, the screen that requires the most training and practice in administration before users can competently put it to use. Moreover, its general structure and format is somewhat confusing and invites myriad recording and scoring errors, increasing the need for intensive training and ongoing supervision of examiners. Present data suggest that as a standalone test, using Cooper’s standard scoring procedures, it fails badly as an indicator of either LD or LN in the target population. Like the NEUROPSI, however, several of its items appear promising as discriminators between persons with LN and persons without LN. Indeed, when the items were allowed to be scored using alternate scoring systems, the test appeared extremely promising. However, in spite of the Cooper items’ potential for accurate identification of persons with LN, many of these items must be scored by examiners, a time-consuming process that probably cannot be done by front-line social service personnel with the necessary level of accuracy, unless they have extensive training and practice in administering this screen. For example, the Cooper requires examinees to rhyme certain words, and different examiners subjectively evaluating responses may come to different conclusions about whether or not examinees have difficulty rhyming. Similar inter-examiner problems may crop up when evaluating the quality of examinees’ writing.

ix
Each of the four candidate screens thus has strengths and weaknesses, and none provides the level of diagnostic accuracy expected in a test to be used in making real-life decisions about individuals. For this reason, it was clearly advisable to use the data collected for this project to explore the creation of a fifth screen, a composite test made up of items selected on the basis of their diagnostic utility from among the four candidate tests, each of which appeared to have at least some items or subscales that did a good job in discriminating between persons with learning needs and those without. Selection of items for the composite was based on both rational and empirical criteria, with the following desiderata: 1. the composite should be brief, in the interests of efficiency of administration 2. the composite should be user-friendly, in the interests of standardization of administration 3. the composite should not require any physical testing materials beyond the paper and pencil
questionnaire form, in the interests of containing costs associated with production of, and training in use of, said materials
4. the composite should provide better diagnostic accuracy than any of the four candidate screens
To minimize the potential for administration or clerical/scoring errors, therefore, no items were considered if they required the use of additional materials (e.g., as test stimuli) or required any coding, quantification, or evaluation of participant responses by the examiner. The pool of potential test items consisted of those that used a simple “true/false” or “yes/no” closed-ended dichotomous response format. The advantage of restricting the item pool in this way is that the resulting screen can be easily administered and scored by minimally trained personnel with no background in psychological assessment. The disadvantage is that such restriction likely will mean that certain diagnostically useful items are not considered, leaving the screen less accurate than it might ultimately have been. This tradeoff is considered necessary, though, because of the enormous time and cost commitment inherent in training social service personnel in the proper use of a more complicated device. To create this “fifth” screen, a statistical analysis (logistic regression) was performed using all individual test items from the four candidate screens. The analysis began with a blank slate – no items – and was set up to allow the screen to be built item-by-item until no further improvements in diagnostic accuracy could be achieved by adding more items. The 11 items comprising this “fifth” screen are all phrased in a “yes”/“no” format. Each response to each question has a certain point value associated with it. The examinees responses are summed, a constant value is subtracted from the sum, and the resultant score is compared to a cut-off score of 50. Scores above 50 are considered to reflect the presence of learning needs. All in all, considering the limitations imposed on the content of the composite, this set of items would appear to provide a user-friendly, cost-effective tool whose properties are at least as good as those of any of the four candidate screens (even allowing for optimal modifications to those screens). However, the creation of a composite screen such as this must be seen as the beginning, not the end, of the test’s development process. Moreover, there are other issues pertinent to the creation of a test via these methods that need to be addressed. One of these issues revolves around the fact that during the study, the items that make up the composite were administered in the context of many other items requiring self-disclosure of personal, health, and educational history, whereas those same items used in the real world in isolation as a composite screen lack the benefit of that same context.

x
By being removed from the larger context, the items comprising the screen may not be answered out in the real world with the same degree of candor, limiting the screen’s effectiveness. To address these concerns, a smaller, second wave of data collection was conducted in the Buffalo area. Seventy eight additional participants, demographically similar to the larger, initial sample, were administered the composite “Empire State Screen” as a standalone test (rather than having items responses extracted from the four existing screens) and underwent the same full battery diagnostic workup (i.e., TONI-3, Batería-R) as was performed in the main study. Among these participants, the Empire State Screen exhibited 83% overall diagnostic accuracy (83% sensitivity, 84% sensitivity), a level of performance encouragingly higher than that obtained in its initial construction phase. These results offer an tantalizing glimpse of the Empire State Screen’s usefulness, particularly because, although the full diagnostic workup was conducted as per the main study, the screen itself was administered by real-world users (i.e., front line social service personnel). A second issue pertains to the possibility that the characteristics of the participant sample used in this project differ from the characteristics of the overall target population (i.e., low-income Spanish speaking adults). Specifically, should the true prevalence of LN (especially in the form of MR/MIF) be considerably lower in the population than in this study’s sample, the real-world applicability of this project’s findings may be limited. The key question, then, revolves around the extent to which the high rate of MR/MIF in our sample reflects a veridical characteristic of the target population. Qualitative Perspectives Looking more qualitatively at the results gleaned from the project provides additional insight on two important issues: First, there is no doubt a significant gap in services aimed at integrating Spanish-speaking adults into appropriate vocational/rehabilitative programming. There were many instances where Spanish-speaking adults were immediately referred to ESL programs where they became increasingly frustrated at their lack of progress in mastering even basic English. Likewise, others were referred to various work activities that did not provide any support or assistance in helping them transition to the workplace. In later discussions with local DSS employment counselors and supervisors, a concern emerged relative to assessing Spanish-speaking adults for appropriate work-readiness activities. Specifically, employment interviews are too often facilitated by an accompanying family member who serves as a translator for the client. As such, the employment counselor is unable to fully engage with the client and render an appropriate assessment of the individual’s strengths and challenges in developing a comprehensive employment plan. All too often, adults are placed in a variety of settings that are not appropriate to their abilities. As a result, they shuffle from activity to activity with little to no success; many end up with a variety of sanctions resulting in even more instability and strife that serve as further impediments to employment. The other issue arising from project findings also involves provision of ongoing services that address other obstacles to employment. The data from Erie County alone reveal that at least 25% reported a secondary diagnosis of mental health problems such as depression and other mood disorders. In addition, clinical interviews with participants placed emphasis on other barriers to employment such as chronic health issues, traumatic events such as sexual/physical abuse in addition to instability within the family. In point of fact, many of the women participating in the study revealed that they were overwhelmed by personal issues such as domestic violence, behaviorally-challenged children and severely fragmented family systems. Many were clinically depressed and, therefore, unable to mobilize themselves toward independence from public assistance programs. The prognosis for success in any type of vocational/educational placement is

xi
questionable at best for many of these adults. Accordingly, Spanish-speaking adults identified as learning disabled who received case management services were able to identify individual barriers to employment. They were then able to work through such obstacles by way of a goal-directed service plan initiated by a Service Navigator, who provided case intensive services that highlight individual strengths and potential. Toward this end, project findings for this population are consistent with studies conducted with the general LD population: Intensive case management services consistently promote the individual to reach toward positive outcomes. That is, those individuals who made use of services placed at their fingertips were more likely to participate in job-readiness activities that resulted in meaningful employment. Originally, the project embraced a short-term case management model. Yet clearly and without surprise, those individuals who were followed closely by staff and received extended services achieved optimal results. The Spanish Language Project provides us with valuable insight into what service needs are not being met within the Latino community, the largest single growing minority community in the United States. Outside the metropolitan New York City area, there is a paucity of bilingual social service caseworkers not to mention other human service caseworkers and counselors. To provide quality and effective services, such services should begin “where the client is at,” right down to dominant language spoken. In conclusion, knowledge of the target community being served is essential. Bilingual/bicultural staff are the thoroughfare for effective outreach, rapport, and linkage. With this, individuals are more likely to be receptive to work opportunities and other services. Conclusions There are clearly myriad individual and systemic impediments to successful integration of many members of the target population into the workplace. This study addressed one of the key, but heretofore under-examined, impediments: the presence of unidentified conditions (e.g., LD) that hinder academic and occupational functioning. The screening tests under investigation could not differentially diagnose LD and MR/MIF, which appears to be a common weakness among them, yet the elevated prevalence of MR/MIF in the present sample(s) suggests that screening for the latter condition may be just as worthwhile as screening for LD -- and may even be a necessary endeavor in the population. In light of this, the ability of the newly created Empire State Screen to identify these conditions (collectively referred to as learning needs) more accurately than any of the four original candidate screens offers reason for continuing to pursue its use as one of the components of the larger process of identifying, remediating, and/or managing barriers to achieving goals such as educational attainment and obtaining and maintaining gainful employment. Recommendations • Further research to clarify the true prevalence rates of LD and especially MR/MIF in the target
population • Additional investigation of the Empire State Screen usefulness in real-world contexts • Development of training procedures for end-users of the screen, as well as policies regarding
voluntary versus mandated examination, diagnosis, and follow-up services • Identification of sources of funding and provision for diagnosis and follow-up services

1
Introduction In April, 2000 a work group met in San Antonio, Texas to discuss issues related to Spanish-speaking adults who are at risk for having learning disabilities (LD). The resulting report, Learning disabilities and Spanish-speaking adult populations: The beginning of a process (U.S. Department of Education, 2000), recommended four existing screening instruments for field testing, with the expectation that one or more (in whole or in part) would prove useful as a component of the diagnostic process for identifying LD in Spanish-speaking adults. This report details the results of the field testing, and offers recommendations regarding the diagnostic process based on these findings. A great deal of research and practice focuses on LD among children and adolescents, yet there is little need to offer an extensive rationale for why the issue of LD is important among adults, too. Since the implementation of the Personal Responsibility and Work Opportunity Reconciliation Act, researchers, social policy analysts, and TANF program administrators have focused increased attention on individual obstacles that have proved to be an impediment for many clients who are attempting to make the transition from welfare to work. In response, discussion has turned to three common issues that are no doubt often barriers to employment: Issues such as mental health, chronic substance abuse and physical limitations/disabilities are no doubt paramount in the development of program strategies in moving the client from welfare to meaningful employment. Many other disabilities are not as overt as blindness or deafness, but may include disabilities such as addictive disorders, mental illness, learning disabilities, and mental retardation. More recently, the issue of learning disabilities has been highlighted by representatives from the federal government as well as by agencies in a number of states. According to recent data provided by the U.S. Department of Labor, perhaps 50-80% of adults with severe literacy problems possess undetected or untreated learning disabilities. Moreover, it is suspected that the prevalence of LD among TANF recipients may be much higher than among the general population. Accordingly, such covert disabilities are often found to be poorly understood by welfare to work or other vocational/job training policies and programs. Toward this end, the identification of disabling conditions and subsequent referral to service agencies have focused for the most part on the most obvious physical disabilities or issues arising from a client request for exemption from work requirements. Pilot project experiences point to the challenges of uncovering “hidden” disabilities that may have been interfering with a client’s participation in welfare to work programs, employment or other human service programs. Suffice it to say, the consequences of not properly identifying and addressing learning disabilities can certainly be felt by every major institution in our country. With respect to adults, businesses are affected because the pool of trained and skilled workers will be diminished. Likewise, the criminal justice system is affected because of the high number of adults in the system who were never properly diagnosed and treated for learning disabilities when they were children. Therefore, it is perhaps incumbent upon policy strategists, researchers, and social service program administrators to address these issues in order to forge ahead with establishing comprehensive programs, training and services. There is now a process in place for identifying adults who have learning disabilities, a process sufficiently mature to have resulted in the development and implementation of quick, user-friendly screening devices that can be administered by non-mental health professional (e.g., front-line social service workers). Screening devices are critical in the overall diagnostic process: Because the time and expense of full diagnostic testing is so great, and resources for it so limited, screening is a

2
necessary first step to identify those persons who are most likely to have LD (and thereby identify those persons at whom scarce diagnostic resources should be directed). However, all of these screens are in English. The need for alternate language tests is great, and perhaps nowhere is it greater than among Spanish speakers, by virtue of their rapidly growing numbers in the U.S. population. The U.S. Census bureau (2004) projections for 2000-2050 population change indicate an estimated 188% increase in the Hispanic population in the U.S. (although this percentage increase is actually lower than the estimated 213% increase in the Asian American population, the larger starting population of Hispanic Americans translates into a nearly threefold greater numerical growth among Hispanic than Asian populations). The increasing number of Spanish-speaking adults in the U.S. has been paralleled, albeit slowly, by increasing development of psychological assessment devices in Spanish. There is now an extensive all-in-one battery of tests in Spanish (the Batería Woodcock-Muñoz – Revisida) suitable for the diagnosis of conditions such as LD across a broad range of ages. There is not yet, however, a suitable screening test for LD among Spanish-speaking adults, a gaping hole in the overall diagnostic process noted by participants in the San Antonio conference. The easiest approach to creating a Spanish language LD screen would be to translate an existing English test. Yet long experience with attempting to make direct, straight-ahead translations of psychological tests from one language into another has shown that this tack is fraught with problems. Even the oft-recommended procedure of translating a test from English into Spanish, and then back-translating into English as a check on the accuracy of the translation, is inadequate (Woodcock & Muñoz-Sandoval, 2001). The primary reason for this is that, even when linguistic factors are taken into account, other sources of bias and distortion (e.g., cultural) are likely to influence – usually in a detrimental way – the performance of a Spanish speaker taking a test designed for English speakers (Horton, Carrington, & Lewis-Jack, 2001). Padilla (2001) points out another subtle yet critical issue related to test standardization: Virtually all contemporary psychological assessments use a “norm-based” scoring system in which an examinee’s score/performance is interpreted by comparing it to appropriate test “norms” (i.e., scores obtained from a representative sample of persons demographically similar to the examinee) to determine if the examinee is above, below, or near average. Padilla’s argument, in essence, is that the best test translation of an English test into Spanish, even if it manages to avoid all cultural unfairness or bias, may be an exercise in futility without suitable norms (e.g., a large set of data collected from Spanish-speakers who are demographically similar to the persons who will be given the test). Clearly then it seems that tests to be used with the growing numbers of Spanish-speaking persons in the U.S. ought to be developed from the outset in Spanish, with normative data collected from Spanish speakers. This approach, in spite of its cogency and obvious advantages, entails far greater time, effort, and expense than merely translating an existing test from English.4 Sadly, the state of the art, circa 2005, remains test translation. Of the seven screens discussed at the San Antonio conference, only one was specifically developed (and had normative data collected) in Spanish. Three of the screens were thought to have significant problems with linguistic translation, and three were criticized for having
4 It is easy to imagine, perhaps cynically, that this situation will change (only) when there is a critical mass of Spanish-speaking potential examinees -- and perhaps more importantly, a critical mass of Spanish speaking clinicians who would purchase and use the tests -- to make this approach profitable to test developers. The limiting factor, if experience in this project is any guide, is the scarcity of Spanish-speaking mental health and educational professionals qualified to use this type of test.

3
item content that did not translate well cross-culturally. Overall, four were thought to have enough promise to warrant further consideration.
• Cooper Screening of Information Processing (Cooper, 2000): The Cooper screen, originally constructed in English, was criticized for serious problems with its translation into Spanish, as well as its excessive length and overemphasis on educational concerns. On the other hand, participants at the conference praised its breadth of coverage of academic skills. The test was considered to be an acceptable candidate screen to the extent that (1) the translation errors were rectified, and (2) the screen was abbreviated by reducing the number of items per section.
• Southwest College Initial Screen (Flores-Charter, 1999): The Initial Screen was seen by
many as being too lengthy, too education-oriented, and more appropriate for persons entering college than for poorly educated and/or low-literacy individuals. On the other hand, this test was judged to have been well constructed in English, and well translated into Spanish. It was considered acceptable as a candidate screen if it could be shortened somewhat and include items relevant to workplace issues.
• NEUROPSI (Ostrosky-Solís, Ardila, & Rosselli, 1997, 1999): This brief neuropsychological
test battery was viewed positively in light of its development in Spanish (it is the only one of the seven tests under consideration that did not require translation from English). However, many saw it as inappropriate for use in LD screening, although some remarked on its value in the overall diagnostic process.5 Moreover, it was criticized for being too lengthy, and for the evidently high degree of training necessary to properly administer and score the test. The author of the NEUROPSI, one of the conference participants, countered that the test took no more than one hour to learn and no more than 15 minutes to administer, that it was non-language based, and that it could be administered by semi-literate persons to non-literate persons. Persuaded by this appeal from the test’s creator, the conference participants agreed to include the NEUROPSI as one of the candidate screens.
• Adult Learning Disability Screen (Mellard, 2000): The ALDS (AKA the Kansas screen)
was viewed cautiously because of translation problems, culturally inappropriate (or just culturally irrelevant) questions, its length, and scoring difficulty.6 These problems were thought to be reparable, and the test itself to be generally solid, so the ALDS was added to the list of candidates pending the necessary alterations in items content and translation.
A study, headquartered at the University of Kansas Center for Research on Learning and funded in part by the U.S. Department of Education Office of Vocational and Adult Education (OVAE),
5 The value of formal neuropsychological testing in the LD diagnostic process is probably situation-dependent (e.g., in cases in which the effects of known or suspected brain damage might need to be differentiated from an apparent learning disability), and an open question involves the extent to which some of the usual tests for LD diagnosis (e.g., the Woodcock-Johnson III Tests of Cognitive Function, or the Batería Woodcock-Muñoz – Revisida – Pruebas de habilidad cognitiva) provide adequate assessment of neuropsychological functioning. We are presently using data from the current project to answer this question by directly comparing scores on NEUROPSI items against scores on Batería Woodcock-Muñoz – Revisida subtest scores. 6 Curiously, the San Antonio report notes some participants’ concern with the difficulties of the ALDS scoring system, but apparently no one commented on either the involved scoring system of the NEUROPSI or the tortuous system employed by the Cooper screen.

4
Office of Special Education (OSEP), and the U.S. Department of Health and Human Services (Award # H324M980109) was initiated to examine the utility of these four assessment devices as screens for LD among Spanish-speaking adults. As originally proposed, seven states (Arizona, California, Massachusetts, New Mexico, New York, Texas, and Virginia) would participate in data collection, each contributing ~200 individuals randomly selected from adult education programs and ~100 individuals known to have LD. Each participant would be administered the four candidate screens along with several other measures (of health status, acculturation, etc.) by “local activity coordinators.” Each participant would also receive a full diagnostic assessment, in Spanish, from local diagnosticians. The data were to be analyzed at the University of Kansas to determine which, if any, of the screens best predicted the results of the diagnostic assessment. As is turned out, the procedures actually employed differed in several respects. First, the target population from which participants were recruited changed from being primarily adult education to low income (e.g., TANF eligible), without regard for any a priori knowledge of diagnoses. Of note, while this approach does not necessarily yield a more representative or a less representative sample of the population of Spanish-speaking adults in the U.S., it does seem to have led to the enrollment of significant numbers of participants with general intellectual limitations, such as mental retardation (MR) or marginal intellectual function (MIF). Because either a specific learning disability or a more general intellectual disability is likely to create a significant impediment to finding or keeping a job, it seemed appropriate (and pragmatic) to evaluate the screens’ ability to identify persons with either or both of these problems. These individuals are henceforth referred to as having learning needs (LN). Second, because of a lack of Spanish-speaking diagnosticians, local activity coordinators administered (and scored) both the screens and the diagnostic assessments. Non-Spanish-speaking diagnosticians then interpreted the results of the diagnostic assessment, remaining blind to the data derived from the screens, and rendered their diagnostic impressions.7 Finally, only three states produced any data at all, and only one (New York) made a commitment to see the project through to conclusion. At the end of the project’s federal funding period, the University of Kansas investigators declined to pursue additional data collection, and when New York State’s Department of Labor made the decision to continue data collection in New York, directorship of the project transferred to the State University of New York, College at Brockport.8
7 This mirrors the common and accepted use of technicians to administer diagnostic tests in many different health fields, with the diagnostic professional providing the interpretation. In psychological testing, when a test is available in both English and a language not spoken by the diagnostician, it is considered far preferable to train a technician to administer the test proficiently in the non-English language than to have the diagnostician attempt to administer the English version with the technician providing ad hoc translation into the examinee’s language. 8 A report by Mellard, Edwards, Giertz, and Tata (2004) carefully details the project and its results based on the first 388 participants, prior to the project being taken up by the State of New York. Readers of the Mellard et al. report should be aware that the participant sample described therein is therefore a subset of the larger sample used in this report.

5
Methods I. Characteristics of the Sample As of this writing, a total of 762 cases were available for analysis, including 218 from California, 515 from New York, and 26 from Virginia. Males comprised 21% of the sample, females the remaining 79%. This gender discrepancy appeared across all three states (CA: 82% female; NY: 79% female; VA 69% female). The mean (SD) age of the participants was 35.6 (±10.5) years, differing slightly by state (CA: 38.8 ± 9.5 years; NY: 34.6 ± 11.0 years; VA: 35.6 ± 12.9 years). Educational history was variable, ranging from a reported 0 years of schooling to 21 years. Depending on how this information was solicited, from 2-3% of participants claimed that they had received no formal education at all. Six or fewer years of education were reported by 24-31% of the sample, and 12 or fewer years of education were reported by 77-87% of participants. (The higher percentages come from a self-report item phrased in terms of number of years attending school; the lower values from an items more specifically addressing highest grade completed.) All participants identified their ethnicity as Hispanic, but although all spoke Spanish, some (~30) considered themselves to be stronger speakers of English than Spanish; because such persons could be more appropriately screened using existing devices, and because their often limited abilities in Spanish could negatively affect the data analysis, only those participants who reported Spanish to be their best language were included in the analyses. A breakdown by country of origin is shown below: Country of Birth Percentage of cases in sample Puerto Rico 53.6% Mexico 22.9 United States 7.1 El Salvador 4.5 Cuba 2.9 Dominican Republic 2.6 Guatemala 1.4 Peru 0.9 Colombia 0.6 Honduras 0.6
Nicaragua 0.6 Ecuador 0.6 Panama 0.2 Other or not reported 1.5
Not all cases contained complete and/or usable data. Data from California were the least complete, and data from New York were the most complete. For example, a diagnostic impression was entered for only 667 cases. Of these, 44% received a diagnostic impression of “no disability” (referred to herein as “no diagnosis”). Learning disability (LD) was diagnosed in 74 participants (11% of those for whom a diagnostic impression was entered), which is roughly similar to prevalence estimates for LD in mainstream, unselected United States samples. There were no sex

6
differences in LD prevalence (i.e., 11% for both males and females); interestingly, LD is typically identified more often in males by a ratio of ~4:1, yet in this sample that proportion didn’t hold. Although LD was originally the primary diagnosis (Dx) of interest, in this sample general intellectual limitations were notably more common. Sixty-nine participants were formally diagnosed as mentally retarded (MR), and an additional 250 performed poorly enough on cognitive ability and/or intelligence testing to be considered as having “borderline” MR or “marginal intellectual function” (MIF). The latter term will be used in this report. It refers to a situation in which an individual (1) displays performance on cognitive ability and/or intelligence testing that is near or within the MR range, but (2) does not display evidence of deficits in adaptive daily functions (which would be necessary for the MR diagnosis). These 250 persons represent ~38% of those for whom a diagnostic impression was available, a prevalence that is much higher than the <10% prevalence expected in the mainstream United States population. More critically, it is unclear how discrepant this is from MR/MIF prevalence rates in low-income Spanish-speaking adults in the U.S. Overall, then, ~48% of the participants whose data included a diagnostic impression were identified as MR or MIF. Of these, 19 (2.8% of those with a diagnostic impression available) were also identified as having LD. The breakdown of diagnosis by state is shown below. (In this and subsequent cross-tabulations, apparent inconsistencies in tallies reflect the effects of missing data and the possibility of individuals receiving multiple diagnoses.) Diagnostic Impression LD MR or MIF MR/MIF &
LD No
diagnosis Row totals
California 21 61 4 53 139 State New York 30 239 15 223 507 Virginia 4 0 0 17 21 Column totals
55
300
19
293
667
A diagnosis of mental illness, although present in ~7% of participants, was not a focus of this project. Virtually all of the mental illness diagnoses were secondary diagnoses made in individuals whose primary diagnosis had been LD or MR/MIF. For this reason, and because the heterogeneity of problems comprising a generic “mental illness” category precludes meaningful analysis, diagnoses of mental illness, therefore, will not be considered in subsequent analyses. While the variations in diagnoses across states (e.g., “Why did none of the VA sample earn an MR/MIF diagnosis?”) invite conjecture, the data collection methods used in the present study make such speculations extremely tenuous. This project is not, and was never designed to be, an epidemiological study, and thus no attempt was made during recruitment to ensure that the participant sample was representative of any specific population. It is inappropriate to make generalizations from this sample to any larger population of persons (e.g., Spanish-speaking residents of the U.S.) about how frequent, prevalent, or widespread conditions such as LD, MR, or MIF are.

7
Diagnostic impressions also varied depending on which demographic group participants were recruited from, as shown in the table below. Diagnostic Impression LD MR or MIF MR/MIF &
LD No
diagnosis Row totals
Adult Ed. 5 3 0 20 28 Group TANF 29 219 15 182 445 Voc. Rehab 2 0 0 3 5 Other 12 64 3 65 144 Column totals
48
286
18
270
622
Predictably, most of those participants drawn from adult education courses received no diagnosis, and the 5 out of 28 persons (18%) in this group identified as LD is not overly discrepant from general LD prevalence estimates. The most noteworthy point about this cross-tabulation is the unusually high prevalence (53%) of MR/MIF diagnoses among the TANF participants. It is difficult to know how to interpret the diagnoses for the “Other” group, but regardless of who they are or how they were recruited they also have a disproportionately high prevalence of MR/MIF. Recruitment of participants, although initially expected to occur primarily through Department of Social Services offices, often relied instead on contacts with leaders within the Spanish-speaking communities. The sampling technique turned out to be non-random (indeed, true random sampling is never attained in any study employing human participants), and followed a “snowball” approach wherein study enrollment proceeded largely by word of mouth. It is crucial to bear in mind that participation in this project was by self-selection; that is, participants decided for themselves whether or not to take part in the study. Anecdotally, their reasons for doing so included, among others, a desire to help the community, to get out of class or work assignment, to receive the monetary compensation, to learn more about LD because a friend or relative has LD, and to receive free evaluation because the participant him/herself, or someone working with the participant, suspects the presence of a learning problem. It is possible, if not likely, that these prevalence rates are somewhat inflated, and in particular it can be argued that that a self-selection bias might have caused a disproportionately high number of MR/MIF individuals to enroll in the project. By the same token, it would be expected that in an un-self-selected sample of Spanish speaking adults, the prevalence of these problems, especially MR/MIF, would be lower (although exactly how much lower remains an open question, and it would not be surprising if the prevalence of MR/MIF in the target population really is somewhat higher than in the overall U.S. population, given evidence of elevated rates of conditions such as LD in welfare populations).9
9 As noted below, in a subsequent wave of data collection using consecutively scheduled Spanish-speaking clients at the DSS office in Buffalo, and in which self-selection biases would presumably be minimized, the prevalence of MR/MIF was observed to be 65%, even higher than in the main data set, which might help vitiate the concern that the large sample had an unrepresentatively high percentage of MR/MIF cases. Still, further study of this is warranted, and the implications of confirming such elevated rates of MR/MIF in the target population could be staggering.

8
II. Procedures Upon participant enrollment, examiners obtained signed informed consent to participate, along with signed consent to release information to various relevant agencies. Participants also had the option of releasing information (e.g., testing results) to professionals of their choosing (e.g., personal physicians, therapists, etc.). Examiners (AKA local activity coordinators) were themselves Hispanic/Latino, and Spanish was their primary language. They were also fluent in English. Testing locations varied, often in response to daily room availability or to participants’ transportation and/or personal comfort issues, but always took place in quiet, private, well-lit environments as free as possible from distractions. Snacks, drinks, assistance with transport, and rest breaks were all provided as needed. The assessment began with the Sensory Abilities and Cultural Experiences Survey, followed by the four candidate screens (ALDS, Cooper, Selección Inicial, Neuropsi) administered in counterbalanced order, and the Woodcock-Muñoz Language Survey (English version). The TONI-3 and the entire Batería Woodcock-Muñoz – Revisida were also administered. Testing normally took three sessions, spread out over the course of several days. Participants were compensated for their efforts monetarily (e.g., $50 for completing all testing) and/or with small gifts from local businesses (e.g., movie tickets). Raw data from the TONI-3 and Batería Woodcock-Muñoz – Revisida were forwarded to diagnosticians, who provided scores, interpretations, and diagnostic impressions. Diagnosticians occasionally administered (or asked to have administered) additional tests necessary to clarify diagnoses, provided feedback (with local activity coordinators assisting as necessary with translation) to those participants who requested it, and forwarded reports of findings and recommendations to professionals or agencies as requested by participants. A note about LD diagnoses: There is no consensus in the professional community regarding the operational criteria for diagnosing LD, although an undeniably necessary condition is achievement in academic skill areas (e.g., reading, writing, arithmetic, among others) that is significantly below what would be expected on the basis of either (1) the individual’s overall cognitive ability or (2) what is considered normal ability for persons of the individual’s age and educational background.10 Typically the degree of discrepancy between a person’s ability and his/her achievement is determined by comparing performance on tests of ability (e.g., an IQ test) and tests of achievement. Diagnosis can then be done “by the numbers” if the difference in ability and achievement scores exceeds some pre-established value (as in the so-called “discrepancy” and “regressed standard score” models). However, these strictly quantitative models do not take account of the myriad mitigating circumstances (e.g., personal illness, family discord, inconsistent attendance at school, etc.) that may be contributing to observed discrepancies, and so a degree of professional judgment is often called for in making the proper interpretation of ability/achievement discrepancies. For this reason, the diagnoses in this report are those based on professional judgment informed by both test scores (Test 10 Actually, there are a few professionals who argue that the issue of aptitude/achievement discrepancy, and indeed even the concept of LD, is irrelevant. Their position is that the only parameter that need be assessed is achievement, because the remedial interventions for deficient achievement are identical regardless of the “cause” of those deficits. To them, the diagnostic label “LD” is moot. The counterargument to this is largely pragmatic, that receipt of appropriate services often requires documentation of a disability in the form of a professional diagnosis. (Deficient achievement not caused by an identifiable disability -- perhaps being a poor reader because one skipped school too frequently -- would therefore make one rightly[?] ineligible for government-sponsored services).

9
of Nonverbal Intelligence [TONI-3]; Batería Woodcock-Muñoz - Revisida, Pruebas de habilidad cognitive [Batería-R COG]; Batería Woodcock-Muñoz - Revisida, Pruebas de aprovechamiento [Batería-R APR]) and knowledge of the participants’ personal histories. With respect to diagnoses of MR and MIF, the key criterion was performance on tests of cognitive ability (TONI-3 quotient; Batería-R COG Broad Cognitive Ability score). MR was diagnosed if scores on both cognitive ability tests were clearly below average for age (i.e., <70, or 2 standard deviations below the mean) and there was evidence of significant impairment in adaptive functioning (e.g., deficits in self-care, personal financial management, housekeeping, travel through the community, etc.). MIF was diagnosed if intellectual limitations were present but full criteria for MR were not met, as in the case of those with cognitive ability scores <70 but without adaptive function deficits, or those with cognitive ability scores ranging from ~70 to ~77 (i.e., 1.5 – 2 standard deviations below average for age). As with LD diagnoses, MR/MIF diagnoses were not purely mechanical; decisions were influenced by knowledge of participants’ personal histories.

10
III. Instruments The following instruments were used in this study: Sensory Abilities and Cultural Experiences Survey Not one of the screens, this questionnaire assesses family and demographic background, as well as current social activities (presumably as an indication of acculturation). It was developed by the University of Kansas project staff specifically for this study, but was not relevant for the analyses presented in this report. Selección Inicial (Spanish translation) The Selección Inicial is a checklist format, subjective self-report questionnaire that requires “Yes” or “No” responses to 22 items that tap into performance of scholastic-type activities in school (e.g., “Math tests were easy for me.”), home (e.g., “My important paperwork at home is well organized.”), and work (e.g., “It is easy to read and fill out forms for work.”) environments. It is extremely quick (<5 minutes administration time) and simple to administer, and can even be administered in group-testing sessions. Each item endorsement indicative of problematic performance receives a score of 1 point, so the possible total ranges from 0-22, with higher scores indexing greater difficulties.11 As with the two preceding tests, it seems that this assessment has not appeared in any peer-reviewed research. NEUROPSI The NEUROPSI is a brief neuropsychological test battery developed in Spanish with an eye toward use with persons of limited educational background. It assesses, at least in a cursory fashion, all of the major domains of higher cognitive functions, including reading comprehension, writing to dictation, and simple arithmetic. For these reasons it appears initially to be a strong candidate instrument for identification of LD in the target population. The NEUROPSI has eight subsections: 1. Orientation: knowledge of current date, location, and age 2. Attention & Concentration: ability to focus and maintain attention on mental tasks 3. Memory Registration: ability to store/encode both verbal and nonverbal information 4. Language: ability to perform a variety of receptive and expressive language-related tasks 5. Reading: ability to answer questions about a brief story that the participant reads 6. Writing: ability to copy and write to dictation 7. Executive Function: ability to think conceptually and carry out motor actions 8. Long-term Memory: ability to recall and recognize previously presented information Each of these subsections consists of multiple items. The scores for the NEUROPSI subsections can be totaled to yield an overall score (range of possible scores is 0-130, with higher scores indicative of more intact function). The NEUROPSI is the only one of the four candidate screens that has been the subject of research reports appearing in peer-reviewed journals (e.g., Ardila,
11 Mellard et al. (2004) scored the Selección Inicial items 1 or 2, rather than 0 or 1, as we did here, which explains why the scores they reported were some 22 points higher than those reported here.

11
Ostrosky-Solís, & Mendoza, 2000; Ardila, Ostroski-Solís, Roselli, & Gómez, 2000; Ostrosky-Solís, Ardila, Rosselli, Lopez-Arango, & Uriel-Mendoza, 1998). None of the extant research using the NEUROPSI has given any hint of its validity as a tool for identifying the presence of LD, however. Adult Learning Disabilities Screen (Spanish translation) This test is essentially a direct translation of the English-language ALDS (Mellard, 1999). It consists of a series of interview and self-report items. The opening section includes items inquiring about facility with English and Spanish in different settings, along with some questions about vision and hearing (these questions were added for this study, and do not appear in the original ALDS). The next part, somewhat curiously labeled “Part 1” – a reflection of the fact that this is the beginning of the original English version of the test -- requires the examinee to read 25 descriptive statements (e.g., “I am a good speller.”) and respond to each by selecting one response choice on a 5-point scale (e.g., strongly disagree, disagree, undecided, agree, strongly agree). These 25 items form seven subscales (“clusters”): 1. Self-Attribution (5 items) 2. Spelling Skills (2 items) 3. Reading Skills (3 items) 4. Social Skills (4 items) 5. Efficiency (5 items) 6. Sense of Direction (2 items) 7. Organization Skills (4 items) “Part 2” contains 19 questions about psychiatric and academic history (e.g., “Do you remember having learning or achievement difficulties?”) that examinees read and answer by selecting Yes or No. Six subscales (“clusters”) are formed from these 19 items, with one item contributing to two subscales: 1. Learning Influences (3 items) 2. Learning Problems (3 items) 3. Educational Experience (4 items) 4. Mental Health (3 items) 5. Fraction Skills (3 items) 6. Math Operations (4 items) “Part 3” is an interview, in which the examiner queries further to elicit additional information about responses to certain critical items on Part 2. Although a great deal of useful information can be gleaned from the interview portion, there is no formal way to incorporate this information into the scoring system. Instead, scores for Parts 1 and 2 are based on simple tallies, for each cluster, of item endorsements in the pathological direction. These cluster scores are next converted into “Part scores” using tables found in the instruction manual; the Part scores are then summed separately for Part 1 and Part 2. Summed Part 1 scores above a pre-specified cut-off value indicate the possibility of LD; summed Part 2 scores below a different pre-specified cut-off value indicate the possibility of LD. Administration time depends on how quickly the examinee responds to the self-report items, but should be ~15 minutes. This instrument has not been used in any peer-reviewed research appearing in the scientific literature (at least as far as this author was able to determine), and the test manual itself gives no information at all on the psychometric properties of the ALDS.

12
Cooper Screening of Information Processing (Spanish translation) The translated version of the Cooper screen (Cooper, 2000) used in this study consists of both self-report items (as in the Selección Inicial and ALDS) and performance items (as in the NEUROPSI). All of the 12 areas explored by this screen are directly relevant to the assessment of LD (unlike, say, the NEUROPSI which is a general measure of cognitive function). The domains assessed by the Cooper are as follows: 1. Educational history 2. Hearing 3. Right/left discrimination 4. Organizational skills 5. Oral communication 6. Writing skills 7. Writing performance 8. Mathematics skills 9. Mathematics vocabulary 10. Reading skills 11. Reading accuracy 12.Reading comprehension The scoring system for the Cooper is quite involved, requiring differential weighting of its 12 subsection scores and a peculiar adjustment to the total score based on responses to a set of general vocabulary items (i.e., measuring participants’ ability to define words). The Cooper has a pre-established cut-off score of 75, with scores above this level indicative of LD. Like the ALDS, no mentions of this test were to be found in the peer-reviewed literature. Test of Nonverbal Intelligence – 3 (TONI-3) The TONI-3 (Brown, Sherbenou, & Johnson, 1997) uses a multiple choice, matrix completion format to test intelligence. In this format, each test item consists of an array of visual stimuli (e.g., three squares) with one missing, along with several response choices (e.g., circle, square, triangle); the examinee must select the response that correctly completes the matrix (e.g., square, in this example). The test instructions can be pantomimed, and examinees respond by pointing to their answer choices, thus circumventing the need for any use of language at all. The TONI-3 is an adequate measure of intelligence, and although it fails to tap into numerous specific aspects of intelligence, including obviously anything verbal, TONI-3 scores correlate well with scores from broader, omnibus tests of intelligence. Woodcock-Muñoz Language Survey The language survey (Woodcock & Muñoz-Sandoval, 1993) consists of four English language subtests taken from the Woodcock-Johnson Psychoeducational Battery – Revised (Picture Vocabulary, Verbal Analogies, Letter-word Identification, and Dictation). It provides a general measure of proficiency with English, as well as scores for Oral Language and Reading-Writing skills. It was not used in the analyses for this report.

13
Batería Woodcock-Muñoz – Revisida – Pruebas de habilidad cognitiva, and Batería Woodcock-Muñoz – Revisida – Pruebas de aprovechamiento The Batería Woodcock-Muñoz-Revisada (Batería -R; Woodcock & Muñoz-Sandoval, 1996) is the analogous Spanish-language edition of the Woodcock-Johnson-Revised (WJ-R). It is a revision of the 1982 Batería Woodcock Psico-Educativa, a test so fraught with problems that Lintel’s (1996) excoriating review in the Mental Measurements Yearbook strongly advised against its use. The up-to-date Batería-R varies considerably from its forerunner in several aspects, and the test has received positive, if somewhat tentative, acceptance (Frary, 1996). The Batería-R, like the WJ-R, consists of two separate, but co-normed, batteries. The Batería Woodcock–Muñoz: Pruebas de habilidad cognitiva-Revisada (Batería-R COG) corresponds to the English-language Woodcock-Johnson Tests of Cognitive Ability-Revised (WJ-R COG), and provides summary scores (“Broad Cognitive Ability”) that are likened to IQ scores, as well as scores indicating aptitude (i.e., potential) for reading, writing, and arithmetic. The Batería Woodcock-Muñoz: Pruebas de aprovechamiento-Revisada (Batería-R APR) corresponds to the Woodcock-Johnson Tests of Achievement-Revised (WJ-R ACH), and provides an assessment of actual achievement in academic skill areas such as reading, writing, and arithmetic. Both parts are further subdivided into a Standard Battery and a Supplemental Battery (Estándar and Suplementaria, respectively, in the Batería-R). All tests in the Batería-R have been carefully adapted from the WJ-R (Dean & Woodcock, 1999). Depending on the purpose and extent of the assessment, the Standard Batteries may be used alone or in conjunction with tests from the Supplemental Batteries (Woodcock & Mather, 1989, 1990), although in this project the entire set of standard and supplemental subtests for both the Batería-R COG and the Batería-R APR were administered. All tests in the Batería-R and the WJ-R are parallel in content and organization: A bilingual examiner competent at administering one could therefore competently administer the other with no additional training. Norms for the Batería-R are equated to WJ-R norms. This was accomplished by capitalizing on certain advantages of item response theory, in particular the Rasch model, to equate and scale the tasks underlying each Batería-R test to their empirical difficulties in English (Woodcock & Muñoz-Sandoval, 2001). Although this appears to be an appropriate procedure overall, its limitations may become apparent on, for example, tests of reading accuracy; because of the phonological regularity of Spanish, reading unfamiliar words or even non-words in Spanish is fundamentally easier than in English, leading to spuriously high scores even among poor Spanish readers because reading accuracy norms are based on the more difficult English tasks with their phonological irregularities. Diagnosis of LD with the Batería-R is accomplished as follows: First, aptitude scores from the Batería-R COG are used to derive predicted achievement scores; second, the degree of discrepancy between predicted and actual achievement scores is determined; finally, if this predicted/actual discrepancy is appreciably greater (in the direction of predicted > actual) than it is for most people with similar levels of cognitive ability, then LD is indicated.

14
IV. Evaluation of the Screening Tests: Overview There are numerous ways to address the issue of adequacy and quality of tests, and most of these ways focus on the reliability and the validity of the tests. Good tests possess high reliability, or freedom from random measurement errors. High reliability makes it more likely that the score an examinee obtains is an accurate estimation of whatever is being measured. Reliability can be assessed in multiple ways. For example, temporal stability can be evaluated by having examinees take the test on more than one occasion; assuming that what is being measured is a stable trait (e.g., LD), the scores obtained by any given participant at one testing should match (or be very similar to) scores obtained by that participant at other testings -- that is, all else being equal, a person identified by a test as learning disabled today should also be identified as learning disabled a month from now and a year from now; if not, the test lacks temporal stability, but more importantly, the user has no idea which test result is the truthful one! Because the design of this project makes no allowance for repeat testings, the so-called test-retest reliability of the screens can not be assessed. As another example, internal consistency can be examined by comparing how examinees respond to the entire collection of items on a single screening test at one sitting. Internal consistency, typically measured using a statistic known as Cronbach’s alpha (� ), is the extent to which items making up the test are all measuring the same thing. Assessments of internal consistency don’t tell us what the items are measuring, but it is a good first step to know that whatever it is the items are measuring, it’s being consistently measures by all of the test items. Low internal consistency is often, but not always, a red flag indicating a poorly constructed test. Validity in general refers to the extent to which a test measures what it purports to measure. Like reliability, validity can be examined in a number of different ways, but for purposes of developing a screening test that can serve as a stand-in for a lengthy, full battery assessment, what is known as criterion-related validity is most relevant. Simply put, criterion-related validity is an evaluation of the screening test’s ability to provide the same diagnosis as the full assessment procedure. For each screening test, diagnostic accuracy was evaluated by several different methods, but common to all methods was the general criterion-related validity approach that the diagnostic predictions made by the screen were compared to the diagnosticians’ impressions (based on the full ~6 hour Batería-R assessment). First, the predicted diagnosis was determined using the standard scoring and/or interpretation rules for the screening test. Typically this involved generating a total raw score for each participant on the test, and basing the diagnostic prediction on a “cut-off” score (e.g., scores below the cut-off indicate absence of LD, scores above the cut-off indicate presence of LD). Second, scores for individual test items were simultaneously entered into a logistic regression analysis, which allowed for calculation of “weighting” factors. This allows for items to be weighted differently (from each other, as well as from the unweighted item scores used in the standard scoring procedures). This is done so that better test items “count” for more than poorer test items. Rather than simply obtaining a total score for the test by adding up scores for the test items, each item must be weighted by entering it into an algebraic equation (the “regression equation”), the score resulting from which would indicate predicted diagnosis (LN or non-LN). Third, individual test items were selectively entered into the analysis using a forward selection procedure, which picks only the best, most useful items for inclusion. Finally, if the screening test generated scores for subsets of items, these “subscale” scores were also used in regression analyses, first with simultaneous entry of all subscales, and then with selective (forward) entry. For all of the regression analyses (i.e., all but the first approach to evaluating the screening test), the sample was randomly split in two in order to provide cases for a cross-validation of the regression equations.

15
Each of the four screening tests is addressed separately. The key psychometric properties to be examined in investigating the adequacy of these instruments are: (1) overall diagnostic accuracy rate (i.e., the percentage of cases in which the screening test results match the diagnosticians’ impressions); (2) diagnostic sensitivity (i.e., of the total number of persons who have a diagnostician-identified disability, the percentage of whom are correctly identified as such by the screening test); and (3) diagnostic specificity (i.e., of the total number of persons who do not have a diagnostician-identified disability, the percentage of whom are correctly identified as such by the screening test). These parameters can be understood by looking at the table below.
Screening Test’s Predicted Diagnosis
Does not have LD
Has LD Row totals
Real
Does not have LD
45 15 60
Diagnosis Has LD
8 32 40
Column totals 53 47 100 In this scenario, 100 persons (40 known to have LD, and 60 without LD) were evaluated using the fictitious test. The screening test correctly identified 32 of the 40 learning disabled persons as learning disabled, giving it a sensitivity of 32/40, or 80%. It correctly identified 45 of the 60 non-learning disabled persons as non-learning disabled, giving it a specificity of 75%. Its overall accuracy rate [(45 + 32)/100] was 77%. In the real world, 32 learning disabled people would be referred for full diagnostic workups, but 8 learning disabled people would fall through the cracks (cases referred to as misses), and 15 non-learning disabled people would be needlessly sent for full diagnostic workup (cases referred to as false alarms). All else being equal, misses and false alarms tend to vary inversely, and a test’s cut-off score can be adjusted in such a way as to maximize or minimize either. The decision on where to set the cut-off is typically based on the score that yields the highest overall diagnostic accuracy rate, but ultimately rests with the test developer and user, who must decide whether it is better to be over-inclusive (with fewer misses but more false alarms) or under-inclusive (with more misses but fewer false alarms). In the current project, the most likely consequence of a high false alarm rate is the added expense of needless testing of non-affected persons, along with the potential anxiety and dismay that often accompany referrals for such testing. The most likely consequence of a high false negative rate is obvious: failure to identify many of those that the screen seeks to identify, and consequent lack of referral for further assessment and remedial/supportive services. Incidentally, note that the prevalence, or base rate, of LD in this example [40/100] is 40%. Generally, tests are better to the extent that their overall diagnostic accuracy rate exceeds the accuracy rate that could be obtained merely from making guesses based on knowledge of prevalence rates. Here, without use of any screening test whatsoever, a person having knowledge of base rates would be correct 60% of the time by making a “blind” diagnostic guess that no persons in this sample have LD. See the table below.

16
Blind (but educated) Guess Does not have
LD Has LD Row totals
Real
Does not have LD
60 0 60
Diagnosis Has LD
40 0 40
Column totals 100 0 100 The sensitivity of the blind guess is 0/40 or 0%, however the guess in this case provides 100% specificity (60/60) and an overall diagnostic accuracy rate of (60 + 0)/100 or 60%. In the real world, no persons would be sent for full diagnostic workup, which means that none of the learning disabled people would be properly diagnosed, but also that no funds would be wasted on needless testing of non-learning disabled persons who were mistakenly identified by the screen as having LD (a situation akin to the state of affairs existing prior to initiation of this study). At first, most test users find this type of example silly, because they see that none of the target group (persons with LD) are being correctly identified, yet the importance of correctly identifying cases that are not in the target group must not be dismissed lightly. Furthermore, consider the following situation, in which the screening test is accurate 60% of the time.
Screening Test’s Predicted Diagnosis
Does not have LD
Has LD Row totals
Real
Does not have LD
45 15 60
Diagnosis Has LD
25 15 40
Column totals 70 30 100 Here, with a sensitivity of 37.5% and a specificity of 75%, the overall accuracy rate is 60%. Yes, 15 learning disabled persons will be referred for further testing, but most of the LD cases are missed and 15 non-LD cases will be sent off for unnecessary testing. Unless one is comfortable with this amount of unnecessary testing while at the same time allowing >60% of the learning disabled cases to fall through the cracks, it is difficult to justify the use of such a screening test, particularly when without any screening test at all one would make the same number of correct diagnoses (60 versus 45 + 15)! The bottom line, then, is that a useful screening test will make the correct diagnosis much more often than could be made using no test and simply predicting that none (or in some situations all) of the cases have the diagnosis. Recall that in the participant sample used for the present analyses, 43% received no LD or MR/MIFdiagnosis, and the remaining 57% were identified as having LD (~11%) and/or MR/MIF (~49%). Therefore, a suitable LD screening test should classify LD cases with much better than 89% accuracy (because one would be correct 100 – 11 = 89% of the time by blindly guessing that no participants had LD). Tests with such accuracy levels are quite rare. For this project, the situation is complicated by the presence of a large number of persons with MR/MIF. Given this, an ideal

17
screening test would distinguish between persons with LD, those with MR/MIF, and those without any diagnosis. None o f the four candidate s c reens was able to make a di f f e ren t ial diagnos i s o f LD versus MR/MIF; the t es t performance o f these two groups was so simi lar on al l o f the sc re ens that i t was dec ided to combine them into a single group hence forth re fe rred to as “learn ing needs”(LN). This desi gnat ion was chosen to re f le c t the fac t that , regardle s s o f diagnos i s , these individuals l ike ly have l imitat ions that cou ld in ter fe re wi th se eking, obtain ing, or ho lding gain fu l employment , and would bene f it f rom more thorough assessment (not on ly to e stabl i sh diagnos i s but to iden ti fy individual s t rengths and weaknesses ) . In the case of the present data, by blindly guessing that all examinees had learning needs, one would be correct 57% of the time, and so the “winning” screen must make the correct diagnosis for more than 57% of the participants.12 Its overall accuracy rate should also be sufficiently higher than 57% to justify its administration time and costs. As a corollary, the more costly, time-consuming, and difficult the screen is to administer, the greater its diagnostic accuracy ought to be if its use is to be considered a worthwhile exercise.
12 Ideally, the comparison would be between the diagnostic accuracy rates of the candidate screens and the known population prevalence of learning needs in the low-income Spanish speaking U.S. population (not sample prevalence, as is done here). Absent an accurate estimate of the population prevalence, however, the “winning” screen is simply the one that offers the highest overall diagnostic accuracy, although it must be understood that the usefulness of any screen is diminished to the extent that known population prevalence (AKA base) rates allow “blind” guessing of diagnoses that would be correct more often than the screen is (which could occur, if, for example, the prevalence rate of a condition is higher than the diagnostic accuracy rate of the screen used to detect it).

18
Results
I. Screening Test Candidate #1: Selección Inicial (Initial Screen) For the entire sample, the mean (SD) Selección Inicial score was 10.2 (5.7), with scores ranging from 0-22. Among diagnostic subgroups, the mean (SD) score for those with LD was 10.5 (4.9), for those with MR/MIF it was 12.5 (5.7), for those with both MR/MIF and LD it was 13.8 (4.6) and for those with no diagnosis it was 8.1 (4.9). Reliability: The internal consistency of the Selección Inicial is quite strong for a test such as this (Cronbach’s � = .89 on a scale of 0-1), indicating that examinees tend to respond to one item the way they respond to the others; in other words, the various test items are measuring something in common. Validity: Appendix A shows how item was responded to by the participants, as well as validity data (accuracy, sensitivity, specificity) for each item. Notably, items addressing performance in the workplace were left unanswered by ~10% of the participants.13 Not one item has a diagnostic accuracy rate of >70%, and 10 items have accuracy rates between 50 and 60%. Although several items can be seen to possess high sensitivity or specificity, high levels of one of these attributes are almost always accompanied by correspondingly low levels of the other. Indeed, only two items had >60% sensitivity and specificity. To see if total scores on this screen could distinguish between those with learning needs (LN) and those without (No Dx), a cut-off score of 8 was chosen. The percentage of cases scoring at or below (42%) and above (58%) this cut-off score provided the best match for the percentages of cases in the No Dx (43%) and LN (57%) groups. The Table below shows the diagnostic accuracy obtained when using this cutoff score. Cell entries are percentages of the total number of cases in the analysis.
Selección Inicial Predicted Diagnosis
Does not have LN (≤ 8)
Has LN (>8)
Row totals
Diagnostic
Does not have LN
26 19 45
Impression Has LN
15 40 55
Column totals 41 59 100 This test has an overall diagnostic accuracy rate of 66% in this sample, a sensitivity of 73%, and a specificity of 58%. More than 25% of those with learning needs will be missed by this test, and one-third of those with no diagnosis will end up being referred for additional testing needlessly.
13 Ironically, participants at the San Antonio conference had requested that this screen be revised to include items addressing workplace-relevant issues, but these items were the ones most likely to be left blank by our participants.

19
Other cut-off scores could be used, with predictable changes in sensitivity (increased by lowering the cut-off) and specificity (increased by raising the cut-off):
Cut-off set at 7 yields diagnostic accuracy of 66%, with 79% sensitivity and 51% specificity. Cut-off set at 9 yields diagnostic accuracy of 67%, with 68% sensitivity and 66% specificity. Cut-off set at 10 yields diagnostic accuracy of 67%, with 62% sensitivity and 74% specificity. Cut-off set at 11 yields diagnostic accuracy of 65%, with 55% sensitivity and 77% specificity.
None of these cut-off scores provides a particularly high degree of diagnostic accuracy, and all leave the test user with something of a Hobson’s choice: To lower the cut-off is to decide that “we’ll not let a lot people with learning needs fall through the cracks, even though we’ll waste a lot of money testing people who don’t need to be tested,” while to raise the cut-off is to decide that “we’ll not waste a lot of money testing people who don’t need to be tested, even though we’ll let a lot of people with learning needs fall through the cracks.” Because some of the individual test items might be better than others at discriminating between participants with LN and those without, a logistic regression was conducted in an attempt to differentially weight items based on their discriminative ability. In the first subsample, the use of weighting factors for individual test items led to 69% diagnostic accuracy, with 71% sensitivity and 67% specificity. However, in the cross-validation subgroup, these figures dropped to 65%, 69%, and 59%, respectively. This drop, incidentally, is quite characteristic of findings during cross-validation. Statisticians call it shrinkage, and it reflects that fact that certain unique or quirky aspects of the participants in the first subgroup made certain test items particularly good predictors of group membership (LN versus No Dx), but the absence of these unique or quirky aspects in other samples (including the cross-validation subsample) limits the usefulness of the previously identified “good” items. Finally, because not all of the items on the screen are necessarily useful at all, a second logistic regression was conducted that allowed for inclusion of only those test items that seemed to do a good job of discriminating between LN and No Dx cases. The advantage here is that, by using only the test’s “best” items, a shorter, more examinee-friendly measure might be identified. Two different analytic approaches were tried. First, the analysis started with no test items included and was allowed to proceed by adding test items one at a time to maximize diagnostic accuracy. Maximal accuracy (69%, with 70% sensitivity and 67% specificity) was obtained with just three items, although in the cross-validation subsample, these figures changed slightly to 68%, 71%, and 63%. Second, the analysis started with all 22 of the test items included and was allowed to proceed by dropping test items one at a time to maximize diagnostic accuracy. Maximal accuracy (69%, with 77% sensitivity and 59% specificity) was obtained using four items (three of which had been included in the preceding analysis). Again, however, during cross-validation these figures shrank to 68% accuracy and 51% specificity, although sensitivity increased to 82%. Comment: Despite its good reliability, and the undeniable advantages associated with its quickness and ease of administration and scoring, the Selección Inicial did not fare especially well in the validity analyses. No attempt to differentially select or weight individual items appeared to consistently lead to better diagnostic accuracy than could be obtained by simply obtaining a raw score and applying a cut-off. Based on this sample, a cut-off of 9, with scores of 10 and above indicative of LN, appeared most useful. Using this score as the cut-off, two out of every three individuals with LN were correctly identified as such, although one out of every three persons with no diagnosis was misidentified as

20
having LN. This means that some 19% of all persons screened might be referred for additional testing unnecessarily, which is significant when considering that 59% of all persons screened will be referred for additional testing. Since the percentage of persons with LN in this population appears to be so high, and the associated expense of testing them so great, finding a screening test that doesn’t needlessly refer so many non-LN examinees for testing (i.e., one with higher specificity) would appear to be of great practical importance.

21
II. Screening Test Candidate #2: NEUROPSI In this sample, the mean (SD) score was 97.5 (17.1), with a range of 28.5-127. Among diagnostic subgroups, the mean (SD) score for those with LD was 102.1 (11.3), for those with MR/MIF it was 88.5 (18.7), for those with both MR/MIF and LD it was 92.0 (12.8) and for those with no diagnosis it was 106.8 (11.7). Appendix B shows the results of item analyses for the NEUROPSI. The most promising sections of the test are its Attention section (particularly the serial subtraction item) and its Conceptual section, both of which have diagnostic accuracy rates of 70%. Reliability: The internal consistency (Cronbach’s � ) of the full set of NEUROPSI items was .83 (on a scale of 0-1), which is low. Note, however, that the NEUROPSI was developed to cover a broad range of cognitive functions, and so a high � is not necessarily to be expected. Given that, this figure is extremely impressive. Previously published results (Ostroski-Solís et al., 1999), indicate a temporal stability coefficient of .89 over a three-month interval, which is also quite good. Validity: To see if total scores on this screen could distinguish between those with learning needs (LN) and those without (No Dx), a cut-off score of 101.5 was chosen. The percentage of cases scoring below (56%) and above (44%) this cut-off score provided the best match for the percentages of cases in the No Dx (44%) and LN (56%) groups. The Table below shows the diagnostic accuracy obtained when using this cutoff score. Cell entries are percentages of the total number of cases in the analysis.
NEUROPSI Predicted Diagnosis Does not have
LN (≥101.5) Has LN (<101.5)
Row totals
Diagnostic
No Dx 31 12 43
Impression LN
17 40 57
Column totals 48 52 100 This test has an overall diagnostic accuracy rate of 71% in this sample, a sensitivity of 70%, and a specificity of 72%. This yields better accuracy than the Selección Inicial. Other cut-off scores could be used, with predictable changes in sensitivity (increased by raising the cut-off) and specificity (increased by lowering the cut-off), but no such slight changes made a striking difference in overall accuracy rates. It is also possible to categorize raw NEUROPSI scores, based on age and educational experience, into performance levels (normal, mildly impaired, moderately impaired, or severely impaired). The table below shows the crosstabulation of diagnosis and NEUROPSI level of functioning, again expressed as percentages.

22
NEUROPSI Level of Functioning Normal Mildly
impaired Moderately impaired
Severely impaired
Row totals
LD 5 3 3 3 14 Diagnostic MR/MIF 14 6 12 10 42 Impression No Dx 30 4 8 2 44 Column
totals
49
13
23
15
100 Aside from the somewhat greater likelihood of MR/MIF participants scoring in the moderately (or especially the severely) impaired range, there is little in the way of consistent, systematic relationships between NEUROPSI functional levels and diagnostic group. While this is not particularly encouraging, it must be remembered that the NEUROPSI was not developed for the diagnosis of either LD or MR, nor is it an intelligence test. The picture brightens somewhat when the LD and MR/MIF groups are collapsed into a single learning needs (LN) group, and the three impairment levels are collapsed into a single group, as can be seen in the next crosstabulation.
NEUROPSI Level of Functioning Normal Impaired Row totals
Diagnostic No Dx 30 15 45
Impression LN
19 36 55
Column totals 49 51 100 Here the overall diagnostic accuracy rate is 66%, with sensitivity of 65% and specificity of 67%. This is worse than could be obtained using raw NEUROPSI scores, and slightly worse than the results that could be obtained using the vastly more user-friendly Selección Inicial. Because use of the subsection totals might be better than use of the total raw score at discriminating between participants with LN and those without, a second logistic regression was conducted in an attempt to differentially weight subsection totals based on their discriminative ability. In the first subsample, the use of weighting factors for individual subsection totals led to 74% diagnostic accuracy, with 74% sensitivity and 73% specificity. In the cross-validation subgroup, these figures were 74%, 76%, and 71%, respectively. Although still not at the level they should be, these values do represent a meaningful step up from the Selección Inicial results. In a similar fashion, individual NEUROPSI items were also subjected to logistic regression analysis. In the first subsample, the use of weighting factors for individual items led to 74% diagnostic accuracy, with 76% sensitivity and 70% specificity. In the cross-validation subgroup, these figures were 75%, 77%, and 73%, respectively. Note that even in the cross-validation subgroup diagnostic accuracy is now superior to that obtained using Selección Inicial raw scores, suggesting that at least some of the NEUROPSI items are highly useful in discriminating between those with learning needs and those without.

23
Lastly, to capitalize on the differential usefulness of the NEUROPSI items, a final logistic regression was conducted that allowed for inclusion of only those test items that seemed to do a good job of discriminating between LN and No Dx cases. As with the Selección Inicial, two different analytic approaches were tried. First, the analysis started with no test items included and was allowed to proceed by adding test items one at a time to maximize diagnostic accuracy. Maximal accuracy (72%, with 74% sensitivity and 70% specificity) was obtained with just five items. In the cross-validation subsample, overall accuracy stayed almost the same (71%), sensitivity shrank slightly to 71%, and specificity stayed almost the same (71%). Second, the analysis started with all test items included and was allowed to proceed by dropping test items one at a time to maximize diagnostic accuracy. Maximal accuracy (72%, with 74% sensitivity and 70% specificity) was obtained using eight items (five of which had been included in the preceding analysis). During cross-validation these figures were 74%, 73%, and 75%. Comment: The NEUROPSI, an important recent addition to the psychodiagnostician’s toolbox, has previously shown itself to be useful in the identification of brain damage, and it is a reliable test. Both the administration and the scoring of the test items are considerably more difficult, time-consuming (e.g., at least a 25-30 minute administration time for a competent examiner, with as much time also needed for scoring), and demanding of training/practice than is the “idiot-proof” Selección Inicial. It is probably not the best stand-alone screening test for identifying persons in the target population who have learning needs. Use of the entire NEUROPSI, while affording notably better prediction than the Selección Inicial, is difficult to recommend at a practical level because of the administration and scoring time (easily up to 60’ for each examination), as well as the need for fairly extensive training and practice in test administration which likely would need to be overseen by a professional psychologist.14 Additionally, the need to provide and maintain large quantities of physical testing materials (e.g., spiral bound cardstock test stimuli, which are reusable but subject to damage, wear, and misplacement) presents another impediment to recommendation of the NEUROPSI. Still, results of the final regression analyses seem to confirm the idea that some, but not all, of the NEUROPSI items do an adequate job of discriminating between LN and No Dx participants, and its development in Spanish (as opposed to translation) gives it a significant advantage over its competitors.
14 The administration, scoring, and examiner training time and difficulty, it should be noted, are significantly greater than the test’s creator indicated during the San Antonio conference. It is easy for this author to imagine grave difficulties with obtaining proper administration and scoring of the NEUROPSI by the minimally trained end users of this screen.

24
III. Screening Test Candidate #3: Cuestionario para Saber la Deficiencia de Aprendizaje en un Adulto (Adult Learning Disabilities Screen) For Part 1 (Rating Scales), the mean (SD) score for the entire sample was 343 (11.4). Among diagnostic subgroups the mean (SD) Part 1 score for those with LD was 343.4 (11.4), for those with MR/MIF it was 338.4 (10.7), for those with both MR/MIF and LD it was 338.3 (9.3), and for those with no diagnosis it was 348.5 (10.5). For Part 2 (Inventory), the mean (SD) score for the entire sample was 303.2 (11.5). Among diagnostic subgroups the mean (SD) score for those with LD was 303.3 (11.1), for those with MR/MIF it was 308.2 (11.6), for those with both MR/MIF and LD it was 309.6 (14.0), and for those with no diagnosis it was 298.4 (9.3). Appendix C shows the results of item analyses for the ALDS. Few individual items appear to be particularly helpful in distinguishing between those with learning needs and those without. The most promising items are those at the end of Part 2, which address problems with mathematical skills. Item 19 by itself, for example, has a 71% accuracy rate, with nearly equivalent sensitivity and specificity. Reliability: Rather than looking at the internal consistency of the full collection of ALDS items, or even the full sets of items for Parts 1 and 2, Cronbach’s alpha was calculated separately for each of the clusters. Part 1 alphas were as follows: 1. Self-Attribution (� = .53) 2. Spelling Skills (� = .43) 3. Reading Skills (� = .78) 4. Social Skills (� = .52) 5. Efficiency (� = .70) 6. Sense of Direction (� = .67) 7. Organization Skills (� = .77) Internal consistencies for Part 2 clusters were as follows: 1. Learning Influences (� = .38) 2. Learning Problems (� = .43) 3. Educational Experience (� = .60) 4. Mental Health (� = .43) 5. Fraction Skills (� = .53) 6. Math Operations (� = .86)

25
Although some of these values are decent, on the whole these clusters are not internally consistent. This raises concern because when items in a cluster are not all measuring the same thing, then the accuracy (and ultimately the meaning and interpretation) of the score becomes uncertain. For example, the Fraction Skills cluster contains the following items: Did you fail any classes in school? Do you understand fractions? Do you understand percentages? The latter two items are clearly related, but the first item is not. An examinee who failed classes (perhaps due to behavior problems or illness totally unrelated to LD) but understands fractions and percentages perfectly would endorse one item in the pathological direction, and end up with the same score on this cluster as a person who didn’t fail classes, has a basic understanding of fractions, but has no grasp of percentages whatsoever, thus also endorsing one item in the pathological direction. Validity: The validity of the ALDS was evaluated separately for Part 1 and Part 2. For Part 1, the overall diagnostic accuracy (using the pre-specified cut-off of 338) yielded a 63% correct classification rate, with a sensitivity of 44% and a commendable specificity of 87%, as shown by the percentages in the following table.
ALDS Part 1, Predicted Diagnosis Does not have
LN (≥338) Has LN (<338)
Row totals
Diagnostic
No Dx 39 6 45
Impression LN
31 24 55
Column totals 70 30 100 Part 2 fared slightly less well, with a 62% correct classification rate. Sensitivity was 45%, although specificity was still excellent at 85%, as shown below.
ALDS Part 2, Predicted Diagnosis Does not have
LN (≤ 309) Has LN (> 309)
Row totals
Diagnostic
No Dx 37 7 44
Impression LN
31 25 56
Column totals 68 32 100 The cut-off scores used in these analyses were those from the original English version. For use of a language-modified version with a different population, it is possible that an improvement in sensitivity (with retention of relatively strong specificity) might be obtained by raising the cut-off

26
score (for Part 1) and/or lowering the cut-off score (for Part 2). For example, raising the Part 1 cut-off score from 338 to 345 led to an improvement in diagnostic accuracy from 65% to 67%, with a corresponding increase in sensitivity to 67%, although specificity dropped to 67%. These figures are now in the same realm as the percentages for the other screens. Lowering the Part 2 cut-off score from 309 to 300 led to an improvement in diagnostic accuracy from 62% to 67%. Sensitivity increased to 67%, while specificity dropped to 67%. The ALDS does not use Part 1 and Part 2 scores conjointly, although there may be advantage in doing so. Entry of both Part 1 and Part 2 scores into a logistic regression, allowing for differential weighting, indicates that 71% of participants can be classified correctly into LN versus No Dx categories, with a sensitivity of 75% and specificity of 65%. Under cross-validation these figures showed little change: 71%, 71%, and 71%, respectively. The ALDS bases the totals for Parts 1 and 2 on clusters of items, and once again differential weighting of the clusters might lead to improved diagnostic accuracy. This approach yielded a 73% overall diagnostic accuracy with 78% sensitivity and 67% specificity. Corresponding values under cross-validation were 72%, 80%, and 62%. Attempts to make use of the differential usefulness of the ALDS clusters by including only those clusters that seemed to do a good job of discriminating between LN and No Dx cases resulted in no meaningful improvements. As with the first two screens, two different analytic approaches were tried. First, the analysis started with no clusters included and was allowed to proceed by adding clusters one at a time to maximize diagnostic accuracy. Maximal accuracy (74%, with 77% sensitivity and 71% specificity) was obtained with five clusters (Reading, Organization, Mental Health, Fraction Skills, and Math Operations). In the cross-validation subsample, overall accuracy shrank (69%), as did specificity (59%), although sensitivity did not change. Second, the analysis started with all clusters included and was allowed to proceed by dropping clusters one at a time to maximize diagnostic accuracy. Maximal accuracy (75%, with 79% sensitivity and 71% specificity) was obtained using eight clusters (five of which had been included in the preceding analysis). During cross-validation these figures shrank to 72%, 79%, and 64%. The last set of analyses investigated individual ALDS items. In the first of these analyses, all ALDS items were entered simultaneously and differentially weighted, leading to 81% correct classification. Sensitivity was 84%; specificity was 78%. The corresponding values under cross-validation were less impressive: 71% overall accuracy, 79% sensitivity, and 61% specificity. Next, the analysis started with no items included and was allowed to proceed by adding items one at a time to maximize diagnostic accuracy. Maximal accuracy (75%, with 75% sensitivity and 74% specificity) was obtained with seven items. In the cross-validation subsample, overall accuracy shrank (70%), as did specificity (58%), although sensitivity increased (80%). Lastly, the analysis started with all items included and was allowed to proceed by dropping test items one at a time to maximize diagnostic accuracy. Maximal accuracy (79%, with 82% sensitivity and 76% specificity) was obtained using 11 items (seven of which had been included in the preceding analysis). During cross-validation these figures shrank to 70%, 81%, and 56%. Comment: The ALDS is second in user-friendliness to the Selección Inicial. It does, however, require a series of score conversions that could easily lead to mistakes in the hands of under-trained, over-worked, or careless administrators. On the other hand it is even more likely that administration and or scoring problems would appear with either the NEUROPSI or the Cooper (discussed next). Aside from the aforementioned problems with reliability, the most noteworthy psychometric problem with

27
the Spanish version of the ALDS is its very low sensitivity when using the specified cut-off scores. Clearly the cut-off scores need to be adjusted for the population under present study, but even then it was not possible to obtain diagnostic accuracy rates over 70%. The established scoring system for the ALDS does weight the item clusters differentially, but those weights are evidently not optimal in the current target population. An additional problem for the Spanish ALDS is the irrelevance of several items to Spanish-speakers in the U.S. For example, several items on the Self-Rating Scales (Part 1) ask about ease of reading medicine labels and household bills; given that these are presented almost exclusively in English in the U.S., a Spanish speaker with limited English skills answering the items honestly would respond in a way that makes him/her appear learning disabled. The ALDS still has a great deal of promise. If some of the remaining issues of item translation and content are addressed, and a new scoring system is developed, the ALDS may be a suitable Spanish language screen.15
15 A scoring system that uses both Part 1 and Part 2 scores conjointly appears to provide the best combination of sensitivity and specificity, although the analyses in this section clearly suggest that it is possible to maximize sensitivity (if that is considered paramount) without too much of an adverse effect on specificity by selecting and using a small number of ALDS items. Maximal specificity (if that is considered paramount) obtains with the original scoring system, although this procedure tends to compromise sensitivity.

28
IV. Screening Test Candidate #4: Investigación de Cooper para Procesar Información (Cooper Screening of Information Processing) In our sample, the mean (SD) score was 24.9 (23.9). Of the 650 participants who for whom total scores were available, only 10 scored above 75. In fact, the modal (most common) score was 0, obtained by 89 participants. Among diagnostic subgroups, the mean (SD) score for those with LD was 10.5 (4.9), for those with MR/MIF it was 12.5 (5.7), for those with both LD and MR/MIF it was 13.8 (4.6), and for those with no diagnosis it was 8.1 (4.9). Obviously, the more serious the disability, the higher the obtained score tends to be, but no group’s mean even came close to approaching, let alone surpassing, the pre-established cut-off of 75. This suggests problems in Cooper’s scoring system. Reliability: The internal consistency (Cronbach’s � ) of the Cooper items was .86, which is more than acceptable for a test of this type. Regardless of what the total score actually means, the various items generally appear to be measuring something in common. Validity: To see if the screen could distinguish between those with learning needs (LN) and those without (No Dx), a cut-off score of 22 was chosen. The percentage of cases scoring below (43%) and above (57%) this cut-off score provided the best match for the percentages of cases in the No Dx (43%) and LN (57%) groups. The Table below shows the diagnostic accuracy obtained when using this cutoff score. Cell entries are percentages of the total number of cases in the analysis.
Cooper Predicted Diagnosis Does not have
LN (≤22) Has LN (>23)
Row totals
Diagnostic
No Dx 19 24 43
Impression LN
37 20 57
Column totals 56 44 100 This test has an overall diagnostic accuracy rate of 39% in this sample, a sensitivity of 35%, and a specificity of 44%. (Incidentally, had Cooper’s recommended cut score of 75 been employed, the overall accuracy rate would have been 58%, with a sensitivity of 1% and specificity of 99%. This situation is very similar to the aforementioned example given in Section II, in which the test is abandoned altogether and a blind guess is made that all persons have LN; in this case the guess would lead to correct classification 57% of the time, with 0% sensitivity and 100% specificity, essentially identical to what would be obtained using Cooper’s test with his established cut-off.) Interestingly, however, the Cooper fared better in regression analyses. In the first logistic regression, allowing the subsection scores from the Cooper to be differentially weighted, simultaneous inclusion of all subsection scores led to a 73% diagnostic accuracy rate, with 77% sensitivity and 67% specificity in the first subsample. On cross-validation these values changed to 75% accuracy, 80% sensitivity, and 69% specificity.
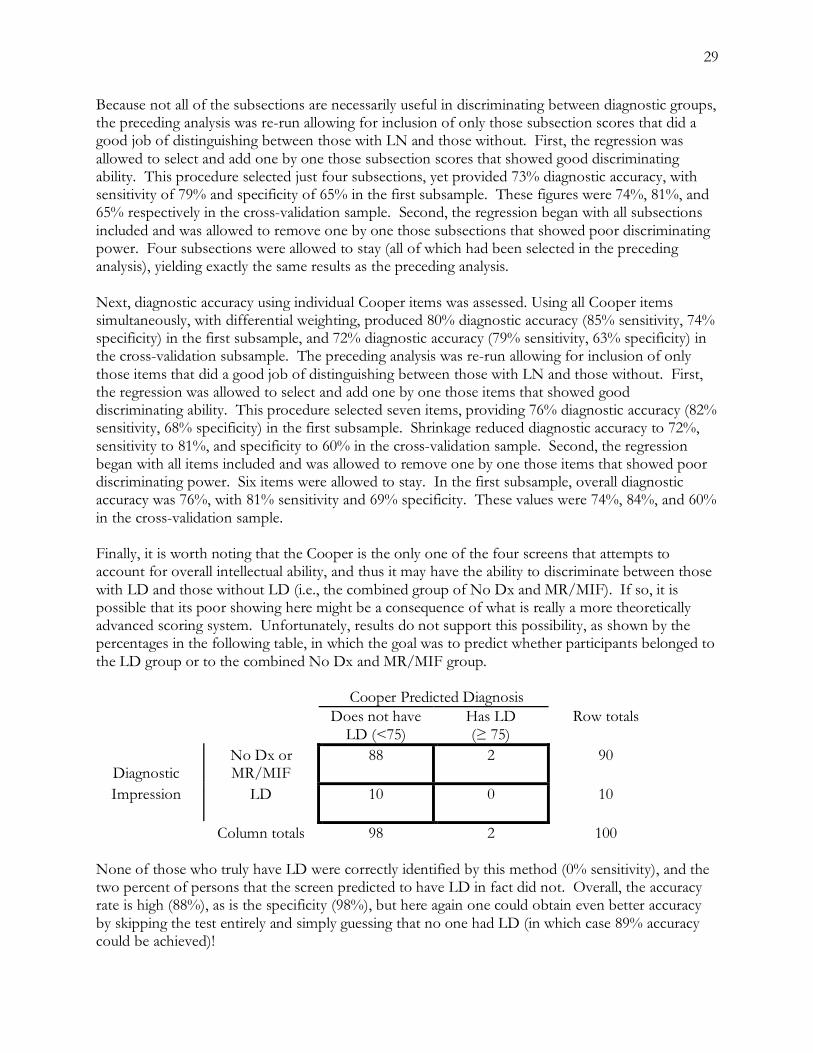
29
Because not all of the subsections are necessarily useful in discriminating between diagnostic groups, the preceding analysis was re-run allowing for inclusion of only those subsection scores that did a good job of distinguishing between those with LN and those without. First, the regression was allowed to select and add one by one those subsection scores that showed good discriminating ability. This procedure selected just four subsections, yet provided 73% diagnostic accuracy, with sensitivity of 79% and specificity of 65% in the first subsample. These figures were 74%, 81%, and 65% respectively in the cross-validation sample. Second, the regression began with all subsections included and was allowed to remove one by one those subsections that showed poor discriminating power. Four subsections were allowed to stay (all of which had been selected in the preceding analysis), yielding exactly the same results as the preceding analysis. Next, diagnostic accuracy using individual Cooper items was assessed. Using all Cooper items simultaneously, with differential weighting, produced 80% diagnostic accuracy (85% sensitivity, 74% specificity) in the first subsample, and 72% diagnostic accuracy (79% sensitivity, 63% specificity) in the cross-validation subsample. The preceding analysis was re-run allowing for inclusion of only those items that did a good job of distinguishing between those with LN and those without. First, the regression was allowed to select and add one by one those items that showed good discriminating ability. This procedure selected seven items, providing 76% diagnostic accuracy (82% sensitivity, 68% specificity) in the first subsample. Shrinkage reduced diagnostic accuracy to 72%, sensitivity to 81%, and specificity to 60% in the cross-validation sample. Second, the regression began with all items included and was allowed to remove one by one those items that showed poor discriminating power. Six items were allowed to stay. In the first subsample, overall diagnostic accuracy was 76%, with 81% sensitivity and 69% specificity. These values were 74%, 84%, and 60% in the cross-validation sample. Finally, it is worth noting that the Cooper is the only one of the four screens that attempts to account for overall intellectual ability, and thus it may have the ability to discriminate between those with LD and those without LD (i.e., the combined group of No Dx and MR/MIF). If so, it is possible that its poor showing here might be a consequence of what is really a more theoretically advanced scoring system. Unfortunately, results do not support this possibility, as shown by the percentages in the following table, in which the goal was to predict whether participants belonged to the LD group or to the combined No Dx and MR/MIF group.
Cooper Predicted Diagnosis Does not have
LD (<75) Has LD (≥ 75)
Row totals
Diagnostic
No Dx or MR/MIF
88 2 90
Impression LD
10 0 10
Column totals 98 2 100 None of those who truly have LD were correctly identified by this method (0% sensitivity), and the two percent of persons that the screen predicted to have LD in fact did not. Overall, the accuracy rate is high (88%), as is the specificity (98%), but here again one could obtain even better accuracy by skipping the test entirely and simply guessing that no one had LD (in which case 89% accuracy could be achieved)!

30
Comment: The Cooper is, along with the NEUROPSI, the screen that requires the most training and practice in administration before users can competently put it to use. Moreover, its general structure and format is somewhat confusing and invites myriad recording and scoring errors, increasing the need for intensive training and ongoing supervision of examiners. It has adequate reliability, but present data suggest that as a standalone test, using raw scores and a simple cut-off point, it lacks validity as an indicator of either LD or LN in the target population.16 Like the NEUROPSI, however, several of its items appear promising as discriminators between LN and No Dx groups. Indeed, when the items were allowed to be scored using alternate scoring systems, the test appeared extremely promising. However, in spite of the Cooper items’ potential for accurate identification of persons with LN, many of these items must be scored by examiners, a time-consuming process that probably can not be done by front-line social service personnel with the necessary level of accuracy, unless they have extensive training and practice in administering this screen. For example, the Cooper requires examinees to rhyme certain words, and different examiners subjectively evaluating responses may come to different conclusions about whether or not examinees have difficulty rhyming. Similar inter-examiner problems may crop up when evaluating the quality of examinees’ writing.
16 The curious failure of so many obviously disabled participants to obtain scores above Cooper’s recommended cut-off score of 75 certainly suggests something is amiss. The scoring system used in this study is evidently the correct one (D. Mellard, personal communication, July 2002), and the Mellard et al. (2004) report on a subset of the present data described a similar situation, although it is tempting to wonder if some modification to Cooper’s scoring system associated with the shortening of his screen for this study was overlooked when the study was designed.

31
V. Identification and Evaluation of Items for a Composite Test (Empire State Screen) Each of the four candidate screens has strengths and weaknesses, and none stands head and shoulders above the others. More critically, none provides the level of diagnostic accuracy expected in a test to be used in making real-life decisions about individuals. For this reason, it was clearly advisable to use the data collected for this project to explore the creation of a fifth screen, a composite test made up of items selected on the basis of their diagnostic utility from among the four candidate tests, each of which appeared to have at least some items or subscales that did a good job in discriminating between persons with learning needs and those without. Selection of items for the composite was based on both rational and empirical criteria, with the following desiderata: 1. the composite should be brief, in the interests of efficiency of administration 2. the composite should be user-friendly, in the interests of standardization of administration 3. the composite should not require any physical testing materials beyond the paper and pencil
questionnaire form, in the interests of containing costs associated with production of, and training in use of, said materials
4. the composite should provide better diagnostic accuracy than any of the four candidate screens
To minimize the potential for administration or clerical/scoring errors, therefore, no items were considered if they required the use of additional materials (e.g., as test stimuli) or required any coding, quantification, or evaluation of participant responses by the examiner. The pool of potential test items consisted of those that used a simple “true/false” or “yes/no” closed-ended dichotomous response format. The advantage of restricting the item pool in this way is that the resulting screen can be easily administered and scored by minimally trained personnel with no background in psychological assessment. The disadvantage is that such restriction likely will mean that certain diagnostically useful items are not considered, leaving the screen less accurate than it might ultimately have been. This tradeoff is considered necessary, though, because of the enormous time and cost commitment inherent in training social service personnel in the proper use of a more complicated device. One obvious approach to creating a composite screen would be to select by inspection (e.g., using information in appendices A-D) the best items from among the screens, and package them together as the composite. Despite its intuitive plausibility and appeal, this approach – no matter which set of items was chosen by eyeball – failed to yield a screen that was even as successful as any of the four candidate screens. A different tack was then tried. Logistic regression analysis was performed using all dichotomous individual test items from the four candidate screens. The analysis began with a blank slate – no items – and was set up to allow items to be added one by one until no further improvements in diagnostic accuracy could be achieved. As before, the sample was split in two so that the results from the first subgroup could be applied to the second in a cross-validation. A composite test consisting of 11 items was constructed that provided the results shown below (values are percentages).
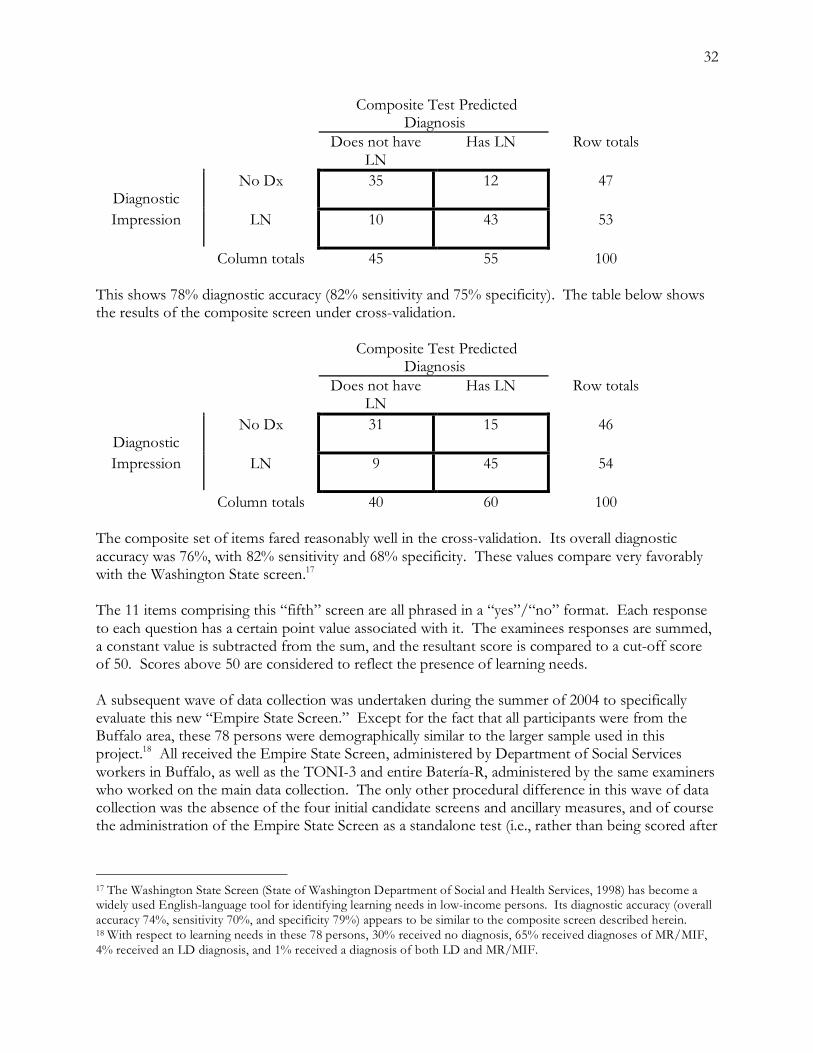
32
Composite Test Predicted Diagnosis
Does not have LN
Has LN
Row totals
Diagnostic
No Dx 35 12 47
Impression LN
10 43 53
Column totals 45 55 100 This shows 78% diagnostic accuracy (82% sensitivity and 75% specificity). The table below shows the results of the composite screen under cross-validation.
Composite Test Predicted Diagnosis
Does not have LN
Has LN
Row totals
Diagnostic
No Dx 31 15 46
Impression LN
9 45 54
Column totals 40 60 100 The composite set of items fared reasonably well in the cross-validation. Its overall diagnostic accuracy was 76%, with 82% sensitivity and 68% specificity. These values compare very favorably with the Washington State screen.17 The 11 items comprising this “fifth” screen are all phrased in a “yes”/“no” format. Each response to each question has a certain point value associated with it. The examinees responses are summed, a constant value is subtracted from the sum, and the resultant score is compared to a cut-off score of 50. Scores above 50 are considered to reflect the presence of learning needs. A subsequent wave of data collection was undertaken during the summer of 2004 to specifically evaluate this new “Empire State Screen.” Except for the fact that all participants were from the Buffalo area, these 78 persons were demographically similar to the larger sample used in this project.18 All received the Empire State Screen, administered by Department of Social Services workers in Buffalo, as well as the TONI-3 and entire Batería-R, administered by the same examiners who worked on the main data collection. The only other procedural difference in this wave of data collection was the absence of the four initial candidate screens and ancillary measures, and of course the administration of the Empire State Screen as a standalone test (i.e., rather than being scored after
17 The Washington State Screen (State of Washington Department of Social and Health Services, 1998) has become a widely used English-language tool for identifying learning needs in low-income persons. Its diagnostic accuracy (overall accuracy 74%, sensitivity 70%, and specificity 79%) appears to be similar to the composite screen described herein. 18 With respect to learning needs in these 78 persons, 30% received no diagnosis, 65% received diagnoses of MR/MIF, 4% received an LD diagnosis, and 1% received a diagnosis of both LD and MR/MIF.

33
the fact by extracting items responses from the four initial candidate screens). The table below shows the accuracy of this new screen (table values expressed in percentages).
Empire State Screen Predicted Diagnosis
Does not have LN
Has LN
Row totals
Diagnostic
No Dx 24 5 29
Impression LN
12 59 71
Column totals 36 64 100 This screen predicted the correct diagnosis 83% of the time, with equivalent sensitivity (83%) and specificity (84%). Comment: Considering the limitations imposed on the content of the composite, this set of items would appear to provide a user-friendly, cost-effective tool whose psychometrics are at least as good as those of any of the four candidate screens (even allowing for modifications to those screens) or the Washington State Screen. Moreover, during the second wave of data collection, in which the Empire State Screen was for the first time administered as a standalone test by social service workers, it performed at an even higher level of diagnostic accuracy. However, as discussed further in subsequent sections, the creation of a composite screen such as this must be seen as the beginning, not the end, of the test’s development process. Moreover, there are other issues pertinent to the creation of a test via these methods that need to be addressed (see discussion below). A copy of the Empire State Screen using the identified items and score weightings, is shown in Appendix E.

34
Qualitative perspectives on the project19 Since the implementation of the Personal Responsibility and Work Opportunity Reconciliation Act, researchers, social policy analysts, and TANF program administrators have focused increased attention on individual obstacles that have proved to be an impediment for many clients who are attempting to make the transition from welfare to work. In response, discussion has turned to three common issues that are no doubt often barriers to employment: Issues such as mental health, chronic substance abuse and physical limitations/disabilities are no doubt paramount in the development of program strategies in moving the client from welfare to meaningful employment. Many other disabilities are not overt, such as blindness or deafness, but may include disabilities such as addictive disorders, mental illness, learning disabilities, and mental retardation. More recently, the issue of learning disabilities has been highlighted by representatives from the federal government as well as by agencies in a number of states. According to recent data provided by the U.S. Department of Labor, perhaps 50-80% of adults with severe literacy problems possess undetected or untreated learning disabilities. Moreover, it is suspected that an overwhelming percentage of TANF recipients may possess a learning disability in comparison to the general population. Accordingly, such covert disabilities are not often found to be well understood by welfare to work or other vocational/job training policies and programs. Toward this end, the identification of disabling conditions and subsequent referral to service agencies have focused for the most part on the most obvious physical disabilities or issues arising from a client request for exemption from work requirements. Pilot project experiences point to the challenges of uncovering “hidden” disabilities that may have been interfering with a client’s participation in welfare to work programs, employment or other human service programs. Suffice it to say, the consequences of not properly identifying and addressing learning disabilities can certainly be felt by every major institution in our country. With respect to adults, businesses are affected because the pool of trained and skilled workers will be diminished. Likewise, the criminal justice system is affected because of the high number of adults in the system who were never properly diagnosed and treated for learning disabilities when they were children. Therefore, it is perhaps incumbent upon policy strategists, researchers, and social service program administrators to address these issues in order to forge ahead with establishing comprehensive programs, training and services. Project funding was provided through federal grants; specifically funds aimed at Welfare-to-Work and Workforce programs. The New York State Department of Labor in partnership with the State Education Department’s Office of Vocational Educational Services for Individuals with Disabilities and SUNY (UCAWD) implemented the LD pilot project in an effort to establish a process by which clients are screened, diagnosed and provided related accommodations. The overall objective was to facilitate client participation in work activities or transition to meaningful employment. Spanish Language Project The following summarizes a brief overview of the data collected relative to the Spanish Language Pilot. The LD Screening Study for Spanish-speaking adults was initiated as a national effort to evaluate the accuracy of four selected instruments for the purpose of screening a LD among Spanish speaking adults. One of the primary objectives of the project was to participate in the gathering of
19 This section was kindly contributed in its entirety by the Learning Disabilities Association of WNY, Inc. -DA

35
the data for the eventual validation of a selected screening tool. In addition, the collected information would be useful in identifying individuals likely to have a disability who would benefit from a referral for a full diagnostic evaluation. The effort would ideally result in establishing eligibility procedures for education and other services directed toward adults identified as possessing a LD. Toward this end, Spanish-speaking adults who participated in the study completed a variety of tests that investigated cognitive abilities, achievement, learning skills, and language skills. Our involvement in the project reveals that particular education vocation and other service needs are not currently being met in New York State’s growing Latino population. Administration of the four screens under study together with a comprehensive neuropsychological evaluation was completed at Buffalo General Hospital.20 The client/participant usually spent between 5 to 6 hours with the Diagnostic Technician. All participants were provided an opportunity individually and confidentially to review their results with the neuropsychologist at a separate appointment. Any individual who was identified as LD or MR received an individual service plan developed with specific recommendations relative to employment and vocational training. The service plan was also useful in identifying possible barriers and methods of rehabilitation in order for individuals to become self-sufficient. Individuals were referred for services such as supported employment programs such as VESID. In addition, assistance was provided in facilitating reasonable accommodations in order to pursue other educational opportunities or complete the GED exam. For those participants identified as LD or MR, time-limited case management services were facilitated by trained “Service Navigators.” These helping professionals provided guidance through linkage and referral to appropriate community services in order to provide ongoing support to the consumer. Specifically, Service Navigators assisted clients in making and following up with various appointments as well as serving as interpreters and advocates as they guided the consumer through the maze of various social service and other public agencies. It became our primary objective that these referrals of participants to the project would satisfy welfare-to-work requirements and thus be integrated as part of the individual’s service plan to return to the workforce. In addition to the “hard” data gleaned for the eventual goal of developing a reliable LD screen for Spanish-speaking adults, project findings yield viable, if not tangible information that will no doubt be useful in developing, or perhaps, enhancing services to the Latino population. Given that the data collected in Erie and Monroe Counties provide more than half of the total number of data sets, a particular caveat is offered in making general assumptions that may or may not apply to other Latino communities in North American cities. Specifically, results from the collected data reveal particular variables across the board that merit attention and discussion. According to the 2000 census statistics, approximately 32,000 Erie County residents are of Latino descent. For the purposes of this study, the subject sample was drawn from the TANF 200% population of adults between the ages of 18 and 65. Sixty-six percent of the subject sample was drawn from Erie County Department of Social Services – Comprehensive Employment Division. An additional 34% of those participating in the study were directly referred to the project either by way of self-referral or referral from other social service/mental health agency providing direct services to the Latino community.
20 This matches the procedures followed in Monroe County (Rochester) except that testing venues varied, based on what was convenient for the participant. See Procedures section. -DA

36
At the outset, a glance at the data reveals that there is a significant percentage of participants diagnosed with mild mental retardation (MIF). In Erie County, 385 diagnostic tests were completed. Of that number, 23% of individuals tested were diagnosed as mentally retarded/MIF while 7% received a diagnosis of LD. It is noteworthy to point out that in Monroe County, of the 161 data sets completed, 2% received a diagnosis of MIF while 20% were diagnosed as LD. One explanation for the disparity of these outcomes may be the pool of individuals comprising the subject sample. As aforementioned, in Erie County, a majority of participants were TANF recipients who had little to no success in previously assigned employment/vocational activities. In addition, many of those diagnosed as mild MR were directly referred to the study by either a mental health professional or other family member who felt that the individual could benefit from services. It is without question that there is a significant gap in services for Spanish-speaking adults who are mildly MR. Other variables such as mental health problems (i.e., mood disorders such as depression), instability within families, as well as difficulties in navigating public systems all stand in the way of providing ongoing services to this population. Ostensibly, the data for Monroe County reveal a higher functioning community that is consistent with the general population in terms of LD diagnoses. However, in comparing these findings with those of Erie County, it is essential to point out that the pool of participants in the Rochester region were drawn more from vocational/adult education programs where the individual possessed some modicum of success. Concurrent with these findings, the Erie County data reveal that those individuals diagnosed as LD also were referred to the project from similar vocational/adult education programs as well. The upshot of the results gleaned from the project provides additional insight on two important issues: There is no doubt a significant gap in services aimed at integrating Spanish-speaking adults into appropriate vocational/rehabilitative programming. There were many instances where Spanish-speaking adults were immediately referred to ESL programs where they became increasingly frustrated at their lack of progress in mastering even basic English. Likewise, others were referred to various work activities that did not provide any support or assistance in helping them transition to the workplace. In later discussions with local DSS employment counselors and supervisors, a concern emerged relative to assessing Spanish-speaking adults for appropriate work-readiness activities. Specifically, employment interviews are too often facilitated by an accompanying family member who serves as a translator for the client. As such, the employment counselor is unable to fully engage with the client and render an appropriate assessment of the individual’s strengths and challenges in developing a comprehensive employment plan. All too often, adults are placed in a variety of settings that are not appropriate to their abilities. As a result, they shuffle from activity to activity with little to no success; many end up with a variety of sanctions resulting in even more instability and strife that serve as further impediments to employment. The other issue arising from project findings also involves provision of ongoing services that address other obstacles to employment. The data from Erie County alone reveal that at least 25% reported a secondary diagnosis of mental health problems such as depression and other mood disorders. In addition, clinical interviews with participants placed emphasis on other barriers to employment such as chronic health issues, traumatic events such as sexual/physical abuse in addition to instability within the family. In point of fact, many of the women participating in the study revealed that they were overwhelmed by personal issues such as domestic violence, behaviorally-challenged children and severely fragmented family systems. Many were clinically depressed and, therefore, unable to mobilize themselves toward independence from public assistance programs. The prognosis for success in any type of vocational/educational placement is

37
questionable at best for many of these adults. Accordingly, Spanish-speaking adults identified as learning disabled who received case management services were able to identify individual barriers to employment. They were then able to work through such obstacles by way of a goal-directed service plan initiated by a Service Navigator, who provided case intensive services that highlight individual strengths and potential. Toward this end, project findings for this population are consistent with studies conducted with the general LD population: Intensive case management services consistently promote the individual to reach toward positive outcomes. That is, those individuals who made use of services placed at their fingertips were more likely to participate in job-readiness activities that resulted in meaningful employment. Originally, the project embraced a short-term case management model. Yet clearly and without surprise, those individuals who were followed closely by staff and received extended services achieved optimal results. The Spanish Language Project provides us with valuable insight into what service needs are not being met within the Latino community, the largest single growing minority community in the United States. Outside the metropolitan New York City area, there is a paucity of bilingual social service caseworkers not to mention other human service caseworkers and counselors. To provide quality and effective services, such services should begin “where the client is at,” right down to dominant language spoken. In conclusion, knowledge of the target community being served is essential. Bilingual/bicultural staff are the thoroughfare for effective outreach, rapport, and linkage. With this, individuals are more likely to be receptive to work opportunities and other services. Prospects for the future of this type of intervention with Spanish-speaking adults are suggested by the outcomes of a similar English language project, detailed below. English Language Project The English Language Pilot was initiated in March 2002. The majority of those tested were referred directly from Erie County Department of Social Services – Comprehensive Employment Division. TANF recipients were screened during scheduled interviews with employment counselors. The Washington State Adult Learning Disabilities screen was the instrument selected for this project. Of the 243 evaluations completed, 80% received a diagnosis of LD or mild MR. A total of 61% of the 194 individuals with a primary diagnosis also possessed a secondary condition such as attention deficit disorder, clinical depression or some other type of mood disorder. It is noteworthy to point out that 93% of those tested possessed some combination of a primary diagnosis and/or secondary condition. As with the Spanish Language Project, project findings reveal similar insight into other impediments to finding and maintaining employment that go beyond an LD diagnosis. As a result of the project, 88 individuals were referred to VESID. Fifty percent of those referrals resulted in 44 individuals who followed through with the orientation process. Fifty percent of those, or 22 individuals, actually enrolled for VESID services. At this juncture, 18 of those enrolled with VESID were later referred to LDA Vocational program (3 are pending referral to the same program). Currently, eight of these consumers have found and maintained employment. According to ECDSS, 16 individuals were referred to Project Lives while 102 TANF clients were referred to Legal Advocacy for the Disabled for further referral to SSI/SSD. A further look at these data reveal similar findings; to wit, many long-term TANF recipients had multiple vocational/educational placements where they often realized little to no success. The rate of attrition in most of these programs is not surprisingly high given other presenting variables that impede success. Specifically, many participants reported limited educational success in addition to
38
other social/economical barriers that prematurely foreclosed on realizing educational or vocational potential. Many of the women interviewed became mothers during adolescence and, therefore, dropped out of high school. As they transition to the workplace, they are unprepared for even the most basic of jobs. Most of these women are overwhelmed by their lives as primary caretakers in a community where resources and jobs are scarce. Many of the jobs they would qualify for do not offer family-friendly hours that allow a single parent to be at home when school-aged children arrive from school. Notwithstanding, many of those who completed the diagnostic evaluation were presented with an array of services that would facilitate integration into the workplace. Although many of those diagnosed as learning disabled did not follow through with services offered at the time, they were provided an opportunity to establish a path that would allow them to reach the eventual goal of employment and self-sufficiency. However, the significant rate of attrition also points to the need for services to be swift, intensive, solution-oriented and user friendly. That is, welfare-to-work programs that screen and assess for LD/MR can only serve in establishing a realistic employment plan that calls on client participation and self-direction. Suffice it to say, the process of assessment and further diagnostic evaluation encourages the client to self-reflect on his/her own strengths while addressing barriers to employment. The client is, thus, valued and is then able to become a partner in selecting employment/educational activities that will lead to successful outcomes. Unfortunately, however, we must not ignore the sector of long-term TANF clients who, for a multitude of reasons, are unable to find and maintain employment. Separate clinical histories with each client demonstrate a significant number of possessing moderate to almost incapacitating mental or physical health issues. Many clients reported past trauma such as sexual/physical abuse; many transitioned from foster care or other out-of-home placements to public assistance. The instability in their lives is too often chronic and without immediate recourse. The prognosis for these individuals is guarded at best; however, many expressed the desire to become self-sufficient. Suffice it to say, clients who demonstrated some level of resiliency were those that engage in services that provided individual attention and direction.

39
Summary, Discussion, Conclusions, and Recommendations
I. Review of Diagnostic Accuracy of 4 Screening Tests plus Composite None of the four candidate screens stood head-and-shoulders above the rest. With the exception of the ALDS, all of the screens appeared to be acceptably reliable (at least in terms of internal consistency). Criterion-related validity was assessed in terms of the screens’ ability to predict the presence or absence of learning needs (LN) defined as learning disability, mental retardation, and or marginal intellectual function. As summarized in the following table, the criterion-related validity was roughly similar for the four screens, with the sample composite screen outperforming all of them by a small margin. As shown below, when the composite (AKA Empire State Screen) was later administered by itself as a standalone test, it achieved both >80% overall diagnostic accuracy and >80% specificity. The latter suggests that, compared to the other screens, it will lead to fewer needless testing referrals of persons who do not in fact have need for referral; this implies significant cost savings. Test Optimal Diagnostic Accuracy Rates Overall Accuracy Sensitivity Specificity Selección Inicial* 68 71 63 NEUROPSI** 75 77 73 ALDS† 71 71 71 Cooper†† 74 84 60 Empire State Screen‡ 76 82 68 Empire State Screen‡‡ 83 83 84 Notes: * obtained under cross-validation using differential weighting of selected Selección Inicial items ** obtained under cross-validation using differential weighting of all NEUROPSI items † obtained under cross-validation using differential weighting of both Part 1 & Part 2 scores †† obtained under cross-validation using differential weighting of selected Cooper items ‡ obtained under cross validation using differential weighting of selected items from other screens ‡‡ obtained during second wave of data collection, as a standalone test To put these percentages in context, for tests used to make decisions about people’s lives, it would be highly desirable to have better than 80% diagnostic accuracy, and some diagnostic tests top 90%. Screening tests are often “quick ‘n’ dirty” devices, and typically fare less well than lengthier, professionally administered tests. So, while none of the initial four screens is quite up to snuff, neither are any of them dreadful – at least when alterations to their scoring systems are allowed. Note then that for three of the four candidate screens (the exception being the Selección Inicial), maximal accuracy was indeed obtained when some significant departure from standard scoring was made. A test used for the purpose of classifying participants into groups (e.g., distinguishing between those with LN and those without) is optimally effective to the extent that the groups respond differently to the items comprising that test. That is, an ideal test contains items that are responded to one way

40
by the first group, and another way by the second group. For example, it would be desirable for those with LN to unanimously respond affirmatively to some test item (such as “I have trouble adding numbers in my head”) while those without LN unanimously respond in the negative to that item. Such items are useful for predicting the diagnosis of someone whose LN status is unknown, as would be the intended purpose of the screen. However, the usefulness of test items decreases when participants in the different groups tend to respond in similar ways to those items. Using the above example, as more participants without LN join those with LN in responding affirmatively to the item, the false positive rate goes up (i.e., specificity decreases). Alternatively, as more participants with LN join those without LN in responding negatively to the item, the false negative rate goes up (i.e., sensitivity decreases). There were relatively few individual test items from the four screens that possessed both high sensitivity and high specificity, and fewer still that were able to demonstrate these characteristics in both the construction subsample and the cross-validation subsample. Many items from the four screens showed neither sensitivity nor specificity, and others possessed either a combination of high sensitivity and low specificity (i.e., high false positive rate) or the equally problematic combination of low sensitivity (i.e., high false negative rate) and high specificity. It is difficult to know the precise reasons for this, but it seems reasonable to speculate that characteristics of this participant sample (e.g., demographics, educational histories, cultural experiences, etc.) led both LN and non-LN groups to tend to respond similarly to many of the items from the four screens. Presumably these characteristics, whatever they are, would operate throughout the target population and limit the usefulness of the vast majority of test items. Furthermore, as the results indicated, summary scores derived from the four screens also tended to suffer similarly from low overall accuracy, low sensitivity, and/or low specificity. Because of these shortcomings, efforts were directed toward the development of a composite screen that would possess a higher level of overall diagnostic accuracy without sacrificing either sensitivity or specificity. Initial attempts to create such a composite using the best individual items from the four screens failed to yield a psychometrically stronger screen than any of the original four. This seems counterintuitive, yet combining a number of strong items – if their strengths overlap and the items’ usefulness is therefore redundant – may yield an inadequate test. An analogy drawn from team sports may be apropos. A team made up of individual star players may look unbeatable on paper, but if those players do not perform well as a unit, perhaps due to redundant strengths, the team will not be successful. As an extreme example, consider how (un)successful a baseball team made up of (only) the league’s nine best pitchers would be. On the other hand, a group of players with lesser, or less redundant, skills can achieve greater success, even if no individual is a star, if they happen to play well together as a team. The trick, then, as any experienced coach knows, is to find the proper combinations of players whose unique characteristics complement, and bring out the best in, one another. Rather than simply acquiring the best players possible, it is necessary to find the right players. That parallels the philosophy underlying the use of regression analyses to construct the composite screen. The regression allows for the completely objective identification of a set of items that, by weighting each item according to its usefulness in conjunction with the other items, offers maximal diagnostic accuracy. The procedure selects the set of items that collectively offer the best predictive power, even if some of the items either did not look psychometrically strong individually or do not have the surface appearance of being strong (or even, for that matter, relevant). The resulting composite screen, therefore, was created according to strictly empirical procedures. The data used in the generation of the composite screen were gathered using objective data

41
collection methods (i.e., participant self-report), without examiners making any subjective interpretations about the participants’ true intentions or capabilities. Moreover, the regression analyses were blindly objective, and appear to have included items that help to discriminate between LN and no-LN groups even though some participants may have been deliberately dissimulating. Therefore, the effectiveness of this screen in real world use will probably depend heavily on the use of similar data collection methods. It is important that persons using this screen allow clients to answer the items freely, without making any attempt to help, bias, or influence in any way the clients’ natural response tendencies, and without making any attempt to reinterpret client responses or write down different responses based on their personal “knowledge” of the client. Two potentially significant limitations of this approach must be noted. First, the items used to create the composite screen were embedded within the four candidate screens, and so the data derived from these items were not collected in a vacuum. It is unknowable whether, or how, participants’ responses to these items may have been influenced by earlier items (that were not included in the composite and therefore can no longer exert their peculiar influence). One very real possibility is that having already answered a great many questions about personal, intellectual, and academic matters, participants responded to the items that would eventually comprise the composite in a more candid and frank manner than they would respond to them in the more limited context of being administered the composite screen by itself. As a specific example, one item on the composite inquires about problems with dividing numbers. Originally, this item (from the ALDS) was immediately preceded by various items addressing general academic and specific arithmetic problems, and in a larger sense was preceded by numerous instances of self-disclosure. This may have set the stage for participants to be forthcoming on this item, a situation that simply cannot exist when a brief screen is administered out of the blue to a participant. For this reason, it would be unwise to administer the screen to a rank stranger, and in fact it seems imperative that the screen be used only in circumstances in which the administrator has already developed rapport with the client, and has the client’s trust and confidence. The second potential limitation of this approach is more methodological, and derives from the possibility that the two subsamples used in the creation and cross-validation of the composite screen are more similar to each other than either is to the population on which the screen will ultimately be used. As noted previously, the participants in this project are not a random sample of low-income Spanish-speaking adults living in the U.S. (or even New York State), and because of that there is a danger that they are not representative of the population of low-income Spanish-speaking adults living in New York State (much less the entire U.S.). Recall that during cross-validation, shrinkage occurs when items that initially looked promising during the creation of the test turn out to be less than stellar in the cross-validation sample; this happens because those unique or quirky characteristics of the members of the first subsample that made certain items appear useful are not as prominent in the cross-validation sample. Now imagine how much additional shrinkage there would be if the test were to be used with clients who were even less like either of the participant subsamples. As a (particularly gratuitous) example, suppose that 30% of participants in the first subsample, the one used for initial identification of items for the composite, were from Mexico, and for some unknown cultural reason, a particular set of test items proved to be especially useful (valid as indicators of learning needs) with these participants. This would influence the identification of items for the screen. Suppose further that, even though assignment to subsample was random, only 15% of the cross-validation subsample were from Mexico. When used with this subsample, the screen would not fare as well (i.e., shrinkage would occur) simply because this subsample contains fewer of the type of individuals for whom this screen works best. Suppose finally, that the clientele

42
in NY State who will ultimately be given this screen contains only a minuscule percentage of persons from Mexico. Clearly this screen would be even less valid in the real world than it was in either of this project’s subsamples.21 In this example the problem would be the result of demographic differences between the research participants and the real world clients, but the same type of situation could result from participant/client differences on any variable that might exert an influence on responses to test items (e.g., personality characteristics, financial and other life circumstances, acculturation issues, etc.). To a large extent, these concerns seem to be allayed by the results of the follow-up wave of data collection using the Empire State Screen. Overall, the test made the correct diagnosis 83% of the time, with equivalently strong sensitivity (83%) and specificity (84%). That these figures are stronger than those obtained from the initial participant data is particularly encouraging, considering that the screens were administered by front-line social service personnel, and suggests that this screen has potential usefulness in identifying low income Spanish speakers who would benefit from additional diagnostic evaluation. II. Practical Issues The agency selecting a screening test must bear in mind that if the diagnoses made of the participants in this study are in fact representative of base rates for LD, MR, and MIF in the target population, then (1) identification of LD in this population is probably less vital than identifying persons with “learning needs” broadly defined in terms of substandard functioning in either general cognitive or specific academic domains, inasmuch as all persons so described will likely experience difficulty in seeking, obtaining, and/or holding gainful employment, and (2) a great number of persons screened will be referred for full diagnostic testing, at considerable expense. Given this, a screening test must not only be accurate in its prediction, but inexpensive in its production and implementation, and it should not require costly training or monitoring of administrators. The NEUROPSI, for example, although in many ways a fine test, is not a good candidate at a practical level as a standalone LN screen because it contains copyrighted testing materials (e.g., spiral bound cardstock test stimuli) that must be procured from the test publisher (or at least reproduced in mass quantity under permission from the publisher). It also has the added practical disadvantage of being a test that should be administered by a professional psychologist, or at least by psychometricians trained by professional psychologists (as has been done in this research project). Much the same can be said for the Cooper. The Selección Inicial is exceedingly brief, can be group-administered, and requires virtually no training to administer; unfortunately it possesses the poorest diagnostic accuracy of the candidate screens. The ALDS is in some respects the best of the initial bunch, combining much of the Selección Inicial’s administration ease with relatively strong diagnostic accuracy. To achieve this, however, a new scoring/interpretation system based on the results of the regression analyses described previously will need to be devised, effectively making this a new test. In addition, even in this best-case scenario, the percentages of misses and false alarms are higher than is desirable for an instrument whose results will be used to make decisions of great
21 In all likelihood, if the present sample does not accurately represent the target population, then the inaccuracy would be one of true (i.e., population) LN prevalences being somewhat lower than the prevalence of LN in the present sample, in which case LN would be overdiagnosed by the screen, leading to an inflated false positive rate. Again, however, this is an open question that awaits careful study, but the findings from the second wave of data collection suggest that the prevalence rates of LN observed in the main data set are not necessarily inaccurate.

43
importance in people’s lives. Directly related to this, the reliabilities of many of the clusters whose scores would make up the new scoring/interpretation system are well below what is typically considered acceptable in psychological and educational testing. For various reasons, then, none of the four initial candidate screens clearly stands apart as being superior, and all of them have shortcomings that compromise their acceptability for their intended use as screens for learning needs in low-income Spanish-speaking adults in New York State. The Empire State Screen, however, seems to offer a desirable combination of high diagnostic accuracy and ease of use, and therefore stands out as the clear winner, at least in this competition. Perhaps the most significant issue concerns the representativeness of the participant sample. As noted previously, it appears that a self-selection bias might have led to a greater percentage of MR/MIF participants in this sample than would truly be present in the target population. This is important for two reasons. First, it can lead to mistaken assumptions about how common this condition is in the target population. Second, when a test is developed using non-representative participants with a disproportionately high prevalence of some condition, that test ends up diagnosing the condition at rates similar to the prevalence rates in the original participant sample. In the target population, where the prevalence of the condition is lower than in the (non-representative) sample, the test often tends to over-pathologize – it diagnoses too many unaffected persons as having the condition. For example, if the actual base rate for a condition in the overall population is 5%, then a good test should diagnose the condition in 5% of the persons to whom it is administered (assuming these persons are representative of the population). However, if the sample used to develop the test shows a 50% base rate for the condition, then this newly developed test will often end up being designed in such a way that it diagnoses ~50% of the examinees with the condition, even when it is used in the general population. As a result, a great many persons without the condition will end up with an unwarranted (false positive) diagnosis. If this test is a screening test, then individuals will be referred needlessly for full evaluation; presumably the full diagnostic evaluation will reveal the false alarm, but only at great expense. Making certain right from the beginning that the screening test identified or created in this project does not over-diagnose learning problems (especially MR/MIF) will be important.22 III. Recommendations 1. Clarify the true prevalence rates for LD and especially MR/MIF in the target population. Investigation of options for acquiring this knowledge (e.g., a large-scale externally funded epidemiological study conducted by or in collaboration with a university-based epidemiology department) should be considered – at least in the long-term, so that, for example, adjustments can be made to the screening test’s cut-off score(s) so that the percentage of examinees who test positive for the condition roughly matches the prevalence rate for that condition in the target population. 2. Begin planning for additional investigation of the Empire State Screen. Temporal stability (i.e., test-retest reliability) should be determined for the Empire State Screen when administered on repeated occasions to persons in the target population. Moreover, in this project all of the screens were administered under favorable conditions (i.e., by carefully trained examiners who spend a great deal of their time testing willing participants in quiet, non-distracting environments) that are probably unlike the real-life conditions under which the screen will be used (e.g., by minimally trained social service workers for whom this screening is at best a minor part of their daily activities,
22 Overdiagnosis on the part of the screen is clearly undesirable from a cost standpoint, but in a diagnosis and management process such as this it is, compared to underdiagnosis, conceptually the lesser of two evils.

44
testing persons who may be uninterested in – or even hostile to -- being screened, in distraction-filled environments). Although the second wave of data collection yielded promising results, ongoing evaluation of the Empire State Screen, under real-world conditions, is highly advisable. Doing so will also help to address the issue raised previously, viz. whether the screen tends to over-diagnose learning needs in the target population whose base rates for conditions like MR/MIF are lower than those in the present study sample. Policies regarding use of the screen (e.g., voluntary versus mandatory examination; voluntary versus mandatory follow-through on referrals) must be developed. 3. Related to the previous recommendation, it is recommended that plans be developed for training the end-users of the screen in its administration and scoring, as well as in making referrals for further testing. This is likely the simplest of the recommendations to implement, and its importance should not be overlooked. 4. Even with a highly accurate screen that does its job under real-world conditions, the ensuing referrals for full diagnostic assessment will be costly. It is recommended that relevant governmental agencies identify the source(s) of funds for these assessments, guidelines for the conduct of these assessments,23 as well as providers and funding of remedial services for those with identified learning needs. Moreover, careful investigation of the personal outcomes of individuals who undergo the screening/diagnostic process is warranted. An objective program evaluation is the next recommendation; obviously if those who go through the screening/assessment process don’t experience better outcomes than persons who don’t go through the process, then the process needs to be improved or eliminated.
23 Among the issues is how to provide full diagnostic workups to those clients who live in areas not served by a qualified Spanish-speaking diagnostician. As noted in the Procedures section, the unavailability of Spanish-speaking diagnosticians for this project led to the (acceptable but less than ideal) practice of having local activity coordinators administer and score the TONI-3 and Batería-R diagnostic tests, with English-speaking psychologists providing interpretations and diagnoses. For the foreseeable future, this compromise will likely be necessary across much of New York State, but should not create a significant impediment to the overall process, as long as cultural sensitivity is maintained on the part of the diagnostician. Experience with this project suggested that close cooperation between diagnostician and test administrator facilitates appropriate interpretation of test results.

45
References
Ardila, A., Ostrosky-Solís, F., & Mendoza, V. U. (2000). Learning to read is much more than learning to read: A neuropsychologically based reading program. Journal of the International Neuropsychological Society, 6, 789-801.
Ardila, A., Ostrosky-Solís, F., Roselli, M., & Gómez, C. (2000). Age related cognitive decline during normal aging: The complex effect of education. Archives of Clinical Neuropsychology, 15, 495-513.
Brown, L., Sherbenou, R. J., & Johnsen, S. (1997). Test of Nonverbal Intelligence: A language-free measure of cognitive ability (3rd ed.). Austin, TX: Pro-Ed. Cooper, R. (2000). Investigación de Cooper para Procesar Información. Bryn Mawr, PA: Learning Disabilities Resources. Dean, R. S., & Woodcock, R. W. (1999). The WJ-R and Batería-R in neuropsychological assessment: Research report number 3. Itasca, IL: Riverside Publishing. Flores-Charter, P. (1999). Selección Inicial. Unpublished manuscript, Southwestern College, Chula Vista, CA. Frary, R. B. (1996). Review of the Batería Woodcock-Muñoz-Revisida. In J. C. Impara & B. S. Plake (Eds.) The thirteenth mental meaurements yearbook (pp 82-85). Lincoln, NE: Buros Institute for Mental Measurements. Horton, A. M., Jr., Carrington, C. H., & Lewis-Jack, O. (2001). Neuropsychological assessment in a multicultural context. In L. A. Suzuki, J. G. Ponterotto, & P. J. Meller (Eds.), Handbook of multicultural assessment: Clinical, psychological, and educational applications (pp. 433-460). San Francisco: Jossey-Bass. Lintel, M. P. (1996). Review of the Batería Woodcock Psico-Educativa en Español. In J. C. Impara & B. S. Plake (Eds.) The thirteenth mental meaurements yearbook (pp 85-86). Lincoln, NE: Buros Institute for Mental Measurements. Mellard, D. (1999). Adult Learning Disabilities Screening. Perry, KS: Kaw Valley Resources, Inc. Mellard, D. (2000). Cuestionario para Saber le Deficiencia de Aprendizaje en un Adulto. Perry, KS: Kaw Valley Resources, Inc. Mellard, D. F., Edwards, L. M., Giertz, G. H., & Tata, V. (2004). Empirical analysis of four learning disabilities screening instruments for Spanish-speaking adults. Unpublished manuscript, University of Kansas. National Joint Committee on Learning Disabilities. (1994). Collective perspectives on issues affecting learning disabilities: Position papers and statements. Austin, Tx: Pro-Ed. Ostrosky-Solís, F., Ardila, A., & Rosselli, M. (1997). NEUROPSI: Evaluación Neuropsicológica Breve en Español. Manual, Instructivo y Protocolo de Aplicación [NEUROPSI: A brief neuropsychological test battery in Spanish. Manual, instructions, and application protocol]. D. F., México: Bayer de México Ostrosky-Solís, F., Ardila, A., & Rosselli, M. (1999). NEUROPSI: A brief neuropsychological test battery in Spanish with norms by age and educational level. Journal of the International Neuropsychological Society, 5, 413-433. Ostrosky-Solís, F., Ardila, A., Rosselli, M., Lopez-Arango, G., & Uriel-Mendoza, V. (1998).
Neuropsychological test performance in illiterate subjects. Archives of Clinical Neuropsychology, 13, 645-660. Padilla, A. M. (2001). Issues in culturally appropriate assessment. In L. A. Suzuki, J. G. Ponterotto, & P. J. Meller (Eds.), Handbook of multicultural assessment: Clinical, psychological, and educational applications (pp. 5-27). San Francisco: Jossey-Bass.

46
State of Washington Department of Social and Health Services. (1998). Washington State Learning Disabilities Project. Unpublished manuscript. U.S. Census Bureau. (2004). U.S. Interim Projections by Age, Sex, Race, and Hispanic Origin. Retrieved June 3, 2004 from http://www.census.gov/ipc/www/usinterimproj/ U.S. Department of Education. (2000). Learning disabilities and Spanish-speaking adults: The beginning of a process. Report on the April 10-11, 2000 conference, San Antonio, Texas. Unpublished manuscript. Woodcock, R. W., & Mather, N. (1989, 1990). WJ-R Tests of Cognitive Ability - Standard and Supplemental Batteries: Examiner’s Manual. In R. W. Woodcock & M. B. Johnson, Woodcock-Johnson Psychoeducational Battery - Revised. Itasca, IL: Riverside Publishing. Woodcock, R. W., & Muñoz-Sandoval, A. F. (1993). Woodcock-Muñoz Language Survey. Itasca, IL: Riverside Publishing. Woodcock, R. W., & Muñoz-Sandoval, A. F. (1996). Batería Woodcock-Muñoz –Revisada. Itasca, IL: Riverside Publishing. Woodcock, R. W., & Muñoz-Sandoval, A. F. (2001). The Batería-R in neuropsychological
assessment. In M. O. Pontón & J. L. León-Carrión (Eds.), Neuropsychology and the Hispanic patient: A clinical handbook (pp.137-164). Mahwah, NJ: Lawrence Erlbaum.

47
Appendix A
Initial Selection Individual Item Analysis Percent endorsing each response choice Item # Yes No Missing Hit rate Sensitivity Specificity 1 33 65 2 65 79 47 2 48 49 3 61 61 62 3 42 55 3 66 71 59 4 53 44 3 61 57 67 5 37 60 3 64 75 50 6 31 66 3 67 82 46 7 56 41 3 58 52 65 8 32 65 3 62 77 43 9 30 67 3 63 80 42 10 39 58 3 65 73 54 11 62 35 3 55 43 71 12 79 19 2 50 23 85 13 61 37 2 53 44 66 14 49 43 8 56 55 58 15 66 31 3 53 37 74 16 59 38 3 57 46 71 17 70 28 2 60 41 85 18 36 61 3 56 68 41 19 75 16 9 54 25 90 20 54 36 10 65 55 76 21 43 45 12 62 63 62 22 65 25 10 55 37 78 Note: In this and subsequent tables, hit rate, sensitivity, and specificity all refer to the ability of the screen to make the dichotomous differentiation between those with identified learning needs and those without identified learning needs.

48
Appendix B
NEUROPSI, Individual Item and Section Total Analysis
Mean score (SD) No diagnosis
group Learning need
group Hit rate
Sensitivity Specificity
Orientation 5.91 (0.326) 5.54 (0.924) 56 29 92 Attention 22.21 (3.79) 18.10 (5.69) 70 78 59 Digits Backward 3.78 (1.12) 3.08 (1.32) 62 65 57 Visual Detection 14.24 (2.78) 12.56 (4.02) 59 46 76 20 – 3 4.21 (1.39) 2.55 (2.01) 70 74 65 Encoding 14.54 (2.46) 12.72 (3.04) 66 80 49 Verbal Memory 4.86 (0.86) 4.16 (1.24) 63 54 75 Semicomplex Figure Copy
9.69 (2.27) 8.57 (2.54) 65 72 56
Language 21.76 (1.50) 20.46 (2.21) 64 71 57 Naming 7.81 (0.44) 7.50 (1.07) 54 32 85 Repetition 3.97 (0.16) 3.89 (0.41) 46 9 97 Comprehension 5.59 (0.59) 5.03 (1.12) 62 61 64 Semantic Fluency 17.07 (4.67) 14.43 (5.25) 63 54 74 Phonemic Fluency 9.07 (3.89) 6.39 (4.22) 61 52 74 Reading 2.34 (0.95) 1.62 (1.18) 65 68 60 Writing 1.62 (0.56) 1.24 (0.76) 51 57 66 Conceptual Function 7.49 (1.58) 5.58 (2.24) 71 67 78 Similarities 4.83 (0.93) 4.05 (1.53) 63 52 79 Calculation 2.17 (0.87) 1.33 (1.10) 67 57 79 Sequence 0.53 (0.55) 0.22 (0.44) 68 79 50 Motor Function 6.22 (1.58) 5.73 (2.21) 54 40 72 Changing Hand Positions
2.75 (1.16) 2.68 (1.25) 53 68 32
Alternating Movements 1.62 (0.61) 1.36 (0.71) 58 52 67 Opposing Reactions 1.85 (0.40) 1.70 (1.27) 53 29 86 Recall 22.42 (4.76) 17.92 (5.85) 68 60 78 Words (Free Recall) 4.32 (1.58) 3.16 (1.91) 66 71 59 Words (Cued Recall) 4.55 (1.62) 3.25 (1.92) 66 68 63 Words (Recognition) 5.59 (0.80) 5.14 (1.36) 56 45 72 Semicomplex Figure 7.98 (2.67) 6.38 (3.02) 63 83 36