evaluation of seismic vulnerability of reinforced...
TRANSCRIPT

Journal of Rehabilitation in Civil Engineering 5-1 (2017) 01-16
journal homepage: http://civiljournal.semnan.ac.ir/
Evaluation of Seismic Vulnerability of Reinforced
Concrete Buildings Adjacent to the Deep
Excavations
H. Fadavi1 and A. Mortezaei
2*
1. M.Sc. of Structural Engineering, Civil Engineering Department, Semnan Branch, Islamic Azad University,
Semnan, Iran
2. Associate Professor, Seismic Geotechnical and High Performance Concrete Research Centre, Civil Engineering
Department, Semnan Branch, Islamic Azad University, Semnan, Iran
Corresponding author:[email protected]
ARTICLE INFO
ABSTRACT
Article history:
Received: 24 January 2017
Accepted: 03 April 2017
In this study, the effect of deep excavation on the seismic
response of RC moment resisting building systems has been
studied. Deep excavation can cause significant changes in
the stress and strain levels of soil environment and also
changes in the propagation of seismic waves. This leads to
permanent displacements in the foundation system. In this
study, three RC building systems, i.e. 5, 10, and, 15 stories,
were modelled considering the nonlinear behaviour of soil
and structural material as well as the soil-structure
interaction effect. Nonlinear dynamic responses of buildings
were evaluated before and after excavation and also with a
rigid base (without soil modelling) under the seven
earthquake records. Analysis results indicate an increase in
seismic demands and responses in the vicinity of the
excavation. So for 15-storey buildings near the excavation,
35% increase in the base shear, 70% increase in maximum
drift, 26% increase in the story shear force, and a 30%
increase in the maximum story acceleration was observed.
As a result, considering the effect of excavation on the
seismic response of RC building systems is inevitable.
Keywords:
Deep excavation,
Seismic response,
Nonlinear dynamic analysis,
Soil-structure interaction.
1. Introduction
Rapid urban development is leading to
more and more designs of deep excavation
for construction of high-rise buildings and
subways. In the process of deep excavation,
significant changes occur in the stress and
strain levels of the soil around the excavation
site. The amount and distribution of ground
motions for an excavation depends on soil
property, excavation geometry (such as
length, width, and depth), distance between
excavation and the building, type of
supporting system as well as construction
methods. Since the soil is non-linear and
contains inelastic material, deep excavation
analysis will be a problem with the nature of
soil-structure interaction. Deep excavation

2 H. Fadavi and A. Mortezaei/ Journal of Rehabilitation in Civil Engineering 5-1 (2017) 01-16
analysis process includes the simulation of
soil behaviour, behavioural relationships of
soil and structure, and the excavation
process. Literature review in this regard
confirmed the relative development of some
simulation theories.
A study by Chungsik and Dongyeob[1] on
deep excavation because of ground surface
movement indicated that the general shape of
a ground surface settlement profile is closely
related to the source of the wall movement.
Also, the unsupported span length has a
significant influence on the magnitude and
distribution of wall and ground movement
characteristics. Maleki and Baei[2] reached
the conclusion that the stiffness of the
structure will draws the focus on the
maximum horizontal displacement in the
bottom area of wall excavation. Without
considering structural stiffness, the maximum
horizontal displacement will occur close to
the ground surface. El-Sawwaf and Nazir[3]
studied the effect of deep excavation-induced
lateral soil movements on the behaviour of
supported strip footing. The results indicated
that soil reinforcement in granular soil under
strip footing adjacent to deep excavation
does not significantly decrease. The footing
settlement, however, provides greater
stability to the footing. Reinforcement is
most effective when the footing is placed
close to the excavation and the influence of
the excavation on the footing behaviour may
be neglected once footing is located at a
distance of more than three times of footing
width from the excavation. Hsieh et al. [4]
studied the three-dimensional numerical
analysis of deep excavations with cross
walls. The study results indicated that the
maximum lateral deflection at the position of
the cross wall and the midpoint between two
cross walls were predicted to have a
reduction of 67 to 83% and 12 to 67%
respectively compared to the condition where
cross walls are absent. Abd El-Raheem[5]
indicated that during earthquakes the
maximum variation of building horizontal
displacement after channel excavation
increases by 18 to 24% which is a
considerable value. For vertical
displacement, an increase would be by 17 to
21% with respect to the model.
A study by Huang et al. [6] on deep
excavations indicated that a significant lift of
tunnel occurs when the tunnel is underlying
the excavation and the influence of the
excavation stretches sideward from the end
of the excavation would be two times the
excavation width. For both the road tunnel
and subway tunnel the influence points are
1.5 times the excavation width away from the
excavation axis. Castaldo and
DeIulii[7]investigated the effects of deep
excavation on the seismic vulnerability of
existing framed structures. They reached this
conclusion that after excavation ductility
demand, Park and Ang index values would
increase. Zahmatkesh and Choobbasti[8]
studied wall deflections and ground surface
settlements in deep excavations. The findings
of the study indicated that when the depth of
excavation was more than 60% wall length,
use of support system in order to decrease
ground surface settlement and wall deflection
is most important. According to a numerical
analysis by Dong et al. [9], wall deflection is
such that increasing wall depth increases wall
deflection and this pattern is adopted by field
data. Viswanath et al. [10] showed when the
distance between the bottom of excavation
and tunnel axis is larger than 1.5D (D: tunnel
diameter), the influence of tunnel structure
on soil movement is negligible.
According to previous research, deep
excavation can cause significant changes in
the stress and strain levels of soil
environment and also changes in the
propagation of seismic waves. This
consequently leads to permanent
displacements in the foundation system.
Therefore, considering the excavation effect
on the structural seismic response is most

H. Fadavi and A. Mortezaei/ Journal of Rehabilitation in Civil Engineering 5-1 (2017) 01-16 3
important and effective. Accordingly, this
study by emphasizing on RC buildings
evaluates this subject.
2. Methodology
2.1. Soil-Structure Modelling
Three RC frames with 5, 10, and 15
storeysare used for structural modelling. The
span and height of the frames are 5m and 3m
respectively. In the modelling of linear and
nonlinear behaviour of controlled members
by deflection the lower-band strength and
expected strength of material are used
respectively. The distance between the
buildings and excavation edge is 15m.
Excavation characteristics are 15m depth,
15m length, and 10m width. The end of the
excavation edge is assumed fixed. Properties
of concrete, soil, and rebar have been
presented in Table 1. Buildings in three
scenarios of before excavation, after
excavation, and fixed base foundation
areanalysed. Soil-structure interaction effect
is considered in the analysis.
The application of dynamic forces causes a
dynamic interaction between the structure
and soil. In the case of relatively soft soil and
stiff structure, this effect would be more
effective. When the dynamic forces of
propagated waves reach to structure, it is
excited because of wave motion in the soil.
Owing to the relative motion between the
structure and ground, structural displacement
affects active soil displacement[11]. All
regions in soil-structure interaction analysis
are divided into two parts. The first part is
named erratic area and includes the structural
model and surrounding soil area. In this area
soil behaviour is usually assumed to be
linear. The second part is named regular area
which extends from the first area to the
infinity border. Since by getting away from
the structure the stress domain is decreased
the soil behaviour is assumed linear.
Figure 1. Model of 5-story building before
and after excavation and with rigid base (no
SSI)

4 H. Fadavi and A. Mortezaei/ Journal of Rehabilitation in Civil Engineering 5-1 (2017) 01-16
Figure 2. Model of 10-story building before and after excavation and with rigid base (no
SSI)
Figure 3. Model of 15-story building before and after excavation and with rigid base (no SSI)

H. Fadavi and A. Mortezaei/ Journal of Rehabilitation in Civil Engineering 5-1 (2017) 01-16 5
Table 1. Material properties Characteristi
cs Soil Concrete Steel
Module of
elasticity
(kg/𝒎𝟐)
1.64×10⁸ 2.5×10⁹ 2×10¹⁰
Weight per
unit volume
(kg/𝒎𝟑)
1765.8 2500 7850
Poisson's
ratio
0.28 0.15 0.3
Shear module
(kg/𝒎𝟐)
64062500 ---- ----
Strength
(kg/𝒄𝒎𝟐)
---- 𝑓′c=210 fy =2350
fu =3700
fye=2580
fue=4070
Automatic hinges properties are used for
plastic hinges in the end of beams (M3) and
columns (P-M3). Since the plastic hinges in
SAP2000 programme[12]are defined as a
lumped model, so the location of plastic
hinges is approximated in 0.05L and 0.95L
(L: length of beams and columns). The Type
and property of plastic hinges are determined
based on FEMA 356 [13]. Dead and live load
in all storeys were 2000𝑘𝑔 𝑚⁄ and
500𝑘𝑔 𝑚⁄ respectively. A rigid diaphragm
based on the Iranian code of practice for
seismic resistant design of buildings [14]is
assigned to the nodes. By considering the
nonlinear behaviour for soil, a four-node
solid element is used for excavation
modelling.
2.2. Selected Ground Motions
For nonlinear dynamic analysis seven near-
fault records of earthquake ground motions
are selected, as shown in Table 2. Wavelet
analysis method, presented by Baker [15]is
used for selecting pulse-like NF ground
motions[16]. The moment magnitude of
records ranged from 6.5 to 7.4 and all of
them are associated with soil type C site
classification.
Table 2. Near-fault ground motions used in
this study PG
A
(g)
PGV
(cm/
s)
PGD
(cm)
Vs30
m/s
(SP)
Rrup
(km) MW Station Year
Earthquak
e
0.8 118 97 767
(I) 2.1 7.4 Tabas 1978 Tabas,Iran
0.4 115 40 186
(III) 0.1 6.5 EcMelol
and 1979 Imperial
Valley
0.5 45 14 462
(II) 3.9 6.9 Corralito
s 1989 Loma
Prieta
0.9 167 29 282
(III) 6.5 6.7 Rinaldi 1664 Northridge
0.7 170 45 256
(III) 1.5 6.9 Takatori 1995 Kobe,
Japan
0.4 169 215 579
(II) 0.7 7.6 Tcu052 1999 Chi Chi,
Taiwan
0.4 62 47 276
(III) 6.6 7.2 Duzce 1999 Duzce,Tur
key
Where𝑀w is moment magnitude, PGA is
peak ground acceleration, PGV is peak
ground velocity, PGD is peak ground
displacement,𝑅𝑟𝑢𝑝 is closest distance to co-
seismic rapture plane, 𝑉𝑠30 is average shear-
wave velocity of upper 30m of site, and SP is
soil profile type according to the reference
[14]. For scaling acceleration of earthquake
records, the procedure proposed by the
Iranian code of practice for seismic resistant
design of buildings [14] is used. The mean
response spectra for seven acceleration
earthquake of records are shown in Figures 4
and 5.
3. Time history analysis and results
In this study, time history analysis has been
done using time integration Hilbert-Hughes-
Taylor method with α=0, β=0.25, γ=0.5.
Dynamic nonlinear analysis includes three
scenarios i.e. before excavation by
considering soil-structure interaction (SSI),
after excavation (EXC), and rigid base
without considering soil-structure interaction
(FIX). The scaling base of percent values is
FIX state.
The maximum decrease and increase in
base shear occurs after excavation. The
values are 43.8% and 56.7% for 5-storey

6 H. Fadavi and A. Mortezaei/ Journal of Rehabilitation in Civil Engineering 5-1 (2017) 01-16
models. For 10-storey models no increase
occurs, but the maximum decrease occurs
before-excavation than after-excavation, i.e.
68.4%. In 15-storey buildings, maximum
decrease is 17% before-excavation and the
highest increase is 35.4% after-excavation.
Base shear effective factors include 1) soil
environment 2) ductility 3) total weight of
the structure 4) fundamental period, and 5)
structural stiffness. By considering the
effective factors this variation can be
explained (Figs 6 to 8).
Figure 4. Pseudo-acceleration spectra for selected records for damping ratio = 5%
Figure 5. Mean response spectra of 10-story building in the range of 0.2T to 1.5T

H. Fadavi and A. Mortezaei/ Journal of Rehabilitation in Civil Engineering 5-1 (2017) 01-16 7
Figure 6. Results of base shear force in 5-story model

8 H. Fadavi and A. Mortezaei/ Journal of Rehabilitation in Civil Engineering 5-1 (2017) 01-16
Figure 7. Results of base shear force in 10-story model

H. Fadavi and A. Mortezaei/ Journal of Rehabilitation in Civil Engineering 5-1 (2017) 01-16 9
Figure 8. Results of base shear force in 15-story model
The maximum increase and decrease of
beams shear force after-excavation than
before-excavation in a 15-storey model are
26.11% and15.3% respectively. In this
model, the maximum increase and decrease
of shear force is related to the middle and end
of beams. The beams of the 9th, 10th, and
11th floors have the highest increase and the
beams of 15th
floor have the highest decrease.
The highest increase and decrease in 10-

10 H. Fadavi and A. Mortezaei/ Journal of Rehabilitation in Civil Engineering 5-1 (2017) 01-16
storey models for after- and before
excavation configurations are 3.16% and
18.9% respectively. The highest increase and
decrease in before and after excavation
configuration are 13.8% and 18.4% for the
perimeter beams of 6th floor. The highest
shear force decrease in fixed base and after-
excavation configurations is related to the
perimeter beams of 7th floors. Shear force
changes rates in 5-storeymodels for all
configurations is insignificant. The effective
factors for the increase or decrease of shear
force beams are 1) stiffness 2) ductility 3)
beams bending strength. When stiffness,
ductility, and bending strength increase,
beams shear force decrease. These factors
cause an increase in beams shear force, while
the same factor on 10 floors models are
inverse and the excavation is a factor for
decreasing of beams shear force. Perimeter
beams are always more vulnerable than
middle beams.
3.1. Plastic hinges
In 15-story models, plastic hinges
formation are more critical in after-
excavation condition than before-excavation
and fixed base configurations. The number of
plastic hinges in the levels of B, IO, LS, C, E
are respectively 366, 220, 20, 34in before-
excavation status, 382, 207, 11, 34 in fixed
base and 309, 170, 56, 83, 1 in after-
excavation condition. In before- and after-
excavation configuration the number of B,
IO, LS, C, E points decrease by 15%, 25%
and increase by 175%, 150%, and 100%,
respectively.
In fixed base and after-excavation status,
number of plastic hinges decreases by 20%,
and 18% and increases by 400%, 150%,
100%. In 10-storey models plastic hinges
formation are the same. The number of
plastic hinges in the levels of B, IO, LS, C in
before-excavation configuration are 189,
200, 8, 7, in fixed base configuration are 215,
196, 8, 8 and for after-excavation condition
are 275, 151, 12, 11. In before and after
excavation the number of B, IO, LS, C points
respectively increase 45%, decrease 25%,
100%, 100%. In fixed base and after-
excavation configuration the above amount
increase 25% and decrease 25%, 100%,
100%. Plastic hinges formation in all5-story
models isthe same and changing is
negligible. The number of plastic hinges in
the levels of B and IO in before-excavation
configuration are 142, 94, fixed base are 141,
66 and after-excavation are 177, 96. In before
and after excavation configuration, number
of B, IO increase 20% and unchanged, in
fixed base configuration increase 20% and
45% (Figs 9 to 11).
By difining a dimensionless parameter that
the ratio of the maximum drift occur in the
mensioned level to total height, it is
determined that the results of 5-story models
in before- and after excavation and fixed base
configurations are unchanged. In 10-story
models, there is no changing in the results
but under the two earthquake records in after-
excavation than before-excavation
configuration,the maximum drift increase
30% and maximum changing in 4th floor
occur and in fixed base and after-excavation
configuration no change happened. The
maximum drift of 15 story models in after-
excavation configuration than before-
excavation and fixed base configuration
isshowed an increase of 70%. The highest
changing occurs in the 6th floor and the
changing increas by height reduction.
For investigating the maximum base shear
effect, a dimensionless parameter is defined
whichis the ratio of the maximum shear force
occur in that height to total height[17].
According to the results in all configuration
of 5 story models in first,second, and third
span, no changing occur. On 10 story models
in post-excavation than pre-excavation
configuration in first span, maximum shear
force decrease 41%, there is no changes in
H. Fadavi and A. Mortezaei/ Journal of Rehabilitation in Civil Engineering 5-1 (2017) 01-16 11
second span and in thirth span increase 62%.
The shear force of first span in post-
excavtion than fixed base configuration
decrease 35%,second span is unchanged and
third span decrease 33%. The change rates in
15 story models in post-excavation than pre-
excavationincreased in the first span by 90%,
in the second span by 200% and in the third
span by 26%. In post-excavation than fixed
base configuration the first span decreased by
5%, second span increased by 38% and third
span decreased by 28%.
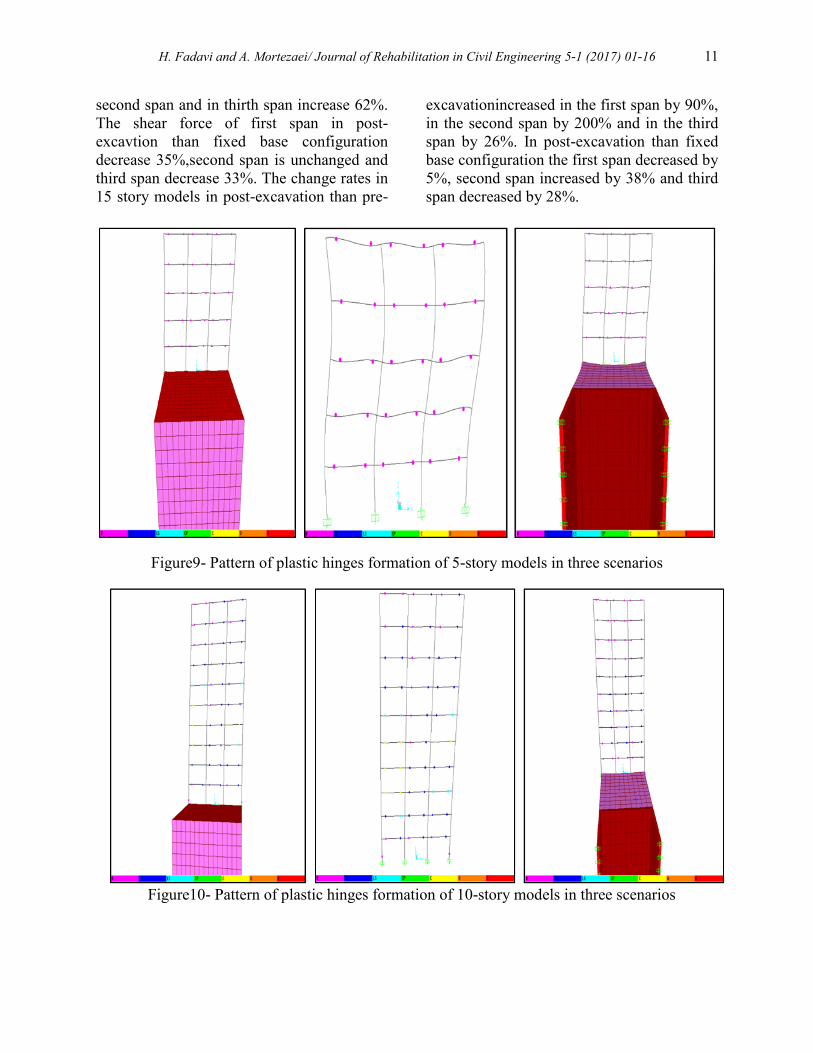
Figure9- Pattern of plastic hinges formation of 5-story models in three scenarios
Figure10- Pattern of plastic hinges formation of 10-story models in three scenarios

12 H. Fadavi and A. Mortezaei/ Journal of Rehabilitation in Civil Engineering 5-1 (2017) 01-16
Figure11- Pattern of plastic hinges formation of 15-story models in three scenarios
In 5 and 10 story models, positive and
negative maximum relative acceleration in
three configurations are unchanged. The
positive maximum relative acceleration in 15
story models in post-excavation than pre-
excavation configuration increased by 30%
and negative relative acceleration increased
85% (Figs 12 to 14). In post-excavation than
fixed base configuration, the positive relative
acceleration decreased by 10% and negative
relative acceleration increased by 85%. The
highest changing in 15 story model is related
to 4th
and 15th floors, although in 5 and 10
story models did not happen changes
except4th
and 10th
story in 10 story models
and 5th story in 5 story models has greatest
effect.
4. Conclusions
In this study, deep excavation effect on
seismic response of reinforcement concrete
buildings have been studied. It can be
concluded that by considering soil type and
excavation characteristics, excavation has the
most effect on high-rise buildings than low-
rise buildings.
1) The highest increase on base shear was
35.4% which was related to 15 story models.
2) The highest increase of period of 66% was
related to 5 story models. The lowest increase
was related to 15 story models. Low-rise
buildings compared to high-rise buildings in
after-excavation configuration had more
period increase.
3) Storey acceleration was increased in after-
excavation state rather than before-
excavation and fixed base configuration.
4) Storey drifts in after-excavation
configuration rather than before-excavation
and fixed base configuration increase. The
increase in 15 story models was more than
10- and 5-story models.
5) The maximum increase in columns axial
force and beams shear force in after-
excavation configuration of 15 story models
was respectively 25.2% and 26.11%.
6) Plastic hinges formation in 15 story
models in after-excavation was more than
before-excavation and fixed base
configuration, so that the structure has more
tends to nonlinear behaviour and collapse
mechanism.

H. Fadavi and A. Mortezaei/ Journal of Rehabilitation in Civil Engineering 5-1 (2017) 01-16 13
Figure12- Base shear coefficients of 5-story models

14 H. Fadavi and A. Mortezaei/ Journal of Rehabilitation in Civil Engineering 5-1 (2017) 01-16
Figure13-Base shear coefficients of10-story models

H. Fadavi and A. Mortezaei/ Journal of Rehabilitation in Civil Engineering 5-1 (2017) 01-16 15
Figure14- Base shear coefficients of15-story models

16 H. Fadavi and A. Mortezaei/ Journal of Rehabilitation in Civil Engineering 5-1 (2017) 01-16
References
[1] Chungsik, Y., Dongyeob, L., (2008).
Deep excavation-induced ground surface
movement characteristics – A numerical
investigation, Computers and
Geotechnics, 35(2): 231-252.
[2] Maleki, M., Baei, B. (2010) Excavation-
adjacent structure interaction effect on
excavation analysis in urban area, journal
of civil engineering,Ferdowsi University,
21(2): 25-40.
[3] El Sawwaf, M., Nazir, .A.K. (2012).The
effect of deep excavation-induced lateral
soil movements on the behavior of strip
footing supported on reinforced
sand.Journal of Advanced Research, 3(4):
337-344.
[4] Hsieh, P.G., Ou, C.Y., Lin, Y.L. (2013).
Three-dimensional numerical analysis of
deep excavations with cross walls.
ActaGeotechnica, 8(1): 33–48
[5] Abd El-Raheem, A. (2011). Impact on
underground deep foundation excavation
from adjacent channels during earthquake,
Journal of Engineering Sciences, Assiut
University, 39(3): 497 -511.
[6] Huang, X., Schweiger, H.F., Huang, H.
(2013). Influence of deep excavations on
nearby existing tunnels. International
Journal of Geomechanics, 13(2), April.
[7] Castaldo, P., De Iuliis, M. (2014). Effects
of deep excavation on seismic
vulnerability of existing reinforced
concrete framed structures, Soil Dynamics
and Earthquake Engineering, 64: 102-112.
[8] Zahmatkesh.A, Choobbasti, A. J. (2015).
Evaluation of wall deflections and ground
surface settlements in deep
excavations.Arabian Journal of
Geosciences, 8(5): 3055-3063.
[9] Dong, Y., Burd, H., Houlsby, G., Houb, Y.
(2014). Advanced finite element analysis
of a complex deep excavation case history
in Shanghai, Frontiers of Structural and
Civil Engineering, 8(1): 93–100
[10] Viswanath, B., Krishna, A., Padmashree,
M. (2014). Numerical analysis of
influence of deep excavation on nearby
existing tunnel, International Journal of
Research in Engineering and Technology,
63(6): 120-124.
[11] Mortezaei, A. (2013) Plastic hinge
length of RC columns considering soil-
structure interaction. Earthquakes and
Structures, 5(6): 679-702.
[12] SAP2000, Integrated software for
Structural analysis & design, Computers
& structures, Inc., Berkeley, California,
USA, V. 18.1.1.
[13] Federal Emergency Management
Agency, Pre-standard and Commentary
for the Seismic Rehabilitation of Building:
FEMA-356.(2000)
[14] Iranian code of practice for seismic
resistant design of buildings (2014).
Standard no. 2800, 4th edition.
[15] Baker JW. (2007). Quantitative
classification of near-fault ground motions
using wavelet analysis, Bulletin of the
Seismological Society of America,
97(5):1486–1501.
[16] HoseiniVaez, S.R., Sharbatdar, M. K.,
Amiri, G. G., Naderpour, H.,
&Kheyroddin, A. (2013). Dominant pulse
simulation of near fault ground motions.
Earthquake Engineering and Engineering
Vibration, 12(2), 267-278.
[17] Kheyroddin, A. and Mortezaei, A.
(2008). The Effect of Element Size and
Plastic Hinge Characteristics on Nonlinear
Analysis of RC Frames.Iranian Journal of
Science & Technology, Transaction B,
Engineering, 32(B5): 451-470.