evaluation of sibc’s “youth of today, leaders for today ... of sibc’s “youth of today,...
TRANSCRIPT

Evaluation of SIBC’s “Youth of Today, Leaders for Today”
Radio Program and Talk Back Show for youth
Part A of the Evaluation Draft Survey Report
Prepared by the Solomon Islands Development Trust for UNICEF Pacific 5th April 2007
Table of Contents
1. Executive Summary......................................................................................... 5
2. Introduction ...................................................................................................... 5
3. Methodology .................................................................................................... 6
3.1 Methodology for assessing reach and share ................................................. 6
3.2 Research protocol for the survey................................................................... 6
3.3 Steps Undertaken in the Survey Report ........................................................ 7
3.4 Preparation Phase......................................................................................... 7
Design of the sampling frame .......................................................................... 7
Selection and training of the survey team........................................................ 9
Pre-testing and Finalising the Questionnaire ................................................. 10
Test Data Analysis......................................................................................... 11
3.5 Implementation............................................................................................ 11
Implementation of the Quantitative Research ................................................ 11
3.6 Post Implementation Data Analysis............................................................. 11
4. Survey Results.................................................................................................. 12
4.1 Introduction to the Data ............................................................................... 12
4.2 Respondent Characteristics ........................................................................ 12
4.3 Access to Radio and Listening Habits ......................................................... 14
4.4 Listening Preferences.................................................................................. 20
4.5 Radio Magazine ‘Youth for today, leaders of today’ ................................... 23
4.5 Talk back shows.......................................................................................... 26
5. Analysis of project reach and share ................................................................. 29
5.1 Reach of the Talk Back Show and the Radio Magazine.............................. 29
5.2 Share........................................................................................................... 30
6. Conclusions ...................................................................................................... 32
Reach of the Radio Magazine........................................................................ 32
Reach of the Talk Back Show........................................................................ 33
Share of both youth pragrams ....................................................................... 33
7. Attachments ...................................................................................................... 33
Attachment One: Sample Design Data.............................................................. 35
SIBC Evaluation Part A- Survey Report Page 2

Attachment Two: Instructions for Survey Team................................................. 38
Attachment three: Survey.................................................................................. 40
Attachment four: Village report form for survey team in rural areas .................. 49
SIBC Evaluation Part A- Survey Report Page 3

List of Tables and Figures Table 1: Apportioning Respondents........................................................................ 7
Table 2: Key characteristics of sample population ................................................ 12
Table 3: Age breakdown of sample population: .................................................... 13
Figure 1: Occupational characteristics of sample population: ............................... 13
Table 4: Radio ownership ..................................................................................... 14
Table 5: Radio in house or nearby ........................................................................ 14
Table 6: Access to working Radio with Batteries .................................................. 15
Table 7: Radio station coverage ........................................................................... 15
Table 8: When respondent last listened to the radio ............................................. 16
Table 9: How often respondents listen to the radio ............................................... 17
Table 10: What times respondents listen to the radio ........................................... 17
Figure 2: Usual Radio Listening Times ................................................................. 18
Table 11: Who youth listen with ........................................................................... 19
Table 12: If youths share radio information with friends and family....................... 19
Table 13: Whether youths trust information from the radio ................................... 19
Table 14: What radio stations youth last listened to.............................................. 20
Table 15: Which radio station youth most listen to................................................ 21
Table 16: Which radio stations are best for music, news, or social issues........... 21
Figure 3: Which radio stations are best for music, news, or social issues ............ 22
Figure 4: Preferred type of radio programs ........................................................... 22
Table 18: Programs that youths have listened to.................................................. 23
Figure 5: How many times youth have listened to the radio magazine ................. 24
Figure 6: Rating the radio magazine ..................................................................... 25
Figure 7: Rating the radio magazine with gender and provincial comparisons ..... 25
Table 19: Knowledge of the talk back shows ........................................................ 26
Figure 9: Rating the talk back show...................................................................... 27
SIBC Evaluation Part A- Survey Report Page 4
1. Executive Summary When examining the reach and share for the “Radio Magazine for Youth” and Talk Back Shows for Young People Project the following key findings were made: Reach
The radio magazine reached 57% of youths in the Solomon Islands, and presented the following key findings:
• The talk back show was more popular in urban areas, whilst the radio magazine was more popular in rural areas.
• Seven out of ten youths who heard the radio magazine, had listened to it more than once.
• 88% of youths who listened to the radio magazine show rated it as ‘interesting’ or ‘very interesting’.
• 57% of youths who had listened to the radio magazine said it was both educational and entertaining.
• Slightly more males listen to the radio magazine than females. The talk back show reached 40% of youths in the Solomon Islands, and presented the following key findings:
• More respondents in the provinces reported they had heard a talk back show (42%) compared to Honiara residents (34%).
• The talk back show was more interesting for youths in Honiara (73%) than youths in the provinces (15%).
• Three out of four youths found the talk back show either interesting or very interesting.
• Slightly more males listen to the talk back show than females. Share SIBC has the share of the target market, closely followed by PaoaFM.
• 49% of youths interviewed last listened to SIBC, 43.2% to PaoaFM and 13% to ZFM.
• Youths listen to PaoaFM more often (43.5%) than SIBC (33.6%)
• The majority of youths report that SIBC is the best station news (89.9%) and social issues (73.7%).
2. Introduction The Solomon Islands Broadcasting Corporation (SIBC), with funding from the United Nations Childrens Fund (UNICEF), has been running a weekly radio magazine and a series of talk back shows. The radio magazine titled “Youth of
SIBC Evaluation Part A- Survey Report Page 5

Today, Leaders for Today” has been aired since most Sunday afternoons since 2nd April 2006. From October to December 2006 a series of talk back shows were produced and aired on Saturday afternoons. Both the radio magazine and talk back shows target young people aged 15 to 22 across the Solomon Islands. The purpose of this report is to assess the reach of the show for the target audience, and the share of the market of SIBC’s radio shows for young people. The results of the questionnaire also allow for an assessment of the second project indicator, which states ‘by the end of 2006, at least 30% of the target audience in the Solomon Islands will have been reached by the radio magazine’. The remaining four indicators are analysed in part B of the evaluation, the Assessment of Indicators Report. This report compiles and analyses data from quantitative research among young people in the Solomon Islands. The research was undertaken using a questionnaire conducted via face to face individual interviews with 414 young people during a two week period in March 2007. The young people were located in three rural areas and one urban area of the Solomon Islands.
3. Methodology 3.1 Methodology for assessing reach and share This report involves an evaluation of the reach of the programme. Reach is calculated as the percentage of the target audience who listened to at least some of the program in a set period of time – in this case one year. Also included in this report is an assessment of the share of the market of SIBC’s radio shows for young people. This is the percentage of those young people listening to radio at a certain time that are listening to SIBC programs. It can be calculated by adding up the amount of time spent listening to the radio and expressing figures for each station as a percentage of all listening. It is not practical in the Solomon Islands to get an accurate, quantitative measure of the total number of hours that someone listens to the radio. Therefore the survey, questions were designed to gather data that gave an indication of the popularity of different stations, the stations listened to most often and the station listened to most recently. This final question is used to get a percentage of the respondents that at a particular time were listening to SIBC, a measure of share.
3.2 Research protocol for the survey The target population for the programme produced was young people aged 15-22 in Solomon Islands. The terms of reference for the evaluation presented a Research Protocol that was used as the basis for the survey undertaken.
• Research method: face to face individual interviews through questionnaire
• Sample size: 400 respondents
• Sampling: stratified random sampling (cluster or multi-stage sampling) in three rural areas and one urban area of Solomon Islands. Sample weighted
SIBC Evaluation Part A- Survey Report Page 6

to population of the area as percentage of the population of the whole country.
3.3 Steps Undertaken in the Survey Report As per the TOR the project was delivered by the following steps:
1) design the sampling frame 2) pre-test the questionnaire among representatives of the target group 3) finalize the research questionnaire and get it approved by UNICEF Pacific 4) undertake quantitative research among young people in Solomon Islands
using the questionnaire and according to the research protocol 5) compile and analyse the data collected 6) prepare a draft research report, including tables for presentation of data,
and get it approved by UNICEF Pacific 7) prepare the final draft of the research report
3.4 Preparation Phase Design of the sampling frame The requested sample was 400 as specified in the Terms of Reference. It was agreed that the target number of surveys for the survey team to completed be increased to 450 to ensure that the survey team would complete at least 400. The evaluation used stratified random sampling and multi-stage sampling in three rural areas and one urban area of Solomon Islands.
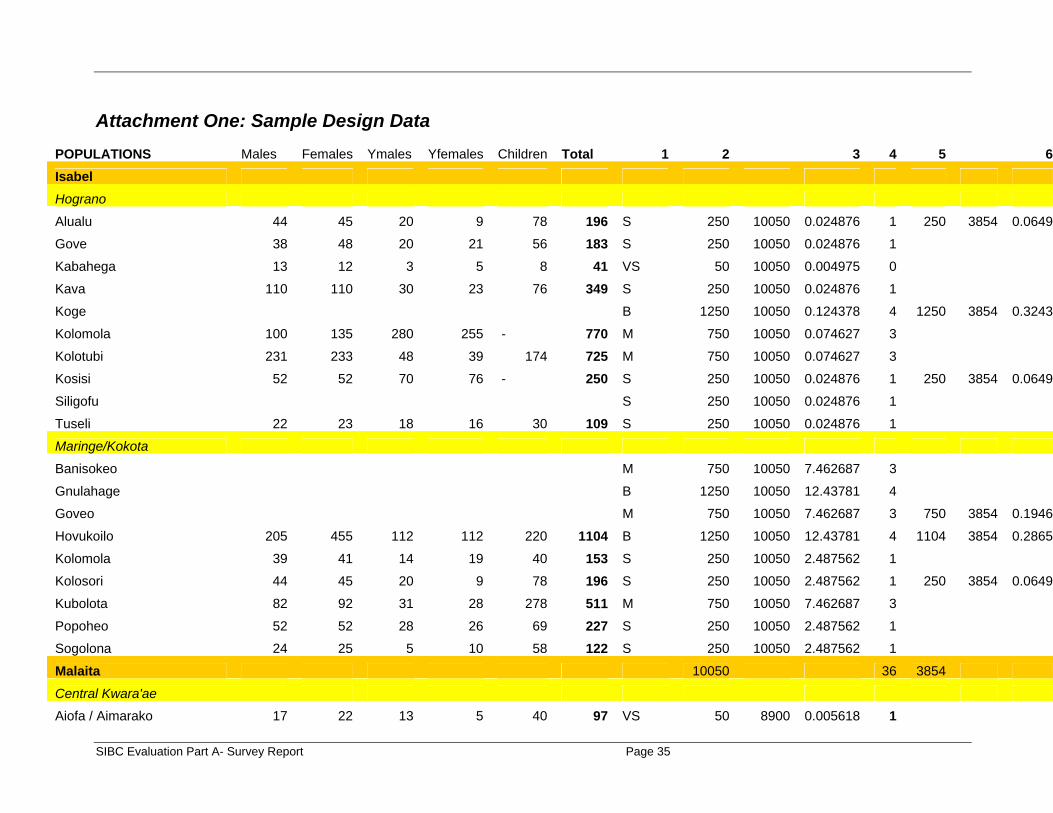
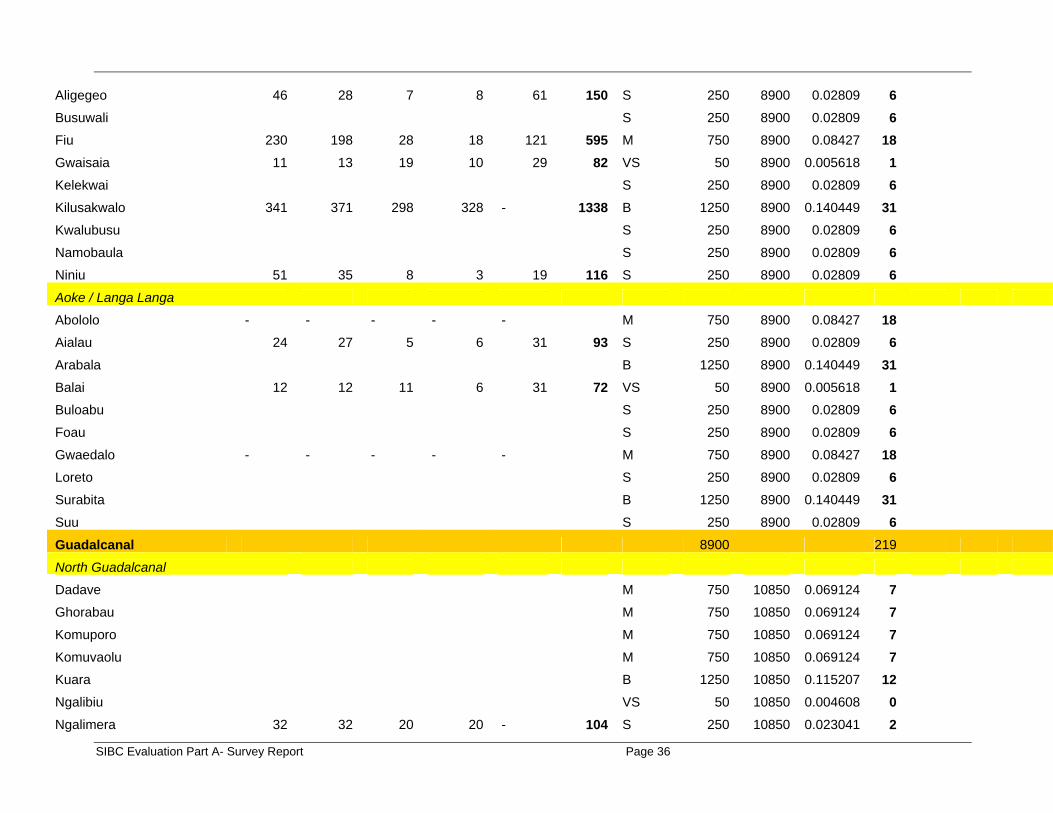
Provincial and Constituency Level The selection of target provinces and constituencies within provinces was determined by the locations in which SIDT has staff. SIDT is based in Honiara, and has six community development workers (CDWs) working in six different constituencies across three provinces in the Solomon Islands – Isabel, Guadalcanal and Malaita. 1999 Census population data, the most recent available, was used to calculate the total number of participants and the spread across the three provincial areas and Honiara. Table 1: Apportioning Respondents
Apportioning Respondents*
Province Population % of Total
Target no. of Respondents
Isabel 20,421 8.09 36
Guadalcanal 60,275 24.00 107
Malaita 122,620 48.58 219
SIBC Evaluation Part A- Survey Report Page 7

Honiara 49,107 19.46 88
Total 252,423 100% 450
*Source: 1999 Census
Methodology for apportioning respondents across selected villages
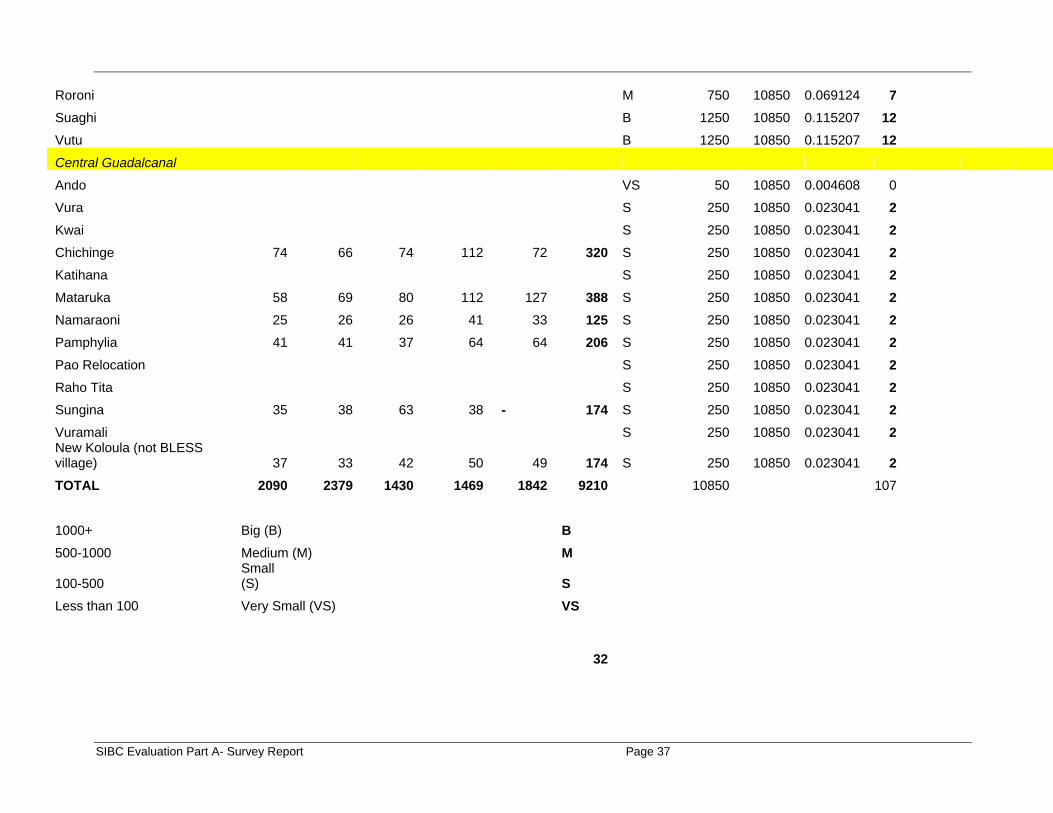
Village Level Having determined the total number of surveys to be completed in each province, it was necessary to allocate these surveys across villages in each province. As noted, SIDT has six CDWs working in six different constituencies across three provinces. The CDWs are employed under the Building Livelihoods Empowerment and Strategic Sustainability (BLESS) project which undertakes participatory community development with a particular focus on empowering women and youth in decision making and governance. Each CDW is allocated 10 target villages in their local area to work with, although not all these villages have continued to be part of the project. It was these 10 villages which formed the pool of villages that formed the basis of the sampling frame. Whilst this was not random selection of villages, the work that CDWs are doing is not considered to effect the radio listening habits of the youth in these villages. Unfortunately, village-based population data was missing for many of the villages to be surveyed and village level data available from the 1999 census was considered to be too inaccurate at the village level to be of use for determining their current populations. Given the low level of data available, the following method was used to allocate provincial level totals to the village level to ensure proportional representation: 1. Using knowledge from local SIDT staff who are from or normally based in each
of the constituencies, the villages were assigned a category based on their estimated size (Big= >1000, Medium= 500-1000 Small= 100-500 VerySmall= <100)
2. A mean population was assigned to each size category (B=1250, M=750, S=250, VS=50).
3. The percentage of the sample for each constituency was calculated. 4. These calculations were then used to apportion sample respondent numbers to
the villages in each constituency. Some Practical Considerations
Isabel Isabel province has a low percentage of the total population and hence the total number of surveys to be taken there was low. Due to the impracticality of visiting many (often quite inaccessible villages) in Isabel Province to conduct sometimes only one interview, a second stage of random village selection was undertaken using the following method:
SIBC Evaluation Part A- Survey Report Page 8

1. 3 villages for each of the two constituencies were selected at random (drawn out of a hat).
2 The same methodology outlined above (steps 1 – 4) was used to determine how many respondents would be required in each village.
Malaita The three villages that required only one respondent to be surveyed in Malaita were assigned to Aligegeo village where there is a high school. Interviewers in Aligegeo were instructed to randomly select and interview six youths who live in Aligegeo, and three youths that live outside Aligegeo but attend school there. It is suggested that this minor adjustment does not present a bias of any significance.
Central Guadalcanal The small size of the villages in Central Guadalcanal have resulted in a small number of respondents to be interviewed in each village. Discussions with our CDW have revealed however, that all of the youth in five of the villages walk daily to one school. Therefore five of the villages will be surveyed from students in the school that are from the target villages. Other villages will be visited individually. Again, it is suggested that this does not present an obstacle to randomised selection of the sample. Selection and training of the survey team Selection The survey team consisted of:
a. SIDT village-based CDWs b. Honiara Youth Volunteers c. One member of SIDT’s office staff
The SIDT village-based workers were experienced in carrying out surveys as part of their community development work such as conducting village profile surveys and Village Quality of Life Index surveys. They also have knowledge of the areas to be surveyed which cut down on logistical problems such as transport and accommodation. The Honiara Youth volunteers have a long history of involvement with SIDT, and a number of members had carried out urban-based surveys previously. Two Honiara Youth Volunteers accompanied the two CDWs based in Malaita to help with the considerable number of surveys to be carried out there. The SIDT office staff member usually carries out security and odd jobs at SIDT but has consistently shown an eagerness to widen his skills and experiences. Training One CDW from each province travelled to Honiara to be trained to conduct the surveys. All Honiara Youth Volunteers and the office staff member participated in the training. Training was completed over 3 days:
SIBC Evaluation Part A- Survey Report Page 9

Day 1 (morning): Basic introduction to UNICEF survey, introduction to representative samples and random surveying (powerpoint presentation). Instructions for completing the survey were distributed and explained. Day 1 (afternoon): Go through survey question by question and discuss any potential problems. Day 2 (morning): Discussion of logistical issues and revision of budgets Day 2 (afternoon): Conduct test questionnaire (20 respondents) Day 3: De-brief on test questionnaires and problems identified. Training was detailed and there was a lot of opportunity for surveyors to ask questions and raise potential problems. The two CDWs in Isabel and Malaita that did not attend training in Honiara were briefed by the CDW and Honiara Youth that accompanied them respectively. The following materials were provided for each surveyor:
• Letter to the local Provincial MP
• List of villages and target number of respondents for each constituency
• Instruction sheet
• Copies of questionnaires
• List of radio program topics
• Template for feedback report to be conducted in each village
• 3 pens
• 1 plastic zip-seal case
• notebook
• copy of budget Pre-testing and Finalising the Questionnaire The survey developed by UNICEF was reviewed and tested to ensure applicability and appropriateness to Solomon Islands. This testing involved:
• Input from SIDT staff
• Initial test of 10 surveys
• Input from survey team
• Input from an epidemiologist consultant at the Ministry of Health with extensive experience in conducting surveys in the Solomon Islands
• Input from UNICEF
• 20 test surveys
• Revision of questions and structure
SIBC Evaluation Part A- Survey Report Page 10

The survey team and SIDT staff debated whether the survey should be written in English or Pijin. Writing in Pijin could have created confusion with some questions misinterpreted. Some of the survey team also communicated using local languages, in which case English was an easier to use when reading and translating to language. Team and staff members agreed that the survey was to be written in English. Test Data Analysis To further ensure the survey tool would result in the appropriate data, the results of the test surveys were entered into the data analysis system and a test data analysis undertaken. The final survey was reviewed and signed off by UNICEF on 5 March 2007.
3.5 Implementation Implementation of the Quantitative Research The survey data was gathered concurrently in three provinces by the 12 members of the survey team between the 5th and the 16th of March, 2007. The survey team used field reports to document any issues that arose during implementation. Commonly reported included:
• Shyness of the respondents, in particular the females. As a result conducting some of the individual surveys took longer than expected with the survey team members having to spend longer in some villages.
• In some villages it was not possible to survey the total number intended due to a lack young people in the village. In addition in some villages this made it impossible to select respondents randomly as all of them were surveyed.
• Village leaders requesting that they return at a later time due to other village activities. This increased transport costs and data collection time.
• Honiara surveyors found that interviewees were easily distracted when they were interviewed in public.
Nevertheless, the surveys were carried out effectively and all surveyors (except the Isabel CDW who could not travel because of flooding) were able to return their surveys on time.
3.6 Post Implementation Data Analysis Through the analysis phase the data were cleaned of any obvious inconsistencies such as responses to inapplicable questions and incomplete questions. Other than that the data presented is as gathered in the interviews. The data analysis tool EPI6 was used to enter and analyse the data. It was chosen because of its affordability, simple data entry process, and the availability of local support.
SIBC Evaluation Part A- Survey Report Page 11
The data was entered by a member of the survey team after detailed training in use of the system and test data entry exercises. Any issues found through the data entry were raised with the Project Coordinator prior to a decision being made. The Project Coordinator supervised data entry and undertook a verification process which involved a random selection spot-check of 5% of the surveys entered. Very few errors were found during the spot-check and the accuracy of data level was considered to be satisfactory.
4. Survey Results 4.1 Introduction to the Data The following analysis is based on the data set of 414 surveys completed by the 12 members of the survey team. The sample was large enough to support some comparisons / stratifications. As relevant this is presented between respondents in Honiara and those in the provinces and between males and females. The rest of this section presents the characteristics of the sample population, their listening habits, their opinions and preferences on radio, and their opinions and preferences of program. The final section looks in more detail at the reach achieved by the program and the share of SIBC radio station.
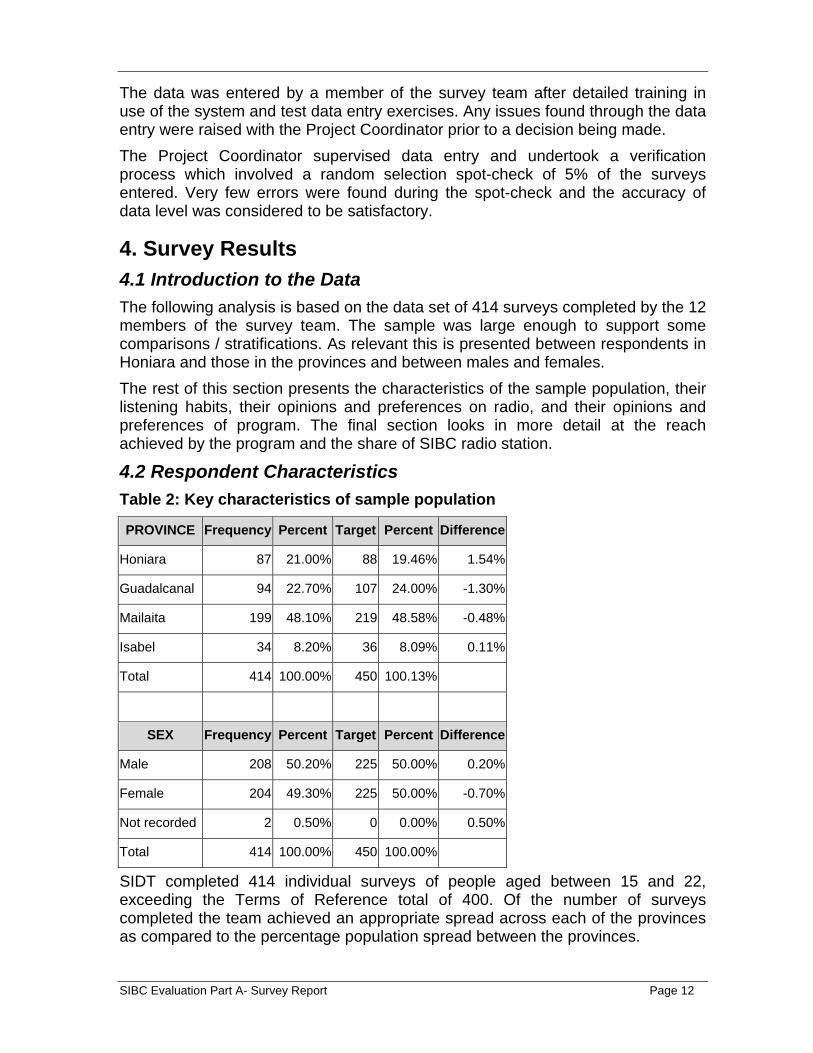
4.2 Respondent Characteristics Table 2: Key characteristics of sample population
PROVINCE Frequency Percent Target Percent Difference
Honiara 87 21.00% 88 19.46% 1.54%
Guadalcanal 94 22.70% 107 24.00% -1.30%
Mailaita 199 48.10% 219 48.58% -0.48%
Isabel 34 8.20% 36 8.09% 0.11%
Total 414 100.00% 450 100.13%
SEX Frequency Percent Target Percent Difference
Male 208 50.20% 225 50.00% 0.20%
Female 204 49.30% 225 50.00% -0.70%
Not recorded 2 0.50% 0 0.00% 0.50%
Total 414 100.00% 450 100.00%
SIDT completed 414 individual surveys of people aged between 15 and 22, exceeding the Terms of Reference total of 400. Of the number of surveys completed the team achieved an appropriate spread across each of the provinces as compared to the percentage population spread between the provinces.
SIBC Evaluation Part A- Survey Report Page 12
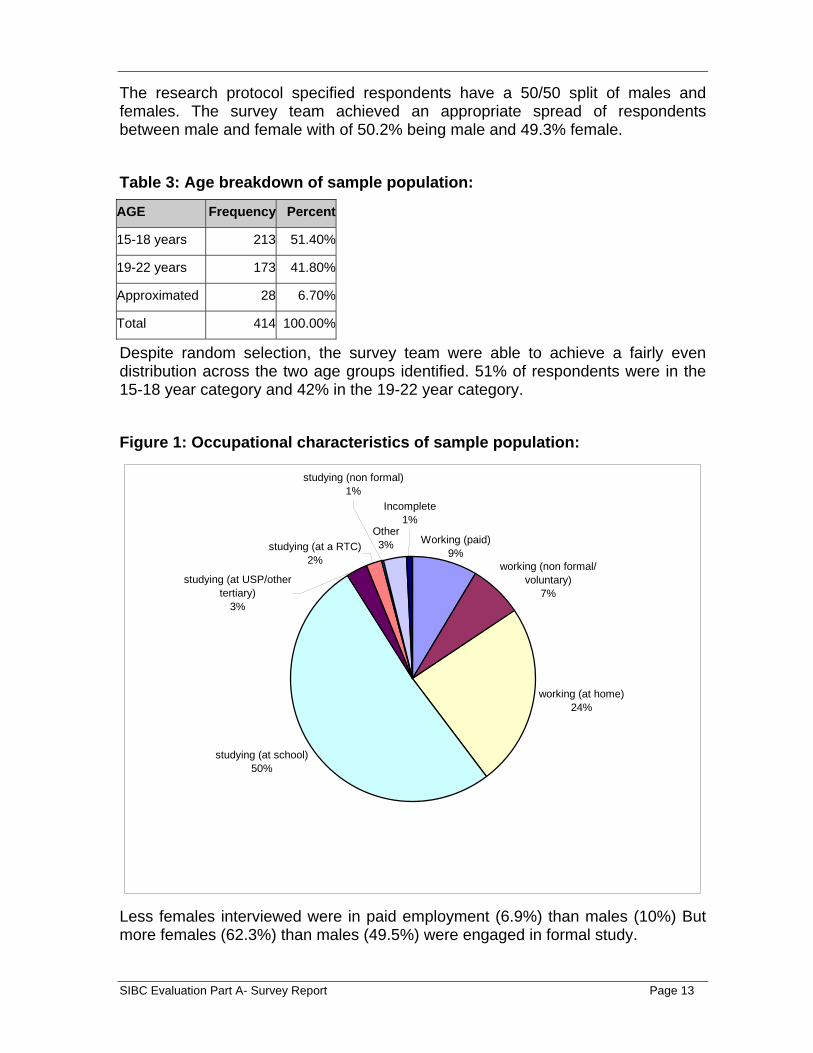
The research protocol specified respondents have a 50/50 split of males and females. The survey team achieved an appropriate spread of respondents between male and female with of 50.2% being male and 49.3% female. Table 3: Age breakdown of sample population:
AGE Frequency Percent
15-18 years 213 51.40%
19-22 years 173 41.80%
Approximated 28 6.70%
Total 414 100.00%
Despite random selection, the survey team were able to achieve a fairly even distribution across the two age groups identified. 51% of respondents were in the 15-18 year category and 42% in the 19-22 year category. Figure 1: Occupational characteristics of sample population:
working (at home)24%
studying (at school)50%
Other 3%
studying (non formal)1%
studying (at USP/other tertiary)
3%
Incomplete1%
Working (paid)9%
working (non formal/ voluntary)
7%
studying (at a RTC)2%
Less females interviewed were in paid employment (6.9%) than males (10%) But more females (62.3%) than males (49.5%) were engaged in formal study.
SIBC Evaluation Part A- Survey Report Page 13

When comparing provincial to urban respondents, more of those interviewed in provincial areas were at school (56%), compared to 33% of those in Honiara. 50.5% of those in Honiara were in formal study and 57.5% of those in a provincial area were in formal study. Not surprisingly, more (23%) of those living in Honiara were in paid employment, than in provincial areas (4.6%). Also, more of those in provincial areas were working at home (26.6%), compared to 15% in Honiara
4.3 Access to Radio and Listening Habits Access to radio Table 4: Radio ownership
Do you own a radio?
Freq Percent Honiara Freq
Honiara Percent
Provincial Freq
Provincial Percent
Yes 238 57.50% 55 63.20% 183 56.00%
No 173 41.80% 30 34.50% 143 43.70%
Other 1 0.20% 0 0.00% 1 0.30%
Incomplete 2 0.50% 2 2.30% 0 0.00%
Total 414 100.00% 87 100.00% 327 100.00%
Overall, 57% of respondents reported that they own their own radio. 63% of respondents in Honiara reported that they own a radio,10% more than those interviewed in the provinces. Table 5: Radio in house or nearby
Do you have a radio in the house you usually sleep in or nearby?
Freq Percent Honiara Freq
Honiara Percent
Provincial Freq
Provincial Percent
Yes 375 90.60% 84 96.60% 291 89.00%
No 34 8.20% 3 3.40% 31 9.50%
Other 3 0.70% 0 0.00% 3 0.90%
Incomplete 2 0.50% 0 0.00% 2 0.60%
Total 414 100.00% 87 100.00% 327 100.00%
Overall, 91% of respondents have a radio in their house or nearby. 96.6% of respondents in Honiara have a radio in their house or nearby. More respondents in Honiara reported that they have a radio in the house they usually sleep in or nearby than in the provincial respondents with 89%.
SIBC Evaluation Part A- Survey Report Page 14
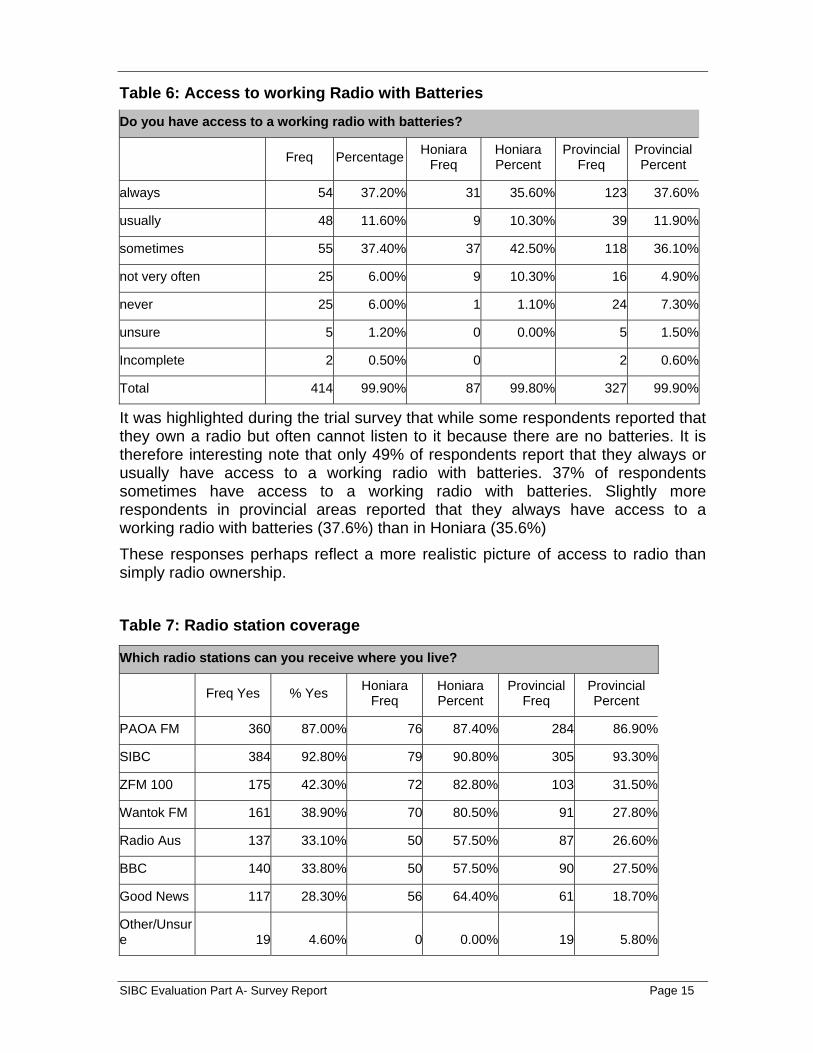
Table 6: Access to working Radio with Batteries
Do you have access to a working radio with batteries?
Freq Percentage Honiara Freq
Honiara Percent
Provincial Freq
Provincial Percent
always 54 37.20% 31 35.60% 123 37.60%
usually 48 11.60% 9 10.30% 39 11.90%
sometimes 55 37.40% 37 42.50% 118 36.10%
not very often 25 6.00% 9 10.30% 16 4.90%
never 25 6.00% 1 1.10% 24 7.30%
unsure 5 1.20% 0 0.00% 5 1.50%
Incomplete 2 0.50% 0 2 0.60%
Total 414 99.90% 87 99.80% 327 99.90%
It was highlighted during the trial survey that while some respondents reported that they own a radio but often cannot listen to it because there are no batteries. It is therefore interesting note that only 49% of respondents report that they always or usually have access to a working radio with batteries. 37% of respondents sometimes have access to a working radio with batteries. Slightly more respondents in provincial areas reported that they always have access to a working radio with batteries (37.6%) than in Honiara (35.6%) These responses perhaps reflect a more realistic picture of access to radio than simply radio ownership. Table 7: Radio station coverage
Which radio stations can you receive where you live?
Freq Yes % Yes Honiara Freq
Honiara Percent
Provincial Freq
Provincial Percent
PAOA FM 360 87.00% 76 87.40% 284 86.90%
SIBC 384 92.80% 79 90.80% 305 93.30%
ZFM 100 175 42.30% 72 82.80% 103 31.50%
Wantok FM 161 38.90% 70 80.50% 91 27.80%
Radio Aus 137 33.10% 50 57.50% 87 26.60%
BBC 140 33.80% 50 57.50% 90 27.50%
Good News 117 28.30% 56 64.40% 61 18.70%
Other/Unsure 19 4.60% 0 0.00% 19 5.80%
SIBC Evaluation Part A- Survey Report Page 15
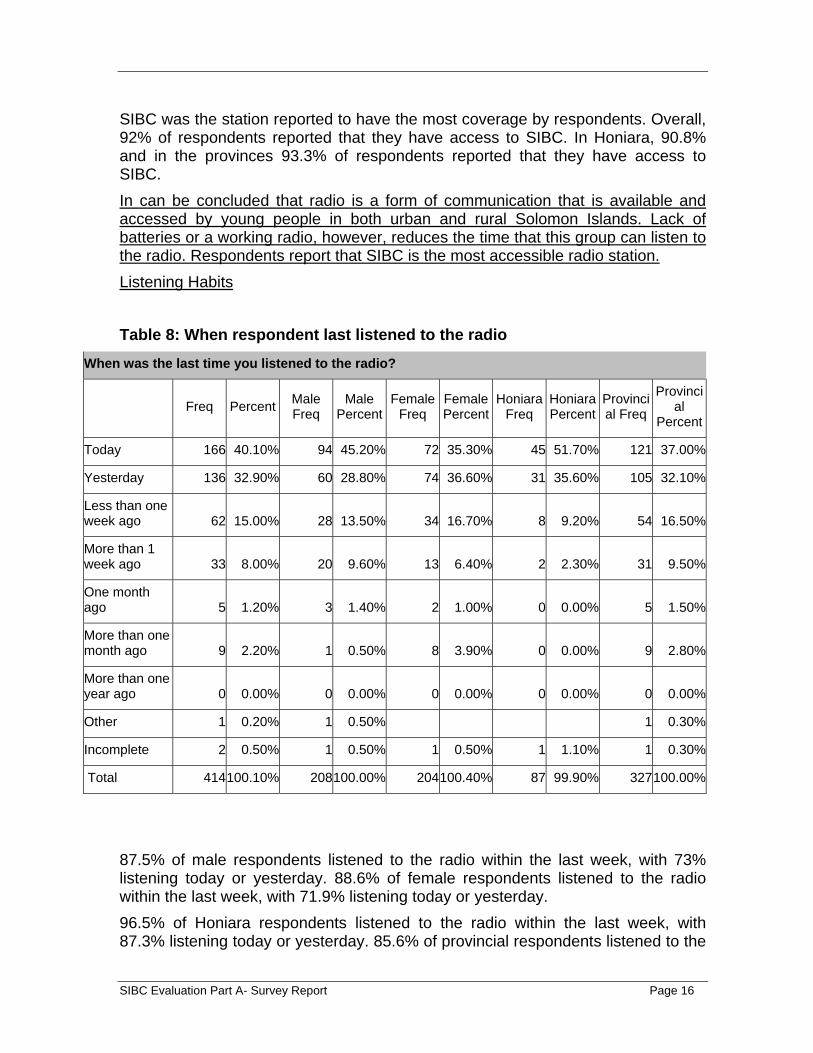
SIBC was the station reported to have the most coverage by respondents. Overall, 92% of respondents reported that they have access to SIBC. In Honiara, 90.8% and in the provinces 93.3% of respondents reported that they have access to SIBC. In can be concluded that radio is a form of communication that is available and accessed by young people in both urban and rural Solomon Islands. Lack of batteries or a working radio, however, reduces the time that this group can listen to the radio. Respondents report that SIBC is the most accessible radio station. Listening Habits Table 8: When respondent last listened to the radio
When was the last time you listened to the radio?
Freq Percent Male Freq
Male Percent
Female Freq
Female Percent
Honiara Freq
Honiara Percent
Provincial Freq
Provincial
Percent
Today 166 40.10% 94 45.20% 72 35.30% 45 51.70% 121 37.00%
Yesterday 136 32.90% 60 28.80% 74 36.60% 31 35.60% 105 32.10%
Less than one week ago 62 15.00% 28 13.50% 34 16.70% 8 9.20% 54 16.50%
More than 1 week ago 33 8.00% 20 9.60% 13 6.40% 2 2.30% 31 9.50%
One month ago 5 1.20% 3 1.40% 2 1.00% 0 0.00% 5 1.50%
More than one month ago 9 2.20% 1 0.50% 8 3.90% 0 0.00% 9 2.80%
More than one year ago 0 0.00% 0 0.00% 0 0.00% 0 0.00% 0 0.00%
Other 1 0.20% 1 0.50% 1 0.30%
Incomplete 2 0.50% 1 0.50% 1 0.50% 1 1.10% 1 0.30%
Total 414100.10% 208100.00% 204100.40% 87 99.90% 327100.00%
87.5% of male respondents listened to the radio within the last week, with 73% listening today or yesterday. 88.6% of female respondents listened to the radio within the last week, with 71.9% listening today or yesterday. 96.5% of Honiara respondents listened to the radio within the last week, with 87.3% listening today or yesterday. 85.6% of provincial respondents listened to the
SIBC Evaluation Part A- Survey Report Page 16

radio within the last week, with 69.1% listening today or yesterday. 88% of respondents listened to the radio within the last week, with 73% listening today or yesterday. Table 9: How often respondents listen to the radio
How often do you listen to the radio?
Freq % Male Frequency
Male Percent
Female Frequency
Female Percent
Honiara Frequency
Honiara Percent
Provincial Frequency
Provincial Percent
Every day 172 41.50% 95 45.70% 77 37.70% 37 42.50% 135 41.30%
Once a week 73 17.60% 28 13.50% 45 22.10% 14 16.10% 59 18.00%
Not very often 166 40.10% 84 40.40% 80 39.20% 35 40.20% 131 40.10%
Never 0 0.00% 0 0.00% 0 0.00% 0 0.00% 0 0.00%
Other 1 0.20% 0 0.00% 1 0.50% 0 0.00% 1 0.30%
Incomplete 2 0.50% 1 0.50% 1 0.50% 1 1.10% 1 0.30%
Total 414100.00% 208100.10% 204100.00% 87 99.90% 327 100.00%
40% of respondents reported that they listened to the radio not very often. However, as reported above, 88% reported they had listened to the radio within the last week. This may reflect an interpretation of not very often as being less than weekly. More males listen to the radio daily (45%), compared to 37.7% of females, but more females (22.1%) reported listening to the radio weekly, compared to 13.5% of males. Table 10: What times respondents listen to the radio
What times of the day do you usually listen to the radio?
Yes no % yes % no Male Freq
Male Percent
Female Freq
Female Percent
Honiara Freq
Honiara Percent
Provincial Freq
Provincial
Percent
Early morning 108 300 26.00% 72.50% 70 33.70% 38 18.60% 35 40.20% 73 22.30%
Late morning 30 378 7.20% 91.30% 14 6.70% 16 7.80% 14 16.10% 16 4.90%
Lunchtime 39 369 9.40% 89.`% 24 11.50% 15 7.40% 24 27.60% 15 4.60%
Early afternoon 41 367 9.90% 88.60% 28 13.50% 13 6.40% 4 4.60% 37 11.30%
SIBC Evaluation Part A- Survey Report Page 17

Late afternoon 177 231 42.80% 55.80% 91 43.50% 85 41.70% 20 23.00% 157 48.00%
Dinner time 47 361 11.40% 87.20% 27 13.50% 20 9.80% 7 8.00% 40 12.20%
After dinner 169 240 40.80% 58.00% 84 40.40% 85 41.70% 27 31.00% 142 43.40%
Late at night 149 259 36.00% 62.60% 74 35.60% 74 36.60% 45 51.70% 104 31.80%
Incomplete 6 0 0.00% 0.00% 3 0.00% 3 0.00% 0.00% 0.00% 6 0.00%
Figure 2: Usual Radio Listening Times
Usual Listening Times - All Respondents
0 20 40 60 80 100 120 140 160 180 200
Early morning
Late morning
Lunchtime
Early afternoon
Late afternoon
Dinner time
After dinner
Late at night
Incomplete
Respondents report that they are unlikely to listen to the radio during late morning 91%, lunchtime 89% and early afternoon 88.6%. When the Honiara results were isolated, only 27.6% of Honiara residents listened at lunchtime. This would generally reflect the time that 56% of the young people surveyed were at school or at university to study. Across Solomon Islands, young people are likely to be listening to the radio during the late afternoon 42.8% after dinner 40.8% and early morning 26%,. Late afternoon is the best time to catch provincial listeners with 48% listening at this time. Late afternoon or after dinner will both reach 41.7% of females, or 43.5% and 40.4% of males respectively. More than double the number (48%) of provincial respondents listen to the radio in the late afternoon compared to 23% of Honiara respondents. 51.7% of Honiara
SIBC Evaluation Part A- Survey Report Page 18

residents listen to the radio late at night compared to 31.8% of those in the provinces. Table 11: Who youth listen with
Who do you usually listen to the radio with?
Freq Percent Male Freq
Male Percent
Female Freq
Female Percent
Honiara Freq
Honiara Percent
Provincial Freq
Provincial Percent
Schoolmates 20 4.80% 11 5.30% 9 4.40% 10 11.50% 10 3.10%
Friends/Family your age 117 28.30% 57 27.40% 60 29.40% 23 26.40% 94 28.70%
Friends/Family different age 197 47.60% 97 46.60% 99 48.50% 24 27.60% 173 52.90%
Alone 64 15.50% 33 15.90% 30 14.70% 26 29.90% 38 11.60%
Other 5 1.20% 4 1.90% 1 0.50% 5 1.50%
Incomplete 11 2.70% 6 2.90% 5 2.50% 4 4.60% 7 2.10%
Total 414100.00% 208100.00% 204100.00% 87100.00% 327 99.90%
Most respondents listen to the radio with friends or family of different ages (47%). 28% of respondents listen to the radio with schoolmates, friends or family of their own age, indicating possible further reach achieved by the program. Slightly more respondents in Honiara listen to the radio with schoolmates, friends or family of their own age (37.9%) Than provincial respondents (31.8%) Table 12: If youths share radio information with friends and family
Do you talk about what you hear onthe radio with friends or family?
All the time 93 22.50%
Usually 23 5.60%
Sometimes 198 47.80%
Never 90 21.70%
Unsure 4 1.00%
Incomplete 6 1.40%
Total 414 100.00%
Restults for this question did not show a strong pattern of talking about radio with friends and family. 22.5% of respondents however, talk about what they hear on the radio with friends or family all the time. Table 13: Whether youths trust information from the radio
SIBC Evaluation Part A- Survey Report Page 19
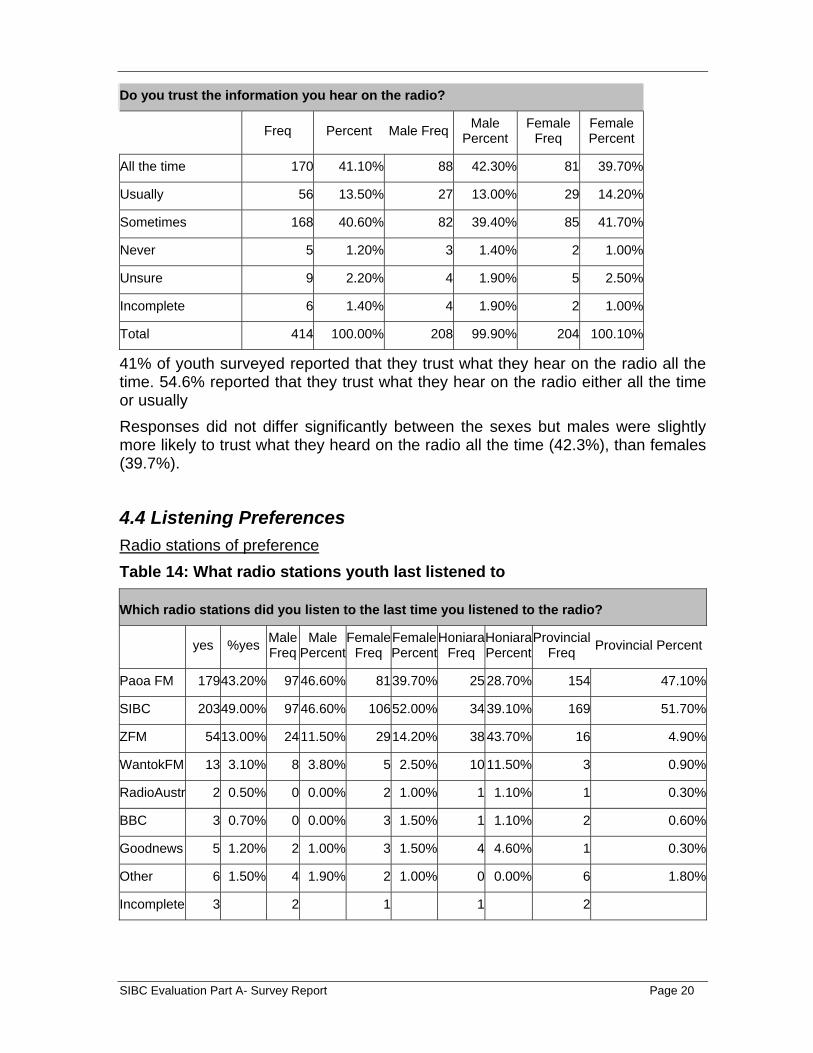
Do you trust the information you hear on the radio?
Freq Percent Male Freq Male Percent
Female Freq
Female Percent
All the time 170 41.10% 88 42.30% 81 39.70%
Usually 56 13.50% 27 13.00% 29 14.20%
Sometimes 168 40.60% 82 39.40% 85 41.70%
Never 5 1.20% 3 1.40% 2 1.00%
Unsure 9 2.20% 4 1.90% 5 2.50%
Incomplete 6 1.40% 4 1.90% 2 1.00%
Total 414 100.00% 208 99.90% 204 100.10%
41% of youth surveyed reported that they trust what they hear on the radio all the time. 54.6% reported that they trust what they hear on the radio either all the time or usually Responses did not differ significantly between the sexes but males were slightly more likely to trust what they heard on the radio all the time (42.3%), than females (39.7%).
4.4 Listening Preferences Radio stations of preference Table 14: What radio stations youth last listened to
Which radio stations did you listen to the last time you listened to the radio?
yes %yes Male Freq
Male Percent
FemaleFreq
FemalePercent
HoniaraFreq
HoniaraPercent
Provincial Freq Provincial Percent
Paoa FM 179 43.20% 97 46.60% 8139.70% 25 28.70% 154 47.10%
SIBC 203 49.00% 97 46.60% 10652.00% 34 39.10% 169 51.70%
ZFM 54 13.00% 24 11.50% 2914.20% 38 43.70% 16 4.90%
WantokFM 13 3.10% 8 3.80% 5 2.50% 10 11.50% 3 0.90%
RadioAustr 2 0.50% 0 0.00% 2 1.00% 1 1.10% 1 0.30%
BBC 3 0.70% 0 0.00% 3 1.50% 1 1.10% 2 0.60%
Goodnews 5 1.20% 2 1.00% 3 1.50% 4 4.60% 1 0.30%
Other 6 1.50% 4 1.90% 2 1.00% 0 0.00% 6 1.80%
Incomplete 3 2 1 1 2
SIBC Evaluation Part A- Survey Report Page 20
49% of respondents last listened to SIBC, 42.3% last listened to PaoaFM, and 13% last listened to ZFM. 52% of females last listened to SIBC, compared to 46.6% of males In provincial areas, 51.7% last listened to SIBC, compared to 47.1% that listened to PAOA FM. In Honiara, 43.7% last listened to ZFM, with 39.1% last listening to SIBC Table 15: Which radio station youth most listen to
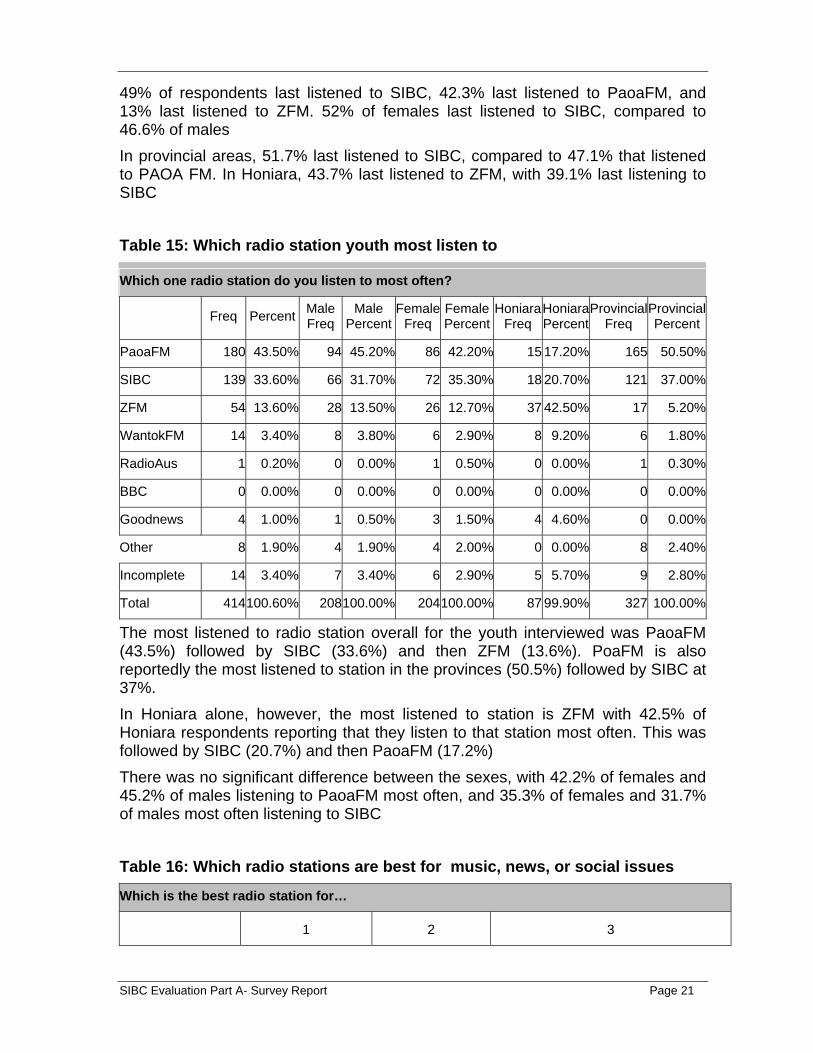
Which one radio station do you listen to most often?
Freq Percent Male Freq
Male Percent
Female Freq
Female Percent
HoniaraFreq
HoniaraPercent
ProvincialFreq
Provincial Percent
PaoaFM 180 43.50% 94 45.20% 86 42.20% 15 17.20% 165 50.50%
SIBC 139 33.60% 66 31.70% 72 35.30% 18 20.70% 121 37.00%
ZFM 54 13.60% 28 13.50% 26 12.70% 37 42.50% 17 5.20%
WantokFM 14 3.40% 8 3.80% 6 2.90% 8 9.20% 6 1.80%
RadioAus 1 0.20% 0 0.00% 1 0.50% 0 0.00% 1 0.30%
BBC 0 0.00% 0 0.00% 0 0.00% 0 0.00% 0 0.00%
Goodnews 4 1.00% 1 0.50% 3 1.50% 4 4.60% 0 0.00%
Other 8 1.90% 4 1.90% 4 2.00% 0 0.00% 8 2.40%
Incomplete 14 3.40% 7 3.40% 6 2.90% 5 5.70% 9 2.80%
Total 414100.60% 208100.00% 204100.00% 87 99.90% 327 100.00%
The most listened to radio station overall for the youth interviewed was PaoaFM (43.5%) followed by SIBC (33.6%) and then ZFM (13.6%). PoaFM is also reportedly the most listened to station in the provinces (50.5%) followed by SIBC at 37%. In Honiara alone, however, the most listened to station is ZFM with 42.5% of Honiara respondents reporting that they listen to that station most often. This was followed by SIBC (20.7%) and then PaoaFM (17.2%) There was no significant difference between the sexes, with 42.2% of females and 45.2% of males listening to PaoaFM most often, and 35.3% of females and 31.7% of males most often listening to SIBC Table 16: Which radio stations are best for music, news, or social issues
Which is the best radio station for…
1 2 3
SIBC Evaluation Part A- Survey Report Page 21

Music PaoaFM (55.6%) ZFM100 (17.4%) SIBC (12.8%)
News SIBC (89.9%) PAOAFM (2.9%) ZFM100 (1.9%)
Social Issues SIBC (73.7%) PaoaFM (9.4%) ZFM100 (1.4%)
When asked what station is best for music, PaoaFM was by far the most popular. SIBC was, however, overwhelmingly the most popular station for news and information about social issues. Figure 3: Which radio stations are best for music, news, or social issues
What is the best radio station for:
0% 20% 40% 60% 80% 100%
Music
News
Social IssuesPAOA FM SIBCZFM 100 Wantok FM Radio AustraliaBBCGood News RadioOther/UnsureIncomplete
Table 17: Radio program formats
What do you like listening to?
Freq Percent
Music only 71 17.10%
Talk only 8 1.90%
Mix of music & talk 332 80.20%
Incomplete 3 0.70%
Total 414 99.90%
A mixture of music and talk is overwhelmingly the most popular format for radio programs (80.2%), followed by music only (17.1%). Talk shows are not popular among the youth surveyed with only 1.9% reporting it as their preferred format. Figure 4: Preferred type of radio programs
SIBC Evaluation Part A- Survey Report Page 22

46%
2%
55%
27%
10%
40%
21%
21%
19%
12%
1%
0% 10% 20% 30% 40% 50% 60%
New s
Traditional music
Island music
Modern music
Talkback show s
Requesting songs
Kastom stories
Educational
Service messages
Devotional/religious
Other show
Preferred Types of Radio Programs
When asked what types of radio programs the youth surveyed liked to listen to, their preferred types of programs were Island Music (55%) followed by News (46%) and then requesting songs (40%). Modern music (27%), Kastom stories (21%) and educational programs (21%) were also reported to be popular types of radio programs.
4.5 Radio Magazine ‘Youth for today, leaders of today’ Table 18: Programs that youths have listened to
Have you ever listened to any of the following programs?
yes %yes Male Freq
Male Percent
Female Freq
Female Percent
HoniaraFreq
HoniaraPercent
ProvincialFreq
Provincial Percent
Gavman Blong Iu 103 24.90% 10 4.80% 44 21.60% 20 23.00% 83 25.40%
Walkabout Long Solomon 30 7.20% 14 6.70% 16 7.80% 9 10.30% 21 6.40%
Youth of Today, Leaders for Today 237 57.20% 123 59.10% 113 55.40% 41 47.10% 196 59.90%
Voice Blong Mere Solomon 176 42.50% 89 42.8 86 42.20% 45 51.70% 131 40.10%
Incomplete 20 4.80% 10 4.80% 10 4.90% 1 1.10% 19 5.80%
SIBC Evaluation Part A- Survey Report Page 23
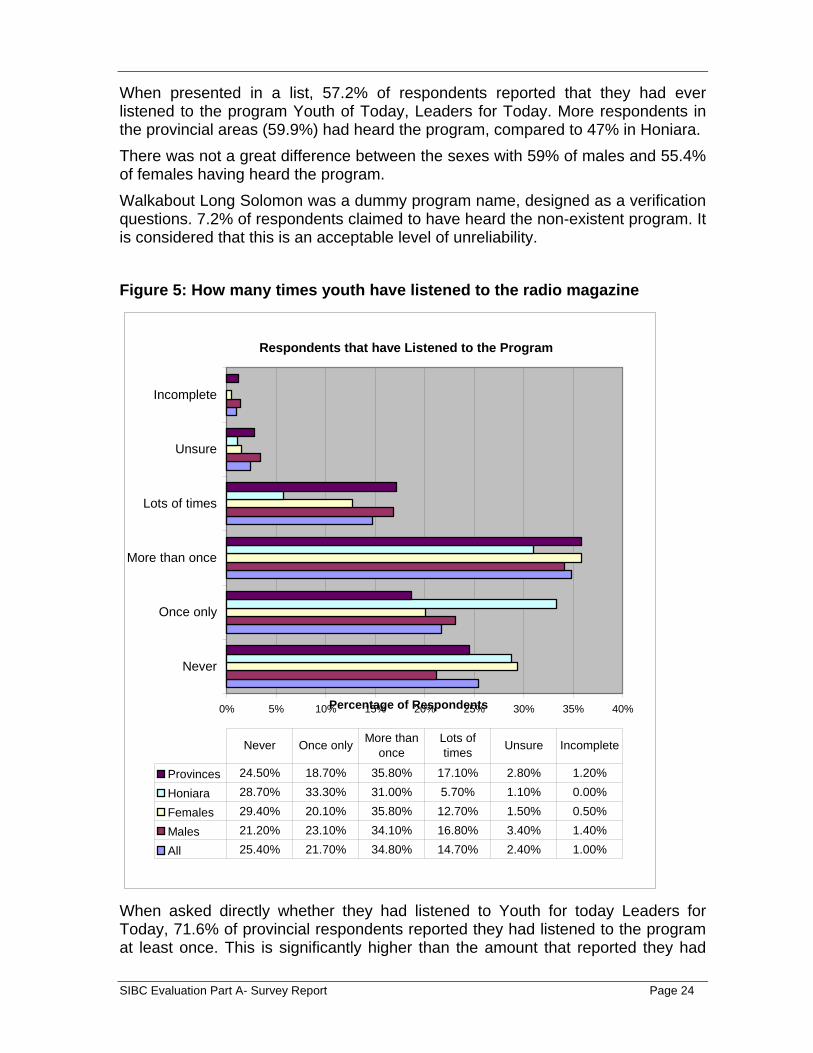
When presented in a list, 57.2% of respondents reported that they had ever listened to the program Youth of Today, Leaders for Today. More respondents in the provincial areas (59.9%) had heard the program, compared to 47% in Honiara. There was not a great difference between the sexes with 59% of males and 55.4% of females having heard the program. Walkabout Long Solomon was a dummy program name, designed as a verification questions. 7.2% of respondents claimed to have heard the non-existent program. It is considered that this is an acceptable level of unreliability. Figure 5: How many times youth have listened to the radio magazine
Respondents that have Listened to the Program
0% 5% 10% 15% 20% 25% 30% 35% 40%
Never
Once only
More than once
Lots of times
Unsure
Incomplete
Percentage of Respondents
Provinces 24.50% 18.70% 35.80% 17.10% 2.80% 1.20%
Honiara 28.70% 33.30% 31.00% 5.70% 1.10% 0.00%
Females 29.40% 20.10% 35.80% 12.70% 1.50% 0.50%
Males 21.20% 23.10% 34.10% 16.80% 3.40% 1.40%
All 25.40% 21.70% 34.80% 14.70% 2.40% 1.00%
Never Once only More than once
Lots of times Unsure Incomplete
When asked directly whether they had listened to Youth for today Leaders for Today, 71.6% of provincial respondents reported they had listened to the program at least once. This is significantly higher than the amount that reported they had
SIBC Evaluation Part A- Survey Report Page 24

listened to the program when it was presented in a list (57.2%). This may reflect that on prompting they did remember having heard it. Figure 6: Rating the radio magazine
Program Description
Educational and entertaining
57%
Unsure11%
Incomplete1%
Entertaining but not educational
5%
Educational but not entertaining
24%
Not educational or entertaining
2%
Of those respondents who had reported listening to the program, 57% found it both educational and entertaining. A significantly higher proportion of respondents in the provinces found the program both educational and entertaining (63.7%), compared to 36.1% of Honiara respondents. Figure 7: Rating the radio magazine with gender and provincial comparisons
SIBC Evaluation Part A- Survey Report Page 25

Very in
teres
ting
Not ve
ry int
eresti
ng Provinces
Honiara
Females
Males
0%
10%
20%
30%
40%
50%
60%
70%
Rating Youth for Today
Overall, 88.5% of those surveyed who had listened to the program rated it as either very interesting or interesting. Slightly more males (90.2%) than females (87.1%) rated it as interesting or very interesting. Slightly more provincial respondents (89.7%) rated it as interesting or very interesting compared to 83.6% of those in Honiara. Of those that had listened to the program, 48.5% remembered at least one topic covered. More Honiara respondents (62%) remembered a topic covered compared to 44.9% of provincial respondents. Male and female respondents had similar recall of a topics covered with 49.4% and 47.9% respectively
4.5 Talk back shows Table 19: Knowledge of the talk back shows
Have you ever heard a talk back show for young people on the radio?
freqpercentage Male Freq
Male Percent
Female Freq
Female Percent
Honiara Freq
Honiara Percent
Provincial Freq
Provincial Percent
Yes 169 40.80% 94 45.20% 75 36.80% 30 34.50% 139 42.50%
No 231 55.80% 107 51.40% 123 60.30% 55 63.20% 176 53.80%
Unsure 11 2.70% 6 2.90% 4 2.00% 1 1.10% 10 3.10%
Incomplete 3 0.70% 1 0.50% 2 1.00% 1 1.10% 2 0.60%
Total 414 100.00% 208 100.00% 204 100.10% 87 99.90% 327 100.00%
SIBC Evaluation Part A- Survey Report Page 26
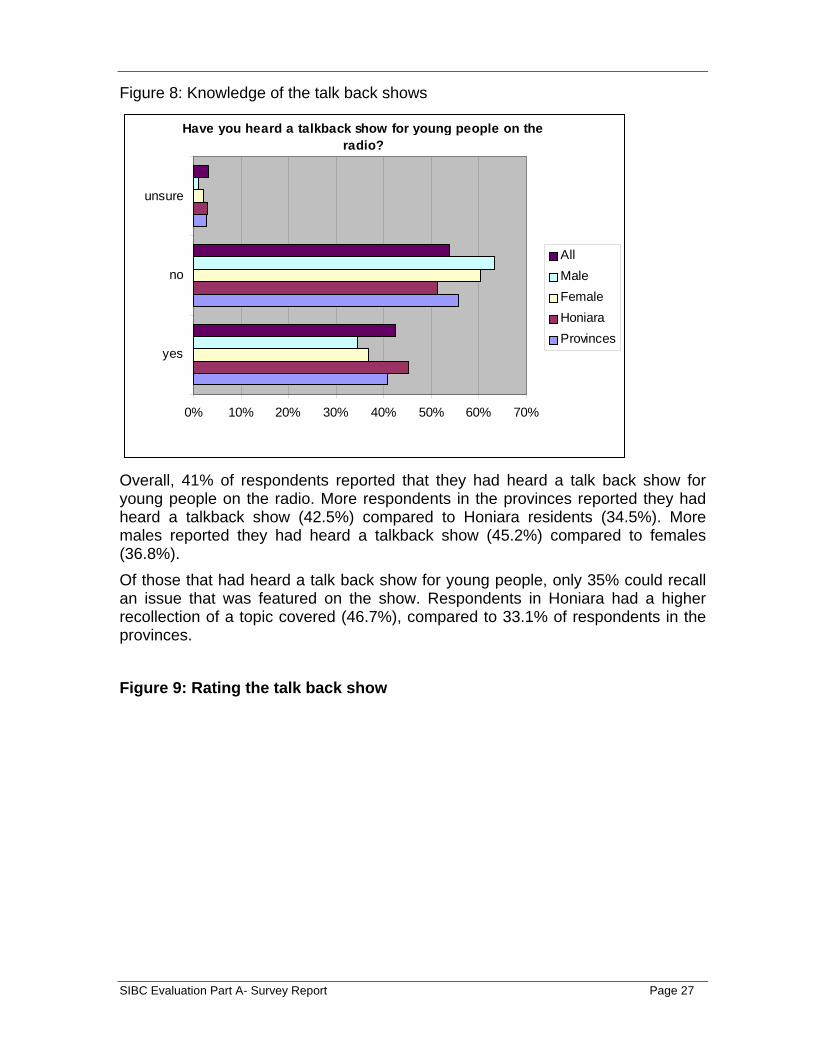
Figure 8: Knowledge of the talk back shows
Have you heard a talkback show for young people on the radio?
0% 10% 20% 30% 40% 50% 60% 70%
yes
no
unsure
AllMaleFemaleHoniaraProvinces
Overall, 41% of respondents reported that they had heard a talk back show for young people on the radio. More respondents in the provinces reported they had heard a talkback show (42.5%) compared to Honiara residents (34.5%). More males reported they had heard a talkback show (45.2%) compared to females (36.8%). Of those that had heard a talk back show for young people, only 35% could recall an issue that was featured on the show. Respondents in Honiara had a higher recollection of a topic covered (46.7%), compared to 33.1% of respondents in the provinces. Figure 9: Rating the talk back show
SIBC Evaluation Part A- Survey Report Page 27

Very int erest ing
Int erest ing
Not very int erest ing
Boring
Male Percent
Female Percent
Honiara Percent
ProvincialPercent
0%
10%
20%
30%
40%
50%
60%
70%
80%
Rating of Talkback Show
Of those that had heard a talk back show for young people, 77% found it either interesting or very interesting. Nearly all respondents in Honiara that had heard a talk back show for young people, found it interesting or very interesting (96.6%) compared to 73.4% in the provinces. Of those respondents in Honiara that had heard a talk back show for young people, 73.3% found it very interesting compared to 15.1% in the provinces. This could reflect the lack of access to telephones in provincial areas limiting participation and hence enjoyment in talk back shows.
SIBC Evaluation Part A- Survey Report Page 28

5. Analysis of project reach and share 5.1 Reach of the Talk Back Show and the Radio Magazine Reach is calculated as the percentage of the target audience who listened to at least some of the program in a set period of time. In this report we are assessing how many youths in the Solomon Islands listened to at least some of the radio magazine and talk back show in the from April 2006 until March 2007 (the running time for the program). Radio Magazine This report is also concerned with an evaluation of the indicator:
By the end of 2006, at least 30% of the target audience in the Solomon islands will have been reached by the radio magazine programme.
When given a list of several radio programs that included Youth of Today, Leaders for Today, a considerable 57.2% of respondents reported that they had listened to the radio magazine. More respondents in the provincial areas (59.9%) had heard the magazine, compared Honiara (47%). Slightly more males (59%) had heard the radio magazine than females (55.4%). Respondents were asked directly how many times they had listened to the program which provided the following results:
• Of all respondents, 71.2% had listened to it more than once, and 14.7% had listened lots of times.
• 71.6% of provincial respondents had listened to the radio magazine at least once, and 17% of provincial respondents had listened lots of times.
• In comparison, 70% of respondents in Honiara had heard the radio magazine at least once, with only 5.7% in Honiara listening lots of times.
• 68.6% of females had listened at least once, compared to 74% of males. As verification of the reach of the radio magazine a further question was asked of those who had heard it at least once, to see who could remember a topic covered by the program:
• Of those who had listened to the radio magazine, 48.5% remembered at least one topic featured.
• 62% of Honiara respondents remembered one topic, compared to 44.9% of provincial respondents.
• Male and female respondents had similar recall at least one of the topic covered with 49.4% and 47.9% respectively.
Having established the reach of the radio magazine it is also valuable to consider how respondents rated the program:
• 88.5% rated the program as either very interesting or interesting.
SIBC Evaluation Part A- Survey Report Page 29
• 90.2% of respondents who rated the program highly were males, compared to 87.1% of females.
• 89.7% of provincial respondents rated it as interesting or very interesting compared to 83.6% of those in Honiara.
In addition to the reach achieved as reported above, 33% of respondents listen to the radio with schoolmates, friends or family of their own age, indicating a further reach achieved by the program. The radio magazine has, therefore, far exceeded the reach indicator across the country and within all of the groups. The program reached well over 30% of its target audience in each category of those who had heard the radio magazine more than once. In addition, theability of the respondents to recall at least one topic covered in the radio magazine was also strong across all categories. The radio magazine was also felt to be both educational and entertaining by 57% of respondents showing that the radio magazine has not only been heard by the target audience in large numbers but has also appealed to its target audience. Talk back show 2 out of 5 youth surveyed had heard a youth talk back show on the radio. The talk back show funded by UNICEF is the only youth talk back show, so it is reasonable to believe that they are referring to the talk back show in question. The reach of the talk back show was therefore 40%. When looking at the 40% of youths who had listened to the show, the following key points were revealed:
• Slightly more males (45%) than females (36%) listened to the talkback show.
• More respondents in the provinces reported they had heard a talkback show (42.5%) compared to Honiara residents (34.5%).
• Only 35% could recall an issue that was featured on the show. Respondents in Honiara had a higher recollection of a topic covered (46.7%), compared to 33.1% of respondents in the provinces.
• Of those respondents in Honiara that had heard the talk back show, 73.3% found it very interesting compared to 15.1% in the provinces. This could possibly reflect the lack of access to telephones in provincial areas limiting participation and hence enjoyment in talk back shows.
Having established the reach of the radio magazine it is also valuable to consider how respondents rated the program. Three out of four youths (77%) found it either interesting or very interesting.
5.2 Share The share is the percentage of young people listening to radio at a certain time who are also listening to SIBC programs. As noted in the methodology section of this report, it was impractical to take a strictly mathematical approach to calculating share. Therefore, a combination of three approaches were used.
SIBC Evaluation Part A- Survey Report Page 30
What radio station had youths last listened to Respondents were asked what station they had listened to last time they listened to the radio which revealed that:
• 49% of respondents last listened to SIBC, 43.2% to PaoaFM and 13% to ZFM.
• SIBC was last listened to by 52% of females, being greater than males at 46.6%.
• In Honiara SIBC was last listened to by 39.1% of respondents, PaoaFM by 28.7% and ZFM by the largest number at 43.7%.
• In the provinces PaoaFM was last listened to by 47.1% of respondents, and SIBC by 51.7%.
These results show that more respondents last listened to SIBC than any other station, including respondents in provincial areas where there is only one alternative – PaoaFM, although it does not attract a significantly larger audience than PaoaFM overall. In Honiara, the number of respondents who last listened to SIBC was lower, with more listening to ZFM than both SIBC and PaoaFM. More females last listened to SIBC than males. What stations had youth listened to in the last week A further calculation was made to consider the stations last listened in more detail. A selection was made of respondents who had listened in the within the period of the last week to see what station was listened to.
• It was found that 41.4% of youths had listened to SIBC, 40.2% had listened to PaoaFM and 13.6% last listened to ZFM.
• 42.5% of males and 37% of females had last listened to PaoaFM, and 40% of males and 42.3% of females had listened to SIBC.
• In the provinces 46.6% had last listened to PaoaFM and 45.2 had last listened to SIBC.
• In Honiara 21.6% had last listened to PaoaFM, 29.7% last listened to SIBC and 34.2% last listened to ZFM.
This question showed a slightly lower share for SIBC but not a large reduction. More male and fewer female respondents listened to PaoaFM than in the previous section. In general this analysis confirmed the previous analyses undertaken. What stations did youths listen to most A result that is also of relevance to a discussion about market share is the station the respondent reports that they listen to the most.
• 43.5% of all respondents reported they listened to PaoaFM most often, and just 33.6% listen to SIBC most often. This is in contrast to the 49% who last listened to SIBC.
SIBC Evaluation Part A- Survey Report Page 31

• 45.2% of males listen to PaoaFM most often, followed by 31.7% who listen to SIBC and 13.5% who listen to ZFM.
• 42.2% of females listen to PaoaFM most often, 31.7% listen to SIBC most often and 12.7% listen to ZFM most often.
• 42.5% of Honiara respondents reported that they listen to ZFM most often, 20.7% listen to SIBC most often (compared to 39.1% who last listened to SIBC), and 17.2% listen to PaoaFM most often.
• 50.5% of provincial respondents reported that they listen to PaoaFM most often, and 37% reported SIBC.
Analysis of the three approaches This data relating to station preference reflects a variation in the SIBC market share showing that perhaps it is not as high as the initial analysis showed possibly with a lower share in both Honiara and in the provinces. Respondents, however, may have expressed their station of preference when asked about the station listened to most often, when in fact they most recently listened to SIBC. 47.6% respondents said they listened to the radio with family and friends of a different age and station choice is may reflect this. It can be concluded that SIBC is the most widely listened to station by young peopleacross the country, although PaoaFM is a close second. Broadcasting on ZFM in Honiara is likely to increase the reach of the program in Honiara – although this is currently already high at 70%.
6. Conclusions This report has assessed how many youths in the Solomon Islands listened to at least some of the Youth for Today, Leaders for Today radio magazine in the past year (reach), and what percentage of youths who listen to the radio listen to SIBC (share). The evaluation involved completing questionnaires using face to face interviews with 414 youth between the ages of 15-22 in three rural areas and one urban area of Solomon Islands, a sample that was designed to be reflective of the Solomon Islands population. The data collected provided results relating to the characteristics of the sample population, their listening habits, their opinions and preferences on radio, and their opinions and preferences of the Youth for Today, Leaders for Today program. It also looked in detail at the reach achieved by the program and the share of SIBC in comparison to other radio stations. Reach of the Radio Magazine It was found that 57.2% of youths in the Solomon Islands listened to at least some of the radio magazine in the past year.
SIBC Evaluation Part A- Survey Report Page 32
• More males (59%) had heard the program than females (55.4%) • More respondents in the provincial areas (59.9%) had heard the magazine,
compared Honiara (47%). • Of all respondents, 71.2% had listened to it more than once, and 14.7% had
listened lots of times. Reach of the Talk Back Show It was found that the talk back show reached 40% of youths in the Solomon Islands.
• Of those who had listened to the show, slightly more youths were males (45%) than females (36%).
• More respondents in the provinces reported they had heard a talkback show (42.5%) compared to Honiara residents (34.5%).
• Of those respondents in Honiara that had heard the talk back show, 73.3% found it very interesting compared to 15.1% in the provinces. This could reflect the lack of access to telephones in provincial areas limiting participation and hence enjoyment in talk back shows.
• Three out of four youths (77%) found it either interesting or very interesting. Share of both youth pragrams SIBC is the most widely listened to station by youth across the country, although PaoaFM is a close second. Broadcasting on ZFM in Honiara is likely to increase the reach of the program in Honiara – although this is currently already high at 70%. The key findings were:
• 49% of youths last listened to SIBC, 43.2% to PaoaFM and 13% to ZFM.
• SIBC was last listened to by more females (52%) than males (46.6%).
• Youths listen to PaoaFM more often (43.5%) than SIBC (33.6%)
• The majority of youths report that SIBC is the best station news (89.9%) and social issues (73.7%).
In conclusion, the radio magazine reached at least 57% of young people in the Solomon Islands, whilst the talk back show reached 40% of young people in the Solomon Islands. Youths claim to listen to PaoaFM more often, but the findings show that SIBC has the largest share of youth listeners in the Solomon Islands, although this is followed closely by PaoaFM. SIBC is considered by youths to be the best station for news and social issues.
7. Attachments Attachment One: Sample Design Data Attachment Two: Instructions for Survey Staff Attachment Three: Survey
SIBC Evaluation Part A- Survey Report Page 33
SIBC Evaluation Part A- Survey Report Page 34
Attachment Four: Village report form for survey team in rural areas
SIBC Evaluation Part A- Survey Report Page 35
Attachment One: Sample Design Data
POPULATIONS Males Females Ymales Yfemales Children Total 1 2 3 4 5 6Isabel
Hograno
Alualu
44 45 20 9 78 196 S 250 10050 0.024876 1 250 3854 0.0649
Gove 38 48 20 21 56 183 S 250 10050 0.024876 1
Kabahega 13 12 3 5 8 41 VS 50 10050 0.004975 0
Kava 110 110 30 23 76 349 S 250 10050 0.024876 1
Koge B 1250 10050 0.124378 4 1250 3854 0.3243
Kolomola 100 135 280 255 - 770 M 750 10050 0.074627 3
Kolotubi 231 233 48 39 174 725 M 750 10050 0.074627 3
Kosisi 52 52 70 76 - 250 S 250 10050 0.024876 1 250 3854 0.0649
Siligofu S 250 10050 0.024876 1
Tuseli 22 23 18 16 30 109 S 250 10050 0.024876 1
Maringe/Kokota
Banisokeo
M 750 10050 7.462687 3
Gnulahage B 1250 10050 12.43781 4
Goveo M 750 10050 7.462687 3 750 3854 0.1946
Hovukoilo 205 455 112 112 220 1104 B 1250 10050 12.43781 4 1104 3854 0.2865
Kolomola 39 41 14 19 40 153 S 250 10050 2.487562 1
Kolosori 44 45 20 9 78 196 S 250 10050 2.487562 1 250 3854 0.0649
Kubolota 82 92 31 28 278 511 M 750 10050 7.462687 3
Popoheo 52 52 28 26 69 227 S 250 10050 2.487562 1
Sogolona 24 25 5 10 58 122 S 250 10050 2.487562 1
Malaita 10050 36 3854
Central Kwara'ae
Aiofa / Aimarako 17 22 13 5 40 97 VS 50 8900 0.005618 1
SIBC Evaluation Part A- Survey Report Page 36
Aligegeo
46 28 7 8 61 150 S 250 8900 0.02809 6Busuwali S 250 8900 0.02809 6Fiu 230 198 28 18 121 595 M 750 8900 0.08427 18Gwaisaia 11 13 19 10 29 82 VS 50 8900 0.005618 1Kelekwai S 250 8900 0.02809 6Kilusakwalo 341 371 298 328 - 1338 B 1250 8900 0.140449 31Kwalubusu S 250 8900 0.02809 6Namobaula S 250 8900 0.02809 6Niniu 51 35 8 3 19 116 S 250 8900 0.02809 6Aoke / Langa Langa
Abololo - - - - - M
0.140449
750 8900 0.08427 18Aialau 24 27 5 6 31 93 S 250 8900 0.02809 6Arabala B 1250 8900 31Balai 12 12 11 6 31 72 VS 50 8900 0.005618 1Buloabu S 250 8900 0.02809 6Foau S 250 8900 0.02809 6Gwaedalo - - - - - M 750 8900 0.08427 18Loreto S 250 8900 0.02809 6Surabita B 1250 8900 0.140449 31Suu S 250 8900 0.02809 6Guadalcanal 8900 219
North Guadalcanal
Dadave
M 750 10850 0.069124 7Ghorabau M 750 10850 0.069124 7Komuporo M 750 10850 0.069124 7Komuvaolu M 750 10850 0.069124 7Kuara B 1250 10850 0.115207 12Ngalibiu VS 50 10850 0.004608 0Ngalimera 32 32 20 20 - 104 S 250 10850 0.023041 2
SIBC Evaluation Part A- Survey Report Page 37
Roroni
M 750 10850 0.069124 7Suaghi B 1250 10850 0.115207 12Vutu B 1250 10850 0.115207 12Central Guadalcanal
Ando
VS 50 10850 0.004608 0
Vura S 250 10850 0.023041 2Kwai S 250 10850 0.023041 2Chichinge 74 66 74 112 72 320 S 250 10850 0.023041 2Katihana S 250 10850 0.023041 2Mataruka 58 69 80 112 127 388 S 250 10850 0.023041 2Namaraoni 25 26 26 41 33 125 S 250 10850 0.023041 2Pamphylia 41 41 37 64 64 206 S 250 10850 0.023041 2Pao Relocation S 250 10850 0.023041 2Raho Tita S 250 10850 0.023041 2Sungina 35 38 63 38 - 174 S 250 10850 0.023041 2Vuramali S 250 10850 0.023041 2New Koloula (not BLESS village) 37 33 42 50 49 174 S 250 10850 0.023041 2TOTAL 2090 2379 1430 1469 1842 9210 10850 107
1000+ Big (B) B 500-1000 Medium (M) M
100-500 Small (S) S
Less than 100 Very Small (VS) VS
32

Attachment Two: Instructions for Survey Team
UNICEF Survey- Instruction Sheet for SIDT and Honiara Youth Field Staff 1. Provide letter to Provincial Member Letters will be provided for Provincial Members- CDW’s to distribute before surveying starts
2. Travel to villages following the Sample Selection Only visit villages in the sample selection, and only interview the number of youths specified.
3. In each village randomly select youths to interview “Random Selection” means – everyone (within the age group) has equal chance of being a participant. Methods of random selection:
a) Put names of every youth in bag, and select out (make sure even female, male) b) Go to chief’s house/store, toss a coin for which direction to take (left or right), pick a number (or
ask someone to pick a number), walk past that number of houses, then ask if there is a person between 15-22 in the house.
c) Point with arm out, spin around with eyes shut until someone says stop, pick number and go to that house to ask for young person.
d) Any other ideas??
Remember- Interviewing youths who approach you or the ones you know is not random selection.
4. Conduct the Questionnaire with the randomly selected youths Don’t:
- Don’t tell the respondent which program you are evaluating - Don’t record names (survey is anonymous) - Don’t prompt questions (don’t suggest answers unless it is necessary in the question) - Don’t skip questions or go too fast - Don’t stop the interview in the middle - Don’t let other people answer questions (interview one at a time) - Don’t provide too much explanation (if unsure, tick unsure) - Don’t show anyone surveys other than SIDT employees after they have been filled in- all
surveys are confidential Do:
- Do fill in the province, village and sex on each form - Do tick at least one box in each question - Do complete all questions - If you make a mistake, go over box again (make it clear which box is ticked) - Do complete the number of surveys assigned for each village (if unable, explain why in short
report)
SIBC Evaluation Part A- Survey Report Page 38

5. Write a brief report for each village - Fill in one report form for every village - Which random selection method you used, and explain why you chose that method - Any problems you encountered - Any comments or interesting facts you may have heard about radio listening. - Honiara surveying staff are also required to each write a one page report at the end of the
week, explaining where they surveyed, how many youths they surveyed and addressing the same questions
6. Budget through out and send acquittals with surveys - Record expenditure in notebook (give details: date, item purchased, what needed for, how
much it cost). Please note that food is included in your allowance. - Keep all receipts together – group them into categories if possible - Send expenditure notebook, receipts, village reports, and surveys together to the SIDT
Honiara Office. - Return unspent money to SIDT within one week of finishing the surveys (send back with
completed questionnaires).
SIBC Evaluation Part A- Survey Report Page 39
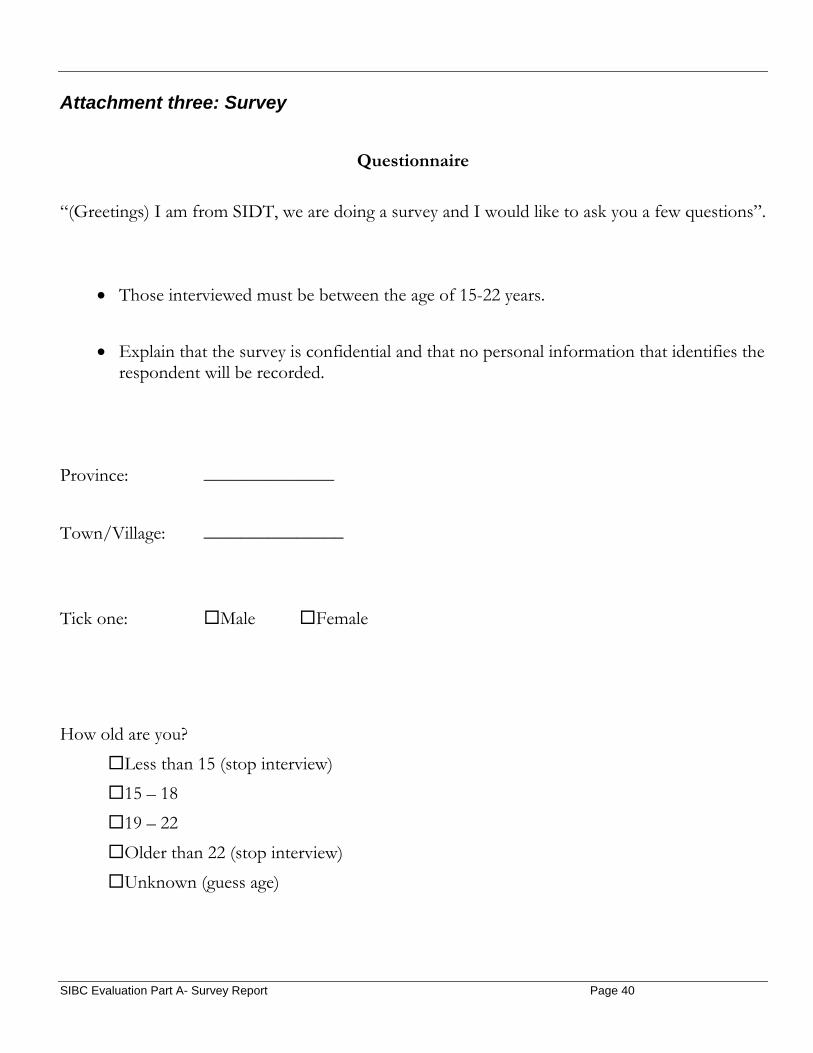
Attachment three: Survey
Questionnaire
“(Greetings) I am from SIDT, we are doing a survey and I would like to ask you a few questions”.
• Those interviewed must be between the age of 15-22 years.
• Explain that the survey is confidential and that no personal information that identifies the respondent will be recorded.
Province: ______________ Town/Village: _______________
Tick one: Male Female How old are you?
Less than 15 (stop interview) 15 – 18 19 – 22 Older than 22 (stop interview) Unknown (guess age)
SIBC Evaluation Part A- Survey Report Page 40

1. Are you currently…
(Tick one only)
working (paid)
working (non formal/voluntary)
working (gardening/cooking at home)
studying (at school)
studying (at USP/other tertiary)
studying (at a RTC)
studying (non formal)
Other
2. Where do you live for most of the year?
(Tick one only)
In a village
In an urban village
In a provincial centre (eg. Auki, Buala)
At school (boarding)
In Honiara
Other
3. Do you own a radio?
Yes No Other
4. Do you have a radio in the house you usually sleep in or nearby?
Yes No Other
5. Do you have access to a working radio with batteries? (Tick one only)
Always
Usually
Sometimes
Not very often
Never
Unsure
SIBC Evaluation Part A- Survey Report Page 41

6. Which radio stations can you receive where you live?
PAOA FM
SIBC (Radio Happy Isles)
ZFM 100
Wantok FM
Radio Australia
BBC
Good News Radio
Other/Unsure
7. When was the last time you listened to the radio? (Tick one only) Today
Yesterday
Less than 1 week ago
More than 1 week ago
1 month ago
More than one month ago
More than one year ago
Other
8. How often do you listen to the radio?
(Tick one only)
Every day
Once a week
Not very often
Never
Other
9. Which radio stations did you listen to the last time you listened to the radio?
PAOA FM
SIBC (Radio Happy Isles)
ZFM 100
Wantok FM
Radio Australia
SIBC Evaluation Part A- Survey Report Page 42

BBC
Good News Radio
Other/Unsure
10. Which one radio station do you listen to most often? (Tick one only) PAOA FM
SIBC (Radio Happy Isles)
ZFM 100
Wantok FM
Radio Australia
BBC
Good News Radio
Other/Unsure
11. What time of the day do you usually listen to the radio?
Early morning
Late morning
Lunchtime
Early afternoon
Late afternoon
Dinner time
After dinner
Late at night
12. Who do you usually listen to the radio with? (Tick one only) Schoolmates
Friends/family your own age
Friends/family of different ages
Alone
Other
13. Which types of radio programs do you like most?
News
SIBC Evaluation Part A- Survey Report Page 43

Traditional music (panpipes, bamboo)
Island music
Modern music
Talkback shows
Requesting songs
Kastom stories
Educational
Service messages
Devotional/religious
Other/Unsure
14. Which is the best radio station for music?
(Tick one only)
PAOA FM
SIBC (Radio Happy Isles)
ZFM 100
Wantok FM
Radio Australia
BBC
Good News Radio
Other/Unsure
15. Which is the best radio station for news?
(Tick one only)
PAOA FM
SIBC (Radio Happy Isles)
ZFM 100
Wantok FM
Radio Australia
BBC
Good News Radio
Other/Unsure
SIBC Evaluation Part A- Survey Report Page 44
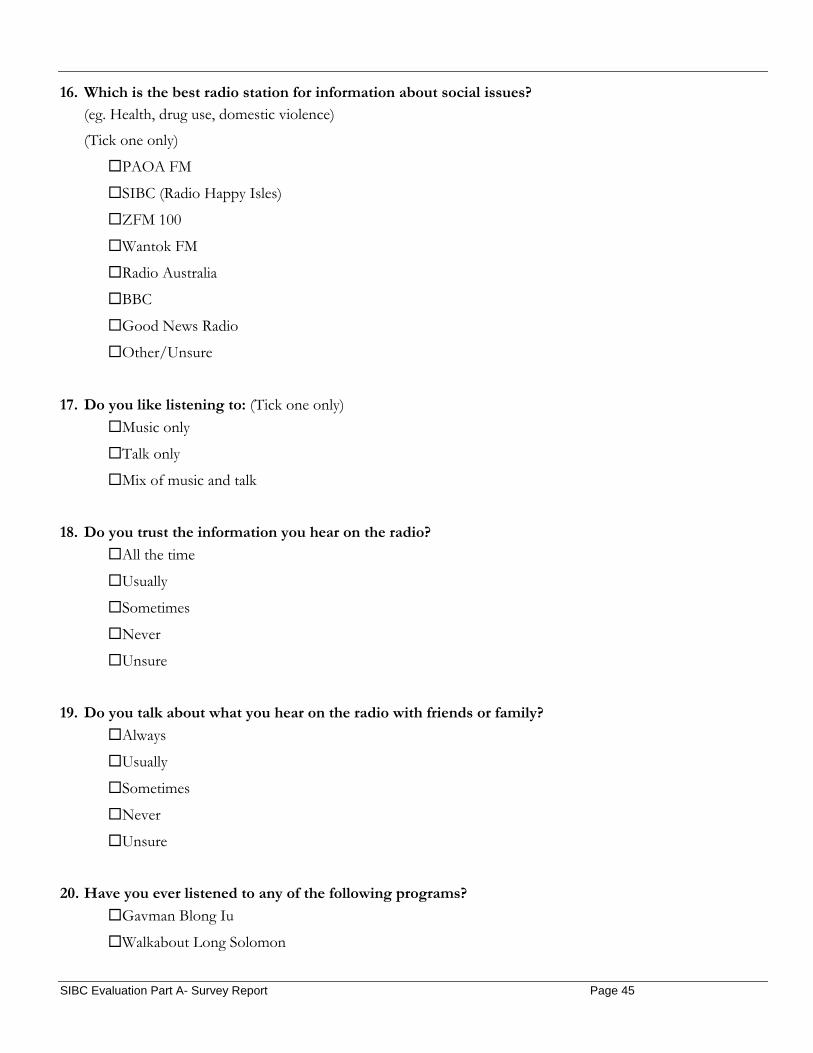
16. Which is the best radio station for information about social issues?
(eg. Health, drug use, domestic violence)
(Tick one only)
PAOA FM
SIBC (Radio Happy Isles)
ZFM 100
Wantok FM
Radio Australia
BBC
Good News Radio
Other/Unsure
17. Do you like listening to: (Tick one only) Music only
Talk only
Mix of music and talk
18. Do you trust the information you hear on the radio?
All the time
Usually
Sometimes
Never
Unsure
19. Do you talk about what you hear on the radio with friends or family?
Always
Usually
Sometimes
Never
Unsure
20. Have you ever listened to any of the following programs?
Gavman Blong Iu
Walkabout Long Solomon
SIBC Evaluation Part A- Survey Report Page 45
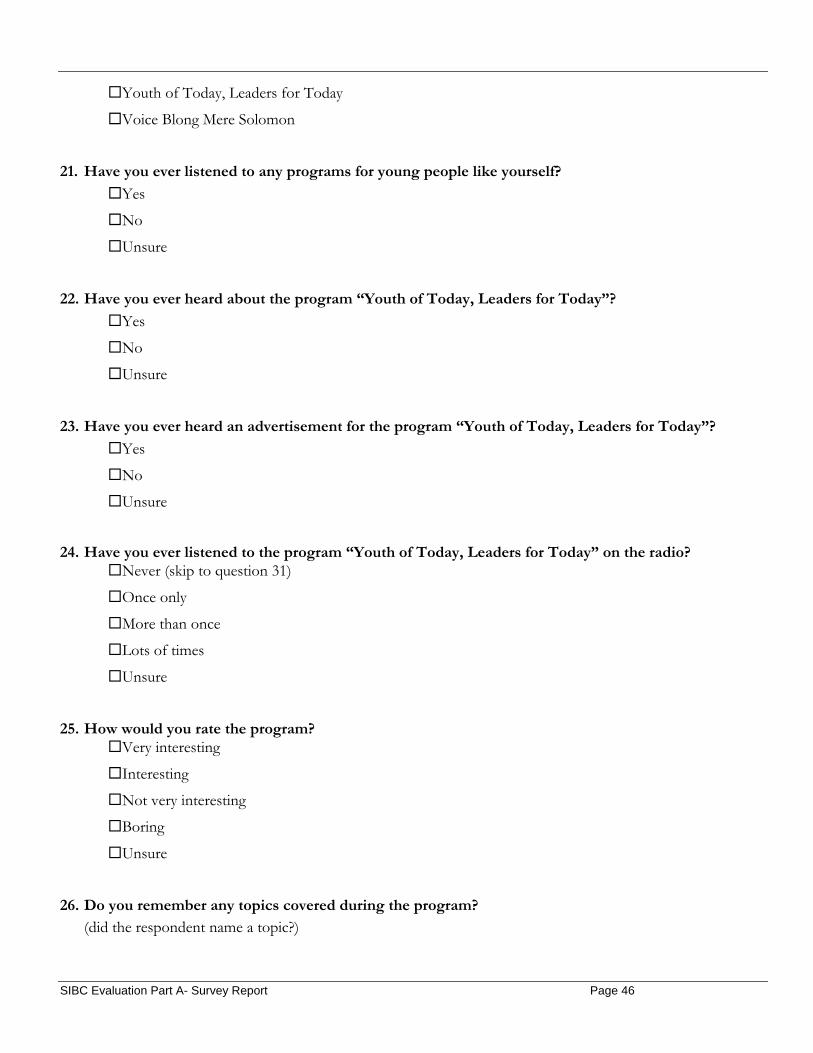
Youth of Today, Leaders for Today
Voice Blong Mere Solomon
21. Have you ever listened to any programs for young people like yourself?
Yes
No
Unsure
22. Have you ever heard about the program “Youth of Today, Leaders for Today”?
Yes
No
Unsure
23. Have you ever heard an advertisement for the program “Youth of Today, Leaders for Today”?
Yes
No
Unsure
24. Have you ever listened to the program “Youth of Today, Leaders for Today” on the radio? Never (skip to question 31)
Once only
More than once
Lots of times
Unsure
25. How would you rate the program? Very interesting
Interesting
Not very interesting
Boring
Unsure
26. Do you remember any topics covered during the program?
(did the respondent name a topic?)
SIBC Evaluation Part A- Survey Report Page 46
Yes
No
Unsure
27. Did you find the program:
(Tick one)
Entertaining but not educational
Educational but not entertaining
Both educational and entertaining
Not educational or entertaining
Unsure
28. Did you listen to the program “Youth of Today, Leaders for Today” last week?
Yes
No (skip to question 31)
Unsure (skip to question 31)
29. If yes, on which station did you hear it?
(Tick one only)
PAOA FM
SIBC (Radio Happy Isles)
ZFM 100
Wantok FM
Radio Australia
BBC
Good News Radio
Other/Unsure
30. Do you remember the topics covered during the program?
(did the respondent name a topic?)
Yes No Unsure
31. Have you ever heard a talk back show for young people on the radio? (Refer to the explanation of a talk back program if neeeded).
SIBC Evaluation Part A- Survey Report Page 47
Yes No (end interview) Unsure
32. Do you remember any issues that were featured on the talkback show? (did the respondent name any of the topics?) Yes No Unsure
33. How would you rate the talkback show?
Very interesting
Interesting
Not very interesting
Boring
Unsure
Thank the participant for their time and cooperation
SIBC Evaluation Part A- Survey Report Page 48

Attachment four: Village report form for survey team in rural areas
UNICEF SURVEY - VILLAGE REPORT FORM FOR SIDT FIELD STAFF
Province: Constituency:
Name of village: Date visited:
Time of arrival in village: Approx. no of hour(s) surveying:
Number of males surveyed: Number of females surveyed:
Which random selection method did you use?
Why did you choose that method?
Did you have any problems whilst surveying?
Any other comments?
If you need more space turn page over and write on the back
Village report form completed by:
Name(s):
Signature(s): Date signed:
SIBC Evaluation Part A- Survey Report Page 49