evaluation of stereoscopic geoeye-1 satellite imagery …
TRANSCRIPT

EVALUATION OF STEREOSCOPIC GEOEYE-1 SATELLITE IMAGERY TO ASSESS LANDSCAPE AND STAND LEVEL CHARACTERISTICS
K. Kliparchuk, M.Sc, GISP a, Dr. D. Collins, P.Geo. b
a Hatfield Consultants Partnership, 200-850 Harbourside Drive, North Vancouver, BC, V7P0A3 Canada –
[email protected] b BC Ministry of Forests and Range, Coast Forest Region, 2100 Labieux Road, Nanaimo, BC, V9T6E9, Canada -
Commission I, WG I/3 KEY WORDS: Remote sensing, GeoEye-1, effectiveness evaluation, forest resource management, stereo, photogrammetry ABSTRACT: An ongoing remote sensing project has been underway within the Coast Forest Region since 2000. The initial parts of the project investigated the application of commercially available high-resolution satellite imagery to resource feature mapping and compliance and enforcement surveillance. In the current project, stereo imagery from the new GeoEye-1 satellite was acquired. This system provides 0.5m panchromatic and 1.65m colour imagery, which is approximately a four time increase in spatial resolution compared to IKONOS imagery. Stereo imagery at this resolution enables the delineation of single trees, coarse woody debris measurement and the generation of Digital Elevation Models and estimation of volumes of material displaced by landslides. Change detection and identification of high priority zones for Compliance & Enforcement investigation is greatly enhanced. Results of this research are presented and discussed.
1. INTRODUCTION
1.1 Introduction
The initial focus of the project was to investigate the application of commercially available high-resolution satellite imagery to resource feature mapping and compliance and enforcement surveillance. A previous published study by the authors in 2008 extended the use of high resolution IKONOS imagery through the acquisition of reference stereo IKONOS imagery and analysis of the imagery using KLT softcopy photogrammetry for forest cover, topographic, and landslide mapping Using GeoEye-1 imagery, our goals were to: - assess the increase in detail of topographic mapping of a
watershed using GeoEye-1 imagery compared with the same areas compiled from the IKONOS imagery;
- assess the change within a major landslide between the 2007 IKONOS and the 2009 GeoEye-1 imagery.
1.2 Study Areas
Two areas were selected for this analysis. The Hesquiat area (Figure 1a), is located in and around Clayoquot Sound on the west coast of Vancouver Island. The area’s topography ranges from flat to steep-sided terrain, with elevations ranging from sea level along the coastal plain north of the Estevan Peninsula, to approximately 1,000 m elevation inland. Much of the area was logged in the 1960s and into the 1980s, but some recent variable retention logging has been conducted. There are numerous pre-Forest Practices Code landslides and some natural landslides in the area, many of which were initiated during an intense storm cycle in January 1996.
Figure 1. Study area locations (shown in red rectangles). a)
Hesquiat Inlet (left), b) Moses Inlet (right). The weather on the west coast of Vancouver Island is dominated by Pacific cyclones that cause significant cloud cover and precipitation. The area is situated within the transition between the very humid and very wet maritime Coastal Western Hemlock biogeoclimatic zones (CWHvh and CWHvm). The Moses Inlet area (Figure 1b) is within the hypermaritime, Coastal Western Hemlock, Submontane and Montane Very Wet Hypermaritime (CWHvm1 or vm2), which occurs along the windward slopes of the Coast Mountains. (Coast Forest Region, BEC WEB http:// www.for.gov.bc.ca/rco/research/eco/bec_web/dni.htm).
2. METHODOLOGY
2.1 GeoEye-1 Satellite and Data Acquisition
GeoEye-1 was launched on September 6, 2008, and orbits at an altitude of approximately 684 km. The satellite is one of the latest generation of satellites, collecting very high spatial resolution optical image data with a 0.41 meter resolution panchromatic sensor and a 1.64 meter resolution multispectral sensor. The 0.41 meter panchromatic imagery is resampled and delivered at 0.5meter resolution for non-military users. For this project, 0.5m pan-fused colour GeoStereo imagery was ordered. The sensor for both satellites can be pointed up to 60 degrees off nadir in order to generate stereo image pairs. Two sets of in-track stereo images were acquired in the fall of 2009 (Figures 2

and 3). All GeoEye-1 images shown are copyright GeoEye Corp.
Figure 2. September 27, 2009 GeoEye-1 natural colour image coverage of Hesquiat / Mooyah area. (Left image on left, right
image on right) 2.2 Creation of Colour Composite Images
Colour composite image combinations were produced from the GeoStereo GeoEye-1 images using the ER Mapper and PCI image processing systems: 1) red, green and blue channels fused with panchromatic image; 2) near infrared, red, green channels fused with panchromatic image. The image combinations were enhanced using manual contrast stretching. These composite stereo pair images were loaded into a KLT softcopy photogrammetric workstation for stereo visual analysis using polarized goggles. 2.3 Photogrammetric Data Input
The KLT softcopy photogrammetric software (www.kltassoc.com) was used for stereo setup and viewing. The stereo GeoEye-1 imagery is supplied with Rational Polynomial Coefficients (RPC) files, which contain a series of coefficients used to describe the relationship between the image as it existed when captured and the Earth’s surface. The RPC files contain
Figure 3. October 8, 2009 GeoEye-1 natural colour image of
Moses Inlet area (Left image on left, right image on right) information that is needed to determine “interior” and “exterior” orientation, as well as supplemental information such as the geographic coordinates associated with the coordinates of the imagery. Individual stereo model setups were created for Hesquiat Inlet and for Moses Inlet. GeoStereo GeoEye-1 imagery, without supplemental ground control points, has a published positional accuracy of: - 4m horizontal accuracy CE90, and - 6m vertical accuracy at a 90% Confidence Level (CL). At this level of positional accuracy, GeoEye Corp. Indicates that 0.5m GeoStereo imagery can be used for topographic mapping up to 1:5,000 without additional ground control points (GCP). Fraser and Ravanbakhsh. (2009) noted geopositioning accuracy of 0.1m (0.2 pixels) in planimetry and 0.25m (0.5 pixel) in height can be attained with a single additional GCP. When the GeoEye-1image was overlaid on the IKONOS image from 2007, the two datasets coincided approximately +/- 3m for most areas. 2.4 Analysis of Images for Forest Cover and Landscape
From the stereo imagery, the following types of information products were generated: - Coarse Woody Debris Measurements (CWD) - Digital Elevation Model (DEM) compilation - Forest Cover Mapping - Land Cover Change Detection - Landslide Volume Measurement
3. RESULTS
3.1 Coarse Woody Debris
One key potential application for the sub-metre satellite imagery could be to measure the amount of CWD left within cutblocks. A cutblock within the Hesquiat Inlet area that is visible on both the 2007 and the 2009 satellite imagery was selected to measure CWD. Figure 4 shows the two dates of imagery over the cutblock. The measurements were undertaken using heads-up digitizing on the monoscopic orthorectified images. Table 2 provides

information on the CWD measured for each image. Three times more logs could be measured and digitized in the 0.5m GeoEye-1 imagery than in the earlier IKONOS imagery. This directly impacts the total length of logs reported as CWD. Number
of Logs Marked
Min Log Length
Max Log Length
Mean Log Length
Total Log Length
2007 54 4.50m 20.42m 9.37m 505.74m 2009 159 2.55m 25.60m 8.27m 1315.14m
Table 2. Log measurements of CWD analysis from 2007 and 2009 images.
3.2 Digital Elevation Model
A DEM was previously produced by photogrammetrically using the natural colour IKONOS imagery acquired in 2007. With the higher spatial resolution GeoEye-1 satellite image from 2009, this area was recompiled to produce a new DEM for comparison. The spot heights and break lines were saved as 3D AutoCAD files and imported into ArcGIS. A Triangulated Irregular Network (TIN) model function was used to convert the points into a DEM with 10x10m grid cells. This process was applied to both the 2007 and the 2009 data. The two DEMs (Figures 5 and 6) were subtracted (2007 minus 2009) to produce a differenced grid (Figure 7). Statistics were calculated on the minimum, maximum, mean, median and standard deviation values for the grid difference values, in order to make an estimate of repeatability of compilation (Table 3).
Figure 4. CWD images. 2007 top image from IKONOS, 2009
bottom image from GeoEye-1.
Figure 5. DEM compiled from 2007 IKONOS image.
Figure 6. DEM compiled from 2009 GeoEye-1 image.
Most of the differenced grid is “grey”, indicating minimal difference between grids. The largest differences are in the negative values, which represent 2009 height values larger than 2007 values (2007 – 2009 = difference grid). The large negative values occur both on the north and south sides of the drainage area. These areas have both flat valleys and steep-sided slopes. It is possible that the 2009 GeoEye-1 image height values are slightly more accurate due to the smaller pixel size, allowing a more accurate elevation point to be captured on the ground surface, however this assumption needs to be validated.

Figure 7. Differenced DEM (2007 – 2009).
GeoEye-1 2009 stereo pair
Minimum 137.774m
Maximum 1081.06m
Mean 502.501m
Standard Deviation 180.136m
IKONOS 2007 stereo pair
Minimum 128.336m
Maximum 1073.04m
Mean 490.858m
Standard Deviation 178.983m
Differenced grid
Minimum -94.650m
Maximum 28.851m
Mean -11.739m
Standard Deviation 10.850m Table 3. DEM statistics for GeoEye-1 2009 and
IKONOS 2007 stereo pairs. Overall, the statistics between the two DEMs are quite similar, which indicates repeatability of DEM generation and possibly minimal differences in accuracy of height collection regardless of pixel size. The longer and deeper shadows in the GeoEye-1 image could be contributing to errors in surface elevation in the middle values, e.g., 2.89 to -24.17m. 3.3 Forest Cover Mapping
A Registered Professional Forester (RPF) undertook forest cover interpretation of the Hesquiat Inlet stereo pairs in 3D using the natural colour RGB composite and the false colour near infrared (NIR) composite. One area of interest from a forest inventory perspective is to determine how consistent the forest cover polygons interpreted by the RPF from the
GeoStereo GeoEye-1 images are when compared with the conventional base forest cover map (FC1) derived from aerial photography. A total of 32 polygons were interpreted from the false colour near infrared (NIR) image (Figure 8) and 15 polygons were interpreted from the RGB image (Figure 9). Table 4 indicates which forest polygons were interpreted from which image, and the number of FC1 polygons per interpreted polygon. The CW_HW and HW_CW classes appear to be the easiest to interpret from either the RGB or the NIR image.
Forest Cover
Type RGB Number of
Polygons NIR Number of
Polygons CW_HW 6 18 HW_CW 1 10 DR_HW 0 0CW 0 1 HW_BA 3 1 Table 4. Forest cover types identified from GeoEye-1 imagery.
Figure 8. NIR derived forest cover polygons overlain on FC1
Forest Cover polygons, Hesquiat Inlet. 3.4 Land Cover Change Detection
As part of the monitoring component to this project, the 2007 and 2009 Hesquiat Inlet images were combined into a single dataset, to which guided Principal Components Analysis (PCA) was applied. The images in this study are separated in anniversary date by almost three months – the 2007 image was acquired in early July and the 2009 image was acquired in late September. Summer versus fall vegetation changes have an effect, as do differences in length of shadows between the two

Figure 9. Natural colour derived forest cover polygons overlain
on FC1 Forest Cover polygons, Hesquiat Inlet. images. The Principal Component channels were generated using only the red and near infrared channels from both 2007 and 2009. In general, vegetation changes are detected through differences between the red and near infrared reflectance. The factor loadings (eigenvectors) for the principal components, using the covariance matrix as input to the analysis, are shown in Table 5. Cov. Eigen- PC1 PC2 PC3 PC4 vectors 66.71% 23.93% 6.79% 2.56% 2007-red 0.149 0.152 -0.433 -0.876 2007-NIR 0.743 0.608 -0.076 0.270 2009-red 0.170 -0.461 -0.800 0.345 2009-NIR -0.630 -0.629 0.408 -0.204
Table 5. Factor loadings (eigenvectors) for the four principal component channels using the covariance matrix.
PC1 is usually weighted average of the input channels, but in this case it is more a difference between the NIR values from the two imaging dates. PC2 is the difference between 2007 and 2009 dates. PC3 is a difference between the red and near infrared channels from 2009 with some contribution from the red channel from2007. This may represent vegetation vigour both within 2009 and between years. PC4 is a weaker version of PC2. A PCA colour composite image was produced by combining the first 3 PCA channels as RGB (Figure 10).
Figure 10. PCA image of 2007/2009 images (top), 2009 Natural colour image (middle), 2009 NIR image (bottom).
The above images show conifer stands with no change (dark grey area on left side of image in the Natural Colour image) between the two dates, plus deactivated roads with alder regrowth (visible in the reddish coloured vegetation in the NIR image). At the edge of the forest cover in the centre of the image, there is a brownish coloured area in the top right PCA image. In the natural colour images it appears as a grassy area. The 2009 NIR image appears to show more vegetation growth in the harvested area compared to the 2007 image so the brownish colour in the top right PCA image could be representing small increases in vegetation vigour. 3.5 Landslide Volume Measurements
In the author’s previous study (Kliparchuk and Collins, 2008), a DEM was produced from the 2006 and 2007 stereo IKONOS natural colour imagery for a large landslide in the Hesquiat area. Using the 2009 GeoEye-1 stereo imagery, the landslide area was recompiled to produce a new DEM to compare against the 2007 IKONOS-derived DEM. The spot heights and break lines were sampled between 4-9m within the slide area and 15m around the slide area margins. A TIN model algorithm was used to convert the points into a DEM with 3x3m grid cells.
Twb MMM
F Pmv2swhdvvn Vtet
4
TDFdDspDsm 4
Afl
The 2009 DEM were generated fboundary (Table
Minimum Maximum Mean Standard Devia
Table 6. De
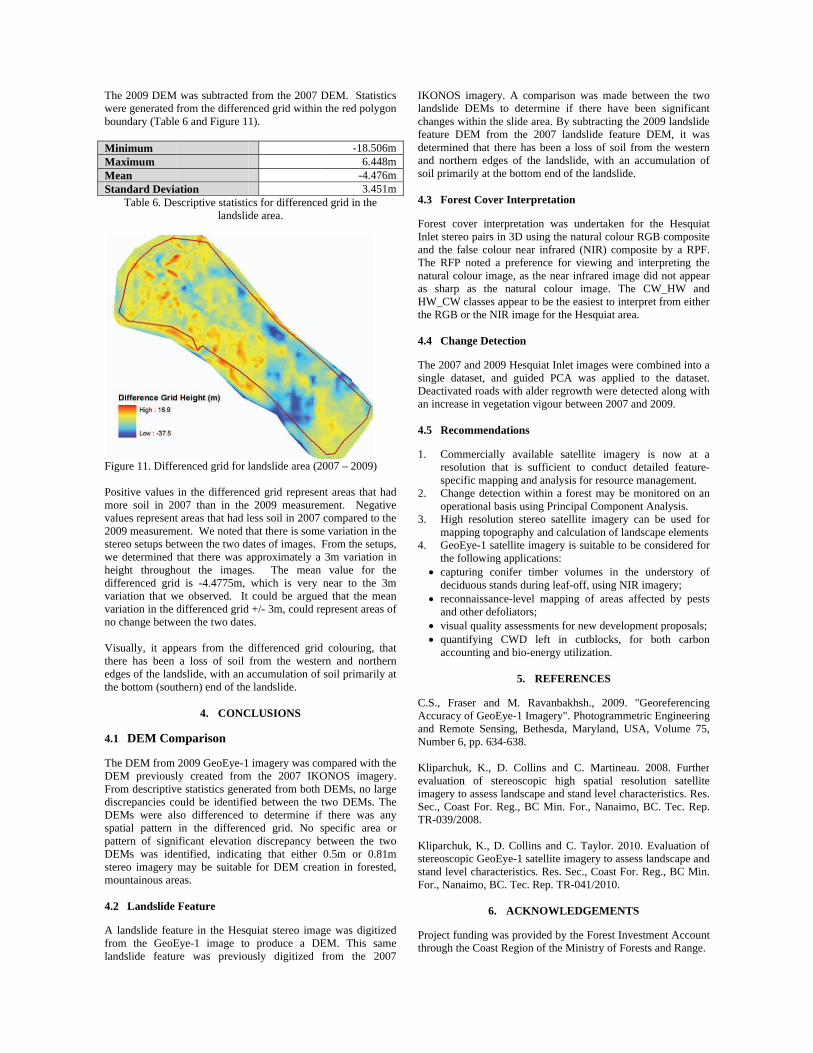
Figure 11. Diffe
Positive values more soil in 20values represent2009 measuremestereo setups betwe determined height throughodifferenced gridvariation that wvariation in the dno change betwe
Visually, it appthere has been edges of the lanthe bottom (sout
4.1 DEM Com
The DEM from DEM previouslFrom descriptivdiscrepancies coDEMs were alsspatial pattern pattern of signiDEMs was idestereo imagery mountainous are
4.2 Landslide
A landslide featfrom the GeoElandslide featur
was subtracted from the differene 6 and Figure 1
ation scriptive statistic
landslid
erenced grid for l
in the differenc007 than in thet areas that had lent. We noted thtween the two dathat there was aout the imagesd is -4.4775m,
we observed. It differenced grideen the two date
pears from the da loss of soil
dslide, with an athern) end of the
4. CONC
mparison
2009 GeoEye-1ly created frome statistics geneould be identifieso differenced in the differen
ificant elevationentified, indicatimay be suitable
eas.
Feature
ture in the HesqEye-1 image tore was previou
from the 2007 nced grid within1).
cs for differencede area.
landslide area (2
ced grid represen 2009 measuremless soil in 2007 hat there is someates of images. approximately as. The meanwhich is very could be argue
d +/- 3m, could res.
differenced gridfrom the westeaccumulation of e landslide.
CLUSIONS
imagery was com the 2007 IKO
rated from both ed between the to determine if
nced grid. No n discrepancy bing that either e for DEM crea
quiat stereo imao produce a DEusly digitized
DEM. Statisticn the red polygon
-18.506m6.448m
-4.476m3.451m
ed grid in the
2007 – 2009)
nt areas that hadment. Negativecompared to the
e variation in theFrom the setups
a 3m variation inn value for the
near to the 3med that the meanepresent areas o
d colouring, thaern and northernf soil primarily a
ompared with theONOS imageryDEMs, no largetwo DEMs. The
f there was anyspecific area o
between the two0.5m or 0.81m
ation in forested
ge was digitizedEM. This samefrom the 2007
s n
m m m m
d e e e s, n e
m n f
at n at
e y. e e y r o
m d,
d e 7
IKONOS landslide changes wfeature DEdeterminedand northesoil primar 4.3 Fores
Forest covInlet stereoand the faThe RFP natural colas sharp HW_CW cthe RGB o 4.4 Chan
The 2007 single datDeactivatean increase 4.5 Reco
1. Commresoluspecif
2. Chanopera
3. High mapp
4. GeoEthe fo
• captudecid
• reconand o
• visua• quant
accou
C.S., FrasAccuracy and RemoNumber 6, Kliparchukevaluationimagery toSec., CoasTR-039/20 Kliparchukstereoscopstand leveFor., Nana
Project funthrough th
imagery. A comDEMs to deter
within the slide aEM from the 2d that there hasern edges of thrily at the bottom
st Cover Interp
ver interpretatioo pairs in 3D usalse colour near noted a preferelour image, as thas the natural
classes appear toor the NIR image
nge Detection
and 2009 Hesqutaset, and guideed roads with alde in vegetation v
mmendations
mercially availaution that is sufic mapping and
nge detection witational basis usin
resolution stereping topography Eye-1 satellite imollowing applicauring conifer timduous stands durinnaissance-level other defoliators;al quality assessmtifying CWD lunting and bio-en
5. R
ser and M. Raof GeoEye-1 Im
ote Sensing, Bet, pp. 634-638.
k, K., D. Collin of stereoscopo assess landscapst For. Reg., BC008.
k, K., D. Collinpic GeoEye-1 satl characteristics
aimo, BC. Tec. R
6. ACKN
nding was provihe Coast Region
mparison was mrmine if there harea. By subtract2007 landslide
been a loss of e landslide, wit
m end of the land
pretation
on was undertaing the natural cinfrared (NIR)
ence for viewinghe near infraredl colour imageo be the easiest te for the Hesquia
uiat Inlet imagesed PCA was apder regrowth wevigour between 2
able satellite imufficient to cond analysis for resthin a forest ma
ng Principal Comeo satellite imaand calculation
magery is suitablations: mber volumes ing leaf-off, usinmapping of ar
; ments for new deleft in cutblocnergy utilization
REFERENCES
avanbakhsh., 2magery". Photogr
thesda, Marylan
ns and C. Marpic high spatiape and stand levC Min. For., Na
ns and C. Taylortellite imagery to. Res. Sec., Coa
Rep. TR-041/201
NOWLEDGEM
ded by the Foreof the Ministry o
made between thhave been signting the 2009 lanfeature DEM, soil from the w
th an accumulatdslide.
aken for the Hecolour RGB com
composite by ag and interpreti
d image did not . The CW_HWto interpret fromat area.
s were combinedpplied to the d
ere detected alon2007 and 2009.
magery is nowduct detailed fe
source managemay be monitoredmponent Analysiagery can be usof landscape elele to be consider
in the understong NIR imagery;reas affected by
evelopment propcks, for both cn.
S
009. "Georeferrammetric Enginnd, USA, Volum
rtineau. 2008. Fal resolution savel characteristicnaimo, BC. Tec
r. 2010. Evaluato assess landsca
ast For. Reg., BC10.
MENTS
st Investment Aof Forests and R
he two nificant ndslide it was
western tion of
esquiat mposite a RPF. ng the appear
W and m either
d into a dataset. ng with
w at a eature-
ment. d on an is. sed for ements red for
ory of ; y pests
posals; carbon
rencing neering me 75,
Further atellite s. Res. c. Rep.
tion of ape and C Min.
ccount Range.