evaluation of strategic stockpoints for unfpa using a
TRANSCRIPT

1
Evaluation of strategic stockpoints for
UNFPA using a facility location model A Master’s Thesis in Humanitarian Logistics
Department of Industrial Management and Logistics, Lund University
2018-06-20
Authors: Erik Hansson & Dayanand Sagar
Supervisors: Marianne Jahre, Department of Industrial Management and Logistics, Lund
University
Ingegerd Nordin, Procurement Coordinator of the Procurement Service Branch, UNFPA

2
Preface This thesis concludes our Master of Science in Industrial Engineering and Management at
Lund University, Sweden. The study was initiated in the winter of 2017 and conducted during
the spring of 2018. The whole project has challenged us but has taught us a lot and allowed
for development on an academic and personal level. We are happy and proud to have
contributed to the research in the humanitarian logistics area and, hopefully, the work of
UNFPA.
We would like to extend our sincere gratitude for the hospitality of everyone at UNFPA - PSB
in Copenhagen and their willingness to answer our questions. We would also like to thank
everyone we had the chance to interview and discuss our project with around the globe. We
would like to direct a special thank you to our supervisor Ingegerd Nordin at UNFPA who
helped us define the project and set us up with valuable contacts. We would also like to
sincerely thank our supervisor Marianne Jahre at Lund University and our examiner Joakim
Kembro for guiding us through the process of research in the humanitarian logistics context
and helping us unravel the mysteries of report writing.
Erik Hansson and Dayanand Sagar
Lund, June 2018

3
Abstract Distribution and warehousing networks of Humanitarian Organizations has proven to be an
area where cost reductions and shortened lead times can be achieved. Humanitarian
organizations have also started pre-positioning goods in anticipation of disasters as a way to
improve their disaster preparedness. Research in the area has, generally, been extensive
but few articles have tried to incorporate the shelf life of the goods that have been pre-
positioned. The study aims at incorporating the lessons learned from research of pre-
positioning and network layouts for humanitarian organizations with the shelf life aspects.
To achieve the purpose of this study, a literature review and a single case study combined
with mathematical modelling. The case chosen was a humanitarian organization with
products that has shelf life restrictions: UNFPA. The subjects of the literature review covered
case-specific factors regarding network planning, disaster preparedness and facility location
problems in both commercial and humanitarian organizations. 13 interviews and two
validation meetings were carried out to lay the ground for the understanding of UNFPA as
well the need that should be fulfilled by a facility location model.
When these two steps had been completed a new facility location model was developed that
incorporated a global demand for UNFPA, 14 potential warehouse locations, transport and
purchasing costs, shelf life limitations and relevant factors such as logistics hardship. The
model was run in an optimization program to be able to give recommendations as to how
UNFPA may revise their current layout.
The study identified some clear benefits as well as drawbacks with the pre-positioning of
goods on both a regional and national level. The study also identified some core issues for
UNFPA that would have to be solved before an alteration of the warehouse network could be
carried out. The study did, however, show that there would be clear cost reduction benefits
from switching to a decentralized warehouse layout as well as some lead time reductions.
The optimization model that was developed is also applicable in another case with a
Humanitarian Organization using perishable commodities.
Keywords: Humanitarian Logistics, Facility Location, UNFPA, Perishable Commodities, Pre-
positioning

4
Table of Contents Preface ................................................................................................................................. 2
Abstract................................................................................................................................. 3
List of abbreviations ....................................................................................................... 6
1. Introduction ....................................................................................................................... 7
1.1 Purpose and research questions .................................................................................................. 7
1.2 Report Disposition ......................................................................................................................... 8
2. Methodology ..................................................................................................................... 9
2.1 Thesis Process .............................................................................................................................. 9
2.2 Choice of method ........................................................................................................................ 10
2.3 Case Selection ............................................................................................................................ 11
2.4 Case Description ......................................................................................................................... 12
2.4.1 UNFPA ................................................................................................................ 13
2.4.2 Emergency Reproductive Health Kits .................................................................. 14
2.5 Data Collection ............................................................................................................................ 15
2.6 Data Analysis .............................................................................................................................. 17
2.7 Research Quality ......................................................................................................................... 18
2.8 Delimitations of the study ............................................................................................................ 19
3. Literature ......................................................................................................................... 21
3.1 Humanitarian Logistics ................................................................................................................ 22
3.1.1 Disaster preparedness ........................................................................................ 22
3.2 The facility location problem ....................................................................................................... 23
3.2.1 Facility location in mathematical programming .................................................... 24
3.2.2 Models in humanitarian logistics .......................................................................... 24
3.3 Network Planning and Configuration .......................................................................................... 26
3.3.1 Factors to consider in regard to warehouse location ........................................... 26
3.3.2 Factors to consider in regard to distribution ......................................................... 28
3.3.3 Factors to consider in regard to perishability ....................................................... 29
3.4 Theoretical Framework ............................................................................................................... 29
4. Model development based on empirical findings ............................................................. 31
4.1 Empirical findings influencing the model ..................................................................................... 31
4.1.1 UNFPAs prior experience with pre-positioning .................................................... 32
4.1.2 Commodity Characteristics ................................................................................. 35
4.1.3 Demand Characteristics ...................................................................................... 36
4.1.4 Logistics Characteristics ...................................................................................... 39
4.1.5 Sourcing Characteristics and Budgetary Constraints ........................................... 43
4.2 Model........................................................................................................................................... 44
5
4.2.1 Model delimitation ............................................................................................... 45
4.2.2 Problem definition ............................................................................................... 45
4.2.3 Indices ................................................................................................................ 47
4.2.4 Parameters ......................................................................................................... 47
4.2.5 Decision variables ............................................................................................... 47
4.2.6 Minimum cost model ........................................................................................... 48
4.2.7 Constrained minimum response time model ........................................................ 52
4.2.8 Minimum cost model with additional warehouse locations ................................... 53
5. Results ............................................................................................................................ 55
5.1 Current Layout ............................................................................................................................ 55
5.2 UNHRD Layout ........................................................................................................................... 56
5.3 Free Layout ................................................................................................................................. 58
6. Analysis & Discussion ..................................................................................................... 59
6.1 Discussion of empirical findings .................................................................................................. 59
6.1.1 UNFPAs prior experience with pre-positioning .................................................... 59
6.1.2 Commodity characteristics .................................................................................. 59
6.1.3 Demand Characteristics ...................................................................................... 60
6.1.4 Logistics Characteristics ...................................................................................... 60
6.1.5 Sourcing Characteristics and Budgetary Constraints ........................................... 61
6.2 Analysis and discussion of model results ................................................................................... 62
6.2.1 Using the model to calculate the cost for the current layout ................................. 62
6.2.2 UNHRD Layout ................................................................................................... 62
6.2.3 Free Layout ......................................................................................................... 62
6.3 Sensitivity Analysis ...................................................................................................................... 63
6.3.1 UNHRD Layout ................................................................................................... 63
6.3.2 Free Layout ......................................................................................................... 64
7. Conclusions .................................................................................................................... 64
7.1 Answering research question 1 ................................................................................................... 64
7.2 Answering research question 2 ................................................................................................... 64
7.3 Impact on future research ........................................................................................................... 67
References ......................................................................................................................... 68
Primary Sources ................................................................................................................................ 68
Secondary Sources ........................................................................................................................... 69
8. Appendix ......................................................................................................................... 73
8.1 Interview Guides ......................................................................................................................... 73
8.2 Model Parameters ....................................................................................................................... 78

6
List of abbreviations
AIDS - Acquired ImmunoDeficiency Syndrome
CO - Country Office of UNFPA
CSB - Commodity Security Branch
ERH-kits - Emergency Reproductive Health-kits
ERP-system - Enterprise Resource Planning system
FLP – Facility Location Problem
HCT - Humanitarian Country Team
HFCB - Humanitarian and Fragile Context Branch within UNFPA
HIV - Human ImmunoDeficiency Virus
HO - Humanitarian Organization
IFRC - International Federation of Red Cross and Red Cross Movements
LPI – Logistics performance index
NGO - Non-Governmental Organization
OCHA - United Nations Office for the Coordination of Humanitarian Affairs
OR - Operations research
PSB - Procurement Service Branch
RH - Reproductive Health
UN - United Nations
UNHCR - United Nations High Commissioner for Refugees
UNFPA - United Nations Populations Fund
UNHRD - United Nations Humanitarian Response Depot
WFP - World Food Programme
7
1. Introduction The increasing number of disasters occurring, and the people affected by these, has led to an increased attention to the needs for disaster responses to be effective and efficient. (Balcik & Beamon, 2008) Improving network design to cut costs and reduce lead times has proven critical for humanitarian logistics (Jahre et al, 2016a; Van Wassenhove, 2006). Among large humanitarian organizations such as UNHCR (United Nations High Commissioner for Refugees), IFRC (International Federation of Red Cross) and WFP (World Food Programme) a way improve the distribution network has been to pre-position un-consigned items for disaster relief closer to disaster-prone areas (Jahre & Heigh, 2008; Jahre et al, 2016a). Stock pre-positioning is expensive, however, and alternatives have been suggested to build this preparedness in other ways (Van Wassenhove & Pedraza-Martinez, 2012).
The concept of pre-positioning, which entails moving supplies to strategic stock points before
a crisis has arisen, has been a fairly well researched topic in recent years (Jahre et al,
2016a; Rawls & Turnquist, 2009; Rezaei-Malek et al, 2016; Balcik & Beamon, 2008; Duran
et al, 2011). Most of the articles on the subject involve some form of optimization model used
with the objective of minimizing costs and/or lead times. During the years, models have been
developed to incorporate further parameters such as risk of loss of stock, loss of
infrastructure or shelflife, to mention a few.
Sexual and reproductive health problems are a leading cause of death and disability for women in the developing world. (UNFPA, 2018) Since 1969 the United Nations Populations Fund (UNFPA) has been working with these and other issues related to womens health. Recently, UNFPA has decided to build capacity on a global level (Abbas, 2018) to be able to fulfil their goals of delivering a world where every pregnancy is wanted, every childbirth is safe and every young persons potential is fulfilled. (UNFPA, 2018). The need for reproductive and sexual health does not end when a disaster strikes an area and UNFPA also works in this context by delivering specially designed Emergency Reproductive Health kits to the disaster-stricken areas (UNFPA, 2018).
UNFPA has pre-positioned some relief items on a country level, as well as on a regional
level. The rationales behind the initiatives differ but include: reduction of lead times, cost
reductions, reluctance to foreign aid and preparing for major disasters (Jurman, 2018;
Marwah & Millar, 2018; Malah, 2018). Thus far it has not been implemented on a global,
controlled level (Nordin, 2018). In October 2017 we were approached by UNFPA via our
examiner Joakim Kembro to carry out a study whether such global pre-positioning could be
feasible for UNFPA.
1.1 Purpose and research questions
There has been a lot of research in the area of humanitarian logistics and also facility
location problems in the area (Jahre et al. 2016a; Balcik & Beamon, 2008). These models
have often incorporated lead time, cost and budgetary constraints and have lowered lead
times and costs for the organizations using them.
There has been some research as to how shelf life may be incorporated in a facility location
model (Rezaei-Malek et al. 2016). However, this research has not been conducted on a
global scale and incorporated as many parameters as the aforementioned research.

8
The purpose of this study is to use these two different types of facility location models and to
try to incorporate them both into a single model. Therefore, the first research question of the
thesis is:
How can a humanitarian logistics facility location model incorporate shelf life whilst
minimizing costs and potentially lead times?
The case that has been used to answer this research question is the distribution and pre-
positioning of ERH-kits (Emergency Reproductive Health-kits) for UNFPA. Upon the initiation
of the project a list of questions to address was received from Ingegerd Nordin at UNFPA in
Copenhagen. The ERH-kits and UNFPA are described in more detail in the Case
Description chapter. ERH-kits have a shelf life limitation and are deployed in emergencies
which make them well suited to study in relation to the research question. A study proposal
that included accounting for the costs of transportation to and from the new proposed
locations, cold chain supply chain, warehousing, insurance costs and obsolescence of goods
was sent by UNFPA upon initiation of the project. UNFPA also asked for a concluding
recommendation whether or not to pre-position the ERH-kits.
To answer these specific questions from the UNFPA and to be able to make a significant
contribution to the organization a second research question was formulated:
Should UNFPA pre-position ERH-kits in a decentralized warehouse layout?
1.2 Report Disposition
The report consists of seven chapters: Introduction, Methodology, Literature, Model
Development Based on Empirics, Results, Analysis & Discussion and Conclusions. The
second chapter outlines the methodology that was used for conducting the study and briefly
presents the case. The literature chapter presents literature that is of relevance to the study
as well as setting a theoretical framework for the model development. The fourth chapter
contains data gathered during the study, categorized into influencing characteristics and how
these characteristics influenced the model development. The chapter also contains a
detailed description of the facility location model and its parameters and constraints. The
Results chapter contains the computational results obtained from the model. The Analysis &
Discussion chapter discusses the influencing characteristics for the facility location model as
well as the two layout proposals put forward by the authors. This chapter also includes
sensitivity analyses. The final section, Conclusions, contains final remarks about the different
layout proposals as well as a recommendation for UNFPA.
Throughout all the chapters, consideration has been taken to make the language less
academic as well as explaining theoretical models more closely. This endeavour was
undertaken to make the thesis more readable, and thus more usable, for employees at
UNFPA. This approach is supported by Kunz et al. (2017) as part of a strategy to make
research in humanitarian logistics more relevant for the host organizations.

9
2. Methodology The methodology chapter will cover the outline of methodology for the study. Section 2.1 will
briefly cover the thesis process. Section 2.2 will cover the choice of method for the study.
Sections 2.3 and 2.4 will go over the case selection and a brief description of the case.
Sections 2.5 and 2.6 cover how data was collected and analysed and finally, section 2.7 and
2.8 will cover the research quality and delimitations of the study.
2.1 Thesis Process
The thesis process is visualised in Figure 2.1. In November we started background research
and started discussing the methodology for the study. These ideas of methodology were, to
some extent, the ones that were later used.
In December 2017 the first meeting at UNFPA took place and besides discussing the
proposed methodology we also set the delimitations and the project scope. We also had a
Skype-meeting with our supervisor at the department, Marianne Jahre, where our proposed
methodology was improved after some alterations. After this a project plan regarding the
methodology was sent to UNFPA and our supervisor at the department whereafter the
literature review started. The main emphasis of this review was to gain insights into different
facility location models in the humanitarian logistics field. To this end keywords such as
facility location, humanitarian logistics and pre-positioning were searched for in
WebOfScience.
In February the Data Collection started at UN-City in Copenhagen. Qualitative and
quantitative data was collected from UNFPA personnel. This included ERP-system
(enterprise resource planning system) data from UNFPA as well as interviews. In parallel
with this, the facility location model used for the later analyses was developed, utilizing
previous models developed in the research area as well as modifying these to fit the context
which UNFPA operates in.
In the beginning of March, the analysis of the current setup of the distribution network was
carried out using the collected data and theoretical framework. This led to the identification
of influencing characteristics that needed to be considered before finalizing the facility
location model. When finding these characteristics an additional, smaller, literature review
was conducted to answer specific problems that arose, for example how to model flight
costs. The next step was to build a working optimization model using IBM ILOG CPLEX and
feeding the model with demand and cost data from UNFPA. The analysis of the model
results started in April when two layouts were tried. One layout using the existing UNHRD
network and one using seven additional locations for pre-positioning around the world. In
addition, the model was used on UNFPAs current warehouse layout.
In May the results were discussed and subjected to sensitivity analyses and
recommendations and conclusions were drawn out.

10
Figure 2.1. An outline of the thesis process (Hansson & Sagar, 2018)
2.2 Choice of method
To be able to answer the research question the study will have to take both qualitative and
quantitative data into account. The qualitative data is required for understanding how the
facility location model should be configured and what constraints to it are necessary. The
quantitative data is required to acquire data for input to the model.
Five commonly used ways of conducting qualitative research are experiments, surveys,
histories, analysis of archival information and case studies (Yin, 2014). To determine which
method is most suitable depends mainly on two factors. The first is centred around the
research questions and whether there is a need for control of behavioural events. The
second is if the focus of the research is on historical or contemporary data. A case study is
often used when observing a phenomenon or a specific situation (Yin, 2014) and has proven
to be a very powerful tool for studying an operational context (Voss et al. 2002). Case
research uses the case study as its unit of analysis (Voss et al. 2002). The unit of analysis is
the major entity that is being analysed – in other words the “what” and “who” of the analysis.
Case studies related to operations management research have two major strengths
according to Voss et al. (2002):
1. The phenomenon may be studied in its natural setting. This also allows for the theory
developed and generated during the study to be relevant and gained through observing the
actual practice.
2. The method allows for answering the questions why, what and how with a relatively full
understanding of the complexity and nature of the complete phenomenon as well as its
context.
Given that the study aims at describing how UNFPA:s distribution network is designed as of
now and how it might change, it implies that a case study, history or an experiment would be
suitable. The purpose of the study calls for a contemporary focus rather than a historical,
which leads to the conclusion that history is not a suitable method for the thesis. Finally, the
environment for the study can not be controlled which is a prerequisite for conducting an
experiment. A case study does not require this (Yin, 2014) and thus makes it the best choice
for the present study. Choosing a case study also allows several forms of evidence - such as
qualitative evidence including interviews, artifacts and observations as well as quantitative

11
evidence including archival records and documents - to be used (Yin, 2014) thus
strengthening the conclusion that a case study is the best method for the thesis given the
data available from UNFPA.
Given the complexity of the distribution chain of UNFPA and the lack of a mathematical
model for incorporating perishables in the facility location problem of a humanitarian
organization it was feasible to assume that a new (or modified) model would need to be
created. Eisenhardt (1989) points out that another strength of the case study is to use it as a
way of building novel theory. This is very much applicable to the challenge at hand.
The mathematical modelling used in the study can best be described as a rational
knowledge generation approach. According to Bertrand and Fransoo (2002) this approach is
used to describe the future state of the modeled process and aims at describing changes
and causality between variables. For instance, if the variable 𝛼 changes then another
variable 𝐹(𝛼) changes accordingly, in other words all relationships are causal and
quantitative. This makes all the claims within the model unambiguous and verifiable.
Analysing quantitative data usually requires some type of mathematical modelling.
Mathematical modelling can be classified into axiomatic and empirical research. Axiomatic
research is primarily driven by the model itself. This type of research can be used to produce
knowledge about certain variables and their effect on the model as a whole. Axiomatic
research may be descriptive in its nature but is largely normative. This means that while it is
possible to study a system with axiomatic research, it is suitable for determining and develop
policies and strategies as well as finding an optimal solution for a newly defined problem.
Empirical research is not used in as great an extent. It is often used to describe the causal
relationship between variables which may exist in reality and through this gain an
understanding of how the process works. An issue with empirical modelling is the difficulty in
making sure that the causality is caused by a specific action and not changing
circumstances. (Bertrand & Fransoo, 2002)
For this study an axiomatic approach is the most feasible. This is due to the goal to optimize
the cost for the UNFPA distribution network and the need to control the causality between
different variables.
2.3 Case Selection
Case studies should be organized to fit the scope and purpose of the research. To achieve
this, there are four ways of setting up a case study as depicted in Figure 3.2.

12
Figure 3.2. The different ways of organizing a case study (Hansson & Sagar, 2018)(Adapted from Yin, 2014)
The multiple case study is the study of choice when there is a desire to generalize the
findings beyond the unique environment of one organization and the time and resources to
manage such a project (Yin, 2014). The single-case study allows for a more in-depth
understanding of the studied phenomenon (Voss et al. 2002). Based on this reasoning as
well as the problem specification received by UNFPA a single-case study was chosen for the
study.
As for the choice of a holistic or embedded approach it can be said that the scope of the
study is to examine the distribution chain of UNFPA, specifically for ERH-kits originating from
a warehouse in the Netherlands to a Country Office. This network will be the unit of analysis
in the case study. Based on the reasoning of Yin (2014) and Voss et al. (2002) as well as the
time restraints, a holistic approach was chosen for the thesis. Furthermore, UNFPA has a
wide range of products with short shelf-lives which makes it a good candidate for answering
the first research question.
2.4 Case Description
The primary goal of the case study is to investigate the costs associated with the current
layout of the distribution chain for the UNFPA:s Emergency Reproductive Health (ERH) kits
and to compare this with two alternative proposals. One proposal includes the use of United
Nations Humanitarian Resource Depots (UNHRD) and the other proposal aims at finding the
optimal locations for new warehouses. However, considering the humanitarian context, the
responsiveness of the network cannot be ignored. Therefore, response times have also
been considered throughout the study. In this section we present relevant background on
UNFPA and ERH-kits.

13
2.4.1 UNFPA
The United Nations Population Fund (UNFPA) is a branch of the United Nations that was
created in 1969 (UNFPA, 2018). This was the year when the UN General Assembly declared
“parents have the exclusive right to determine freely and responsibly the number and
spacing of their children” (UNFPA, 2018). The organization strives to deliver a world where
every pregnancy is wanted, every childbirth is safe and every young persons potential is
fulfilled (UNFPA, 2018). In 2016 UNFPA delivered RH (Reproductive Health) supplies to 117
countries and provided over 35 million couple years protection. UNFPA supports 2488
facilities, providing obstetric care, in 38 countries as well as 481 mobile clinics in 27
countries, ensuring safe births (UNFPA, 2017). In 2015 the organization received 979 million
USD in contributions where 398 million USD was directed towards the organizations core
resources and the rest was earmarked for specific projects and investments (UNFPA, 2018).
UNFPA has a presence in 140 countries across the globe and is managed from the HQ in
New York. Beyond this, there are five regional offices organized in the following regions:
Arab States and Eastern Europe, Asia, Francophone Africa, Anglophone Africa and Latin
America and Caribbean. Some larger country offices have support offices including
procurement branches. Additionally, UNFPA is organized into five thematic branches - family
planning, HIV/AIDS, population and development, gender and maternal health. The head of
the emergency branch is HFCB (Humanitarian and Fragile Context Branch) and PSB
(Procurement Service Branch) answer to them. The overall responsibility for preparedness
befalls HFCB but in practicality PSB has assumed much of the responsibility. (Nordin, 2018)
An overview of the structure of UNFPA can be found in figure 2.3.
Figure 2.3. An organization chart for UNFPA (Nordin, 2018)

14
2.4.2 Emergency Reproductive Health Kits
In support of the UNFPA mandate, ERH-kits are administered by the Procurement Service
Branch (PSB) located in Copenhagen. UNFPA has been responsible for these kits since
they were instituted in 1998. An ERH-kit refers to one of the 17 kits that UNFPA or an
organization/government affiliated with UNFPA sends as part of an emergency response to
a disaster zone. These kits are organized as seen in Figure 2.4. A kit is designed to fulfil the
needs of a varying population size. Important to note is that for instance with the post rape
treatment-kit, a single kit is not designed to help 10 000 victims in need of post rape
treatment but rather the potential victims out of a total, average population of 10 000. The
amount of SKU:s in a kit varies from 2 to over 50 between the different kits, subsequently the
volume of a kit also differs a lot. During 2016 UNFPA delivered ERH-kits targeting 12 million
people in 47 countries at a total cost of 7 million USD (UNFPA, 2018).
Figure 2.4. A Summary of the ERH-kits used by UNFPA (Internal Document 1)
The inventory is handled by a branch of the PSB - the Emergency and Inventory Team. The
team’s responsibilities include replenishment and dispatch of the inventory. (UNFPA, 2017)
The ERH-kits have a wide array of articles and some have short shelf-lives. A strategic
positioning of stock will therefore have to account for the shelf-life of short lived articles in the
ERH-kits to minimize costs of handling waste and re-ordering.

15
2.5 Data Collection
Data was collected throughout the study process. The data collected can be divided into
qualitative and quantitative data. The quantitative data consist of information about the ERH-
kits and ERP-data from UNFPA. The qualitative data came from interviews held with staff at
UNFPA and other UN-agencies with insight into distribution, warehousing and other fields
relevant to the study.
A complete list of interviewees can be found in Table 2.1. The first interviews were held in
December and January and were held in an unstructured manner with our supervisor at
UNFPA and two other people working at PSB in Copenhagen. These in turn led to other
interviews via a “snowball” principle where the initial contact led to other relevant interviews.
Most of the interviews were semi-structured and qualitative (Yin, 2014). An interview guide
was used in all the semi-structured interviews and these may be found in Appendix 8.1.
These questions were complemented by related and open-ended questions. The interview
guides were sent to the interviewees beforehand. The interviews started with general
questions and then covered relevant areas related to the competence and role of the
interviewee. All interviews were conducted by the two authors, with one being the leader of
the interview and the other taking notes. After the interview, a summary was sent to the
interviewee to ensure that no misinterpretations or factual errors had occurred. In some
cases, changes to the summaries were made after the revision of the interviewee.
Table 2.1. The interviews conducted during the thesis
Interviewee
Position Organization
Type of Interview
Purpose Time Date Location
Ingegerd Nordin, Kristian Nielsen
Procurement Coordinator, Demand Planner & Inventory Associate
UNFPA Unstructured Initial case understanding
90 min 1 dec 2017
UN-city, Copenhagen
Ingegerd Nordin, Kristian Nielsen, Dina Amarri Engel
Procurement Coordinator, Demand Planner & Inventory Associate, Procurement Associate
UNFPA Unstructured In depth case understanding, determining further interview subjects
75 min 29 jan 2018
UN-city, Copenhagen
Aleksandra Doruch
Procurement Assistant
UNFPA
Semi-structured Procurement, Warehousing and Distribution of goods
45 min 13 feb 2018
UN-city, Copenhagen
Kristian Nielsen
Demand Planner and Inventory Associate
UNFPA Semi-structured Forecasting and funding
45 min 14 feb 2018
UN-city, Copenhagen
Ingegerd Nordin
Procurement Coordinator
UNFPA Semi-structured Organizational structure
60 min 15 feb 2018
UN-city, Copenhagen
Danielle Jurman
Consultant in global humanitarian RH at HFCB,
UNFPA Semi-structured UNFPA:s current pre-positioning efforts
30 min 26 feb 2018
Skype

16
Geneva
Veronika Tatunts
Finance Associate
UNFPA Semi-structured Funding 20 min 27 feb 2018
UN-city, Copenhagen
Johnny Abbas
Global Logistics Advisor, Beirut
UNFPA Semi-structured Process of disaster relief and pre-positioning
30 min 28 feb 2018
Skype
Andrès Blasco
Procurement Specialist
UNFPA Semi-structured Disaster relief operations on a regional level
45 min 28 feb 2018
UN-city, Copenhagen
Andrea Tornese, Nadia Parisi
UNHRD Support Office staff, Brindisi
WFP Semi-structured Costs and capabilities of UNHRD warehouses
45 min 7 mar 2018
Skype
Ahmed Malah Humanitarian Coordinator, Baghdad, Iraq
UNFPA Semi-structured Disaster relief operations on a country level
20 min 14 mar 2018
Skype
Kristian Nielsen
Demand Planner and Inventory Associate
UNFPA Unstructured Clarification of prior interviews in the area of funding
40 min 19 mar 2018
UN-city, Copenhagen
Sathya Doraiswamy
Chief of RH, Dhaka, Bangladesh
UNFPA Semi-structured Disaster relief operations on a country level
20 min 22 mar 2018
Skype
Priya Marwah, Branwen Millar
Humanitarian Response Coordinator, Bangkok; Humanitarian Project Coordinator, Bangkok
UNFPA Semi-structured Experience of pre-positioning on a regional level
60 min 27 mar 2018
Skype
The ERP-data used in the study was requested from UNFPA as specified in Table 2.2. The
only data that could not be obtained, were the sales prices for the goods that were close to
expiry.
Table 2.2. A summary of the ERP-request sent to UNFPA.
Data requested Data relation Unit Purpose Collected (Y/N)
Historical data of number of units shipped
A Preferable number of kits
This data will lay the foundation for scenario creation. In other words, where need arises and at what probability
Y
Location to which kits have been shipped historically
A Preferable number of kits
-//- Y
Cost of shipments A USD/kg or USD can be converted to USD/kg manually with kit data
The historical cost data will lay the foundation for shipment costs.
Y

17
Purchasing Costs of Kits
B USD Will be used directly as costs incurred when pre-positioning and also as basis for holding costs, “loss of sales”.
Y
Sales prices of “close to expiry kits”
C USD or % of purchasing costs
Will be used to incorporated the sales of kits which are close to expiry.
N
Distribution of kits in this years purchase order of 8 Mil USD
D Nbr of kits in order Might aid in creating the distribution of kits pre-positioned.
Y
In addition to the other data collection, validation meetings were held with UNFPA staff on
two occasions. These meetings were meant to clarify assumptions and the understanding of
the authors of UNFPA as an organization and its operations. A list of the meetings and its
participants can be found in Table 2.3.
Table 2.3. The validation meetings conducted throughout the thesis.
Participants Position Date Topic
Ingegerd Nordin, Kristian Nielsen, Dina Amarri Engel, Michael Kenny
Procurement Coordinator, Demand Planner & Inventory Associate, Procurement Associate, Data Analyst
19 mar 2018 Validation of as-is analysis and clarification of fund structure
Ingegerd Nordin, Kristian Nielsen, Dina Amarri Engel, Michael Kenny, Andrés Blasco
Procurement Coordinator, Demand Planner & Inventory Associate, Procurement Associate, Data Analyst, Procurement Specialist
19 apr 2018 Validation and discussion regarding the UNHRD layout
2.6 Data Analysis
The gathered data was structured based on what it concerned and was compared with
relevant literature. As suggested by Voss et al. (2002) the data was categorized and
displayed, to structure and draw valid conclusions.
In some cases, the gathered information was visualized by process maps. These
visualizations were made to identify the different activities, actors, information flows, financial
flows and material flows involved in the processes. Rummler and Brache (1991) argue that,
in order to improve a process, a thorough understanding of the process has to be in place
first. They also argue that a process map is a viable way to improve the visibility and
understanding of processes.
After each interview a summary of which answers were useful for the model development
and in congruence with the theoretical framework was made. Certain answers within
categories led to further questions thereby affecting further data collection. This is similar to
the iterative process of open coding described by Ellram (1996). The theoretical framework
was updated when major findings were uncovered in the analysis. Therefore, the next step
of data analysis was to establish connections between qualitative data, quantitative data and
the theoretical framework, similar to the process of axial coding (Ellram, 1996).

18
The authors went through finding after finding in the empirics and tried to determine how and
if a facility location could incorporate these. For the qualitative data analyses were made to
determine specific costs and distributions as well as getting an understanding of the case
specifics. To do this in an effective manner, some data had to be filtered out in the process.
For example, whilst analysing mode of transport, qualitative data could be supported by what
was found in the quantitative data; air freight was by far the most commonly used mode of
transport, followed by sea freight. This in turn lead to further analysis sea freight but in
particular of air freight, due to its significant prominence in the case, but land transport was
completely excluded. The process was similar for all the major findings in the empirics.
These then formed the backbone of the characteristics that were eventually incorporated into
the model development.
The first step was to categorize where each finding would fit in and how similar facility
location models, used in the theoretical framework, had used their findings. In this process
some non-crucial insights, such as the extent to which third-party clients ordered kits, were
omitted from the report. Others, such as transportation costs and historical demand, were
decided to be incorporated into the model via parameters or objective functions. Some
insights, such as the lead time at the supplier, shaped the model without being directly
incorporated into it. When these insights had been categorized the work on the model itself
began.
2.7 Research Quality
Kunz et al. (2017) found that research in the humanitarian logistics field sometimes lacks
relevance due to a variety factors; researchers frequently fail to contextualize the
environment in which the research takes place, as well as to make a clear, relevant problem
formulation. Furthermore, researchers often fail to validate the findings and data collection
with the host organization. According to Yin (2014) there are four criteria for judging the
quality of research that include; Construct Validity, Internal Validity, External Validity and
Reliability. The work that the authors undertook to ensure research quality can be found in
Table 2.4.
Table 2.4. Types of research quality and actions taken to ensure them during the study.
Type of research quality Action
Construct Validity Clear definition of what was measured, Continuous validation
Internal validity Extra literature review, Continuous validation
External Validity Parameters for a more generalizable case included in model
Reliability Triangulation, Description of the research process

19
Construct Validity refers to what change will be studied in the research and how the change
will be measured (Yin, 2014). When starting the study, it was decided that the impact of
potential change of facility locations would be measured in cost and it was also specified
which costs that were to be accounted for. The construct validity was ensured by
continuously validating the gathered information. The validations were conducted in
cooperation with UNFPA, the supervisor at the department and internally between the
authors. Using an approach where the stakeholders are invited to validate the findings is
supported by Kunz et al. (2017).
Internal validity is aimed at establishing a causality between an event or activity x that leads
to a certain result y. The main challenge is to rule out that it was not in fact a rival event or
activity z that caused y (Yin, 2014). Another challenge is to make sure that the inferences
between occurrences and results that the researcher suggests are legitimate (Yin, 2014).
The internal validity was ensured by using both validation meetings and an additional
literature review after the empirical data had been collected. The purpose of this additional
literature review was to strengthen the assumptions made when developing the facility
location model. It was also used to validate information obtained from interviews and
analyses made from the quantitative data.
If one were to summarize external validity in one question the question would be “to what
extent are these findings generalizable?” (Yin, 2014). The external validity of the study is
somewhat limited to UNFPA but there are parts of the developed facility location model that
other HO:s (Humanitarian Organizations) with similar supply chains could use to address
similar problems. This is especially true considering that the model was developed using
other, similar models. These parameters are incorporated in the model but their values were
set to 0 and thus did not affect the final result.
Reliability in research quality terms means that if the same study was conducted again the
same results and findings would ensue (Yin, 2014). The reliability of the literature used in the
study was ensured by solely using sources that were published in peer-reviewed journals.
The reliability of the empirical study was ensured through triangulation. Data triangulation
was used by interviewing more than one person on the same topic, where this was possible,
as well as comparing to UNFPA:s ERP-data. Investigator triangulation was ensured by
having the two authors present throughout the research process and continuously
discussing how the gathered data should be interpreted. A description of the research
process has also been included to make sure that the research could be replicated. The
extra literature review also strengthened the reliability.
The mix of qualitative and quantitative method choice also allowed for another type of
triangulation where claims made in interviews were confirmed or dismissed through use of
qualitative data. Two examples of this was the frequency of different modes of transport that
was validated by the quantitative data and the lead time from request to dispatch that was
dismissed by the use of quantitative data.
2.8 Delimitations of the study
The study is restricted of the following factors.

20
The study is restricted to looking at the current product portfolio of the UNFPA and thus will
not include potential future kits. Furthermore, it is assumed that the content of the ERH-kits
will not be altered.
UNFPA conducts some distribution of ERH-kits from a supplier in China. By the order of staff
at UNFPA it is assumed that all the distribution of ERH-kits originates from the Netherlands
in this study. This is also strengthened by the fact that the Chinese supplier has only dealt
with 10% of the shipments 2015-2017 and does not manufacture all ERH-kits.
PSB hands over responsibility of the ERH-kits to Country Offices after the kits have reached
the capital of the country. This means that the study will not take last mile-distribution into
account.
Lastly, the study will only take into consideration the distribution of assembled ERH-kits. In
other words, the supply-chain regarding procurement and transportation from suppliers to
the central warehouse in the Netherlands will be assumed to be the same.
A visualization of the system studied can be found in Figure 2.5.
Figure 2.5. A visualization of the system of delivering ERH-kits. The area within the green rectangle is studied in the thesis. (Hansson & Sagar, 2018)

21
3. Literature To answer the research question and to develop a functioning facility location model three
key areas of literature were identified. The first was humanitarian logistics with a focus on
disaster preparedness, to set the context for pre-positioning. The second was previous
research on pre-positioning that was needed to build an understanding of how the new
model should be built. Finally, network planning with an emphasis on case specific factors
such as perishability and transport costs was studied. The chapter ends with a section to
summarise the theoretical framework used for the analysis of the case. An overview of the
key areas can be found in Figure 3.1.
Since the 2004 Indian Ocean earthquake and tsunami literature within the area of
humanitarian logistics has increased drastically (van Wassenhove, 2006). Literature on the
humanitarian logistics sector - with an emphasis on disaster preparedness - is included to
set the context within which UNFPA is working. The main research question in this thesis is
related to pre-positioning of stock, which goes some way to improve preparedness.
Network Planning in this study refers to the process of planning the supply chain network.
One key issue is where to place the warehouses and which factors to consider when doing
this, a section about this is included in the chapter. Given that distribution of ERH-kits is one
of the core components of the thesis a short section on distribution is also included in the
chapter. Another, heavily influencing, factor for the distribution of ERH-kits is the perishability
of the kits.

22
A research area that has seen significant development is the research of using optimization
models to solve certain parts of the logistical operations, specifically warehouse location
problems, within humanitarian relief. The last section in the chapter covers this.
3.1 Humanitarian Logistics
For many years humanitarian logistics was considered to be a peripheral support function by
many HO:s. This has changed somewhat in the recent years and research in the area has
increased (Kunz et al. 2017). The speed at which demand can be met is, in many cases,
also correlated to saving lives, making it a higher priority than in a commercial supply chain
(Pettit & Berresford, 2009). Logistics is crucial for effectiveness and speed when responding
to a disaster. It is also the most expensive part of any relief operation and thus a place
where money can be saved (Kunz & Gold, 2017). During the first 72 hours of a response,
the operations are characterized by speed and costs play a less dominant role (van
Wassenhove, 2006). Distribution is often carried out by air (van Wassenhove, 2006).
3.1.1 Disaster preparedness
A disaster is described as “serious disruption of the functioning of society, causing
widespread human, material or environmental losses which exceed the ability of affected
society to cope using only its own resources” by United Nations (1992). Furthermore, a
disaster is classified by whether it is a natural hazard or man-made. Disasters can also be
broken down into whether they are sudden-onset or slow-onset. Examples are presented in
Figure 3.2.
Figure 3.2. Categorization of different disaster types. (van Wassenhove, 2006)
Disaster preparedness has become increasingly prioritised after the 2004 tsunami in the
Indian Ocean (Jahre & Heigh, 2008). Jahre and Heigh (2008) argue that funding for
humanitarian organizations has traditionally been limited to disaster response, but that there
is a lot to gain from having funding that is not earmarked, that may build preparedness for
disasters and permanent supply chains.
For the scope of this study the points of interest are within logistics preparedness. Many
humanitarian organizations such as IFRC, WFP and UNHCR use a pre-positioned stock
spread across the globe with the explicit goal to be better prepared for responding to a
disaster (Jahre et al., 2016a). Pre-positioning goods can help to secure supplies in the
immediate disaster response but also help reduce costs for transportation (Jahre & Heigh,
2008). Jahre et al. (2016b) found that 11 out of 13 reviewed HO:s opted for pre-positioning

23
supplies as a way of improving their logistics preparedness. They also found that pre-
positioning has been a focus of many HO:s. Jahre et al. (2016b) addresses that pre-
positioning items can be expensive, especially considering the strained budgets that many
HO:s experience.
Besides pre-positioning of stock, logistics preparedness can be built by working with the
procurement of relief items in an earlier stage through, for example, supplier partnerships
and forecasting as well as standardizing and modularizing the items sent. It can also include
building a robust transport and distribution network prior to the disaster. Jahre and Fabbe-
Costes (2015) discuss the implications for standardizing equipment and training for
personnel in HO:s and found that while preparedness in this field is helpful where it is
applicable, it is not a universal cure for poor preparedness. Another example is how
humanitarian organizations can develop their procurement power towards supplier-
dominated markets such as vaccines through pooling demand, increased information
sharing, long-term agreements and investing in local supplier development (Pazirandeh &
Norrman, 2014). However, increasing the procurement power of an organization does not
directly solve the issue of poor preparedness. Additionally, important steps can be, and are
being, taken in fields like information management, personnel training and collaboration with
governments and other organizations as well.
3.2 The facility location problem
Facility location is a well-established research area within Operations research (Melo et al,
2008). A generic facility location model involves a set of spatially distributed customers and
facilities to serve the customer demands (Melo et al, 2008). A discrete facility location
problem involves a predefined set of candidate locations, in contrary to a continuous model
which would allow any locations to be used. One of the models which have attracted a lot of
attention in literature is the p-median problem (Melo et al, 2008). In this problem p locations
are considered in order to minimize the total distance or cost to supply customer demand.
Furthermore, it assumes that all setup costs are the same for the different locations. Allowing
different setup costs related to the locations evolves the model into the so called
uncapacitated facility location problem (UFLP). This is done by adding a cost for location
setup to the objective function. In both the p-median and UFLP, customers are supplied by
the closest (or cheapest) facility. Introducing a capacity constraint on the demand each
facility can supply, is described as the capacitated facility location problem (CFLP). The
models mentioned above were originally developed for a single commodity with a single
period planning horizon using one type of facility to answer allocation - location decisions
with deterministic parameters (Melo et al, 2008). Several extensions of the models
mentioned above have, however, been introduced and studied extensively. Common
extensions are multi-period planning horizons, multi-commodity models, stochastic models
and multi-layered (multi-echelon) models. All of which will be covered briefly below.
Multiple periods are commonly included to incorporate the fact that certain parameters
change predictability over time; for example, the remaining shelf-life of goods stored.
Stochastic models aim to incorporate uncertainty in parameters, usually in demand, which
can be highly uncertain. Multi-layered models take the hierarchy of facilities into account, for
example production facilities and warehouses, which dictates the natural flow of materials.

24
Finally, there are multi-commodity models taking into account the different characteristics
related to the different commodities.
3.2.1 Facility location in mathematical programming
The facility location problem is commonly modeled as an integer programming model. The
basic CFLP problem can be seen in Figure 3.3 as described by Conforti et al (2014). The
objective of the model is to minimize the total costs of both transportations and annual facility
costs. The model uses a set of m customers with known demands di where i = 1,...,m.
Furthermore, there is a set of n locations where facilities can be located. Each location has
an annual operating cost of fj and a capacity of uj where j = 1,...,n. Finally cij denotes the
transportation cost from facility j to demand point i.
The model can be formulated by assigning xj to be 1 if a facility is located at j and otherwise
0 and by letting yij represent the fraction of demand at location i satisfied by facility j. The first
term of the objective function represents the total transportation cost of satisfying the
demand at all locations from the different facilities. The second term represents the total
annual costs of all open facilities. The first constraint ensures that the demand of all
customers is fulfilled. The second constraint ensures that the total amount transported from
any location does not exceed the capacity of the facility at the location. The two final
constraints ensure that y is greater than 0 and that x is binary.
Figure 3.3. The constrained facility location problem. (Conforti et al. 2014)
As mentioned previously the CFLP is one of the basic models of the facility location. The
formulation with an objective and set of constraints is the same in more complex models,
such as the one used in this study.
3.2.2 Models in humanitarian logistics
In the humanitarian logistics context, the facility location model is commonly used to help
determine the location and quantities of pre-positioned goods (Jahre et al, 2016a). Caunhye
et al. (2011) conducted a literature review covering optimization models used in the
humanitarian context. They proposed a framework (Figure 3.4) for emergency logistics
activities. The arrows in the figure represent the different activities and the direction of

25
activity flows. They further propose that models in the area can be divided between the main
areas of facility location and relief distribution. In addition, most facility location models also
consider relief distribution to different extents, which is also the case in this study. However,
Jia et al. (2005) present variations of the P-median and P-center models for large scale
emergencies, which solely focus on the amount of locations and their corresponding
distance to disasters. Dessouky et al. (2006) also present a maximum coverage model, but
incorporate a stochastic vehicle routing model to optimize relief distribution. In contrary to the
models previously mentioned Horner and Downs (2010) present a model to solve the facility
location problem with the objective of minimizing transportation costs to and from distribution
centres, while being constrained to fulfilling demand.
Figure 3.4. Proposed framework for emergency logistics activities (Caunhye et al. 2011).
All previously mentioned models have been of deterministic character. In other words, an
optimization was made based on a fixed demand, which works well when historical demand
is stable but may fail to capture the volatile nature of emergency relief operations. For
instance, Balcik and Beamon (2008) present a version of the maximum coverage model
taking into account the locations and number of distribution centers, inventory decisions,
multiple items and budgetary constraints. Furthermore, this is done while studying scenarios
instead of deterministic demand. Meaning that each scenario may occur with a certain
probability resulting in a stochastic demand which the model is then optimized on. Rawls and
Turnquist (2009) further developed this area by additionally taking into account survival of
pre-positioned goods and the condition of the transportation network. This while also
allowing scenarios to create demand points in multiple locations. Considering the complex
nature of humanitarian logistics quite a few of the later models in literature have been multi-
objective models taking both response times and costs into consideration (Jahre et al,
2016a; Rezaei-Malek et al, 2016; Bozorgi-Amiri et al, 2013; Tofighi et al, 2016). All the
articles studied can be found in Tables 3.1 and 3.2.

26
Table 3.1. Categorization of articles studied sorted by deterministic/stochastic and single/multi-objective.
Single objective Multi-objective
Deterministic Jia et al (2005), Dessouky et al (2006), Horner & Downs (2010),
Gormez et al (2011)
Stochastic Balcik & Beamon (2008), Rawls & Turnquist (2009), Duran et al (2011), Martel et al (2013), Döyen et al (2012),
Jahre et al (2016a), Rezaei-Malek et al (2016), Bozorgi-Amiri et al (2013), Tofighi et al (2016)
Table 3.2. Categorization of articles studied sorted by single/multi-layer and single/multi-commodity.
Single Commodity Multi-commodity
Single Layer Jia et al (2005), Balcik & Beamon (2008), Horner & Downs (2010)
Multi Layer Jahre et al (2016a), Dessouky et al (2006), Bozorgi-Amiri et al (2013), Gormez et al (2011)
Rezaei-Malek et al (2016), Rawls & Turnquist (2009), Duran et al (2011), Martel et al (2013), Döyen et al (2012), Tofighi et al (2016)
3.3 Network Planning and Configuration
Planning the network for a supply chain is a process where the performance of the supply
chain is optimised in regard to conflicting objectives, uncertainties in demand and supply
chain dynamics. If done properly the result will balance costs, match supply and demand as
well as use the resources in an optimal way. The process of network planning can be divided
into three steps: Network design, inventory positioning as well as management and resource
allocation. The timeframes of the network planning are strategic, tactical and operational.
The most vital strategic decision to be made in network planning is the design of the network
(Simchi-Levi et al., 2003). Strategic decisions have the longest time frame and can last for
several years. One of the typical strategic decisions is the quantity and placement of
warehouses. The strategic decisions set the conditions for the tactical decisions. These
decisions include sourcing and inventory policies. The tactical decisions in turn set the
conditions for the operational decisions, which are made continuously. These decisions
include purchasing orders and routing for shipments (Jonsson & Mattsson, 2011; Simchi-
Levi, et al., 2003).
3.3.1 Factors to consider in regard to warehouse location
There is a multitude of factors to consider and incorporate when choosing warehouse
locations. Facility location models mainly consider the factors of effect on total operational
cost and timeliness of response to demand (Haghani, 1996). However, considering the
complexity of humanitarian relief, additional factors are commonly addressed. Factors such
as political stability of the location, customs regulations, labor skill level, labor costs and
logistics accessibility are mentioned by Duran et Al. (2011) as influential. Furthermore,
considering the risk of the warehouses themselves being compromised by a disaster or
political unrest. These factors are also mentioned by multiple researchers (Martel et al, 2013;
Rawls et al, 2009; Rezaei-Malek et al, 2016). Jahre et al. (2016a) identified nine factors
influencing the network design at UNHCR (Fig 3.5), in addition to the factors already

27
mentioned; relationship with government, country security level, pilferage and co-location
with others are brought up as influential. Relationships with governments relates to what kind
of exemptions and custom clearance procedures that are in place when goods enter or leave
the country. Furthermore, some governments might be willing to provide facilities to the HO’s
at a lower price or even for free. The factor of country security level and pilferage relates to
the political stability in the country or region. A country with high instability may require
special security arrangements. This may also be the case if the country experiences high
risks of theft. These factors may not only negatively impact costs through the loss of goods,
but also the public image of the HO. Finally, the possibility and feasibility to cooperate with
other organizations affects the attractiveness of the location. If there are other organizations
in place opportunities to share resources and coordinated operations such as transport or
security services may be beneficial.
Figure 3.5. Influencing factors for network design at UNHCR (Jahre et al. 2016a).
Roh et al. (2013) researched this area further by conducting a study identifying the
warehouse location decision factors and used AHP (analytical hierarchy process) to assign
numerical weights to the respective factors. As can be seen in Figure 3.6 political stability in
the region, relation to host government and logistics capability were found to be the three
most important factors. The economic viability of the location was also placed high being the
fifth most important factor.

28
Figure 3.6. Weighted importance of warehouse location decision factors (Roh et al. 2013).
3.3.2 Factors to consider in regard to distribution
The international distribution market has developed into a highly commoditized market with
falling prices as a consequence. The four main modes of transportation are road, rail, sea
and air-freight where the most expensive mode of transport is air-freight and the cheapest
one is sea-freight. In terms of delivery speed air-freight, however, is the fastest and sea-
freight is the slowest. (Lumsden, 2007)
A drawback for sea, rail and air transports is that it requires infrastructure - in terms of ports,
airports and railroads - to deliver while truck transport only requires roads which are largely
available across the globe. (Lumsden, 2007)
Facility locations models in the field (Jahre et Al, 2016a; Rawls and Turnquist, 2010;
Bozorgi-Amiri et al, 2013) commonly use distance as a determinant for transportation costs.
However, the determinants of freight rates have been thoroughly covered in research with
mixed results. Hummels (2001) found prices elasticity of transportation costs for different
transportation modes to be 0,46 (air), 0,39 (rail), 0,275 (road), 0,22 (sea) in relation to
distance. In later work however Hummels (2007) found diminishing elasticities in regards to
distance that were practically the same for air and sea freight, 0,16 and 0,17 respectively.
Abe and Wilson (2009) found similar results of an elasticity between 0,14 and 0,21 in regard
to port-to-port distance. Further articles such as Limao and Venables (2001), Egger (2005),
Combes and Lafourcade (2005) as well as Martinez-Zarzoso and Nowak-Lehmann (2006)
all found positive linear correlation between distance and transportation costs. However,
there seems to be a consensus between researchers that distance alone cannot explain all
variability in transportation costs. Hummels (2007) for example, also found positive linear
29
correlation between freight costs and weight/value of the goods shipped and the current fuel
prices.
3.3.3 Factors to consider in regard to perishability
There are multiple models within humanitarian logistics answering the questions of where to
place commodities as well as which quantities should be stored (see Tables 3.1 & 3.2). In
humanitarian relief however, there is a high degree of uncertainty related to when a disaster
will strike, and it may occur first after a long time (Jaller et al, 2008). Since some HO:s
handle perishable commodities, the network should consider fixed shelf lifes of perishable
commodities at warehouses and renew them appropriately to prepare for probable disaster
(Jaller et al, 2008). The literature regarding perishable commodities within humanitarian
logistics is scant. Tofighi et al (2016) mention that most relief items are non-perishable and
thereby chose to leave perishable commodities outside of their model scope. Rezaei-Malek
et al (2016) have written one of few articles which proposes a facility location model with
perishable commodities. They propose a model to determine the optimum location-allocation
and distribution plan of goods. The model is a single event model with two phases, a pre-
disaster phase and a post-disaster phase. In the pre-disaster phase optimal location-
allocation of goods and an optimal ordering policy for renewing perishable goods is
determined. In the post-disaster phase an optimal distribution plan of the stored goods is
determined. This is done by assigning fixed shelf lives to all goods utilized by the model and
reducing the remaining shelf life for each time period the goods are held in storage during
the pre-disaster phase. The model then determines the optimal quantities to be held at each
location in regards to response time and replenishment costs given that a disaster can strike
with even probability in any time period. Since the model is constructed for a single event
with two phases, inventory levels are not dynamically updated after disaster has struck. The
optimal inventory levels instead act as a constraint on distribution plan in the post disaster
phase.
Furthermore, they share the view that there currently are no other models incorporating the
dimension of perishable commodities at least with fixed shelf lives. Aspects of perishability
within the area have been incorporated to some extent by (Zhang and Yang, 2007). They
propose a facility location model incorporating a perishability velocity applied during
transportation. The proposed model however, is a single period model, not capturing
deterioration during storage.
3.4 Theoretical Framework
UNFPA operates in the humanitarian logistics context, thus all decisions have to be in
accordance with this specific context. The distribution needs to be able to meet the
requirements of the acute emergencies as well as being cost-efficient in the long run.
Additionally, any alterations need to take disaster preparedness, with an emphasis on
logistics preparedness, into account. Given that the model aims at proposing a strategy for
pre-positioning, this will be taken into careful consideration.
The unique traits of the UNFPA supply chain demand a facility location model that can
capture both the stochastic and varied demand that is handled by Jahre et al. (2016a) as
well as the shelf life aspects of the model presented by Rezaei-Malek et al. (2016).

30
Furthermore, the model needs to minimize lead time and costs to provide a meaningful
answer for UNFPA and to stay in line with the research question.
As for the network planning and configuration, UNFPA needs to take the strategic, tactical
and operational level into account when planning for a potential layout alteration. When
studying a facility location problem, the most obvious implications are on the strategic level
and the study is focused around these. The operational and tactical levels will be handled
indirectly by incorporating transport costs affected by routing, as well as suggesting an
inventory policy for the new warehouses. Furthermore, the case specific factors to consider
when developing the model will be used continuously throughout the study.
A visualization of the theoretical framework can be seen in Figure 3.7.
Figure 3.7. The theoretical framework for the study (Hansson & Sagar, 2018).

31
4. Model development based on
empirical findings The following chapter will describe how the facility location model was developed. Section
4.1 will cover the qualitative and quantitative empirical findings that have affected the
process of model development as well as the empirical data that was used as input to the
model. In addition, it will cover certain empirical findings which are not directly incorporated
in the model but will act as delimitations to the model. Empirics in this chapter was obtained
through interviews, ERP-data and internal documents. Section 4.2 contains information on
how the model combined the theoretical framework with the influencing factors. The section
describes the model itself - how it was built, why different parameters were chosen and how
it works.
4.1 Empirical findings influencing the model
The empirical study unearthed five groups of characteristics influencing the model
development. This is visualised in Figure 4.1. Each group is handled in its own subsection.
Key takeaways, that were used to develop the model, are listed at the end of each
subsection. These key takeaways were, to a large extent, set in accordance with the
theoretical framework.
Figure 4.1. The influencing factors identified through empirics and the theoretical framework (Hansson & Sagar, 2018) (Adapted from Jahre et al (2016a)).

32
4.1.1 UNFPAs prior experience with pre-positioning
On national level
In a report on pre-positioning of ERH kits by Jurman (2017) as well as the interview
conducted with Jurman 8 reasons were stated as explanation to why CO:s pre-position
ERH-kits nationally. Some of these were also emphasised in other interviews. These
reasons can be found in Table 4.1.
Table 4.1. Reasons for CO:s to pre-position nationally (Hansson & Sagar, 2018) (Adapted from Jurman (2017))
1 UNFPA has a considerably longer lead time than other agencies.
2 An increase in predictable/cyclical disasters has led to CO:s being able to forecast their demand more efficiently.
3 The nature of conflicts, such as in Syria, means that access to delivering aid can be short and intermittent.
4 Protracted conflicts with bursts of active conflicts and migration have increased the need for rapid response.
5 Some countries have a reluctance to accept foreign aid. In-country supplies are often exempted from this reluctance even if it was originally provided by international donors.
6 A desire to use the entire annual budget may lead to CO:s using national pre-positioning as a way to empty their budgets.
7 If a crisis prediction shows that access points will be destroyed in a disaster national pre-positioning is the only way to deliver aid.
8 Fear of stock-outs at the central warehouse.
Some of the concerns can be handled by regional pre-positioning of goods, mainly the
concerns about stockouts and lead times. Other concerns such as the reluctance to foreign
aid would seem to require a national pre-positioning of goods. (Jurman, 2018)
Jurman (2017) also lists challenges that UNFPA must overcome in case it would wish to
implement national pre-positioning. Jurman states that CO:s need a sustainable funding
source. They also need to have a distribution and restock plan when items expire. Each CO
(country office) has to have the potential to handle waste due to expiry of stocked goods.
Investments are needed in logistic and management system in countries. Lastly,
coordination with other HO:s as well as governments to monitor pre-positioned goods is
needed.
Jurman (2018) also believed that until these factors are in place and the organization has
evaluated how the global stock levels of ERH-kits should be altered to account for national
pre-positioning, CO:s should be discouraged from using national pre-positioning. UNFPA
also needs to work with how to relocate ERH-kits stocked in a nearby country to another
nearby country struck by a disaster. This includes influencing donors to change their

33
donation behaviour. Currently, it is common that donors have earmarked their donations to a
specific country or disaster and thus the kits that were financed by that donation can only be
used to that specific end. HFCB should also have the possibility to redirect an order meant
for pre-positioning to answer to a disaster if the need arises. Jurman (2018) also stressed
that pre-positioning should be an element of disaster preparedness and not the only way to
work with preparedness.
A country that has had experience with national pre-positioning is Iraq. The rationale behind
this was the long lead time for receiving the kits from the global warehouse. Also, according
to Ahmed Malah the humanitarian coordinator for UNFPA in Iraq, the pre-positioning in Iraq
has not resulted in a single expired kit since they started using the strategy a little over a
year ago. Malah did, however, stress that personally, he thinks that global pre-positioning
with shorter lead times would be a more viable initiative due to the lower costs it would mean
for the organization as a whole. CO:s should, however, keep a small national pre-positioning
buffer for the first 24-48 hours of a disaster response, in his opinion. Other measures to
counter the long lead times have been taken. For example the customs clearance time in
Iraq has gone from 4 to 2 weeks.(Malah, 2018)
In Bangladesh there has been some pre-positioning, but this was not a conscious strategy,
but rather some kits that were not used up in one disaster response were kept as a buffer
stock for the future. The issues with pre-positioning nationally is mainly the question of how
long it will stay in stock and who will handle it during this time. Also, the risk of expiry is a
concern. (Doraiswamy, 2018)
Summary of key takeaways
● National pre-positioning brings a lot of advantages but is not feasible to implement on
a large scale.
● The national pre-positioning initiatives that were studied by the authors were not set
up due to strategic considerations.
On regional level
The regional office of UNFPA for Asia and the Pacific (APRO) covers 23 nations in Asia and
Oceania. An initiative from APRO to pre-position regionally started in 2015 with a pilot
project of one and a half years. Before this, disaster prone COs pre-positioned supplies on
an adhoc basis. Massive disasters in Philippines and Nepal proved the value of pre-
positioning in the region. APRO started discussions with PSB and HFCB on this subject. In
the light of these discussions APRO wanted to consider regional pre-positioning as well.
(Marwah & Millar, 2018)
The APRO office has set up a main regional warehouse in Brisbane, Australia in
collaboration with the Australian Department of Foreign Affairs and Trade (DFAT) and a sub-
regional warehouse in Fiji. Choosing the location for the warehouse in Brisbane was to a
great extent motivated by the need to get closer to the needs in the Pacific Islands as well as
the possibility of reduced costs using DFAT as a partner. For Fiji there were other rationales.
One of the reasons was the proximity to other agencies and Fiji is well positioned,
geographically, among the disaster prone Pacific Islands. Furthermore, UNFPA has a
number of field offices in the Pacific Islands, but Fiji is the sub-regional hub for UNFPA as

34
well as other UN-agencies. WFP runs the logistics cluster for the Pacific from Fiji and also
houses supplies for a number of UN-agencies. (Marwah & Millar, 2018)
The Brisbane warehouse is run by a commercial actor in collaboration with DFAT and is
shared with other NGO:s (Non-Governmental Organizations). UNFPA has 100 pallet
locations allocated to their stock. The stocking is free of charge for UNFPA, given that it is
provided by the Australian government. In some cases, the transports are also paid by
DFAT. The Pacific sub-regional office of UNFPA manages the warehouse in Fiji. UNFPA
does, however, own the stock in both warehouses. The warehouses stock dignity kits, tents,
RH-kits and women safe spaces. This is done in discussion with PSB and HFCB as well as
HQ in New York. (Marwah & Millar, 2018)
The initiative operates on an annual work plan with DFAT. The CO:s provide APRO with
disaster scenarios that the annual work plan is built around. The annual work plan is created
both based on impact of the disaster on RH, but also the percentage of RH-need that
UNFPA hopes to fill. Most CO:s in the initiative would probably like more supplies but there
are limitations. (Marwah & Millar, 2018)
APRO has experienced some issues with the shelf life of the pharmaceuticals. The
agreement with DFAT is to donate supplies prior to the expiry. An example of this was in
Myanmar where the CO could give the supplies to an implementing partner that forwarded
them to an ongoing operation. When DFAT announces additional funds, the depleted goods
can be replenished right away but otherwise APRO have a modest fund that can replenish
stock after the disaster response. (Marwah & Millar, 2018)
From the warehouses in Brisbane and Fiji APRO has been able to sea freight emergency
supplies directly to the disaster-stricken areas and thus save costs. One example was after
the cyclone in Tonga hit 70 000 people, roughly 70% of the country. In the response, UNFPA
drew supplies from Brisbane. These were transported by DFAT and supplies were on the
ground 48 hours after the request. According to Marwah and Millar (2018) the transport
would take 4 weeks from Amsterdam. The initiative has also dealt with a bigger disaster after
an earthquake hit Papua New Guinea. In this response PSB stated that it would cost
approximately 45 000 USD to airlift the goods from Amsterdam. Instead the cost amounted
to 6 000 USD using sea freight from Brisbane. Another pro of the regional focus is that
APRO and CO:s can customise things like dignity kits for a country to adjust to
contemporary and cultural factors in the country. (Marwah & Millar, 2018)
During interviews it was stated that APRO is beginning to build up evidence that the regional
pre-positioning is a success. Important to note is, that this initiative had the funding from
DFAT and that made all the difference. DFAT is increasing its investment into the initiative.
This is due to the marketing value being very great for DFAT. Donors are keen to see the
relatively immediate action that can be provided by pre-positioning. When packages with
DFAT logos are in place in the disaster zone quickly after the disaster has stricken, it has a
big medial impact. (Marwah & Millar, 2018)
Summary of key takeaways
● Regional pre-positioning has saved lead times and costs for UNFPA.

35
● Regional pre-positioning has a medial impact for donors.
● Regional pre-positioning requires stable funding.
4.1.2 Commodity Characteristics
One of the main concerns uncovered by the data collection was the aspect of product
perishability in relation to pre-positioning.
The shelf life for the different ERH-kits are subject to the components of the kit. The shelf life
can vary from 8 to 60 months. There are also kits consisting of only non-perishable
commodities. When sending an ERH-kit to a CO the remaining shelf-life of the kit has to be
at least 75% of the total shelf life, which is a WHO-standard. This creates an issue when
considering the current contract with the supplier which states that the remaining shelf life of
the kits needs to be at least 75% when placed in the warehouse. Almost every week the
PSB-team receives an e-mail from the supplier that they have components in the kits that
are approaching the contracted limit for shelf life or have already reached it. This is due to
two factors. The first is that the supplier has a minimum order quantity when ordering the
components for the kits. The second is the long lead time required to assemble the kits. In
practicality this means that some of the total shelf life has already passed when UNFPA
receives the kits. (Nielsen, 2018a)
However, if a component needs to be replaced in a kit the supplier can handle this. It is not
pre-decided whether the supplier or PSB carries the cost for such an operation, in some
cases it is split between the two parties (Doruch, 2018). If a kit would expire, the monetary
losses of this would be drawn from UNFPA reserves (Tatunts, 2018). Furthermore, through
validation meetings, the functions of replacing single kit components was deemed unique to
the supplier in the Netherlands and would thereby be lost if utilizing other warehouses. This
links to the concern that, with a global warehousing layout, the process of substitution would
be more costly for UNFPA as a whole, as well as more time consuming for employees at
PSB (Doruch, 2018). Furthermore, there are concerns that the total amount of perished
products would increase, instead of fulfilling need in other regions or countries (Doruch,
2018).
In some cases CO:s are willing to accept kits with a shorter remaining shelf life (Nielsen,
2018a). The Iraq office for example, has accepted some kits that were nearing expiry and
only had about 8 months of shelf life left. Despite this, they could use them in their
operations after the Mosul crisis (Malah, 2018). Measures are also being taking by PSB to
create demand kits approaching the end of their shelf life. These measures include lowering
the price for kits nearing expiration date and trying to make CO:s start programmes using the
kits (Doruch, 2018). However, no clear data on how prices are reduced when kits are
nearing their expiry date was obtained.
Initially, it was stated that some of the kit components (oxytocin and blood transfusion kits)
required cold chain transportations. However, it was uncovered through interviews that the
kits containing components that require a cold chain are usually broken up when dispatched.
This means that the components that require a cold chain are shipped separately and thus
the majority of shipments made by UNFPA do not require a cold chain transport (Nielsen,
2018a).

36
Summary of key takeaways
● Cost of perished kits needs to be incorporated.
● Different kits have different shelf lives.
● There is no single way to deal with kits close to expiry.
● Kit components requiring cold chain transport are handled separately.
● The warehouse in the Netherlands, has specific unique functions for handling
perished goods compared to other warehouses.
4.1.3 Demand Characteristics
There is an especially relevant factor to consider when discussing the delivery of ERH-kits
carried out by UNFPA. Johnny Abbas, the Global Logistics Advisor for UNFPA (2018),
stated that when a crisis emerges, the reproductive health needs of an afflicted population
does not take precedence over more rudimentary supplies such as water, medicines and
food. This was discussed and validated by several other interviewees as well as during the
validation meetings.
Since the study involves ERH-kits, historical shipments (Figure 4.2) done by UNFPA should
be considered as fulfillment of emergency demand. As described clearly in literature (Balcik
and Beamon, 2008; Jahre et al, 2016a; Rawls and Turnquist, 2009; Rezaei-Malek et al,
2016) emergency demand is difficult to predict and requires the consideration of multiple
scenarios. There are, however, multiple factors complicating the demand patterns of
UNFPA. Firstly, the actual need experienced by UNFPA is not solely dependent on demand
but also on the availability of funds (Nielsen, 2018a). Thereby, historical shipments will not
show demand that could not be fulfilled due to lack of funding. Additionally, small
discrepancies between actual demand and historical shipments might have been caused by
CO:s retracting orders for ERH-kits when they realised they were unlikely to be fulfilled due
to stockouts (Doruch, 2018; Nielsen, 2018a). Finally, Danielle Jurman (2017) conducted a
survey with UNFPA CO:s where it was stated that 56,25% of the respondents had procured
ERH-kits for pre-positioning although the kits are only to be used for emergency situations.
Unfortunately, it is not possible for the authors to determine which shipments were made
with the purpose to respond to a disaster and which were made to pre-position. The factors
above can possibly explain why the historical shipments in (Figure 4.2) both shows kits with
high volatility as well as very low volatility over the last three years.

37
Figure 4.2. The different quantities of ERH-kits shipped 2015-2017.
Patterns are not only seen when studying the amount of kit types shipped, but also when
studying the geographical distribution of kit shipments from 2015-2017. It can be discerned
that the countries with the highest demand were the same for all three years, the exception
being Nepal which suffered from an earthquake in 2015. The total demand for years 2015-
2017 is shown in Figure 4.3. The pareto distribution of demand was visualized further when
studying the regional distribution of shipments (Figure 4.4). This analysis reveals that the
western hemisphere has a very low demand for the period 2015-2017, whilst the two African
regions and the Arab States make up almost 75% of the total shipments.

38
Figure 4.3. Distribution of amount of kits shipped to different countries 2015-2017.
Figure 4.4. The total amount of kits shipped to different regions for 2015-2017. APRO is the Asia Pacific Regional Office, ASRO is the Arab States Regional Office, EECARO is the Eastern Europe and Central Asia Regional Office, ESARO is the Eastern and South Africa Regional Office, LACRO is the Latin America and Caribbean Regional Office and finally WCARO is the Western and Central Africa Regional Office.
Summary of key takeaways
● Emergency demand requires considering multiple scenarios.

39
● Actual demand may be larger than historical shipments due to order cancellation and
shortage of funding.
● A significant portion of ERH-kits are currently purchased in pre-positioning purposes.
● A few countries stand for a large portion of the demand.
● The African region and the Arab states make up the vast majority of demand.
● ERH-kits are not a first priority in a disaster response.
4.1.4 Logistics Characteristics
There are multiple logistics factors uncovered in the study that will impact the model. These
include: transportation costs, warehousing costs, transportation times, demand points and
demand point accessibility. All of which will be addressed in this section.
It is important to note that UNFPA are quite new to humanitarian response. Johnny Abbas,
the Global Logistics Advisor for UNFPA, (2018) stated that it is only the last 7-8 years that
they have become more involved in it.
Warehousing and accessibility
The two main warehousing facilities incorporated in this study are the warehouse in the
Netherlands and the UNHRD warehouses. Currently all warehousing activities; receiving,
put-away, storage and dispatch are handled by the supplier in the Netherlands.
Unfortunately, no clear cost break-down of the different activities was obtained. However,
with some data on storage costs in combination with validation meetings with UNFPA a
warehousing cost for the Netherlands of 10 % of kit value was deemed reasonable.
The United Nations Humanitarian Response Depot (UNHRD) is a network of strategically
positioned depots used to store and facilitate quick distribution of emergency supplies for
humanitarian organizations, managed by WFP. The depots are located in; Accra (Ghana),
Dubai (UAE), Subang (Malaysia), Panama City (Panama), Las Palmas (Spain) and Brindisi
(Italy). UNFPA has the opportunity to utilize the UNHRD network for pre-positioning of
supplies as an alternative to establishing their own network of strategically positioned
warehouses. All UNHRD:s are specialised in cold chain storage and the security of the
facilities is considered to be high (Tornese & Parisi, 2018).
These depots provide their customers with standard as well as specific services. Most of the
standard services such as stock keeping and customs clearance are free of charge for the
utilizers of the UNHRD network. This also includes storage of drugs and issuing of stock
reports. The specific services include transport facilitation by the WFP/UNHRD. The prices
obtained for these are charged with an additional 7 % recovery cost added to the price
received in the quotation. The UNHRD network would be able to offer kitting services.
(UNHRD, 2016)
UNHRD offers pharmaceutical services and management of drugs. The price of this varies
and has to be obtained through an RFQ to UNHRD. The UNHRD network has experience
with handling this type of goods from a previous collaboration with World Health
Organization (Tornese & Parisi, 2018).

40
Storage capacities in both the warehouse in the Netherlands and UNHRD warehouses were
not deemed to be an issue (Doruch, 2018; Tornese & Parisi, 2018). However, as mentioned
by Jahre et al (2016a) and expressed in validation meetings, certain locations may have
different conditions in relation to physical accessibility depending on the locations
infrastructure.
Summary of key takeaways
● Warehousing costs differ between UNHRD warehouses and the warehouse in the
Netherlands.
● There are no capacity constraints on warehouses.
● UNHRD warehouses have recovery costs on transport.
● Accessibility depending on infrastructure needs to be accounted for.
Transportation mode and costs
Doruch (2018) stated that the majority of shipments dispatched by UNFPA use air freight as
mode of transport. According to Abbas (2018), airfreight is the freight mode of choice in a
disaster response. Sea freight is utilized as much as possible when lead times are not an
issue (Doruch, 2018). This relationship could be identified in the data analysis of ERP-data.
Figure 4.5 shows the distribution of mode of transport for years 2015-2017. During the three
years studied, air freight decreased from 79 to 67 percent, sea freight has increased from 18
percent to 28 percent and land transport was low all three years varying between 2 and 5
percent. Transportation by land is usually associated with considerable hardship, especially
when crossing multiple borders (Blasco, 2018; Jurman, 2018).
Figure 4.5. The distribution of different means of transportation from the supplier to CO:s for 2015-2017.
Analysis of ERP-data yielded average transportations costs of sea and air freight presented
in Table 4.2. It was identified that the costs for sea freight are significantly lower compared to
the costs for air freight. Furthermore, as can be seen in the table, shipments of large sizes
seem to gain economies of scale and have a lower price than the average sea freight cost.
The same goes for shipments where the total volume of kits is close to that of a multiple of a
TEU. In other words, fully loaded containers results in lower costs per kilo. Since air freight is
not intended to be used for bulk shipments, the same type of analysis on air freight was not

41
found necessary. The size of air shipments will always vary depending on the disaster at
hand. Therefore, always shipping optimal quantities is not possible.
Table 4.2. Average cost for different modes of transport and different types of shipments.
Average Transport cost Air freight (USD/KG)
Average Transport Cost Sea freight (USD/KG)
Average Sea freight Cost removing multimodal posts (USD/KG)
Average Sea freight cost with ship sizes close to whole fractions of TEU (+- 0,2) (USD/KG)
4,847345175
1,243565513
0,844276238 0,733914956
The data analysis of ERP data also uncovered a slight linear trend between air freights costs
and geographical distance as seen in Figure 4.6. It is in line with literature (Hummels, 2007;
Limao and Venables, 2001) that only a portion of transportation costs can be explained by
geographical distance. Concerns regarding transportations cost relation to geographical
distance were also expressed during validation meetings, especially in relation to limited
transportation routes from locations such as Ghana.
Figure 4.6. A scatter chart for the correlation between distance and USD/kg for airfreight.
Summary of key takeaways
● Air freight is most commonly used for dispatch to disasters.
● Sea freight is preferred if lead times are not an issue.
● Air freight is significantly more expensive than sea freight.
● Air freight costs vary in relation to distance but require incorporation of location
specific factors, such as ease of arranging international transports.
Lead times and request handling
The process of request handling is initiated with a CO or third party generating a request
(Nordin, 2018). The process of request handling is visualised in Figure 4.7. The request is
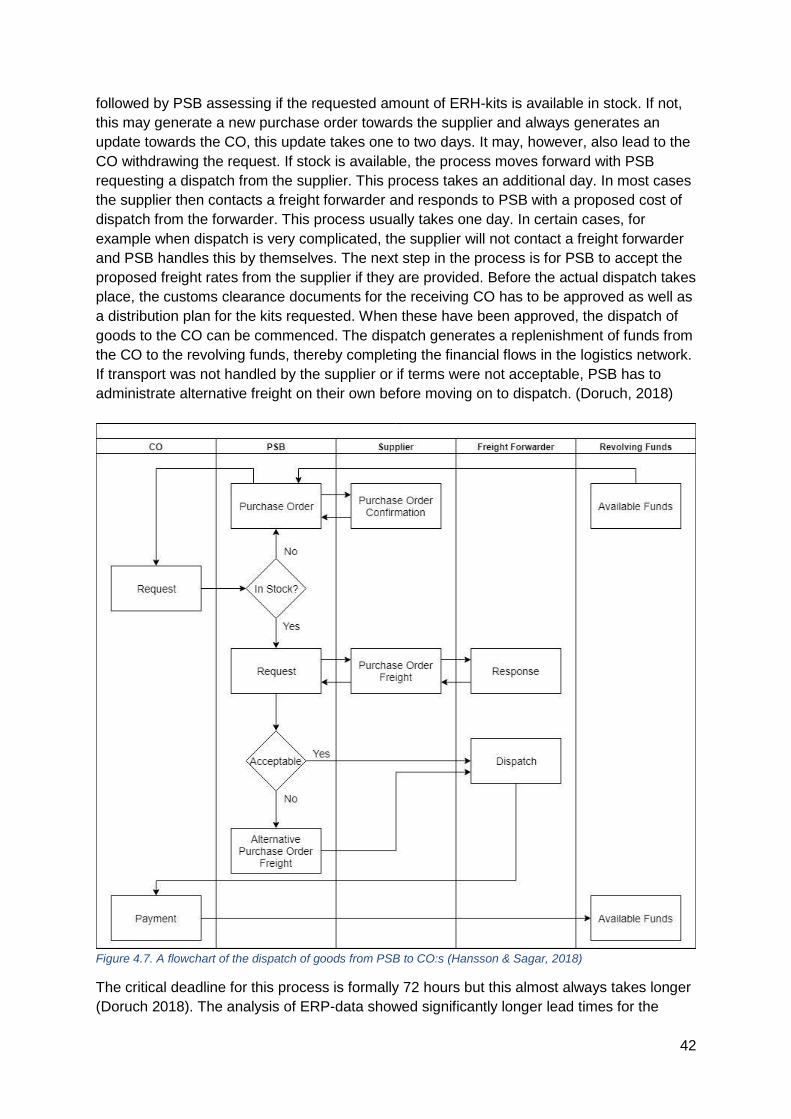
42
followed by PSB assessing if the requested amount of ERH-kits is available in stock. If not,
this may generate a new purchase order towards the supplier and always generates an
update towards the CO, this update takes one to two days. It may, however, also lead to the
CO withdrawing the request. If stock is available, the process moves forward with PSB
requesting a dispatch from the supplier. This process takes an additional day. In most cases
the supplier then contacts a freight forwarder and responds to PSB with a proposed cost of
dispatch from the forwarder. This process usually takes one day. In certain cases, for
example when dispatch is very complicated, the supplier will not contact a freight forwarder
and PSB handles this by themselves. The next step in the process is for PSB to accept the
proposed freight rates from the supplier if they are provided. Before the actual dispatch takes
place, the customs clearance documents for the receiving CO has to be approved as well as
a distribution plan for the kits requested. When these have been approved, the dispatch of
goods to the CO can be commenced. The dispatch generates a replenishment of funds from
the CO to the revolving funds, thereby completing the financial flows in the logistics network.
If transport was not handled by the supplier or if terms were not acceptable, PSB has to
administrate alternative freight on their own before moving on to dispatch. (Doruch, 2018)
Figure 4.7. A flowchart of the dispatch of goods from PSB to CO:s (Hansson & Sagar, 2018)
The critical deadline for this process is formally 72 hours but this almost always takes longer
(Doruch 2018). The analysis of ERP-data showed significantly longer lead times for the

43
process. As seen in Figure 4.8 lead times for the process of request handling have
increased drastically from 2015 to 2017. Since the process includes several steps, the root
cause for the increase in lead time over the years has not been unambiguously identified.
Throughout interviews and validation meetings, however, this phenomenon was mostly
ascribed to the supplier not being able to supply kits at a sufficient pace. In addition, it was
expressed that COs in some cases have had issues with customs clearance, creating very
long lead times and thereby skewing the data. The data is, however, strengthened by the
point made by Malah (2018) who expressed that lead times have increased the last years.
Figure 4.8. The mean of lead time from request to dispatch for ERH-kits 2015-2017.
From a CO point of view, the delivery starts with the CO assessing the needs for a time
period. For the Iraq CO this period used to be a few weeks but due to problems with long
lead times, the new planning horizon is three to four months. A great challenge for the CO:s,
that is being addressed, is the custom clearance of ERH-kits. In Iraq for example, the
process of clearing all the components through customs has been reduced from one month
to two weeks. (Malah, 2018)
Summary of key takeaways
● The process of request handling is complex with multiple steps.
● The lead time from request to dispatch is long and this has caused problems in the
Supply Chain.
● Stock availability is a major issue.
4.1.5 Sourcing Characteristics and Budgetary Constraints
The sourcing of components and assembly of ERH-kits is handled by a supplier in the
Netherlands. The contract with the supplier is a long-term agreement that has been running
for two years and has been extended throughout 2018. The high-quality standards that are
required to handle the ERH-kits make the list of possible suppliers for the kits rather short.
(Doruch, 2018)

44
The quality assurance of the supplier is not followed up continuously unless a CO
specifically requests a pre-shipment control. This is due to a rigorous control in the supplier
selection phase with on-site visits and a requirement to send the kits to UNFPA for control.
There have been suggestions to make random inspections at the suppliers site, but this has
been deemed costly. (Doruch, 2018)
The funding of ERH-kits is administered by two revolving funds. A revolving fund in the
context of UNFPA means a budgetary post to secure liquidity to be able to make purchase
orders and hold stock. The first fund, GCCP, is reserved solely for buying ERH-kits and
consists circa 5 million USD. This sets the limitation of the value of ERH-kits in stock to 5
million USD. The money in this fund is refilled by CO:s making purchase orders from the
stock. The purchase is divided into two components: the cost of the ERH-kit and the cost for
the transport of the kit. The second revolving fund is Access RH. It contains circa 14 million
USD and is used for both ERH-kits and other purchases made by PSB. This fund is used for
allocating money tied up in work-in-progress and purchase orders. The GCCP fund was
created in 1996 and the money in it is no longer sufficient to support the need for ERH-kits.
Also there have been no signals that it will grow and thus the hard line between the two
revolving funds has become somewhat blurred to be able to fulfil PSB:s need for buying
ERH-kits. The payment for an ERH-kit from a CO includes all costs associated with getting
the ERH-kit to stock. This means that the price for each of the components, the kitting cost,
the transportation cost to the supplier and the warehousing cost are included in this price.
The price of the freight from stock to the CO is paid separately. (Nielsen, 2018b)
On the national level there are issues related to funding, lead times and mode of transport.
Sathya Doraiswamy, chief of RH in Bangladesh (2018), expressed that donors might have a
short funding span for certain situations, meaning that the funds are available for usage of
UNFPA only during a limited time. For example, there have been projects in Bangladesh that
have funds available for 3-6 months. This has, in some cases, led to the CO in Bangladesh
having to choose air freight over sea freight despite the higher cost.
Summary of key takeaways
● There are few suppliers capable of supplying ERH-kits, making global sourcing very
challenging.
● Total costs of PSB activities regarding ERH-kits may not exceed 19 million USD.
● PSB revolving funds are replenished when kits are sent to COs.
4.2 Model
In this section, a scenario based two-stage programming model is proposed to solve the
facility location problem. The idea of two-stage stochastic programming is to allow optimal
decisions to be based on the data available at the time and not depend on future
observations (Shapiro and Philpott, 2007). The model thereby optimizes the objective value
of the first stage decisions plus the expected objective value of second stage decisions. This
type of programming approach is commonly used within humanitarian logistics (Jahre et al,
2016a; Rawls and Turnquist, 2010; Tofighi et al, 2016) to handle uncertainty in input
parameters.

45
The model is developed with the intention to incorporate as many of the key takeaways as
possible. This will be shown throughout the model delimitations and problem definition. In
the following sections the model will be described in detail by first introducing the general
indices, parameters and decision variables and then going over the objective functions and
parameter values for each of the different layouts.
4.2.1 Model delimitation
The delimitations below are specific to the model and are complementary to the delimations
of the entire study.
● As national pre-positioning was deemed infeasible, this will not be incorporated in the
model.
● Since kit components requiring cold chain transport are handled separately, cold
chain requirements on transports are not incorporated.
● The warehouse in the Netherlands specific handling expiring kit components will not
be incorporated, due to a significant increase in model complexity.
● Kits close to expiry will not be sold at reduced prices.
● The lead time from request to dispatch of 2017 will not be directly incorporated into
the model. Instead it is deemed feasible that UNFPA manages to reduce their lead
times to the levels of 2015.
● Revolving fund functionalities will not be incorporated since total system costs should
be considered and not only PSB.
4.2.2 Problem definition
All kits will originate from the Netherlands. The scenarios will be constructed by studying
historical shipments to different countries from 2015-2017, where each year will represent
one scenario as was done by Jahre et al (2016a). The selection of warehouse locations will
therefore be the optimal given that any of the three scenarios could occur with equal
probability. All demand will be considered to be ER demand, since the model aims to
determine locations and kit amounts for pre-positioning it will be assumed that CO:s will no
longer feel the same need for national pre-positioning.
Inventory levels at each warehouse will be measured in the units of kits of each type. This is
a key aspect of the model since different kits have different shelf lives. To fully capture the
aspect of kit deterioration, the model will be optimized over thirteen time periods, one period
for determining initial warehouse stock levels and the twelve following periods to represent
the twelve months of a year. This is similar to Rezaei-Malek et al (2016) who also determine
optimal stock levels in the first time period. Every kit in storage will have a corresponding
shelf life (in months) which is reduced for each time period it spends in storage.
Opening of warehouses will incur a fixed cost depending on which warehouse it is. The
warehouse in the Netherlands, UNHRD and prospective new warehouse will all have
different related fixed costs to capture the costs identified in the empirics. In addition to the
fixed cost, a percentage penalty costs, will be added depending on the country
characteristics. This to account for accessibility to both infrastructure and competent service
providers. This was inspired by Jahre et al (2016a) who had penalties based for hardship,

46
pilferage and lack of accessibility. Inventory holding costs will be applied to the stock in
storage, this also depending on which type of warehouse the stock is held in. Country
demand can be served by any warehouse which is opened. However, the model will always
select the closest open warehouse to be used, given that there is sufficient stock in that
warehouse. The lead-times before a product arrives at any given warehouse will be set to
one month for all warehouses with the exception of the Netherlands were the lead-time will
be zero months.
Shipment rates to and from warehouses will differ. Restocking, in other words shipments
from supplier to warehouses, will be covered by sea freight. Costs of perished kits will
thereby be captured by requiring a re-purchase of the kit including a new transport cost to
the given warehouse. All shipments from warehouses to disasters will be covered by
airfreight, these costs will be determined based on the weight of goods shipped and the
distance of transportation. The transportations costs from warehouses to disasters will also
be exposed to penalty costs with the aim of incorporating location specific issues with
arranging transports as well as timeliness.
The goal of the model will be to fulfil all demand in all scenarios at a minimal cost. Allowing
an allowed percentage of shortage of kits responding to disasters as seen in Rezaei-Malek
et al. (2016) was considered. However, due to scenarios being created using historical
shipments, it was deemed feasible to require the model to fully satisfy the demand.
Furthermore, by not allowing any kit shortages at disasters, the cost of shortage and
indirectly the cost of loss of life does not have to be approximated. The model will, however,
impose penalty costs when stock levels deviate from the optimal determined in the first time
period. Rezaei-Malek et al (2016) use a similar penalty. However, they only impose the
penalties when stock levels are below the optimal. This is done, by the authors, to avoid
unfeasible ordering policies where stock levels vary greatly between time periods to reduce
total model costs. By applying this penalty cost a more realistic ordering policy can hopefully
be captured. The model will strive to keep initial stock levels, which could compare to a
yearly forecast in reality.
Even though response times were deemed not to be a priority for UNFPA, a response time
model similar to Jahre et al. (2016a) and Rezaei-Malek (2016) will be introduced. In this
response time model, the optimization from the cost model will be used as a budget
constraint. This is done in order to study how much response time reductions would actually
cost which, in turn, opens up the opportunity to weigh lead time reductions against
costs.Generally, for facility location models, response times and related transportation times
are addressed as a key aspect (Balcik & Beamon, 2008; Jahre et al, 2016a; Rawls &
Turnquist, 2010; Rezaei-Malek et al, 2016). However, given that UNFPA delivers non-
rudimentary products, ERH-kits, the hours prospectively saved by pre-positioning does not
hold the same value in this specific case.
Finally, the initial model will be extended with additional prospective warehouses from
selected countries with historically high demand. This will be done in order to study how an
optimal solution would be affected if not being constrained by only utilizing the UNHRD
warehouses as options.

47
To solve the two model variations an IBM ILOG CPLEX machine with 16 GB of ram was
used. Model instances were solved in between 11 to 24 minutes with a maximum of 11 000
000 binary and integer variables and 12 000 000 constraints.
4.2.3 Indices
𝑖 Index of candidate warehouses (𝑖 = 1, … , 𝐼)
𝑗 Index of demand points (𝑗 = 𝑗, … , 𝐽 )
𝑘 Index of ERH-kits (𝑘 = 1, … , 𝐾)
𝑠 Index of possible scenarios (𝑠 = 1, … , 𝑆)
𝑡 Index of time periods (𝑡 = 0, … , 𝑇)
ℎ Index of remaining period shelf life (ℎ = 0, … , ℎ)
Figure 4.9. A world map with the warehouse candidates plotted. Red indicates the original warehouse, blue indicates UNHRD-warehouses and green are other candidate locations. (Hansson & Sagar, 2018)
4.2.4 Parameters
𝑓𝑖 Fixed cost of establishing warehouse i (USD)
𝐶𝐻𝑖𝑘 Unit holding cost for kit k at warehouse i (USD)
𝑆𝑃𝑘 Penalty costs of unit shortage at warehouse of commodity k (USD)
𝐶𝑃ℎ𝑘 Purchasing cost of kit k with h remaining shelf life (USD)
𝐶𝑀𝑖𝑘 Transportation cost for kit k from supplier to warehouse i (USD)
𝐶𝑇𝑖𝑗𝑘 Transportation cost for kit k from warehouse i to demand point j (USD)
𝐶𝑅𝑖 Recovery costs on transport for warehouse i
𝐻𝑃𝑖 Penalty costs for infrastructure and logistics competence at warehouse i
𝑇𝑃𝑖 Penalty costs for international shipments and timeliness on transports from
warehouse i
𝛾𝑖𝑘 Holding capacity of warehouse i for kit k (units)
𝐵 Budget constraint for establishing warehouses (units)

48
𝑀 A sufficiently large number
𝑝𝑠 Probability of scenario s
𝑡𝑖𝑗 Transportation time from warehouse i to demand point j (hours)
𝑑𝑗𝑘𝑠𝑡 Demand in scenario s, time period t of kit k at demand point j (units)
4.2.5 Decision variables
𝑥𝑖𝑗𝑘𝑠𝑡ℎ Amount of kit k shipped from warehouse i, to demand point j, in scenario s,
time period t with remaining shelf life h (units)
𝑧𝑖𝑘𝑠𝑡 Amount of kit k not used for disaster response at warehouse i, in time period t,
scenario s (units)
𝑦𝑖 1 if warehouse i is open; 0 otherwise (binary)
𝑏𝑘𝑖𝑡ℎ𝑠 Amount of kit k with remaining shelf life h, removed from warehouse i, in time
period t, scenario s (units)
𝑄𝑘𝑖𝑡ℎ𝑠 Amount of kit k with remaining shelf life h, purchased for warehouse i, in time
period t, scenario s (units)
𝐸𝑘𝑖𝑡𝑠 Deviation of kit k from optimal level in warehouse i, in scenario s, time period t
(units)
𝐼𝑘𝑖𝑡ℎ𝑠 Ingoing stock level of kit k with remaining shelf life h, at warehouse i, in time
period t, scenario s (units)
𝑂𝑘𝑖𝑡ℎ𝑠 Outgoing stock level of kit k with remaining shelf life h, at warehouse I, in time
period t, scenario s (units)
𝑞𝑖𝑘 Amount of kit k to be held at warehouse i (units)
4.2.6 Minimum cost model
To achieve the goal of the minimum cost model, to satisfy all demand in every scenario and
time period at as low a cost as possible, the objective function TC is minimized.
𝑇𝐶 = ∑ 𝑦𝑖
𝐼
𝑖=1
𝑓𝑖𝐻𝑃𝑖 + ∑ ∑ 𝑝𝑠 (∑ ∑ 𝑧𝑖𝑘𝑠𝑡𝐶𝐻𝑖𝑘 + ∑ ∑ 𝑥𝑖𝑗𝑘𝑠𝑡ℎ𝐶𝑇𝑖𝑗𝑘𝐶𝑅𝑖𝑇𝑃𝑖
𝐻
ℎ=1
𝐽
𝑗=1
𝐾
𝑘=1
𝐼
𝑖=1
)
𝑇
𝑡=1
𝑆
𝑠=1
+ ∑ ∑ ∑ ∑ 𝑝𝑠 (∑((𝐶𝑃ℎ𝑘 + 𝐶𝑀𝑖𝑘)
𝐻
ℎ=1
𝑄𝑘𝑖𝑡ℎ𝑠) + 𝑆𝑃𝑘𝐸𝑘𝑖𝑡𝑠)
𝑇
𝑡=0
𝑆
𝑠=1
𝐾
𝑘=1
𝐼
𝑖=1
The first term in the objective function represents the annual costs of utilizing a selected
warehouse. This term also includes penalty costs for in-country infrastructure and logistics
capability. The second term represents the holding costs of unused stock in each time period
and scenario. The third term represents the transportation costs of kits from warehouses to
disaster CO. This term also includes penalty costs related to the international shipment
potential and timeliness of the country where the warehouse is located and recovery costs.
The fourth term shows purchasing costs for each kit as well as transportation costs from
supplier to the warehouse in question. As can be seen in the sum over time periods the
objective function here accounts for purchases in time period 0, in other words the model
takes into account the cost of initial stock building and not only replenishment. The final term
represents the penalty cost incurred when stock levels deviate from initially calculated
optimal stock levels.

49
Constraints
The following constraints are part of all optimization models and will be covered below.
(1) 𝑏𝑘𝑖𝑡ℎ𝑠 + ∑ 𝑥𝑖𝑗𝑘𝑠𝑡ℎ
𝐽
𝑗=1
≤ 𝐼𝑘𝑖𝑡ℎ𝑠 ∀ 𝑘, 𝑖, ℎ, 𝑠, 𝑡 ∈ (1, … , 𝑇)
(2) 𝐼𝑘𝑖(𝑡+1)(ℎ−1)𝑠 = 𝑂𝑘𝑖𝑡ℎ𝑠 ∀ 𝑘, 𝑖, 𝑠, 𝑡 ∈ (0, … , 𝑇 − 1), ℎ ∈ (1, … , 𝐻)
(3) 𝐼𝑘𝑖𝑡ℎ𝑠 = 0 ∀ 𝑘, 𝑖, 𝑠, 𝑡 ∈ (1, … , 𝑇), ℎ = 𝐻
(4) 𝑂𝑘𝑖𝑡ℎ𝑠 = 𝑄𝑘𝑖𝑡ℎ𝑠 + 𝐼𝑘𝑖𝑡ℎ𝑠 − 𝑏𝑘𝑖𝑡ℎ𝑠 − ∑ 𝑥𝑖𝑗𝑘𝑠𝑡ℎ
𝐽
𝑗=1
∀ 𝑘, 𝑖, ℎ, 𝑠, 𝑡 ∈ (1, … , 𝑇)
(5) 𝑏𝑘𝑖(𝑡+1)(ℎ−1)𝑠 = 𝑂𝑘𝑖𝑡ℎ𝑠 ∀ 𝑘, 𝑖, 𝑠, 𝑡 ∈ (0, … , 𝑇 − 1), ℎ = 1
(6) 𝑏𝑘𝑖𝑡ℎ𝑠 = 0 ∀ 𝑘, 𝑖, 𝑡, 𝑠, ℎ(ℎ ∈ 𝐻 ∧ ℎ ≠ 0)
(7) 𝑥𝑖𝑗𝑘𝑠𝑡ℎ = 0 ∀ 𝑘, 𝑖, 𝑡, 𝑠, 𝑗, ℎ = 0
(8) 𝐼𝑘𝑖𝑡ℎ𝑠 = 𝑄𝑘𝑖𝑡ℎ𝑠 ∀ 𝑘, 𝑖, ℎ, 𝑠, 𝑡 = 0
(9) 𝑂𝑘𝑖𝑡ℎ𝑠 = 𝐼𝑘𝑖𝑡ℎ𝑠 ∀ 𝑘, 𝑖, ℎ, 𝑠, 𝑡 = 0
(10) 𝑄𝑘𝑖𝑡ℎ𝑠 = 0 ∀𝑘, 𝑖, 𝑡, 𝑠, ℎ(ℎ ∈ 𝐻 ∧ ℎ ≠ 𝛼𝑘)
(11) ∑ 𝐼𝑘𝑖𝑡ℎ𝑠
𝐻
ℎ=1
= 𝑞𝑖𝑘 ∀ 𝑘, 𝑖, 𝑠, 𝑡 = 0
(12) 𝐸𝑘𝑖𝑡𝑠 = |𝑞𝑖𝑘 − ∑ 𝑂𝑘𝑖𝑡ℎ𝑠
𝐻
ℎ=1
| ∀ 𝑘, 𝑖, 𝑠, 𝑡 ∈ (1, … , 𝑇)
(13) ∑ ∑ 𝑥𝑖𝑗𝑘𝑠𝑡ℎ = 𝑑𝑗𝑘𝑠𝑡 ∀ 𝑘, 𝑗, 𝑠, 𝑡 ∈ (1, … , 𝑇)
𝐻
ℎ=1
𝐼
𝑖=1
(14) 𝑧𝑖𝑘𝑠𝑡 = ∑(𝐼𝑘𝑖𝑡ℎ𝑠 −
𝐻
ℎ=0
𝑏𝑘𝑖𝑡ℎ𝑠) − ∑ ∑ 𝑥𝑖𝑗𝑘𝑠𝑡ℎ ∀ 𝑘, 𝑖, 𝑠, 𝑡 ∈ (1, … , 𝑇)
𝐽
𝑗=1
𝐻
ℎ=0
(15) 𝑥𝑖𝑗𝑘𝑠𝑡ℎ ≤ 𝑀 ∀ 𝑘, 𝑖, 𝑗, 𝑠, 𝑡, ℎ
(16) ∑ 𝑓𝑖𝑦𝑖 ≤ 𝐵
𝐼
𝑖=1
(17) 𝐼𝑘𝑖𝑡ℎ𝑠 ≤ 𝑦𝑖𝛾𝑖𝑘 ∀ 𝑘, 𝑖, 𝑡, ℎ, 𝑠
(18) 𝑂𝑘𝑖𝑡ℎ𝑠 ≤ 𝑦𝑖𝛾𝑖𝑘 ∀ 𝑘, 𝑖, 𝑡, ℎ, 𝑠
(19) 𝑥𝑖𝑗𝑘𝑠𝑡ℎ, 𝑧𝑖𝑘𝑠𝑡 , 𝑏𝑘𝑖𝑡ℎ𝑠, 𝑄𝑘𝑖𝑡ℎ𝑠, 𝐸𝑘𝑖𝑡𝑠, 𝐼𝑘𝑖𝑡ℎ𝑠, 𝑂𝑘𝑖𝑡ℎ𝑠, 𝑞𝑖𝑘 ≥ 0 ∀ k, i, j, s, t, h
(20) 𝑦𝑖 ∈ {0,1} ∀ 𝑖
Constraint (1) ensures that the sum of kits removed (due to perishing) and kits sent to
disaster COs cannot exceed the inbound stock level of the time period in question.
Constraint (2) dictates that the inbound stock level of the next time period is equal to the
outbound stock level of current time period, with one less time period in remaining shelf life.
Constraint (3) ensures that there are not any kits in inbound stock with the maximum shelf
life, this constraint complements constraint (2) and helps capture the aspect of shelf life
depreciation during transport from supplier to warehouse. Constraint (4) dictates that the
outbound stock for each time period is equal to the sum of purchased kits and inbound stock
minus perished kits and kits shipped to disaster CO:s. Constraint (5) ensures that all kits in
outgoing stock with remaining shelf life one time period will perish and be removed in the
following time period. Constraint (6) ensures that only kits with remaining shelf life 0 can be

50
removed. Constraint (7) ensures that no kits with remaining shelf life 0 can be sent out to
disaster CO:s. Constraint (8) ensures that inbound stock levels in time period 0 is equal to
the purchased amount of kits in time period 0. Constraint (9) ensures that inbound stock
level and outbound stock level are the same in time period 0, thereby initial stock will be
inbound stock in time period one. Constraint (10) dictates that kits can only be purchased at
maximum shelf life. Constraint (11) sets the initial levels of kits for each open warehouse to
the optimal storage amount which is the same in all scenarios. Constraint (12) dictates that
the deviation from optimal stock levels is equal to the difference between optimal stock level
and outgoing stock in each time period. Constraint (11) and (12) are in place to keep
relatively even stock levels at each warehouse and thereby emulate a realistic ordering
policy. Without these constraints in place the model would only keep the exact required
amount in stock for the coming time period. Constraint (13) ensures that the entire demand
is fulfilled in each time period. Constraint (14) shows that unused stock in each time period is
equal to inbound stock minus perished kits and kits shipped to disaster CO:s. Constraint (15)
ensures that the budget for establishing warehouses is not exceeded. Constraint (16) and
(17) ensure that stock levels never exceed the space available for each kit in each
warehouse. Finally, constraint (18) ensures that initial stock levels do not exceed the amount
of kits available for pre-positioning.
Input parameter selection
The following section will cover the parameters used during the optimization, for a full
overview of how parameters were acquired, see Appendix 8.2.
The max value for the indices was set to different values depending on the index. There are
7 warehouses to be studied (Netherlands + 6 UNHRD warehouses), why I was set to 7.
There are 70 demand points (countries that have received a shipment during the time
periods studied) and so J was set to 70. There are 17 ERH-kits to study so K was set to 17.
The model includes 3 scenarios, so S was set to 3. Each scenario contains 12 time periods
and thus T was set to 12. The maximum remaining shelf life, H, was set to 15 due to the
UNFPA policy of aiming to ship kits with 75 % of remaining shelf life. When studying the
different shelf lives 15 months was found to be the longest number of months for any kit
(except non-perishables) before the 75 % mark had passed.
Table 4.3. The costs used in the optimization model.
fi 0 for the Netherlands, 40889 USD/year for UNHRD warehouses
CHik 10 % of kit costs for Netherlands, 0 for UNHRD warehouses
SP 3 times kit costs
CMik 0,000135106 USD/KG/KM
CTijk 0,000820839 USD/KG/KM
CRi 7 % for UNHRD warehouses, 0 for Netherlands
gammik 100 000
B 10 000 000
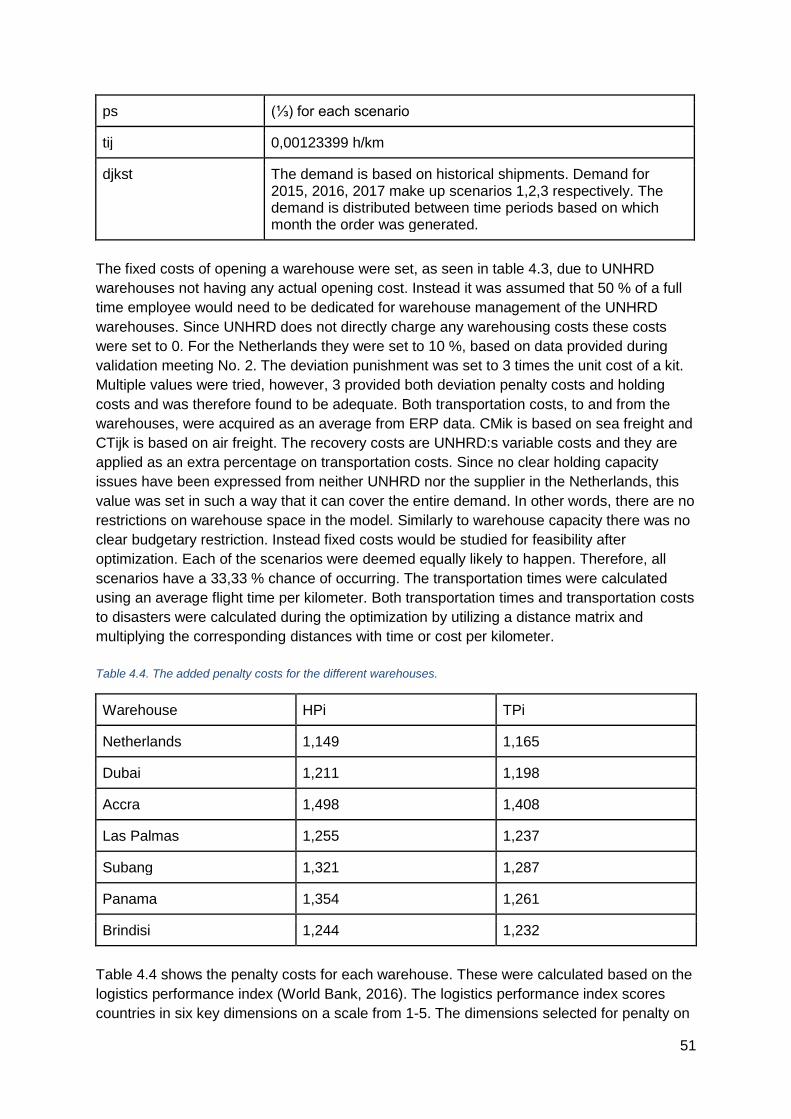
51
ps (⅓) for each scenario
tij 0,00123399 h/km
djkst The demand is based on historical shipments. Demand for 2015, 2016, 2017 make up scenarios 1,2,3 respectively. The demand is distributed between time periods based on which month the order was generated.
The fixed costs of opening a warehouse were set, as seen in table 4.3, due to UNHRD
warehouses not having any actual opening cost. Instead it was assumed that 50 % of a full
time employee would need to be dedicated for warehouse management of the UNHRD
warehouses. Since UNHRD does not directly charge any warehousing costs these costs
were set to 0. For the Netherlands they were set to 10 %, based on data provided during
validation meeting No. 2. The deviation punishment was set to 3 times the unit cost of a kit.
Multiple values were tried, however, 3 provided both deviation penalty costs and holding
costs and was therefore found to be adequate. Both transportation costs, to and from the
warehouses, were acquired as an average from ERP data. CMik is based on sea freight and
CTijk is based on air freight. The recovery costs are UNHRD:s variable costs and they are
applied as an extra percentage on transportation costs. Since no clear holding capacity
issues have been expressed from neither UNHRD nor the supplier in the Netherlands, this
value was set in such a way that it can cover the entire demand. In other words, there are no
restrictions on warehouse space in the model. Similarly to warehouse capacity there was no
clear budgetary restriction. Instead fixed costs would be studied for feasibility after
optimization. Each of the scenarios were deemed equally likely to happen. Therefore, all
scenarios have a 33,33 % chance of occurring. The transportation times were calculated
using an average flight time per kilometer. Both transportation times and transportation costs
to disasters were calculated during the optimization by utilizing a distance matrix and
multiplying the corresponding distances with time or cost per kilometer.
Table 4.4. The added penalty costs for the different warehouses.
Warehouse HPi TPi
Netherlands 1,149 1,165
Dubai 1,211 1,198
Accra 1,498 1,408
Las Palmas 1,255 1,237
Subang 1,321 1,287
Panama 1,354 1,261
Brindisi 1,244 1,232
Table 4.4 shows the penalty costs for each warehouse. These were calculated based on the
logistics performance index (World Bank, 2016). The logistics performance index scores
countries in six key dimensions on a scale from 1-5. The dimensions selected for penalty on

52
the fixed (annual) costs related to warehouses were logistics competence and Infrastructure.
These dimensions were deemed equally important and HPi was calculated by the following
(2-(D1 + D2))/10 thereby providing a value between 1 and 2 to be multiplied with annual
costs. The same principle was used for transportation penalties but in this case the
dimensions International shipments and timeliness were used instead.
Table 4.5. The price and allowed shelf life for the different kits.
Index Kit CPhk (USD) Alpha k (Months)
1 ERH KIT 0 123,1 15
2 ERH KIT 1A 567,47 15
3 ERH KIT 1B 292,88 15
4 ERH KIT 2A 602,3 15
5 ERH KIT 2B 102,73 15
6 ERH KIT 3 1124,85 4
7 ERH KIT 4 428,83 7
8 ERH KIT 5 565,95 4
9 ERH KIT 6A 878,32 9
10 ERH KIT 6B 607 6
11 ERH KIT 7 172,25 9
12 ERH KIT 8 635,38 6
13 ERH KIT 9 289,61 9
14 ERH KIT 10 857,29 15
15 ERH KIT 11A 605,45 15
16 ERH KIT 11B 4430,29 6
17 ERH KIT 12 1424,13 2
Finally, Table 4.5 shows the different kits to be shipped. Their corresponding costs were
acquired from ERP data provided by UNFPA. Their maximum shelf life was set considering
the policy of only shipping kits with a remaining shelf life of 75 % of the total shelf life.
4.2.7 Constrained minimum response time model
The goal of the constrained minimum response time model is to satisfy all demand in every
scenario and time period with as low transportation time from warehouse to disaster CO as
possible, given that the model is constrained by a value close to optimal value of TC. This is
done by minimizing the following function TL and introducing the constraint 21. 𝛽 is then

53
varied from 1.00 - 1.05 to get a picture of how much response time reductions would cost
and how this would differ from the optimal layout found in the minimum cost model.
𝑇𝐿 = ∑ 𝑝𝑠 [∑ ∑ ∑ ∑ ∑ 𝑥𝑖𝑗𝑘𝑠𝑡ℎ𝑡𝑖𝑗𝑇𝑃𝑖
𝐻ℎ=1
𝑇𝑡=1
𝐾𝑘=1
𝐼𝑖=1
𝐽𝑗=1
∑ ∑ ∑ 𝑑𝑗𝑘𝑠𝑡𝑇1
𝐾𝑘=1
𝐽𝑗=1
]
𝑆
𝑠=1
(21) 𝑇𝐶 ≤ 𝛽
The numerator in TL represents the time it takes to transport each kit from warehouse to
disaster CO. This term also includes penalties in form of timeliness and international
shipments depending on which warehouse the shipment is going from. The denominator in
TL represents the total demand. TL thereby minimizes the average of response times over
all scenarios.
Other than constraint (21) being introduced, constraints and input parameter selection are
identical to those found in 4.2.4
4.2.8 Minimum cost model with additional warehouse locations
This model is identical to the minimum cost model with the exception of taking more
warehouse locations into account. With the exception of Brisbane and Fiji the additional
warehouses were selected due to their geographical proximity to high demand regions.
Furthermore, all selected warehouse locations are within countries who have access to sea
ports. Brisbane and Fiji were selected due to UNFPA already having pre-positioning
initiatives in these locations. Due to this resulting in a significant increase in model size, it will
be optimized with a relative optimality tolerance of 1 %, meaning that the solutions found will
be within 1 % of the optimal value for the model.
The changes in input parameters will be described below. For details, see Table 4.6.
Table 4.6. The new warehouses and their corresponding HPi and TPi.
Warehouse CRi HPi TPi Fi (USD)
Netherlands 1 1,149 1,165 0
Dubai 1,07 1,211 1,198 40889
Accra 1,07 1,498 1,408 40889
Las Palmas 1,07 1,255 1,237 40889
Subang 1,07 1,321 1,287 40889
Panama 1,07 1,354 1,261 40889
Brindisi 1,07 1,244 1,232 40889
Brisbane 1 1,231 1,233 242828

54
Fiji 1 1,550 1,519 492828
Algeciras 1 1,255 1,237 492828
Djibouti 1 1,574 1,483 492828
Beirut 1 1,491 1,43 492828
Mersin 1 1,320 1,284 492828
Lagos 1 1,486 1,453 492828
Since none of the added warehouses are UNHRD warehouses, the recovery cost is set to 0
for all new warehouse locations. Both HPi and TPi were calculated for the new locations the
same way as in the minimum cost model. The fixed costs related to opening a warehouse
are quite different. This is both due to the requirement of actually renting a warehouse and
requirements of employing staff to manage inventory. The staffing costs were calculated
based on an approximated requirement of staff via e-mail from Ingegerd Nordin. While the
rental costs were taken from the similar study conducted by Jahre et Al. (2016a).

55
5. Results The following chapter presents the computational results uncovered by the model developed
by the authors. Section 5.1 presents the results using UNFPAs current network layout.
Section 5.2 presents the results when UNHRD warehouses are also considered. Finally
section 5.3 present the results when UHRD warehouse and additional warehouses are
considered.
5.1 Current Layout
By constraining the model to only using the warehouse in the Netherlands the total cost for
the system amounted to 10,3 million USD annually. The total transport cost amounted to
almost 2,66 million USD annually. The average response time for this layout was 7,88 hours.
Table 5.1 shows the total amount of perished kits under the different scenarios and Table
5.2 shows the optimal stock levels of the different kits.
Table 5.1. The total amount of perished kits for the different scenarios.
Kit Scenario 1 Scenario 2 Scenario 3
3 94 0 58
4 139 0 60
5 140 177 133
6B 62 0 0
8 11 0 0
12 59 32 32
Table 5.2. The optimal warehouse levels for different kits using only the warehouse in the Netherlands.
Kit Qik
0 6
1A 128
1B 24
2A 221
2B 136
3 157
4 179
5 201

56
6A 168
6B 203
7 115
8 100
9 109
10 61
11A 69
11B 50
12 18
5.2 UNHRD Layout
The results of using the model, allowing UNHRD-warehouses, were to keep the warehouse
in Amsterdam open as well as opening two UNHRD-warehouses one in Accra, Ghana and
one in Dubai, UAE.
This setup led to a total cost of 10,06 million USD annually. The transport costs amounted to
2,25 million USD annually. The cost for shipments to disasters amounted to about 1,75 USD
million annually and the transport cost to the warehouses amounted to 0,51 million USD
annually. The average response for this layout was 4,69 hours.
Table 5.3 shows the total amount of perished kits under the different scenarios and Table
5.4 shows the optimal stock levels of different kits at the selected warehouses.
Table 5.3. The total amount of perished goods when using the optimal UNHRD-layout.
Kit Scenario 1 Scenario 2 Scenario 3
3 94 0 58
4 139 0 60
5 140 177 133
6B 62 0 0
8 11 0 0
12 59 32 32
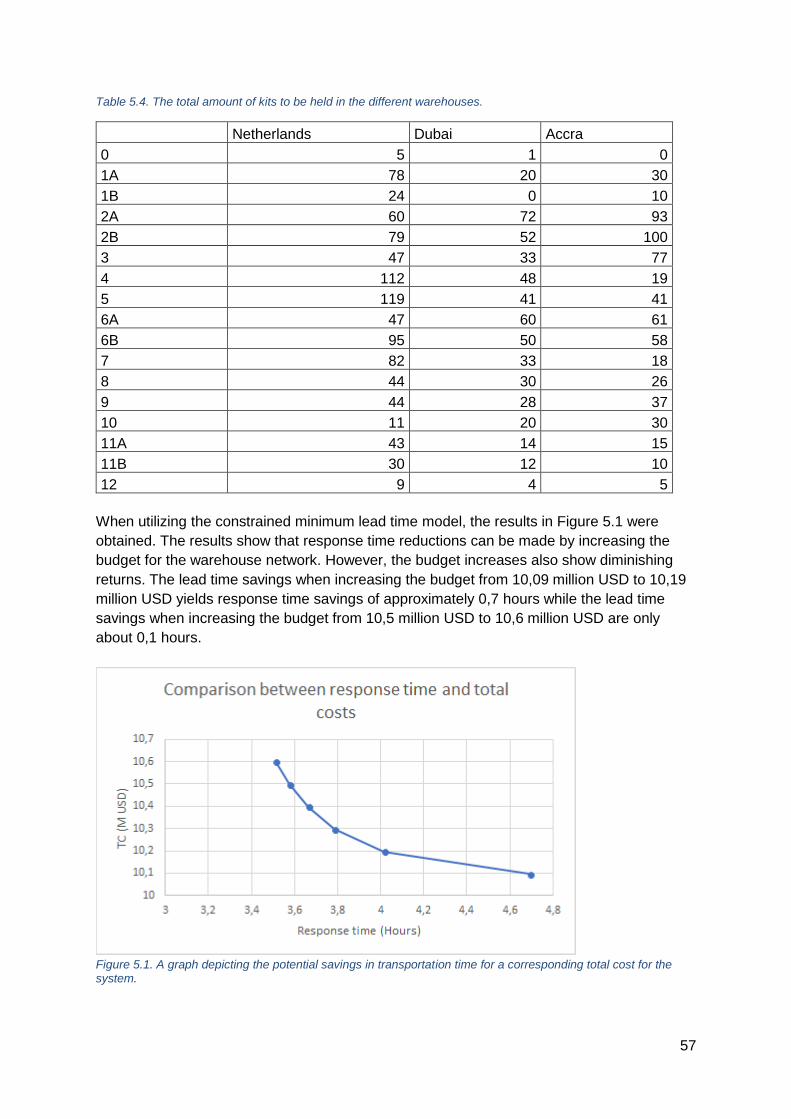
57
Table 5.4. The total amount of kits to be held in the different warehouses.
Netherlands Dubai Accra
0 5 1 0
1A 78 20 30
1B 24 0 10
2A 60 72 93
2B 79 52 100
3 47 33 77
4 112 48 19
5 119 41 41
6A 47 60 61
6B 95 50 58
7 82 33 18
8 44 30 26
9 44 28 37
10 11 20 30
11A 43 14 15
11B 30 12 10
12 9 4 5
When utilizing the constrained minimum lead time model, the results in Figure 5.1 were
obtained. The results show that response time reductions can be made by increasing the
budget for the warehouse network. However, the budget increases also show diminishing
returns. The lead time savings when increasing the budget from 10,09 million USD to 10,19
million USD yields response time savings of approximately 0,7 hours while the lead time
savings when increasing the budget from 10,5 million USD to 10,6 million USD are only
about 0,1 hours.
Figure 5.1. A graph depicting the potential savings in transportation time for a corresponding total cost for the system.

58
5.3 Free Layout
Allowing the model to choose from 7 more warehouse locations did not affect the outcome of
the optimization and the same results as in the UNHRD layout ensued. The full set of
warehouse locations can be seen in Figure 4.9 and Table 4.5.

59
6. Analysis & Discussion The analysis and discussion chapter starts with a discussion regarding the empirical findings
influencing the model and how well they are incorporated. Each group of findings is
discussed and, where applicable, compared to the theoretical framework. The discussion
then moves on to an analysis of the model results and finally to the sensitivity analyses of
the model.
6.1 Discussion of empirical findings
6.1.1 UNFPAs prior experience with pre-positioning
As seen in the delimitations of the model, national pre-positioning was disregarded as a
viable option. The major reason for this, being the costs related to warehousing and locking
kits to specific countries, thereby preventing kits from being used in other locations. In
general, on a global scale, these arguments are found to be true, by the authors. There are,
however, specific scenarios with countries that still may want to consider national pre-
positioning on a small scale. As mentioned by Ahmed Malah (2018) the Iraqi country office
commonly absorbs kits that are close to expiry due to the high and largely stable demand in
the country. In these specific cases the total model costs could actually have been reduced
by allowing countries to source directly from the supplier or from regional warehouses using
cheaper means of transportation. This aspect is modelled to some extent in Jahre et al
(2016a) where transportation costs to ongoing operations were lower than that of emergency
response. However, for this to have been incorporated in the developed model, a clear
difference between ER and OO demand would have been needed.
An interesting aspect brought up during the interview regarding the pre-positioning in the
APRO-region was the fact that donors appreciated having their emergency goods in place
shortly after a disaster has struck. This ties in to the point made by Jahre and Heigh (2008)
about donors wanting to see the money they donate having an impact. If these results could
be transferred to other regional pre-positioning initiatives it may increase the willingness of
donors to donate to preparedness projects. This could possibly have been incorporated into
the model as generating income if any exact figures could be obtained. In relation to funding
it is also important to note that the pre-positioning in Brisbane is dependent on funding from
DFAT.
6.1.2 Commodity characteristics
Currently the model has no specific cost for handling of medical waste when a kit expires.
This is something that can be incorporated directly into the model if figures for these could
be obtained. Therefore, it should be a goal for UNFPA to obtain such figures to complete the
analysis. This goes for the sales price of the near-to-expiry goods as well.
In the current setup of the model, all the components requiring cold chain transport are
assumed to be handled in the same manner as today. This means that these components
will be stored and flown separately. This may entail higher transport costs than have been
presented in the model if they were to be stored in UNHRD warehouses. Alternatively, the

60
components would have to be flown in from Amsterdam and arrive in the CO requesting a kit
at the same time as the rest of the kit, which would be a complex process.
There is an aspect discovered in interviews, that is not thoroughly captured in the model,
which speaks in favour of UNFPAs current layout. Currently the model replenishes entire kits
when they perish. In reality it may be possible to only replace the expired component of a kit,
and thereby prolonging the kits shelf life at a significantly lower cost. This possibility is seen
to be restricted to only the warehouse in the Netherlands. If these costs were to be fully
incorporated, optimal model results might have been different. Important to note is that co-
location, which was found to be the most important by Roh et Al (2013), is not incorporated
either. If these aspects were to be taken into account, it would heavily favour UNHRD
warehouses.
6.1.3 Demand Characteristics
When looking at the specific case in this study it is important to note that UNFPA has a
substantially lower yearly delivered volume than, for example, UNHCR that was studied by
Jahre et al (2016a). The fixed costs for opening a new warehouse are quite high in relation
to the variable costs, such as transport costs. The transport costs decrease with a
decentralized layout. The transport costs and other variable costs are directly affected by the
total amount of kits shipped, whereas, the fixed costs remain the same. This means that if
the demand would grow or the unfulfilled demand would be satisfied the variable costs would
be even more dominant in the total cost. If this were the case, a decentralized layout would
prove even more cost-efficient. No figures on how great the unfulfilled demand of CO:s is
were obtained.
Finally, over the years that were studied, the demand for ERH-kits remained relatively
stable. This was quite surprising given that many of the traditional challenges of HO’s that
were found in the literature are related to volatile and unexpected demand. Although the
cause for it could not be uncovered in this study, it still implies that forecasting the quantities
needed for pre-positioning items would be very much possible. If this stable demand would
be incorporated into the model in a fashion like Jahre et al (2016a) the total cost could be
lower.
6.1.4 Logistics Characteristics
The model was built assuming a lead time from the warehouse in Amsterdam to UNHRD of
one month, which is a lot shorter than it would be with the lead times of 2017. Before pre-
positioning can be considered on a global level, UNFPA needs to have the ability to build
stock. This in turn can only be achieved by lowering the lead time from request to dispatch.
The APRO office described that they had been able to save response time by their regional
pre-positioning. Given the long lead times of 2017 it is not surprising that the perceived
benefits of regional or national pre-positioning may be great, but could simply be caused by
the availability of stock, rather than the geographical proximity of the pre-positioned goods.
Unsurprisingly, land transport is vastly underrepresented due to the complexities involved
with custom clearance over multiple borders, and in some cases security requirements
(Blasco, 2018). When studying the historical demand however, certain possible land routes

61
may have been overlooked. Most notable is the high amount of transports going to Turkey.
Utilizing land transport to Turkey would entail transport through the European Union, thereby
completely removing additional issues in relation to customs clearance. Furthermore, land
transport is, in most cases, a less costly alternative. On this subject it was also mentioned
that Turkey is one of the current hubs for small scale pre-positioning due to the current high
demand for aid in Syria (Jurman, 2018). Therefore, kits transported to Turkey were most
likely not in need of the slightly lower transit time provided by air freight.
As put forward by Jahre et al. (2016a) political dimensions always have to be taken into
account and the exact complexities of storing “politically sensitive” goods such as post-rape
treatment kits and contraceptive kits may present yet another challenge. This is an issue that
is very much political and very complex and thus no analysis of the political landscape
related to the ERH-kits or a prospective impact on the warehousing of these items was
conducted. Another factor found in the literature review that was not incorporated in the
model was the risk that a warehouse used for pre-positioning may be struck by the disaster it
is meant to respond to. Whilst there may be a risk of this, the UNHRD warehouses are used
by several other agencies that have found the risks tolerable. No risk analysis of disasters
striking was carried out for the additional 7 warehouses in the free layout.
Currently, UNFPA does not view itself as a first-response agency. Even if this prioritization of
needs may change over time, response time improvements of a few hours may not lead to
the ERH-kits reaching the affected population any sooner, since other emergency supplies
might take precedence in the last-mile distribution.
It seems that a bullwhip-effect has taken place in the supply chain. Considering that Ahmed
Malah (2018) said Iraq orders quantities that would fulfil the demand for several months in
Iraq, due to lead time issues, that may have been caused by stock outs. Van Ackere et. al
(1993) describes how a lack of communication between different actors in the supply chain
leads to buffer stock and backorders fluctuating immensely. The typical antidotes to these
challenges are either removing steps such as distribution warehouses in the supply chain or
sharing the customer demand data with all the entities of the supply chain. The cause of the
bullwhip-effect in UNFPA:s supply chain seems to be the poor performance on lead time
from ordering to dispatch. The Bullwhip effect is a common phenomenon in humanitarian
supply chains according to van Wassenhove & Pedraza-Martinez (2012).
6.1.5 Sourcing Characteristics and Budgetary Constraints
Should a cooperation with UNHRD prove fruitful it may be possible for UNHRD to source
components directly from the supplier and allow UNHRD staff to assemble them into kits.
This would require PSB to source the components individually as well as arranging for the
transport to UNHRD but might save money in the long run. This was not something that was
considered in the model but it may be extended to look at such a setup. However, this would
extend the size of the model drastically and was not feasible to do in this study. The actual
cost for kitting at UNHRD would also be hard to approximate and incorporate.
62
6.2 Analysis and discussion of model results
The results presented regarding the quantities stored in each location should not be read as
a universal quantity that will fulfil the demand caused by any disaster that strikes the world. It
is not cost-efficient nor feasible to pre-position items to account for eg. the Indian Ocean
tsunami of 2004.
6.2.1 Using the model to calculate the cost for the current layout
When allowing only one warehouse to be open the model opted for the current layout of
UNFPA were only Netherlands warehouse is open. The reason for this is probably the fact
that Amsterdam has no opening cost in the model. The legitimacy of the claim that the
warehouse in the Netherlands has no fixed warehousing cost can be questioned.
This does however show that UNFPA with their current staff setup and sourcing situation are
handling distribution rather efficiently, since another warehouse was not selected.
Furthermore, the cost difference between the optimal layout and current was only about 240
000 USD which represents a cost saving of about 2,3 %.
6.2.2 UNHRD Layout
Keeping the warehouse in Amsterdam open when utilizing the UNHRD-warehouses is
motivated by the absent opening cost for the warehouse as well as the fact that the costs for
shipping by sea and then switching to air-freight are sometimes greater than the costs for
simply flying directly from Amsterdam. Another influencing factor is that the transports
originating from UNHRD are subject to a 7% recovery cost adding to the original cost. All of
this is also based on the assumption that the supplier in the Netherlands does not charge
any type of recovery cost for the transports that they administer.
During the second validation concerns were raised by the UNFPA-staff that placing goods in
Accra could lead to problems due to the relative low infrastructure levels. The final
punishment cost for Accra, using the LPI (Logistics Performance Index), amounted to almost
1,5 times the original cost for both flights as well as the opening cost. This indicates that the
geographical benefits in terms of proximity to the demand are great for Accra. As seen in the
literature review, distance alone cannot capture transport cost variability. Even though
penalties derived from LPI have been incorporated, having more exact transportation costs
would certainly affect the model results. Some of the concerns raised were due to a
limitation of flights in the region and a concern that most flights would have to be routed via
Europe. This concern was addressed through the extra transport costs using LPI, but can
still be a point of discussion at UNFPA.
6.2.3 Free Layout
An aspect that was not taken into account when looking at the free layout is that with the
proximity to disaster-stricken areas some transports to disaster responses would be possible
to conduct by truck rather than by plane. This is especially true for the warehouses in Beirut,
Mersin and Lagos. Using trucks instead of planes would probably save a substantial amount
of money and may have given an alternative solution.

63
An aspect of moving the warehouses to entirely new premises is the tedious process for
tending bids and getting permission from higher levels of the UNFPA-organization. Nordin
(2018) described that this would be a process that would require several years to complete,
whereas the UNHRD solution would be available for implementation earlier.
No clear cost breakdown of the warehousing activities in Brisbane and Fiji has been carried
out. If these costs were lower, the model results may have incorporated one or both of these
warehouses. The subsidised transports from these warehouses, that were mentioned in the
interview, have not been incorporated into the model. If this had been incorporated a
different result may have ensued. However, considering the low demand in the region,
placing a regional warehouse would not be feasible if the warehousing and transportation
costs are relatively similar to those used in the model.
6.3 Sensitivity Analysis
In this section different alterations to the parameters in the model as well as the ensuing
results are presented.
6.3.1 UNHRD Layout
The model opted to keep all three warehouses open whilst having an opening cost lower
than the equivalent of 2 FTE:s working on keeping the warehouses open. Given that the
agreed cost to open a warehouse was set to the equivalent of using 0,5 FTE:s annually this
parameter is not considered to influence the final result to a great extent.
When constraining the model to use only use one UNHRD warehouse and not the
Netherlands, the new location chosen was Brindisi, Italy.
When raising the penalty cost for not following the optimal warehouse level (SPk) the layout
of the model stayed the same. Amsterdam, Dubai and Accra were all open. However, the
defined set of warehouse quantities were raised, and more kits perished. This led to higher
purchasing costs and thus a higher total cost. The transportation costs for the system stayed
more or less the same with the exception of the extra kits shipped to the warehouses in
Dubai and Accra. Changing this cost is, to a large extent, a way of affecting the model to act
in a way a human purchaser would set a warehouse level in anticipation of a yearly demand.
This makes the cost one that could be altered by organizations depending on their annual
need or strategic goals with pre-positioning. When closing the Accra warehouse in the
sensitivity analysis the model opted to open the warehouse in Las Palmas instead. This led
to an increase in total costs for the system.
For all calculations the shelf life, before expiry in a warehouse, of the ERH-kits were set to
75 % of the total shelf life of an ERH-kit. This is a figure that is not always a hard line at
UNFPA. However, reducing the shelf life requirements is something that would further
strengthen current findings of an optimal solution with a decentralized layout. This is due to
fewer perished products leading to lower transport costs to warehouses (this cost is 0 to the
Netherlands).

64
6.3.2 Free Layout
Due to the long calculation times when running the optimization for the free layout the
sensitivity analysis mainly focused around the fixed cost of opening warehouses (see section
6.3 for details). When lowering the staff costs in the total warehousing costs by half and
three quarters the model showed the same optimal result.
When lowering the fixed opening cost of warehouses by half, the optimization showed that
the warehouse in Dubai should be moved to Djibouti.
7. Conclusions
7.1 Answering research question 1
To answer the research question the facility location model that was developed incorporates
the shelf life of products directly into the total cost for the system. As described in chapter 4,
this is done by reducing the shelf life of each kit in store every month and adding a
repurchase cost when replacing it. It is also possible to add a waste cost to the model as
well as a sale price for kits nearing expiry.
These functions allow the facility location model to minimize transportation costs, holding
costs, purchase costs, fixed costs and costs of expiry as a whole. Furthermore, the model
can be altered to incorporate lead time reductions as an objective function and thus also
minimize response times.
Furthermore, an important part of making the model feasible is the penalty costs for
deviating from the optimal storage quantity. Without the penalty the model would store the
exact amounts required in each time-period. This would be impossible in reality due to the
difficulty of predicting demand. The process of penalizing the model when deviating from the
optimal stock level could be compared to stock handling in reality, were yearly forecasts may
dictate the goals for stock levels.
7.2 Answering research question 2
Answering the second research question is more complicated and requires a longer answer
where multiple factors need to be considered and weighed in.
Decentralizing the distribution network for UNFPA and pre-positioning supplies on a regional
level would render cost savings, according to the model results. The optimization showed
that an optimal layout would be for UNFPA to open two new warehouses in collaboration
with UNHRD in Accra and Dubai as well as keeping the warehouse in the Netherlands open.
This could save almost 240 000 USD annually compared to the model’s calculations on the
costs for using only the warehouse in the Netherlands. Even though this only represents 2,3
% in total cost savings, 240 000 USD can make a significant difference. For that amount of
money, you could for example purchases 398 additional units of ERH-kit 2A, which was the
most shipped kit from 2015 to 2017.

65
A decision of this magnitude would, however, entail considerable challenges. A risk with
decentralizing stock is losing control of it and increasing the administrative burden. The
exact cost and drawbacks of this has to be discussed further within UNFPA. The study
concluded, that with a regional pre-positioning strategy, there could be non-economic
benefits that may outweigh these negative consequences. These benefits include donors
receiving increased media coverage and a possibility to customise the response to the
regional requirements. However, as discussed in the analysis chapter, the perceived lead
time benefits that were seen in these initiatives could be related to availability of stock rather
than geographical proximity. This benefit could therefore be made available through the
warehouse in the Netherlands if sufficient stock was built. As stressed in the analysis
chapter, UNFPA should not change their current distribution and warehousing layout until
the issue with long lead times from request to dispatch has been resolved.
A clear advantage with using UNHRD warehouses is that the overall responsibility of running
day-to-day operations regarding warehousing would be left to staff at UNHRD. Given that
UNFPA has limited prior experience with running warehouses it would be beneficial not
having to focus on these issues at an early stage of the decentralization process. The
UNHRD warehouses also hold additional benefits in relation co-location, since other HO:s
also utilizes their facilities it may be possible to consolidate shipments and other services
when answering to demand. Also, co-location with other agencies could lead to many
lessons learned for UNFPA as an organization.
One of the greatest concerns for UNFPA was how the perishability of the ERH-kits would
affect a decentralized network. The model developed in the study accounts for the cost of
perished goods and still manages to reduce costs. It should be noted that the model can
take other costs associated with perishability, such as removal cost and sales of close-to-
expiry goods, into account. If these could be determined by UNFPA, the model would be
able to give a more precise answer related to these costs. Given that expiry of goods has
been a negligible problem the last years and the possibility for certain CO:s to absorb ERH-
kits nearing expiry, perished goods should not be seen as prohibiting a decentralized layout.
Furthermore, it is important to remember that the perished goods in the new layout would
perish regardless of where they were stored. The alteration of the network itself did not
cause the kits to perish but rather the fact that goods were in storage. Stock building is the
cause of goods perishing, not decentralization. This was proven in the results where the
same amount of kits perished regardless of the number of warehouses used. It should be
noted that this is due to the ordering policy set by the model remains the same regardless of
the number of warehouses used and that all warehouses can supply any country. If
warehouses were limited to only supply countries in close proximity, the amount of perished
goods would most likely increase. It could also be argued that a greater buffer stock in the
different warehouses would be needed and thus the amount of perished kits may be greater
in a decentralized layout. In this specific case, however, UNFPA would also need to weigh
the special capability of the warehouse in the Netherlands to lengthen kit shelf lives against
the prospective savings of a decentralized model.
Overall it can be said that a critical challenge for UNFPA is the building of stock and it will be
required whether the organization chooses to decentralize its warehouse layout or not. It is
possibly also the reason for the long lead times from request to dispatch that has been seen
for the last two years and it is probably the reason for the APRO offices view that regional

66
pre-positioning of stock reduced lead times. Decentralizing the warehouse layout would not
solve this problem but would require other efforts. It should also be noted that the current
steps taken by UNFPA to build stock through larger orderings can help improve the lack of
stock availability.
As for national pre-positioning, the study shows that there are many non-economic benefits
to be had by implementing it, despite the costs. The study also showed, that there are many
prerequisites that need to be in place before goods as complex as an ERH-kit could be pre-
positioned on a national level. To overcome these would require a lot of effort and the cost
for implementing national pre-positioning would be high. Therefore, the authors recommend
not to start widespread pre-positioning on a national level. However specific countries with
stable demands could have implementations on a minor scale. However, when studying the
free layout of the model a country such as Nigeria with a high and stable demand through
the years was not selected by the model. This leads to the conclusion that unless the costs
for national warehouses can be lowered national pre-positioning will not be feasible from an
economic perspective.
The potential lead time reductions that can be achieved by increasing the total cost of the
system are relatively small. This leads to the conclusion that UNFPA should not implement
these changes for the sake of lead time reductions. UNFPA is not a first-response agency
and thus saving an average of 1,5 hours in response time for a substantial cost is not a
priority. If it could help stop the over ordering of CO:s, it may be an option to explore since it
may improve the overall performance of the Supply Chain. It should be noted that this would
be due to psychology rather than any substantial change to the lead time. It could be that
countries with a regional warehouse in geographical proximity would be less inclined to order
ERH-kits for pre-positioning.
Given that UNFPA currently has no warehouses of its own, setting up warehouses in
collaboration with UNHRD would alter the present operations. To do this would require an
organizational will and engagement from all levels of the organization. It would also require
the possibility to expand the current staff number working with dispatches and emergency
response. Therefore, this decision should not be taken light-heartedly.
They should also consider that the actual demand was, in all probability, higher than the
demand used in the study. A greater demand would render greater savings from a
decentralized model. This is due to the fact that the fixed cost of opening a new warehouse
is relatively high while the variable costs decrease somewhat when shipping first by sea to
the warehouses and then by air to the disaster zones. This saving, using multimodal
transports, generates greater savings with a larger demand. If considering retracted orders a
driver for greater demand it can also be noted that the CO:s both had the need and funding
to make these purchases of kits as well which would lead to the conclusion that the demand
will go up when UNFPA has built enough stock. Another important factor to consider is the
benefit from co-location with other humanitarian organizations in the UNHRD-warehouses
that was not incorporated into the model. This could help bring the transport costs down for
the UNHRD warehouses if co-shipment with other agencies was made possible.

67
The final recommendation for UNFPA is to get the lead time issue under control by eg.
switching supplier and building stock. When the lead time from request to dispatch has been
shortened, UNFPA should start to consider a decentralized model for their warehouse
layout, based on the findings from the optimization. This could specifically be done with a
pilot-project using UNHRD warehouses, since they provide multiple benefits at a low cost. In
this process UNFPA needs to consider the aspects that were not incorporated into the model
such as the unique capabilities of the supplier to lengthen the shelf lives of ERH-kits, the
demand question and the co-location aspect.
7.3 Impact on future research
During the literature review it became apparent that research on the shelf life aspects of pre-
positioning is limited. This study has developed a facility location model that is highly
applicable for use for UNFPA. With slight alterations to the ingoing parameters it can be
used by other, similar HO:s. The model can incorporate costs for removal of medical waste
which is another contribution to the research area.
Given the lack of literature on the subject of perishability, more research could be focused on
this specific matter. The authors believe that this study goes some way toward helping in this
endeavour. Simple alterations of the model could account for more specific costs in the
matter, for example by adding removal costs which might be incurred. Especially when
handling medical waste. An interesting finding is that even when accounting for perishability,
decentralization saves costs.
A limitation of the model that was developed in this thesis is that some of the assumptions
may be crude. This is probably due to the limited time span in which a Master’s thesis has to
be completed. Future research could therefore be focused on how to represent transport
costs in a better way, depending on the origin of the shipment. This type of research could
help not only the humanitarian logistics field but also facility location models for all
Operations Research.
A further possible improvement of the facility location model would be to incorporate road
transport into the model as a choice of transport. This would allow a fairer representation of
transport costs from warehouses in close geographical proximity to the demand points.
In the specific case of UNFPA, more care should be taken to investigate the political climate
in the different warehouse locations that were proposed in the study. This is especially
relevant given the political sensitivity of the ERH-kits.

68
References
Primary Sources
Abbas, J. (2018). Global Logistics Advisor, UNFPA; Beirut.
Semi-structured Interview 28th February, 2018
Blasco, A. (2018). Procurement Specialist, PSB, UNFPA; Copenhagen.
Semi-structured Interview 28th February, 2018
Doraiswamy, S. (2018). Chief of Reproductive Health, UNFPA; Dhaka.
Semi-structured Interview 22nd March, 2018
Doruch, A. (2018). Procurement Assistant, PSB, UNFPA; Copenhagen.
Semi-structured Interview 13th February, 2018
Jurman, D. (2018).Consultant in Reproductive Health, HFCB, UNFPA; Geneva.
Semi-structured Interview 26th February, 2018
Malah, A. (2018). Humanitarian Coordinator, UNFPA; Baghdad
Semi-structured Interview 14th March, 2018
Marwah, P. Millar, B. (2018). Humanitarian Response Coordinator, Humanitarian Project
Coordinator, UNFPA, APRO; Bangkok
Semi-structured Interview 27th March, 2018
Nielsen, K. (2018a). Demand Planner and Inventory Associate, PSB, UNFPA; Copenhagen.
Semi-structured Interview 14th February, 2018
Nielsen, K. (2018b). Demand Planner and Inventory Associate, PSB, UNFPA; Copenhagen.
Unstructured Interview 19th March, 2018
Nordin, I. (2018). Procurement Coordinator, PSB, UNFPA; Copenhagen.
Semi-structured Interview 15th February, 2018
Tatunts, V. (2018). Finance Associate, PSB, UNFPA; Copenhagen.
Semi-structured Interview 27th February, 2018
Tornese, A. Parisi, N. (2018) UNHRD Support Staff, WFP; Brindisi
Semi-structured Interview 7th March, 2018

69
Secondary Sources
Abe, K. Wilson, J (2009), Weathering the Storm: Investing in Port Infrastructure to
Lower Trade Costs in East Asia, World Bank Policy Research Working Paper 4911
Balcik, B. Beamon, B. M. (2008), Facility location in humanitarian relief,
International Journal of Logistics-Research and Applications; 2008, Vol. 11, No. 2, p. 101-
121.
Bertrand, JWM. & Fransoo, JC. (2002). “Operations management research methodologies
using quantitative modelling”, International Journal of Operations and Production
Management, Vol. 22, No.2, p. 241-264.
Bozorgi-Amiri, A. Jabalameli, M. S. Mirzapour Al-e-Hashem, S. M. J. (2013) A multi-objective
robust stochastic programming model for disaster relief logistics under uncertainty.
OR Spectrum. Nov 2013, Vol. 35, No. 4, p 905-933.
Caunhye, A. M. Nie, X. Pokharel, S. (2012), Review: Optimization models in emergency
logistics: A literature review, Special Issue: Disaster Planning and Logistics: Part 1, Socio-
Economic Planning Sciences; 2012, Vol 46, No. 1, p. 4-13
Combes, P. Lafourcade, M. (2002) Transport costs, geography, and regional
Inequalities, 2894, C.E.P.R. Discussion Papers.
Conforti, M. Cornuejols, G. Zambelli, G., 2014. Integer Programming, 1 ed, Springer.
Dessouky, M. Jia, H. Ordóñez, F. Shen, Z. (2006), Rapid Distribution of Medical Supplies,
Patient Flow: Reducing Delay in Healthcare Delivery; 2006, p309-338
Duran S. Gutierrez, M. A. Keskinocak, P. (2011) Pre-Positioning of Emergency Items for
CARE International. Interfaces. Vol. 41, No. 3, p. 223-237
Döyen, A. Aras N. Barbarosoglu, G. (2012) A two-echelon stochastic facility location model
for humanitarian relief logistics. Optimization Letters Aug. 2012, Vol. 6, No. 6, p. 1123-45.
Egger, P. (2005) On the impact of transportation costs on trade in a multilateral
World, Southern Economic Journal, Vol. 71, No. 3, p. 592-606.
Eisenhardt, M. (1989) Building theories from case study research. The Academy of
Management Review, Vol. 14, No. 4 (Oct., 1989), p. 532-550
Ellram, L.M (1996), The use of case study method in logistics research. J. Bus. Logist. Vol.
17, No. 2, p. 93-138
Flighttime-calculator (2018) [Online] https://flighttime-calculator.com/ [Accessed 2018-04-22]
Görmez, N. Köksalan, M. Salman, FS. (2011) Locating disaster response facilities in
Istanbul. The Journal of the Operational Research Society; Vol 62, No. 7, p. 1239-1252

70
Hagani, A. (1996) Capacitated maximum covering location models: Formulations and
solution procedures. Journal of advanced transportation; Vol 30, No. 3, p. 101-136
Hummels, D (2001) Towards a geography of trade costs, mimeo.
Hummels, D (2007) Transportation Costs and International Trade in the second era of
Globalization, Journal of Economic Perspectives, Vol. 21, No. 3, p. 131–154.
Jahre, M. Fabbe-Costes, N. (2015) How standards and modularity can improve humanitarian
supply chain responsiveness. Journal of Humanitarian Logistics & Supply Chain
Management, Vol. 5, Issue: 3, p. 348-386.
Jahre, M. Heigh, I. (2008) Does the Current Constraints in Funding Promote Failure in
Humanitarian Supply Chains?. Supply Chain Forum: An International Journal, Vol. 9, Issue:
2, p. 44-54.
Jahre, M. Kembro, J. Rezavanian, T. Ergun, O. Håpnes, S. J. & Berling, P.
(2016a) Integrating supply chains for emergencies and ongoing operations in UNHCR.
Journal of Operations Management, Vol. 45, p. 57-72.
Jahre, M. Pazirandeh, A. Van Wassenhove, L. (2016b) Defining logistics preparedness: a
framework and research agenda. Journal of Humanitarian Logistics and Supply Chain
Management. 2016, Vol. 6, Issue: 3, p. 372-398.
Jaller, M. Ukkusury, S. Holguin-Veras, J. (2008). A stochastic inventory model for fixed
lifetime goods for disaster planning. In The proceeding of the 87th annual meeting of the
transportation research
Jia, H. Ordóñez, F. Dessouky, M. (2007), A modeling framework for facility location of
medical services for large-scale emergencies, IIE Transactions; Jan 2007, Vol. 39, No 1, p
41-55.
Jonsson, P. & Mattsson, S.-A., 2011. Logistik : läran om effektiva materialflöden. 2 ed. Lund:
Studentlitteratur.
Kunz, N. Gold, S. (2017) Sustainable humanitarian supply chain management – exploring
new theory, International Journal of Logistics Research and Applications, Vol. 20, Issue 2, p.
85-104.
Kunz, N. Van Wassenhove, L. Besiou, M. Hambye, C. Kovács, G. (2017) Relevance of
humanitarian logistics research: best practices and way forward. International Journal of
Operations & Production Management. 2017, Vol. 37 Issue 11, p. 1585-1599.
Limao, N. Venables, A.J. (2001) Infrastructure, geographical disadvantage,
transport costs and trade, The World Bank Economic Review, Vol. 15, No. 3, p. 451-479.
Lumsden, K. (2007), Fundamentals of Logistics, Chalmers university of Technology

71
Martinez-Zarzoso, I. Nowak-Lehmann, F. (2006) Is distance a good proxy for transport costs? The case of competing transport modes. Center of Globalization and Europeanization of the Economy (CEGE) Discussion Paper 54, May 2006. Melo, M. T. Nickel, S. Saldanha-da-Gama, F. (2008), Facility location and supply chain management - A review, European Journal of Operational Research; July 2008, Vol.196, No. 2, p. 401-12. Pettit, S. Beresford, A. (2009) Critical success factors in the context of humanitarian aid supply chains, International Journal of Physical Distribution & Logistics Management, Vol. 39, No. 6, p. 450-468 Rawls, Carmen G.; Turnquist, Mark A. (2010), Pre-positioning of emergency supplies for disaster response, Transportation Research Part B: Methodological; May 2010, Vol. 44, No. 4, p. 521-34 Rezaei-Malek, M. Tavakkoli-Moghaddam, R. Zahiri, B. Bozorgi-Amiri, A. (2016), An interactive approach for designing a robust disaster relief logistics network with perishable commodities, Computers & Industrial Engineering; April 2016, Vol. 94, p. 201-215 Roh, S.; Jang, H.; Han, C. (2013), Warehouse Location Decision Factors in Humanitarian Relief Logistics, The Asian Journal of Shipping and Logistics; April 201, Vol. 29, No. 1, p. 103-120 Rummler, Geary A.; Brache, Alan P. (1991), Managing the White Space, Training; Jan 1991; 28, 1; p. 55-70. Shapiro, A. Philpott, A (2007). A tutorial on stochastic programming. School of industrial and systems engineering, Georgia Institute of Technology.
Simchi-Levi, D., Kaminsky, P. & Simchi-Levi, E., 2003. Managing the supply chain.
s.l.:McGrave Hill.
Tofighi, S.; Torabi, S.A.; Mansouri, S.A. (2016), Humanitarian logistics network design under
mixed uncertainty, European Journal of Operational Research ;April 2016, Vol. 250, No.1, p.
239-50.
UNHRD (2016) Standard Operating Procedures. [Online] Available from: https://unhrd.org/sites/default/files/standard_operating_procedures_june_2016_interim_v1.pdf [Accessed: 2018-03-05]
UNFPA (2018) About Us [Online] Available from: http://www.unfpa.org/about-us. [Accessed: 2018-01-24]
UNFPA (2011) Manual Inter-Agency Reproductive Health Kits for Crisis Situations. [Online] Available from: https://www.unfpa.org/sites/default/files/resource-pdf/RH%20kits%20manual_EN_0.pdf [Accessed: 2018-01-24]
UNFPA (2017) REQUEST FOR QUOTATION RFQ Nº UNFPA/DNK/RFQ/17/056. [Online] Available from: https://www.ungm.org/UNUser/Documents/DownloadPublicDocument?docId=579958 [Accessed: 2018-01-30]

72
United Nations, (1992). Internationally agreed glossary of basic terms related to Disaster Management. [Online] Available at: http://reliefweb.int/sites/reliefweb.int/files/resources/004DFD3E15B69A67C1256C4C006225C2-dha-glossary-1992.pdf [Accessed 26 January 2016].
Van Ackere, A. Reimer Larsen, E. Morecroft, J.D.W. (1993) Systems thinking and business process redesign: An application of the beer game. European Management Journal, Vol 11, No. 4, p. 412-423.
Van Wassenhove, L. (2006) Humanitarian aid logistics: supply chain management in high gear, Journal of the Operations Research Society, May 2006, Volume 57, Issue 5, p. 475-489
Van Wassenhove, L. Pedraza Martinez, A. (2012) Using OR to adapt supply chain management best practices to humanitarian logistics, International Transactions in Operational Research. 19 (2012) p. 307-322
Voss, C. Tsikriktsis, N. Frohlich, M. Case research in operations management International Journal of Operations and Production Management, 22 (2) (2002), p. 195-219
World Bank (2016) International Scorecard [Online] Available at: https://lpi.worldbank.org/international/scorecard [Accessed 2018-05-02]
Yin, R. (2014) Case Study Research, Design and Methods. Fifth Edition. SAGE Publications.
Zhang, M. Yang, J. (2007) Optimization modeling and algorithm of facility location problem in perishable commodities emergency system, Third international conference on Natural Computation, Natural computation, Aug 2007.
Internal documents
Internal Document 1: Health and Humanitarian Logistics Conference - RH-kits, TPP, WFP and GF
Internal Document 2: 2017 Evaluation of the Use of Inter-Agency Reproductive Health Kits for Crisis Situations. Jurman, D. Doedens, W. UNFPA, HFCB - Geneva.
Internal Document 3: Prepositioning to address lifesaving sexual and reproductive health and the protection needs of women and girls in the Asia Pacific Region. Marwah, P. Asia Pacific Region Office, UNFPA.

73
8. Appendix
8.1 Interview Guides
Interview with Aleksandra Doruch
1. What is your role at UNFPA?
2. How long have you been working at UNFPA?
3. Procurement
a. How does the procurement process look currently?
i. Is it based on forecasts or realized demand?
ii. Are there any pre-negotiated agreements with supplier/warehouse in
the Netherlands, if yes to what extent?
4. Warehouse/Replenishment/Perishables
a. Could you please describe the warehousing operations as they look today?
b. How are expired goods handled in the warehouse?
i. How much does currently expire?
c. Kristian mentioned that sometimes pieces of kits are sent separately (i.e.
oxytocin) how often does this happen?
d. What type of demands do you have on warehousing capabilities, if any?
i. Cold facilities?
ii. Material handling equipment?
iii. Racks/Floor storage?
iv. Counterbalance trucks?
v. etc.
e. Do you know if there is a cost breakdown of warehousing activities available?
5. Distribution/Transport
a. Do you have any critical deadlines when it comes to distribution?
b. How does the current setup with distributors work? To what extent do you use
vendor managed transports?
i. What kind of service levels have you experienced with vendor
managed transports?
c. What is the procedure of distribution if the vendor can’t handle it?
i. Which other options of distribution are considered? Third party
logisticians, direct contact with freight companies?
1. Are there any pre-negotiated agreements to be used with
these parties?
d. What type of demands do you have on distribution capabilities, if any?
i. Specific routes
ii. Cold chain requirements
iii. Container sizes
iv. Lead times
v. etc.
e. On a regional scale, are there any specific areas with extraordinary supply
chain challenges in regards to infrastructure, theft/security, service availability
and taxes & tariffs?
f. Is there any cost breakdown available in regards to distribution and transport?

74
6. Item requirements/KPIs
a. How much remaining shelf life is expected from goods distributed?
b. RH-kits are said to fulfil the needs of 10 000 people to 100 000 people
(depending on type. Does this mean that there are supplies to handle i.e. 100
000 pregnancies or the pregnant percentage of 100 000 average people?
c. What are the relief time requirements on RH-kits
i. Are there different requirements depending on kits or scenarios?
d. Dimensions of the different RH-kits?
e. What type of quality assurance is done to goods shipped, and what is
required?
i. We have for example understood that a pharmacist is required if
oxytocin is to be stored at a facility?
7. Is there anything that you feel is missing or something you would like to add?
Interview with Kristian Nielsen
1. What is your role in UNFPA?
2. How long have you been working with UNFPA?
3. Forecasting
a. How do you currently forecast?
i. Are the forecasts done on a yearly/monthly/weekly basis?
ii. What kind of deviations from forecasts have you seen since you
began the practice of forecasting?
iii. How is historical data incorporated in forecasts?
iv. Is the geographical distribution of need account for in forecasts?
1. If yes, how do you distribute need over the different
geographical locations? In other words do you work with
regions/country/site demands?
v. To what extent are county offices or other actors (external customers)
involved in forecasting?
vi. Is the supplier involved in forecasting? Does the supplier get access to
the forecasts?
1. Do you differentiate between the two different suppliers?
b. We have understood that majority of shipped goods are taken from stock,
how do you plan procurement of this stock?
i. Is all purchasing done according to forecasts for the next coming
month or do you for example make a yearly forecast for contracts and
then replenish at certain levels?
ii. How are stock levels selected?
c. Does forecasting influence the availability of funding?
d. How time-consuming is your forecasting?
e. Do you have any plans on developing forecasting further, if yes how?
4. Is there anything you would like to add or something we forgot to ask you?
Interview with Ingegerd Nordin
1. What is your role at UNFPA?
2. How long have you been working at UNFPA?
3. UNFPA Organization

75
1. How does the organization look today?
1. What departments are there and what are they responsible for?
(Focus on parts of the organization in some way involved with
distribution and stocking)
2. How does the reporting structure/chain of command look between the
different departments?
1. Could you walk us through an example of how the information
would flow before giving aid to a upcoming disaster.
3. In other words whose decision is it to supply aid in different scenarios?
4. Planning in contrast to response
1. What part of the organization would have the authority to dedicate funding to
preparedness? In other words what department or person would be
responsible for ensuring stock levels in warehouses?
2. Do you have a function working with preparedness specifically.
5. Lead Times and bureaucracy
1. What would be the estimated time to select new service provides for transport
if needed in new areas?
2. Suppose it was decided to move the warehouses. Who would need to be
contacted and is there a referral time?
6. Is there something you would like to add or something you feel we forgot to ask you?
Interview with Danielle Jurman
1. What is your role at UNFPA? 2. How long have you been working at UNFPA? 3. What do you think are the underlying reasons for a large portion of kits being
requested for pre-positioning? a. What are the sought benefits of storing kits locally?
i. Lead time reductions, Fear of stockouts etc? ii. Do you think these benefits could be provided by regional pre-
positioning? 2. Do you believe the respondents in the survey paint a representative picture
of UNFPA operations as a whole? 3. A lesson learned from the WFP:s strategic pre-positioning in Mombasa a few years
back was that when local programmes learned that there was a stock near at hand they ordered goods to “safeguard” their programme. What measures would need to be taken to avoid this at UNFPA, if they were to attempt similar pre-positioning efforts?
4. Regarding the warehouse in Brisbane. Did you notice if CO:s supplied by this warehouse had different order patterns than other CO:s? Eg. less pre-positioning orders?
5. What are your thoughts on regional pre-positioning of RH-kits, what would be the major benefits and challenges?
6. Is there anything you feel that we forgot to ask you or something you would like to add?
Interview with Veronika Tatunts
1. What is your role at UNFPA?
2. How long have you been working at UNFPA?

76
3. How does funding structure for RH-kits look?
1. How much funds are dedicated and in what form?
2. We have understood that you use the concept of a revolving fund, could you
explain in detail how this works?
3. If kits purchased from the fund were to expire how does that affect the
revolving fund?
4. What costs are covered with the fund? Do you for example also cover freight
costs, which are later reimbursed or are freight cost covered directly by the
CO?
4. How is the budget for UNFPA and specifically kits set?
1. How has it changed in recent years, do you expect any future changes?
1. Increase/decrease in budget?
5. Are there any other parts of the budget dedicated to preparedness?
1. Assuming that the purpose of the revolving fund, is to increase preparedness
6. What type of payment terms do you have in regards to kits funded by the revolving
fund?
1. In other words does the fund replenish directly after dispatch of kits or is there
for example a monthly delay?
7. Is there anything you feel that we forgot to ask you or something you would like to
add?
Interview with Johnny Abbas
1. What is your role at UNFPA?
2. How long have you been working at UNFPA?
3. Could you walk us through the process of answering to a disaster?
a. What departments are involved and responsible at which stages?
4. We are struggling with quantifying the cost of not fulfilling the demand. Do you -
based on your experience - have any advice to offer on this point?
5. How crucial are hours in a disaster response? Eg. if the dispatch arrives 12 hours
late is the response seriously hampered?
6. What is your view on pre-positioning?
a. How do you think it would affect your ability to respond?
7. Is there anything you feel that we forgot to ask you or something you would like to
add?
Interview with Andrés Blasco
1. What is your role at UNFPA?
a. Where in the organization does your department fit in? Who do you report to?
2. How long have you been working at UNFPA?
3. Are there any specific challenges to delivering ERH-kits in your area of operations?
4. Are you aware of any CO:s in your area of operations that have pre-positioned
nationally?
a. If yes, do you know the rationales behind this?
5. Have you had any experience of transporting ERH-kits across land borders in the
region?
a. What kind of challenges are presented when using land transport?
77
6. Could air freight be substituted by ground transport for anything other than last mile
distribution?
7. Is there anything you feel that we forgot to ask you or something you would like to
add?
Interview with UNHRD-staff
1. What is your role in WFP/UNHRD?
2. How long have you been working at WFP/UNHRD?
3. Questions in regard to Warehousing operations
1. How does the process of utilizing UNHRD look for UN-agencies?
1. Who is responsible for putting, stock keeping, picking of goods stored
at UNHRD?
2. What type of limitations are there on UNHRD warehouse?
1. Space
2. Handling equipment
3. Safety
2. If warehousing activities are handled by WFP how has efficiency of
operations been up until now?
1. Have there been any issues with UNHRD warehouse processes in
general or can each facility be completely seen as an individual
operation?
3. Which UNHRD:s have the possibility for cold storage (2-8 deg. C)?
4. Questions in regard to Costs of warehousing operations
1. How are UN-agencies charged for utilizing the UNHRD warehouses?
1. How are the variable costs for warehouse operations calculated, and
finally charged to users of UNHRD warehouses?
2. Is there any fixed cost for utilizing a UNHRD, as a UN agency?
5. Questions in regard to dispatch/distribution from warehouses
1. Does UNHRD/WFP aid in the dispatch of goods?
1. We have heard that there is a possibility for getting the dispatch paid
for by a donor. To what extent does this occur?
2. Does UNHRD/WFP administrate transport from the warehouses or is this task
assigned to the agency using the warehouse?
1. If UNHRD/WFP aids with distribution how are these services
acquired? Are there pre-negotiated agreements in place with freight
forwarders etc?
6. How do you handle insurance at a UNHRD?
7. Is there anything you feel that we forgot to ask or something you would like to add?
Interview with Ahmed Malah
1. What is your role at UNFPA?
2. How long have you been working at UNFPA?
3. Could you please describe the process of ordering RH-kits from Iraq?
4. In your opinion what are the issues/challenges with distribution of RH-kits from the
regional/global warehouse to the CO today?

78
5. How are your operations affected by a longer lead time? Eg. loss of lives? Negative
publicity?
6. Do you have any experience of national pre-positioning of RH-kits?
7. Do you have any experience of regional pre-positioning of RH-kits?
8. How dependent is the Iraqi government on UNFPA for fulfilling the reproductive
health needs of the country?
9. Is there something that you feel we forgot to ask you or something you would like to
add?
Interview with Sathya Doraiswamy
1. What is your role at UNFPA?
2. How long have you been working at UNFPA?
3. Could you please describe the process of ordering RH-kits from Bangladesh?
4. In your opinion what are the issues/challenges with distribution of RH-kits today?
5. Have you received any shipments of RH-kits from the warehouse in Brisbane?
1. In your opinion - was there any difference from the shipments received from
Amsterdam? Eg. lead times?
6. How are your operations affected by a longer lead time? Eg. loss of lives? Negative
publicity?
7. Do you have any experience of national pre-positioning of RH-kits?
8. Is there something that you feel we forgot to ask you or something you would like to
add?
Interview with the APRO office
1. What are your role at UNFPA?
2. How long have you been working at UNFPA?
3. Could you explain the decision process and rationales behind opening up a regional
pre-positioning in Brisbane?
a. Who was involved in the decision?
b. How long did it take to get approval?
4. What do you stock in the warehouse?
5. Who owns the stock in the Brisbane warehouse?
a. How do you handle kits that have expired practically as well as financially?
6. What is your planning horizon for pre-positioning?
7. How do you forecast demand?
8. Have you measured the impact on costs and lead times since the warehouse
opened?
9. Is there anything you feel that we forgot to ask you or something you would like to
add?
8.2 Model Parameters

79
Parameter Method of acquisition
fi Based on description of employees of different roles needed for central PSB. ● 100 % of a FTE of a G6 employee for stock management ● 200 % of a FTE of a G5 employee for order processing ● 75 % of a FTE of a G6 employee for demand planning ● 5 % of a FTE of a P3 employee for finance specialist time ● 5 % of a FTE of a P4 employee for ERP specialist time ● 5 % of a FTE of a G5 employee for finance assistance
Taking the respective fractions of the different employees the cost of fictive FTE could be calculated at 81779 USD per year. Through validation meetings it was estimated that a new UNHRD warehouse would require around 50 % of a FTE, therefore the warehouse opening costs for UNRHD warehouses was set to 40889 USD.
CHi For Netherlands set to 10 % of kit unit costs.This was found in data provided by UNFPA and validated through validation meetings. For UNHRD 0 % of kit unit costs, UNHRD instead utilizes recovery costs. For additional warehouses 10 %, assuming that rented warehouses have similar procedures to the Netherlands.
SPk Set to three times kit unit costs. Multiple values were used during optimization with the goal of having perished kits and holding costs. With a to low value of SPk the model would have the exact required amount at every time period creating a unfeasible ordering policy.
CPk Extracted from ERP data. The prices for kits 2A-12 were drawn from the last purchase order made by PSB to the supplier in the Netherlands. The price for kits 0, 1A and 1B were calculated using an average of the 2015-2017 prices.
CMik Extracted from ERP data, average transportation costs per/kg/km for sea freight (0,000135106) was multiplied by kit weight and distance. ERP data was sorted to only account for shipments done from the Netherlands when calculating the average.
CTijk Extracted from ERP data, average transportation cost per/kg/km for air freight (0,000820839) was multiplied by kit weight and distance. ERP data was sorted to only account for shipments done from the Netherlands when calculating the average.
CRi For UNHRD warehouses set to 7 % of transportation costs according to pricing provided by UNHRD personnel. For all other warehouses 0.
HPi Calculated using the logistics performance index (LPI). The dimensions of logistics competence (D1) and infrastructure (D2) were used, which are both graded on a scale from 1-5. The following formula was used for calculation: 2 − (𝐷1 + 𝐷2)/10
TPi Calculated using the logistics performance index (LPI). The dimensions of international shipments (D3) and timeliness (D4) were used, which are both graded on a scale from 1-5. The following formula was used for calculation: 2 − (𝐷3 + 𝐷4)/10.
Gammai Set to value higher than total demand, to observe which spacings would be required. This in accordance with validation meetings.
B Set to a value allowing for opening of all warehouses, to observe what kind of budget would be required for a optimal layout. This in accordance with validation meetings.
ps All scenarios were deemed equally likely therefore they all have a (⅓) chance of occuring.
tij Transportation times were calculated using the average of 0,00123399 Hours/km which was found using https://flighttime-calculator.com/ for multiple flights from varying locations and of varying distances.
Flight distance
All flight distances were determined using https://www.freemaptools.com/how-far-is-it-between.htm. The distance between country capitals was used.
Sea freight distances
All sea freight distances were determined using https://www.searates.com/reference/portdistance/. The distances between the port of amsterdam and ports closed to country capitals was used.

80