evaluation of strut-and-tie modeling for bridge pier
TRANSCRIPT
Graduate Theses, Dissertations, and Problem Reports
2002
Evaluation of strut-and-tie modeling for bridge pier applications Evaluation of strut-and-tie modeling for bridge pier applications
Thomas Nicholas II West Virginia University
Follow this and additional works at: https://researchrepository.wvu.edu/etd
Recommended Citation Recommended Citation Nicholas, Thomas II, "Evaluation of strut-and-tie modeling for bridge pier applications" (2002). Graduate Theses, Dissertations, and Problem Reports. 1893. https://researchrepository.wvu.edu/etd/1893
This Thesis is protected by copyright and/or related rights. It has been brought to you by the The Research Repository @ WVU with permission from the rights-holder(s). You are free to use this Thesis in any way that is permitted by the copyright and related rights legislation that applies to your use. For other uses you must obtain permission from the rights-holder(s) directly, unless additional rights are indicated by a Creative Commons license in the record and/ or on the work itself. This Thesis has been accepted for inclusion in WVU Graduate Theses, Dissertations, and Problem Reports collection by an authorized administrator of The Research Repository @ WVU. For more information, please contact [email protected].

Evaluation of Strut-and-Tie Modeling for Bridge Pier Applications
Thomas Nicholas II
Thesis submitted to the College of Engineering and Mineral Resources at West Virginia University in partial fulfillment of the
requirements for the Degree of
Masters of Science in
Civil Engineering
Dr. Karl E. Barth, Chair Dr. John P. Zaniewski
Dr. Anthony L. Brizendine, UNCC
Department of Civil and Environmental Engineering
Morgantown, West Virginia 2002
Keywords: Reinforced Concrete, Strut-and-Tie Modeling, Hammerhead Piers

ABSTRACT
Evaluation of Strut-and-Tie Modeling for Bridge Pier Applications
Thomas Nicholas II
Strut-and-tie modeling is an analysis and design tool for reinforced concrete
elements which assumes that internal stresses are transferred through a truss type mechanism. The tensile ties and compressive struts serve as truss members connected by nodal zones. The internal truss idealized by the strut-and-tie model implicitly accounts for the distribution of both flexure and shear.
In 1998, the AASHTO LRFD Bridge Specifications (1998) incorporated the strut-and-tie modeling procedure for the analysis and design of deep reinforced concrete members where sectional design approaches are not valid. In most instances, hammerhead piers can be defined as deep reinforced concrete members and therefore, should be designed using the strut-and-tie modeling approach. However, little has been done to develop a consistent approach to the design of hammerhead pier caps employing the strut-and-tie modeling method.
The present study is focused on developing a uniform design procedure for applying the strut-and-tie modeling method to hammerhead piers. In addition to developing a design procedure, a survey of all fifty State Transportation Departments was conducted to ascertain the degree of implementation of the AASHTO LRFD Bridge Specifications for substructure design.
A design study was conducted using four hammerhead piers that were previously designed using the strength design method specified by the AASHTO Standard Specifications in order to evaluate strut-and-tie modeling procedures. The four pier caps were designed using the strut-and-tie modeling procedure and the results compared to the results of the sectional design method. For each hammerhead pier cap, the strut-and-tie method required more flexural steel than the sectional method. Based on the design studies, a well-defined procedure for designing a hammerhead pier utilizing the strut-and-tie model was established that may be used by bridge engineers.

ACKNOWLEDGEMENTS
I would like to express my deepest gratitude to my advisor Dr. Karl E. Barth for
providing me the opportunity to pursue my graduate degree under his direction. His
support, direction, and encouragement throughout the course of my graduate study made
the completion of this work possible. His exemplary work ethic and commitment to
excellence have made it a privilege to work with him. The tutelage and guidance I
received under him have helped me to grow as an individual, educator, and engineer.
I would like to express my sincere gratitude to Dr. John Zaniewski for his
willingness to serve on my graduate advisory committee.
I would like to thank Dr. Anthony L. Brizendine for serving on my committee and
for his guidance and support throughout my professional and scholarly careers.
I would like to thank my family for their encouragement, support, and
understanding throughout my graduate work.
Finally, I would like to thank my wife, Melissa. My graduate studies would not
have been possible without her patience, support, and love.
iii

TABLE OF CONTENTS
ABSTRACT ..................................................................................................................... ii
ACKNOWLEDGMENTS ................................................................................................iii
TABLE OF CONTENTS ..................................................................................................iv
LIST OF TABLES ..........................................................................................................viii
LIST OF FIGURES .......................................................................................................... ix
1. INTRODUCTION ....................................................................................................…1
1.1 Problem Statement........................................................................................... 1
1.2 Objectives and Scope of Study........................................................................ 2
1.3 Organization of Thesis .................................................................................... 3
2. LITERATURE REVIEW ........................................................................................... 4
2.1 Abstract……..................................................................................................... 4
2.2 Overview of Strut-and Tie Modeling .............................................................. 5
2.3 Adequate Selection of Truss Members ........................................................... 6
2.4 General Strength of Truss Members................................…............................. 9
2.4.1 Strength of Tensile Ties ......................….........…............................ 9
2.4.2 Strength of Compressive Strut ............….........….......................... 10
2.4.3 Node Strength ………………............…........…............................ 11
2.5 Shear Concerns in Strut-and-Tie Models ....................................................... 13
2.6 Summary ........................................................................................................ 14
3. AASHTO LFD AND LRFD SPECIFICATIONS AND DEPARTMENT OF
HIGHWAYS SURVEY RESULTS .............................................................................. 26
iv

3.1 Introduction ................................................................................................... 26
3.2 AASHTO Standard Code Specifications for the Design of Reinforced
Concrete Members ......................................................................................... 27
3.2.1 Design for Flexure ...........……………………………................... 29
3.2.2 Design for Shear …..........……………………………................... 33
3.3 AASHTO LRFD Code Specifications for the Design of Reinforced Concrete
Members using Strut-and-Tie Modeling ........................................................ 35
3.3.1 Compression Struts ..........……………………………................... 36
3.3.2 Tension Ties ……….........……………………………................... 38
3.3.3 Nodal Zones ……….........……………………………................... 39
3.4 Survey of State Transportation Departments ................................................. 40
3.5 Survey Results ..........................………………………………..................... 41
4. DESIGN COMPARISIONS… .................................................................................. 49
4.1 Introduction .................................................................................................... 49
4.2 Description of Design Procedures ................................................................. 50
4.2.1 Load Generation Procedure ………................................................ 50
4.2.2 Strut-and-Tie Model Truss Background and Development for
Hammerhead Piers ………………….............................................. 51
4.2.2.1 Strut-and-Tie Model Background .................................... 51
4.2.2.2 Truss Definition Procedure for Hammerhead Pier Caps
..............................…………………………………….... 54
4.2.3 Pier Design Procedure ……………................................................ 55
4.3 Design Studies .….......................................................................................... 57
v

4.3.1 Barboursville Bridge Hammerhead Pier Design Example ............. 57
4.3.1.1 Project Description ............….……………...................... 57
4.3.1.2 Original Analysis/Design....………………...................... 58
4.3.1.3 Strut-and-Tie Analysis/Design……………...................... 59
4.3.2 South Madison Bridge Hammerhead Pier Design Example ........... 60
4.3.2.1 Project Description ............….……………...................... 60
4.3.2.2 Original Analysis/Design....………………...................... 61
4.3.2.3 Strut-and-Tie Analysis/Design……………...................... 62
4.3.3 Clear Fork Bridge Hammerhead Pier Design Example .……......... 63
4.3.3.1 Project Description ............….……………...................... 63
4.3.3.2 Original Analysis/Design....………………...................... 64
4.3.3.3 Strut-and-Tie Analysis/Design……………...................... 65
4.3.4 Shepherd Bridge Hammerhead Pier Design Example .………....... 66
4.3.4.1 Project Description ............….……………...................... 66
4.3.4.2 Original Analysis/Design....………………...................... 67
4.3.4.3 Strut-and-Tie Analysis/Design……………...................... 68
4.4 Discussion of Results ..................................................................................... 69
5. DESIGN RECOMMENDATIONS……................................................................. 104
5.1 Recommended Strut-and-Tie Design Procedure For Hammerhead Piers.... 104
5.1.1 Determination of Loads................................................................ 104
5.1.2 Defining the Truss Model............................................................. 105
5.1.3 Dimensioning of Tensile Ties, Compressive Struts, and Nodal
Zones ..........................…………………………….................... 106
vi
6. SUMMARY AND CONCLUSIONS…………………………………................... 110
6.1 Summary ......…............................................................................................ 110
6.2 Conclusions ………...................................................................................... 112
REFERENCES CITED ............................................................................................... 114
APPENDICES
Appendix A: STATE TRANSPORTATION DEPARTMENT SURVEY ....................117
Appendix B: Nomenclature..........…….......................................................................... 120
vii
LIST OF TABLES
Table 2.1 Effective Stress Levels in Nodal Zones. Adapted from Yun and Rameriz
(1996) ...............………………………..……………………………........ 15
Table 4.1 Tensile Reinforcement Calculations and Concrete Compression
Requirements – Barboursville Bridge ..................………………….......... 70
Table 4.2 Tensile Reinforcement Calculations and Concrete Compression
Requirements – South Madison Bridge ...................................................... 71
Table 4.3 Tensile Reinforcement Calculations and Concrete Compression
Requirements – Clear Fork Bridge ...……………………………….......... 72
Table 4.4 Tensile Reinforcement Calculations and Concrete Compression
Requirements – Shepherd Bridge ............................................................... 73
Table 4.5 Comparison between LFD and Strut-and-Tie Modeling Results
............................................................………………………..................... 74
viii

LIST OF FIGURES
Figure 2.1 Typical truss model for a deep beam. Adapted from MacGregor, 1997
……………………................................................................................... 16
Figure 2.2 Examples of the basic types of hydrostatic nodes: (a) Compression-
Compression-Tension-nodes. (b) Compression-Compression-
Compression-nodes. Adapted from Schlaich et. al., 1997 ……………... 17
Figure 2.3 Example strut-and-tie models. (a) An Acceptable Model (b) A Poor
Model. Adapted from Schlaich et. al., 1997.....................…................…18
Figure 2.4 Hammerhead Pier Cap with Acceptable Truss Model.............................. 19
Figure 2.5 Hammerhead Pier Cap with Alternate Truss Model................................. 20
Figure 2.6 Topology Optimization History (a) Topology at iteration 20, (b) topology
at iteration 40, (c) Optimum topology at iteration 49. Adapted from
Liang, et. al. (2002). ....…………………………………………............. 21
Figure 2.7 Final Strut-and-Tie Model from Topology Optimization Procedure.
Adapted from Liang, et. al. (2002). .........……………………................ 22
Figure 2.8 Types of Compression Struts. (a) Prismatic Strut (b) Bottle Shaped Strut
(c) Strut-and-Tie Model for Bottle Shaped Strut. Adapted from
MacGregor, 1997. .........………………................................................... 23
Figure 2.9 (a) Typical singular nodes, (b) Typical smeared nodes. Adapted from
Schlaich et. al., 1997 ………………………………………………….... 24
Figure 2.10 Predicted and observed strengths of concrete beams tested by Kani, (1979)
………....................................................................................................... 25
ix

Figure 3.1 Rectangular Section with Tension Reinforcement Only ........……......... 44
Figure 3.2 Rectangular Section with Compression and Tension Reinforcement....... 45
Figure 3.3 Flanged Section with Tension Reinforcement Only................................. 46
Figure 3.4 Compressive Strut anchorages (Collins and Mitchell, 1991)
…………………………………….......................................................... 47
Figure 3.5 United States Map of Responding State Transportation Departments..…48
Figure 4.1 HL-93 Reaction Calculation Configuration ....................………………. 75
Figure 4.2 Illustration of Wheel Placement ............…………………………........... 76
Figure 4.3 Illustration of Lane Loading Placement ............…………………........... 77
Figure 4.4 Steps for defining a truss model. (Collins and Mitchell, 1991)................ 78
Figure 4.5 Hammerhead Pier Cap with Truss Model .......…………………............. 79
Figure 4.6 Bridge Elevation – Barboursville Bridge .....…………………................ 80
Figure 4.7 Typical Section – Barboursville Bridge………………… ....................... 81
Figure 4.8 Barboursville Pier Cap LFD Design ..........……………………….......... 82
Figure 4.9 Barboursville Truss Model Dimensions and Solutions…........................ 83
Figure 4.10 Effective Depth Calculation for Barboursville Bridge Pier Cap.............. 84
Figure 4.11 Barboursville Bridge Strut-and-Tie Modeling Reinforcing Details......... 85
Figure 4.12 Bridge Elevation – South Madison Bridge ........……………….............. 86
Figure 4.13 Typical Section – South Madison Bridge………………. ....................... 87
Figure 4.14 South Madison Bridge Pier Cap LFD Design………….. ....................... 88
Figure 4.15 South Madison Truss Model Dimensions and Solutions…...................... 89
Figure 4.16 Effective Depth Calculation for South Madison Bridge Pier Cap............ 90
Figure 4.17 South Madison Bridge Strut-and-Tie Modeling Reinforcing Details....... 91
x

Figure 4.18 Bridge Elevation – Clear Fork Bridge ..........……………………........... 92
Figure 4.19 Typical Section – Clear Fork Bridge…………………… ....................... 93
Figure 4.20 Clear Fork Bridge Pier Cap LFD Design……………….. ....................... 94
Figure 4.21 Clear Fork Truss Model Dimensions and Solutions……......................... 95
Figure 4.22 Effective Depth Calculation for Clear Fork Bridge Pier Cap................... 96
Figure 4.23 Clear Fork Bridge Strut-and-Tie Modeling Reinforcing Details.............. 97
Figure 4.24 Bridge Elevation – Shepherd Bridge ..............……………………......... 98
Figure 4.25 Typical Section – Shepherd Bridge………………………...................... 99
Figure 4.26 Shepherd Bridge Pier Cap LFD Design ...........………………….......... 100
Figure 4.27 Shepherd Bridge Truss Model Dimensions and Solutions .................... 101
Figure 4.28 Effective Depth Calculation for Shepherd Bridge Pier Cap................... 102
Figure 4.29 Shepherd Bridge Strut-and-Tie Modeling Reinforcing Details.............. 103
xi

Chapter 1 INTRODUCTION
1.1 Problem Statement
Strut-and-tie modeling is an analysis and design tool for reinforced concrete
elements in which it may be assumed that internal stresses are transferred through a truss
mechanism. The tensile ties and compressive struts serve as truss members connected by
nodal zones. The internal truss, idealized by the strut-and-tie model, implicitly account
for the distribution of both flexure and shear.
In 1998, the AASHTO LRFD Bridge Specifications (1998) incorporated the strut-
and-tie modeling procedure for the analysis and design of deep reinforced concrete
members where sectional design approaches are not valid. In most instances,
hammerhead piers can be defined as deep reinforced concrete members and therefore,
should be designed using the strut-and-tie modeling approach.
However, most bridge designers have not embraced the strut-and-tie model due to
the unfamiliarity with the design procedure, the inability to check the truss model’s
validity (without laboratory tests or a finite element model), and the time it takes to
complete the strut-and-tie model analysis and design. Therefore, it is likely that, with the
formulation of a well-defined strut-and-tie modeling procedure, practicing engineers will
1
become more comfortable with the design method and therefore, employ the method
more often and consistently.
1.2 Objectives and Scope of Study
The specific objectives of the study are:
• To ascertain the degree of strut-and-tie modeling implementation in State
Transportation Departments,
• To compare the flexure and shear reinforcing requirements for typical
hammerhead type bridge piers using both strut-and-tie modeling and
standard sectional design practices, and
• To develop a uniform design procedure for employing strut-and-tie
modeling for hammerhead piers.
A survey of all fifty State Transportation Departments was conducted to ascertain
the implementation of the AASHTO LRFD Bridge Specifications and the strut-and-tie
method for bridge substructures in their respective states. The survey consisted of two
questions and follow-ups were performed via email and telephone.
The design study utilizes four hammerhead piers that were previously designed
using the strength design method specified by the AASHTO Standard Specifications.
The four pier caps are designed using the strut-and-tie modeling procedure and the results
compared to the results of the sectional design method. By comparing the results, the
reduction or increase in the flexural steel and the shear steel can be quantified.
2

Lastly, a well-defined procedure for designing a hammerhead pier utilizing the
strut-and-tie model saw established that may be used by bridge engineers.
1.3 Organization of Thesis
The thesis is organized in six chapters. The first chapter presents the background,
objectives and scope of the project. Chapter 2 presents a review of previous work on the
development of strut-and-tie models in deep reinforced concrete sections. Chapter three
presents the state transportation department survey and the governing specifications for
the design of reinforced concreted in bridges. Chapter four discusses the design
comparisons between the strength design method and the strut-and-tie method. Chapter
five provides design recommendations for strut-and-tie modeling of hammerhead piers.
Lastly, chapter six presents a summary and conclusions of the current study and describes
potential directions for future work.
3

Chapter 2 LITERATURE REVIEW
2.1 Abstract
Over the past several decades considerable research has been conducted on the
analysis, strength and behavior of various reinforced concrete sections designed using the
strut-and-tie approach. Initial work was conducted by Ritter (1899) and later Morsch
(1920) whom first used a truss type analogy to model the internal load carrying
mechanism in a reinforced concrete beam. Later, Schlaich et al. (1987) worked to
combine individual research conducted on various reinforced concrete elements in such a
fashion that strut-and-tie modeling could be used for the entire structure.
Strut-and-tie modeling is an analysis and design tool for reinforced concrete
elements in which it may be assumed that both flexural and shearing stresses are
transferred internally in a truss type member comprised of concrete compressive struts
and steel reinforcing tension ties. It should be noted that while the shear design is
theoretically coupled with the truss model, in most instances designers perform a separate
check for providing additional stirrup type shear reinforcement.
During the past few years design codes, ACI (2001) and AASHTO LRFD (1998),
have adopted strut-and-tie principles for the design of deep beam members. The
4

definition of deep sections provided by these specifications classifies most hammerhead
piers as deep sections.
This chapter provides a brief overview of previous work that has been conducted
on strut-and-tie modeling specifically as it relates to the design of sections such as
hammerhead piers.
2.2 Overview of Strut-and-Tie Modeling
Previous researchers focused on understanding the internal distribution of forces
in a reinforced concrete structure and have defined two specific regions; B-Regions and
D-Regions. The B-Regions of a structure (where B stands for a region where Bernoulli
Beam theory may be employed) have internal states of stress that are easily derived from
the sectional forces e.g. bending, shear, etc. For structural members that do not exhibit
plane strain distribution, e.g. the strain distribution is non-linear, the sectional force
approach in not applicable. These regions are called D-Regions (where D stands for
discontinuity, disturbance, or detail). The D-Regions of a structure are normally corners,
corbels, deep sections, and areas near concentrated loads. When D-Regions crack the
treatments used such as “detailing,” “past experience,” and “good practice” often prove
inadequate and inconsistent (Schlaich et al., 1987).
Figure 2.1 provides a simple strut-and-tie model applied to a simply supported
deep beam. In this figure, the lighter shaded regions represent concrete compressive
struts, the steel reinforcing bar represents a tensile tie, and the dark shared regions
represent nodal zones.
5

The tension ties in the truss model may represent one or several layers of flexural
reinforcement in the deep section. The locations of the tension ties normally are defined
at the centroid of reinforcing mat. The compressive struts are concrete compressive
stress fields with the prevailing compression in the direction of the strut (Kuchma and
Tjhin, 2001). As previously stated, nodal zones are the truss joints in the strut-and-tie
model. Nodal zones are formed where tension ties, compression struts, and exterior loads
intersect. Figure 2.2 shows the two types of hydrostatic nodal zones.
For further in-depth information on the general application of strut-and-tie
modeling for general structures, the reader is referred to Schlaich, et., al. (1987); Collins
and Mitchell (1991); Adebar and Zhou (1996); and MacGregor (1997). It should be
noted while research has been widely performed on the various parts of a structure,
Schlaich et al. (1987) combined the individual pieces of the structure to allow for the
entire structure to be modeled using the strut-and-tie approach.
2.3 Adequate Selection of Truss Members
Adequate representation of the truss model requires a level of skill and
engineering judgment and typically requires an iterative procedure to produce an
adequate reinforcement pattern for a given member. The process of defining the truss
begins by defining the flow of forces in the member and locating the nodal zones at
points where the external loads act and the loads are transferred between structural
members, e.g. the pier cap to pier column or at the supports. The tension ties and
compression struts can then be located once the nodal zones have been defined. The
6

tension ties are located at the assumed centroid of tensile reinforcing beginning and
terminating at nodal zones. The compression struts are defined to coincide with the
compressive field and, as with the tensile ties, begin and terminate at the nodal zones
(Collins and Mitchell, 1991).
The truss should exhibit equilibrium at each node and should portray an
acceptable truss model. Figure 2.3 illustrates the difference between an acceptable model
and a poor model. The truss model represented by Fig. 2.3b is classified as poor due to
the larger number of tension ties and the truss members cross. Furthermore, it is helpful
to realize that loads try to use the path with the least forces and deformations. Since
reinforced ties are much more deformable than concrete struts, the model with the least
and shortest ties should provide the most favorable model. Schlaich et al., proposes a
simple criterion for optimizing a model that derived from the principle of minimum strain
energy for linear elastic behavior of the struts and ties after cracking. The contribution of
the concrete struts can generally be omitted because the strains of the struts are usually
much smaller than those of the steel ties. The minimum number of ties required for the
model can be found by the following equation:
MinimumlF miii =∈∑ (2-1)
where
Fi = force in strut or tie i
li = length of member i
єmi = mean strain of member i
7
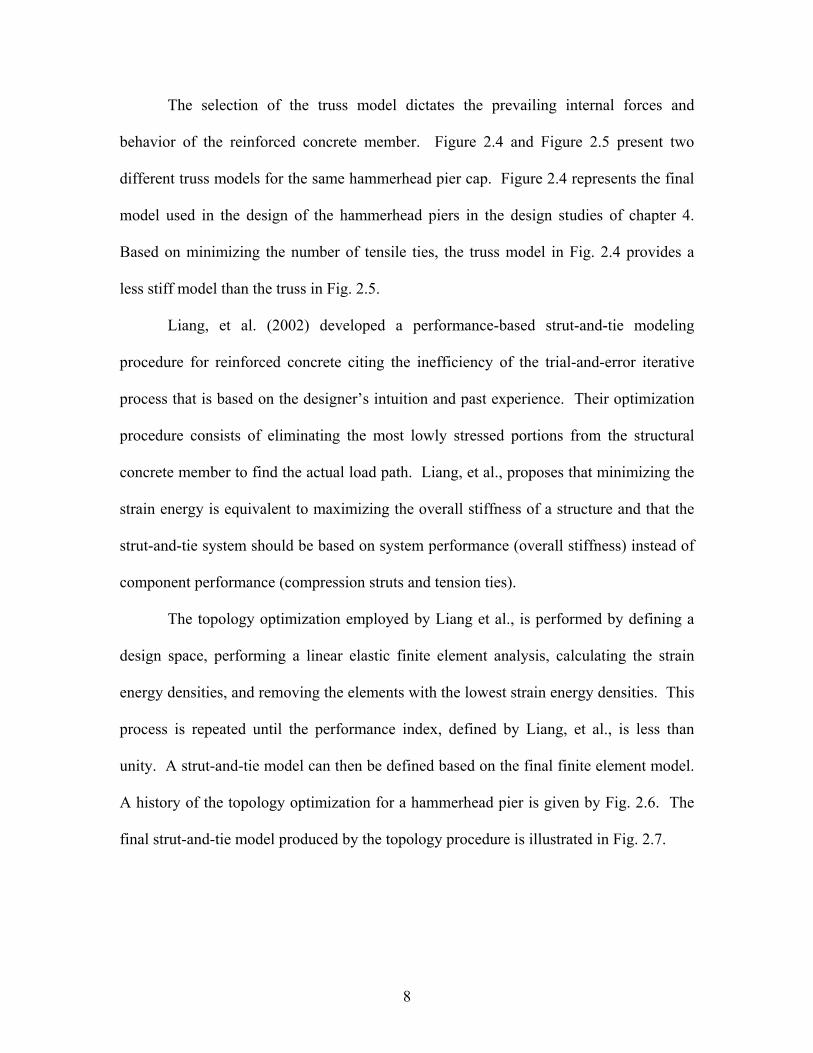
The selection of the truss model dictates the prevailing internal forces and
behavior of the reinforced concrete member. Figure 2.4 and Figure 2.5 present two
different truss models for the same hammerhead pier cap. Figure 2.4 represents the final
model used in the design of the hammerhead piers in the design studies of chapter 4.
Based on minimizing the number of tensile ties, the truss model in Fig. 2.4 provides a
less stiff model than the truss in Fig. 2.5.
Liang, et al. (2002) developed a performance-based strut-and-tie modeling
procedure for reinforced concrete citing the inefficiency of the trial-and-error iterative
process that is based on the designer’s intuition and past experience. Their optimization
procedure consists of eliminating the most lowly stressed portions from the structural
concrete member to find the actual load path. Liang, et al., proposes that minimizing the
strain energy is equivalent to maximizing the overall stiffness of a structure and that the
strut-and-tie system should be based on system performance (overall stiffness) instead of
component performance (compression struts and tension ties).
The topology optimization employed by Liang et al., is performed by defining a
design space, performing a linear elastic finite element analysis, calculating the strain
energy densities, and removing the elements with the lowest strain energy densities. This
process is repeated until the performance index, defined by Liang, et al., is less than
unity. A strut-and-tie model can then be defined based on the final finite element model.
A history of the topology optimization for a hammerhead pier is given by Fig. 2.6. The
final strut-and-tie model produced by the topology procedure is illustrated in Fig. 2.7.
8

2.4 General Strength of Truss Members
As previously stated, the truss model is comprised of tension ties, compression
struts, and nodal zones. For the adequate design of the reinforced concrete member, the
elements of the truss model must be sized. The following sections present the general
strength of the tensile ties, compressive struts, and nodal zones.
2.4.1 Strength of TensileTies
One or several layers of reinforcement in the same direction represent a tension
tie in a truss model. According to ACI, the tension tie can be designed with the
straightforward approach of dividing the factored tie force by the yield strength of the
reinforcing steel and is expressed as follows (Kuchma and Tjhin, 2001; ACI, 2001):
y
uf
NAs φ> (2-2)
where
Nu = the factored tie force
fy = the tie yield strength
φ = resistance factor
As = the required area of steel
However, the emphasis is not in the design of the tensile reinforcement but in the
selection of how to distribute and anchor the reinforcement. This becomes apparent due
9
to the ability of the joint or nodal zone to transfer forces between the strut-and-tie is
dependent on the surface area of the reinforcement, the height over which it is distributed,
the length of the node, and the type of anchorage method that is employed. ACI and
AASHTO have provisions, which require the tie reinforcement be distributed over such a
height that if the tie were anchored on the far side of the node that the nodal stress limit
value will not be exceeded (Kuchma and Tjhin, 2001). AASHTO requirements for nodal
stress limits can be found in Section 3.3 of this paper.
2.4.2 Strength of Compressive Strut
Struts represent one dimensional stress fields, which should not exceed the
compressive strength of the concrete (Yun and Rameriz, 1996). Struts are often
portrayed as prismatic or uniformly tapered members; however, struts can vary along
their length and form what is known as a bottle-shape. Figure 2.8 shows several forms
that may be used to represent internal compressive struts. Cracking may develop in
bottle shaped elements if no crack control reinforcement is used.
ACI uses the following formula to limit the compressive stress in the strut (ACI,
2001).
cscu ff '85.0 β= (2-3)
where βs = 1.00 for prismatic struts in uncracked compression zones
βs = 0.40 for struts in tension members
10

βs = 0.75 when struts may be bottle shaped and crack control
reinforcement is included
βs = 0.60 when struts may be bottle shaped and crack control
reinforcement is not included
βs = 0.60 for all other cases
f’c = concrete compressive strength
The ACI code equation accounts for when struts are prismatic, tapered, or bottle
shaped and whether transverse reinforcement is or is not provided. ACI also gives the
following equation for the required amount of crack control reinforcement:
003.0sin ≥∑ ivi γρ (2-4)
where
ρvi = steel ratio of the i-th layer of reinforcement crossing that strut
γi = angle between the axis of a strut and the bars
2.4.3 Node Strength
Nodal zones (the joints of the truss) are formed where tension ties, compression
struts, and exterior loads intersect. To allow safe transfer of strut-and-tie forces through
the nodal zones, concrete stress levels must be controlled. The strength of concrete in the
nodal zones depends on (Yun and Rameriz, 1996):
11

• The confinement of the zones by reactions, compression struts, anchorage
plates for prestressing, reinforcement from the adjoining members and hoop
reinforcement,
• The effects of strain discontinuities within the nodal zone when ties strained in
tension are anchored in, or across, a compressed nodal zone, and
• The splitting stresses and hook-bearing stresses resulting from the anchorage
of the reinforcing bars of a tension tie in or immediately behind a nodal zone.
When a node is introduced into a model it is implied that the internal forces
change directions abruptly. In reality, the force changes directions over a certain length
and width. This yields two types of nodes based on the length and width of the node;
singular and smeared. Singular nodes are encountered when forces tend to be locally
concentrated and the deviation of the forces tends to be locally concentrated. Conversely,
if a strut or tie represents a wide stress field the node can be considered a smeared node.
Figure 2.9 illustrates some typical examples of singular and smeared nodes (Schlaich et
al., 1987).
A great deal of research has been done to determine the effective stress levels in
nodal zones and is summarized in the third column of Table 2.1 (Yun and Rameriz,
1996). However, ACI gives the following equation for limiting the stresses in nodal
zones:
12

cncu ff '85.0 β= (2-5)
where βn = when nodes are bounded by struts and/or bearing areas βn = 0.80 when nodes anchor only one tie βn = 0.60 when nodes anchor more than one tie f’c = concrete compressive strength
2.5 Shear Concerns in Strut-and-Tie Models
Truss models implicitly carry both flexure and shearing type forces through
compressive and tensile axial force elements. Therefore, it is apparent that shear
reinforcement could be omitted when employing the strut-and-tie model to reinforced
concrete members, based on how the flexural and shearing stresses are treated by the
truss model.
Kani et al., (1979) suggest that the shear behavior of a beam is dependent on the
“shear span.” The shear span is defined as the distance from the support of the structure
to the load acting on the structure. A simply supported beam can resist high levels of
shear closer to the support, which is illustrated in Figure 2.10 (Kani et al., 1979). The test
showed that for span-to-depth ratios from 1 to 2.5 the shear is carried by strut-and-tie
action; however, over the 2.5 ratio a sectional model transfers the shearing stress. The
findings of Kani et al., (1979) would further support the ability of the truss model to
transfer the shear in disturbed regions near supports and point loads. However, bridge
designers are typically uncomfortable with the idea of not using shear reinforcement and
13

therefore after a strut-and-tie has been developed most engineers have then also
conducted a sectional analysis to detail additional shear reinforcement.
2.6 Summary
Throughout the past several years, researchers have sought to reliably and
accurately predict the behavior of deep structural members consisting of D-Regions. For
a number of years designers have been using “good” engineering judgment and
“detailing” to handle theses situations. Now, due to the implementation of strut-and-tie
modeling into the AASHTO LRFD Bridge Specifications and the ACI Design Code,
designers have the tools to more accurately design these regions.
The truss model is constructed by defining the tension ties, compression struts,
and nodal zones. The tensile ties represent the flexural reinforcement in the structural
member, while the compressive struts represent the primary compressive stress paths.
The nodal zones are defined where the external loads act on the structure; the intersection
of compressive struts and tensile ties; and load paths between elements.
Truss model geometry and the detailing of the truss elements is an iterative and
subjective process. However, when done by experienced engineers will provide a
solution that is acceptable and more accurate than the traditional treatment of
discontinuity regions. Where experience is insufficient, Liang, et al. (2002) provides the
topology optimization procedure which consists of eliminating the underutilized portions
from the structural concrete member to find the actual load path. The final load path is
then used to define the truss model.
14

Table 2.1 Effective Stress Levels in Nodal Zones. Adapted from Yun and Rameriz (1996)
Effective
stress level (1)
Nodes (2)
Proposed by (3)
0.85f’c Compression-compression-compression nodes
Schlaich et al. (1987)
0.68f’c Nodes where reinforcement is anchored in or crossing the node
Schlaich et al. (1987)
0.85f’c Nodes bounded by compressive struts and bearing areas
MacGregor (1988)
0.65f’c Nodes anchoring one tension tie
MacGregor (1988)
0.50f’c Nodes anchoring tension ties in more than one direction
MacGregor (1988)
0.8f’c for f’c ≤ 27.6 MPa
Unconfined nodes without bearing plates
Bergmeister et al. (1991)
(0.9-0.25f’c/69) f’c for 27.6 ≤ f’c ≤ 69 MPa
Unconfined nodes without bearing plates
Bergmeister et al. (1991)
0.65f’c for f’c ≥ 69 MPa
Unconfined nodes without bearing plates
Bergmeister et al. (1991)
v(A/Ab)0.5 + α(Acore/Ab)flat(1-s/d)2
Confined nodes Bergmeister et al. (1991)
v f’c(A/Ab)0.5 Unconfined nodes with bearing plates
Bergmeister et al. (1991)
2.5f’c Triaxially confined nodes Bergmeister et al. (1991)
Note: A, Ab, and Acore = area of confined concrete, bearing plate, and the confined strut, respectively; flat = lateral pressure (2fyAs/(ds) for f’c < 48.3 MPa; 2fyAs/(ds) for f’c > 48.3 MPa; s = pitch or spacing of confining reinforcement; d = diameter of confined core; α = parameter (4.0 for spiral confinement, 2.0 for square closed hoop confinement anchored with longitudinal reinforcement, and 1.0 for square closed hoop confinement without longitudinal reinforcement anchorage); and v = 0.5 + 1.25 / √ f’c.
15

Major Compression Diagonal
Figure 2.1 Typical truss model for a deep beam. Adapted from MacGregor, 1997
16
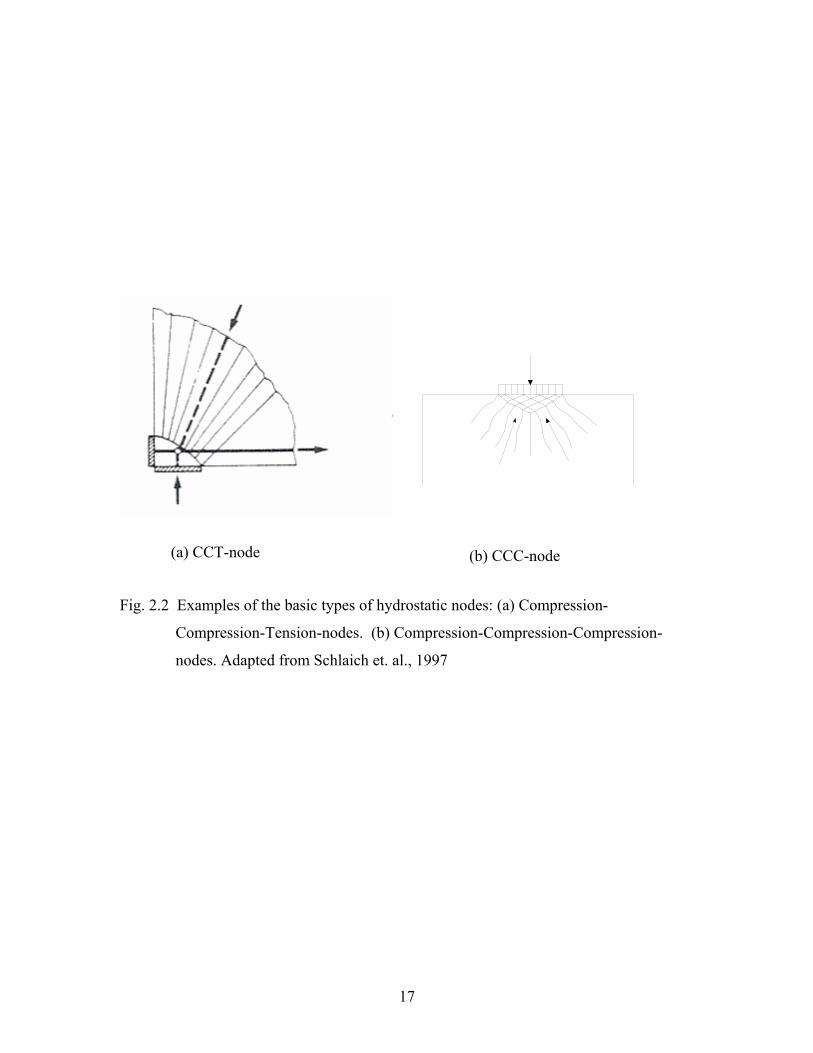
(a) CCT-node (b) CCC-node
Fig. 2.2 Examples of the basic types of hydrostatic nodes: (a) Compression-
Compression-Tension-nodes. (b) Compression-Compression-Compression-
nodes. Adapted from Schlaich et. al., 1997
17

An Acceptable model A Poor model
Figure 2.3. Example strut-and-tie models. (a) An Acceptable Model (b) A Poor
Model. Adapted from Schlaich et. al., 1997
18
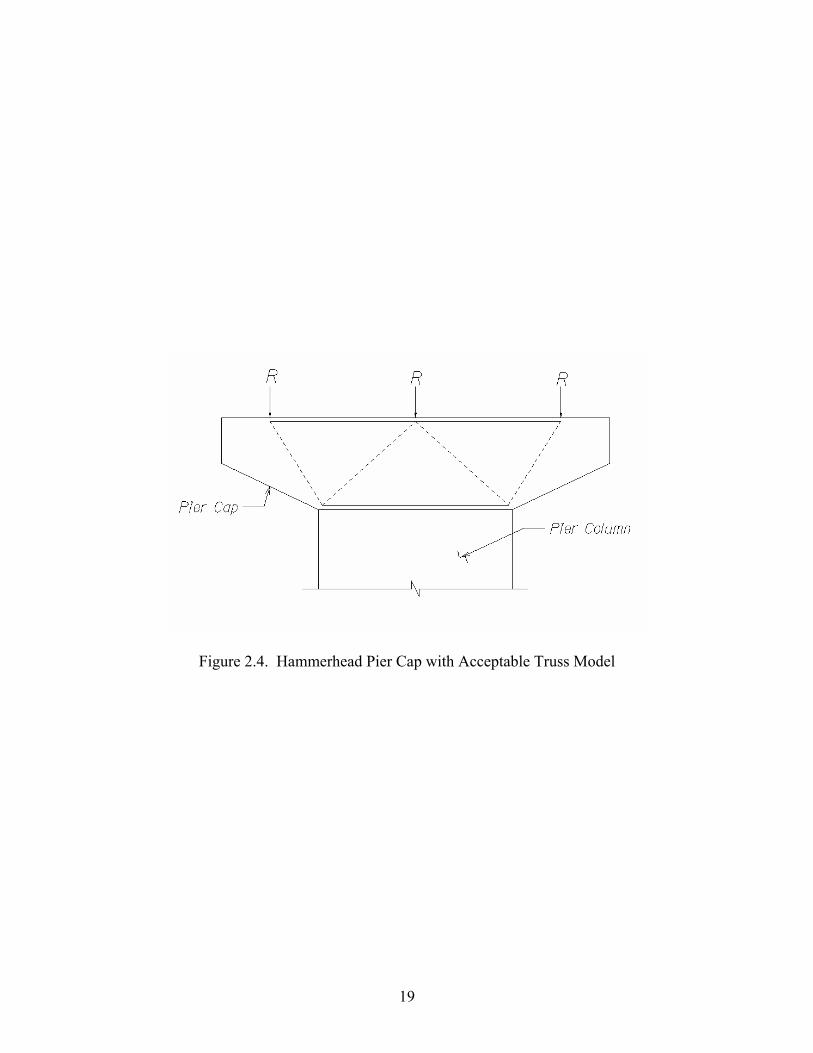
Figure 2.4. Hammerhead Pier Cap with Acceptable Truss Model
19

Figure 2.5. Hammerhead Pier Cap with Alternate Truss Model
20
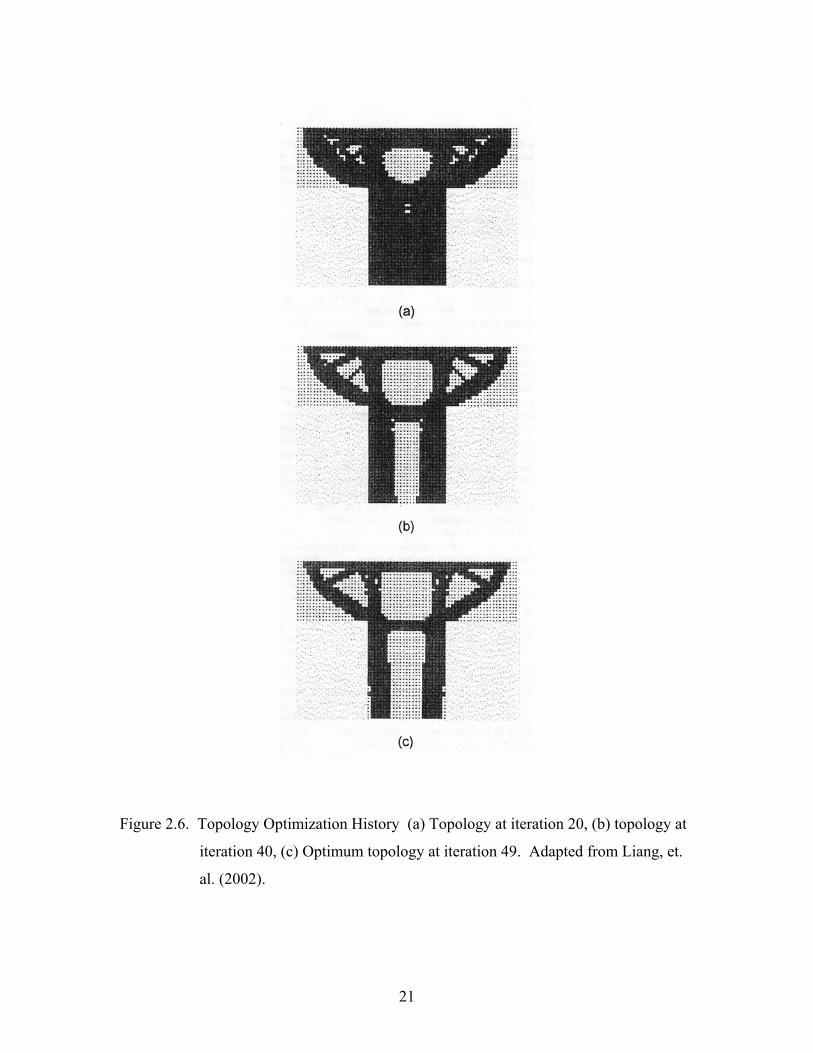
Figure 2.6. Topology Optimization History (a) Topology at iteration 20, (b) topology at
iteration 40, (c) Optimum topology at iteration 49. Adapted from Liang, et.
al. (2002).
21

Figure 2.7. Final Strut-and-Tie Model from Topology Optimization Procedure. Adapted
from Liang, et. al. (2002).
22

Figure 2.8. Types of Compression Struts. (a) Prismatic Strut (b) Bottle Shaped Strut (c)
Strut-and-Tie Model for Bottle Shaped Strut. Adapted from MacGregor,
1997.
23

Figure 2.9. (a) Typical singular nodes, (b) Typical smeared nodes. Adapted from
Schlaich et. al., 1997
24
a
b

6 x 6 x 1 in (152 x 152 x 25 mm) plate 6 x 9 x 2 in (152 x 229 x 51 mm) plate 6 x 3 x 0.38 in (152 x 76 x 9.6 mm) plate
69 0.25
V V67 a a
0.20 24 in (610 mm)
d VV
0.15 Fc’ = 3940 psi (27.2 MPa) max agg = ¾ in (19 mm) d = 21.2 in (238 mm) b = 6.1 in (155 mm) As = 3.53 in2 (2277 mm2) Iγ = 53.9 ksi (372 MPa)
V bdfc’
0.10 72
6165 76 74 750.05 63 6671 79
sectional model strut and tie model
0 1 4 50 2 3 6 7
a/d
Figure 2.10. Predicted and observed strengths of concrete beams tested by Kani, (1979)
25
Chapter 3
AASHTO LFD AND LRFD SPECIFICATIONS AND DEPARTMENT OF
HIGHWAYS SURVEY RESULTS
3.1 Introduction
With the implementation of the AASHTO LRFD Bridge Specifications, bridge
designers were presented with a new approach in the design of deep reinforced concrete
sections, the strut-and-tie design method. While strut-and-tie modeling has been
employed in the past for various reinforced concrete designs, the introduction of the
AASHTO LFRD Specifications marks the first time it is presented as a suggested design
procedure. This chapter outlines the procedures used in both the AASHTO Standard
Specifications and the AASHTO LRFD Specifications for the design of deep concrete
sections. Additionally, a survey of State Transportation Departments was conducted to
determine design practice currently used for hammerhead type piers. Results of this
survey are summarized in this chapter.
26

3.2 AASHTO Standard Code Specifications for the Design of Reinforced Concrete
Members
Generally, the design strength of a given member is in terms of moment, shear, or
stress. In the strength design method, a nominal strength is calculated and then reduced
by a factor normally expressed asφ . Article 8.16.1.2.2 of the Standard Specifications
gives the following strength-reduction factors (for shear and moment), φ , shall be as
follows (AASHTO, 1998):
(a) Flexure………………………………………. φ = 0.90
(b) Shear………………………………………… φ = 0.85
Section 8.16.2 presents several design assumptions used in the strength design
method for reinforced concrete and are as follows:
• 8.16.2.1 The strength design of members for flexure and axial loads shall
be based on the assumptions given in this Article, and on the satisfaction
of the applicable conditions of equilibrium of internal stresses and
compatibility of strains.
• 8.16.2.2 The strain in reinforcement and concrete is directly proportional
to the distance from the neutral axis.
• 8.16.2.3 The maximum usable strain at the extreme concrete compression
fiber is equal to 0.003.
• 8.16.2.4 The stress in reinforcement below its specified yield strength, fy,
shall be Es times the steel strain. For strains greater than that
27

corresponding to fy, the stress in the reinforcement shall be considered
independent of strain and equal to fy.
• 8.16.2.5 The tensile strength of the concrete is neglected in flexural
calculations.
• 8.16.2.6 The concrete compressive stress/strain distribution may be
assumed to be a rectangle, trapezoid, parabola, or any other shape that
results in prediction of strength in substantial agreement with the results of
comprehensive tests.
• 8.16.2.7 A compressive stress/strain distribution, which assumes a
concrete stress of 0.85 uniformly distributed over an equivalent
compression zone bounded by the edges of the cross section and a line
parallel to the neutral axis at a distance
cf '
ca 1β= from the fiber of
maximum compressive strain, may be considered to satisfy the
requirements of Article 8.16.2.6. The distance c from the fiber of
maximum strain to the neutral axis shall be measured in a direction
perpendicular to that axis. The factor 1β shall be taken as 0.85 for
concrete strengths, , up to and including 4,000 psi. For strengths
above 4,000 psi,
cf '
1β shall be reduced continuously at a rate of 0.05 for
each 1,000 psi of strength in excess of 4,000 psi but 1β shall not be taken
less than 0.65.
28

3.2.1 Design for Flexure
The AASHTO Standard Specifications first presents the maximum reinforcement
for flexural members. Article 8.16.3.1.1 states that the ratio of reinforcement ρ provided
shall not exceed 0.75 of the ratio ρ b that would produce balanced strain conditions for
the section. The portion of ρ b balanced by compression reinforcement need not be
reduced by the 0.75 factor. Article 8.16.3.1.2 states that balanced strain conditions exist
at a cross section when the tension reinforcement reaches the strain corresponding to its
specified yield strength, fy, just as the concrete in compression reaches its assumed
ultimate strain of 0.003.
The AASHTO Standard Specifications follow the traditional design approach for
bending in reinforced concrete sections. Three cases are presented in the Specifications:
rectangular sections with tension reinforcement only, flanged sections with tension
reinforcement only, and rectangular sections with tension and compression
reinforcement. The three cases for bending design are illustrated by Fig. 3.1, Fig. 3.2, and
Fig. 3.3, respectively.
Article 8.16.3.2.1 gives the following equation for the design moment strength,
φ Mn, for rectangular sections with tension reinforcement only:
29

−=
c
yysn f
fdfAM
'6.01
ρφφ (3-1)
−=
2adfA ysφ
where,
bffA
ac
ys
'85.0= (3-2)
The balanced reinforcement ratio, ρ , is then given by Article 8.16.3.2.2 as:
+=
yy
cb ff
f000,87
000,87'85.0 1βρ (3-3)
For instances when the compression flange thickness is less than a (depth of the
compression block), the design moment strength may be computed by:
( ) ( ) ( )[ ]fysfysfsn hdfAadfAAM 5.02/ −+−−= φφ (3-4)
where,
( )y
fwcsf f
hbbfA
−=
'85.0 (3-5)
30

( )wc
ysfs
bffAA
a'85.0
−= (3-6)
and the balanced steel ratio is:
+
+
= f
yy
cwb ff
fb
bρ
βρ
000,87000,87'85.0 1 (3-7)
where,
dbA
w
sff =ρ (3-8)
Article 8.16.3.4.1 gives the following equation for the design moment strength,
φ Mn, for Rectangular sections with tension and compression reinforcement as:
If
−
≥
−
yy
css
fdfdf
bdAA
000,87000,87''
85.0'
1β (3-9)
then,
( ) ( ) ( )[ ]''2/' ddfAadfAAM ysyssn −+−−= φφ (3-10)
31

where,
( )bffAA
ac
yss
'85.0'−
= (3-11)
Article 8.16.3.4.2 states that when the value of ( ) bdAA ss /'− is less than the
value required by Eqn. 3-10, such that the stress in the compression reinforcement is less
than the yield strength, fy, or when effects of compression reinforcement is less than the
yield strength, fy, or when effects of compression reinforcement are neglected, the design
moment strength may be computed by the equations in Article 8.16.3.2 (Eqns. 3-1, 3-2,
and 3-3).
Article 8.16.3.4.3 gives the balanced reinforcement ratio bρ for rectangular
sections with compression reinforcement as follows:
+
+=
y
s
yy
cb f
fff
f ''
000,87000,87'85.0 1 ρ
βρ (3-12)
where,
yy
s ff
ddf ≤
+
−=
000,87000,87'1000,87' (3-13)
32

3.2.3 Design for Shear
Shear design in the Standard Specifications is accomplished by computing the
contribution to the shear capacity from both the concrete and steel. The Standard
Specifications provides the following equation for the design of cross sections subjected
to shear:
nu VV φ≤ (3-14)
where Vu is the factored shear force at the section considered and Vn is the nominal shear
strength computed by:
scn VVV += (3-15)
where Vc is the nominal shear strength provided by the concrete in accordance with
Article 8.16.6.2, and Vs is the nominal shear strength provided by the shear reinforcement
in accordance with Article 8.16.6.3. Whenever applicable, effects of torsion shall be
included.
The shear strength provided by the concrete, for members subject to shear and
flexure only, Vc shall be computed by:
33

dbM
dVfV w
u
uwcc
+= ρ500,2'9.1 (3-16)
or,
dbfV wcc '2= (3-17)
where bw is the width of web and d is the distance from the extreme compression fiber to
the centroid of the longitudinal tension reinforcement. For tapered webs, bw shall be the
average width or 1.2 times the minimum width, whichever is smaller.
Additionally, the Standard Specifications provides the following two notes for the
contribution of concrete shear resistance:
(a) Vc shall not exceed dbf wc'5.3 when using more detailed calculations.
(b) The quantity Vud/Mu shall not be greater than 1.0 where Mu is the factored
moment occurring simultaneously with Vu at the section being considered.
When the factored shear force, Vu exceeds shear strength cVφ , shear
reinforcement must be provided. The Standard Specifications provides for three cases of
reinforcement. The first is when shear reinforcement is perpendicular to the axis of the
member is used. The amount of reinforcement is then:
sdfA
V yvs = (3-18)
where Av is the area of shear reinforcement within a distance s.
When using inclined stirrups, the amount of required reinforcement is given by:
34
( )s
dfAV yv
s
αα cossin += (3-19)
When a single vertical bar or a single group of vertical parallel bars located at the same
distance from the support is used:
dbffAV wcyvs '3sin ≤= α (3-20)
The Standard Specifications also limit the amount of shear strength that the steel
can provide. Article 8.16.6.3.9 states that shear strength Vs shall not be taken greater
than:
dbfV wcs '8≤ (3-21)
3.3 AASHTO LRFD Code Specifications for the Design of Reinforced Concrete
Members using Strut-and-Tie Modeling
The AASHTO LRFD Specifications states that strut-and-tie models may be used
to determine internal force effects near supports and the points of application of
concentrated loads at strength and extreme event limit states. Additionally, the strut-and-
tie model should be considered for the design of deep footings and pile caps or other
situations in which the distance between the centers of applied load and the supporting
35

reactions is less than twice the member thickness. Strut-and-tie modeling is covered by
Articles 5.6.3.2 through 5.6.3.6.
As previously mentioned, strut-and-tie modeling implicitly addresses the effects
of both flexure and shear. Axial members in the truss model most explicitly satisfy force
limitations as provided by the following generalized expression:
nr PP φ= (3-22)
where:
Pn = nominal resistance of strut or tie
φ = resistance factor for tension or compression specified in Article
5.5.4.2, as appropriate
3.3.1 Compression Struts
AASHTO LRFD Specifications permit the use of either unreinforced or
reinforced compression struts. AASHTO gives the following equation for the nominal
resistance of an unreinforced compressive strut:
cscun AfP = (3-23)
where:
Pn = nominal resistance of a compressive strut
fcu = limiting compressive stress as specified in Article 5.6.3.3.3
36
Acs = effective cross-sectional area of strut as specified in Article
5.6.3.3.2
AASHTO provides the following equation for the condition where if the
compressive strut contains reinforcement that is parallel to the strut and detailed to
develop its yield stress in compression. For this reinforcing case, the nominal resistance
of the strut shall be taken as:
ssycscun AfAfP += (3-24)
where:
Ass = area of reinforcement in the strut
Acs = effective cross-sectional area of strut as specified in Article
5.6.3.3.2
fcu = limiting compressive stress as specified in Article 5.6.3.3.3
fy = yield strength of steel
The cross sectional area of the compressive strut depends on the geometry of the
reinforcing pattern. Figure 3.4 shows various reinforcing patterns, which affect the
compressive strut’s area. AASHTO states that the value of Acs shall be determined by
considering both the available concrete area and the anchorage conditions at the ends of
the strut, as shown in Fig. 3.4. When a strut is anchored by reinforcement, the effective
37

concrete area may be considered to extend a distance of up to six bar diameters from the
anchored bar, as shown in Fig. 3.4(a).
As stated previously, struts represent one dimensional stress fields, which should
not exceed the compressive strength of the concrete (Yun and Rameriz, 1996). AASHTO
provides the following for limiting compressive stress, fcu:
cc
cu ff
f '85.01708.0'
1
≤+
=ε
(3-25)
where:
( ) sss αεεε 21 cot002.0++= (3-26)
and:
sα = the smallest angle between the compressive strut and adjoining
tension ties
sε = the tensile strain in the concrete in the direction of the tension tie
cf ' = specified compressive strength (ksi)
3.3.2 Tension Ties
AASHTO LRFD Specifications state that tension tie reinforcement shall be
anchored to the nodal zones by specified embedment lengths, hooks, or mechanical
anchorages. The tension force shall be developed at the inner face of the nodal zone. The
nominal resistance of a tension tie shall be taken as:
38

Pn = fy Ast + Aps [fpe + fy] (3-27)
where:
Ast = total area of longitudinal mild steel reinforcement in the tie
Aps = area of prestressing steel
fy = yield strength of mild steel longitudinal reinforcement
fpe = stress in prestressing steel due to prestress after losses
3.3.3 Nodal Zones
AASHTO LRFD Specifications state unless confining reinforcement is provided
and its effect is supported by analysis or experimentation, the concrete compressive stress
in the node regions of the strut shall not exceed:
• For node regions bounded by compressive struts and bearing areas: φ85.0
cf '
• For node regions anchoring a one-direction tension tie: φ75.0 cf '
• For node regions anchoring tension ties in more than one direction:
φ65.0 cf '
where:
φ = the resistance factor for bearing on concrete as specified in Article 5.5.4.2.
In detailing the tension tie reinforcement, AASHTO LRFD Specifications states
that the tension tie reinforcement shall be uniformly distributed over an effective area of
concrete at least equal to the tension tie force divided by the stress limits specified herein.
39
In addition to satisfying strength criteria for compression struts and tension ties, the nodal
regions shall be designed to comply with the stress and anchorage limits specified in
Articles 5.6.3.4.1 and 5.6.3.4.2. The bearing stress on the nodal region produced by
concentrated loads or reaction forces shall satisfy the requirements specified in Article
5.7.5.
As with all reinforced concrete sections, crack control reinforcement should be
provided. When employing the strut and tie model, structural members, not including
slabs and footings, should contain a grid of reinforcing bars at each face of the member,
typically referred to as skin steel. AASHTO LRFD Specifications state that the spacing
of the bars in the orthogonal grid shall not exceed 12 inches. Additionally, the code
allows crack control reinforcing that is located within the tension tie to be considered as
part of the tension tie reinforcing. The ratio of reinforcement area to gross area shall not
be less than 0.003 in each direction.
3.4 Survey of State Transportation Departments
A survey of all fifty State Transportation Departments was conducted to assess
the implementation of the AASHTO LRFD strut-and-tie modeling procedure in their
respective state. The survey was emailed to each Engineering Director, and was either
answered directly by the Engineering Director or forwarded to the State Bridge Engineer
who then completed the survey. The reply was then sent back to the author and, if
required, further correspondence, in the form of a phone call, was conducted. A copy of
40

the survey emailed to the Engineering Directors is located in Appendix A. Figure 3.2
shows a map of the United States with each of the participating states highlighted.
The first question in the survey sought to determine if their state was currently
using the AASHTO LRFD Bridge Design Code. It is not only important to determine
which states are or are not employing the LRFD Code but at the same time, it is equally
important to determine the reasons for implementing or not implementing the LRFD
Design Code.
Secondly, the respective state was asked if the LRFD code was being used what
design method was being employed to design the pier caps. This question was
meaningful due to the analysis and design options provided by the LRFD Bridge Design
Code. Each state was also asked to provide sample calculations, whether they were using
LFD or LRFD Bridge Design Codes, and the bridge plans related to the sample
calculations they provided. With each reply, the representative of the state responding to
the survey was asked to provide their contact information and position title for future
correspondence. Additionally, for the states which have implemented the strut-and-tie
model, it was asked (in further correspondence), in their opinion, if the strut-and-tie
model was a feasible analysis and design method for bridge pier caps.
3.5 Survey Results
Table 3.1 summarizes the survey results (the author would like to point out the
names of the states in the table and in this paper have been changed and listed in random
order to insure the anonymity of each state). Table 3.1 lists the states participating in the
41

survey, as well as whether the state was using the LRFD or LFD Bridge Design Code.
The Bridge Code the state was currently using was divided into two categories:
Superstructure and Substructure. The division was necessary due to the states using
LRFD for the superstructure and LFD for the substructure. As can be seen in Fig. 3.5, 24
states or 48 percent of the states responded to the survey. Of the respondents 33 percent
have switched in some fashion to the LRFD Bridge Design Code. However, most of the
states using LRFD have not switched to designing the substructures by the strut-and-tie
model. The group using the strut-and-tie model only makes up approximately 8 percent
of the total responding. It should be noted, a number of states responding are beginning
to implement the LRFD Code to substructures; however, they are in the very early stages
with no trial designs as of the date of this survey.
The survey illustrated, among the respondents, that the state Departments of
Highways are hesitant to employ the LRFD Bridge Design Code. For the most part, the
states are attempting to ease into the LRFD Code by using it for superstructure design
only. The author realizes the cost of acquiring the new computer software and the
training for employees both for the new design method and the purchase of the
corresponding software can be an expensive endeavor. However, a mixing of codes is
occurring in the Bridge Design Industry. Case in point, State E uses LRFD as the code
for the superstructure, while reverting back to LFD for the substructure. The mixing of
design codes is a concern; however, is beyond the scope of this study. The prevalent
reason for states not employing the Strut-and-Tie Model in their designs is the
unfamiliarity with the procedure and the fact that the traditional design method has been a
successfully proven method in designing pier caps.
42

Two states responding to the survey use Strut-and-Tie Modeling to design the pier
caps, State B and State V. These states also sent example calculations illustrating their
steps in creating the model. In addition to the two states sample calculations, two other
examples illustrating the strut-and-tie modeling procedure were obtained for comparison
reasons. In each case, considerably different design procedures were employed.
43

Figure 3.1. Rectangular Section with Tension Reinforcement Only
44

Figure 3.2. Rectangular Section with Compression and Tension Reinforcement
45

Figure 3.3. Flanged Section with Tension Reinforcement Only
46

Figure 3.4. Compressive Strut anchorages (AASHTO, 1998)
47

Figure 3.5. United States Map of Responding State Transportation Departments
48
Chapter 4 DESIGN COMPARISIONS
4.6 Introduction
As previously stated, the strut-and-tie method is being promoted by the AASHTO
LRFD Specifications for the design of deep reinforced concrete sections. The lack of
familiarity with the procedure has caused most practicing engineers, from the states
responding to the survey, to avoid implementation of LRFD substructure design. This
chapter presents a series of four design comparisons performed to illustrate the use of
strut-and-tie modeling and to compare these designs with traditional sectional
approaches.
The description of the proposed design procedure presents the process of defining
loads and location of loads to produce the maximum moments on the cantilever of the
hammerhead pier. The section for the creation of the truss model provides background
information in truss modeling as well as the procedure used in the design studies for
modeling the hammerhead pier’s internal truss. The final section in the design procedure
is the dimensioning of the compressive struts, tension ties, and nodal zones. This section
also discusses the placement of reinforcement for the shear and temperature effects.
49

The design studies provide examples of the strut-and-tie model applied to
previously designed hammerhead piers, which used the AASHTO Standard
Specifications. This will allow for a comparison of the two designs and their
accompanying reinforcing requirements. Finally, the results of the design studies will be
discussed as well as the trends of industry to embrace the strut-and-tie model as a viable
design option for deep sections.
4.2 Description of Design Procedures
4.2.1 Load Generation Procedure
The first load to be considered in the pier design is the dead load reactions
generated by the superstructure. Members contributing to the dead load reactions are the
beam, intermediate diaphragms, deck, pier diaphragm, parapet, and future wearing
surface. The dead load reactions should be calculated for the interior and exterior beams.
Live loading consisted of using the HL-93 loading from the AASHTO LRFD
Specifications (AASHTO, 1998). For the design studies presented in this chapter, the
software program CONSYS 2000® was used to generate the live load reactions. When
placing the truck component of the HL-93 live load, the designer should place the second
wheel directly over the pier insuring the maximum reaction. The load placement is
illustrated in Fig. 4.1. When considering the load distribution to the beams, the HL-93
reaction should be placed so that to induce the maximum moment on the cantilever of the
50

hammerhead pier. For the design study, the maximum moment is produced by placing
the HL-93 reaction two feet from the face of the curb or parapet as shown in Fig. 4.2.
The lane load component of the HL-93 loading reaction was also found using the
CONSYS 2000® program. The lane load must also be placed to induce the maximum
moment, which for the design study was at the face of the curb and is illustrated by Fig.
4.3.
Upon completion of determining the exterior and interior beam reactions, the
loads must be factored in accordance with AASHTO LRFD Specifications (e.g. see Table
3.4.1-1 (AASHTO, 1998)). The load combination, which governed the design studies,
was Strength I from the AASHTO LRFD Specifications. Strength I is defined as the
following:
Factored Load = Truck (1.75 + IM) + Lane (1.75) + Dead load (1.25) (4-1)
Additionally, the load effects from water, wind, self-weight, and wind on the live
load were not considered as part of the load combinations for the design studies.
4.2.2 Strut-and-Tie Model Truss Background and Development for Hammerhead
Piers
4.2.2.1 Strut-and-Tie Model Background
As previously stated, the major concern in employing the strut-and-tie modeling
procedure is the development of the truss model. It should be noted that the creation of
51

the model is an iterative process involving refinement of the model after each solution.
Significant experience and engineering judgment are required to develop a final model.
While it is true that the model is subjective, some clear guidelines have been presented in
order to more consistently model structural elements when employing the truss model.
The strut-and-tie model is based on the flow of forces in the entire structural
member instead of sections along the member. The flow of forces is resisted by tension
ties and compressive struts, which along with nodal zones form an internal truss. In
general, the model is developed by defining the flow of forces in the structural member;
locating and sizing the nodal zones; determining the truss geometry; and solving for the
forces in the struts and ties. The steps for defining the strut-and-tie model are illustrated
by Fig. 4.4 (Collins and Mitchell, 1991).
The internal truss is based on the lower bound theory of plasticity. Therefore, the
actual capacity of the structure is always equal to or greater than that of the idealized
truss. The hypothesis based on lower bound plasticity is correct only if proper measures
are performed to assure that “splitting” does not occur. That is, the forces may spread out
along the length of the strut resulting in the strut failing by splitting at a lower load than it
would have failed by crushing at had the stress trajectories been parallel. Such effects
can, however, be easily accounted for in provisions by reducing ultimate stress limit
values (Kuchman and Tjhin, 2002).
The first step in deciding the location of the ties, struts, and nodes is to define the
flow of forces in the uncracked D-region of the structural member. Locating D-Regions
can be accomplished using an elastic analysis, such as a finite element analysis. It should
be noted, while this is a useful means of starting a model, it is not essential (MacGregor,
52

1997). Furthermore, Huang, et. al. (1998), suggests that a hammerhead bridge pier cap
should be considered entirely as a D-Region. However, Schlaich et. al. (1987), points out
that in normally or lightly stressed regions the direction of the struts and ties in the model
may deviate considerably from the elastic pattern without exceeding the structure's
ductility. The ties and hence the reinforcement may be arranged according to practical
considerations. That is, the structure will adapt itself to the assumed internal structural
system. Of course, in every case an analysis and safety check must be made using the
final model. The method of orienting the strut-and-tie-model along the force paths
indicated by the theory of elasticity obviously neglects some ultimate load capacity,
which could be utilized by a pure application of the theory of plasticity. On the other
hand, it has the major advantage that the same model can be used for both the ultimate
load and the serviceability check.
Orienting the geometry of the model to the elastic stress distribution is also a
safety requirement because the tensile strength of concrete is only a small fraction of the
compressive strength. In certain cases, it would be unsafe even if both requirements of
the lower bound theorem of the theory of plasticity are fulfilled, namely, equilibrium and
actual stress is less than the allowable stress. Compatibility evokes tensile forces, usually
transverse to the direction of the loads that may cause premature cracking and failure
(Schlaich, et.al., 1987).
As a rule of thumb, Schlaich, et. al. (1987) proposes that in heavier members the
struts should reside eight to twelve inches inside of the member. Due to the fact that the
truss models the centroid of the elements, the rule of thumb should provide adequate
space for the reinforcing pattern to reside.
53

In addition to using elastic analysis, crack patterns of test specimens can be used
to define the “best” strut-and-tie model (MacGregor, 1997). This would suggest an
agreement between the crack pattern and the truss model. However, this is not a practical
approach for most practicing engineers as cracking patterns are not readily available.
4.2.2.2 Truss Definition Procedure for Hammerhead Pier Caps
In beginning the modeling procedure it is first helpful to locate the nodal zones in
the pier cap. The nodal zones are first defined where external loads, e.g. beam reactions,
act on the pier cap. Referring to Fig. 4.5, the top three nodes in the truss model are
located directly under the reactions. For the nodes located on the bottom of the truss, the
stress path from the cap to the column is first defined. The stress path can be considered
to follow the reinforcing pattern that transfers stress from the cap to the column. The
depth where the nodes are located is dictated by the location of where the tensile ties and
compression struts are defined. The final node locations are shown in Fig. 4.5 for a
three-girder bridge.
It should be noted that the compression struts and tension ties should intersect at
the nodal zones and represent the location of the reinforcing pattern. While Schalich et.
al. does suggest compression struts to reside eight to twelve inches inside of the member,
they also suggest that the truss models the centroid of the structural elements, namely the
reinforcement. Using the predicted flow of forces and the location of reinforcing steel in
the structural member, a beginning truss model can be developed. In most instances,
larger diameter bars are used in the pier cap for tensile reinforcing. As a result, the
54
reinforcing mat resides at three to six inches inside of the pier cap. An example of tensile
tie and compression strut location for a three-beam configuration is given in Fig. 4.5.
4.2.3 Pier Design Procedure
The solution for the truss forces can be accomplished by using a software
program or by performing manual calculations. The truss solution will also aid in
defining the members that are in tension and compression for complex truss systems.
The dimensioning of the compression strut, tension tie, and nodal zones are governed by
Articles 5.6.3.2 through 5.6.3.6 of the AASHTO LRFD Specifications and were
previously discussed in Section 3.3.
The theory for the required and available compressive strut areas were discussed
in Section 3.3 of this paper; however, the procedure for calculating the compressive struts
is as follows. Based on the calculated Acs required, a required effective depth of the
compressive strut is calculated as:
DR StruteCompressivWidth
Acs= (4-1)
where:
DR = required effective depth
Acs = required area of concrete in compression
Width of Compressive Strut = taken as the width of the pier cap (Oliva,
1997)
55

In order to calculate the capacity of the available compressive area, the nodal zone
dimensions must be defined. The width and the depth of the nodal zone can be taken as
the width of the required bearing area (previously calculated in the superstructure design)
(Oliva, 1997). Using the smallest angle between the compressive strut and adjoining
tension ties sα , the available effective depth can be calculated as follows:
DA = (W * sin sα ) + (D * cos sα ) (4-2)
where:
DA = available effective depth
W = width of the nodal zone
D = depth of the nodal zone
sα = the smallest angle between the compressive strut and adjoining
tension ties
While the dimensioning of the compressive strut entails the limiting of the
concrete stress in the nodal zone, AASHTO LRFD Specifications require the concrete
compressive stress in the node regions of the strut shall not exceed the following:
• For node regions bounded by compressive struts and bearing areas: φ85.0
cf '
• For node regions anchoring a one-direction tension tie: φ75.0 cf '
• For node regions anchoring tension ties in more than one direction:
φ65.0 cf '
56
where:
φ = the resistance factor for bearing on concrete as specified in Article 5.5.4.2.
4.3 Design Studies
Four bridge designs were chosen for the comparison study between the strength
design method and the strut-and-tie design method (see AASHTO Section 5.6.3.1). The
primary basis of selection for the designs was that the piers had to be hammerhead piers
that met the definition of a deep structural member defined by AASHTO LRFD
Specifications. Additionally, the designs were selected to provide a varying ratio of the
overhang length with respect to the column width. The significance of the overhang to
column width ratio is that the differing geometries provided differing truss geometries.
The final designs chosen were as follows: Barboursville Bridge (West Virginia), South
Madison Bridge (West Virginia), Clear Fork Bridge (Tennessee), and Shepherd Bridge
(West Virginia).
4.3.1 Barboursville Bridge Hammerhead Pier Design Example
4.3.1.1 Project Description
The Barboursville Bridge is located in Barboursville, West Virginia and spans the
Gyandotte River. The bridge provides access to a newly constructed community park.
The structure is comprised of three spans totaling 329 feet: span 1 is 109.25 feet, span 2
is 110.50 feet, and span 3 is 109.25 feet. The superstructure consists of three Type IV
57

prestressed concrete beams that support a nine-inch deck and is illustrated by Fig. 4.6
(bridge elevation) and Fig. 4.7 (typical section). The beams are supported at the
beginning of bridge bearing and end of bridge bearing by abutments that are integral with
the deck. The integral abutments are supported by pilings that are embedded into
bedrock. Additionally, the bridge utilizes two hammerhead piers as intermediate
supports. The piers are located in the Gyandotte River and have an overall height of
62.67 ft are positioned on spread footings that are keyed into bedrock. The ratio of the
cantilever to width of column is for the pier 1.724. Figure 4.8 shows the dimensions of
the pier and the reinforcing pattern provided by the original design.
4.3.1.2 Original Analysis/Design
The original design was conducted using the AASHTO Standard Specifications
and the live loading consisted of the HS-25 truck and lane load (the live load was
controlled by the lane load). Multiple live load cases were generated by placing lane
loads in different locations on the superstructure. Five live load cases were entered into
the program, which included one and two lanes loaded. Other loads considered to be
acting on the pier cap were dead loads, buoyancy, wind loads, temperature, and water
pressure.
The original analysis of the hammerhead pier was performed using the Georgia
Pier Program (1984). The Georgia Pier program is a based program that employs the
AASHTO Standard Specifications and is widely used by the West Virginia Department
of Highways for the design of piers. An input file containing the loads and pier geometry
58

is created in a text file and loaded into the DOS program for calculation. The output file
generated by Georgia Pier is also in a text file and contains the governing load case as
well as the reinforcing requirements.
The original analysis yielded eight number-ten bars for the tension reinforcing in
the pier cap. Furthermore, the original design also specified double number-five shear
stirrups spaced at seven inches. The final design of the pier is shown in Fig. 4.8.
4.3.1.3 Strut-and-Tie Analysis/Design
The strut-and-tie analysis and the pier design were completed using the procedure
previously defined in this chapter. After performing several iterations a truss model,
illustrated by Fig. 4.9, was considered optimum and was used for the pier cap analysis.
Figure 4.9 also shows the resulting forces obtained from the truss analysis. The truss
analysis was performed using the software program RISA2D® and checked by manual
calculations. An Excel® spreadsheet was used for the sizing the reinforcement for the
tension ties and calculation of the required compression area. The spreadsheet is
presented in Table 4.1.
As can be seen in Table 4.1, the required area of the tensile steel is 11.7 in2.
Number 10 reinforcing bars were selected for the tensile steel requiring 10 bars or 12.27
in2 of tensile reinforcing. Furthermore, the required area of compression concrete in
compressive strut #2 is 464.53 in2. Referring to Fig. 4.10, the calculation of the required
effective depth and the available effective depth for compressive strut #2 for illustration
purposes is as follows.
59

• Assuming a 45” width of the compressive strut (width of pier cap) the required effective depth is:
"323.10"45
53.464 2
==inDR
• The available effective depth is given by:
( ) ( ) "47.36306.52cos*26306.52sin*26 =+=AD
• Comparing DR and DA:
36.47” > 10.323” ∴ no reinforcing is required.
The final steps in completing the pier cap design is completing the shear design
and providing evenly distributed temperature steel. The amount of shear stirrups required
was double number-six shear stirrups spaced at eight inches. Figure 4.11 shows the final
reinforcing details for the pier cap in the elevation view.
4.3.2 South Madison Bridge Hammerhead Pier Design Example
4.3.2.1 Project Description
The South Madison Bridge is located in Madison, West Virginia and spans the
Pond Fork of the Coal River. The bridge is comprised of two spans totaling 148.12 feet:
span 1 is 74.06 feet and span 2 is 74.06 feet. The superstructure utilizes three spread
60

prestressed box beams to support an eight-inch deck and is illustrated by Fig. 4.12 (bridge
elevation) and Fig. 4.13 (typical section). The beams are supported at the beginning of
bridge bearing and end of bridge bearing by abutments that are integral with the deck.
The integral abutments are supported by pilings that are embedded into bedrock.
Additionally, the bridge utilizes one hammerhead pier as an intermediate support. The
pier is located in the middle of Pond Fork and has an overall height of 26.25 ft. The pier
is positioned on a spread footing that is keyed into bedrock. The ratio of the cantilever to
width of column is for the pier 1.52. Figure 4.14 shows the dimensions of the pier in the
elevation view and the reinforcing pattern provided by the original design.
4.3.2.2 Original Analysis/Design
The loading for the original design was completed using an HS-25 truck and lane
loading; land loading was found to control. Multiple live load cases were generated by
placing lane loads in different locations on the superstructure. A total of five live load
cases were entered into the design program, which included one and two lanes loaded.
Other loads considered to act on the pier cap were dead loads, buoyancy, wind loads,
temperature, and water pressure.
As with the Barboursville Bridge, the original analysis of the hammerhead pier
was performed using the Georgia Pier Program (1984) previously discussed. The
original analysis yielded seven number- eight bars for the tension reinforcing in the pier
cap. Furthermore, the original design also specified double number-five shear stirrups
61

spaced at nine and three-quarters inches. The final design of the pier is shown in Fig.
4.14.
4.3.2.3 Strut-and-Tie Analysis/Design
The strut-and-tie analysis and the pier design were completed using the procedure
previously defined in this chapter. After performing several iterations, a truss model
illustrated by Fig. 4.15 was considered optimum and was used for the pier cap analysis.
Figure 4.15 also shows the resulting forces obtained from the truss analysis. The truss
analysis was performed using the software program RISA2D® and checked by manual
calculations. An Excel® spreadsheet was used for the sizing the reinforcement for the
tension ties and calculation of the required compression area. The spreadsheet is
presented in Table 4.2.
As can be seen in Table 4.2, the required area of the tensile steel is 7.57 in2.
Using the area of a number-eight bar, the final design requires ten number-eight bars
providing 7.85 in2 of tensile reinforcing. Furthermore, the required area of compression
concrete in compressive strut #2 is 296.70 in2. Referring to Fig. 4.16, the calculation of
the required effective depth and the available effective depth for compressive strut #2 for
illustration purposes is as follows.
• Assuming 42” width of the compressive strut (width of pier cap) the required effective depth is:
"1.7"42
70.296 2
==inDR
62

• The available effective depth is given by:
( ) ( ) "83.461092.58cos*341092.58sin*34 =+=AD
• Comparing DR and DA:
46.83” > 7.1” ∴ no reinforcing is required.
The final steps in completing the pier cap design is completing the shear design
and providing evenly distributed temperature steel. The amount of shear stirrups required
was double number-six shear stirrups spaced at nine inches. Figure 4.17 shows the final
reinforcing details for the pier cap in the elevation view.
4.3.3 Clear Fork Bridge Hammerhead Pier Design Example
4.3.3.1 Project Description
The Clear Fork Bridge is located on State Route 52 in Tennessee and spans the
Clear Fork River. The bridge is a replacement structure. The structure is comprised of
four spans totaling 995 feet: span 1 is 145 feet, span 2 is 220 feet, span 3 is 350 feet, and
span 4 is 280 feet. The superstructure consists of four - 98 ¼ inch deep hybrid steel
girders that support a 9 ¼ inch deck and is illustrated by Fig. 4.18 (bridge elevation) and
Fig. 4.19 (typical section). The beams are supported at the beginning of bridge bearing
63

and end of bridge bearing by concrete pedestal abutments. The pedestal abutments are
supported by pilings that are embedded into bedrock. Additionally, the bridge utilizes
three hammerhead piers as intermediate supports. The first and third pier is located to the
left and right of the Clear Fork River; while, pier two is located in the Clear Fork River.
Pier 1, which was used for the design study, has an overall height of 54.37 ft and is
positioned on spread footings that are keyed into bedrock, was used for the design study.
The ratio of the cantilever to width of column is for the pier 1.11. Figure 4.20 shows the
dimensions of the pier and the reinforcing pattern provided by the original design.
4.3.3.2 Original Analysis/Design
The original design was conducted using the AASHTO Standard Specifications
and the live loading consisted of the HS-25 truck and lane load (the live load was
controlled by the lane load). Multiple live load cases were generated by placing lane
loads in different locations on the superstructure. Two live load cases were entered into
the program, which included one and two lanes loaded. Other loads considered to act on
the pier cap were dead loads, buoyancy, wind loads, temperature, and water pressure.
As with the Barboursville Bridge, the original analysis of the hammerhead pier
was performed using the Georgia Pier Program (1984). The original analysis yielded
twenty-one number-eleven bars for the tension reinforcing in the pier cap. Furthermore,
the original design also specified double number-six shear stirrups spaced at four inches.
The final design of the pier is shown in Figure 4.20.
64
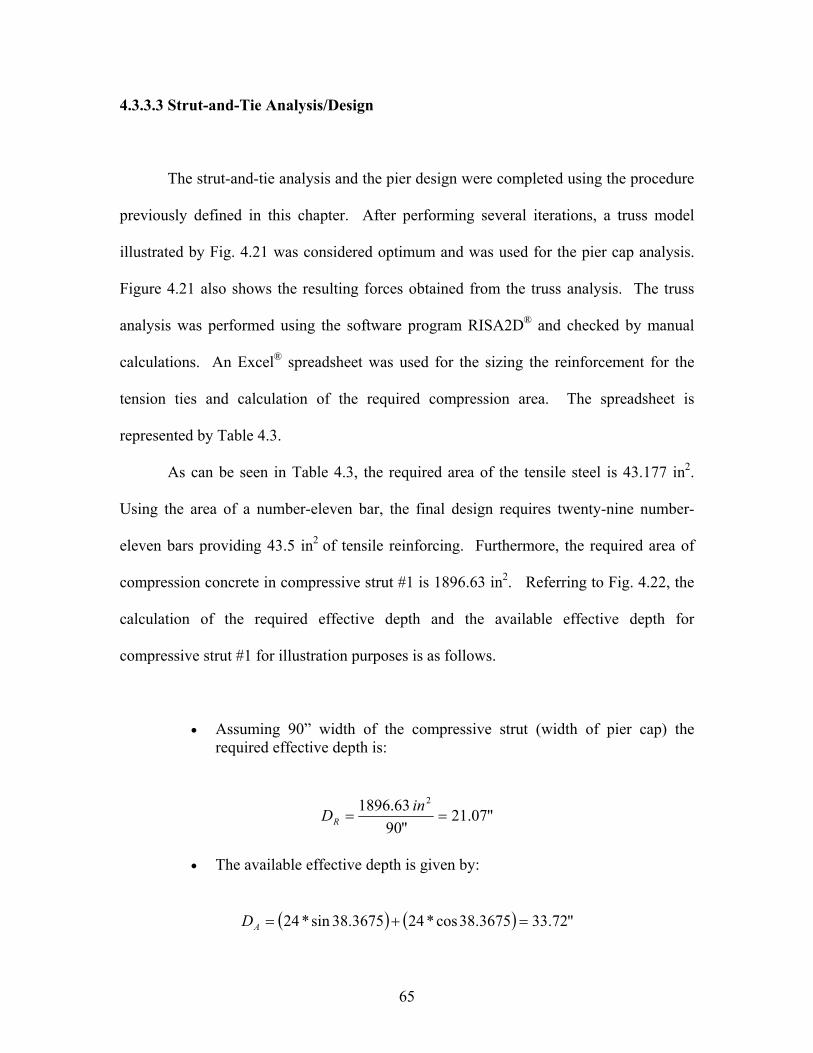
4.3.3.3 Strut-and-Tie Analysis/Design
The strut-and-tie analysis and the pier design were completed using the procedure
previously defined in this chapter. After performing several iterations, a truss model
illustrated by Fig. 4.21 was considered optimum and was used for the pier cap analysis.
Figure 4.21 also shows the resulting forces obtained from the truss analysis. The truss
analysis was performed using the software program RISA2D® and checked by manual
calculations. An Excel® spreadsheet was used for the sizing the reinforcement for the
tension ties and calculation of the required compression area. The spreadsheet is
represented by Table 4.3.
As can be seen in Table 4.3, the required area of the tensile steel is 43.177 in2.
Using the area of a number-eleven bar, the final design requires twenty-nine number-
eleven bars providing 43.5 in2 of tensile reinforcing. Furthermore, the required area of
compression concrete in compressive strut #1 is 1896.63 in2. Referring to Fig. 4.22, the
calculation of the required effective depth and the available effective depth for
compressive strut #1 for illustration purposes is as follows.
• Assuming 90” width of the compressive strut (width of pier cap) the required effective depth is:
"07.21"90
63.1896 2
==inDR
• The available effective depth is given by:
( ) ( ) "72.333675.38cos*243675.38sin*24 =+=AD
65
• Comparing DR and DA:
33.72” > 21.07” ∴ no reinforcing is required.
The final steps in completing the pier cap design is completing the shear design
and providing evenly distributed temperature steel. The amount of shear stirrups required
was double number-six shear stirrups spaced at five inches. Figure 4.23 shows the final
reinforcing details for the pier cap in the elevation view.
4.3.4 Shepherd Bridge Hammerhead Pier Design Example
4.3.4.1 Project Description
The Shepherd Bridge is located in Wheeling, West Virginia and spans the Big
Wheeling Creek River. The bridge is a replacement structure for a Whipple Truss
constructed in 1882 that is to remain in place due to historical considerations. The bridge
along with the new roadway alignment is to provide improved access to the neighboring
community. The structure is comprised of three spans totaling 202 feet: span 1 is 66.25
feet, span 2 is 67.5 feet, and span 3 is 66.25 feet. The superstructure consists of three
spread-box prestressed concrete beams that support an eight-inch deck and is illustrated
by Fig. 4.24 (bridge elevation) and Fig. 4.25 (typical section). The beams are supported
at the beginning of bridge bearing and end of bridge bearing by abutments that are
integral with the deck. The integral abutments are supported by pilings that are embedded
into bedrock. Additionally, the bridge utilizes two hammerhead piers as intermediate
66
supports. The piers are located in the Big Wheeling Creek River and have an overall
height of 38.092 feet are positioned on spread footings that are keyed into bedrock. The
ratio of the cantilever to width of column is for the pier is 0.5. Figure 4.26 shows the
dimensions of the pier and the reinforcing pattern provided by the original design.
4.3.4.2 Original Analysis/Design
The original design was conducted using the AASHTO Standard Specifications
and the live loading consisted of the HS-25 truck and lane load (the live load was
controlled by the lane load). Placing lane loads in different locations on the
superstructure generated multiple live load cases. A total of seven live load cases were
entered into the program, which included one and two lanes loaded. Other loads
considered to act on the pier cap were dead loads, buoyancy, wind loads, temperature,
and water pressure.
As with both the Barboursville Bridge and Shepherd Bridge, the original analysis
of the hammerhead pier was performed using the Georgia Pier Program (1984). The
original analysis yielded seven number-ten bars for the tension reinforcing in the pier cap.
Furthermore, the original design also specified number-five shear stirrups spaced at 6.75
inches. The final design of the pier is shown in Fig. 4.26.
67

4.3.4.3 Strut-and-Tie Analysis/Design
The strut-and-tie analysis and the pier design were completed using the procedure
previously defined in this chapter. After performing several iterations, a truss model
illustrated by Fig. 4.27 was considered optimum and was used for the pier cap analysis.
Figure 4.27 also shows the resulting forces obtained from the truss analysis. The truss
analysis was performed using the software program RISA2D® and checked by manual
calculations. An Excel® spreadsheet was used for the sizing the reinforcement for the
tension ties and calculation of the required compression area. The spreadsheet is
presented in Table 4.4.
As can be seen in Table 4.4, the required area of the tensile steel is 10.865 in2.
Using the area of a number-ten bar, the final design requires nine number-ten bars
providing 11.10 in2 of tensile reinforcing. Furthermore, the required area of compression
concrete in compressive strut #1 is 444.31 in2. Referring to Fig. 4.28, the calculation of
the required effective depth and the available effective depth for compressive strut #1 for
illustration purposes is as follows.
• Assuming 48” width of the compressive strut (width of pier cap) the required effective depth is:
"25.9"48
31.444 2
==inDR
• The available effective depth is given by:
( ) ( ) "88.50879.42cos*36879.42sin*36 =+=AD
68

• Comparing DR and DA:
50.88” > 9.25” ∴ no reinforcing is required.
The final steps in completing the pier cap design is completing the shear design
and providing evenly distributed temperature steel. The amount of shear stirrups required
was number-five shear stirrups spaced at 8.75 inches. Figure 4.29 shows the final
reinforcing details for the pier cap in the elevation view.
4.4 Discussion of Results
Consistently, for the case studies of this paper, the strut-and-tie model requires
more flexural steel than the traditional design procedures. As can be seen in Table 4.5,
the increase of the required flexural steel ranges from approximately 25 percent to
approximately 38 percent. A major contribution to the increase of required steel is due to
the concurrent application of the truck load and the lane load associated with the
AASHTO LRFD HL-93 loading. The Standard Specifications do not approach live load
generation in this manner, only allowing for one of the loads to be applied. The increase
in load will ultimately cause an increase in the required flexural steel.
The required amount of shear steel is not consistent as it pertains to the two
design methods. Table 4.5 illustrates the variance in the required amount of steel ranging
from approximately 53.0 percent to –23.0 percent. The negative value indicates that the
strut-and-tie model required less shear stirrups than the strength design method.
69
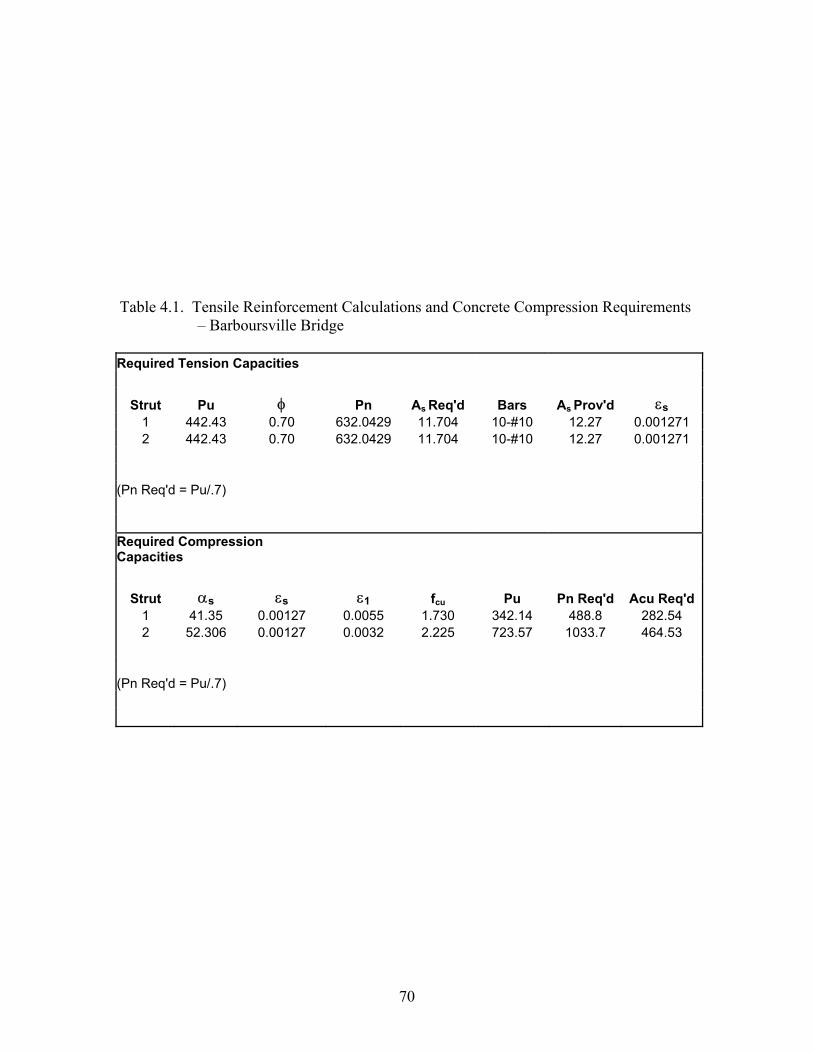
Table 4.1. Tensile Reinforcement Calculations and Concrete Compression Requirements
– Barboursville Bridge Required Tension Capacities
Strut Pu φ Pn As Req'd Bars As Prov'd εs 1 442.43 0.70 632.0429 11.704 10-#10 12.27 0.001271 2 442.43 0.70 632.0429 11.704 10-#10 12.27 0.001271
(Pn Req'd = Pu/.7)
Required Compression Capacities
Strut αs εs ε1 fcu Pu Pn Req'd Acu Req'd 1 41.35 0.00127 0.0055 1.730 342.14 488.8 282.54 2 52.306 0.00127 0.0032 2.225 723.57 1033.7 464.53
(Pn Req'd = Pu/.7)
70

Table 4.2. Tensile Reinforcement Calculations and Concrete Compression Requirements – South Madison Bridge
Required Tension Capacities
Strut Pu φ Pn As Req'd Bars As Prov'd εs 1 286 0.70 408.5714 7.566 6-#11 10.5 0.000939 2 286 0.70 408.5714 7.566 6-#11 10.5 0.000939
(Pn Req'd = Pu/.7)
Required Compression Capacities
Strut αs εs ε1 fcu Pu Pn Req'd Acu Req'd 1 42.0824 0.00094 0.0045 1.908 350.023 500.0 262.09 2 58.1092 0.00094 0.0021 2.602 540.329 771.9 296.70
(Pn Req'd = Pu/.7)
71

Table 4.3. Tensile Reinforcement Calculations and Concrete Compression Requirements
– Clear Fork Bridge
Required Tension Capacities
Strut Pu φ Pn As Req'd Bars As Prov'd εs
1 1632.095 0.70 2331.5643 43.177 29-#11 43.5 0.001294 2 1632.095 0.70 2331.5643 43.177 29-#11 43.5 0.001294
(Pn Req'd = Pu/.7)
Required Compression Capacities
Strut αs εs ε1 fcu Pu Pn Req'd Acu Req'd1 38.3675 0.00129 0.0065 1.568 2081.632 2973.8 1896.63 2 90 0.00129 0.0013 2.941 989.175 1413.1 480.43
(Pn Req'd = Pu/.7)
72

Table 4.4. Tensile Reinforcement Calculations and Concrete Compression Requirements – Shepherd Bridge
Required Tension Capacities
Strut Pu φ Pn As Req'd Bars As Prov'd εs 1 410.685 0.70 586.6929 10.865 9-#10 11.1 0.001282 2 410.685 0.70 586.6929 10.865 9-#10 11.1 0.001282
(Pn Req'd = Pu/.7)
Required Compression Capacities
Strut αs εs ε1 fcu Pu Pn Req'd Acu Req'd 1 42.879 0.00128 0.0051 1.802 560.437 800.6 444.31 2 68.962 0.00128 0.0018 2.726 129.154 184.5 67.68
(Pn Req'd = Pu/.7)
73

LFD DESIGN vs. Strut and Tie Design - South Madison Bridge
Area of Steel Required (in2/ft for shear) Specified Reinforcing Bars Percent Increase
Parameters LFD STM LFD STM
Tension Steel-cap 6.28 7.85 7 - #8 10 - #8 25.00%
Shear Steel-cap 0.755 1.178 D#[email protected]" D#6@9" 56.03%
LFD DESIGN vs. Strut and Tie Design - Barboursville Bridge
Area of Steel Required (in2/ft for shear) Specified Reinforcing Bars Percent Increase
Parameters LFD STM LFD STM
Tension Steel-cap 9.8175 12.27 8 - #10 10 - #10 24.98%
Shear Steel-cap 1.052 1.325 D#[email protected]" D#[email protected]" 25.95%
LFD DESIGN vs. Strut and Tie Design - Clear Fork Bridge
Area of Steel Required (in2/ft for shear) Specified Reinforcing Bars Percent Increase
Parameters LFD STM LFD STM
Tension Steel-cap 31.18 43.06 21 - #11 29 - #11 38.10%
Shear Steel-cap 2.65 2.12 D#6@4" D#6@5" -20.00%
LFD DESIGN vs. Strut and Tie Design - Shepherd Bridge
Area of Steel Required (in2/ft for shear) Specified Reinforcing Bars Percent Increase
Parameters LFD STM LFD STM
Tension Steel-cap 8.54 11.05 7 - #10 9 - #10 29.4%
Shear Steel-cap .552 .4485 D#[email protected] D#[email protected]" -23.00%
Table 4.5. Comparison between LFD and Strut-and-Tie Modeling Results
74

Figure 4.1. HL-93 Reaction calculation configuration
75

Figure 4.2. Illustration of Wheel Placement
76

Figure 4.3. Illustration of Lane Loading Placement
77

Compression
Figure 4.4 Steps for defining a truss model. (Collins and Mitchell, 1991)
78
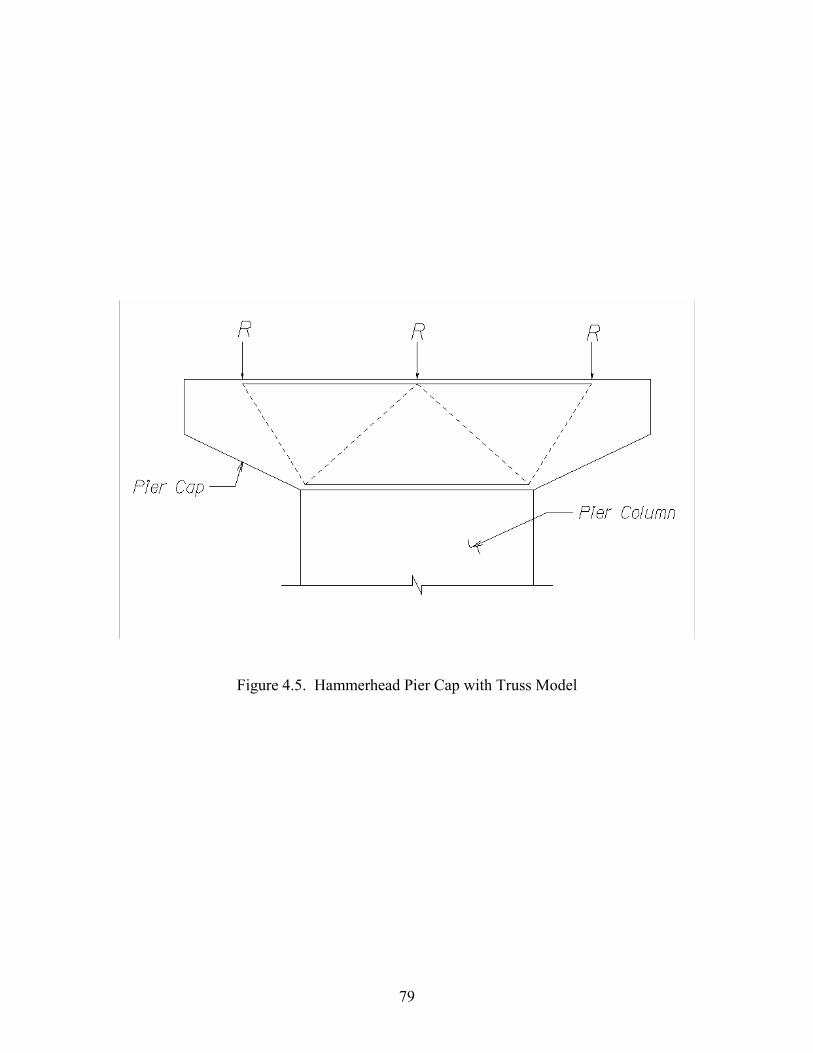
Figure 4.5. Hammerhead Pier Cap with Truss Model
79


Figure 4.7 Typical Section – Barboursville Bridge
81
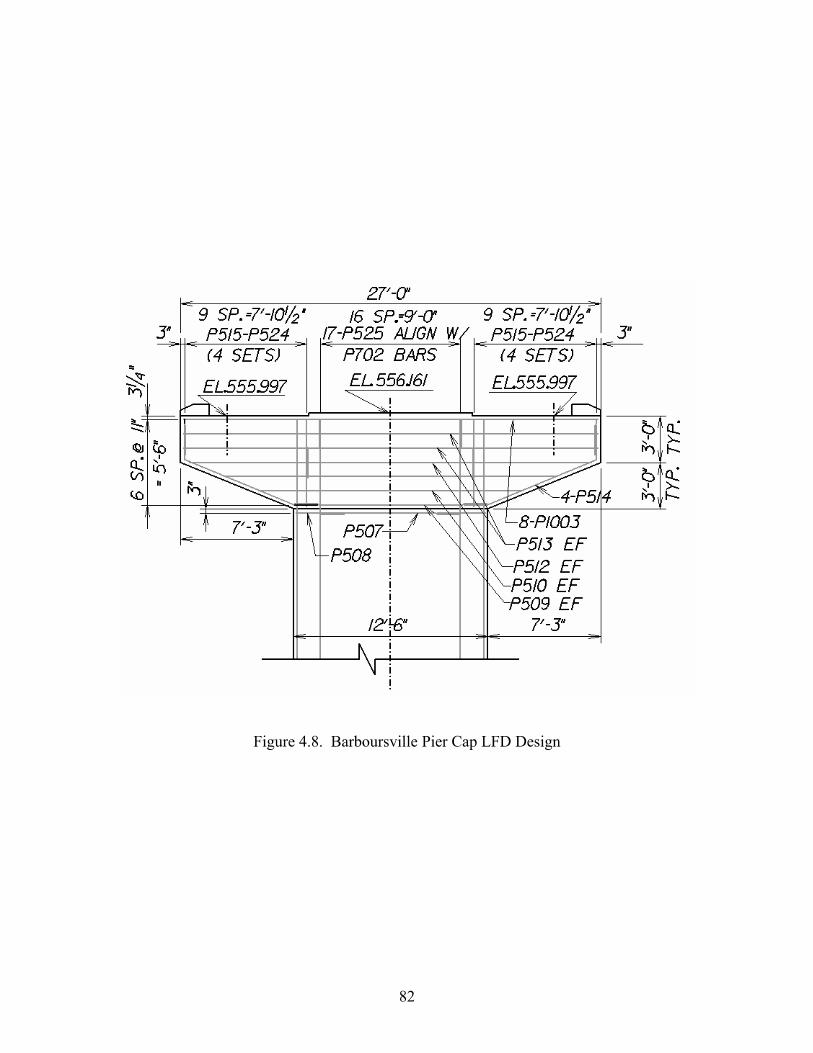
Figure 4.8. Barboursville Pier Cap LFD Design
82

Figure 4.9. Barboursville Truss Model Dimensions and Solutions
83
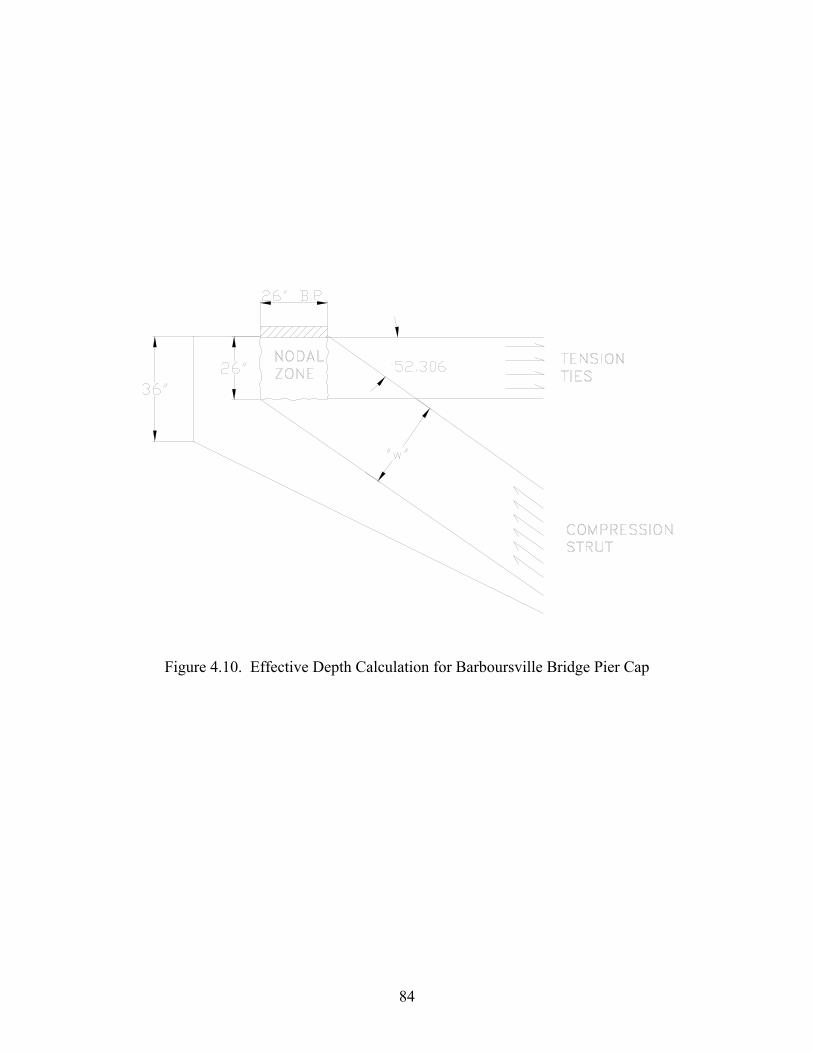
Figure 4.10. Effective Depth Calculation for Barboursville Bridge Pier Cap
84

Figure 4.11. Barboursville Bridge Strut-and-Tie Modeling Reinforcing Details
85


Figure 4.13 Typical Section – South Madison Bridge
87

Figure 4.14. South Madison Bridge Pier Cap LFD Design
88

Figure 4.15. South Madison Truss Model Dimensions and Solutions
89

Figure 4.16 Effective Depth Calculation for South Madison Bridge Pier Cap
90

Figure 4.17. South Madison Bridge Strut-and-Tie Modeling Reinforcing Details
91
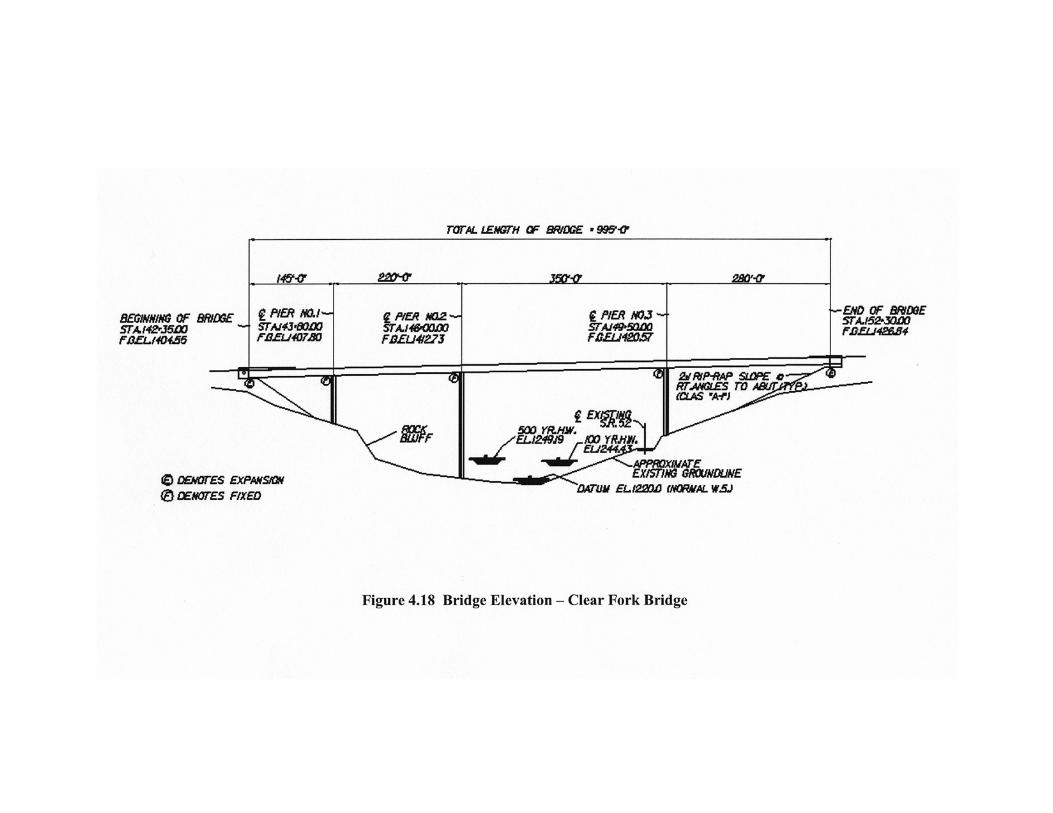

Figure 4.19 Typical Section – Clear Fork Bridge
93

Figure 4.20 Clear Fork Bridge Pier Cap LFD Design
94
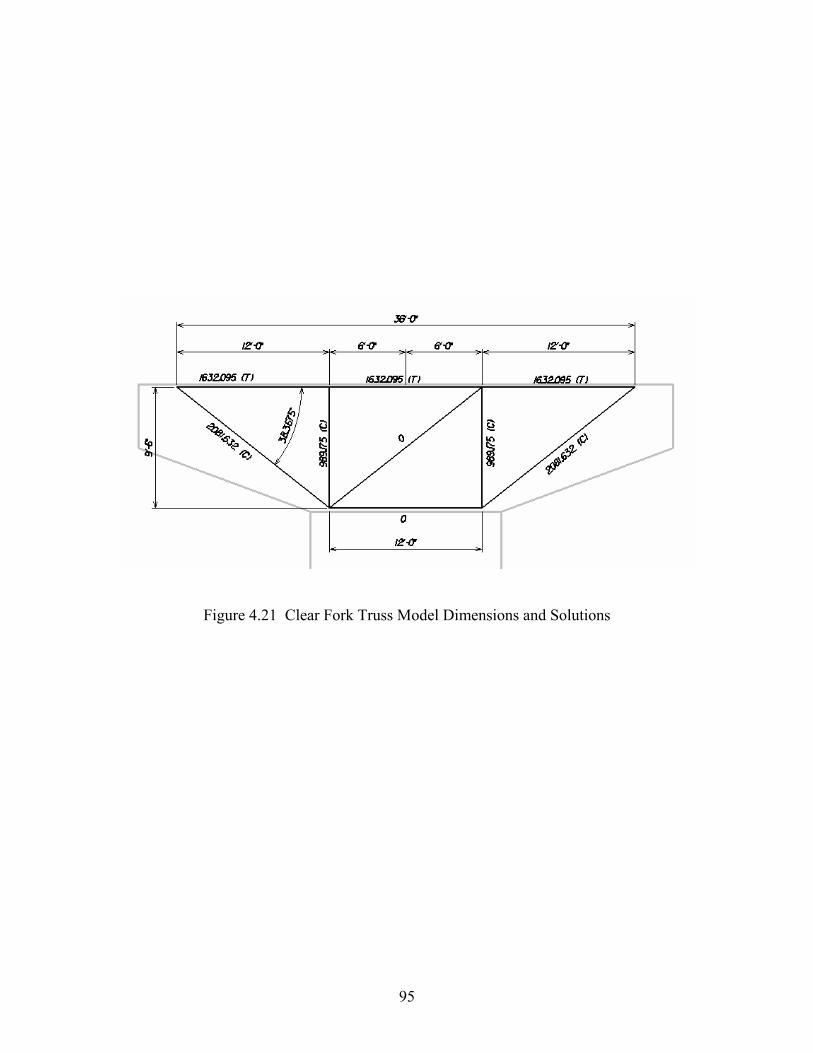
Figure 4.21 Clear Fork Truss Model Dimensions and Solutions
95
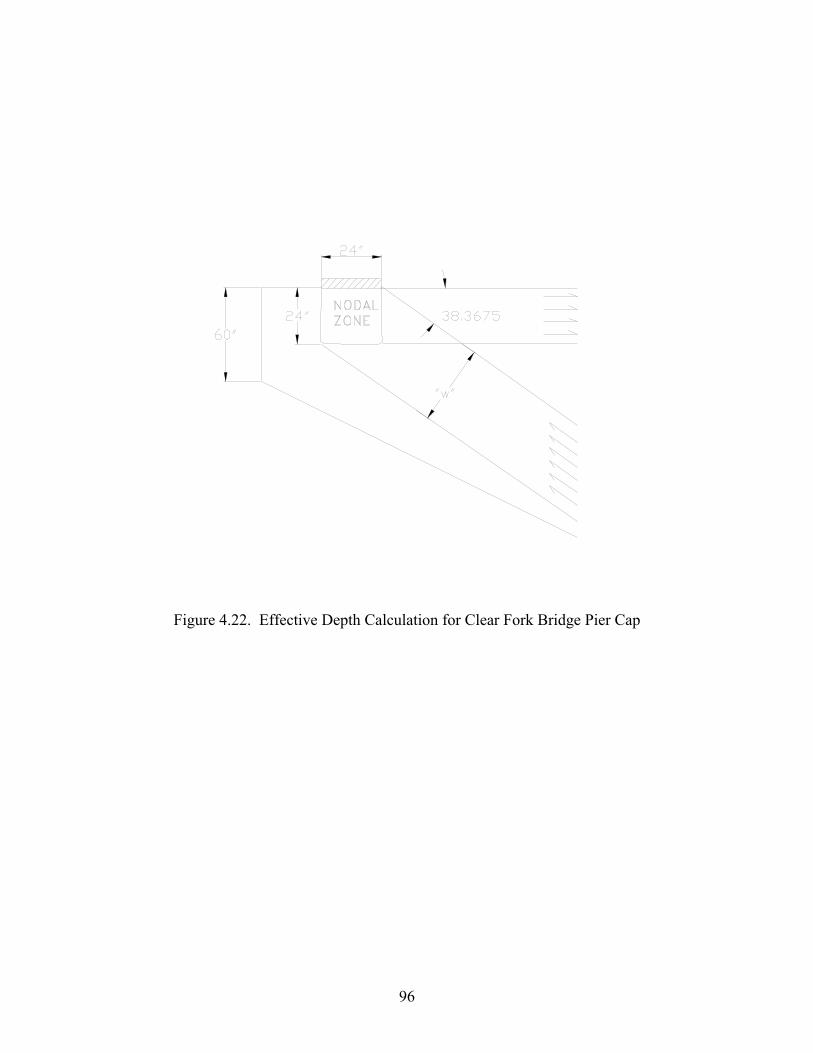
Figure 4.22. Effective Depth Calculation for Clear Fork Bridge Pier Cap
96

Figure 4.23 Clear Fork Bridge Strut-and-Tie Modeling Reinforcing Details
97
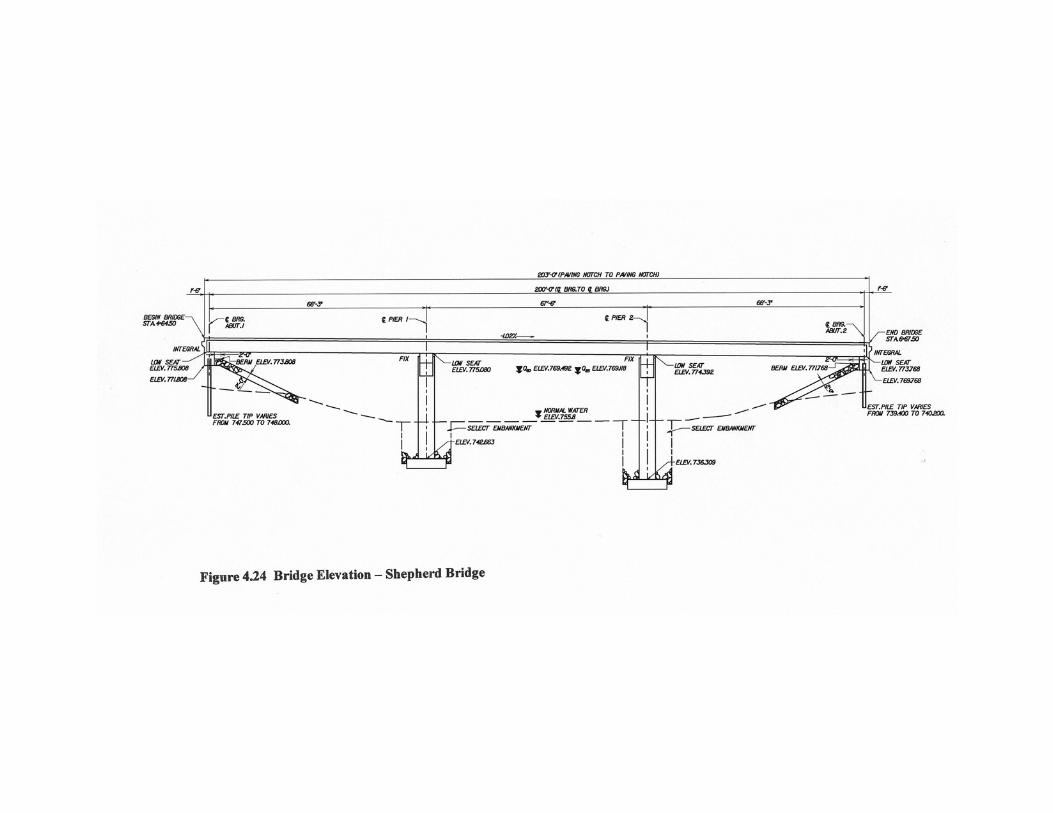
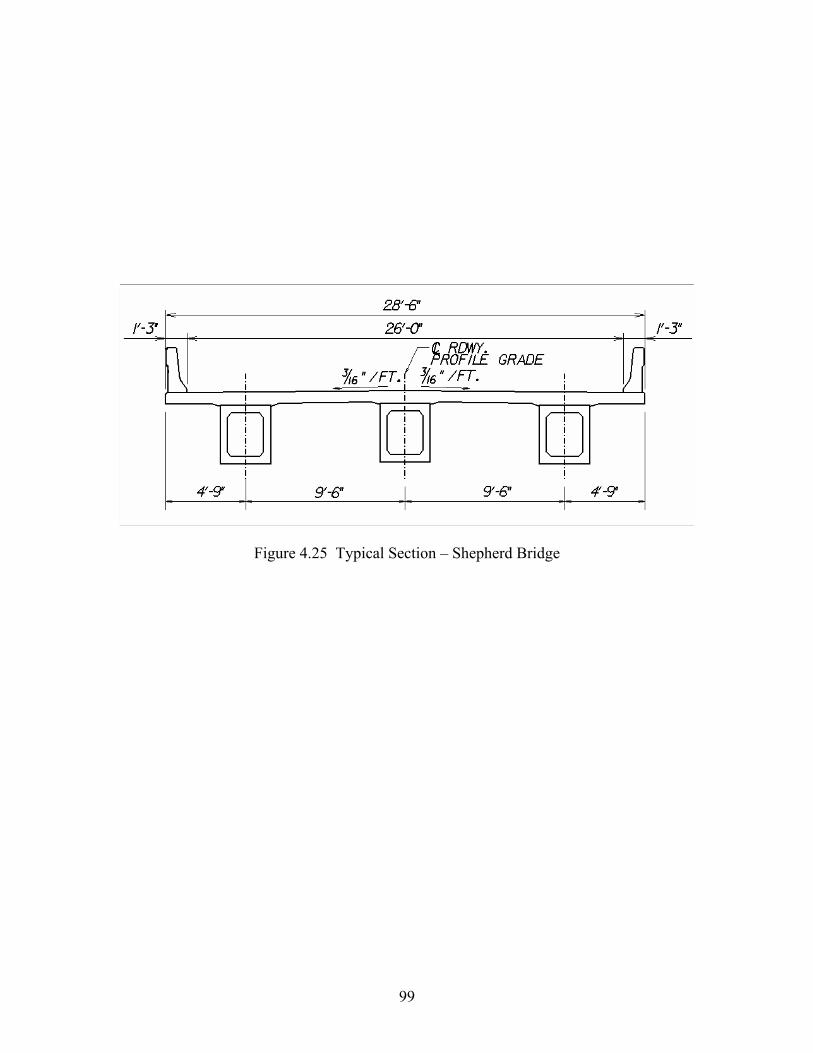
Figure 4.25 Typical Section – Shepherd Bridge
99

Figure 4.26. Shepherd Bridge Pier Cap LFD Design
100

Figure 4.27. Shepherd Bridge Truss Model Dimensions and Solutions
101

Figure 4.28 Effective Depth Calculation for Shepherd Bridge Pier Cap
102

Figure 4.29. Shepherd Bridge Strut-and-Tie Modeling Reinforcing Details
103
Chapter 5 DESIGN RECOMMENDATIONS
This chapter will address the differences in flexural and shear steel required by
the Standard Specifications and the LRFD Specifications. Additionally, this chapter
presents a concise procedure for the consistent design of hammerhead piers which
addresses load generation, truss model definition, truss element dimensioning, and shear
design.
5.1 Recommended Strut-and-Tie Design Procedure For Hammerhead Piers
5.1.1 Determination of Loads
The external loads acting on the pier at the nodal zone locations are the
superstructure dead load and live load reactions. Members contributing to the dead load
reactions are the beam, intermediate diaphragms, deck, pier diaphragm, parapet, and
future wearing surface. The dead load reactions should be calculated for the interior and
exterior beams separately due to the difference in effective slab widths. The live load
reactions should consist of the HL-93 defined by the AASHTO LRFD Specifications
(AASHTO, 1998). The live load reactions should be determined by considering the
104
structure to be continuous. When placing the truck component of the HL-93 live load, the
designer should place the second wheel directly over the pier to insure the maximum
reaction is achieved. In turn, the HL-93 reaction should be placed so that to induce the
maximum moment on the cantilever of the hammerhead pier. For the design study, the
maximum moment is produced by placing the truck component of the HL-93 reaction
two feet from the face of the curb or parapet. While the lane load component of the HL-
93 is placed at the face of the curb to produce the maximum moment. Additional
superstructure load configurations may control and should be considered when
applicable.
Furthermore, the load effects from water, wind, self-weight, and wind on the live
load should be considered when applicable. The pressure loads, as well as the self-
weight of the pier cap, are distributed evenly as point loads to each node by dividing the
total pressure load by the total number of nodes.
5.1.2 Defining the Truss Model
The first step in defining the truss is locating the nodal zones. The nodal zones
are defined where external loads, e.g. beam reactions, act on the pier cap and where the
stress is transferred from the cap to the column. The location of the stress path can be
assumed to be located where the reinforcing pattern transfers load from the cap to the
column.
The tension ties should be modeled at the predicted location of the tension
reinforcement while the compression struts represent the primary compressive stress and
105

should be defined accordingly. Both the tension ties and compression struts should begin
and terminate at the nodal zones. The final truss model should be represented by an
acceptable truss model and have the least number of tensile ties possible.
The geometry of the tension tie is determined by the location of the tensile
reinforcing pattern; therefore, care should be taken to insure that the final reinforcing
pattern represents the tensile tie location in the truss model. For example, if the flexural
reinforcing is assumed to be located three inches from the face of the concrete, then the
tension tie should be modeled at a depth of three inches. If the location of flexural steel
exceeds the three-inch depth, then the model should be resized based on the new centroid
of the reinforcing mat. The diameter of reinforcing bars used also dictates the depth of
the reinforcing centroid. Smaller reinforcing bars will normally produce a deeper
centroid due an increase in the layers required to accommodate the number of bars, while
the opposite occurs for larger diameter bars. However, care should be taken when
specifying the larger diameter bars due to violating flexural steel distribution to control
cracking.
5.1.3 Dimensioning of Tensile Ties, Compressive Struts, and Nodal Zones
The dimensioning of the compression strut, tension tie, and nodal zones are
governed by Articles 5.6.3.2 through 5.6.3.6 of the AASHTO LRFD Specifications and
were previously discussed in Section 3.3.
106

The nominal resistance of a tensile tie in a hammerhead pier cap should be
calculated using the following equation:
Pn = fy Ast (5-1)
Using Pn = Pu / φ and solving for Ast, the result of Eqn. 5-1 is the area of steel
required to resist the tensile load. The area of required reinforcing can then be used to
size rebar and calculate the spacing of rebar based on the requirements of AASHTO
LRFD Specifications (AASHTO, 1998).
The first step in determining the capacity of the compression struts is calculating
the limiting compressive stress, fcu:
cc
cu ff
f '85.01708.0'
1
≤+
=ε
(5-2)
where:
( ) sss αεεε 21 cot002.0++= (5-3)
Utilizing fcu found in Eqn. 5-3, the nominal resistance can be calculated
depending on the reinforcing pattern used in the hammerhead pier. For the unreinforced
compressive strut, AASHTO gives the following equation for the nominal resistance:
cscun AfP = (5-4)
107
Using Pn = Pu / φ and solving for Acs, the result of Eqn. 5-4 is the area of concrete
required to resist the compressive load.
AASHTO provides the following equation for the condition where the
compressive strut contains reinforcement that is parallel to the strut and detailed to
develop its yield stress in compression. For case where reinforcement is present, the
nominal resistance of the strut shall be taken as:
ssycscun AfAfP += (5-5)
Again, using Pn = Pu / φ and solving for Acs, the result of Eqn. 5-5 is the area of
concrete required to resist the compressive load. The value of the required Acs can then
be compared to the available Acs. The theory for the required and available compressive
strut areas were discussed in Section 3.3; however, the procedure for calculating the
compressive struts is as follows. Based on the calculated Acs required, a required
effective depth of the compressive strut is calculated as:
DR StruteCompressivWidth
Acs= (5-6)
The width and the depth of the nodal zone can be taken as the width of the
required bearing area (previously calculated in the superstructure design) (Oliva, 1997).
Using the smallest angle between the compressive strut and adjoining tension ties sα , the
available effective depth can be calculated as follows:
108
DA = (W * sin sα ) + (D * cos sα ) (5-7)
After the dimensioning of the tension ties and compression struts, the stress levels
of the nodal zones must be checked. AASHTO LRFD Specifications require the concrete
compressive stress in the node regions of the strut shall not exceed the following:
• For node regions bounded by compressive struts and bearing areas: φ85.0
cf '
• For node regions anchoring a one-direction tension tie: φ75.0 cf '
• For node regions anchoring tension ties in more than one direction:
φ65.0 cf '
By definition, the truss model does take into account shear and moment effects.
However, it is the opinion of the author that it would not be prudent to forgo the addition
of traditional shear stirrups. The shear design should be accomplished using a sectional
approach provided by AASHTO LRFD Article 5.8.3.3. Additionally, distributed steel
should be provided in accordance with State Transportation Department procedures and
AASHTO LRFD Specifications.
109
Chapter 6 SUMMARY AND CONCLUSIONS
6.1 Summary
Strut-and-tie modeling is an analysis and design tool for reinforced concrete
elements where a truss model represents the internal force paths. The truss model is
comprised of tensile ties, compressive struts, and nodal zones.
In the literature, Ritter (1899) and later Morsch (1920) conducted initial work on
the truss type analogy to model the internal load carrying mechanism in a reinforced
concrete beam. Kani et al. (1979) and Collins and Mitchell (1991) further developed
strut-and-tie modeling for individual reinforced concrete members such as deep
reinforced concrete members, prestressed concrete beams, and corbels. Realizing that if
strut-and-tie approach was valid for parts of a structure then it should be valid for the
entire structure, Schlaich et al. (1987) worked to combine individual research conducted
on various reinforced concrete elements in such a fashion that strut-and-tie modeling
could be used for the entire structure. Citing the inefficiency of the trial-and-error
iterative process that is based on the designer’s intuition and past experience, Liang, et al.
(2002) developed a topology optimization procedure for reinforced concrete design using
strut-and-tie modeling.
110

The goal of the State Transportation Department survey is to assess the level of
implementation of the AASHTO LRFD Specifications. The State Transportation
Department survey was sent to all fifty states with 48 percent of the states responding.
The results of the survey showed that the states are hesitant to implement the strut-and-tie
modeling method.
The design study presents a procedure for developing the strut-and-tie model for
hammerhead pier caps. The design procedure addresses the placement of the loads so as
to induce the maximum moment in the cantilever section of the hammerhead pier. The
design procedure also demonstrates the process for defining the tension ties, compression
struts, and nodal zones. In summary, the following steps are used for the design of
hammerhead pier caps by the strut-and-tie method.
• Determine the reactions of the superstructure based on the governing load
combination.
• Define all nodal zones at the beam reactions and the cap to column
reinforcing locations.
• Define the tension ties and compression struts from each nodal zone and at
depths equal to the approximate location of the reinforcing pattern.
• Check truss continuity at each nodal zone.
• Solve truss internal forces for tension ties and compression struts.
• Determine reinforcing requirements for tension ties and check
compressive strut regions.
• Check stress of nodal zones.
• Revise truss as required.
111
• Provide shear stirrups and distributed steel for the hammerhead pier cap.
Furthermore, the design study compares the reinforcing requirements of the
original (LFD) design with the results obtained in the strut-and-tie modeling method
(based on LRFD). Based on the results of the design study and the procedure used in the
modeling, recommendations are proposed for employing the strut-and-tie model to
hammerhead piers. The recommendations include the revising of the truss model
geometry, treatment of reinforcing bars and crack control, the repeating of truss model
geometry, and the use of shear stirrups.
6.2 Conclusions
The AASHTO LRFD Design Code states in Section 5.6.3.1 “The strut-and-tie
model should be considered for the design of deep footings and pile caps or other
situations in which the distance between the centers of applied load and the supporting
reactions is less than about twice the member thickness.” The commentary further
elaborates on the use of strut-and-tie models by pointing out the shortcomings of
traditional design theory. Traditional design theory assumes that the shear distribution
remains uniform and that the longitudinal strains will vary linearly over the depth of the
beam. Furthermore, traditional design theory does not account for shear, moment, and
torsional interaction, which the strut-and-tie model does take into account (AASHTO,
1998).
112

The LRFD Specifications promote the strut-and-tie method as the design method
of choice for deep reinforced concrete sections. However, no one has undertaken the task
of developing a consistent approach to the design of hammerhead pier caps employing
the strut-and-tie modeling method. The State Transportation Department survey supports
the need for a design procedure for strut-and-tie modeling due to the reluctance of the
majority of the states to implement the LRFD Code for substructure design.
The specific objectives of the study are to compare the reinforcing requirements
of the strength design method (AASHTO LFD) for flexure and shear design with the
strut-and-tie modeling method; ascertain the degree of strut-and-tie modeling
implementation in State Transportation Departments; and to develop a procedure for
modeling a hammerhead pier cap that can be applied by practicing engineers. This work
presents a clear and concise procedure for utilizing the strut-and-tie model for the
analysis and design of hammerhead piers. As was stated in section 4.5, an increase in
tensile reinforcing was incurred by the LRFD strut-and-tie procedure. However, even
though it was specified, shear reinforcing is implicitly not required. The strut-and-tie
model design study results establish the method as a viable analysis and design tool in the
design of hammerhead piers.
113
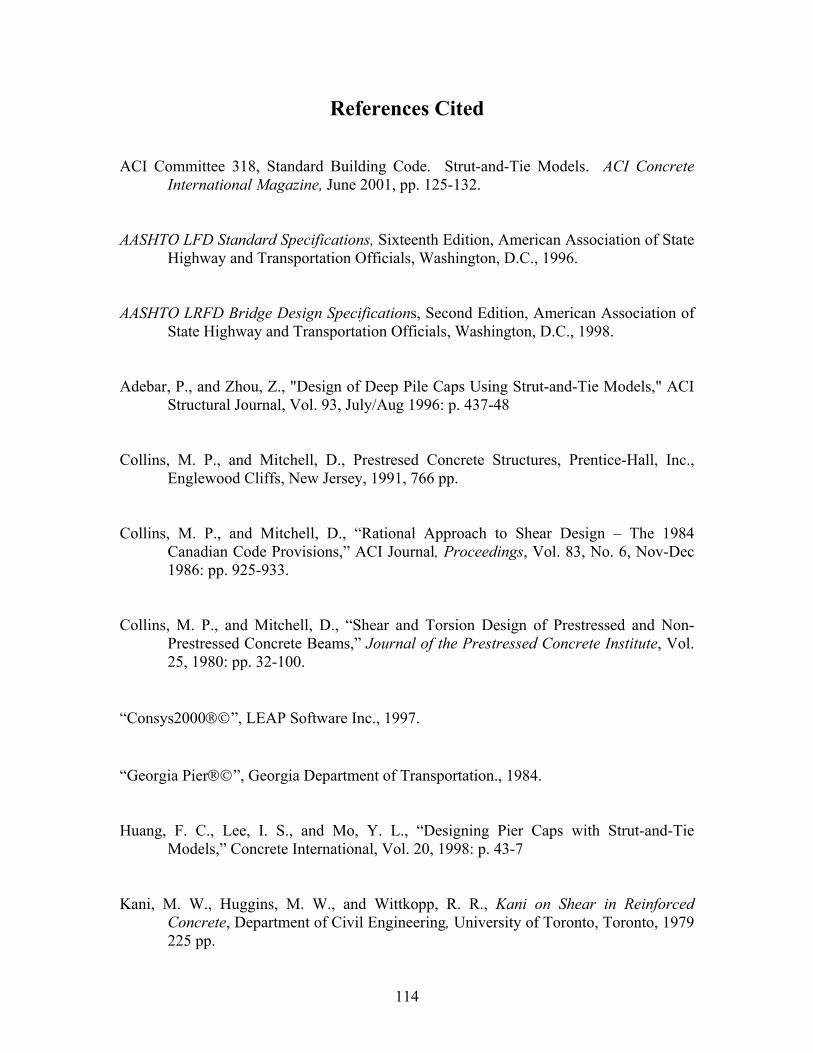
References Cited ACI Committee 318, Standard Building Code. Strut-and-Tie Models. ACI Concrete
International Magazine, June 2001, pp. 125-132.
AASHTO LFD Standard Specifications, Sixteenth Edition, American Association of State Highway and Transportation Officials, Washington, D.C., 1996.
AASHTO LRFD Bridge Design Specifications, Second Edition, American Association of State Highway and Transportation Officials, Washington, D.C., 1998.
Adebar, P., and Zhou, Z., "Design of Deep Pile Caps Using Strut-and-Tie Models," ACI Structural Journal, Vol. 93, July/Aug 1996: p. 437-48
Collins, M. P., and Mitchell, D., Prestresed Concrete Structures, Prentice-Hall, Inc., Englewood Cliffs, New Jersey, 1991, 766 pp.
Collins, M. P., and Mitchell, D., “Rational Approach to Shear Design – The 1984 Canadian Code Provisions,” ACI Journal, Proceedings, Vol. 83, No. 6, Nov-Dec 1986: pp. 925-933.
Collins, M. P., and Mitchell, D., “Shear and Torsion Design of Prestressed and Non-Prestressed Concrete Beams,” Journal of the Prestressed Concrete Institute, Vol. 25, 1980: pp. 32-100.
“Consys2000”, LEAP Software Inc., 1997.
“Georgia Pier”, Georgia Department of Transportation., 1984. Huang, F. C., Lee, I. S., and Mo, Y. L., “Designing Pier Caps with Strut-and-Tie
Models,” Concrete International, Vol. 20, 1998: p. 43-7
Kani, M. W., Huggins, M. W., and Wittkopp, R. R., Kani on Shear in Reinforced Concrete, Department of Civil Engineering, University of Toronto, Toronto, 1979 225 pp.
114

Kuchma, D.A. and Tjhin, T. N., “Design of Discontinuity Regions in Structural Concrete Using a Computer-Based Strut-and-Tie Methodology,” TRB Session Committee on Concrete Bridges, Nov 2001.
Liang, Q. Q, Uy, B., and Steven, G.P, “Performance-Based Optimization for Strut-Tie Modeling of Structural Concrete,” Journal of Structural Engineering Vol. 128 June 2002: pp. 815-823.
MacGregor, J. G., and ACI Committee 318E (Shear and Torsion), Appendix X and CE49: Strut-and-Tie Models, draft of code and commentary to be considered for 2002 ACI Building Code, June, 2000, approx. 30 pp.
MacGregor, J. G., Reinforced Concrete: Mechanics and Design, Prentice-Hall, Inc., Englewood Cliffs, New Jersey, 3rd ed., 1997, 939 pp.
Marti, P., "Basic Tools of Reinforced Concrete Beam Design," ACI Journal, Proceedings, Vol. 82, No. 1, January-February 1985, pp. 45-56.
“Microsoft Excel”, Microsoft Corporation, 1987-1999. Morcsh, E., Der Eisenbetonbau-Seine Theorie und Anwendung (Reinforced Concrete
Construction-Theory and Application), 5th Ed., Wittwer, Stutgart, V.1, Part 1, 1920, Part 2, 1922.
Oliva, M., “Hammerhead Pier Design Using the Strut-and-Tie Modeling Method,” Training for Wisconsin Department of Transportation, 1997.
“RISA2D”, RISA Technologies, 1999. Ritter, W., “The Hennebique Design Method (Die Bauweise Hennebique),”
Schweizerische Bauzeitung (Zurich), Vol. 33, No. 7, Feb 1899, pp. 59-61.
115

Schlaich, J., Schäfer, K., and Jennewein, M., "Toward a Consistent Design of Structural Concrete," Journal of the Prestressed Concrete Institute, Vol. 32, No. 3, May-June 1987, pp. 74-150.
Yun Y. M., and Ramirez, J. A., “Strength of struts and nodes in strut-tie model,” Journal of Structural Engineering Vol. 122 Jan 1996: p. 20-9.
116

APPENDIX A
STATE DEPARTMENT OF TRANSPORTATION SURVEY
117

Please allow me to introduce myself, my name is Thomas Nicholas and I was a
bridge engineer with the West Virginia Department of Highways. I am currently an
instructor at Fairmont State College and a graduate student at West Virginia University. I
am doing a study on the use of strut and tie modeling as it pertains to bridge
substructures. It would be highly appreciated if I could ask for a moment of your time to
answer a few questions and provide some information on how pier design is approached
in your state.
1. Is your state currently using the AASHTO LRFD Design code, and if
so, is the strut and tie analysis and design procedure being used for the
design of bridge pier caps?
2. If the strut and tie procedure is currently not being employed, what
design procedure is being used to design the bridge pier caps?
3. In addition to the two questions above, if you have a pier cap designed
by strut and tie modeling could you please send a copy of the design
calculations, a copy of the construction plans, and a copy of
construction plans for an LFD Designed pier to the address below.
4. Any further information you could provide on the design of bridge pier
caps in your state would be most helpful.
118

Again, I would like to thank you for donating your valuable time in taking part in
this study.
Sincerely, Thomas Nicholas II
119

APPENDIX B
NOMENCLATURE
120
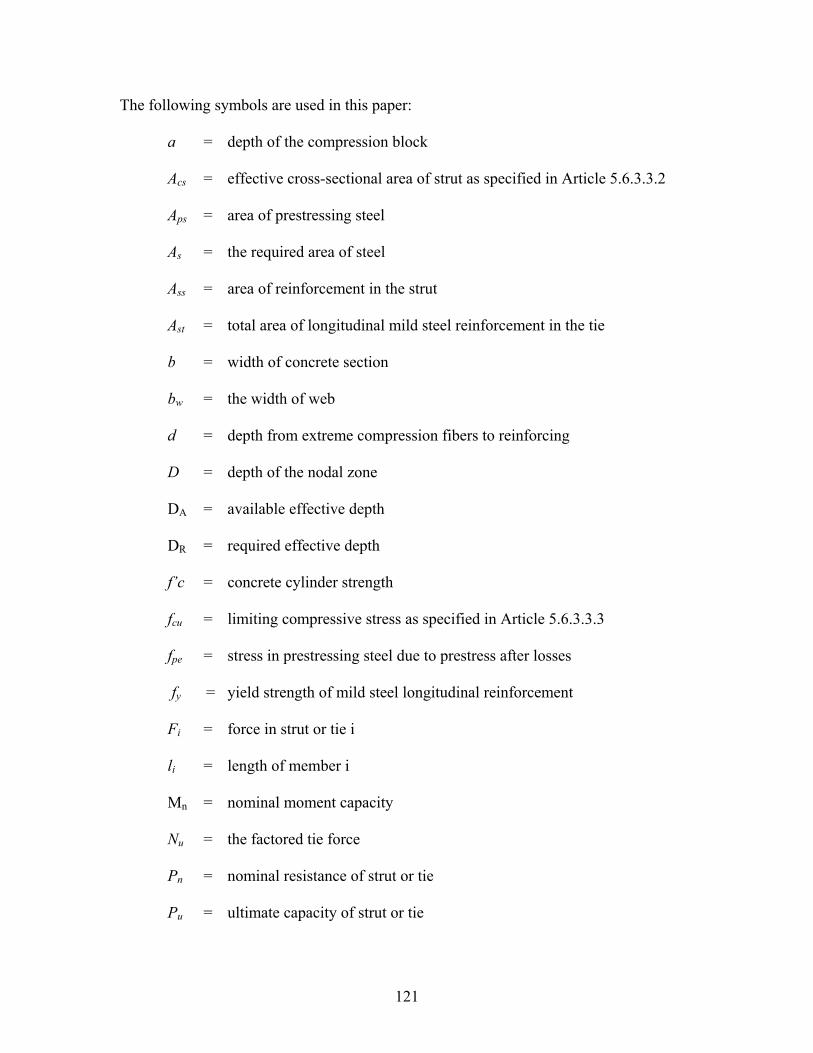
The following symbols are used in this paper:
a = depth of the compression block
Acs = effective cross-sectional area of strut as specified in Article 5.6.3.3.2
Aps = area of prestressing steel
As = the required area of steel
Ass = area of reinforcement in the strut
Ast = total area of longitudinal mild steel reinforcement in the tie
b = width of concrete section
bw = the width of web
d = depth from extreme compression fibers to reinforcing
D = depth of the nodal zone
DA = available effective depth
DR = required effective depth
f’c = concrete cylinder strength
fcu = limiting compressive stress as specified in Article 5.6.3.3.3
fpe = stress in prestressing steel due to prestress after losses
fy = yield strength of mild steel longitudinal reinforcement
Fi = force in strut or tie i
li = length of member i
Mn = nominal moment capacity
Nu = the factored tie force
Pn = nominal resistance of strut or tie
Pu = ultimate capacity of strut or tie
121

Vc = the nominal shear strength provided by the concrete
Vn = the nominal shear strength
Vu = the factored shear force at the section considered
W = width of the nodal zone
sα = the smallest angle between the compressive strut and adjoining tension
ties (deg)
βs = 1.00 for prismatic struts in uncracked compression zones
βs = 0.40 for struts in tension members
βs = 0.75 when struts may be bottle shaped and crack control reinforcement
is included
βs = 0.60 when struts may be bottle shaped and crack control reinforcement
is not included
βs = 0.60 for all other cases
βn = when nodes are bounded by struts and/or bearing areas βn = 0.80 when nodes anchor only one tie βn = 0.60 when nodes anchor more than one tie
єmi = mean strain of member i
sε = the tensile strain in the concrete in the direction of the tension tie (in/in)
γi = angle between the axis of a strut and the bars
φ = resistance factor
ρ = the reinforcement ratio
bρ = the balanced reinforcement ratio
ρvi = steel ratio of the i-th layer of reinforcement crossing that strut
122