evaluation of the 2003 population census data the gambia by mr. alieu sarr presented at the un...
TRANSCRIPT
EVALUATION OF THE 2003 POPULATION CENSUS DATA
THE GAMBIA
BY MR. ALIEU SARR
PRESENTED AT THE UN REGIONAL WORKSHOP ON CENSUS EVALUATION AND POST-ENUMERATION SURVEYS, ADDIS ABABA,
ETHIOPIA, 14TH – 18TH SEPTEMBER 2009
EVALUATION OF AGE
Age misreporting is a common phenomenon in African censuses
This may be due to Ignorance of actual age; Deliberate attempt to increase or decrease age for
one reason or the other
Why evaluate the quality of age reporting?
1. To establish the consistency of the data.2. Reveal past trends in fertility.3. Identify errors in reported ages.4. Determine the effects of migration on age structure.
EVALUATION OF AGE (cont.)Indices of Evaluating Age and Sex:Sex Ratios: The larger the departure of the
Sex Ratio from 100 the larger the possibility of errors in the data.
Age Ratios: All Age Ratios should be closed to 100 where fertility has not fluctuated a lot during the past and international migration has not been significant.
Age-sex Accuracy index:
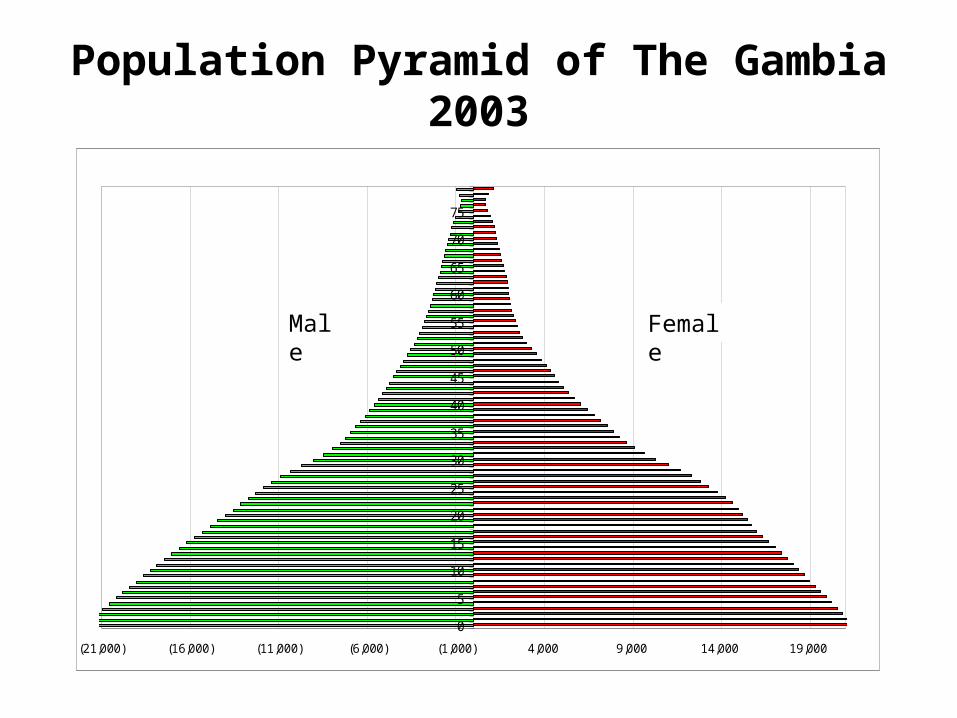
Population Pyramid of The Gambia 2003
(21,000) (16,000) (11,000) (6,000) (1,000) 4,000 9,000 14,000 19,000
0
5
10
15
20
25
30
35
40
45
50
55
60
65
70
75
Male Female
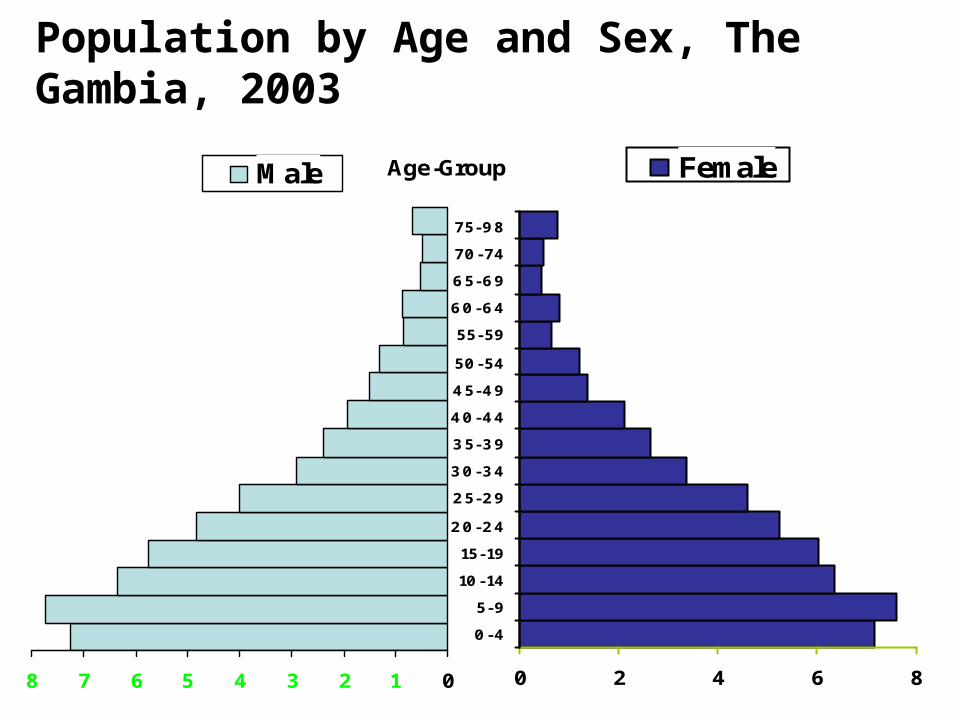
Population by Age and Sex, The Gambia, 2003
8 7 6 5 4 3 2 1 0
Male
0 2 4 6 8
0-4
5-9
10-14
15-19
20-24
25-29
30-34
35-39
40-44
45-49
50-54
55-59
60-64
65-69
70-74
75-98
Age-Group Female
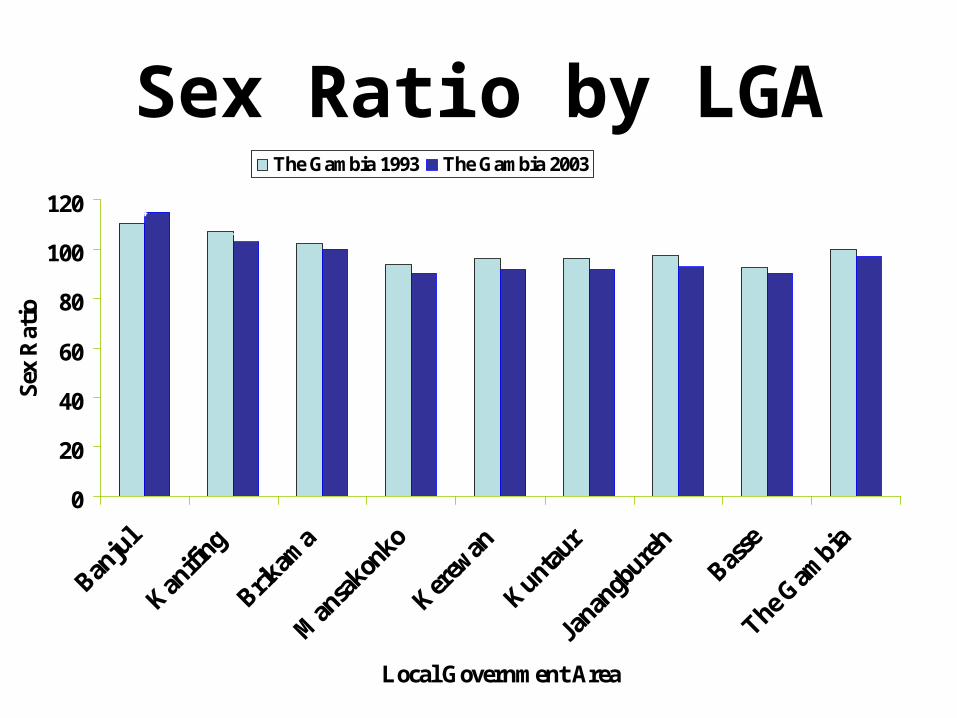
Sex Ratio by LGA110.4
107.1102.5
93.9 96.1 96.6 97.592.5
99.9
115.1
103.1100.1
90.1 91.8 91.8 92.9 90.297.1
0
20
40
60
80
100
120
Banju
l
Kanifi
ng
Brikam
a
Man
sakon
ko
Kerew
an
Kuntaur
Janan
gbure
hBas
se
The Gam
bia
Local Government Area
Sex
Rat
io
The Gambia 1993 The Gambia 2003
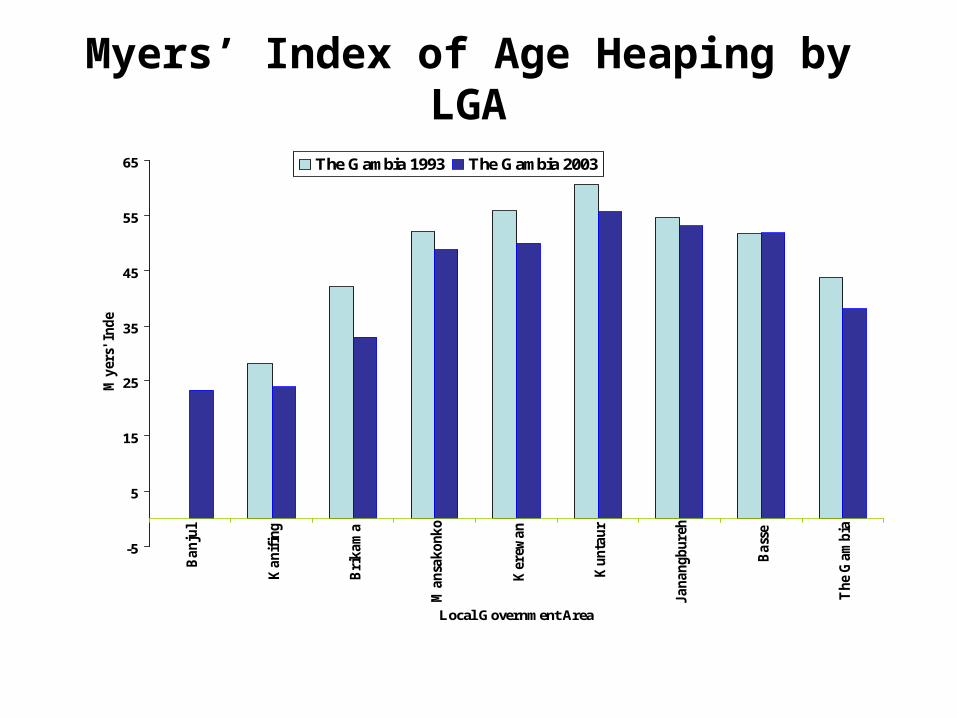
Myers’ Index of Age Heaping by LGA
28.2
42.1
52.1
55.8
60.7
54.7
51.7
43.8
23.4 23.9
33
48.850
55.7
53.151.9
38.1
-5
5
15
25
35
45
55
65
Ba
nju
l
Ka
nif
ing
Bri
ka
ma
Ma
nsa
ko
nk
o
Ker
ewa
n
Ku
nta
ur
Ja
na
ng
bu
reh
Ba
sse
Th
e G
am
bia
Local Government Area
My
ers'
In
dex
The Gambia 1993 The Gambia 2003

Index Reported, 1993 Census
Reported, 2003 Census
Sex ratio score 15.5 9.4
Male age ratio score
10.6 8.8
Female age ratio score
22.4 15.9
Accuracy index 79.4 52.9
Summary of Indices Measuring the Accuracy of Data, 1993 and 2003 Censuses, The Gambia
The UN defines the values of the index as follows:
< 20 Accurate, 20-40 Inaccurate, 40 + highly inaccurate

Key Findings• Sex-ratio in urban areas is above 100, whilst that
of rural areas is below 100
• Under-reporting of under-five population
• Age data are relatively more accurate in urban than in rural areas
• Age data for males are relatively more accurate than that of females
• Age-sex data in 2003 is relatively more accurate than that of 1993
• Level of accuracy of age data below recommended standards
Correction of Age Misreporting
Methods of Smoothing Age Misreporting;
• Smoothing without modifying the totals of each age-group
• Smoothing modifying the totals of each age-group
• Smoothing of age structure can be done using spreadsheets such as; SINAGE, AGESEX and AGESMTH

Figure 2.2a: Reported and Smoothed Male Population by Age, 2003 Census
0
20,000
40,000
60,000
80,000
100,000
120,000
0-4 5-9 10-14 15-19 20-24 25-29 30-34 35-39 40-44 45-49 50-54 55-59 60-64 65-69 70-74 75-79
Age
Reported CF K.-King N Male Arriaga U N Strong
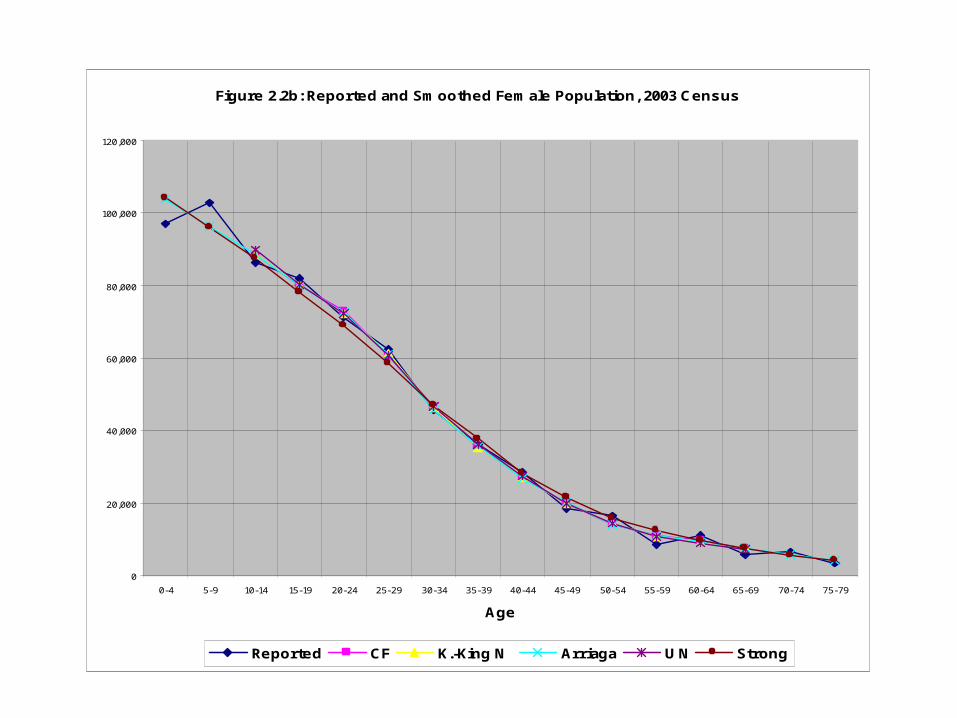
Figure 2.2b: Reported and Smoothed Female Population, 2003 Census
0
20,000
40,000
60,000
80,000
100,000
120,000
0-4 5-9 10-14 15-19 20-24 25-29 30-34 35-39 40-44 45-49 50-54 55-59 60-64 65-69 70-74 75-79
Age
Reported CF K.-King N Arriaga U N Strong
Evaluation of Data on Children Ever Born
Questions Asked to Determine Parity for Females aged 12 years and Over:
• Of the children ever born alive to you, how many are living in this household?
• Of the children ever born alive to you, how many are living elsewhere?
• Of the children ever born alive to you, how many have died?
Evaluation of Data on Children Ever Born (cont.)
How do we evaluate the data on children ever born?
• Average parities should increase by age of women. Average parities for the 2003 census progressively increased with age of women showing some consistency in the data.
• When parity not stated is less than 5 per cent, they can either be ignored or added to the denominator since their inclusion or exclusion will not affect the estimates. The parity ‘’not stated’’ for the 2003 Census data was 2.5 per cent.
• Coale-Demeny and Brass empirical formulae to compare the results with the average parity for women 45-49 or P7. If the average parity for women 45-49 is lower than that estimated from the empirical formulae, then this can be an indication that there was under-reporting or omissions of children for women 45-49 years.
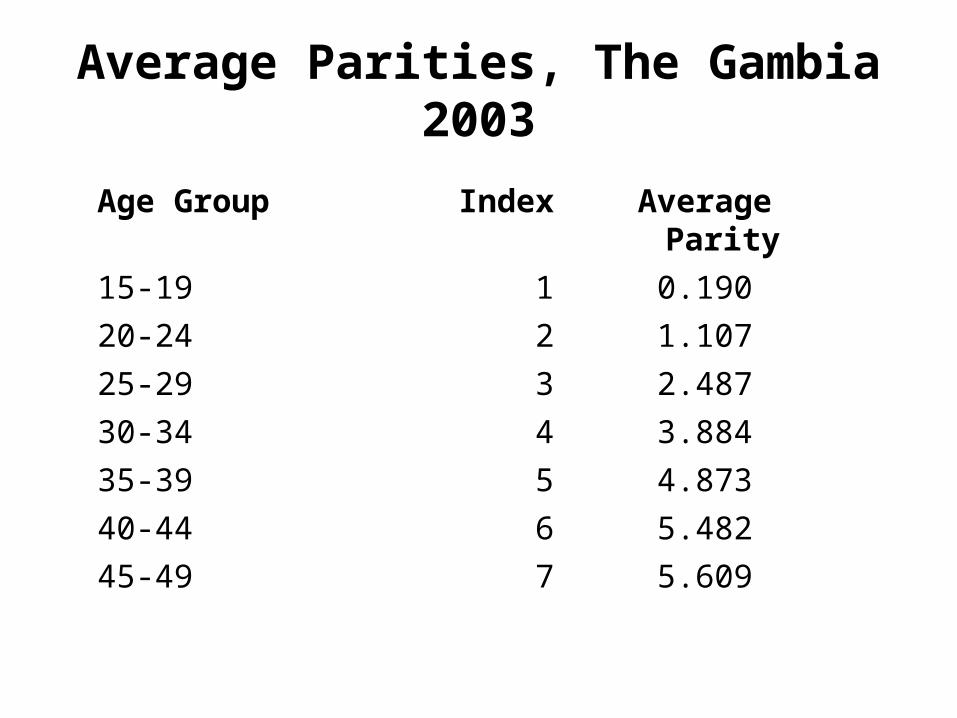
Average Parities, The Gambia 2003
Age Group Index Average Parity
15-19 1 0.190
20-24 2 1.107
25-29 3 2.487
30-34 4 3.884
35-39 5 4.873
40-44 6 5.482
45-49 7 5.609
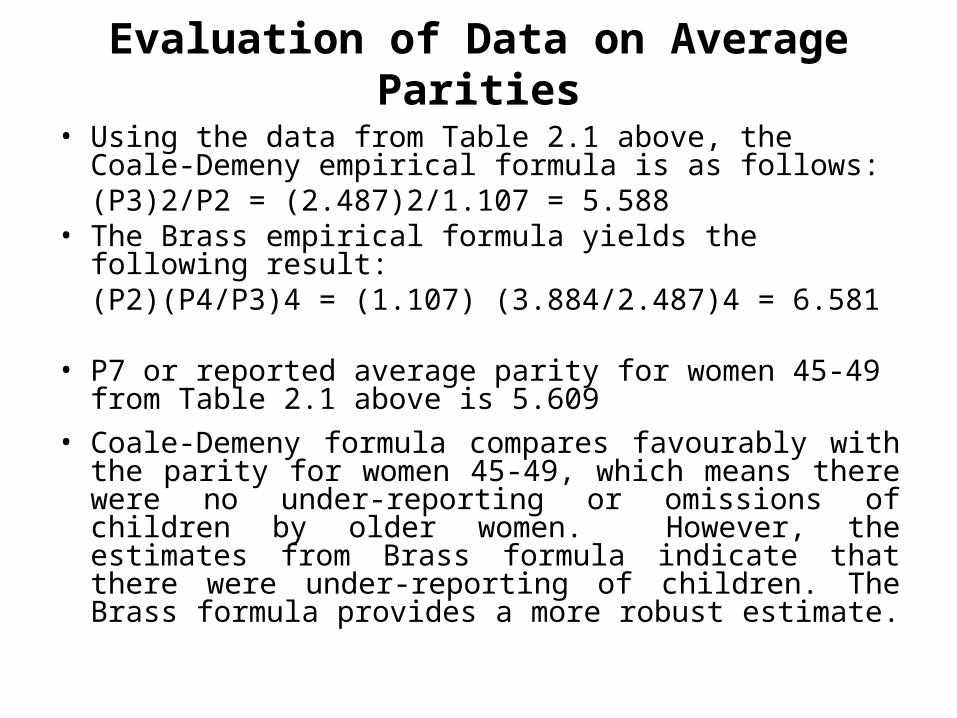
Evaluation of Data on Average Parities
• Using the data from Table 2.1 above, the Coale-Demeny empirical formula is as follows:(P3)2/P2 = (2.487)2/1.107 = 5.588
• The Brass empirical formula yields the following result:(P2)(P4/P3)4 = (1.107) (3.884/2.487)4 = 6.581
• P7 or reported average parity for women 45-49 from Table 2.1 above is 5.609
• Coale-Demeny formula compares favourably with the parity for women 45-49, which means there were no under-reporting or omissions of children by older women. However, the estimates from Brass formula indicate that there were under-reporting of children. The Brass formula provides a more robust estimate.

Evaluation of Data on Average Parities (cont.)
• Evaluation of data on children born during the year preceding the census showed some inconsistencies in the data with an over-reporting of births in the year preceding the census.
General Conclusion:
• There has been a general under-reporting of children of women in the older ages.

Deaths in the Year Preceding the Census
Methods of Evaluation Data:
• Growth Balance Method developed by Brass
• Preston-Coale (PRECOA)
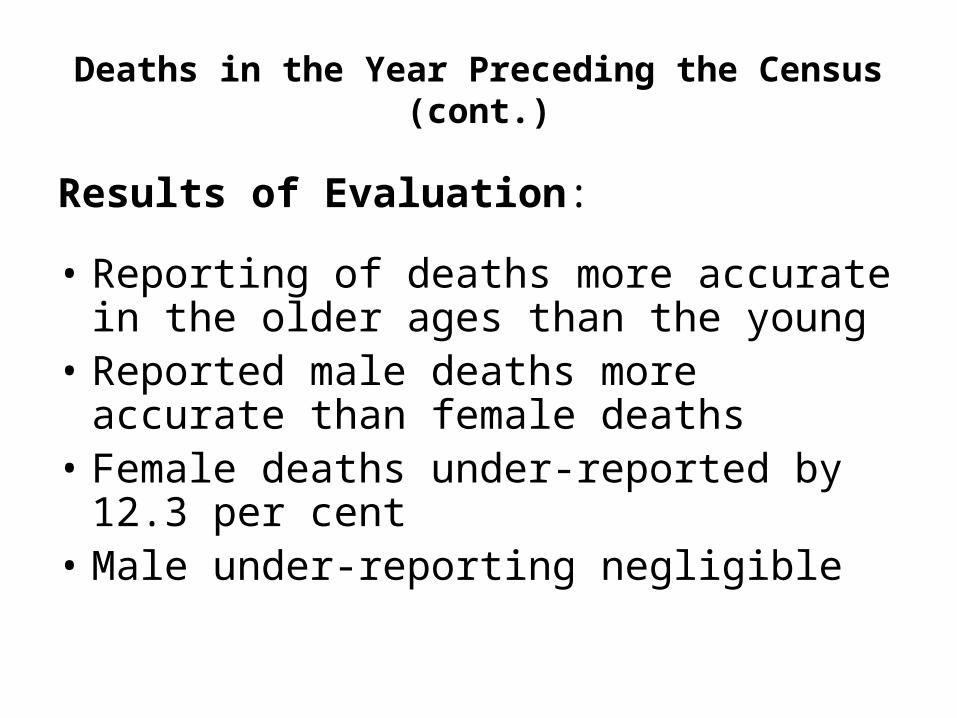
Deaths in the Year Preceding the Census (cont.)
Results of Evaluation:
• Reporting of deaths more accurate in the older ages than the young
• Reported male deaths more accurate than female deaths
• Female deaths under-reported by 12.3 per cent
• Male under-reporting negligible
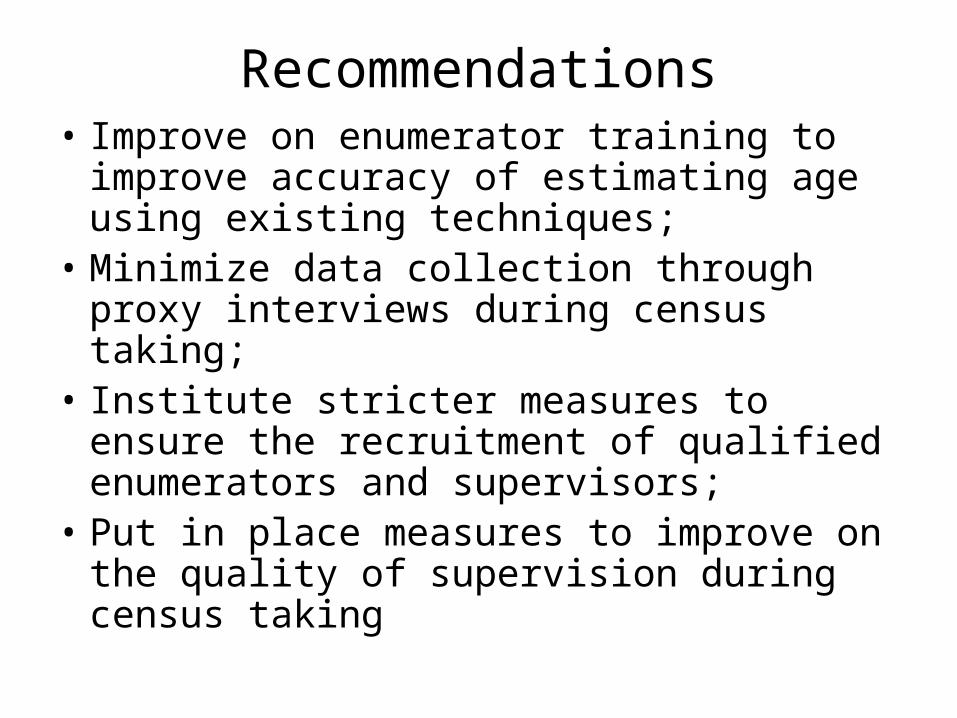
Recommendations• Improve on enumerator training to improve
accuracy of estimating age using existing techniques;
• Minimize data collection through proxy interviews during census taking;
• Institute stricter measures to ensure the recruitment of qualified enumerators and supervisors;
• Put in place measures to improve on the quality of supervision during census taking

Thank you for the attention.