evaluation of the austrian industrial research promotion fund (fff
TRANSCRIPT
Evaluation of the Austrian Industrial Research Promotion Fund (FFF) and the Austrian Science Fund (FWF)
Background report 3.1.2
FFF: Internal functioning and customer satisfaction
Leonhard Jörg (Technopolis) Rahel Falk (WIFO)
March 2004

2
Introduction Background report 3 describes and assesses the internal functioning of FFF and the perception of FFF from customers’ point of view. The aim is twofold: Observed good practice should be identified to help learn from successes and to maintain high standards for the future. Observed bad practice opens room for improvement and points to necessary changes and adjustments. The report covers two main areas: Chapter 1 deals with the internal functioning of FFF, chapter 2 brings in the customers’ view. The analysis of internal functioning is based on the project assessment data provided by FFF, publications of FFF and several interviews with FFF staff. Chapter 2 draws on the survey conducted by the evaluation team. Table of Contents
1. Internal functioning of FFF 4 1.1. Project inflow and funding 4 1.2. One-year funding and its implications 7 1.3. Budgeting 9 1.4. Costs for administration 12 1.5. Speed 13 1.6. Project assessment and selection process 14
1.6.1. Project assessment: design of the scoring system and workflow 14 1.6.2. How does the assessment scheme work in practice? 16 1.6.3. Is it necessary to use 14 criteria in project assessment? 21 1.6.4. Overall assessment of the project assessment scheme 23 1.6.5. Do firms adapt to the project assessment scheme? 25
1.7. Funding instruments 27 1.8. Programming 32 1.9. Learning FFF 34 1.10. Monitoring and Controlling 35
2. Customer content analysis 37 2.1. Firms’ judgements about the FFF 37 2.2. Firms’ resource inputs into the FFF-application process 39 2.3. Firms’ judgements on FFF-funding criteria 43 2.4. Feedback on project rejection 45
3. Summary and Conclusions 47 3.1. The overall picture 47 3.2. Development of funding volumes and selectivity 47 3.3. Budgeting 47 3.4. Functionality of the project assessment scheme 48 3.5. Implementation of the assessment scheme and suggested changes 49 3.6. Funding instruments 51 3.7. Programming 51 3.8. Qualification and Learning 51
3
Exhibits Exhibit 1: FFF, submitted projects by type of funding .............................................................................4 Exhibit 2: FFF, project costs and funding volumes ..................................................................................5 Exhibit 3: Average project size and funding intensity..............................................................................6 Exhibit 4: Rejection rates of new projects and follow-on projects ...........................................................8 Exhibit 5: Sources of FFF budgets [1998 - 2002]...................................................................................10 Exhibit 6: FFF, administrative costs .......................................................................................................12 Exhibit 7: FFF, distribution of decision times ........................................................................................13 Exhibit 8: FFF, funding criteria ..............................................................................................................14 Exhibit 9: Example for process assessment checklist: Novelty ..............................................................15 Exhibit 10: Distribution of total score, rejected and funded projects .....................................................17 Exhibit 11: Distribution of scores in four dimensions, 2000 – 2002, .....................................................18 Exhibit 12: Quality of project portfolio, funded projects 1999 - 2002 ...................................................20 Exhibit 13: Mean scores of rejected and funded projects, [scale: 0 – 4].................................................21 Exhibit 14: Share of KO-projects ...........................................................................................................26 Exhibit 15: Mean scores of submitted projects, KO-projects excluded..................................................27 Exhibit 16: FFF funding instruments......................................................................................................28 Exhibit 17: Default rate loans, ex-post conversion of loans ...................................................................29 Exhibit 18: Funding formula: Determination of share of grant on total funding ....................................30 Exhibit 19: FFF-funding of science-industry projects ............................................................................30 Exhibit 20: Cash value of funding as share of total project costs ...........................................................31 Tables Table 1: Proposed and actual funding decision ......................................................................................16 Table 2: Project assessment, distribution of scores [1999 – 2002] .........................................................19 Table 3: Correlation matrix for used assessment criteria........................................................................22 Table 4: Alternative grouping for criteria, factor loads ..........................................................................23 Table 5: ITF-projects funded by FFF .....................................................................................................33 Table 6: FFF funding lines .....................................................................................................................34 Table 7: General appraisal of the FFF’s working (Question 18) ............................................................38 Table 8: Evaluation of the terms of support (Question 36).....................................................................39 Table 9: Administrative effort of applicants in connection with the whole FFF-procedure (Question
19)- total sample .................................................................................................................39 Table 10: Administrative effort of applicants in connection with the whole FFF-procedure (Question
19) .......................................................................................................................................40 Table 11: Have you hired external support for writing the FFF-proposal (Question 21) ?.....................41 Table 12: Average time-input to apply for FFF-support (measured in man-days’ work).......................42 Table 13: Is it difficult to fulfil the FFF-support criteria (Question 22)? ...............................................44 Table 14: Are the FFF-support criteria hard/easy to fulfil? (Question 22) .............................................45 Table 15: Did the FFF give reasonable explanation why it has turned down your application? (Question
53) .......................................................................................................................................46 Table 16: In your view: why has your proposal been rejected by the FFF (Question 52) ? ...................46

4
1. Internal functioning of FFF
1.1. Project inflow and funding Compared with research funding organisations in other European countries, FFF appears to be a fairly specialised and focused organisation. Within the Austrian funding system FFF clearly stands for bottom-up project funding. This focus goes back to the very beginning of FFF when bottom-up funding was the dominant funding mode for public research support for the private enterprise sector. The concept of technology programmes as a new way to mobilise research and innovation potentials found its way into the FFF only in the recent years, when FFF was involved in the programme management of a series of technology programmes designed and launched by BMVIT. Exhibit 1 illustrates the strong focus on bottom-up project funding and the increasing role of technology programmes in the last years. Furthermore, Exhibit 1 shows that the last seven years have been a period of growth for FFF. This holds both for the number of submitted projects (1996: 937; 2002: 1.600) as well as for staff employed in the FFF secretary. The number of projects per employee has been fairly stable and only increased substantially in 2002 to 39.
Exhibit 1: FFF, submitted projects by type of funding
937 1.006 1.076 1.084
1.302
1.1041.264
41
33634
3739
41
32,333,5
29,4
313029
39
31,9
35,2
34,7
1996 1997 1998 1999 2000 2001 2002
submitted projects - technology programmes
submitted projects - bottom up
projects/staff
operational staff
Source: FFF, own calculations
The overall picture of growth however needs be differentiated. First, we see that in the last three years of observation a relatively steady growth path with respect of number of submitted projects has been interrupted. Reaching its peak in the year 2000 the number of submitted projects sharply declined in the following year (2001). This interruption gives a first indication of how demand for public funding of private research activities is linked to the overall economical situation. Apparently the

5
economic slowdown after 2000 hampered the propensity of the private sector to carry out risky research. Second, the shown figures clearly point to changed philosophies in public R&D-funding: While the number of submitted project proposals in the bottom-up area reached its peak in year 2000 the growth in project proposals comes mainly from the top-down programme side. Focusing on bottom-up project funding, Exhibit 2 shows the development of project volumes and funding levels. As can be seen the average size (project costs) of funded projects increased significantly over time from 414.000 € (1996) to 658.000 € (2002). In the same period of time the number of submitted projects has been growing by about 33 %. Even though the total funding volume has almost doubled from 65 mill € (1995) to 121 mill € (2002), it could not fully keep the level to maintain both the funding rates (funded projects/submitted projects) and funding intensity (share of funding in project costs). In sum, money has become more scarce.
Exhibit 2: FFF, project costs and funding volumes
65 6783 89 98
124 113 121295 303
379431 453
573
502547
733 732
840 843
955
788830804
1995 1996 1997 1998 1999 2000 2001 2002
funding (cash value) [mill. EURO]
total project costs [mill. EURO]
number of funded projects - buttom up
Source: FFF, own calculations How did FFF deal with this development? Basically the choice here is either to reduce the average funding intensity by lowering the share of funding as proportion of total project costs or to become more selective leading to a higher rejection rate. The figures in Exhibit 3 indicate that FFF followed the second path: While the funding intensity remained fairly stable over time the rate of rejection increased significantly from 22% (1996) to 30% (2002).

6
Exhibit 3: Average project size and funding intensity
414
471
513537
600
638658
92 103 106 116 129144 146
1996 1997 1998 1999 2000 2001 20020
5
10
15
20
25
30
35
[%]
average project size [tsd. EURO]
average funding [cash value, tsd. EURO]
funding/project volume [%]
rate of rejection [%]
Source: FFF, own calculations Given the fact that average project quality has not come down over time (see chapter 1.6.5; pp. 23), the increased rejection rates raises questions about the allocation mechanism in place: The most obvious one is whether there is a distinct mechanism that links the budgetary situation to the project selection process? At least at the operational side of project selection we did not encounter any formal mechanism that translates tight budget constraints into more demanding funding criteria. Both the funding decision as well as the decision about funding volumes for each project is taken on basis of the internal FFF project assessment procedure which only takes into account the technical and economical quality of the project and its relevance for the submitting firm. Whenever projects have been rejected because of empty budgets, FFF documents these cases separately. Since 1996 this was the case only for 1,2% of submitted projects (126 out of 9,967). Most rejections (68) on basis of budgetary constraints occurred in 2002. At the face of it the number of project rejections on basis of budgetary constraints remains fairly low. This suggests that there are other than budgetary reasons for increased rejection rates. In practice however it was indeed the budgetary situation that has driven FFF to be more selective. As reported by interviewees the link between budgetary constraints and the selection process is not formalised but maintained implicitly1. To conclude: In the absence of any formal mechanism which links budget conditions to the project selection process we take the increased rejection rates as an implicit strategy of FFF to gradually increase the level of aspiration in its project selection.
1 It was reported that FFF faced some pressure not to document whenever projects were rejected for budgetary reasons. We take this attitude as an indication that there is a real need for explicit mechanisms that link budgetary constraints to the selection process and to overcome the self-perception of FFF being almost obliged to fund every projects that is reasonably good.

7
This can be seen in the broader context of the latest developments in the Austrian funding system. While additional public resources have been devoted mostly to programme activities the proportion of funds going into bottom-up funding has come under question. In an increasingly competitive environment the pressure to escalate the funding crossbar for bottom-up project has increased. At this stage of analysis we can retain the following observations:
• FFF bottom-up project funding budgets have become tighter in the last years. Available funds could not keep pace with increased demand caused by increased project size and number of submitted projects.
• With the funding routines in place tight budgets seem to lead to higher rejection rates rather than a reduction of funding intensity (share of funding as proportion of total project costs) which remained stable.
• Even though project assessment and the funding decision process is formally independent of budgetary constraints, it seems that FFF has raised the funding crossbar. This holds particularly for the last two years of observation (2001 and 2002).
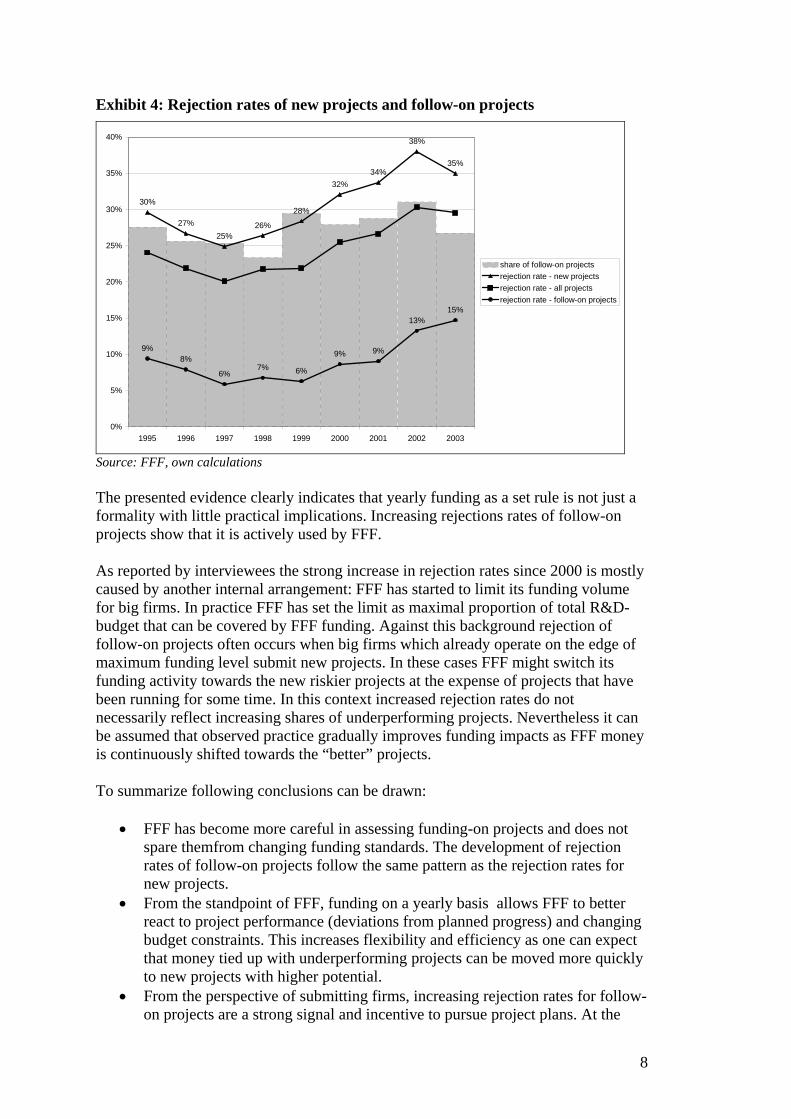
1.2. One-year funding and its implications FFF funds on a yearly basis. Thus selection rates on basis of the whole portfolio of submitted projects might be misleading as they do not differentiate between new projects and follow-on projects. It is worthwhile to make this differentiation as it touches an important funding rule. One-year project funding has come under question as observers pointed to the long term nature of R&D-activities that also need longer-term financial planning. In this context, public funding made available only on a yearly basis seemed not to fit to observed requirements. In the following section we discuss the one-year funding rule in the light of operational practice and its implications for FFF and the submitting firms. The first expectation was, that rejection rates for follow-on projects are at a lower level than rejection rates of new projects. Moreover rejection rates of follow-on projects should be stable over time as one can expect, that the funding decision at the project start is based on the assessment of the whole project and not just on the first year project plan. Rejection in following years may occur, when substantial deviations from the project plan are observed or the project outcome appears outdated as new, unforeseen developments (e.g. new technological options) come up. Furthermore the submitting firm may have undergone a substantial change which may change the relevance of the project substantially. There is no reason why these eventualities occur more often over time. Exhibit 4 confirms the first hypothesis: Rejection rates for new projects are substantially higher than for follow-on projects. It does not confirm the second expectation though: Rejection rates of follow-on projects have been increasing over time. Interestingly, rejection rates for follow-on projects started to rise two years later than for new projects and kept rising also in 2002 when rejection rate of new projects came down somewhat.
8
Exhibit 4: Rejection rates of new projects and follow-on projects
30%
27%25%
26%
28%
32%34%
38%
35%
9%8%
6%7% 6%
9% 9%
13%15%
0%
5%
10%
15%
20%
25%
30%
35%
40%
1995 1996 1997 1998 1999 2000 2001 2002 2003
share of follow-on projectsrejection rate - new projectsrejection rate - all projectsrejection rate - follow-on projects
Source: FFF, own calculations The presented evidence clearly indicates that yearly funding as a set rule is not just a formality with little practical implications. Increasing rejections rates of follow-on projects show that it is actively used by FFF. As reported by interviewees the strong increase in rejection rates since 2000 is mostly caused by another internal arrangement: FFF has started to limit its funding volume for big firms. In practice FFF has set the limit as maximal proportion of total R&D-budget that can be covered by FFF funding. Against this background rejection of follow-on projects often occurs when big firms which already operate on the edge of maximum funding level submit new projects. In these cases FFF might switch its funding activity towards the new riskier projects at the expense of projects that have been running for some time. In this context increased rejection rates do not necessarily reflect increasing shares of underperforming projects. Nevertheless it can be assumed that observed practice gradually improves funding impacts as FFF money is continuously shifted towards the “better” projects. To summarize following conclusions can be drawn:
• FFF has become more careful in assessing funding-on projects and does not spare themfrom changing funding standards. The development of rejection rates of follow-on projects follow the same pattern as the rejection rates for new projects.
• From the standpoint of FFF, funding on a yearly basis allows FFF to better react to project performance (deviations from planned progress) and changing budget constraints. This increases flexibility and efficiency as one can expect that money tied up with underperforming projects can be moved more quickly to new projects with higher potential.
• From the perspective of submitting firms, increasing rejection rates for follow-on projects are a strong signal and incentive to pursue project plans. At the

9
same time, the incentive to stick with underperforming projects because they receive public funding disappears when the funding procedure has to be repeated every year.
• The yearly funding procedure for follow-on projects does cause additional administrative costs.2 The additional funding volumes released in support of “better” projects and at the expense of underperforming projects exceeds additional administration costs by a multiple3
Overall the benefits from funding on a yearly basis instead of funding commitments for the whole project duration exceed its negative implications.
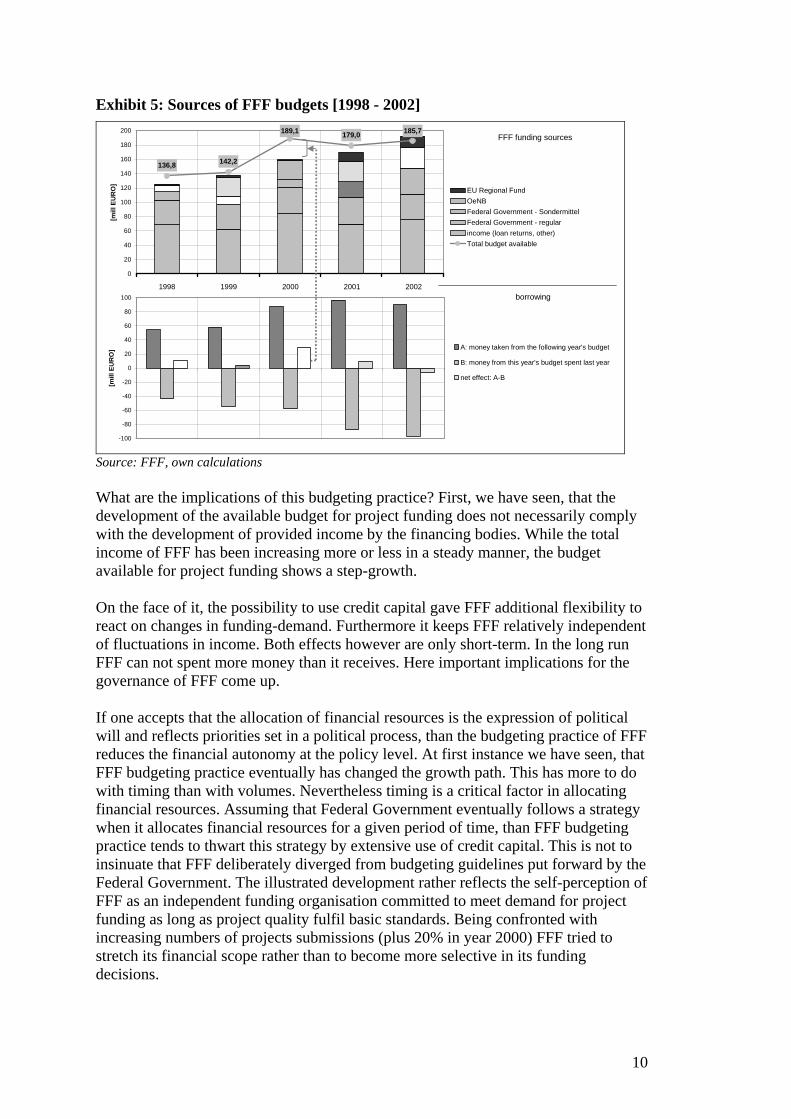
1.3. Budgeting FFF works with one-year budgets which depend on a range of different sources. The regular contribution of the Federal Government together with income from loan redemption are the most stable and important income sources for FFF. Beside these sources the Austrian national Bank (OeNB) as well as EU-Regional Funds have contributed to the FFF budget. Moreover the Federal Government has provided additional financial resources in the course of various initiatives (“Technologiemilliarde”, “Offensivprogramm”). Exhibit 5 summarizes the development of the budgetary situation over the last five years and shows the contribution of the different sources.
As can be seen, the total budget available increased significantly from 1998 to 2002. Interestingly this is not the result of a steady growth but the consequence of one boost in 2000 when the available budget grew by 33% (46.89 mill EURO) on the preceding year. The second remarkable observation is that most of this increase comes from a financial advance from the following years budget (29.14 mill EURO). In practice this is credit capital secured by expected income from loan redemption as well as expected contribution of the Federal Government. Exhibit 5 reveals that FFF has increased its exposure to credit capital substantially during the last years. Only in one year (2002) did the borrowing practice of FFF lead to a significant increase of the budget available for project funding. In the following years the net effect remained at a low level and was negative in the last year of observation (2002).
2 If we use administrative costs per submitted project (see Exhibit 6) as starting point and allow a reduction of one third for fixed costs, the approximation of variable costs for projects assessment comes close to 2,000 EURO per project. The average number of follow-on projects in the last 5 years was 320 per year. An estimation of “additional” costs based on this rather rough calculation amounts to 128,000 EURO per year. 3 If we take the average funding volume (cash value) of approved follow-on projects as a proxy for released funds in case of project rejection, than the total funding volume set free for new projects at the expense of rejected follow-on projects has increased from 2.6 mill € (1995) to 8.8 mill € (2003).
10
Exhibit 5: Sources of FFF budgets [1998 - 2002]
136,8 142,2
189,1 179,0 185,7
0
20
40
60
80
100
120
140
160
180
200
[mill
EU
RO
]
EU Regional FundOeNBFederal Government - SondermittelFederal Government - regularincome (loan returns, other)Total budget available
-100
-80
-60
-40
-20
0
20
40
60
80
1001998 1999 2000 2001 2002
[mill
EU
RO
] A: money taken from the following year's budget
B: money from this year's budget spent last year
net effect: A-B
FFF funding sources
borrowing
Source: FFF, own calculations What are the implications of this budgeting practice? First, we have seen, that the development of the available budget for project funding does not necessarily comply with the development of provided income by the financing bodies. While the total income of FFF has been increasing more or less in a steady manner, the budget available for project funding shows a step-growth. On the face of it, the possibility to use credit capital gave FFF additional flexibility to react on changes in funding-demand. Furthermore it keeps FFF relatively independent of fluctuations in income. Both effects however are only short-term. In the long run FFF can not spent more money than it receives. Here important implications for the governance of FFF come up. If one accepts that the allocation of financial resources is the expression of political will and reflects priorities set in a political process, than the budgeting practice of FFF reduces the financial autonomy at the policy level. At first instance we have seen, that FFF budgeting practice eventually has changed the growth path. This has more to do with timing than with volumes. Nevertheless timing is a critical factor in allocating financial resources. Assuming that Federal Government eventually follows a strategy when it allocates financial resources for a given period of time, than FFF budgeting practice tends to thwart this strategy by extensive use of credit capital. This is not to insinuate that FFF deliberately diverged from budgeting guidelines put forward by the Federal Government. The illustrated development rather reflects the self-perception of FFF as an independent funding organisation committed to meet demand for project funding as long as project quality fulfil basic standards. Being confronted with increasing numbers of projects submissions (plus 20% in year 2000) FFF tried to stretch its financial scope rather than to become more selective in its funding decisions.

11
This practice however gives the negotiation on budgets between FFF and the Federal Government a specific twist: Strong exposure to credit capital is costly and carries a strong signal of FFF being under funded even though overall public spending on RTD is increasing. Moreover, as FFF targets the broad mass of Austrian firms political costs of increasing rejection rates at FFF should not be underestimated. In the end Federal Government gradually looses control over timing and remains locked in a rather defensive negotiating position. To be fair, the use of credit capital secured by anticipated income has been explicitly approved by the responsible ministry as substantial additional resources were expected for the coming years. In retrospect however not all expectations were fulfilled. Again, the described dynamic is less the outcome of a well thought-out strategy but the result of a specific constellation between Federal Government and an “autonomous” funding organisation, that actively pursues the interest of its clients. To sum up, budgeting practice of FFF has tried to adapt to fluctuations in funding demand by increased borrowing from expected income. This increases flexibility and eventually improves the position of FFF in future negotiations on budget allocation. The cost of this practice have been significant as borrowing from future incomes increased the budget available for additional project funding only in one year while capital costs moved to a higher level for a much longer period of time. With respect to governance of FFF the funding practice goes hand in hand with a loss of steering power at the level of RTD-policy. The described budgeting practice as we have seen it in the past years can only be explained in the light of the specific setting of the Austrian funding system with autonomous funding organisations. It is the result of allocation processes that are not based on long term strategy taking into account various funding instruments and types but on yearly negotiations between the Federal Government and beneficiaries of single funding types. In the long run this lack of overall strategy reduces the performance of the Austrian RTD-system. As for FFF’s budgeting practice we suggest following adjustments:
• The financial scope of FFF should be set in advance for a longer period of time. This implies an increase in the share of regular financial contributions from the main financing bodies and a reduction of FFF’s exposure to financial inflows from temporary sources.
• Financial flexibility using credit capital is valuable as long it remains on relatively low levels. The observed exposure to credit capital is too high and causes significant costs at the expense of resources available for project funding. It should be reduced. Limits for future budgeting are needed.
• Currently the budget available for project funding is not linked to the selection process or decision on funding intensity. Thus budgeting is mostly demand driven. Under these circumstances allocation of overall budgets among different funding instruments remains difficult. In order to keep within the preset financial scope, mechanisms for linking funding process with the budgetary situation are needed. It is important that this link is explicit and transparent for policy makers as well as submitting firms.

12
Overall the suggested changes only make sense when they are grounded on a longer-term strategy on public funding of RTD that positions FFF within the broader spectrum of different funding instruments.
1.4. Costs for administration Total administrative costs (60% for personnel) has been growing in line with the increased funding volumes. Exhibit 6 illustrates the development of administrative costs in absolute terms and administrative costs per submitted project. The costs for handling one submitted project has been fairly stable until 2000. Since then we see first a substantial increase (plus 30%) in year 2001 followed by a decrease, bringing relative administrative costs back to the earlier level. This development overlaps with the start of the first BMVIT programmes of which the financial execution was contracted out to FFF4. Obviously there was a need to build up extra capacity already in the preparation phase of these programmes. The first rounds of calls were completed in 2002. Thus 336 submitted projects feed in to the project statistic used here.
Exhibit 6: FFF, administrative costs
2,89 2,843,12
3,363,50
4,00
4,473.084
2.823 2.9003.100
2.688
3.493
2.794
1996 1997 1998 1999 2000 2001 2002
administration costs [mill EURO]
administration costs per project[EURO]
4,3%
3,5%3,4% 3,4%
3,3%
2,8%
3,4%
administration costs as proportion oftotal funding (cash value) [%]
Source: FFF, own calculations Administration costs as a proportion of total funding volume (cash value) have been stable at the range between 3,3 % and 3,5 %. Only exemptions were 1996 (4,3%) and 2000 (2,8%). This is low if we take 5% as the international reference level for similar funding organisations (see background report International comparison).
4 The programme management of BMVIT programmes has been contracted out to expert organisations. This however does not include the financial management of the programme which has been handed over to FFF. Beside the mere financial execution of funding contracts FFF is also involved in the project selection process (economic rating) and fulfils monitoring tasks.
13
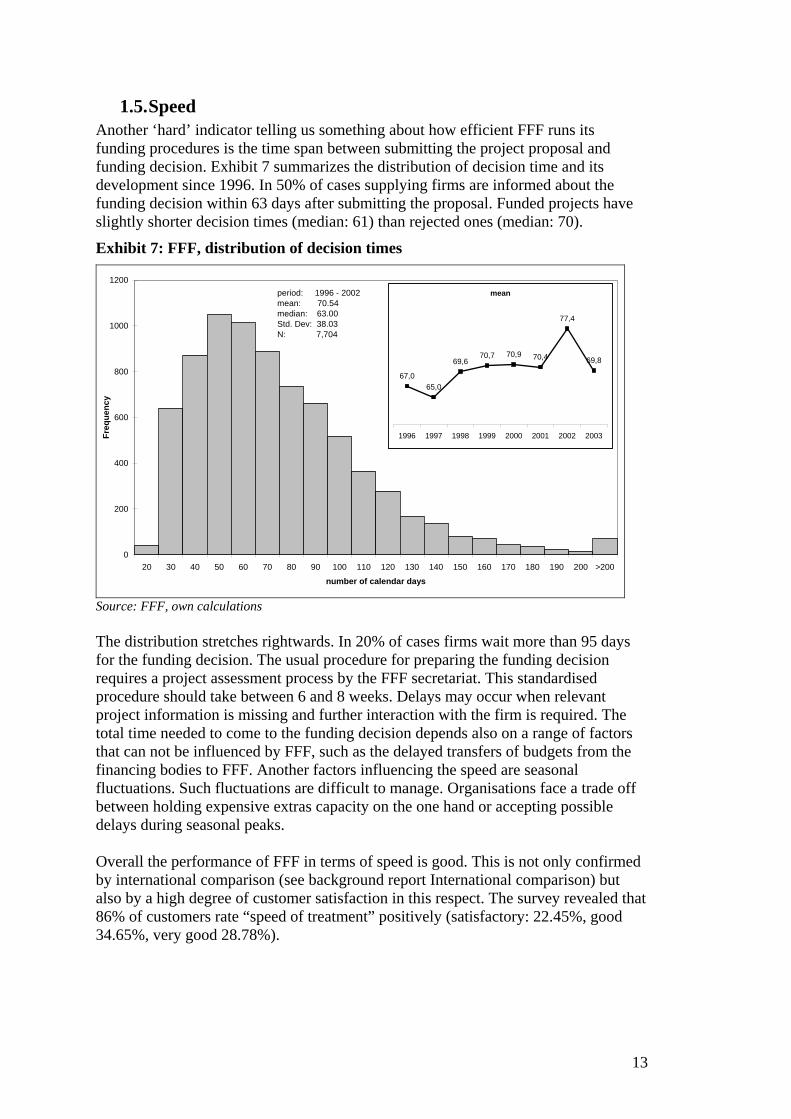
1.5. Speed Another ‘hard’ indicator telling us something about how efficient FFF runs its funding procedures is the time span between submitting the project proposal and funding decision. Exhibit 7 summarizes the distribution of decision time and its development since 1996. In 50% of cases supplying firms are informed about the funding decision within 63 days after submitting the proposal. Funded projects have slightly shorter decision times (median: 61) than rejected ones (median: 70).
Exhibit 7: FFF, distribution of decision times
0
200
400
600
800
1000
1200
20 30 40 50 60 70 80 90 100 110 120 130 140 150 160 170 180 190 200 >200
number of calendar days
Freq
uenc
y
period: 1996 - 2002mean: 70.54median: 63.00Std. Dev: 38.03N: 7,704
mean
67,065,0
69,670,7 70,9 70,4
77,4
69,8
1996 1997 1998 1999 2000 2001 2002 2003
Source: FFF, own calculations The distribution stretches rightwards. In 20% of cases firms wait more than 95 days for the funding decision. The usual procedure for preparing the funding decision requires a project assessment process by the FFF secretariat. This standardised procedure should take between 6 and 8 weeks. Delays may occur when relevant project information is missing and further interaction with the firm is required. The total time needed to come to the funding decision depends also on a range of factors that can not be influenced by FFF, such as the delayed transfers of budgets from the financing bodies to FFF. Another factors influencing the speed are seasonal fluctuations. Such fluctuations are difficult to manage. Organisations face a trade off between holding expensive extras capacity on the one hand or accepting possible delays during seasonal peaks. Overall the performance of FFF in terms of speed is good. This is not only confirmed by international comparison (see background report International comparison) but also by a high degree of customer satisfaction in this respect. The survey revealed that 86% of customers rate “speed of treatment” positively (satisfactory: 22.45%, good 34.65%, very good 28.78%).

14
1.6. Project assessment and selection process Project assessment processes are considered as one of the crucial steering mechanisms for public research funding organisations. Project assessment procedures should reflect perceived policy challenges. In practice they specify entry conditions with respect to project quality (technological and economical) and address a whole range of broader impacts public funding of private R&D can strive for. The following chapter describes the functioning of the project assessment in FFF and assesses its usability and observed selection dynamic.
1.6.1. Project assessment: design of the scoring system and workflow Project assessment in FFF is done exclusively in-house with half of FFF staff (20 out of 41) devoting most of their capacity to project assessment. Against this background project assessment can be seen as the very core of FFF’s funding task5. FFF has established a software based project assessment tool which integrates a whole set of various funding criteria. Important input for further standardising and codifying the project assessment came from an international technology-rating project in which FFF together with national experts (WIFO) took part. Four dimensions are addressed in the project assessment procedure as it is used now: (i) Technological quality of the project itself, (ii) technological quality in relation to the submitting firm, (iii) economic value of the project and finally (iv) economic and managerial performance of the company.
Exhibit 8: FFF, funding criteria
Technical evaluation Economic Evaluation
Project
1. Novelty 2. Technological challenge 3. Practical value / benefit 4. Environmental effects
1. Market prospects 2. Commercialisation 3. Market experience 4. Social impacts (implications) Other external effects (e.g. job creation)
Firm 5. Increase of Know-how 6. R&D dynamics 7. Feasibility
6. Financial performance 7. Management
In each of those four dimensions a set of criteria is used (see Exhibit 8). For further clarifying the rational of used criteria a checklist of stylised project characteristics has been produced (see Exhibit 9). For example: The assessment of the “technological novelty” is split into 5 dimensions that have to be checked. With this checklist in hand the assessment officer assesses the novelty of the project within the given range. Possible scores are preset including one knock-out possibility (“0” = KO!). This allows using different weights across the set of 14 different criteria. The four basic dimensions are balanced out as the maximum scores in each is the same (50).
5 Even the managing director has still reserved some of his capacity for project assessment. This is a strong signal that FFF considers its project assessment procedure as the central function. It is where the common understanding of its funding business is grounded.

15
Exhibit 9: Example for process assessment checklist: Novelty
KO -- - + ++ Novelty 0 3 6 12 15 Novelty with respect to state of the art Handling of intellectual property rights Expected competitive advantage Potential for future Showcase for the sector
The highest ranking criteria are: “financial performance” (max. 30 scores), “increase of Know-how” (max. 25. scores), “technical challenge” (max. 20 scores) and “management” (max. 20 scores). This is interesting: Only one (“technical challenge”) of the four most important criteria are related to the project itself. The remaining dimensions refer to the importance of the project for the company and its financial and managerial ability to eventually tap the economic potential of the proposed research work. As for the organisation of the workflow, each project is assessed by one technical and one economical in-house expert. Incoming projects are allocated once a week (Friday) to staff members. For the technical evaluation FFF has built up teams covering specific technological fields. Ideally each technological field should be covered by at least two experts. At the side of economic project evaluators no specialisation (sectors, product clusters) pattern has been developed. On the contrary, FFF procedures ensure that evaluators rotate on a regular basis. Having allocated incoming project proposals to the evaluation team, projects are assessed sequentially: First on technical then on economical grounds. Project assessment is first done individually by the responsible team member. The result and proposed funding decision is then discussed in the team. These discussions usually take place in preparation of the next meeting of the Presidium. They are crucial as they help to build up a shared perception of quality and funding objectives. The assessed project portfolio together with the suggestion for the funding decision is then presented to the Presidium. Table 1 shows that for the vast majority of projects the Presidium follows the prepared suggestion of the operative FFF team. Only in 18 out of 9,967 cases the Presidium reversed the proposed funding decision. In 346 cases the FFF Secretary abstained from putting forward a funding suggestion and put them on discussion.

16
Table 1: Proposed and actual funding decision Definitive decision (Presidium)
Proposed by FFF-secretary Rejected rejected (empty
budget) Funded Withdrawn total
Number of submitted projects [1995 – 2003]
Rejection 2,323 7 10 3 2,343 rejection (empty budget) 126 126 Discussion 112 3 232 347 Funding 7 4,732 4,739 funding-prolonged 1 2,376 1 2,378 funding highlights 34 34
Total 2,443 136 7,384 4 9,967 Source: FFF, own calculations Given the number of project proposals and frequency of meeting of the Presidium (8-9 a year) it can not be expected, that the Presidium discusses single proposals in depth. The discussion on this very small sample of projects however is crucial. In these discussions the line between “good” projects and “bad” projects is defined.
1.6.2. How does the assessment scheme work in practice? The following chapter presents the portfolio of submitted projects using the result of the assessment data of FFF. The underlying questions are: What factors determine the funding decision? What distinguished rejected projects from funded projects? Answering these questions should reveal some of the practical implications of the project assessment system in place. A first rather trivial hypothesis on the practical implications of the project assessment scheme is that in retrospective, funded projects have received higher scores than rejected projects. A first crude approach to test this hypothesis is to compare total scores of rejected and funded projects. Exhibit 10 illustrates the cumulative distribution of total scores for the two categories. The result is interesting: Even though funded projects tend to receive higher scores than rejected projects, there remains a wide bandwidth containing both rejected and funded projects. For example: 20% of rejected projects received more than 110 points. At the same time about 25% of funded projects lie below this level.

17
Exhibit 10: Distribution of total score, rejected and funded projects
[2000 - 2002]
0%
10%
20%
30%
40%
50%
60%
70%
80%
90%
100%
55 60 65 70 75 80 85 90 95 100 105 110 115 120 125 130 135 140 145 150 155 160 165 170 175 180 185
total scores
cum
ulat
ive
perc
enta
ge
distribution of total scores: funded projects, cumulative, N = 3,256
distribution of total scores: rejected projects (excl. KO-projects), cumulative, N = 853
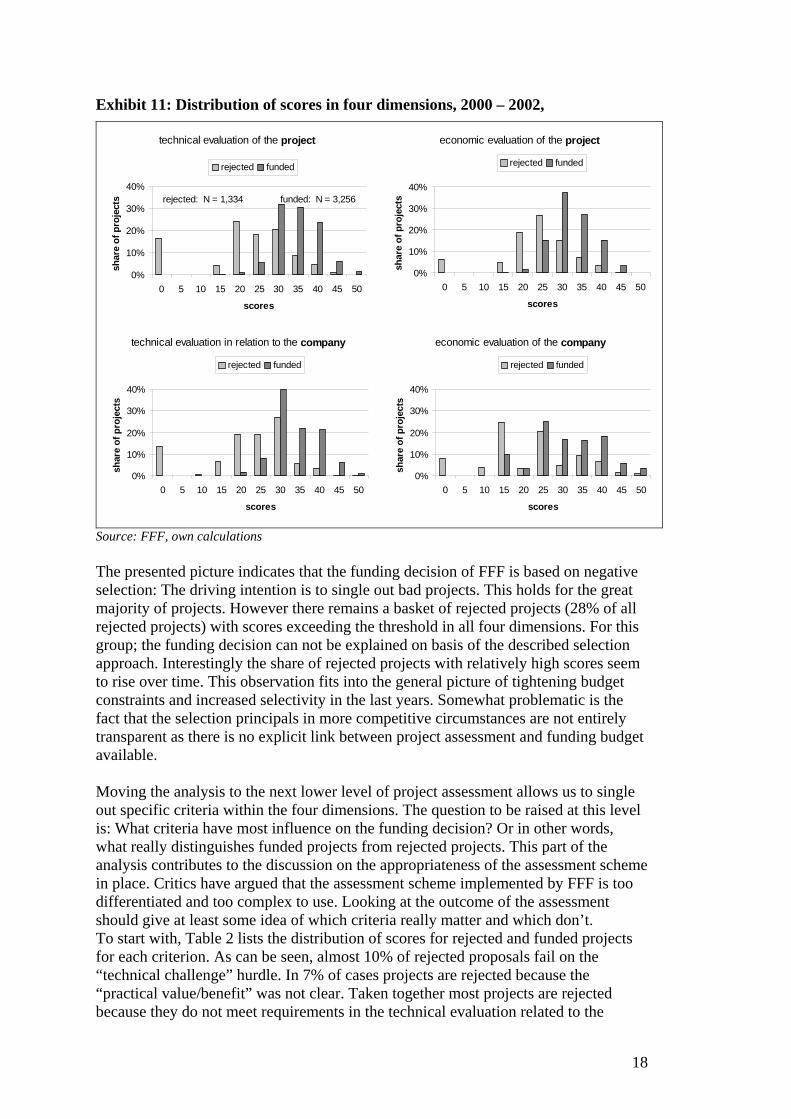
Source: FFF, own calculations Obviously the total number of scores does not tell us, whether a project gets funded or rejected. Beware that in this calculation we excluded projects that did not meet one or more KO-conditions. The result shows, that FFF does not use the sum of scores to derive its funding decision. This is reasonable, as for example good economical performance would automatically increase the likelihood to receive funding irrespective of the quality of submitted projects. From the standpoint of overall funding impact this would clearly be contra productive. If the sum of scores does not explain the funding decision, what really distinguishes funded projects from rejected projects? Exhibit 11 provides part of the answer. It shows the distribution of scores in the four basic dimensions. As can be seen, also at this level of aggregation funded projects did not necessarily receive higher scores. However, they lie in almost all cases above the 20 score level. This indicates that FFF applies a threshold that each funded project has to overcome6. Given this threshold, rejected projects may receive relatively high total scores. Unless they do not overcome the stated threshold in each dimension the chances of receiving funding remain low. There is one exemption though: 13% of funded projects received less than 20 scores in the assessment of the economic performance of the company. This involves two criteria: “Financial performance” and “management”. The rational behind this result is, that economically weak firms are not discriminated when applying for public support of their research activities. This applies most of all to small firms and young start-up firms.
6 Representatives of FFF confirmed this selection practice.
18
Exhibit 11: Distribution of scores in four dimensions, 2000 – 2002,
technical evaluation of the project
0%
10%
20%
30%
40%
0 5 10 15 20 25 30 35 40 45 50
scores
shar
e of
pro
ject
s
rejected funded
rejected: N = 1,334 funded: N = 3,256
technical evaluation in relation to the company
0%
10%
20%
30%
40%
0 5 10 15 20 25 30 35 40 45 50
scores
shar
e of
pro
ject
s
rejected funded
economic evaluation of the company
0%
10%
20%
30%
40%
0 5 10 15 20 25 30 35 40 45 50
scores
shar
e of
pro
ject
s
rejected funded
economic evaluation of the project
0%
10%
20%
30%
40%
0 5 10 15 20 25 30 35 40 45 50
scores
shar
e of
pro
ject
s
rejected funded
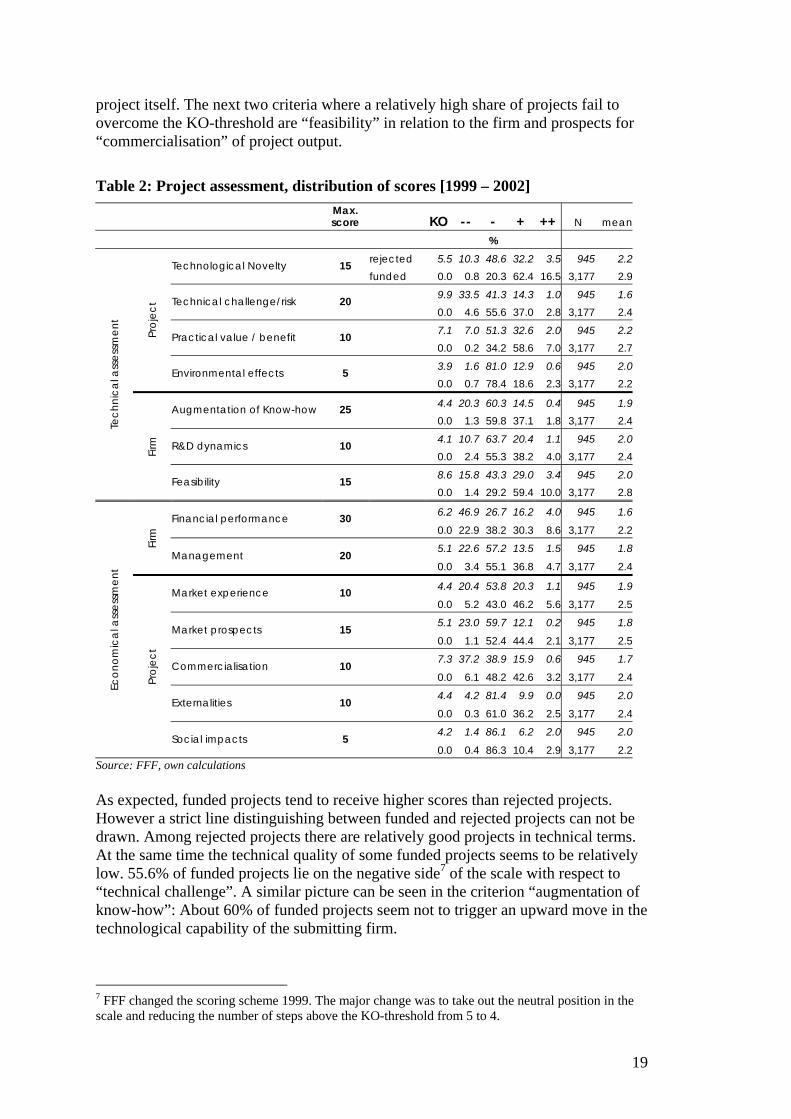
Source: FFF, own calculations The presented picture indicates that the funding decision of FFF is based on negative selection: The driving intention is to single out bad projects. This holds for the great majority of projects. However there remains a basket of rejected projects (28% of all rejected projects) with scores exceeding the threshold in all four dimensions. For this group; the funding decision can not be explained on basis of the described selection approach. Interestingly the share of rejected projects with relatively high scores seem to rise over time. This observation fits into the general picture of tightening budget constraints and increased selectivity in the last years. Somewhat problematic is the fact that the selection principals in more competitive circumstances are not entirely transparent as there is no explicit link between project assessment and funding budget available. Moving the analysis to the next lower level of project assessment allows us to single out specific criteria within the four dimensions. The question to be raised at this level is: What criteria have most influence on the funding decision? Or in other words, what really distinguishes funded projects from rejected projects. This part of the analysis contributes to the discussion on the appropriateness of the assessment scheme in place. Critics have argued that the assessment scheme implemented by FFF is too differentiated and too complex to use. Looking at the outcome of the assessment should give at least some idea of which criteria really matter and which don’t. To start with, Table 2 lists the distribution of scores for rejected and funded projects for each criterion. As can be seen, almost 10% of rejected proposals fail on the “technical challenge” hurdle. In 7% of cases projects are rejected because the “practical value/benefit” was not clear. Taken together most projects are rejected because they do not meet requirements in the technical evaluation related to the
19
project itself. The next two criteria where a relatively high share of projects fail to overcome the KO-threshold are “feasibility” in relation to the firm and prospects for “commercialisation” of project output.
Table 2: Project assessment, distribution of scores [1999 – 2002] Max.
score KO -- - + ++ N mean %
rejected 5.5 10.3 48.6 32.2 3.5 945 2.2Technological Novelty 15 funded 0.0 0.8 20.3 62.4 16.5 3,177 2.9
9.9 33.5 41.3 14.3 1.0 945 1.6Technical challenge/risk 20 0.0 4.6 55.6 37.0 2.8 3,177 2.4
7.1 7.0 51.3 32.6 2.0 945 2.2Practical value / benefit 10 0.0 0.2 34.2 58.6 7.0 3,177 2.7
3.9 1.6 81.0 12.9 0.6 945 2.0
Proj
ect
Environmental effects 5 0.0 0.7 78.4 18.6 2.3 3,177 2.2
4.4 20.3 60.3 14.5 0.4 945 1.9Augmentation of Know-how 25 0.0 1.3 59.8 37.1 1.8 3,177 2.4
4.1 10.7 63.7 20.4 1.1 945 2.0R&D dynamics 10 0.0 2.4 55.3 38.2 4.0 3,177 2.4
8.6 15.8 43.3 29.0 3.4 945 2.0
Tech
nica
l ass
essm
ent
Firm
Feasibility 15 0.0 1.4 29.2 59.4 10.0 3,177 2.8
6.2 46.9 26.7 16.2 4.0 945 1.6Financial performance 30 0.0 22.9 38.2 30.3 8.6 3,177 2.2
5.1 22.6 57.2 13.5 1.5 945 1.8Firm
Management 20 0.0 3.4 55.1 36.8 4.7 3,177 2.4
4.4 20.4 53.8 20.3 1.1 945 1.9Market experience 10 0.0 5.2 43.0 46.2 5.6 3,177 2.5
5.1 23.0 59.7 12.1 0.2 945 1.8Market prospects 15
0.0 1.1 52.4 44.4 2.1 3,177 2.5
7.3 37.2 38.9 15.9 0.6 945 1.7Commercialisation 10
0.0 6.1 48.2 42.6 3.2 3,177 2.4
4.4 4.2 81.4 9.9 0.0 945 2.0Externalities 10
0.0 0.3 61.0 36.2 2.5 3,177 2.4
4.2 1.4 86.1 6.2 2.0 945 2.0
Econ
omic
al a
sses
smen
t
Proj
ect
Social impacts 5 0.0 0.4 86.3 10.4 2.9 3,177 2.2
Source: FFF, own calculations As expected, funded projects tend to receive higher scores than rejected projects. However a strict line distinguishing between funded and rejected projects can not be drawn. Among rejected projects there are relatively good projects in technical terms. At the same time the technical quality of some funded projects seems to be relatively low. 55.6% of funded projects lie on the negative side7 of the scale with respect to “technical challenge”. A similar picture can be seen in the criterion “augmentation of know-how”: About 60% of funded projects seem not to trigger an upward move in the technological capability of the submitting firm.
7 FFF changed the scoring scheme 1999. The major change was to take out the neutral position in the scale and reducing the number of steps above the KO-threshold from 5 to 4.
20
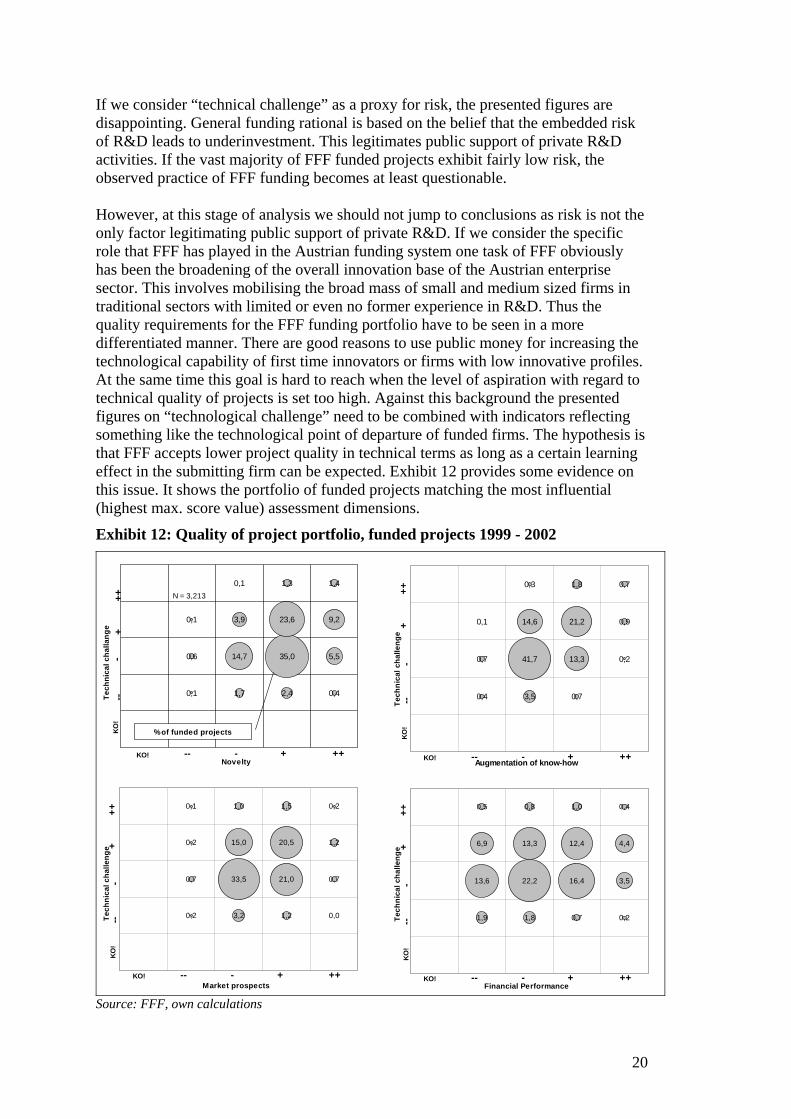
If we consider “technical challenge” as a proxy for risk, the presented figures are disappointing. General funding rational is based on the belief that the embedded risk of R&D leads to underinvestment. This legitimates public support of private R&D activities. If the vast majority of FFF funded projects exhibit fairly low risk, the observed practice of FFF funding becomes at least questionable. However, at this stage of analysis we should not jump to conclusions as risk is not the only factor legitimating public support of private R&D. If we consider the specific role that FFF has played in the Austrian funding system one task of FFF obviously has been the broadening of the overall innovation base of the Austrian enterprise sector. This involves mobilising the broad mass of small and medium sized firms in traditional sectors with limited or even no former experience in R&D. Thus the quality requirements for the FFF funding portfolio have to be seen in a more differentiated manner. There are good reasons to use public money for increasing the technological capability of first time innovators or firms with low innovative profiles. At the same time this goal is hard to reach when the level of aspiration with regard to technical quality of projects is set too high. Against this background the presented figures on “technological challenge” need to be combined with indicators reflecting something like the technological point of departure of funded firms. The hypothesis is that FFF accepts lower project quality in technical terms as long as a certain learning effect in the submitting firm can be expected. Exhibit 12 provides some evidence on this issue. It shows the portfolio of funded projects matching the most influential (highest max. score value) assessment dimensions.
Exhibit 12: Quality of project portfolio, funded projects 1999 - 2002
0,1
0,6
0,1
1,7
14,7
3,9
0,1
2,4
35,0
23,6
1,3
0,4
5,5
9,2
1,4
KO! -- - + ++
-KO
!--
+++
Tech
nica
l cha
llang
e
Novelty
N = 3,213
% of funded projects
0,4
0,7
0,1
3,5
41,7
14,6
0,3
0,7
13,3
21,2
1,8
0,2
0,9
0,7
Augmentation of know-howKO! -- - + ++
KO!
--+
++Te
chni
cal c
halle
nge
-
0,2 3,2 1,2 0,0
0,7 33,5 21,0 0,7
0,2 15,0 20,5 1,2
0,1 1,0 1,5 0,2
Market prospectsKO! -- - + ++
KO!
--+
++Te
chni
cal c
halle
nge
-
1,9 1,8 0,7 0,2
13,6 22,2 16,4 3,5
6,9 13,3 12,4 4,4
0,5 0,8 1,0 0,4
Financial PerformanceKO! -- - + ++
KO!
--+
++Te
chni
cal c
halle
nge
-
Source: FFF, own calculations
21
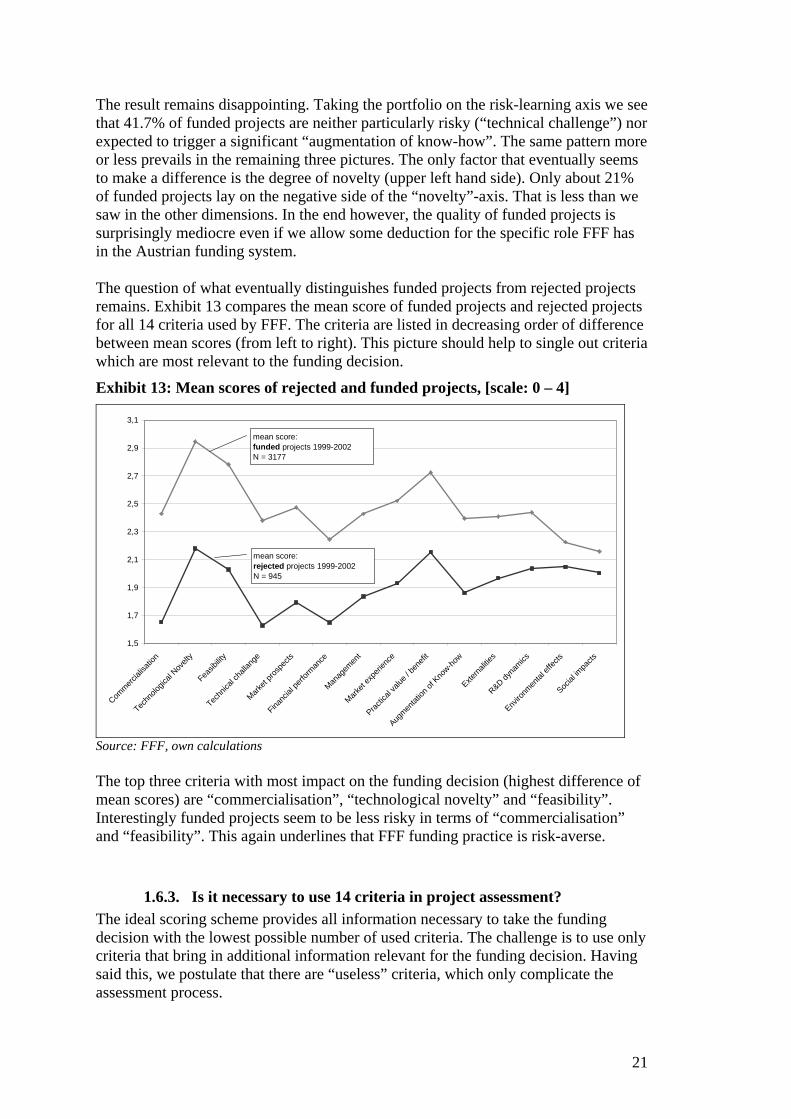
The result remains disappointing. Taking the portfolio on the risk-learning axis we see that 41.7% of funded projects are neither particularly risky (“technical challenge”) nor expected to trigger a significant “augmentation of know-how”. The same pattern more or less prevails in the remaining three pictures. The only factor that eventually seems to make a difference is the degree of novelty (upper left hand side). Only about 21% of funded projects lay on the negative side of the “novelty”-axis. That is less than we saw in the other dimensions. In the end however, the quality of funded projects is surprisingly mediocre even if we allow some deduction for the specific role FFF has in the Austrian funding system. The question of what eventually distinguishes funded projects from rejected projects remains. Exhibit 13 compares the mean score of funded projects and rejected projects for all 14 criteria used by FFF. The criteria are listed in decreasing order of difference between mean scores (from left to right). This picture should help to single out criteria which are most relevant to the funding decision.
Exhibit 13: Mean scores of rejected and funded projects, [scale: 0 – 4]
1,5
1,7
1,9
2,1
2,3
2,5
2,7
2,9
3,1
Commerc
ialisa
tion
Techn
ologic
al Nov
elty
Feasib
ility
Techn
ical c
halla
nge
Market
prosp
ects
Financ
ial pe
rform
ance
Manag
emen
t
Market
expe
rienc
e
Practic
al va
lue / b
enefi
t
Augmen
tation
of K
now-ho
w
Externa
lities
R&D dyna
mics
Enviro
nmen
tal ef
fects
Social
impa
cts
mean score: funded projects 1999-2002 N = 3177
mean score:rejected projects 1999-2002N = 945
Source: FFF, own calculations The top three criteria with most impact on the funding decision (highest difference of mean scores) are “commercialisation”, “technological novelty” and “feasibility”. Interestingly funded projects seem to be less risky in terms of “commercialisation” and “feasibility”. This again underlines that FFF funding practice is risk-averse.
1.6.3. Is it necessary to use 14 criteria in project assessment? The ideal scoring scheme provides all information necessary to take the funding decision with the lowest possible number of used criteria. The challenge is to use only criteria that bring in additional information relevant for the funding decision. Having said this, we postulate that there are “useless” criteria, which only complicate the assessment process.

22
In statistical terms the degree of correlation within the range of used criteria should be low. Table 3 contains the respective correlation matrix for all criteria. The correlation coefficient is positive for all combinations and does not exceed 0,6 (“commercialisation” with “market experience”). The correlation coefficients seems to group certain criteria. On one hand criteria related to the technical quality seem to be positively correlated with the technological capability of the submitting firms. On the other hand the commercial potential of the project seem to be stronger related to the economical capability in terms of financial performance and market experience. This is not surprising. The question is whether the set of used criteria could be melted down to a smaller set - handier to use and producing the same results.
Table 3: Correlation matrix for used assessment criteria
Tech
nolo
gica
l N
ovel
ty
Tech
nica
l ch
alle
nge
Pra
ctic
al
valu
e/be
nefit
En
viro
nmen
tal
effe
cts
Aug
men
tatio
n of
Kn
ow-h
ow
R&D
dyn
am
ics
Fea
sibilit
y
Fina
ncia
l p
erfo
rma
nce
Man
agem
ent
Mar
ket e
xper
ienc
e
Ma
rket
pro
spec
ts
Com
mer
cia
lisa
tion
Exte
rna
litie
s
Soci
al im
pact
s
Technological Novelty 1,00
Technical challenge 0,47 1,00
Practical value/benefit 0,30 0,23 1,00
Environmental effects 0,21 0,18 0,34 1,00
Augmentation of Know-how 0,47 0,56 0,37 0,25 1,00
R&D dynamics 0,35 0,34 0,44 0,26 0,36 1,00
Feasibility 0,37 0,30 0,41 0,25 0,16 0,39 1,00
Financial performance 0,24 0,24 0,10 0,08 0,14 0,17 0,41 1,00
Management 0,32 0,31 0,19 0,08 0,23 0,34 0,42 0,43 1,00
Market experience 0,21 0,23 0,21 0,11 0,17 0,18 0,37 0,46 0,38 1,00
Market prospects 0,37 0,37 0,25 0,12 0,29 0,29 0,39 0,39 0,46 0,38 1,00
Commercialisation 0,27 0,25 0,24 0,10 0,20 0,23 0,44 0,54 0,42 0,60 0,49 1,00
Externalities 0,26 0,27 0,19 0,13 0,20 0,20 0,30 0,34 0,32 0,33 0,43 0,41 1,00
Social impacts 0,22 0,21 0,15 0,08 0,15 0,13 0,15 0,16 0,22 0,15 0,25 0,16 0,30 1,00 Source: FFF, own calculations The results of the factor analysis conducted suggest that regrouping the whole set of criteria into three main factors (Table 4) may be in order. The first factor groups all criteria pointing to the commercial potential of the project itself and the company’s ability to exploit them. Within the realm of factor 2 the technical quality of the project itself and technological capability of the submitting firm feed in. The grouping in factor 3 is less plausible. “R&D dynamics” relating to how strongly the submitting firm is committed to research and innovation is grouped with “environmental effects” of the project.

23
Table 4: Alternative grouping for criteria, factor loads Factor 1 Factor 2 Factor 3 Commercialisation .805 Financial performance .755 Market experience .745 Management .609 Market prospects .591 .418 Feasibility .568 .513 Externalities .539 Technical challenge .746 Augmentation of Know-how .712 Technological Novelty .640 Social impacts .520 Practical value/benefit .756 Environmental effects .689 R&D dynamics .627 Source: FFF, own calculations Results of the factor analysis have to be interpreted with some care as they only indicate similarities between patterns. This does not necessarily imply a causal relation between specific criteria. However, there are some interesting hints on how the assessment scheme works in practice. The first association supported by the factor analysis is that technological quality is fairly independent of the economic and managerial capability. On the other hand, FFF seems to assess the prospects of commercialisation in the light of economic and managerial capability of the submitting firm. Both are plausible. At this point an interesting implication arises: Firms with high financial and managerial capabilities do not necessarily submit better projects. From the perspective of additionality of granted funding one could argue that FFF should lift the crossbar with respect to technical quality of the project along with the financial and managerial capability of firm. Overall, we have seen that the range of criteria in use seems to group along three main areas of project assessment. Furthermore we observed some degree of overlapping (positive correlation) between specific criteria. Nevertheless we do not see room for reducing the number of criteria without loosing relevant information. For this the degree of correlation is too low. Finally some overlapping is reasonable as it allows crosschecking and provides the framework for identifying outstanding projects which to not fit in to mainstream patterns.
1.6.4. Overall assessment of the project assessment scheme In relation to our starting question on whether the assessment scheme has the right degree of differentiation, the analysis has revealed some cross dependencies between different criteria in use. Moreover the observed funding decision seems to be based on a much smaller number of criteria than are actually on offer. Nevertheless we think that the assessment scheme is appropriate:
• It is comprehensive. All relevant aspects of public funding of private R&D are covered. The whole range of criteria is needed as all bring in additional relevant information. A certain degree of overlapping is reasonable as it allows crosschecking and helps to identify “unusual” projects.
24
• It is principally able to address specific needs and challenges of firms as it uses a differentiated scoring system putting different weights to different dimensions of assessment.
• Moreover it is built as a generic tool. Thus it can be further developed and adapted to new goals. This flexibility is a valuable asset.
• The high degree of standardisation helps to keep a relatively high level of objectivity.
• It is easy to use. Although it might seem complex and over differentiated the supporting software application is user-friendly.
• The assessment scheme is a powerful monitoring tool allowing a wide range of in-depth analysis for evaluation and scientific research.
In sum, the assessment scheme in place depicts high functionality and a solid base for profound project assessment. As for the practical use of the assessment scheme on hand and its implications on project selection, it seems that FFF does not deploy the whole potential of the scheme. In some respects the way the assessment scheme is used contradicts the general accepted funding rational. We suggest the following changes:
• Project selection is risk averse in at least two respects: o The highest ranking criteria (maximal score value 30) is the financial
performance of the submitting firm. This does not only favour big firms but reduces the expected additional impact of funding8. In practice however, FFF is shown to be more tolerant in its funding decision as the internally set threshold for the economical assessment of the submitting firm seems to be lower than officially stated. Funding rationality supports this practice. Consequently we suggest that the assessment scheme should be aligned to observed practice. Financial capability might even be neglected for the project assessment as long as immediate risk of financial fall out can be excluded.
o The vast majority of funded projects are neither particularly risky nor expected to trigger a significant “augmentation of know-how” of funded firms. Moreover factors that eventually discriminate most between funded and rejected projects are not the technical quality or risk but the prospects of commercialisation and feasibility. All in all this result leaves quite some room for lifting the funding crossbar. We suggest a reconsideration of the scoring scheme in order to concentrate funding resources more precisely on technological challenge and/or expected learning effects for the submitting firm.
• Targeting specific groups: To enhance funding impact further, project assessment could differentiate between specific groups of firms. As it is used, the assessment scheme covers a big range of settings which indeed should be addressed. For example small newcomer firms are favoured when it comes to “augmentation of knowledge” as they tend to start from lower levels. Innovation champions have an advantage when it comes to “novelty”. Both
8 For example: The checklist for assessing the financial capability of the submitting firm includes the isolated assessment on how the submitted projects will be funded. In this dimension the case of “project can be funded from cash-flow” ranks highest (“++), whereas “financing of the project is secured even though it reaches the limits of financial capability of the firm” is assessed negative (“-“). Accepted funding rational would suggest that additionality is higher in the later case. Thus to reverse the scoring guideline seems to be a reasonable option.

25
make sense. However the problem is that in this scheme, different criteria tend to leverage each other out. With increasing rejection rates it might become necessary to target more precisely specific groups. Big firms for example could be faced with higher standards when it comes to “novelty” or “technical challenge” of the proposed innovation, whereas small firms should face stronger incentives when it comes to “knowledge augmentation”. The implementation of a customized assessment scheme would require reversing the assessment workflow (economic assessment before technical assessment) and developing an extension of used software in order to allow the scheme to use customized scoring schemes.
• Dealing with big firms: With the suggested changes it should be possible to deal more transparently with big firms. The current assessment scheme favours big firms to an extent that seems not justified by common funding rationale. This was confirmed by the fact that FFF informally limits the funding volume for the big Austrian innovation champions9. Such informal practice might be necessary in certain cases. However it goes at the cost of transparency and is a way to surpass legitimate questions on how the funding cake should be allocated. Do deal with this issue openly would be another step towards a transparent and better steered funding system.
• Mission oriented criteria: FFF uses a range of criteria that try to link missions to the funding decision. As those criteria have a fairly small score value the practical implication is limited to the KO-threshold. It is important to include such criteria as they at least allow FFF to single out “problematic” projects which contradict values shared by society. The practical use of these criteria suggests, that they should either be ranked higher (more scores) or scaled down to mere KO-criteria.
• Linking up to budgetary situation: We have seen that the sample of rejected projects that did overcome the stated (KO!) requirements is increasing over time. We expect that implicitly this is caused by tightening budgets in recent years. Moreover we have seen that demand driven budgeting practice, that does not link the budgetary situation to project selection is problematic. An explicit link between budgetary situation and selection process is needed. With the current assessment scheme in place, it is possible in principle to rank projects as a precondition for setting the rejection line in accordance with the budgets available.
1.6.5. Do firms adapt to the project assessment scheme? Project assessment schemes are a tool to take and to legitimate the funding decision. There is however a second important side of the coin: Firms have a clear incentive to reduce risk of rejection. Thus one can expect that they learn from past experience and try to submit projects with realistic chances of receiving funding. It is in the interest of the funding organisation to actively communicate project requirements and project assessment practice. The aim is to reduce transaction costs caused by project rejection. Exhibit 14 shows that firms have indeed learned from past experience. The
9 The big innovations champions are usually asked at the beginning of the year to disclose their projects portfolio for the starting year. On this basis FFF selects those projects where funding seems to be most legitimate even though there might be other projects that would meet the FFF funding criteria as well. In this way FFF eventually limits the funding volume of big firms that could otherwise absorb a substantial share of available budgets.
26
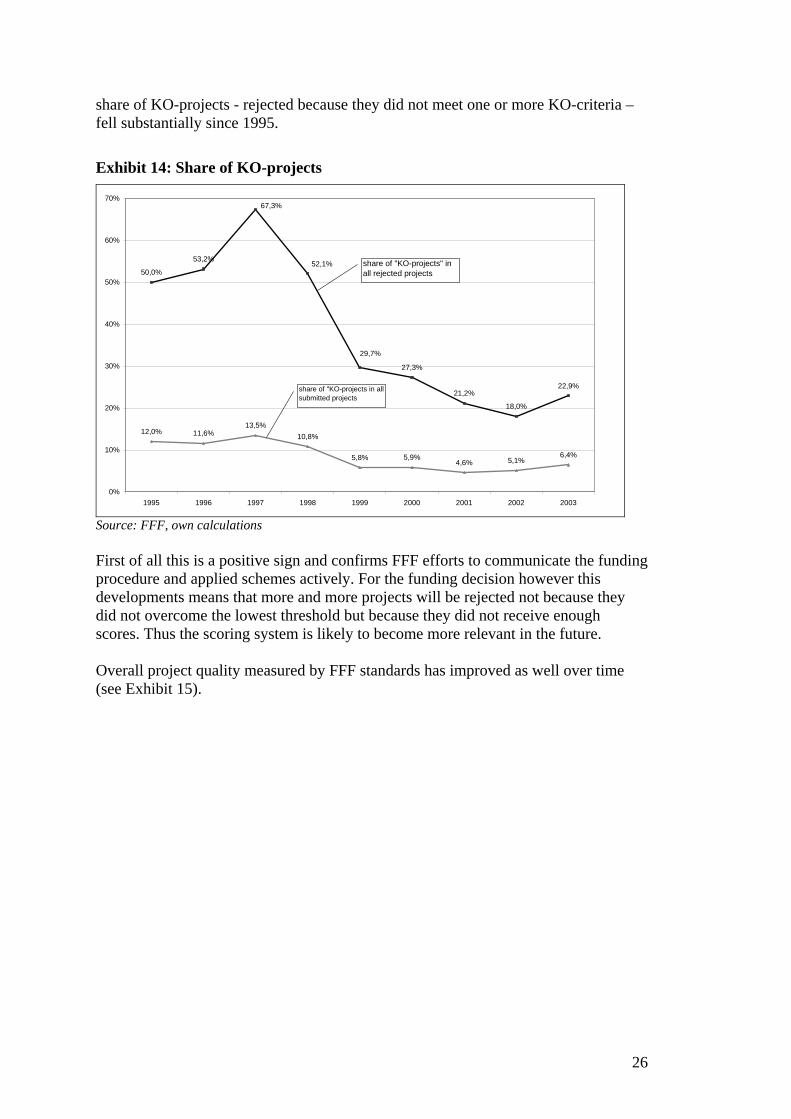
share of KO-projects - rejected because they did not meet one or more KO-criteria – fell substantially since 1995.
Exhibit 14: Share of KO-projects
50,0%
53,2%
27,3%
21,2%
18,0%
22,9%
12,0% 11,6%13,5%
10,8%
5,8% 5,9%4,6% 5,1%
6,4%
67,3%
52,1%
29,7%
0%
10%
20%
30%
40%
50%
60%
70%
1995 1996 1997 1998 1999 2000 2001 2002 2003
share of "KO-projects" in all rejected projects
share of "KO-projects in all submitted projects
Source: FFF, own calculations First of all this is a positive sign and confirms FFF efforts to communicate the funding procedure and applied schemes actively. For the funding decision however this developments means that more and more projects will be rejected not because they did not overcome the lowest threshold but because they did not receive enough scores. Thus the scoring system is likely to become more relevant in the future. Overall project quality measured by FFF standards has improved as well over time (see Exhibit 15).

27
Exhibit 15: Mean scores of submitted projects, KO-projects excluded
technical evaluation of the project
2022242628303234363840
1995 1996 1997 1998 1999 2000 2001 2002 2003
aver
age
scor
e
Standard deviation
technical evaluation in relation to the company
2022242628303234363840
1995 1996 1997 1998 1999 2000 2001 2002 2003
aver
age
scor
e
economic evaluation of the company
2022242628303234363840
1995 1996 1997 1998 1999 2000 2001 2002 2003
aver
age
scor
e
economic evaluation of the project
2022242628303234363840
1995 1996 1997 1998 1999 2000 2001 2002 2003
aver
age
scor
e
Source: FFF, own calculation Interestingly the technical evaluation in relation to the company shows the most significant and clear upward trend. At the same time the economic evaluation of the company seems to reflect the overall economic situation.
1.7. Funding instruments The only way FFF differentiates between good and average (but funded) projects is by tailoring the combination of financial instruments. Four different instruments are available: (i) grants, (ii) loans, (iii) subsidies for interest of bank loans, (iv) guarantees for bank loans. Exhibit 16 shows the distribution of used instruments. The two core instruments directly served by the FFF budget obviously are grants and loans. Interestingly the loan to grant ratio has seen significant changes over time. While in the first three years of observation (1995 – 1997) the funding volume of loans exceeded that of grants, this pattern changed in the year 1998. Since then grants have been the most important funding instrument. This complies with the development of the average funding intensity.

28
Exhibit 16: FFF funding instruments
64,6 67,0
83,189,0
98,1
123,6
113,3
121,3
-
20
40
60
80
100
120
140
1995 1996 1997 1998 1999 2000 2001 2002
[mill
. EU
RO
]
grantsFFF loansinterest grants for bank creditsguaranteescash value of total funding
Source: FFF, own calculations With the funding instruments on hand FFF can tailor its funding activities according to specific needs. Roughly speaking, grants arethe bonus for taking risks whereas loans and guarantees provide cash flow for bridging financial burden before returns can be generated. Exhibit 17 shows that FFF has faced relatively low default rates. The respective range was between 0.87% (1997) and 2.38% (2002). This is lower than the default rate which can be observed in the bank sector. The significant increase during the last two years goes mostly back to projects in new technology fields (biotech and information technology) with many start-up firms. Two different interpretations are possible here: First, FFF runs a restrictive credit policy. Second, innovating firms are less in danger of insolvency than the rest of firms using bank credits. In the absence of stronger evidence for one of those interpretations, a mixture of both seem a reasonable guess. Exhibit 17 points to an additional option FFF has when deciding on what funding instruments should be used: Loans can be converted into grants ex-post. This can be donein cases where projects are terminated because of technical reasons. Even though FFF has increasingly used this option the number of converted loans remains low. Nevertheless the possibility to react to project performance ex-post makes sense. Innovation projects can fail. It is also possible that both sides, FFF and the submitting firm, underestimated the project risk at the beginning. In this context, the conversion of loans is a signal that failure is not punished.

29
Exhibit 17: Default rate loans, ex-post conversion of loans
0,0%
0,5%
1,0%
1,5%
2,0%
2,5%
20022001200019991998199719961995
% o
f out
stan
ding
loan
s
default rate for loans
ex-post conversion of loans into grants
Source: FFF, own calculations How does FFF decide on the instrument mix to be used? FFF has tried to standardise the decision on funding instruments. As a general rule up to 50% of accepted project costs are funded. In this context funding stands for provided cash flow. The cash value of funding depends on the share of the provided loan. The higher the share of loan is, the lower the cash value of total funding gets. The decision upon what share of loan is applied depends on
• project risk: high risk leads to a decrease of the loan component and thus to an increase of the overall cash value of funding,
• know-how augmentation: outstanding projects (resembling a big technological step for the individual company) receive a lower share of loan, thus again increase the relative cash value of funding,
• financial capability: weak financial position of the applying firm increases the share of grant, unless danger of liquidation is deducted (KO!). Start-up firms further benefit from a higher multiplier.
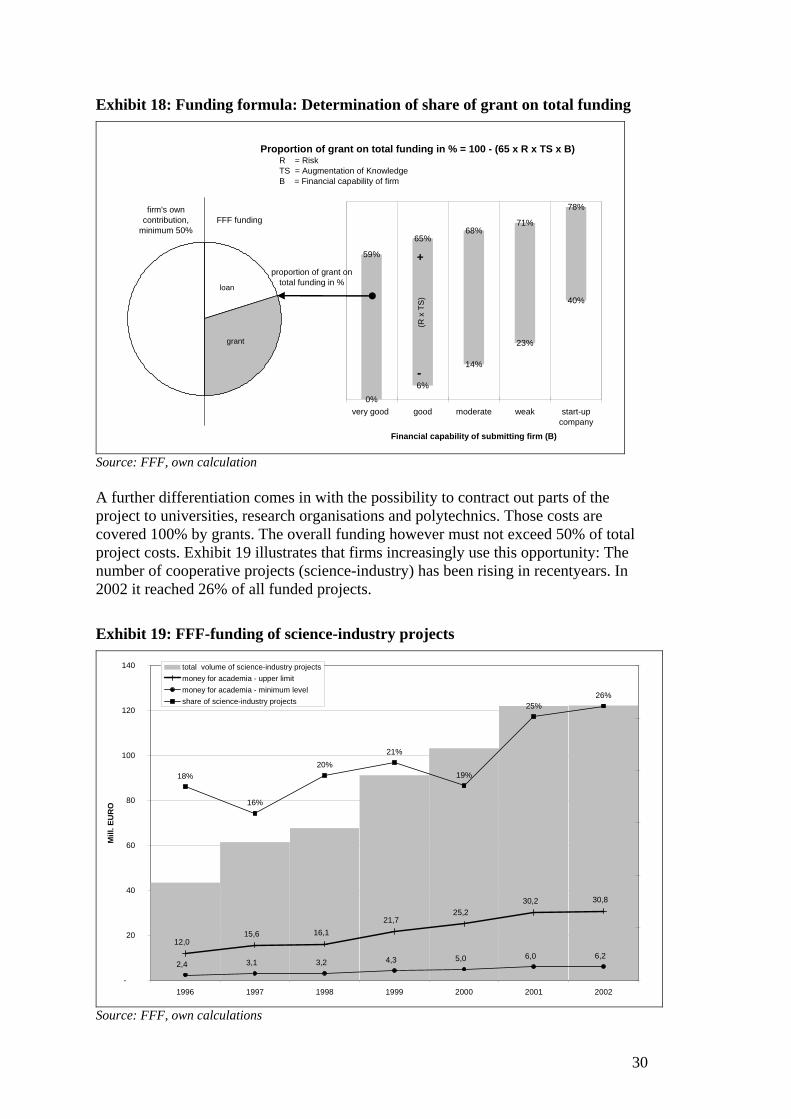
Exhibit 18 shows how the funding formula works in practice. It illustrates possible ranges of funding intensity depending on the financial assessment of the company. Overall the maximum share of grant as a proportion of total funding is 78% for start-up companies with a high risk project.
30
Exhibit 18: Funding formula: Determination of share of grant on total funding
0%6%
14%
23%
40%
59%
65%68%
71%
78%
very good good moderate weak start-upcompany
Financial capability of submitting firm (B)
+
-
(R x
TS
)
loan
grant
firm's own contribution,
minimum 50%FFF funding
proportion of grant on total funding in %
Proportion of grant on total funding in % = 100 - (65 x R x TS x B) R = Risk TS = Augmentation of Knowledge B = Financial capability of firm
Source: FFF, own calculation A further differentiation comes in with the possibility to contract out parts of the project to universities, research organisations and polytechnics. Those costs are covered 100% by grants. The overall funding however must not exceed 50% of total project costs. Exhibit 19 illustrates that firms increasingly use this opportunity: The number of cooperative projects (science-industry) has been rising in recentyears. In 2002 it reached 26% of all funded projects.
Exhibit 19: FFF-funding of science-industry projects
12,0 15,6 16,1
21,7 25,2
30,2 30,8
2,4 3,1 3,2 4,3 5,0 6,0 6,2
18%
16%
20%21%
19%
25%26%
-
20
40
60
80
100
120
140
1996 1997 1998 1999 2000 2001 2002
Mill
. EU
RO
total volume of science-industry projectsmoney for academia - upper limitmoney for academia - minimum levelshare of science-industry projects
Source: FFF, own calculations

31
The described formula applies to the majority of bottom-up projects submitted to FFF. However some derivations occur for specific project types. For example feasibility studies generally receive a higher share of funding (see chapter 1.8 on programming for more details). Exhibit 20 illustrates the distribution of cash value as a fraction of total project costs. Interestingly it has been increasing over time even though the overall funding share (total cash value/total project costs, see Exhibit 3) has been fairly stable in the same period of time. This points to a shift in the distribution of funding intensity: Relatively smaller projects receive higher funding while relatively bigger projects receive lower funding over time. Consequently, the mean value (not adjusted for project size) has increased. If we take the whole period of time, the distribution of funding intensity is astonishingly concentrated: 42% of projects receive between 20% and 25% funding coverage of total project costs. Even though the distribution seems to have flattened out towards the right hand side in recent years, concentration remains high.
Exhibit 20: Cash value of funding as share of total project costs
0,00
0,05
0,10
0,15
0,20
0,25
0,30
0,35
0,40
0,45
0,05 0,1 0,15 0,2 0,25 0,3 0,35 0,4 0,45 0,5 0,55 0,6 0,65 0,7 higher
cash value of funding / total project costs
rela
tive
freq
uenc
y
period: 1995 - 2003mean: 0.28median: 0.23Std. Dev: 0.14N = 4,389
cash value of funding / total project costs, mean
0,100,150,200,250,300,350,400,450,50
1995 1996 1997 1998 1999 2000 2001 2002 2003
Standard Deviation
Source: FFF, own calculation At first sight the way FFF tailors its funding instruments complies with common funding rational. FFF rewards high risk. What remains questionable however is the way FFF deals with the second important innovation barrier: access to financial resources. As the funding volume is preset (50% of project costs) and both risk and learning is addressed purely by the share of grant, there is no room for individual adjustments in the third dimension: financial capability. In practice, firms with a weak financial position and reduced access to credit capital do not receive a higher share of funding in terms of provided cash (flow - not cash value!) than firms with stronger financial positions. In the end the funding formula is exclusively focused on the cash value of funding and does not address financial preconditions in an appropriate manner.

32
In order to better align FFF funding to all three relevant dimensions – risk, learning and access to financial resources – we suggest the breaking up of and simplification of the funding formula:
• FFF uses grants as the dominant instrument for covering risk and learning effects. This is reasonable and keeps financial administration of funding efficient. There is however no reason for presenting the total funding at a fixed level. There is also no reason for mix instruments (grants and loans) in any case. We suggest that FFF removes the preset share of funding and gives up the forced mix of instruments. Grants could then become the default instrument that alone covers risk and learning effects.
• Loans and guarantees are valuable instruments when it comes to overcoming difficulties in accessing credit capital in order to finance R&D-projects. FFF should be able to give out loans whenever this problem occurs. However there is no reason for linking the provision of loans or guarantees with the provided grant. The message here is, to use two different types of instrument independently in order to address different types of market failures (risk averse firms and risk averse capital markets). Naturally, the funding limits set by the EU apply.
In the end this should further broaden the distribution of funding intensity, as has been observed during recentyears.
1.8. Programming The presented chart underlines the strong focus on bottom-up project funding. However this does not imply that FFF does not use measures to target specific technology areas or specific types of R&D-project settings (e.g. science-industry cooperation). First steps to use top-down elements in its funding activities were set in the course of implementing ITF-programmes. ITF was set up as a virtual fund dedicated to the implementation of technology programmes. Virtual in this context means that FFF and ERP10 were responsible for the financial execution of the programmes and brought in their project assessment competence. Design and steering however were either directly in the hands of the responsible ministries, or contracted out by them to external experts. Table 5 shows the number of projects FFF funded under ITF-rules.
10 ERP was the second major fund for the Austrian enterprise sector at the national level. Other than FFF with a clear focus on research, ERP is positioned closer to the market focusing on financial support for development and investment projects. However the frontline between FFF and ERP has not always been clear-cut.

33
Table 5: ITF-projects funded by FFF
1995 1996 1997 1998 1999 2000 2001 2002 2003 total
number of funded projects Funding intensity*
Energietechnik-ITF 1 2 5 4 1 13 28%
FlexCIM 23 18 8 4 53 24%
Technologien f.d. Informationsges. 1 30 75 58 48 27 14 3 256 25%
Industrial Design ITF 30 16 6 52 34%
Verkehrstechnik 7 12 35 5 1 60 23%
Softwaretechnik 57 47 42 36 11 1 1 195 26%
Technologietransfer 13 28 31 22 24 8 4 1 131 37%
ITF - ohne Sonderbereich 3 6 1 10 33%
ArbeitnehmerInneneinbindung 8 4 12 24%
Haus der Zukunft – Vorlauf 5 5 34%
Total 121 115 155 163 97 73 41 18 4 787 *cash value as proportion of total project costs, mean In retrospect, ITF provided an important test and learning environment for implementing the concept of technology programmes in Austria. This was in the mid 90s with the ITF-transport programme and ITF Flex-CIM programme setting new visible standards. The implementation of technology programmes within the rather complex ITF-setting was not as smooth as most protagonists might have hoped. Nevertheless technology programmes as a way to bundle scarce resources and to create R&D-communities in specific thematic areas have become an important element in the Austrian R&D-funding system. The role of FFF in this development was to some extent ambiguous. On the one hand many observers have seen FFF being fairly reluctant to take up top-down programming activities. At the other hand FFF has build up programme management competence and actually provided programme management services for several technology programmes, competence networks (Knet) and industrial competence centres (Kind) on a contract basis. Besides its involvement in implementing top-down programmes on a contract basis, FFF has also made first steps in introducing top-down programme elements in its bottom-up funding activities. In practice FFF has launched a range of thematically orientated funding lines. Good examples for this are various funding lines for specific sectors or technology clusters like wood or food. Those specific funding lines are most of all used as marketing and communication tools, which should help to reach sectors with perceived particular research or innovative needs. On the level of project assessment and selection, projects submitted under the heading of such a funding line are usually treated the same way as other bottom-up projects. Another way FFF tries to target specific problems or groups is by launching funding lines with specifically tailored funding instruments. This is further supported by increased marketing measures. For example, FFF runs a funding line for feasibility studies that allows higher grants as a share of total project costs. Another interesting example in this context is the funding line “F&E-Dynamik”. This has been launched to mobilise newcomers or first time innovators. The specific incentive is reached by a more generous coverage of investments in research equipment. Table 6 illustrates those specific funding lines that FFF has launched since 1995.

34
Table 6: FFF funding lines 1995 1996 1997 1998 1999 2000 2001 2002 2003 total number of funded projects
Funding intensity*
Holzforschung 15 44 66 71 53 1 250 30% Mikrotechnik 22 34 53 109 26% WFW-Kontaktprojekte 17 2 1 20 41% Nachwuchsförderung 38 23 37 36 33 41 23 22 23 276 36% Lebensmittel-Initiative 46 62 65 53 46 33 305 30% F&E-Dynamik 2 13 17 8 6 46 23% Feasibility 4 23 23 48 32 130 65% Start Up Förderung 4 92 107 203 29% EU-BMVIT 41 41 44% Total 70 69 104 153 154 142 143 250 295 1380
* cash value as proportion of total project costs, mean Moreover FFF offers a range of funding measures for participation in international (mostly EU) programmes, like EURKA, EU-FP’s, structural funds or COST. Overall FFF has clearly opened up to more top down funding activities and has become more active in promoting and packaging its funding product to specific groups. In sum however, FFF has not become a real driver and programme entrepreneur. Programme design seems still to be the domain of the ministries. FFF remains in its core business clearly a bottom-up research funding institution.
1.9. Learning FFF During the last decade the Austrian funding system has seen substantial changes. Technology and research programmes were introduced as a new way to mobilise research communities in specific areas. Along with increased programming efforts, a culture of evaluation has also evolved. FFF took part in this development to the extent that it expanded its portfolio towards programme management tasks. With respect to evaluation, FFF started to commission evaluations for specific funding lines. So far however, FFF has not developed an explicit evaluation strategy. This seems also to be reflected in the organisational setting, where no dedicated in-house capacity for evaluation and monitoring is foreseen. With around 40 employees the FFF-Secretary is a lean and extremely focused organisation. Division of labour is arranged around the one dominating task: assessment of submitted proposals and financial handling of running projects. There is no specialisation beyond thematic areas of competence (Software, new materials etc.) that had to be developed in order to build up project assessment competence. Tasks not directly linked to project assessment and financial control are done mostly on an ad hoc basis and in addition to the core task. Interestingly even the team of executives is still involved in project assessment. Against this background, project assessment can be seen as the real core of FFF. The scheme in place is the essence of FFF’s funding policy. It is the common ground for internal discussion and the major training tool for new entrants. Programme management tasks FFF has taken over on contract basis have proved to create important learning opportunities. As in most programmes project assessment and selection is done by an external expert group, FFF had the opportunity to mirror own assessment competence and styles vis a vis external juries. Another important

35
exercise FFF has started is to compare ex-ante project assessment results with ex-post assessment. This exercise was done with the help of an external consulting group (KMU Forschung Austria). TAFTIE, the European platform of funding organisations, has been another important learning source for FFF. Last year (2003) FFF took over the presidency of the TAFTIE-network. In the past TATFIE has most of all been a fruitful platform to exchange experience and further develop funding tools. In this respect FFF discussed its own project assessment scheme in an international setting with the result thatother European funding institutions also took up core elements of the FFF-system. In retrospect, FFF obviously has proved to be a learning organisation. It opened up to new styles of public research funding (technology programmes) and increased its efforts to evaluate its own work. However FFF’s organisation of workflow sets limits to develop specialised competence not directly related to project assessment and financial handling.
1.10. Monitoring and Controlling Most of the analysis presented in this chapter is based on the monitoring information provided by FFF. In this context the project assessment scheme has proved to be a powerful monitoring instrument. It allows monitoring of the project portfolio (submitted and funded) with a high level of differentiation. Furthermore a range of firm specific data is collected in the course of the application procedure. Taken together, FFF monitoring has a solid database on hand that allows in-depth monitoring of its funding activities. Nevertheless some shortcomings have been identified in the course of this evaluation. Most important deficits came up with respect to FFF’s specific positioning in the Austrian funding system. As the biggest funding agency with its long history and broad coverage, FFF funding activities can be taken as a fairly precise fingerprint of the innovative enterprise sector. Against this background, monitoring is not just a controlling tool for the financial execution of the funding task. More than that it should provide contemporary information on priorities and trends within the Austrian enterprise sector. This is highly relevant information needed in all phases of the so-called policy cycle (problem analysis, design of new programmes, execution and evaluation). To some extent FFF has tried to take up this observing role. Besides collecting the basic information on project characteristics, FFF keeps track of its funding activities in some fields of specific interest. Most of these fields refer to high-potential technology fields like “Bio Science”, “Material Science” or “Micro electronics”. Furthermore a range of specific characteristics were put on the monitoring check list. Among others, FFF documents “strategic projects” as well as projects submitted by Austrian branches of multinationals. Each of these categories are worth being included in a monitoring system of the biggest Austrian funding agency. However the list of covered categories is neither comprehensive nor coherent. The currently used list of technology fields highlights the most obvious high-tech areas missing out on a whole range of more traditional ones. Furthermore generic projects characteristics like

36
product innovation or process innovation are completely missing. Finally the use of categories is optional for the project assessment managers. All this results in a statistical artefact with very limited significance: During the time of observation (1995 – 2003) only half of projects have been assigned to specific categories. Counting specific categories reveals implausible fluctuations. Overall the attempts to establish a meaningful monitoring tool for observing the innovative dynamic of the Austrian enterprise sector did not succeed so far. We suggest a reworking of the used list of observed categories. The goal should be to be coherent in the level of observation and comprehensive in the sense that used categories cover the whole spectrum of possible projects.

37
2. Customer content analysis
This section deals with the customers’ evaluation of the FFF funding scheme. Subsection C.1 explores firms’ former experiences with the FFF. Here, various aspects relating to the FFF’s customer advisory service are discussed, as well as the customers’ satisfaction with the terms of support (in case FFF-assistance has indeed been granted). The following section makes some inquiry into the kind and amount of resources companies put into the FFF-application process, and finally some careful attention is focused on the particular feedback of the unsuccessful candidates. To not bother the reader with too extensive presentation of the data, most tables merely display summary results for the total sample. Detailed analyses by sector-affiliation, firm-size and FFF-feedback category (see section A) are only tabled by exception, but will be discussed whenever differences across various subgroups turn out statistically significant.11 Whether differences between subgroups turn out statistically significant depends to a considerable degree on the selected sample, i.e. if observations which do not fall into a well-defined sub-group are to be included as well, and, more importantly, how to proceed with missing answers. As a rule of thumb, observed differences are less significant the more constrained the sample. Missing entries may either express indifference (e.g. some criteria are equally hard as easy to meet), or, alternatively, the question is left unanswered because the respondent is not able to judge on that issue. Observations should be deleted from the sample only if the latter case applied, in general practice, however, it is quite troublesome to tell the difference. For this reason detailed analyses will be based on the sample defined by the set of firms which fall into a well defined subgroup and which actually answered the specific (sub-)question. The only notable exception refers to Table 11.
2.1. Firms’ judgements about the FFF Table 7 contains several aspects of FFF-governance on which firms were asked to comment on (Question 18). For each issue observed differences across feedback categories, as well as across firm-size categories turn out statistically significant at a reasonable significance level (p<0.05). In contrast, differences across various sub-sectors prove to be statistically significant only with respect to sub-questions two (consultancy services for writing the initial proposal) and three (competence to judge the proposal on technical grounds). For the former the distinctness is governed by the inherent R&D-intensity, or knowledge-intensity, respectively: within traditional companies 16% complain about poor consultancy services at the initial stage, while that share amounts to only 11% in case of the set of companies which are more prone to the adoption of modern technologies. The total servicing sector is somewhat more suspicious about the FFF’s ability to properly judge a project on technical grounds (15%), within the industrial sector this kind of supposition is only stated by one in ten respondents. It does not come by surprise that firms with only positive feedback by the FFF highly appreciate the fund’s governance on their part. If, on the other hand, projects have (repeatedly) been turned down by the FFF, respondents are far less content with the fund’s management, while the group of companies sharing mixed FFF-experience
11 Unless otherwise stated a significance level of 95% applies.

38
falls in between these two extremes. This ordering is prevailing in respect of every aspect of FFF-governance and holds in particular for the questions relating to the fund’s (in)competent judgement. 45% (40%) of the rejected firms doubt the fund’s ability to properly evaluate the merits of a project on technical (commercial) grounds. Top grades, on the other hand, are given in respect of the confidentiality with which the FFF is handling the proposals sent in by the candidates. In total 90% of the sample firms agree that this aspect of FFF-governance is “very good”, “good” or at least “satisfactory” and only 2% state the contrary. There is nearly equally unanimous agreement that information about the fund is readily available and sufficient (89% vs. 8%).12 If there was a weak point at all it related to poor consultancy services during the implementation phase of the project: “only” three out of four respondents acknowledge the FFF’s efforts in this respect – a service, by the way, which is not the fund’s original business anyway. In case of the rejected firms a share of 44% claim that consultancy services during the application phase were poor as well.
Table 7: General appraisal of the FFF’s working (Question 18)
very good good satisfactory bad very bad missing Total
Availability of information 500 460 194 68 40 34 1296 about support schemes 38.58 35.49 14.97 5.25 3.09 2.62 100 Consultancy services 394 416 281 101 59 45 1296 for writing the proposal 30.4 32.1 21.68 7.79 4.55 3.47 100 Competence to judge the project 487 397 208 91 66 47 1296 on technical grounds 37.58 30.63 16.05 7.02 5.09 3.63 100 Competence to judge the project 435 417 237 95 62 50 1296 on commercial grounds 33.56 32.18 18.29 7.33 4.78 3.86 100 Speed of treatment 373 449 291 86 55 42 1296 28.78 34.65 22.45 6.64 4.24 3.24 100 Confidentiality 777 262 124 19 12 102 1296 59.95 20.22 9.57 1.47 0.93 7.87 100 Consultancy during implementation 246 346 386 144 60 114 1296 phase of the project 18.98 26.7 29.78 11.11 4.63 8.8 100
Source: survey When question 18 is evaluated by firm-size category we find the share of companies dissatisfied with a particular FFF-governance issue to be increasing byfirm-size. A vast majority of the micro-sector firms appreciate aspects like “availability of information” and “speed of treatment”, but about one in five firms of the smallest size-category feel some discomfort with the core activities of the FFF. Overall, the general appraisal of the FFF’s working is turning out very positive, however. In a subsequent question firms were asked to evaluate various aspects of FFF-support. Naturally, for this question the relevant sample is reduced to the set of 1131 firms in total which have been provided with FFF-assistance at least once. Table 8 presents aggregate results in descending order of appreciation. From here a strong notion arises that FFF-assisted firms in general value the terms of support quite highly. The fraction of firms feeling uncomfortable with particular sponsoring conditions actually never reaches even 20%. This general appraisal would turn even more positive if the sample consisted only of firms whose application for FFF-support has never been rejected. 12 The first (second) figure gives the percentage of firms who appreciate (are not content with) a specific governance aspect.

39
Again, the analysis by firm-size reveals that the share of respondents being pleased (discontent) with a support-detail is increasing (decreasing) in firm-size. Differences between respective size-categories turn statistically insignificant only with respect to sub-question 36.2 (the amount of financial assistance granted in relation to the entire costs of the project). If the sample was grouped according to sector-affiliation, the servicing sector proves to be somewhat less satisfied in that respect and similarly a higher share of respondents within the servicing sector argue that FFF-support should cover a wider range of expenditure items related to the project (sub-question 36.5).
Table 8: Evaluation of the terms of support (Question 36) yes, basically basically not at Terms of FFF-support indeed yes indifferent no all missing Total The modes of (re)payment 395 411 165 45 14 101 1131 34.92 36.34 14.59 3.98 1.24 8.93 100 Amount of financial assistance in relation 274 432 237 77 23 88 1131 to the effort if took to write the proposal 24.23 38.2 20.95 6.81 2.03 7.78 100 The recognition of project cost 273 394 228 83 40 113 1131 allowable for deduction 24.14 34.84 20.16 7.34 3.54 9.99 100 Amount of financial assistance in relation 140 434 296 143 25 93 1131 to the cost of the project 12.38 38.37 26.17 12.64 2.21 8.22 100 Amount of non-repayable grants in relation 146 319 303 179 38 146 1131 to the provision of soft loans 12.91 28.21 26.79 15.83 3.36 12.91 100
Source: survey
2.2. Firms’ resource inputs into the FFF-application process In a following question respondents were asked to comment on the administrative effort which arises from the whole FFF-process (Question 19 of the questionnaire). Summary results for the total sample (displayed in Table 9) show that the vast majority do not consider its administrative inputs as disproportionately high. The only exception relates to the effort it takes to write the initial proposal, where one out of four firms complain about too much input. Needless to say, any administrative input will be regarded as too high if eventually public support is denied, while the same amount of resources would have been more acceptable in the case of final admission.
Table 9: Administrative effort of applicants in connection with the whole FFF-procedure (Question 19)- total sample Effort in respect of Low appropriate High no experience yet Missing Total initial proposal 48 869 342 -- 37 1296 3.7 67.05 26.39 -- 2.85 100 discussion & modi- 293 752 160 -- 91 1296 fications of proposal 22.61 58.02 12.35 -- 7.02 100 interim report 105 774 204 139 74 1296 8.1 59.72 15.74 10.73 5.71 100 final report 32 822 192 175 75 1296 2.47 63.43 14.81 13.5 5.79 100 Auditing and 82 745 138 241 90 1296 revision process 6.33 57.48 10.65 18.6 6.94 100
Source: survey

40
Table 10 summarizes the results of the more detailed analyses. The auditing and revision process is evaluated as significantly different by all relevant subgroups. In other words whether the analysis is conducted by FFF-feedback category, by sector-affiliation, or by firm-size, the distribution of categorized answers is characterized by distinguishable patterns across the categorical attributes. Results by firm-size reveal that the largest companies do not spend much capacity in the revision process and the same is true – with some reservation- for the micro-sector firms. Across branches companies affiliated to traditional sectors (to traditional industries as well as to traditional services, respectively) seem to face the greatest problems in this respect: one out of five firms that fall into these subgroups consider the revision process as rather lengthy. The respective share amounts to 30% in the case of firms in the negative FFF-feedback category.
Table 10: Administrative effort of applicants in connection with the whole FFF-procedure (Question 19)- Differences between sub-goups are statistically significant in case ofa by FFF-feedback by sector- by firm- Effort in respect of Category affiliation Size initial proposal Yes No No discussion & modification of proposal Yes No Yes interim report No Yes No final report No Yes Yes Auditing and revision process Yes Yes Yes
a) Constrained sample: firms are only considered if they (i) fall into a well-defined subset, (ii) have gained relevant experience and (iii) have actually answered the specific sub-question of Question 19. Source: survey In contrast, the administrative and time efforts it takes to prepare interim and final reports significantly vary across sector-affiliation but are similarly evaluated by FFF-feedback categories. Most obviously this finding is due to the fact that firms that have been repeatedly rejected by the FFF are dropped because they lack relevant experience. To go into details, servicing firms are generally less troubled by the preparation of such reports as compared to manufacturing firms and within each aggregate sector, it is particularly the R&D-intensive industries and the knowledge-intensive services, respectively, which seem to have built up professional skills and capacities to write such reports. The analysis by firm-size reveals that the administrative input for the final report is at a peak for firms with 10 or more employees and is decreasing with rising-firm size thereafter. Lastly, the FFF-feedback category proves to be a very distinguishing feature with respect to the effort it takes to write the initial proposal and the required input to discuss and adapt it. Nearly every second firm that has been (repeatedly) rejected by the FFF claim that the necessary input in respect of the initial proposal is disproportionately high and one out of three is bothered by a lengthy, apparently fruitless adaptation process. This must be so much the more frustrating because within this subgroup the share of firms hiring external expertise is significantly higher than in other FFF-feedback categories (see Table 11). When sample firms are categorized by size, the share of companies complaining about too long discussions and modifications is decreasing by firm-size – as is, by the way, the share of companies seeking for professional assistance to write the initial proposal. Of course final rejection lowers the acceptance of invested resources ex post, this is one of the trivial messages from the analysis of question 19. Irrespective of the validity of this general rule, Table 12 shows however, that unsuccessful FFF-
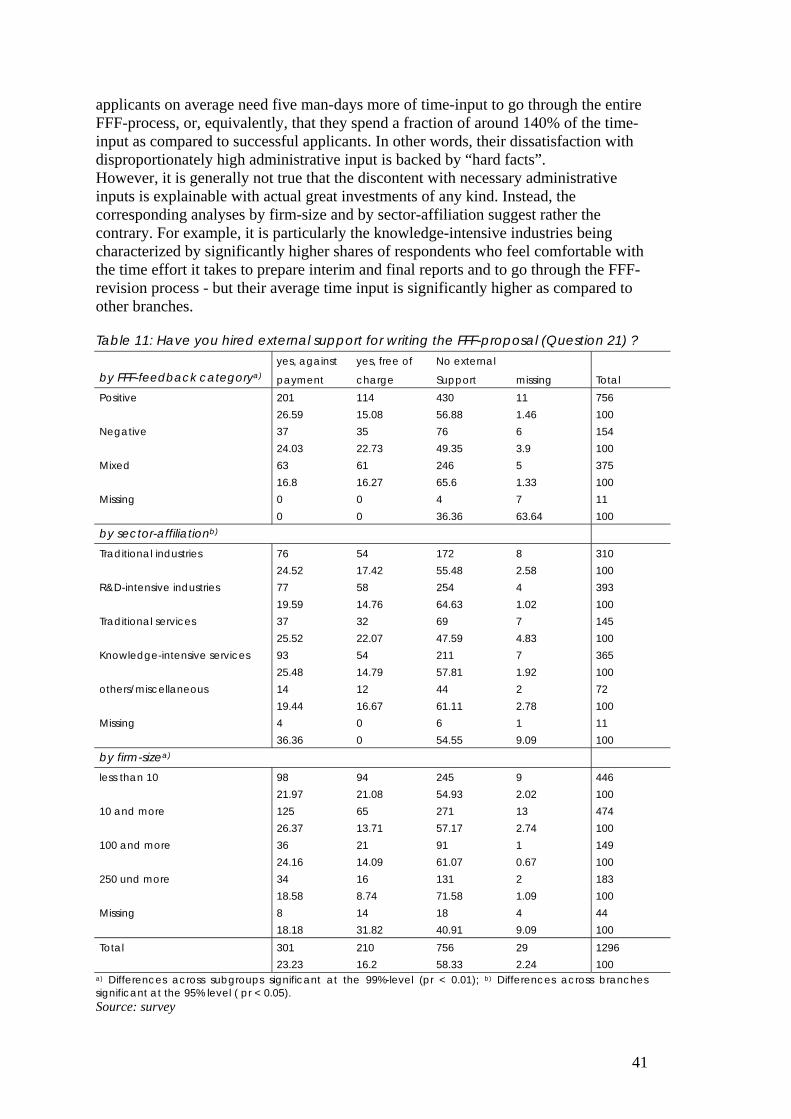
41
applicants on average need five man-days more of time-input to go through the entire FFF-process, or, equivalently, that they spend a fraction of around 140% of the time-input as compared to successful applicants. In other words, their dissatisfaction with disproportionately high administrative input is backed by “hard facts”. However, it is generally not true that the discontent with necessary administrative inputs is explainable with actual great investments of any kind. Instead, the corresponding analyses by firm-size and by sector-affiliation suggest rather the contrary. For example, it is particularly the knowledge-intensive industries being characterized by significantly higher shares of respondents who feel comfortable with the time effort it takes to prepare interim and final reports and to go through the FFF-revision process - but their average time input is significantly higher as compared to other branches.
Table 11: Have you hired external support for writing the FFF-proposal (Question 21) ? yes, against yes, free of No external by FFF-feedback categorya) payment charge Support missing Total Positive 201 114 430 11 756 26.59 15.08 56.88 1.46 100 Negative 37 35 76 6 154 24.03 22.73 49.35 3.9 100 Mixed 63 61 246 5 375 16.8 16.27 65.6 1.33 100 Missing 0 0 4 7 11 0 0 36.36 63.64 100 by sector-affiliationb) Traditional industries 76 54 172 8 310 24.52 17.42 55.48 2.58 100 R&D-intensive industries 77 58 254 4 393 19.59 14.76 64.63 1.02 100 Traditional services 37 32 69 7 145 25.52 22.07 47.59 4.83 100 Knowledge-intensive services 93 54 211 7 365 25.48 14.79 57.81 1.92 100 others/miscellaneous 14 12 44 2 72 19.44 16.67 61.11 2.78 100 Missing 4 0 6 1 11 36.36 0 54.55 9.09 100 by firm-sizea) less than 10 98 94 245 9 446 21.97 21.08 54.93 2.02 100 10 and more 125 65 271 13 474 26.37 13.71 57.17 2.74 100 100 and more 36 21 91 1 149 24.16 14.09 61.07 0.67 100 250 und more 34 16 131 2 183 18.58 8.74 71.58 1.09 100 Missing 8 14 18 4 44 18.18 31.82 40.91 9.09 100 Total 301 210 756 29 1296 23.23 16.2 58.33 2.24 100
a) Differences across subgroups significant at the 99%-level (pr < 0.01); b) Differences across branches significant at the 95% level ( pr < 0.05). Source: survey

42
On the other hand, firms falling into the size-category of 100 or more employees on average invest the least time-input when seeking FFF-support (see Table 12, bottom panel), but are in general the least willing to do so, i.e. they complain the most. We hypothesize that firms are (un)comfortable with the input requests on their behalves whenever they have (not) built up internal capacities to meet the various FFF-requirements; in this case the average time-input to apply for FFF-support is particularly high (low). Finally, the finding that firms which have experienced both, acceptances, as well as rejections, on average spend more time into the whole FFF-process than the successful ones but less time than the completely unsuccessful ones, supports the idea that plain experience makes firms gradually more professional (“learning by doing”). A careful validation of this conjecture would, however, require time-series data. As for now, simple t-tests on the insignificance of mean-differences between “mixed FFF-feedback category” and other feedback-categories (null-hypothesis) cannot be rejected.
Table 12: Average time-input to apply for FFF-support (measured in man-days’ work) By FFF-feedback categorya) Mean Sample valid answers in % Positive 12.72 729 96.43 Negative 17.71 139 90.26 Mixed 14.13 359 95.73 Missing 11.00 4 36.36
a) Differences between means statistically significant for firms with positive and negative FFF-feedback (at the 97%-level)
By Sector-affiliationb) Mean Sample valid answers in % Traditional industries 12.66 291 93.87 R&D-intensive industries 11.70 378 96.18 Traditional services 12.03 135 93.10 Knowledge-intensive services 17.14 352 96.44 others/miscellaneous 13.90 66 91.67 Missing 18.78 9 81.82
b) Firms affiliated to knowledge-intensive services spend significantly more time for FFF-proposal than firms affiliated to other sectors; mean differences between other branches statistically not significant
By firm-sizec) Mean Sample valid answers in % less than 10 15.27 429 96.19 10 and more 14.06 442 93.25 100 and more 9.91 145 97.32 250 und more 12.70 178 97.27 Missing 10.34 37 84.09 Total 13.69 1231 94.98
c) Firms with 100 and more employees spend significantly less time for FFF-proposal as compared to micro-sector firms or firms with 10 and more employees; mean differences between other size-groups statistically not significant
Source: survey

43
2.3. Firms’ judgements on FFF-funding criteria In spite of increasing rejection rates in the last two years, the chances to be provided with FFF-support are still fairly good.13 Accordingly, in most cases the share of firms stating that a particular FFF-support criterion has been “easy to meet” outweighs the share of firms with the opposite view by far. There are two notable exceptions to this general evidence, one relates to the softest criteria, the other relates to the presumably hardest one. The “soft” criteria require projects to be unobjectionable with respect to social, ethical and environmental aspects and state that support will only be given if the project generates high benefits to the total economy, and not only to the individual firm. We call such criteria “soft” because they are hard to verify, or rather it is hard to verify that the project does not come up the various sustainability-principles. As the case may be, about half of the total sample firms state that it is easy to comply with such requirements and, most interestingly, within the group of firms that have been (repeatedly) rejected by the FFF, the corresponding shares are significantly higher as is the case with the more successful candidates. The presumably hardest criterion refers to the financial capacity of the firm. FFF-support is not meant to cover total project costs, but firms are requested to bear substantial shares of total expenditure as well. This qualification is “hard” in a double sense. For one, it is easy and straightforward to prove from the companies’ accounts and for second, every other respondent reports that this was a very demanding requirement (see, sub-question 13). A detailed analysis by sector-affiliation reveals that limited financial capacities are particularly problematical for servicing firms, and within that sector it is especially the (presumably younger) knowledge-intensive firms who face the greatest difficulties to bear their share in total cost.14 By firm-size we find dramatic and highly significant differences with respect to the financial capacity: within the micro-sector a fraction as high as 71% have problems to persuade the FFF-officials in respect of its solvency, while the respective share drops down to only 20% in case of the largest firms.15
13 While in 2000 three out of four submitted proposals have been accepted, the average rejection rate in 2001 and 2002 amounts to 33% (see FFF annual report at www.fff.co.at). 14 57% in case of traditional services and 65% in case of knowledge-intensive industries when the share relates to the set of companies (within sub-groups) making a definite statement on the particular criterion. (Traditional industries: 45%, R&D-intensive industries: 48%). 15 Firms with 10 (100) and more employees: 54% (37%). Again, the share relates to the set of companies (within sub-groups) which comment on their financial resources.

44
Table 13: Is it difficult to fulfil the FFF-support criteria (Question 22)? easy to hard to Missing sub-question FFF-support criteria meet Meet answer total
Technical criteria relating to the project 1 High degree of innovation 888 345 63 1296 68.52 26.62 4.86 100 2 High degree of technical difficulty 819 404 73 1296 63.19 31.17 5.63 100 3 High practical benefit/value 1016 205 75 1296 78.4 15.82 5.79 100 4 Improves environmental standards 567 613 116 1296 43.75 47.3 8.95 100
Technical criteria relating to the company 10 Project generates high know-how transfer 1021 204 71 1296 78.78 15.74 5.48 100 11 High R&D-intensity within the firm 826 378 92 1296 63.73 29.17 7.1 100 12 Firm is technically able to implement the project 966 238 92 1296 74.54 18.36 7.1 100
Commercial criteria relating to the project 5 Decent market prospects 822 405 69 1296 63.43 31.25 5.32 100 6 Relevant market experience of the firm 927 292 77 1296 71.53 22.53 5.94 100 7 High degree of realizability 747 472 77 1296 57.64 36.42 5.94 100 8 High benefits to the Austrian economy 650 575 71 1296 50.15 44.37 5.48 100 9 Social and ethical criteria 646 552 98 1296 49.85 42.59 7.56 100
Commercial criteria relating to the company 13 Financial capacity of firm in relation to project costs 569 643 84 1296 43.9 49.61 6.48 100 14 Availability of expert project managers 803 410 83 1296 61.96 31.64 6.4 100
Source: survey Depending on the particular FFF-criterion to be evaluated, the analyses by sector-affiliation as well as by firm-size are characterized by either of the following patterns: The share of firms reporting problems with respect to particular requirements is
• decreasing in firm-size (“size-pattern A”), or • comparatively low for micro-sector firms and for the largest firms, and peak
within the two medium firm-size categories (“size-pattern B”). • c) significantly differs across aggregate sectors (“branch-pattern C”: industry
vs. services) • d) significantly differs within aggregate sectors (“branch-pattern D”:
traditional vs. R&D, or knowledge-intensive firms, respectively) To summarize the evidence: small firms are widely constrained by commercial requirements on behalf of the project and on behalf of the company, respectively, while the technical criteria are easier to meet.

45
From the analysis by branches we find that broad sector affiliation matters (i.e. industries vs. services) for the evaluation of criteria relating to the project itself. To go into detail, the requested high degree of innovation does not really burden the servicing sector (only one out of five), but rather the manufacturing sector (one out of three). Every third servicing firm is missing relevant market experience, but this is true for only 18% of the manufacturing firms. For the degree of realizability the respective shares amount to 32% for industries and 46% for servicing firms.
Table 14: Are the FFF-support criteria hard/easy to fulfil? (Question 22)- Detailed results by firm-size and by sector-affiliationa) sub-question FFF-support criteria size-pattern Branch-pattern Technical criteria relating to the project 1 High degree of innovation B C 2 High degree of technical difficulty B D 3 High practical benefit/value B n.s. 4 Improves environmental standards B For trad. Services the easiest to meet Technical criteria relating to the company For knowl-int. serv. 10 Project generates high know-how transfer n.s. the easiest to meet 11 High R&D-intensity within the firm n.s. D 12 Firm is technically able to implement the project A/B D Commercial criteria relating to the project 5 Decent market prospects n.s. n.s. 6 Relevant market experience of the firm A C 7 High degree of realizability A C 8 High benefits to the Austrian economy B n.s. 9 Social and ethical criteria B n.s. Commercial criteria relating to the company 13 Financial capacity of firm in relation of project cost A C 14 Availability of expert project managers A D
a) “n.s.” abbreviates “differences across sub-groups are statistically not significant at a reasonable significance-level.” Source: survey
When criteria relating to the company are to be judged, the decisive characteristic is the immanent R&D-intensity, or knowledge intensity, respectively, of the firm. It does not come by surprise that the traditional sub-sectors face significantly greater difficulties to meet the respective criteria as compared to the R&D-intensive, or knowledge-intensive companies, respectively. Overall, the “branch-patterns” are, however, not that conclusive as is the case when the sample is grouped by size-categories.
2.4. Feedback on project rejection When asked if the FFF gave reasonable and sufficient explanation for the causes of rejection a share as high as 58% of the relevant sample say that the FFF has indeed failed to do so (see Table 15). Within the subset of firms which have never qualified for FFF-assistance the respective share even amounts to 84% and exactly 3 out of four micro-sector firms feel unsatisfied in this respect.
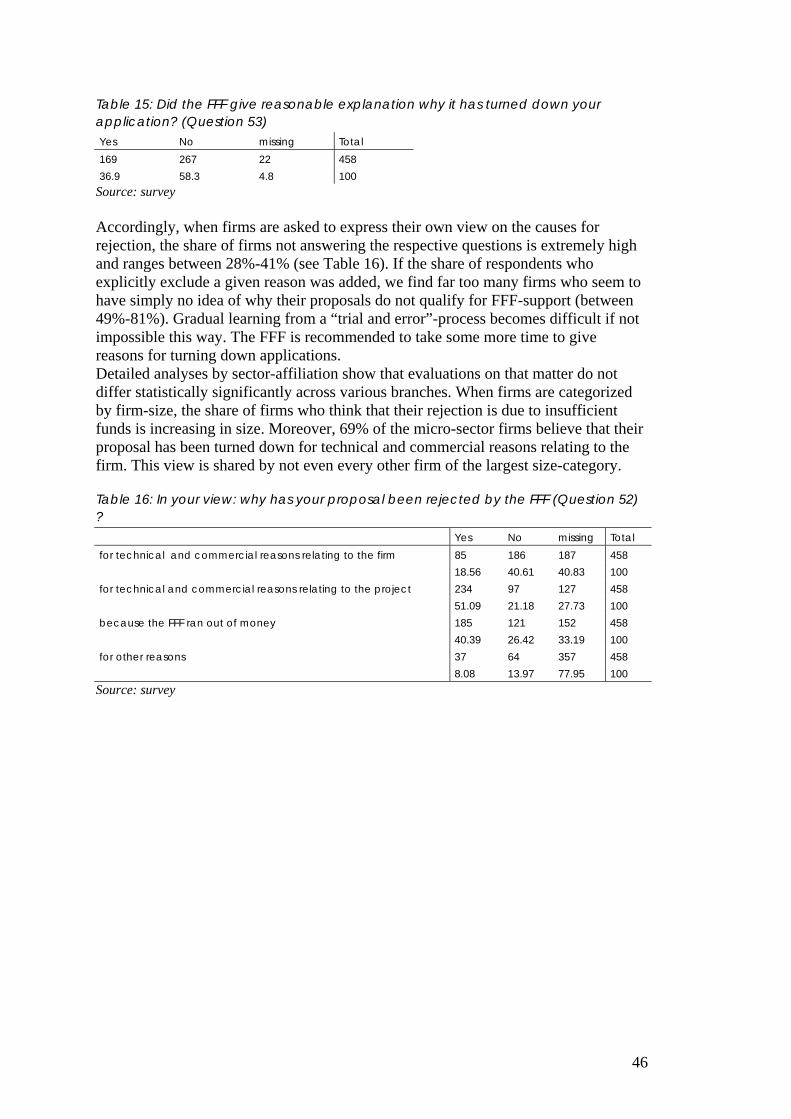
46
Table 15: Did the FFF give reasonable explanation why it has turned down your application? (Question 53) Yes No missing Total 169 267 22 458 36.9 58.3 4.8 100
Source: survey Accordingly, when firms are asked to express their own view on the causes for rejection, the share of firms not answering the respective questions is extremely high and ranges between 28%-41% (see Table 16). If the share of respondents who explicitly exclude a given reason was added, we find far too many firms who seem to have simply no idea of why their proposals do not qualify for FFF-support (between 49%-81%). Gradual learning from a “trial and error”-process becomes difficult if not impossible this way. The FFF is recommended to take some more time to give reasons for turning down applications. Detailed analyses by sector-affiliation show that evaluations on that matter do not differ statistically significantly across various branches. When firms are categorized by firm-size, the share of firms who think that their rejection is due to insufficient funds is increasing in size. Moreover, 69% of the micro-sector firms believe that their proposal has been turned down for technical and commercial reasons relating to the firm. This view is shared by not even every other firm of the largest size-category.
Table 16: In your view: why has your proposal been rejected by the FFF (Question 52) ? Yes No missing Total for technical and commercial reasons relating to the firm 85 186 187 458 18.56 40.61 40.83 100 for technical and commercial reasons relating to the project 234 97 127 458 51.09 21.18 27.73 100 because the FFF ran out of money 185 121 152 458 40.39 26.42 33.19 100 for other reasons 37 64 357 458 8.08 13.97 77.95 100
Source: survey

47
3. Summary and Conclusions
The following chapter highlights the main findings and explores options for improving internal processes.
3.1. The overall picture Historically FFF has been established as THE funding organisation for bottom-up project funding. Even though FFF has opened up towards technology programmes bottom-up funding remains the core business.
FFF has been innovative in communicating and packaging its funding service to specific target groups. A wide range of programmes and initiatives have been launched during the last decade. Nevertheless most FFF programmes have a marketing character and eventually improved project acquisition.
The operative arm of FFF (Secretary) fulfils its funding job efficiently:
• Speed: time for decision is low in international comparison and fairly stable over time
• Administrative cost are moderate and stable over time • Customer satisfaction is high with respect to speed, competence and
confidentiality.
3.2. Development of funding volumes and selectivity FFF’s bottom-up project funding budgets have become tighter in the last years. Available funds could not keep pace with increased demand caused by increased project size and number of submitted projects.
With the funding routines in place tight budgets seem to lead to higher rejection rates rather than a reduction of funding intensity (share of funding as proportion of total project costs) which remained stable.
Even though project assessment and the funding decision process is formally independent of budgetary constraints, it seems that FFF has raised the funding crossbar. This holds particularly for the last two years of observation (2001 and 2002).
FFF reports whenever projects are rejected because of budgetary constraints. Even though the number of projects rejected for budgetary reasons remains low, it increased considerably in 2002.
3.3. Budgeting Budgeting practice of FFF has tried to adapt to fluctuations in funding demand by increased borrowing from expected income. This increases flexibility and eventually

48
improves the position of FFF in future negotiations on budget allocation. The cost of this practice have been significant as borrowing from future incomes increased the budget available for additional project funding only in one year while capital costs moved to a higher level for a much longer period of time.
With respect to governance of FFF the funding practice goes hand in hand with a loss of steering power at the level of RTD-policy. Excessive exposure to credit capital is costly and carries a strong signal of FFF being under funded even though overall public spending on RTD is increasing. Moreover, as FFF targets the broad mass of Austrian firms, political costs of increasing rejection rates at FFF should not be underestimated. In the end, Federal Government gradually looses control over timing and remains locked in a rather defensive negotiating position. To be fair, FFF budgeting practice has been explicitly approved by the responsible ministry. In retrospect the described dynamic is less the outcome of a well thought-out strategy but the result of a specific constellation between Federal Government and an “autonomous” funding organisation, that actively pursues the interest of its clients. The observed funding practice is only possible because allocation processes at Federal level are not based on long term strategy taking into account various funding instruments and types but on yearly negotiations between the Federal Government and beneficiaries of single funding types. In the long run this lack of overall strategy reduces the performance of the Austrian RTD-system. As for FFF’s budgeting practice we suggest the following adjustments:
• The financial scope of FFF should be set in advance for a longer period of time. This requires an increase in the share of regular financial contributions from the main financing bodies and a reduction of FFF’s exposure to financial inflows from temporary sources.
• Financial flexibility using credit capital is valuable as long it remains on relatively low levels. The observed exposure to credit capital is too high and causes significant costs at the expense of resources available for project funding. It should be reduced. Limits for future budgeting are needed.
• Currently the budget available for project funding is not linked to the selection process or decision on funding intensity. Thus budgeting is mostly demand driven. Under these circumstances allocation of overall budgets among different funding instruments remains difficult. In order to keep within the preset financial scope, mechanisms for linking funding processes with the budgetary situation are needed. It is important that this link is explicit and transparent for policy makers as well as submitting firms.
Overall the suggested changes only make sense when they are grounded on a longer-term strategy on public funding of RTD that positions FFF within the broader spectrum of different funding instruments.
3.4. Functionality of the project assessment scheme The project assessment scheme in place is comprehensive. All relevant aspects of public funding of private R&D are covered. The whole range of criteria is needed as

49
all bring in additional and relevant information. A certain degree of overlapping is reasonable as it allows crosschecking and helps to identify atypical projects.
It is principally able to address specific needs and challenges of firms as it uses a differentiated scoring system putting different weights to different dimensions of assessment.
Moreover it is built as a generic tool. Thus it can be further developed and adapted to new goals. This flexibility is a valuable asset.
The high degree of standardisation helps keep a relatively high level of objectivity.
It is easy to use. Although it seems complex and over differentiated the software-base implementation is user-friendly.
The assessment scheme is a powerful monitoring tool allowing a wide range of in-depth analysis for evaluation and scientific research.
In sum, the assessment scheme in place depicts high functionality and a solid base for profound project assessment.
3.5. Implementation of the assessment scheme and suggested changes
As for the practical use of the assessment scheme on hand and its implications on project selection it seems, that FFF does not deploy the whole potential of the scheme. In some respects the way the assessment scheme is used contradicts the general accepted funding rationale. We suggest the following changes:
• Project selection is risk averse in at least two respects: o The highest-ranking criteria (maximal score value 30) is the financial
performance of the submitting firm. This does not only favour big firms but reduces the expected additional impact of funding16. In practice however, FFF has shown to be more tolerant in its funding decision as the internal set threshold for the economical assessment of the submitting firm seems to be lower than officially stated. Funding rationality supports this practice. Consequently we suggest that the assessment scheme should be aligned to observed practice. Financial capability might even be neglected for the project assessment as long as immediate risk of financial fall out can be excluded.
o The vast majority of funded projects are neither particularly risky nor expected to trigger a significant “augmentation of know-how” of funded firms. Moreover factors that eventually discriminate most between funded and rejected projects are not the technical quality or
16 For example: The checklist for assessing the financial capability of the submitting firm includes the isolated assessment on how the submitted projects will be funded. In this dimension the case of “project can be funded from cash-flow” ranks highest (“++), whereas “financing of the project is secured even though it reaches the limits of financial capability of the firm” is assessed negative (“-“). Accepted funding rational would suggest that additionality is higher in the later case. Thus to reverse the scoring guideline seems to be a reasonable option.

50
risk but the prospects of commercialisation and feasibility. All in all this result leaves quite some room for lifting the funding crossbar. We suggest a reworking of the scoring scheme in order to concentrate funding resources more precisely on technological challenge and/or expected learning effects for the submitting firm.
• Targeting specific groups: To enhance funding impact further, project assessment could differentiate between specific groups of firms. As it is used, the assessment scheme covers a big range of settings which indeed should be addressed. For example small newcomer firms are favoured when it comes to “augmentation of knowledge” as they tend to start from a lower levels. Innovation champions have an advantage when it comes to “novelty”. Both make sense. However the problem is that in this scheme, different criteria tend to leverage each other out. With increasing rejection rates it might become necessary to target specific groups more precisely. Big firms for example could be faced with higher standards for the novelty of the proposed innovation, whereas small firms should face stronger incentives when it comes to “knowledge augmentation”. The implementation of a customized assessment scheme would require reversing the assessment workflow (economic assessment before technical assessment) and developing an extension of used software in order to allow the scheme to use customized scoring schemes.
• Dealing with big firms: With the suggested changes it should be possible to deal more transparently with big firms. The current assessment scheme favours big firms to an extent that seems not justified by the common funding rationale. This was confirmed by the fact that FFF informally limits the funding volume for the big Austrian innovation champions. Such informal practice might be necessary in certain cases. However it goes at the cost of transparency and is a way to surpass legitimate questions on how the funding cake should be allocated. Do deal with this issue openly would be another step towards a transparent and better steered funding system.
• Mission oriented criteria: FFF uses a range of criteria that try to link missions (e.g. environment) to the funding decision process. As those criteria have a fairly small score value the practical implication is limited to the KO-threshold. It is important to include such criteria as they at least allow FFF to single out “problematic” projects which contradict the values shared by society. The practical use of these criteria suggests, that they should either be ranked higher (more scores) or scaled down to a mere KO-criteria.
• Linking up to budgetary situation: We have seen that the sample of rejected projects which did overcome the basic requirements is increasing over time. We expect that implicitly this is caused by tightening budgets in recent years. Moreover we have seen that demand driven budgeting practice that does not link the budgetary situation to project selection is problematic. An explicit link between the budgetary situation and selection process is needed. With the current assessment scheme in place it is possible in principal to rank projects or groups of projects. This is a precondition for setting the rejection line in accordance with the budgets available.
51
3.6. Funding instruments In order to better align FFF funding to all three relevant dimensions – risk, learning and access to financial resources – we suggest to the breaking up and simplification of the funding formula:
• FFF uses grants as the dominant instrument for covering risk and learning effects. This is reasonable and keeps financial administration of funding efficient. There is however no reason for presenting the total funding at a fixed level. There is also no reason for mixed instruments (grants and loans) in any case. We suggest that FFF removes the preset share of funding and gives up the forced mix of instruments. Grants could then become the default instrument that alone covers risk and learning effects.
• Loans and guarantees are valuable instruments when it comes to overcoming difficulties in accessing credit capital in order to finance R&D-projects. FFF should be able to give out loans whenever this problem occurs. However there is no reason for linking the provision of loans or guarantees with the provided grant. The message here is, to use two different types of instruments independently in order to address different types of market failures (risk averse firms and risk averse capital markets). Naturally, the funding limits set by the EU apply.
In the end this should further broaden the distribution of funding intensity as was already observed during recent years.
3.7. Programming FFF has been fairly inventive when it comes to targeting specific groups. However most programming activities developed in-house seem to have mere marketing purposes.
Besidesthis, FFF has increasingly opened up to integrated technology programmes as it is involved in the implementation of a range of BMVIT and BMWA programmes. However FFF is not a programme management organisation. For most of those programmes the programme management is contracted out the expert organisations. FFF provides financial supervision and financial execution of the programme. This is important as it reflects the self-perception of FFF as an efficient and routined programme executor (not manager!)
The reluctance to fully enter the programme management business may also come from its internal organisation: Project assessment is the dominating task and core competence of FFF. It provides the common ground for discussion and drives the functioning of the group. The organisation does not foresee specialisation outside the project assessment task. The dominating organisational arrangement for specific tasks are task forces. This inhibits the build up of specialised competence not directly related to projects’ assessment.
3.8. Qualification and Learning At first sight human resource development in terms of qualification measures and training seems underdeveloped in FFF. The most important training is learning by doing. The project assessment scheme functions as the most important training tool.

52
In fact, FFF devotes quite some effort and resources for training if one considers that young team members are supervised and directly trained by experienced project assessment officers for at least one year. External training consists most of all of presence in trade exhibitions and conferences. Overall, FFF was able to reach and keep a high level of competence. This is not only confirmed by customers but also by the fact, that FFF trains staff in related organisations.
FFF’s involvement in the implementation of technology programmes proved to be an important learning source. Most of all, the possibility to mirror own project assessment routines along with project assessment carried out by expert panels was a welcome opportunity to reflect own practice.
FFF has no explicit evaluation strategy. Correspondingly evaluation as a learning tool has been used on an ad hoc basis. Nevertheless FFF has increased its effort to evaluate own work during the last years. On a more regular basis FFF commissions studies on achieved funding impacts. Finally the survey on project success in relation to ex-ante assessment of projects has produce valuable feedback on the quality of FFF’s assessment regime. Overall FFF should better anchor learning and evaluation both with respect to dedicated organisational units as well as resources.