evaluation of the building educated leaders for life (bell
TRANSCRIPT
Evaluation of the
Building Educated Leaders for Life (BELL) Summer
Learning Program in
Montgomery County Public Schools
Office of Shared Accountability
January 2017
Elizabeth Cooper-Martin, Ph.D.
Julie Wade, M.S.

OFFICE OF SHARED ACCOUNTABILITY
850 Hungerford Drive
Rockville, Maryland 20850
301-279-3553
Dr. Jack R. Smith Dr. Janet S. Wilson
Superintendent of Schools Associate Superintendent
Montgomery County Public Schools Office of Shared Accountability
Program Evaluation i Evaluation of the BELL Program
Table of Contents
Executive Summary ........................................................................................................................ v
Summary of Methodology .......................................................................................................... v
Summary of Results .................................................................................................................... v
Conclusion and Recommendations ........................................................................................... vii
Background ..................................................................................................................................... 1
Review of Selected Literature ......................................................................................................... 3
Summer Learning Loss ............................................................................................................... 3
Evaluation of the BELL Program................................................................................................ 4
Evaluation Scope and Questions ..................................................................................................... 4
Methodology ................................................................................................................................... 5
Evaluation Design ....................................................................................................................... 5
Sample, Data Sources, and Measures: Evaluation of Implementation ...................................... 5
Measures, Sample, and Data Sources: Outcome Evaluation ..................................................... 6
Analytical Procedures ................................................................................................................. 7
Results ............................................................................................................................................. 8
Findings for Question 1: How was the BELL program implemented in MCPS? ....................... 8
Findings for Question 2: Mathematics ..................................................................................... 11
Findings for Question 3: Reading ............................................................................................ 16
Findings for Question 4: Did the impact of the BELL program vary by assessment types? ... 21
Conclusion and Recommendations ............................................................................................... 23
Acknowledgments......................................................................................................................... 24
References ..................................................................................................................................... 25
Appendix A 2016 BELL Summer Learning Program Sites ......................................................... 27
Appendix B Bell Summer Learning Program Application ........................................................... 28
Montgomery County Public Schools Office of Shared Accountability
Program Evaluation ii Evaluation of the BELL Program
List of Tables
Table 1 Characteristics of Study Samples at the 2016 BELL Program .......................................... 7
Table 2.1 Mean and Standard Deviation of MAP-M Scale Scores for Grades 3 and 4 by Attendance
at BELL ................................................................................................................................... 11
Table 2.2 The Relationship between BELL Attendance and MAP-M Scale Scores for Grades 3
and 4 ........................................................................................................................................ 11
Table 2.3 Mean and Standard Deviation of MAP-M Scale Scores for Black or African American
Students in Grades 3 and 4 by Attendance at BELL .............................................................. 12
Table 2.4 The Relationship between BELL Attendance and MAP-M Scale Scores for Black or
African American Students in Grades 3 and 4 ........................................................................ 12
Table 2.5 Mean and Standard Deviation of MAP-M Scale Scores for Hispanic/Latino Students in
Grades 3 and 4 by Attendance at BELL ................................................................................. 12
Table 2.6 The Relationship between BELL Attendance and MAP-M Scale Scores for
Hispanic/Latino Students in Grades 3 and 4 ........................................................................... 13
Table 2.7 Mean and Standard Deviation of MAP-M Scale Scores for ESOL Recipients in Grades
3 and 4 by Attendance at BELL .............................................................................................. 13
Table 2.8 The Relationship between BELL Attendance and MAP-M Scale Scores for ESOL
Recipients in Grades 3 and 4 .................................................................................................. 13
Table 2.9 Mean and Standard Deviation of MAP-M Scale Scores for FARMS Recipients in Grades
3 and 4 by Attendance at BELL .............................................................................................. 13
Table 2.10 The Relationship between BELL Attendance and MAP-M Scale Scores for FARMS
Recipients in Grades 3 and 4 .................................................................................................. 14
Table 2.11 Mean and Standard Deviation of MAP-M Scale Scores for Special Education
Recipients in Grades 3 and 4 by Attendance at BELL ........................................................... 14
Table 2.12 The Relationship between BELL Attendance and MAP-M Scale Scores for Special
Education Recipients in Grades 3 and 4 ................................................................................. 14
Table 2.13 Mean and Standard Deviation of MAP-R Scale Scores for Grades 3 and 4 by
Attendance at BELL ............................................................................................................... 16
Table 2.14 The Relationship between BELL Attendance and MAP-R Scale Scores for Grades 3
and 4 ........................................................................................................................................ 16
Table 2.15 Mean and Standard Deviation of MAP-R Scale Scores for Black or African American
Students in Grades 3 and 4 by Attendance at BELL .............................................................. 17
Table 2.16 The Relationship between BELL Attendance and MAP-R Scale Scores for Black or
African American Students in Grades 3 and 4 ........................................................................ 17
Table 2.17 Mean and Standard Deviation of MAP-R Scale Scores for Hispanic/Latino Students in
Grades 3 and 4 by Attendance at BELL ................................................................................. 17
Table 2.18 The Relationship between BELL Attendance and MAP-R Scale Scores for
Hispanic/Latino Students in Grades 3 and 4 ........................................................................... 18

Montgomery County Public Schools Office of Shared Accountability
Program Evaluation iii Evaluation of the BELL Program
Table 2.19 Mean and Standard Deviation of MAP-R Scale Scores for ESOL Recipients in Grades
3 and 4 by Attendance at BELL .............................................................................................. 18
Table 2.20 The Relationship between BELL Attendance and MAP-R Scale Scores for ESOL
Recipients in Grades 3 and 4 .................................................................................................. 18
Table 2.21 Mean and Standard Deviation of MAP-R Scale Scores for FARMS recipients in Grades
3 and 4 by Attendance at BELL .............................................................................................. 18
Table 2.22 The Relationship between BELL Attendance and MAP-R Scale Scores for FARMS
Recipients in Grades 3 and 4 .................................................................................................. 19
Table 2.23 Mean and Standard Deviation of MAP-R Scale Scores for Special Education Recipients
in Grades 3 and 4 by Attendance at BELL ............................................................................. 19
Table 2.24 The Relationship between BELL Attendance and MAP-R Scale Scores for Special
Education Recipients in Grades 3 and 4 ................................................................................. 19
Table 2.25 Mean Changes in Scale Scores and Effect Sizes in Mathematics for Third Graders by
Assessment Type .................................................................................................................... 21
Table 2.26 Mean Changes in Scale Scores and Effect Sizes in Mathematics for Fourth Graders by
Assessment Type .................................................................................................................... 22
Table 2.27 Mean Changes in Scale Scores and Effect Sizes in Reading for Fourth Graders by
Assessment Type .................................................................................................................... 22
Montgomery County Public Schools Office of Shared Accountability
Program Evaluation iv Evaluation of the BELL Program
List of Figures
Figure 1 Design of the BELL program evaluation of outcomes .................................................... 5
Figure 2 Effect size of fall MAP-M scores for BELL attendance in 2016, for all students and by
race/ethnicity ........................................................................................................................... 15
Figure 3 Effect size of fall MAP-M scores for BELL attendance in 2016, by service receipt groups
................................................................................................................................................. 15
Figure 4 Effect size of fall MAP-R scores for BELL attendance in 2016, for all students and by
race/ethnicity ........................................................................................................................... 20
Figure 5 Effect size of fall MAP-M scores for BELL attendance in 2016, by service receipt groups
................................................................................................................................................. 20

Montgomery County Public Schools Office of Shared Accountability
Program Evaluation v Evaluation of the BELL Program
Executive Summary
At the request of the Board of Education for Montgomery County Public Schools (MCPS), the
Office of Shared Accountability evaluated the Building Educated Leaders for Life (BELL)
summer learning program held in MCPS during summer 2016. The target population for BELL
was rising third and fourth graders who were enrolled at Title I schools and whose reading or
mathematics scores on Measures of Academic Progress (MAP) tests were below the 60th
percentile in winter 2016. The evaluation examined implementation of the BELL program, its
impact on students’ mathematics and reading achievement, and whether that impact varied with
different student subgroups and tests.
Summary of Methodology
To examine implementation, BELL staff at each of the eight MCPS sites was interviewed about
staffing, training, communication between MCPS and BELL, support from MCPS and BELL, and
benefits and challenges with the BELL summer learning program.
To evaluate the impact of the BELL program on student achievement, this study used multiple
regression analyses that included both attendees and non-attendees and controlled for students’
characteristics, including their initial abilities. The attendees were 815 students in Grades 3 or 4
who attended 19 days or more of the BELL program (out of 25 days) and had MAP test results
from fall 2016 (i.e., after the program). One quarter of these students was Black or African
American. Seven out of 10 attendees were Hispanic/Latino and a similar percentage received
English for Speakers of Other Languages (ESOL) services. Close to 90% qualified for Free and
Reduced-price Meals System (FARMS) services and almost one fifth received special education
services. Non-attendees were 1,135 students who were invited to BELL but did not attend.
Summary of Results
Implementation. Program managers at each site reported mostly positive experiences
with the implementation of the BELL program. The training provided by BELL was described as
valuable, inspiring, and effective at communicating what to expect in the day-to-day operation of
the program, BELL’s vision, and its mission. The only concern expressed about training was a
need for more time. Overall, reports from program managers about the BELL curriculum were
positive; teachers noted that it was very detailed and aligned with the Common Core. Teachers
also liked the information on student learning needs and instructional strategies that was provided
with results from the STAR assessments. (BELL administered these tests in the first week of the
program.) However, a major concern expressed at nearly all sites was that the materials received
at the start of the program did not match the reading and mathematics levels of some students.
At all sites, program staff described the enrichment activities and the field trips as valuable
components of the program and engaging to the students.
Site staff indicated that BELL provided an appropriate program for some students with disabilities,
especially with its focus on differentiation, but the program could not support students with severe
needs or with a need for one-on-one support. To address the needs of English language learners,
Montgomery County Public Schools Office of Shared Accountability
Program Evaluation vi Evaluation of the BELL Program
two rotating ESOL specialists supported teachers at all sites by modeling lessons and providing
resources. Program managers expressed concern that no records were provided about receipt of
special education or ESOL services at the start of the program, so teachers started without
information about the needs of these students.
Impact of the BELL program on student mathematics skills. Based on multiple
regression analyses, there was evidence for a positive impact of the BELL program on MAP scores
in mathematics from fall 2016 for attendees in both Grades 3 and 4, among all students and four
subgroups: Hispanic/Latino, ESOL recipients, FARMS recipients, and special education
recipients. Each of these differences between attendees and non-attendees was statistically
significant in both grades. The relationship was stronger for Grade 3 than Grade 4; each of these
differences for third graders also was practically significant, meaning it was large enough to be
useful to staff in making programmatic decisions. But only the difference for special education
recipients was large enough to be useful among fourth graders. There was no evidence in Grades
3 or 4 of an impact among the subgroup of African American or Black students.
Impact of the BELL program on student reading skills. Based on multiple regression
analyses, there was some evidence for a positive impact of the BELL program on MAP scores in
reading for Grade 3, but no evidence for Grade 4. For third graders, the relationship between
attendance and MAP scores in reading was statistically significant among all students and among
three subgroups: Hispanic/Latino, ESOL recipients, and FARMS recipients. However, none of
these differences between attendees and non-attendees in Grade 3 was practically significant (i.e.,
large enough to be useful in making instructional decisions). For each group of fourth graders
tested, there was no significant (statistically or practically) relationship between attending BELL
and reading achievement.
Variations across tests. The above analyses used results from MAP in fall 2016, after the
BELL program; students also completed MAP tests in spring 2016 prior to the program. Further,
BELL attendees completed STAR assessments (administered by BELL) at the start and end of the
program. There was interest in determining whether the impact of the BELL program varied by
assessment type (i.e., MAP vs. STAR). However, it was not possible to examine the impact of
BELL on STAR scores because non-attendees did not take the STAR tests.
Instead, the analysis examined whether changes in attendees’ achievements over time differed
between the two tests, MAP and STAR. Effect sizes from bivariate analyses (i.e., comparisons of
changes in mean scores) were used; effect sizes are metric-free and thus appropriate for comparing
the effects associated with different tests. The effect sizes differed between MAP and STAR for
all areas analyzed, indicating that changes in attendees’ achievements over time varied, based on
the test. The STAR results consistently suggested immediate gains from the beginning to the end
of BELL, while the MAP results for changes from spring 2016 to fall 2016 suggested slight
declines in Grade 3 math, no change in Grade 4 math, and slight gains in Grade 4 reading. (Data
were not available for Grade 3 reading.) However, these bivariate analyses did not address the
impact of the BELL program on MAP or on STAR scores; they included attendees only and so
there was no comparison group to understand what achievement might have been without
attending BELL.
Montgomery County Public Schools Office of Shared Accountability
Program Evaluation vii Evaluation of the BELL Program
Conclusion and Recommendations
The most accurate sense of the BELL program’s impact on students’ academic performance came
from the multiple regression analyses using MAP scores. They provided evidence of a positive
impact of attendance at the BELL program on students’ performance in Grade 3 mathematics,
Grade 4 mathematics, and Grade 3 reading. The multiple regression analyses of MAP scores
provide a more accurate sense of program impact than the bivariate analyses of STAR or MAP
scores because 1) the regression employs a comparison group, so there is a sense of how students
performed in the absence of BELL and 2) MAP tests cover a wider set of skills and more closely
align with the MCPS curriculum than STAR tests.
The findings on implementation and outcomes suggest the following recommendations:
Continue the BELL program, given its positive impact on students’ performance in
Grade 3 mathematics, Grade 4 mathematics, and Grade 3 reading for all students, along
with three subgroups: Hispanic/Latino, ESOL recipients, and FARMS recipients.
Examine how to improve the program so it has a stronger impact on Black or African
American students.
Work with BELL to maximize the value of its training for staff through the following:
o Ensure that all materials are in hand at the start of the training.
o Provide more time on site before the start of the program, so that program staff can
work with the teachers.
o Provide more training time to cover all the information provided.
Improve coordination and communication between MCPS and BELL to achieve the
following by the start of the program:
o Ensure that curriculum materials match the mathematics and reading levels of all
attendees.
o Provide student information such as needs for ESOL or special education services.
o Provide clear information on bus schedules and bus stops to site staff and parents.
Consider providing extra support with the following:
o Add a specialist who can support the instruction of students with disabilities.
o Provide technology support when BELL staff set up their equipment.
Revisit the schedule for providing a nurse or health technician to each site on every day
that students are onsite.
Montgomery County Public Schools Office of Shared Accountability
Program Evaluation 1 Evaluation of the BELL Program
Evaluation of the Building Educated Leaders for Life (BELL) Summer
Learning Program in Montgomery County Public Schools
The Board of Education for Montgomery County Public Schools (MCPS) asked the Office of
Shared Accountability (OSA) to conduct an evaluation of the BELL (Building Educated Leaders
for Life) Summer Learning Program in MCPS, launched during the summer of 2016. The BELL
program provided expanded learning opportunities for students in Title I schools who were
performing below benchmarks in reading and mathematics; the program aimed to improve
students’ academic success, self-confidence, and social skills. The purpose of this evaluation was
examine implementation of the program and to assess gains in the academic achievement of the
students enrolled in the program.
Background
During the summer, there is a tendency for students, especially those from low-income families,
to lose achievement gains made during the school year. One response to preventing summer
learning loss is a summer learning program. For the summer of 2016, MCPS and the Montgomery
County Department of Health and Human Services (MCDHHS) collaborated with the BELL
organization to offer a summer learning program (Montgomery County Council Presentation,
2016).
BELL is a national organization that provides extended learning opportunities after school and
during the summer; it grew out of a community service project at Harvard Law School and has
served more than 100,000 students nationwide since 1992 (BELL, 2016). The BELL Summer
Learning Program is designed to achieve the following goals:
Students will increase their literacy and math skills.
Students will strengthen their self-confidence.
Students will improve their social skills.
Parents/guardians will become more engaged in their children’s education.
To accomplish its goals, the BELL Summer Learning Program provides a summer academic and
enrichment program to eligible rising third and fourth grade students who are from Title I schools
and show academic need. If successful in preventing summer learning loss, the program should
narrow the achievement gap and help students transition from grade to grade successfully.
BELL Program at MCPS
The BELL program in MCPS was designed to offer both rigorous instruction and engaging
activities. The academic component of BELL (i.e., language arts and mathematics programming)
was scheduled for Monday through Thursday mornings for the length of the program. BELL
partnered with Scholastic to develop a customized curriculum for the five-week program. BELL
also provided, for both language arts and mathematics, professional development and instructional
materials including activities, teacher’s guides, and resources. To support data-driven instruction
and to measure student progress, BELL administered STAR assessments in reading and
Montgomery County Public Schools Office of Shared Accountability
Program Evaluation 2 Evaluation of the BELL Program
mathematics to each student (Renaissance Learning, 2014) during the first week and again in the
last week of the program.
Enrichment learning was scheduled for each afternoon, Monday through Thursday, in areas such
as STEM (science, technology, engineering, and math), physical activity, healthy living, character
education, and creative arts. These experiential and project-based learning opportunities supported
academic learning, as well as social and emotional learning. One day per week (usually Friday)
the schedule included non-classroom activities that were designed to expand student learning, such
as hands-on enrichment opportunities, field trips, and community service projects (BELL &
MCPS, 2016).
Breakfast and lunch were offered each day, along with transportation to and from the program
sites. The program operated 6.5 hours per day, five days a week, for five weeks in the summer,
June 27 through July 29, 2016.
Participating Schools, Students, and Staff
The BELL program was located at eight MCPS elementary school sites in the summer of 2016
(see list in Appendix A). The eight sites were strategically chosen from among the 25 Title I
elementary schools in MCPS to be the most accessible to students in all Title I schools.
The target population for the program was those rising third and fourth graders who were enrolled
in Title I schools and whose reading or math scores on Measures of Academic Progress (MAP)
assessments were below the 60th percentile in winter 2016. More than 2,000 eligible students were
identified and their parents/guardians were sent a description of the BELL program and an
application (see copy in Appendix B). Invitations went to students from all Title I schools, along
with students at one non-Title 1 school that feeds into a Title 1 middle school. The program had
capacity for 1,050 students and enrolled students on a first come, first served basis.
Staff at each BELL site included a program manager, program assistant, instructional coach, and
a team of teachers for each classroom. (One site lacked a program assistant). Teaching teams
comprised an academic teacher for the morning, an enrichment teacher for the afternoon, and a
teaching assistant for the full day. Also, each site had access to the services of an English Language
Learners (ELL) coach. BELL administered hiring of all staff, many of them MCPS employees.
Further, BELL provided training for staff before the start of the program. Management teams from
each site—comprising the program manager, instructional coach, and program assistant—had
training sessions after school during the last week of the school year, plus for two full days the
following week. BELL provided two full-day training sessions for teachers and teaching
assistants. The full-day training sessions were at the BELL sites.
Funding and Administration In November 2015, the Montgomery County Council approved a special appropriation to support
implementation of the BELL program in MCPS. The program was funded through a public-private
partnership with the Norman R. and Ruth Rales Foundation, which provided funds for the program
Montgomery County Public Schools Office of Shared Accountability
Program Evaluation 3 Evaluation of the BELL Program
and supported local fundraising efforts to raise the remaining program funds. Planning and
implementation of the 2016 summer program was a collaboration among MCDHHS, MCPS, and
BELL (Montgomery County Council Presentation, March 1, 2016).
Review of Selected Literature
Summer Learning Loss
A growing body of research has shown that students from low-income communities suffer greater
academic loss during the summer vacation than their counterparts from more wealthy communities
(Cooper et al., 1996; Entwisle & Alexander, 1992). Cooper et al. (1996) conducted a meta-analysis
of studies of summer learning loss published between 1975 and 1994. Their analysis indicated
that the overall summer loss was equal to about one month on a grade-level equivalent scale; for
all students, the detrimental effect of summer break was more pronounced for mathematics than
for reading. However, when the effect of family income was analyzed, middle-class students
gained in reading and language achievement over the summer, while lower-class students showed
a significant loss. Consistent with this finding, Downey, von Hippel, and Broh (2004) analyzed
the Early Childhood Longitudinal Study data and found that economically disadvantaged children
fell about 2.5 months behind more advantaged students in reading during the summer months
between kindergarten and Grade 1. Of further concern, the gap between economically
disadvantaged and advantaged students that results from summer learning loss has been shown to
be cumulative; Hayes and Grether (1983) estimated that as much as 80% of the reading
achievement gap that existed between economically advantaged and disadvantaged students at
sixth grade could be attributed to summer learning loss.
The “faucet theory” (Entwisle, Alexander, & Olson, 2001) has been posited to explain the
phenomenon of summer learning loss. The theory suggests that opportunities to learn and access
to educational resources are “turned on” for all children during the school year. As a result, gains
made during the school year are similar for students from different social and economic
backgrounds. But during the summer break when the faucet is “turned off,” students have different
opportunities to learn and different access to resources leading to different outcomes in learning.
To reduce the summer learning loss among low-income students, a number of strategies have been
adopted. Many interventions involve traditional summer school programs, focusing on
remediation and skill development. Some states and districts have implemented summer reading
programs that rely on prizes and rewards to encourage children to read during the summer break.
An emerging body of evaluation research provides evidence that summer programs may benefit
student achievement. A study conducted by RAND Education (McCombs et. al., 2011) assessed
the evidence on effective summer learning programs and concluded that all types of summer
programs—including mandatory summer programs, voluntary summer programs, and programs
that encourage students to read at home in the summer—can mitigate summer learning losses and
even lead to achievement gains.
Montgomery County Public Schools Office of Shared Accountability
Program Evaluation 4 Evaluation of the BELL Program
Evaluation of the BELL Program
The BELL program has conducted several internal evaluations that have reported promising
findings of academic improvements over the summer (BELL, 2015; T. Cooper, 2004). In 2006, a
large, rigorous study of BELL summer programs in New York and Boston was conducted (Chaplin
and Capizzano, 2006). More than 1,000 elementary school students who applied to BELL summer
programs were randomly chosen to be in either a treatment group that participated in the BELL
summer program or a comparison group that did not. Random selection was possible because the
number of applicants was more than double the number of slots available. Independent researchers
collected student reading tests, student surveys, and teacher surveys.
The study found that children who attended the BELL summer program gained about a month’s
worth of reading skills more than their counterparts who did not attend the BELL program. When
the authors controlled for the rates of actual participation in the BELL program, the estimated
improvement in reading test scores was about two months. The impact of the program on test
scores appears similar to that of a similar amount of school during the school year. The study also
found a positive impact on the degree to which parents/guardians encouraged their children to
read. No effects were found for academic self-perceptions or social behaviors, and the study found
no interactions between reading test scores and grade, race, or gender. The authors summarized
the findings to say that the BELL program, as implemented in these two cities in 2005, “had
important impacts on summer learning activities, parent involvement in reading, and on reading
test scores.” (Chaplin & Capizzano, 2006, p. 38).
Evaluation Scope and Questions
The main purpose of this study was to assess gains in the academic achievement of the students
enrolled in the program. A secondary purpose was to provide formative information for program
administrators by examining the implementation of the BELL program.
The evaluation addressed the following questions.
1. How was the BELL program implemented in MCPS, with regard to the curriculum, staff
training, and program operation?
2. What was the impact of the BELL program on student mathematics skills? Did the
mathematics impact of the program vary by student subgroups?
3. What was the impact of the BELL program on student reading skills? Did the reading impact
of the program vary by student subgroups?
4. Did the impact of the BELL program on student skills in mathematics or reading vary by
assessment type for all students or for student subgroups?
Montgomery County Public Schools Office of Shared Accountability
Program Evaluation 5 Evaluation of the BELL Program
Methodology
Evaluation Design
The design for evaluation question 1 to examine the implementation of the BELL program in
MCPS was nonexperimental and relied on descriptive data provided by staff at the BELL sites.
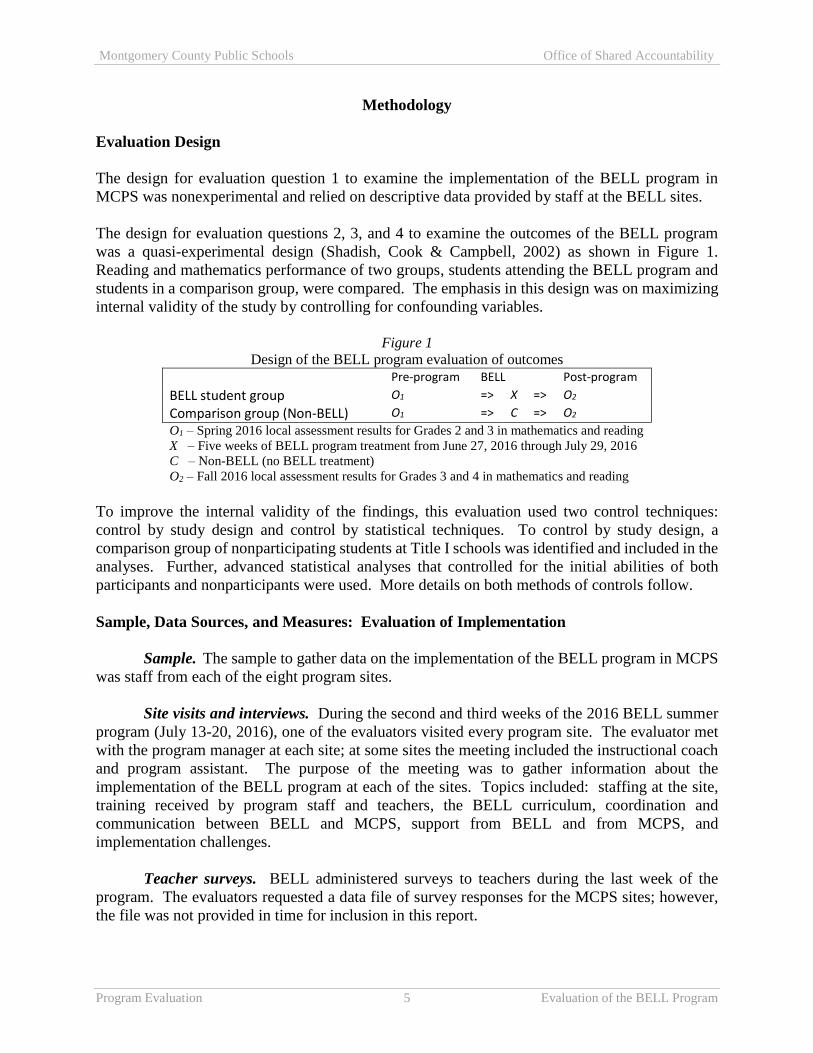
The design for evaluation questions 2, 3, and 4 to examine the outcomes of the BELL program
was a quasi-experimental design (Shadish, Cook & Campbell, 2002) as shown in Figure 1.
Reading and mathematics performance of two groups, students attending the BELL program and
students in a comparison group, were compared. The emphasis in this design was on maximizing
internal validity of the study by controlling for confounding variables.
Figure 1
Design of the BELL program evaluation of outcomes
Pre-program BELL Post-program
BELL student group O1 => X => O2
Comparison group (Non-BELL) O1 => C => O2 O1 – Spring 2016 local assessment results for Grades 2 and 3 in mathematics and reading
X – Five weeks of BELL program treatment from June 27, 2016 through July 29, 2016
C – Non-BELL (no BELL treatment)
O2 – Fall 2016 local assessment results for Grades 3 and 4 in mathematics and reading
To improve the internal validity of the findings, this evaluation used two control techniques:
control by study design and control by statistical techniques. To control by study design, a
comparison group of nonparticipating students at Title I schools was identified and included in the
analyses. Further, advanced statistical analyses that controlled for the initial abilities of both
participants and nonparticipants were used. More details on both methods of controls follow.
Sample, Data Sources, and Measures: Evaluation of Implementation
Sample. The sample to gather data on the implementation of the BELL program in MCPS
was staff from each of the eight program sites.
Site visits and interviews. During the second and third weeks of the 2016 BELL summer
program (July 13-20, 2016), one of the evaluators visited every program site. The evaluator met
with the program manager at each site; at some sites the meeting included the instructional coach
and program assistant. The purpose of the meeting was to gather information about the
implementation of the BELL program at each of the sites. Topics included: staffing at the site,
training received by program staff and teachers, the BELL curriculum, coordination and
communication between BELL and MCPS, support from BELL and from MCPS, and
implementation challenges.
Teacher surveys. BELL administered surveys to teachers during the last week of the
program. The evaluators requested a data file of survey responses for the MCPS sites; however,
the file was not provided in time for inclusion in this report.

Montgomery County Public Schools Office of Shared Accountability
Program Evaluation 6 Evaluation of the BELL Program
Sample, Data Sources, and Measures: Outcome Evaluation
Local assessments. Measures of Academic Progress (MAP) are integrated collections of
computerized assessments (Northwest Education Association, 2008 and 2011). These tests include
multiple-choice items and a variety of other item types and are designed to provide educators with
instructional information about what students are ready to learn. Scores on MAP tests are reported
on the Rasch Unit (RIT) scale. The equal-interval property of the RIT scale scores makes them
especially appropriate for various statistical purposes, including measuring change over time.
RIT scores from the fall 2016 administration of the Measures of Academic Progress-Reading
(MAP-R) were the outcome (or post-program) measure in reading for all students. For the rising
Grade 4 students, spring 2016 MAP-R scores were the pre-program measure. For the rising Grade
3 students, the pre-program measures in reading were reading levels from the spring 2016
Assessment Program in Primary Reading (MCPS AP-PR) because Grade 2 students in MCPS do
not take MAP-R. In advanced analyses, the pre-program measure can be any measure prior to the
program that is highly correlated with the post-program measure.
RIT scores from the fall 2016 administration of the Measures of Academic Progress-Mathematics
(MAP-M) were the outcome measure in mathematics for all students. For the rising Grade 4
students, RIT scores from the spring 2016 MAP-M were the pre-program measures. For the rising
Grade 3 students, the pre-program measures in mathematics were RIT scores in mathematics from
the spring 2016 administration of Measures of Academic Progress-Primary Grades (MAP-P),
because Grade 2 students in MCPS do not take MAP-M.
BELL assessments. As noted above, the BELL program tested reading and math skills of
program participants with STAR assessments during the first week and the last week of the
program. STAR assessments are computer-adaptive, multiple choice tests; each subject assessment
(reading and mathematics) can be administered in about 20 minutes. Scale scores from the STAR
assessments (provided by the BELL program) and the RIT scale scores from the MAP assessments
were analyzed for evaluation question 4 regarding the effects of different types of assessments.
Student data. MCPS student-level records provided data on local assessments and
demographics, including gender, racial/ethnic group, and receipt of English for Speakers of Other
Languages (ESOL) services, Free and Reduced-price Meals System (FARMS) services, or special
education services, for students in the BELL program and students in the comparison group.
Student attendance at the summer program was recorded daily by staff at each BELL program site;
the BELL program provided student-level attendance data to MCPS.
Sample. There were two groups of students for the outcome evaluation. The sample of
BELL participants was all students who met the attendance threshold, defined as attending BELL
in summer 2016 for 19 or more days (out of 25 days), and who had data from fall 2016 on MAP-
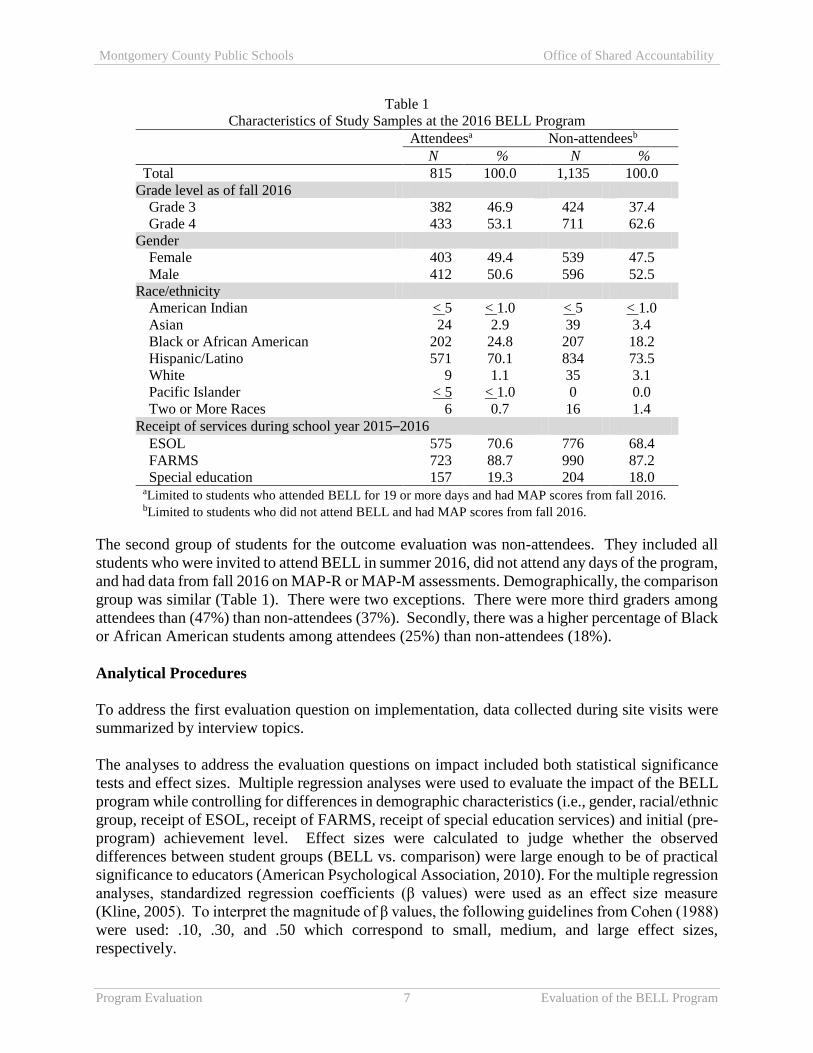
R or MAP-M assessments. Table 1 presents the demographic characteristics of this sample of 815
students. They were evenly split between female and male. One quarter were Black or African
American. Seven out of 10 of these students were Hispanic/Latino and a similar percentage
received English for Speakers of Other Languages (ESOL) services. Not surprisingly, because
BELL served students in Title I schools, close to 9 out of 10 qualified for Free and Reduced-price
Meals System (FARMS) services. Lastly, almost one fifth received special education services.
Montgomery County Public Schools Office of Shared Accountability
Program Evaluation 7 Evaluation of the BELL Program
Table 1
Characteristics of Study Samples at the 2016 BELL Program
Attendeesa Non-attendeesb
N % N %
Total 815 100.0 1,135 100.0
Grade level as of fall 2016
Grade 3 382 46.9 424 37.4
Grade 4 433 53.1 711 62.6
Gender
Female 403 49.4 539 47.5
Male 412 50.6 596 52.5
Race/ethnicity
American Indian < 5 < 1.0 < 5 < 1.0
Asian 24 2.9 39 3.4
Black or African American 202 24.8 207 18.2
Hispanic/Latino 571 70.1 834 73.5
White 9 1.1 35 3.1
Pacific Islander < 5 < 1.0 0 0.0
Two or More Races 6 0.7 16 1.4
Receipt of services during school year 2015–2016
ESOL 575 70.6 776 68.4
FARMS 723 88.7 990 87.2
Special education 157 19.3 204 18.0 aLimited to students who attended BELL for 19 or more days and had MAP scores from fall 2016. bLimited to students who did not attend BELL and had MAP scores from fall 2016.
The second group of students for the outcome evaluation was non-attendees. They included all
students who were invited to attend BELL in summer 2016, did not attend any days of the program,
and had data from fall 2016 on MAP-R or MAP-M assessments. Demographically, the comparison
group was similar (Table 1). There were two exceptions. There were more third graders among
attendees than (47%) than non-attendees (37%). Secondly, there was a higher percentage of Black
or African American students among attendees (25%) than non-attendees (18%).
Analytical Procedures
To address the first evaluation question on implementation, data collected during site visits were
summarized by interview topics.
The analyses to address the evaluation questions on impact included both statistical significance
tests and effect sizes. Multiple regression analyses were used to evaluate the impact of the BELL
program while controlling for differences in demographic characteristics (i.e., gender, racial/ethnic
group, receipt of ESOL, receipt of FARMS, receipt of special education services) and initial (pre-
program) achievement level. Effect sizes were calculated to judge whether the observed
differences between student groups (BELL vs. comparison) were large enough to be of practical
significance to educators (American Psychological Association, 2010). For the multiple regression
analyses, standardized regression coefficients (β values) were used as an effect size measure
(Kline, 2005). To interpret the magnitude of β values, the following guidelines from Cohen (1988)
were used: .10, .30, and .50 which correspond to small, medium, and large effect sizes,
respectively.
Montgomery County Public Schools Office of Shared Accountability
Program Evaluation 8 Evaluation of the BELL Program
Results
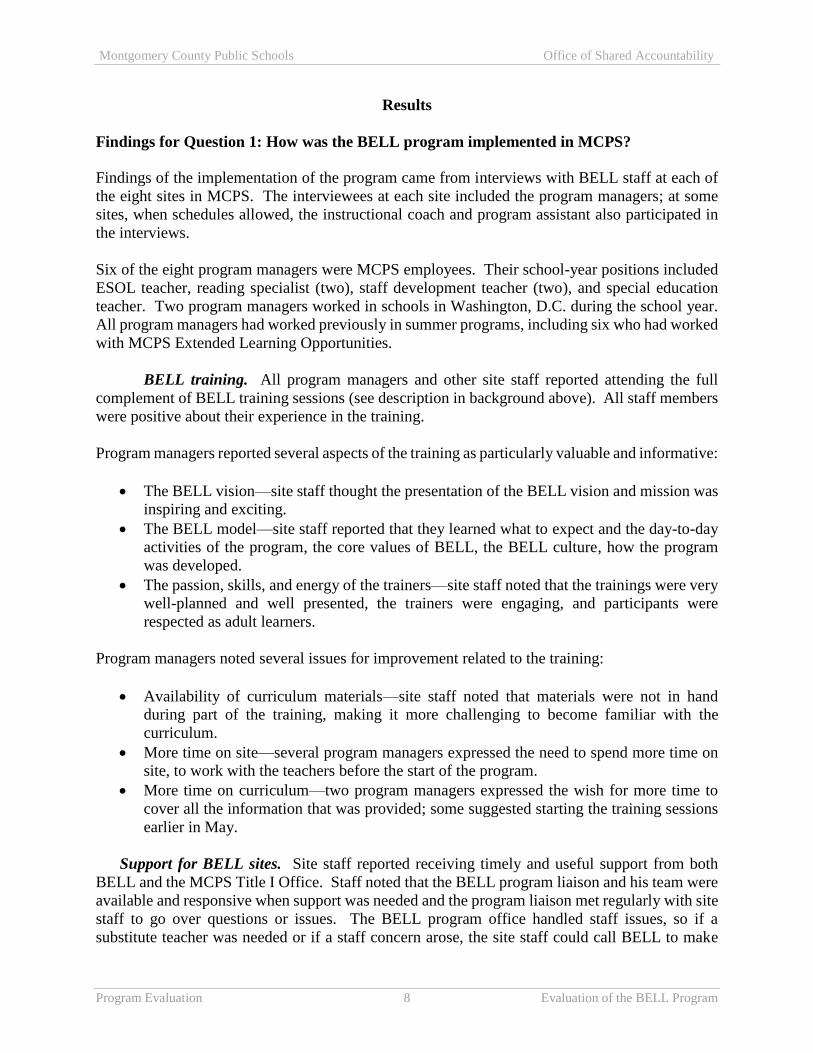
Findings for Question 1: How was the BELL program implemented in MCPS?
Findings of the implementation of the program came from interviews with BELL staff at each of
the eight sites in MCPS. The interviewees at each site included the program managers; at some
sites, when schedules allowed, the instructional coach and program assistant also participated in
the interviews.
Six of the eight program managers were MCPS employees. Their school-year positions included
ESOL teacher, reading specialist (two), staff development teacher (two), and special education
teacher. Two program managers worked in schools in Washington, D.C. during the school year.
All program managers had worked previously in summer programs, including six who had worked
with MCPS Extended Learning Opportunities.
BELL training. All program managers and other site staff reported attending the full
complement of BELL training sessions (see description in background above). All staff members
were positive about their experience in the training.
Program managers reported several aspects of the training as particularly valuable and informative:
The BELL vision—site staff thought the presentation of the BELL vision and mission was
inspiring and exciting.
The BELL model—site staff reported that they learned what to expect and the day-to-day
activities of the program, the core values of BELL, the BELL culture, how the program
was developed.
The passion, skills, and energy of the trainers—site staff noted that the trainings were very
well-planned and well presented, the trainers were engaging, and participants were
respected as adult learners.
Program managers noted several issues for improvement related to the training:
Availability of curriculum materials—site staff noted that materials were not in hand
during part of the training, making it more challenging to become familiar with the
curriculum.
More time on site—several program managers expressed the need to spend more time on
site, to work with the teachers before the start of the program.
More time on curriculum—two program managers expressed the wish for more time to
cover all the information that was provided; some suggested starting the training sessions
earlier in May.
Support for BELL sites. Site staff reported receiving timely and useful support from both
BELL and the MCPS Title I Office. Staff noted that the BELL program liaison and his team were
available and responsive when support was needed and the program liaison met regularly with site
staff to go over questions or issues. The BELL program office handled staff issues, so if a
substitute teacher was needed or if a staff concern arose, the site staff could call BELL to make

Montgomery County Public Schools Office of Shared Accountability
Program Evaluation 9 Evaluation of the BELL Program
the necessary arrangements. In addition, MCPS provided support for the sites when needed; site
staff reported that Title I staff had come to help at the site, the transportation office was responsive
to concerns that arose, and the school principal and office staff were helpful when needed.
Student attendance at BELL. Site staff reported that the average daily attendance at the time
of the visit was 90% or higher. Staff at seven of the eight sites reported that they made calls to the
parent on the day a student was absent. The expectation for attendance at BELL was that students
would attend every day. The BELL attendance policy indicated that students who missed multiple
days would not be allowed to continue the program. Program managers reported varied levels of
enforcing the attendance policy, but overall, the expectation for consistent attendance was
maintained. Staff at all eight of the BELL sites described ways that they supported regular
attendance, in addition to contacting parents about any absence. All sites offered incentives for
attendance, such as raffles, a prize box, “scholar dollars,” or a party for the class.
BELL curriculum and program. Overall, site staff had positive feedback about the BELL
curriculum. Staff noted that the curriculum was very detailed and aligned with the Common Core,
and that teachers were getting comfortable with it. A number of site staff reported that teachers
liked the information that was supplied by the STAR assessments. Data from the initial STAR
assessment included student learning needs, instructional strategies, and ways to group students.
However, a major issue with the BELL curriculum that was reported at nearly every site, was that
the materials received did not match the levels of the students. Students were working at a lower
level than the materials received, so site staff had to request supplemental materials to meet
students’ needs. BELL was able to provide appropriate materials, but time was lost in some cases.
Site staff reported that students used Chromebooks every day in BELL classrooms for enrichment,
publishing, or accessing materials. BELL provided a list of online resources that aligned with the
curriculum.
In addition to the curriculum in reading and math, the BELL summer program included enrichment
activities and field trips. Staff feedback was positive about these two components; staff reported
that the students appeared very engaged in the activities and excited about the field trips. At most
sites, students participated in two enrichment activities each day, such as the following: STEM,
technology, performing arts, culinary activities, theater, art, music, dance, creative writing,
Chinese culture, poetry, sports, photography, sign language, zumba, “Legos and literacy,” and
book publishing. Although a few BELL teachers taught both the morning academic content and
an afternoon enrichment activity, in most cases, the academic and enrichment components were
taught by different teachers.
Each site also provided three off-site field trips and one or more special “theme” days, such as
college day or career day. Field trip destinations included the Spy Museum, Elioak Farm, a jazz
concert at Wolf Trap, the National Zoo, Imagination Stage, and the Natural History Museum.
Students with disabilities and ELL students. Site staff indicated that BELL provided an
appropriate program for some students with disabilities, but could not support those with severe
needs or students who need one-on-one support. Several program managers noted that BELL had
a focus on differentiation, that teachers were able to adapt the program for students with different
Montgomery County Public Schools Office of Shared Accountability
Program Evaluation 10 Evaluation of the BELL Program
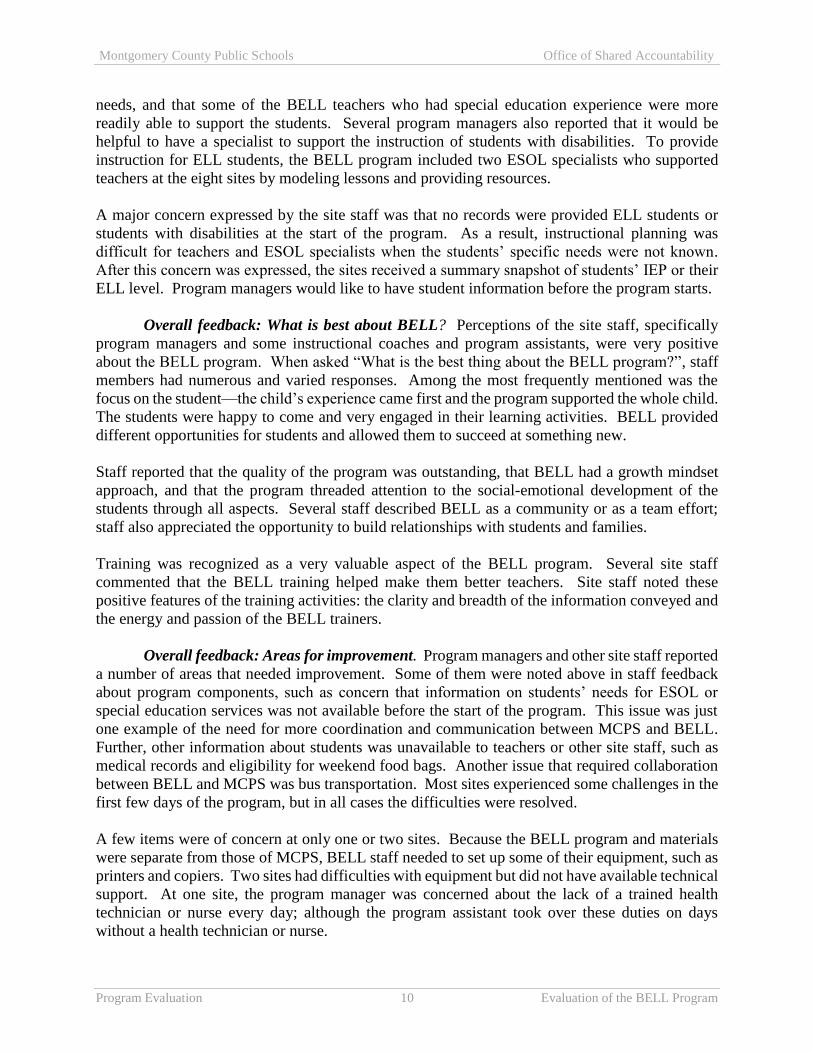
needs, and that some of the BELL teachers who had special education experience were more
readily able to support the students. Several program managers also reported that it would be
helpful to have a specialist to support the instruction of students with disabilities. To provide
instruction for ELL students, the BELL program included two ESOL specialists who supported
teachers at the eight sites by modeling lessons and providing resources.
A major concern expressed by the site staff was that no records were provided ELL students or
students with disabilities at the start of the program. As a result, instructional planning was
difficult for teachers and ESOL specialists when the students’ specific needs were not known.
After this concern was expressed, the sites received a summary snapshot of students’ IEP or their
ELL level. Program managers would like to have student information before the program starts.
Overall feedback: What is best about BELL? Perceptions of the site staff, specifically
program managers and some instructional coaches and program assistants, were very positive
about the BELL program. When asked “What is the best thing about the BELL program?”, staff
members had numerous and varied responses. Among the most frequently mentioned was the
focus on the student—the child’s experience came first and the program supported the whole child.
The students were happy to come and very engaged in their learning activities. BELL provided
different opportunities for students and allowed them to succeed at something new.
Staff reported that the quality of the program was outstanding, that BELL had a growth mindset
approach, and that the program threaded attention to the social-emotional development of the
students through all aspects. Several staff described BELL as a community or as a team effort;
staff also appreciated the opportunity to build relationships with students and families.
Training was recognized as a very valuable aspect of the BELL program. Several site staff
commented that the BELL training helped make them better teachers. Site staff noted these
positive features of the training activities: the clarity and breadth of the information conveyed and
the energy and passion of the BELL trainers.
Overall feedback: Areas for improvement. Program managers and other site staff reported
a number of areas that needed improvement. Some of them were noted above in staff feedback
about program components, such as concern that information on students’ needs for ESOL or
special education services was not available before the start of the program. This issue was just
one example of the need for more coordination and communication between MCPS and BELL.
Further, other information about students was unavailable to teachers or other site staff, such as
medical records and eligibility for weekend food bags. Another issue that required collaboration
between BELL and MCPS was bus transportation. Most sites experienced some challenges in the
first few days of the program, but in all cases the difficulties were resolved.
A few items were of concern at only one or two sites. Because the BELL program and materials
were separate from those of MCPS, BELL staff needed to set up some of their equipment, such as
printers and copiers. Two sites had difficulties with equipment but did not have available technical
support. At one site, the program manager was concerned about the lack of a trained health
technician or nurse every day; although the program assistant took over these duties on days
without a health technician or nurse.

Montgomery County Public Schools Office of Shared Accountability
Program Evaluation 11 Evaluation of the BELL Program
Findings for Question 2: Mathematics
What was the impact of the BELL program on student mathematics skills? Did the
mathematics impact of the program vary by student subgroups?
To evaluate the impact of the BELL program on student skills in mathematics, this study used
multiple regression analysis to test for a significant relationship between attendance at BELL and
student achievement on MAP-M for the group of all students and separately for each student
subgroup of 35 or more students. The sample included both attendees and non-attendees (students
who were invited but did not attend). For multiple regression analyses, standardized regression
coefficients (β values) were used as an effect size measure to determine if the differences were
large enough to be useful in making programmatic decisions (Kline, 2005). To interpret the
magnitude of β values, the following guidelines from Cohen (1988) were used: .10, .30, and .50
which correspond to small, medium, and large effect sizes, respectively.
All Students
In both Grades 3 and 4, BELL attendees as a group had higher mean scale scores on the test of
math achievement (MAP-M) in the fall after the BELL program, than the comparison students
(Table 2.1).
Table 2.1
Mean and Standard Deviation of MAP-M Scale Scores for
Grades 3 and 4 by Attendance at BELL
Attendees Non-attendees
N Mean
Standard
deviation N Mean
Standard
deviation
Grade 3 377 179.2 9.2 412 176.4 9.3
Grade 4 427 190.0 9.3 686 189.5 10.5
The regression analysis confirmed the positive relationship between BELL attendance and
mathematics skills. The relationship was statistically significant for both Grade 3 (β = .10,
p < .001) and Grade 4 (β = .04, p < .05) (Table 2.2). This relationship also was practically
significant for Grade 3, with a small effect size (β = .10), meaning that the difference between
BELL attendees and non-attendees, although small, was large enough to be useful to educators.
Table 2.2
The Relationship between BELL Attendance and MAP-M Scale Scores for Grades 3 and 4
Attendance at
BELL: B (SE)
Attendance at
BELL: β
Model fit:
F (df)
Model fit:
adjusted R2
Grade 3 (N = 789) 1.82 (.47) 0.10*** 270.82 (3, 785) 0.51
Grade 4 (N = 1,113) 0.91 (.38) 0.04* 485.63 (4, 1,108) 0.64
*p < .05, **p < .01, ***p < .001.
Montgomery County Public Schools Office of Shared Accountability
Program Evaluation 12 Evaluation of the BELL Program
Subgroups
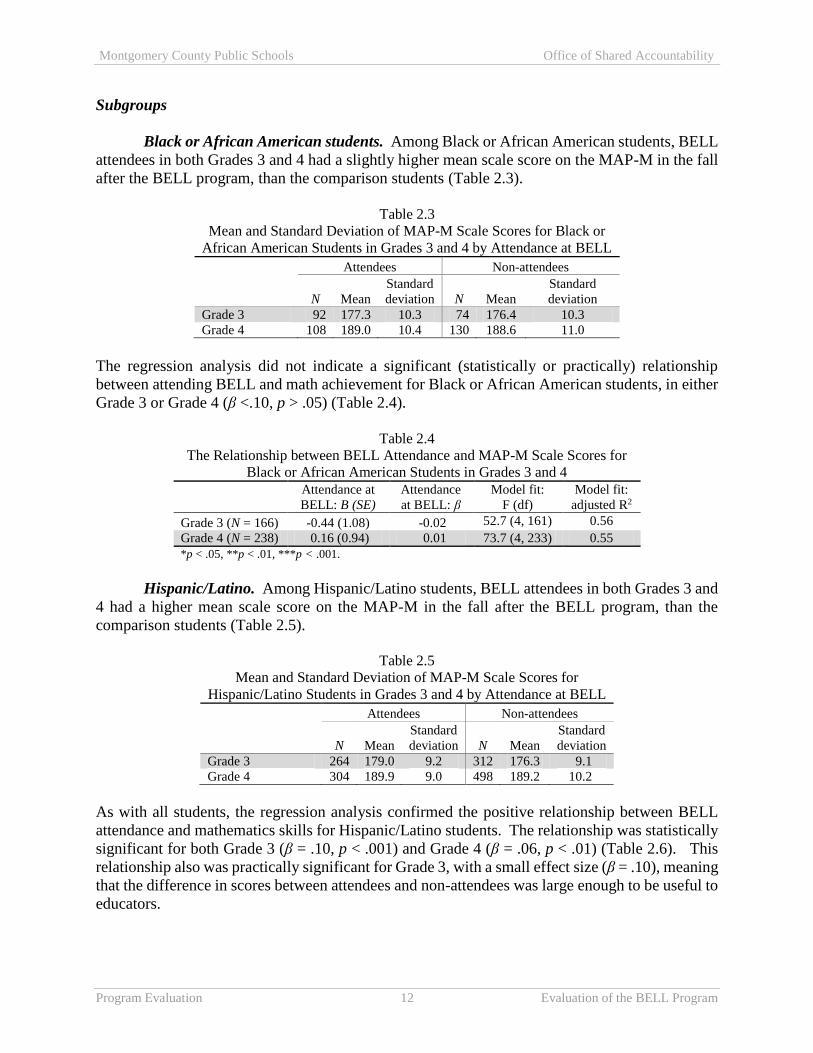
Black or African American students. Among Black or African American students, BELL
attendees in both Grades 3 and 4 had a slightly higher mean scale score on the MAP-M in the fall
after the BELL program, than the comparison students (Table 2.3).
Table 2.3
Mean and Standard Deviation of MAP-M Scale Scores for Black or
African American Students in Grades 3 and 4 by Attendance at BELL
Attendees Non-attendees
N Mean
Standard
deviation N Mean
Standard
deviation
Grade 3 92 177.3 10.3 74 176.4 10.3
Grade 4 108 189.0 10.4 130 188.6 11.0
The regression analysis did not indicate a significant (statistically or practically) relationship
between attending BELL and math achievement for Black or African American students, in either
Grade 3 or Grade 4 (β <.10, p > .05) (Table 2.4).
Table 2.4
The Relationship between BELL Attendance and MAP-M Scale Scores for
Black or African American Students in Grades 3 and 4
Attendance at
BELL: B (SE)
Attendance
at BELL: β
Model fit:
F (df)
Model fit:
adjusted R2
Grade 3 (N = 166) -0.44 (1.08) -0.02 52.7 (4, 161) 0.56
Grade 4 (N = 238) 0.16 (0.94) 0.01 73.7 (4, 233) 0.55
*p < .05, **p < .01, ***p < .001.
Hispanic/Latino. Among Hispanic/Latino students, BELL attendees in both Grades 3 and
4 had a higher mean scale score on the MAP-M in the fall after the BELL program, than the
comparison students (Table 2.5).
Table 2.5
Mean and Standard Deviation of MAP-M Scale Scores for
Hispanic/Latino Students in Grades 3 and 4 by Attendance at BELL
Attendees Non-attendees
N Mean
Standard
deviation N Mean
Standard
deviation
Grade 3 264 179.0 9.2 312 176.3 9.1
Grade 4 304 189.9 9.0 498 189.2 10.2
As with all students, the regression analysis confirmed the positive relationship between BELL
attendance and mathematics skills for Hispanic/Latino students. The relationship was statistically
significant for both Grade 3 (β = .10, p < .001) and Grade 4 (β = .06, p < .01) (Table 2.6). This
relationship also was practically significant for Grade 3, with a small effect size (β = .10), meaning
that the difference in scores between attendees and non-attendees was large enough to be useful to
educators.

Montgomery County Public Schools Office of Shared Accountability
Program Evaluation 13 Evaluation of the BELL Program
Table 2.6
The Relationship between BELL Attendance and MAP-M Scale Scores for
Hispanic/Latino Students in Grades 3 and 4
Attendance at
BELL: B (SE)
Attendance
at BELL: β
Model fit:
F (df)
Model fit:
adjusted R2
Grade 3 (N = 576) 1.86 (0.56) 0.10*** 178.5 (3, 572) 0.48
Grade 4 (N = 802) 1.30 (0.44) 0.06** 271.1 (5, 796) 0.63
*p < .05, **p < .01, ***p < .001.
ESOL recipients. Among students who received ESOL services prior to the summer,
BELL attendees in both Grades 3 and 4 had a higher mean scale score on the MAP-M in the fall
after the BELL program, than the comparison students (Table 2.7).
Table 2.7
Mean and Standard Deviation of MAP-M Scale Scores for
ESOL Recipients in Grades 3 and 4 by Attendance at BELL
Attendees Non-attendees
N Mean
Standard
deviation N Mean
Standard
deviation
Grade 3 281 179.3 8.7 308 176.2 8.7
Grade 4 288 189.0 9.5 441 188.3 10.0
As with all students, the regression analysis confirmed the positive relationship between BELL
attendance and mathematics skills for ESOL recipients. The relationship was statistically
significant for both Grade 3 (β = .11, p < .001) and Grade 4 (β = .07, p < .01) (Table 2.8). This
relationship also was practically significant for Grade 3, with a small effect size (β > .10), meaning
that the difference in scores between attendees and non-attendees was large enough to be useful to
educators.
Table 2.8
The Relationship between BELL Attendance and MAP-M Scale Scores for
ESOL Recipients in Grades 3 and 4
Attendance at
BELL: B (SE)
Attendance
at BELL: β
Model fit:
F (df)
Model fit:
adjusted R2
Grade 3 (N = 589) 2.05 (0.54) 0.11*** 189.0 (3, 586) 0.49
Grade 4 (N = 729) 1.42 (0.48) 0.07** 183.4 (6, 722) 0.60
*p < .05, **p < .01, ***p < .001.
FARMS recipients. Among students who received FARMS services prior to the summer,
BELL attendees in both Grades 3 and 4 had a higher mean scale score on the MAP-M in the fall
after the BELL program, than the comparison students (Table 2.9).
Table 2.9
Mean and Standard Deviation of MAP-M Scale Scores for
FARMS Recipients in Grades 3 and 4 by Attendance at BELL
Attendees Non-attendees
N Mean
Standard
deviation N Mean
Standard
deviation
Grade 3 338 181.4 11.7 363 179.1 12.2
Grade 4 375 189.8 9.2 598 189.1 10.4
Montgomery County Public Schools Office of Shared Accountability
Program Evaluation 14 Evaluation of the BELL Program
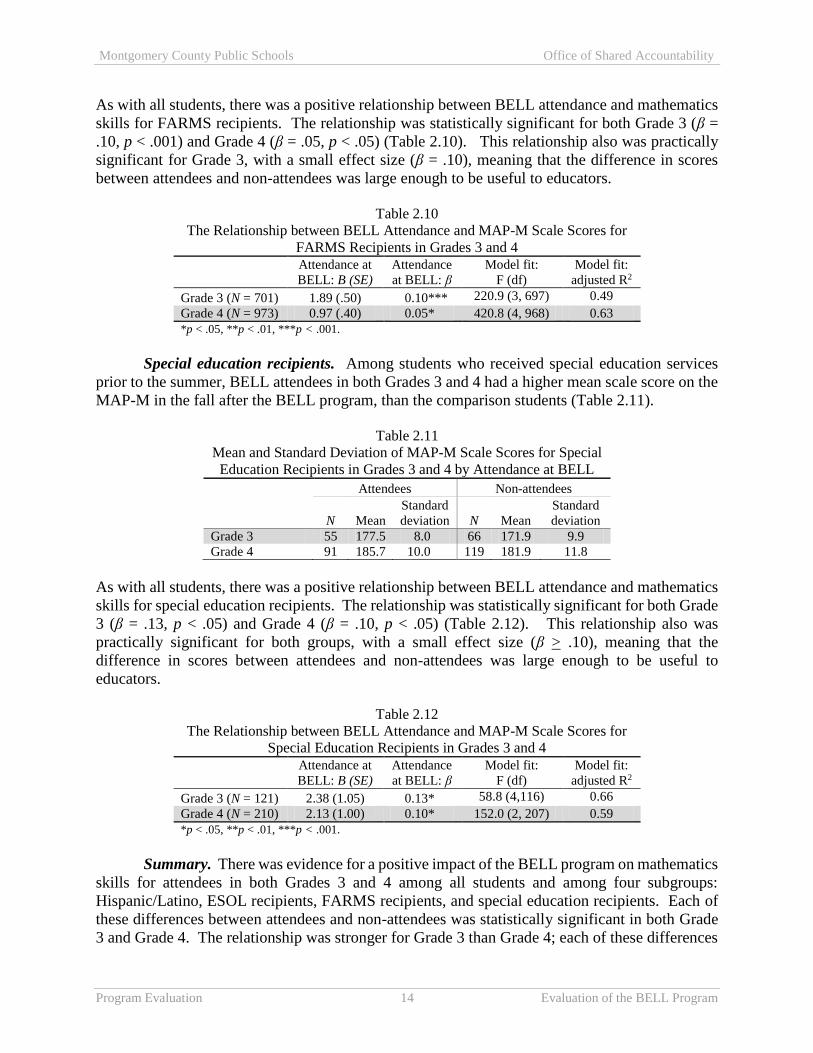
As with all students, there was a positive relationship between BELL attendance and mathematics
skills for FARMS recipients. The relationship was statistically significant for both Grade 3 (β =
.10, p < .001) and Grade 4 (β = .05, p < .05) (Table 2.10). This relationship also was practically
significant for Grade 3, with a small effect size (β = .10), meaning that the difference in scores
between attendees and non-attendees was large enough to be useful to educators.
Table 2.10
The Relationship between BELL Attendance and MAP-M Scale Scores for
FARMS Recipients in Grades 3 and 4
Attendance at
BELL: B (SE)
Attendance
at BELL: β
Model fit:
F (df)
Model fit:
adjusted R2
Grade 3 (N = 701) 1.89 (.50) 0.10*** 220.9 (3, 697) 0.49
Grade 4 (N = 973) 0.97 (.40) 0.05* 420.8 (4, 968) 0.63
*p < .05, **p < .01, ***p < .001.
Special education recipients. Among students who received special education services
prior to the summer, BELL attendees in both Grades 3 and 4 had a higher mean scale score on the
MAP-M in the fall after the BELL program, than the comparison students (Table 2.11).
Table 2.11
Mean and Standard Deviation of MAP-M Scale Scores for Special
Education Recipients in Grades 3 and 4 by Attendance at BELL
Attendees Non-attendees
N Mean
Standard
deviation N Mean
Standard
deviation
Grade 3 55 177.5 8.0 66 171.9 9.9
Grade 4 91 185.7 10.0 119 181.9 11.8
As with all students, there was a positive relationship between BELL attendance and mathematics
skills for special education recipients. The relationship was statistically significant for both Grade
3 (β = .13, p < .05) and Grade 4 (β = .10, p < .05) (Table 2.12). This relationship also was
practically significant for both groups, with a small effect size (β > .10), meaning that the
difference in scores between attendees and non-attendees was large enough to be useful to
educators.
Table 2.12
The Relationship between BELL Attendance and MAP-M Scale Scores for
Special Education Recipients in Grades 3 and 4
Attendance at
BELL: B (SE)
Attendance
at BELL: β
Model fit:
F (df)
Model fit:
adjusted R2
Grade 3 (N = 121) 2.38 (1.05) 0.13* 58.8 (4,116) 0.66
Grade 4 (N = 210) 2.13 (1.00) 0.10* 152.0 (2, 207) 0.59
*p < .05, **p < .01, ***p < .001.
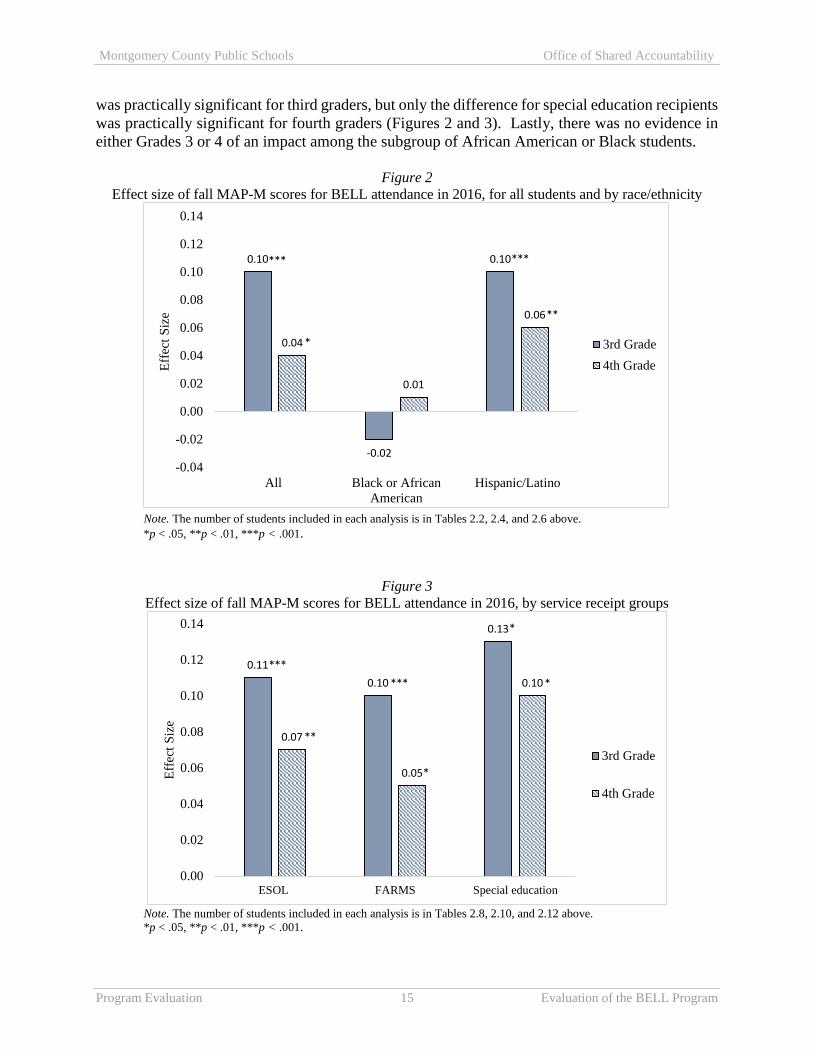
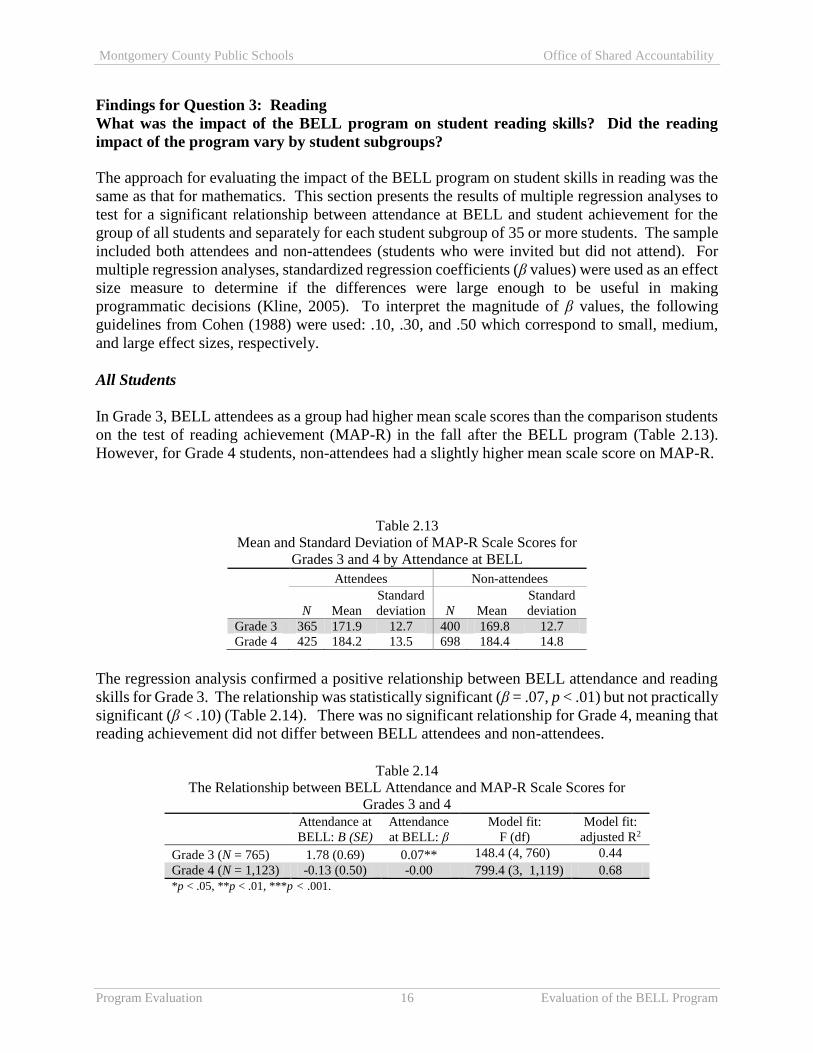
Summary. There was evidence for a positive impact of the BELL program on mathematics
skills for attendees in both Grades 3 and 4 among all students and among four subgroups:
Hispanic/Latino, ESOL recipients, FARMS recipients, and special education recipients. Each of
these differences between attendees and non-attendees was statistically significant in both Grade
3 and Grade 4. The relationship was stronger for Grade 3 than Grade 4; each of these differences
Montgomery County Public Schools Office of Shared Accountability
Program Evaluation 15 Evaluation of the BELL Program
was practically significant for third graders, but only the difference for special education recipients
was practically significant for fourth graders (Figures 2 and 3). Lastly, there was no evidence in
either Grades 3 or 4 of an impact among the subgroup of African American or Black students.
Figure 2
Effect size of fall MAP-M scores for BELL attendance in 2016, for all students and by race/ethnicity
Note. The number of students included in each analysis is in Tables 2.2, 2.4, and 2.6 above.
*p < .05, **p < .01, ***p < .001.
Figure 3
Effect size of fall MAP-M scores for BELL attendance in 2016, by service receipt groups
Note. The number of students included in each analysis is in Tables 2.8, 2.10, and 2.12 above.
*p < .05, **p < .01, ***p < .001.
0.10
-0.02
0.10
0.04
0.01
0.06
-0.04
-0.02
0.00
0.02
0.04
0.06
0.08
0.10
0.12
0.14
All Black or African
American
Hispanic/Latino
Eff
ect
Siz
e
3rd Grade
4th Grade
*** ***
**
*
0.11
0.10
0.13
0.07
0.05
0.10
0.00
0.02
0.04
0.06
0.08
0.10
0.12
0.14
ESOL FARMS Special education
Eff
ect
Siz
e
3rd Grade
4th Grade
***
***
*
**
*
*
Montgomery County Public Schools Office of Shared Accountability
Program Evaluation 16 Evaluation of the BELL Program
Findings for Question 3: Reading
What was the impact of the BELL program on student reading skills? Did the reading
impact of the program vary by student subgroups?
The approach for evaluating the impact of the BELL program on student skills in reading was the
same as that for mathematics. This section presents the results of multiple regression analyses to
test for a significant relationship between attendance at BELL and student achievement for the
group of all students and separately for each student subgroup of 35 or more students. The sample
included both attendees and non-attendees (students who were invited but did not attend). For
multiple regression analyses, standardized regression coefficients (β values) were used as an effect
size measure to determine if the differences were large enough to be useful in making
programmatic decisions (Kline, 2005). To interpret the magnitude of β values, the following
guidelines from Cohen (1988) were used: .10, .30, and .50 which correspond to small, medium,
and large effect sizes, respectively.
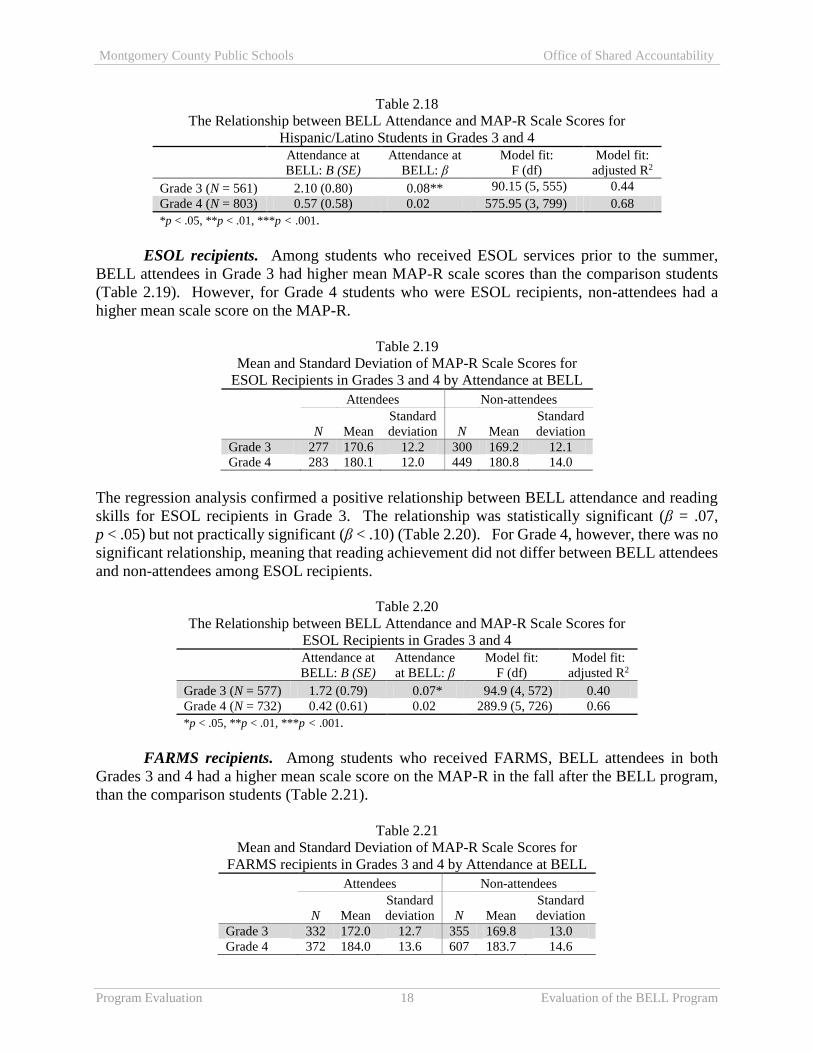
All Students
In Grade 3, BELL attendees as a group had higher mean scale scores than the comparison students
on the test of reading achievement (MAP-R) in the fall after the BELL program (Table 2.13).
However, for Grade 4 students, non-attendees had a slightly higher mean scale score on MAP-R.
Table 2.13
Mean and Standard Deviation of MAP-R Scale Scores for
Grades 3 and 4 by Attendance at BELL
Attendees Non-attendees
N Mean
Standard
deviation N Mean
Standard
deviation
Grade 3 365 171.9 12.7 400 169.8 12.7
Grade 4 425 184.2 13.5 698 184.4 14.8
The regression analysis confirmed a positive relationship between BELL attendance and reading
skills for Grade 3. The relationship was statistically significant (β = .07, p < .01) but not practically
significant (β < .10) (Table 2.14). There was no significant relationship for Grade 4, meaning that
reading achievement did not differ between BELL attendees and non-attendees.
Table 2.14
The Relationship between BELL Attendance and MAP-R Scale Scores for
Grades 3 and 4
Attendance at
BELL: B (SE)
Attendance
at BELL: β
Model fit:
F (df)
Model fit:
adjusted R2
Grade 3 (N = 765) 1.78 (0.69) 0.07** 148.4 (4, 760) 0.44
Grade 4 (N = 1,123) -0.13 (0.50) -0.00 799.4 (3, 1,119) 0.68
*p < .05, **p < .01, ***p < .001.

Montgomery County Public Schools Office of Shared Accountability
Program Evaluation 17 Evaluation of the BELL Program
Subgroups
Black or African American students. Among Black or African American students, BELL
attendees in Grade 3 had higher mean MAP-R scale scores than the comparison students
(Table 2.15). However, for Grade 4 students, non-attendees had a higher mean scale score on the
MAP-R.
Table 2.15
Mean and Standard Deviation of MAP-R Scale Scores for Black or
African American Students in Grades 3 and 4 by Attendance at BELL
Attendees Non-attendees
N Mean
Standard
deviation N Mean
Standard
deviation
Grade 3 87 173.9 12.6 73 172.8 14.9
Grade 4 108 187.0 13.4 130 187.9 14.5
The regression analysis did not indicate a significant (statistically or practically) relationship
between attending BELL and reading achievement for Black or African American students, in
either Grade 3 or Grade 4 (β <.10, p > .05) (Table 2.16).
Table 2.16
The Relationship between BELL Attendance and MAP-R Scale Scores for Black
or African American Students in Grades 3 and 4
Attendance at
BELL: B (SE)
Attendance
at BELL: β
Model fit:
F (df)
Model fit:
adjusted R2
Grade 3 (N = 160) 0.83 (1.83) 0.03 33.4 (2, 157) 0.29
Grade 4 (N = 238) -1.80 (1.13) -0.06 192.54 (2, 235) 0.62
*p < .05, **p < .01, ***p < .001.
Hispanic/Latino. Among Hispanic/Latino students, BELL attendees in both
Grades 3 and 4 had a higher mean scale score on the MAP-R in the fall after the BELL program,
than the comparison students (Table 2.17).
Table 2.17
Mean and Standard Deviation of MAP-R Scale Scores for
Hispanic/Latino Students in Grades 3 and 4 by Attendance at BELL
Attendees Non-attendees
N Mean
Standard
deviation N Mean
Standard
deviation
Grade 3 259 171.2 12.9 302 169.5 12.4
Grade 4 298 183.2 13.0 505 183.1 14.5
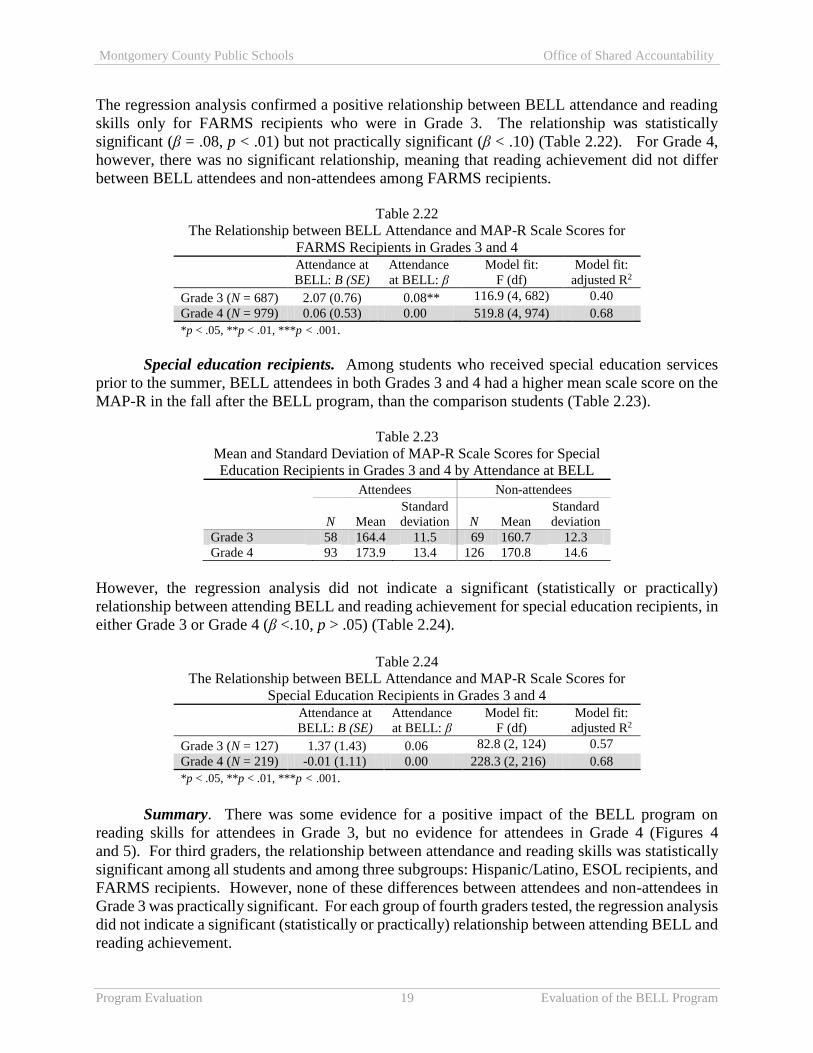
The regression analysis confirmed a positive relationship between BELL attendance and reading
skills for Hispanic/Latino students in Grade 3. The relationship was statistically significant
(β = .08, p < .01) but not practically significant (β < .10) (Table 2.18). For Grade 4, however,
there was no significant relationship, meaning that reading achievement did not differ between
BELL attendees and non-attendees.
Montgomery County Public Schools Office of Shared Accountability
Program Evaluation 18 Evaluation of the BELL Program
Table 2.18
The Relationship between BELL Attendance and MAP-R Scale Scores for
Hispanic/Latino Students in Grades 3 and 4
Attendance at
BELL: B (SE)
Attendance at
BELL: β
Model fit:
F (df)
Model fit:
adjusted R2
Grade 3 (N = 561) 2.10 (0.80) 0.08** 90.15 (5, 555) 0.44
Grade 4 (N = 803) 0.57 (0.58) 0.02 575.95 (3, 799) 0.68
*p < .05, **p < .01, ***p < .001.
ESOL recipients. Among students who received ESOL services prior to the summer,
BELL attendees in Grade 3 had higher mean MAP-R scale scores than the comparison students
(Table 2.19). However, for Grade 4 students who were ESOL recipients, non-attendees had a
higher mean scale score on the MAP-R.
Table 2.19
Mean and Standard Deviation of MAP-R Scale Scores for
ESOL Recipients in Grades 3 and 4 by Attendance at BELL
Attendees Non-attendees
N Mean
Standard
deviation N Mean
Standard
deviation
Grade 3 277 170.6 12.2 300 169.2 12.1
Grade 4 283 180.1 12.0 449 180.8 14.0
The regression analysis confirmed a positive relationship between BELL attendance and reading
skills for ESOL recipients in Grade 3. The relationship was statistically significant (β = .07,
p < .05) but not practically significant (β < .10) (Table 2.20). For Grade 4, however, there was no
significant relationship, meaning that reading achievement did not differ between BELL attendees
and non-attendees among ESOL recipients.
Table 2.20
The Relationship between BELL Attendance and MAP-R Scale Scores for
ESOL Recipients in Grades 3 and 4
Attendance at
BELL: B (SE)
Attendance
at BELL: β
Model fit:
F (df)
Model fit:
adjusted R2
Grade 3 (N = 577) 1.72 (0.79) 0.07* 94.9 (4, 572) 0.40
Grade 4 (N = 732) 0.42 (0.61) 0.02 289.9 (5, 726) 0.66
*p < .05, **p < .01, ***p < .001.
FARMS recipients. Among students who received FARMS, BELL attendees in both
Grades 3 and 4 had a higher mean scale score on the MAP-R in the fall after the BELL program,
than the comparison students (Table 2.21).
Table 2.21
Mean and Standard Deviation of MAP-R Scale Scores for
FARMS recipients in Grades 3 and 4 by Attendance at BELL
Attendees Non-attendees
N Mean
Standard
deviation N Mean
Standard
deviation
Grade 3 332 172.0 12.7 355 169.8 13.0
Grade 4 372 184.0 13.6 607 183.7 14.6
Montgomery County Public Schools Office of Shared Accountability
Program Evaluation 19 Evaluation of the BELL Program
The regression analysis confirmed a positive relationship between BELL attendance and reading
skills only for FARMS recipients who were in Grade 3. The relationship was statistically
significant (β = .08, p < .01) but not practically significant (β < .10) (Table 2.22). For Grade 4,
however, there was no significant relationship, meaning that reading achievement did not differ
between BELL attendees and non-attendees among FARMS recipients.
Table 2.22
The Relationship between BELL Attendance and MAP-R Scale Scores for
FARMS Recipients in Grades 3 and 4
Attendance at
BELL: B (SE)
Attendance
at BELL: β
Model fit:
F (df)
Model fit:
adjusted R2
Grade 3 (N = 687) 2.07 (0.76) 0.08** 116.9 (4, 682) 0.40
Grade 4 (N = 979) 0.06 (0.53) 0.00 519.8 (4, 974) 0.68
*p < .05, **p < .01, ***p < .001.
Special education recipients. Among students who received special education services
prior to the summer, BELL attendees in both Grades 3 and 4 had a higher mean scale score on the
MAP-R in the fall after the BELL program, than the comparison students (Table 2.23).
Table 2.23
Mean and Standard Deviation of MAP-R Scale Scores for Special
Education Recipients in Grades 3 and 4 by Attendance at BELL
Attendees Non-attendees
N Mean
Standard
deviation N Mean
Standard
deviation
Grade 3 58 164.4 11.5 69 160.7 12.3
Grade 4 93 173.9 13.4 126 170.8 14.6
However, the regression analysis did not indicate a significant (statistically or practically)
relationship between attending BELL and reading achievement for special education recipients, in
either Grade 3 or Grade 4 (β <.10, p > .05) (Table 2.24).
Table 2.24
The Relationship between BELL Attendance and MAP-R Scale Scores for
Special Education Recipients in Grades 3 and 4
Attendance at
BELL: B (SE)
Attendance
at BELL: β
Model fit:
F (df)
Model fit:
adjusted R2
Grade 3 (N = 127) 1.37 (1.43) 0.06 82.8 (2, 124) 0.57
Grade 4 (N = 219) -0.01 (1.11) 0.00 228.3 (2, 216) 0.68
*p < .05, **p < .01, ***p < .001.
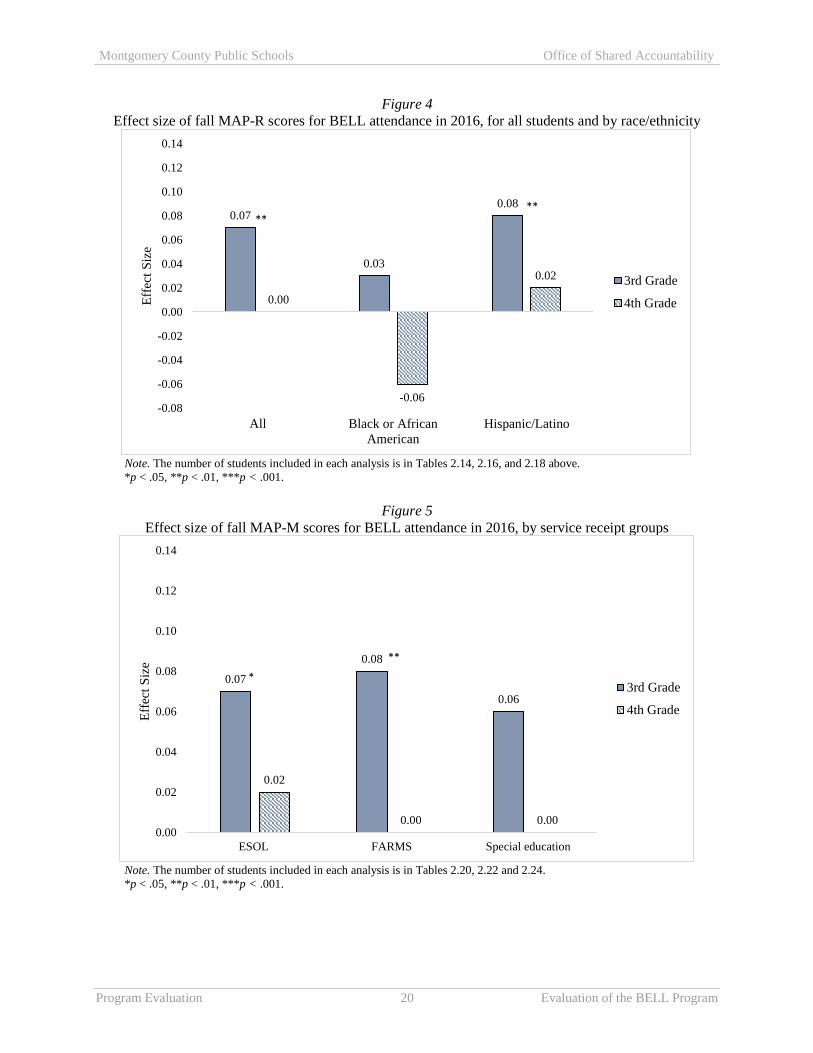
Summary. There was some evidence for a positive impact of the BELL program on
reading skills for attendees in Grade 3, but no evidence for attendees in Grade 4 (Figures 4
and 5). For third graders, the relationship between attendance and reading skills was statistically
significant among all students and among three subgroups: Hispanic/Latino, ESOL recipients, and
FARMS recipients. However, none of these differences between attendees and non-attendees in
Grade 3 was practically significant. For each group of fourth graders tested, the regression analysis
did not indicate a significant (statistically or practically) relationship between attending BELL and
reading achievement.
Montgomery County Public Schools Office of Shared Accountability
Program Evaluation 20 Evaluation of the BELL Program
Figure 4
Effect size of fall MAP-R scores for BELL attendance in 2016, for all students and by race/ethnicity
Note. The number of students included in each analysis is in Tables 2.14, 2.16, and 2.18 above.
*p < .05, **p < .01, ***p < .001.
Figure 5
Effect size of fall MAP-M scores for BELL attendance in 2016, by service receipt groups
Note. The number of students included in each analysis is in Tables 2.20, 2.22 and 2.24.
*p < .05, **p < .01, ***p < .001.
0.07
0.03
0.08
0.00
-0.06
0.02
-0.08
-0.06
-0.04
-0.02
0.00
0.02
0.04
0.06
0.08
0.10
0.12
0.14
All Black or African
American
Hispanic/Latino
Eff
ect
Siz
e
3rd Grade
4th Grade
****
0.07
0.08
0.06
0.02
0.00 0.000.00
0.02
0.04
0.06
0.08
0.10
0.12
0.14
ESOL FARMS Special education
Eff
ect
Siz
e
3rd Grade
4th Grade
*
**
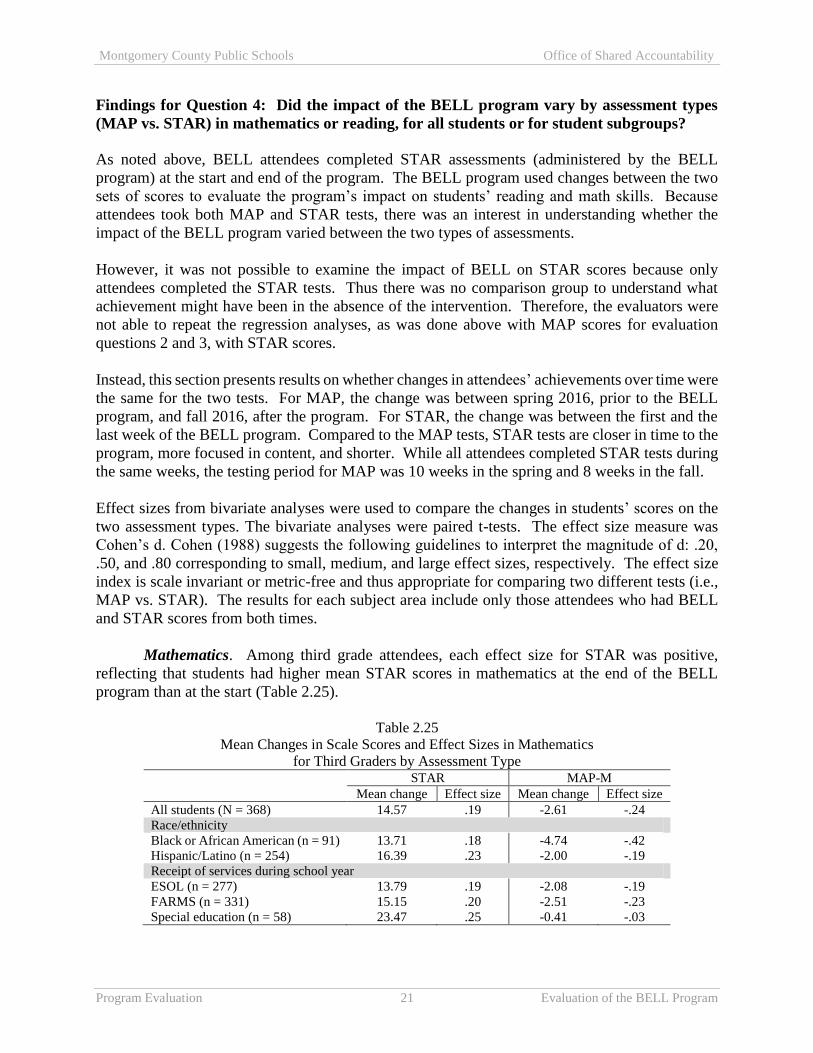
Montgomery County Public Schools Office of Shared Accountability
Program Evaluation 21 Evaluation of the BELL Program
Findings for Question 4: Did the impact of the BELL program vary by assessment types
(MAP vs. STAR) in mathematics or reading, for all students or for student subgroups?
As noted above, BELL attendees completed STAR assessments (administered by the BELL
program) at the start and end of the program. The BELL program used changes between the two
sets of scores to evaluate the program’s impact on students’ reading and math skills. Because
attendees took both MAP and STAR tests, there was an interest in understanding whether the
impact of the BELL program varied between the two types of assessments.
However, it was not possible to examine the impact of BELL on STAR scores because only
attendees completed the STAR tests. Thus there was no comparison group to understand what
achievement might have been in the absence of the intervention. Therefore, the evaluators were
not able to repeat the regression analyses, as was done above with MAP scores for evaluation
questions 2 and 3, with STAR scores.
Instead, this section presents results on whether changes in attendees’ achievements over time were
the same for the two tests. For MAP, the change was between spring 2016, prior to the BELL
program, and fall 2016, after the program. For STAR, the change was between the first and the
last week of the BELL program. Compared to the MAP tests, STAR tests are closer in time to the
program, more focused in content, and shorter. While all attendees completed STAR tests during
the same weeks, the testing period for MAP was 10 weeks in the spring and 8 weeks in the fall.
Effect sizes from bivariate analyses were used to compare the changes in students’ scores on the
two assessment types. The bivariate analyses were paired t-tests. The effect size measure was
Cohen’s d. Cohen (1988) suggests the following guidelines to interpret the magnitude of d: .20,
.50, and .80 corresponding to small, medium, and large effect sizes, respectively. The effect size
index is scale invariant or metric-free and thus appropriate for comparing two different tests (i.e.,
MAP vs. STAR). The results for each subject area include only those attendees who had BELL
and STAR scores from both times.
Mathematics. Among third grade attendees, each effect size for STAR was positive,
reflecting that students had higher mean STAR scores in mathematics at the end of the BELL
program than at the start (Table 2.25).
Table 2.25
Mean Changes in Scale Scores and Effect Sizes in Mathematics
for Third Graders by Assessment Type STAR MAP-M
Mean change Effect size Mean change Effect size
All students (N = 368) 14.57 .19 -2.61 -.24
Race/ethnicity
Black or African American (n = 91) 13.71 .18 -4.74 -.42
Hispanic/Latino (n = 254) 16.39 .23 -2.00 -.19
Receipt of services during school year
ESOL (n = 277) 13.79 .19 -2.08 -.19
FARMS (n = 331) 15.15 .20 -2.51 -.23
Special education (n = 58) 23.47 .25 -0.41 -.03

Montgomery County Public Schools Office of Shared Accountability
Program Evaluation 22 Evaluation of the BELL Program
By contrast, each effect size for MAP-M was negative, because students had lower mean MAP-M
scores in the fall after the BELL program than the spring before, as indicated by a negative mean
change (Table 2.25). Thus, for each student group, the difference between effect sizes (i.e., MAP
and STAR) indicated that the changes in attendees’ achievement over time were not the same for
the two tests. The MAP results suggest slight learning loss from spring to fall and the STAR
results suggest immediate learning gains after attending BELL.
For mathematics scores among fourth grade attendees, each effect size for STAR was positive
(Table 2.26). The MAP-M effect sizes were close to zero. Thus, the effect sizes for the two
assessments did vary; those for STAR were larger, suggesting immediate gains in mathematics
after attending BELL, than those for MAP-M that suggest no change from spring to fall.
Table 2.26
Mean Changes in Scale Scores and Effect Sizes in Mathematics for Fourth Graders
by Assessment Type
Student group
STAR MAP-M
Mean change Effect size Mean change Effect size
All (N = 406) 15.78 0.19 0.03 0.00
Race/ethnicity
Black or African American (n = 101) 11.16 0.14 -0.31 -0.03
Hispanic/Latino (n = 288) 17.46 0.22 0.22 0.02
Receipt of services during school year
ESOL (n = 273) 16.60 0.20 0.37 0.04
FARMS (n = 355) 15.58 0.20 0.04 0.00
Special education (n = 85) 12.87 0.16 -0.26 -0.03
Reading. There are no reading results for Grade 3, because these students did not take
MAP-R in the spring prior to the BELL program.
For reading scores among fourth grade attendees, each effect size for STAR was at least a little
larger than the MAP-R effect size for the same student group (Table 2.27). Although the effect
sizes are similar between the two tests, those for STAR suggest more gains in reading than those
for MAP-R.
Table 2.27
Mean Changes in Scale Scores and Effect Sizes in Reading for Fourth Graders
by Assessment Type STAR MAP-R
Mean change Effect size Mean change Effect size
All students (N = 394) 13.99 0.14 0.81 0.06
Race/ethnicity
Black or African American (n = 99) 11.25 0.10 -0.81 -0.06
Hispanic/Latino (n = 278) 15.12 0.15 1.32 0.11
Receipt of services during school year
ESOL (n = 263) 14.70 0.16 1.39 0.11
FARMS (n = 345) 13.27 0.13 0.88 0.07
Special education (n = 87) 11.69 0.14 0.99 0.08
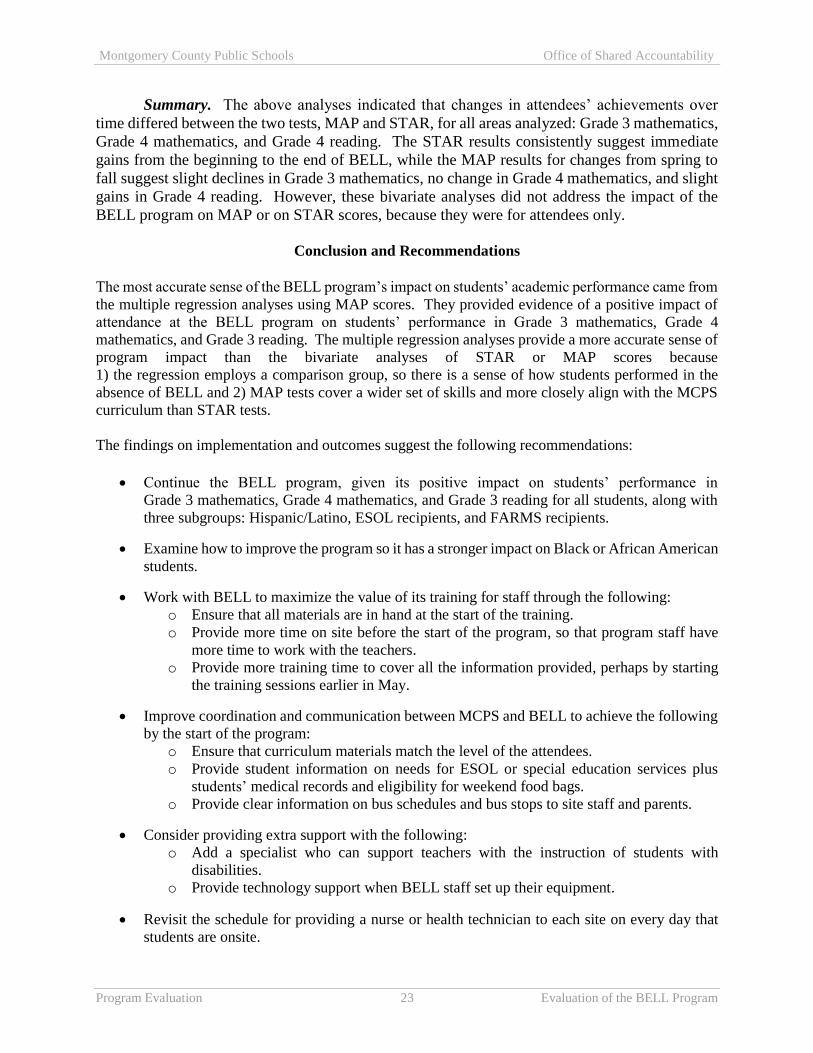
Montgomery County Public Schools Office of Shared Accountability
Program Evaluation 23 Evaluation of the BELL Program
Summary. The above analyses indicated that changes in attendees’ achievements over
time differed between the two tests, MAP and STAR, for all areas analyzed: Grade 3 mathematics,
Grade 4 mathematics, and Grade 4 reading. The STAR results consistently suggest immediate
gains from the beginning to the end of BELL, while the MAP results for changes from spring to
fall suggest slight declines in Grade 3 mathematics, no change in Grade 4 mathematics, and slight
gains in Grade 4 reading. However, these bivariate analyses did not address the impact of the
BELL program on MAP or on STAR scores, because they were for attendees only.
Conclusion and Recommendations
The most accurate sense of the BELL program’s impact on students’ academic performance came from
the multiple regression analyses using MAP scores. They provided evidence of a positive impact of
attendance at the BELL program on students’ performance in Grade 3 mathematics, Grade 4
mathematics, and Grade 3 reading. The multiple regression analyses provide a more accurate sense of
program impact than the bivariate analyses of STAR or MAP scores because
1) the regression employs a comparison group, so there is a sense of how students performed in the
absence of BELL and 2) MAP tests cover a wider set of skills and more closely align with the MCPS
curriculum than STAR tests.
The findings on implementation and outcomes suggest the following recommendations:
Continue the BELL program, given its positive impact on students’ performance in
Grade 3 mathematics, Grade 4 mathematics, and Grade 3 reading for all students, along with
three subgroups: Hispanic/Latino, ESOL recipients, and FARMS recipients.
Examine how to improve the program so it has a stronger impact on Black or African American
students.
Work with BELL to maximize the value of its training for staff through the following:
o Ensure that all materials are in hand at the start of the training.
o Provide more time on site before the start of the program, so that program staff have
more time to work with the teachers.
o Provide more training time to cover all the information provided, perhaps by starting
the training sessions earlier in May.
Improve coordination and communication between MCPS and BELL to achieve the following
by the start of the program:
o Ensure that curriculum materials match the level of the attendees.
o Provide student information on needs for ESOL or special education services plus
students’ medical records and eligibility for weekend food bags.
o Provide clear information on bus schedules and bus stops to site staff and parents.
Consider providing extra support with the following:
o Add a specialist who can support teachers with the instruction of students with
disabilities.
o Provide technology support when BELL staff set up their equipment.
Revisit the schedule for providing a nurse or health technician to each site on every day that
students are onsite.
Montgomery County Public Schools Office of Shared Accountability
Program Evaluation 24 Evaluation of the BELL Program
Acknowledgments
The evaluators thank Dr. Cara Jackson, evaluation support specialist, Program Evaluation Unit
(PEU) and Mrs. Natalie Wolanin, logistics support specialist, PEU, for analysis, assistance with
figures and tables, and helpful suggestions on an earlier draft of this report.
The authors also appreciate assistance in acquiring information and data from BELL and helpful
suggestions on earlier drafts of this report provided by Mrs. Deann M. Collins, director, Division
of Title I and Early Childhood Programs and Services and Mrs. Nichelle Owens-Jones, supervisor,
Division of Title I and Early Childhood Programs and Services. We are also grateful to the site
staff at each BELL site for sharing their experiences and perceptions.
Lastly, the authors thank Dr. Shahpar Modarresi, supervisor, PEU, for her guidance and support
throughout this study.
Montgomery County Public Schools Office of Shared Accountability
Program Evaluation 25 Evaluation of the BELL Program
References
American Psychological Association. (2010). Publication of the American Psychological
Association, Sixth Edition. Washington D.C.: American Psychological Association.
BELL (Building Educated Leaders for Life) & MCPS (Montgomery County Public Schools Board
of Education). (2016). Memorandum of Agreement between BELL and the Board of
Education of Montgomery County.
BELL Summer Impact Report. (2015). Available at http://www.experienceBELL.org.
BELL (Building Educated Leaders for Life). (2016). Goals and core essentials. Available at
http://www.experiencebell.org/our-programs/core-essentials.
Campbell, D. T., & Stanley, J. C. (1966). Experimental and Quasi-experimental Designs for
Research. Chicago: Rand McNally.
Chaplin, D., & Capizzano, J. (2006). Impacts of a summer learning program: A random
assignment study of Building Educated Leaders for Life (BELL). Mathematics Policy
Research/The Urban Institute.
Cohen, J. (1988). Statistical power analysis for the behavioral science (2nd ed.). Hillsdale, NJ:
Lawrence Earlbaum Associates.
Cooper, H., Nye, B., Charlton, K., Lindsay, J., & Greathouse, S. (1996). The effects of summer
vacation on achievement test scores: A narrative and meta-analytic review. Review of
Educational Research, 66(3), 227-268.
Cooper, T. (2004). BELL after-school program: 2003–2004 national program outcomes.
Dorchester, MA. Building Educated Leaders for Life (BELL).
Downey, D. B., von Hippel, P. T., & Broh, B. A. (2004). Are schools the great equalizer?
Cognitive inequality during the summer months and the school year. American
Sociological Review, 69(5), 613–635.
Entwisle, D. R., & Alexander, K. L. (1992). Summer setback: Race, poverty, school composition,
and mathematics achievement in the first two years of school. American Sociological
Review, 57, 72-84.
Entwisle, D. R., Alexander, K. L., & Olson, L. S. (2001). Keep the Faucet Flowing: Summer
Learning and Home Environment. American Educator, 25(3), 10-15.
Hayes, D. P., & Grether, J. (1983). The school year and vacations: When do students learn?
Cornell Journal of Social Relations, 17(1), 56-71.
Montgomery County Public Schools Office of Shared Accountability
Program Evaluation 26 Evaluation of the BELL Program
Judd, C. M., Smith, E. R., & Kidder, L. H. (1991). Research Methods in Social Relations, Fort
Worth, Holt, Rinehart and Winston.
Kline, R. B. (2005). Beyond significance testing: Reforming data analysis methods in behavioral
research (2nd ed.). Washington, DC: American Psychological Association.
Lakens, D. (2013). Calculating and reporting effect sizes to facilitate cumulative science: a
practical primer for t-tests and ANOVAs. Frontiers in Psychology, 4.
https://doi.org/10.3389/fpsyg.2013.00863.
McCombs, J. S., Augustine, C. H., Schwartz, H. L., Bodilly, S. J., McInnis, B., Lichter, D. S., &
Cross, A. B. (2011). Making summer count: How summer programs can boost children’s
learning. Report produced for the RAND Corporation, commissioned by The Wallace
Foundation.
Montgomery County Council. (2016). Update on the implementation of the Building Educated
Leaders for Life (BELL) Program, March 1, 2016.
Northwest Evaluation Association. (2008). RIT scale norms for use with Measures of Academic
Progress. Lake Oswego, OR: Northwest Evaluation Association.
Northwest Evaluation Association. (2011). Technical manual for Measures of Academic Progress
and Measures of Academic Progress for primary grades. Lake Oswego, OR: Northwest
Evaluation Association.
Renaissance Learning. (2015). STAR Reading Technical Manual. Wisconsin Rapids, WI:
Renaissance Learning.
Shadish, W. R., Cook, T. D., & Campbell, D. T. (2002). Experimental and quasi-experimental
designs for generalized causal inference. Boston: Houghton Mifflin.

Montgomery County Public Schools Office of Shared Accountability
Program Evaluation 27 Evaluation of the BELL Program
Appendix A
2016 BELL Summer Learning Program Sites
Arcola Elementary School
Bel Pre Elementary School
Clopper Mill Elementary School
Cresthaven Elementary School
Sargent Shriver Elementary School
Summit Hall Elementary School
Watkins Mill Elementary School
Weller Road Elementary School

Montgomery County Public Schools Office of Shared Accountability
Program Evaluation 28 Evaluation of the BELL Program
Appendix B
Bell Summer Learning Program Application
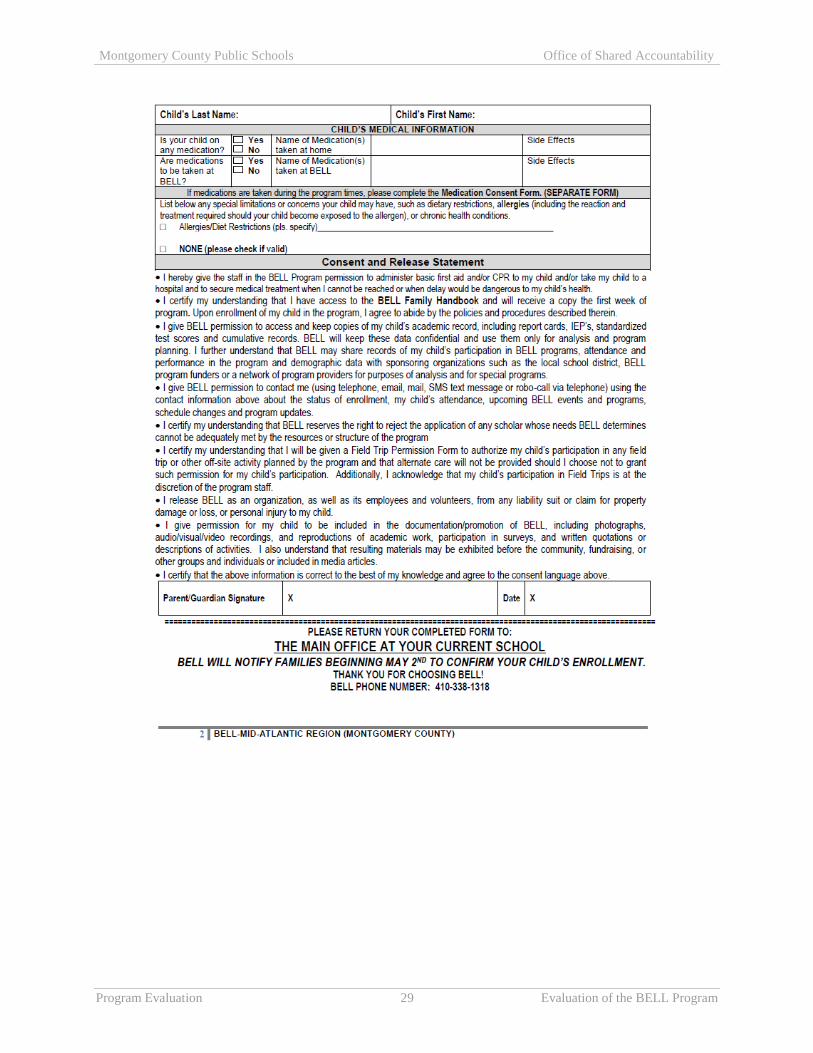
Montgomery County Public Schools Office of Shared Accountability
Program Evaluation 29 Evaluation of the BELL Program