evaluation of the medicare diabetes prevention program
TRANSCRIPT

Evaluation of the Medicare Diabetes Prevention Program First Annual Report
March 2021 Prepared for: Patricia Markovich, Jean Gaines Centers for Medicare & Medicaid Services Center for Medicare and Medicaid Innovation Mail Stop WB-06-05 7500 Security Boulevard Baltimore, MD 21244-1850
Prepared by: Thomas J. Hoerger, PhD Sara Jacobs, PhD Melissa Romaine, PhD Yiyan Liu, PhD Simon Neuwahl, MSPH, MS Annette Casoglos, MPH Adam Walter, MS Benjamin Allaire, MS Zohra Tayebali, BA Wendi Elkins, BA RTI International 3040 East Cornwallis Road Research Triangle Park, NC 27709-2194 USA Peter Amico, PhD Amico Consulting 4843 Big Oaks Lane Orlando, FL 32806
RTI Project Number: 0214448.001.011.000.004

EVALUATION OF THE MEDICARE DIABETES PREVENTION PROGRAM (MDPP)
FIRST ANNUAL REPORT
by Thomas J. Hoerger, PhD, Project DirectorSara Jacobs, PhD, Associate Project Director
Melissa Romaire, PhD, Yiyan Liu, PhD, Simon Neuwahl, MSPH, MS, Annette Casoglos, MPH, Adam Walter, MS. Zohra Tayebali, BA, Wendi Elkins, BA, and Peter Amico, PhD
Federal Project Officer: Patricia Markovich, Jean Gaines
RTI International
CMS Contract No. HHSM-500-2014-0037I, Order No. 75FCMC18F0003
March 2021
This project was funded by the Centers for Medicare & Medicaid Services under contract no. HHSM-500-2014-0037I. The statements contained in this report are solely those of the authors and do not necessarily reflect the views or policies of the Centers for Medicare & Medicaid Services. RTI assumes responsibility for the accuracy and completeness of the information contained in this report.

iii
ACKNOWLEDGMENTS
Vincent Keyes and Amy Huebeler provided programming and analytic support. Deborah Porterfield provided clinical expertise, and Emily Callot and Tayo Jolaoso provided editorial assistance. We appreciate the support of CMS Contracting Officer Technical Representatives Patricia Markovich and Jean Gaines.

iv
CONTENTS
Acknowledgments.......................................................................................................................... iii
Abbreviations Used ....................................................................................................................... vii
Executive Summary .........................................................................................................................1
Section 1. Purpose, Background, and Key Data Sources ................................................................71.1 Background ....................................................................................................................8
1.1.1 The Medicare Diabetes Prevention Program .....................................................81.1.2 Research Questions ..........................................................................................10
1.2 Logic Model of the MDPP ...........................................................................................111.3 Key Data Sources on MDPP Beneficiaries ..................................................................14
1.3.1 MDPP Enrollee Identification: The Supplier Crosswalk .................................141.3.2 MDPP Program Information: The DPRP Data ................................................161.3.3 Claims and Enrollment Data: The CCW .........................................................171.3.4 Impact of Reporting Schedules ........................................................................17
1.4 Supplier Data Sources ..................................................................................................19
Section 2. Supplier Enrollment and Access ...................................................................................202.1 Currently Enrolled MDPP Suppliers ...........................................................................212.2 Increase in MDPP Suppliers Over Time ......................................................................222.3 Supplier Reach .............................................................................................................232.4 Beneficiary Access .......................................................................................................242.5 Supplier Implementation of the MDPP ........................................................................242.6 Conclusions ..................................................................................................................26
Section 3. Beneficiary Participation, Weight Loss, and Physical Activity in the MDPP ..............27 3.1 Number of Beneficiaries ..............................................................................................273.2 Beneficiary Demographics...........................................................................................273.3 Session Attendance ......................................................................................................313.4 Weight Loss .................................................................................................................32
3.4.1 Weight Loss Based on Time Since First Class ................................................333.4.2 Achievement of Target Weight-Loss Goals ....................................................353.4.3 Comparison to Other Studies ...........................................................................37
3.5 Physical Activity ..........................................................................................................373.6 Summary ......................................................................................................................39
Section 4. MDPP Services Billed to Medicare and Baseline Medicare Spending and Use among MDPP Beneficiaries ..................................................................................................404.1 FFS MDPP Services Billed to Medicare .....................................................................404.2 Baseline Spending and Utilization Among MDPP FFS Beneficiaries ........................45
4.2.1 Analysis Time Period, Study Sample Identification, and Outcomes ...............45

v
4.2.2 Baseline Spending and Utilization Findings ....................................................474.3 Summary of Findings and Limitations ........................................................................48
Section 5. Evaluation Next Steps ...................................................................................................505.1 Continued Data Collection ...........................................................................................505.2 Analysis........................................................................................................................505.3 Comparison Group .......................................................................................................505.4 Effects of the COVID-19 Pandemic on the MDPP .....................................................51
References ......................................................................................................................................52
AppendixesAppendix A: Data Sources............................................................................................................ 54 Appendix B: Suppliers .................................................................................................................. 57 Appendix C: Beneficiaries ............................................................................................................ 59 Appendix D: Methods: FFS Claims Analysis ............................................................................... 71 Appendix E: Diabetes Indicator Flags in the CCW ...................................................................... 73
List of FiguresFigure 1. Logic model for the Medicare Diabetes Prevention Program ....................................... 13 Figure 2. Overlap between the Supplier Crosswalk and DPRP datasets ...................................... 18 Figure 3. Overlap between the Supplier Crosswalk FFS subsample and the CCW claims
dataset .................................................................................................................................. 19 Figure 4. MDPP supplier locations across the United States (N = 762), as of March 2,
2020 ..................................................................................................................................... 22 Figure 5. Number of MDPP supplier organizations and locations over time ............................... 23 Figure 6. Average weight-loss percentage by time since first class and overall .......................... 34 Figure 7. Average weight loss by number of sessions attended ................................................... 35 Figure 8. Cumulative percentage of beneficiaries reaching 5% and 9% weight loss by
time since first class ............................................................................................................. 36 Figure 9. Self-reported physical activity by sessions attended ..................................................... 38 Figure 10. Reimbursement for FFS MDPP services ..................................................................... 42 Figure 11 Number of MDPP FFS beneficiaries in the Supplier Crosswalk versus
Medicare claims ................................................................................................................... 43 Figure 12. Number of beneficiaries with approved MDPP FFS claims, April 1, 2018–
December 31, 2019 .............................................................................................................. 44
List of TablesTable ES-1. Key MDPP outcomes to date ...................................................................................... 5 Table 1 MDPP program structure ................................................................................................... 9 Table 2. Key data sources for beneficiary-level data on MDPP participants ............................... 15 Table 3. Supplier reach ................................................................................................................. 24 Table 4. Demographic characteristics of MDPP beneficiaries ..................................................... 28 Table 5. Referral source for beneficiaries ..................................................................................... 30 Table 6. Summary statistics for mean number of sessions and days enrolled by subset .............. 31 Table 7. Summary statistics for weight change among MDPP beneficiaries ............................... 33 Table 8. Summary statistics for achieving weight-loss goals for MDPP beneficiaries ................ 36

vi
Table 9. Y-USA DPP and MDPP weight change comparison ..................................................... 37 Table 10. Attributed start date based on Supplier Crosswalk datasets ......................................... 46 Table 11. Spending, utilization, and sociodemographic characteristics of MDPP FFS
beneficiaries and Medicare FFS beneficiaries ..................................................................... 47

vii
ABBREVIATIONS USED
BENE_ID Unique beneficiary identifier used in the CCWCCW Chronic Conditions Data WarehouseCDC Centers for Disease Control and PreventionCMMI Centers for Medicare and Medicaid InnovationCMS Centers for Medicare & Medicaid ServicesCOVID-19 Coronavirus disease 2019DPP Diabetes prevention programDPRP Diabetes Prevention Recognition Program: CDC program that sets standards for
DPP suppliersED Emergency departmentFFS Fee-for-serviceHCPCS Healthcare Common Procedure Coding SystemHEDIS Healthcare Effectiveness Data and Information SetHICN Medicare Health Insurance Claim NumberICD-10 International Classification of Diseases, 10th RevisionMA Medicare AdvantageMBI Medicare Beneficiary IdentifierMDPP Medicare Diabetes Prevention ProgramNational DPP National Diabetes Prevention ProgramOriginal DPP Diabetes Prevention Program clinical trial that provided evidence to support later
DPP initiatives, including the NDPP and MDPPPA Physical activityPBPM Per beneficiary per monthPCP Primary care providerPECOS Provider Enrollment, Chain, and Ownership SystemWL Weight lossY-USA YMCA of the USAY-USA DPP YMCA of the USA Diabetes Prevention Program—model test of a DPP serving
Medicare beneficiaries; provided evidence supporting creation of the MDPP

Evaluation of the Medicare Diabetes Prevention Program Annual Report
1
EXECUTIVE SUMMARY
The purpose of this annual report is to provide information from the Evaluation of the Medicare Diabetes Prevention Program (MDPP). The MDPP began serving Medicare beneficiaries on April 1, 2018, and RTI International was selected to evaluate the program in September 2018. This report provides information on
• suppliers enrolled in MDPP,
• beneficiaries participating in the MDPP,
• attendance and weight loss for MDPP beneficiaries,
• claims for MDPP services, and
• baseline costs for MDPP beneficiaries.
Unless otherwise noted, results in this report are based on data covering the program from April 1, 2018, through December 31, 2019.
The evaluation is designed to examine whether MDPP participation results in weight loss, improved health outcomes, and lower Medicare expenditures. Preliminary evidence suggests that MDPP beneficiaries lose weight while participating in the program. Currently, it is too early and there are not a sufficient number of participants to answer whether participation improves health outcomes or lowers expenditures. As beneficiary enrollment in the program increases, the evaluation will address these issues in subsequent annual reports.
E.1 Background and Data Sources
On April 1, 2018, Medicare began offering beneficiaries the MDPP, an evidence-based approach to delay or prevent type 2 diabetes. The MDPP was the first preventive service model tested by the Center for Medicare & Medicaid Innovation (CMMI) that was approved as a Medicare-covered service for fee-for-service (FFS) and Medicare Advantage (MA) beneficiaries.
The MDPP is a lifestyle-change intervention targeting weight loss and exercise in persons who are overweight or obese and are at high risk of developing type 2 diabetes. It covers 16 core sessions during the first 6 months, six monthly core maintenance sessions during months 7 through 12, and up to 12 monthly ongoing maintenance sessions during months 13 through 24 (if the participant meets weight-loss targets during the first 12 months). Sessions must be delivered in person, although limited virtual (e.g., online) makeup sessions are allowed.
Key Evaluation Questions and Evidence to Date1. Do MDDP beneficiaries lose
weight?Yes
2. Do MDPP beneficiaries enjoy improved health outcomes?It is too early and there are not a sufficient number of participants to answer this question
3. Does MDPP participation reduce Medicare expenditures?It is too early and there are not a sufficient number of participants to answer this question

Evaluation of the Medicare Diabetes Prevention Program Annual Report
2
Medicare FFS and MA beneficiaries are eligible to receive MDPP services if they are overweight or obese, have prediabetes documented by a clinical laboratory test, have not been previously diagnosed with diabetes or end-stage renal disease, and have not previously received MDPP services.
To participate as an MDPP supplier, organizations must (1) have preliminary or full recognition from the Centers for Disease Control and Prevention’s (CDC’s) Diabetes Prevention Recognition Program (DPRP) and (2) enroll in Medicare. Suppliers must meet a series of other provisions to prevent fraud and abuse. Reimbursement of suppliers is based on performance, as measured by the number of sessions attended and amount of weight lost by beneficiaries. In 2020, a supplier may receive up to $702 per beneficiary over 2 years if all performance targets (weight loss and attendance) are met.
The key beneficiary-level data sources for the evaluation are the
• Supplier Crosswalk, which identifies MDPP beneficiaries;
• DPRP data, which provide information on MDPP beneficiary demographics, attendance, weight loss, and physical activity; and
• Chronic Conditions Data Warehouse (CCW) data, which provide information on Medicare FFS beneficiary enrollment, claims, utilization, and expenditures for program participants.
The data sources have different reporting schedules, so information on an individual beneficiary may initially be present in only one or two of the data sources. As a result, we cannot always provide complete, integrated information for a beneficiary across all data sources.
The key supplier data source is the Supplier Enrollment Summary, which contains information on the name and service locations of suppliers enrolled in the program. To understand how suppliers have implemented the MDPP, we also interviewed 10 participating suppliers.
E.2 Supplier Enrollment and Access
The MDPP began in April 2018 with eight enrolled MDPP suppliers. The number of suppliers has gradually increased to 196 suppliers providing services in 762 unique locations (as of March 2, 2020). Increasing supplier enrollment continues to be a priority for the program. MDPP suppliers include health systems, health plans, health departments, YMCAs, foundations, and other health care or community organizations.
Because beneficiaries must attend 16 in-person class sessions during the core MDPP curriculum, beneficiaries who live closer to an MDPP supplier may find it easier to access the program. As of December 31, 2019, most MDPP beneficiaries lived in the same county as an MDPP supplier (89%) or within 25 miles of a supplier (96%). However, 57% of all Medicare beneficiaries live more than 25 miles away from the nearest MDPP, so increasing access to suppliers remains a priority of the program. As might be expected, access is better in urban areas

Evaluation of the Medicare Diabetes Prevention Program Annual Report
3
than in rural areas, but as of March 2, 2020, even some large cities and seven states do not have MDPP suppliers.
Key numbers related to suppliers:
196 MDPP suppliers762 unique MDPP supplier locations96% of MDPP beneficiaries live within 25 miles on an MDPP supplier57% of all Medicare beneficiaries live more than 25 miles from an MDPP supplier
E.3 Beneficiary Participation, Weight Loss, and Physical Activity in the MDPP
Beneficiary participation in the MDPP has grown gradually as the number of suppliers has increased. Between April 2018 and December 31, 2019, 2,248 Medicare beneficiaries participated in the MDPP, including 1,095 FFS beneficiaries and 1,153 MA beneficiaries.
Of the 1,419 MDPP beneficiaries for whom we have detailed demographic, session attendance, weight loss, and physical activity data, approximately 67% fall between the ages of 65 and 74, approximately 75% are white, and 74% are female. Primary care providers, specialists, or other health care professionals are the main referral sources for the program (44% of all beneficiaries), which is consistent with reports from the MDPP suppliers we interviewed.
On average, the 1,419 beneficiaries attended 16 sessions, and the median length of enrollment was approximately 6 months. This average includes beneficiaries who may be partway through the program. MDPP beneficiaries had an average starting weight of 205 lbs. and lost an average of 5.1% of their body weight. Overall, 48.9% of the 1,419 beneficiaries met the 5% weight-loss goal for the program, and 22.3% of beneficiaries met the 9% weight-loss goal. After the program begins to emphasize physical activity (session 5), the percentage of beneficiaries meeting the 150-minute goal for physical activity ranged from 65% to 75%.
The observed weight loss and physical activity for MDPP participants is comparable to or slightly more favorable than results for persons aged 65 or older in previous diabetes prevention programs.
Key numbers related to beneficiaries served:
2,248 FFS and MA beneficiaries served by MDPP16 sessions attended, on average5.1% average weight loss among those with two or more weigh-ins48.9% of beneficiaries meet the 5% weight-loss goal

Evaluation of the Medicare Diabetes Prevention Program Annual Report
4
E.4 MDPP Services Billed to Medicare and Baseline Medicare Spending and Use among MDPP Beneficiaries
The CCW contains enrollment and claims data for MDPP FFS beneficiaries (but not for MDPP MA beneficiaries). As of December 31, 2019, CMS has paid 37 MDPP suppliers for delivering MDPP services to 623 FFS beneficiaries. Of the 1,720 paid claims, 69% were for core session attendance, 13% were for achieving 5% or 9% weight-loss goals, and the remainder were for maintenance session attendance (about half of the maintenance sessions had sustained weight
loss of at least 5%, earning higher reimbursement). To date, according to claims, 25% of beneficiaries have achieved the 5% weight-loss goal and 12% of beneficiaries have achieved the 9% weight-loss goal. The percentages of beneficiaries achieving the weight-loss goals should rise as beneficiaries who are partway through the MDPP curriculum attend more sessions and have more time to lose weight.
Medicare FFS payments totaled $101,989 for MDPP services from April 1, 2018, through December 31, 2019. Because suppliers may submit claims up to 12 months after providing MDPP services, these totals could increase as more claims are submitted and processed.
Baseline estimates of total Medicare expenditures, inpatient admissions, and emergency department visits indicate that MDPP FFS beneficiaries have lower costs and use less inpatient care prior to enrollment than the average Medicare beneficiary. Later in the evaluation, we will account for these findings as we select a comparison group of non-participating Medicare beneficiaries with characteristics similar to the MDPP beneficiaries.
Key numbers from claims:
623 unique FFS beneficiaries with a reimbursable MDPP claim1,720 FFS MDPP paid claims$101,989 in total FFS MDPP payments$545 in average monthly Medicare FFS spending for MDPP beneficiaries in the year
before enrollment
E.5 Next Steps in the Evaluation
We will continue to receive quarterly information about beneficiary enrollment and participation in the MDPP from suppliers throughout the evaluation. We expect the number of MDPP beneficiaries to increase as more MDPP suppliers will have served beneficiaries for at least 6 months. As enrollment increases, we will compare utilization, Medicare expenditures, and health outcomes for MDPP participants with those of a comparison group that has similar characteristics.
This report is based on data through December 31, 2019. Therefore, any effects of the coronavirus disease 2019 (COVID-19) pandemic on the MDPP are not reflected in the data

Evaluation of the Medicare Diabetes Prevention Program Annual Report
5
included in this report. Because of the pandemic, in March 2020, CMS issued regulations for the MDPP to protect beneficiaries and suppliers during the pandemic. Under these regulations, suppliers are allowed to conduct unlimited virtual sessions with MDPP participants through distance learning or online classes. Virtual sessions were previously allowed only in limited numbers to make up missed sessions. Suppliers can also pause classes during the emergency and restart classes once the emergency regulations are lifted. Beneficiaries are allowed to restart the program at its first session (previously beneficiaries could only start the program once in their lifetime). We will examine the unique experience of the pandemic on program participation and outcomes in subsequent reports.
E.6 Summary
The MDPP has started slowly, with the number of MDPP suppliers and, consequently, the number of beneficiaries served by those suppliers increasing gradually since the program began. Both the DPRP data and CCW claims indicate that a significant share of MDPP beneficiaries are meeting weight-loss goals, suggesting that the program is accomplishing this objective. At this point in the evaluation, it is too early and there are not a sufficient number of participants to address key evaluation research questions about Medicare expenditure and health outcomes.
The first annual report provides descriptive information about the progress of the MDPP, including the increase in suppliers over time; information about the number of FFS and MA beneficiaries served by the program; data on MDPP beneficiary demographics, session attendance, weight loss, and physical activity; and information about spending and utilization by MDPP FFS beneficiaries prior to MDPP enrollment (Table ES-1). Increasing supplier and beneficiary enrollment will be key priorities for the MDPP going forward. As beneficiary enrollment increases, more data for the evaluation will accumulate, and with more time and data, more beneficiaries will be linked across data sources. The additional data and linkage will allow us to conduct more-rigorous analyses and answer the key research questions as the evaluation progresses.
Table ES-1. Key MDPP outcomes to date
Variable Outcome Data source Data through
Suppliers and Access
MDPP suppliers 196 Supplier Enrollment Summary 3/2/20
Unique MDPP supplier locations 762 Supplier Enrollment Summary 3/2/20
MDPP beneficiaries living within 25 miles of an MDPP supplier 96% Supplier Crosswalk;
CCW 12/31/19
(continued)

Evaluation of the Medicare Diabetes Prevention Program Annual Report
6
Table ES-1 (continued) Key MDPP outcomes to date
Variable Outcome Data source Data through
Percentage of all Medicare beneficiaries living more than 25 miles from an MDPP supplier
57% CCW 12/31/19
BeneficiariesMDPP beneficiaries (FFS and MA) 2,248 Supplier Crosswalk 12/31/19
Average number of sessions attended 16 DPRP 2/29/2020
Average weight loss (%) 5.1% DPRP 2/29/2020Claims
FFS MDPP paid claims 1,720 CCW 12/31/19FFS MDPP payments $101,989 CCW 12/31/19Average monthly payment for FFS MDPP beneficiaries in the year before enrollment
$545 CCW 12/31/19

Evaluation of the Medicare Diabetes Prevention Program Annual Report
7
SECTION 1. PURPOSE, BACKGROUND, AND KEY DATA SOURCES
The purpose of this annual report is to provide descriptive information from the Evaluation of the Medicare Diabetes Prevention Program (MDPP). The MDPP began serving Medicare beneficiaries on April 1, 2018, and RTI International was selected to evaluate the program in September 2018. The report provides descriptive information on
• suppliers enrolled in the MDPP,
• beneficiaries participating in the MDPP,
• attendance and weight loss for MDPP beneficiaries,
• claims for MDPP services, and
• baseline costs for MDPP beneficiaries.
Unless otherwise stated, the report is based on data from April 1, 2018, through December 31, 2019. Given this time period, any effects of the coronavirus disease 2019 (COVID-19) pandemic on the MDPP are not observed in the data provided in this report.
The evaluation will eventually determine whether MDPP participation results in weight loss, improved health outcomes, and lower expenditures. At the time of this report, evidence suggests that MDPP participation is associated with meaningful weight loss, but it is too early and there are not a sufficient number of participants to determine whether participation leads to improved health outcomes or lowers Medicare expenditures. The evaluation will address these questions in subsequent annual reports as beneficiary enrollment in the program increases. The larger sample size will allow us to perform regression analyses comparing outcomes for MDPP beneficiaries with outcomes for a comparison group of non-participants with similar characteristics.
In the remainder of this section, we provide a brief background on the program and the key research questions for its evaluation. We then describe the content and reporting schedules for the three major beneficiary-level data sources on MDPP beneficiaries. Understanding the differences in reporting schedules among these sources is necessary for interpreting the results that we present in this update; because the reporting schedules do not align, we cannot always provide complete, integrated data for MDPP suppliers and beneficiaries across all data sources.
Subsequent sections of the report follow a logical order.
· Supplier Enrollment and Access: Medicare beneficiaries can only receive MDPP services from suppliers that have met Centers for Medicare & Medicaid Services (CMS) requirements to enroll in the MDPP. Section 2 shows how the number of MDPP suppliers has increased since the program started and discusses the implications for beneficiary access.
· Beneficiary Participation, Weight Loss, and Physical Activity in the MDPP: Once MDPP suppliers are enrolled and accessible, beneficiaries can begin to participate by attending

Evaluation of the Medicare Diabetes Prevention Program Annual Report
8
MDPP sessions with a goal of losing weight and increasing physical activity. Section 3 presents our analyses related to overall beneficiary participation, session attendance, weight loss, and physical activity.
· MDPP Services Billed to Medicare and Baseline Medicare Spending and Use among MDPP Beneficiaries: MDPP suppliers’ performance-based reimbursement depends on the number of sessions attended and the weight loss achieved by beneficiaries. Section 4 presents information on MDPP claims and reimbursement and provides baseline information on overall Medicare expenditures for fee-for-service (FFS) MDPP beneficiaries.
· Next Steps: Section 5 describes next steps for the evaluation.
1.1 Background
1.1.1 The Medicare Diabetes Prevention Program
On April 1, 2018, Medicare began offering beneficiaries the MDPP, an evidence-based approach to delay or prevent type 2 diabetes, one of the most common, burdensome, and costly diseases affecting Medicare beneficiaries. The MDPP was the first preventive service model tested by the Center for Medicare & Medicaid Innovation (CMMI) that was approved as a Medicare-covered service for FFS and Medicare Advantage (MA) beneficiaries.
The MDPP is a lifestyle intervention targeting weight loss and exercise in persons who are at high risk of developing diabetes. Medicare FFS or MA beneficiaries are eligible to receive MDPP services if they are overweight or obese, have prediabetes documented by a clinical laboratory test, have not been previously diagnosed with diabetes or end-stage renal disease, and have not previously received MDPP services.
The MDPP defines and covers three types of services (Table 1):
• at least 16 core sessions in the first 6 months
• monthly core maintenance sessions in months 7–12
• monthly ongoing maintenance sessions in months 13–24.
To qualify for ongoing maintenance sessions in the second year of the program, beneficiaries must meet attendance (attend at least two of the three monthly classes) and weight-loss (≥ 5% weight loss) goals in months 10–12; they must continue to meet these goals on a quarterly basis to receive coverage of the program in subsequent quarters. The ongoing maintenance sessions in year 2 are a unique feature of the MDPP that are not included in other iterations of CDC’s National Diabetes Prevention Program (National DPP).

Evaluation of the Medicare Diabetes Prevention Program Annual Report
9
Table 1MDPP program structure
The program includes at least 16 sessions in the first 6 months, followed by monthly sessions thereafter.
Time Since Beneficiary Enrollment
Session Name Frequency Number of Sessions
Year 1 Months 1–6 Core sessions No more than once per week
At least 16
Months 7–12 Core maintenance sessions
Monthly At least 6
Year 2 Months 13–24 Ongoing maintenance sessions*
Monthly At least 12
*Beneficiaries must meet attendance and weight-loss goals to be eligible to continue to attend ongoing maintenance sessions in Year 2.
The MDPP core sessions focus on changing eating habits and encouraging physical activity. The core maintenance and ongoing maintenance sessions provide additional strategies for maintaining weight loss. Sessions must be delivered in person, although limited virtual (e.g., online) makeup sessions are allowed. The sessions are led by lifestyle coaches who, in some cases, provide supplementary support to participants between sessions via email, text, or telephone. An important component of the in-person sessions is a weigh-in, allowing the participant and supplier to track weight loss over time. The curriculum begins to emphasize tracking physical activity around session 5. Participants self-report minutes of physical activity to the supplier.
To participate as an MDPP supplier, organizations must first have preliminary or full recognition from the Centers for Disease Control and Prevention’s (CDC’s) Diabetes Prevention Recognition Program (DPRP). To achieve preliminary recognition, an organization must have provided diabetes prevention services for at least 12 months and have at least 60% of participants attend at least nine sessions in months 1–6 and at least three sessions in months 7–12. For full recognition, the supplier’s participants must have an average weight loss of 5% and meet standards for reporting physical activity. Thus, the suppliers who enroll in the MDPP will already have experience providing diabetes prevention services and will have demonstrated that their participants attend classes and achieve weight loss.
In addition to DPRP recognition, suppliers must enroll in Medicare, and meet a series of other provisions designed to prevent fraud and abuse before they become an MDPP supplier. Not all eligible DPRP-recognized suppliers enroll in the MDPP (see Section 2).
Medicare FFS reimbursement of suppliers is based on performance, as measured by the number of sessions attended and amount of weight lost by participants. A supplier may receive up to $702 per beneficiary if all performance targets (attendance and weight loss) are met. The reimbursement schedule and performance standards are described in greater detail in Section 4.

Evaluation of the Medicare Diabetes Prevention Program Annual Report
10
The MDPP is based in part on the landmark Diabetes Prevention Program clinical trial (hereafter called the original DPP to distinguish it from the MDPP and other diabetes prevention programs), which found that type 2 diabetes could be prevented (or at least delayed) by a lifestyle intervention targeting weight loss and exercise in people who are overweight or obese and at high risk of developing diabetes. The trial was stopped early, after 3-year follow-up data showed that the lifestyle intervention reduced the risk of diabetes onset by 58% relative to a placebo intervention (Knowler et al., 2002). The MDPP is also based on evidence from the evaluation of the YMCA of the USA Diabetes Prevention Program (Y-USA DPP), which tested whether participants in the program had lower Medicare expenditures and utilization than a comparison group selected through propensity score matching. The evaluation found that the Y-USA DPP significantly reduced expenditures and utilization (Alva, Hoerger, Jeyaraman, Amico, & Rojas Smith, 2017; Rojas Smith et al., 2017) On average, participants lost about 4.6% of their baseline body weight. The evaluation did not measure whether the program reduced diabetes onset; however, weight loss was the major determinant of risk reduction in the original DPP (Hamman et al., 2006).
The MDPP is closely affiliated with—but distinct from—the National Diabetes Prevention Program (National DPP). The National DPP was established in 2010 under CDC leadership to facilitate a partnership of public and private organizations working to prevent or delay type 2 diabetes. The National DPP raises awareness of prediabetes and diabetes prevention among patients and health care providers and encourages private- and public-sector employers and insurers to support diabetes prevention. CDC has developed curricula for the National DPP, sets DPRP standards, and collects participant data from DPRP-recognized suppliers. These roles help set the standards for the MDPP. For the evaluation of the MDPP, CDC provides an extract of the DPRP data that contains key information on participants covered by the MDPP.
1.1.2 Research Questions
The objective of CMS evaluations is to determine whether the model being tested is successful. For the MDPP model, that means answering three main research questions:
Does MDPP participation result in weight reduction?
Does MDPP participation lead to improved health outcomes?
Does MDPP participation lead to lower health care expenditures for Medicare FFS beneficiaries (both before and net of program payments)?
Adjunct questions further explore the relationship between participation and outcomes:
Does the percentage of MDPP beneficiaries achieving, and then maintaining, 5% weight loss differ by number of sessions attended, supplier recognition status, or type of supplier?
Is the MDPP more effective among certain demographic groups?
Does MDPP participation lead to medical utilization changes?

Evaluation of the Medicare Diabetes Prevention Program Annual Report
11
Were any changes in medical utilization or costs related to reported weight loss, completion of the MDPP, or length of time in the program?
Are any markers of progression to diabetes present? Does the program appear to prevent or delay the incidence or onset of diabetes?
1.2 Logic Model of the MDPP
Figure 1 presents the logic model for the MDPP, which also provides a useful framework for evaluating the MDPP and answering the main evaluation research questions. Development of the logic model begins with the problem that the MDPP is designed to address: many Medicare beneficiaries have prediabetes and are at risk of developing diabetes, a serious and costly health condition. The goal of the MDPP is to prevent type 2 diabetes in Medicare beneficiaries with prediabetes, thereby improving their health and reducing Medicare expenditures. Given this problem statement and goal, the logic model relates how program inputs and resources support program activities that lead to measurable program outputs that in turn lead to short-term and long-term outcomes that achieve the program’s goals. Below, we describe the key components of the MDPP logic model and discuss implications for the evaluation.
Inputs/Resources: The MDPP builds on inputs and resources that are provided by CDC, CMS, suppliers, health care providers, and beneficiaries. These inputs and resources include the MDPP curriculum developed by CDC, the DPRP administered by CDC that recognizes suppliers, organizations (and personnel) who are interested in becoming MDPP suppliers (and coaches), Medicare beneficiaries with prediabetes who are interested in participating in the program, beneficiary referrals to the program from health care providers and other sources, and supplier enrollment and reimbursement systems administered by CMS. The evaluation does not explicitly examine these inputs and resources, but they provide the foundation for the program.
Activities: A key program activity is enrolling suppliers in the MDPP, which requires that suppliers first have preliminary or full DPRP recognition with CDC and then enroll as a Medicare provider. Once enrolled, suppliers provide in-person MDPP services to beneficiaries, including at least 16 core sessions in months 1–6, six monthly core maintenance sessions in months 7–12, and monthly ongoing maintenance sessions in months 13–24. Because beneficiaries are expected to attend many in-person sessions, beneficiaries must have access to nearby suppliers. Thus, for a large number of beneficiaries to participate in the program there needs to be a sufficient number of MDPP suppliers. The evaluation will monitor the number of suppliers and beneficiary access to see whether these necessary conditions are met. Beneficiary enrollment is also an obvious necessary requirement for the program to be successful: if few beneficiaries enroll, the overall effect of the program on diabetes incidence and Medicare expenditures will be limited. Thus, the evaluation will measure beneficiary enrollment.
Outputs: The direct outputs measured by the program and considered by the evaluation include session attendance, weight measured during in-person sessions, physical activity reported by beneficiaries, and Medicare claims for attendance and weight loss.

Evaluation of the Medicare Diabetes Prevention Program Annual Report
12
Short-Term Outcomes: Attending MDPP sessions is expected to lead in the short-term to behavioral changes—improved nutrition and increased physical activity—that in turn lead to beneficiary weight loss. In the evaluation, we observe weight loss and self-reported physical activity; although we do not observe nutrition, its impact will contribute to participants’ weight loss. We will be able to measure and evaluate these short-term outcomes within a year after a beneficiary enrolls in the MDPP. Weight loss is likely to be the most important short-term outcome variable for the evaluation; in the original DPP clinical trial, weight loss was the most important factor associated with reductions in the probability of developing diabetes (Hamman et al., 2006). Therefore, examining whether MDPP participants lose weight is the first main research question for the evaluation.
Longer-Term: Longer-term outcomes, which may not be observable until at least 1 year after an individual begins participation in the program, include cases of diabetes prevented, and lower Medicare utilization and expenditures because diabetes care (provider visits, diabetes medications, and treatments for diabetes complications) is averted. These potential longer-term outcomes form the basis for the second and third main evaluation research questions: Does MDPP participation lead to improved health outcomes (fewer cases of diabetes)? Does MDPP participation lead to lower health care expenditures?
Each step in the logic model helps determine whether the next step will be successful and whether the MDPP will ultimately achieve its goals. For example, if few suppliers are willing to provide MDPP services (activities not conducted) or if eligible beneficiaries choose not to enroll (activity not achieved), the program will have limited reach and impact on outcomes. For the evaluation, we monitor supplier enrollment and beneficiary participation to see whether these necessary conditions for program success are met. Similarly, we are measuring outcomes at different time horizons. Although we may not immediately be able to observe longer-term effects, the short-term outcomes will provide important clues about the likely longer-term outcomes. If the short-term outcomes are positive (e.g., beneficiaries lose weight), the long-term outcomes are more likely to be achieved. On the other hand, if we do not observe improvements in the short-term outcomes, improvements in the longer-term outcomes are less likely.

Evaluation of the Medicare D
iabetes Prevention Program A
nnual Report
13
Figure 1. Logic model for the Medicare Diabetes Prevention Program
The logic model illustrates how the MDPP is expected to reach its goals; the evaluation will assess how the program implements its activities and whether it produces its expected outputs and outcomes.
• DPP curriculum (CDC) • CDC Diabetes
Prevention Recognition Program (DPRP)
• Organizations (and individuals) interested in becoming MDPP suppliers (and coaches)
• Medicare beneficiaries with prediabetes
• Referrals (health care providers, beneficiaries)
• Enrollment and reimbursement systems (CMS)
• Suppliers provide in-person MDPP services - Core sessions (at least
16 sessions in months 1–6)
- Core maintenance sessions (monthly sessions in month 7–12)
- Ongoing maintenance sessions (monthly sessions in months 13–24)
• Session attendance • Beneficiary weigh-ins • Self-reported physical
activity • Medicare claims for
beneficiary attendance and weight loss
Longer-Term • Reduced incidence
or delayed onset oftype 2 diabetes
• Lower health care utilization
• Lower Medicare expenditures
Short-Term • Improved nutrition • More exercise • Weight loss
Outcomes Activities Outputs
Suppliers:
• Receive preliminary or full recognition from CDC
• Register with Medicare • Recruit and enroll Medicare
beneficiaries with prediabetes
Inputs/Resources

Evaluation of the Medicare Diabetes Prevention Program Annual Report
14
1.3 Key Data Sources on MDPP Beneficiaries
This section describes the three key data sources for beneficiary-level data on MDPP beneficiaries:
• Supplier Crosswalk data submitted by suppliers to RTI
• DPRP data from CDC
• Chronic Conditions Data Warehouse (CCW) claims and enrollment information
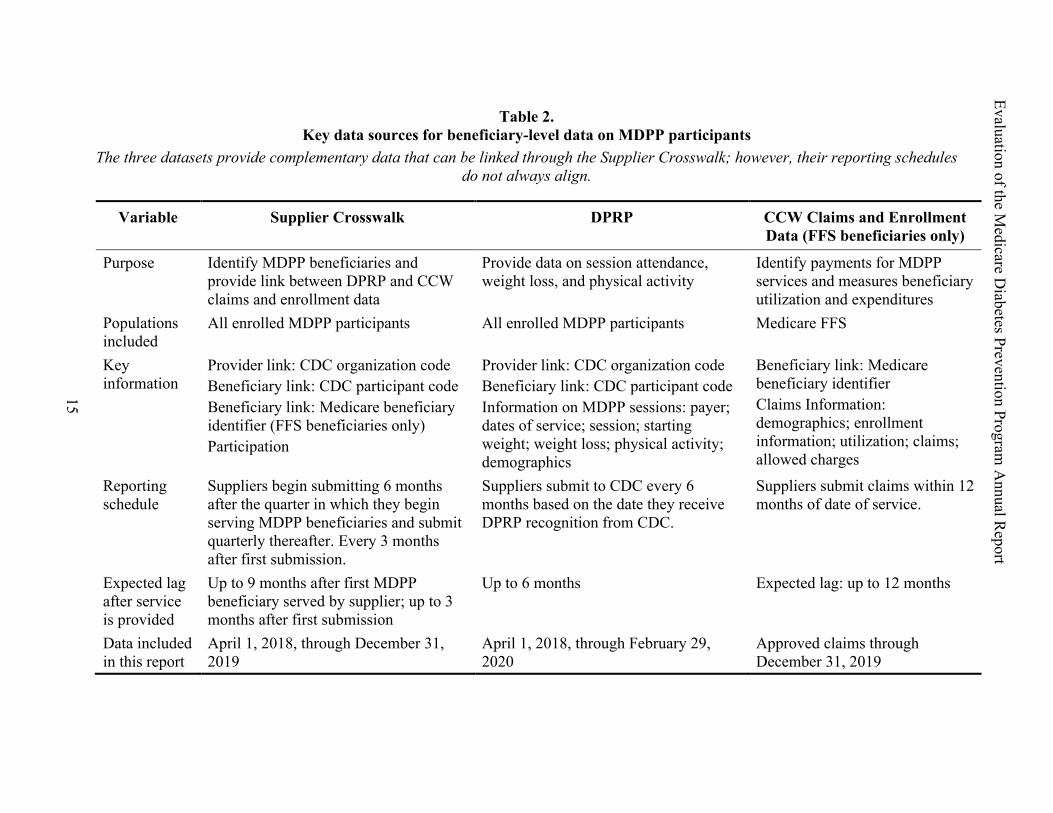
The data sources provide different information and have differing reporting schedules. Because of the differing reporting periods, information on a beneficiary in one data source cannot always or immediately be linked with data on the same beneficiary from the other data sources. Understanding this limitation is important for interpreting the beneficiary-level results we present in this report. Sections 1.3.1–1.3.3 describe each of the datasets; Table 2 summarizes the contents of each dataset. Section 1.3.4 discusses the implications of differences in reporting schedules among the datasets.
1.3.1 MDPP Enrollee Identification: The Supplier Crosswalk
The Supplier Crosswalk contains the information used to identify which beneficiaries are enrolled in MDPP. It plays a crucial role in linking the information on session attendance and weight loss from DPRP data and information about MDPP payments and other health care utilization from the CCW Medicare FFS claims data. The Supplier Crosswalk also provides our best estimates of the number of Medicare beneficiaries who have participated in the MDPP to date.
For details on linkage between datasets, see Appendix A.
The Supplier Crosswalk links the DPRP and CCW claims data and provides the best estimate of the total number of MDPP beneficiaries.
Evaluation of the Medicare D
iabetes Prevention ProgramA
nnual Report
15
Table 2. Key data sources for beneficiary-level data on MDPP participants
The three datasets provide complementary data that can be linked through the Supplier Crosswalk; however, their reporting schedules do not always align.
Variable Supplier Crosswalk DPRP CCW Claims and Enrollment Data (FFS beneficiaries only)
Purpose Identify MDPP beneficiaries and provide link between DPRP and CCW claims and enrollment data
Provide data on session attendance, weight loss, and physical activity
Identify payments for MDPP services and measures beneficiary utilization and expenditures
Populations included
All enrolled MDPP participants All enrolled MDPP participants Medicare FFS
Key information
Provider link: CDC organization codeBeneficiary link: CDC participant codeBeneficiary link: Medicare beneficiary identifier (FFS beneficiaries only)Participation
Provider link: CDC organization codeBeneficiary link: CDC participant codeInformation on MDPP sessions: payer; dates of service; session; starting weight; weight loss; physical activity; demographics
Beneficiary link: Medicare beneficiary identifierClaims Information: demographics; enrollment information; utilization; claims; allowed charges
Reporting schedule
Suppliers begin submitting 6 months after the quarter in which they begin serving MDPP beneficiaries and submit quarterly thereafter. Every 3 months after first submission.
Suppliers submit to CDC every 6 months based on the date they receive DPRP recognition from CDC.
Suppliers submit claims within 12 months of date of service.
Expected lag after service is provided
Up to 9 months after first MDPP beneficiary served by supplier; up to 3 months after first submission
Up to 6 months Expected lag: up to 12 months
Data included in this report
April 1, 2018, through December 31, 2019
April 1, 2018, through February 29, 2020
Approved claims through December 31, 2019

Evaluation of the Medicare Diabetes Prevention Program Annual Report
16
Suppliers begin submitting the Supplier Crosswalk 6 months after the quarter in which they begin serving MDPP beneficiaries, so there is a lag before beneficiaries served by a newly enrolled MDPP supplier begin appearing in the Supplier Crosswalk. However, once a supplier begins reporting, they submit their Supplier Crosswalk every 3 months, which is more frequently than they submit their DPRP session level data to CDC. The Supplier Crosswalk may be more up to date than the CCW claims because suppliers have up to 12 months after the date of service to submit claims for processing and payment. Moreover, the CCW only includes claims for FFS beneficiaries, so the Supplier Crosswalk provides a more-complete picture of the total number of FFS and MA beneficiaries served by the MDPP. Therefore, this report uses the Supplier Crosswalk as the source for the number of MDPP beneficiaries served to date.
Although, the Supplier Crosswalk provides the best estimate of the total number of MDPP beneficiaries, it does not provide information on beneficiaries’ class attendance, dates of service, program outcomes, MDPP claims, health care utilization, or Medicare expenditures. Those variables come from either the DPRP or CCW data.
This report includes Supplier Crosswalk data from January 15, April 15, July 15, and October 15, 2019, and from January 15, 2020. We will collect data quarterly on these dates in subsequent years during the evaluation.
1.3.2 MDPP Program Information: The DPRP Data
Suppliers are required to submit detailed beneficiary information to CDC every 6 months. This information includes the supplier’s CDC organization code, CDC participant code, expected payer, date of service, session number, starting weight, weight loss from baseline, physical activity minutes, and beneficiary demographics.
Many suppliers recognized by the DPRP have not enrolled in the MDPP, and MDPP suppliers may serve both MDPP beneficiaries and participants covered by other payers. For purposes of the MDPP evaluation, CDC provides an extract from the DPRP database that only includes participants with Medicare listed as the payment source.
Session attendance, weight loss, and physical activity represent output and short-term outcomes of the MDPP. Although the CCW data provide some information on session attendance and limited weight-loss information for FFS beneficiaries, they provide less information than the DPRP data on weight loss and no information on physical activity. Additionally, the DPRP data provide the only information on attendance, weight loss, and physical activity for MA beneficiaries. Thus, the DPRP dataset provides key information to address the evaluation’s research questions.
This report includes DPRP data from April 1, 2018, through February 29, 2020. More than 97% of the sessions included in the DPRP occurred between April 1, 2018, and December 31, 2020.
DPRP data provide information on demographics, session attendance, weight loss, and physical activity for MDPP beneficiaries.

Evaluation of the Medicare Diabetes Prevention Program Annual Report
17
1.3.3 Claims and Enrollment Data: The CCW
The CCW contains demographic and enrollment data for each Medicare beneficiary and utilization, claims, and allowed charges for FFS beneficiaries for MDPP and other Medicare services. The CCW data for an FFS beneficiary can be linked to the Supplier Crosswalk, and the linked CCW–Supplier Crosswalk can then be linked to the DPRP data.
Importantly, the CCW data provide estimates of actual claims and payments for MDPP services provided to FFS beneficiaries, as well as demographic and enrollment characteristics to include as explanatory variables in analyses. Later in the evaluation, we will use CCW claims information to determine whether MDPP participation leads to lower health care expenditures for Medicare FFS beneficiaries (both before and net of direct MDPP payments). We will also use CCW claims data to examine whether MDPP participation prevents or delays the onset of diabetes.
This report includes claims in the CCW as of December 31, 2019.
1.3.4 Impact of Reporting Schedules
As previously described, the reporting schedules differ between data sources. Therefore, we cannot always or immediately link data for the same beneficiary across data sources. It is possible for a new MDPP beneficiary to appear in any one of the datasets before they appear in the other datasets. Appendix A provides examples that help illustrate this point.
The differences in reporting schedules among datasets have several implications for interpreting the results we present in this report. First, the number of MDPP beneficiaries included in analyses will vary depending on which data source provides the best information for the analysis. Thus, our estimate of the number of MDPP beneficiaries in Section 2 (2,248 beneficiaries) is based on Supplier Crosswalk data because new beneficiaries are most likely to appear in this data source first. Supplier Crosswalk data are submitted more frequently and with a shorter delay (quarterly, within 3 months except for a supplier’s first submission) than data from the DPRP and CCW.
Second, when we present estimates on session attendance, weight loss, and physical activity based on DPRP data, we only report results for beneficiaries included in the DPRP and in the Supplier Crosswalk. We do not report results for beneficiaries included in the DPRP but not in the Supplier Crosswalk. We adopted this approach because the Supplier Crosswalk reports only Medicare beneficiaries covered by MDPP. In contrast, suppliers submit DPRP data for Medicare and privately insured participants making it possible for payer status to be incorrectly entered. Therefore, the sample that will be used to understand weight-loss outcomes contains 1,419 MDPP beneficiaries (Figure 2). There are 829 MDPP beneficiaries in the Supplier Crosswalk who did not match to DPRP. However, they may be matched when we receive future DPRP data submissions.
CCW data provide Medicare utilization and expenditures information for FFS beneficiaries participating in the MDPP.

Evaluation of the Medicare Diabetes Prevention Program Annual Report
18
Third, the analyses based on FFS claims from the CCW include fewer beneficiaries. This is partly because claims are only available for FFS beneficiaries, and partly because not all MDPP FFS beneficiaries have had claims submitted and approved (recall that claims can be submitted up to 12 months after the service date). Figure 3 shows the overlap between the Supplier Crosswalk subsample of FFS beneficiaries and the CCW claims sample (which only includes FFS claims), based on data as of December 31, 2019. Many beneficiaries are in only one of the two datasets. Of the 1,095 beneficiaries identified as FFS in the Supplier Crosswalk, 1,081 (99%) matched to valid beneficiary IDs in the CCW enrollment data and 560 (52%) had MDPP claims in the CCW. On the other hand, 63 beneficiaries have MDPP claims in the CCW but are not yet in the Supplier Crosswalk.
Fourth, we expect that most beneficiaries will eventually be included in all data sources for which they are eligible. MDPP FFS beneficiaries should be included in all three sources within 12 months, and MDPP MA beneficiaries should be included in both the Supplier Crosswalk and the DPRP data within 9 months of the first session.
Figure 2. Overlap between the Supplier Crosswalk and DPRP datasets
Source: RTI analysis of Supplier Crosswalk, DPRP, and CCW datasets.

Evaluation of the Medicare Diabetes Prevention Program Annual Report
19
Figure 3. Overlap between the Supplier Crosswalk FFS subsample and the CCW claims dataset
Source: RTI analysis of Supplier Crosswalk, and CCW datasets.
Note: Supplier Crosswalk numbers only include FFS beneficiaries with an identifier that could be matched to Medicare enrollment data. An additional 14 FFS beneficiaries in the Supplier Crosswalk had identifiers that could not be matched to Medicare enrollment data.
1.4 Supplier Data Sources
The key data source for the number and location of MDPP suppliers is the Supplier Enrollment Summary, compiled by CMS. The Supplier Enrollment Summary combines data on MDPP suppliers enrolled in Medicare from the CMS Provider Enrollment, Chain, and Ownership System (PECOS) with information on DPRP suppliers from CMS. The data set includes Medicare supplier identifiers, CDC DPRP supplier identifiers, and locations for all MDPP suppliers. For more details on the Supplier Enrollment Summary, see Appendix B. To understand how suppliers have implemented MDPP, we also interviewed ten participating suppliers.

Evaluation of the Medicare Diabetes Prevention Program Annual Report
20
SECTION 2. SUPPLIER ENROLLMENT AND ACCESS
Because the MDPP is delivered through a series of in-person classes, beneficiaries may prefer to visit nearby MDPP suppliers that are convenient and require low travel costs. Therefore, the effectiveness of the MDPP will depend on beneficiaries’ ability to access the program locally or in a nearby community. As more MDPP supplier organizations are enrolled each month, additional Medicare beneficiaries are more likely to have a nearby supplier and thereby gain the opportunity to participate in the MDPP. In this section, we discuss the current number of Medicare-enrolled MDPP suppliers and how that has changed since the program’s launch. We also describe how MDPP suppliers have modified their operations to serve Medicare beneficiaries.
Key Findings:
Supplier enrollment has grown. ▪ As of March 2, 2020, 196 suppliers are enrolled in the MDPP,
offering services at 762 unique locations. ▪ The number of MDPP suppliers grew from 8 in April 2018 to 196 in
March 2020. Access to suppliers remains a challenge. ▪ Twenty-two percent of MDPP-eligible suppliers (those with
preliminary or full recognition from CDC’s DPRP) have enrolled as MDPP suppliers.
▪ Despite the growth in MDPP suppliers, as of March 2, 2020 some major metropolitan areas and seven states do not have any MDPP suppliers.
▪ Local access to MDPP suppliers is important: 89% of MDPP beneficiaries attended MDPP supplier locations within their home county, and 96% of participants lived within 25 miles of their supplier’s nearest location. Nationwide, only 43% of Medicare beneficiaries live within 25 miles of the nearest suppliers.
Suppliers integrated MDPP into their established processes. ▪ MDPP suppliers did not make major changes to their curriculum
after enrolling in the program, but they sometimes tailor their examples to be more relevant for MDPP beneficiaries.
▪ MDPP suppliers generally integrate Medicare beneficiaries into combined classes with non-Medicare participants.

Evaluation of the Medicare Diabetes Prevention Program Annual Report
21
In this section, we distinguish between MDPP supplier organizations and unique supplier locations. Examples of MDPP supplier organizations include health systems, health plans, health departments, YMCAs, foundations, and other health care or community organizations. Supplier organizations can provide MDPP services at more than one location, and these locations are listed in the online MDPP Supplier Map (https://innovation.cms.gov/initiatives/medicare-diabetes-prevention-program/mdpp-map.html) that Medicare beneficiaries can use to locate nearby MDPP suppliers. Details on supplier data sources and methods are provided in Appendix B.
2.1 Currently Enrolled MDPP Suppliers
As of March 2, 2020, the Supplier Enrollment Summary indicated that there are 196 approved MDPP supplier organizations with 762 unique supplier locations across the United States. Although all of the suppliers have previously provided diabetes prevention services as part of the National DPP, some of the suppliers have not had previous experience submitting claims for Medicare beneficiaries.
Supplier locations are mapped in Figure 4. Many MDPP supplier locations are clustered around large urban areas (e.g., Boston, Denver, Detroit, Seattle, New York City), with far fewer supplier locations in rural areas. Seven states (Alabama, Nevada, New Mexico, Rhode Island, South Dakota, Vermont, and Wyoming) have no MDPP supplier locations. Even some major metropolitan areas such as Atlanta and Dallas have no MDPP locations. The large number of supplier locations in Michigan is attributable to one organization that offers the MDPP in 140 community locations.
196 suppliers are enrolled in the MDPP, offering services at 762 unique locations.

Evaluation of the Medicare Diabetes Prevention Program Annual Report
22
Figure 4. MDPP supplier locations across the United States (N = 762), as of March 2, 2020
Access to MDPP suppliers varies widely, with some metropolitan areas and seven states having no MDPP suppliers.
Source: Supplier Enrollment Summary, CMS, March 2, 2020
2.2 Increase in MDPP Suppliers Over Time
Despite the shortage of MDPP supplier locations in some urban areas and many rural areas, new locations are added each month, improving beneficiary access to the MDPP. Over the first 23 months of the program, an average of nine MDPP supplier organizations and 36 supplier locations were added each month. Figure 5 shows the number of organizations and locations enrolled each month according to the Supplier Enrollment Summary file as of March 2, 2020. The figure distinguishes between administrative and community locations, which are counted separately by CMS; however, the distinction is less important for beneficiaries because MDPP suppliers can provide services at either administrative or community locations (see Appendix B).
The average number of supplier locations added each month was heavily influenced by an outlier month. In August 2018, one MDPP supplier enrolled with one administrative location

Evaluation of the Medicare Diabetes Prevention Program Annual Report
23
and 140 community locations. Boosted by these 140 additional community locations, the community locations added in August 2018 spiked to 175 new locations. Figure 5 shows this sudden increase in access on the gray line, which represents community locations. The figure shows a steady increase in supplier organizations with a couple of lulls (January through March 2019 and December 2019 through February 2020). The lulls may be due to administrative delays in reporting or seasonal factors.
Figure 5. Number of MDPP supplier organizations and locations over time
The number of suppliers and locations has increased since the start of the program in April 2018.
0
50
100
150
200
250
300
350
400
450
500
Apr-
18
May
-18
Jun-
18
Jul-1
8
Aug-
18
Sep-
18
Oct
-18
Nov
-18
Dec-
18
Jan-
19
Feb-
19
Mar
-19
Apr-
19
May
-19
Jun-
19
Jul-1
9
Aug-
19
Sep-
19
Oct
-19
Nov
-19
Dec-
19
Jan-
20
Feb-
20
Num
ber
Month-Year
Organizations Administrative Locations Community Locations
Source: Supplier Enrollment Summary, CMS, March 2, 2020
2.3 Supplier Reach
To be eligible to enroll as an MDPP supplier, a supplier must first receive preliminary or full recognition from CDC’s DPRP by providing diabetes prevention services for at least 1 year and by meeting performance standards. As of March 2, 2020, 22% of eligible DPRP suppliers have enrolled in the MDPP. The reach of a health care program can be measured by the percentage of eligible suppliers or beneficiaries who participate in the program (Glasgow, Vogt, & Boles, 1999). Table 3 shows the reach of the MDPP with respect to eligible suppliers. Reach has increased from 3% in the first month of the MDPP to 17% after 1 year and to 22% by March 2, 2020, even as the number of eligible DPRP suppliers doubled during that time.

Evaluation of the Medicare Diabetes Prevention Program Annual Report
24
Table 3. Supplier reach
22% of eligible DPRP suppliers have enrolled in the MDPP.
Month
Suppliers with Preliminary or Full DPRP Recognition
MDPP-Enrolled Suppliers Percentage Enrolled
April 2018 431 8 3%April 2019 686 119 17%March 2020 893 196 22%
Source: Supplier Enrollment Summary, CMS, March 2, 2020
2.4 Beneficiary Access
The distance between a Medicare beneficiary and the nearest MDPP supplier is an important factor in determining whether beneficiaries will access the program. Using county and zip code information for supplier locations and FFS MDPP beneficiaries who
were included in the Supplier Crosswalk, we estimated that 89% of current MDPP participants receive services at MDPP suppliers in their county of residence, and 96% of participants travel less than 25 miles to receive services (see Beneficiary Access to Suppliers in Appendix B). Access to local MDPP suppliers provides convenience and reduces travel costs for beneficiaries, who are expected to attend 16 in-person core MDPP sessions during the first 6 months and up to18 monthly in-person maintenance sessions thereafter.
The finding that most MDPP participants visit local suppliers has implications for expanding access to the MDPP. Although the number of supplier locations has steadily increased since the program began, with 762 MDPP supplier locations as of March 2, 2020, 57% of all Medicare beneficiaries still live more than 25 miles away from the nearest MDPP location. The map in Figure 1 shows that Medicare beneficiaries in large areas of the country do not have nearby MDPP locations. Travel distance is not the only factor affecting beneficiary access; access may also be limited in large urban areas with only one or two MDPP suppliers. However, beneficiaries in areas with no nearby suppliers clearly lack access.
2.5 Supplier Implementation of the MDPP
As previously noted, to be eligible to enroll as an MDPP supplier, a supplier must first receive preliminary or full recognition from CDC’s DPRP. This recognition requires at least 12 months’ experience providing diabetes prevention services and achieving various performance
There are major metropolitan areas and seven states that do not have any MDPP suppliers
Local access to MDPP suppliers is important: 96% of MDPP beneficiaries attended MDPP supplier locations within 25 miles of their residence. However, 57% of Medicare beneficiaries live more than 25 miles from the nearest supplier location.

Evaluation of the Medicare Diabetes Prevention Program Annual Report
25
standards. Thus, all MDPP suppliers had experience providing diabetes prevention services prior to MDPP enrollment. We interviewed a sample of 10 MDPP suppliers to examine whether or how MDPP suppliers modified their programs for the MDPP.
Of the MDPP suppliers interviewed, most did not hold separate classes for MDPP beneficiaries; instead, they integrated Medicare and non-Medicare beneficiaries into combined classes. Some suppliers thought that mixed classes provided benefits to both the Medicare and non-Medicare participants. One lifestyle coach noted, “Part of it is you get some young whippersnapper [saying] "I don't have time to exercise" [whereas a 70-year-old woman] is out there walking away and it … [makes them think], "Oh, maybe I better get started doing this." It really gets rid of excuses across the board of age or ability. … [People] see each other doing it and inspire each other to do it. And we also have the population that doesn't cook and the population that cooks everything. … They help each other a lot in that way, too.”
The suppliers did not make major changes to their National DPP curriculum to accommodate MDPP beneficiaries, but they did sometimes tailor curriculum examples to address the physical abilities and local context of MDPP beneficiaries. As one program administrator said, “Physical activity … looks different when you're older. … [You] need more chair exercises or balance classes.” Suppliers also attempted to make the program accessible to MDPP beneficiaries by setting class times and selecting locations to best fulfill Medicare beneficiary needs. Lifestyle coaches communicated with beneficiaries between sessions to keep them engaged in the overall goals of the program and provided flexible one-on-one make-up sessions to ensure beneficiaries stayed engaged and did not fall behind. Most suppliers provided support tools (e.g., resistance bands, kitchen scales, physical activity planners) to all participants rather than using cash or gift card incentives tied to an individual participant’s weight loss.
Suppliers noted that becoming an MDPP supplier significantly increased their administrative burden. They reported that the Medicare program requires additional effort to confirm eligibility of beneficiaries, submit Supplier Crosswalk data quarterly, and set up billing and coding systems. For example, some suppliers kept paper records for beneficiaries before becoming an MDPP supplier and needed to transition to an electronic administrative system to be able to bill Medicare.
Most of the MDPP suppliers interviewed expected retention to be a challenge in the Year 2 ongoing maintenance sessions for beneficiaries who achieve 5% weight loss in Year 1 of the program. The Year 2 ongoing maintenance sessions are a unique feature of the MDPP that is not offered in the National DPP; beneficiaries must meet attendance and weight loss goals during the core maintenance sessions in months 7–12 of Year 1 to be eligible for the ongoing maintenance sessions in Year 2. Suppliers reported that keeping beneficiaries in the program past the 6-month mark was often difficult. Suppliers were concerned that, given the beneficiary requirements for Year 2 participation, they may not have enough beneficiaries to maintain a separate ongoing maintenance class. Therefore, suppliers reported that they had made additional efforts to ensure that beneficiaries met the attendance and 5% weight-loss requirements to be eligible to receive Year 2 services.

Evaluation of the Medicare Diabetes Prevention Program Annual Report
26
2.6 Conclusions
Access to the MDPP is a prerequisite for the program’s effectiveness. Access hinges on two key elements: (1) the number of MDPP supplier locations and (2) the geographic distribution of these locations. Although the number of MDPP supplier locations has steadily increased since the program began, MDPP must continue to expand beneficiary access to its services by enrolling new supplier organizations in both rural and urban areas. For access to increase, special attention should be paid to rural areas, many of which have low or no access to MDPP locations currently.
As of March 2, 2020, the MDPP has enrolled 22% of the eligible DPRP-recognized suppliers of diabetes prevention services. Increasing supplier enrollment remains a priority for the MDPP model team.
Most MDPP suppliers do not appear to have drastically changed their operations after enrolling in the MDPP. They did not make major changes to their curriculum, although they did change some examples in the curriculum to be more relevant to MDPP beneficiaries. MDPP suppliers often include MDPP beneficiaries and non-Medicare participants in the same classes. MDPP suppliers also report that MDPP enrollment led to higher administrative costs related to determining beneficiary eligibility, submitting Supplier Crosswalks, and filing claims with Medicare.

Evaluation of the Medicare Diabetes Prevention Program Annual Report
27
SECTION 3. BENEFICIARY PARTICIPATION, WEIGHT LOSS, AND PHYSICAL ACTIVITY IN
THE MDPP
This section describes the demographics of MDPP participants, session attendance, average weight loss, and physical activity outcomes. Analysis of Supplier Crosswalk data and DPRP data from CDC indicate how beneficiaries are progressing throughout the program and provide key insights on beneficiary weight loss.
Key Findings
▪ From April 2018 through December 2019, 2,248 Medicare beneficiaries (1,095 FFS and 1,153 MA) participated in the MDPP.
▪ On average, beneficiaries attended 15.7 sessions and were enrolled approximately 6 months.
▪ Beneficiaries lost an average of 5.1% of their starting weight.▪ Overall, 48.9% of beneficiaries have met the 5% weight-loss goal.▪ After the curriculum emphasized physical activity tracking (session 5),
the percentage of beneficiaries self-reporting having met the 150-minute goal ranged from 65% to 75%.
3.1 Number of Beneficiaries
Suppliers reported 1,095 unique FFS beneficiaries and 1,153 unique MA beneficiaries for 2,248 beneficiaries served by MDPP through the end of December 2019. The number of beneficiaries steadily increased from the 97 FFS beneficiaries and 52 MA beneficiaries (149 total) reported through December 2018 in the January 2019 Supplier Crosswalk. For more details on the Supplier Crosswalk and the growth in the number of MDPP beneficiaries over time, see Appendix C and Appendix Tables C-1 through C-3.
3.2 Beneficiary Demographics
The supplier crosswalk is matched with DPRP data to construct the sample of MDPP beneficiaries used in the remaining analyses in this section. Of the 2,248 beneficiaries served by MDPP, 1,419 were matched to DPRP data. Of the 1,419 beneficiaries with DPRP data, 846 were Medicare FFS beneficiaries and
573 were MA beneficiaries. Based on the DPRP data, approximately 74% of MDPP beneficiaries are women, 66% fall between the ages of 65 and 74, over 75% are white, and over 77% are non-Hispanic (Table 4). Slightly more than half of the beneficiaries have some college education (53%), and 5% are dually eligible for Medicare and Medicaid. Most beneficiaries are Medicare FFS beneficiaries (60%). In general, Medicare MA and FFS beneficiaries are similar; however, 79% of FFS beneficiaries, compared with 70% of MA beneficiaries, are white. In
Most MDPP beneficiaries are female, white, and 65 to 74 years old.

Evaluation of the Medicare Diabetes Prevention Program Annual Report
28
addition, MA beneficiaries are younger—12% are under 65 compared with 8% of FFS beneficiaries—and 11% of MA beneficiaries are dually eligible.
The high proportion of non-Hispanic white women in the MDPP mirrors participation in the National DPP, which includes participants at CDC-recognized suppliers covered by all payers (Ely et al., 2017). In the National DPP analysis, which includes all ages, 80% of beneficiaries were female, 24% were older than 65, 14% were Black, and 10% were Hispanic. Demographic data were not available, however, for the 65 and older cohort specifically.
Table 4. Demographic characteristics of MDPP beneficiaries
Most MDPP beneficiaries are female, white, and 65 to 74 years old.
Beneficiary characteristic Percentage of all beneficiaries (n = 1,419)
Percentage of FFS beneficiaries
(n = 846)
Percentage of MA beneficiaries
(n = 573)Gender
Female (%) 74.3 74.9 73.3Male (%) 25.7 25.1 26.5
Age group≤ 64 (%) 9.4 7.6 12.265–69 (%) 35.5 37.8 32.170–74 (%) 30.2 31.2 28.875–79 (%) 17.4 16.4 18.9≥ 80 (%) 7.4 7.0 8.0
RaceAmerican Indian (%) 0.4 0.1 0.7Asian (%) 2.1 2.4 1.8Black (%) 7.4 6.5 8.7Native Hawaiian or Pacific Islander (%)
0.4 0.6 0
White (%) 75.3 79.1 69.8Unknown (%) 14.6 11.5 19.2
EthnicityHispanic or Latino (%) 2.9 2.0 4.2Not Hispanic or Latino (%)
77.2 75.4 79.9
Not Reported (%) 19.9 22.6 15.9(continued)

Evaluation of the Medicare Diabetes Prevention Program Annual Report
29
Beneficiary characteristic Percentage of all beneficiaries (n = 1,419)
Percentage of FFS beneficiaries
(n = 846)
Percentage of MA beneficiaries
(n = 573)Education status
Some college (%) 53.5 56.2 49.6Less than college (%) 14.5 13.8 15.5Unknown (%) 32.0 30.0 34.9
Payer Dual eligible (%) 4.5 0.2 10.8Medicare (%) 95.5 99.8 89.2
Type of Medicare CoverageFFS (%) 59.6 100.0 0.0MA (%) 40.4 0.0 100.0
NOTE: Includes beneficiaries who were in both the crosswalk and DPRP data. Percentages may not sum to 100% because beneficiaries can select multiple categories for race.
SOURCE: RTI analysis of Supplier Crosswalk data; DPRP data
The primary referral source for all beneficiaries in MDPP is from a health care provider (44%). In examining differences between FFS and MA, 42% of FFS beneficiaries, compared with 33% of MA beneficiaries, reported their referral source as their primary care provider or specialist (Table 5). This
finding is consistent with what we heard from MDPP suppliers when we interviewed 10 MDPP suppliers on supplier implementation. The interviews covered referral processes, MDPP delivery, and retention strategies. Most suppliers emphasized the importance of establishing an easy referral process for physicians and nurses, often integrating an MDPP referral process into providers’ electronic medical records if possible. Outreach to providers included personal face-to-face interactions, such as supplier-held lunch-and-learns, presentations at Grand Rounds, staff meetings, and one-on-one conversations with physicians and nurses, as well as more traditional means such as flyers, brochures, and newsletters. In addition, suppliers worked to build relationships with providers so that providers were aware of the program, knew who to reach out to, and felt a more personal connection to the program.
Compared with only 1% of FFS beneficiaries, 27% of MA beneficiaries reported insurance as their referral source. Overall, 12% of beneficiaries reported insurance companies as their referral source. Respondents from organizations with access to patient data (e.g., health plans) reported that, for the most part, they do not focus on a specific pool of eligible or potentially eligible beneficiaries to recruit from. They reported that they were unable to use their
The most common referral source across beneficiaries was referral from a health care provider.
Table 4 (continued) Demographic characteristics of MDPP beneficiaries

Evaluation of the Medicare Diabetes Prevention Program Annual Report
30
data systems because they did not know how to access such information or their systems are not up to date regarding potential eligibility.
Other referral sources were media (8%) and self-referral (6%). MDPP suppliers that we interviewed reported using a combination of traditional, digital, and interpersonal outreach strategies to market the MDPP within their communities. Most suppliers reported that they had not tailored their marketing materials specifically for Medicare beneficiaries; however, some did report tailoring photos and descriptions of physical activities and program goals and advertising class times within marketing materials to the preferences and needs of older adults and people with disabilities. Suppliers also reported that word-of-mouth from and promotion by past MDPP or National DPP participants often lead to self-referrals. Family members and community members, such as neighbors, church members, and senior center residents, sharing positive experiences from their local MDPP with someone they know generates significant interest within the community.
Table 5. Referral source for beneficiaries
The primary means by which beneficiaries were referred was from a health care professional.
NOTE: Referral source is based on ENROLL variable in CDC DPRP data. Primary care provider/specialist includes MD, DO, PA, NP, or other staff at the provider’s office. Media includes radio, newspaper, billboard, poster/flyer, TV, internet ads, and social media platforms such as Twitter or Facebook. Non-primary care health professional includes pharmacists and dietitian.
SOURCE: RTI analysis of Supplier Crosswalk data; DPRP data
Referral source Percentage of all beneficiaries (n = 1,419)
Percentage of FFS beneficiaries
(n = 846)
Percentage of MA beneficiaries
(n = 573)
Primary care provider/specialist 38.6 % 42.3% 33.2% Not reported 14.0 % 12.2% 16.6% Insurance company 11.6 % 1.3% 26.7% Media 8.0 % 9.9% 5.1% Self (decided to come on own) 6.0 % 6.7% 4.9% Other 5.9 % 8.0% 2.8% Non-primary care health professional
5.5 % 5.1% 6.1%
Community-based organization or community health worker
4.7 % 7.0% 1.4%
Family/friends 4.7 % 5.9% 2.8% An employer or employer wellness program
1.1 % 1.5% 0.5%

Evaluation of the Medicare Diabetes Prevention Program Annual Report
31
3.3 Session Attendance
On average, beneficiaries attended 16 sessions, including 13 of the 16 core sessions, 2 of the 6 monthly core maintenance sessions, and less than 1 makeup session (Table 6). As discussed in the next paragraph, the average includes some beneficiaries who recently entered the program and would therefore be only partway through the 16-session core
curriculum Days enrolled is calculated on the individual beneficiary level. It is based on the beneficiary’s first and last session attended. It is an important assessment of retention (i.e., how long beneficiaries stay actively engaged in the program). The average days enrolled in the program for beneficiaries is 193 days, approximately 6 months. FFS beneficiaries have slightly longer enrollment (206 days) versus MA beneficiaries (173 days).
Table 6. Summary statistics for mean number of sessions and days enrolled by subset
Beneficiaries have completed an average of 16 sessions and have been enrolled for 193 days.
Subgroup Sample size Days enrolled Sessions attended
All Beneficiaries 1,419 193 15.7FFS 846 206 16.5MA 573 173 14.5Time Since First Class
0–3 Months 171 36 5.54–6 Months 279 111 12.47–9 Months 280 191 17.310–12 Months 226 225 17.812+ Months 463 285 19.4
Session Count ≥ 9 1,119 236 18.8NOTE: We examined time since the first class attended by mutually exclusive cohorts. Time since first class is calculated using the beneficiary’s first session date and the supplier’s last session date. Days enrolled is calculated at the individual beneficiary level using the beneficiary’s last session date—the beneficiary’s first session date + 1. See Appendix C for additional explanation.
SOURCE: RTI analysis of Supplier Crosswalk data; DPRP data
We also examined time since the first class attended by mutually exclusive cohorts. Time since the first class is calculated based on the beneficiary’s first session date and the supplier’s most-recent session date in the DPRP dataset and provides a measure of how long beneficiaries could have been enrolled in the program.1 For example, the 171 beneficiaries whose time since
1 The following example illustrates the difference between days enrolled and time since first class. If a beneficiary’s first session is February 1, 2019, his or her last session is August 31, 2019, and the supplier’s last session reported in the DPRP for another beneficiary is December 31, 2019, then the beneficiary’s days enrolled would
82% of MDPP beneficiaries attended 9 or more sessions during the 6-month core.

Evaluation of the Medicare Diabetes Prevention Program Annual Report
32
first class was 0–3 months could have been enrolled for at most 90 days, indicating that they would not have had time to complete the initial 16 core sessions of the curriculum and may still be attending sessions. Their average enrollment time (36 days) further suggests that many of the beneficiaries in this cohort may be very early in the MDPP curriculum; not surprisingly, they have only attended 5.5 sessions. At the other end of the spectrum, 463 beneficiaries have a time since first class equal to 12 or more months. These beneficiaries could have completed both the 16 core sessions and the 6 core maintenance sessions in Year 1. The average days enrolled for this cohort is 285 days, indicating that not everyone remained enrolled for a full year, but the average is still well above the 6 months allowed for core sessions.
To promote retention, suppliers noted that they tried to make the program accessible to Medicare beneficiaries by scheduling class times and selecting locations to best meet beneficiaries’ needs. They also reported that they would try to find ways to involve family members in the program to foster support for lifestyle changes; connect beneficiaries to support programs to address issues such as access to safe places to exercise and to healthy foods; and provide support tools, such as measuring cups, cook books, and kitchen scales, at strategic times during the course to keep beneficiaries engaged. Suppliers also noted that they provided flexible one-on-one make-up sessions to ensure beneficiaries stay engaged and do not fall behind. Several suppliers noted the importance of checking in with beneficiaries after they have missed a class and working with them to make up the session.
3.4 Weight Loss
A critical goal of the MDPP is beneficiary weight loss; the program aims to achieve at least 5% weight loss. The average starting weight for beneficiaries for whom we had data (n = 1,419) was 204.6 pounds, and on average, they lost 5.1% of their starting weight (Table 7). This analysis includes all beneficiaries who attended at least two
sessions, regardless of total sessions attended. Beneficiaries who attended nine or more sessions lost 5.9% of their starting weight. On average, FFS beneficiaries lost 5.4% of their starting weights; MA beneficiaries lost 4.7% of their starting weights. As previously mentioned, FFS beneficiaries were enrolled for 25% longer than MA beneficiaries and attended more sessions. It is not clear whether these differences will persist as sample sizes increase or as both groups advance through the program.
be 212 days (February 1 through August 31, 2019) and the time since first class would be 334 days (February 1 through December 31, 2019).
MDPP beneficiaries lost an average of 5.1% of their starting weight.

Evaluation of the Medicare Diabetes Prevention Program Annual Report
33
3.4.1 Weight Loss Based on Time Since First Class
To examine weight loss by time since first class attended, all beneficiaries that attended at least two sessions were divided into mutually exclusive groups. Beneficiaries with 0–3 months since the first class lost 2.3% of their starting weights, whereas those with 4–6 months since the first class lost 4.2% and those with 7–9 months since the first class lost 6.3% (Table 7). Beneficiaries with 10–12 months since the first class lost 5.6% of their starting weight and those with 12+ months since the first class lost 5.5% (Table 7). Figure 6 presents the average weight loss for each of the
cohorts and the 95% confidence intervals. All of the values were statistically significant relative to baseline weight; however, weight changes were not available for a comparison group. Because we do not have a comparison group for this measure, although we can say that there was a statistically significant drop in weight—a goal of the program—we cannot say how much of that was attributable to the MDPP or whether the beneficiaries would have lost weight anyway. Data from the second year of the MDPP were only available for a small subset of beneficiaries. These data will be important for evaluating whether weight loss is maintained and whether weight changes occur over a longer period.
Table 7. Summary statistics for weight change among MDPP beneficiaries
On average, beneficiaries lost 5.1% of their starting weights.
Subgroup Sample sizeWeight at first session (lbs.)
Weight change (lbs.)
Weight change (%)
All Beneficiaries 1,359 204.6 −10.5 −5.1%FFS 824 204.3 −11.0 −5.4%MA 535 205.1 −9.6 −4.7%Time Since First Class
0–3 Months 141 204.5 −4.7 −2.3%4–6 Months 265 202.2 −8.3 −4.2%7–9 Months 275 205.1 −13.1 −6.3%10–12 Months 224 202.6 −11.2 −5.6%12+ Months 454 206.9 −11.5 −5.5%
Session Count ≥ 9 1,119 205.1 −12.1 −5.9%
Note: Sample size for weight at first session is 1,419. Sample size for weight change is 1,359 due to requiring two observations. Time since first class is calculated using the beneficiary’s first session date and the supplier’s last session date.
SOURCE: RTI analysis of Supplier Crosswalk data; DPRP data
As MDPP beneficiaries spent more time in the program they lost more weight. Beneficiaries with 0–3 months since the first class lost 2.3% of their starting weights compared with a 6.3% loss among those with 7–9 months since the first class.

Evaluation of the Medicare Diabetes Prevention Program Annual Report
34
Figure 6. Average weight-loss percentage by time since first class and overall
Beneficiaries steadily increased their weight loss during the first 6 months and maintained it after that.
SOURCE: RTI analysis of Supplier Crosswalk data; DPRP data
We also examined weight loss by the number of sessions attended (Figure 7). There appears to be a nearly linear relationship between weight loss and session attendance. Appendix Table C-5 shows the detailed table with all values. By session 4, the second MDPP performance goal for attendance, the average weight loss was 1.6% of starting body weight. By session 9, the third performance goal for attendance, the average weight loss was 3.4% of starting body weight. By the end of the core sessions, session 16, the average weight loss was 5.8% of starting body weight. This finding is important because performance goal payments in months 7–12, the core maintenance sessions, are higher if the person has achieved at least 5% weight loss.
Although there is a clear relationship between weight loss and the number of sessions attended, we cannot yet say that the relationship is causal in the sense that attending more classes leads to (i.e., causes) more weight loss. The causality could run in the opposite direction, with beneficiaries who lost more weight in the early sessions choosing to attend more sessions and those who did not lose weight becoming discouraged and deciding to stop attending sessions. We will examine this issue in more detail as the evaluation continues.

Evaluation of the Medicare Diabetes Prevention Program Annual Report
35
Figure 7. Average weight loss by number of sessions attended
The more sessions beneficiaries attended, the more weight loss they achieved.
SOURCE: RTI analysis of Supplier Crosswalk data; DPRP data
3.4.2 Achievement of Target Weight-Loss Goals
Forty-nine percent of MDPP beneficiaries have ever met the 5% weight-loss goal, and 22.3% have ever met the 9% weight-loss goal (Table 8 ). In Figure 8, we plot all beneficiaries, with at least one session attended. We present all beneficiaries to give a conservative estimate of the percentage achieving the weight-loss
goals. Sixty beneficiaries only had one session. If they are excluded from the analysis, 51.1% of the remaining 1,359 beneficiaries meet the 5% weight-loss goal, and 23.3% meet the 9% weight-loss goal.
Beneficiaries are divided into mutually exclusive groups based on the time since their first class. For those with 0–3 months or 4–6 months since the first class, less than half of participating beneficiaries achieved 5% weight loss. The cohorts with more than 6 months since the first class had 57% or more achieving 5% weight loss. Suppliers receive $165 per beneficiary when they first meet the 5% weight-loss goal and an additional $26 when the reach the 9% weight-loss goal. In addition, after the first 6 months, performance payments are higher if 5% weight loss is sustained.
49% of beneficiaries achieved the 5% weight-loss goal.
22% of beneficiaries achieved the 9% weight-loss goal

Evaluation of the Medicare Diabetes Prevention Program Annual Report
36
Table 8. Summary statistics for achieving weight-loss goals for MDPP beneficiaries
48.9% of beneficiaries lost at least 5% of their starting weight.
Subgroup Sample SizeMeeting 5% WL
Goal Meeting 9% WL
GoalAll Beneficiaries 1,419 48.9% 22.3%FFS 846 53.6% 24.7%MA 573 42.1% 18.9%
SOURCE: RTI analysis of Supplier Crosswalk data; DPRP data
Figure 8. Cumulative percentage of beneficiaries reaching 5% and 9% weight loss by time since first
class48.9% of MDPP beneficiaries ever achieved 5% weight loss.
SOURCE: RTI analysis of Supplier Crosswalk data; DPRP data

Evaluation of the Medicare Diabetes Prevention Program Annual Report
37
3.4.3 Comparison to Other Studies
Although the MDPP is the first widespread Medicare-funded diabetes prevention program, it is not the first DPP program to include Medicare beneficiaries. Using data collected from Medicare suppliers on weight loss and session attendance throughout the first year of the MDPP, we compared
MDPP results with those of the Y-USA DPP, which received a Health Care Innovation Award to implement its program for Medicare beneficiaries across 17 YMCA sites (Rojas Smith et al., 2017), and those of the National DPP (Ely et al., 2017). The same inclusion criteria that were used for the Y-USA analyses were applied to MDPP beneficiaries for this analysis. This reduced the MDPP sample size to 417 to only include beneficiaries who had attended at least two sessions in 12 or more months.
The average weight change was 5.7% in the MDPP sample vs 4.6% in the Y-USA DPP sample. The starting weight was slightly higher among MDPP beneficiaries than among Y-USA DPP participants ( ). Although the weight change is higher among MDPP beneficiaries, the MDPP sample size is substantially smaller and will increase in future years.
Table 9
Table 9. Y-USA DPP and MDPP weight change comparison
The weight change among MDPP beneficiaries was slightly higher than the Y-USA DPP sample.
Subgroup Sample size
Weight at first session (lbs.)
Avg
Weight change (lbs.) Avg
Weight change (%) Avg
Y-USA DPP 7,832 200.3 −9.3 −4.6 MDPP 417 204.4 −11.9 −5.7
Note: Y-USA DPP weight change was calculated for those attending at least one session during a 12-month period. MDPP weight change was calculated for those attending at least two sessions during a 12-month period. The MDPP sample dropped six beneficiaries who only had one session. Including these six beneficiaries would decrease the average weight change to 11.7 pounds but does not change the weight change percentage.
SOURCE: RTI analysis of Supplier Crosswalk data; DPRP data; Source Y-USA DPP: (Rojas Smith et al., 2017)
Across cohorts, the percentage weight change by session and time was comparable between the MDPP beneficiaries and the 65 and older population in a study of National DPP participants (Ely et al., 2017). More detail is provided in Appendix C and Appendix Table C-7.
3.5 Physical Activity
As part of the MDPP curriculum, coaches instruct beneficiaries to track how many physical activity minutes are completed each week of the program. These data are self-reported by the beneficiaries. The CDC curriculum emphasizes
MDPP weight loss results were comparable to or slightly better than those observed in other studies.
By session six, 66% of beneficiaries reported meeting the goal of 150 minutes of physical activity per week.

Evaluation of the Medicare Diabetes Prevention Program Annual Report
38
recording physical activity minutes beginning in session 5, and the program’s goal is for beneficiaries to achieve at least 150 minutes of physical activity per week.
At session 1, 20% of beneficiaries met the physical activity goal of 150 minutes among the 38.4% of beneficiaries reporting. The percentage of beneficiaries meeting the physical activity goal, among those reporting physical activity minutes, rose to 66% by session 6. The percentage of beneficiaries meeting the physical activity goal rose to 76% by session 22.
Figure 9 presents the percentage of beneficiaries who reported physical activity minutes at each session and the percentage of beneficiaries (among those reporting) who reported more than 150 minutes of physical activity per week. Appendix Table C-8 shows the detailed results of this analysis.
Figure 9. Self-reported physical activity by sessions attended
After Session 5 when the physical activity goal was emphasized, on average of 71% MDPP beneficiaries met the goal of 150 minutes per week.
0%
10%
20%
30%
40%
50%
60%
70%
80%
90%
100%
1 2 3 4 5 6 7 8 9 10 11 12 13 14 15 16 17 18 19 20 21 22
Perc
enta
ge o
f Par
ticip
ants
Session Number
Reporting Physical Activity Minutes Meeting Physical Activity Goal
Note: Only presented through 22 sessions as the number of beneficiaries who reached 23 sessions decreased to 369, or less than 20% of the full sample.
SOURCE: RTI analysis of Supplier Crosswalk data; DPRP data
Evaluation of the Medicare Diabetes Prevention Program Annual Report
39
3.6 Summary
Through December 31, 2019, at least 2,248 Medicare beneficiaries participated in the MDPP, including 1,095 FFS beneficiaries and 1,153 MA beneficiaries, based on Supplier Crosswalk data. Because of lags in data reporting schedules, these numbers may underestimate the total number of MDPP beneficiaries.
Most beneficiaries participating in the MDPP were between the ages of 65 and 74 years, female, and white. The key finding from the DPRP data is that approximately half (48.9%) of the beneficiaries in the program are meeting the 5% weight-loss goal. Participants, on average, lost 5.1% of their body weight, and those in the program between 7 and 9 months after their first class lost 6.3% of their starting weights. FFS beneficiaries lost 5.4% of their starting weights, and MA beneficiaries lost 4.7%, although this difference may be affected by the shorter enrollment periods for MA beneficiaries. In general, weight loss and attendance results to date for MDPP beneficiaries are similar to those for adults 65 and older in the National DPP and for Medicare beneficiaries enrolled in the Y-USA DPP model test that led to the MDPP. The program was also successful in encouraging 70% to 75% of beneficiaries to meet the goal of 150 minutes of physical activity per week.

Evaluation of the Medicare Diabetes Prevention Program Annual Report
40
SECTION 4. MDPP SERVICES BILLED TO MEDICARE AND BASELINE MEDICARE SPENDING
AND USE AMONG MDPP BENEFICIARIES
This section describes the types of MDPP FFS claims billed to Medicare by suppliers, the total Medicare payments for these MDPP services, and trends in select measures of FFS beneficiary health care use and spending during 3 baseline years before an MDPP beneficiary enrolls in the program.2 Analyses of MDPP claims signal how beneficiaries progress through the MDPP. Baseline utilization and spending provide insight into beneficiaries’ use of health care, serving as a proxy for understanding beneficiaries’ health status prior to MDPP enrollment.
Key Findings:
▪ CMS has paid 37 MDPP suppliers for delivering MDPP services to 623 FFS Medicare beneficiaries.
▪ CMS has paid $101,989 to suppliers from April 1, 2018, through December 31, 2019 for MDPP services.
▪ Most paid MDPP claims are for the provision of core MDPP sessions.▪ Using the 623 beneficiaries with an MDPP claim as the denominator,
25% of beneficiaries (155/623) have met the 5% weight loss goal and 12% of beneficiaries (77/623) have met the 9% weight loss goal.
▪ Compared with the average Medicare beneficiary, MDPP beneficiaries had lower total expenditures and used less inpatient care prior to enrollment in the program.
4.1 FFS MDPP Services Billed to Medicare
As described in Section 3, MDPP suppliers have been enrolling Medicare FFS beneficiaries into MDPP, so billing for MDPP services has increased steadily since program inception. From April 1, 2018, (program start date) through December 31, 2019, suppliers billed and received payment for delivering 1,720 MDPP services. The amount that MDPP suppliers are paid is based on a combination of how long the beneficiary has been in the program, the number of sessions attended, and achievement of weight loss goals (see Overview of MDPP Reimbursement textbox and Figure 10 for a description of how MDPP reimburses suppliers).
2 This section focuses on MDPP FFS claims, expenditures, and utilization because Medicare does not make direct payments to MA plans for MDPP services. Instead, Medicare pays per capita for each beneficiary enrolled in an MA plan, and the MA plan then pays suppliers for any MDPP services used by enrolled beneficiaries.

Evaluation of the Medicare Diabetes Prevention Program Annual Report
41
CMS has reimbursed MDPP suppliers with $101,989. In addition to claims for payable MDPP services, 3,282 claims were for nonpayable DPP sessions. According to billing records, 37 MDPP suppliers have provided 5,002 MDPP services to 623 FFS beneficiaries.
Many suppliers have not yet billed Medicare for services rendered to MDPP FFS beneficiaries. In the January 2020 Supplier Crosswalk, suppliers reported serving 1,095 FFS beneficiaries. Of these, 1,081 FFS beneficiaries could be linked to CCW FFS enrollment data,
yet only 560 (or 48%) of those beneficiaries had an MDPP claim (Figure 11). Because suppliers have up to 12 months to submit a claim for services rendered, MDPP services found in the claims data are an undercount of the services rendered in the time period examined. Because of the lag between services and submission of claims, the program is serving more beneficiaries than the claims suggest.
Overview of MDPP ReimbursementFor MDPP FFS beneficiaries, the MDPP reimburses suppliers through a performance-based system (Figure 10). MDPP suppliers submit claims when beneficiaries meet specific program attendance and weight-loss goals. These claims are payable services.Medicare reimburses suppliers a one-time payment, when applicable, called a “bridge payment” if a beneficiary transitions to the supplier’s MDPP after first starting the program with another supplier. Medicare also requires suppliers to submit claims for beneficiary attendance at sessions that are not associated with a specific performance goal; these claims are part of the MDPP and considered an approved service but not a payable service.
$101,989: Amount paid to MDPP suppliers for services provided.Suppliers have not yet billed Medicare for 48% of their enrolled MDPP FFS beneficiaries.

Evaluation of the Medicare D
iabetes Prevention ProgramA
nnual Report
42
Figure 10. Reimbursement for FFS MDPP services
Reimbursement is performance based, depending on beneficiary attendance and weight loss (WL).
Source: Reproduced from CMS website https://innovation.cms.gov/files/fact-sheet/mdpp-billpymnfs-2020.pdf

Evaluation of the Medicare Diabetes Prevention Program Annual Report
43
Some suppliers have also billed Medicare for MDPP services rendered on behalf of FFS beneficiaries who have not been included as MDPP enrollees in the Supplier Crosswalk. There were 63 of these beneficiaries in these claims. Suppliers do not have to submit a Supplier Crosswalk until 6 months after they start providing MDPP services, so these 63 beneficiaries are likely associated with suppliers who had not yet submitted a Supplier Crosswalk by the time this analysis was conducted.
Figure 11Number of MDPP FFS beneficiaries in the Supplier Crosswalk versus Medicare claimsSuppliers serve more MDPP FFS beneficiaries than they have billed for in Medicare claims.
Note: The Supplier Crosswalk identified 1,095 MDPP FFS beneficiaries, but only 1,081 of the beneficiary identifiers submitted could be linked to Medicare enrollment data.
Examining billed MDPP claims sheds light on how MDPP FFS beneficiaries are progressing through the program (see Figure 12). First, all beneficiaries for whom there is an MDPP claim should have a claim for attending one core session because that attendance triggers the start of program engagement. However, only 70% (439 of 623) of the study sample has an approved claim for first core MDPP session. Individuals with no claim for attending the first core session have claims for other payable MDPP services or claims for attendance at DPP sessions that are not associated with particular performance goals and thus not payable.
Second, of the 623 beneficiaries with an MDPP claim, 58% (363 of 623) have completed nine sessions. In contrast, as presented in the previous chapter, suppliers are reporting to CDC that approximately 82% of their served MA and FFS beneficiaries have received nine or more

Evaluation of the Medicare Diabetes Prevention Program Annual Report
44
visits. The provision of nine visits is an important program milestone because it takes a beneficiary through enough of the curriculum to teach the principles of healthy eating and how to increase physical activity; the ninth visit also triggers an additional payment. That a little over half of the sample has claims for completing nine sessions may suggest that some MDPP beneficiaries drop out of the program over time, but it may also reflect that some MDPP beneficiaries are early in their program participation and have not yet completed all 16 core sessions or that suppliers have not yet submitted claims for the ninth visit.
Figure 12. Number of beneficiaries with approved MDPP FFS claims,
April 1, 2018–December 31, 2019Medicare is most frequently paying for MDPP core session attendance, and beneficiaries are
meeting weight-loss goals.
*All 623 beneficiaries with an approved claim should have a claim for attending one core session because that attendance triggers the start of program engagement, but this is not the case. After further investigation, most of the individuals with no approved claim for attending the first core session have G9891 (attendance at a nonpayable DPP session) as their first claim.**Beneficiaries may have claims for this service more than once. These 470 beneficiaries had a total of 3,282 claims for nonpayable DPP sessions (G9891).Abbreviations: WL = weight loss; Y1, Y2 = Year 1, Year 2; Q1, Q2, Q3, Q4 = Quarters 1-4
SOURCE: RTI analysis of CCW Medicare FFS claims.
Third, MDPP FFS beneficiaries in this study sample are meeting weight-loss goals. Based on paid claims, 155 beneficiaries have achieved 5% weight loss, 79 beneficiaries have achieved 9% weight loss, and more than half of those with ongoing core maintenance sessions had achieved 5% weight loss. The estimated percentage achieving the weight-loss goals depends on the denominator used in the calculation.
Using the 623 beneficiaries with an approved claim as the denominator, 25% (155 of 623) have
Among the 623 beneficiaries with an MDPP claim, 25% have met the 5% weight-loss goal, and 12% have met the 9% weight-loss goal.

Evaluation of the Medicare Diabetes Prevention Program Annual Report
45
met the 5% weight-loss goal and 12% (77 of 623) have met the 9% weight-loss goal. These estimates are lower than corresponding estimates from the DPRP data in Section 3 (48.9% for 5% weight loss and 22.3% for 9% weight loss, see Table 8). Using the 439 beneficiaries with a paid claim for one session, the percentages achieving 5% and 9% weight loss are 35% (155/439) and 18% (79/439), respectively. Because this study sample of beneficiaries with MDPP claims includes beneficiaries who have not yet completed the program, more beneficiaries will likely reach weight-loss goals as they progress through the program.
4.2 Baseline Spending and Utilization Among MDPP FFS Beneficiaries
The goal of the MDPP is to help Medicare beneficiaries achieve weight loss and better health outcomes, resulting in less expensive health care utilization and reductions in the total cost of care, after enrolling in the MDPP. To test whether this happens, measures of utilization and spending before a beneficiary begins the MDPP must be constructed. Baseline measures of total FFS spending, emergency department (ED) visits, inpatient admissions, and ambulatory care visits for MDPP FFS beneficiaries characterize pre-existing levels of utilization and inform selection of a comparison group. If baseline data indicate that MDPP FFS beneficiaries are more or less healthy than the average Medicare beneficiary, this must be accounted for when selecting the comparison group for future analyses that will compare changes in health care utilization and spending for MDPP beneficiaries with a similar group of Medicare beneficiaries not participating in MDPP.
4.2.1 Analysis Time Period, Study Sample Identification, and Outcomes
Analysis Time Period—The analysis included Medicare FFS claims from April 1, 2015, through September 30, 2019. The analysis period ended in September to allow for 6 months of claims run-out. Based on each beneficiary’s start date (described below), a beneficiary was assigned a specific baseline period, going back up to 3 years from the individual’s start date. Some beneficiaries were enrolled in Medicare for the full 3 years of the baseline period. Others were only enrolled in Medicare FFS for a portion of the 3 years prior to their start date, and for these individuals, their available utilization and spending data were included in the analysis.
Study Sample—A cumulative list of 1,0813 MDPP FFS beneficiaries reported by MDPP suppliers in the January 15, 2020, Supplier Crosswalk was used as the starting point, and 982 beneficiaries were ultimately included in this baseline claims analysis because of several criteria imposed on the data. In the total Medicare FFS spending and utilization analysis, claims in months where the beneficiary was alive, had Medicare Parts A and B, and was not enrolled in MA were included. Some beneficiaries were new Medicare enrollees, and their Medicare enrollment began after September 2019, so no baseline data were available. Others had no months in the analysis period in which they met the criteria of being alive, having Medicare Parts A and B, and not being enrolled in MA. Moreover, although MA beneficiaries are eligible to
3 In the January 2020 Supplier Crosswalk, suppliers reported 1,095 MDPP FFS beneficiaries. However, only 1,083 could be found in the Medicare enrollment database. Erroneous Medicare identifiers likely explains why 14 participants were not identified. Furthermore, of the 1,083 MDPP FFS beneficiaries that were found, two beneficiaries were dropped from the file for the claims analysis for a total of 1,081 beneficiaries. According to Medicare enrollment data, one beneficiary died before they could have enrolled in MDPP and another had no FFS enrollment.

Evaluation of the Medicare Diabetes Prevention Program Annual Report
46
participate in MDPP, the MDPP suppliers are not required to submit the Medicare beneficiary identification number to CMS for MA beneficiaries, so MDPP beneficiaries’ Medicare managed care encounter data could not be identified.
Program Start Date—To determine each beneficiary’s baseline period , MDPP FFS beneficiaries were assigned a program start date based on the Supplier Crosswalk in which the MDPP FFS beneficiary first appeared; for most beneficiaries, the start date was the first day of the reporting quarter associated with the Supplier Crosswalk (Table 10). The limitation of this approach is that some beneficiaries’ MDPP enrollment time was coded as pre-enrollment time because they did not start the program at the beginning of the reporting quarter. As more data become available, refinements to each beneficiary’s start date can be made.
Table 10. Attributed start date based on Supplier Crosswalk datasets
We assigned MDPP start dates for beneficiaries based on the Supplier Crosswalk in which the MDPP FFS beneficiary first appeared.
Supplier Crosswalk Submission Date
Attributed MDPP Start Date
Baseline Start Date
Number of MDPP FFS Beneficiaries
January 15, 2019 July 1, 20184 July 1, 2015 81April 15, 2019 January 1, 2019 January 1, 2016 336July 15, 2019 April 1, 2019 April 1, 2016 160October 15, 2019 July 1, 2019 July 1, 2016 186January 15, 2020 October 1, 2019 October 1, 2016 219
Outcomes—The spending outcome included total Medicare FFS spending per beneficiary per month (PBPM). Utilization outcomes included ED visits, inpatient admissions, and primary care and specialty care visits. Appendix D provides detailed definitions of how these outcomes were operationalized in the Medicare claims data. Baseline trend graphs for inpatient admissions, ED visits, and primary care and specialty visits are also presented in Appendix D.
4 The January 15, 2019, Supplier Crosswalk covered the reporting period April 1, 2018, through December 31, 2018. Given the relatively slow program start-up, we assumed that most beneficiaries in this crosswalk did not enroll on April 1, 2018, so we assigned a program start date of July 1, 2018.

Evaluation of the Medicare Diabetes Prevention Program Annual Report
47
4.2.2 Baseline Spending and Utilization Findings
Prior to enrollment, MDPP FFS beneficiaries are lower cost and use less inpatient care than the average Medicare beneficiary, as shown in Table 11. National estimates of Medicare spending vary between $11,000 and $12,000 per Medicare beneficiary per year (Hartman, Martin, Benson, Catlin, & National Health Expenditure Accounts, 2019; Holahan & McMorrow,
2019), and the annual estimate of $6,432 for MDPP beneficiaries (derived by annualizing a baseline average across 3 baseline years of $536 PBPM) is lower than those estimates. Lower costs may be driven in part by fewer inpatient hospital stays. Our sample has 9–12 inpatient admissions per 100 beneficiaries, which is less than the national average of 26 inpatient admissions per 100 beneficiaries (Centers for Medicare & Medicaid Services, 2019).
Moreover, many of the characteristics that define the MDPP FFS beneficiaries are associated with incurring fewer health care costs. Compared with all Medicare FFS beneficiaries, the sample of MDPP FFS beneficiaries has a greater proportion of individuals who are white and female and a lower proportion of individuals who are racially and ethnically diverse, who have been enrolled in Medicare due to disability, and who have been enrolled in Medicare and Medicaid (Table 12).
Table 11. Spending, utilization, and sociodemographic characteristics of MDPP FFS beneficiaries
and Medicare FFS beneficiaries MDPP FFS beneficiaries are lower cost and use less inpatient care than the average
Medicare beneficiary.
CharacteristicMDPP FFS
BeneficiariesMedicare FFS Beneficiaries
Annual Baseline Spending1 Total Medicare FFS, mean $536 PBPM
$6,552/year$1,000 PBPM$11,000–$12,000/year
Annual baseline Utilization2 Inpatient admissions per 100 beneficiaries, mean
9 27
ED visits per 100 beneficiaries, means 31 26Physician visits per beneficiary, mean 12 (all visits)
5.4 (PCP visits)6.5 (Specialist visits)
13.4 (all visits)
(continued)
Before enrolling in the program, MDPP beneficiaries cost roughly half that of the average Medicare beneficiary ($536 vs $1,000 per beneficiary per month).

Evaluation of the Medicare Diabetes Prevention Program Annual Report
48
Table 13 (continued) Spending, utilization, and sociodemographic characteristics of MDPP FFS beneficiaries
and Medicare FFS beneficiaries
CharacteristicMDPP FFS
BeneficiariesMedicare FFS Beneficiaries
Sociodemographic Characteristics3
Age, mean 71 72Female, % 75 55Race, %
White 86 78Black 8 9Hispanic 1 6Asian/Pacific Islander 2 3
Originally enrolled due to disability, % 11 22At least 1 month of Medicare/Medicaid enrollment, %
6 20
At least 1 month of coverage through Medicare Advantage, %
12 2
Rural region of residence, % 22 26Notes:
1. The sample size of MDPP beneficiaries is 982. Baseline spending estimates for MDPP beneficiaries include the authors’ analyses. Spending estimates for Medicare FFS beneficiaries can be found in Hartman, Martin, Benson, Catlin, & National Health Expenditure Accounts (2019) and Holahan & McMorrow (2019).
2. The sample size of MDPP beneficiaries is 982. Baseline utilization estimates for MDPP beneficiaries include the authors’ analyses and represent utilization in the year before MDPP enrollment. Utilization estimates for Medicare FFS beneficiaries can be found in Centers for Medicare & Medicaid Services (2019).
3. The sample size of MDPP beneficiaries is 1,081 and includes all MDPP beneficiaries found in Medicare enrollment files from the January 2020 Supplier Crosswalk. The sample size of Medicare FFS beneficiaries is 33,506,263 and includes individuals enrolled in Medicare Part B and had FFS for at least 6 months in 2019.
That the MDPP FFS beneficiaries are lower cost is somewhat expected because the MDPP targets community-dwelling beneficiaries who are healthy enough to participate in a program that promotes exercise and healthy eating. The comparison group selected for future regression analyses will have to be similarly lower cost to make correct inferences about program effectiveness.
4.3 Summary of Findings and Limitations
In this analysis of Medicare FFS claims, MDPP suppliers have provided 5,002 MDPP services (including 1,720 paid claims and 3,282 approved claims for nonpayable services) to 623 FFS beneficiaries over the first 2 years of the MDPP program, with Medicare payments for

Evaluation of the Medicare Diabetes Prevention Program Annual Report
49
MDPP services totaling $101,989. Most MDPP services paid to suppliers were for core DPP session attendance. Paid MDPP claims have increased as more MDPP suppliers join the program and more Medicare FFS beneficiaries enroll. Notably, suppliers are submitting claims for weight loss, so MDPP FFS beneficiaries are achieving the weight-loss goals for the program.
Early findings from FFS spending and utilization data suggest that MDPP beneficiaries have lower costs and use less inpatient care prior to enrollment than the average Medicare beneficiary. An implication of this finding is that a comparison group of similarly low utilizers must be identified for future impact analyses.
This analysis has several limitations. First, because of the relatively small number of MDPP FFS beneficiaries in our study period, our findings are preliminary and will change in the future. Second, as previously noted, almost half of MDPP FFS beneficiaries do not yet have MDPP claims because MDPP suppliers have not submitted these claims for reimbursement. We will better understand beneficiary progression through the MDPP program when more MDPP claims become available. Third, lags in claims submission constrain our ability to make real-time assessments of the program. Fourth, analyses of spending and utilization are limited to Medicare FFS beneficiaries. Detailed claims data are not available for MDPP MA beneficiaries, who account for 51% of MDPP enrollment to date. Finally, this report presents descriptive analysis only; future analyses will include assessing program impacts on health care outcomes among MDPP FFS beneficiaries relative to a comparison group.

Evaluation of the Medicare Diabetes Prevention Program Annual Report
50
SECTION 5. EVALUATION NEXT STEPS
In this section, we describe planned activities for data collection, analysis, and selection of the comparison group. We also discuss the effects of the COVID-19 pandemic on the MDPP. Although the pandemic is not reflected in the data analyzed in this report, COVID-19 began affecting MDPP activities in March 2020, and we will account for these effects in later annual reports.
5.1 Continued Data Collection
We will continue to receive Supplier Crosswalk, DPRP, and CCW claims data quarterly. We expect the number of beneficiaries matched across datasets to increase over time. As the time since a beneficiary’s service increases, it is more likely that service will fall within the required reporting period for each dataset.
5.2 Analysis
In the coming year, we will focus on more-rigorous analyses of post-enrollment spending and utilization. Next steps include identifying a comparison group for claims analyses (see Section 5.3 for additional details); regression modeling of outcomes; identifying subgroups of interest; and analyzing outcomes among subgroups.
5.3 Comparison Group
To estimate the impact of MDPP participation on Medicare utilization and expenditures, we will construct a comparison group of Medicare FFS beneficiaries with similar characteristics as FFS beneficiaries who participate in the MDPP. Our next step in the comparison group work is to construct a primary comparison group for the MDPP intervention group. The primary comparison group is intended to provide an estimate of what would have happened to beneficiary utilization, costs, and other outcomes in the absence of MDPP services to address diabetes prevention and weight loss.
One issue that we will have to attempt to model in a consistent way between the treatment and the comparison group is the presence of a CCW indicator variable for diabetes. Preliminary evidence shows that some MDPP FFS beneficiaries have CCW indicator flags for previous diabetes despite the fact that, to be eligible for the MDPP, a beneficiary must not have previously diagnosed diabetes. We believe this occurs because MDPP suppliers rely on referral sources or beneficiary self-report for information about previous diabetes diagnoses and do not have access to the CCW diabetes indicator flags.
Moreover, the claims-based algorithm that generates the diabetes indicator is not perfect: it misses some beneficiaries who truly have diabetes and it yields false positives in some beneficiaries who do not have diabetes. Regardless for the reason and the extent to which this code reflects “real” diabetic status, this and other chronic disease indicators will need to be considered in the creation of the comparison group. For more details on the CCW diabetes flag, see Appendix E.

Evaluation of the Medicare Diabetes Prevention Program Annual Report
51
We will continue to monitor the CCW flags during the evaluation, and we will assess whether the diabetes flags have any implications for our selection of a comparison group and our analyses of spending and utilization. In the Y-USA DPP model test, we performed a sensitivity analysis of spending that excluded beneficiaries with a previous diabetes flag. The results for the sensitivity analysis were similar to the results for the main analysis, which included all participants (Alva et al., 2017).
5.4 Effects of the COVID-19 Pandemic on the MDPP
This report is based on data through December 31, 2019. Therefore, any effects of the COVID-19 pandemic on the MDPP are not reflected in the data included in this report.
The MDPP was designed to be delivered during in-person group sessions. Once the pandemic began, however, in-person sessions were considered unsafe for beneficiaries and suppliers. Because of the emergency, CMS issued regulations for the MDPP to protect beneficiaries and suppliers during the emergency (Centers for Medicare & Medicaid Services, 2020). Under these regulations, suppliers are allowed to conduct unlimited virtual sessions with already-enrolled MDPP participants through distance learning or online classes. Suppliers are also allowed to pause classes during the pandemic and restart classes once the emergency regulations are lifted. Beneficiaries are allowed to restart the program at its first session (previously beneficiaries could only start the program once in their lifetime). Finally, CMS postponed submission of the April 15, 2020, Supplier Crosswalk to July 15, 2020.
Information collected by CDC indicates that over half of suppliers switched to virtual delivery of programs and about half chose to pause or postpone some or all classes (some suppliers chose to move some classes to virtual delivery and pause or postpone other classes).
To the extent allowed by the availability of data, the evaluation will examine the effects of the pandemic and the changes in regulations on program participation and outcomes in subsequent reports. The DPRP data will identify which beneficiaries attend virtual sessions or pause participation in the program. In regression analyses, we will consider including indicator variables for the COVID-19 period to test whether this period affects program outcomes or overall Medicare expenditures and utilization.

Evaluation of the Medicare Diabetes Prevention Program Annual Report
52
REFERENCES
Alva, M. L., Hoerger, T. J., Jeyaraman, R., Amico, P., & Rojas-Smith, L. (2017). Impact of the YMCA of the USA Diabetes Prevention Program on Medicare spending and utilization. Health Affairs, 36(3), 417-424. doi:10.1377/hlthaff.2016.1307
Centers for Medicare & Medicaid Services. (2019). Medicare beneficiaries at a glance. Retrieved from https://www.cms.gov/Research-Statistics-Data-and-Systems/Statistics-Trends-and-Reports/Beneficiary-Snapshot/Downloads/Bene_Snaphot.pdf
Centers for Medicare & Medicaid Services. (2020). Policy and regulatory revisions in response to the COVID-19 public health emergency. Federal Register, 86(66), 19230-19292.
Centers for Medicare & Medicaid Services (CMS). (2019). Medicare Diabetes Prevention Program (MDPP)—frequently asked questions. Retrieved from https://innovation.cms.gov/initiatives/medicare-diabetes-prevention-program/faq.html
Chronic Conditions Data Warehouse. (2020). Condition Categories. Retrieved from https://www2.ccwdata.org/web/guest/condition-categories
Ely, E. K., Gruss, S. M., Luman, E. T., Gregg, E. W., Ali, M. K., Nhim, K., . . . Albright, A. L. (2017). A National Effort to Prevent Type 2 Diabetes: Participant-Level Evaluation of CDC's National Diabetes Prevention Program. Diabetes Care, 40(10), 1331-1341. doi:10.2337/dc16-2099
Glasgow, R. E., Vogt, T. M., & Boles, S. M. (1999). Evaluating the public health impact of health promotion interventions: the RE-AIM framework. American Journal of Public Health, 89(9), 1322-1327. doi:10.2105/ajph.89.9.1322
Hamman, R. F., Wing, R. R., Edelstein, S. L., Lachin, J. M., Bray, G. A., Delahanty, L., . . . Wylie-Rosett, J. (2006). Effect of weight loss with lifestyle intervention on risk of diabetes. Diabetes Care, 29(9), 2102-2107. doi:10.2337/dc06-0560
Hartman, M., Martin, A. B., Benson, J., Catlin, A., & National Health Expenditure Accounts, T. (2019). National Health Care Spending In 2018: Growth Driven By Accelerations In Medicare And Private Insurance Spending. Health Affairs, 101377hlthaff201901451. doi:10.1377/hlthaff.2019.01451
Hebert, P. L., Geuiss, L. S., Tierney, E. F., Engelgau, M. M., Yawn, B. P., & McBean, A. M. (1999). Identifying persons with diabetes using Medicare claims data. American Journal of Medical Quality, 14(6), 270-277. doi:https://doi.org/10.1177/106286069901400607
Holahan, J., & McMorrow, S. (2019). Slow growth in Medicare and Medicaid spending per enrollee has implications for policy debates. Urban Institute. Retrieved from https://www.urban.org/sites/default/files/publication/99748/rwjf451631_1.pdf .
Knowler, W. C., Barrett-Connor, E., Fowler, S. E., Hamman, R. F., Lachin, J. M., Walker, E. A., . . . Diabetes Prevention Program Research Group. (2002). Reduction in the incidence of

Evaluation of the Medicare Diabetes Prevention Program Annual Report
53
type 2 diabetes with lifestyle intervention or metformin. New England Journal of Medicine, 346(6), 393-403. doi:10.1056/NEJMoa012512
Rojas Smith, L., Amico, P., Hoerger, T. J., Jacobs, S., Payne, J., & Renaud, J. (2017). Evaluation of the Health Care Innovation Awards: Community resource planning, prevention, and monitoring. Third annual report addendum. Research Triangle Park, NC: RTI International. Retrieved from https://downloads.cms.gov/files/cmmi/hcia-crppm-thirdannrptaddendum.pdf.

Evaluation of the Medicare Diabetes Prevention Program Annual Report
54
APPENDIX A: DATA SOURCES
Linkages between Datasets
The Supplier Crosswalk plays a key role in linking the DPRP and CCW datasets (Appendix Table A-1). The Supplier Crosswalk includes the supplier’s name; an organization code assigned by CDC; and—for each beneficiary—a CDC participant code (randomly assigned by the supplier to the beneficiary) and a variable indicating whether the beneficiary has Medicare FFS or MA coverage. For FFS beneficiaries, the supplier also submits a Medicare identifier (either a Health Insurance Claim Number [HICN] or Medicare Beneficiary Identifier [MBI]).
For the DPRP data, the key linkage variables are the organization code and the CDC participant code. The Supplier Crosswalk data can be linked to DPRP data through the combination of the CDC organization code and the CDC participant code.
For the CCW, the linkage variable is a unique beneficiary identifier (BENE_ID). MDPP suppliers submit claims information for FFS beneficiaries to Medicare Administrative Contractors; once the claims are processed, the resolved claims are stored in the CCW under the BENE_ID. The CCW data for a beneficiary can be linked from the BENE_ID to a crosswalk between the BENE_ID and the corresponding MBI, and then to the Supplier Crosswalk.
The linked CCW–Supplier Crosswalk can then be linked to the DPRP data through a combination of the CDC organization code and the CDC participant code. Because the CCW only includes claims information for FFS beneficiaries, the linked DPRP–CCW dataset is limited to FFS beneficiaries.
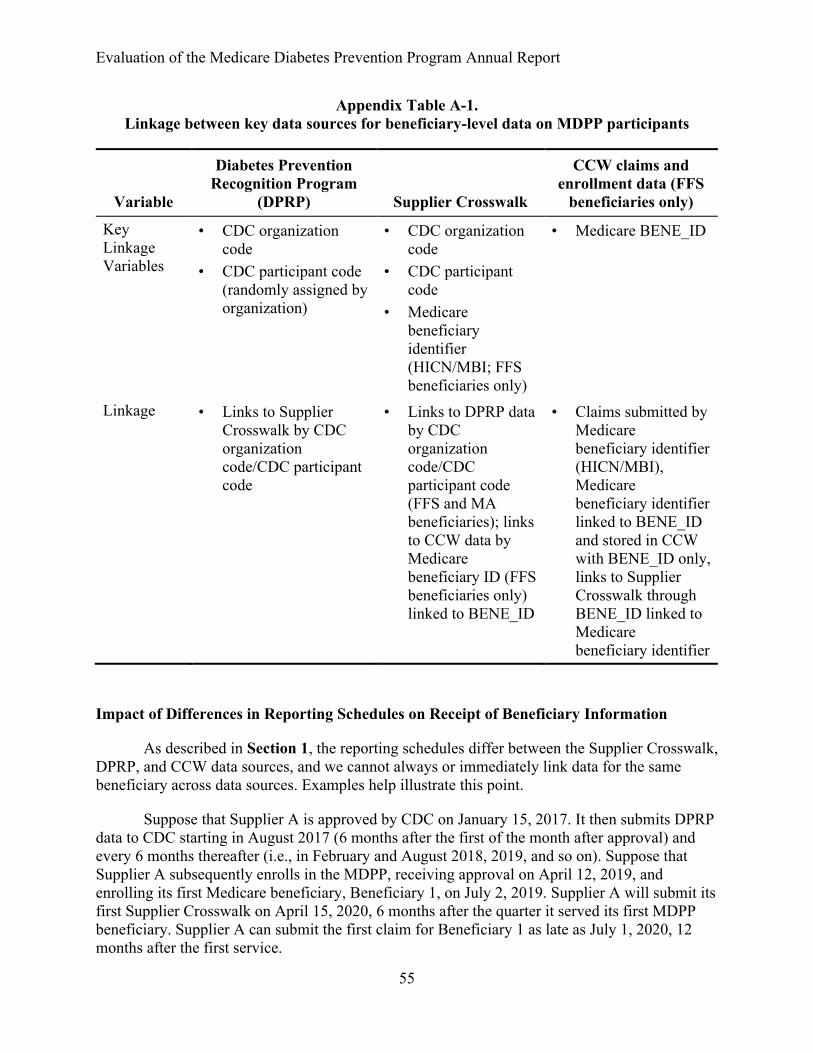
Evaluation of the Medicare Diabetes Prevention Program Annual Report
55
Appendix Table A-1. Linkage between key data sources for beneficiary-level data on MDPP participants
Variable
Diabetes Prevention Recognition Program
(DPRP) Supplier Crosswalk
CCW claims and enrollment data (FFS
beneficiaries only)
Key Linkage Variables
• CDC organization code
• CDC participant code (randomly assigned by organization)
• CDC organization code
• CDC participant code
• Medicare beneficiary identifier (HICN/MBI; FFS beneficiaries only)
• Medicare BENE_ID
Linkage • Links to Supplier Crosswalk by CDC organization code/CDC participant code
• Links to DPRP data by CDC organization code/CDC participant code (FFS and MA beneficiaries); links to CCW data by Medicare beneficiary ID (FFS beneficiaries only) linked to BENE_ID
• Claims submitted by Medicare beneficiary identifier (HICN/MBI), Medicare beneficiary identifier linked to BENE_ID and stored in CCW with BENE_ID only, links to Supplier Crosswalk through BENE_ID linked to Medicare beneficiary identifier
Impact of Differences in Reporting Schedules on Receipt of Beneficiary Information
As described in Section 1, the reporting schedules differ between the Supplier Crosswalk, DPRP, and CCW data sources, and we cannot always or immediately link data for the same beneficiary across data sources. Examples help illustrate this point.
Suppose that Supplier A is approved by CDC on January 15, 2017. It then submits DPRP data to CDC starting in August 2017 (6 months after the first of the month after approval) and every 6 months thereafter (i.e., in February and August 2018, 2019, and so on). Suppose that Supplier A subsequently enrolls in the MDPP, receiving approval on April 12, 2019, and enrolling its first Medicare beneficiary, Beneficiary 1, on July 2, 2019. Supplier A will submit its first Supplier Crosswalk on April 15, 2020, 6 months after the quarter it served its first MDPP beneficiary. Supplier A can submit the first claim for Beneficiary 1 as late as July 1, 2020, 12 months after the first service.
Evaluation of the Medicare Diabetes Prevention Program Annual Report
56
Beneficiary 1 will first appear in the DPRP data that RTI receives from CDC on September 30, 2019. Beneficiary 1 will first appear in the Supplier Crosswalk submitted on April 15, 2020. Beneficiary 1 may not appear in CCW claims data until July 1, 2020 (or even later because claims are not immediately processed and approved). Thus, Beneficiary 1 will appear in the DPRP data first, then the Supplier Crosswalk, and then the claims data. By the end of July or August 2020, Beneficiary 1 should appear in all three datasets.
Now consider a different beneficiary, Beneficiary 9, who first receives services from Supplier A on March 3, 2020. Beneficiary 9 will appear on the April 15, 2020, Supplier Crosswalk, but the beneficiary will not be included on the supplier’s DPRP submission until August 2020 and will not be submitted by CDC to RTI until September 2020. The claims for this patient may not be submitted for processing until as late as March 2, 2021. Thus, unlike the previous case, Beneficiary 9 will appear in the Supplier Crosswalk first, then the DPRP data, and then the claims data.
A third example may occur because, although suppliers can submit MDPP claims up to 12 months after the date of service, they have an obvious incentive—payment—to submit them earlier. Thus, an MDPP beneficiary may appear in the CCW claims data before appearing in the Supplier Crosswalk or DPRP data.

Evaluation of the Medicare Diabetes Prevention Program Annual Report
57
APPENDIX B: SUPPLIERS
In Section 2, we distinguish between MDPP supplier organizations and unique supplier locations. Examples of MDPP supplier organizations include health systems, health plans, health departments, YMCAs, foundations, and other health care or community organizations. These MDPP supplier organizations can have multiple locations, which are further designated as administrative locations or community locations. Each MDPP supplier organization is required to have at least one administrative location, which is “any physical location associated with the suppliers’ primary business operations” (CMS, 2019). An administrative location conducts the billing but may also deliver the program to beneficiaries. Suppliers are not required to have additional community locations, but many do to deliver the program to more beneficiaries across a broader geographic area.
Data Sources
MDPP Suppliers and Supplier Locations
The data used to report on suppliers and locations were drawn from the March 2, 2020, Supplier Enrollment Summary from CMS, which in turn includes data from Medicare’s Provider Enrollment, Chain, and Ownership System (PECOS). Potential suppliers use PECOS to enroll as an approved supplier of the MDPP. Suppliers must already have preliminary or full DPRP recognition from CDC before they can enroll.
Data from the PECOS spreadsheet in the Supplier Enrollment Summary provided a comprehensive list of organizations enrolled in Medicare and approved to offer the MDPP to eligible beneficiaries. The PECOS spreadsheet lists the PECOS Approval Date for each supplier organization, which allows us to illustrate the month-to-month increases in MDPP supplier organizations since the program’s launch on April 1, 2018. The PECOS spreadsheet also provides data on how many administrative locations and community locations were managed by each organization, allowing us to calculate the number of MDPP locations added each month.
Although suppliers separately list administrative and community locations in their application to Medicare, the distinction is less important in practice. Each MDPP supplier organization must have at least one administrative location, but it does not need to list any separate community locations. Most MDPP suppliers have one administrative location and list no separate community locations. We assume that these suppliers provide services at the administrative location. Other suppliers with one administrative location list separate community locations, with the number of community locations ranging from 1 to 140.
Meanwhile, a small group of organizations have more than one administrative location. Most of these suppliers do not list separate community locations, and we assume that they provide services at each of their administrative locations. These MDPP supplier organizations can conduct billing and deliver the program at each of their many administrative locations, which may better suit their structure and billing practices.
Finally, a small number of suppliers list an administrative and a community location at the same address, and a few suppliers list two locations that are very close to each other (e.g., the

Evaluation of the Medicare Diabetes Prevention Program Annual Report
58
same street address but a different suite number; two locations within a half mile). After accounting for duplicate addresses and suppliers that have two locations within a half mile, we identified 762 unique locations (about 5% less than the 798 sum of administrative and community locations).
Beneficiary Access to Suppliers
Location data from the Supplier Enrollment Summary were combined with county and zip codes for FFS MDPP beneficiaries in the Supplier Crosswalk to determine the distance that beneficiaries traveled to their MDPP supplier. County and zip codes for the FFS MDPP beneficiaries came from CCW enrollment files, and distances were calculated from a beneficiary’s zip code centroid to the supplier’s zip code centroid.
Supplier Implementation
To better understand how suppliers implement MDPP, RTI conducted a qualitative study of 10 MDPP suppliers representing various types of organizations in different settings across the country. We created semi-structured interview guides to identify implementation strategies and program characteristics that facilitate recruitment, enrollment, and retention in MDPP. We conducted two interviews with each supplier: one interview with program administration staff and one interview with a lifestyle coach. We used a multistep coding scheme and QSR NVivo 11.0 software to analyze the interviews.

Evaluation of the Medicare Diabetes Prevention Program Annual Report
59
APPENDIX C: BENEFICIARIES
Supplier Crosswalk
This section describes the details of the number of participants from the Supplier Crosswalk over the first five quarters of the MDPP performance. Results include the number of suppliers submitting crosswalks and the number of beneficiaries submitted over time.
Appendix Table C-1 defines the quarters used in the subsequent analyses for the Supplier Crosswalk. The dates covered in each quarter varies depending on whether the supplier is submitting a crosswalk for the first time or not. Once a supplier furnishes MDPP services for 6 months, the supplier should submit a crosswalk file on the quarterly due dates. In the initial crosswalk file, MDPP suppliers include all beneficiaries to whom they have furnished MDPP services by the end of the month before the first submission due date. After submission of the initial crosswalk file, all MDPP suppliers should continue to submit an updated crosswalk file with any new beneficiaries appended to the previous list at each of the quarterly due dates.
Appendix Table C-1 Crosswalk submission dates for new and existing suppliers, by quarter
Quarter Submission date New supplier submission:Date of first MDPP session
Existing supplier submission:
Dates included in ongoing quarterly
submission
1 January 15, 2019 Between 4/1/2018 and 6/30/2018 NA2 April 15, 2019 Between 7/1/2018 and 9/30/2018 1/1/2019–3/31/20193 July 15, 2019 Between 10/1/2018 and 12/31/2018 4/1/2019–6/30/20194 October 15, 2019 Between 1/1/2019 and 3/31/2019 7/1/2019–9/30/20195 January 15, 2020 Between 4/1/2019 and 6/30/2019 10/1/2019–12/31/2019
NOTE: Initial submissions are not due until suppliers have had beneficiaries participating for 6 months. Their submissions are due on the next due date after the 6-month period has passed.
SOURCE: Guidance to Maintain the MDPP Crosswalk File
MDPP suppliers are asked to register with RTI prior to their Supplier Crosswalk submission date; they then receive instructions for submitting the data through a secure transfer protocol. As of the end of the fifth quarter (December 2019), 86 suppliers were registered with RTI (Appendix Table C-2). Suppliers began to register at an increasing pace from the third through fifth quarters. A supplier can register with RTI at any time, but they are not required to submit a crosswalk until they have had an MDPP beneficiary participating for at least 6 months. Although suppliers are required to submit a crosswalk every quarter, they do not always have new beneficiaries. Suppliers may enroll beneficiaries on a rolling basis or at specific times throughout the year. As of Quarter 5, 56 of the 86 suppliers had submitted data on new beneficiaries for the most-recent quarter. The percentage of registered suppliers who submitted

Evaluation of the Medicare Diabetes Prevention Program Annual Report
60
data on new beneficiaries in their crosswalk declined from 75% to near 65% from Quarter 1 to Quarter 5.
Appendix Table C-2 Number of suppliers registered and submitted per quarter
QuarterCumulative number of
suppliers registered with RTINumber of suppliers who submitted crosswalks with new beneficiaries
1 20 152 41 303 51 294 63 415 86 56
NOTE: The number of suppliers who submitted Supplier Crosswalks with new beneficiaries is defined as a supplier that had an increase in MA beneficiaries or FFS beneficiaries between the current and preceding quarter. Quarter numbers are defined in Appendix Table C-1.SOURCE: RTI analysis of Supplier Crosswalk data
Number of Beneficiaries
Suppliers reported 1,095 unique FFS beneficiaries and 1,153 unique MA beneficiaries for 2,248 beneficiaries served by MDPP through the end of December 2019. The number of beneficiaries steadily increased from 149 total beneficiary reported in the January 2019 crosswalk to 2,248 through the January 2020 crosswalk. (Appendix Table C-3).
Appendix Table C-3 Number of beneficiaries beginning their MDPP services by quarter
Crosswalk Submission date FFS beneficiaries (%) MA beneficiaries (%) Total beneficiaries
(%)
January 2019 97 (8.9%) 52 (4.5%) 149 (6.6%)April 2019 354 (32.3%) 208 (18.0%) 562 (25.0%)July 2019 181 (16.5%) 346 (30.0%) 527 (23.4%)October 2019 201 (18.4%) 218 (18.9%) 419 (18.6%)January 2020 262 (23.9%) 329 (28.5%) 591 (26.3%)Total 1,095 (100.0%) 1,153 (100.0%) 2,248 (100.0%)
NOTE: Table includes all beneficiaries who were submitted in the Supplier Crosswalk. Not all beneficiaries submitted in the Supplier Crosswalk can be matched to Medicare enrollment and claims data in the CCW (N = 1,083 FFS beneficiaries matched, and two dropped due to having no FFS eligibility in the post period [N = 1,081]) or to the DPRP data (N = 1,419 beneficiaries matched). Percentages may not sum to 100% because of rounding.SOURCE: RTI analysis of Supplier Crosswalk

Evaluation of the Medicare Diabetes Prevention Program Annual Report
61
Supplier Crosswalk Data Matching
Of the 1,095 unique FFS beneficiary identifiers (HIC/MBI) submitted in the Supplier Crosswalk, 1,083 matched to the Medicare enrollment data from the CCW. Twelve beneficiaries were not matched to available CCW Medicare identifiers, and two were dropped for not having FFS eligibility in the post period. The final sample size for claims analysis was 1,081. We are currently following up with suppliers regarding correcting these non-matches.
DPRP Data
We received three deliveries of DPRP data from CDC on September 30, 2019; January 28, 2020; and April 29, 2020. The session dates range from April 2018 to February 2020. Although the Supplier Crosswalk provides our best estimate of the number of beneficiaries who have participated in MDPP and allows us a link to other datasets, it does not provide any detailed information regarding program attendance or outcomes for beneficiaries. The DPRP dataset from CDC provides beneficiary-level information on session attendance, weight loss, and demographics. The Supplier Crosswalk provides identifiers to link CCW enrollment and claims data on FFS beneficiaries to the DPRP data. As described in Section 1, differences in reporting schedules between the data sources mean that beneficiaries in one dataset cannot always be matched to their corresponding information in another dataset. For example, of the 2,248 beneficiary CDC identifiers submitted in the Supplier Crosswalk through the fifth quarterly submission, only 1,419 (63%) matched to beneficiaries in the DPRP data. These numbers are expected to increase in subsequent quarters as we receive additional DPRP data.
DPRP Analytic Methods
Section 1 describes the reporting schedule for suppliers. First, we cleaned the three datasets and combined them such that any duplicate sessions among organization, participant identifier, session date, and session type were removed, retaining data from the most-recent file for that session.
Additionally, the first delivery did not include data on ethnicity. We could overcome this absence for beneficiaries who also had sessions—and ethnicity data—in the second or third data deliveries, but we had to leave the ethnicity variable missing for beneficiaries who were only included in the first delivery.
Data from the DPRP database were included in the analysis for beneficiaries whose first session was on or after April 1, 2018, the day MDPP approved services began. We performed the following data cleaning steps on the DPRP data:
1. Beneficiaries who had any sessions before April 1, 2018, were not included in the analysis (N = 79).
2. Beneficiaries who had a body mass index (BMI) below 23 at their first session were not included. A BMI of at least 23 is required to be eligible for the MDPP (N = 8).
3. We did not include beneficiaries if their associated supplier’s organizational code was not included in the list of approved MDPP suppliers maintained by CMS (N = 30). Although not all MDPP suppliers submitted a crosswalk as of December 31, 2019, we

Evaluation of the Medicare Diabetes Prevention Program Annual Report
62
only included DPRP data for suppliers who were approved to participate in the MDPP.
4. We excluded participants who could not be matched to Supplier Crosswalk participants (N = 722). This represents approximately 32% of all participants in DPRP data deliveries.
5. For sessions within 21 days of each other, we replaced any session weight that increased or decreased by more than 10% from the previous session with the beneficiary’s previous session weight (N = 4). In addition, we replaced any missing weight with the last measured weight of the beneficiary (N = 273).
After data cleaning, the final DPRP sample size included in the analysis was 1,419 beneficiaries. Appendix Figure C-1 diagrams the data cleaning steps outlined above. The figure also includes the final sample size for FFS and MA beneficiaries.
Appendix Figure C-1 DPRP beneficiary sample size after exclusions applied
SOURCE: RTI analysis of Supplier Crosswalk data; DPRP data

Evaluation of the Medicare Diabetes Prevention Program Annual Report
63
Overall, prior to matching, the DPRP database includes records for 2,258 beneficiaries. After exclusions for session date (n = 79), MDPP approved supplier (n = 30), and starting BMI (N = 8) and after excluding those who did not match an identifier in the Supplier Crosswalk (n = 722), we are left with 1,419 matched to Supplier Crosswalk participants and included in analysis. As discussed in Section 1, the reporting schedules for suppliers differ between the Supplier Crosswalk and the DPRP dataset. Consequently, MDPP beneficiaries may appear only in the Supplier Crosswalk, in both the Supplier Crosswalk and the DPRP data, or only in the DPRP data. We are most confident that matched beneficiaries are true MDPP beneficiaries because suppliers have definitively listed them as MDPP beneficiaries in the Supplier Crosswalk. We expect that most of the beneficiaries only found in the DPRP data (n = 722) will eventually be matched on future Supplier Crosswalk submissions, but some of them may be incorrectly listed with Medicare as their payer in the DPRP data.
Appendix Table C-4 shows the overlap between beneficiaries submitted in the Supplier Crosswalk and those found in the DPRP data. The total potential number of beneficiaries from both the crosswalk and the DPRP is 2,962 beneficiaries. Suppliers that submitted both datasets may have had all, some, or none of their beneficiaries’ match between the two datasets.
Of the 67 suppliers that submitted a crosswalk and DPRP data, 64 had at least one beneficiary match between datasets, 11 suppliers matched 100%, and three organizations had zero matches. Five organizations submitted Supplier Crosswalks to RTI, covering 431 beneficiaries, but have not appeared in DPRP data received by RTI. Forty-nine organizations submitted DPRP data to CDC, covering 433 beneficiaries, but have not yet submitted a crosswalk to RTI. Across all suppliers, 821 beneficiaries were in Supplier Crosswalks only, and 722 beneficiaries were in the DPRP data only.
Appendix Table C-4 Overview of beneficiaries by organization subset
Organization and submission status
Beneficiaries matched in crosswalk and DPRP
Beneficiaries in Supplier Crosswalk only, not
DPRP
Beneficiaries in DPRP
onlyRow total
Organizations submitting Supplier Crosswalk and DPRP (N = 67)
1,419 390 289 2,098
Organizations submitting Supplier Crosswalk only (N = 5)
0 431 0 431
Organizations submitting DPRP only (N = 49)
0 0 433 433
Column total 1,419 821 722 2,962SOURCE: RTI analysis of Supplier Crosswalk data; DPRP data

Evaluation of the Medicare Diabetes Prevention Program Annual Report
64
NOTE: DPRP counts exclude data on 117 beneficiaries who were removed in data cleaning step. Table C-4 represents the number of unique participant codes submitted by suppliers to RTI Supplier Crosswalk and CDC DPRP. The total number of Supplier Crosswalk participants in this table are fewer than the sum of Fee-for-Service (FFS) and Medicare Advantage (MA) beneficiaries due to several participants who were submitted as both FFS and MA.
Cohort Construction. We calculated quarterly groups for participants in the program using the individual beneficiary’s first session date and the organization’s final session date. This standardizes the cohorts to allow for comparison based on the individual’s first session date, but not constraining the end date to the individual. Therefore, the cohorts are constructed to show that the individual could have attended classes for 0–3, 4–6, 7–9, 10–12, or 12+ months.
Fee-for-Service and Medicare Advantage. A small number of beneficiaries were submitted as both FFS and MA at different times. These beneficiaries are presented as FFS in this analysis.
Session Definitions. To determine the first session for a beneficiary, we used the session with the earliest date. We then assumed that the remaining sessions were sequentially ordered by date.
Length of Enrollment. Length of enrollment, in days, was calculated using the beneficiary’s last session date minus the beneficiary’s first session date plus 1.
Additional Results Tables
Appendix Table C-5 Summary statistics for average weight loss for beneficiaries, by session
Session Sample size Average % weight loss
1 1419 N/A2 1360 0.67%3 1331 1.20%4 1293 1.60%5 1248 1.95%6 1206 2.42%7 1163 2.77%8 1142 3.14%9 1119 3.43%10 1090 3.86%11 1047 4.13%12 1005 4.46%13 960 4.79%
(continued)

Evaluation of the Medicare Diabetes Prevention Program Annual Report
65
Appendix Table C-5 (continued) Summary statistics for average weight loss for beneficiaries, by session
Session Sample size Average % weight loss
14 925 5.10%15 876 5.47%16 828 5.76%17 755 6.15%18 670 6.50%19 586 6.85%20 486 7.21%21 408 7.19%22 339 7.62%23 264 7.84%24 206 8.17%25 158 8.00%26 114 7.58%27 72 8.11%28 55 8.15%29 40 8.34%30 26 9.10%31 16 7.51%32 10 8.78%33 5 6.91%34 5 6.92%35 4 6.73%36 4 7.35%37 2 6.23%
SOURCE: RTI analysis of Supplier Crosswalk data; DPRP data
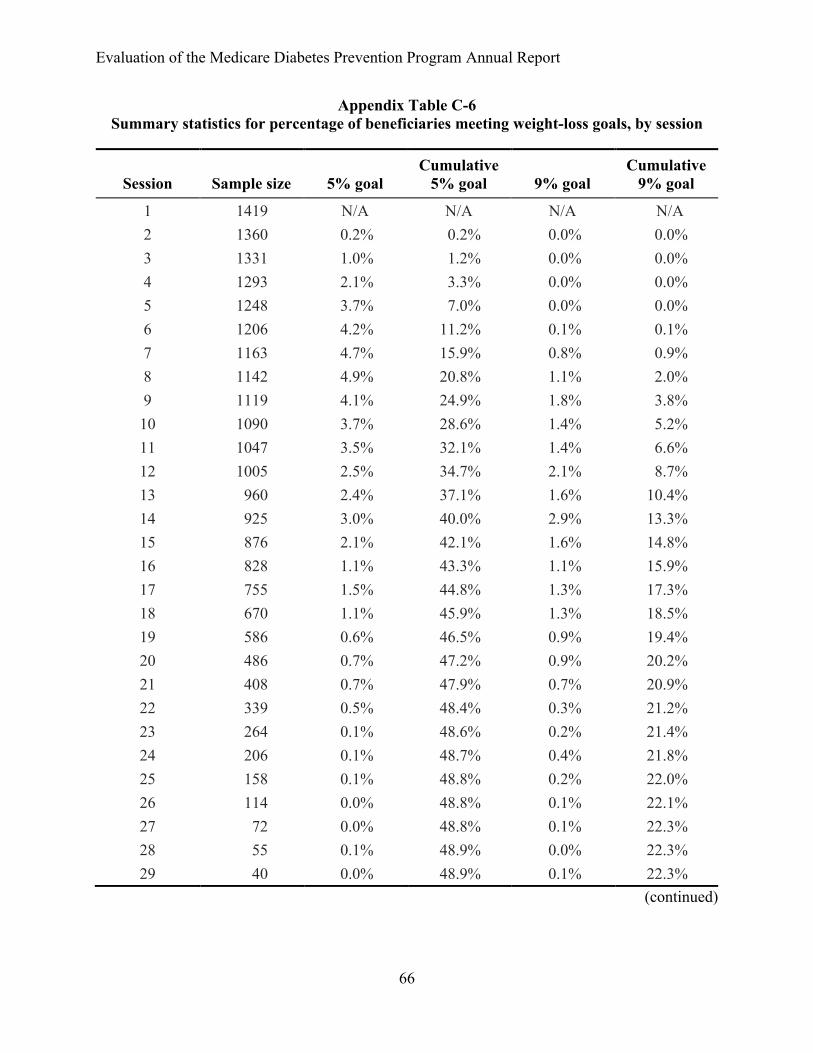
Evaluation of the Medicare Diabetes Prevention Program Annual Report
66
Appendix Table C-6 Summary statistics for percentage of beneficiaries meeting weight-loss goals, by session
Session Sample size 5% goalCumulative
5% goal 9% goalCumulative
9% goal
1 1419 N/A N/A N/A N/A2 1360 0.2% 0.2% 0.0% 0.0%3 1331 1.0% 1.2% 0.0% 0.0%4 1293 2.1% 3.3% 0.0% 0.0%5 1248 3.7% 7.0% 0.0% 0.0%6 1206 4.2% 11.2% 0.1% 0.1%7 1163 4.7% 15.9% 0.8% 0.9%8 1142 4.9% 20.8% 1.1% 2.0%9 1119 4.1% 24.9% 1.8% 3.8%10 1090 3.7% 28.6% 1.4% 5.2%11 1047 3.5% 32.1% 1.4% 6.6%12 1005 2.5% 34.7% 2.1% 8.7%13 960 2.4% 37.1% 1.6% 10.4%14 925 3.0% 40.0% 2.9% 13.3%15 876 2.1% 42.1% 1.6% 14.8%16 828 1.1% 43.3% 1.1% 15.9%17 755 1.5% 44.8% 1.3% 17.3%18 670 1.1% 45.9% 1.3% 18.5%19 586 0.6% 46.5% 0.9% 19.4%20 486 0.7% 47.2% 0.9% 20.2%21 408 0.7% 47.9% 0.7% 20.9%22 339 0.5% 48.4% 0.3% 21.2%23 264 0.1% 48.6% 0.2% 21.4%24 206 0.1% 48.7% 0.4% 21.8%25 158 0.1% 48.8% 0.2% 22.0%26 114 0.0% 48.8% 0.1% 22.1%27 72 0.0% 48.8% 0.1% 22.3%28 55 0.1% 48.9% 0.0% 22.3%29 40 0.0% 48.9% 0.1% 22.3%
(continued)

Evaluation of the Medicare Diabetes Prevention Program Annual Report
67
Appendix Table C-6 (continued) Beneficiaries meeting weight-loss goals, by session
Session Sample size 5% goalCumulative
5% goal 9% goalCumulative
9% goal
30 26 0.0% 48.9% 0.0% 22.3%31 16 0.0% 48.9% 0.0% 22.3%32 10 0.0% 48.9% 0.0% 22.3%33 5 0.0% 48.9% 0.0% 22.3%34 5 0.0% 48.9% 0.0% 22.3%35 4 0.0% 48.9% 0.0% 22.3%36 4 0.0% 48.9% 0.0% 22.3%37 2 0.0% 48.9% 0.0% 22.3%
NOTE: The denominator for the 5% and 9% goals is the total number of participants in the program (N = 1,419). The denominator for the cumulative goal is also the total number of participants in the program (N = 1,419).
SOURCE: RTI analysis of Supplier Crosswalk data; DPRP data

Evaluation of the Medicare D
iabetes Prevention ProgramA
nnual Report
68
Appendix Table C-7. National DPP and MDPP comparison: Percentage weight change by sessions attended and months in the program
The percentage weight change by session and time was comparable across MDPP and the National DPP 65 and older cohort
Source Medicare DPP (MDPP) National DPP (Ely et al., 2017)
Sessions 2–16 sessions attended 17+ session attended 2–16 sessions attended 17+ session attended
Time period
1–6 Months
7–12 Months 1–6 Months
7–12 Months
1–6 Months
7–12 Months
1–6 Months
7–12 Months
N 289 134 69 329 *1,764 *363 *71 *1,164Weight change (%) −2.6 −2.2 −5.4 −7.0 −2.4 −3.5 −6.1 −6.4
Note: MDPP data and National DPP data are based on individual session start date and last supplier organization session date.*Estimated based on Table 1 percentage of 65+ (24.2%) in Ely et al., 2017.
SOURCE: RTI analysis of Supplier Crosswalk data; DPRP data; Source (Ely et al., 2017)

Evaluation of the Medicare Diabetes Prevention Program Annual Report
69
Appendix Table C-8 Summary statistics for physical activity (PA) for beneficiaries, by session
Session
# Beneficiaries with
nonmissing PA
# Beneficiaries with PA ≥ 150
minutes
% Beneficiaries reporting PA
minutes
% Beneficiaries meeting PA
goal*
1 545 111 38.4% 20.4%2 802 389 59.0% 48.5%3 939 521 70.5% 55.5%4 1112 666 86.0% 59.9%5 1130 705 90.5% 62.4%6 1160 770 96.2% 66.4%7 1116 760 96.0% 68.1%8 1106 749 96.8% 67.7%9 1096 741 97.9% 67.6%10 1056 707 96.9% 67.0%11 1012 688 96.7% 68.0%12 980 676 97.5% 69.0%13 930 651 96.9% 70.0%14 887 637 95.9% 71.8%15 839 592 95.8% 70.6%16 801 597 96.7% 74.5%17 726 527 96.2% 72.6%18 641 476 95.7% 74.3%19 555 419 94.7% 75.5%20 466 351 95.9% 75.3%21 396 301 97.1% 76.0%22 329 251 97.1% 76.3%23 258 196 97.7% 76.0%24 198 154 96.1% 77.8%25 151 117 95.6% 77.5%26 108 86 94.7% 79.6%27 69 54 95.8% 78.3%28 52 43 94.5% 82.7%29 38 32 95.0% 84.2%
(continued)

Evaluation of the Medicare Diabetes Prevention Program Annual Report
70
Appendix Table C-8 (continued) Summary statistics for physical activity (PA) for beneficiaries, by session
Session
# Beneficiaries with
nonmissing PA
# Beneficiaries with PA ≥ 150
minutes
% Beneficiaries reporting PA
minutes
% Beneficiaries meeting PA
goal*
30 26 20 100.0% 76.9%31 14 10 87.5% 71.4%32 9 6 90.0% 66.7%33 4 3 80.0% 75.0%34 4 4 80.0% 100.0%35 4 3 100.0% 75.0%36 4 4 100.0% 100.0%37 2 2 100.0% 100.0%
Note: *As share of beneficiaries with non-missing PA
SOURCE: RTI analysis of Supplier Crosswalk data; DPRP data

Evaluation of the Medicare Diabetes Prevention Program Annual Report
71
APPENDIX D: METHODS: FFS CLAIMS ANALYSIS
Data Sources
MDPP Supplier Crosswalk—MDPP suppliers submit a list of Medicare Beneficiary Identifiers (MBIs) for each beneficiary who receives MDPP services. This crosswalk is updated quarterly and submitted to CMS and RTI. The January 15, 2020, Supplier Crosswalk encompassed the most-recent list of MDPP beneficiaries available for inclusion in this report.
Medicare data—We used Medicare Master Beneficiary Summary File, claims data, and chronic conditions file provided by CMS in the CCW. The Medicare data in the CCW include (1) denominator information, which indicates the number of beneficiaries alive; (2) enrollment information, which indicates the number of days that beneficiaries were enrolled in Medicare during the period; (3) the claims experience for each beneficiary; and (4) indicators for whether beneficiaries have common chronic conditions. We used both Part A and Part B claims to create claims-based outcome measures. We used Medicare data from April 1, 2015, through September 30, 2019.
Data Linkage
The Supplier Crosswalk includes MDPP beneficiaries’ Medicare Health Insurance Claim Number (HICN) or MBI. We used the CCW HICN/MBI to CCW BENE_ID crosswalks to assign each HICN/MBI its BENE_ID. We then linked the Supplier Crosswalk data to the Medicare claims data using the BENE_ID.
Outcomes Measure Specifications
For this report, we present baseline descriptive estimates for Medicare FFS beneficiaries for several outcomes: total expenditures, inpatient admissions, ED visits not leading to hospitalization, primary care visits, and specialty care visits. Admission and visit outcomes represent the mean number of events per 100 beneficiaries. We included events in a baseline year’s total if the discharge or service date on the claim was during that 12-month period. Measures only included eligible beneficiaries during a given baseline year. Therefore, some beneficiaries are not observed in each of the 3 baseline years.
Additionally, because some individuals were not enrolled in Medicare FFS throughout the entirety of each year, we calculated eligibility fractions for each beneficiary. The eligibility fraction is defined as the total number of months the beneficiary was enrolled in each year divided by the total number of months in a year. For example, a beneficiary enrolled in Medicare FFS for 6 months of a year has an eligibility fraction of 0.5 for that year. In the calculation of weighted average outcomes, the eligibility fractions downweight observations for beneficiaries who are not eligible for the full year because there is greater uncertainty about the information, so the observations exert less influence on the analyses.
Total expenditures: We defined expenditures as FFS payments made by Medicare. This represents overall net payment amounts from all inpatient and outpatient (facility and professional) claims (i.e., Part A and Part B); this excludes member cost sharing and pharmacy

Evaluation of the Medicare Diabetes Prevention Program Annual Report
72
component expenditures (i.e., Part D for Medicare). We calculated PBPM expenditures. We annualized total costs by dividing total costs for each beneficiary in each year by that beneficiary’s eligibility fraction. We did not risk adjust or price standardize payments across geographic areas. We set negative payments on claims to zero.
Number of inpatient admissions: This is a count of admissions to an acute care hospital reported in the inpatient file per beneficiary for the year. We identified all hospital admissions in which the last four digits of the provider values were 0001 through 0879 (acute inpatient) or 1300 through 1399 (critical access hospitals). We did not annualize inpatient admissions.
Number of ED visits not leading to hospitalization: This is a count of the number of visits to the ED that did not result in an inpatient hospital admission and the number of observation stays per beneficiary per year. We annualized counts of ED visits by dividing the number of ED visits for each beneficiary in each year by that beneficiary’s eligibility fraction. We then rounded the number of ED visits to the nearest integer. We identified ED visits in the claims files as visits with a line item revenue center code of 0450 through 0459 or 0981 (ED care). We excluded claims where every line item of the ED claim has a procedure code of 70000 through 89999. This criterion excludes claims for radiological or pathology/laboratory services only. For all data sources, we identified observation stays in the claims files as visits with a line item revenue center code of 0762 (treatment or observation room). We counted multiple ED visits or observation stays in a single day as one visit.
Number of primary care visits: This is a count of the number of visits to primary care providers per beneficiary per year. We annualized counts of primary care visits by dividing the number of visits for each beneficiary in each year by that beneficiary’s eligibility fraction. We then rounded the number of visits to the nearest integer. We identified primary care visits in the carrier and outpatient claims files if a line item had a Healthcare Common Procedure Coding System (HCPCS) or revenue center code in the 2016 Healthcare Effectiveness Data and Information Set (HEDIS) value sets for ambulatory visits or other ambulatory visits. We used HEDIS HCPCS and revenue center codes because HEDIS is a reliable source for operationalizing common health care outcomes in claims data. We used the Medicare provider specialty variable to identify ambulatory visits to primary care provider specialties, which included general practice, internal medicine, geriatric medicine, family practice, pediatrics, preventive medicine, nurse practitioner, clinical nurse specialist, and physician assistant. We counted multiple primary care visits in a single day as one visit.
Number of specialty care visits: This is a count of the number of visits to specialty care providers per beneficiary per year. We annualized counts of specialty care visits by dividing the number of visits for each beneficiary in each year by that beneficiary’s eligibility fraction. We then rounded the number of visits to the nearest integer. We identified specialty care visits in the carrier and outpatient claims files if a line item had an HCPCS or revenue center code in the 2016 HEDIS value sets for ambulatory visits or other ambulatory visits. We counted multiple specialty care visits in a single day as one visit. We used the Medicare provider specialty variable to identify ambulatory visits to specialty care provider specialties (available upon request).

Evaluation of the Medicare Diabetes Prevention Program Annual Report
73
APPENDIX E: DIABETES INDICATOR FLAGS IN THE CCW
One issue that may affect the selection of a comparison group for our analysis is that some MDPP FFS beneficiaries have CCW indicator flags for previous diabetes. To be eligible for the MDPP, a beneficiary must have a clinical laboratory test indicating blood glucose or HbA1c in the prediabetes range and must not have previously diagnosed diabetes. MDPP suppliers receive test results and rely on referral sources or beneficiary self-report for information about previous diabetes diagnoses. Suppliers generally do not have access to medical records or claims history when determining whether a beneficiary has previously had a diagnosis of diabetes.
The CCW contains indicator flags for diabetes based on a claims-based algorithm that examines ICD-10 diagnosis codes on submitted Medicare claims (Hebert et al., 1999). Using these indicators (see methods below), we found that 16% of MDPP FFS beneficiaries had the diabetes indicator flag in 2018 (indicator flags for 2019 are not yet available), and another 8% of beneficiaries had an indicator flag for diabetes in a previous year. This combined percentage of 24% is somewhat lower than in the Y-USA DPP model test, where the percentage of Medicare beneficiaries with any previous diabetes indicator flag was 30% (Centers for Medicare & Medicaid Services, 2020).
The claims-based algorithm for diabetes is not perfect: it misses some beneficiaries who have diabetes (i.e., false negatives) and it yields false positives in some beneficiaries who do not have diabetes. In an earlier study of Medicare beneficiaries, researchers found that the algorithm had a positive predictive value of 88%, meaning that 88 people of 100 with the indicator flag do have diabetes, and 12 of 100 with the indicator do not have diabetes (i.e., false positives) (McBean, Li, Gilbertson, & Collins, 2004).
We will continue to monitor the CCW flags during the evaluation, and we will assess whether the flags have any implications for our selection of a comparison group and our analyses of spending and utilization. In the Y-USA DPP model test, we performed a sensitivity analysis of spending that excluded beneficiaries with a previous diabetes flag. The results for the sensitivity analysis were similar to the results for the main analysis, which included all participants (Alva et al., 2017).Methods for Identifying MDPP FFS Beneficiaries with Diabetes
The CCW contains indicator flags for diabetes based on a claims-based algorithm that examines ICD-10 diagnosis codes on submitted Medicare claims (Hebert et al., 1999). To identify potential existing cases of diabetes, we merged MDPP FFS beneficiaries reported by suppliers in the January 15, 2020, Supplier Crosswalk with the 2018 CCW’s Chronic Conditions file. We found that 98% of the MDPP FFS beneficiaries were present in the 2018 file. Additional beneficiaries will be included in the 2019 file, which will be finalized in January 2021 once all claims from 2019 are incorporated.
The CCW chronic conditions file uses inpatient, outpatient, skilled nursing facility, and home health claims from the past 2 years to flag chronic conditions like diabetes using an algorithm (Chronic Conditions Data Warehouse, 2020) that relies on diagnosis codes from Medicare claims. In general, cases of diabetes are flagged when a minimum number of claims

Evaluation of the Medicare Diabetes Prevention Program Annual Report
74
are found with ICD-10 diagnosis codes using the prefixes E08, E09, E10, E11, and E13. Prefixes E10 (type 1 diabetes) and E11 (type 2 diabetes) flagged most of the diabetes cases (97%).5
In addition to flagging cases of diabetes from the 2-year lookback period, the 2018 Chronic Conditions File also includes a diabetes ever indicator for identifying beneficiaries that were flagged for diabetes in any previous Chronic Condition File back to the 1999 file. If an MDPP FFS beneficiary was not flagged in the 2018 file, they may still have been flagged in previous years’ files.
5 In our analysis of MDPP FFS beneficiaries from January 1, 2016, to January 1, 2018, prefixes E08 (diabetes due to underlying condition), E09 (drug or chemical induced diabetes), and E13 (other specified diabetes) represented less than 3% of beneficiaries with a diabetes flag when used alone to identify cases. Therefore, these transitory and rare cases of diabetes (E08, E09, and E13) do not account for many of the MDPP beneficiaries flagged as having diabetes.