evaluation of the need for fish passage at the arizona ... · at the arizona public service and...
TRANSCRIPT

FINAL REPORT
Evaluation of the Need for Fish Passage at the Arizona Public Service and Fruitland Irrigation Diversion Structures
October 2005
Grant Agreement No. 04-FG-40-2160PR 948-1
Prepared by:
Melissa Stamp and Michael Golden, BIO-WEST, Inc., and R. Craig Addley, Watershed Systems Group, Inc.
Submitted to:
San Juan River Basin Recovery Implementation ProgramMr. Mark McKinstryU.S. Bureau of Reclamation125 South State Street Room 6103Salt Lake City, UT 84138-1102
Submitted by:
BIO-WEST, Inc.1063 West 1400 NorthLogan, UT 84321-2291


BIO-WEST, Inc. Final ReportOctober 2005 APS and Fruitland Diversion Evaluationi
TABLE OF CONTENTS
1. INTRODUCTION . . . . . . . . . . . . . . . . . . . . . . . . . . . . . . . . . . . . . . . . . . . . . . . . . . . . . . . . . . . . . . 1Purpose and Need . . . . . . . . . . . . . . . . . . . . . . . . . . . . . . . . . . . . . . . . . . . . . . . . . . . . . . . . 1Goals and Objectives . . . . . . . . . . . . . . . . . . . . . . . . . . . . . . . . . . . . . . . . . . . . . . . . . . . . . . 1
2. METHODS . . . . . . . . . . . . . . . . . . . . . . . . . . . . . . . . . . . . . . . . . . . . . . . . . . . . . . . . . . . . . . . . . . . 3Hydrodynamic Model Development . . . . . . . . . . . . . . . . . . . . . . . . . . . . . . . . . . . . . . . . . . . 3
Detailed Topographic Surveys . . . . . . . . . . . . . . . . . . . . . . . . . . . . . . . . . . . . . . . . . 3Substrate and Riparian Mapping . . . . . . . . . . . . . . . . . . . . . . . . . . . . . . . . . . . . . . . 3Water Surface Profile and Discharge Measurements . . . . . . . . . . . . . . . . . . . . . . . . 5Water Surface and Velocity Modeling . . . . . . . . . . . . . . . . . . . . . . . . . . . . . . . . . . . . 7
Fish Passage Criteria . . . . . . . . . . . . . . . . . . . . . . . . . . . . . . . . . . . . . . . . . . . . . . . . . . . . . . 10Hydrology . . . . . . . . . . . . . . . . . . . . . . . . . . . . . . . . . . . . . . . . . . . . . . . . . . . . . . . . . . . . . . 10Fruitland Diversion Maintenance Information . . . . . . . . . . . . . . . . . . . . . . . . . . . . . . . . . . 11
3. RESULTS . . . . . . . . . . . . . . . . . . . . . . . . . . . . . . . . . . . . . . . . . . . . . . . . . . . . . . . . . . . . . . . . . . . 12Description of APS Diversion . . . . . . . . . . . . . . . . . . . . . . . . . . . . . . . . . . . . . . . . . . . . . . . 12Description of Fruitland Diversion . . . . . . . . . . . . . . . . . . . . . . . . . . . . . . . . . . . . . . . . . . . 12
Physical Structure . . . . . . . . . . . . . . . . . . . . . . . . . . . . . . . . . . . . . . . . . . . . . . . . . . 12Maintenance Practices . . . . . . . . . . . . . . . . . . . . . . . . . . . . . . . . . . . . . . . . . . . . . . 18
Fish Passage Criteria . . . . . . . . . . . . . . . . . . . . . . . . . . . . . . . . . . . . . . . . . . . . . . . . . . . . . . 19Review of Literature on Swimming Abilities . . . . . . . . . . . . . . . . . . . . . . . . . . . . . . 19Recapture Data . . . . . . . . . . . . . . . . . . . . . . . . . . . . . . . . . . . . . . . . . . . . . . . . . . . . 21Depth and Vertical Drop Data . . . . . . . . . . . . . . . . . . . . . . . . . . . . . . . . . . . . . . . . . 24
4. MODELING RESULTS . . . . . . . . . . . . . . . . . . . . . . . . . . . . . . . . . . . . . . . . . . . . . . . . . . . . . . . . . . 25Fruitland Diversion . . . . . . . . . . . . . . . . . . . . . . . . . . . . . . . . . . . . . . . . . . . . . . . . . . . . . . . 25
Analysis Techniques . . . . . . . . . . . . . . . . . . . . . . . . . . . . . . . . . . . . . . . . . . . . . . . . 25Depth and Velocity Conditions . . . . . . . . . . . . . . . . . . . . . . . . . . . . . . . . . . . . . . . . 28Potential Effects of Maintenance Practices . . . . . . . . . . . . . . . . . . . . . . . . . . . . . . . 38
Model Results: APS Weir . . . . . . . . . . . . . . . . . . . . . . . . . . . . . . . . . . . . . . . . . . . . . . . . . . . 38Analysis Techniques . . . . . . . . . . . . . . . . . . . . . . . . . . . . . . . . . . . . . . . . . . . . . . . . 38Depth and Velocity Conditions : Weir . . . . . . . . . . . . . . . . . . . . . . . . . . . . . . . . . . . 40Depth and Velocity Conditions: Sluiceway . . . . . . . . . . . . . . . . . . . . . . . . . . . . . . . 44Summary . . . . . . . . . . . . . . . . . . . . . . . . . . . . . . . . . . . . . . . . . . . . . . . . . . . . . . . . 49
5. DISCUSSION . . . . . . . . . . . . . . . . . . . . . . . . . . . . . . . . . . . . . . . . . . . . . . . . . . . . . . . . . . . . . . . . 54Interpretation of Model Results . . . . . . . . . . . . . . . . . . . . . . . . . . . . . . . . . . . . . . . . . . . . . 54
Two-Dimensional Modeling . . . . . . . . . . . . . . . . . . . . . . . . . . . . . . . . . . . . . . . . . . 54Biological Interpretation . . . . . . . . . . . . . . . . . . . . . . . . . . . . . . . . . . . . . . . . . . . . . 54
Recommendations . . . . . . . . . . . . . . . . . . . . . . . . . . . . . . . . . . . . . . . . . . . . . . . . . . . . . . . 55
6. REFERENCES . . . . . . . . . . . . . . . . . . . . . . . . . . . . . . . . . . . . . . . . . . . . . . . . . . . . . . . . . . . . . . . . . 57

BIO-WEST, Inc. Final ReportOctober 2005 APS and Fruitland Diversion Evaluationii
LIST OF TABLES
Table 2.1. Size classes used for substrate mapping. . . . . . . . . . . . . . . . . . . . . . . . . . . . . . . . . . 5
Table 3.1. Summary of swimming ability information available in the literature. . . . . . . . . . . 21
Table 4.1. Modeled flows and sluiceway conditions for Fruitland Diversion. . . . . . . . . . . . . . 25
Table 4.2. Fruitland Diversion results using 0.30 m (1 foot) minimum depth criteria. . . . . . . 29
Table 4.3. Fruitland Diversion results using 0.15 m (6 inch) minimum depth criteria. . . . . . . 29
Table 4.4. Percent of time flows fall within ranges represented by modeled discharges. . . . 37
Table 4.5. Modeled flows for APS Diversion. . . . . . . . . . . . . . . . . . . . . . . . . . . . . . . . . . . . . . 39
Table 4.6. Depth and velocity conditions across the concrete weir at APS diversion. . . . . . . . 42
Table 4.7. Sluiceway velocities for different gate positions. . . . . . . . . . . . . . . . . . . . . . . . . . . 49
Table 4.8. Summary of passage conditions within the weir area at APS Diversion. . . . . . . . . 50
Table 4.9. Summary of passage conditions within the sluiceway at APS Diversion. . . . . . . . . 51
LIST OF FIGURES
Figure 1.1. Location map. . . . . . . . . . . . . . . . . . . . . . . . . . . . . . . . . . . . . . . . . . . . . . . . . . . . . . . 2
Figure 2.1. Overview of the APS Weir Diversion structure. . . . . . . . . . . . . . . . . . . . . . . . . . . . . . 4
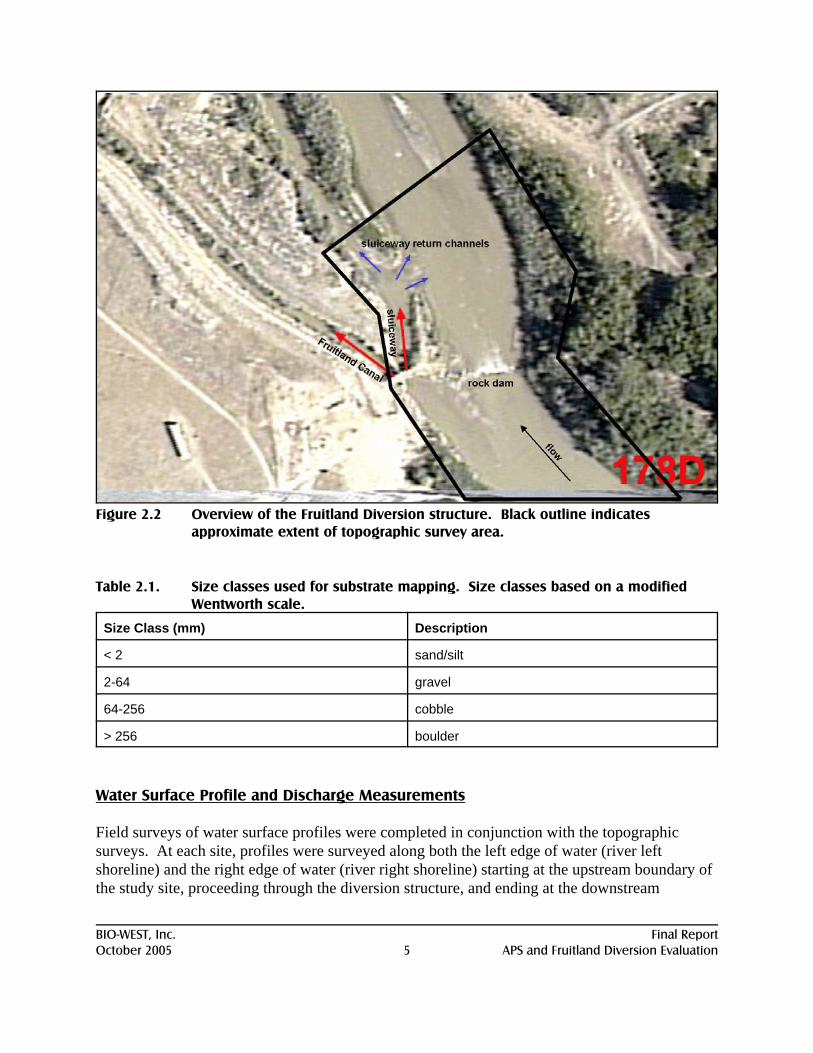
Figure 2.2 Overview of the Fruitland Diversion structure. . . . . . . . . . . . . . . . . . . . . . . . . . . . . 5
Figure 2.3. Comparison plot of measured versus modeled water surface elevationsat the APS Diversion for low- and high-calibration flows. . . . . . . . . . . . . . . . . . . . . . 9
Figure 2.4. Comparison plot of measured versus modeled water surface elevations at the Fruitland Diversion for the 790 cfs calibration flow. . . . . . . . . . . . . . . . . . . . . 9
Figure 3.1a. Photos of APS Weir. Top: Upstream view of concrete weir. Bottom: Upstream view of weir with pumphouse and sluiceway visible on the right side of the photo. . . . . . . . . . . . . . . . . . . . . . . . . . . . . . . . . . . . . . . . . . . . . . . . . . . . . . 13
Figure 3.1b. Photos of APS Weir. Top: Upstream close-up view of sluiceway gate. Bottom: View across concrete weir from river right to river left. . . . . . . . . . . . . . . 14

BIO-WEST, Inc. Final ReportOctober 2005 APS and Fruitland Diversion Evaluationiii
Figure 3.2. Duration curve of pumping rates at the APS weir, based on monthly diversionrecords from 1985-2004. . . . . . . . . . . . . . . . . . . . . . . . . . . . . . . . . . . . . . . . . . . . . . 15
Figure 3.3a. Photos of Fruitland Diversion. Top: View of rock dam looking towards river left. Bottom: View of rock dam looking towards river right. . . . . . . . . . . . . . . . . . . . . . 16
Figure 3.3b. Photos of Fruitland Diversion. Top: Downstream view of sluiceway gates and canal headgates. Bottom: Upstream close-up view of sluiceway gates. . . . . . 17
Figure 3.4. Photo of fish passage facility at PNM weir. . . . . . . . . . . . . . . . . . . . . . . . . . . . . . . 22
Figure 4.1. Three-dimensional view of topographic mesh used to model Fruitland diversion. . . . . . . . . . . . . . . . . . . . . . . . . . . . . . . . . . . . . . . . . . . . . . . . . . . . . . . . . 26
Figure 4.2. Fruitland model site. . . . . . . . . . . . . . . . . . . . . . . . . . . . . . . . . . . . . . . . . . . . . . . . . 27
Figure 4.3. Number of model nodes meeting depth criteria within rock dam area at Fruitland Diversion. . . . . . . . . . . . . . . . . . . . . . . . . . . . . . . . . . . . . . . . . . . . . . . 30
Figure 4.4a. Fruitland model results for nodes in vicinity of rock dam.. . . . . . . . . . . . . . . . . . . . 31
Figure 4.4b. Fruitland model results for nodes in vicinity of rock dam. . . . . . . . . . . . . . . . . . . . 32
Figure 4.4c. Fruitland model results for nodes in vicinity of rock dam. . . . . . . . . . . . . . . . . . . . 33
Figure 4.5. Image of modeled velocities at Fruitland diversion at the 10,000 cfs flow level. . 35
Figure 4.6. Photo showing upstream view of the right side of the Fruitland diversion rock dam at 7,500 cfs. . . . . . . . . . . . . . . . . . . . . . . . . . . . . . . . . . . . . . . . . . . . . . . 36
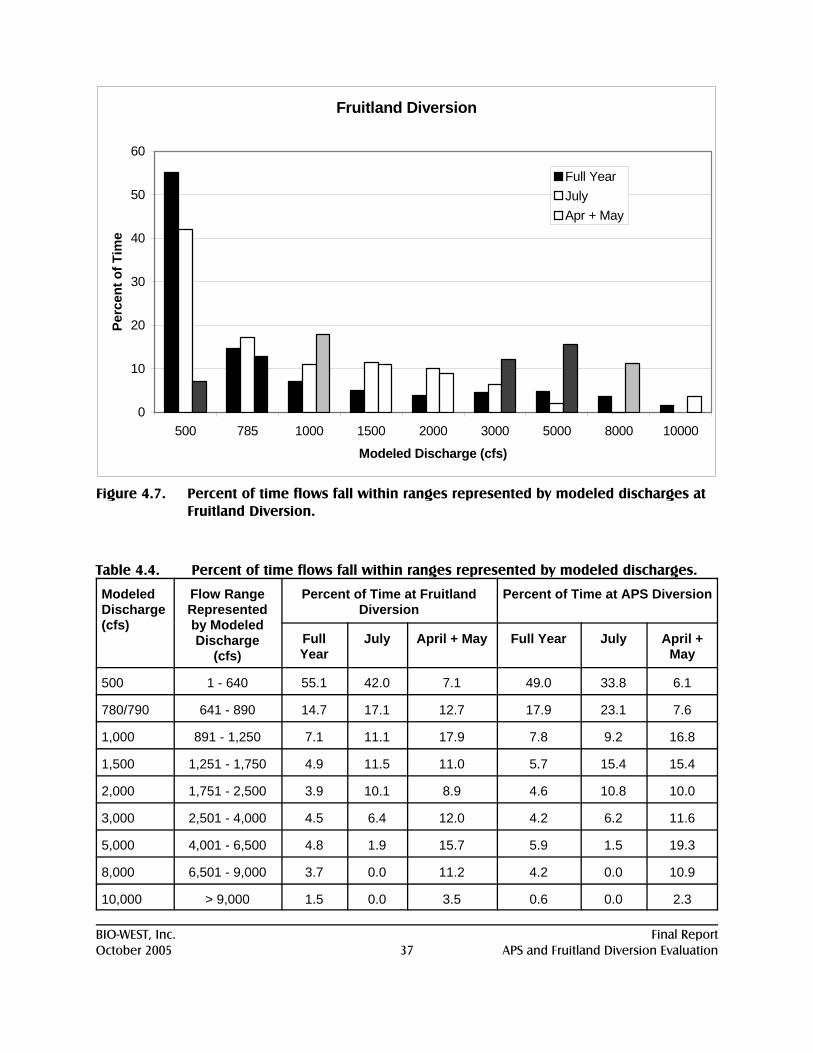
Figure 4.7. Percent of time flows fall within ranges represented by modeled discharges at Fruitland Diversion. . . . . . . . . . . . . . . . . . . . . . . . . . . . . . . . . . . . . . . . . . . . . . . 37
Figure 4.8. Three-dimensional view of topographic mesh used to model APS diversion. . . . . 39
Figure 4.9. APS model site.. . . . . . . . . . . . . . . . . . . . . . . . . . . . . . . . . . . . . . . . . . . . . . . . . . . . 41
Figure 4.10. Photo of the APS diversion at 7,000 cfs. . . . . . . . . . . . . . . . . . . . . . . . . . . . . . . . . . 43
Figure 4.11a. Velocity distributions within sluiceway at APS Diversion. . . . . . . . . . . . . . . . . . . . 45
Figure 4.11b. Velocity distributions within sluiceway at APS Diversion. . . . . . . . . . . . . . . . . . . . . 46
Figure 4.12. APS diversion model outputs of velocity for the 500, 2,000, and 8,000 cfs model runs. . . . . . . . . . . . . . . . . . . . . . . . . . . . . . . . . . . . . . . . . . . . . . . . . . . . . . . 47

BIO-WEST, Inc. Final ReportOctober 2005 APS and Fruitland Diversion Evaluationiv
Figure 4.13. Modeled average flows by month at the Farmington and APS inflow model nodes. . . . . . . . . . . . . . . . . . . . . . . . . . . . . . . . . . . . . . . . . . . . . . . . . . . . . . 48
Figure 4.14. Percent of time flows fall within ranges represented by modeled discharges at APS Diversion. . . . . . . . . . . . . . . . . . . . . . . . . . . . . . . . . . . . . . . . . . . . . . . . . . . 52

BIO-WEST, Inc. Final ReportOctober 2005 APS and Fruitland Diversion Evaluation1
1. INTRODUCTION
Purpose and Need
Efforts by the San Juan Basin Recovery Implementation Program (SJRIP) to recover theendangered Colorado pikeminnow (Ptychocheilus lucius) and the razorback sucker (Xyrauchentexanus) include habitat management, habitat development (e.g., fish ladders), nonnative speciescontrol, and native species augmentation (e.g., stocking of hatchery-reared Coloradopikeminnow and razorback sucker). In-stream diversion structures that affect upstream anddownstream fish passage have the potential to inhibit the success of these recovery efforts. Understanding the effects that structures such as the Arizona Public Service Company (APS) andFruitland diversions have on fish passage is essential to recovery efforts.
The Fruitland Diversion is located at River Mile (RM) 178.5 on the San Juan River, between theconfluence of the Animas and the confluence of the La Plata River with the San Juan River nearFarmington, New Mexico (Figure 1.1). The APS diversion - also known as the Four CornersPower Plant Diversion – is located at RM 163.3 (Figure 1.1). Both of these diversions arelocated within the designated critical habitat for Colorado pikeminnow and razorback sucker(USFWS 1994). Fish passage has already been provided at the two other diversion structures–Hogback Diversion and PNM Weir –located within the critical habitat. There is concern thatthe APS and Fruitland diversion structures may be affecting access to high quality spawning andrearing habitat upstream.
The extent to which the APS and Fruitland diversions are impediments to fish movement iscurrently unknown. Previous and ongoing SJRIP mark and recapture studies have demonstratedupstream movement of Colorado pikeminnow and razorback sucker past the Hogback and APSdiversion structures, and upstream movement of flannelmouth (Catostomus latipinnis) andbluehead sucker (C. discobolus) past the Fruitland diversion (D. Ryden 2005, pers. comm.). However, the specific flows and operational conditions during which passage has beensuccessful have not been documented. Although neither structure is a complete barrier to all fishat all times, the diversions may hinder passage for certain species/life stages under particularflow conditions.
Goals and Objectives
The overall goal of the proposed study is to provide an accurate assessment of the need for fishpassage at the APS and Fruitland diversion structures. This assessment will help the SJRIPdetermine whether to focus any future efforts and resources on providing fish passage at the APSand Fruitland diversion structures, and will ultimately assist in recovering the populations ofColorado pikeminnow and razorback sucker in the San Juan River.

BIO-WEST, Inc. Final ReportOctober 2005 APS and Fruitland Diversion Evaluation2
Figure 1.1. Location map.
In pursuit of this goal, three main objectives were established for this study:
1. Quantify the physical and hydraulic characteristics of the diversion structures andupstream and downstream channel segments.
2. Determine if and when the structures hinder or eliminate fish passage.
3. Assess the effect of diversion maintenance procedures on fish passage at the Fruitlandstructure.

BIO-WEST, Inc. Final ReportOctober 2005 APS and Fruitland Diversion Evaluation3
2. METHODS
Hydrodynamic Model Development
Detailed Topographic Surveys
At each of the diversion sites, channel and floodplain topographic data were surveyed in the fieldusing total station equipment (Figures 2.1 and 2.2). The diversion structures themselves werealso surveyed to the extent feasible given safety constraints. Approximately 1,000 topographicdata points were surveyed at each site. At the APS diversion, the topographic survey extendedabout 240 feet upstream from the weir and about 300 feet downstream from the weir. At the Fruitland diversion, the topographic survey extended about 370 feet upstream and about 400 feetdownstream from the diversion structure. Survey data were reviewed for completeness (missingdata, holes in the topography, etc.) during data collection to ensure that data density wasadequate for accurate terrain model development. Field surveys were completed betweenNovember 3, 2004 -November 6, 2004. Flows at the U.S. Geological Survey (USGS) gage inFarmington (Gage #09365000 ) were between 783 and 804 cubic feet per second (cfs) duringthat time period (USGS 2004).
At the APS diversion, high water velocities prevented field surveys in the sluiceway and gatearea for safety reasons. Therefore, original construction details obtained from the APS Companywere used to determine the topography (elevations and dimensions) in that area and supplementthe field-surveyed topographic data set. Similarly, at the Fruitland diversion, five data pointsfrom a 1996 survey of the sluiceway gate area were added to the data set. At both sites, theadditional data points were added in the office using ArcView 3D Analyst and OrthoMax 3Dvisualization software. Where needed, additional terrain points and breaklines were addedinteractively to insure that the terrain interpolation algorithm (triangular irregular network [TIN]with break lines) accurately represented the site topography and produced appropriatehydrodynamic modeling results. These same techniques were used to “virtually adjust” thesluiceway gate heights to represent different operating conditions at each structure.
Substrate and Riparian Mapping
For each site, substrate and vegetation information was gathered in order to provide hydraulicroughness information for modeling purposes. Specifically, substrate and riparian vegetationclassifications throughout the study sites were hand-delineated in the field on prints oftopographic survey maps. Substrate was delineated into visibly homogeneous substrate typesbased on dominant and subdominant particle sizes. Classification was based on a modifiedWentworth scale (Table 2.1). Where water depth and turbidity were too great to determinesubstrate size visually, substrate was classified based on the “feel” of the material underfoot. Riparian vegetation was delineated into the categories based on species type (grass/herbaceous,tamarisk, Russian Olive, etc.) and approximate vegetation height. Substrate and riparian mapswere digitized into a GIS layer using ArcView software.

BIO-WEST, Inc. Final ReportOctober 2005 APS and Fruitland Diversion Evaluation4
Figure 2.1. Overview of the APS Weir Diversion structure. Black outline indicatesapproximate extent of topographic survey area.
BIO-WEST, Inc. Final ReportOctober 2005 APS and Fruitland Diversion Evaluation5
Figure 2.2 Overview of the Fruitland Diversion structure. Black outline indicatesapproximate extent of topographic survey area.
Table 2.1. Size classes used for substrate mapping. Size classes based on a modifiedWentworth scale.
Size Class (mm) Description
< 2 sand/silt
2-64 gravel
64-256 cobble
> 256 boulder
Water Surface Profile and Discharge Measurements
Field surveys of water surface profiles were completed in conjunction with the topographicsurveys. At each site, profiles were surveyed along both the left edge of water (river leftshoreline) and the right edge of water (river right shoreline) starting at the upstream boundary ofthe study site, proceeding through the diversion structure, and ending at the downstream

BIO-WEST, Inc. Final ReportOctober 2005 APS and Fruitland Diversion Evaluation6
boundary of the study site. A sufficient number of water surface elevation data points werecollected to ensure that all significant breaks in slope (e.g., any abrupt drops in water surfaceelevation at the diversion structures) were well defined, and that average water surface slopeconditions above and below the structures were also well defined. These water surface profiledata were used to establish initial boundary conditions for the 2-D model and to calibrateroughness estimates.
Field measurements of discharge were also made at each site to determine the distribution offlow through the different components of the diversion structures. Measurements were madewith a Marsh-McBirney flow meter and top-set rod using standard techniques. At the APSdiversion, the flow passing over the concrete weir was measured and subtracted from the gagedflow at the Farmington USGS gage to determine the discharge passing through the sluiceway. At the Fruitland diversion, flow was measured in each of the three sluiceway return channelsbelow the diversion. These measurements were used in conjunction with the gaged flow atFarmington to determine the discharge passing through the rock diversion and through thesluiceway gates (see Figure 2.2). For the APS Weir, the amount of flow being diverted throughthe pumps at the time of our field surveys was obtained from the APS Company and wassubtracted from the Farmington gage value to further define the flow through the sluiceway. Adjustments were also made for the inflow from the La Plata River and for the flow diversionvia the APS pumps. No flow was being diverted at the Fruitland structure at the time of our fieldsurveys.
In order to improve model verification and calibration, a second set of field-surveyed watersurface elevation data were collected in June 2005 during high-flow conditions. At the APSDiversion, a water surface profile was surveyed along the right edge of water (river rightshoreline) between the upstream and downstream boundaries of the site. Data were collectedbetween 10:00 AM and 1:00 PM on June 17, 2005, when the average river flow was 7,000 cfs. Because the APS Diversion is located about halfway between the Farmington and ShiprockUSGS gages, the 7,000 cfs value was determined by averaging the recorded 15-minute gagevalues for the time period of the survey, factoring in the lag time between the two gages. Because the river was not wadeable at this flow, no field measurements of the discharge splitbetween the weir and sluiceway were made at the APS Diversion during the June survey. Thesluiceway gate was in the “full open” position at the time of the survey.
At the Fruitland Diversion, a water surface profile was surveyed along the left edge of water(river left shoreline) between the upstream and downstream boundaries of the study site. Datawere collected between 4:30 PM and 6:30 PM on June 16, 2005, when the average river flowwas 7,500 cfs at the nearby Farmington USGS gage. Because the river was not wadeable at thisflow, detailed field measurements of the discharge splits between the rock dam, sluiceway, andcanal were not made during the June survey. However, several spot measurements of velocityand depth were made in the sluiceway and canal. Based on these limited data, it was estimatedthat approximately 190 cfs were being diverted into the canal, approximately 1,000 to 1,500 cfs

BIO-WEST, Inc. Final ReportOctober 2005 APS and Fruitland Diversion Evaluation7
were passing through the sluiceway, and approximately 6,000 cfs were passing over the rockdam. Both sluiceway gates were fully open at the time of the survey.
Water Surface and Velocity Modeling
Hydrodynamic modeling at the study sites was accomplished using the River2D model. Themodel is a two-dimensional, depth averaged hydrodynamic and fish habitat model developedspecifically for use in natural streams and rivers. It is a Finite Element model, based on aconservative Petrov-Galerkin upwinding formulation. It features subcritical-supercritical andwet-dry area solution capabilities. It has been verified through a number of comparisons withtheoretical, experimental and field results (Ghanem et al. 1995a; Waddle et al. 1996, Christisonet al. 1999). A complete description of the formulation and implementation of the model iscontained in Ghanem et al. (1995b). The model solves the two-dimensional vertically averagedflow equations using a spatially variable, scalar eddy viscosity (turbulence closure) thatemphasizes vertical diffusion of momentum. The program utilizes spatially variable channelroughness. When supplied good data on topography and flow and stage boundary conditions,River2D will calculate velocities, water surface elevations and boundary shear stresses in thechannel. It has been used in channels with or without islands.
Computational meshesFinite element meshes were generated at each of the study sites using the utilities in River2D. Meshes were refined as much as practical given the size of the study sites and limitations ofcomputational time. Mesh density was maximized in the immediate vicinity of the diversionstructures, with reduced resolution upstream and downstream from the structures where detail isnot as critical.
Water surface modelingThe two-dimensional model was calibrated to the measured water surface at the field-surveyeddischarge by adjusting substrate and riparian vegetation roughness. The substrate maps at eachsite included an estimated hydraulic roughness height based on the size of the largest particlesizes in each substrate category. Approximate roughness was calculated for riparian vegetationtypes from standard Manning’s “n” versus vegetation type references (e.g., Chow 1959;Arcement and Schneider 1989). Manning’s “n” values for vegetation were converted tocomparable roughness height. The roughness algorithm in the 2D model adjusts roughness as afunction of relative depth (depth/roughness height). Thus, once roughness is calibrated in themodel at one discharge, the same roughness can be used throughout the full range of dischargelevels. Where water surface elevation data is available at additional flows, it can be used tovalidate the relative roughness algorithm. We have done this on many rivers and the accuracy isvery good such that water surface elevations at flows other than the calibration flow are usuallyonly minimally improved by making adjustments to the original calibrated roughness (Addleyforthcoming).

BIO-WEST, Inc. Final ReportOctober 2005 APS and Fruitland Diversion Evaluation8
During the calibration phase of the hydrodynamics modeling, the roughness heights across allsubstrate types were increased or decreased by a constant percentage until the modeled watersurface matched the measured water surface. Within the digital terrain model (DTM), thesluiceway gate positions were also adjusted slightly to ensure that the modeled flow splitsmatched the field discharge measurements. Because a two-dimensional model cannot model asubmerged gate we used a flow block on the bottom of the channel (gate extending up from thebed of the channel) to approximate the submerged gates. Nine to ten specific flows weremodeled at each site.
At the APS Diversion study site, roughness heights were originally only calibrated to the low-flow water surface profile survey and then extrapolated to higher discharges. After collectinghigh-flow water surface elevation data in June 2005, roughness was increased slightly in order tominimize the differences between the modeled and measured water surface elevations for boththe low (780 cfs) and high (7,000 cfs) calibration flows. One set of final roughness height valueswas used to model all flows. As seen in Figure 2.3 , the match for the 7,000 cfs flow level isquite good, except in the area immediately below the weir. At high flows, a significant hydraulicjump occurs along the lip of the weir, and the modeling discrepancy in this area is a function ofthe limitations of using a two-dimensional hydrodynamics model to represent the complex,three-dimensional hydraulics that develop in this area. However, the model does closely matchmeasured values upstream and downstream of the weir lip, and the discrepancy at the weir lip isminor under low flow conditions (Figure 2.3).
At the Fruitland Diversion study site, roughness heights and the sluiceway gate settings (partiallyclosed) were also originally calibrated to the low-flow water surface profile survey andextrapolated to the higher discharges. As seen in Figure 2.4, the modeled versus measuredvalues match closely for the 790 cfs flow run. After collecting high-flow water surface elevationdata in June, 2005, along the left side of the channel with the sluiceway gates completely open,we attempted to compare model results to the measured data. However, we were unable tomodel the site at high flow with the sluiceway gates wide open because the large velocities in thesluiceway prevented the model from numerically converging. The site was easily modeled athigh flows with the gates partially closed, but closing the gates affected the flow and watersurface elevations along the left side of the channel above the sluiceway and prevented acomprehensive comparison to the measured data. We were able to compare some of the field-measured elevations along the right side of the island below the rock dam with the modeledvalues, and generally found good agreement. We are confident that the solutions with theroughness calibrated at low flow and the gate partially closed provide an accurate representationof conditions at the rock dam and have no reservations using these solutions over the entire rangeof flows.

BIO-WEST, Inc. Final ReportOctober 2005 APS and Fruitland Diversion Evaluation9
27.5
28
28.5
29
29.5
30
30.5
-25 0 25 50 75 100 125 150 175 200Distance Upstream (m)
Elev
atio
n (m
)
780 cfs Measured 780 cfs Modeled7000 cfs Measured 7000 cfs Modeled
26.726.826.9
2727.127.227.327.427.527.6
0 20 40 60 80 100 120 140 160
Distance Upstream (m)
Elev
atio
n (m
)
Modeled Measured
Figure 2.3. Comparison plot of measured versus modeled water surface elevations at theAPS Diversion for low- and high-calibration flows.
Figure 2.4. Comparison plot of measured versus modeled water surface elevations at theFruitland Diversion for the 790 cfs calibration flow.

BIO-WEST, Inc. Final ReportOctober 2005 APS and Fruitland Diversion Evaluation10
Velocity modelingVertically averaged velocities are generated during the solution of the two-dimensionalhydrodynamics equations at each of the mesh nodes. No “calibration” of the velocitymodeling is done. Accuracy of modeled velocities is primarily dependent on the accuracyof the channel topography, the accuracy of the channel roughness inputs, accuracyof the water surface elevations, and the hydrodynamics model itself (appropriatenessof equations used in the model and the turbulence model used). In natural rivers,River 2D and other models like it such as the STAGR model written by Jonathan Nelson,both of which have been used extensively at Utah State University Water ResearchLaboratory, have been shown to generate accurate mean column velocities across thechannel (e.g., Lisle et al. 2000, Nelson and Smith 1989, Shimizu et al. 1989, Addleyforthcoming) and accurately model the size of recirculation zones (Nelson and McDonald,in Press; pers. observation).
Fish Passage Criteria
A thorough literature search was completed to obtain information on passage criteria andswimming abilities of Colorado pikeminnow and razorback sucker. Because of the paucity ofinformation available for Colorado pikeminnow and razorback sucker, information oncongeneric species, and species thought to have similar swimming abilities were also obtainedand reviewed. Specific information sought during the literature search included minimum waterdepth requirements, burst speed and sustained swimming speed data, and maximum passablevertical drop information. In addition to reviewing available literature, we also obtained inputfrom various knowledgeable professionals who have been involved with native fish research andnon-salmonid fish passageway designs.
We also obtained empirical data from mark-recapture studies that demonstrate movementthrough various diversion structures and engineered fishways. Where possible, information onthe water velocities and depths that fish encountered during passage through these structures wasreviewed to help define “passable” conditions.
The information from these various sources was used to define minimum depth, maximumvelocity, and maximum vertical drop criteria. These criteria were used in conjunction with thehydrodynamic model outputs to identify passable and unpassable portions of the diversionstructures at different flows.
Hydrology
To place the passage conditions under different flow levels into a biological and temporalperspective, flow duration curves were developed using available hydrology data. Hydrologydata were obtained from the San Juan Hydrology model developed by Keller-BliesnerEngineering. This model uses historical streamflow data in conjunction with projected“modern” operational conditions and water demands to simulate 65 years of flow data for the

BIO-WEST, Inc. Final ReportOctober 2005 APS and Fruitland Diversion Evaluation11
river. Modeled daily flows at the Farmington USGS gage node were used to represent flowconditions at the Fruitland diversion. Modeled monthly flows at the “Four Corners Power PlantInflow” model node were used to represent flow conditions at the APS diversion. Modeled flowdata for the Four Corners Power Plant Inflow node were only available as total monthly flowvolumes; these volumes were converted into daily flow rates for duration analysis by assuming aconstant daily rate for each month.
Monthly pumping records from 1985-2004 were provided by the APS Company, and these datawere used to describe typical diversion conditions at the APS diversion. Diversion records forthe Fruitland Canal are only available for 2003-2004; we reviewed these data and also spokewith Shiprock Irrigation Company staff to describe typical diversion conditions at the Fruitlanddiversion.
Fish passage conditions during the spawning periods for Colorado pikeminnow and razorbacksucker are of particular interest. In the San Juan River, Colorado pikeminnow spawn on thedescending limb of the hydrograph, typically in mid- to late-July (Holden 1999). Razorbacksucker spawn on the ascending limb of the hydrograph, typically in April or May (Holden 1999). Therefore, in addition to analyzing flow duration using the full set of hydrology data, we alsodeveloped duration curves for July flows and April/May flows. For each of the three timeframes analyzed, we determined the proportion of time that flows fall within the rangerepresented by each modeled discharge.
Fruitland Diversion Maintenance Information
Marlin Saggboy of the Shiprock Irrigation Company and Michael Isaacson of Keller-BliesnerEngineering were contacted to obtain information on typical maintenance and operationpractices at the Fruitland Diversion structure.

BIO-WEST, Inc. Final ReportOctober 2005 APS and Fruitland Diversion Evaluation12
3. RESULTS
Description of APS Diversion
The APS diversion operates year round and provides water for use at the nearby Four CornersPower Plant. The structure consists of a concrete weir section across the river, with a gate andsluiceway assembly on river left. Together, the weir and sluiceway span the entire width of theriver. The weir controls water surface elevation to provide water into pump intakes on river left(Figures 2.1 and 3.1). The sluiceway gate is 6 feet tall and opens from the bottom. The gate isoperated to ensure adequate flow into the pumping station, and overall operations are variedbased on river stage and pumping schedule. Based on monthly pumping records from 1985-2004, the average (and median) pumping rate is 41 cfs, with a minimum of 12 cfs and amaximum of 76 cfs (Figure 3.2).
According to the APS Company (B. Salisbury 2005a, pers. comm.), in a typical year thesluiceway gate is left completely open during April, May, and June while river flows are high. When flows drop in the beginning of July, the operators will partially close the gate (typically tothe 50% closed position) to increase elevation and suction head for the pumps. The gatetypically remains partially closed from July through March.
The concrete weir at the APS diversion is 10 feet thick and about 150 feet wide. The width ofthe sluiceway is 20 feet. Based on our 2004 survey, the average vertical drop in bed elevationfrom the top to the bottom of the concrete weir is about 8 feet, tapering to a 7 foot drop at theright and left edges of the weir. The drop from the downstream edge of the concrete sluicewayto the bottom of the scour pool below it is about 4 feet. According to the 1962 constructiondrawings of the APS facility, sloping rip rap aprons composed of 2' diameter rock wereoriginally placed below the weir and below the concrete sluiceway. Apparently, considerablescour of the rip rap material and streambed has occurred since weir construction. At the time ofour topographic survey, the water surface elevation drop over the weir was about 1.6 feet, thesluiceway gate was in the 80% closed position, and the diversion was running in single-trainoperation, pumping at a rate of 38 cfs.
Description of Fruitland Diversion
Physical Structure
The Fruitland diversion is operated seasonally for irrigation and is constructed of large bouldersplaced in the channel to divert water into a head gate assembly and sluiceway/canal on river left. The structure has three main components. The first component is a rock diversion damcomposed of quarry rock material (3-4' diameter boulders) placed on the native streambedmaterial. The rock dam spans most of the river width from the right bank to the edge of a high,narrow island (Figure 2.2). The dam is about 163 feet wide with a breadth of 20 feet in the

BIO-WEST, Inc. Final ReportOctober 2005 APS and Fruitland Diversion Evaluation13
Figure 3.1a. Photos of APS Weir. Top: Upstream view of concreteweir. Bottom: Upstream view of weir with pumphouseand sluiceway visible on the right side of the photo.

BIO-WEST, Inc. Final ReportOctober 2005 APS and Fruitland Diversion Evaluation14
Figure 3.1b. Photos of APS Weir. Top: Upstream close-up view ofsluiceway gate. Bottom: View across concrete weir fromriver right to river left.

BIO-WEST, Inc. Final ReportOctober 2005 APS and Fruitland Diversion Evaluation15
APS Pumping Rate Duration Curve
10
20
30
40
50
60
70
80
0 10 20 30 40 50 60 70 80 90 100
percent exceedence
pum
ping
rate
(cfs
)
Figure 3.2. Duration curve of pumping rates at the APS weir, based on monthly diversionrecords from 1985-2004.
upstream-downstream direction. The vertical drop from the top of the boulders to the streambedbelow is about 4 to 6 feet, but this value varies considerably because the rock structure does notcreate a continuous elevational feature (Figure 3.3a). On average, the streambed gradientthrough the steepest part of the rock dam is 14 percent. At the time of our survey, the edges ofthe dam were at a somewhat higher elevation than the middle of the dam. The rock dam servesas a grade control structure to maintain an adequate water surface elevation for flow diversioninto the sluiceway/canal facility on river left. The dam is periodically rebuilt by importingmaterial or excavating bed material and placing it on the diversion structure to maintain flowinto the diversion canal.
The second component of the Fruitland diversion is a sluiceway facility located between theisland and the left bank of the river (Figure 2.2 and 3.3b). The sluiceway consists of two 10-footwide steel radial headgates that open from the bottom. At the time of our topographic survey,which occurred after the end of the irrigation season, the right sluiceway gate was in the closedposition and left sluiceway gate was open. This gate arrangement is typical of conditions during

BIO-WEST, Inc. Final ReportOctober 2005 APS and Fruitland Diversion Evaluation16
Figure 3.3a. Photos of Fruitland Diversion. Top: View of rockdam looking towards river left. Bottom: View ofrock dam looking towards river right.

BIO-WEST, Inc. Final ReportOctober 2005 APS and Fruitland Diversion Evaluation17
Figure 3.3b. Photos of Fruitland Diversion. Top: Downstream view ofsluiceway gates and canal headgates. Bottom: Upstreamclose-up view of sluiceway gates.

BIO-WEST, Inc. Final ReportOctober 2005 APS and Fruitland Diversion Evaluation18
the non-irrigation season, when one gate is left open to promote flushing of accumulated debrisand sediment away from the canal headgates. During the irrigation season, both gates typicallyremain closed to help back up water and maintain head into the canal. A narrow bridge crossesthe facility and provides vehicle access to a boat put-in at the downstream end of the island.
The third component of the Fruitland facility is the Fruitland Canal. Flow into the canal iscontrolled via three 4' by 4' steel headgates located in a concrete wall along the left bank of theriver just upstream of the sluiceway headgates (Figure 3.3b). These gates open from the bottom,and are generally kept closed during the non-irrigation season (from November through March). During the irrigation season, they are opened to divert about 200 cfs into the canal. About 1 miledown the canal, a second set of headgates is operated to return half of the flow back into the SanJuan River (M. Isaacson 2004, pers. comm.). This “double-control” of flow helps preventexcessive sediment accumulation in the canal, but it also means that more water than is actuallyused for irrigation is initially diverted out of the San Juan River.
Maintenance Practices
Periodic maintenance of the rock diversion dam is needed when flood events cause the bouldersto roll and shift, reducing the water surface elevation maintained by the dam. In general,maintenance procedures involve using heavy equipment to place new boulders on the structureand/or to move existing boulders that have rolled downstream back onto the structure (M.Saggboy 2004, pers. comm.). Rather than actually increasing the overall maximum height of therock dam, these maintenance activities typically involve filling in gaps between the in-tactboulders. Also, when the structure is rebuilt, a lower-elevation notch in the dam is typically leftto allow for boat passage. This type of maintenance work is usually completed in the springtime(early April), at the start of the irrigation season (M. Saggboy 2004, pers. comm.). Occasionally,if high spring runoff conditions substantially displace rocks, maintenance work may also becompleted in late July after a high-flow event.
At the time of our survey in November 2004, no maintenance work had been performed on theFruitland diversion dam since early spring, 2002 (M. Saggboy 2004, pers. comm.). Recentspringtime flood magnitudes have been low on the San Juan River, and no difficulties withmaintaining flow into the diversion headgates were reported during the 2004 irrigation season. Therefore, it is unlikely that significant shifting of the boulders within the rock dam had occurredprior to our November 2004 survey. Although no surveys of the structure immediatelyfollowing maintenance work are available for comparison, we assume that the condition of thestructure in November 2004 is a reasonable representation of the “average” condition andelevation of the dam. The existing condition of the structure appears similar to the conditionseen in several photos of the rock dam taken by Shiprock Irrigation in July, 1991, furthersuggesting that conditions at the structure do not vary dramatically through time.

BIO-WEST, Inc. Final ReportOctober 2005 APS and Fruitland Diversion Evaluation19
Fish Passage Criteria
Review of Literature on Swimming Abilities
Colorado pikeminnow and surrogate speciesWe found limited information on the sustained swimming abilities of Colorado pikeminnow, butno burst speed information specifically for Colorado pikeminnow. Childs and Clarkson (1996)calculated the 50% fatigue velocity (FV50) for larval and young-of-year (YOY) Coloradopikeminnow. The FV50 is the water velocity at which 50% of the fish can not continueswimming against the current, even with prodding using electrical current. Using hatchery-reared, unexercised fish, they found that the FV50 for YOY Colorado pikeminnow (average totallength [TL] 27-28 mm) was 0.15 meters per second (m/s) in 30 minute trials at watertemperatures of 14oC. The FV50 varied with temperature and was 0.14 m/s at 10oC and 0.19 m/sat 19oC. They also state that Beamish (1980) indicated that sustained swimming speeds forlarger fish are ~ 80% of FV50 values obtained in 30 minute tests.
Berry and Pimenthal (1985) also calculated the FV50 for Colorado pikeminnow using hatchery-reared, unexercised fish. They found that the FV50 for Colorado pikeminnow with an averagesize of 432 mm was 1.04 - 1.08 m/s in 2 minute trials at temperatures of 14, 20 and 26oC. TheFV50 for 120 minute trials with similar sized fish was 0.87 - 0.95 m/s at those temperature. Berry and Pimenthal (1985) found lower FV50s for smaller Colorado pikeminnow (average size104 mm), during similar trials. The FV50 for the smaller Colorado pikeminnow was 0.50 m/sand 0.52 m/s in 2 minute trials at temperatures of 20oC and 26oC. However, when temperatureswere lowered to 14oC, the FV50 decreased to 0.39 m/s. Similarly, in 120 minute trials the FV 50for smaller Colorado pikeminnow at 20oC and 26oC was 0.47m/s, while the FV50 at 14oC wasonly 0.35 m/s.
Additionally, we also found information on the sustained and burst swimming speeds of severalspecies congeneric to the Colorado pikeminnow, which may serve as surrogates for Coloradopikeminnow. Mesa and Olson (1993) determined prolonged swimming performance of twosize-classes of northern pikeminnow (Ptychocheilus oregonensis). Using a swim tunnel theycalculated the FV50 for fish after they swam the fish to exhaustion under a variety of watervelocities and two temperature regimes. They found that in 20 minute trials at 12oC the FV50was 1.05 m/s for northern pikeminnow at an average size of 435 mm (TL). At 18oC the FV50for the same size fish was 1.15 m/s in 27 minute trials. Northern pikeminnow with a smalleraverage size (355mm TL) fatigued slightly faster at lower water velocities (the FV50 was 1.00m/s in 20 minutes at 12oC and 1.07 m/s in 14.1 minutes at 18oC).
Kolok and Farrell (1994) measured the critical swimming speed for adult northern pikeminnowat 5oC and 16oC. Critical swimming speed is found by increasing the current velocity fish areswimming against every 20 minutes until fatigue is achieved. They found that northernpikeminnow with an average fork length of 305 mm had a critical swimming velocity of 0.73m/s at 16oC. At 5oC critical swimming velocity for northern pikeminnow with an average fork

BIO-WEST, Inc. Final ReportOctober 2005 APS and Fruitland Diversion Evaluation20
length of 150 mm was 0.49 m/s. Myrick and Cech (2000) found that critical swimmingvelocities for Sacramento pikeminnow (Ptychocheilus grandis) were 0.40, 0.57, and 0.50 m/s at10, 15, and 20oC. Average total length of the fish were 229, 247, and 233 mm, respectively.
Froese and Pauly (2004) define burst speed as speeds that can be maintained for 5-10 seconds.While we did not find any information on burst speeds for Colorado pikeminnow, Froese andPauly (2004) suggest that burst speed is about 10 times higher than sustained speed, but can onlybe sustained for a matter of seconds. If sustained speed is ~80% of FV50 values, and burst speedis ~ 10 times sustained speed, then we can estimate that burst speed for a Colorado pikeminnownear 400mm TL is approximately 7 m/s. Froese and Pauly (2004) listed burst speeds forSacramento pikeminnow found by Bainbridge (1958), which were somewhat lower than thisestimate. Bainbridge (1958) found burst speeds of 4.8 to 6.7m/s for Sacramento pikeminnowbetween 750 and 850mm TL. In their bioenergetics model for northern pikeminnow feeding on juvenile salmonids, Petersonand Ward (1999) used average swimming speeds generated from radio telemetry contact datacollected by Martinelli and Shively (1997). These average swimming speeds were substantiallylower than “sustained speeds” seen in critical velocity and FV50 trials. In dam tailraces theyused an average swimming speed of 0.09 m/s. Outside of tailrace areas they used a swimmingvelocity of 0.01 m/s. These speeds were calculated as the straight line distance between radiotelemetry contacts divided by time.
Razorback sucker and surrogate speciesWe found no published information on the sustained swimming abilities or burst speeds of therazorback sucker. However, some published data were available for the Sacramento sucker(Catostomus occidentalis). Myrick and Cech (2000) found that critical swimming velocities forSacramento sucker were 0.47, 0.48, and 0.51 m/s at 10, 15, and 20oC. Average total length ofthe fish were 191, 200, and 209 mm, respectively. Substituting the critical swimming velocityfor an FV50 value and using the formula outlined above for estimating the burst speeds ofColorado pikeminnow, we can estimate burst speeds for Sacramento sucker may be between3.76-4.08 m/s. However, critical swimming velocities for northern pikeminnow were lower thanFV50 velocities, so this may be a conservative estimate.
Summary of swimming ability informationA summary of the swimming ability information described above is provided in Table 3.1. Forsimplicity and for comparison purposes, only data for the larger (200mm length and greater) lifestages are included, and only values for water temperatures between 16 and 20oC are included. The San Juan River is typically within this temperature range from June through September. Water temperatures are somewhat cooler – between 11 and 13oC – during April and May, whenrazorback sucker typically spawn (Holden 1999). Therefore, the values listed in Table 3.1 maybe somewhat greater than the true swimming speeds for razorback sucker during their spawningperiod. However, since no swimming ability information was specifically found for razorbacksucker, it is difficult to know how significantly temperature would affect their swimming speed.

BIO-WEST, Inc. Final ReportOctober 2005 APS and Fruitland Diversion Evaluation21
Table 3.1. Summary of swimming ability information available in the literature.
ColoradoPikeminnow
Northern Pikeminnow SacramentoPikeminnow
SacramentoSucker
Fish Length(mm)
432 435 305 235 200
Speed (m/s) 1.06 0.91 1.15 0.73 0.50 0.51
Type of Trial FV50 FV50 FV50 Criticalswimmingvelocity
Critical swimmingvelocity
Critical swimmingvelocity
Length of Trial(min)
2 120 27 n/a n/a n/a
Citation Berry & Pimenthal‘85
Mesa &Olson ’93
Kolok &Farrell ‘94
Myrick & Cech ‘00 Myrick & Cech ‘00
Burst SpeedEstimate
7.0 m/s(Froese & Pauly‘04)
4.8 to 6.7 m/s(Bainbridge ‘58;750-850 mm longfish)
4.0 m/s(Froese & Pauly ‘04)
The results of the studies described above indicate that adult-sized (400mm long and greater)pikeminnow are capable of maintaining speeds of about 1.0 m/s for sustained time periods(Table 3.1). Available information applicable to razorback sucker is very limited and relativelyinconclusive; however, the sustained speed data reported for Sacramento sucker is essentially thesame as that reported for Sacramento pikeminnow (Table 3.1), suggesting that the sustainedspeed capabilities for razorback sucker may be fairly comparable to Colorado pikeminnow. Burst speed information is not well-established for either species.
Recapture Data
Since information on the swimming abilities of Colorado pikeminnow and razorback sucker islimited, we also reviewed documented instances of these species passing through variousinstream structures on the San Juan River and through Redlands fish ladder on the GunnisonRiver to help define “passable” conditions. PNM Weir In 2003, the fish passage facility at the PNM Weir on the San Juan River (located betweenFruitland Diversion and the APS Weir - see Figure 1.1) began operation in June and remainedopen until November. During this time period, eight individual Colorado pikeminnow and fourrazorback sucker used the fish passage facility. Seven of the Colorado pikeminnow werecaptured in late June-early July. The Colorado pikeminnow ranged in size from 520 mm - 640mm total length (TL). The razorback sucker ranged in size from 400 mm - 460 mm. Additionally, 6,193 flannelmouth suckers and 10,076 bluehead suckers used the fish passagefacility in 2003. In 2004, the PNM fish passage facility operated from June through October.

BIO-WEST, Inc. Final ReportOctober 2005 APS and Fruitland Diversion Evaluation22
Figure 3.4. Photo of fish passage facility at PNM weir. Photo byWilliam Miller, Miller Ecological Consultants; photoobtained from San Juan Recovery Program web site athttp://www.fws.gov/southwest/sjrip/.
During that time, five Colorado pikeminnow and seven razorback sucker used the passagefacility. The Colorado pikeminnow ranged from 185-643 mm TL, and the razorbacks rangedfrom 435-480 mm TL (A. Lapahie 2005, pers. comm.).
The PNM fish passage facility consists of an artificial “side channel” with boulder (rip-rap) bedmaterial that leads to a gate area where fish are collected and sorted (Figure 3.4). Native fishesare returned to the river above the diversion structure. The fishway is about 350 feet long. Although detailed information on the flow velocities and depths within the PNM fishway wasnot readily available, the weir was designed to meet some general criteria used by the Bureau ofReclamation (BOR) when designing fishways for native sucker species. Velocities are keptbelow a maximum of 1.2 m/s (4 ft/s); vertical drops are avoided or kept to a height of 0.12 m(0.4 ft) or less; and water depths are kept to a minimum of 0.9 m (3 ft) to provide cover andreduce predation risk (B. Mefford 2005, pers. comm.). The successful use of the PNM facilityby both adult Colorado pikeminnow and razorback sucker provides evidence that these fish arecapable of sustained swimming speeds of up to 1.2 m/s, at least in channels where bouldersprovide velocity refuge zones.

BIO-WEST, Inc. Final ReportOctober 2005 APS and Fruitland Diversion Evaluation23
All four razorback sucker collected in the PNM fish ladder in 2003 had been stockeddownstream of the Hogback Diversion and recollected upstream of the APS Diversion (D.Ryden 2005, pers. comm.). Additional fish sampling in the San Juan River by SJRIPcooperators showed that at least three additional razorback suckers that were stocked below theHogback Diversion have been collected above the APS diversion. One of the Coloradopikeminnow collected in the PNM fish ladder in 2003 had also been previously captured belowthe APS diversion. Additional fish sampling in the San Juan River by SJRIP cooperatorsdocumented an additional Colorado pikeminnow that was captured below the APS diversion, andsubsequently recaptured above the APS diversion.
Most of these recaptures were separated by hundreds of days, so it is not possible to know thespecific flow conditions under which the Colorado pikeminnow and razorback sucker were ableto swim past the APS diversion. However, in 2002, one stocked Colorado pikeminnow (TL 521mm) was collected below the APS diversion on 10/11/2002 and recollected above it on10/22/2002 (D. Ryden 2005, pers. comm.). During this time, flows at the Farmington USGSgage were between 671 and 741 cfs. The APS sluiceway gate was set at the 50% closed positionthroughout this time period, and the pumps were diverting at a rate of 38 cfs every day exceptOctober 20, when the pumps were off (B. Salisbury 2005b, pers. comm.). These conditions aresimilar to the conditions we experienced during our topographic and water surface surveys at theAPS site in November 2004. During our survey, it was unsafe to closely approach the sluicewaygate area due to the extremely high water velocities passing under the gate. The drop in watersurface elevation over the weir was 1.6 feet, and water depths in the weir area were only about 6inches or less. The fact that an adult Colorado pikeminnow was able to migrate past thediversion during these conditions suggests that the APS Diversion is not a complete barrier tocertain Colorado pikeminnow, even when conditions are less than ideal.
The New Mexico Fisheries Resource Office has seen movement of other species of fish past theAPS diversion during their nonnative removal efforts between PNM Weir and HogbackDiversion. Below Hogback Diversion, they tagged 3,361 fish in 2003 and 2004, including thefollowing species: channel catfish (Ictalurus punctatus), common carp (Cyprinus carpio),flannelmouth sucker, bluehead sucker, flannelmouth x bluehead sucker hybrids (Catotomusspp.), and flannelmouth x white sucker hybrids. They have subsequently found ten of those fishabove the APS diversion (5 flannelmouth sucker, 3 common carp,and 2 channel catfish).
One tagged flannelmouth sucker and one tagged bluehead sucker have been documented to passthe Fruitland Diversion (D. Ryden 2005, pers. comm.). The bluehead sucker also passed severaldiversions on the lower Animas River. Flannelmouth sucker are probably similar to razorbacksucker in terms of swimming ability, so the fact that flannelmouth sucker have successfullynavigated the Hogback Diversion fish passage facility, the APS Diversion, the PNM Weir fishpassage facility, and Fruitland Diversion adds further evidence that these structures are notcomplete barriers to native and endangered fishes. Unfortunately, the recaptures described forthese other species did not occur close enough together in time to be able to determine thespecific flow conditions that were present when successful upstream passage was made.

BIO-WEST, Inc. Final ReportOctober 2005 APS and Fruitland Diversion Evaluation24
Redlands DiversionThe Redlands Diversion on the Gunnison River has a fish ladder that has passed both Coloradopikeminnow and razorback sucker (Burdick 2001). The fish passage is a 107 m long verticalslot/orifice passageway. The final bottom slope of the passage is 3.75%. Approximately 25 cfsruns down the passageway. Velocities measured near the top middle and bottom of thepassageway ranged from 0.70 - 1.07 m/s (U.S. Bureau of Reclamation, unpublished data). Thedepths measured in the passageway were 1.8 m at the entrance and 1.07 m in the forebay at thetop of the ladder. Burdick (2001) indicated that while the depths in the ladder may vary by riverstage, the hydraulics remain the same. He found that between 1996 and 2000, 51 Coloradopikeminnow negotiated the fish ladder at the Redlands Diversion. The Colorado pikeminnowranged in size from 383 - 765 mm. The Colorado pikeminnow utilized the fish ladder almostexclusively in July and August. Additionally, Burdick (2001) listed several instances where thesame fish used the ladder in multiple different years. The timing of Colorado pikeminnow use,combined with collecting several of the same fish in multiple years, suggests that thesemovements were probably associated with spawning migrations.
Burdick (2001) did not see any of the over 40,000 razorback suckers stocked through July 2001in the Gunnison and Upper Colorado Rivers use the fish trap. However, they enclosed 6razorback sucker in the bottom of the fish trap, and two successfully navigated the fish ladder. Additionally, over 14,000 flannelmouth sucker and over 22,000 bluehead sucker used thepassageway between 1996 and 2001. Additionally, from July 2001-December 2004 16 Coloradopikeminnow and 9 razorback sucker ascended the passageway (B. Burdick 2005, pers. comm.).
Depth and Vertical Drop Data
We found little information related to depths associated with velocities for different swimmingperformances. The only detail we were able to find relative to depth was that the swimmingchamber used by Berry and Pimenthal (1985) in their trials with Colorado pikeminnow had adiameter of 20 cm. This suggests that adult Colorado pikeminnow can sustain speeds of about 1m/s in fairly shallow water.
We did not find any quantitative information related to the leaping abilities of any species ofPtychocheilus or any Catostomid species. We did find several reports stating that northernpikeminnow were not known for their leaping ability.
Regardless of physical leaping ability (or a lack thereof), there is evidence that vertical drops inthe streambed can present a behavioral passage impediment to bottom-oriented sucker species. When the height of a vertical drop approaches the fork length of the fish, the eddyforces/hydraulic alterations associated with the drop can cause orientation problems for the fishthat may prevent it from even attempting to swim up over the drop (B. Mefford 2005, pers.comm.).

BIO-WEST, Inc. Final ReportOctober 2005 APS and Fruitland Diversion Evaluation25
4. MODELING RESULTS
Fruitland Diversion
Analysis Techniques
The topographic mesh (DTM) used to model the Fruitland site is shown in Figure 4.1, and Table4.1 lists the specific flows modeled for the Fruitland site. Because flows during the winter (non-irrigation) season are typically low, inflows of 1,500 cfs and lower were modeled with one of thesluiceway gates in the “open” position. Flows of 2,000 cfs and greater were modeled with bothsluiceway gates in the “closed” position, as if active flow diversion were occurring. Althoughadditional combinations of inflow values and sluiceway gate positions are possible, they werenot specifically modeled because the major issue of concern is passage conditions through therock dam portion of the Fruitland structure. Closing or opening a sluiceway gate simply altersthe proportion of the total inflow that runs through the rock dam area. For example, if thesluiceway gates were closed when the total inflow to the site was 790 cfs, a greater proportion ofthe flow would run through the rock dam, and conditions in that area would be more similar tothe model run for 1,000 cfs total inflow. Therefore, the model runs that were completed providean adequate representation of the range of conditions within the rock dam area.
Table 4.1. Modeled flows and sluiceway conditions for Fruitland Diversion.
ModeledDischarge (cfs)
Discharge ThroughRock Dam (cfs)
Discharge ThroughSluiceway Area (cfs)
Modeled Sluiceway GatePosition
500 305 195 one gate open
790 519 271 one gate open
1,000 689 311 one gate open
1,500 1,112 388 one gate open
2,000 1,797 203 both gates closed
3,000 2,704 296 both gates closed
5,000 4,547 453 both gates closed
8,000 7,331 669 both gates closed
10,000 9,196 804 both gates closed

BIO-WEST, Inc. Final ReportOctober 2005 APS and Fruitland Diversion Evaluation26
Figure 4.1. Three-dimensional view of topographic mesh used to model Fruitlanddiversion.
The sluiceway channel and gate area were not analyzed in detail. At the time of our survey, thevertical drop in water surface elevation between the upstream and downstream sides of theclosed gate was 2 feet, and velocities in the vicinity of the gates were high. While it may bepossible for a fish to swim underneath a gate (when open) or leap over a gate (when closed) ,these conditions are not ideal for passage, and would likely constitute an impediment to passage. Therefore, our modeling efforts focused primarily on providing an accurate representation ofconditions that would be encountered by an upstream-migrating fish within the main channelrock dam area.
To examine passage conditions within the rock dam area, a subset of model nodes were extractedfrom the overall model for detailed analysis (Figure 4.2). At total of 425 nodes were extracted,each representing a “pixel” size of about 4 feet by 4 feet. This subset was used to examine theproportion of nodes meeting various depth and velocity criteria relevant to fish passage.

BIO-WEST, Inc. Final ReportOctober 2005 APS and Fruitland Diversion Evaluation27
Figure 4.2. Fruitland model site. Bright red area indicates model nodes in vicinity of rockdam extracted for passage analysis.

BIO-WEST, Inc. Final ReportOctober 2005 APS and Fruitland Diversion Evaluation28
Depth and Velocity Conditions
Because the specific depth and velocity criteria for Colorado pikeminnow and razorback suckerare not definitively established, model results are presented for a variety of depth and velocitycombinations. Two specific minimum depth criteria were analyzed: a depth of 0.30 m (1 foot),and a depth of 0.15 m (6 inches). The 0.30 m value was selected because this depth wouldprobably provide adequate “wetted cover” for the largest size classes of Colorado pikeminnowand razorback sucker. The 0.15 m value was selected as a less restrictive criteria that wouldprovide cover for all but the largest size classes of fish. Additionally, the 0.15 m value is closerto the 20 cm swimming chamber depth (diameter) used by Berry and Pimenthal (1985) in theirtrials with Colorado pikeminnow.
For each of these two minimum depth criteria, we determined the proportion of nodes meetingvarious maximum velocity criteria. Specifically, maximum velocity increments of 1, 2, 4, 6, and8 m/s were analyzed. The minimum value of 1 m/s was selected because the literature indicatesthat this is a good approximation of the swimming speed that can be sustained for an extendedperiod of time by adult Colorado pikeminnow and razorback sucker. However, the use of a burstspeed estimate may also be relevant because the rock dam structure at Fruitland Diversion onlyspans a river length of about 6 meters (20 feet). Therefore, higher velocity threshold values upto 8 m/s were also examined.
Model results within the rock dam area for the various depth and velocity criteria are presentedin Tables 4.2 and 4.3. For modeled flows of less than 3,000 cfs, depth is an important factor. Atthese flows, a substantially greater proportion of nodes meet the minimum depth value of 0.15 mthan meet the minimum depth value of 0.30 m, and many nodes do not meet either value (Figure4.3). Once flows entering the site reach 3,000 cfs or greater, depth becomes less of an issue(Figure 4.3) and velocity becomes a more important variable.
At flows of 1,500 cfs and less, our model results indicate that at least one third of the wettedportion of the rock dam meets the most restrictive depth and velocity criteria of 0.30 m minimumdepth and 1 m/s maximum velocity (Table 4.2). If the criteria are relaxed to 0.15 minimumdepth and 2 m/s maximum velocity, only the 8,000 cfs and 10,000 cfs model runs show less thanone third of the wetted nodes meeting the criteria (Table 4.3). For all of the modeled flows, atleast 67% or more of the wetted notes have velocities of 4 m/s or less and meet the indicateddepth criteria (Tables 4.2 and 4.3).
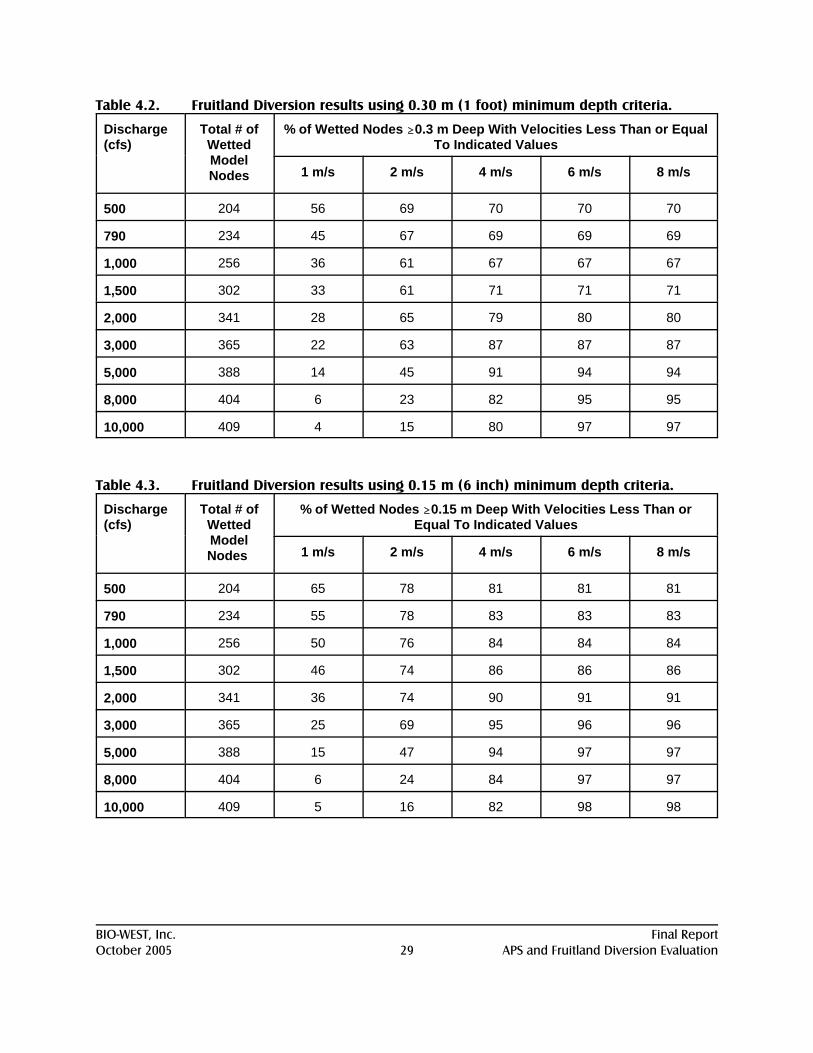
BIO-WEST, Inc. Final ReportOctober 2005 APS and Fruitland Diversion Evaluation29
Table 4.2. Fruitland Diversion results using 0.30 m (1 foot) minimum depth criteria.
Discharge(cfs)
Total # ofWettedModelNodes
% of Wetted Nodes $0.3 m Deep With Velocities Less Than or EqualTo Indicated Values
1 m/s 2 m/s 4 m/s 6 m/s 8 m/s
500 204 56 69 70 70 70
790 234 45 67 69 69 69
1,000 256 36 61 67 67 67
1,500 302 33 61 71 71 71
2,000 341 28 65 79 80 80
3,000 365 22 63 87 87 87
5,000 388 14 45 91 94 94
8,000 404 6 23 82 95 95
10,000 409 4 15 80 97 97
Table 4.3. Fruitland Diversion results using 0.15 m (6 inch) minimum depth criteria.
Discharge(cfs)
Total # ofWettedModelNodes
% of Wetted Nodes $0.15 m Deep With Velocities Less Than orEqual To Indicated Values
1 m/s 2 m/s 4 m/s 6 m/s 8 m/s
500 204 65 78 81 81 81
790 234 55 78 83 83 83
1,000 256 50 76 84 84 84
1,500 302 46 74 86 86 86
2,000 341 36 74 90 91 91
3,000 365 25 69 95 96 96
5,000 388 15 47 94 97 97
8,000 404 6 24 84 97 97
10,000 409 5 16 82 98 98

BIO-WEST, Inc. Final ReportOctober 2005 APS and Fruitland Diversion Evaluation30
Model Nodes Meeting Depth Criteria at Fruitland Diversion
0
50
100
150
200
250
300
350
400
450
500 790 1000 1500 2000 3000 5000 8000 10000
Modeled Discharge (cfs)
Num
ber o
f Mod
el N
odes
Total Number WettedAt Least 0.15m DeepAt Least 0.30m Deep
Figure 4.3. Number of model nodes meeting depth criteria within rock dam area atFruitland Diversion.
Because migrating fish need to be able to navigate the rock dam in a continuous manner, thedistribution of “passable” nodes within the rock dam area is perhaps more important than thesimple percentage of nodes meeting specific depth and velocity criteria. Figure 4.4 shows thedistribution of model nodes meeting versus not meeting two different sets of depth and velocitycriteria. Results are shown for the most restrictive depth/velocity criteria evaluated (depth $0.30m and velocity #1 m/s), and for a less restrictive set of criteria (depth $0.15 m and velocity #2m/s). Because the majority of nodes at any flow have velocities less than 4 m/s, results are notshown for these higher maximum velocity levels.
As seen in Figure 4.4a, the nodes that meet the depth and velocity criteria under the lowestmodeled flows (discharge 1,000 cfs and less) are primarily located near the central section of therock dam. Conditions along the right and left edges of the dam are too swift and shallow to meetthe criteria. The model results indicate that no fully continuous path of “suitable” nodes throughthe rock dam exists at the 500 cfs, 790 cfs, or 1,000 cfs flow levels using the most restrictivedepth and velocity criteria (Figure 4.4a). However, an upstream-migrating fish would only needto swim through a short (5- to 10-foot long) stretch of shallower/faster water in the middle of thedam to successfully pass the structure under these low flow conditions. When the model criteriaare relaxed to the less-restrictive depth ( $0.15 m) and velocity (#2 m/s) criteria, one or more

BIO-WEST, Inc. Final ReportOctober 2005 APS and Fruitland Diversion Evaluation31
Figure 4.4a. Fruitland model results for nodes in vicinity of rock dam. Blue-colored dotsindicate nodes that are greater than or equal to indicated depth and less thanor equal to indicated velocity; red-colored dots do not meet criteria. Arrowsindicate flow direction.

BIO-WEST, Inc. Final ReportOctober 2005 APS and Fruitland Diversion Evaluation32
Figure 4.4b. Fruitland model results for nodes in vicinity of rock dam. Blue-colored dotsindicate nodes that are greater than or equal to indicated depth and less thanor equal to indicated velocity; red-colored dots do not meet criteria. Arrowsindicate flow direction.

BIO-WEST, Inc. Final ReportOctober 2005 APS and Fruitland Diversion Evaluation33
Figure 4.4c. Fruitland model results for nodes in vicinity of rock dam. Blue-colored dotsindicate nodes that are greater than or equal to indicated depth and less thanor equal to indicated velocity; red-colored dots do not meet criteria. Arrowsindicate flow direction.

BIO-WEST, Inc. Final ReportOctober 2005 APS and Fruitland Diversion Evaluation34
continuous paths of “suitable” nodes are available for migrating fish at the 500 cfs, 790 cfs, and1,000 cfs flow levels (Figure 4.4a).
Results are fairly similar for the moderate flow levels that were modeled, but the locations of the“suitable” nodes begin to shift farther towards the edges of the rock dam (Figure 4.4b). As withthe low flow results, a short gap in “suitable” nodes exists at the 1,500 cfs and 2,000 cfs flowlevels when the most restrictive criteria are used. At 3,000 cfs, one continuous path of suitablenodes exists near the right side of the dam, even when the most restrictive criteria are used(Figure 4.4b). When the criteria are relaxed to 0.15 minimum depth and 2 m/s maximumvelocity, continuous paths of suitable nodes are available at all three flow levels (Figure 4.4b). At 3,000 cfs, the far left portion of the rock dam becomes more completely inundated and anadditional continuous suitable path becomes available in this area (Figure 4.4b).
Model results for the 5,000 cfs flow level are similar to the results for the 3,000 cfs flow level for the less restrictive depth/velocity criteria (Figures 4.4b and 4.4c). However, at 5,000 cfs, shortgaps in suitable nodes appear when the most restrictive criteria are used (Figure 4.4c). For the8,000 cfs and 10,000 cfs model runs, very few nodes meet the restrictive criteria, particularlywithin the upstream portion of the rock dam (Figure 4.4c). At these high discharge levels, flowvelocities are high throughout the main river channel, and exceed 1 m/s in the main channelareas above and below the rock dam (Figure 4.5). However, even at these high flow levels,narrow continuous suitable paths are available along the far right side of the dam when the lessrestrictive depth/velocity criteria are used (Figure 4.4c). Observations of the rock dam duringthe high-flow (7,500 cfs) survey in June 2005 confirm that conditions along the far right side ofthe dam appear to meet the less restrictive passage criteria. In this area, a large eddy developsimmediately below the rock dam, and velocities just above the rock dam are slowed byinundated vegetation (Figure 4.6).
In summary, all the modeled flows have at least one continuous path of suitable model nodes thatmeet the less restrictive criteria of 0.15 m minimum depth and 2 m/s maximum velocity. Onlythe 3,000 cfs model run shows a continuous path of suitable nodes when the most restrictivecriteria (0.30 m minimum depth and 1 m/s maximum velocity) are used; however, all modeleddischarges except 8,000 cfs and 10,000 cfs show nearly continuous paths of suitable nodes evenwhen the most restrictive criteria are used. Based on duration analysis of the full year’shydrology, the flow ranges represented by the 8,000 and 10,000 cfs model runs only occur about5 percent of the time (Figure 4.7, Table 4.4).

BIO-WEST, Inc. Final ReportOctober 2005 APS and Fruitland Diversion Evaluation35
Figure 4.5. Image of modeled velocities at Fruitland diversion at the 10,000 cfs flow level. Blue areas indicate velocities of about 2 m/s and less; green, yellow, and redareas indicate velocities greater than 2 m/s.

BIO-WEST, Inc. Final ReportOctober 2005 APS and Fruitland Diversion Evaluation36
Figure 4.6. Photo showing upstream view of the right side of the Fruitland diversion rockdam at 7,500 cfs.
BIO-WEST, Inc. Final ReportOctober 2005 APS and Fruitland Diversion Evaluation37
Fruitland Diversion
0
10
20
30
40
50
60
500 785 1000 1500 2000 3000 5000 8000 10000
Modeled Discharge (cfs)
Perc
ent o
f Tim
e
Full YearJulyApr + May
Figure 4.7. Percent of time flows fall within ranges represented by modeled discharges atFruitland Diversion.
Table 4.4. Percent of time flows fall within ranges represented by modeled discharges.
ModeledDischarge(cfs)
Flow RangeRepresentedby ModeledDischarge
(cfs)
Percent of Time at FruitlandDiversion
Percent of Time at APS Diversion
FullYear
July April + May Full Year July April +May
500 1 - 640 55.1 42.0 7.1 49.0 33.8 6.1
780/790 641 - 890 14.7 17.1 12.7 17.9 23.1 7.6
1,000 891 - 1,250 7.1 11.1 17.9 7.8 9.2 16.8
1,500 1,251 - 1,750 4.9 11.5 11.0 5.7 15.4 15.4
2,000 1,751 - 2,500 3.9 10.1 8.9 4.6 10.8 10.0
3,000 2,501 - 4,000 4.5 6.4 12.0 4.2 6.2 11.6
5,000 4,001 - 6,500 4.8 1.9 15.7 5.9 1.5 19.3
8,000 6,501 - 9,000 3.7 0.0 11.2 4.2 0.0 10.9
10,000 > 9,000 1.5 0.0 3.5 0.6 0.0 2.3

BIO-WEST, Inc. Final ReportOctober 2005 APS and Fruitland Diversion Evaluation38
Assuming that adult Colorado pikeminnow and razorback sucker are capable of swimming atspeeds greater than their sustained swimming speed for short distances, the rock dam at theFruitland diversion does not appear to be a significant impediment to upstream migration.Literature-based burst speed estimates for various pikeminnow and sucker species range from 4to 7 m/s (Table 3.1). The majority of model nodes within the rock dam have velocities less thanthese values at all modeled discharge levels (Tables 4.2 and 4.3). In addition, the individualboulders that comprise Fruitland dam create numerous “pockets” of lower-velocity habitat wheremigrating fish may be able to rest while navigating the structure. The diversity of boulder sizesand heights across the rock dam also means that the potential for orientation problems associatedwith large vertical drops in bed elevation is low at Fruitland diversion. For these reasons, weconclude that there does not appear to be a need to provide fish passage at Fruitland diversion.
Potential Effects of Maintenance Practices
As discussed previously, the condition of the rock dam during our topographic survey appears tobe a reasonable representation of the average condition and elevation of the dam. Thus, it isassumed that the depths and velocities shown in the hydrodynamics model outputs representpassage conditions for the rock dam in its typical state. When individual rocks shift or tumbledownstream during flood flows, the gradient and elevation of the structure would be reduced,reducing flow velocities and improving passage conditions. As long as rock material is used torepair the structure, the elevation of the dam remains varied, and the maximum height of thestructure is not substantially increased, we assume that normal maintenance activities atFruitland diversion would not negatively affect fish passage. However, in order to help confirmthat this assumption is valid, we recommend that photographs be taken of the rock damimmediately after maintenance/repair work is next performed.
Model Results: APS Weir
Analysis Techniques
The topographic mesh (DTM) used to model the APS diversion is shown in Figure 4.8, andTable 4.5 lists the specific flows modeled for the APS site. At the APS diversion, fish may beable to swim upstream either over the concrete weir or through the sluiceway. As describedpreviously, the sluiceway gate is most commonly operated in either the fully-open or 50% closedposition. In order to assess passage conditions within the sluiceway, we ran the APS diversionmodel with the gate in the fully open position for all discharges. Preliminary model runsindicated that the presence or absence of an obstruction (gate) within the sluiceway did notsubstantially affect the flow distribution between the weir and sluiceway; therefore, conditions atthe weir are adequately represented by the model runs completed assuming an open sluicewaygate.

BIO-WEST, Inc. Final ReportOctober 2005 APS and Fruitland Diversion Evaluation39
Figure 4.8. Three-dimensional view of topographic mesh used to model APS diversion.
Table 4.5. Modeled flows for APS Diversion.
Modeled Discharge (cfs) Discharge Through Sluiceway(cfs)
Discharge Over Concrete Weir(cfs)
500 475 25
780 644 136
1,000 717 283
1,500 848 652
2,000 959 1041
3,000 1108 1892
5,000 1424 3576
7,000 1695 5305
8,000 1842 6158
10,000 2109 7891

BIO-WEST, Inc. Final ReportOctober 2005 APS and Fruitland Diversion Evaluation40
To assess passage conditions at the concrete weir, a subset of model nodes forming a transectacross the weir was extracted for analysis (Figure 4.9). Average water depth and velocity alongthe wetted portion of this transect was determined for each modeled discharge. In addition, thewater surface elevation at the upstream edge of the weir was compared to the water surfaceelevation below the weir. Because a hydraulic jump develops along the downstream edge (“lip”)of the weir which causes a localized depression in water surface elevation, a point about 10 feetbelow the downstream edge of the weir was used to represent the water surface elevationdownstream of the weir. The total downstream distance between the upstream and downstreampoints examined is 20 feet. We also compared the downstream water surface elevation to theelevation of the concrete weir itself as an additional indicator of the magnitude of the verticaldrop that exists at the weir at different discharges.
To examine passage conditions within the sluiceway, a subset of model nodes located within thesluiceway was extracted for analysis (Figure 4.9). Because the sluiceway is fairly narrow, withvertical walls and a flat concrete bottom, depths exceed 0.60 m (2 feet) throughout the sluicewayeven at the lowest modeled discharge. Since depth does not limit passage through the sluiceway,only velocity distributions within the extracted subset of model nodes were examined to evaluatepassage conditions.
Depth and Velocity Conditions : Weir
Conditions across the concrete weir are summarized in Table 4.6. At the modeled dischargesbelow 2,000 cfs, a vertical drop exists between the top of the weir and the downstream watersurface. Although the leaping ability (or lack thereof) of Colorado pikeminnow and razorbacksucker is not well documented, the literature states that northern pikeminnow are not known fortheir leaping ability. Razorback sucker are considered to be less athletic than Coloradopikeminnow (B. Mefford 2005, pers. comm.). Based on this limited information, we assume thatthe need to leap over a vertical drop of any size would constitute an impediment to upstreammigration by either species. Therefore, even though average depth and velocity across themiddle portion of the weir may be within a “suitable” range (depth > 0.15 m; velocity < 2 m/s),passage at the weir is considered potentially impeded at flows of 1,500 and 1,000 cfs. Passage isalso impeded at flows below 780 cfs due to the lack of depth across the weir as well as thepresence of a vertical drop (Table 4.6).
At flows greater than 2,000 cfs, the downstream water surface elevation becomes high enough tobegin to shallowly inundate the weir. Depths across the middle of the weir are adequate (> 0.30m), and velocities are within the range of burst speed estimates for pikeminnow and suckerspecies (Table 4.6, Table 3.1). However, the presence of an 8 foot drop in streambed elevationat the weir creates a strong potential for orientation problems that have been observed forrazorback sucker when vertical drops exceed the length of the fish (B. Mefford 2005, pers.comm.). The large vertical drop at the weir also creates a localized depression (hydraulic jump)in the water surface along the downstream lip of the weir at flows greater than 2,000 cfs. This
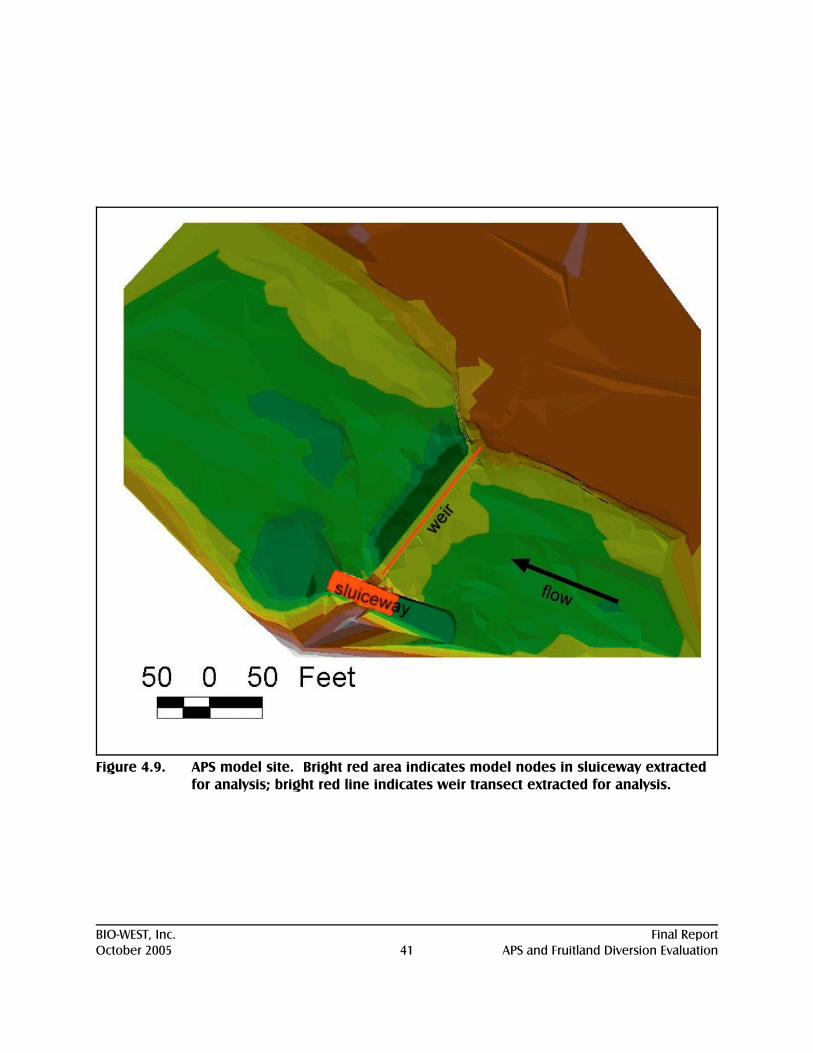
BIO-WEST, Inc. Final ReportOctober 2005 APS and Fruitland Diversion Evaluation41
Figure 4.9. APS model site. Bright red area indicates model nodes in sluiceway extractedfor analysis; bright red line indicates weir transect extracted for analysis.

BIO-WEST, Inc. Final ReportOctober 2005 APS and Fruitland Diversion Evaluation42
Table 4.6. Depth and velocity conditions across the concrete weir at APS diversion.
ModeledDischarge(cfs)
AverageDepth
Across Weir(m)
AverageVelocity
Across Weir(m/s)
DifferenceBetween Water
Surface ElevationUpstream and
Downstream ofWeir (m)
Water Surface ElevationDownstream of Weir
Relative to Top of Weir
500 0 0 0.45 0.52 m lower than weir
780 0.12 0.6 0.52 0.38 m lower than weir
1,000 0.20 0.8 0.50 0.29 m lower than weir
1,500 0.26 1.3 0.46 0.13 m lower than weir
2,000 0.35 1.7 0.41 same height as weir
3,000 0.50 2.2 0.29 0.28 m higher than weir
5,000 0.75 2.7 0.27 0.55 m higher than weir
7,000 0.95 3.2 0.17 0.89 m higher than weir
8,000 1.04 3.3 0.17 0.97 m higher than weir
10,000 1.29 3.8 0.14 1.24 m higher than weir
effect reduces depths and increases velocities beyond the average values listed for the middleportion of the weir in Table 4.6. Strong vertical velocities, eddies, and turbulent currents occurin this location. Therefore, conditions along the downstream edge of the weir are not ideal forpassage under any of the modeled flow conditions.
At flows of 5,000 cfs and greater, the sloped abutment to the right (facing downstream) of theflat portion of the concrete weir begins to be substantially inundated, providing a potentialpathway for upstream migration that avoids the intense hydraulics at the lip of the weir (Figure4.10). This right bank area has a smaller vertical drop in bed elevation, reducing the likelihoodof fish orientation problems (right bank area adjacent to weir can be seen in top photo, Figure 3-1a). At flows of 5,000 and greater, a narrow pathway with suitable depth and velocity conditions(depth > 0.15 m, velocity < 2 m/s) emerges in this area. Assuming that adult Coloradopikeminnow and razorback sucker are capable of swimming at speeds somewhat greater thantheir sustained swimming speed for short distances of about 4 m (13 ft), the right side of the APSweir would most likely be passable during high flow conditions (5,000 cfs and greater).

BIO-WEST, Inc. Final ReportOctober 2005 APS and Fruitland Diversion Evaluation43
Figure 4.10. Photo of the APS diversion at 7,000 cfs. Photo taken from the right banklooking across the weir to the sluiceway. Note the strong hydraulic jumpacross middle portion of weir and the more moderate hydraulics towards theright edge of water.

BIO-WEST, Inc. Final ReportOctober 2005 APS and Fruitland Diversion Evaluation44
Depth and Velocity Conditions: Sluiceway
As described previously, depth is not a limiting factor within the sluiceway area. Velocitydistributions within the extracted sluiceway nodes are shown in Figure 4.11. Images of modeloutputs for velocity at three flows are shown in Figure 4.12. For all model runs except the 500cfs run, the majority of nodes in the sluiceway have velocities greater than 2 m/s (Figure 4.11). In general, the lowest -velocity nodes occur along the right and left edges of the sluiceway. Athigh flows, lower-velocity nodes also develop in the left (facing downstream) side of theentrance to the sluiceway due to an eddy that develops along the left bank above the diversion. This effect is most apparent in the results for the 7,000, 8,000, and 10,000 cfs flow levels (Figure4.11).
At discharges of about 2,000 cfs and less, the highest velocities occur at the downstream edge ofthe sluiceway, where the concrete pad ends and the bed drops into the scour hole below. Ahydraulic jump develops at this location. Once flows reach about 3,000 cfs, this feature becomesless pronounced, and velocities become more consistently high throughout the middle section ofthe sluiceway (Figure 4.11).
Based on the model outputs, no continuous pathways with velocities less than 1 m/s are presentat any of the modeled discharges. Therefore, passage through the sluiceway would requireColorado pikeminnow or razorback sucker to be able to exceed their sustained swimming speed(estimated at 1 m/s for adults) for the majority of the trip up the sluiceway. At flows of 780 cfsand greater, velocities throughout the sluiceway exceed 1 m/s everywhere or nearly everywhere. However, for all the flows modeled, 84 to 100% of the sluiceway nodes have velocities less thanor equal to 4.0 m/s, which is the low-end burst speed estimate we found in the literature for adult sucker or pikeminnow. Assuming that Colorado pikeminnow and razorback sucker can swim atburst speed for distances of about 50-70 feet (15-21 m), the sluiceway may be passable at themodeled flows. However, since burst speeds can generally be maintained for only 5-10 seconds(Froese and Pauly 2004), the length of the sluiceway may present a challenge depending on thetrue maximum burst speed of the fish.
Although velocities within the sluiceway may be within the burst speed capabilities of Coloradopikeminnow and razorback sucker, the physical conditions within the structure are not ideal forpassage. The vertical walls and smooth concrete bottom mean that no micro-habitats or potentialresting areas are available for upstream-migrating fish, and velocity gradients along the edges ofthe structure are very sharp. This makes swimming conditions more challenging than in achannel with natural bed and bank material. Without more definitive biological data on theswimming abilities of Colorado pikeminnow and razorback sucker, it is difficult to conclusivelydetermine whether or not the sluiceway at the APS diversion would impede passage.
As described previously, the sluiceway gate at the APS diversion is typically kept open duringApril, May, and June, and then partially closed when flows drop in July. Based on averagemonthly flow data, the gate would typically be in the fully open position when flows are greaterthan 2,000 cfs and in the 50% closed position when flows are less than 2,000 cfs (Figure 4.13).

BIO-WEST, Inc. Final ReportOctober 2005 APS and Fruitland Diversion Evaluation45
Figure 4.11a. Velocity distributions within sluiceway at APS Diversion. Arrows indicate flowdirection.

BIO-WEST, Inc. Final ReportOctober 2005 APS and Fruitland Diversion Evaluation46
Figure 4.11b. Velocity distributions within sluiceway at APS Diversion. Arrows indicate flowdirection.

BIO-WEST, Inc. Final ReportOctober 2005 APS and Fruitland Diversion Evaluation47
Figure 4.12. APS diversion model outputs of velocity for the 500, 2,000, and 8,000 cfs modelruns. Outlined areas indicate approximate boundary of model nodes extractedto examine conditions within the sluiceway.

BIO-WEST, Inc. Final ReportOctober 2005 APS and Fruitland Diversion Evaluation48
0
500
1000
1500
2000
2500
3000
3500
4000
4500
5000
oct nov dec jan feb mar apr may jun jul aug sep
Dis
char
ge (c
fs)
FarmingtonAPS inflow
Figure 4.13. Modeled average flows by month at the Farmington and APS inflow modelnodes.
Although detailed modeling of the sluiceway with the gate partially closed was not performed,some simple discharge calculations were completed to assess the extent to which velocitieswould increase if flow depth was constrained. When the gate is 50% closed, the height of theopening between the bottom of the gate and the floor of the sluiceway is 3 feet (0.91 m). Forflows of 2,000 cfs and less, average velocity conditions within the central 5 meters of thesluiceway were calculated for both the open and partially-closed gate scenarios (Table 4.7). Atthe 1,000, 1,500, and 2,000 cfs discharge levels, velocities in the sluiceway gate area nearlydouble when the gate is partially closed. At these discharge levels, velocities exceed 4 m/s,which is the low-end burst speed estimate found for adult sucker or pikeminnow species. At the780 and 500 cfs flow levels, sluiceway velocities also increase significantly when flow depth isconstrained by the gate, but remain below 4 m/s (Table 4.7). Occasionally during low flowconditions, the gate is dropped below the 50% closed position, which would further compressflow depth and increase velocities under the gate. Specifically, if the gate were 80% closed,velocities under the gate would exceed 4 m/s at the 500 and 780 cfs flow levels. Therefore,depending on the specific gate position and the true burst speed capabilities of Coloradopikeminnow and razorback sucker, the sluiceway may hinder passage when the gate is partiallyclosed.

BIO-WEST, Inc. Final ReportOctober 2005 APS and Fruitland Diversion Evaluation49
Table 4.7. Sluiceway velocities for different gate positions.
ModeledDischarge(cfs)
Average Velocity Within Central Portion of Sluiceway (m/s)
Gate Open Gate 50% Closed
500 1.72 2.92
780 2.06 3.78
1,000 2.22 4.21
1,500 2.50 4.87
2,000 2.64 5.53
Summary
At flows of 5,000 cfs and greater, model results indicate that passage would be possible alongthe sloping right abutment of the weir (Table 4.8). This conclusion is based on the assumptionthat fish would be able to swim at speeds of 2 m/s (i.e., double their sustained swimming speed)for a short distance. At flows of 500 cfs and less, the dry conditions across the top of the weirwould most likely impede passage, even if fish were able to leap up over the vertical drop at thelip of the weir (Table 4.8). For all other discharge levels, it is difficult to make definitiveconclusions about fish passage at the weir given the lack of biological information about theleaping abilities of Colorado pikeminnow and razorback sucker. If the assumption that neitherspecies is able to leap over a vertical drop is valid, then passage at the weir would be impeded atthe 1,500, 1,000, and 780 cfs flow levels. However, the fact that in October, 2002 a Coloradopikeminnow was documented to have passed the APS Diversion when flows were in the range of700 cfs may suggest that Colorado pikeminnow do have some leaping ability – but, there is noway to know whether that particular fish passed over the weir or through the sluiceway. If theassumption that the 8 foot vertical drop in the streambed at the weir causes orientation problemsis valid, then passage at the weir would also be impeded at the 2,000 and 3,000 cfs dischargelevels. However, while these orientation problems have been observed in bottom-orientedsucker species, it is not known to what extent Colorado pikeminnow would be affected. Again,the fact that a Colorado pikeminnow has been documented to have passed the APS Diversionunder low flow conditions suggests that the vertical drop in the bed may not prevent passage –but again, there is no way to know whether that particular fish passed over the weir or throughthe sluiceway. Basically, for discharge levels greater than 500 cfs and less than 5,000 cfs, theonly thing that can be definitively stated about passage at the weir is that conditions are not idealfor passage. Specifically, conditions at the weir do not match the criteria used to design passablefishways for native species. Those criteria specify that vertical water surface drops be avoided;that vertical drops in bed elevation not exceed 0.12 m (0.4 ft); and that velocities not exceed 1.2m/s (5 ft/s) (B. Mefford 2005, pers. comm.).

BIO-WEST, Inc. Final ReportOctober 2005 APS and Fruitland Diversion Evaluation50
Table 4.8. Summary of passage conditions within the weir area at APS Diversion.
ModeledDischarge(cfs)
Passage Conditions at Weir
PassageCondition
Reason(s) Biological Assumption(s)
500 impeded 1. no flow depth across weir2. vertical drop3. vertical drop in bed
1. lack of ability to leap across dryweir2. lack of vertical leaping ability3. orientation problems
780 may beimpeded
1. vertical drop2. vertical drop in bed
1. lack of vertical leaping ability2. orientation problems
1,000 may beimpeded
1. vertical drop2. vertical drop in bed
1. lack of vertical leaping ability2. orientation problems
1,500 may beimpeded
1. vertical drop2. vertical drop in bed
1. lack of vertical leaping ability2. orientation problems
2,000 may beimpeded
1. vertical drop in bed 1. orientation problems
3,000 may beimpeded
1. vertical drop in bed2. velocities at weir lip exceedlow-end burst speed estimate (4m/s)
1. orientation problems2. lack of ability to swim faster than4 m/s
5,000 passable 1. passable depth and velocityconditions along right bank
1. ability to swim at 2x sustainedspeed for brief (4m) distance
8,000 passable 1. passable depth and velocityconditions along right bank
1. ability to swim at 2x sustainedspeed for brief (4m) distance
10,000 passable 1. passable depth and velocityconditions along right bank
1. ability to swim at 2x sustainedspeed for brief (4m) distance
Similarly, the only thing that can be definitively stated about passage through the sluiceway isthat conditions are not ideal for passage at any discharge level (Table 4.9). To navigate thesluiceway with the gate open, fish would need to swim at velocities between 2 and 4 timesgreater than their sustained swimming speed for a distance of 15 to 21 meters. Although thesevelocities are within the burst speed estimates for Colorado pikeminnow and Sacramento sucker,the estimates were made by applying a general mathematical formula to limited sustained speedinformation (Table 3.1). Without more information on the true burst speeds and burst speedendurance of Colorado pikeminnow and razorback sucker, it is difficult to know to what degreepassage may be impeded (or not) within the sluiceway. The documented October 2002 passageby a Colorado pikeminnow suggests that passage is possible – but it is unknown whether the fishnavigated the weir or the sluiceway. In addition, even if adult Colorado pikeminnow are able tonavigate the sluiceway during low flow it is unknown whether passage would be possible forrazorback sucker or for Colorado pikeminnow of a different size or gender. Studies have found

BIO-WEST, Inc. Final ReportOctober 2005 APS and Fruitland Diversion Evaluation51
Table 4.9. Summary of passage conditions within the sluiceway at APS Diversion.ModeledDischarge(cfs)
GatePosition
Passage Conditions in Sluiceway
PassageCondition
Reason Biological Assumption
500 open or50%
closed
may bepassable
velocities less than low-endburst speed estimate (4 m/s)
ability to swim at burstspeed for moderately long(15-21 m) distance
780 open or50%
closed
may bepassable
velocities less than low-endburst speed estimate (4 m/s)
ability to swim at burstspeed for moderately long(15-21 m) distance
1,000 open may bepassable
velocities less than low-endburst speed estimate (4 m/s)
ability to swim at burstspeed for moderately long(15-21 m) distance
50%closed
may beimpeded
velocities at gate exceedlow-end burst speedestimate (4 m/s)
lack of ability to swim fasterthan 4 m/s
1,500 open may bepassable
velocities less than low-endburst speed estimate (4 m/s)
ability to swim at burstspeed for moderately long(15-21 m) distance
50%closed
may beimpeded
velocities at gate exceedlow-end burst speedestimate (4 m/s)
lack of ability to swim fasterthan 4 m/s
2,000 open may bepassable
velocities less than low-endburst speed estimate (4 m/s)
ability to swim at burstspeed for moderately long(15-21 m) distance
50%closed
may beimpeded
velocities at gate exceedlow-end burst speedestimate (4 m/s)
lack of ability to swim fasterthan 4 m/s
3,000 open may bepassable
velocities less than low-endburst speed estimate (4 m/s)
ability to swim at burstspeed for moderately long(15-21 m) distance
50%closed
may beimpeded
velocities at gate exceedlow-end burst speedestimate (4 m/s)
lack of ability to swim fasterthan 4 m/s
5,000 open may bepassable
velocities less than low-endburst speed estimate (4 m/s)
ability to swim at burstspeed for moderately long(15-21 m) distance
8,000 open may bepassable
velocities less than low-endburst speed estimate (4 m/s)
ability to swim at burstspeed for moderately long(15-21 m) distance
10,000 open may bepassable
velocities less than low-endburst speed estimate (4 m/s)
ability to swim at burstspeed for moderately long(15-21 m) distance

BIO-WEST, Inc. Final ReportOctober 2005 APS and Fruitland Diversion Evaluation52
APS Diversion
0
10
20
30
40
50
60
500 785 1000 1500 2000 3000 5000 8000 10000
Modeled Discharge (cfs)
Perc
ent o
f Tim
e
Full YearJulyApr + May
Figure 4.14. Percent of time flows fall within ranges represented by modeled discharges atAPS Diversion.
considerable variability in swimming ability based on age and gender (B. Mefford 2005, pers.comm.). In summary, based on our modeling results, it appears that passage up the sluicewaywould be the most likely to be impeded under a high discharge/partially closed gate scenario,and passage would be the least likely to be impeded under a low discharge/open gate scenario.
During April and May, when razorback sucker typically spawn, flows equal or exceed 5,000 cfsmore than 30% of the time (Figure 4.14). Therefore, spawning razorback sucker would be ableto successfully pass around the right side of the weir every one out of three years, on average. Inaddition, since the sluiceway gate is typically kept open in April and May, spawning razorbacksucker may be able to pass through the sluiceway even if passage is impeded at the weir, if the 4m/s burst speed estimate is accurate and can be maintained through the length of the sluiceway. However, during the remainder of the year when flows are lower and the sluiceway gate is keptpartially closed, conditions may impede passage by razorback sucker (Table 4.8).

BIO-WEST, Inc. Final ReportOctober 2005 APS and Fruitland Diversion Evaluation53
During July, which is the typical spawning period for Colorado pikeminnow, the average flow is1,250 cfs. Flows are only in the 5,000 cfs and greater range 1.5% of the time, and the sluicewaygate is typically partly closed (Figure 4.13, Figure 4.14). Therefore, in most years, theconditions at the APS Diversion have the potential to impede spawning Colorado pikeminnowfrom reaching 16 miles of potentially high quality habitat upstream of the diversion and withinthe species' designated critical habitat (Table 4.8).

BIO-WEST, Inc. Final ReportOctober 2005 APS and Fruitland Diversion Evaluation54
5. DISCUSSION
Interpretation of Model Results
Two-Dimensional Modeling
There are limitations to using a two-dimensional hydrodynamics model to represent hydraulicconditions where substantial vertical velocity patterns occur, such as flow at the crest andimmediately downstream of a weir (e.g., flow over APS weir) and flow through a submergedgate (e.g., the sluiceway gates at both APS and Fruitland Diversions). However, at the APSDiversion the model did a good job of matching measured water surface elevations upstream anddownstream of the weir at both low (780 cfs) and high (7,000 cfs) flow conditions. This providessome assurance that the model results are accurate throughout the range of modeled discharges. We were also able to model the sluiceway with the gates open and provide velocities through theopen sluiceway.
Although conditions within the sluiceway at the APS Diversion were not modeled under thepartially closed (submerged) gate scenario using the two-dimensional model, the sluiceway andgate dimensions are known, along with the total sluiceway discharge. Therefore, the velocityestimates in Table 4.7, which are based on the standard continuity equation (flow = width xdepth x velocity) should provide a reasonably accurate representation of average velocityconditions in the gate area.
The rock dam at the Fruitland Diversion provides less difficulty for a two-dimensional model asflows through the rock dam are primarily two-dimensional. The Fruitland Diversion site wascalibrated (roughness calibration) to low flow (790 cfs) conditions with a partial flow block inthe sluiceway to simulate the typical gate settings. Water surface elevations over the rock damaccurately matched the measured data. Flow was simulated over the range of discharges usingthis model setup. The Fruitland Diversion sluiceway, however, proved to be difficult to model athigh flows with the gates fully open. Therefore, comparison of the measured high flow watersurface data with modeled values was limited to the area along the right side of the island belowthe rock dam, and agreement was generally good. We are confident that the model resultsgenerated at the rock dam over the range of discharges is a good representation of depths andvelocities experienced by fish.
Biological Interpretation
The greatest hindrance to interpreting the model results is the fact that the swimming abilities ofColorado pikeminnow and razorback sucker are not definitively established. No literature wasfound specifically documenting the burst speeds, minimum depth requirements, or leapingabilities of either species. No published swimming ability information of any kind was found forrazorback sucker. Because of the paucity of biological data, determination of the flowconditions that hinder or allow passage must rely on a number of assumptions.

BIO-WEST, Inc. Final ReportOctober 2005 APS and Fruitland Diversion Evaluation55
At the Fruitland Diversion, model results suggest that the rock dam structure does notsignificantly hinder fish passage, expect perhaps at very high discharges (8,000 cfs and greater). This conclusion is based on the assumption that Colorado pikeminnow and razorback sucker areable to swim at speeds of up to 2 m/s for brief distances. This assumption seems reasonable,especially given the fact that the boulder material would provide some small velocity refugeswithin the structure.
At the APS Diversion, model results suggest that passage would be possible along the right bankside of the weir during high flows (5,000 cfs and greater). As with Fruitland Diversion, thisconclusion is based on the assumption that adult Colorado pikeminnow and razorback sucker areable to swim at speeds of up to 2 m/s for brief distances. At flows less than 5,000 cfs, conditionsat the APS Diversion do not match the vertical drop and velocity criteria known to be passable(i.e., used in designing fishways for native species), but it is uncertain to what extent theconditions would impede passage. It is not possible to resolve this uncertainty without moredefinitive biological data on the swimming ability, leaping ability, and orientation behavior ofdifferent ages and genders of Colorado pikeminnow and razorback sucker. In the absence ofthese data, it can only be concluded that the APS Diversion has the potential to impede passageat flows less than 5,000 cfs. This means that in most years, there is the potential for spawningColorado pikeminnow to be impeded by the APS Diversion and unable to access 16 miles ofupstream habitat. Similarly, in years with low spring runoff, there is the potential for spawningrazorback sucker to be impeded by the APS Diversion and unable to access upstream habitat.
Recommendations
If it is a priority for the SJRIP to eliminate the concern over fish passage at the APS Diversion,then steps should be taken to improve passage conditions at the structure. One possible optioncould involve re-installing a sloping rip-rap apron along the downstream edge of the weir. Thiswould reduce the vertical drop in bed elevation and the vertical water surface drop that currentlyexists at flows below 2,000 cfs. This measure would improve passage conditions undermoderate flow conditions; however, at flows below 780 cfs, passage would still be impeded bythe lack of flow depth across the weir (unless a notch were also cut into the weir). Becauseflows are in this low range nearly 50% of the time (Figure 4.14), passage would still potentiallybe hindered during much of the year. In addition, a very large amount of rock would be neededto convert the existing 8 foot drop into a slope flat enough to meet passable fishway criteria,which require slopes of 5:1 or flatter (B. Mefford 2005, pers. comm.). The rip-rap would also besusceptible to future scour, and would likely require some maintenance over time. It may bepossible to selectively rip-rap only a portion of the weir to help limit costs.
Other possible options for improving passage could involve constructing an artificial “sidechannel” around the weir (similar to the PNM fishway), or using a combination of notching theexisting weir and providing a rip-rap ramp at the notch to eliminate the low-flow vertical drop inwater surface elevation. If passage improvements are pursued, we recommend that a variety ofoptions be explored in more detail, and that they be evaluated in terms of short- and long-term

BIO-WEST, Inc. Final ReportOctober 2005 APS and Fruitland Diversion Evaluation56
costs, feasibility (i.e., would a particular option be compatible with the APS diversion facilityand pumping needs), and relative passage benefits.
Additional biological studies would be helpful in determining the validity of the variousassumptions listed in Tables 4.8 and 4.9. Laboratory experiments in swimming tubes or flumescould be conducted to better determine the swimming abilities (sustained speed, burst speed,burst speed endurance) of Colorado pikeminnow and razorback sucker. Ideally, experimentsshould be conducted in a variety of water temperatures with both female and male fish, as wellas with fish of different sizes and ages. Studies to evaluate whether Colorado pikeminnowexperience orientation problems at vertical drops in bed elevation could also be pursued. Resultsfrom these studies may allow for more definitive conclusions to be made about whether or notthe velocities within the APS sluiceway hinder passage. However, if it is a priority for the SJRIPto eliminate the concern over passage at the APS Diversion, we recommend that studies toexplore the feasibility of various passage improvement options be pursued without delay. Biological studies would provide helpful information, but should not be considered aprerequisite for pursuing passage improvements.
At this time, we do not recommend that additional modeling or field velocity measurements bepursued in the sluiceway gate area. Although such measurements may improve the accuracy ofthe existing velocity estimates, the results would still not be conclusive given the absence ofbiological data. If and when reliable burst speed and endurance estimates become available, itmay be useful at that time to pursue more detailed sluiceway velocity measurements. If this ispursued, a combination of empirical velocity measurements and 3D flow modeling and/or scalemodeling could be used to obtain very accurate velocity data
At the Fruitland Diversion, there does not appear to be a need to provide improved fish passage. However, we recommend that the rock dam be visited and photographed immediately aftermaintenance work is next performed on the structure to confirm that the maintenance activitiesdo not substantially alter the height or composition of the dam relative to the conditionsdocumented in this study.

BIO-WEST, Inc. Final ReportOctober 2005 APS and Fruitland Diversion Evaluation57
6. REFERENCES
Addley RC. Forthcoming. Accuracy of 2D hydrodynamics modeling for water surfaceelevations, depths and velocities in natural channels.
Arcement GJ, Schneider VR. 1989. Guide for selecting Manning's roughness coefficients fornatural channels and flood plains. U.S. Geological Survey Water Supply Paper 2339.
Bainbridge R. 1958. The speed of swimming as related to size and to the frequency andamplitude of the tail beat. Journal of Experimental Biology 35(1):109-133.
Beamish FWH. 1980. Swimming performance and oxygen consumption of the charrs. Pages739-748 in E.K. Balon (editor). Charrs, salmonid fishes of the genus Salvelinus. Dr. W.Junk, The Hague, The Netherlands.
Berry CR, Jr., Pimental R. 1985. Swimming performances of three rare Colorado River fishes.Transactions of the American Fisheries Society 114(3):397-402.
Burdick BD. 2001. Five-year evaluation of fish passage at the Redlands Diversion Dam on theGunnison River near Grand Junction Colorado: Final Report. Recovery Program ProjectNumber CAP - 4b. Final Report prepared for the Recovery Implementation Program forEndangered Fishes in the Upper Colorado River Basin. Grand Junction (CO): U.S. Fishand Wildlife Service, Colorado River Fishery Project. 57 p.
Burdick BD. 2005. Fishery Biologist, U.S. Fish and Wildlife Service, Grand Junction, CO. Personal communication with Michael Golden of BIO-WEST, Inc., regarding fishpassage at Redlands Diversion. 2/9/2005
Childs MR, Clarkson RW. 1996. Temperature effects on swimming performance of larval andjuvenile Colorado squawfish: implications for survival and species recovery. Transactions of the American Fisheries Society 125(6):940-947.
Chow VT. 1959. Open-channel hydraulics. New York City: McGraw-Hill.
Christison KJ, Steffler PM, Katopodis C. 1999. Two-dimensional hydrodynamic modeling of abraided river – a case study. Proceedings of the Third International Conference onEcohydraulics: July 1999; Salt Lake City, Utah. CD ROM.
Froese R, Pauly D. (editors). 2004. FishBase. World Wide Web electronic publication. Location: www.fishbase.org. 12/2004.

BIO-WEST, Inc. Final ReportOctober 2005 APS and Fruitland Diversion Evaluation58
Ghanem A, Steffler PM, Hicks FE, Katopodis C. 1995a. Dry area treatment for two-dimensional finite element shallow flow modeling. Proceedings of the 12th CanadianHydrotechnical Conference: June 1995; Ottawa, Ontario. 10 p.
Ghanem A, Steffler PM, Hicks FE, Katopodis C. 1995b. Two dimensional finite element modelfor aquatic habitats. Alberta (Canada): Department of Civil Engineering, University ofAlberta. Water Resources Engineering Report 95-S1. 189 p.
Holden PB. (editor). 1999. Flow recommendations for the San Juan River. Albuquerque (NM):U.S. Fish and Wildlife Service, San Juan River Basin Recovery Implementation Program.
Isaacson M. 2004. Engineer, Keller-Bliesner Engineering, Farmington, NM. Personalcommunication with Melissa Stamp of BIO-WEST, Inc., regarding operations ofShiprock Irrigation Canal. 11/04.
Kolok AS, Farrell AP. 1994. Individual variation in the swimming performance and cardiacperformance of northern squawfish, Ptychocheilus oregonensis. Physiological Zoology67:706-722.
Lapahie A. 2005. Fish culturist and head of PNM fish passage operation, Navajo Nation,Shiprock, NM. Personal communication with Melissa Stamp and Michael Golden ofBIO-WEST, Inc., via presentation at the San Juan River Recovery ImplementationProgram Biology Committee Annual Meeting in Farmington, New Mexico. 02/16/05.
Lisle TE, Nelson JM, Madej MA, Barkett BL. 2000. Variability bed mobility in natural, gravel-bed channels and adjustments to sediment load at local and reach scales. WaterResources Research 36(12):3743-3755.
Martinelli TL, Shively RS. 1997. Seasonal distributions, movements, and habitat associationsof northern squawfish in two lower Columbia River reservoirs. Regulated Rivers:Research and Management 13:543-556.
Mefford B. 2005. Technical specialist, U.S. Bureau of Reclamation Water Resources ResearchLaboratory, Denver, CO. Personal communication with Melissa Stamp of BIO-WEST,Inc., Logan, Utah, regarding design of fishways. 03/08/05.
Mesa MG, Olson TM. 1993. Prolonged swimming performance of northern pikeminnow.Transactions of the American Fisheries Society 122:1104-1110.
Myrick CA, Cech JJ Jr. 2000. Swimming performances of four California stream fishes:temperature effects. Environmental Biology of Fishes 58(3):289-295.
Nelson JM, McDonald RR. Forthcoming. Mechanics and modeling of flow and bed evolutionin lateral separation eddies.

BIO-WEST, Inc. Final ReportOctober 2005 APS and Fruitland Diversion Evaluation59
Nelson J M, Smith JD. 1989. Flow in meandering channels with natural topography. Pages 69-102 in S. Ikeda and G. Parker (eds), River Meandering, AGU Water ResourcesMonograph 12, Washington, D.C.
Poe TP, Shively RS. 1994. Development of biological criteria for design of juvenile fish bypasssystems: Protecting anadromous juvenile salmonids from predation in Columbia Riverreservoirs. Lake and Reservoir Management 9(2):104.
Peterson JH, Ward DL. 1999. Development and Corroboration of a bioenergetics model fornorthern pikeminnow feeding on juvenile salmonids in the Columbia River. Transactionsof the American Fisheries Society 128(5):784–801.
Ryden D. 2005. Fisheries biologist, U.S. Fish and Wildlife Service, Grand Junction, CO.Personal communication with Michael Golden of BIO-WEST regarding fish recapturedata on the San Juan River. 03/05.
Saggboy M. 2004. Supervisor, Navajo Nation, Shiprock Irrigation Department, Shiprock, NM. Personal communication with Melissa Stamp of BIO-WEST regarding maintenance andoperation practices at the Fruitland Irrigation Diversion. 10/20/04.
Salisbury B. 2005a. Lead Mechanical Engineer, Arizona Public Service Company. Personalcommunication with Melissa Stamp of BIO-WEST regarding typical sluiceway gateconditions. 04/15/05.
Salisbury B. 2005b. Lead Mechanical Engineer, Arizona Public Service Company. Personalcommunication (via email) with Melissa Stamp of BIO-WEST regarding sluiceway andpumping conditions during October 2002. 03/05.
Shimizu Y, Smith JD, Nelson JM. 1989. Comparison of models for single thread streams. Pages524-529 in S.Y. Wang (ed). Proceedings of the International Symposium on SedimentTransport Modeling, New York.
[USFWS] U.S. Fish and Wildlife Service 1994. Endangered and Threatened Wildlife and Plants;Determination of Critical Habitat for the Colorado River Endangered Fishes: RazorbackSucker, Colorado Squawfish, Humpback Chub, and Bonytail Chub. 50 CFR Part 17, RIN1018—A891. Federal Register Vol. 59, No. 54 , Monday, March 21, 1994, Rules andRegulations, p.13374-13399.
[USGS] U.S. Geological Survey 2004. Provisional Recent daily flow data. Location: http://waterdata.usgs.gov/nm/nwis. 11/19/04.

BIO-WEST, Inc. Final ReportOctober 2005 APS and Fruitland Diversion Evaluation60
Waddle T, Steffler PM, Ghanem A, Katopodis C, Locke A. 1996. Comparison of one and twodimensional hydrodynamic models for a small habitat stream. Pages unknown in Leclercet al. (eds.). Ecohydraulics 2000: Proceedings of the 2nd international symposium onhabitat hydraulics; 11-14 July 1996; Quebec City, Canada.
Ward DL, Schultz AA, Matson PG. 2003. Differences in swimming ability and behavior inresponse to high water velocities among native and nonnative fishes. EnvironmentalBiology of Fishes 68(1):87-92.