evaluation of the physicochemical-microbiological quality
TRANSCRIPT

Nippon Journal of Environmental Science
ISSN: 2435-6786
2021, 2(3): 005
© 2021 by Author
1
Full Length Research Paper
Evaluation of the physicochemical-microbiological quality of surface waters in The
Highlands of Jalisco, Mexico
Aldo Antonio Castañeda-Villanueva
Centro Universitario de Los Altos, Universidad de Guadalajara, México. Av. Rafael Casillas Aceves No. 1200, CP 47600. Tepatitlán de Morelos, Jalisco, México
*Corresponding Author: [email protected] ; Tel/Fax: (52)3787838033
Received 30 September 2021; Accepted 11 November 2021
NJES stays neutral with regard to jurisdictional claims in published maps, figures and institutional affiliations.
Abstract. The Highlands is located northeast of the state of Jalisco (Mexico), concentrates a population of 829,313 Inhabitants
(2020), which represents 9.93% of the state population, this area contributes with more than 35% of the state's agricultural
GDP, the sources of waters contamination of the region are related to the economic activities that take place in each
municipality. The objective of this work was to quantitatively evaluate the quality of the surface water of the 20 municipalities
that make up the study area, by analytical determination physicochemical and microbiological parameters. 55 sampling points
were established in the main water bodies; the samplings were carried out from November 2020 to March 2021. The results
indicate that most of the water bodies sampled present different degrees of contamination, which is essentially related to the
discharge of domestic, livestock and industrial wastewater, with insufficient, or no treatment to rivers, streams and dams.
Keywords: Highlands region, Jalisco Mexico, Surface water quality.
1. INTRODUCTION
In 2018, the state of Jalisco occupied the first places in agricultural, livestock and fishing production in the
central-western area of the country, including at the national level (Table 1) (SEDER, 2019).
In that same year, livestock production in the state of Jalisco reached significant amounts, as in the case of
goats, where it contributed 11.3% of national production (Table 2) (SIAP, 2019).
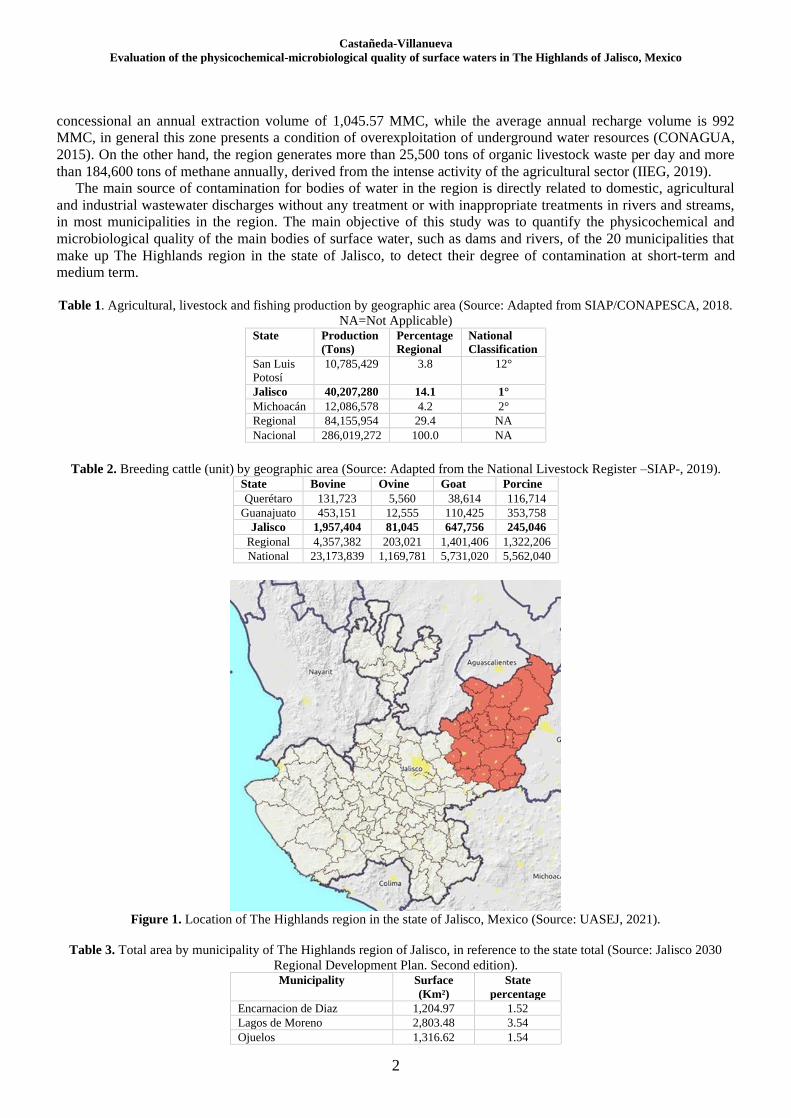
The Highlands region is located in the northeast part of the state of Jalisco (Figure 1), collimated to the north
with the states of Zacatecas and Aguascalientes, to the east with the states of San Luis Potosí and Guanajuato, to
the south with the Jalisco municipalities of Tototlan, Atotonilco el Alto and Degollado and to the west with the
municipalities of Zapotlanejo, Cuquio and the state of Zacatecas (UASEJ, 2021).
The area of The Highlands region is 15,153.77 km², which represents 18.44% of the state territory (Table 3)
(PED, 2020).
In 2020, the population in the Altos de Jalisco region amounted to 829,313 inhabitants, while the state total was
8,348,151 inhabitants (table 4), which represents 9.93% (INEGI, 2020).
This region is of national importance due to its agricultural and agro-industrial vocation; in 2013, a bovine milk
production of the order of 1,316,955 million liters was achieved, which represented 63.45% of state production and
12% of national production. Similarly, in that year 1,155,200 tons of eggs for dishes were generated, contributing
to 88.1% of state production and 46% of national production (table 5) (AEDRJ, 2020).
Likewise, in 2014 the volume of live pig and poultry production reached 184,205 and 242,852 tons respectively
(table 6) (SAGARPA, 2015).
The current problem in the region focuses on the fragile environmental situation, considering that it is one of the
areas with the highest risk of drought, the National Water Commission (CONAGUA) updated the average annual
availability of groundwater, published in 2015 at the Official Gazette of the Federation (OGF), where it is
recognized that of the 59 aquifers that are located in the state of Jalisco, 26 present conditions of overexploitation.
The Highlands region is located on 18 aquifers, of which 13 present overexploitation conditions, with a total
volume for the region of 172.38 Million Cubic Meters (MMC) per year of deficit. Likewise, the region has
Castañeda-Villanueva
Evaluation of the physicochemical-microbiological quality of surface waters in The Highlands of Jalisco, Mexico
2
concessional an annual extraction volume of 1,045.57 MMC, while the average annual recharge volume is 992
MMC, in general this zone presents a condition of overexploitation of underground water resources (CONAGUA,
2015). On the other hand, the region generates more than 25,500 tons of organic livestock waste per day and more
than 184,600 tons of methane annually, derived from the intense activity of the agricultural sector (IIEG, 2019).
The main source of contamination for bodies of water in the region is directly related to domestic, agricultural
and industrial wastewater discharges without any treatment or with inappropriate treatments in rivers and streams,
in most municipalities in the region. The main objective of this study was to quantify the physicochemical and
microbiological quality of the main bodies of surface water, such as dams and rivers, of the 20 municipalities that
make up The Highlands region in the state of Jalisco, to detect their degree of contamination at short-term and
medium term.
Table 1. Agricultural, livestock and fishing production by geographic area (Source: Adapted from SIAP/CONAPESCA, 2018.
NA=Not Applicable) State Production
(Tons)
Percentage
Regional
National
Classification
San Luis
Potosí
10,785,429 3.8 12°
Jalisco 40,207,280 14.1 1°
Michoacán 12,086,578 4.2 2°
Regional 84,155,954 29.4 NA
Nacional 286,019,272 100.0 NA
Table 2. Breeding cattle (unit) by geographic area (Source: Adapted from the National Livestock Register –SIAP-, 2019).
State Bovine Ovine Goat Porcine
Querétaro 131,723 5,560 38,614 116,714
Guanajuato 453,151 12,555 110,425 353,758
Jalisco 1,957,404 81,045 647,756 245,046
Regional 4,357,382 203,021 1,401,406 1,322,206
National 23,173,839 1,169,781 5,731,020 5,562,040
Figure 1. Location of The Highlands region in the state of Jalisco, Mexico (Source: UASEJ, 2021).
Table 3. Total area by municipality of The Highlands region of Jalisco, in reference to the state total (Source: Jalisco 2030
Regional Development Plan. Second edition). Municipality Surface
(Km²)
State
percentage
Encarnacion de Diaz 1,204.97 1.52
Lagos de Moreno 2,803.48 3.54
Ojuelos 1,316.62 1.54

Nipp. J. Environ. Sci., 2(3): 005
3
San Diego de Alejandria 318.09 0.40
San juan de los lagos 928.01 1.17
Teocaltiche 894.39 1.13
Union de San Antonio 699.97 0.88
Villa Hidalgo 473.54 0.60
Acatic 331.04 0.42
Arandas 984.06 1.24
Cañadas de Obregon 249.40 0.32
Jalostotitlan 527.48 0.67
Jesús María 684.08 0.86
Mexticacan 278.57 0.35
San Julian 250.23 0.32
San Miguel el Alto 864.99 1.09
Tepatitlán de Morelos 1,252.43 1.58
Valle de Guadalupe 375.50 0.47
Yahualica de Gonzalez Gallo 588.11 0.74
San Ignacio Cerro Gordo 228.02 0.29
Total Regional 15,153.77 18.44
Table 4. Distribution of the population in The Highlands of Jalisco (Source: INEGI, 2020). Municipality Population Municipality Population
Arandas 80,609 San Julian 16,792
Acatic 23,175 San Miguel el Alto 31,965
Encarnacion de Diaz 53,039 Teocaltiche 39,839
Jalostotitlan 32,678 Tepatitlan de Morelos 150,190
Jesús María 18,982 Union de San Antonio 19,069
Lagos de Moreno 172,403 Valle de Guadalupe 6,627
Mexticacan 5,307 Villa Hidalgo 20,088
Ojuelos de Jalisco 33,588 Cañadas de Obregon 4,388
San Diego de Alejandria 7,609 Yahualica de González Gallo 22,394
San Juan de los Lagos 72,230 San Ignacio Cerro Gordo 18,341
Total 829,313
Table 5. Main livestock products in The Highlands of Jalisco, according to their volumes of production, compared to State and
National production, 2013 cycle (Source: AEDRJ, 2020). Product Units Regional
volume
State
volume
State
%
National
volume
National
%
Bovine milk Thousands of liters 1,316,965 2,078,203 63.45 10,965,632 12.0
Goat milk Thousands of liters 644 6,667 9.6 152,332 0.4
Egg for plate Tons 1,155,200 1,311.542 88.1 2,516.094 46.0
honey Tons 837 6,635 12.6 56,907 1.5
Wax Tons 66 541 12.3 2,010 3.4
2. MATERIALS AND METHODS
Through field recognition and geographic information, such as the hydrological features of each of the municipalities that make up The Highlands of Jalisco region, 55 monitoring and sampling points were established,
distributed according to the importance of each body of water. The geographical location and a brief description of
these sampling points, distributed in the 20 municipalities of the study area, are found in Table 7.
Both the collection of samples and the analytical determinations were carried out between November 2020 and
March 2021, that is, during the dry season (low water).
The main parameters that were quantified were the following:
a) Chemical Oxygen Demand (COD): it is the amount of oxygen, measured in milligrams per liter (mg/L) that
is consumed in the oxidation of organic matter and oxidizable inorganic matter, under test conditions; it is an
indicator the degree of water pollution (NMX-AA-030-SCFI-2001).
b) Dissolved Oxygen (DO): it is a quantification of the volume of oxygen present in the water and available for
respiration, this amount depends, among other factors, on the consumption of aerobic organisms (bacteria and fish),
on the consumption of plants (algae), as well as temperature and depth. It is a basic parameter for classifying the
degree of contamination in surface waters when comparing its values at the same temperature conditions, with
water saturated with oxygen in solution.

Castañeda-Villanueva
Evaluation of the physicochemical-microbiological quality of surface waters in The Highlands of Jalisco, Mexico
4
c) Specific Conductivity (SC): in general, terms it consists of the ability of water to conduct electric current, it
depends on the amount of dissolved solid matter: Indirectly it provides the volume of ions in solution (nitrate,
sulfate, phosphate, sodium, magnesium and calcium). In general, untreated wastewater discharges to bodies of
water tend to increase their conductivity, since they increase the amount of dissolved matter, which infers on its
quality, the SC is measured in milisiemens per centimeter (mS/cm).
d) Total Nitrogen (TN): This represents ammoniacal nitrogen plus organic nitrogen, which is made up of
nitrates, nitrites and ammonia. N is a pollutant present in wastewater that causes a decrease in DO in surface waters
and is toxic to aquatic ecosystems.
e) Total Phosphorus (TP): Phosphorus is generally found in natural, sewage and treated wastewater in the form
of phosphates. These are classified as orthophosphates, condensed phosphates, and organophosphate compounds.
Phosphorus is an essential element in the growth of plants and animals, together with N they are responsible for the
excessive growth of algae and other organisms, this process is known as eutrophication and is the main responsible
for the contamination of water in lakes, dams rivers and reservoirs.
f) Total Coliform Organism (TCO): They are all those facultative aerobic or anaerobic organisms capable of
growing at 35 ºC in a lactose liquid medium, producing acid and gas in a period of 48 hours. The samples for this
microbiological indicator were collected in sterile glass bottles with a 500 ml screw cap, following the procedure
established in NOM-230-SSA1-2002. To perform the presumptive test, the Most Probable Number method was
used in 100 ml of sample (MPN/100 ml) in multiple tubes according to NOM-112-SSA1-1994; the incubation was
carried out at 44.5 ° C ± 0.2 ° C for 24 to 48 hours in a water bath with a recirculation system looking for gas
formation (NOM-210-SSA1-2014, NOM-112-SSA1-1994).
Likewise, the samples were taken in accordance with the corresponding norms and standards (NOM-230-SSA1-
2002. APHA, 2012).
The main laboratory equipment used for quantitative determinations were DRB200 digital reactor, DR 2800
spectrophotometer (HACH, 2019).
The field equipment used were DR900 portable colorimeter and Sension + model portable meters applications:
OD6 (OD) and EC5 (CE) (HACH, 2019).
Table 6. Production volume (tons) of live cattle and poultry 2014 (Source: SAGARPA, 2015. NA=Not available).
Municipality Bovine Porcine Ovine Goat Fowl
Encarnacion de Diaz 11,226 3,671 353 23 16,238
Lagos de Moreno 22,626 26,179 177 278 113,344
Ojuelos 4,838 208 94 159 8,356
San Diego de Alejandria 1,866 475 9 8 274
San Juan de los Lagos 7,848 52,375 273 9 22,859
Teocaltiche 3,790 1,678 107 52 89
Union de San Antonio 2,067 789 20 21 799
Villa Hidalgo 3,804 370 7 56 49
Acatic 5,391 20,061 8 6 29,806
Arandas 10,607 31,286 149 50 2,893
Cañadas de Obregon 1,030 255 6 5 40
Jalostotitlan 3,402 327 60 6 2,741
Jesus Maria 2,944 1,228 16 10 42
Mexticacan 750 142 22 4 9
San Ignacio Cerro Gordo NA NA NA NA NA
San Julian 2,309 3,797 5 6 190
San Miguel el Alto 8,293 865 4 5 56
Tepatitlan de Morelos 16,755 35,785 29 26 41,895
Valle de Guadalupe 1,545 2,379 6 6 2,797
Yahualica de Gonzalez
Gallo
1,894 2,336 98 109 381
Regional 112,985 184,205 1,443 840 242,858
State 378,569 313,347 6,341 2,773 411,455
State % 29.84 58.79 22.76 30.29 59.02
Table 7. Geographical location of the sampling points in The Highlands of Jalisco, 2021 (Source: Own elaboration). Sample
identification
key
Location of the sampling point Type Description
N W Altitude
(m)
L1 21°21.071’ 101°55.741’ 1870 River In the center of Lagos
L2 21°20.660’ 101°56.288’ 1867 River At the exit of Lagos

Nipp. J. Environ. Sci., 2(3): 005
5
L3 21°22.880’ 101°56.646’ 1871 Dam Orilla del Agua, north of Lagos
L4 21°22.101’ 101°55.183’ 1872 River At the entrance of Lagos
SJL1 21°14.851’ 102°20.329’ 1713 River In the center of San Juan
SJL2 21°22.319’ 101°56.638’ 1718 Dam Alcala by highway to Lagos
SJL3 21°15.366’ 102°20.733’ 1706 River At the exit of San Juan
SJL4 21°13.733’ 102°18.917’ 1708 River At the entrance of San Juan
E1 21°31.454’ 102°14.461’ 1806 River In the center of Encarnacion
E2 21°31.389’ 102°13.559’ 1845 Dam East of Encarnacion
U1 21°08.467’ 102°00.690’ 1904 Dam At the entrance of Unión de San Antonio
VH1 21°40.440’ 102°35.610’ 1918 River In the center of Villa Hidalgo
VH2 21°41.888’ 102°36.507’ 1941 Dam Guadalupe, west of Villa Hidalgo
VH3 21°41.921’ 102°32.605’ 1875 Dam Juiquinaqui, northeast of Villa Hidalgo
TE1 21°25.581’ 102°34.449’ 1717 River In the center of Teocaltiche
TE2 21°24.683’ 102°34.250’ 1710 River At the entrance of Teocaltiche
O1 21°31.203’ 101°43.349’ 1982 Dam Cuarenta, by road to Lagos
O2 21°52.038’ 101°35.325’ 2216 Dam In the center of Ojuelos
O3 21°44.967’ 101°49.917’ 2073 Dam Duquesa, in municipality of Ojuelos
SDA1 20°59.981’ 102°01.586’ 1960 Dam Amapola, west of San Diego de Alejandria
SDA2 20°59.306’ 101°59.975’ 1943 Dam The Park, in San Diego de Alejandría.
T1 20°51.295’ 102°42.873’ 1904 Dam Jihuite in Tepatitlán
T2 20°51.308’ 102°48.089’ 1888 Dam Carretas in Tepatitlan
T3 20°48.257’ 102°45.765’ 1767 River In the center of Tepatitlan
T4 20°47.258’ 102°48.893’ 1742 River At the exit of the municipality of Tepatitlan
T5 20°49.135’ 102°35.003’ 2052 Dam In Capilla de Guadalupe
T6 20°46.707’ 102°48.202’ 1744 Stream Tributary of the Tepatitlan river
AC1 20°03.078’ 102°49.365’ 1738 Dam Red in the municipality of Acatic
AC2 20°01.435’ 102°57.675’ 1620 Dam Calderon In the municipality of Acatic
AC3 20°45.675’ 102°52.653’ 1697 Dam Lagunillas at Acatic
AC4 20°45.873’ 102°54.002’ 1688 River At the entrance to Acatic
AC5 20°47.009’ 102°56.932’ 1670 River At the exit of Acatic
AC6 20°45.873’ 102°54.356’ 1689 Stream Tributary of the river in Acatic
AR1 20°44.123’ 102°25.564’ 2014 Dam Tule in Arandas
AR2 20°44.478’ 102°20.341’ 2059 River In the center of Arandas
AR3 20°41.214’ 102°19.893’ 2026 River At the exit of Arandas
Y1 21°10.947’ 102°54.149’ 1817 Dam Estribon in Yahualica
Y2 21°00.421’ 102°49.961’ 1473 River Verde before Yahualica
SMA1 20°59.574’ 102°24.312’ 1835 Dam San Miguel in San Miguel el Alto
SMA2 21°01.649’ 102°23.503’ 1843 River In the center of San Miguel
CO1 21°11.702’ 102°42.010’ 1612 River Verde in Temacapulin
SI1 20°46.068’ 102°32.092’ 2069 Dam Mezquite in San Isidro CG
J1 21°09.384’ 102°27.482’ 1749 Dam In Jalostotitlan
J2 21°09.703’ 102°28.005’ 1738 River In the center of Jalostotitlan
SJ1 20°58.204’ 102°10.956’ 2088 Dam San Isidro in San Julian
SJ2 21°00.007’ 102°10.405’ 2052 River At the exit of San Julian
SJ3 21°00.508’ 102°09.004’ 2048 Dam In San Julian
SJ4 21°00.581’ 102°10.204’ 2057 River At the entrance of San Julian
M1 21°16.587’ 102°46.704’ 1756 Dam Paloma in Mexticacan
M2 21°15.937’ 102°46.392’ 1733 River In the center of Mexticacan
M3 21°16.201’ 102°46.596’ 1741 River At the entrance to Mexticacan
JM1 20°43.308’ 102°09.002’ 2207 Dam In Ojo Zarco, Jesús María
JM2 20°39.004’ 102°08.045’ 2171 Dam La Luz in the municipality of Jesus Maria
VG1 21°01.746’ 102°42.002’ 1812 Dam El salto in Valle de Guadalupe
VG2 21°00.604’ 102°37.167’ 1820 River In the center of Valle de Guadalupe
Table 8. Coverage of piped water, drainage and sanitation services by municipality (Source: CEA.Jal, 2019).
Municipality Coverage
of water
piped
(%)
Coverage
of
Drainage
connected
to the
public
network
(%)
Coverage
of
Sanitation
(%)
Encarnacion de Diaz 86.78 81.09 0
Lagos de Moreno 88.49 77.39 66.23

Castañeda-Villanueva
Evaluation of the physicochemical-microbiological quality of surface waters in The Highlands of Jalisco, Mexico
6
Ojuelos de Jalisco 86.21 55.15 6.63
San Diego de Alejandria 89.72 75.83 77.48
San Juan de Los Lagos 79.64 79.29 75.31
Teocaltiche 90.73 70.49 71.41
Union de San Antonio 86.15 64.74 0
Villa Hidalgo 89.93 81.71 0
Acatic 78.0 82.9 64.7
Cañadas de Obregon 86.9 72.4 0
Arandas 82.3 84.6 4.2
Jalostotitlan 91.2 88.9 76.5
Jesus Maria 80.3 69.2 11.0
Mexticacan 89.1 79.5 65.9
San Ignacio Cerro Gordo 83.8 68.8 65.9
San Julian 93.2 86.3 61.3
San Miguel el Alto 86.5 85.9 11.4
Tepatitlan 91.8 91.1 74.7
Valle de Guadalupe 88.7 82.5 83.1
Yahualica 71.2 81.3 61.1
Regional 84.52 78.23 48.38
Table 9. Reference standards to evaluate the physicochemical and microbiological quality of the water bodies of Highlands of
Jalisco (Source: Own elaboration with official information).
Parameter
Unit
COD
mg/L
TN
mg/L
TP
mg/L
SC
mS/cm
DO
mg/L
TCO
NMP/100
ml
NMX-029-SCFI-
2001
0.2-
0.3
NOM-001-
SEMARNAT-1996
60-400 15-
60
NOM-003-
SEMARNAT-1997
40-60
240-1000
NOM-127-SSA1-
1994
10.55
2
NOM-069-ECOL-
1994
120
250
WHO (human
consumption)
2.5 0.2
8.4
(20°C)
3. RESULTS AND DISCUSSION
All Drinking water coverage in The Highlands region (Jalisco), reaches an average 84.52%, as for the drainage
system the coverage is 78.23% and for the sanitation of domestic wastewater is 48.38%. In summary, the
municipalities that show the greatest lags in the coverage of the aforementioned services are: Encarnacion de Diaz,
Union de San Antonio, Ojuelos de Jalisco, Villa Hidalgo, Cañadas de Obregon, Arandas, Jesus Maria and San
Miguel el Alto (Table 8) (CEA-Jal., 2019).
In order to establish the physicochemical-microbiological quality of the surface waters of the main water bodies
(rivers and dams) of the Altos de Jalisco region, in the present study the reference for the microbiological content
was taken as referenced in the NOM- 127-SSA1-1994, likewise for the physicochemical parameters both the
official regulations in force in our country for wastewater and wastewater treated for reuse were considered (NOM-
001-Semarnat-1996, NOM-002-Semarnat-1996, NOM-003-Semarnat-1996, NOM-201-SSA1-2015, NOM-110-
SSA1-1994), as well as those suggested by the World Health Organization (WHO, 2020), whose reference values
appear in the Table 9.
The results are presented in Table 10, where different levels of quality can be seen in the bodies of water in the
study area.
In the present analysis it is highlighted that in practically all sampling points in the study area, there is a certain
degree of contamination, the municipalities that present lower physical-chemical and microbiological quality in
their surface bodies of water are: Lagos de Moreno, San Juan de los Lagos, Encarnacion de Diaz, Union de San
Antonio, Villa Hidalgo, San Diego de Alejandria, Tepatitlan, Acatic, Arandas and San Julian, likewise the
municipalities that present less contamination and therefore better quality in their surface waters are: Teocaltiche,
Mexticacan, Cañadas de Obregon, San Miguel el Alto and Jesus Maria.
Nipp. J. Environ. Sci., 2(3): 005
7
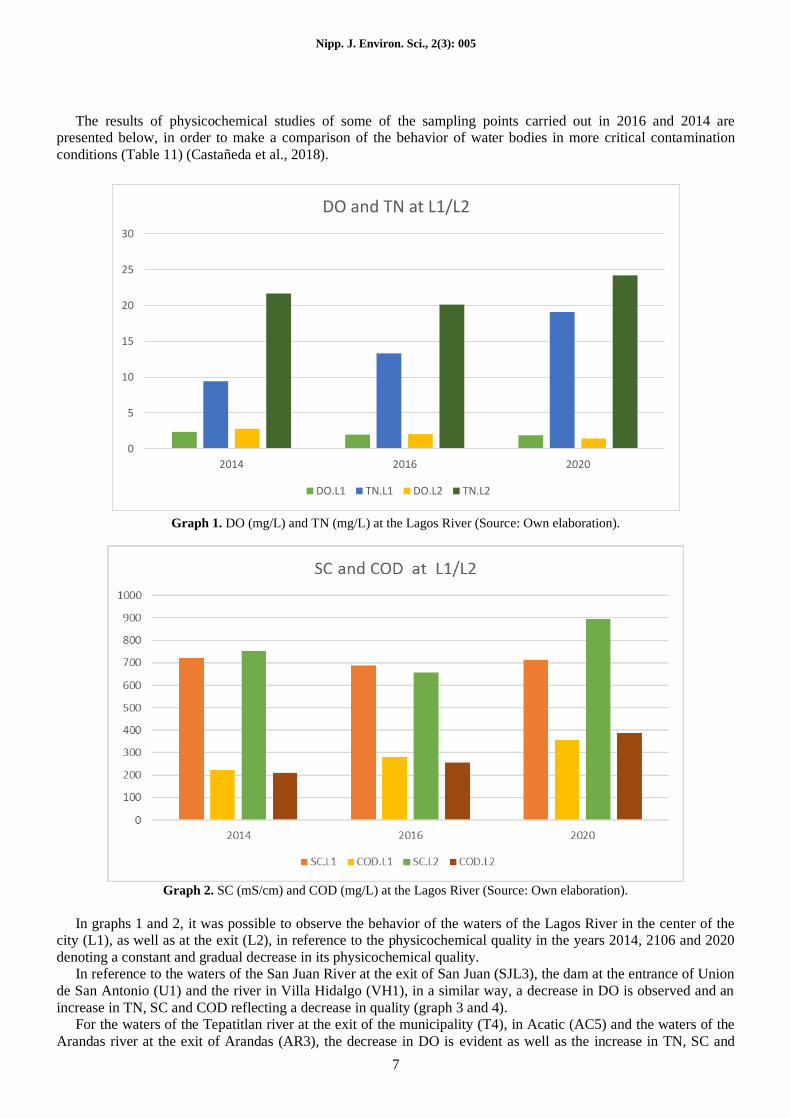
The results of physicochemical studies of some of the sampling points carried out in 2016 and 2014 are
presented below, in order to make a comparison of the behavior of water bodies in more critical contamination
conditions (Table 11) (Castañeda et al., 2018).
0
5
10
15
20
25
30
2014 2016 2020
DO and TN at L1/L2
DO.L1 TN.L1 DO.L2 TN.L2
Graph 1. DO (mg/L) and TN (mg/L) at the Lagos River (Source: Own elaboration).
Graph 2. SC (mS/cm) and COD (mg/L) at the Lagos River (Source: Own elaboration).
In graphs 1 and 2, it was possible to observe the behavior of the waters of the Lagos River in the center of the
city (L1), as well as at the exit (L2), in reference to the physicochemical quality in the years 2014, 2106 and 2020
denoting a constant and gradual decrease in its physicochemical quality.
In reference to the waters of the San Juan River at the exit of San Juan (SJL3), the dam at the entrance of Union
de San Antonio (U1) and the river in Villa Hidalgo (VH1), in a similar way, a decrease in DO is observed and an
increase in TN, SC and COD reflecting a decrease in quality (graph 3 and 4).
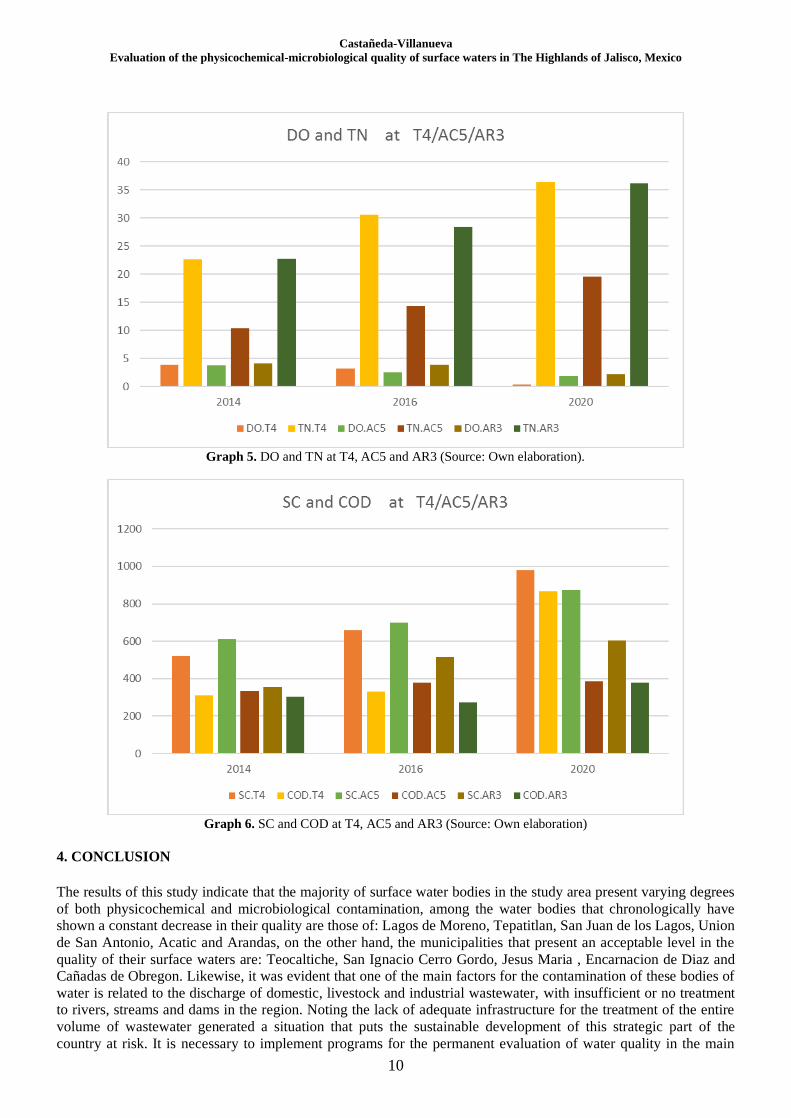
For the waters of the Tepatitlan river at the exit of the municipality (T4), in Acatic (AC5) and the waters of the
Arandas river at the exit of Arandas (AR3), the decrease in DO is evident as well as the increase in TN, SC and

Castañeda-Villanueva
Evaluation of the physicochemical-microbiological quality of surface waters in The Highlands of Jalisco, Mexico
8
COD, denoting the progressive decrease in the quality of the waters of these sampling points (Castañeda, 2020)
(graphs 5 and 6).
Graph 3. DO and TN at SJL3, U1 and VH1 (Source: Own elaboration).
Table 10. Results of the Physicochemical and bacteriological analyzes of surface waters in Highlands of Jalisco, 2020 (Source:
Own elaboration). Key COD
mg/L
TN
mg/L
TP
mg/L
SC
mS/cm
DO
mg/L
TCO
MPN/100 ml
L1 356 19.1 8.1 712.7 1.89 1,500,000
L2 388 24.2 12.5 896.8 1.45 2,900,000
L3 188 14.2 3.4 372.8 2.45 28,000
L4 192 4.3 2.3 223.0 4.65 21,000
SJL1 267 31.1 13.2 874.4 2.56 24,000
SJL2 168 11.7 8.7 137.9 4.56 700
SJL3 432 33.1 16.1 1060 2.03 2,100,000
SJL4 179 26.3 4.8 935.4 4.51 1,700
E1 412 4.9 3.6 601.3 3.78 720,000
E2 163 3.1 1.3 189.2 5.87 70
U1 455 43 13.6 776.8 0.02 9,200,000
VH1 365 12.4 4.2 434.8 2.44 4,000
VH2 171 2.6 1.8 94.4 4.73 46
VH3 87 2.1 1.2 72.1 8.15 7.8
TE1 289 6.8 3.9 493.7 2.45 4,000
TE2 117 3.8 2.1 88.4 6.12 1,600
O1 155 6.5 1.5 83.5 8.54 9,200
O2 325 13.4 3.6 372.7 2.34 1,400
O3 178 2.6 1.7 73.9 7.11 220
SDA1 160 7.5 3.8 125.9 6.56 2,800
SDA2 322 9.3 4.9 393.8 2.73 17,000
T1 193 12.3 2.2 223.6 152 170
T2 122 6.2 1.2 134.3 122 <1.8
T3 398 31.2 5.7 452.9 2.54 42,000
T4 867 36.4 17.3 978.8 0.34 9,200,000
T5 204 9.2 2.7 273.0 3.45 2,100
T6 420 18.l 3.8 634.4 2.12 135,000
AC1 94 15.3 1.3 301.2 7.18 540
AC2 88 12.5 1.5 137.9 7.23 330
AC3 125 15.9 7.1 452.9 3.12 22,000
AC4 125 13.4 8.4 367.4 2.67 46,000
AC5 385 19.6 11.96 874.7 1.78 1,700,000

Nipp. J. Environ. Sci., 2(3): 005
9
AC6 178 6.3 4.1 137.9 5.33 4,900
AR1 90 3.4 1.5 172.3 5.54 28
AR2 183 2.5 2.2 292.3 3.45 4,300,000
AR3 378 36.2 10.1 605.4 2.11 22,000,000
Y1 106 3.36 2.7 163.7 4.23 33
Y2 143 2.8 2.3 277.3 5.32 130
SMA1 135 5.9 2.1 185.8 5.66 110
SMA2 150 7.5 5.7 339.4 4.04 280
CO1 82 7.3 3.1 96.3 6.67 94
SI1 105 3.8 0.7 132.6 8.13 350
J1 151 5.8 1.8 145.6 6.43 920
J2 132 7.3 2.1 98.6 7.34 250
SJ1 175 18.6 5.8 134.6 4.56 2,800
SJ2 123 28.4 9.4 298.3 3.23 24,000
SJ3 69 3.8 0.8 88.7 6.83 170
SJ4 108 17.6 3.9 203.5 5.78 1,700
M1 98 8.8 3.1 432.6 3.23 1,600
M2 68 7.1 2.8 278.1 6.45 79
M3 58 5.7 1.4 104.7 7.88 22
JM1 114 5.9 1.8 177.7 6.89 170
JM2 71 4.8 1.3 155.1 7.43 70
VG1 79 3.8 1.3 232.6 7.23 12
VG2 142 11.9 2.2 453.5 3.56 350
Table 11. Summary of surface water analysis results at The Highlands of Jalisco 2016/2014 (Source: Castañeda et al., 2018).
Key DO (mg/L) TN (mg/L) SC (mS/cm) COD (mg/l) 2016 2014 2016 2014 2016 2014 2016 2014
L.2 2.05 2.80 20.11 21.69 657.6 753.3 255 210
L.1 1.98 2.36 13.32 9.43 689.7 723.8 281 222
SJL.3 1.83 2.15 22.64 16.40 911.4 925.2 291 232
U.1 1.27 1.66 31.12 19.64 734.0 852.6 312 250
VH.1 3.45 4.66 9.67 10.15 254.8 133.5 210 149
T.4 3.23 3.89 30.56 22.61 658.2 521.3 330 312
AC.5 2.46 3.78 14.33 10.36 701.3 611.3 378 333
AR.3 3.90 4.12 28.41 22.73 515.2 356.2 273 302
Graph 4. SC and COD at SJL3, U1 and VH1 (Source: Own elaboration).
Castañeda-Villanueva
Evaluation of the physicochemical-microbiological quality of surface waters in The Highlands of Jalisco, Mexico
10
Graph 5. DO and TN at T4, AC5 and AR3 (Source: Own elaboration).
Graph 6. SC and COD at T4, AC5 and AR3 (Source: Own elaboration)
4. CONCLUSION
The results of this study indicate that the majority of surface water bodies in the study area present varying degrees
of both physicochemical and microbiological contamination, among the water bodies that chronologically have
shown a constant decrease in their quality are those of: Lagos de Moreno, Tepatitlan, San Juan de los Lagos, Union
de San Antonio, Acatic and Arandas, on the other hand, the municipalities that present an acceptable level in the
quality of their surface waters are: Teocaltiche, San Ignacio Cerro Gordo, Jesus Maria , Encarnacion de Diaz and
Cañadas de Obregon. Likewise, it was evident that one of the main factors for the contamination of these bodies of
water is related to the discharge of domestic, livestock and industrial wastewater, with insufficient or no treatment
to rivers, streams and dams in the region. Noting the lack of adequate infrastructure for the treatment of the entire
volume of wastewater generated a situation that puts the sustainable development of this strategic part of the
country at risk. It is necessary to implement programs for the permanent evaluation of water quality in the main
Nipp. J. Environ. Sci., 2(3): 005
11
bodies of water to quantify both the impact of the economic activities of each municipality, and to measure the
effectiveness of actions and policies for environmental control and improvement.
Acknowledgements: We wish to express our appreciation to both the Los Altos University Center of the
University of Guadalajara, especially the Laboratory for Water Analysis and the Academic Groups UDG-CA-561,
UDG-CA-972 for their valuable technical support, as well as the program for the strengthening of Academic
Groups PRODEP-SEP 2020 call, for their support for the achievement of this project.
Conflict of Interest: authors declare that there is no conflict of interest.
REFERENCES
Agenda Estratégica para el Desarrollo Regional de Jalisco-AEDRJ- (2020). Síntesis de los planes regionales de
desarrollo Jalisco 2015-2015. Plan Estatal de Desarrollo Jalisco 2013-2033.
American Public Health Association-APHA- (2012). Standard Methods for examination of water and wastewater.
EPA, 22nd ed. Washington DC. [Date of reference July 24 of 2021]. Available at:
http://www.standardmethods.org/
Castañeda, A. (2020). Physicochemical determination of the quality of surface waters in the Highlands region of
Jalisco, Mexico. In Chemistry Research Journal, 5(6):221-234 ISSN: 2455-8990 CODEN. USA (CRJHA5).
Rajasthan, India. [Date of reference April 15 of 2021]. Available at: https://chemrj.org/
https://chemrj.org/archive/volume-5-issue-6-2020
Castañeda Villanueva, A. A., Flores López, H. E., & Cuevas-Villanueva, R. A. (2018). Diagnóstico de la calidad de
las aguas superficiales en la región de Los Altos Norte de Jalisco, México. Acta Universitaria, 28(6), 1-13.
http://doi:10.15174/au.2018.1843
Comisión Estatal del Agua de Jalisco-CEA-Jal- (2019). Estadísticas por región. [Date of reference March 12 of
2021]. Available at: http://www.ceajalisco.gob.mx/contenido/municipios/regiones
Comisión Nacional del Agua-CONAGUA- (2015). Estadísticas del agua en México. [Date of reference April 16 of
2021]. Available at:
http://www.conagua.gob.mx/CONAGUA07/Publicaciones/Publicaciones/EAM2015.pdf/
Gobierno Constitucional del Estado de Jalisco, (2020). Plan Estatal de Desarrollo 2030. Región 03 Altos Sur. 2°
Edición. Dirección de Publicaciones del Gobierno de Jalisco, Guadalajara, Jalisco, México. [Date of
reference May 2 of 2021]. Available at: https://www.jalisco.gob.mx/es/Jalisco/municipios/
HACH Lab Instruments, (2019). Digital Reactors DRB200. [Date of reference May 23 of 2021]. Available at:
https://www.hach.com/digital-reactors/drb200/family?productCategoryId=51113157534
HACH, (2019). Manual de análisis de agua: Procedimientos fotométricos, Procedimientos de titulación,
Procedimientos microbiológicos. Segunda edición en español. Hach Company, Loveland, Colorado, EE.UU.
HACH, (2019). Espectrofotómetro visible DR2800. [Date of reference Jun 2 of 2021]. Available at:
https://www.directindustry.es/prod/hach/product-14401-699235.html
Instituto Nacional de Estadística y Geografía-INEGI- (2020). Censo de Población y Vivienda 2020. [date of reference July 15th of 2021]. Available at:
Http://cuentame.inegi.org.mx/monografias/informacion/jal/poblacion/default.aspx?tema=me&e=14/
Instituto de Información, Estadística y Geográfica-IIEG- (2019). Municipios de Jalisco. [Date of reference Jun 9 of
2021]. Available at: https://iieg.gob.mx › 03_altos_sur_diagnostico 02 altos_norte
Norma Oficial Mexicana. Secretaria de Salud, NOM-127-SSA1-1994. Salud ambiental, agua para uso y consumo
humano-límites permisibles de calidad y tratamientos a que debe someterse el agua para su potabilización.
(2018). [Date of reference Jun 12 of 2021]. Available at:
http://www.salud.gob.mx/unidades/cdi/nom/127ssa14.html/
Norma Oficial Mexicana. Secretaria de Medio Ambiente, Recursos Naturales y Pesca. NOM-001-Semarnat-1996.
límites máximos permisibles de contaminantes en las descargas residuales en aguas y bienes nacionales (2019). [date of reference May 11th of 2021]. Available at:
http://siga.jalisco.gob.mx/Assets/documentos/normatividad/nom001semarnat1996.htm
Norma Oficial Mexicana. Secretaría de Economía, NMX-AA-030-SCFI-2001. Análisis de agua - determinación de
la demanda química de oxígeno en aguas naturales, residuales y residuales tratadas-método de prueba,
(2001). [Date of reference Jun 15 of 2021]. Available at: https://agua.org.mx/wp-
content/uploads/2011/01/nmx-aa-030-scfi-2001.pdf/
Castañeda-Villanueva
Evaluation of the physicochemical-microbiological quality of surface waters in The Highlands of Jalisco, Mexico
12
Norma Oficial Mexicana. Secretaria de Salud y Asistencia. NOM-230-SSA1-2002: Salud ambiental, agua para uso
y consumo humano, requisitos sanitarios que se deben cumplir en los sistemas de abastecimiento públicos y
privados durante el manejo del agua. procedimientos sanitarios para el muestreo. Diario Oficial de la
Federación, (2002). [Date of reference April 15 of 2021]. Available at:
http://www.salud.gob.mx/unidades/cdi/nom/230ssa102.html/
Norma Oficial Mexicana. Secretaria de Salud y Asistencia, NOM-210-SSA1-2014, Productos y Servicios. Métodos
de prueba microbiológicos. Determinación de microorganismos indicadores. Determinación de
microorganismos patógenos. Diario Oficial de la Federación, (2014). [Date of reference April 14 of 2021].
Available at:
http://dof.gob.mx/nota_detalle.php?codigo=5398468&fecha=26/06/2015#:~:text=1.1%20Esta%20Norma%2
0tiene%20por,%2D%20Ap%C3%A9ndice%20A%20Normativo
Norma Oficial Mexicana. Secretaria de Medio Ambiente, Recursos Naturales y Pesca. NOM-002-Semarnat-1996.
límites máximos permisibles de contaminantes en las descargas de aguas residuales a los sistemas de
alcantarillado urbano o municipal, (2019). [Date of reference Jun 16 of 2021]. Available at:
http://siga.jalisco.gob.mx/Assets/documentos/normatividad/nom002semarnat1996.htm
Norma Oficial Mexicana. Secretaria de Medio Ambiente, Recursos Naturales y Pesca. NOM-003-Semarnat-1996.
límites máximos permisibles de contaminantes para las aguas residuales tratadas que se reusen en servicios
al público, (2018). [Date of reference Jun 16 of 2021]. Available at:
http://siga.jalisco.gob.mx/assets/documentos/normatividad/nom003semarnat1997.htm
Norma Oficial Mexicana. Secretaria de Salud y Asistencia, NOM-110-SSA1-1994, bienes y servicios. preparación
y dilución de muestras de alimentos para su análisis microbiológico. Diario Oficial de la Federación. (1994).
[Date of reference Jun 2 of 2021]. Available at: http://www.salud.gob.mx/unidades/cdi/nom/110ssa14.html/
Norma Oficial Mexicana. Secretaria de Salud, NOM-201-SSA1-2015. Productos y servicios. Agua y hielo para
consumo humano, envasados y a granel. Especificaciones sanitaria, (2015). [Date of reference Jun 12 of
2021]. Available at: http://www.economia-noms.gob.mx/normas/noms/2010/201ssa12015.pdf/
Norma Oficial Mexicana. Secretaria de Salud y Asistencia, NOM-112-SSA1-1994. bienes y servicios.
Determinación de bacterias coliformes. técnica del número más probable. Diario Oficial de la Federación,
(2019). [Date of reference May 2 of 2021]. Available at:
http://www.salud.gob.mx/unidades/cdi/nom/112ssa14.html/
Secretaría de Agricultura y Desarrollo Rural-SEDER- (2019). Expectativas agroalimentarias Servicio de
Información Agroalimentaria y Pesquera, 2019. [Date of reference July 17 of 2021]. Available at:
http://infosiap.siap.gob.mx/gobmx/Brochure%20Expectativas%202019.pdf/
Secretaría de Agricultura, Ganadería, Desarrollo Rural, Pesca y Alimentación-SAGARPA- (2015). Servicio de
Información Agroalimentaria y Pesquera. [Date of reference April 12 of 2021]. Available at:
https://www.gob.mx/siap/acciones-y-programas/produccion-agric.
Servicio de Información Agroalimentaria y Pesquera-SIAP- (2019). Valor de la producción ganadera en Jalisco.
[Date of reference Jun 4 of 2021]. Available at:
http://infosiap.siap.gob.mx/repoAvance_siap_gb/pecCompaEdo.jsp/
Unión de Asociaciones de Silvicultores del Estado de Jalisco-UASEJ- (2021). Asociación de Silvicultores de los
Altos de Jalisco A.C. [Date of reference October 28 of 2021]. Available at:
http://silvicultoresdejalisco.org.mx/asociacion-de-silvicultores-de-los-altos-de-jalisco-a-c/
World Health Organization-WHO- (2020). Guidelines for Drinking Water Quality, Third Edition: Volume 1 -
Recommendations: Guidelines for Drinking Water Quality. First appendix to the third edition. Volume 1.
Geneva, Switzerland.