evaluation of the potential effects of maintenance ... · sedimentation at greco island...
TRANSCRIPT

Memorandum October 25, 2018
130 Battery Street, Suite 400 San Francisco, California 94111
415.230.0862
To: Kevin Vickers, Baker Botts, LLP
Mark Sanders, Westpoint Harbor
From: Michael L. MacWilliams, PE, PhD, and Aaron Bever, PhD, Anchor QEA, LLC
cc: Jaclyn Gnusti, PE, Anchor QEA, LLC
Re: Evaluation of the Potential Effects of Maintenance Dredging at Westpoint Harbor on Sedimentation at Greco Island
Introduction Anchor QEA, LLC, conducted an evaluation of the potential effects of maintenance dredging of 150,000 cubic yards (cy) of sediment at Westpoint Harbor on sedimentation at Greco Island. The purpose of this assessment was to use existing information and previously conducted modeling studies to provide a professional assessment of the effect that this quantity of maintenance dredging at Westpoint Harbor could potentially have on sediment dynamics at Greco Island.
The evaluation used two primary information sources to develop an assessment of the effect of maintenance dredging at Westpoint Harbor on sedimentation at Greco Island:
1. A modeling study conducted for the U.S. Army Corps of Engineers (USACE), San Francisco District, in 2015 applied a high-resolution hydrodynamic and sediment transport model to evaluate the effect of the proposed deepening of the Redwood City Harbor navigational channel on the adjacent Bair Island Restoration Project. The analysis documented in this memorandum references the findings from the modeling work conducted for that study to inform assumptions about the potential magnitude of expected effects of maintenance dredging at Westpoint Harbor, which is in close proximity to Redwood City Harbor.
2. Available aerial imagery collected between 2003 and 2018 was evaluated to assess changes to Greco Island that have occurred prior to and since the construction of Westpoint Harbor in 2006. This analysis documents changes to the Greco Island marsh edge that occurred between 2003 and 2018.
Based on these two sources of available information, Anchor QEA provided a professional assessment of the potential effects of maintenance dredging at Westpoint Harbor on sediment dynamics at Greco Island.

October 25, 2018 Page 2
Analysis of Previous Hydrodynamic and Sediment Transport Modeling In 2015, USACE, San Francisco District, prepared a feasibility report that describes the planning process for improving navigation efficiency at the Port of Redwood City, California (HydroPlan 2015). The recommended plan consisted of deepening the Redwood City Harbor and San Bruno Shoal Channels from -30 feet mean lower low water (MLLW) to -32 feet MLLW and slightly realigning the Redwood City Harbor Channel to avoid sensitive environmental features of Bair and Greco Islands (Figure 1). Due to the close proximity of the Redwood City Harbor Channel and Westpoint Harbor, the analysis conducted for Redwood City Harbor Channel Deepening study can be used to make inferences about the potential effects of dredging at Westpoint Harbor on adjacent islands.
Figure 1 Redwood City Harbor Channel, Turning Basins, and Bair and Greco Islands
Source: HydroPlan 2015 Note: A portion of Westpoint Harbor is visible in the bottom center of the figure.
As described in the feasibility report, analysis of historical data determined that the average sedimentation rate for the Redwood City Harbor Channel is about 183,000 cy per year (HydroPlan 2015). Including the 20% bulking estimate, the recommended plan evaluated by USACE consisted of dredging 1,126,800 cy from the Redwood City Harbor Channel and 638,400 cy from San
Westpoint Harbor
Redwood City Harbor Channel Boundary
October 25, 2018 Page 3
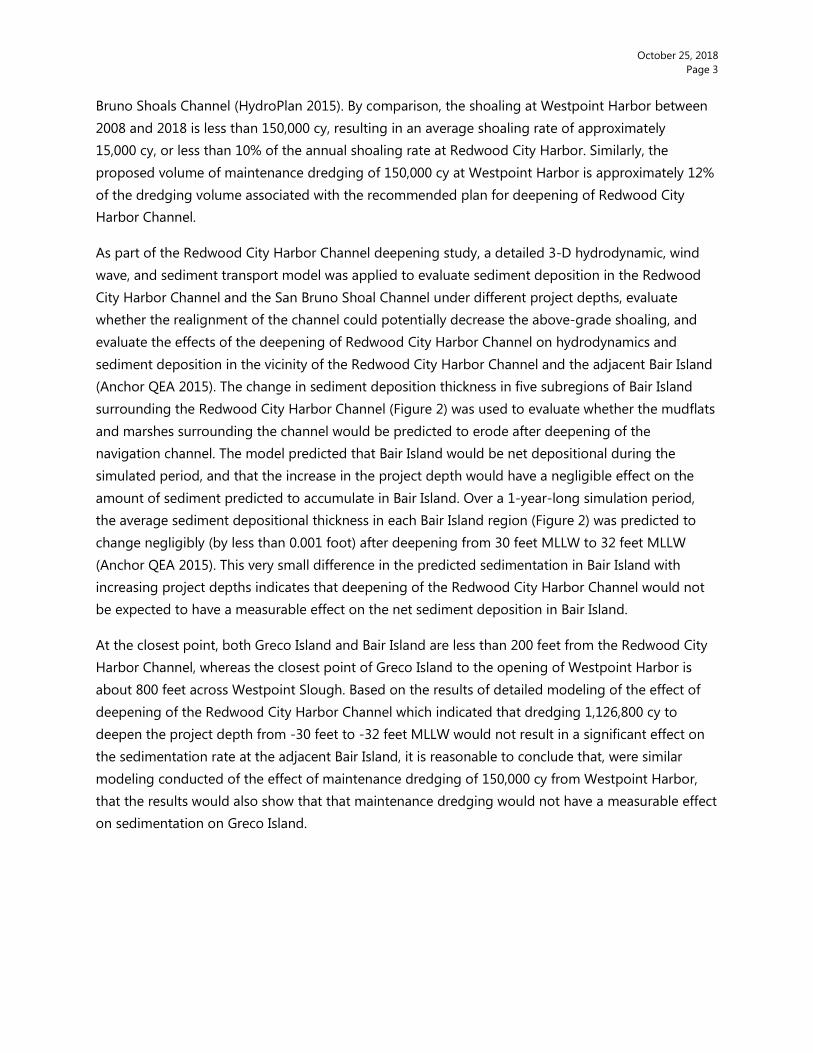
Bruno Shoals Channel (HydroPlan 2015). By comparison, the shoaling at Westpoint Harbor between 2008 and 2018 is less than 150,000 cy, resulting in an average shoaling rate of approximately 15,000 cy, or less than 10% of the annual shoaling rate at Redwood City Harbor. Similarly, the proposed volume of maintenance dredging of 150,000 cy at Westpoint Harbor is approximately 12% of the dredging volume associated with the recommended plan for deepening of Redwood City Harbor Channel.
As part of the Redwood City Harbor Channel deepening study, a detailed 3-D hydrodynamic, wind wave, and sediment transport model was applied to evaluate sediment deposition in the Redwood City Harbor Channel and the San Bruno Shoal Channel under different project depths, evaluate whether the realignment of the channel could potentially decrease the above-grade shoaling, and evaluate the effects of the deepening of Redwood City Harbor Channel on hydrodynamics and sediment deposition in the vicinity of the Redwood City Harbor Channel and the adjacent Bair Island (Anchor QEA 2015). The change in sediment deposition thickness in five subregions of Bair Island surrounding the Redwood City Harbor Channel (Figure 2) was used to evaluate whether the mudflats and marshes surrounding the channel would be predicted to erode after deepening of the navigation channel. The model predicted that Bair Island would be net depositional during the simulated period, and that the increase in the project depth would have a negligible effect on the amount of sediment predicted to accumulate in Bair Island. Over a 1-year-long simulation period, the average sediment depositional thickness in each Bair Island region (Figure 2) was predicted to change negligibly (by less than 0.001 foot) after deepening from 30 feet MLLW to 32 feet MLLW (Anchor QEA 2015). This very small difference in the predicted sedimentation in Bair Island with increasing project depths indicates that deepening of the Redwood City Harbor Channel would not be expected to have a measurable effect on the net sediment deposition in Bair Island.
At the closest point, both Greco Island and Bair Island are less than 200 feet from the Redwood City Harbor Channel, whereas the closest point of Greco Island to the opening of Westpoint Harbor is about 800 feet across Westpoint Slough. Based on the results of detailed modeling of the effect of deepening of the Redwood City Harbor Channel which indicated that dredging 1,126,800 cy to deepen the project depth from -30 feet to -32 feet MLLW would not result in a significant effect on the sedimentation rate at the adjacent Bair Island, it is reasonable to conclude that, were similar modeling conducted of the effect of maintenance dredging of 150,000 cy from Westpoint Harbor, that the results would also show that that maintenance dredging would not have a measurable effect on sedimentation on Greco Island.

October 25, 2018 Page 4
Figure 2 Outline of the five subregions of Bair Island considered in the calculation of sediment depositional volumes. The subregions are: (A) Inner Bair Island; (B) Middle Bair Island, (C) Outer Bair Island; (D) the Outer Bair Island marsh; and (E) the Middle Bair Island marsh
Source: Anchor QEA 2015

October 25, 2018 Page 5
Aerial Imagery Analysis Available aerial imagery collected between 2003 and 2018 was evaluated to assess changes to Greco Island that have occurred prior to and since the construction of Westpoint Harbor. Aerial imagery from Google Earth Pro was used to analyze the location of the Greco Island marsh vegetation edge through time, to determine whether the edge of the marsh vegetation has moved over time, and to better understand the cause of any erosion or accretion. Google Earth Pro is well suited for this analysis of the Greco Island marsh vegetation edge because it allows for the visualization of both past images and the most recent image. The edge of the Greco Island marsh vegetation can be traced on images collected over many years to evaluate whether the marsh vegetation has been eroding or accreting through time. This analysis focuses on four aerial photographs taken near low water when the mudflats were clearly visible between 2003 and 2018 (Table 1) and was limited to a region surrounding Westpoint Harbor (Figure 3).
Table 1 Dates of Aerial Images Used in the Analysis
Date of Image Westpoint Harbor Constructed
December 31, 2003 No
June 16, 2006 No
January 16, 2008 Yes
May 9, 2018 Yes
One of the challenges associated with using aerial imagery for this type of analysis is that the aerial images in Google Earth Pro are not all georeferenced exactly the same, that is, specific locations do not always overlay exactly on images collected on different dates. To minimize the effects of image offset on the analysis of the marsh vegetation edge, only images that were relatively closely aligned were used to estimate the location of the edge of the marsh vegetation. Image position control lines were added along the center of a road with known location to estimate the amount of uncertainty in the location of the traced marsh vegetation edge from potential offsets in the aerial images. The location of the road used for the image position control lines is shown in the small inset box on Figure 3. Figure 4 shows the position control lines for three of the dates analyzed. The georeferenced location of the center of the road shifts by about 10 feet between the December 2003, June 2006, and May 2018 images. However, this offset is not constant in space over the region analyzed. Because the offset is not constant in space, the offset estimated from the position control lines can only be used as a guide to estimate the potential magnitude of uncertainty associated with the traced shorelines. However, the offsets of the position control lines cannot be used to directly correct the traced shoreline positions to remove any image offsets.

October 25, 2018 Page 6
Figure 3 Greco Island in relation to Westpoint Harbor
Note: Green boxes outline the extent of the aerial images used for examining the Greco Island marsh vegetation edge (largest), change in the morphology of the channel through Greco Island (middle), and image position control lines (smallest).
The edge of the marsh vegetation is readily identifiable in the aerial imagery and was examined in aerial images from December 2003 through May 2018. The marsh vegetation edge was traced in georeferenced images using Google Earth Pro by following the edge of the marsh vegetation on the western side of Greco Island and near Westpoint Harbor to the best of our professional judgment (Figure 3). Only images during low water were used so that high water levels did not obscure the edge of the vegetation. These tracings were used to estimate the change in the location of the marsh vegetation edge through time and estimate the effects of sedimentation in Westpoint Harbor on Greco Island relative to other factors that could impact sediment dynamics around Greco Island.

October 25, 2018 Page 7
Figure 4 Tracings of the center of the road used to estimate potential offsets between the aerial images collected on different dates
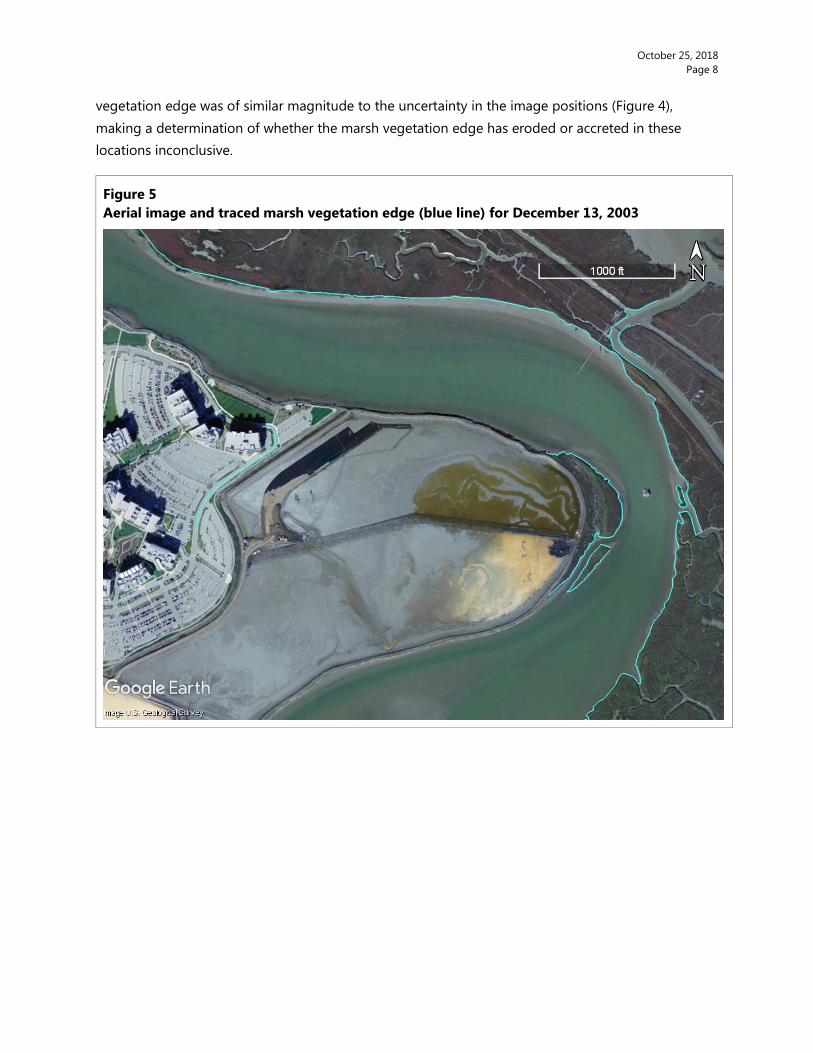
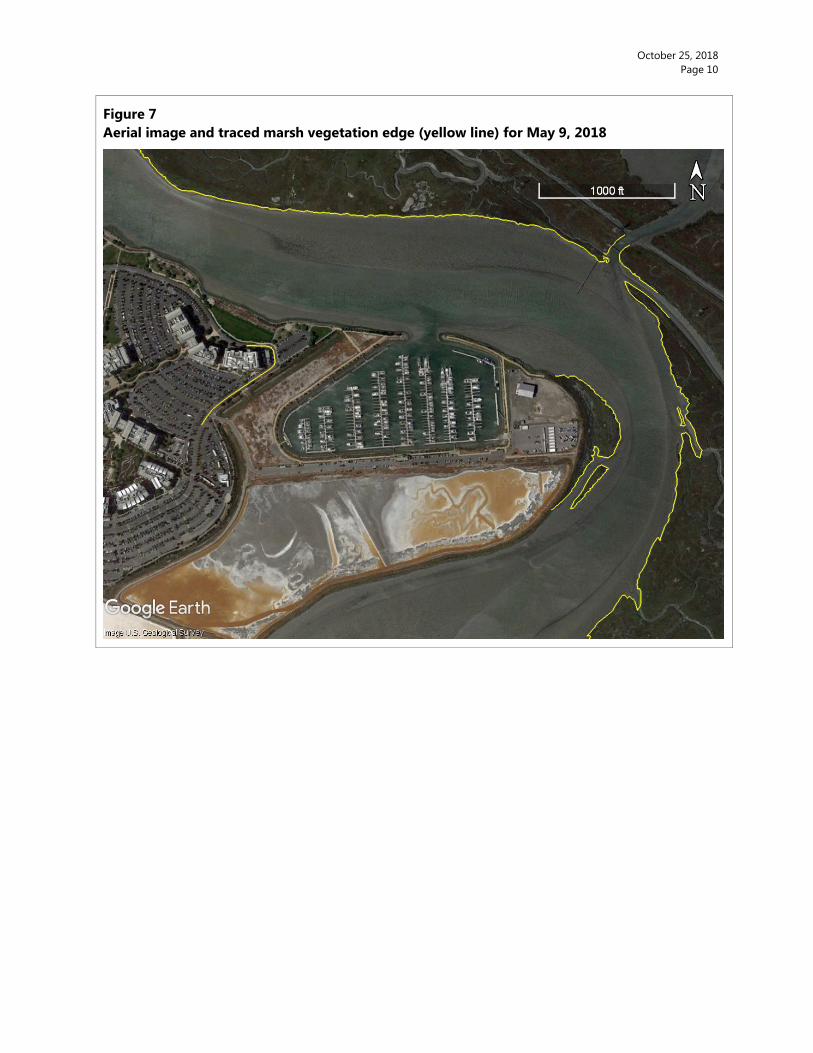
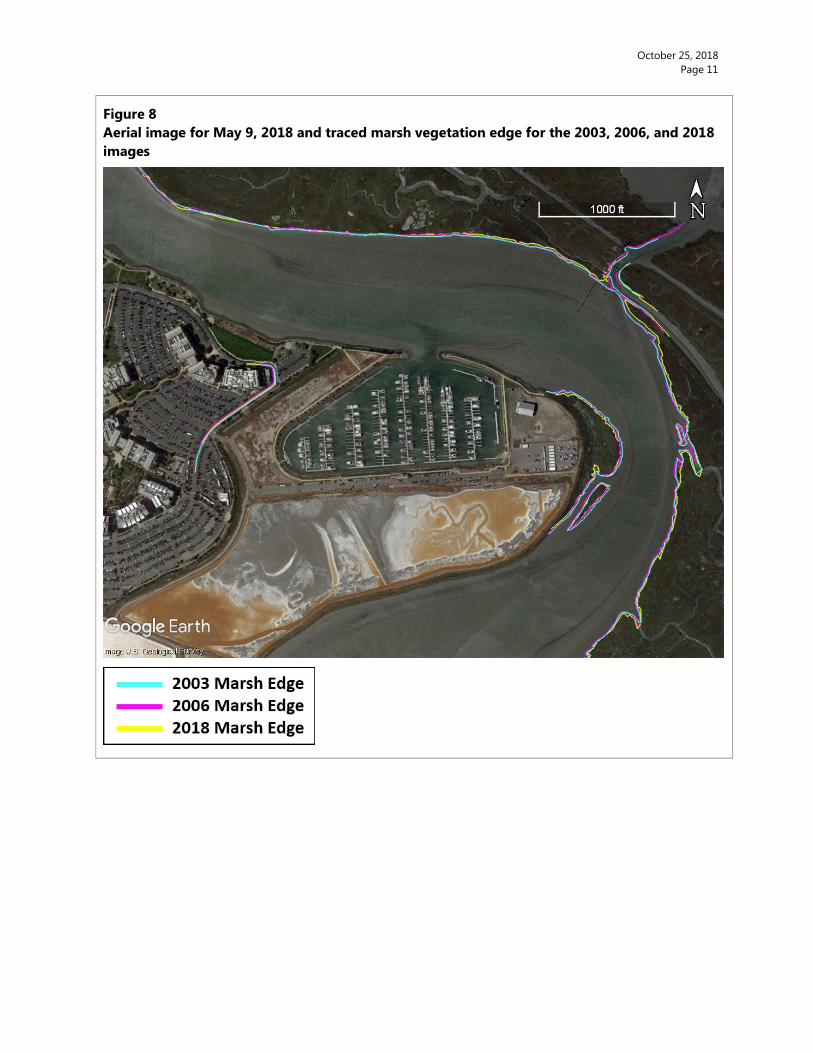
Analysis of the aerial images through time suggests the position of the Greco Island marsh vegetation edge has been relatively constant since 2003, except for the area around the northeast-southwest trending channel through Greco Island. Figure 5 shows the position of the marsh vegetation edge in December 2003. Figure 6 shows the position of the marsh vegetation edge in June 2006. Figure 7 shows the marsh vegetation edge in May 2018. The estimated position of the marsh vegetation edges in all 3 years is shown together with the May 2018 aerial photograph on Figure 8. The location of the marsh vegetation edge changed minimally from 2003 to 2018 northwest and southeast of Westpoint Harbor. In these regions, the shift in the location of the marsh
October 25, 2018 Page 8
vegetation edge was of similar magnitude to the uncertainty in the image positions (Figure 4), making a determination of whether the marsh vegetation edge has eroded or accreted in these locations inconclusive.
Figure 5 Aerial image and traced marsh vegetation edge (blue line) for December 13, 2003

October 25, 2018 Page 9
Figure 6 Aerial image and traced marsh vegetation edge (purple line) for June 16, 2006
October 25, 2018 Page 10
Figure 7 Aerial image and traced marsh vegetation edge (yellow line) for May 9, 2018
October 25, 2018 Page 11
Figure 8 Aerial image for May 9, 2018 and traced marsh vegetation edge for the 2003, 2006, and 2018 images

October 25, 2018 Page 12
However, northeast of Westpoint Harbor near the connection between the northeast-southwest trending channel through Greco Island and Westpoint Slough, the position of the marsh vegetation edge indicates that the marsh vegetation has eroded since 2003. A set of four aerial images centered around where the change in the marsh vegetation has been the largest between 2003 and 2018 was used to understand how the morphology has changed through time and estimate the primary cause of the erosion of the marsh edge. These four aerial images demonstrate that the channel through Greco Island did not connect directly to Westpoint Slough in 2003 (Figure 9, top left). In 2003, a small strip of marsh vegetation separated the channel through Greco Island from Westpoint Sough and the channel took a 90-degree turn near Westpoint Slough. It would not be unusual for the outside of a bend (the southwest side closest to Westpoint Slough) to erode as water flows through a channel. By 2006, water from the channel was beginning to flow into Westpoint Slough depending on the tidal stage but the channel still largely followed the 2003 alignment. The narrow marsh separating the channel and Westpoint Slough that was visible in 2003 had eroded by 2006 (Figure 9, top right) and the channel through Greco Island connected more directly to Westpoint Slough. This change occurred before construction of Westpoint Harbor. Between 2008 (Figure 9, lower left) and 2018 (Figure 9, lower right), the edge of the marsh vegetation near this channel connection to Westpoint Slough continued to erode as the channel through Greco Island continued to widen.
This analysis suggests that the largest morphologic change to Greco Island in the vicinity of Westpoint Harbor between 2003 and 2018 was the opening of the direct connection between Westpoint Slough to the channel through Greco Island. However, this change initially occurred between 2003 and 2006, prior to the construction of Westpoint Harbor. In the portions of Greco Island directly across from the entrance to Westpoint Harbor, the marsh vegetation did not change significantly between 2003 and 2018. This suggests that, within the uncertainty of the aerial photograph alignments, the harbor itself is not having a significant effect on adjacent marsh areas because the closest marsh areas to the harbor have not changed over the period evaluated.
This analysis also highlights one of the challenges associated with monitoring of changes in sediment deposition the vicinity of Westpoint Harbor. With monitoring programs, it is only possible to obtain sedimentation rates or data for a single condition, and from those data it is not possible to directly infer whether any changes detected through the monitoring are directly attributable to a specific action. Natural processes, such as the gradual opening of the channel connection through Greco Island to Westpoint Slough, have resulted in the largest morphologic changes that are evident from the aerial photographs. Because these changes began prior to the construction of Westpoint Harbor, we can assume that they did not occur as a result of any changes in hydrodynamics or sediment dynamics resulting from construction of the harbor.

October 25, 2018 Page 13
Figure 9 Aerial images focusing on the area where the northeast-southwest trending channel through Greco Island now connects to Westpoint Slough

October 25, 2018 Page 14
Conclusions Anchor QEA evaluated a previous modeling study and a suite of historical aerial imagery to provide a professional assessment of the potential effect of maintenance dredging at Westpoint Harbor on sediment dynamics at Greco Island. The previous modeling study evaluated the effect of a deepening project that consisted of dredging 1,126,800 cy from the Redwood City Harbor Channel on sedimentation rates at the adjacent Bair Island site. The Redwood City Harbor Channel is less than 1 mile from Westpoint Harbor; therefore, it is expected that the hydrodynamic and sediment dynamics of the two sites would be similar. The modeling study conducted for the Redwood City Harbor Channel found that average sediment depositional thickness over 1 year at Bair Island was predicted to change negligibly (by less than 0.001 foot) after the channel deepening (Anchor QEA 2015). Based on the analysis of the Redwood City Harbor Channel, which is less than 1 mile from Westpoint Harbor, it is reasonable to conclude that, were similar modeling conducted of the effect of maintenance dredging of 150,000 cy from Westpoint Harbor, the results would also show that that maintenance dredging would not have a measurable effect on sedimentation on nearby marshes or on Greco Island.
Anchor QEA also evaluated available aerial imagery collected between 2003 and 2018 to assess changes to Greco Island that have occurred prior to and since the construction of Westpoint Harbor. In the portions of Greco Island directly across from the entrance to Westpoint Harbor, the marsh vegetation did not appear to change significantly between 2003 and 2018. This suggests that, within the uncertainty of the aerial photograph alignments, the harbor itself is not having a significant effect on adjacent marsh areas. The largest morphologic change to Greco Island in the vicinity of Westpoint Harbor between 2003 and 2018 was the opening of the direct connection between Westpoint Slough to the channel through Greco Island. However, this change initially occurred between 2003 and 2006, prior to the construction of Westpoint Harbor. Natural processes, such as the gradual opening of the channel connection through Greco Island to Westpoint Slough, have resulted in the largest morphologic changes that are evident from the aerial photographs in the study area. Because these changes began prior to the construction of Westpoint Harbor, we can assume that they did not occur as a result of any changes in hydrodynamics or sediment dynamics resulting from construction of the harbor.
Based on these two lines of analysis, it is our professional opinion that maintenance dredging of up to 150,000 cy of sediment from Westpoint Harbor would be very unlikely to have a measurable effect on sedimentation rates at Greco Island or any other nearby marsh. Further, monitoring of sedimentation rates near the harbor can be used to show sedimentation rates change over time, but it is not possible to infer from these measurements any potential effects resulting from the maintenance dredging, because other natural processes and larger-scale processes in the South Bay are likely to have a larger effect of sediment dynamics at Greco Island than the volume of maintenance dredging being considered at Westpoint Harbor.

October 25, 2018 Page 15
References Anchor QEA (Anchor QEA, LLC), 2015. Redwood City Harbor Navigation Improvement Feasibility
Study, Hydrodynamic and Sediment Transport Modeling for Navigation Channel Deepening of Redwood City Harbor. Final Report. Prepared for the U.S. Army Corps of Engineers, San Francisco District. October 2015.
HydroPlan (HydroPlan, LLC), 2015. Draft Integrated Feasibility Report and Environmental Impact Statement/Environmental Impact Report. Redwood City Harbor Navigation Improvement Feasibility Report and Integrated EIS/EIR. Prepared for the U.S. Army Corps of Engineers, San Francisco District. June 2015.