evaluation of the potential impacts of increasing speed ... · evaluation identified a 0.5 mph...
TRANSCRIPT

Evaluation of the PotentialImpacts of Increasing SpeedLimits for HGVs in Scotland
Transport Scotland
February 2018

Evaluation of Impact of Increasing Speed Limitfor HGVs in Scotland
Transport Scotland
Prepared for: Transport Scotland AECOM
Quality information
Prepared by Checked by Approved by
Nick WoollettAssociate DirectorTransportation
Richard Cann Richard Redfern
Revision History
Revision Revision date Details Authorized Name Position
1 8 August 2017 Client comments R Redfern R Cann AssociateDirector
2 10 November2017
Client feedback R Redfern R Cann AssociateDirector
3 22 January 2018 Client feedback R Redfern R Cann AssociateDirector
4 12 February2018
Client feedback R Redfern R Cann AssociateDirector
5 23 February2018
Client feedback R Redfern R Cann AssociateDirector

Evaluation of Impact of Increasing Speed Limitfor HGVs in Scotland
Transport Scotland
Prepared for: Transport Scotland AECOM
Prepared for:Transport Scotland
Prepared by:Nick WoollettAssociate Director TransportationT: +44 (0)1392 663212E: [email protected]
AECOM Limited1 TanfieldEdinburghEH3 5DAUK
T: +44 131 301 8600aecom.com
© 2016 AECOM Limited. All Rights Reserved.
This document has been prepared by AECOM Limited (“AECOM”) for sole use of our client(the “Client”) in accordance with generally accepted consultancy principles, the budget forfees and the terms of reference agreed between AECOM and the Client. Any informationprovided by third parties and referred to herein has not been checked or verified by AECOM,unless otherwise expressly stated in the document. No third party may rely upon thisdocument without the prior and express written agreement of AECOM.

Evaluation of Impact of Increasing Speed Limitfor HGVs in Scotland
Transport Scotland
Prepared for: Transport Scotland AECOM
Table of ContentsExecutive Summary .............................................................................................................. 51. Introduction .................................................................................................................. 8
1.1 Introduction ......................................................................................................... 81.2 Scope of Research ............................................................................................. 81.3 Structure of this Report ....................................................................................... 9
2. Literature Review ....................................................................................................... 102.1 Approach .......................................................................................................... 102.2 Flows and Traffic Volumes .................................................................................112.3 Speeds ............................................................................................................. 122.4 Safety ............................................................................................................... 152.5 Environment...................................................................................................... 172.6 Economic Factors ............................................................................................. 18
3. Highway Network Audit and Analysis ......................................................................... 193.1 Introduction ....................................................................................................... 193.2 Road Network and Traffic Flows ....................................................................... 203.3 Average Vehicle Speeds ................................................................................... 233.4 Accidents on the Scottish Road Network .......................................................... 263.5 Summary .......................................................................................................... 27
4. Model Assessment and Analysis ................................................................................ 284.1 Introduction ....................................................................................................... 284.2 Modelling Using Transport Model for Scotland .................................................. 284.3 TEE Outputs ..................................................................................................... 304.4 Summary .......................................................................................................... 35
5. Summary of Evidence ................................................................................................ 375.1 Introduction ....................................................................................................... 375.2 Single Carriageway Trunk Roads ...................................................................... 375.3 Single Carriageway Non-Trunk Roads .............................................................. 375.4 Dual Carriageway Trunk Roads ........................................................................ 38
Appendix A - References ..................................................................................................... 39Appendix B - Speed and Flow Data Processing .................................................................. 40

Evaluation of Impact of Increasing Speed Limitfor HGVs in Scotland
Transport Scotland
Prepared for: Transport Scotland AECOM5/44
Executive SummaryPurpose and Aims of the ResearchIn 2012, the Scotland Act gave Scottish Ministers the power to determine the level of thenational speed limits on dual carriageways and motorways. These powers also extend to theability to set vehicle-specific speed limits, such as those for Heavy Good Vehicles (HGVs).
In April 2015, the speed limits for HGVs over 7.5 tonnes were increased in England andWales; from 40 to 50 mph on single carriageways and from 50 to 60 mph on dualcarriageways. Scottish Ministers did not mirror the 2015 increases and there are nowdifferent HGV speed limits in Scotland than those in place in England and Wales; in Scotlandthe limit for HGVs is 40 mph on single carriageways and 50 mph on dual carriageways.
Transport Scotland commissioned AECOM to consider the potential impacts of increasingHGV-specific speed limits on Scottish roads. No specific speed limit change was identifiedby Transport Scotland and the commissioning of the research did not indicate any intentionor commitment to implement any revised speed limits.
ApproachThe research was undertaken as four interlinked tasks:
Literature review: to understand the evidence that exists regarding the impacts of speedlimit changes on speed, safety, environment, and economic factors;
Emerging evidence: AECOM is currently undertaking the evaluation of the impact of theHGV speed limit change in England and Wales. The first annual report was consideredas part of this research;
Audit of the Scottish Road Network: data was collated in order to build up an overview ofthe Scottish road network. This enabled an understanding of how similar the network isto that of England and Wales and hence how transferrable conclusions from theevaluation are; and
Analysis of potential impact: using the evidence gathered in the previous tasks, AECOMthen sought to provide reasoned conclusions on the potential impacts of an increase inHGV speed limits in Scotland. This included some limited use of transport modelling.
This research was limited in scope, and was not intended as a Scottish equivalent of the fullImpact Assessment undertaken by the UK DfT prior to the introduction of the HGV speedlimit increase in England and Wales. The consideration of impact quantification have paiddue respect to the capabilities of the modelling software available, in particular theconfidence in model outputs and margins of error.
Key FindingsLiterature Review and Emerging EvidenceA review of existing evidence confirmed the assumed links between vehicle speeds, roadsafety and wider impacts on the environment and economy. Extensive academic andindustry research outlined the impacts of increasing average speeds, particularly of HGVs,including increased risks of road traffic collisions and increased severity of casualties. Anincrease in HGV speeds also negatively impacts their stopping distances, which couldcontribute to collision risks.
However, evidence from studies undertaken by the Department for Transport (DfT) andTransport Scotland highlighted that an increase in HGV speeds could reduce the speeddifferential with other traffic, thereby reducing the occurrence of risky overtaking. Higher

Evaluation of Impact of Increasing Speed Limitfor HGVs in Scotland
Transport Scotland
Prepared for: Transport Scotland AECOM6/44
HGV speeds, and reduced delay for other vehicles no longer travelling in platoons behindslower moving HGVs, could also generate journey time and vehicle operating cost benefits.
Audit of the Scottish Road Network and Analysis of Potential ImpactThe evidence of the impacts of HGV speed increases on factors such as accident rate andseverity was therefore clear. However, there was little empirical evidence on the impacts ofHGV speed limit increases on HGV speeds. An important factor in such an analysis was thelevel of speed limit compliance in the before situation. To consider the potential impacts, areview was undertaken of the Scottish road network and evidence from the England andWales year one evaluation.
The key findings for single carriageway trunk roads were:
Single carriageway trunk roads make up approximately 4% of the Scottish rural roadnetwork and carry an estimated 14% of the HGV miles operated;
The baseline (2016) average free flow speeds of HGVs on single carriageway trunkroads in Scotland was 48.2 mph. This is well in excess of the 40 mph speed limit thatexists;
In comparison, the baseline for England and Wales was 46.4 mph, which increased byapproximately 1.5 mph following the speed limit change to 50 mph. The post speed limitchange average speed was therefore still below the baseline value observed inScotland; and
There was no compelling evidence to indicate whether, or by how much, HGV averagespeeds could increase on Scottish single carriageway trunk roads should the speed limitincrease to 50 mph. The high baseline average speed suggested that the speed limit isnot the determining factor in HGV driver behaviour.
The main findings for single carriageway non-trunk roads were:
Single carriageway non-trunk roads make up approximately 40% of the Scottish ruralroad network, and carry an estimated 30% of freight mileage;
The baseline 2014 average HGV speed was lower (44.6 mph) for non-trunk than trunk,but this was still nearly 5 mph above the 40 mph speed limit; and
The speed differential between HGVs (44.6mph) and light vehicles (48.9) was low in2016, reflecting the slower average speeds on such roads and despite the limit of60mph for non-HGVs. These free flow average speeds suggest that the characteristicsand topography of these roads are likely to be contributing to constraining averagespeeds for both light and heavy vehicles.

Evaluation of Impact of Increasing Speed Limitfor HGVs in Scotland
Transport Scotland
Prepared for: Transport Scotland AECOM7/44
The initial modelling work has indicated that should a change in speed limit on Scottishsingle carriageway roads result in a 1.5 mph increase in HGV average speeds (as perEngland and Wales), the travel time and vehicle operating benefits were within the margin oferror of the national transport model (ie around zero). There are small safety benefits andCO2e emissions increases when restricting the speed limit change to trunk roads only.Conversely, when the speed limit increase is applied to all rural roads there are small safetydisbenefits and CO2e reductions.
Furthermore, there was no compelling evidence that an increase in HGV speed limits inScotland would result in such an increase in average vehicle speeds, with any change indriving behaviour considered likely to occur on a route-by-route basis. The impacts of theimplementation of a speed limit increase across all single carriageway roads couldeffectively be limited to legitimising existing driving behaviour in terms of speed. It wouldthough provide a consistency across Scotland, and in relation to limits in England andWales.
The key findings for dual carriageways were:
Dual carriageway trunk roads make up approximately 1% of the Scottish rural roadnetwork, and carry approximately 6% of freight mileage;
The baseline HGV average speed for Scottish dual carriageway trunk roads was 47.8mph, which was below the baseline speed limit across all road types; and
The baseline HGV average speed of 52.2 mph in England and Wales was relatively highand above the baseline speed limit (50 mph). The England and Wales year oneevaluation identified a 0.5 mph increase in average HGV speeds following a change inspeed limit from 50 mph to 60 mph.
These numbers could indicate the potential to increase HGV speeds in Scotland. It couldequally reflect existing constraints (e.g. topography or bendiness) on these roads that keepaverage speeds in Scotland below 50 mph. An increase of between 0.5 mph (England andWales) and 4 mph (to match average speeds on Scottish motorways) could be anticipatedfollowing an increase in speed limit; the latter, although considered unrealistic, could havesignificant impacts on safety and the environment. Overall, with the relatively short length ofthe dual carriageway trunk road network, and the forecast economic benefits, relative tosingle carriageways, there is not compelling evidence to increase the HGV speed limit from50 mph to 60 mph across all such roads.
RecommendationsIt is recommended that the evidence emerging from the year two England and Walesevaluation and A9 evaluation should be reviewed prior to any formal conclusions beingdrawn. This could be undertaken in Spring 2018 following the availability of A9 related data.

Evaluation of Impact of Increasing Speed Limitfor HGVs in Scotland
Transport Scotland
Prepared for: Transport Scotland AECOM8/44
1. Introduction
1.1 Introduction
1.1.1 In late 2016 Transport Scotland commissioned a research project to collateevidence through which to consider the potential impacts of any increase in thespeed limit for HGVs on single and dual carriageways in Scotland. The 2012Scotland Act gave Scottish Ministers the power to determine the level of thenational speed limits on dual carriageways and motorways (currently 70 mph) andsingle carriageway roads (currently 60 mph) as well as associated vehicle speedlimits in Scotland (e.g. HGV speed limits of 40 mph on single carriageways and 50mph on dual carriageways). The 2016 Scotland Act devolved all remaining powersto amend speed limits to the Scottish Parliament, including the national urbanspeed limit of 30 mph.
1.1.2 The powers that have been devolved were utilised, with effect from October 2014,to allow for the maximum speed limit for HGV’s over 7.5 tonnes to be raised from 40mph to 50 mph on single carriageway sections of the A9 between Perth andInverness. The decision to implement this speed limit increase was taken due to theparticular considerations applicable to that specific route and incorporated anAverage Speed Camera system in order to mitigate any risks.
1.1.3 In April 2015, HGV speed limits were increased in England and Wales from 40 mphto 50 mph on single carriageway roads and 50 mph to 60 mph on dual carriagewayroads for vehicles weighing more than 7.5 tonnes. The Department for Transport(DfT) published an impact assessment to accompany the increase which predicteda rise in fatalities and serious injuries as a result of the change. They havesubsequently commissioned AECOM and Atkins to undertake a three yearevaluative study of the speed limit changes which seeks to understand the impactof the increase on speeds, safety, the environment and the economy.
1.1.4 Scottish Ministers did not mirror the 2015 increase in HGV speed limits in Englandand Wales and, therefore, there are now different HGV speed limits in Scotlandthan those in place in England and Wales.
1.2 Scope of Research
1.2.1 The purpose of the research was to determine the potential impacts of any HGVspeed limit changes, to inform future policy decisions. Any realised benefits in termsof reduced journey times and operating costs following a change in speed limits(assuming a change in average speeds resulted) would be expected to improve theoperating conditions for the logistics sector. However, there are potentially negativeair quality and safety impacts of any increase in speed limits.
1.2.2 This research consists of four elements:
Literature Review – to provide context for future policy decisions, understandthe evidence that exists regarding the impacts of speed limit changes onspeed, safety, environment and economic factors;
Emerging evidence from HGV Evaluation – a summary of the emergingevidence from evaluation of the impact of the change in HGV speed limit in

Evaluation of Impact of Increasing Speed Limitfor HGVs in Scotland
Transport Scotland
Prepared for: Transport Scotland AECOM9/44
England and Wales (recognising that findings are emerging, with only the firstannual report currently available), and evidence from the A9 between Perth andInverness;
Audit of Scottish Road Network – use data provided by Transport Scotland tosummarise the characteristics of the Scottish road network. This is comparedwith baseline characteristics of England and Wales, in order to understandwhether observed changes in England and Wales can with confidence bepredicted to manifest similar observable changes in Scotland, should a speedlimit change be implemented;
Analysis of Potential Impact – analyse the Scottish road network in order tounderstand the potential impact of an increase in HGV speed limit. Thisincludes some limited quantification using transport modelling.
1.3 Structure of this Report
1.3.1 This report contains the following sections:
Section 2: Literature review and Emerging Evidence;
Section 3: Highway network audit and Analysis of Potential Impact; and
Section 4: Transport Modeling and Analysis.
1.3.2 The report also includes Appendices of supporting evidence and information.

Evaluation of Impact of Increasing Speed Limitfor HGVs in Scotland
Transport Scotland
Prepared for: Transport Scotland AECOM10/44
2. Literature Review
2.1 Approach
2.1.1 The first task of this commission was to undertake a short literature review ofevidence pertaining to the potential impacts of changes in HGV speed limits. Thisincluded the impacts of increasing HGV specific speed limits on key factors such asspeed, flows and safety, and any differences in impacts between trunk road andnon-trunk road networks.
2.1.2 In October 2015, the DfT commissioned AECOM/Atkins to undertake a three yearevaluation of changes in HGV speed limits1 in England and Wales. This workincluded a rapid evidence review, completed in March 20162. This presentcommission therefore built on the 2016 work. An initial search was undertaken fornewly published material, to supplement the previous evidence review. However,this search determined that very limited new material had been published nationallyor internationally since March 2016. A full list of references is provided in AppendixA.
2.1.3 The focus of this initial task was therefore to report a short synthesis of the availableevidence on the potential impacts of increasing speed limits for HGVs. Thisincluded the initial evidence from the DfT evaluation and data from the A9 speedlimit and Average Speed Camera pilot. This will help to inform future considerationson HGV speed limits in Scotland. The findings of the literature review are presentedunder the following key areas of evidence on the potential impacts of changing HGVspeed limits:
Traffic flows and volumes;
Speeds;
Safety;
Environment; and
Economic factors.
1 50 mph on single carriageways (up from 40 mph) and 60 mph on dual carriageway (up from 50 mph) for HGVs over 7.5tonnes.2 Evaluation of the national HGV Speed Limit Increase: Scoping Report, AECOM, Atkins 2016

Evaluation of Impact of Increasing Speed Limitfor HGVs in Scotland
Transport Scotland
Prepared for: Transport Scotland AECOM11/44
2.2 Flows and Traffic Volumes
2.2.1 It could be hypothesised that an increase in HGV speed limits could lead to reduceddelays for other vehicles, and thereby induce further travel demand. Traffic speedsand flow characteristics influence journey time, and may in turn influence routechoice, and thereby flows on specific routes. However, there was no evidence foundthat directly linked an increase in speed limit and changes in traffic volumes.
2.2.2 The lack of empirical evidence of the impacts of speed limit changes on flows wassupported by the emerging evidence from the DfT evaluation, where no significantchanges in flows were identified following the limit uplift. Data from April toDecember 2014 were used to understand the baseline situation (before the speedlimit changes). Data from April to December 2015 were used for the analysis of theinitial impact of the speed limit changes.
2.2.3 The DfT evaluation commission will continue to monitor changes in traffic volumesat selected sites, against national trends in traffic growth, to provide an indication ofchanges. For some sites, parallel roads have been included in the study and it willbe possible to compare flows on those routes before and after the introduction ofspeed limit changes. Further data will be added as part of the ongoing evaluation toextend the timeframe of the analysis and thereby provide increased confidence inthe results.
2.2.4 Research on the A9 has focused on the change in HGV speed limit on singlecarriageways (from 40mph to 50mph). The work included three counting stations tocollect data on traffic volumes; these sites are located between Perth andInverness. The data is presented as a seven day annual average daily flow (AADF)which represents a standard format for these types of reports; the collection oftraffic volume data has been interrupted by maintenance operations on the route.From the data available there is a suggestion that traffic growth is slowing on thestretch north of Aviemore when compared with the original baseline. As thesefigures take account of the peak summer months they can vary considerably duringthis period. To ensure that this information is correct, data will be extracted fromother counter sites on this stretch for verification purposes and the outcome will beprovided later in 20173. Given the above evidence, attributing any observedchanges in flows directly to the change in speed limit is considered extremelyunlikely.
2.2.5 Overall, the effects of speed limit changes on traffic volumes is considered likely tobe limited, although this will vary by location and road characteristics.
3 In early 2017 Transport Scotland commissioned AECOM to undertake a full ex-post evaluation of the three year pilot, withreporting due in early 2018.
Evaluation of Impact of Increasing Speed Limitfor HGVs in Scotland
Transport Scotland
Prepared for: Transport Scotland AECOM12/44
2.3 Speeds
2.3.1 The key potential impact area of changing HGV speed limits is the speeds of bothHGVs and other vehicles. If flows remain constant the HGV speed limit increasecould increase HGV speeds and reduce the speed differential between HGVs andcars. Furthermore, increases in HGV speeds could impact on their stoppingdistance and the prevalence and risks associated with overtaking. These factorsassume an increase in speeds resulting from speed limit changes. To consider this,the research has reviewed available evidence on speed limit compliance andaverage speeds before and after limit changes.
Speed Compliance2.3.2 The 2009 TRL appraisal made use of 190 Automatic Traffic Count sites
representing free flow conditions maintained by the DfT, to consider the percentageof HGVs exceeding the pre-change limit. The estimated average speed of HGVsover 7.5 tonnes on single carriageways in England and Wales was in the range 43-45 mph, therefore over the 40mph limit. This finding was supported by research forDfT (AECOM/Atkins 2015 - ongoing), which estimated the free-flow speed of HGVsover 7.5 tonnes on single carriageways with a national speed limit of 40mph as 45.8mph, and the equivalent average speed over a range of flows from 0 – 1,000vehicles per hour as 44.2 mph.
2.3.3 For national speed limit (50mph) dual carriageways the free-flow speed wasestimated as 52.2 mph and the average speed over a range of flows 0 – 1,600vehicles per hour per lane was 52.6 mph. Again, above the baseline speed limit.This evidence is important context for potential speed changes following any speedlimit increase, as HGVs were already exceeding pre-change limits.
2.3.4 The 2012 Speed Enforcement and Vehicle Speed Report on the A9 identified thatthe average HGV speeds on single carriageways before the speed limit change was50.0 mph4; the figure for dual carriageways was 53.7 mph. This was thereforeabove the speed limit indicating a high level of non-compliance. The November2016 monitoring report states that the introduction of the Average Speed Camerasin November 2014 has resulted in a reduction of over 63% in the number of driversacross all modes being detected speeding.
4 It should be noted that only 3 of the A9 count sites had the capability to identify HGVs over 7.5 t and therefore this data isbased on a small sample.
Evaluation of Impact of Increasing Speed Limitfor HGVs in Scotland
Transport Scotland
Prepared for: Transport Scotland AECOM13/44
Average Speeds2.3.5 The DfT Impact Assessment for the 2015 HGV speed limit change5 indicated that
an increased average speed would be expected for single carriageways but not ondual carriageways. Furthermore, a reduction in speed variance for HGVs would beexpected on single carriageways, whilst it would be unchanged on dualcarriageways. The results of the year one ex-post analysis of the HGV speed limitchange in England and Wales indeed showed that average speeds for HGVs over7.5 tonnes on single carriageway roads had increased between 2014 and 2015 byjust over 1 mph calculated across a range of flow conditions. The equivalent figurefor dual carriageways was an increase of less than 0.5 mph. Restricting the analysisto free flow conditions, the increases were 1.5mph and 0.7mph for single and dualcarriageways, respectively. These results also showed that the average HGVspeeds on single and dual carriageways were not both below the speed limit.
2.3.6 A separate study carried out by SIAS Limited and TRL, on behalf of TransportScotland in May 2012, involved the development of a microsimulation model of theA9(T) covering 80 km between Dalwhinnie and Moy. The baseline data was derivedfrom the ‘Vehicle speed and speed enforcement summary report 2012’ (TransportScotland, May 2012). Additional data was collected via portable equipmentpositioned near the proposed speed camera sites; it should be noted that spotspeed data were captured from the respective counters, not average speed.Furthermore, Bluetooth technology was used to measure journey times (andthereby speeds) along the A9. As part of this assessment, a scenario was modelledwith increased speed limits for HGVs over 7.5 tonnes to 50mph on single and60mph on dual carriageways. The assessment demonstrated that by increasingHGV speed limits, in association with average speed cameras, the following resultsshould be expected:
A slight increase in average HGV speeds and consequently a reduction injourney times. This is in line with the emerging DfT results;
The average speed of all vehicles would reduce due to a reduction in thenumber of vehicles exceeding the speed limit; and
The average speed of all vehicles would remain lower than the baseline,primarily because of the camera enforcement.
2.3.7 Monitoring on the A9 has determined that there was a large change in drivingbehaviour and speed limit compliance immediately following the implementation ofthe Average Speed Cameras. The data indicated that there has been very littlechange to the speed profile along the route following this, evidencing a sustainedchange in driver behaviour since the pilot started. The latest data continues todemonstrate high levels of speed limit compliance and the occurrence of vehiclestravelling at more than 10mph above the speed limit continues to be low.
5 DfT Impact Assessment for Single and Dual Carriageways:https://www.gov.uk/government/uploads/system/uploads/attachment_data/file/336315/hgv-single_-carriageway-impact-assessment.pdfhttps://www.gov.uk/government/uploads/system/uploads/attachment_data/file/380984/Annex_D_-_Impact_Assessment_-_dual_carriageway_speed_limits_FINAL.pdf

Evaluation of Impact of Increasing Speed Limitfor HGVs in Scotland
Transport Scotland
Prepared for: Transport Scotland AECOM14/44
Stopping Distances2.3.8 There is evidence that increased HGV speeds impact on their stopping distances:
at 40mph the distance is approximately 42m; and at 50mph it is approximately 62m(evidence from a pre-implementation appraisal of the potential impacts of HGVspeed limit changes on traffic speeds undertaken by TRL in 2009)6. This increase ofapproximately 20m was supportive of the 2002 research (Knight et al 2002).However, as noted in the TRL work there are important technological developmentsthat will assist in mitigating this risk:
‘Electronic Braking Systems (EBS) reduce the reaction time within the brakingsystem, improve the distribution of the braking force between the wheels and alsoincorporate self-diagnostic capability. The effect of EBS is an importantconsideration when looking at the potential effect of increasing the speed limit from40mph to 50mph. As of 2009 EBS was not mandatory for HGVs. However, manynew vehicles are voluntarily equipped with it and it will soon become mandatory tofit electronic stability control (ESC) to HGVs. All current ESC systems are onlyavailable for EBS equipped vehicles so it is likely that mandating ESC will result inalmost 100% fitment of EBS without any further specific requirements.
2.3.9 The levels of change observed in average HGV speeds from the DfT and A9evaluations suggest that there will only be a minimal impact on stopping distances.
Overtaking2.3.10 Summersgill et al (2009) included research on the impacts of vehicle speeds on
overtaking manoeuvres. A distinction was made between an ‘accelerative’ and‘flying’ overtaking manoeuvre, where an accelerative overtake is defined as onewhere the following vehicle has slowed to around the speed of the vehicle in frontand therefore has to accelerate to overtake, and a flying overtake is defined as onewhere the following vehicle does not slow before overtaking and overtakes at asimilar speed to its approach speed. The former is considered more relevant as thisis the most likely form of overtaking for the majority of road conditions, other thanthose where traffic flows are very low.
2.3.11 The research highlighted the large increase in distances (sight distance, gap inoncoming traffic and road distance) required for an overtaking manoeuvre as thespeed of the vehicle to be overtaken increases. For example, a vehicle driving at 35mph would require a distance of 118m to complete an overtaking manoeuvre, with asite distance of approximately 300m. This is compared to a vehicle travelling at 55mph that would require a distance of 600m and a site distance of over 1,000m.Maycock et al (1998) concluded that the required sight distance would increase by35m for every 2.2 mph increase in speed of the vehicle to be overtaken.
2.3.12 The SIAS work also forecast that the change in speed limit would reduce theoccurrence of long platoons, which could in turn reduce the desire to overtake.
6 Summersgill et al 2009

Evaluation of Impact of Increasing Speed Limitfor HGVs in Scotland
Transport Scotland
Prepared for: Transport Scotland AECOM15/44
Other Evidence2.3.13 The DfT evaluation also included interviews with HGV drivers. HGV drivers noted
the opinion that the ability to drive up to 50 mph on single carriageways had, or will,reduce collisions involving the overtaking of HGVs. The research determined that allindividuals consulted were aware of the speed limit changes on singlecarriageways, but not all were aware of the changes on dual carriageways.Conversely, 25% of non-HGV drivers were aware of the changes. The level ofawareness among residents living adjacent to roads affected by the speed limitchanges was also very low.
Summary2.3.14 The emerging evidence of changes in average HGV speeds following speed limit
changes in England & Wales and on the A9 show a small increase in speeds onsingle carriageways in free flow conditions. There was a very small increase on dualcarriageways, largely in line with appraisal forecasts. The analysis of speed andflow data will be repeated in the DfT study in 2017 and 2018, extending thetimeframe and quantity of data, thereby improving understanding of the impact ofthe speed limit changes. These levels of average speed change would indicate thatstopping instances and overtaking impacts will be low. However, this does notpreclude some HGVs increasing their speeds significantly, thereby contributing tothe aforementioned impacts.
2.4 Safety
2.4.1 A central consideration of the increase in HGV speed limits is the consequentimpacts on safety. There are both positive and negative potential impacts. Anincrease in HGV speeds, leading to the reduced speed variance between HGVsand general traffic, could reduce overtaking. However, increased speeds couldpotentially increase the severity of accidents involving HGVs.
2.4.2 Research (documented by Finch et al 1994) concluded that higher speeds areassociated with more accidents. Elvik (2009) also concluded that high speed andvariations in speed, increase the probability of accidents and serious personalinjuries. However, none of the existing research has been directly related tochanges in HGV speed limits. It has also been forecast that accidents resulting fromovertaking manoeuvres are the most likely type of collisions to be affected by achange of speed limits for HGVs (Summersgill 2009 and Heydecker 2013).

Evaluation of Impact of Increasing Speed Limitfor HGVs in Scotland
Transport Scotland
Prepared for: Transport Scotland AECOM16/44
2.4.3 For research on the A9, baseline safety data was taken from the 1st Januarythrough to 31st December, for each calendar year between 2011 and 2013. Datafrom 2014 has been excluded due to the seven month construction programme forthe speed cameras, ensuring the associated activities would not influence thebaseline data. The forecast safety impact of increasing the HGV speed limit inisolation on the A9 was inconclusive. However, accident benefits were consistentlypredicted when an increase in HGV speed limits was combined with speedenforcement measures and significant cost savings were estimated. The 2016 postspeed limit change Monitoring Report shows a sustained drop in injury collisionsand casualties across the route compared with the 2011-13 baseline. The mainfindings include:
The number of fatal casualties between Dunblane and Inverness is down byalmost 43% compared to the baseline average;
The number of ‘fatal and serious’ collisions between Dunblane and Invernessoverall is down by almost 45%, with fatal and serious casualties down byalmost 63%;
There have been no fatal collisions between Dunblane and Perth with thenumber of serious collisions down by over 60% and serious casualties down byover 47%;
The number of ‘fatal and serious’ collisions between Perth and Inverness isdown by over 33%, with fatal and serious casualties down by 59%;
The number of serious injury casualties between Perth and Inverness is downby almost 69%;
The overall number of casualties of all classes between Dunblane andInverness is down by 45%; and
Since the last report there have been no fatal collisions on the A9 within themonitoring area.
2.4.4 Although it is not possible to attribute the above results to the change in speedlimits for HGVs against the impact generated by introducing the speed cameraenforcement system, it is evident that the increased level of speed compliance andreduced speed differential will have contributed to the improved safety.

Evaluation of Impact of Increasing Speed Limitfor HGVs in Scotland
Transport Scotland
Prepared for: Transport Scotland AECOM17/44
2.4.5 The initial analysis undertaken as part of the DfT’s evaluation7 on safety databetween 2005 and 2015 identified that:
Historically, up to 17% of all reported collisions in England and Wales haveoccurred on single carriageway (50 mph and 60 mph speed limit) and dualcarriageway (60 mph and 70 mph speed limit) roads;
7.6% of the total collisions on these roads were reported to involve HGVs;
Before the introduction of the new speed limits there had already been a trendof collisions reducing on these roads, though the rate of reduction had slowedin recent years; and
In the period following the introduction of the new HGV speed limits there ispreliminary evidence of a reduction in HGV collisions estimated to be between10% and 36%, however, it is not possible to assign this directly to the speedlimit changes as opposed to other road safety policies or campaigns.
2.5 Environment
2.5.1 The potential environmental impacts of increasing HGV speed limits are, in part,related to the influence on average speeds and flow characteristics (e.g.acceleration and deceleration). The DfT Impact Assessment for the 2015 HGVspeed limit change forecast that an increase in mean speeds for HGVs on singlecarriageways of approximately 4 mph would be associated with the following costsand benefits (using standard DfT values of cost):
A benefit in terms of NOx, with a net present value (NPV) estimated to be£0.9m;
A cost in terms of PM10 with a NPV of -£0.1m;
A cost in terms of CO2 with a NPV of -£14.9m; and
A cost in terms of noise, with a NPV of -£7.3m.
7 https://www.gov.uk/government/publications/increased-speed-limit-for-heavy-goods-vehicles-over-75-tonnes-initial-summary-report/evaluation-of-the-national-hgv-speed-limit-increase-in-england-and-wales-year-1-interim-summary-september-2016#contents

Evaluation of Impact of Increasing Speed Limitfor HGVs in Scotland
Transport Scotland
Prepared for: Transport Scotland AECOM18/44
2.5.2 The increase in carbon emissions were due to the increased fuel consumption ofHGVs, and the increased forecast speeds would result in an increase in noise.Conversely, the benefits in terms of local air quality forecast for NOx were related tovehicle emission curves improving as HGV speeds increase. However, particulatematter emission curves forecast a slight cost associated with an increase in speeds.Overall, there was a forecast cost of £21.4m associated with single carriageways.
2.5.3 No change was forecast for dual carriageways in either average speed or,therefore, emissions. This again highlights the importance of identifying the actualchange in speeds, taking into account the high pre-change averages compared tothe actual speed limits. The literature review found no evidence that a change inspeed limits for heavy vehicles resulting in large changes in overall noise levels.
2.5.4 Results on the A9 included a small reduction in overall tailpipe emissions (allvehicles combined) in conjunction with speed enforcement measurements. A slight,general increase in emissions for slow moving/heavy vehicles was also forecast tobe offset by reductions in emissions for all other vehicle types.
2.6 Economic Factors
2.6.1 The economic benefits will be derived by reducing journey times and accidents.Operational improvements on the A9 from an increase in HGV speed was expectedto be counter balanced by the cost of the speed enforcement measures. However,the reduced number of accidents would help off-set any operational disbenefits.Further work will be undertaken as part of the DfT evaluation in 2018 to estimatethe economic implications of changing the speed limits for HGVs.

Evaluation of Impact of Increasing Speed Limitfor HGVs in Scotland
Transport Scotland
Prepared for: Transport Scotland AECOM19/44
3. Highway Network Audit and Analysis
3.1 Introduction
3.1.1 The literature review has highlighted the importance of any increase in averagespeeds, resulting from speed limit changes, on the range of impact areas. Althoughthe DfT and A9 data indicated no significant increase in average speeds, the formercombines data from multiple sites of varied characteristics, and the latter has theAverage Speed Camera complexity. To assess the potential impact on Scottishroads it was necessary to review the baseline speed and flow characteristics.
3.1.2 This section therefore contains the results of an audit of the Scottish road networkundertaken for the purpose of understanding the existing situation in regards totraffic flows, speeds and accidents. Some analysis and discussion has beenproduced herein to consider what indications the existing situation provides aboutthe possible impact of an increase in the speed limit for HGVs on Scottish roads.Where possible, a comparison with the England & Wales network, prior to theintroduction of increased speed limits for HGVs, has been made in order toestablish the level of comparability between the base cases in the two locations,
3.1.3 Establishing the level of comparability allows the level of confidence with whichobserved differences in the England & Wales network post-implementation of theHGV speed limit could be expected to occur in Scotland to be assessed. As theeffect of any policy change relating to the speed limits for HGVs on Scottish roads isconsidered likely to principally affect rural roads, the audit has generally focused onthis road type.
3.1.4 The discussions contained in this section are focused around three of the researchquestions outlined in the project scope of services:
What proportion of HGV traffic is currently using roads which would be affectedby an increase in the HGV speed limit (distinguishing between national speedlimit trunk roads and non-trunk roads)?
What is the average speed of HGVs > 7.5 tonnes on the different road types inScotland and how does this compare with the England and Wales averagesprior to April 2015? and
What proportion of accidents on national speed limit single carriageways anddual carriageways involve an HGV and how does this compare with theEngland and Wales averages prior to April 2015?

Evaluation of Impact of Increasing Speed Limitfor HGVs in Scotland
Transport Scotland
Prepared for: Transport Scotland AECOM20/44
3.2 Road Network and Traffic Flows
Road Network Classification3.2.1 Table 1 presents a summary of the length of the Scotland and England & Wales
road networks in 2016, based on DfT statistics8. Scotland has a rural road networkof just under 29,000 miles, roughly a quarter of the length of the rural road networkin England & Wales (128,323). For both Scotland (78.9%) and England & Wales(85.7%) a large proportion of the rural network is made up of minor rural roads,which include road types affected by the policy change in England & Wales(predominantly single carriageway roads where the national speed limit applies).
3.2.2 Around 1% of Scotland’s rural roads are motorways, lower than the 1.5% inEngland & Wales; however, trunk roads form a greater proportion of the ruralnetwork in Scotland overall, at around 6% compared with 3% in England & Wales.
3.2.3 The reported categorisation of road types does not include speed limits, so it isdifficult to quantify the length of the rural road network in Scotland which would beaffected by any possible policy change. However, around 28,700 miles of the ruralScottish network are either single or dual carriageway, and of these around 1,700miles are trunk roads.
Table 1. Summary of Road Lengths in Scotland and England & Wales
Scotland England and Wales
Miles % of RuralNetwork
Miles % of RuralNetwork
Motorway 283 1.0% 1,984 1.5%
Rural A Trunk Single 1,406 4.9% 1,611 1.3%
Rural A Trunk Dual 276 1.0% 1,713 1.3%
Rural A PrincipalSingle
4,078 14.1% 11,945 9.3%
Rural A Principal Dual 57 0.2% 1,111 0.9%
Minor Rural 22,838 78.9% 109,959 85.7%
All Rural Roads 28,937 100% 128,323 100%
All Roads 36,888 209,622
8 Department for Transport Road Lengths Statistics – RDL0101 Road Lengths (miles) by Road Type and Region and Countryin Great Britain, 2016 https://www.gov.uk/government/statistical-data-sets/rdl01-road-lengths-miles

Evaluation of Impact of Increasing Speed Limitfor HGVs in Scotland
Transport Scotland
Prepared for: Transport Scotland AECOM21/44
Road Traffic Flows3.2.4 Traffic Estimates for Great Britain 20169 indicated that for both Scotland and
England & Wales, the motorway network carries a significant proportion of totalvehicle miles10, notwithstanding the fact that it represents a small part of the totallength of the rural road network (Table 2). This proportion is more than a third inEngland & Wales (34.3%) and slightly less than a quarter in Scotland (23.9%).Comparing the number of vehicle miles with the physical length of the motorwaynetwork allows for a rudimentary estimate of annual average daily flows (AADFs) onmotorway links (2-way) with estimates of 87,000 vehicles AADF for England &Wales and 46,000 vehicles AADF for Scotland. The difference at least partly reflectsthe fact that a large proportion of the Scottish motorway network is two-lane,whereas a large proportion of the network in England & Wales is three or morelanes.
Table 2. Vehicle Miles in Scotland and England & Wales by Road Type (fromDfT Table TRA0103)
Scotland England and Wales
Billion VehicleMiles
% of RuralRoad Miles
Billion VehicleMiles
% of RuralRoad Miles
Motorway 4.8 23.9% 63.0 34.3%
Rural A Trunk 5.6 27.9% 33.2 18.1%
Rural A Principal 5.1 25.4% 49.9 27.15
Minor Rural 4.6 22.9% 37.7 20.5%
All Rural Roads 20.1 100% 183.8 100%
All Roads 28.6 295.0
3.2.5 The remainder of the trunk road network in Scotland carries a higher proportion oftraffic than in England & Wales, 28% compared with 18%, whilst the proportion oftraffic on principal A-roads and minor roads is similar across both areas. In all casesan estimate of the average traffic flows on links indicates that average traffic flowson rural roads in Scotland are substantially lower than those in England & Wales.
3.2.6 Overall, the Scottish rural road network vehicle miles is just under 11% of that inEngland & Wales (20.1 billion miles versus 183.8 billion miles) despite having anetwork which is around a quarter of the length.
9 Department for Transport Road Traffic Estimates Table TRA0103 Motor Vehicle Traffic (vehicle miles) by Road Class andRegion and Country in Great Britain, annual 2016https://www.gov.uk/government/statistics/road-traffic-estimates-in-great-britain-201610 There is no data available on the percentage of HGVs in terms of vehicle flow.

Evaluation of Impact of Increasing Speed Limitfor HGVs in Scotland
Transport Scotland
Prepared for: Transport Scotland AECOM22/44
3.2.7 The DfT also reports goods moved in million tonne miles by country (DfT TableRFS0140). This data source has been used to compare the amount of freightmoved on the Scottish road network compared with the England & Wales network.In 2015 there were 8,631 million tonne miles of road freight movements fromScotland to other parts of the United Kingdom and 85,681 million tonne miles ofcorresponding road freight movements from England & Wales. Whilst internationalmovements are not included in these totals, these domestic movements representaround 90% of the total freight movements of vehicles registered in the UnitedKingdom.
3.2.8 In terms of the level of HGV traffic using roads that could be influenced by anyspeed limit change (assuming a similar policy to that applied in England & Wales) itis not possible to answer this question directly from the data obtained. The reportedclassification of roads for DfT and Transport Scotland statistics does not matchdirectly with the road classes where a change in speed limit could be applied. Inany case, where vehicle miles are reported by vehicle type they also do notdistinguish between different road types.
3.2.9 However, a rudimentary estimate has been made based on the statistics for allvehicle traffic across the Scottish road network and linking this with the million tonnemiles of freight moved in Scotland (Table 3). This estimate indicates that around athird (35.6%) of HGVs > 7.5t traffic in Scotland could be impacted by a speed limitincrease for that vehicle type (depending on the scope of any policy change).However, the estimate required a number of assumptions and should be viewedwith a high degree of caution: HGV vehicle proportions are consistent across road types;
All trunk single and dual carriageway roads are within scope (have speed limitshigh enough to be impacted by any policy change);
All principal11 dual and 75% of principal single roads are within scope;
50% of minor rural roads are within scope and all are assumed to be singlecarriageway;
Dual carriageway roads carry on average twice the traffic flows of singlecarriageway roads.
Table 3. Estimate of % of Heavy Vehicle Miles on Roads which could beAffected by any Increase in Speed Limit
Extent of speed limitincrease
Estimate ofproportion of road
network
Estimate ofproportion of total
heavy vehiclemiles
Million tonnemiles
Trunk SingleCarriageways 3.8% 14.1% 1,214
Trunk Single and DualCarriageways 4.6% 19.6% 1,690
All Single Carriageways 43.1% 35.1% 3,031
All Single and DualCarriageways 44.0% 35.6% 3,072
11 Transport Scotland define principal roads as the main strategic non-trunk road section. These do not include all minor roads.

Evaluation of Impact of Increasing Speed Limitfor HGVs in Scotland
Transport Scotland
Prepared for: Transport Scotland AECOM23/44
3.3 Average Vehicle Speeds
3.3.1 An audit of average vehicle speeds has been undertaken using speed datacollected from automatic traffic counters on the Scottish road network (in 2016). Theresults of this audit have been compared with the results of the baseline work fromthe England & Wales study (2014). The results are used to consider the averagespeed of HGVs > 7.5 tonnes on the different road types in Scotland.
3.3.2 The analysis involved processing data from a large number of sites withobservations covering the whole of 2016. As such, the work involved was complexand there were a number of assumptions and limitations applied. These arecovered in more detail in Appendix B. This element of the audit set out to consideraverage speeds for different road types, including those which would be affected byany policy change, and also by vehicle type. The work is summarised in Table 4 andTable 5 covering free flow speeds (the average speeds of vehicles whenunrestricted by other traffic) and average speeds across a range of flowsrespectively. The speed limits for light and HGVs are shown in brackets for eachrow.
3.3.3 The analysis shown in Table 4 indicates that free flow speeds on motorways anddual carriageways are faster in England & Wales than in Scotland for both lightvehicles and HGVs > 7.5t. On motorways the difference for speeds of light vehiclesis pronounced – close to 10 mph with speeds in Scotland of 62 mph. For HGVs >7.5t the difference is much smaller at 2 mph, with average speeds in Scotland of 52mph. One important consideration in comparing results across the two networks isthe nature of the motorway network in Scotland which is predominantly two-lane.Other research has shown that this does restrict vehicle speeds because heavyvehicles can use the outside lane to overtake thereby limiting the speeds of othervehicles in some situations.
Table 4. Average Free Flow Speeds in Scotland and England & Wales byRoad and Vehicle Type
Scotland 2016 England and Wales 2014
Estimated average free flowspeed (mph)
Estimated average free flowspeed (mph)
Light vehicles HGVs > 7.5t Light vehicles HGVs > 7.5t
Motorway(HGV limit60mph)
70 mph 2-lane 61.6 52.1 71.2 54.1
DualCarriage-way(HGV limit50mph)
Trunk 70 mph2-lane 57.8 47.8 65.4 52.2
SingleCarriage-way(HGV limit40mph)
Trunk 60 mph 53.8 48.2 53.2 46.4
Non-Trunk 60mph 48.9 44.6 50.4 45.2

Evaluation of Impact of Increasing Speed Limitfor HGVs in Scotland
Transport Scotland
Prepared for: Transport Scotland AECOM24/44
3.3.4 The average speeds were also different on trunk road dual carriageways, whereaverage speeds of light vehicles in England & Wales were nearly 8 mph faster thanthose in Scotland, with a lower speed differential of more than 4 mph for HGVs >7.5t.
3.3.5 The two road types described to this point should generally be the most consistent,i.e. the motorway network and much of the trunk dual carriageway is built tohighway design standards. On this basis, one possible conclusion is that drivers inEngland & Wales choose to drive at higher speeds. However, this does not reflectthe full picture as even on these road types, factors such as the varied topographyof Scotland and the different prevailing weather conditions are likely to influencedriver behaviour.
3.3.6 For trunk road single carriageways (excluding the A9 where the speed limit forHGVs > 7.5t is 50 mph) the comparison indicates very similar average free flowspeeds for light vehicles. However, HGVs > 7.5t were recorded as travelling around2 mph faster on Scottish roads (48.2mph) than in England & Wales (46.4mph).
3.3.7 It is worth noting that the estimated average free flow speed of HGVs >7.5t inScotland on trunk road single carriageways is over 48 mph and therefore less than2 mph below the threshold which would be set by an increase in the speed limit forthis vehicle type. In fact, the average recorded free flow speed of HGVs > 7.5t onthis road type is slightly greater than for trunk road dual carriageways, which is acounterintuitive result and likely to reflect a wide margin of error in the calibration ofrecorded speeds by the traffic count equipment.
3.3.8 For non-trunk single carriageways the comparison across the two networks is againsimilar for light vehicles and also in this case for HGVs > 7.5t. Both Scotland andEngland & Wales speeds were over the 40 mph speed limit. In general speeds onnon-trunk single carriageways are a little lower than on their trunk roadcounterparts, a result which matches expectations based on the generally higherstandard of trunk road links. Although it could be hypothesised that an increase inHGV speed limit from 40mph to 50mph on non-trunk single carriageways couldincrease average speeds, it should be noted that some of these roads are likely tohave speeds constrained by the topography and characteristics.
3.3.9 The results for average speeds across a full range of flows shown in Table 5 (0 –1,000 vehicles per hour per lane for single carriageways, 0 – 1,600 vehicles perhour per lane for dual carriageways and 0 – 1,800 vehicles per hour per lane formotorways) are generally in line with the results for free flow speeds. The lowerspeeds reflect conditions where the speed of individual vehicles is restricted by theoverall traffic stream.
3.3.10 There are some occasions when the speeds across the full range of flows are thesame or slightly higher than the free flow speeds and this reflects the fact that thelow flow conditions used for calculating the free flow speeds often correspond withnight-time conditions where drive behaviour is different, particularly on unlit roads.

Evaluation of Impact of Increasing Speed Limitfor HGVs in Scotland
Transport Scotland
Prepared for: Transport Scotland AECOM25/44
Table 5. Average Speeds for a range of flows in Scotland and England & Walesby Road and Vehicle Type
Scotland 2016 England and Wales 2014
Estimated average speedfor range of flows (mph)
Estimated average speedfor range of flows (mph)
Lightvehicles
HGVs >7.5t
Lightvehicles HGVs > 7.5t
Motorway(HGV limit60mph)
70 mph 2-lane 59.9 52.1 71.9 54.2
DualCarriage-way(HGV limit50mph)
Trunk 70 mph 2-lane 55.6 47.8 65.7 52.6
SingleCarriage-way(HGV limit40mph)
Trunk 60 mph 50.9 46.7 47.1 43.6
[Trunk A9 60 mphsites (not included inabove)]
53.6 50.9 N/A N/A
Non-Trunk 60 mph 46.3 43.3 49.1 44.8
3.3.11 The detailed discussion around average speeds, leads to the following broadconclusions:
The average speed of HGVs > 7.5t on motorways in Scotland is approximately4 mph higher than on dual carriageway trunk roads. This could be interpretedthat the maximum increase in HGV > 7.5t speeds on dual carriageways inScotland following any speed limit increase would be likely to be a maximum of4 mph;
The average speed of HGVs > 7.5t on dual carriageway trunk roads in Scotlandis approximately 2 mph lower than the existing 50 mph speed limit and alsolower than the equivalent speed on dual carriageways in England & Wales;
The reported average speed of HGVs > 7.5t on single carriageway trunk roadsin Scotland is considerably higher than the 40 mph existing limit (46.7 mph overthe full range of flows) and also higher than on roads in England & Wales; and
On non-trunk road single carriageways, the average speeds of HGVs > 7.5t inScotland are lower than dual or trunk road single carriageways but still greaterthan the current 40 mph limit. For this road type Scottish speeds are lowerthan the England & Wales averages which may reflect the more variedtopography and challenging weather conditions found on average on Scottishroads.

Evaluation of Impact of Increasing Speed Limitfor HGVs in Scotland
Transport Scotland
Prepared for: Transport Scotland AECOM26/44
3.4 Accidents on the Scottish Road Network
3.4.1 This section discusses the results of analysis of five years’ worth of STATS19records covering all collisions in Scotland with the aim of identifying the proportionof accidents on national speed limit single carriageways and dual carriageways thatinvolve an HGV. Table 6 summarises the analysis of STATS19 records for Scotlandcovering a full five years from 2011 to 2015. Collisions have been assigned to eachroad classification on the basis of a calculation of the proximity of accident locationswith the Scottish road network in GIS.
Table 6. Summary of 2011 – 2015 Collisions on Scottish Road Network
Road Type
Collisions Collisions involvingHGV > 7.5t
Proportion of Collisionsinvolving HGV > 7.5t
Slight Serious& Fatal Slight Serious &
Fatal Slight Serious& Fatal All
Motorway 1,628 227 208 50 12.8% 22.0% 13.9%
Dual Carriageway (6012
or 70 mph) Trunk 1,091 272 97 40 8.9% 14.7% 10.1%
Dual Carriageway (60 or70 mph) All 1,427 370 109 44 7.6% 11.9% 8.5%
Single Carriageway (50or 60 mph) Trunk 2,029 765 127 74 6.3% 9.7% 7.2%
Single Carriageway (50or 60 mph) All 8,688 3,089 322 175 3.7% 5.7% 4.2%
All Study Roads 11,743 3,686 639 269 5.4% 7.3% 5.9%
All Collisions 37,344 8,530 1,020 384 2.7% 4.5% 3.1%
Study Road Collisionsas % of Whole
31% 43% 63% 70%34% 65%
12 The speed limits lists in Table 6 are the maximum limit for the road type, and not specific to HGVs. The presence of two limitsin a row indicates the range of roads within the category, including those with national speed limits and those with lower limits.

Evaluation of Impact of Increasing Speed Limitfor HGVs in Scotland
Transport Scotland
Prepared for: Transport Scotland AECOM27/44
3.4.2 Across all roads within the scope of a policy change (single carriageways with 50and 60 mph speed limits and dual carriageways with 60 and 70 mph speed limits)there were 11,743 slight injury collisions and 3,686 serious and fatal collisions onthe Scottish road network between 2011 and 2015. This accounts for around 34% ofthe total collisions on Scottish roads in that period. This proportion is much higherthan observed in the DfT evaluation work in England & Wales where, over a periodof ten years running up to April 2015; collisions on these road types constitutedbetween 15% and 17% of all collisions.
3.4.3 The analysis indicates that HGVs > 7.5t are involved in more than 10% of collisionson trunk road dual carriageways and 8.5% of collisions across all dual carriagewayroads. On single carriageways HGVs > 7.5t are involved in more than 7% ofcollisions on trunk roads and more than 4% of collisions across all roads.Considering all roads within the scope of a policy change, HGVs are involved in 5.9of collisions. This proportion is comparable with the DfT evaluation work in England& Wales, which identified that collisions involving an HGV >7.5t constituted between5.5 to 7.6% of collisions on these road types.
3.5 Summary
3.5.1 In relation to the three research questions set out in paragraph 3.1.3 the followingconclusions can be drawn:
35.6% of the Scottish HGV mileage is on roads which would be affected byspeed limit changes similar to those adopted in England & Wales;
Average HGV speeds (across a range of flows) were:
- 47.8 mph on dual carriageways was 48 mph therefore 2 mph below thepresent speed limit;
- 46.7 mph on single carriageway trunk roads, therefore over the existing 40mph speed limit;
- 43.3 mph on non-trunk single carriageways; and
The proportion of road traffic collisions involving HGVs were:
- 10% on dual carriageways;
- 7% on single carriageway trunk roads;
- 4% on non-trunk single carriageways; and
- Compared to between 5.5% and 7.6% on roads in England & Wales.
3.5.2 The analysis presented above indicates significant differences between observedbehaviour on the Scottish road network and that of England & Wales. This leads tothe conclusion that it cannot be predicted with any confidence that the emergingevidence from the evaluation of the impact of the change in HGV speed limits inEngland & Wales will be repeated in Scotland, should such a policy change beimplemented.

Evaluation of Impact of Increasing Speed Limitfor HGVs in Scotland
Transport Scotland
Prepared for: Transport Scotland AECOM28/44
4. Model Assessment and Analysis
4.1 Introduction
4.1.1 In considering the potential impacts of increasing HGV speed limits it has beennecessary to postulate the nature of any such policy decision. Four possible policychange options have been considered for Scotland:
An increase in the maximum speed limit of HGVs > 7.5t on all singlecarriageway roads from 40 mph to 50 mph;
An increase in the maximum speed limit of HGVs > 7.5t on single carriagewaytrunk roads from 40 mph to 50 mph;
An increase in the maximum speed limit of HGVs > 7.5t on all singlecarriageway roads from 40 mph to 50 mph and on all dual carriageway roadsfrom 50 mph to 60 mph (this is the policy change as applied in England &Wales in April 2015); and
An increase in the maximum speed limit of HGVs > 7.5t on single carriagewaytrunk roads from 40 mph to 50 mph and on dual carriageway trunk roads from50 mph to 60 mph.
4.1.2 These options are considered the most likely, in part because they could alignScottish limits with those in England & Wales. To consider these options this sectionsynthesises evidence on single carriageway trunk, single carriageway non-trunkand dual carriageway trunk roads. This combines evidence from the previoussections and outputs from the use of the Transport Model for Scotland.
4.2 Modelling Using Transport Model for Scotland
4.2.1 Modelling using the Transport Model for Scotland (TMfS14) was undertaken inorder to address the following research question outlined in the project scope ofservices:
What is the potential impact on Transport Economic Efficiency (TEE) of anincrease in the speed limit for HGVs on single carriageway and dualcarriageway roads in Scotland (based upon the evidence from the literaturereview and emerging from the England and Wales study)?
4.2.2 In order to interpret the information in this chapter correctly, it is important tounderstand what a TEE assessment contains and, equally, what it does not contain.The central principle of TEE analysis is to estimate the welfare gain to society whichresults from transport investment, as measured by individuals' willingness to pay forsuch an improvement and the financial impact on private sector transport operators.This does not measure the direct monetary impact of interventions on businessbalance sheets, and so does not provide an assessment of the impact of changingHGV speed limits on freight industry profitability.

Evaluation of Impact of Increasing Speed Limitfor HGVs in Scotland
Transport Scotland
Prepared for: Transport Scotland AECOM29/44
4.2.3 As it is driven by the outputs of transport modelling, the assessment can onlyinclude the impact of behavioural responses that are included in that modelling. Forexample, TMfS14 only models the re-routing effects of the speed limit changes onHGVs. It does not include possible longer term demand responses from HGVoperators, or potential business impacts that could be achieved through modifiedHGV schedules. Neither can the model include how accident rates may change onroads if the speed limit changes.
4.2.4 TEE analysis presents the key effects disaggregated by particular groups, thepurpose of the trip being made, and by impact (journey time, vehicle operatingcosts, and user costs). Standard methodologies, as defined in Scottish TransportAppraisal Guidance (STAG)13, and Transport Appraisal Guidance (WebTAG)14
monetise these benefits. The following paragraphs give a very brief summary of themethods. For a more detailed discussion the reader should consult the abovesources.
4.2.5 Journey time impacts are assessed for the modelled vehicles, and then transformedinto money values through the application of ‘occupancy factors’, to take account ofthe number of people in vehicles, and ‘Values of Time’, in terms of pounds per hour(£/hr). Standard values are listed in WebTAG: this is the case for all valuesdiscussed in this section. WebTAG also provides forecasts for how occupancyfactors and Values of Time will change over time.
4.2.6 Vehicle operating costs are calculated separately for fuel and non-fuel costs throughthe application of standard formulae. The non-fuel vehicle operating costs includethe cost of ‘wear and tear’.
4.2.7 The costs are then calculated through the application of adjustments for changes inengine efficiency, the composition of the vehicle fleet in terms of fuel type, and thecost of fuel, all of which are forecast in WebTAG.
4.2.8 In order to calculate the TEE, a model scenario without the tested intervention iscompared with a scenario that includes the intervention. It is then extremelyimportant that the difference between the scenario results is then predominantlyattributable to the impact of the scheme. There is a certain degree of randomfluctuation within transport models, which is measured through a statistic called‘convergence’. In general, the smaller in impact the intervention that is tested, themore ‘converged’ the model needs to be to ensure that the resulting differences inthe model output are due to the scheme.
4.2.9 The values in a TEE are expressed in monetary terms, with adjustments applied todiscount the values back to 2010, and adjust the prices to account for inflation.These “2010 pounds” are summed over a 60 year appraisal period to provide aPresent Value of Benefits.
4.2.10 The forecast changes in the amount of fuel vehicles require will also affect theamount of indirect tax collected by the UK Government. This is also included in theTEE table presented. It should be noted that standard Scottish guidance on
13 https://www.transport.gov.scot/our-approach/industry-guidance/scottish-transport-analysis-guide-scot-tag/#4294814 https://www.gov.uk/guidance/transport-analysis-guidance-webtag

Evaluation of Impact of Increasing Speed Limitfor HGVs in Scotland
Transport Scotland
Prepared for: Transport Scotland AECOM30/44
expressing Cost to Government in these tables states that the indirect taxationimpacts should be included, despite this being a UK issue15.
4.2.11 An assessment of global air quality impact is also included in the TEE, calculatedthrough the application of forecasts for carbon dioxide emissions per litre of fuelburnt/used, by type of fuel, and then forecast values of CO2 equivalent.
4.2.12 A separate safety assessment can also be undertaken, using standard accidentrates by type of road; as noted in paragraph 4.3.2 the modelling was not able todetermine any change in accident rates resulting from the speed limit change andtherefore standard values were used. Numbers of accidents and injuries (byseverity) can then be calculated for the with and without intervention case, andstandard valuations applied (again provided by WebTAG).
4.3 TEE Outputs
4.3.1 As noted above, a model scenario without the tested intervention is required. This isknown as the ‘Do Minimum’. TMfS14 currently restricts HGVs to 40mph on singlecarriageways and 50mph on rural dual carriageways, which are the legal speedlimits. However, as outlined in paragraph 2.3.2 these are not the observed averagespeeds, with the free flow average HGV speed on single carriageway trunk roadsbeing 45.8 mph in an analysis of speeds from 2015 onwards. In order to quantifythe benefits of the speed limit change it was necessary to define a Do Minimum(scenario 1) with more realistic maximum HGV speeds, above the 40 mph speedlimit. This was set to 45.8mph.
4.3.2 From this base it was therefore possible to test four further scenarios (the ‘DoSomething’) that reflected the four options for possible HGV speed limit changes onScottish roads set out in the introduction. For clarity, the four do-somethingscenarios tested were:
Scenario 2: An increase in HGV speed limits on all non-urban singlecarriageways;
Scenario 3: An increase in HGV speed limits on trunk non-urban singlecarriageways;
Scenario 4: An increase in HGV speed limits on all non-urban single and dualcarriageways; and
Scenario 5: An increase in HGV speed limits on trunk non-urban single anddual carriageways.
15 STAG Technical Database, section 12.6 (https://www.transport.gov.scot/publication/stag-technical-database/section-12/#s126)

Evaluation of Impact of Increasing Speed Limitfor HGVs in Scotland
Transport Scotland
Prepared for: Transport Scotland AECOM31/44
4.3.3 To reflect these scenarios within the model, the maximum speed permitted forHGVs was adjusted. It is important to note that this does not mean that themaximum speed for HGVs was increased to 50mph on single carriageways. TheTMfS14 does not include speed/flow relationships specific to HGVs and thereforethe modelling may not fully reflect this limit increase in average HGV speeds. It wastherefore necessary to set the maximum speed for HGVs at the level of the forecastaverage HGV speed following a change in speed limit i.e. adding a forecastincrease in speeds to the revised do-minimum (scenario 1). To achieve this, theobserved change in average HGV speeds in free flow conditions from the England& Wales initial evaluation (discussed in paragraph 2.3.5) have been applied, asshown in Table 7. It should be recognised that, as detailed in Chapter 3, thebaseline conditions in England & Wales and Scotland were different and thereforethe use of the observed increase from the former, following an HGV speed limitincrease, is for indicative purposes only.
Table 7. TMfS14 HGV Scenario Speeds Increases by Road Type, comparedwith Do Minimum (‘Scenario 1’) (mph)
Scenario
Non-Urban Single Carriageway Non-Urban Dual Carriageway
Non-Trunk Trunk Non-Trunk Trunk
2 +1.5 +1.5 - -
3 - +1.5 - -
4 +1.5 +1.5 +0.7 +0.7
5 - +1.5 - +0.7
4.3.4 Figure 1 shows the links for which HGV speeds have been changed by scenario,wherein orange links are unchanged and blue links have received a speed uplift.

Evaluation of Impact of Increasing Speed Limitfor HGVs in Scotland
Transport Scotland
Prepared for: Transport Scotland AECOM32/44
Figure 1. Roads with amended speed, by scenario

Evaluation of Impact of Increasing Speed Limitfor HGVs in Scotland
Transport Scotland
Prepared for: Transport Scotland AECOM33/44
4.3.5 The scenarios were run for 2017, 2027, and 2032 forecast years, and the resultsrun through the DfT appraisal software TUBA, with standard WebTAG economicparameters16 over a 17 year appraisal period17. This gave the standard TEEoutputs, including:
Present Value of Benefit (PVB) of the first order impact of the time savings;
PVB of the impact of the average speed change on vehicle operating costs;
PVB of the change in CO2 equivalent emissions, as well as the untraded CO2equivalent emissions, in tonnes, for the modelled years; and
PVB of the impact of the change in fuel purchasing on the indirect tax take.
4.3.6 These model scenario outputs were also analysed in order to calculate the safetybenefits.
4.3.7 As discussed in paragraph 4.2.8, where tested interventions are small in relation tooverall model size, great care must be made to ensure that the transport model iswell converged, in order to ensure that the differences between the with and withoutintervention scenarios are predominantly due to the scheme being tested. Thescenario described above are small in two ways:
The size of the increase in HGV speed (as shown in Table 7); and
For Scenarios 3 and 5 in particular, the number of road sections that areaffected (as shown in Figure 1).
4.3.8 In an attempt to counteract this, the settings for the TMfS were adjusted such that itwas required to achieve a level of convergence ten times more stringent than astandard model run. This resulted in extremely long computer run times, and isconsidered to be at or near the limit of what can be achieved. Even at this higherlevel of convergence, our best professional judgement is that the monetised valuescalculated for time savings, vehicle operating costs, CO2e, and wider publicfinances cannot be distinguished from the margin of error of the model. In effectthey can be described as ‘around zero’. The safety analysis, however, is judged tobe more reliable, as this is based on a more stable output of the model (link flows).
4.3.9 The monetised benefits are presented in Table 8. The table is presented on aseparate page, along with the caveats that should be understood when attemptingto interpret the outputs.
16 Version 1.9.7, the current full version at the time of writing.17 As requested by Transport Scotland.

Evaluation of Impact of Increasing Speed Limitfor HGVs in Scotland
DRAFT Transport Scotland
Prepared for: Transport Scotland AECOM34/44
Table 8. Transport Economic Efficiency Results (2010 £m)
Scenario 2 3 4 5
Increase on Single by 1.5 mph Both Trunk Both Trunk
Increase on Dual by 0.7 mph - - Both Trunk
Time Savings
Business Users * * * *
Commuters * * * *
Other Users * * * *
Freight * * * *
Fuel & VehicleOperating Costs
Business Users * * * *
Commuters * * * *
Other Users * * * *
Freight * * * *
Wider Public Finances (Indirect Taxation Revenue) * * * *
Environmental Impacts Greenhouse Gases (CO2) * * * *
Safety- -1.15 +0.79 -0.21 +1.02
Total Present Value of Benefits (PVB) -1.15 +0.79 -0.21 +1.02* within the margin of error of the transport model: “around zero”
Caveats/Assumptions:as detailed in Chapter 3, the baseline conditions in England & Wales andScotland were different and therefore the use of the observed increase from theformer, following an HGV speed limit increase, is for indicative purposes only.
The following impacts of speed limit changes are included:
Rerouting of HGVs between planned stops;Rerouting of other road users due to changes in aggregate congestion;
Rerouting aspects of safety ie more or less use of inherently safer or moredangerous road classes.
The following possible impacts are not included: Local air quality impacts;
Noise impacts; Impact of speed changes on the sequence of stops given to HGVs, or any
other possible business reaction to the speed limit change18; Reduction in costs associated with speed limit offenders; Reduction in platooning and lack of ability to overtake, as well as possible
reduction in risk taking behaviour, with consequent safety improvements; Possible impact of changes in speed limits on accident rates.
18 For example, an HGV is directed to go from the depot (point A) to deliver to B, C, and D. The route taken between A and B,B and C etc can change in the model in response to the change in speed limit. However, the most efficient sequence ofdeliveries may also change in reality if the HGV speed limit changes. This effect is not modelled.

Evaluation of Impact of Increasing Speed Limitfor HGVs in Scotland
Transport Scotland
Prepared for: Transport Scotland AECOM35/44
4.3.10 Scenario 2 increases the speed HGVs are able to travel on both trunk and nontrunk single carriageway roads. This reports a safety disbenefit. This is intuitivelyreasonable, as the changes encourage HGVs to leave the dual carriageways andmotorways for the now faster single carriageway network. In order to explain thisinterpretation, it is necessary to elaborate on how route choice in undertaken intransport models of this type.
4.3.11 Route choice in transport models is undertaken through a balance of distance andtime. For example, a traveller may choose a longer but quicker route, rather than amore direct but slower one. When single, but not dual, carriageways are increasedin speed, HGVs that in the Do Minimum scenario have chosen a long but fast routeon dual carriageways or motorways (for example, using the M9/A9 between Perthand Grangemouth), may now find it advantageous to switch route to a shorter, nowslightly faster route (in this example, single carriageway roads through Fife to theA90). In this case, safety disbenefits are likely to be seen, as single carriagewayroads have higher accident rates than motorways and dual carriageways.
4.3.12 In Scenario 4, where both dual carriageways and single carriageways increase inspeeds, there is less disruption to the HGV routing. As a result, the lower levels ofrerouting gives safety results where the increased use of more dangerous roadtypes almost balances the shorter trip lengths.
4.3.13 Scenarios 3 and 5 only apply speed changes to a small subset of the road network,which are often in rural areas with low levels of route choice. In these areas thetrunk roads will tend to be the highest standard option available, and hence thesafest. The limited route switching that occurs will, therefore, tend to provide safetybenefits.
4.4 Summary
4.4.1 In relation to the research question set out in paragraph 4.2.1 the followingconclusions can be drawn:
The lack of comparability between the Scottish and England & Wales roadnetworks mean that emerging findings from the post HGV speed limit increaseevaluation are not transferrable to the Scottish context. Model results in thischapter are provided for indicative purposes only;
Testing of the small changes in HGV speeds observed in England & Walesresults in travel time savings, vehicle operating costs, CO2e, and wider publicfinances for each tested scenario that cannot be distinguished from the marginof error of the transport model;
Safety benefits, excluding any possible effect of the HGV speed limits onaccident rates, could be assessed by the model, as this is based on a morestable output of the model (link flows). Small negative benefits were found forscenarios that applied the HGV speed limit change to all rural roads, whereassmall positive benefits were seen for scenarios that restricted speed increasesto the trunk road network only. This was explained by the general increasescenarios encouraging small levels of rerouting to less suitable, moredangerous roads.
Other possible impacts could not be assessed using the available modellingtool:
Local air quality impacts;

Evaluation of Impact of Increasing Speed Limitfor HGVs in Scotland
Transport Scotland
Prepared for: Transport Scotland AECOM36/44
Noise impacts;
Impact of speed changes on planned HGV routes, or any other possiblebusiness reaction to the speed limit change;
Reduction in costs associated with speed limit offenders;
Reduction in platooning and lack of ability to overtake, as well as possiblereduction in risk taking behaviour, with consequent safety improvements;
Possible impact of changes in speed limits on accident rates.

Evaluation of Impact of Increasing Speed Limitfor HGVs in Scotland
Transport Scotland
Prepared for: Transport Scotland AECOM37/44
5. Summary of Evidence
5.1 Introduction
5.1.1 Sections 2-4 of this report have reviewed a range of available evidence relating tospeeds and the factors that influence these. This section provides a short synthesisof evidence for each of the main road types on which speed limit changes could beapplied.
5.2 Single Carriageway Trunk Roads
5.2.1 Single carriageway trunk roads make up approximately 4% of the Scottish ruralroad network and carry an estimated 14% of the HGV miles operated. The evidencepresented in Section 3 has highlighted that the baseline (2016) average free flowspeeds of HGVs on single carriageway trunk roads in Scotland was 48.2 mph. Thisis well in excess of the 40 mph speed limit that exists. In comparison, the baselinefor England & Wales was 46.4 mph, which increased by approximately 1 mphfollowing the speed limit change to 50 mph.
5.2.2 It is noteworthy that the 2016 baseline for Scottish single carriageway trunk roadswas higher than both the England & Wales baseline and the 2016 ex-post results.Furthermore, the speed differential between HGVs and light vehicles in the 2014baseline in Scotland was 5 mph, so lower than the 7 mph reported in England andWales. It could therefore be questioned how much higher HGV average speedscould increase on Scottish single carriageway trunk roads.
5.3 Single Carriageway Non-Trunk Roads
5.3.1 Single carriageway non-trunk roads make up approximately 40% of the Scottishroad network, and carry an estimated 30% of freight mileage. The baseline 2014average HGV speed was lower (44.6 mph) for non-trunk than trunk, as would beexpected. The speed differential to light vehicles was also lower (4 mph) reflectingthe slower average speeds on such roads. The latter again raises the question as tothe extent to which HGV average speeds could increase given their similarity tolight vehicles (48.9mph average speed in 2014) which had a limit of 60mph. Thesefree flow speeds suggest that the characteristics and topography of these roads islikely to be contributing to constraining average speeds for both light and heavyvehicles.
5.3.2 However, these findings do not preclude individual HGVs increasing their speedshould a 50mph limit be introduced. It is also considered likely that the impacts of aspeed limit change will be specific to individual routes, reflective of the baseline andtopographical characteristics e.g. routes such as the A9 where platoons behindslower moving HGVs were common causes of driver frustration.

Evaluation of Impact of Increasing Speed Limitfor HGVs in Scotland
Transport Scotland
Prepared for: Transport Scotland AECOM38/44
5.3.3 There remains no definitive link between a change in speed limits and resultantspeeds in Scotland. Furthermore, any increase in average HGV speeds could havesignificant, if isolated, safety and local air quality impacts, which have not beenquantified.
5.4 Dual Carriageway Trunk Roads
5.4.1 Dual carriageway trunk roads make up approximately 1% of the Scottish rural roadnetwork, and carry approximately 6% of freight mileage. The England & Walesevaluation identified a 0.5 mph increase in average HGV speeds following a changein speed limit to 60 mph. However, the baseline average speed of 52.2 mph wasalready relatively high and above the baseline limit. The comparable figure forScottish dual carriageway trunk roads was 47.8 mph, which was the only HGVaverage speed that was below the baseline speed limit. These numbers couldindicate the potential to increase HGV speeds in Scotland. It could equally reflectexisting constraints (e.g. topography or bendiness) on these roads that keepaverage speeds below 50 mph.
5.4.2 Considering the level of potential increase further, the Scotland baseline HGVaverage speed (47.8 mph) was 10 mph below the average speed of light vehicles.Although this speed differential suggests there is potential to increase HGV speeds,it does not address the issue of why HGV average speeds in the baseline wererelatively low.
5.4.3 Furthermore, the baseline average speed of light vehicles in Scotland (57.8 mph)was 7 mph below that in England & Wales (65.4 mph). The speed differentialbetween light and heavy vehicles in Scotland was also lower at 10mph compared to13 mph in England & Wales. It could be postulated therefore that average speedson dual carriageway trunk roads are already constrained, even in free flowconditions, and that HGV speeds will not increase significantly following a change inspeed limit.
5.4.4 An increase of between 0.5 mph and the 4 mph to match motorway average speeds(as outlined in Section 3) could be anticipated; the latter, although consideredunrealistic, could have significant impacts on safety and the environment. Overall,with the relatively short length of the dual carriageway trunk road network, relativeto single carriageways, there is not compelling evidence to increase the HGV speedlimit form 50 mph to 60 mph across all such roads. However, consideration shouldbe given to individual routes where slower moving HGVs is generating delays andwider journey time dis-benefits.

Evaluation of Impact of Increasing Speed Limitfor HGVs in Scotland
Transport Scotland
Prepared for: Transport Scotland AECOM39/44
Appendix A - ReferencesAECOM/Atkins (2016) Evaluation of the National HGV Speed Limit Increase Scoping Report
AECOM, Atkins (2016) Evaluation of the national HGV speed limit increase in England andWales: Year 1 interim summary, (AECOM, Atkins, Sep 2016) Summary:https://www.gov.uk/government/publications/increased-speed-limit-for-heavy-goods-vehicles-over-75-tonnes-initial-summary-report/evaluation-of-the-national-hgv-speed-limit-increase-in-england-and-wales-year-1-interim-summary-september-2016
Department for Transport (2014); Impact Assessment: Raising the Speed Limit for HGVsover 7.5 tonnes on single carriageway roads in England and Wales
Department for Transport (2014); Impact Assessment: Raising the Speed Limit for HGVsover 7.5 tonnes on dual carriageway roads in England and Wales
Elvik R (2009) The Power Model of the Relationship between Speed and road Safety:Update and new Analyses. Institute of Transport Economics.
Finch D J, Kompfner P, Lockwood C R and Maycock G (1994). Speed, speed limits andaccidents. TRL Project Report PR58. Transport Research Laboratory.
SIAS/TRL (2012) The impact of speed enforcement and increasing the HGV speed limit onthe A9(T)
Summersgill, Buckle, Robinson and Smith, (2009), HGV speed limit increase evaluation,Project Report 576. Transport Research Laboratory (TRL).
Transport Scotland (2014) A9 Average Speed Cameras and HGV 50mph Pilot Monitoring –“Before” Market Research
Transport Scotland (2015) A9 Average Speed Cameras and HGV 50mph Pilot Monitoring –“After” Market Research
Transport Scotland (2015) A9 Data Monitoring Analysis Report
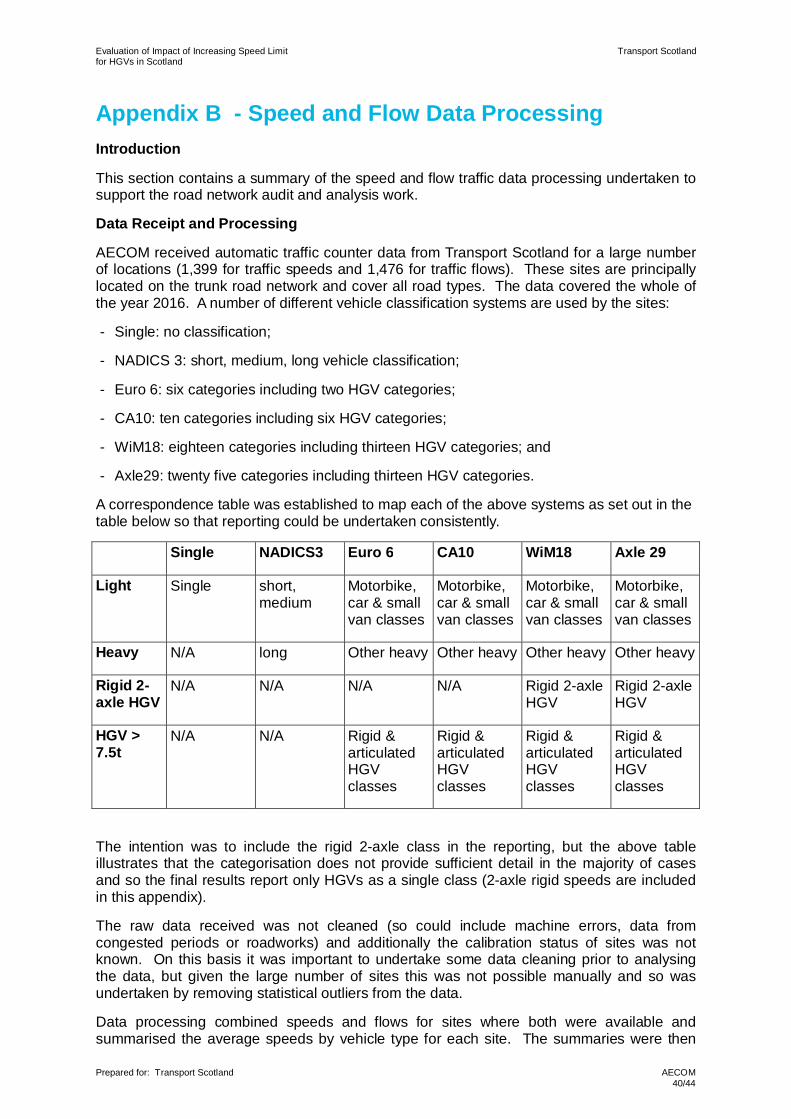
Evaluation of Impact of Increasing Speed Limitfor HGVs in Scotland
Transport Scotland
Prepared for: Transport Scotland AECOM40/44
Appendix B - Speed and Flow Data ProcessingIntroduction
This section contains a summary of the speed and flow traffic data processing undertaken tosupport the road network audit and analysis work.
Data Receipt and Processing
AECOM received automatic traffic counter data from Transport Scotland for a large numberof locations (1,399 for traffic speeds and 1,476 for traffic flows). These sites are principallylocated on the trunk road network and cover all road types. The data covered the whole ofthe year 2016. A number of different vehicle classification systems are used by the sites:
- Single: no classification;
- NADICS 3: short, medium, long vehicle classification;
- Euro 6: six categories including two HGV categories;
- CA10: ten categories including six HGV categories;
- WiM18: eighteen categories including thirteen HGV categories; and
- Axle29: twenty five categories including thirteen HGV categories.
A correspondence table was established to map each of the above systems as set out in thetable below so that reporting could be undertaken consistently.
Single NADICS3 Euro 6 CA10 WiM18 Axle 29
Light Single short,medium
Motorbike,car & smallvan classes
Motorbike,car & smallvan classes
Motorbike,car & smallvan classes
Motorbike,car & smallvan classes
Heavy N/A long Other heavy Other heavy Other heavy Other heavy
Rigid 2-axle HGV
N/A N/A N/A N/A Rigid 2-axleHGV
Rigid 2-axleHGV
HGV >7.5t
N/A N/A Rigid &articulatedHGVclasses
Rigid &articulatedHGVclasses
Rigid &articulatedHGVclasses
Rigid &articulatedHGVclasses
The intention was to include the rigid 2-axle class in the reporting, but the above tableillustrates that the categorisation does not provide sufficient detail in the majority of casesand so the final results report only HGVs as a single class (2-axle rigid speeds are includedin this appendix).
The raw data received was not cleaned (so could include machine errors, data fromcongested periods or roadworks) and additionally the calibration status of sites was notknown. On this basis it was important to undertake some data cleaning prior to analysingthe data, but given the large number of sites this was not possible manually and so wasundertaken by removing statistical outliers from the data.
Data processing combined speeds and flows for sites where both were available andsummarised the average speeds by vehicle type for each site. The summaries were then

Evaluation of Impact of Increasing Speed Limitfor HGVs in Scotland
Transport Scotland
Prepared for: Transport Scotland AECOM41/44
reviewed in parallel to a review of site locations, to establish a shortlist of sites for the finalanalysis (where site location is not constrained by junctions, the speed limit is within scope,the number of observations across the year are sufficient etc). These summaries were thenused as the basis of the analysis of the data to understand the average speeds on Scottishroads.
Summary TablesThe following tables present the results of the analysis by road type.
Non-Trunk Road Single Carriageways 60mph
Average speed mph Observations (number ofsites)
Free flow (0 – 100 vehicles per hour)
Light vehicles 48.9 16
2-axle Rigid HGVs 41.9 3
HGVs > 7.5t 44.6 (39.4) 16 (3)
All flows (0 – 1,000 vehicles per hour)
Light vehicles 46.3 16
2-axle Rigid HGVs 41.4 3
HGVs > 7.5t 43.3 (39) 16 (3)Note 1: The number of observations decreases for the Transport Scotland work when agreater level of categorisation is required. This is a reflection of the different classificationregimes available at each site.Note 2: brackets show results for the smaller sample, but with the increased accuracy fromseparating out the 2-axle rigid vehicles from the HGVs > 7.5t.
Trunk Road Single Carriageways 60mph (A9 sites removed)
Average speed mph Observations (number ofsites)
Free flow (0 – 100 vehicles per hour)
Light vehicles 53.8 52
2-axle Rigid HGVs 52.5 13
HGVs > 7.5t 48.2 (48) 52 (13)
All flows (0 – 1,000 vehicles per hour)
Light vehicles 50.9 52
2-axle Rigid HGVs 49.5 13
HGVs > 7.5t 46.7 (47.1) 52 (13)

Evaluation of Impact of Increasing Speed Limitfor HGVs in Scotland
Transport Scotland
Prepared for: Transport Scotland AECOM42/44
A9 Trunk Road Single Carriageways 60mph
Average speed mph Observations (number ofsites)
Free flow (0 – 100 vehicles per hour)
Light vehicles 55.2 14
2-axle Rigid HGVs 51.2 2
HGVs > 7.5t 51.7 (49.8) 14 (2)
All flows (0 – 1,000 vehicles per hour)
Light vehicles 53.6 14
2-axle Rigid HGVs 50.0 2
HGVs > 7.5t 50.9 (49.2) 14 (2)
All Single Carriageways 60mph (A9 sites removed)
Average speed mph Observations (number ofsites)
Free flow (0 – 100 vehicles per hour)
Light vehicles 52.7 68
2-axle Rigid HGVs 50.4 16
HGVs > 7.5t 47.4 (46.2) 68 (16)
All flows (0 – 1,000 vehicles per hour)
Light vehicles 49.9 68
2-axle Rigid HGVs 47.9 16
HGVs > 7.5t 46 (45.4) 68 (16)
Trunk Road Dual Carriageways 70 mph
Average speed mph Observations (number ofsites)
Free flow (0 – 100 vehicles per hour)
Light vehicles 57.8 38
2-axle Rigid HGVs N/A N/A
HGVs > 7.5t 47.8 38
All flows (0 – 1,600 vehicles per hour)
Light vehicles 55.6 38
2-axle Rigid HGVs N/A N/A
HGVs > 7.5t 47.8 38

Evaluation of Impact of Increasing Speed Limitfor HGVs in Scotland
Transport Scotland
Prepared for: Transport Scotland AECOM43/44
Motorways 70 mph
Average speed mph Observations (number ofsites)
Free flow (0 – 100 vehicles per hour)
Light vehicles 61.6 24
2-axle Rigid HGVs N/A N/A
HGVs > 7.5t 52.4 24
All flows (0 – 1,800 vehicles per hour)
Light vehicles 59.9 24
2-axle Rigid HGVs N/A N/A
HGVs > 7.5t 52.1 24

Evaluation of Impact of Increasing Speed Limitfor HGVs in Scotland
Transport Scotland
Prepared for: Transport Scotland AECOM44/44
aecom.com