evaluation of the socopse decision support · pdf fileevaluation of the socopse decision...
TRANSCRIPT

Evaluation of the SOCOPSE Decision Support System
- A case study of nonylphenol in the river basin of Viskan
Hanna Andersson
Projektrapport från utbildningen i
EKOTOXIKOLOGI
Ekotoxikologiska avdelningen
Nr 134

2
Foreword This report is a degree project leading to a Master of Science in Biology (with a specialisation in ecotoxicology) diploma from Uppsala University. The report is written for IVL Swedish Environmental Research Institute, and it is a case study within the EU project SOCOPSE (Source Control of Priority Substances in Europe).
Supervisors have been Jan Örberg, Uppsala University and Anna Palm Cousins, Katarina Hansson, Eva Brorström-Lundén and John Munthe, IVL Swedish Environmental Research Institute.
3
Acknowledgements Many people have given me support, advice and shared valuable knowledge with me during the work with this case study. I am thankful to all of you! Especially I would like to thank Jan Örberg at Uppsala University who has been the most patient, helpful and encouraging supervisor. Equally important have Katarina Hansson, Anna Palm Cousins and Eva Brorström-Lundén at IVL been. They have answered many questions and given me valuable feedback. Anna Jöborn, John Munthe and Mohammed Belhaj, also at IVL, are all working in the SOCOPSE project and from you I have learnt a lot. Mikael Olshammar, IVL and Tuomas Mattila, SYKE have both shared their expert knowledge regarding modelling. Jenny Kreuger, SLU, Anette Magnusson, Malin Svensson and Lars Fred at the municipality of Borås, Cecilia Niklasson, Anneli Harlén, Sara Bergström and Siv Hansson at the County Administrative Board of Västra Götaland have all taken their time to answer my questions. At last I owe Tomas Rydberg at IVL many thanks for his never ending optimism!

4
Summary
The Decision Support System (DSS) developed in the EU project SOCOPSE (Source Control of Priority Substances in Europe) was used to assess pressures and impacts of nonylphenol to River Viskan, located on the Swedish west coast. The main aim of the study was to test the DSS on a Swedish river basin and evaluate its usefulness on a European and national scale. The results of the study indicates that nonylphenol is likely to be emitted to the recipient via three major sources, the contaminated sediments downstream Borås, storm water and wastewater. The current situation could potentially lead to long term negative effects in the aquatic environment. The study identified the following possible measures to remediate elevated nonylphenol levels in River Viskan or to further investigate the pollution situation:
⋅ Additional monitoring of water and possibly also other matrices ⋅ Further investigations of the section of Häggån that flows by Kinna, e.g. sampling and analysis
of the sediments ⋅ Remediation of the contaminated sediments downstream Borås ⋅ Investigations on nonylphenol and nonylphenol derivative concentration in storm water
within the system ⋅ Studies on cleaning efficiency by storm water facilities with regards to nonylphenol and other
priority substances ⋅ Substitution of nonylphenol containing products, at industries and/or at community level ⋅ End-of-pipe solutions, e.g. coal adsorption or nano filtration, at industries with nonylphenol
emissions to water
It was concluded that the SOCOPSE DSS has a potential to become a useful handbook in the current and future water administration given that the main aim of the handbook is to provide the water managers with tools and methodologies relevant for the work with the priority substances. The handbook should not work as a source of data as this is a field of continuous change and it would probably not be possible to update the handbook with sufficient frequency for it to be useable. The current version of the DSS focuses on point sources of priority substances. In Sweden and many other European countries diffuse sources of these chemicals are becoming increasingly important. It is thus important that the DSS provides guidance also on how to handle emissions from diffuse sources. Furthermore it was concluded that the pollution situation, legislation, administrative systems, data accessibility and implementation strategy for the Water Framework Directive (WFD) varies between member states in EU. It might not be possible to create a handbook to be used in all the member states. Instead the DSS handbook could be used as a basic structure as nation specific guidelines and handbooks are developed, e.g. where Swedish environmental aspects, legislation and other prerequisite are considered specifically.

5
Glossary Abbreviation Meaning
AA-EQS Annual Average EQS CAS nr Chemical Abstract Service registry number
DEHP Di(2-ethylhexyl)-phtalate DSS Decision Support Systema
EC10 Effect Concentration (effects seen in 10 % of the tested population)
EC50 Effect Concentration (effects seen in 50 % of the tested population)
EMIR Länsstyrelsen utsläppsregister (Emissions register at the County Administrative Boards)
EQS Environmental Quality Standard
GIS Geographical Information System
Koc Partition coefficient organic carbon-water
Kow Partition coefficient octanol-water
MAC-EQS Maximum Allowable Concentration EQS
NGO Non-Governmental Organisation OECD Organisation for Economic Co-operation and Development
PAH Polycyclic Aromatic Hydrocarbon PBDE Poly Brominated Diphenyl Ethers PNEC Predicted No Effect Concentration QS Quality Standard QWASI-model Quantitative Water Air Sediment Interaction Model RBMP River Basin Management Plan SFA Substance Flow Analysis SOCOPSE Source Control of Priority Substances in Europe
SSNC Swedish Society for Nature Conservation
TGD Technical Guidance Documentb
TNPP Tri (4-nonylphenyl) phosphite WFD Water Framework Directive WWTP Wastewater Treatment Plant
a) In this study DSS refers specifically to the handbook developed in the SOCOPSE project (www.socopse.eu) b) In this study TGD refers to the TGD on risk assessment, part II (TGD 2003)

6
1 Introduction ..........................................................................................................................................................8 1.1 Background ..................................................................................................................................................8 1.1.1 The Water Framework Directive (WFD).........................................................................................8 1.1.2 Source Control of Priority Substances in Europe...........................................................................8
1.2 Objectives.....................................................................................................................................................9 1.3 Limitations ...................................................................................................................................................9 1.4 Environmental Quality Standards ............................................................................................................9 1.4.1 Water ......................................................................................................................................................9 1.4.2 Sediment and biota.............................................................................................................................10
1.5 Implementation of the WFD in Sweden, with regards to the priority substances.........................10 1.6 Priority substance: nonylphenol .............................................................................................................11 1.6.1 Areas of use.........................................................................................................................................11 1.6.2 Nonylphenol derivatives ...................................................................................................................11 1.6.3 Legislation............................................................................................................................................12 1.6.4 Classification, EQS and toxicity.......................................................................................................12 1.6.5 Distribution and degradation............................................................................................................13
1.7 The Decision Support System (DSS).....................................................................................................15 1.7.1 Substance Flow Analysis ...................................................................................................................15 1.7.2 Environmental Fate Modelling ........................................................................................................16
2 Step 0: System definition...................................................................................................................................17 2.1 Evaluation of the DSS, Step 0 ................................................................................................................18
3 Step 1: Problem definition................................................................................................................................19 3.1 Monitoring data /other information......................................................................................................20 3.2 Data quality OK? / Sufficient data?.......................................................................................................23 3.3 Set up of a monitoring plan.....................................................................................................................23 3.4 Concentrations exceeding EQS or increasing? ....................................................................................23 3.5 Evaluation of the DSS, Step 1 ................................................................................................................24
4 Step 2: Inventory of sources.............................................................................................................................25 4.1 What are the possible sources? ...............................................................................................................26 4.1.1 Point sources.......................................................................................................................................26 4.1.2 Diffuse sources ...................................................................................................................................29
4.2 Estimated emissions of nonylphenol.....................................................................................................31 4.3 Evaluation of the DSS, Step 2 ................................................................................................................33
5 Step 3 Definition of baseline scenarios ..........................................................................................................34 5.1 Environmental Fate Modelling ...............................................................................................................35 5.1.1 System description (Olsdalsbron-Rydboholm)..............................................................................35 5.1.2 The QWASI model ............................................................................................................................35 5.1.3 The Sediment model..........................................................................................................................36 5.1.4 Sensitivity and uncertainty analysis..................................................................................................37
5.2 Estimated future changes in water quality ............................................................................................38 5.2.1 Concentration trends .........................................................................................................................39 5.2.2 Emission trends ..................................................................................................................................40 5.2.3 Environmental trends........................................................................................................................41
5.3 Assessment of future problem areas......................................................................................................42 5.4 Evaluation of the DSS, Step 3 ................................................................................................................42
6 Step 4 Inventory of possible measures ...........................................................................................................43 6.1 Problem areas ............................................................................................................................................43 6.2 Possible additional measures...................................................................................................................43 6.2.1 Substitutes for nonylphenol..............................................................................................................44 6.2.2 End-of-pipe options for the substance...........................................................................................44 6.2.3 Storm water treatment.......................................................................................................................44 6.2.4 The contaminated sediments............................................................................................................44
6.3 Combination effects .................................................................................................................................45 6.4 Evaluation of the DSS, Step 4 ................................................................................................................46
7 Discussion and conclusions..............................................................................................................................47
7
7.1 Nonylphenol in River Viskan..................................................................................................................47 7.2 Evaluation of the DSS..............................................................................................................................47 7.3 The Swedish perspective..........................................................................................................................48
8 References ...........................................................................................................................................................49

8
1 Introduction
1.1 Background
Water is one of our most important natural resources; it is necessary for all living organisms but also in various production processes in modern society. This resource is renewable in the sense that it cycles between land and the atmosphere. Water can however be physically or chemically affected by human activities such as industrial- or energy production, which may have negative effects on the quality of water as a living environment, as a source of drinking water or on the quantity of these resources. Awareness of the fact that this essential resource must be protected has lead to a number of political initiatives on the European and Swedish level.
1.1.1 The Water Framework Directive (WFD) Since the year 2000, most of the EU legislation concerning protection of water lies within the Water Framework Directive (WFD, 2000/60/EC). The aim of the directive is to achieve “good status” for all waters within the EU, by the year 2015. The concept of good status contains both ecological status and chemical status. Ecological status is built on biological quality factors, physico-chemical quality factors and hydromorphological quality factors. The ecological status is determined by comparison of different descriptive parameters for these quality factors, with reference values for each water category. The chemical status on the other hand is assessed based on environmental quality standards (EQS) set at EU Commission level (Directive 2008/105/EC) for the priority substances listed in Annex X of the WFD. Each water body has to have both good ecological status and good chemical status to be defined as water with good status over all. In each water administrative cycle, which runs for six years, a programme of measures to maintain or achieve good or higher status and a river basin management plan (RBMP) have to be developed. These documents are supposed to be ready at the end of 2009 in the current cycle. The WFD requires water administration to be adjusted after the natural borders of water flow – the river basins. Sweden is thus divided into five water districts, each managed by a Water District Authority. These Water District Authorities execute the characterization, pressures and impact analysis and risk assessment for each river basin (WFD Article 5). They are also responsible for the RBMPs, programmes of measures and setting of quality standards. In Sweden the WFD is implemented into national legislation by two enactments, Vattenförvaltningsförordningen (2004:660) and Förordning (2002:864) med länsstyrelseinstruktion.
1.1.2 Source Control of Priority Substances in Europe The EU project SOCOPSE (Source Control of Priority Substances in Europe) aims to support the management of the priority substances during implementation of the WFD (www.socopse.eu). 11 of the priority substances have been selected in the project and these are (penta) brominated diphenyl ethers (PBDE), mercury, cadmium, tributyltin, nonylphenol (para -nonylphenol), hexachlorobenzene, isoproturon, atrazine, di(2-ethylhexyl)-phthalate (DEHP) and the polycyclic aromatic hydrocarbons (PAHs), including anthracene. One of the major products of the project is a Decision Support System (DSS). The DSS is a tool for water managers that in a systematic way guides through the process from definition of a problem to suggestion of the most cost-effective measures. Fact sheets and material flow analysis are being developed within the SOCOPSE-project for the selected substances and these are meant to be used as tools in the DSS.

9
1.2 Objectives
This study is a case study where the DSS handbook is applied to a Swedish river basin, the river basin of Viskan. The purpose of the case study is to:
⋅ Evaluate the DSS handbook and give suggestions of improvements and potentially provide material that can be used as examples in the final version of the handbook
⋅ Evaluate the DSS handbook with a Swedish perspective to highlight how the handbook could
be used in Swedish water management
1.3 Limitations
This study is not intended to be used as a decision support material for any decisions about measures in the Viskan river basin. Instead of trying to give a fully reliable description of the studied system, effort was made to go through all the steps detailed enough to allow for evaluation of the DSS handbook and its tools. The results of this study should therefore be interpreted with caution when it comes to actual levels of and scenarios for pollutants in River Viskan. Furthermore, the study is limited to cover only one substance, i.e. nonylphenol, and thus do not intend to give a complete picture of the pollution situation in River Viskan.
1.4 Environmental Quality Standards
A water body is classified as having good chemical status when concentrations in surface water of all the priority substances are below EQS. In Directive 2008/105/EC, on environmental quality standards in the field of water policy, amending and subsequently repealing Council Directives 82/176/EEC, 83/513/EEC, 84/156/EEC, 84/491/EEC, 86/280/EEC and amending Directive 2000/60/EC of the European Parliament and of the Council, EQS are set for the priority substances as well as for five other substances/substance groups that had quality standards set in other legislation. All priority substances emitted into the recipient have to be monitored. The term emission has in the Guidance document No 3 Analysis of Pressures and Impacts (2003) been defined to include both point sources and diffuse sources. Contaminated land or sediment can thus be a source of emission although there is no current use of the specific chemical.
1.4.1 Water For each priority substance (or substance group) an EQS has been set for annual average concentrations (AA-EQS) and, where applicable, for maximum concentration at momentary exposure, maximum allowable concentration, (MAC-EQS). These EQS are based on ecotoxicity data using the method outlined in Lepper (2005). For several substances different EQS are set for inland waters (lakes and rivers) and for coastal, transitional and territorial waters. The EQS are constructed to be protective for pelagic and benthic organisms as well as for secondary poisoning of predators and human health. Concentrations of priority substances in surface water below EQS are thus assumed to have no adverse effects on any part of the aquatic environment.
10
1.4.2 Sediment and biota EQS for sediment and biota have not been set at commission level (with exception of biota EQS for mercury and its compounds, hexachlorobenzene and hexachlorobutadiene). The substance fact sheets for the priority substances (Homepage of CIRCA b) do however include predicted no effect values (PNEC) for protection of sediment living organisms and secondary poisoning or human health, i.e. concentration in biota. PNEC calculated for sediment are based on toxicity data for sediment dwelling organisms or, when such data were not available, the partitioning equilibrium method (see e.g. DiToro et al. 1991). Concentrations exceeding sediment PNEC, if derived with the equilibrium partition method, should only be interpreted as indicative of potential toxic effect of the substance until further assessment has been made on sediment toxicity of the priority substance. PNEC for protection of human health or secondary poisoning are calculated based on toxicity data on oral exposure of mammals.
1.5 Implementation of the WFD in Sweden, with regards to the priority substances
In the first report to the EU in March 2005 (Homepage of Vattenportalen) the situation in Sweden regarding metals and organic pollutants was evaluated with a general discussion about environmental levels and emissions. For the organic substances it was concluded that the levels are generally low for a majority of the substances with the exception of localities close to point sources and/or heavy diffuse emissions. Concentrations were expected to continue to decrease. It was also concluded that, in many cases, there are not enough data on environmental concentrations in the water phase of the priority substances to make a classification of the chemical status according to the WFD and development of EQS for biota was recommended. In this first WFD cycle water managers in Sweden have been forced to find alternative ways to assess the chemical status. Bremle (2006) proposes a method that is a combined approach where all available monitoring data is assessed together with the pressures and impact analysis (WFD Article 5). Combining the characterization based on monitoring data with the impact analysis results in a map where water bodies are classified as at risk of not reaching good chemical status if there is monitoring data or impact data supporting this. Other examples are methodologies for pressures and impact analysis of chemical pollution developed by the County Administrative Boards of Västra Götaland and Värmland. In these analyses the pressures on each water body are assessed based on land use and human activities within the water body using GIS. (De Beer 2008; Fransson 2008)

11
1.6 Priority substance: nonylphenol
Nonylphenol is the collective name of phenols with a nine coal alkyl chain attached. The general structure of the compound is shown in Figure 1 and basic physico-chemical properties are listed in Table 1. The alkyl chain can vary in degree of branching and it can also be attached to the phenol in different positions although the predominant isomer in commercial production is the branched 4-nonylphenol (Homepage of KEMI a).
Figure 1: General structure of nonylphenol. R1 is an alkyl chain of nine coal atoms. The EU Risk assessment (2002) covers the para substituted compounds with a straight alkyl chain (CAS-nr 25154-52-3) and with a branched alkyl chain (CAS-nr: 84852-15-3). According to the EQS Substance Data Sheet (SDS) on nonylphenol the EQS is set for the total amount of these two (above-mentioned) classes of nonylphenols (Homepage of CIRCA b). Hereafter, in this study, nonylphenol refers to para-substituted nonylphenols, including both branched and straight alkyl chain isomers. In case it has to be specified whether the alkyl chain is branched or not the straight chain isomer will be denoted 4-n-nonylphenol and the branched isomers 4-iso-nonylphenol. Table 1: Physico-chemical properties of nonylphenol. Data from the EU Risk assessment (2002), exceptions are annotated. Parameter Value Unit Molar mass 220.34 g/mol Vapour pressure 0.008a at 25 °C Pa Water solubility 6 at 20 °C, pH 7 mg/l Henry’s laws constant 11.02 Pa m3/mol Log Kow 4.48 - Melting point -8 °C
a) The arithmetical mean value of reported vapour pressures for nonylphenol with CAS nr 84852-15-3 and 25154-52-3 (Homepage of SRC)
1.6.1 Areas of use For commercial use nonylphenol is further processed to various nonylphenol derivatives or materials which can be categorized into nonylphenol ethoxylates, plastics, resin and stabilizers and phenolic oximes (EU Risk assessment 2002). Table 11 in Annex 1 (p. 56) lists use categories of nonylphenol and nonylphenol ethoxylates registered in the Swedish Products Register (www.kemi.se).
1.6.2 Nonylphenol derivatives Nonylphenol ethoxylates are compounds where a varying number of ethoxy groups are attached to the nonylphenol molecule. The phenolic part of the compound is hydrophilic whereas the ethoxy part of the compound is lipophilic and the length of the ethoxy chain determines the lipophilicity of the compound. Nonylphenol ethoxylates are used as detergents, emulsifiers and dispergents in various industrial and consumer products. (Homepage of KEMI b)
12
Other nonylphenol derivatives are nonylphenol sulfites, phenol/formaldehyde resins, tri (4-nonylphenyl) phosphite (TNPP) and phenolic oximes. Although nonylphenol ethoxylates are often referred to as the most common nonylphenol derivatives, the use of nonylphenol ethoxylates is decreasing in Sweden (Homepage of KEMI c).
1.6.3 Legislation Due to the emerging awareness of the possible negative effects of nonylphenol, legislation restricting its production and use within the EU is now in force. Amendment 2003/53/EC of Directive 76/769/EEC restricting marketing and use of certain dangerous substances states that nonylphenol and nonylphenol ethoxylates cannot exceed concentration of 0.1 % by mass in products used for the following purposes:
⋅ Industrial, institutional and domestic cleaning (with exception for closed systems and systems where the washing liquid is recycled or incinerated)
⋅ Textiles and leather processing (with exception for cases where no water is released into waste water and systems where the process water is pre-treated to remove the organic fraction prior to waste water treatment)
⋅ Emulsifier in agricultural teat dips and co-formulatants in pesticides and biocides ⋅ Metal working (except uses in closed systems where the washing liquid is recycled or incinerated) ⋅ Manufacturing of pulp and paper ⋅ Cosmetic products and other personal care products (except spermicides)
Provisions in above mentioned amendment were to be applied in all member states by 17th of January 2005. The fact that these restrictions do not apply to imported goods results in an influx of nonylphenol more difficult to restrict than production within the union. Månsson et al. (2008) made the observation that textiles are one of the major sources of alkylphenols and alkylphenol ethoxylates to wastewater. In 2007 the Swedish Society for Nature Conservation (SSNC) did a study where they estimated the amount of nonylphenol ethoxylates imported to Sweden in textiles in the year 2006 to 217 tons (Hök 2007). Usage of nonylphenol and nonylphenol ethoxylates is also restricted via regulation 648/2004/EC on detergents based on the low biodegradability of the substances.
1.6.4 Classification, EQS and toxicity Table 2 shows the classifications of nonylphenol according to Annex 1 of Directive 67/548/EEC on classification and labeling of dangerous substances. Table 2: Risk phrases for nonylphenol (CAS nr: 25154-52-3 and 84852-15-3) according to Annex 1 in the directive 67/548/EEC (Homepage of JRC) Risk phrase R22 Harmful if swallowed R34 Causes burns
R50/53 Very toxic to aquatic organisms, may cause long-term adverse effects in the aquatic environment.
R62 Possible risk of impaired fertility
R63 Possible risk of harm to the unborn child
EQS for nonylphenol in the water phase and PNEC values for sediment and biota are listed in Table 3.

13
Table 3: Environmental Quality Standards (EQS) for nonylphenol according to Directive 2008/105/EC and Predicted No Effect Concentrations (PNEC) as listed in the substance datasheet for nonylphenol (Homepage of CIRCA b)
Limit value Comment
AA-EQS 0.3 µµµµg/l All surface waters addressed by the WFD
MAC-EQS 2.0 µµµµg/l
Sediment PNEC 0.2 mg/kg dry weight
Calculated using the equilibrium partition method, see 1.4 Environmental Quality Standards, p. 10. This value should only be seen as indicative of sediment toxicity.
Biota PNEC 10 mg/kg wet weight Protection for secondary poisoning.
The EQS have been developed using toxicity data from three different trophic levels (fish, daphnia and green algae) where the most sensitive species in the acute toxicity tests (short term tests) was the freshwater invertebrate Hyalella azteca for which an EC50 (96 h) of 0.02 mg/l was established (Brooke et al. 1993 cited in the SDS). In the long term tests the freshwater algae Scenedesmus subspicatus was the most sensitive with an EC10 (72 h) of 0.0033 mg/l (Kopf 1997 cited in the SDS).
Nonylphenol has also been shown to have estrogenic effects but these occur at higher concentrations than the effects described above and do not affect the EQS.
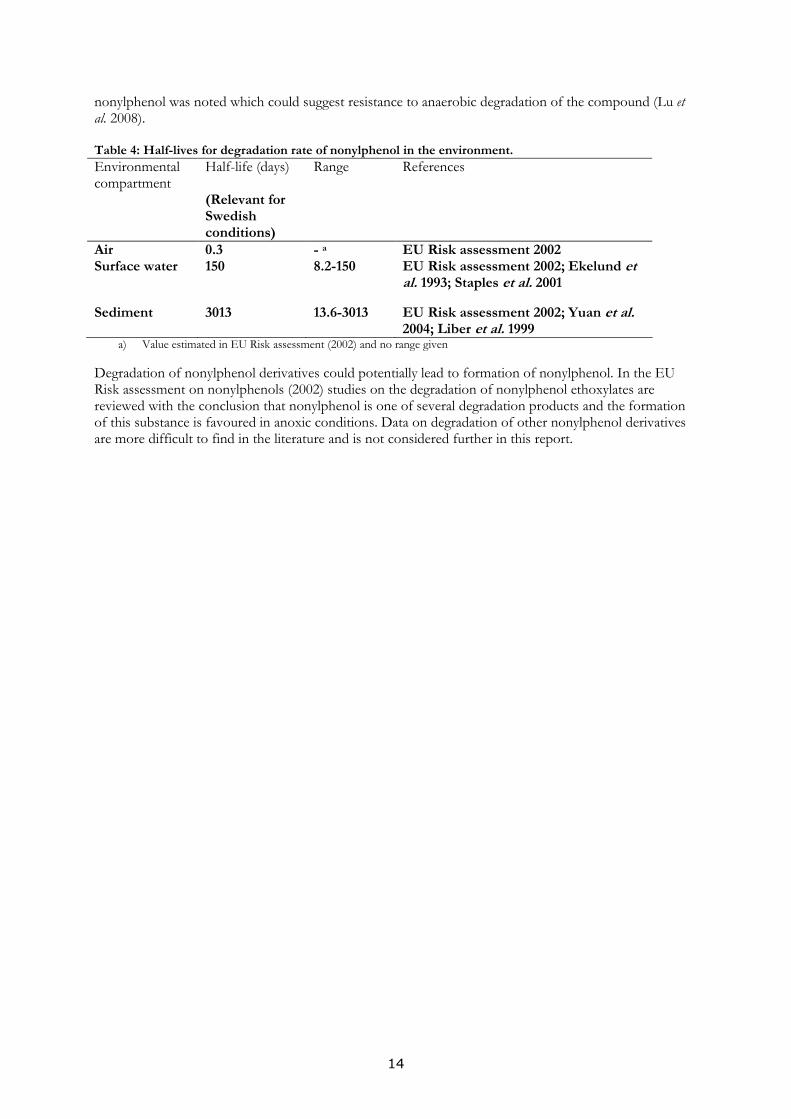
1.6.5 Distribution and degradation In an aquatic environment nonylphenol tends to partition to sediment and to a lesser extent to biota (Huang et al 2007; Lalah et al. 2003). The different isomers of nonylphenol can be expected to have different half-lives. It is believed that the more commonly used branched isomers are more resistant to degradation than the straight alkyl chain isomers (Corvini et al. 2006). This has to be considered when evaluating the results from biodegradation studies. Suggested half-lives, considered to be valid for Swedish conditions, in different environmental compartments are listed in Table 4. Abiotic degradation of nonylphenol occurs in the atmosphere and the substance is not believed to be transported over long distances (EU Risk assessment 2002). In water photolysis of nonylphenol can occur in the top layers of water on a clear day, with a half-life of 10-15 hours (Ahel et al. 1994). Hydrolysis is believed to be a negligible degradation process (EU Risk assessment 2002). Nonylphenol is inherently but not readily biodegradable when tested according to OECD guidelines (EU Risk assessment 2002). The rate of the degradation process increases with increasing temperature and by adaptation of microbes in the system (Yuan et al. 2004; Staples et al. 2001; Tanghe et al. 1998). A wide range of half-lives for aerobic degradation of nonylphenol in water and sediment has been reported in the literature (Table 4). Half-lives in water and sediment given in the EU Risk assessment (2002) were considered relevant for Swedish conditions since development of these rates take into consideration the important factor of low ambient temperature in natural systems. These half-lives refer to mineralisation of nonylphenol. Studies on anaerobic degradation of nonylphenol show ambiguous results; nonylphenol has been shown to degrade in anaerobic river sediments with a half-life of 46.2 to 69.3 days (Chang et al. 2004) but in a recent study of anaerobic degradation of nonylphenol ethoxylates considerable accumulation of
14
nonylphenol was noted which could suggest resistance to anaerobic degradation of the compound (Lu et al. 2008). Table 4: Half-lives for degradation rate of nonylphenol in the environment.
Environmental compartment
Half-life (days) (Relevant for Swedish conditions)
Range References
Air 0.3 - a EU Risk assessment 2002 Surface water 150 8.2-150 EU Risk assessment 2002; Ekelund et
al. 1993; Staples et al. 2001
Sediment 3013 13.6-3013 EU Risk assessment 2002; Yuan et al. 2004; Liber et al. 1999
a) Value estimated in EU Risk assessment (2002) and no range given Degradation of nonylphenol derivatives could potentially lead to formation of nonylphenol. In the EU Risk assessment on nonylphenols (2002) studies on the degradation of nonylphenol ethoxylates are reviewed with the conclusion that nonylphenol is one of several degradation products and the formation of this substance is favoured in anoxic conditions. Data on degradation of other nonylphenol derivatives are more difficult to find in the literature and is not considered further in this report.

15
1.7 The Decision Support System (DSS)
The DSS of the SOCOPSE project (www.socopse.eu) is a handbook and a web-based guidance system with a stepwise description (Figure 2) on how to classify the chemical status of a water body, assess the emissions of the priority substances to the water body and finally find possible measures to remediate problem areas. The handbook also contains guidelines on how to choose the most cost effective method for remediation of pollution problems.
Figure 2: Schematic picture of the SOCOPSE (Source Control of Priority Substances in Europe) Decision Support System (Homepage of SOCOPSE).
The main focus in this study has been on steps 1-3 of the handbook. In the case that the DSS did not provide sufficient support, relevant methodologies were searched for in the literature. The use of these additional methods can be seen as complimentary to the DSS and potentially be included in a later version of the handbook.
1.7.1 Substance Flow Analysis A local and simplified substance flow analysis (SFA) for the Viskan river basin was conducted. The SFA was done using the principles outlined in Brunner and Rechberger (2004). Flows in and out from the system were defined and described. This can be found in chapter 4 (Step 2, p. 25).

16
1.7.2 Environmental Fate Modelling Environmental fate models can be used to predict the fate of a chemical in a defined system. Modelling can be used to predict what water concentration certain emissions will result in or to gain information on what matrix is most suitable for sampling for a specific chemical. In the model the environment is divided into boxes; one box is the air, one is the water, sediment, soil, biota etc. Partitioning of the substance between those boxes is calculated using the concept of fugacity, i.e. the parameter describing the pressure the substance exerts when trying to leave the medium in which it resides. When the system is at equilibrium the fugacity in all compartments is equal and no net transfer of the substance takes place. The partitioning of a substance between the different environmental compartments is determined by the properties of the substance and of the environment. Fugacity models with varying grade of complexity are available. The simplest models assume equilibrium and no net transfer of the chemical and the most complex models are non-equilibrium and dynamic, taking into account change over time. In this study the QWASI (Quantitative Water Air Sediment Interaction) and the Sediment models (Homepage of CEMC), which are “non-equilibrium, steady state (not changing with time) transport”-models, were used to model the fate of nonylphenol in a chosen section of River Viskan. Further descriptions of environmental fate modelling can be found in Mackay (2001) and with specific regards to the WFD priority substances the sections on environmental fate modelling in the DSS handbook is recommended reading (p. 43-53, DSS handbook).

17
2 Step 0: System definition
Figure 3: The river basin of Viskan. River Viskan is one of the larger rivers in Sweden. It flows from Lake Tolken at 228 m.a.s.l. and enters the sea Kattegatt in Klosterfjorden. In the river basin there are several lakes but the main channel of River Viskan flows through only Lake Öresjö. The river flows through the counties of Halland and Västra Götaland and it is a part of the river basin district of Västerhavet. Six different municipalities contain River Viskan or parts of its river basin and they are: Ulricehamn, Borås, Mark, Varberg, Svenljunga and Herrljunga municipalities. The river flows through the cities of Borås and Kinna. Through Kinna flows also one of the tributaries of River Viskan; Häggån. Other stakeholders in the area are the Water Council of Viskan, industries not represented in the water council, NGOs (non-governmental organizations e.g. SSNC) and people living in or visiting the system for e.g. recreational purposes. (Tornevall 2008) The main land use in the area is forestry followed by agriculture; urban areas cover only a small portion of the catchment (Table 5). Table 5: Land cover in the river basin of Viskan, in the year 2005 (Homepage of SCB a if not annotated) Land cover Arable land Pasture Forest Water Urban
areasa Other
Area (km2) 240 110 1300 130 70 350 Percentage of total area (%)
11 5 58 6 3 16
a) Homepage of SCB c
River Viskan Catchment area: 2202 km2
Lake area: 132 km2
Water district: Västerhavet Population: 123 560 inhabitants of which 83 % live in urban areas (2005) Precipitation: 1069 mm/year (Borås, 1994-2006) Temperature: 7 °C (Borås, 1994-2006) Flow at outlet: 39 m3/s (Åsbro, 1994-2006) Reference: Olofsson 2008; Homepage of SCB a and b

18
Large parts of the catchment are considered valuable and beautiful landscapes, important for e.g. recreational purposes. In the Viskan system, salmon, sea-trout, sea lamprey and fresh water pearl mussel can be found. The bedrock in the area is mainly composed of granites and gneiss. Inland areas are mainly covered by moraine and fluvial depositions close to the river. Some smaller parts are also covered with depositions from the ice age. Human activities concerning the river include physical constructions such as dams for power abstraction and lowered lake surfaces, lime treatment to prevent acidification, and industrial activities including e.g. textile, metal and chemical manufacture. Three large as well as more small- scale, both municipal and privately owned, wastewater treatment plants (WWTPs) have their outlet in River Viskan. Within the river basin of Viskan most of the drinking water is abstracted from ground water reservoirs (Oscarsson 2008). The city of Borås takes the drinking water from Lake Öresjö and Kinna takes drinking water from ground water reservoirs (Homepage of Borås Kommun c; Homepage of Marks Kommun). Just downstream Borås River Viskan is known to have one of the most contaminated sediments areas in Sweden. This is mainly due to the fact that the river flows through a region where textile industry has been widespread since the middle of the 19th century. Treatment of the discharge water did not begin until mid 20th century, when the WWTP Gässslösa was built outside (downstream) Borås. Pollutants from these industrial discharges can still be found in the sediments. (Forchhammer et al. 2000) Heavy metals such as lead, cadmium, copper, chromium, mercury, nickel, silver and zinc have been detected in elevated levels in the sediments of lake Djupasjön and lake Guttasjön, downstream the city of Borås, compared to lake Tolken. The brominated diphenylether BDE-209 has been detected in elevated levels in sediments sampled in the river downstream of Kinna. Dioxins, phthalates, PAHs, phenolic compounds and creosotes have also been detected in the sediments of the river. (Forchhammer et al. 2000)
2.1 Evaluation of the DSS, Step 0
Depending on who the user of the handbook is, the results of Step 0 will be different. The user on the regional scale, at the Water District Authority might want to use the DSS handbook to compile information on pollution status and emission sources for the priority substances. In that case the results of Step 0 will be very general at first and the system definition will be added to as each step in the process is completed. Step 0 should therefore be included in the iterative stepwise procedure of the DSS. If the user on the other hand is a water manager on a more local scale, i.e. at the municipal level, information for the system definition could be collected from the Water District Authority. This could include data for the whole catchment area from the pressure and impact analysis as well as characterization and risk assessment. The user on this scale will then proceed with the following steps of the DSS handbook in detail on the local scale, i.e. in a limited area of the river basin. In this case the part of the river basin where measures regarding priority substances are necessary will already have been defined at the Water District Authority. River basin-wide information could then be used to identify emission sources or drivers of change outside the local system.

19
3 Step 1: Problem definition
The objective of Step 1 is to form a problem definition:
⋅ Are priority substances present in concentrations above EQS in the water or are concentrations increasing in water, sediment or biota? And if so,
⋅ In what areas? Figure 4 shows the structure of Step 1.
table/map of actual areas of exceedance
concentrations
exceeding EQS or
increasing?
no
yes
continue
monitoring
according to WFD
set up
monitoring plan
noyes
"sufficient
data?”
yes
measure actual
concentrations
no
harmonized
protocols
available?
yes / not
relevant
no
harmonize
protocols RB wide
Input for Step 2
Input from Step 0
no
yes
guidelines
for
monitoring
and
analysis
EQS or other
target values
define data needed
monitoring
data
available?
report lack
of data to
national level
data
quality OK?
yes
look at
EAQC-WISE outcome
other
information
available?
get advise
from EU CMA (*
*EU Chemical Monitoring Advise Group
(or future bodies) on how to handle data quality
no
look at EAQC-Wise
outcome
guidelines
for data
quality (input
EAQC-WISE)
#1
#2
#3
#4
#10
#5
#6
#12
#14
#8
#9
#7
#11
#13
#15table/map of actual areas of exceedance
concentrations
exceeding EQS or
increasing?
no
yes
continue
monitoring
according to WFD
set up
monitoring plan
noyes
"sufficient
data?”
yes
measure actual
concentrations
no
harmonized
protocols
available?
yes / not
relevant
no
harmonize
protocols RB wide
Input for Step 2
Input from Step 0
no
yes
guidelines
for
monitoring
and
analysis
EQS or other
target values
define data needed
monitoring
data
available?
report lack
of data to
national level
data
quality OK?
yes
look at
EAQC-WISE outcome
other
information
available?
get advise
from EU CMA (*
*EU Chemical Monitoring Advise Group
(or future bodies) on how to handle data quality
no
look at EAQC-Wise
outcome
guidelines
for data
quality (input
EAQC-WISE)
#1
#2
#3
#4
#10
#5
#6
#12
#14
#8
#9
#7
#11
#13
#15
Figure 4: Flowchart depicting the procedure in Step 1 of the decision support system (Homepage of SOCOPSE)

20
3.1 Monitoring data /other information
In 2006, within the national screening program of the Swedish EPA, nonylphenol was measured in samples from Häggån (Screening report 2007:1). In this study grab samples, both filtered and non-filtered were taken. Furthermore nonylphenol has been measured in samples from various locations just downstream Borås in two other studies; a study of WWTP effluent water which included a few sampling points also in the recipient and in a project regarding the contaminated sediments (Remberger et al. 2009; Bank 2004 a). In 2005 Lindström (2006) intended to monitor nonylphenol with passive samplers in Viskan and in Häggån but only the straight chain isomers of nonylphenol, i.e. the isomers not commonly used in commercial products, were measured and the results will be not be used in this study. Figure 5 shows concentration of nonylphenol in water samples from the Viskan system. In Borås and just downstream the city nonylphenol concentrations were in the range 25-240 ng/l. The samples taken in Häggån, outside Kinna, had nonylphenol concentrations of 210 and 320 ng/l in unfiltered and filtered water, respectively. In a project regarding the contaminated sediments in the river, extensive studies of the sediments have been made along the main channel (Forchhammer et al. 2000; Arnér and Nilsson 2002; Von Post 2003; Bank 2004 b). Figure 6 shows nonylphenol concentrations in sediment samples. The section downstream Borås is contaminated with nonylphenol, with concentrations in the top sediment layers in the range ca 3-619 mg/kg dry weight in the three sedimentation lakes Djupasjön, Guttasjön and Rydboholmsdammarna. The concentration of nonylphenol increased with sediment depth at these locations. In all other sampling locations (with the exception of Stora Hålsjön) the concentration of nonylphenol was below the detection limit (0.1 mg/kg dry weight). The sample in Stora Hålsjön had a nonylphenol concentration of 9 mg/kg dry weight, which is almost negligible compared to the levels in the sediments downstream Borås (up to 619 mg/kg dry weight in the same investigation). One explanation to the occurrence of nonylphenols in Stora Hålsjön might be that water from River Viskan has been led to this lake in periods to even out the water flow at the power station at Rydal, south of Borås (Bank et al. 2004). Nonylphenol concentrations in fish, caught in the lakes Öresjö, Guttasjön, Djupasjön and Rydboholmsdammarna, were measured in the spring of the year 2000 in a study by the Water Council of Viskan. Concentrations were below the detection limit in both eel (n=2) and pike (n=4). The detection limits were 1.2 and 6.5 mg/kg fat in eel and ranged from 13-50 mg/kg fat in pike. (PM Fiskstudier i Viskan) No data on environmental monitoring of any of the nonylphenol derivatives in River Viskan have been found in the literature. Other information, complimentary to the monitoring data and valuable in the problem definition, was gathered in Step 2 Inventory of sources (p. 25) and Step 3 Definition of baseline scenarios (p. 34).

21
Figure 5: Nonylphenol concentrations in water samples from River Viskan and Häggån (Remberger et al. 2009; Screening Report 2007:1; Bank 2004 a). The highest measured concentration at each location is shown. Downstream Borås the level of nonylphenol was below detection limit in December 2003 but above in September the same year, these samples were taken close to the bottom of the lakes. Concentrations are in unfiltered samples with exception of the sample in Häggån (Kinna) in which the concentration is in filtered water.

22
Figure 6: Nonylphenol concentrations in surface sediments in River Viskan and Lake Stora Hålsjön (Forchhammer et al. 2000; Arnér and Nilsson 2002). The highest measured concentration at each location is shown.

23
3.2 Data quality OK? / Sufficient data?
The available data are scarce and of varying quality. As available monitoring data for the water phase refers to occasional grab samples, comparison could only be made with the MAC-EQS value and no inference on possible long term negative effects could be made. Neither could the data be used to assess time trends as comparable data from a longer time periods are not available. The water samples have been taken close to urban and/or contaminated areas which mean that they may not be representative for the whole river basin. The sediments in the main channel of River Viskan were sampled in a more structured way which means that the data can be used both to identify possible problem areas and also to identify non-affected areas. Monitoring data for biota in the river has are too scarce to make a proper assessment of possible risks for secondary poisoning of predators, or human health. The detection limits (0.5-2.0 mg/kg wet weight as re-calculated from concentrations on a fat weight basis) in the fish, in which nonylphenol was measured, are however below PNEC (see Table 3) which is an indication of low or no risk.
3.3 Set up of a monitoring plan
A monitoring program for River Viskan could include one or several of the following suggestions in order to further elucidate the pollution status with regards to nonylphenol:
⋅ Monthly sampling for one year at the locations where nonylphenol concentrations in grab samples were close to the AA-EQS (downstream Borås and in Häggån, where it flows by Kinna) to assess possible long term effects.
⋅ To confirm the good status indicated by the sediment samples in several locations,
measurements also in water samples from the same locations could be made. Lakes and tributaries could also be included in the program as the status in these parts of the river system is not known.
⋅ Sampling of the sediments in Häggån, where it flows by Kinna, and subsequent analysis of
the nonylphenol concentration. This would be an important part in an investigation of the source of nonylphenol in this part of the river basin.
3.4 Concentrations exceeding EQS or increasing?
Nonylphenol concentrations in water samples indicate on-going emissions of the substance both in Viskan, just downstream Borås and in Häggån, where it flows by Kinna. The nonylphenol concentrations do not exceed MAC-EQS in either of these locations. Concentrations of nonylphenols in a few grab samples are however close to the AA-EQS. Nonylphenol concentrations in sediment samples indicate that, in the main channel of the river, it is only the section just downstream Borås that is a potential problem area. In this section of River Viskan sediment concentrations exceeded the sediment PNEC value as calculated with the equilibrium partition method. However, the data from the sediment sampling suggests that levels of nonylphenol are decreasing with time as the concentrations increased with increased sediment depth. As nonylphenol is categorized as a priority hazardous substance (WFD; appendix X) and emissions are supposed to cease completely, an investigation of sources of nonylphenol to River Viskan is motivated.

24
3.5 Evaluation of the DSS, Step 1
The general stepwise procedure of Step 1 is rather intuitive, but to carry out each sub step is difficult. Step 1 would make a more helpful tool if each sub step were to be more thoroughly described and also exemplified. The DSS handbook has potential to provide useful help in situations where monitoring data are scarce by introducing the “other data available” box. To do so this part of the handbook needs to be further developed. Examples from the case studies could be used as examples on what “other information” could be and also how to get this information. Monitoring data from other matrices than water, results from modelling exercises, emission data, studies on biological effects etc. are all examples on data that can be used as complement to monitoring data from the water phase. Guidance on how such material can be used for status classification according to the WFD would in many cases be very valuable. If a need for a monitoring programme for the priority substances in the river basin is identified, the outcome of Step 2-3 in this DSS handbook could give valuable information on what substances that need to be monitored (i.e. only substances that are emitted to the system) and also in what matrix each substance should be monitored. This could be mentioned in sub step 5.
25
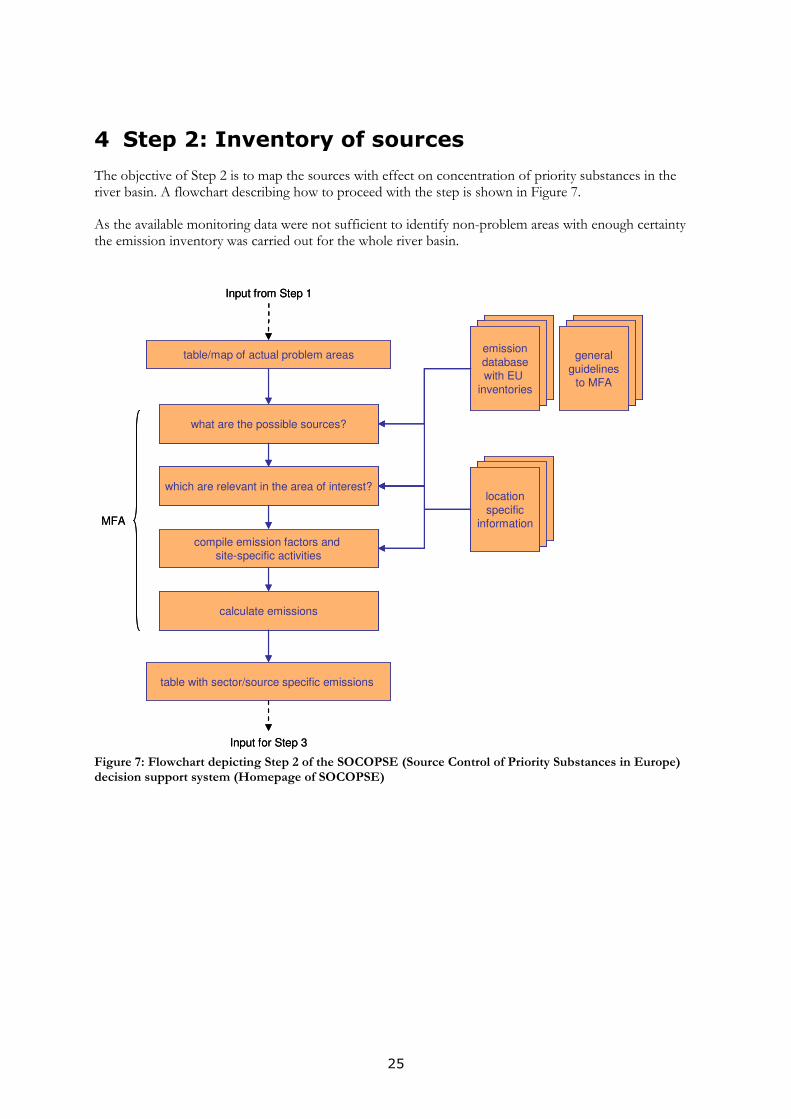
4 Step 2: Inventory of sources
The objective of Step 2 is to map the sources with effect on concentration of priority substances in the river basin. A flowchart describing how to proceed with the step is shown in Figure 7.
As the available monitoring data were not sufficient to identify non-problem areas with enough certainty the emission inventory was carried out for the whole river basin.
table/map of actual problem areasemission
databasewith EU
inventories
Input from Step 1
table with sector/source specific emissions
Input for Step 3
what are the possible sources?
which are relevant in the area of interest?
compile emission factors and site-specific activities
calculate emissions
MFA
general
guidelinesto MFA
location
specificinformation
table/map of actual problem areasemission
databasewith EU
inventories
emission
databasewith EU
inventories
Input from Step 1
table with sector/source specific emissions
Input for Step 3
what are the possible sources?
which are relevant in the area of interest?
compile emission factors and site-specific activities
calculate emissions
MFA
general
guidelinesto MFA
general
guidelinesto MFA
location
specificinformation
location
specificinformation
Figure 7: Flowchart depicting Step 2 of the SOCOPSE (Source Control of Priority Substances in Europe) decision support system (Homepage of SOCOPSE)
26
4.1 What are the possible sources?
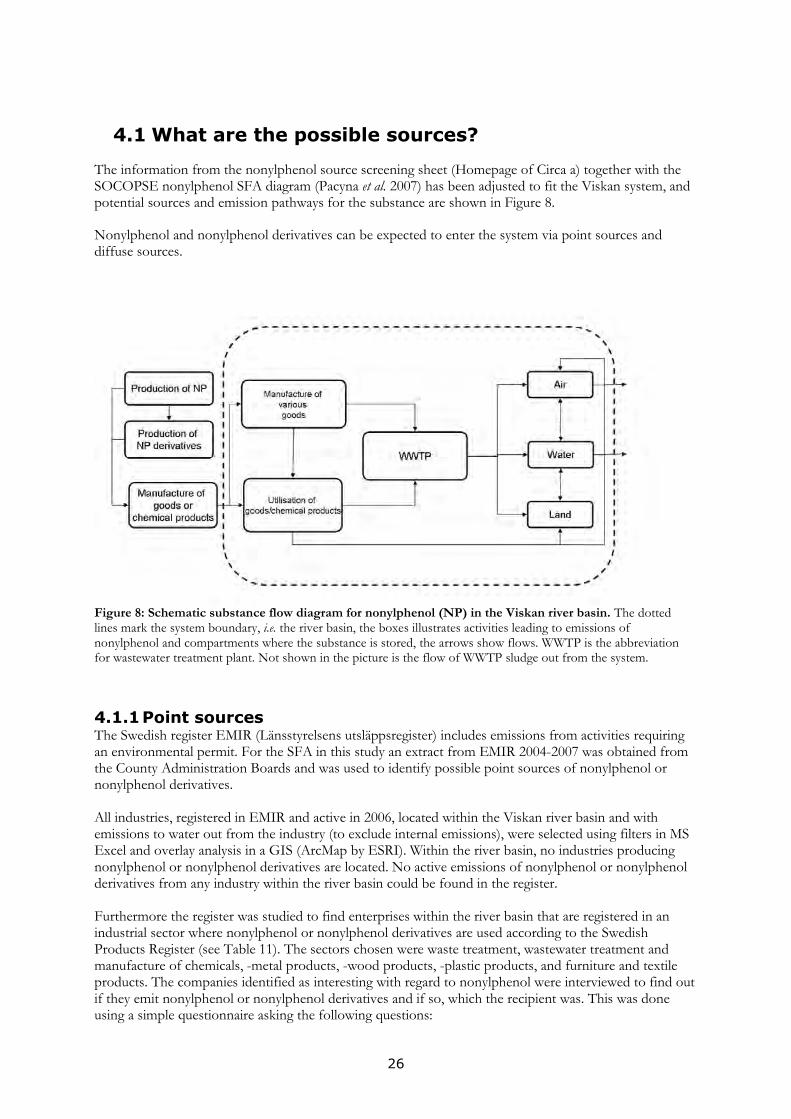
The information from the nonylphenol source screening sheet (Homepage of Circa a) together with the SOCOPSE nonylphenol SFA diagram (Pacyna et al. 2007) has been adjusted to fit the Viskan system, and potential sources and emission pathways for the substance are shown in Figure 8.
Nonylphenol and nonylphenol derivatives can be expected to enter the system via point sources and diffuse sources.
Figure 8: Schematic substance flow diagram for nonylphenol (NP) in the Viskan river basin. The dotted lines mark the system boundary, i.e. the river basin, the boxes illustrates activities leading to emissions of nonylphenol and compartments where the substance is stored, the arrows show flows. WWTP is the abbreviation for wastewater treatment plant. Not shown in the picture is the flow of WWTP sludge out from the system.
4.1.1 Point sources The Swedish register EMIR (Länsstyrelsens utsläppsregister) includes emissions from activities requiring an environmental permit. For the SFA in this study an extract from EMIR 2004-2007 was obtained from the County Administration Boards and was used to identify possible point sources of nonylphenol or nonylphenol derivatives. All industries, registered in EMIR and active in 2006, located within the Viskan river basin and with emissions to water out from the industry (to exclude internal emissions), were selected using filters in MS Excel and overlay analysis in a GIS (ArcMap by ESRI). Within the river basin, no industries producing nonylphenol or nonylphenol derivatives are located. No active emissions of nonylphenol or nonylphenol derivatives from any industry within the river basin could be found in the register. Furthermore the register was studied to find enterprises within the river basin that are registered in an industrial sector where nonylphenol or nonylphenol derivatives are used according to the Swedish Products Register (see Table 11). The sectors chosen were waste treatment, wastewater treatment and manufacture of chemicals, -metal products, -wood products, -plastic products, and furniture and textile products. The companies identified as interesting with regard to nonylphenol were interviewed to find out if they emit nonylphenol or nonylphenol derivatives and if so, which the recipient was. This was done using a simple questionnaire asking the following questions:

27
1. Does the activity generate any emissions to air, water or land? 2. How often are the emissions measured and for what parameters? 3. Are the emissions treated and if so, how? 4. Are nonylphenol and/or nonylphenol derivatives handled in the industry? 5. If nonylphenol and/or nonylphenol derivatives are measured in emissions, what concentrations
are found? All interviewed industries answered that their wastewater (if the production generates waste water) is lead to a WWTP, either municipal or own (Table 6). The emissions to air were mainly due to combustion of fossil fuels or use of paints or lacquers containing volatile solvents. No industry answered that they used nonylphenol or nonylphenol derivatives in their production. Some industries within the textile and metals manufacture sectors analyze the wastewater for nonylphenol and nonylphenol ethoxylates on a regular basis and these measurements verify that nonylphenol ethoxylates are emitted from a few industries within the river basin. The WWTP in Gässlösa works actively with industrial control, i.e. they are updated on what substances that are used in the industries connected to the plant and work actively to lower emissions of certain substances, including nonylphenol, to the WWTP. One example is substitution of degreasing products containing nonylphenol ethoxylate. Table 6: Fate of the wastewater from industries in the Viskan river basin. For each sector listed the percentage of plants emitting wastewater to a wastewater treatment plant (WWTP), the recipient, or not generating wastewater is given. The industrial sectors in the table have been selected based on the criteria that nonylphenol or nonylphenol ethoxylates have registered use (Swedish Products Register) within this sector. Industrial sector WWTP
On site cleaning facilities
Direct to recipient
No water emissions
Number of industries
Manufacture of textiles > 200 ton/year
100 % 5
Manufacture of plastics > 20 ton/year
1**
Manufacture of organic chemicals
100 % 2
Manufacture of fabricated metal products
67 % 33 % 3
Manufacture of furniture 100 % 1
Manufacture of wood and products of wood and cork
100 % 1
Refuse disposal 100 % * 2 * Water from impervious surfaces at one site is lead direct to recipient ** This industry had yet not answered at the time of publication of this report Smaller industrial facilities with duty to report to the authorities but not requiring a permit are normally connected to the municipal WWTP if located in urban areas. Such facilities in rural areas should however be considered as potential point sources. Information on these facilities can be found at the municipal environmental office. No inventory of these sources was made in this study. Wastewater treatment plants In the Viskan river basin there are three major WWTPs that are located in Skene, Bogryd and Gässlösa. The plant at Gässlösa is the largest of the three. The emissions of nonylphenol in the sludge from these plants are reported to EMIR.
28
The sludge from Skene WWTP is deposited within the river basin border and the drainage water is led to the WWTP (Miljörapport Skene Avloppsverk, 2007). Sludge from Bogryd is sent to Gässlösa and all sludge from the Gässlösa plant is transported out of the system, to be used as fertilizer in Skåne. Before 2008 the sludge from Gässlösa was deposited within the river basin and the drainage water was collected and transferred back to Gässlösa WWTP (Fransson, personal communication). Table 7 lists concentrations of nonylphenol and mono-, di- and triethoxylated nonylphenol ethoxylates in in-flow and out-flow to Gässlösa WWTP. The WWTP seems to act as a trap for nonylphenol as out-flow concentrations is consistently lower than inflow concentrations. In the samples of out-flow water from 2008 nonylphenol could be detected and analyzed in concentrations ranging from < 79 – 120 ng/l (Remberger et al. 2009). Monitoring of the sludge (and in one occasion, water) indicates that effluent water from Bogryd and other, smaller WWTPs in Borås municipality, contains similar or lower nonylphenol concentrations compared to effluent water from Gässlösa (Magnusson, personal communication). Table 7: Nonylphenol in influent (in) and effluent (out) water of Gässlösa WWTP
Substance Date Conc. in (ng/l)
Conc. out (ng/l)
Ref
4- nonylphenol 2008-08-06 <79 Remberger et al. 2009
2008-04-03 99 2008-03-04 120 4- nonylphenol 2007b-12-09 <1000 <1000 Magnusson,
personal communication
4- nonylphenol-monoethoxylate <1000 <1000 4- nonylphenol-diethoxylate 1900 <1000 4- nonylphenol-triethoxylate <1000 <1000 4- nonylphenol 2002b-05-16 7700 960 4- nonylphenol 2002b-12-16 <1000 <1000 4- nonylphenol 1999-05-18 15000 <2000 4- nonylphenol-monoethoxylate 37000 <2000 4- nonylphenol-diethoxylate <10000 <2000 4- nonylphenol 1999-02-11 <1000 <3000 4- nonylphenol-monoethoxylate 50000 <5000 4- nonylphenol-diethoxylate <5000 <5000
a) The sign < preceding a value indicates that the concentration is below the detection limit b) Flow proportional sampling over seven days. The listed date is the last day of sampling.
In a few occasions each year the flow of water to the WWTP is too large for the plant to treat in the normal treatment facility. Overflowing water is led over a grid and a sand filter before entering the recipient (Miljörapport Gässlösa Avloppsreningsverk, 2007). These events are thus also a potential source of emissions of nonylphenol to the system but have not been further considered in this study.

29
4.1.2 Diffuse sources To quantify diffuse sources is difficult and knowledge in this field regarding nonylphenol is only starting to emerge. Therefore nonylphenol emissions to Viskan from sources such as the atmosphere and drainage from agricultural land use or polluted land areas will be regarded as minor and thus omitted from quantification in this study. The only diffuse sources quantified in this study are storm water emissions and leakage from the contaminated sediments downstream Borås. Storm water Several studies have recently identified storm water as a potential source of organic pollutants, e.g. nonylphenol, to surface waters (Björklund et al. 2007; Björklund et al. 2009; Ryegård et al. 2007; Rosquist 2004). Nonylphenol in storm water originates e.g. from paints and lacquers, motor oils, concrete building material (Björklund et al. 2007). The amount of storm water entering the recipient and also the concentration of pollutants in this water is dependent on many different variables such as precipitation volume, intensity, frequency and evaporation and area, structure and type of impervious surface (Björklund et al. 2007, Larm 2000). There are a number of storm water computer models available (e.g. SEWSYS and StormTac; see Björklund et al. 2007; Larm 2000). In this study a simplified method, based on the method described by Larm and Holmgren (1999) complemented with the information on distribution of the different impervious surfaces in Swedish cities developed by Ryegård et al. (2007) was applied. Storm water flow Storm water flow can be calculated using the formula presented by Larm and Holmgren (1999):
)(1
i
N
i
i ApQ ∑=
= ϕ
Q = run off (l/year) Ai = area (m2) φi = run off coefficient p = precipitation (mm/year) In the river basin of Viskan two different sources of storm water were defined, urban areas and roads outside urban areas. Urban areas The area of Borås and Kinna (31.3 and 16.4 km2, respectively) was obtained by area measurements in The General map of Sweden in a GIS. The total area of Borås and Kinna (47.7 km2) was used to calculate an estimate of the total storm water run off from urban areas in the river basin. Run off coefficients for Swedish urban areas were obtained from Larm (2000) and the fraction of the total area in each class from Ryegård et al. (2007). In a relationship database (MS Access) the area of impervious surface in each class was calculated for the whole river basin (Table 12) as well as for the two major cities, Borås and Kinna. In Borås municipality 90 % (±25) of the storm water goes straight to the recipient, 5 % (±25) to dams, 5 % (±25) to other treatment facilities and 0 % to the WWTP (Ryegård et al. 2007). According to Svensson (personal communication) no more detailed information on the fate of storm water in Borås is available. In this study the water entering any kind of treatment facility has been regarded as clean (this fraction is 10 % of the total storm water volume). Neither dams nor open ditches are constructed to specifically clean the water of nonylphenol or nonylphenol derivatives. In a more detailed analysis of nonylphenol in storm water retention and degradation in treatment facilities should be taken into consideration. Storm water flow, entering Viskan without prior treatment, from urban areas in the whole river basin, was calculated to 12 800 000 m3 per year based on the average rain rate for Borås 1994-2006, 1069 mm/year

30
(Olofsson 2008). The rain rate was corrected with the factor 1.15 as described in Larm (2000). The run off per square kilometre was thus 0.30 × 10⁶ m3/year1 which is comparable to the flows (0.22 × 10⁶ and 0.28 × 10⁶ m3/year) calculated and verified by Larm and Holmgren (1999). Storm water flow in Borås and Kinna was calculated to 8 400 000 and 4 400 000 m3/year, respectively. Road area The total road area in the river basin was calculated to 5.5 km2, using data included in the working material of the study by Ryegård et al. (2007). In the municipality of Borås 5 % (±25) of the storm water from roads goes straight to the recipient, 5 % (±25) is led to dams before entering the recipient and the main part of the storm water, 90 % (±25) enters some kind of retention and/or treatment construction, e.g. open ditches, before it enters the recipient (Ryegård et al. 2007). For the roads in the river basin the storm water flow, entering Viskan without prior treatment, was calculated to 290 000 m3. Nonylphenol concentration in storm water The concentration of nonylphenol or nonylphenol derivatives in storm water has to my knowledge not been measured in the Viskan river basin. Studies of nonylphenol/nonylphenol ethoxylates in storm water has however been made in Stockholm (this study included one location in Gothenburg) and in Skåne. In the studies by Björklund et al. (2007) and Rosquist (2004), storm water from residential areas as well as locations with intense traffic was sampled and analyzed. In both studies 4-n- nonylphenol, the isomer with a straight alkyl chain, could not be detected at all or was detected in a very low concentration (one sample, 2 ng/l). 4-iso- nonylphenol was however detected in higher levels, ranging from below the detection limit (which varied between <50-200 ng/l) to 1220 ng/l. The maximum value was detected at a traffic intensive location at Gårda in Gothenburg. Nonylphenol ethoxylates (mono- to hexa ethoxylated) was also analyzed in those studies and the reported concentrations varied from below the detection limit (<10-200 ng/l) to 2160 ng/l (nonylphenol -tri-ethoxylate). Contaminated sediments Fugacity modelling conducted in Step 3 (see p. 35, 5.1 Environmental Fate Modelling) indicates that the sediments are a source of nonylphenol to the water phase in Viskan just downstream Borås. Since no measurements of nonylphenol in sediments in tributaries have been found in the literature it is not possible to determine whether sediments act as a source also in these parts. Nonylphenol ethoxylates and/or other nonylphenol derivatives stored in the sediments could possibly be a secondary source of nonylphenol as they are degraded; this is particularly relevant during anoxic conditions (EU Risk assessment 2002). Emissions of nonylphenol from the stored amounts of nonylphenol derivatives can be expected to have seasonal variability, i.e. larger emissions in the summer season when the temperatures are higher and lower emissions in the winter. This potential source of nonylphenol has not been quantified in this study.
1 The yearly storm water flow divided with the area of impervious surface (for the whole catchment)

31
4.2 Estimated emissions of nonylphenol
Potential sources of nonylphenol (and its derivatives) within the river basin of Viskan are shown in Figure 9.
Figure 9: Potential sources of nonylphenol within the river basin of Viskan. The data from Gässlösa WWTP was used to estimate the nonylphenol concentration in wastewater out-flow from the three major WWTPs. The nonylphenol concentration was estimated to 86 ng/l by calculation of the arithmetical mean of the nonylphenol concentration in the samples where the detection limit was low enough for quantification (Remberger et al. 2009, Table 7). For the one sample where the concentration was below the detection limit this value was set to 0.5 × the detection limit. An estimate of nonylphenol concentration in storm water from urban areas and roads was calculated to 200 and 250 ng/l, respectively. For urban areas the concentration was calculated from the arithmetical mean value from all nonylphenol concentrations reported in Björklund et al. (2007) and Rosqvist (2004). For roads results from samples from traffic intense locations (Gårda2 (Björklund et al. 2007) and Malmö, Stockholmsvägen-Krusegatan (Rosqvist 2004)) were used. Concentrations below the detection limit were set to zero for the 4-n- nonylphenol isomer and to 0.5 × the detection limit for 4-iso- nonylphenol.
2 Concentrations included are those in combined samples of in- and out-going water, including both filtered and unfiltered water from the one occasion when filtration was applied.

32
The pollutant concentration in storm water from roads is heavily influenced by the intensity of traffic. The majority of roads intersecting the river basin are not as heavily trafficked as the sampling locations. This potential over estimation of nonylphenol emissions is hopefully balanced by the fact that only a small proportion of the storm water will be considered as a source of nonylphenol to Viskan (5 %). Table 8 lists estimated emissions of nonylphenol from WWTPs and storm water, and predicted flows from the contaminated sediments. These three sources seem to be of equal size if transport, due to diffusion, from the sediments is seen as the only source of nonylphenol to the water phase. If, on the other hand, also resuspension is regarded as a source rather than just replacement of contaminated sediments, these sediments are potentially a very large source of nonylphenol. These results show that, based on available data, the section downstream Borås is most heavily exposed to nonylphenol emissions. These values should, for obvious reasons, be interpreted with caution. Factors influencing the uncertainty are e.g. the fact that all small WWTPs have been omitted, the sediment emissions are modelled and that storm water concentrations are for another locality and calculated from rather few samples. Table 8: Estimated emissions of nonylphenol in the Viskan river basin. The concentrations are estimated from monitoring data and the flows are out-flow from the wastewater treatment plants (WWTP) and estimated yearly storm water flow entering the recipient. Emissions from the sediments are calculated with the Sediment fugacity model. Source Concentration
(ng/l) Flow (l/year)a
Emission (kg/year)
Comment
WWTP
All WWTPs 1.9
Gässlösa 86 17 × 109 1.5
Bogryd 86 1.0 × 10⁹ 0.090
Skene 86 4.2 × 10⁹ 0.37
Storm water
Catchment area (except roads) 200 13 × 109 2.5
Borås 200 8.4 × 10⁹ 1.7
Kinna 200 4.4 × 10⁹ 0.87
Roads 250 0.29 × 10⁹ 0.074
Industry Connected to WWTP
Sedimentsb
Downstream Borås 1.1 Diffusion
11 Resuspension a) The flow (out-flow in l/year) of the WWTPs is the arithmetical mean of yearly out-flow 2004-2007 (2008, for Skene)
(Homepage of Borås kommun d; Mellström, personal communication) b) Predicted with the Sediment model, see. 5.1.3
33
4.3 Evaluation of the DSS, Step 2
The SFAs made in SOCOPSE are meant to be used as a base for the emission inventory, either as an inventory of possible sources or, after appropriate scaling, to quantify flows. In the SFA for nonylphenol in Europe, emissions to water were estimated to 982 ton/year from manufacture of various materials and 29.4 ton/year from municipal and industrial wastewater (Pacyna et al. 2007). Based on population size (EU population 493 millions) these numbers can be scaled down to the Viskan river basin resulting in estimated nonylphenol emissions of 0.25 and 0.007 ton/year for manufacture and wastewater, respectively. The estimated yearly emission of 7 kg, based on the European scale SFA, could be compared to the estimated yearly emission based on local data, approximatley 2 kg. The estimated yearly emission based on European data is larger than the emissions calculated in this study and one reason could be the use of old data in the European SFA as nonylphenol regulations have come into force in recent years. For the SFAs to work as background material it is important that they are clearly referenced as legislation and use patterns continuously change and the user of the data will have to assess its validity in each separate case. As the SOCOPSE project cannot cover all priority substances and information is in many cases difficult to access and to continuously update, the project should aim to provide tools rather than actual numbers. The DSS handbook could provide the water manager with detailed instructions on how to conduct an SFA with regards to the WFD priority substances and with the use of a few example substances the concept of SFA could be illustrated. The SOCOPSE emission database3 presented in the DSS handbook could be a very good tool provided that improvements regarding both its content and user friendliness are undertaken. Such a database should be structured so that only relevant combinations of substance and emission source are possible choices. There would be an obvious need for up-to-date information and continuous revision if the database was made publicly accessible. If the database cannot be finished within this project a similar approach as suggested for the SFA can be taken – the use of emission factors can be illustrated with the example substances and the principles of how find and use emission factors with regards to the WFD priority substances explained. The use of emission factors is thus introduced as a tool in the DSS handbook. In many river basins in Sweden point sources will not be the only large sources for the priority substances but diffuse sources, more difficult to assess both qualitatively and quantitatively, will also be major contributing sources. This may be the case also in other member states; the DSS could thus be more comprehensive with regards to diffuse sources of priority substances. This could be done by introducing useful models or referring to recent studies on storm water, contaminated land, atmospheric deposition etc.
3 This refers to a preliminary version of the database, not publicly available

34
5 Step 3 Definition of baseline scenarios
The main objective of Step 3 is to answer two questions:
⋅ Are additional measures needed to improve the water quality in the system or are the measures already taken sufficient?
⋅ Is there reason to believe that the situation will be different in the future with respect to factors affecting the concentration of priority substances in surface waters?
Figure 10 shows the flowchart describing how to do this step.
Decide upon the time frame: WHEN is the change happening?
What key-drivers are
affecting water quality?
CALCULATE concentration trends
table/map of future areas of exceedance
and possible sources
Input for Step 4
Checklist of possible
drivers
of change
Is there reason to assume that the future water
quality will be different from
the current status?
Local data: emission
factors
EnvironmentalFate Models
Input from Step 2
no
yes
Concentrations
exceeding EQS
or increasing ?
no
Make emission trends
Make environmental trends
yes
no problem
Figure 10: Step 3 of the SOCOPSE (Source Control of Priority Substances in Europe) decision support system (Homepage of SOCOPSE)

35
5.1 Environmental Fate Modelling
The environmental fate models QWASI and Sediment (Homepage of CEMC) were used to identify what natural processes affect nonylphenol concentration in the contaminated section between Borås and Rydboholm (see map in Annex 3).
5.1.1 System description (Olsdalsbron-Rydboholm) This section of River Viskan consists mainly of sedimentation basins, namely the small lakes Djupasjön, Guttasjön and Rydboholmsdammarna. For this modelling exercise these three sedimentation basins were defined as one system and describing parameters were averaged where appropriate. In Annex 4, Table 13 and Table 14 list the environmental properties of this section of River Viskan. Table 15 shows the carbon mass balance set up to quantify the degradation of organic matter in the sediment. Data on nonylphenol as presented in Table 1 and Table 4 was used in the models. The half-lives were placed in the classes suggested by Mackay (2001) and the values used in the models for degradation in water and sediment were 5500 and 55000 h, respectively. Using half-lives referring to mineralisation and not primary degradation of the substance makes the modelling a “worst case scenario” since EQS are set for the parent compounds only. In the Sediment model the mineral-water partition coefficient for nonylphenol was set to 1 l/kg.
5.1.2 The QWASI model A direct input of 100 kg nonylphenol per year to the water was set as the only emission of the substance. The resulting diagram is shown in Figure 11. As can be seen in the diagram 98 % of the nonylphenol entering the system is transported further downstream. This is what can be expected from substances with long half-lives, relatively high water solubility and low vapour pressure, such as nonylphenol. Within the system 78 % of the substance mass is predicted to partition to the sediment and 22 % will be found in the water phase. 0.2 % of the emitted amount evaporates, 0.8 % is buried in the sediment and 0.6 % is transformed in the water and sediment. As the relationship between emissions and the resulting water concentration is linear in the QWASI model the concentration change per emitted kg of the substance can be calculated. According to the relationships in the diagram in Figure 11 each emitted kg of nonylphenol in River Viskan (Olsdalsbron – Rydboholm) would result in a concentration increase of 4.02 ng/l. The AA-EQS for nonylphenol is 0.3 µg/l. Based on the above-mentioned relationship a yearly maximum emission of 75 kg nonylphenol per year would be possible for compliance with the AA-EQS in this section of the river. It would however move a potential problem downstream. The QWASI model predicts the residence time of nonylphenol in the water phase to be 1.31 days. If all emissions of nonylphenol to this system would cease, it would thus take approximately 3 days for the water concentrations to drop to 10 % of the original levels. In the sediment the remediation process would be slower. With a residence time of 0.22 years, a reduction of nonylphenol sediment concentration to 10 % of the original value would take approximate 0.5 years.

36
Figure 11: The fate of nonylphenol in River Viskan (section Olsdalsbron-Rydboholm) at steady state when emission of the substance to water equals 100 kg/year. The modelling was performed in the fugacity model QWASI (Homepage of CEMC).
5.1.3 The Sediment model The measured water and sediment concentration in the modelled section of River Viskan were obtained from different sources (Forchhammer et al. 2000; Arnér and Nilsson 2002; Bank 2004a, Remberger et al. 2009). As the sediment concentrations spans over several orders of magnitude two different scenarios were created; maximum and minimum sediment concentrations. (Annex 5, Table 16). Using the minimum concentrations the Sediment model predicts that the sediments act as a source of nonylphenol with yearly emissions of nonylphenol of 1.1 kg by diffusion and 11 kg by resuspension (Figure 12). The maximum concentration scenario resulted in predicted yearly emissions by diffusion of 57 kg and by resuspension 620 kg.

37
Figure 12: The fate of nonylphenol in the water-sediment system of Viskan downstream Borås (Olsdalsbron – Rydboholm) as modelled with the Sediment model (Homepage of CEMC). Input values for water and sediment concentration of nonylphenol were 0.17 µg/l and 9 mg/kg dry weight, respectively (Table 16). Using the estimated emissions of nonylphenol (Table 8) as input to the QWASI model the results can be used to verify the system description and the estimated emissions when compared to monitoring data. In this modelling exercise a yearly input of 15 kg nonylphenol to the system and a concentration in in-flowing water of 33 ng/l4 results in a predicted water concentration of 88 ng/l and a sediment concentration of 0.2 mg/kg dry weight. The modelled water concentration is lower but in the same order of magnitude as experimental water data. The predicted sediment concentration is one to three orders of magnitude lower than measured concentration in the sediment samples. The reason for these lower values could be that emissions are underestimated, i.e. that there are more emission sources in the area, or that emissions from the existing sources are higher. It is possible that the model gives an overall picture, which is closer to the real situation of the top sediment, compared to measurements of heavily polluted bottom sediment layers, sampled with sediment corers.
5.1.4 Sensitivity and uncertainty analysis Uncertainties of results and background material need to be elucidated mainly for two reasons; for the decision maker(s) to understand the results and be able to assess what decisions can be taken based on the results and for the modeller to be directed to where the efforts to fine-tune the data should be placed. In the QWASI model water concentration, and in the Sediment model the two parameters diffusion and resuspension from the sediment, were identified as the most important parameters to control the reliability of. The uncertainty analysis was performed with preliminary values. The QWASI model This analysis showed that the most important parameter was the water out flow rate from the system. A 25 % increase of the water outflow rate resulted in a decreased nonylphenol water concentration of 20 % and a 25 % decrease in the water outflow increased the concentration with 32 %. As the water concentration predicted by QWASI is in linear relationship with the emissions this variable is also very important in the modelling.
4 The arithmetical mean of concentrations of nonylphenol in two samples taken in Borås (Remberger et al. 2009)

38
The Sediment model The results obtained from the Sediment model are sensitive for change in several parameters (Table 9). Table 9: Parameters important for diffusion or resuspension of nonylphenol from sediment, in the Sediment model. The value (given in Table 13 and Table 14) of each parameter was decreased/increased with 25 % and the resulting change in diffusion and resuspension was recorded. Only parameters for which a change larger than 1 % were recorded are included in the table. Percentage values in the table are the resulting change in nonylphenol flow.
Resulting change in flows of nonylphenol due to adjustment of model input parameters Diffusion Resuspension
Parameter Decrease Increase Decrease Increase Sediment area - 25 % + 25 % - 25 % + 25 %
Volume fraction of pore water in sediment
- 36 % + 14 % -- --
Mass fraction of organic carbon in sediment solids
+ 30 % - 19 % -- --
Diffusion path length in sediment + 37 % - 17 % -- --
Molecular diffusivity of chemical in water
- 25 % + 25 % -- --
Sediment resuspension -- -- - 25 % + 25 %
Total chemical concentration in sediment
- 25 % + 25 % - 25 % + 25 %
Log Kow + 32 % - 20 % -- --
--) indicates zero change The results from the sensitivity analysis direct quality control of input values to the most important parameters, it can also give indication of suitable additional studies and/or modelling scenarios, such as adjustment of the water flow to make sure to also cover worst case scenarios caused by low flow periods. Or change of units, such as diffusion and resuspension rate expressed per square meter to assure comparability between localities as the sediment area affects these parameters in a linear way. The values of some parameters vary in ranges over several orders of magnitude. This means that an uncertainty analysis would be an important complement to the sensitivity analysis.
5.2 Estimated future changes in water quality
In this study the key drivers affecting nonylphenol concentrations in surface water were regarded to be: ⋅ The amount of nonylphenol and nonylphenol derivatives being used, for which the Swedish
Products Register can be used as an indicator ⋅ Awareness and active work to decrease emissions at both industrial and municipal level ⋅ Environmental change e.g. reduced water flow, increased storm frequency, flooding, rain rates
etc. The assessment of changes without additional measures, i.e. the baseline scenario, covers the present situation to the year 2025, when emissions of nonylphenol are due to cease according to the WFD.

39
5.2.1 Concentration trends The Products Register (www.kemi.se) can be used as an indicator of emission trends as it contains all use of chemical products within Sweden. For substances with fewer than three registered users data are however classified and thus not publicly available. This is the case in this study which means that a null value does not equal no use but no quantified use). Registered use of three nonylphenol isomers (CAS nr 84852-15-3, 25154-52-3 and 104-40-5) was available from the Products Register from the period 1992-2006 and these data were used as an indicator for emission trends (Figure 13).
0
10
20
30
40
50
60
70
80
90
1992 1993 1994 1995 1996 1997 1998 1999 2000 2001 2002 2003 2004 2005 2006
Year
Me
tric
to
ns
84852-15-3
25154-52-3
104-40-5
Figure 13: Amount nonylphenol (isomers with CAS nr 104-40-5, 25154-52-3 and 84852-15-3) used in chemical products in Sweden during the period 1992-2006 as registered in the chemicals products register. Export and registered name changes have been excluded. For substances with fewer than three registered users data are classified which means that a null value does not equal no use but no quantified use. (Products Register, 2008-11-26)

40
Figure 14 shows the used amount of nonylphenol ethoxylates (CAS nr 68412-54-4, 9016-45-9, 37205-87-1, 26027-38-3 and 127087-87-0) in Sweden during the period 1992-2006.
0
200
400
600
800
1000
1200
1400
1992 1993 1994 1995 1996 1997 1998 1999 2000 2001 2002 2003 2004 2005 2006
Year
Metr
ic t
on
s
68412-54-4
9016-45-9
37205-87-1
26027-38-3
127087-87-0
Figure 14: Amount nonylphenol ethoxylates (CAS nr 68412-54-4, 9016-45-9, 37205-87-1, 26027-38-3 and 127087-87-0) used in chemical products in Sweden during the period 1992-2006 as registered in the Products Register. Export and registered name changes have been excluded. For substances with fewer than three registered users data are classified which means that a null value does not equal no use but no quantified use. (Products Register, 2008-11-26) Since the early 1990s the uses of nonylphenol and nonylphenol ethoxylates in chemical products have dropped substantially. This decreasing trend does however seem to have stagnated during recent years. A decrease in emissions of nonylphenol or nonylphenol ethoxylates via WWTPs due to change in the use of these substances can thus not be expected to 2025. The decreased use of these substances in the nineties might however affect the storm water emissions in the future since nonylphenol and its derivatives are stored for a long time in e.g. building material and paints. In a more detailed analysis also the use of other nonylphenol derivatives should be considered. Non-chemical products, such as textiles and other commercial goods, are not included in the Products Register. Hök et al. (2007) could show that a large part of the nonylphenol in incoming water at a Stockholm WWTP potentially originated from imported textiles. Within the scope of this study it was not possible to assess whether the amount of imported textile, and other goods, will increase or decrease in the future.
5.2.2 Emission trends At the WWTP in Gässlösa nonylphenol is analyzed in the sludge on a regular basis. Figure 15 shows concentrations of nonylphenol in the sludge during the period 1997-2007. Since the partitioning of nonylphenol between water and sludge in the WWTP can be expected to be rather constant the concentration in the sludge is used as an estimator of how the concentration of nonylphenol in incoming water to the WWTP has changed over time. Although the results from each year show large variability a decreasing trend can be seen over the last ten-year period. Due to the active industrial control at Gässlösa WWTP emissions can be expected to further decrease or, at least, to stabilize at current levels.

41
0
50
100
150
200
250
300
1997 1998 1999 2000 2001 2002 2003 2004 2005 2006 2007
Year
mg
/kg
DW
Figure 15: Concentration (mg/kg dry weight) of nonylphenol (4-nonylphenol, all isomers) in sewage sludge at the Gässlösa wastewater treatment plant, WWTP. Error bars indicate max and min values (n= 12). (Magnusson, personal communication). Trends in storm water emissions were not possible to estimate due to lack of data. Increased area of impervious surface, indirectly leading to increased storm water flows, might be counteracted by increased use of storm water treatment facilities (see also 6.2.3). Change in nonylphenol emissions from the contaminated sediments depends to a large extent, as could be concluded in the sensitivity analysis, on water flows and resuspension events. Change in environmental conditions would thus be the most important factor for change in sediment emissions.
5.2.3 Environmental trends Environmental change that could possibly increase nonylphenol levels in River Viskan is e.g. climate change causing increased rain rates and storm frequencies. Decreased levels could be caused by e.g. increased eutrophication, which would lead to increased sedimentation rates. In a detailed investigation, fugacity models could be used to estimate effects on nonylphenol water concentration due to environmental change.

42
5.3 Assessment of future problem areas
There are no indications that areas at risk of not reaching good chemical status will be different in the future compared with the situation today. If no additional measures are taken the section of River Viskan, just downstream Borås and the section of Häggån passing Kinna, will probably still be subject to the highest pressures with regards to nonylphenol emissions. It is possible that additional areas of exceedance are found if monitoring of priority substances is extended. It is also possible that Häggån, where it flows by Kinna, can be shown to be non-problem site. Undisturbed the contaminated sediments could be remediated by natural processes. The heavily contaminated sediments downstream Borås could still be a potential threat to the water status if a storm event or similar sediment disturbance would occur. Nonylphenol is however a priority hazardous substance, for which emissions should cease completely and this do not seem to be achieved by the autonomous development.
5.4 Evaluation of the DSS, Step 3
Step 3 introduces the environmental fate models, which have the potential to be a very useful tool in the work with the priority substances, especially in cases where monitoring data are scarce. These models could preferably be introduced already in Step 1 as they could serve, as in this case, not only to predict future scenarios but also to give an understanding the fate of the substance in the environment studied. The models could for example be used in the planning process when a new monitoring program is developed. Where monitoring data are scarce but emission data are available the models could also serve as tools to predict current water concentration of a substance. To collect, evaluate and compile data on chemical properties as well as environmental properties is time-consuming. Hence the chemical properties database could be a useful tool (DSS p. 44). If data on chemical properties are to be collected in a database it is important to clearly reference all data and maybe also make an evaluation of the reliability of the data. To foresee future changes is difficult. It is however essential since costly measures, with potential side effects, should not be executed if not necessary. The DSS handbook could therefore contain more detailed descriptions on how to make these kinds of assessments, e.g. how to handle expected increased nutritional loads, storm events or acidification, or at least give relevant references. As diffuse sources are becoming more important, models to predict chemical loads from various sources could be suggested in the DSS handbook, e.g. storm water models or pesticide leakage models. The checklist of possible drivers of change (DSS p. 22) would also provide useful material. This list could preferably be generalized to include drivers of change valid for all priority substances.
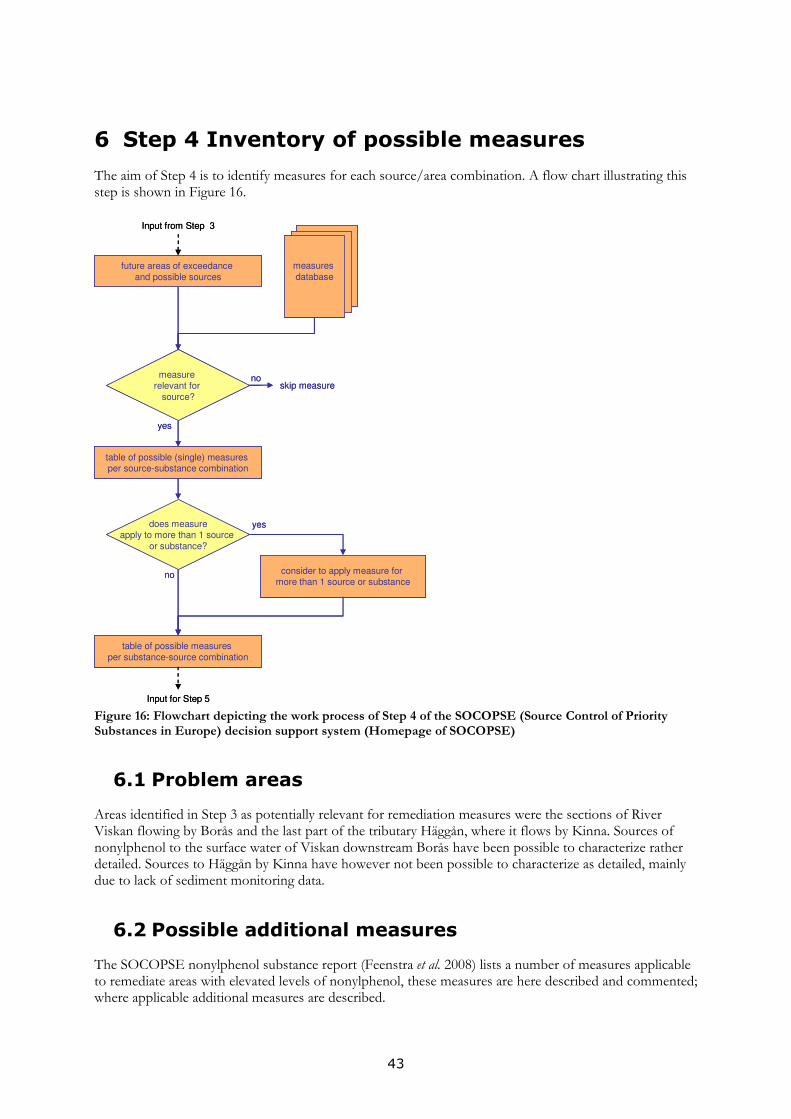
43
6 Step 4 Inventory of possible measures
The aim of Step 4 is to identify measures for each source/area combination. A flow chart illustrating this step is shown in Figure 16.
measures
database
table of possible measures
per substance-source combination
Input for Step 5
future areas of exceedance
and possible sources
Input from Step 3
table of possible (single) measures per source-substance combination
does measureapply to more than 1 source
or substance?
no
yes
consider to apply measure for more than 1 source or substance
measure relevant for
source?
no
yes
skip measure
Figure 16: Flowchart depicting the work process of Step 4 of the SOCOPSE (Source Control of Priority Substances in Europe) decision support system (Homepage of SOCOPSE)
6.1 Problem areas
Areas identified in Step 3 as potentially relevant for remediation measures were the sections of River Viskan flowing by Borås and the last part of the tributary Häggån, where it flows by Kinna. Sources of nonylphenol to the surface water of Viskan downstream Borås have been possible to characterize rather detailed. Sources to Häggån by Kinna have however not been possible to characterize as detailed, mainly due to lack of sediment monitoring data.
6.2 Possible additional measures
The SOCOPSE nonylphenol substance report (Feenstra et al. 2008) lists a number of measures applicable to remediate areas with elevated levels of nonylphenol, these measures are here described and commented; where applicable additional measures are described.

44
6.2.1 Substitutes for nonylphenol According to the concept paper on emission control (Source Identification and Emission Controls 2005, p. 19) measures should not be directed towards end of pipe solutions for storm water and WWTPs. Substitution addresses the problem at the source to reduce emissions of nonylphenol from e.g. storm water or wastewater. The suggested substitute for nonylphenol ethoxylates is alcohol ethoxylates. The fact sheet (Feenstra et al. 2008) does however include information on possible drawbacks of this option such as increased costs and less effective substitutes. Complete cessation of nonylphenol emissions requires substitution of all other nonylphenol derivatives with potential of nonylphenol release to the environment. According to the SOCOPSE nonylphenol substance report (Feenstra et al. 2008) the only available alternative is octylphenols, which due to their assumed toxic similarities to nonylphenols, are not to be recommended as substitutes. This identifies further research in the area of finding environmentally sound substitutes for nonylphenols as an additional, long –term, measure.
6.2.2 End-of-pipe options for the substance The SOCOPSE nonylphenol substance report (Feenstra et al. 2008) describes a number of end-of-pipe options possible to apply at industries. Some of these options are potentially also applicable at the municipal WWTP. The options available for nonylphenol are e.g. coal adsorption, chemical oxidation and nano filtration.
6.2.3 Storm water treatment The DSS handbook does not, to this date, contain any measures specific for storm water treatment. A first measure regarding the storm water would be to confirm the emissions calculated in this study. This could be done by measuring nonylphenol (and derivatives) concentration in storm water samples and also by using more complex, and hopefully more accurate, models. Storm water is in many Swedish cities led straight to the recipient (Ryegård et al. 2007). At some places storm water treatment facilities such as dams have been constructed to even out water flows. Today the aim in new urban areas is often to take care of the storm water locally and sometimes even ecologically, e.g. as in Borås (Homepage of Borås Kommun b). Although end-of-pipe solutions should not be applied to storm water (Source Identification and Emission Controls 2005, p. 19) a potential measure, additional to substitution, is to further investigate how a local storm water treatment facility can be constructed to obtain maximal reduction of priority substances. The issue is discussed to some extent by Kjoholt (2007) who concludes that the most efficient method to reduce nonylphenol concentrations in storm water is by removal of suspended particular matter.
6.2.4 The contaminated sediments The DSS handbook does not, to this date, contain any measures specific for contaminated sediments. In the case of Viskan alternatives for remediation of the sites downstream Borås have been thoroughly investigated in Project Viskan (Homepage of Borås Kommun a). Bank et al. (2004) have made a risk assessment concerning the contaminated sediments downstream Borås. Bank and Elander (2004) did in their report identify four different measures or combination of measures addressing the risks identified in the risk assessment. They are in short: establishment of a protected area due to environmental risk combined with recommendations regarding fish consumption, restriction of activities with effects on the river and monitoring. These basic measures could be combined with dredging and excavation or in-situ capping of one, two or all three sedimentation lakes (Table 10).

45
Costs associated with each of the four measures have been estimated (Bank and Elander (2004) and Elander (2004a; 2004b), Table 10). It is difficult to generalize these costs to be valid for measures to remediate contaminated sediments all over Europe. It can however be concluded that each “extra” remediation step will increase the costs of the measure but also further reduce the risks associated with the contaminated sediments. The net costs do thus depend on how these risks would be valued in monetary terms (Step 5 of the DSS handbook). Table 10: Measures applicable to the contaminated sediments in Viskan (downstream Borås), and estimated costs as identified by Bank and Elander (2004) and Elander (2004a; 2004b).
Option Description Estimated cost (M Sw. krona)
Estimated cost range
1 Establishment of an environmental risk area
Restrictions of activities in the river combined with cost recommendations for eel
0.2 (per year)
2 Dredging of Rydboholmsdammarna
Dredged materials are deposited -locally or on a -specialized facility
20 40
15-26 20-58
3 Capping or dredging of Rydboholmsdammarna and parts of Guttasjön
Capping Dredging with material deposited at -local facility -in Djupasjön -specialized facility
65 95 85 260
55-90 75-115 70-105 115-290
4 Capping or dredging of Rydboholmsdammarna, Guttasjön and Djupasjön
Capping Dredging with material deposited at -local facility -in Djupasjön -specialized facility
103 145 115 425
90-155 112-175 90-135 210-510
6.3 Combination effects
Substitution of nonylphenol derivatives would only apply to nonylphenol. Furthermore, if the substitute is a substance with properties similar to nonylphenol, e.g. octylphenol, it is possible that no net positive effects will be achieved. Storm water treatment aiming at removal of suspended particulate matter would be efficient for reduction in concentration of also other contaminants with affinity for solids although the efficiency would depend on the treatment facility. Remediation of the contaminated sediments downstream Borås would remove numerous contaminants of which several are WFD priority substances.

46
6.4 Evaluation of the DSS, Step 4
Many of the measures to remediate contamination of the priority substances selected in SOCOPSE will be applicable also to other foreign substances found to cause negative effects in the environment. To improve the usefulness of the SOCOPSE measures database it could thus be categorized after substance type, e.g. Coal adsorption - “applicable to non-polar organic substances” or Separation zones for pesticide use - “applicable to substances used in spray pesticide formulations”. This categorization could also lead to an improvement of the measures database as new substance-measure combinations could be found. For example WWTP optimization and sludge treatment options, such as listed in the DSS handbook for the substance DEHP, are measures that possibly could be listed also for nonylphenol. Furthermore the DSS handbook could be more comprehensive with regards to measures for diffuse sources of the priority substances as these kinds of emissions are most probably becoming more and more important in the whole of EU. Useful additions could be suggestion of measures relevant for storm water treatment and also a section on contaminated land and sediments. In Sweden a lot of the work with the programs of measures will be about the inventory and assessment of the efficiency of already existing measures on national, regional and municipal level and the difficulty is then to find an efficient way to assemble all this information. The DSS could include a section on inventory of measures already taken.

47
7 Discussion and conclusions
7.1 Nonylphenol in River Viskan
Nonylphenol is emitted to the recipient via what seems to be three major sources; the contaminated sediments downstream Borås, storm water and wastewater. The section of the river just downstream Borås should thus be the part of the river under the highest pressure with regards to nonylphenol due to the fact that the largest impervious surfaces, largest WWTP and the contaminated sediments are located there. That concentrations of the substance in water, sediment or biota in this area exerts negative effects on humans or other organisms is possible even though a proper assessment of the risk is difficult to make with current knowledge about nonylphenol levels in the river. The current situation could potentially lead to long term negative effects in the aquatic environment. With results from this study it could be concluded that possible measures to assess the chemical status of River Viskan with regards to nonylphenol and to remediate elevated nonylphenol levels are:
⋅ Additional monitoring of water and possibly also other matrices ⋅ Further investigations of the section of Häggån that flows by Kinna, e.g. sampling and analysis
of the sediments ⋅ Remediation of the contaminated sediments downstream Borås ⋅ Investigations on nonylphenol and nonylphenol derivative concentration in storm water
within the system ⋅ Studies on cleaning efficiency of storm water facilities with regards to nonylphenol ⋅ Substitution of nonylphenol containing products at industries and/or at community level ⋅ End-of-pipe solutions, e.g. coal adsorption or nanofiltration, at industries with nonylphenol
emissions to water
7.2 Evaluation of the DSS
The results from Step 1-3 elucidated the pollution situation in River Viskan with regards to nonylphenol. There are however still many questions that remain unanswered. Step 1, the problem definition, has a rather intuitive structure. The use of the DSS handbook could possibly provide a good base for a common approach in all river basins within a certain region, country or transboundary river basin. Step 2, the inventory of measures, introduces the concept of SFA, which is a good way to evaluate all possible sources of a substance. In the case of nonylphenol emissions to River Viskan, the use of SFA resulted in comparable emission estimates from different sources. The emission estimates indicated that WWTP effluents, storm water and contaminated sediments are the three major sources of the substance (storm water and sediment emissions must be seen as potential sources as these emission estimates were not based on monitoring data from the river basin). Step 3, definition of a baseline scenario, is crucial since it is here the actual need of action is assessed. The use of environmental fate models complemented the scarce monitoring data in River Viskan and it could be concluded that even at the site with the potentially largest emissions of nonylphenol (downstream Borås), a large part of the emissions seem to be transported further downstream.

48
Step 4 provided an inventory of possible measures. Since the majority of the measures listed for nonylphenol were for point sources and none of the major sources of nonylphenol in the Viskan system was an industrial point source the SOCOPSE fact sheets could not be used to their full extent. Step 5-6 were not executed in this study. As SOCOPSE only includes a limited selection of WFD priority substances and also because the list of these substances will expand continuously, the main use of the DSS handbook cannot be as a provider of data, since it will not be possible to compile fact sheets of all these substances nor to keep these fact sheets sufficiently updated. The DSS handbook should rather function as a toolbox compiled specifically for the work with the WFD priority substances. The SFAs and fact sheets would then provide good examples on how to compile and assess relevant information. The DSS handbook might not always be followed through all the steps. The web-based version of this handbook would in these cases provide more easily accessible information as one can follow links to only the sections relevant in each specific case. One example is the pressures and impact analysis obligatory in a river basin (WFD Article 5), which could possibly be made with the help of Step 2 in the DSS handbook. The need of a clear referencing system becomes obvious in the light of the continuously changing legislative system, industrial sector and economy. Numbers and values relevant at one time-point may be completely irrelevant only months later. With a clearly referenced set of data it will be easy for the water manager using the material to see where he or she needs to look for updates. The pollution situation, legislation, administrative systems, data accessibility and implementation strategy for the WFD varies between member states in EU. It might not be possible to create a handbook to be used in all the member states in EU. Instead the DSS handbook could be used as a basic structure as nation specific guidelines and handbooks are developed, e.g. where Swedish environmental aspects, legislation and other prerequisite are considered specifically.
7.3 The Swedish perspective
The DSS handbook is designed for the situation where one single authority is responsible for the whole procedure, from problem definition to choice of measures. Since the implementation of the WFD the Swedish water administration is divided in to five large regions with one Water District Authority in each region. These authorities are responsible for the development and implementation of the programs of measures. The municipalities in Sweden are on the other hand responsible for the spatial planning, i.e. planning regarding land and water use, and also in some cases to execute the measures suggested in the programs of measures. It is thus the Water District Authorities that do the comprehensive water planning but, e.g. the municipalities that will plan measures in more detail and choose between alternatives. The DSS handbook will probably not be useful in all its steps in any of these instances. This does not mean that the handbook cannot be used, but that selected parts of the handbook can be used in different situations. To go through the complete DSS handbook for each priority substance that is emitted to the system is a time consuming procedure that in Sweden, with a plenitude of water objects and relatively few problem sites with regards to WFD priority substances, might seem superfluous. A screening procedure might thus become necessary before the water system is assessed using the DSS handbook. An example of such a screening procedure is described in Bremle (2006). When the DSS handbook is finally used in practice it is preferentially applied on a whole drainage basin and not separately on individual water bodies. In certain parts, e.g. modelling exercises, the division in to smaller water bodies can be useful.

49
8 References
Literature: Ahel M, Svully F, Hoigné J and Giger W (1994) Photochemical Degradation of Nonylphenol and Nonylphenol Polyethoxylates in Natural Waters, Chemosphere 28(7):1361-1368 Arnér M and Nilsson Ö (2002) Dokumentation av Sedimentundersökningar i Djupasjön, Guttasjön, övre och nedre Rydboholmsdammen, Delrapport 1, J&W Energi och Miljö on commission from the Västra Götaland County Administration Board; availabe at: http://www.o.lst.se/NR/rdonlyres/F251369F-6FA5-4CEF-BE55-19A8CCC40813/5366/Delrapport1.pdf 2008-10-10 Bank A (2004 a) Kompletterande Miljötekniska Undersökningar i Viskan Nedströms Borås, Viskan 2003:6 Golder Associates AB on commission from the Västra Götaland County Administration Board; availabe at: http://www.o.lst.se/NR/rdonlyres/F251369F-6FA5-4CEF-BE55-19A8CCC40813/5344/VISKAN2003_6.pdf 2008-10-16 Bank A (2004 b) Beräkning av föroreningsmängder i Viskans bottensediment nedströms Borås, Viskan 2003:11 Golder Associates AB on commission from the Västra Götaland County Administration Board; availabe at: http://www.lansstyrelsen.se/NR/rdonlyres/F251369F-6FA5-4CEF-BE55-19A8CCC40813/5348/VISKAN2003_11.pdf 2009-02-06 Bank A and Elander P (2004) Projektrapport 1: Riskbedömning med åtgärdsalternativ inklusive kostnadsuppskattningar, Viskan 2003:13 Golder Associates AB and Envipro Miljöteknnik AB on commission from the Västra Götaland County Administration Board; availabe at: http://www.lansstyrelsen.se/NR/rdonlyres/F251369F-6FA5-4CEF-BE55-19A8CCC40813/5350/VISKAN2003_13.pdf 2009-03-20 Bank A, Paulsson M and Öberg-Högsta AL (2004) Fördjupad Miljö och Hälsoriskbedömning av Föroreningar i Viskan Nedströms Borås, Viskan 2003:7 Golder Associates AB on commission from the Västra Götaland County Administration Board; availabe at: http://www.lansstyrelsen.se/NR/rdonlyres/F251369F-6FA5-4CEF-BE55-19A8CCC40813/5345/VISKAN2003_7.pdf 2008-12-27 Björklund K, Malmqvist PA and Strömvall AM (2007) Källor till och flöden av ftalater och nonylfenoler i Stockholms dagvatten, Nya gifter nya verktyg ISSN 1653-9168, available at: http://www.stockholm.se/KlimatMiljo/Kemikalier-och-miljogifter/Nya-gifter---nya-verktyg/ 2008-10-23 Björklund K, Palm Cousins A, Strömvall AM and Malmqvist, PA (2009). Phthalates and nonylphenols in urban runoff: Occurrence, distribution and area emission factors. Science of the Total Environment, 407(16): 4665-4672 Bremle G (2006) Förslag till hur man kan Hantera Prioriterade Ämnen inom Vattendirektivsarbetet, meddelande nr 2006:7, Länsstyrelsen i Jönköpings Län; available at: http://www.f.lst.se/NR/rdonlyres/800843C5-3313-4DF7-AFFC-D41CDF989385/0/2006_7.pdf 2008-11-24 Brunner PH and Rechberger H (2004) Practical Handbook of Material Flow Analysis. Florida: CRC Press Chang BV, Yu, CH and Yuan SY (2004) Degradation of Nonylphenol by Anaerobic Microorganisms from River Sediment, Chemosphere 55:493–500 Corvini PFX, Schäffer A and Schlosser D (2006) Microbial degradation of nonylphenol and other alkylphenols – our evolving view, Appl Microbiol Biotechnol 72:223-243
50
De Beer K (2008) Metod beskrivning påverkansanalys miljögifter ytvatten, Västra Götalands län och Värmlands län. Miljöanalysenheten Länsstyrelsen Värmland län. Di Toro D, Zarba CS, Hansen DJ, Berry WJ, Swartz RC, Cowan CE, Pavlou SP, Allen HE, Thomas NA and Paquin PR (1991) Technical Basis for Establishing Sediment Quality Criteria for Nonionic Organic Chemicals Using Equilibrium Partitioning, Environmental Toxicology and chemistry, 10:1541-1583 DSS handbook. SOCOPSE Decision Support System Draft 0.8 – applicable for use in the cases. 16 May 2008. Baartmans R, van Tongeren W, van der Vlies J, Ullrich S, Mattila T, Palm Cousins A, Belhaj M, Munthe J, Pacyna J and Sundseth K; available at www.socopse.eu Ekelund R, Granmo Å, Magnusson K and Berggren M (1993) Biodegradation of 4-nonylphenol in seawater and sediment. Environmental Pollution 79:59-61 Elander P (2004 a) Efterbehandlingsmetoder för förorenade sediment, Viskan 2003:3, Envipro Miljöteknnik AB on commission from the Västra Götaland County Administration Board; availabe at: http://www.lansstyrelsen.se/NR/rdonlyres/F251369F-6FA5-4CEF-BE55-19A8CCC40813/5341/VISKAN2003_3.pdf 2009-03-20 Elander P (2004 b) Föroreningar i Viskan nedströms Borås, Åtgärdsutredning, Viskan 2003:9, Envipro Miljöteknnik AB on commission from the Västra Götaland County Administration Board; availabe at: http://www.lansstyrelsen.se/NR/rdonlyres/F251369F-6FA5-4CEF-BE55-19A8CCC40813/5346/VISKAN2003_9.pdf 2009-03-20 EU Risk Assessment (2002), EU Risk Assessment Report, 4-Nonylphenol (Branched) and Nonylphenol (2002) European Commission, Institute for Health and Consumer Protection, European Chemicals Bureau; available at: http://ecb.jrc.it/DOCUMENTS/Existing-Chemicals/RISK_ASSESSMENT/REPORT/4-nonylphenol_nonylphenolreport017.pdf 2008-09-19 Fanger G and Elert M (2002) Förutsättningar för Spridning av Föroreningar från Sediment i Viskan samt Preliminär Bedömning av Miljö och Hälsorisker, Kemakta 2001-18, Kemakta Konsult on commission from the Västra Götaland County Administration Board; available at: http://www.o.lst.se/NR/rdonlyres/F251369F-6FA5-4CEF-BE55-19A8CCC40813/5367/Delrapport2.pdf 2008-10-10 Feenstra L, Brignon JM, Genty A, van Tongeren, Lindeboom R, Oesterholt FIHM, Vlaardingerboek A, Krupanek J, Zielonka U and Ullrich S (2008) An Inventory and Assessment of Options for Reducing Emissions: Nonylphenols Draft 2, Work Package 3 – D3.1, SOCOPSE Project; available at: www.socopse.eu 2009-07-23 (search path: Download documents, substance reports) Forchhammer K, Banks A and Sultan D (2000) Översiktliga Undersökningar av Sediment i Viskans Avrinningsområde, Golder Grundteknik KB on commission from the Västra Götaland County Administration Board ; available at: http://www.o.lst.se/NR/rdonlyres/F251369F-6FA5-4CEF-BE55-19A8CCC40813/5364/Viskan_Huvudrapport2000.pdf 10-10-2008 2009-07-23 Fransson M (2008) Metod beskrivning påverkansanalys miljögifter ytvatten inom Södra Östersjön och Norra Östersjöns distrikt. Naturavdelningen Länsstyrelsen Jönköpings län. Guidance document no. 3 Analysis of Pressures and Impacts (2003) Common Implementation Strategy for the Water Framework Directive 2000/60/EC; available at: http://circa.europa.eu/Public/irc/env/wfd/library?l=/framework_directive/guidance_documents/guidancesnos3spressuress/_EN_1.0_&a=d 2008-09-19 Huang GL, Hiu AG, Wang L and HW Sun (2007) Distribution and fate of nonylphenol in an aquatic microcosm. Water Research 41:4630-4638

51
Håkansson L (2006) Suspended Particulate Matter in Lakes, Rivers and Marine Systems; New Jersey: The Blackburn Press Hök F (2007) Rapport: Handdukar med Smutsigt Förflutet, Swedish Society of Nature Conservation (SSNC or SNF in Swedish); available at the homepage of SSNC: http://www.naturskyddsforeningen.se/upload/Foreningsdokument/Rapporter/rapport_handlamiljovanligt_handdukarmedettsmutsigtforflutet.pdf 2008-09-22 Kjøholt J, Vigsø D, Arnbjerg K, Hansen E, Winther Ringgaard K and Engbo Rasmussen P (2007) Possible Control of EU Priority Substances in Danish Waters Technical and economic onsequences examined by three scenarios. Environmental Project No. 1182 2007 Miljøprojekt. Danish Ministry of the Environment. Environmental Protection Agency; available at: http://www2.mst.dk/Udgiv/publications/2007/978-87-7052-566-4/pdf/978-87-7052-567-1.pdf 2009-05-19 Lalah JO, Schramm KW, Henkelmann B, Lenoir D, Behechti A, Günther K and Kettrup A (2003) The Dissipation, Distribution and Fate of a Branched 14C-Nonylphenol Isomer in Lake Water/Sediment Systems, Environmental Pollution 122:195-203 Larm T (2000) Watershed-based design of stormwater treatment facilities: model development and applications, Doctoral Thesis, Division of Water Resources Engineering, Department of Civil and Environmental Engineering, Royal Institute of Technology, Stockholm Larm T and Holmgren A (1999) Stormwater-GIS, a GIS Planning Tool for Stormwater Best Management Practices, Vatten 55:291-297 Lepper P (2005) Manual on the Methodological Framework to Derive Environmental Quality Standards for Priority Substances in accordance with Article 16 of the Water Framework Directive (2000/60/EC), Fraunhofer-Institute Molecular Biology and Applied Ecology Schmallenberg, Germany Liber K, Knuth ML, and Stay, FS (1999) An integrated evaluation of the persistence and effects of 4-nonylphenol in an experimental littoral ecosystem, Environmental Toxicology and Chemistry 18(3):357-362 Lindström P, rapportansvarig (2006) Miljögifter i ytvatten - en studie av förekomsten av vattendirektivsämnen och andra miljögifter i västsvenska ytvatten. Rapport 2006:68. Länsstyrelsen Västra Götalands län; available at: http://www3.ivl.se/miljo/projekt/dvss/pdf/vasterhavet.pdf 2009-05-24 Lu J, Jin Q, Yiliang H, Wu J, Zhang W and Zhao J (2008) Anaerobic Degradation Behavior of Nonylphenol Polyethoxylates in Sludge, Chemosphere 71:345–351 Mackay D (2001) Multimedia Environmental Models, the Fugacity Approach. Michigan: Lewis Publishers Inc. Miljörapport Gässlösa avloppsreningsverk (2007), Borås kommun; available at: www.boras.se 2009-07-23 (search path: Gatukontoret, Vatten och avlopp, Miljö) Månsson N, Sörme L, Wahlberg C and Bergbäck B (2008) Sources of Alkylphenols and Alkylphenol Ethoxylates in Wastewater – A Substance Flow Analysis in Stockholm Sweden. Water Air Soil Pollut: Focus 8(5-6): 445-456 Nilsson (2004) Sedimenttransport i Viskan Sträckan Borås-Rydboholm, VISKAN 2002:1, AB Hydroconsult on commission from the Västra Götaland County Administration Board; available at: http://www.o.lst.se/NR/rdonlyres/F251369F-6FA5-4CEF-BE55-19A8CCC40813/5333/VISKAN2002_1.pdf 2008-10-10 Olofsson H, projektledare (2008) Samordnad recepientkontroll i Viskan 2007, Viskans Vattenråd; available at http://www.viskan.nu/files/Viskans%20arsrapport%202007.pdf 2008-08-25
52
Oscarsson H, red. (2008) Översikt av väsentliga frågor för förvaltningsplan i Västerhavets förvaltningsdistrikt 2008-2009; available at: http://www.vattenmyndigheterna.se/NR/rdonlyres/2F69D115-1869-4526-AACF-CB94D328E1D5/0/vasentliga_fragor_webb.pdf 2008-12-29 Pacyna J (2007) Material Flow Analysis for Selected Priority Substances (draft) Work package 2-D2.1 of the SOCOPSE project; available at: www.socpse.eu 2009-07-23 (search path: Download documents, deliverable 2.1) PM Fiskstudier i Viskan (2003) Länsstyrelsen i Västra Götalands län. Available at: http://www.lansstyrelsen.se/NR/rdonlyres/F251369F-6FA5-4CEF-BE55-19A8CCC40813/5340/VISKAN2003_2.pdf 2009-05-22 Remberger M, Kaj L, Lilja K, Brorström Lundén E, Allard A and Andersson H (2009) National Screening report. In press. Rosqvist L (2004) Screening av Fenoler i Skånes Miljö, Utvärdering av Provtagning 2003 i Reningsverk, Sjöar och Hav, Länsstyrelsen Skåne Län; available at: http://www.m.lst.se/NR/rdonlyres/D663C8F4-232F-49EA-A1A4-7F4AA4C48D0C/74421/R4212020Screening20av20fenoler20i20Sk%C3%A5nes20milj%C3%B6.pdf 2008-11-04 Ryegård A, Olshammar M, Malander M and Roslund M (2007) Förbättring av dagvattenberäkningar, SMED Rapport nr 8, on commission from the Swedish EPA, available at: http://www.smed.se/frames/subframes/vatten/rapporter/pdf/SMED_Rapport_2007_dagvatten.pdf 2008-10-30 Screening Report 2007:1, Nationwide screening of WFD priority substances (2007), SWECO VIAK on commission from the Swedish EPA; available at: http://www.naturvardsverket.se/upload/02_tillstandet_i_miljon/Miljoovervakning/rapporter/miljogift/rapport_vattendirektivsamnen.pdf 2008-09-03 SDS, Environmental Quality Standards (EQS) Substance Data Sheet, Priority Substance No. 24 Nonylphenol (branched) and Nonylphenol; available at: http://circa.europa.eu/Public/irc/env/wfd/library?l=/framework_directive/i-priority_substances/supporting_background/substance_sheets/eqsdatasheet_310705pdf_2/_EN_1.0_&a=d 2008-09-19 Source Identification and Emission Controls, Informal Background Document Related to the Comission Documents on Priority Substances (2005); available at: http://circa.europa.eu/Public/irc/env/wfd/library?l=/framework_directive/i-priority_substances/supporting_background/concept_controlspdf/_EN_1.0_&a=d 2008-12-28 Staples CA, Naylor CG, Williams JB and Gledhill WE (2001) Ultimate biodegradation of alkylphenol ethoxylate surfactants and their biodegradation intermediates. Environmental Toxicology and Chemistry 20(11):2450-2455 Tanghe T, Devriese G and Verstraete W (1998) Nonylphenol Degradation in Lab Scale Activated Sludge Units is Temperature Dependent, Wat. Res. 32 (10):2889-2896 Technical Guidance Document (TGD) on Risk Assessment (2003), in support of Commission Directive 93/67/EEC on Risk Assessment for new notified substances, Part II; available at the homepage of ECB: http://ecb.jrc.ec.europa.eu/documents/TECHNICAL_GUIDANCE_DOCUMENT/EDITION_2/tgdpart2_2ed.pdf 2008-09-29
53
Tornevall H, red. (2008) Vattenförvaltningen 2007; available at: http://www.vattenmyndigheterna.se/NR/rdonlyres/F5B2836F-2870-45AB-B182-E039C1E744C3/0/arsrapport_2007_slutversion.pdf 2008-12-29 Von Post H (2003) Undersökning av Förorenade Sediment i Viskan, Borås, VISKAN 2002:3, MiljöManagement Svenska AB on commission from the Västra Götaland County Administration Board; available at: http://www.o.lst.se/NR/rdonlyres/F251369F-6FA5-4CEF-BE55-19A8CCC40813/5335/VISKAN2002_3_Del1.pdf 10-10-2008 2009-07-23 Yuan SY, Yu CH and Chang BV (2004) Biodegradation of Nonylphenol in River Sediment, Environmental Pollution 127:425-430 Legislative documents: Annex 1 of Directive 67/548/EEC on classification and labeling of dangerous substances http://ecb.jrc.ec.europa.eu/classification-labelling/search-classlab/ 2008-09-22 a) Nonylphenol, search term CAS nr 25154-52-3; 84852-15-3 Directive 2008/105/EC of the European Parliament and of the Council of 16 December 2008 on environmental quality standards in the field of water policy, amending and subsequently repealing Council Directives 82/176/EEC, 83/513/EEC, 84/156/EEC, 84/491/EEC, 86/280/EEC and amending Directive 2000/60/EC of the European Parliament and of the Council; available at EUR-LEX http://eur-lex.europa.eu/ 2009-05-19 Directive 2003/53/EC amending for the 26th time Council Directive 76/769/EEC relating to restrictions on the marketing and use of certain dangerous substances and preparations (nonylphenol, nonylphenol ethoxylate and cement) available at EUR-LEX http://eur-lex.europa.eu/LexUriServ/LexUriServ.do?uri=OJ:L:2003:178:0024:0027:EN:PDF 2008-09-22 Förordning om Förvaltning av Kvaliteten på Vattenmiljön, SFS 2004:660, available at: http://www.vattenonylphenolortalen.se/docs/2004_660.pdf 2008-09-19 Förordning med Länsstyrelseinstruktion, SFS 202:864, available at: http://www.riksdagen.se/webbnav/index.aspx?nid=3911&bet=2002:864 2008-09-19 Regulation No 648/2004 on detergents, available at: http://eur-lex.europa.eu/LexUriServ/LexUriServ.do?uri=OJ:L:2004:104:0001:0035:EN:PDF 2008-10-29 Water Framework Directive WFD, 2000/60/EC; available at EUR-LEX http://eur-lex.europa.eu/ 2008-09-19

54
Internet sources: Homepage of Borås Kommun
a) Projekt Viskan, http://www.boras.se/miljokontoret/fororenadeomraden/projektviskan.4.633e5e10039748abd7fff78836.html 2008-10-09 b) Dagvatten (storm water) http://www.boras.se/gatukontoret/vattenochavlopp/avlopp/dagvatten.4.59ac75d1100153061a800011342.html 2008-12-28 c) Dricksvatten (drinking water) http://www.boras.se/gatukontoret/vattenochavlopp/dricksvatten.4.633e5e10039748abd7fff36013.html 2008-12-29 d) Avlopp (wastewater), miljörapporter http://www.boras.se/gatukontoret/vattenochavlopp/avlopp/miljo.4.633e5e10039748abd7fff36873.html 2009-09-13
Homepage of CIRCA http://circa.europa.eu/Public/irc/env/wfd/library
a) Nonylphenol source screening sheet; search way: Public library, Priority substances library, Supporting background documents, Substance source screening sheets 2008-10-22 b) Nonylphenol data sheet; search way: Public library, Priority substances library, Supporting background documents, Substance EQS data sheets 2009-05-22
Homepage of CEMC, the Centre for Environmental Modelling and Chemistry http://www.trentu.ca/academic/aminss/envmodel/ 2008-12-29 Homepage of IVL, Datavärdskap luft, http://www.ivl.se/hogermeny/miljodatadatavardskap/datavardskapluft.4.360a0d56117c51a2d30800064417.html (search path: PM10, Station Råö) 2008-10-10 Homepage of JRC, Joint Research Center; European chemicals Substances Information System ESIS http://ecb.jrc.ec.europa.eu/esis/ (search way: CAS nr 25154-52-3 and 84852-15-3) 2008-11-10 Homepage of KEMI, Swedish Chemicals Agency
Information on substances: a) Nonylphenol (rev. 2007) http://apps.kemi.se/flodessok/floden/kemamne_eng/nonylfenol_eng.htm 2008-09-22 b) Nonylphenolethoxylates (rev. 2007) http://apps.kemi.se/flodessok/floden/kemamne/nonylfenoletoxilater.htm 2008-09-12 Statistics from the products register: c) http://apps.kemi.se/kemistat/start.aspx search path: CAS nr 127087-87-0, 26027-38-3, 37205-87-1, 68412-54-4 and 9016-45-9; 2009-04-03
Homepage of Marks Kommun, Dricksvatten, http://www.mark.se/sv/Invanare/Bygga-och-bo/vatten/Dricksvatten/ 2008-12-29

55
Homepage of SCB, Statistics Sweden a) (2005) Land och vattenareal, landareal uppdelad på åker, bete och skog samt vattenflöden
1995, 2000 och 2005; http://www.scb.se/statistik/MI/MI0206/2005A02A/Tab1%201995_2000_2005.xls 2008-08-25
b) (2005) Befolkning fördelad efter tätort respektive utanför tätort samt för befolkning
folkbokförd på lantbruksfastighet eller småhus, typ av avloppsystem 1995, 2000 och 2005; http://www.scb.se/statistik/MI/MI0206/2005A02b/tab2%201995_2000_2005rev080404.xls 2008-08-25
c) (2005) Tätorternas landareal, folkmängd och invånare 2000 och 2005
http://www.scb.se/templates/Product____12991.asp 2008-12-12
Homepage of SOCOPSE, substance report on Nonylphenol and the DSS handbook (DRAFT 0.8), www.socopse.eu (search path: Download documents) 2008-09-01 Homepage of SRC, Syracuse Research Corporation, PhysProp Database http://www.syrres.com/esc/physdemo.htm (search way CAS nr: 84852-15-3 and 25154-52-3) 2008-10-21 Homepage of Vattenportalen www.vattenportalen.se 2009-05-22. Beskrivning, kartläggning och analys av Sveriges vatten – sammanfattande rapport. Rapportering 22 mars 2005 enligt EU:s ramdirektiv för vatten (2000/60/EG) YTVATTEN NATURVÅRDSVERKET Dnr: 721-3909-04. Personal Communications Fransson A, Gatukontoret Borås Stad. Wastewater treatment in Borås municipality. Håkansson L, Department of Earth Sciences, Program for Air-, Water and Landscape Sciences. Uppsala Universitet. Seasonal variation in fluxes of suspended particulate matter. Magnusson A, Gatukontoret Borås Stad. Concentration of nonylphenol and nonylphenol ethoxylates in water and sludge in WWTPs in Borås municipality. Mellström G, Marks kommun. Water flows from Skene WWTP. Svensson M, Gatukontoret Borås Stad. Storm water treatment in Borås municipality.
56
Annex 1 Table 11: Registered use of nonylphenol (CAS nr: 104-40-5, 11066-49-2, 25154-52-3, 84852-15-3, 90481-04-2) and nonylphenol ethoxylates (CAS nr: 127087-87-0, 26027-38-3, 37205-87-1, 68412-54-4, 9016-45-9) in the Swedish Products Register in the year 2006. The register contains information of the manufacture, import, export and name changes of chemical products in quantities > 100 kg. Exported quantities and change of name of a product is not included in this list. (Products Register 2008-09-16) Category Nonylphenol
(ton/year) Nonylphenol ethoxylates (ton/year)
Additives for paints and varnishes .. Anti condesation agents .. Anti-clotting agents .. Binding agents .. 8.72 Biocides (antifouling) .. 0.31 Car care products and boat care products 0.28
Chemicals for photographic use .. Cleaning products 3.34
Coating agents .. Colouring agents .. 3.8a
Construction materials (building materials)
..
Contactors (electrical) .. Cooling agents for metal processing 1.3
Cracking indicators .. Curing agents 3.62 1.29 Dental products .. Dressing agents (glazing agents, polishing agents)
0
Dust laying agents 0.25 Explosives etc. .. Extraction agents .. Fillers (for paints, textiles, plastic etc.) ..
Filling agents 3.09 1.07 Fixing agents .. Flame retardants .. .. Flooring materials 0.44 0.14 Fuel additives .. Galvano-technical agents 0.59 Glossing agents .. Glues 0.46 1 Hydraulic fluids .. Impregnation/proofing .. Insulating materials .. Laboratory chemicals 0.69 Lubricating agents .. 1.84a
Metal surface remedies 0.76a
Moulding compounds .. .. Odour agents .. Paint and varnish removers 0.19 Paints and varnishes 2.6 11.41

57
Category Nonylphenol (ton/year)
Nonylphenol ethoxylates (ton/year)
Plant protection products 1.5 Polishing agents 1.58 Precipitants .. Printing ink .. 0.04 Processregulators (synthesis regulators) .. 0.09
Raw materials and intermediate products (rubber, plastics, other)
.. 1.4
Releasing agents 0.35a
Rinsing agents .. Rust inhibitors .. Softners 0.03a
Solvents .. .. Stabilizers .. .. Surface active agents .. 64.68a
Surface treatment for paper, cardboard and other non-metals
.. 0.14
Tanning agents .. Viscosity changers .. 0.46a
.. Indicates that this value has been omitted due to secrecy reasons since less than three companies has reported use in this category a) One or several sub-categories in this category is covered by secrecy, the given quantity is thus an underestimation of the true value.
58
Annex 2 Table 12: Land use classes, as defined in Ryegård et al. (2007), and corresponding areas for the Viskan river basin
Land use Run off coefficient
Area (km2) Fraction of total area (%)
Houses 0.25 15.2 31.9 Park 0.18 10.5 22.0 Row houses 0.32 5.8 12.2 Industry 0.5 5.2 11.0 Forests 0.05 3.9 8.2 Farmland 0.11 3.9 8.1 Pasture 0.075 0.9 1.9 Water 0 0.6 1.3 Apartments 0.45 0.5 1.1 Cutting area 0.2 0.4 0.9 Roads (5 000 ADT) 0.85 0.4 0.8 Leisure houses 0.2 0.1 0.3 Wetland 0.2 0.09 0.2 Golf courses 0.18 0.06 0.1 Airports 0.85 0.04 0.1
Total 47.7 100

59
Annex 3
Figure 17: Map over the modelled area of River Viskan
60
Annex 4
Table 13: Environmental properties of River Viskan (Olsdalsbron – Rydboholm). Data used in the QWASI model. Mean values are arithmetical means. Property Value Range
(min-max) Comment Reference
Lake Properties
Water surface area (m2)
470 000 Measured in Vattenkartan
Homepage of Vattenmyndigheterna
Water Volume (m3)
940 000 Estimated average water depth 2 m
Sediment active layer depth (m)
0.013 0.002-0.023 Estimated from data for the three sedimentation lakes
Fanger and Elert 2002, Tabell 3.1
Concentration of solids
- in water column (mg/l)
2.9 0.2-17 Mean value from four sampling locations. Sampling period 6 months – 1 year.
Nilsson 2004, Tabell 1(Olsdalsbron, Kranshultsbron, Håkanssons väg, Rydboholm)
- in inflow water (mg/l)
2.7 0.4-18 Mean value from one sampling location. Sampling period 6 months.
Nilsson 2004, Tabell 1(Kärrbron)
- of aerosols in air (µg/m3)
13.7 PM10, Råö 2007
Homepage of IVL
- in sediment (m3/m3)
0.09 0.07-0.15 0-80 cm; the average weight-% (19 %) converted to vol-% by multiplication with the quotient of the average bulk density (1.1 ton/m3) with the compact density (default value 2.4 ton/m3)
Von Post 2003, Tabell 2
Density of solids (kg/m3)
- in water 2400 * - in sediment 2400 ** - in aerosols 1500 *

61
Property Value Range
(min-max) Comment Reference
Organic carbon fraction of solids
- in water column 0.30 Based on particulate organic matter of 60 % as a standard value, divided by 2 as described in Mackay 2001
Håkansson 2006
- in sediment 0.17 0.13-0.20 Mean value from samples from 0-10 cm
Forchhammer et al. 2000, Bilaga 4
- in inflow water 0.30 As in water column - in resuspended sediment
0.30 As in water column
Flows
River water inflow (m3/h)
24 000 Bank et al. 2004
Water outflow rate (m3/h)
28 000 Assuming a 15 % increase in water flow
Bank et al. 2004
Sediment (g/m2/day)
- deposition 21.5 Sediment traps in the three lakes. Mean summer sedimentation rates were corrected to be valid for the full year by assuming half the sedimentation rate during seven winter months*.
Fanger and Elert 2002, Tabell 3.3 *Håkansson 2008, personal comm.
- burial 4.3 Mean burial rate calculated from sedimentation rates based on Pb isotope analysis
Fanger and Elert 2002, Tabell 3.3
- resuspension 14.3 Deposition – (burial + organic matter conversion)
See carbon balance below
Transfer coefficients
Aerosol dry deposition velocity (m/h)
7.2 *
Scavenging ratio (air/rain)
200000 **
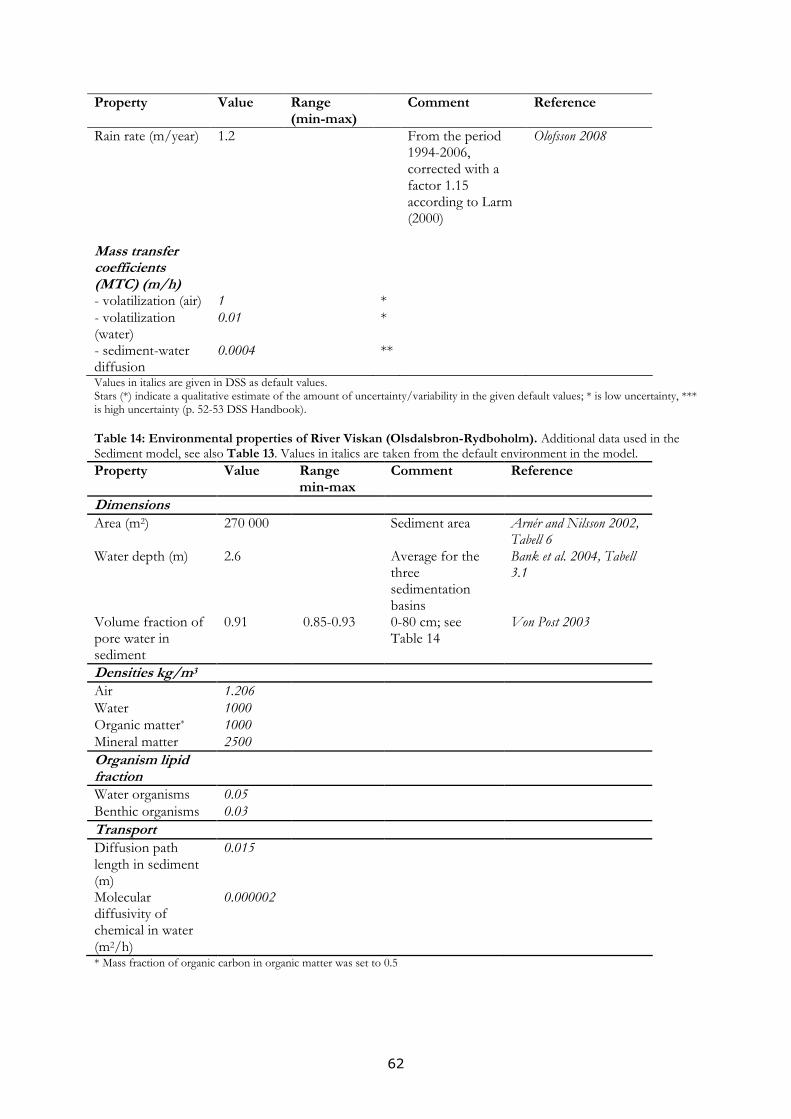
62
Property Value Range (min-max)
Comment Reference
Rain rate (m/year) 1.2 From the period 1994-2006, corrected with a factor 1.15 according to Larm (2000)
Olofsson 2008
Mass transfer coefficients (MTC) (m/h)
- volatilization (air) 1 * - volatilization (water)
0.01 *
- sediment-water diffusion
0.0004 **
Values in italics are given in DSS as default values. Stars (*) indicate a qualitative estimate of the amount of uncertainty/variability in the given default values; * is low uncertainty, *** is high uncertainty (p. 52-53 DSS Handbook). Table 14: Environmental properties of River Viskan (Olsdalsbron-Rydboholm). Additional data used in the Sediment model, see also Table 13. Values in italics are taken from the default environment in the model. Property Value Range
min-max Comment Reference
Dimensions
Area (m2) 270 000 Sediment area
Arnér and Nilsson 2002, Tabell 6
Water depth (m) 2.6 Average for the three sedimentation basins
Bank et al. 2004, Tabell 3.1
Volume fraction of pore water in sediment
0.91 0.85-0.93 0-80 cm; see Table 14
Von Post 2003
Densities kg/m3
Air 1.206 Water 1000 Organic matter* 1000 Mineral matter 2500 Organism lipid fraction
Water organisms 0.05 Benthic organisms 0.03 Transport Diffusion path length in sediment (m)
0.015
Molecular diffusivity of chemical in water (m2/h)
0.000002
* Mass fraction of organic carbon in organic matter was set to 0.5

63
Table 15: Carbon mass balance for River Viskan; section Olsdalsbron-Rydboholm (g/m2/day). The amount of organic matter (OM) was estimated to be twice as much as the amount of organic carbon (OC) (Mackay 2001). The difference in OC content of the deposition (30 %) and the burial solids (17 %) was used as an estimation of OM conversion, thus assuming that all OM was degraded at the same rate. Mineral
matter Organic matter
Total Organic carbon
Deposition 8.6 12.9 21.5 6.5 Resuspension 5.7 8.6 14.3 4.3 OM conversion na 2.9 2.9 1.5 Burial (solids) 2.9 1.4 4.3 0.7
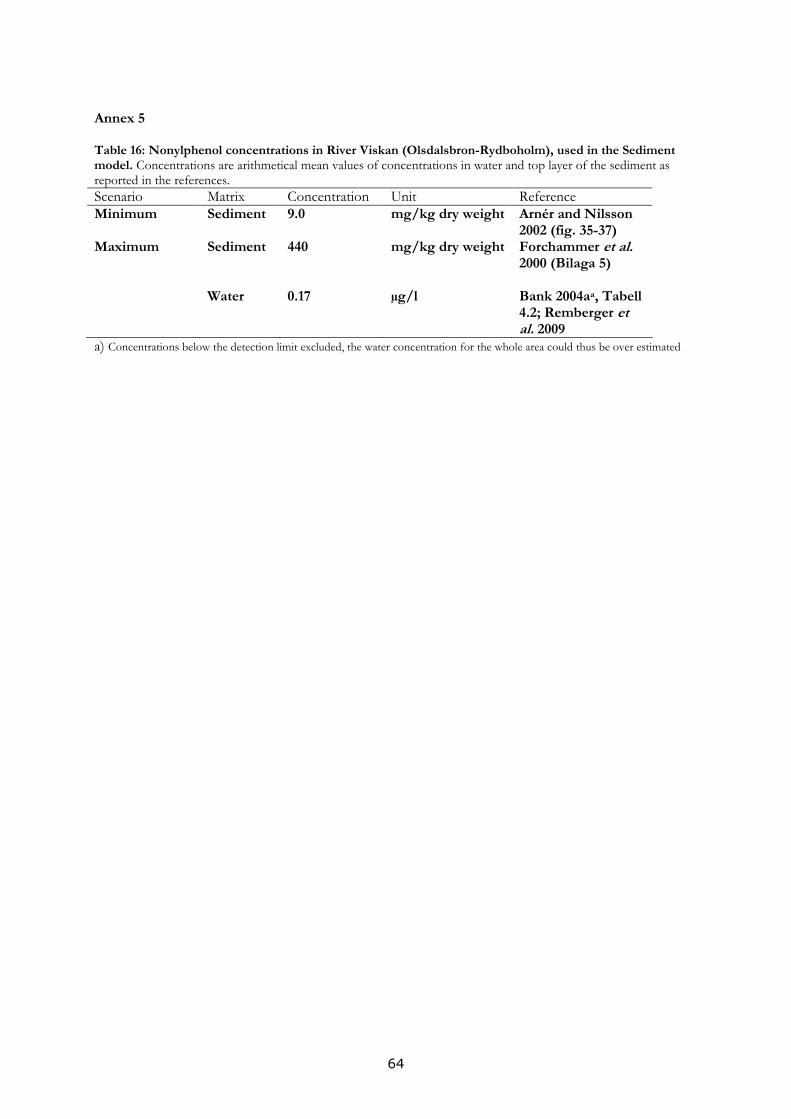
64
Annex 5 Table 16: Nonylphenol concentrations in River Viskan (Olsdalsbron-Rydboholm), used in the Sediment model. Concentrations are arithmetical mean values of concentrations in water and top layer of the sediment as reported in the references. Scenario Matrix Concentration Unit Reference Minimum Sediment 9.0 mg/kg dry weight Arnér and Nilsson
2002 (fig. 35-37) Maximum Sediment 440 mg/kg dry weight Forchammer et al.
2000 (Bilaga 5) Water 0.17 µg/l Bank 2004aa, Tabell
4.2; Remberger et al. 2009
a) Concentrations below the detection limit excluded, the water concentration for the whole area could thus be over estimated