evaluation of the toxicity of test compounds on human ... report sti001 page 1 of 13 study name:...
TRANSCRIPT
S T U D Y # S T I 0 0 1
Evaluation of the Toxicity of Test Compounds on Human Myeloid and Erythroid Progenitors Using Methylcellulose-based In Vitro Colony Assays
CONTRACT SERVICES F I N A L R E P O R T
C O N T R A C T A S S A Y S E R V I C E S B Y

Final Report STI001 Page 1 of 13
Study name: Evaluation of the Toxicity of Test Compounds on Human Myeloid and
Erythroid Progenitors Using Methylcellulose-based In Vitro Colony
Assays
Study Number: STI001
Sponsor: STEMCELL Technologies, 400 – 570 West 7th Ave., Vancouver BC, Canada, V5Z 1B3
Summary: The effects of compounds X, Y and Z on human erythroid and myeloid
progenitor proliferation in MethoCult® 84434 were examined in this study.
Compound Y (IC50 = 5.22 µM) displayed the greatest potency against
erythroid progenitor proliferation followed by Compound X (IC50 = 20.01
µM) and Compound Z (IC50 = 35.51 µM). Compound X (IC50 = 16.45 µM)
displayed the greatest potency against myeloid progenitor proliferation,
followed by Compound Y (IC50 = 26.92 µM) and Compound Z (IC50 =
42.86 µM). Colony morphology (size and/or density) for erythroid and
myeloid progenitors in the presence of test compounds were
compromised where toxicity was observed.
Study Director: Jackie Damen PhD
Testing Laboratory: StemCell Technologies Inc., 570 West Seventh Ave, Suite 400,
Vancouver, BC, Canada V5Z 1B3
Date of Study: July – August 2009

Final Report STI001 Page 2 of 13
Definitions:
CFU-E: Colony-Forming Unit – Erythroid. This is the most mature erythroid colony
forming cell. The small erythroid colony derived from this cell contains one to 2
clusters with a total number of 8-200 erythroblasts.
BFU-E: Burst-Forming Unit – Erythroid. This is a more primitive cell. The larger erythroid
colony derived from this cell contains greater than 200 erythroblasts.
CFU-GM: Colony-Forming Unit – Granulocyte, Macrophage. This colony forming cell is
capable of producing colonies with 40 or more granulocyte–monocyte and/or
macrophage cells.
CFU-GEMM: Colony-Forming Unit – Granulocyte, Erythroid, Macrophage, Megakaryocyte.
This is the most primitive colony forming cell. The colony derived from this cell
contains cells from more than one lineage, including erythroid cells as well as 20
or more granulocytes, macrophages and megakaryocytes.
Cytokines:
Epo Erythropoietin
G-CSF Granulocyte-Colony Stimulating Factor
GM-CSF Granulocyte/Monocyte-Colony Stimulating Factor
IL-3 Interleukin-3
SCF Stem Cell Factor
Purpose:
The aim of the study was to evaluate the potential effects of Compounds X, Y and Z at 6
concentrations on human bone marrow derived erythroid and myeloid progenitor proliferation in
MethoCult® media.
Tests performed:
Human bone marrow derived hematopoietic progenitor cells were incubated with test compounds
in MethoCult® 84434, a methylcellulose-based media containing Epo, G-CSF, GM-CSF, IL-3 and
SCF.

Final Report STI001 Page 3 of 13
Cells:
Normal human bone marrow light density cells (Poietics Lot 07B21195) were stored at -152oC
until required for the assay. On the day of the experiment, the cells were thawed rapidly at 37oC,
the contents of the vial were diluted in 10 ml of Iscove’s modified Dulbecco’s medium containing
2% fetal bovine serum (IMDM + 2% FBS) and washed by centrifugation (1200 r.p.m. for 10
minutes, room temperature). The supernatant was discarded and the cell pellet resuspended in a
known volume of IMDM + 2% FBS. A nucleated cell count (3% glacial acetic acid) and viability
assessment (trypan blue exclusive test) was performed.
Compounds:
STEMCELL Technologies provided 3 compounds (Compound X, Y and Z) as powders. All
compounds were dissolved in DMSO as 50 mM stocks. The 50 mM stocks were diluted in DMSO
to make 1000 fold working stock solutions at 15, 5, 1.5, 0.5, and 0.15 mM. These working stock
solutions were subsequently added to MethoCult® media to provide the appropriate final test
concentrations required: 50, 15, 5, 1.5, 0.5, and 0.15 µM.
Method Summary:
Test compounds were added to MethoCult® 84434 to give final concentrations of 50, 15, 5, 1.5,
0.5, and 0.15 µM. Standard control cultures (containing no compound) and solvent control
cultures (containing no compound but equivalent concentrations of DMSO) were also initiated.
Thawed human bone marrow cells (as described above) were then added to the media
formulation containing compounds. Hematopoietic cultures were set up in triplicate with 1.00 x
104 cells per culture at each compound concentration tested. Following 14 days in culture,
hematopoietic colonies were assessed and scored by trained personnel.
Statistical Analyses of CFC numbers:
The mean colony number (+/- 1 standard deviation) was calculated for triplicate cultures at each
condition. Standard t-tests were performed to compare solvent control to each compound. Due to
the potential subjectivity of colony enumeration, a p value of less than 0.01 is deemed significant.

Final Report STI001 Page 4 of 13
IC50 and IC90 Determination:
To calculate the concentration of 50% and 90% inhibition of colony growth (IC50 and IC90) for
each compound, a dose response curve was generated plotting the log of the compound
concentration versus the percentage of control colony growth using MicrocalTM OriginTM. A
Sigmoidal curve was then fit to the graph and from this curve the inhibitory concentration (µM)
was then calculated using the Boltzman equations:
log(x50) = x0 + dx * LN((A1-A2)/(50-A2)-1)
log(x90) = x0 + dx * LN((A1-A2)/(10-A2)-1)
where A1 = the initial value (baseline response), A2 = final value (maximum response), x0 =
center (drug concentration that provokes a response halfway between A1 and A2) and dx = width
(of the rapidly varying part of the curve) as determined by MicrocalTM OriginTM.
Morphological Assessment of Colonies:
Photographs were taken of representative erythroid and myeloid derived colonies from various
compound concentrations illustrating normal colonies and colonies where the growth was
perturbed due to the activity of the compounds.
Results:
Hematopoietic Progenitor Proliferation
The average colony counts per dish (+/-1 SD) obtained from cells after continuous exposure to
test compounds are presented in Table 1. There were no statistically significant differences
between the solvent control cultures (DMSO) and the standard control cultures (containing no
compound and no DMSO). Statistical analysis was also performed to compare the number of
colonies in compound treated cultures to the solvent control culture.

Final Report STI001 Page 5 of 13
Table 1. Average Colony Counts per Dish For Cultures After Incubation with Test
Compounds in MethoCult® 84434.
CFU-E BFU-E Total
Erythroid CFU-GM
CFU-GEMM
Total CFC
Standard 14+/-3 35+/-6 48+/-6 45+/-3 4+/-2 97+/-8 Solvent Control 13+/-2 36+/-3 49+/-2 49+/-10 4+/-1 102+/-10 Compound X 50 µM ND** ND## ND## ND# ND* ND## 15 µM 7+/-3 23+/-1* 30+/-2** 43+/-8 2+/-1 75+/-7 5 µM 9+/-4 30+/-5 40+/-7 50+/-8 1+/-1 90+/-4 1.5 µM 12+/-3 36+/-8 48+/-11 47+/-1 3+/-2 98+/-9 0.5 µM 14+/-2 35+/-5 49+/-4 46+/-2 3+/-2 98+/-6 0.15 µM 13+/-6 36+/-8 49+/-10 48+/-6 4+/-1 101+/-16 Compound Y 50 µM 1+/-0 * ND## 5+/-6** 14+/-6$ ND* 19+/-8** 15 µM 15+/-2 2+/-2## 17+/-3## 32+/-6 1+/-1 50+/-8* 5 µM 14+/-2 9+/-4# 23+/-5# 41+/-2 1+/-1$ 65+/-6* 1.5 µM 11+/-6 24+/-3$ 35+/-9 45+/-6 1+/-2 81+/-7 0.5 µM 12+/-3 33+/-8 44+/-11 50+/-9 2+/-2 96+/-18 0.15 µM 10+/-1 38+/-3 48+/-2 50+/-10 3+/-1 101+/-9 Compound Z 50 µM 9+/-4 4+/-1## 13+/-4## 20+/-5$ 1+/-1$ 34+/-8# 15 µM 10+/-2 28+/-7 38+/-6 40+/-2 2+/-1 79+/-7 5 µM 12+/-1 28+/-8 40+/-8 51+/-5 4+/-2 95+/-2 1.5 µM 11+/-2 33+/-6 45+/-6 49+/-8 2+/-2 95+/-4 0.5 µM 11+/-4 29+/-5 40+/-8 48+/-7 4+/-2 92+/-5 0.15 µM 13+/-2 30+/-5 44+/-5 50+/-3 4+/-3 97+/-3
ND = none detected $ p < 0.01 compared to solvent control * p < 0.005 compared to solvent control # p < 0.001 compared to sovlent control ** p < 0.0005 compared to solvent control ## p < 0.0001 compared to solvent control

Final Report STI001 Page 6 of 13
Dose Response Curves and IC50 & IC90 Concentrations
Dose response curves plotting percent of control colony growth versus log of compound
concentration are shown in Figures 1-3. IC50 and IC90 values were derived from these curves,
and a summary of the predicted IC50 and IC90 values are contained in Table 2.
Table 2. IC50 and IC90 Values for Test Compounds on Human Erythroid and Myeloid
Progenitor Proliferation in MethoCult® 84434.
Total Erythroid Myeloid
Compound IC50 (µM) IC90 (µM) IC50 (µM) IC90 (µM) X 20.01 43.34 16.45 18.10
Y 5.22 55.08ex 26.92 76.52ex
Z 35.51 59.53ex 42.86 75.34ex ex = extrapolated by the Boltzmann equation

Final Report STI001 Page 7 of 13
Compound X
IC50 and IC90 values for erythroid growth were determined to be 20.01 µM and 43.34 µM,
respectively (Figure 1A). IC50 and IC90 values for myeloid growth were determined to be 16.45 µM
and 18.10 µM, respectively (Figure 1B). The morphology (size and/or density) of erythroid and
myeloid colonies was compromised at the highest test concentration where colonies were
present, 15 µM, and returned to solvent control size at 5 µM (see Photographs 3 - 6 in Appendix).
Figure 1 - Dose Response Curves for the Effect of Compound X on Human (A) Erythroid
and (B) Myeloid Progenitor Proliferation in MethoCult® 84434.
A
B
IC50 = 20.01 µMIC90 = 43.34 µM
IC50 = 16.45 µMIC90 = 18.10 µM
-1.0 -0.5 0.0 0.5 1.0 1.5 2.0
0
20
40
60
80
100Data: Book1_DModel: BoltzmannEquation: y = A2 + (A1-A2)/(1 + exp((x-x0)/dx))Weighting: y No weighting Chi 2/DoF = 8.38831R^2 = 0.9978 A1 102.4291 ±3.6238A2 -821.74476 ±4830.66911x0 2.83799 ±3.66637dx 0.54669 ±0.22995
% Total Erythroid Boltzmann Fit
% C
ontr
ol G
row
th
Compound Concentration (log)
-1.0 -0.5 0.0 0.5 1.0 1.5 2.0
0
20
40
60
80
100
120
Data: Book1_FModel: BoltzmannEquation: y = A2 + (A1-A2)/(1 + exp((x-x0)/dx))Weighting: y No weighting Chi 2/DoF = 18.22157R^2 = 0.99528 A1 97.44898 ±2.13431A2 -4.5123E-10 ±4.25717x0 1.21716 ±--dx 0.01864 ±--
% Myeloid Boltzmann Fit
% C
ontr
ol G
row
th
Compound Concentration (log)

Final Report STI001 Page 8 of 13
Compound Y
IC50 value for erythroid growth was determined to be 5.22 µM; an IC90 value of 55.08 µM was
extrapolated by Boltzmann equation (Figure 2A). IC50 value for myeloid growth was determined to
be 26.92 µM; an IC90 value of 96.52 µM was extrapolated by Boltzmann equation (Figure 2B).
The morphology (size and/or density) of erythroid colonies was compromised at concentrations
between 15 and 1.5 µM and returned to solvent control size at 0.5 µM. Myeloid colonies were
compromised at concentrations between 50 and 5 µM and returned to solvent control size at 1.5
µM (see Photographs 7 - 14 in Appendix).
Figure 2 - Dose Response Curves for the Effect of Compound Y on Human (A) Erythroid
and (B) Myeloid Progenitor Proliferation in MethoCult® 84434. ex – extrapolated by Boltzmann equation
A
B
IC50 = 5.22 µMIC90 = 55.08 µMex
IC50 = 26.92 µMIC90 = 76.52 µMex
-1.0 -0.5 0.0 0.5 1.0 1.5 2.00
20
40
60
80
100 Data: Book1_DModel: BoltzmannEquation: y = A2 + (A1-A2)/(1 + exp((x-x0)/dx))Weighting: y No weighting Chi 2/DoF = 20.03402R^2 = 0.99302 A1 118.11546 ±28.16977A2 -28.1715 ±59.81527x0 0.83744 ±0.50881dx 0.8678 ±0.6015
% Total Erythroid Boltzmann Fit
% C
ontr
ol G
row
th
Compound Concentration (log)
-1.0 -0.5 0.0 0.5 1.0 1.5 2.020
30
40
50
60
70
80
90
100
110
Data: Book1_FModel: BoltzmannEquation: y = A2 + (A1-A2)/(1 + exp((x-x0)/dx))Weighting: y No weighting Chi^2/DoF = 6.28624R^2 = 0.99684 A1 106.05854 ±6.0146A2 -956.62167 ±10545.96575x0 3.69296 ±9.50326dx 0.7836 ±0.46944
% Myeloid Boltzmann Fit
% C
ontr
ol G
row
th
Compound Concentration (log)

Final Report STI001 Page 9 of 13
Compound Z
IC50 value for erythroid growth was determined to be 35.51 µM; an IC90 value of 59.53 µM was
extrapolated by Boltzmann equation (Figure 3A). IC50 value for myeloid growth was determined to
be 42.86 µM; an IC90 value of 75.34 µM was extrapolated by Boltzmann equation (Figure 3B).
The morphology (size and/or density) of erythroid and myeloid colonies incubated was
compromised at 50 and 15 µM and returned to solvent control size at 5 µM (see Photographs 15 -
20 in Appendix).
Figure 3 - Dose Response Curves for the Effect of Compound Z on Human (A) Erythroid
and (B) Myeloid Progenitor Proliferation in MethoCult® 84434. ex – extrapolated by Boltzmann equation
A
B
IC50 = 35.51 µMIC90 = 59.53 µMex
IC50 = 42.86 µMIC90 = 75.34 µMex
-1.0 -0.5 0.0 0.5 1.0 1.5 2.020
30
40
50
60
70
80
90
100
Data: Book1_DModel: BoltzmannEquation: y = A2 + (A1-A2)/(1 + exp((x-x0)/dx))Weighting: y No weighting Chi 2/DoF = 37.4697R^2 = 0.97456 A1 87.02088 ±4.19899A2 -748.9151 ±63587.2892x0 2.42967 ±25.45197dx 0.28628 ±0.78711
% Total Erythroid Boltzmann Fit
% C
ontr
ol G
row
th
Compound Concentration (log)
-1.0 -0.5 0.0 0.5 1.0 1.5 2.0
40
50
60
70
80
90
100
110
Data: Book1_FModel: BoltzmannEquation: y = A2 + (A1-A2)/(1 + exp((x-x0)/dx))Weighting: y No weighting Chi^2/DoF = 37.96535R^2 = 0.97439 A1 101.89027 ±5.05241A2 -517.83399 ±18453.37847x0 2.54145 ±13.99263dx 0.38004 ±0.6712
% Myeloid Boltzmann Fit
% C
ontr
ol G
row
th
Compound Concentration (log)
Final Report STI001 Page 10 of 13
Conclusion:
The effects of compounds X, Y and Z on human erythroid and myeloid progenitor proliferation in
MethoCult® 84434 were examined in this study. Compound Y (IC50 = 5.22 µM) displayed the
greatest potency against erythroid progenitor proliferation followed by Compound X (IC50 = 20.01
µM) and Compound Z (IC50 = 35.51 µM). Compound X (IC50 = 16.45 µM) displayed the greatest
potency against myeloid progenitor proliferation, followed by Compound Y (IC50 = 26.92 µM) and
Compound Z (IC50 = 42.86 µM). Colony morphology (size and/or density) for erythroid and
myeloid progenitors in the presence of test compounds were compromised where toxicity was
observed.
Final Report STI001 Page 11 of 13
Sponsor and Testing Facility: The testing described herein was performed for STEMCELL Technologies by:
StemCell Technologies Inc.
570 West Seventh Ave, Suite 400
Vancouver, BC, Canada V5Z 1B3
Final Report Approved by:
Study Director Date
Report Auditor Date

Final Report STI001 Page 12 of 13
Appendix
Controls
Photograph 1: CFU-GM from solvent control in MethoCult® 84434 (photographed at 30X)
Photograph 2: BFU-E from solvent control in MethoCult® 84434 (photographed at 70X)
Compound X
Photograph 3: Small CFU-GM with compound X at 15 µM in MethoCult® 84434
(photographed at 30X)
Photograph 4: CFU-GM with compound X at 5 µM in MethoCult® 84434 (photographed at 30X)
Photograph 5: Small BFU-E with compound X at 15 µM in MethoCult® 84434
(photographed at 70X)
Photograph 6: BFU-E with compound X at 5 µM in MethoCult® 84434
(photographed at 70X)
Compound Y
Photograph 7: Small CFU-GM with compound Y at 50 µM in MethoCult® 84434
(photographed at 30X)
Photograph 8: Small CFU-GM with compound Y at 15 µM in MethoCult® 84434
(photographed at 30X)
Photograph 9: Small CFU-GM with compound Y at 5 µM in MethoCult® 84434
(photographed at 30X)
Photograph 10: CFU-GM with compound Y at 1.5 µM in MethoCult® 84434
(photographed at 30X)
Photograph 11: Small BFU-E with compound Y at 15 µM in MethoCult® 84434
(photographed at 70X)
Photograph 12: Small BFU-E with compound Y at 5 µM in MethoCult® 84434
(photographed at 70X)
Photograph 13: Small BFU-E with compound Y at 1.5 µM in MethoCult® 84434
(photographed at 70X)
Photograph 14 BFU-E with compound Y at 0.5 µM in MethoCult® 84434
(photographed at 70X)
Compound Z
Photograph 15: Small CFU-GM with compound Z at 50 µM in MethoCult® 84434
(photographed at 30X)
Photograph 16: CFU-GM with compound Z at 15 µM in MethoCult® 84434 (photographed at 30X)
Photograph 17: CFU-GM with compound Z at 5 µM in MethoCult® 84434 (photographed at 30X)

Final Report STI001 Page 13 of 13
Photograph 18: Small BFU-E with compound Z at 50 µM in MethoCult® 84434
(photographed at 70X)
Photograph 19: Small BFU-E with compound Z at 15 µM in MethoCult® 84434
(photographed at 70X)
Photograph 20: BFU-E with compound Z at 5 µM in MethoCult® 84434
(photographed at 70X)

1. CFU-GM from solvent control in
MethoCult® 84434 (30X)
2. BFU-E from solvent control in MethoCult®
84434 (70X)
Appendix
3. Small CFU-GM with compound X at 15 µM in MethoCult® 84434 (30X)
4. CFU-GM with compound X at 5 µM in MethoCult® 84434 (30X)
6. BFU-E with compound X at 5 µM in MethoCult® 84434 (70X)
5. Small BFU-E with compound X at 15 µM in MethoCult® 84434 (70X)

7. Small CFU-GM with compound Y at 50 µM in MethoCult® 84434 (30X)
8. Small CFU-GM with compound Y at 15 µM in MethoCult® 84434 (30X)
9. Small CFU-GM with compound Y at 5 µM in MethoCult® 84434 (30X)
10. CFU-GM with compound Y at 1.5 µM in MethoCult® 84434 (30X)
12. Small BFU-E with compound Y at 5 µM in MethoCult® 84434 (70X)
11. Small BFU-E with compound Y at 15 µM in MethoCult® 84434 (70X)
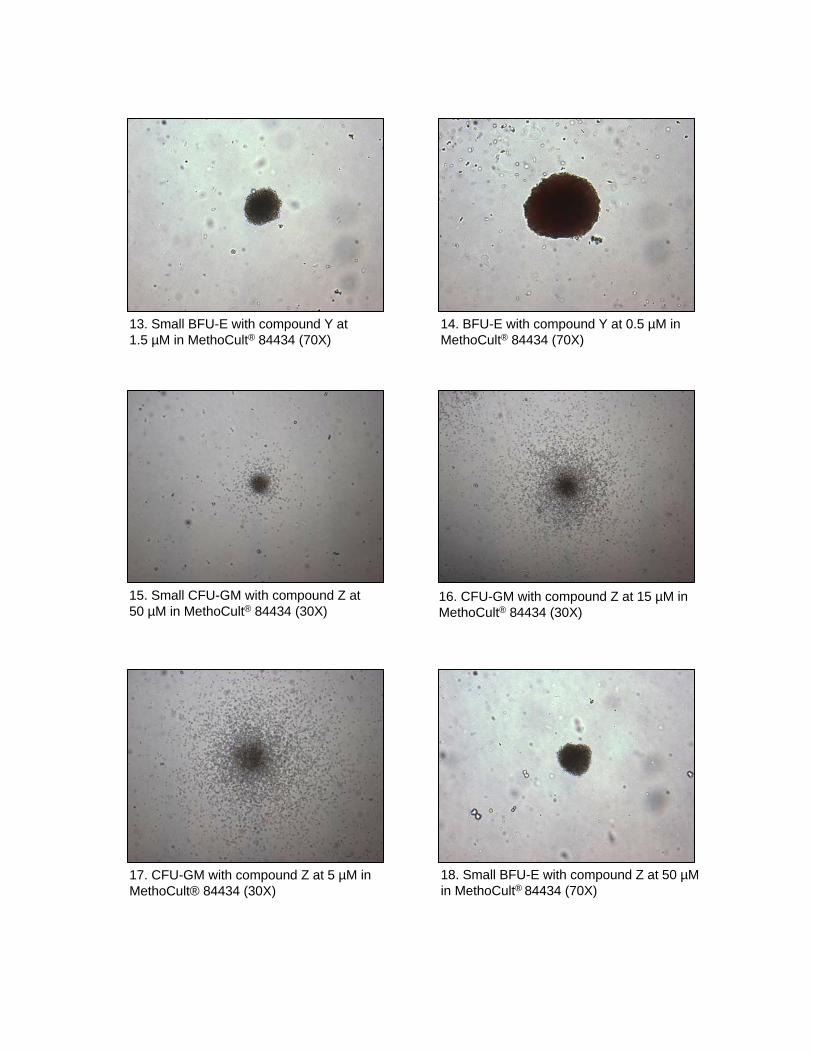
13. Small BFU-E with compound Y at 1.5 µM in MethoCult® 84434 (70X)
14. BFU-E with compound Y at 0.5 µM in MethoCult® 84434 (70X)
15. Small CFU-GM with compound Z at 50 µM in MethoCult® 84434 (30X)
16. CFU-GM with compound Z at 15 µM in MethoCult® 84434 (30X)
17. CFU-GM with compound Z at 5 µM in MethoCult® 84434 (30X)
18. Small BFU-E with compound Z at 50 µM in MethoCult® 84434 (70X)

19. Small BFU-E with compound Z at 15 µM in MethoCult® 84434 (70X)
20. BFU-E with compound Z at 5 µM in MethoCult® 84434 (70X)