evaluation of uprising’s diverse backgrounds…” pathways to ... · uprising is a uk-wide youth...
TRANSCRIPT

“UpRising aims to openpathways to power fortalented young people fromdiverse backgrounds…”
EVALUATION OF UPRISING’SLEADERSHIP PROGRAMME
Ian Wybron
UpRising is a UK-wide youth leadership developmentorganisation, aiming to open pathways to power for talentedyoung people from diverse and under-representedbackgrounds.
This report marks the culmination of a year-longindependent evaluation of UpRising conducted by Demos,which began in summer 2014. The evaluation sought tomeasure the outcomes of UpRising’s flagship nine-monthLeadership Programme. This report focuses on the short-termoutcomes of the programme, measured primarily through apre- and post- survey of the 2014/15 cohort of UpRisers. Thesurvey findings are supplemented with qualitative insightsfrom four focus groups held with recent participants.
Ian Wybron is a senior researcher at Demos.
Evaluation of U
pRising’s L
eadership Programm
e|
Ian Wybron
978-1-911192-00-8 £10© Demos 2016
Evaluation cover 11/7/16 12:49 pm Page 1

Evaluation cover 11/7/16 12:49 pm Page 2

Evaluation cover 11/7/16 12:49 pm Page 2
Demos is Britain’s leading cross-party think-tank.We produce original research, publish innovativethinkers and host thought-provoking events. Wehave spent over 20 years at the centre of thepolicy debate, with an overarching mission tobring politics closer to people.
Demos has always been interested in power: howit works, and how to distribute it more equallythroughout society. We believe in trusting peoplewith decisions about their own lives and solvingproblems from the bottom-up.
We pride ourselves on working together with thepeople who are the focus of our research.Alongside quantitative research, Demos pioneersnew forms of deliberative work, from citizens’juries and ethnography to ground-breaking socialmedia analysis.
Demos is an independent, educational charity,registered in England and Wales (CharityRegistration no. 1042046).
Find out more at www.demos.co.uk

First published in 2016© Demos. Some rights reserved Magdalen House, 136 Tooley Street,
London, SE1 2TU, UK
ISBN 978-1-911192-00-8Series design by modernactivityTypeset by Chat Noir Design, Charente
Set in Gotham Rounded and Baskerville 10Cover paper: Flora GardeniaText paper: Munken Premium White

EVALUATION OF UPRISING’SLEADERSHIP PROGRAMME
Ian Wybron
Open access. Some rights reserved. As the publisher of this work, Demos wants to encourage thecirculation of our work as widely as possible while retainingthe copyright. We therefore have an open access policy whichenables anyone to access our content online without charge.
Anyone can download, save, perform or distribute thiswork in any format, including translation, without writtenpermission. This is subject to the terms of the Demos licencefound at the back of this publication. Its main conditions are:
· Demos and the author(s) are credited· This summary and the address www.demos.co.uk are displayed· The text is not altered and is used in full· The work is not resold· A copy of the work or link to its use online is sent to Demos
You are welcome to ask for permission to use this work forpurposes other than those covered by the licence. Demosgratefully acknowledges the work of Creative Commons ininspiring our approach to copyright. To find out more go towww.creativecommons.org

Contents
Acknowledgements 7
Executive summary 9
Introduction 19
1 Evaluation framework and methodology 25
2 Who takes part in UpRising? 33
3 UpRising’s theory of change: measuring,knowledge, networks, skills and confidence 43
4 Political and democratic engagement 59
5 Community leaders: Outcomes Framework for Youth Social Action 69
6 The voices of UpRisers 79
Conclusion 101
Appendix A Characteristics of Leadership Programme participants and comparisongroup 105
Appendix B Detailed outcome measures for UpRising’s theory of change 112
Appendix C Summary of the Outcomes Framework for Youth Social Action 120
Appendix D Detailed outcomes measures for the Outcomes Framework for Youth Social Action 122
Notes 135
References 137
Contents

AcknowledgementsThis evaluation was made possible through the assistance of agreat many UpRising staff – and we are extremely grateful toall those who helped us in administering surveys andorganising focus groups. Demos would especially like to thankAlice Memminger and Karl Hankinson for their support. Wewould also like to thank the many UpRising alumni whoparticipated in our focus groups across the country and sharedtheir insights.
The report also benefitted from helpful feedback from theCabinet Office, and we are grateful for the input of NerissaSteel and Anna Romaniuk in particular.
At Demos, thanks go to Jonathan Birdwell and LouisReynolds for their assistance with the evaluation, and toPhilippa Alway, Alex Porter, and Louisa Carpenter for steeringthe report through publication. A huge thanks, also, to DrMatt Barnes of City University for his assistance with thequantitative analysis. Any errors and omissions remain my own.
Ian WybronAugust 2016
7


Executive summary
9
UpRising is a UK-wide youth leadership developmentorganisation, aiming to open pathways to power for talentedyoung people from diverse and under-representedbackgrounds.
This report marks the culmination of a year-longindependent evaluation of UpRising conducted by Demos,which began in summer 2014.
Our evaluation sought to capture short-term outcomes forparticipants of UpRising’s flagship nine-month LeadershipProgramme, and to measure medium- and longer-term impactsfor alumni. Our interim report, The Power of UpRising, coveredthe medium to longer term.1 This report focuses on the short-term outcomes, measured through surveying the 2014/15 cohortof UpRisers. The survey findings are supplemented withqualitative insights from four additional focus groups.
Measuring short-term outcomesDemos administered surveys to UpRising participants beforeand after the Leadership Programme (n = 133), which tookplace in seven locations between October 2014 and August2015. We included questions to allow us to measure outcomesin three key areas.
First, we included a number of questions related toUpRising’s theory of change. The theory holds that providingtalented young people from diverse and under-representedbackgrounds with four key ingredients – relevant knowledge,networks, skills and confidence – will enable them to realisetheir leadership potential.
Second, we included a series of questions on participants’political and democratic engagement, which were drawn

primarily from the Hansard Audit of Political Engagementquestionnaire. This is a key theme for UpRising.
Third, we included a series of questions from theOutcomes Framework for Youth Social Action. Thesestandardised questions – used to evaluate a range of socialaction programmes – capture a range of attributes, includingempathy, problem-solving, ‘grit’ and cooperation. Theinclusion of these questions was stipulated by the CabinetOffice as a condition of funding.
Interpreting the findingsThe majority of questions in our surveys required respondentsto mark their level of agreement with a statement on a 0–10scale (with 0 equal to ‘not at all’ and 10 equal to ‘completely’).Our primary method for measuring outcomes on thesequestions has been to calculate the change in the mean scorebefore and after the Leadership Programme, and to test thestatistical significance of that change. We did this for eachindividual question, and combined related questions intocomposite measures and performed the same procedure. Foreach question and composite, we also present additional waysof measuring outcomes – beyond changes in the mean – indetailed tables in the appendices.
For the questions that use different scales (for example,the political engagement questions), we focus instead on thechange in the proportions of participants falling into eachanswer category rather than analysis of the mean.
We recruited and surveyed a comparison group to helpwith attributing changes on these measures to respondentshaving participated in the Leadership Programme rather thanto other factors. As explained in the main text, because of thesmall sample size of the comparison group (n = 55) andchallenging recruitment methods, we use this for at-a-glancecomparison only – better quality evidence would be required tomake a strong case for attribution.
Executive summary

Outcomes: UpRising’s theory of changeOur findings suggest the 2014/15 Leadership Programme led tosignificant positive outcomes in participants’ knowledge,networks, skills and confidence.
On each of the measures we used for the four componentsof UpRising’s theory of change, the average participant’s scoreincreased over the course of the programme by a statisticallysignificant margin. While the comparison group scoredthemselves lower at baseline on many of the relevant surveyquestions, limiting the comparison, substantially less changewas measured – almost none that was statistically significant.Detailed summary tables for these questions can be found inAppendix B.
KnowledgeOur analysis of the knowledge measures showed the followingoutcomes for UpRising participants:
11
· a 22 per cent increase in the average participant’s score for theirunderstanding of key local issues
· a 26 per cent increase in the average participant’s score forunderstanding who has the power to make change happen
· a 31 per cent increase in the average participant’s score forunderstanding how to influence decisions affecting the localarea
· a 14 per cent increase in the average participant’s score forunderstanding their own strengths and weaknesses
· an 11 per cent increase in the average participant’s score fortheir understanding of people from different backgrounds
On the composite knowledge measure there was a 19 per cent increase inthe average participant’s score.
NetworksOur analysis of the networks measures showed the followingoutcomes:

· a 14 per cent increase in the average participant’s score whenrating their networks with senior leaders
· a 35 per cent increase in the average participant’s score whenrating their networks with people from different professionalbackgrounds
· a 21 per cent increase in the average participant’s score whenrating their networks of supportive peers
· a 38 per cent increase in the average participant’s score whenrating ability to get other people involved in fixing a problem
Executive summary
On the composite networks measure there was a 26 per cent increase in the average participant’s score.
SkillsAnalysis of the measures of participants’ skills showed thefollowing outcomes:
· an 11 per cent increase in the average participant’s score whenrating their research skills
· a 10 per cent increase in the average participant’s score forteam-working
· a 14 per cent increase in the average participant’s score forproject management
· a 5 per cent increase in the average participant’s score forproblem solving
· a 12 per cent increase in the average participant’s score forpublic speaking
On the composite skills measure, there was an 11 per cent increase in theaverage participant’s score.
ConfidenceFor participants’ confidence, we found the following:
· a 5 per cent increase in the average participant’s score forfeeling confident in being a leader
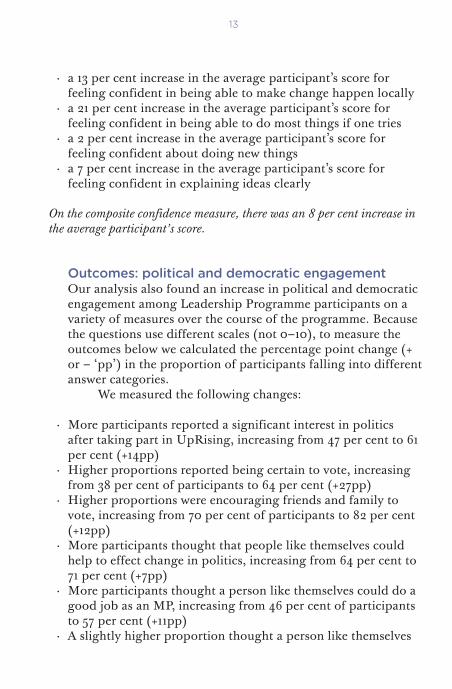
· a 13 per cent increase in the average participant’s score forfeeling confident in being able to make change happen locally
· a 21 per cent increase in the average participant’s score forfeeling confident in being able to do most things if one tries
· a 2 per cent increase in the average participant’s score forfeeling confident about doing new things
· a 7 per cent increase in the average participant’s score forfeeling confident in explaining ideas clearly
13
On the composite confidence measure, there was an 8 per cent increase inthe average participant’s score.
Outcomes: political and democratic engagementOur analysis also found an increase in political and democraticengagement among Leadership Programme participants on avariety of measures over the course of the programme. Becausethe questions use different scales (not 0–10), to measure theoutcomes below we calculated the percentage point change (+or – ‘pp’) in the proportion of participants falling into differentanswer categories.
We measured the following changes:
· More participants reported a significant interest in politicsafter taking part in UpRising, increasing from 47 per cent to 61per cent (+14pp)
· Higher proportions reported being certain to vote, increasingfrom 38 per cent of participants to 64 per cent (+27pp)
· Higher proportions were encouraging friends and family tovote, increasing from 70 per cent of participants to 82 per cent(+12pp)
· More participants thought that people like themselves couldhelp to effect change in politics, increasing from 64 per cent to71 per cent (+7pp)
· More participants thought a person like themselves could do agood job as an MP, increasing from 46 per cent of participantsto 57 per cent (+11pp)
· A slightly higher proportion thought a person like themselves

could do a good job as a local councillor, increasing from 53per cent to 55 per cent (+2pp)
· More participants were using social media at least once a weekto engage in a social or political issue, increasing from 23 percent to 39 per cent (+16pp)
Executive summary
While these results are very positive, in many cases similarchanges were observed in the comparison group, making itdifficult to attribute changes to participating in UpRising. It isperhaps especially difficult to do so during an election yearwhen exposure to politics is greater than usual.
Outcomes: Framework for Youth Social ActionOur surveys found that participants of UpRising’s LeadershipProgramme scored very highly with respect to almost all of therelevant measures in the Outcomes Framework for YouthSocial Action at baseline (on empathy, problem solving, and‘grit’, for example – see Appendix C for a summary of theFramework). These questions use a 0–10 scale, and henceoutcomes were calculated through analysis of changes in themean score.
Our analysis found there was little to no change on themajority of items over the course of the Leadership Programme– there were statistically significant changes in only a smallnumber of measures. The exceptions were the fairly substantialpositive changes seen in relation to participants’ wellbeing andon certain measures of being active in the community. Therewas little to no change on most items in the comparison group.Detailed summary tables can be found in Appendix D.
Below we summarise our findings on each of thecomposite measures in the Framework. Following advice fromthe Cabinet Office we did not aggregate the wellbeingquestions nor the community engagement questions – also partof the Framework. These results are presented separately.
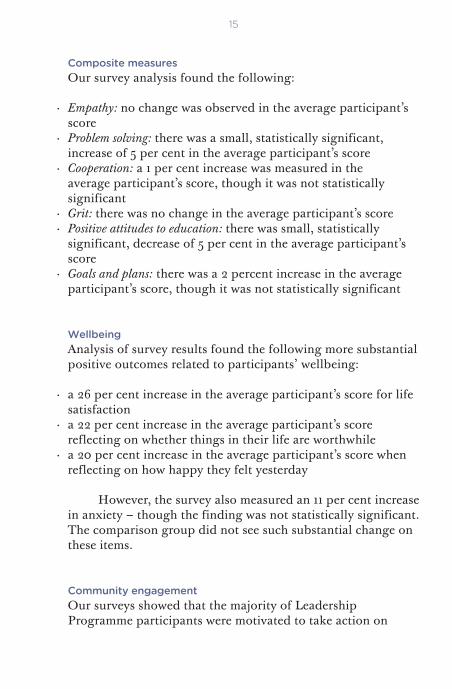
Composite measuresOur survey analysis found the following:
15
· Empathy: no change was observed in the average participant’sscore
· Problem solving: there was a small, statistically significant,increase of 5 per cent in the average participant’s score
· Cooperation: a 1 per cent increase was measured in the average participant’s score, though it was not statisticallysignificant
· Grit: there was no change in the average participant’s score· Positive attitudes to education: there was small, statistically
significant, decrease of 5 per cent in the average participant’sscore
· Goals and plans: there was a 2 percent increase in the averageparticipant’s score, though it was not statistically significant
WellbeingAnalysis of survey results found the following more substantialpositive outcomes related to participants’ wellbeing:
· a 26 per cent increase in the average participant’s score for lifesatisfaction
· a 22 per cent increase in the average participant’s scorereflecting on whether things in their life are worthwhile
· a 20 per cent increase in the average participant’s score whenreflecting on how happy they felt yesterday
However, the survey also measured an 11 per cent increasein anxiety – though the finding was not statistically significant.The comparison group did not see such substantial change onthese items.
Community engagementOur surveys showed that the majority of LeadershipProgramme participants were motivated to take action on

issues in their communities prior to taking part in UpRising(93 per cent), but far fewer were actually doing so regularly (30 per cent were doing so at least once a month).
The survey results showed that after the LeadershipProgramme:
Executive summary
· More participants were undertaking an activity, at least once amonth, to help other people or improve the community, from30 per cent to 59 per cent (+29pp)
· More participants said they were organising a petition or eventto support a local or national issue, from 11 per cent to 23 percent (+12 pp)
· There was a small increase in the proportion of participantsgiving unpaid help to a local club, group, organisation or placeof worship, from 54 per cent to 58 per cent (+4pp)
· There was no change in the proportion of participants raisingmoney for charity, with 23 per cent doing so before and after
While the comparison group made far smaller changes onthe first two items in particular, it is not clear whetherparticipants were including in their answers activitiesundertaken as part of the Leadership Programme or not.
Feedback from UpRisersIn order to gain better understanding of the experience oftaking part in UpRising’s Leadership Programme, weconducted four focus groups with recent UpRising alumni forthis report. The groups were held in London, Birmingham,Stoke-on-Trent and Bedford.
During the focus groups we asked participants to talk usthrough their journey on the Leadership Programme, relatingtheir experiences of each programme component, andreflecting on whether and how each component had benefittedthem. This covered: the two-day residential leadership retreat atthe beginning of the programme, the knowledge and skillssessions, the coaching and mentoring opportunities that
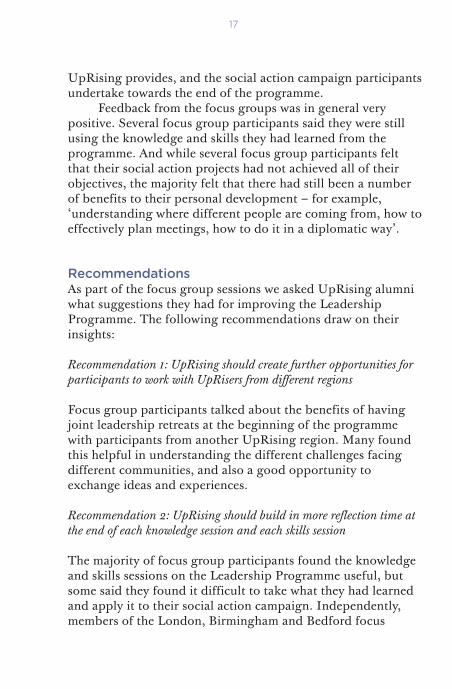
UpRising provides, and the social action campaign participantsundertake towards the end of the programme.
Feedback from the focus groups was in general verypositive. Several focus group participants said they were stillusing the knowledge and skills they had learned from theprogramme. And while several focus group participants feltthat their social action projects had not achieved all of theirobjectives, the majority felt that there had still been a numberof benefits to their personal development – for example,‘understanding where different people are coming from, how toeffectively plan meetings, how to do it in a diplomatic way’.
RecommendationsAs part of the focus group sessions we asked UpRising alumniwhat suggestions they had for improving the LeadershipProgramme. The following recommendations draw on theirinsights:
Recommendation 1: UpRising should create further opportunities forparticipants to work with UpRisers from different regions
Focus group participants talked about the benefits of havingjoint leadership retreats at the beginning of the programmewith participants from another UpRising region. Many foundthis helpful in understanding the different challenges facingdifferent communities, and also a good opportunity toexchange ideas and experiences.
Recommendation 2: UpRising should build in more reflection time atthe end of each knowledge session and each skills session
The majority of focus group participants found the knowledgeand skills sessions on the Leadership Programme useful, butsome said they found it difficult to take what they had learnedand apply it to their social action campaign. Independently,members of the London, Birmingham and Bedford focus
17
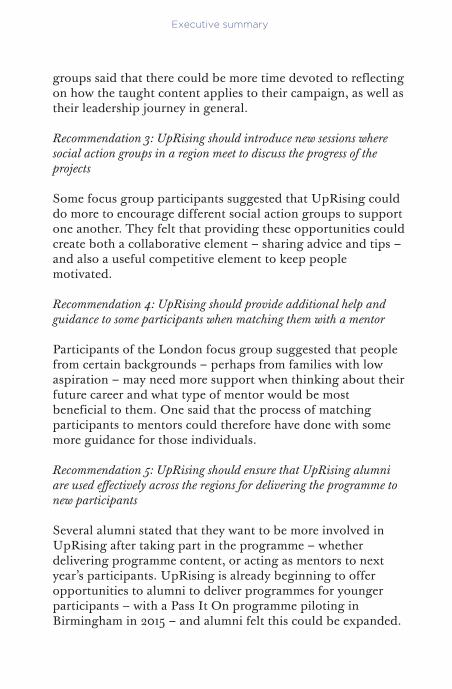
groups said that there could be more time devoted to reflectingon how the taught content applies to their campaign, as well astheir leadership journey in general.
Recommendation 3: UpRising should introduce new sessions wheresocial action groups in a region meet to discuss the progress of theprojects
Some focus group participants suggested that UpRising coulddo more to encourage different social action groups to supportone another. They felt that providing these opportunities couldcreate both a collaborative element – sharing advice and tips –and also a useful competitive element to keep peoplemotivated.
Recommendation 4: UpRising should provide additional help andguidance to some participants when matching them with a mentor
Participants of the London focus group suggested that peoplefrom certain backgrounds – perhaps from families with lowaspiration – may need more support when thinking about theirfuture career and what type of mentor would be mostbeneficial to them. One said that the process of matchingparticipants to mentors could therefore have done with somemore guidance for those individuals.
Recommendation 5: UpRising should ensure that UpRising alumniare used effectively across the regions for delivering the programme tonew participants
Several alumni stated that they want to be more involved inUpRising after taking part in the programme – whetherdelivering programme content, or acting as mentors to nextyear’s participants. UpRising is already beginning to offeropportunities to alumni to deliver programmes for youngerparticipants – with a Pass It On programme piloting inBirmingham in 2015 – and alumni felt this could be expanded.
Executive summary

Introduction
19
This report is the culmination of a year-long independentevaluation of UpRising conducted by Demos. It follows ourinterim report The Power of UpRising, published in 2015.2
UpRising is a UK-wide youth leadership developmentorganisation. Established in 2008, UpRising’s mission is towork towards tackling the lack of diversity in positions ofleadership and power in UK society. The organisation attemptsto find and inspire leaders from diverse and under-representedbackgrounds – in particular, equipping them with theknowledge, networks, skills and confidence to fulfil theirleadership potential, and to make a difference to their localcommunities through social action. Over the long term, thiswill result in communities having leaders who betterunderstand and address their needs.
UpRising’s mission fits the times. As outlined in ourinterim report, recent statistics show that the UK continues tohave a poor social mobility record. People from privilegedbackgrounds continue to be over-represented in a range of topjobs and positions of leadership in the UK. Women continue tobe under-represented in these positions compared with men.And people from ethnic minority backgrounds continue to beunder-represented compared with White British people.
This is true of political leaders. The Sutton Trust reportsthat MPs elected in 2015 are over four times more likely to havegone to a fee-paying school than their constituents, with almosta third of MPs being privately educated (32 per cent)compared with 7 per cent of the population.3 Less than a third(29 per cent) of MPs elected in 2015 are women. Only 6 percent of MPs are from a black and minority ethnic (BAME)background, compared with 14 per cent of the population.4

It is also true of a range of other occupations andpositions of power and influence across the public sector,business and third sector. Elitist Britain,5 a 2014 report by theSocial Mobility and Child Poverty Commission, found anumber of elite occupations dominated by privately educatedpeople, including senior judges (71 per cent of whom wereprivately educated), senior armed forces officers (62 per cent)and senior diplomats (53 per cent). Men continue to dominatethe British boardroom, with women accounting for just 13 percent of FTSE 100 boardroom positions. In the charity sector,only 6 per cent of senior management team members are from aBAME background. And so on.
What UpRising involvesUpRising seeks to tackle this state of affairs by recruitingyoung people from diverse and under-represented backgroundsto take part in its leadership development programmes, whichrun in seven locations across the country: Bedford,Birmingham, Liverpool, London, Luton, Manchester andStoke-on-Trent.
UpRising has a number of different programmes on offerto young people in these areas. Our evaluation focused onUpRising’s flagship nine-month Leadership Programme,targeted at 19–25-year-olds. Since 2008 approximately 850people have completed the Leadership Programme across theseven locations. The components of the programme areoutlined in brief in the box below.
Box 1 The Leadership Programme6
The Leadership Programme comprises the followingcomponents over nine months:
· a two-day residential retreat to introduce key concepts aroundleadership and social change
· a series of six ‘knowledge’ sessions, including visits to keyinstitutions and meetings with people in positions of power
Introduction

(including MPs, local service providers, local press andbusiness leaders)
· a series of six ‘skills’ sessions, focusing on problem solving inthe community, leading teams of people, project managementand other employability skills
· a social action campaign, organised in groups and runningin tandem with the skills and knowledge sessions, anddelivered towards the end of the programme
· coaching and goal setting with a professional coach · career-relevant mentoring with a local professional matched
to the individual· access to a network of alumni, who may help deliver some of
the programme and who form a support network beyond theprogramme
Participants do not have to pay to attend any ofUpRising’s programmes.
Interim findings: The Power of UpRisingThe overall framework for our evaluation is outlined in detailin the next chapter. The evaluation was designed to captureshort-, medium- and longer-term outcomes of participating inUpRising’s Leadership Programme – conducting research withcurrent participants and recent and older alumni.
Because of the nature of the evaluation, this report shouldbe read in tandem with the interim report Demos published in2015, The Power of UpRising. That report focused on our workwith alumni, covering the medium- to longer-term outcomes oftaking part in UpRising’s Leadership Programme.
In the interim report we presented the findings of asurvey of alumni, and feedback from two focus groups withalumni in Birmingham and London. The interim report foundthat UpRising alumni generally report that the LeadershipProgramme helped them to develop relevant knowledge,networks, skills and confidence – both in relation to getting ajob and taking on positions of responsibility, and also beingable to contribute positively to the community. Furthermore,
21

we found many alumni were participating in a wide range ofactivities related to leadership (for example, starting a business,or taking up a position as a trustee or school governor), andmany attributed this, at least in part, to participating in theprogramme. Just under nine in ten respondents (88 per cent)to our alumni survey felt that UpRising had improved theirconfidence to aspire to positions of leadership (n = 112).
On the understanding that the longer-term impact ofUpRising may not be known for some time (whether alumniactually reach positions of leadership and influence), we alsointerviewed 12 ‘people in power’ from diverse backgroundswho are currently successful within politics, the public sector,business and the third sector. While these leaders emphasisedthere was not one path to success, they generally agreed thatUpRising seeks to tackle the right areas – knowledge,networks, skills and confidence – for realising the potential ofparticipants. They also underlined the importance of many ofthe activities UpRising alumni are now involved in.7
This reportThis report focuses on our work with participants, covering theshort-term outcomes for people who took part in theLeadership Programme between October 2014 and August2015, during the time Demos was evaluating. These outcomeswere measured primarily through a survey administered toparticipants before and after taking part.
The first two chapters in this report provide furthercontext. Chapter 1 explains in detail how research conductedfor this report fits into the broader evaluation framework andoutlines the key research activities. Chapter 2 then explores thecharacteristics of UpRising participants. Findings from oursurveys are then organised into the following chapters:
Introduction
· Chapter 3 covers outcomes relating to UpRising’s theory ofchange, measuring changes in participants’ knowledge,networks, skills and confidence
· Chapter 4 covers outcomes relating to the political anddemocratic engagement of participants
· Chapter 5 covers outcomes relating to the OutcomesFramework for Youth Social Action (measuring cooperation,‘grit’, empathy, etc), as stipulated by the Cabinet Office for thisevaluation
After outlining the quantitative findings, in chapter 6 wepresent qualitative insight from four additional focus groups withrecent alumni conducted for this report. These focus groups wereheld in Bedford, Birmingham, London and Stoke-on-Trent.
23

1 Evaluation frameworkand methodology
25
Demos was commissioned by UpRising in August 2014 toundertake an independent evaluation of its LeadershipProgramme over the course of a year, and to develop a longer-term monitoring and evaluation framework for theorganisation.
The evaluation aimed to achieve three top-level objectives:
· to measure the short-term outcomes for participants ofUpRising’s Leadership Programme (the 2014/15 cohort)
· to engage with alumni to gain critical insight into theexperience of taking part in UpRising and to assess impactover the medium term
· to identify any indicators for the future success of UpRisingparticipants over the longer term
Leadership Programme logic modelUpRising’s Leadership Programme is underpinned by a theoryof change, which we used to frame the evaluation. This theoryis that providing talented young people from diverse andunder-represented backgrounds with four key ingredients – theright knowledge, networks, skills and confidence – will enablethem to realise their leadership potential. The longer-termimpact will be greater diversity in positions of leadership in theUK, with more communities having leaders who betterunderstand and address their needs.
In partnership with UpRising, Demos developed adetailed logic model for the Leadership Programme in line withthe theory of change. A summary of the logic model ispresented in figure 1, which shows the outcomes we wereinterested in measuring in bold.8

Evaluatio
n framew
ork and
metho
do
log
yFigure 1 The Leadership Programme logic model
ImpactsOutcomes
Learning ActionOutputs
Activities ParticipationInputs
Increased wellbeing, grit and resillence, etc, in
line with Outcomes Framework for
Youth Social Action
Increased political and democratic
engagement
Improved knowledge,
networks, skills and confidence
Participants take next step to positions of
responsibility and leadership
Increased participation in
social action
Participants contribute to
making leadership more diverse in the
UK
Participants take on positions of power
and influence
Participants help make positive
changes to communities
Six knowledge sessions
Leadership retreat
Participant satisfaction
Participant completion rates
Social action campaign
Mentoring
Coaching
Alumni network
Staff: UpRising
Programme Managers and delivery staff
Locations: Bedford, Birmingham,
Liverpool, Luton, Manchester,
Stoke-on-Trent
Participants: 19–25 year-olds
from diverse backgrounds
Venues: community venues
Partners: recruitment
partners, speakers, career mentors,
professional coaches
Time: 9 months per programme
Six skills sessions
27
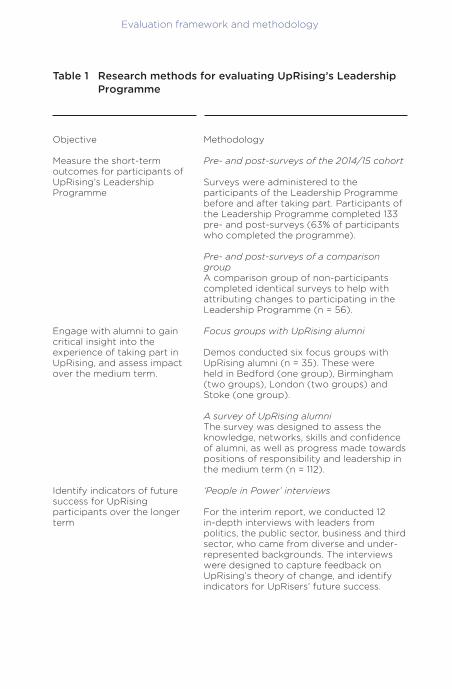
Research methodsTable 1 summarises the key research activities undertaken forthe evaluation in line with the logic model shown in figure 1.The activities are grouped under the three top-level objectivesoutlined at the beginning of this chapter.
Note that it is the first objective which is covered in detailin this report, with some overlap with the second. The secondand third objectives were primarily covered in our interim report,The Power of UpRising.
Pre- and post-survey administrationThe pre- and post-surveys for the 2014/15 cohort of theLeadership Programme were administered between October2014 and August 2015 across the seven UpRising locations.Demos produced both online versions and hard copies of thesurveys. UpRising Programme managers in each area contactedProgramme participants, asking them to complete the surveyonline; they administered hard copies to any participants whohad not done so one week later. Demos did not have directcontact with participants.
Measuring outcomes for this reportThe majority of questions in our surveys required participantsto mark their level of agreement with a statement on a 0–10scale (with 0 equal to not at all, and 10 equal to completely).
Our primary method for measuring outcomes on thesequestions has been to calculate the change in the averageparticipant’s score (using the mean) on each question beforeand after taking part in the Leadership Programme. Changesobserved in the mean were tested for statistical significanceusing paired t-tests (at the 95 per cent confidence level). Wethen calculated the percentage change in the mean scorebetween pre- and post-survey. It should be borne in mind thatbecause these percentage changes reflect movements on a 0–10scale, fairly substantial percentage changes may represent quitesmall changes in actual point scores.
Evaluation framework and methodology
Table 1 Research methods for evaluating UpRising’s LeadershipProgramme
Objective Methodology
Measure the short-term Pre- and post-surveys of the 2014/15 cohortoutcomes for participants of UpRising’s Leadership Surveys were administered to the Programme participants of the Leadership Programme
before and after taking part. Participants ofthe Leadership Programme completed 133pre- and post-surveys (63% of participantswho completed the programme).
Pre- and post-surveys of a comparisongroupA comparison group of non-participantscompleted identical surveys to help withattributing changes to participating in theLeadership Programme (n = 56).
Engage with alumni to gain Focus groups with UpRising alumni critical insight into the experience of taking part in Demos conducted six focus groups withUpRising, and assess impact UpRising alumni (n = 35). These were over the medium term. held in Bedford (one group), Birmingham
(two groups), London (two groups) andStoke (one group).
A survey of UpRising alumni The survey was designed to assess theknowledge, networks, skills and confidenceof alumni, as well as progress made towardspositions of responsibility and leadership inthe medium term (n = 112).
Identify indicators of future ‘People in Power’ interviewssuccess for UpRising participants over the longer For the interim report, we conducted 12term in-depth interviews with leaders from
politics, the public sector, business and thirdsector, who came from diverse and under-represented backgrounds. The interviewswere designed to capture feedback onUpRising’s theory of change, and identifyindicators for UpRisers’ future success.

29
Alongside the scores on each individual question, we havealso combined relevant survey results into composite measures(eg ‘knowledge’, ‘networks’, etc), and calculated aggregatescores. These are not perfect measures, but rather give a usefulindication of the bigger picture. To do so, we calculated theaverage score for each person completing all of the relevantquestions in each construct, and then took an average across allpeople who completed all of those questions. Becauserespondents who did not complete all the relevant questionswere excluded from the analysis, the sample size may besmaller for the aggregate measures than for each individualquestion. For the Outcomes Framework for Youth SocialAction, this aggregation is recommended practice.
There are, of course, a number of ways of measuringoutcomes for 0–10 scale items beyond analysis of the mean. Weconducted two additional sets of analyses, which are includedin detailed tables in the appendices. These are:
· the proportions of participants who scored positively on eachquestion pre- and post-survey (scores of 6 or above on theagreement scale)
· the proportions of participants who saw a negative change, nochange or positive change on each item (what we have looselytermed ‘impact’ groups)
For simplicity, these results are not referenced in detail inthe main text.
For the questions that do not use a 0–10 scale (forexample, the democratic and political engagement questions),we focus instead on the change in the proportions ofparticipants falling into each answer category rather than ananalysis of the mean.
It is worth noting that the sample size of surveyscompleted by Leadership Programme participants (n = 133) isfairly small, and consequently the findings should be read withthis limitation in mind.
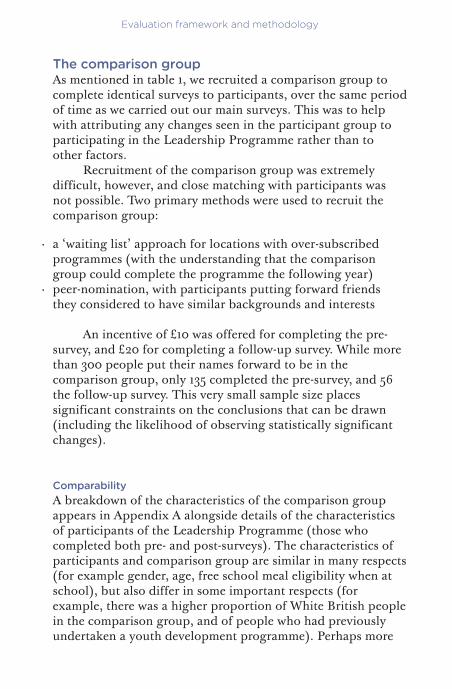
The comparison groupAs mentioned in table 1, we recruited a comparison group tocomplete identical surveys to participants, over the same periodof time as we carried out our main surveys. This was to helpwith attributing any changes seen in the participant group toparticipating in the Leadership Programme rather than to other factors.
Recruitment of the comparison group was extremelydifficult, however, and close matching with participants wasnot possible. Two primary methods were used to recruit thecomparison group:
Evaluation framework and methodology
· a ‘waiting list’ approach for locations with over-subscribedprogrammes (with the understanding that the comparisongroup could complete the programme the following year)
· peer-nomination, with participants putting forward friendsthey considered to have similar backgrounds and interests
An incentive of £10 was offered for completing the pre-survey, and £20 for completing a follow-up survey. While morethan 300 people put their names forward to be in thecomparison group, only 135 completed the pre-survey, and 56the follow-up survey. This very small sample size placessignificant constraints on the conclusions that can be drawn(including the likelihood of observing statistically significantchanges).
ComparabilityA breakdown of the characteristics of the comparison groupappears in Appendix A alongside details of the characteristicsof participants of the Leadership Programme (those whocompleted both pre- and post-surveys). The characteristics ofparticipants and comparison group are similar in many respects(for example gender, age, free school meal eligibility when atschool), but also differ in some important respects (forexample, there was a higher proportion of White British peoplein the comparison group, and of people who had previouslyundertaken a youth development programme). Perhaps more
31
seriously, the pre-survey results show fairly substantialdifferences between the comparison group and participants onmany of the survey measures at baseline (see appendices B andD). The combination of these factors, alongside the smallsample size, means that we use the comparison group for at-a-glance comparison only. A more robust comparison would berequired to make a strong case for attributing changes observedin participants to taking part in the Leadership Programme.


2 Who takes part inUpRising?
33
This chapter provides a brief summary of the characteristics ofthose who participated in UpRising’s Leadership Programmein 2014/15.
Two sets of data are included in figures 2–7 below. Thefirst set are internal UpRising data collected duringrecruitment, which show the characteristics of all LeadershipProgramme participants (n = 279). The second set of data arefrom the sample that completed our pre- and post-surveys (n = 133). These are presented alongside one another to give animpression of how representative our survey sample is likely to be.
Participant characteristicsGenderIn 2014/15, 62 per cent of Leadership Programme participantswere female compared with 38 per cent who were male.
AgeThe Leadership Programme is targeted at 19–25-year-olds.UpRising’s recruitment data show participants were spreadacross these years. There were more 19-year-olds (19 per cent)than any other age group.
EthnicityData gathered by UpRising and Demos on ethnicity have beensimplified here and put into ‘parent groups’ as used by theOffice for National Statistics (figure 4).9

Who takes part in UpRising?
Figure 2 The gender of Leadership Programme participants
70
0
60
50
40
30
20
10
Male Female
66
62
34
38%
All participants (n = 279)
Pre- and post-surveys (n = 133)

35
Figure 3`The age distribution of Leadership Programme participants
19 20 21 22 23 24 25 >25
14
17
14
7
17
19
14
12
16
1111
17
11
7
8
6
20
0
12
10
8
6
4
2
14
16
18
All participants (n = 279)
Pre- and post-surveys (n = 133)
%
Age

Who
takes part in U
pR
ising?
Figure 4 The ethnic backgrounds of Leadership Programme participants
White Mixed/multipleethnic groups
Asian/Asian British
Black/African/Carribean/Black British
Other ethnic group
%
40
0
20
15
5
25
30
35
4
2827
2930
89
37
30
10
All participants (n = 279)
Pre- and post-surveys (n = 133)
37
The data show that participants of the LeadershipProgramme had the following ethnic backgrounds:
· 30 per cent were from a White ethnic group· 9 per cent were from a Mixed ethnicity group· 30 per cent were from an Asian or Asian British ethnic group· 27 per cent were from a Black, African, Caribbean or Black
British ethnic group· 4 per cent were categorised as ‘Other’
Participants in our survey sample came from broadlysimilar backgrounds, though there was a higher proportion ofpeople with White ethnicity (37 per cent).
The data on the ethnicity of participants show thatUpRising is recruiting a diverse ethnic mix of participantsrelative to the national picture. For example, the 2011 Censusshows that around 80 per cent of 19–25-year-olds in Englandare from a White background.
Socioeconomic backgroundDuring recruitment UpRising asked participants about theirparents’ highest qualifications as an indicator of theparticipant’s socioeconomic background. For the father’shighest qualification, the data show that 21 per cent ofparticipants ticked ‘no qualifications’, while 28 per cent saidtheir father had a degree. For the mother, these figures were 19per cent with no qualification and 23 per cent with a degree.
The Demos surveys asked participants whether they hadreceived free school meals when at school to get a further senseof socioeconomic background (figure 5).
Nearly one-quarter (24 per cent) of respondents to thesurvey sample said they had been eligible for free school mealswhen at school, with 66 per cent not having been eligible, and10 per cent not being sure. This compares with 16 per cent ofpupils who are currently eligible and claiming free schoolmeals at secondary schools in England.10

Who takes part in UpRising?
Figure 5 Free school meal eligibility when at school of LeadershipProgramme participants
10
66
24
70
0
60
50
40
30
20
10
%
Yes No Not sureEligible for free school meals when at school
Pre- and post-surveys (n = 133)
Previous participation in youth programmesWe were also interested in how much experience UpRisers hadof undertaking social action before taking part in UpRising.Our survey asked them which, if any, of a range of youthprogrammes they had taken part in.
The results show that a proportion of participants hadparticipated in at least one other youth programme, includingaround one in ten (9 per cent) who had participated in theNational Citizen Service, and the same proportion who hadparticipated in vinspired. However, almost two-thirds (62 percent) had not taken part in any of the programmes we listed.
While many Leadership Programme participants had notundertaken one of these youth programmes, the survey resultsshow that the majority of participants were very motivated toengage in their communities before taking part in UpRising. Inthe pre-survey, 93 per cent of participants said that they weremotivated to take action on issues in the community, with theaverage participant scoring 7.8 out of 10 on the agreementscale. However, the pre-survey also showed that comparativelyfew participants were in fact regularly undertaking activities toimprove the local community before the programme, with only30 per cent saying they did so at least once a month.
Programme locationUpRising’s data shows the highest proportion of participantswere in East London (32 per cent). This is because there was anadditional programme running with Queen Mary University in2014/15 alongside the usual East London programme. TheLiverpool and Stoke-on-Trent courses are newer and hencehave a lower proportion of the total participants. Our surveysample roughly accords with the proportion of totalparticipants in each area, though there is over- and under-representation in certain areas.
39

Figure 6 Previous participation in youth programmes of Leadership Programme participantsW
ho takes p
art in Up
Rising
?
NationalCitizenService
vinspired Envision City Year Scouts/Girlguiding
Duke ofEdinburgh’s
Award
None ofthe above
%
70
0
30
20
40
50
60
10
62
20
12
25
99
Pre- and post-surveys (n = 133)

41
Figure 7 The proportion of Leadership Programme participants in each UpRising location
Programme location
%
35
0
15
10
20
25
30
5
Bedfordshire/Luton Birmingham East London Greater
Manchester Liverpool Stoke-on-Trent
All participants (n = 279)
Pre- and post-surveys (n = 133)
18
25
21
16
25
32
2
11
78
1717
Completion rateThe 2014/15 Leadership Programme began with 279participants across the regions, while 212 participantscompleted the programme (a 76 per cent completion rate).UpRisers we spoke to throughout the course of this researchsuggested that there tended to be a group who did not engagenor benefit as much as other participants, which could explainwhy they stop attending the programme. This is likely reflectedin our ‘impact group’ analyses of the surveys (see appendices Band D), which show that on each outcome measure there was agroup that had a negative change over the course of theprogramme. During the course of our research a range ofpotential explanations was offered for people dropping-out,from individuals not getting on with their social action groupand hence losing interest, to not being able to find the time tocontinue because of their work or study commitments.
Who takes part in UpRising?

3 UpRising’s theory ofchange: measuringknowledge, networks,skills and confidence
43
In this chapter we present the key findings of our pre- andpost-surveys of the 2014/15 cohort as they relate to the fourcomponents of UpRising’s theory of change: knowledge,networks, skills and confidence.
In all of the survey questions referred to in this chapterwe asked respondents to mark on a 0–10 scale their level ofagreement with a statement (for example, ‘I understand the keyissues affecting my local community’), with 0 equal to ‘not atall’ and 10 ‘completely’. In the analysis below, we have focusedon changes in the average participant’s score before and aftertaking part in the programme to measure outcomes, and reportthe statistical significance of observed changes. More detailedresults tables for these outcomes is available in Appendix B.Comparison group results are referenced throughout – but thelimitations of the comparison should be borne in mind (seechapter 1).
KnowledgeThe Leadership Programme has six knowledge sessions. Theseconsist of a range of behind-the-scenes visits, roundtables andpanel discussions with senior leaders. The knowledge sessionsintend to introduce participants to the key issues affecting theirlocal areas, as well as to better their understanding of the rangeof key institutions and actors having an impact in localcommunities and nationally. This includes meeting communityleaders, local service providers, local press representatives,business leaders, and MPs at a session in Westminster.
Our surveys asked five questions to measure changes inparticipants’ knowledge, which were agreed with UpRising in

Up
Rising
’s theory o
f change
Figure 8 Knowledge of local issues and decision-making processes: changes in mean scores forparticipants and comparison group, pre- and post-surveys
8
7
6
5
4
3
9
2
1
0LeadershipProgramme
Comparisongroup
I understand the key issuesaffecting my local community
I understand which organisationsand individuals have power
to make change happen
I know how to influencedecisions affecting my local area
LeadershipProgramme
Comparisongroup
LeadershipProgramme
Comparisongroup
Que
stio
n A
gree
men
t le
vel 0
– 10
6.0
7.3*
5.4 5.3
4.13.9
6.8*
5.2
10
7.7*
6.1 6.05.5
Pre-
surv
ey
Post
-sur
vey
Pre-
surv
ey
Post
-sur
vey
Pre-
surv
ey
Post
-sur
vey
Pre-
surv
ey
Post
-sur
vey
Pre-
surv
ey
Post
-sur
vey
Pre-
surv
ey
Post
-sur
vey
* indicates statistical significance at the 95 per cent confidence level (p < 0.05)

line with their curriculum. On each of these measures, ouranalysis found statistically significant improvements in theaverage participant’s knowledge over the course of theLeadership Programme. For the comparison group wemeasured small to no change – none tested statisticallysignificant – though their baseline position was worse.
In three of the survey questions we asked respondents torate their knowledge of local issues and decision-makingprocesses. For UpRising participants, we measured thefollowing changes:
45
· The mean score for understanding key local issues increased by22 per cent (from 6.0 out of 10, to 7.3)
· The mean score for understanding which organisations andindividuals have the power to make change happen increasedby 26 per cent (6.1 to 7.7)
· The mean score for understanding how to influence decisionsaffecting the local area increased by 31 per cent (5.2 to 6.8)
The average scores before and after are summarised infigure 8, alongside those of the comparison group.
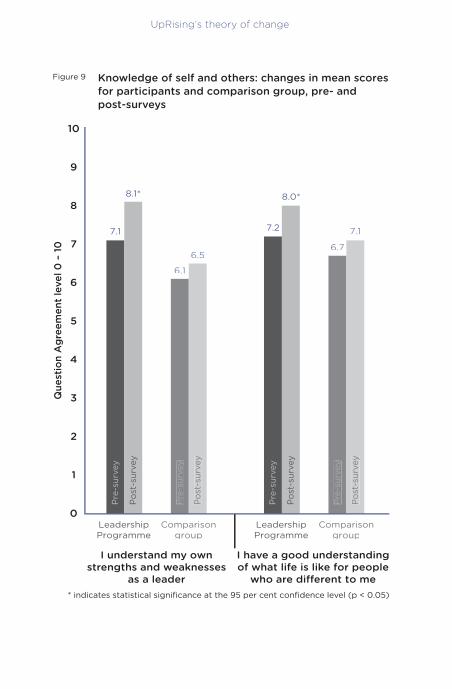
At the same time as learning about decision-makingprocesses, participants are encouraged through the LeadershipProgramme to reflect on their own strengths and weaknesses asleaders, as well as those of people from different backgroundsto their own. We found:
· The mean score for understanding one’s own strengths andweaknesses increased by 14 per cent (7.1 to 8.1)
· The mean score for understanding people from differentbackgrounds increased by 13 per cent (7.2 to 8.0)
The scores are summarised in figure 9.In combining these results into a composite measure
we found:
UpRising’s theory of change
Figure 9 Knowledge of self and others: changes in mean scores for participants and comparison group, pre- and post-surveys
8
7
6
5
4
3
9
2
1
0LeadershipProgramme
Comparisongroup
I understand my ownstrengths and weaknesses
as a leader
I have a good understandingof what life is like for people
who are different to me
LeadershipProgramme
Comparisongroup
Que
stio
n A
gree
men
t le
vel 0
– 10
7.1
8.1*
6.1
6.5
7.1
6.7
8.0*
7.2
10Pr
e-su
rvey
Post
-sur
vey
Pre-
surv
ey
Post
-sur
vey
Pre-
surv
ey
Post
-sur
vey
Pre-
surv
ey
Post
-sur
vey
* indicates statistical significance at the 95 per cent confidence level (p < 0.05)
· The mean knowledge score on relevant questions increased by19 per cent over the course of the Leadership Programme, from6.4 to 7.6 out of 10
47
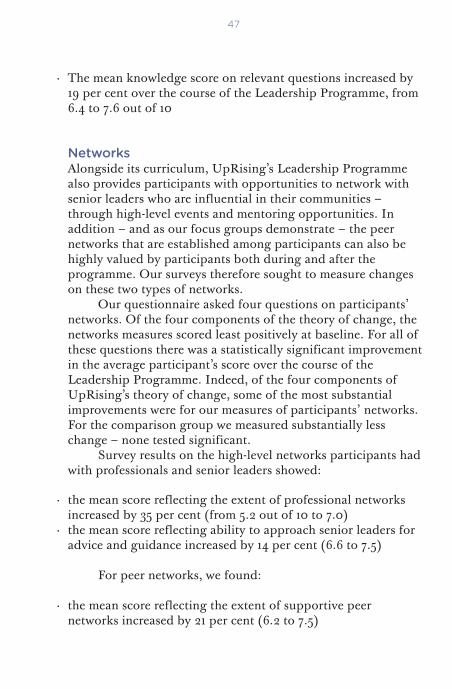
NetworksAlongside its curriculum, UpRising’s Leadership Programmealso provides participants with opportunities to network withsenior leaders who are influential in their communities –through high-level events and mentoring opportunities. Inaddition – and as our focus groups demonstrate – the peernetworks that are established among participants can also behighly valued by participants both during and after theprogramme. Our surveys therefore sought to measure changeson these two types of networks.
Our questionnaire asked four questions on participants’networks. Of the four components of the theory of change, thenetworks measures scored least positively at baseline. For all ofthese questions there was a statistically significant improvementin the average participant’s score over the course of theLeadership Programme. Indeed, of the four components ofUpRising’s theory of change, some of the most substantialimprovements were for our measures of participants’ networks.For the comparison group we measured substantially lesschange – none tested significant.
Survey results on the high-level networks participants hadwith professionals and senior leaders showed:
· the mean score reflecting the extent of professional networksincreased by 35 per cent (from 5.2 out of 10 to 7.0)
· the mean score reflecting ability to approach senior leaders foradvice and guidance increased by 14 per cent (6.6 to 7.5)
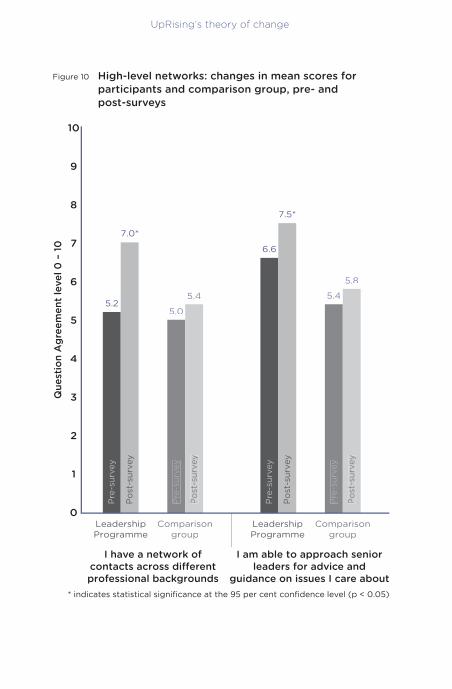
For peer networks, we found:
· the mean score reflecting the extent of supportive peernetworks increased by 21 per cent (6.2 to 7.5)
UpRising’s theory of change
Figure 10 High-level networks: changes in mean scores forparticipants and comparison group, pre- and post-surveys
8
7
6
5
4
3
9
2
1
0LeadershipProgramme
Comparisongroup
I have a network ofcontacts across differentprofessional backgrounds
I am able to approach seniorleaders for advice and
guidance on issues I care about
LeadershipProgramme
Comparisongroup
Que
stio
n A
gree
men
t le
vel 0
– 10
5.2
7.0*
5.0
5.4
5.8
5.4
7.5*
6.6
10
Pre-
surv
ey
Post
-sur
vey
Pre-
surv
ey
Post
-sur
vey
Pre-
surv
ey
Post
-sur
vey
Pre-
surv
ey
Post
-sur
vey
* indicates statistical significance at the 95 per cent confidence level (p < 0.05)

· the mean score reflecting ability to get other people involved infixing a problem increased by 38 per cent (4.8 to 6.6)
The results are summarised in figure 11.
In combining these results into a composite networksmeasure we found:
· The mean network score on relevant questions increased by 26per cent over the course of the Leadership Programme, from5.7 to 7.2 out of 10
49
SkillsOverlapping with the six knowledge sessions on the LeadershipProgramme are six skills sessions. These sessions aim to equipprogramme participants with the practical skills needed toundertake effective social action campaigns (the culmination ofthe programme), and to develop leadership skills that willenable them to be successful in their careers beyond theprogramme.
The sessions cover:
· research skills (enabling participants to identify socialproblems and develop solutions)
· stakeholder mapping (to identify who needs to be influencedto make these solutions a reality)
· team leadership · project management · communication skills
We asked six survey questions related to participants’skills, touching on several of the themes of the sessions above.Our analysis found that substantial proportions of participantsgave positive responses at baseline to the questions askedabout their skills, suggesting they started from a strongposition. Our analysis found that the average participantagreed more strongly with each skills statement at the end of
UpRising’s theory of change
Figure 11 Peer networks: changes in mean scores for participantsand comparison group, pre- and post-surveys
8
7
6
5
4
3
9
2
1
0LeadershipProgramme
Comparisongroup
I have a network of peers whosupport my ambitions
If I see a problem in my localarea I can get other people
involved in fixing it
LeadershipProgramme
Comparisongroup
Que
stio
n A
gree
men
t le
vel 0
– 10
6.2
7.5*
6.1 6.1
3.93.8
6.6*
4.8
10Pr
e-su
rvey
Post
-sur
vey
Pre-
surv
ey
Post
-sur
vey
Pre-
surv
ey
Post
-sur
vey
Pre-
surv
ey
Post
-sur
vey
* indicates statistical significance at the 95 per cent confidence level (p < 0.05)
the programme, by a statistically significant margin. While thecomparison group started from a lower baseline position oneach of the skills statements, less change was measured on allitems bar one (none were statistically significant).
For UpRising participants, we found that the mean score:
51
· for research skills increased by 11 per cent (from 7.0 out of 10 to 7.8)
· for team-working skills increased by 10 per cent (7.2 to 8.0)· for project-management skills increased by 14 per cent (7.0 to
8.0)· for problem-solving skills increased by 5 per cent (7.6 to 8.0)· for communication skills increased by 12 per cent (6.5 to 7.3)
The mean scores for participants and the comparisongroup are summarised in figure 12.
In combining the results of all of the skills questions, ouranalysis found:
· The mean skills score on relevant questions increased by 11 percent over the course of the Leadership Programme, from 7.1 to7.9 out of 10
ConfidenceFinally, we asked six questions relating to participants’confidence. These were questions on the extent to which theysee themselves as a leader, whether they feel confident in beingable to make a difference to their local community, as well assome general questions on confidence (for example, confidencein trying out new things).
The survey results showed that participants were alreadyconfident on the majority of measures when they started theprogramme. However, in line with other findings, over thecourse of the programme there was, on all but one measure, astatistically significant increase in the average participant’sscore out of 10.

Up
Rising
’s theory o
f change
Figure 12 Research skills, team working and project management: changes in mean scores forparticipants and comparison group, pre- and post-surveys
8
7
6
5
4
3
9
2
1
0LeadershipProgramme
Comparisongroup
I have the research skills to findout the needs within my local area
I am able to manage teamsof people
I know what it takes to managea project from start to finish
LeadershipProgramme
Comparisongroup
LeadershipProgramme
Comparisongroup
Que
stio
n A
gree
men
t le
vel 0
– 10
7.0
7.8*
6.9 6.8 6.96.4
8.0*
7.0
10
8.0*
7.2
6.56.5
Pre-
surv
ey
Post
-sur
vey
Pre-
surv
ey
Post
-sur
vey
Pre-
surv
ey
Post
-sur
vey
Pre-
surv
ey
Post
-sur
vey
Pre-
surv
ey
Post
-sur
vey
Pre-
surv
ey
Post
-sur
vey
* indicates statistical significance at the 95 per cent confidence level (p < 0.05)

53
Figure 13 Problem-solving and public-speaking skills: changes inmean scores for participants and comparison group, pre-and post-surveys
8
7
6
5
4
3
9
2
1
0LeadershipProgramme
Comparisongroup
I consider a range of differentsolutions to a problem I am a strong public speaker
LeadershipProgramme
Comparisongroup
Que
stio
n A
gree
men
t le
vel 0
– 10
7.6
8.0*
7.1
7.6
5.65.4
7.3*
6.5
10Pr
e-su
rvey
Post
-sur
vey
Pre-
surv
ey
Post
-sur
vey
Pre-
surv
ey
Post
-sur
vey
Pre-
surv
ey
Post
-sur
vey
* indicates statistical significance at the 95 per cent confidence level (p < 0.05)
UpRising’s theory of change
Figure 14 Having an impact on the community: changes in meanscores for participants and comparison group, pre- andpost-surveys
8
7
6
5
4
3
9
2
1
0LeadershipProgramme
Comparisongroup
I am able to make change happen in my local area
I feel I make a differenceto my local area
LeadershipProgramme
Comparisongroup
Que
stio
n A
gree
men
t le
vel 0
– 10
Pre-
surv
ey
Post
-sur
vey
6.4
7.2*
4.3 4.4
3.83.7
6.9*
5.7
10
Pre-
surv
ey
Post
-sur
vey
Pre-
surv
ey
Post
-sur
vey
Pre-
surv
ey
Post
-sur
vey
* indicates statistical significance at the 95 per cent confidence level (p < 0.05)

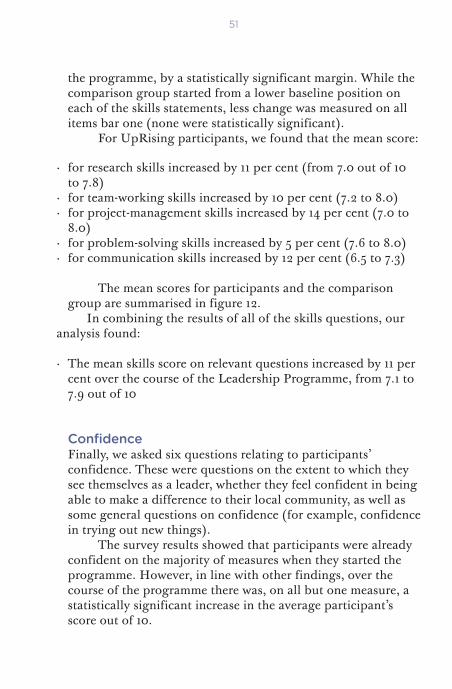
For UpRising participants, the most substantial changeswere seen on the statements about having an impact in thecommunity. We found:
· The mean score for feeling able to make change happen in thelocal area increased by 13 per cent (from 6.4 out of 10 to 7.2)
· The mean score for feeling like one makes a difference to thelocal area increased by 21 per cent (5.7 to 6.9)
No change was observed in the comparison group onthese statements, albeit from a lower baseline position. Figure14 summarises the scores.
For participants, smaller changes were observed on theother confidence statements, from higher baseline positions:
· The mean score for seeing oneself as a leader increased by 5 percent (7.3 to 7.8)
· The mean score for feeling able to do most things increased by4 per cent (8.0 to 8.3)
· The mean score for feeling confident in trying new thingsincreased by 2 per cent (8.2 to 8.4)
· The mean score for confidence in explaining ideas increased by7 per cent (7.2 to 7.7)
· The comparison group started from lower baseline positions,though we measured similar or greater changes in thecomparison group on these items.
In combining the results of all of the confidence questionsfor participants we found:
· The mean confidence score on relevant questions increased by8 per cent over the course of the Leadership Programme, from7.1 to 7.7 out of 10
55

Up
Rising
’s theory o
f change
Figure 15 Confidence questions: changes in mean scores for participants and comparison group, pre- and post-surveys
8
7
6
5
4
3
9
2
1
0
I see myself as a leader I can do most thingsif I try
I am confident abouthaving a go at thingsthat are new to me
Que
stio
n A
gree
men
t le
vel 0
– 10
LeadershipProgramme
Comparisongroup
Pre
-sur
vey
Pos
t-su
rvey
7.37.8*
5.6
6.4*
LeadershipProgramme
Comparisongroup
7.06.5
7.7*7.2
10
LeadershipProgramme
Comparisongroup
7.46.9
8.48.2
LeadershipProgramme
Comparisongroup
8.3*8.0
7.57.1
I am confidentabout explainingmy ideas clearly
Pre
-sur
vey
Pos
t-su
rvey
Pre
-sur
vey
Pos
t-su
rvey
Pre
-sur
vey
Pos
t-su
rvey
Pre
-sur
vey
Pos
t-su
rvey
Pre
-sur
vey
Pos
t-su
rvey
Pre
-sur
vey
Pos
t-su
rvey
Pre
-sur
vey
Pos
t-su
rvey
* indicates statistical significance at the 95 per cent confidence level (p < 0.05)

SummaryThe survey results contained in this chapter show that theLeadership Programme led to significant positive outcomes forparticipants’ knowledge, networks, skills and confidence,adding to the evidence of impact on these indicators from ourinterim report. On all of the measures we used to capture thesecomponents of UpRising’s theory of change, the averageparticipant’s score increased over the course of the programme.All changes in the mean score for each item were statisticallysignificant, bar one. While we have indicated that thecomparison group started from different positions on many ofthe measures, for the purposes of at-a-glance comparison,substantially less change was observed in that group over thesame time period.
57


4 Political and democraticengagement
59
The 2014/15 cohort of UpRisers participated during asignificant year for national politics, with the May 2015 general election falling towards the end of the nine-monthLeadership Programme.
Political engagement is a key theme of UpRising’sprogrammes. This is in recognition of the low level ofengagement with traditional politics among young people inthe UK, and especially so among some of UpRising’s targetgroups (for example those from a BAME background or lowersocioeconomic status – two groups which have been shown toengage less in politics on a variety of measures). Over thecourse of the Leadership Programme participants meet localMPs and civil servants to learn about politics and the policy-making process and to begin developing relationships withthose who hold power.
We included a number of questions in our pre- and post-surveys related to political and democratic engagement. Thesequestions were taken from iterations of the Hansard Society’sAudit of Political Engagement and the British Social AttitudesSurvey. To measure the outcomes below we calculated thechange in the proportions of Leadership Programmeparticipants falling into each response category before andafter taking part in the programme. We asked the samequestions of the comparison group, the results of which arealso presented below.
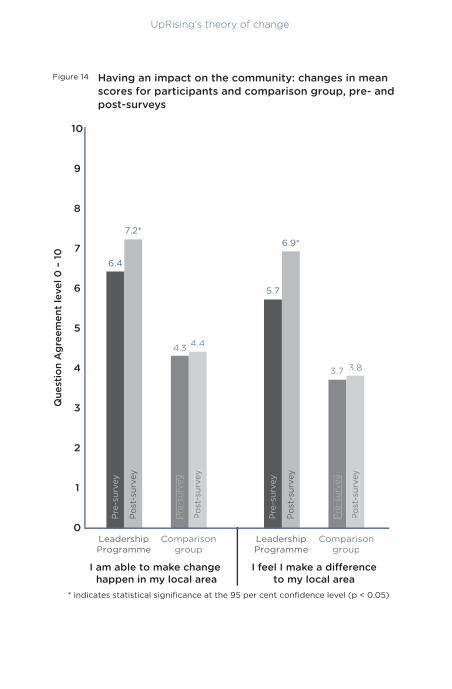
Interest in politicsOur surveys asked Leadership Programme participants howmuch interest they generally have in what is going on inpolitics. Our analysis found that over the course of the

programme interest in politics among participants increased.We found a 14 percentage point increase in the proportion of UpRising participants who said they were interested inpolitics either a ‘great deal’ or ‘quite a lot’ (from 47 per cent to 61 per cent).
By comparison, there was a 7 percentage point increaseon this measure in the comparison group, which started from asimilar baseline position (from 48 per cent to 55 per cent). Theresults are summarised in figure 16.
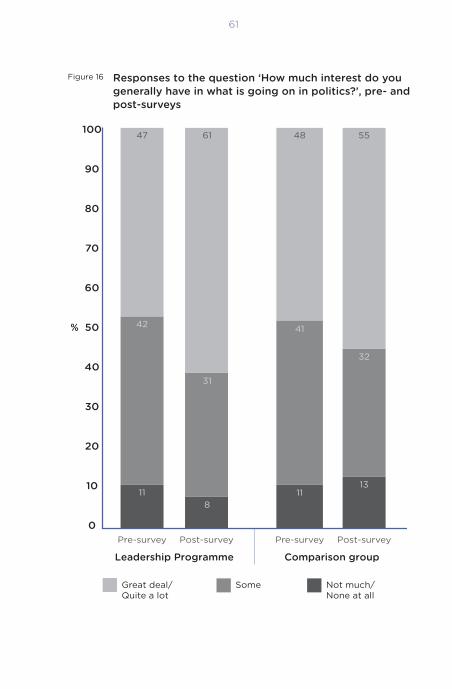
Likelihood to voteTo capture changes in democratic engagement we also askedparticipants how likely they would be to vote in an immediategeneral election.
For Leadership Programme participants, the surveyresults showed:
Political and democratic engagement
· a 27 percentage point increase in the proportion who said they were absolutely certain to vote (from 38 per cent to 64 per cent)
· a 4 percentage point decrease in the proportion who said they were absolutely certain not to vote (from 7 per cent to 2 per cent)
There was also a substantial increase in certainty to voteamong those in the comparison group, albeit smaller (20percentage points). Surprisingly, given the similar levels ofinterest in politics demonstrated above, the pre-survey foundthe comparison group more likely to say they were certain tovote at baseline than the participant group (52 per cent vs 38per cent). It is not clear what explains the discrepancy.Nonetheless, the fact that there were substantial increases incertainty to vote among those in both groups suggests thechanges may be explained by it being an election year ratherthan participation in the programme per se.
The results are summarised in figure 17.
61
Figure 16 Responses to the question ‘How much interest do yougenerally have in what is going on in politics?’, pre- andpost-surveys
80
70
60
50
40
30
90
20
10
0Pre-survey Post-survey
Leadership Programme Comparison group
Pre-survey Post-survey
%
100 47
42
11
61 48 55
32
41
31
811
13
Great deal/Quite a lot
Some Not much/None at all
Political and democratic engagement
Figure 17 Responses to the question ‘How likely would you be tovote in an immediate general election?’, pre- and post-surveys
80
70
60
50
40
30
90
20
10
0Pre-survey Post-survey
Leadership Programme Comparison groupPre-survey Post-survey
%
100
Absolutelycertain to vote
Unlikely tovote but not ruling it out
Certain notto vote
Likely tovote butnot certain
38
39
7
16
64
22
2
11
52
24
2
22
72
12
2
14

63
Figure 18 Responses to the question ‘Are you registered to vote inthe UK?’, pre- and post-surveys
100
0
60
50
40
30
20
10
Leadership Programme Comparison group
93
8082
71
%
Pre
-sur
vey
Pos
t-su
rvey
Pre
-sur
vey
Pos
t-su
rvey
90
80
70
Political and democratic engagement
Registering to voteWe wanted to know the extent to which likelihood to vote wasactually being converted into registering to vote for the May2015 election (note that the pre-survey was before the election,the post-survey afterwards).
Our surveys found an 11 percentage point increase in theproportion of Leadership Programme participants who wereregistered to vote over the course of the programme (from 71per cent to 82 per cent). There was, however, a slightly largerincrease in the comparison group – 13 percentage points (from80 per cent to 93 per cent). This result again makes it difficultto attribute the positive change in the participant group totaking part in the programme.
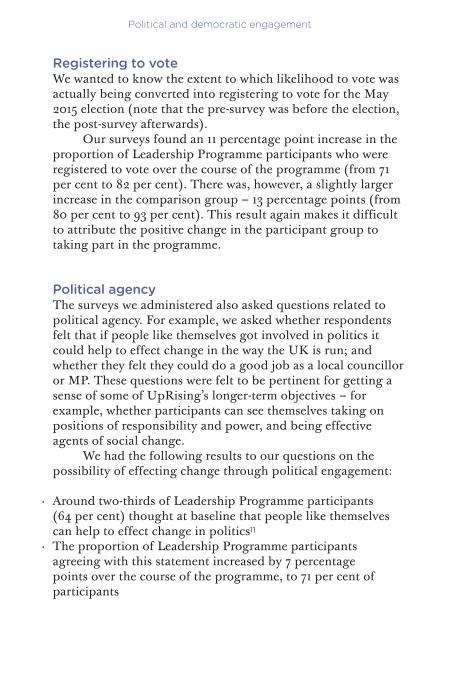
Political agencyThe surveys we administered also asked questions related topolitical agency. For example, we asked whether respondentsfelt that if people like themselves got involved in politics itcould help to effect change in the way the UK is run; andwhether they felt they could do a good job as a local councilloror MP. These questions were felt to be pertinent for getting asense of some of UpRising’s longer-term objectives – forexample, whether participants can see themselves taking onpositions of responsibility and power, and being effectiveagents of social change.
We had the following results to our questions on thepossibility of effecting change through political engagement:
· Around two-thirds of Leadership Programme participants (64 per cent) thought at baseline that people like themselvescan help to effect change in politics11
· The proportion of Leadership Programme participantsagreeing with this statement increased by 7 percentage points over the course of the programme, to 71 per cent ofparticipants

65
There was a smaller increase of 4 percentage points in the comparison group on this item, albeit from a substantiallylower baseline position (increasing from 48 per cent to 52 per cent).
The following changes were observed for participantswhen they were asked about being a councillor or MP:
· There was a 2 percentage point increase in the proportion ofparticipants who thought a person like themselves could do agood job as a local councillor (53 per cent to 55 per cent)
· There was an 11 percentage point increase in the proportion ofparticipants who thought a person like themselves could do agood job as an MP (from 46 per cent to 57 per cent)
There were similar changes in the answers given to thesequestions by the comparison group (figure 19).
The similarities between participant and comparisongroup results again make it difficult to attribute positivechanges to the Leadership Programme.
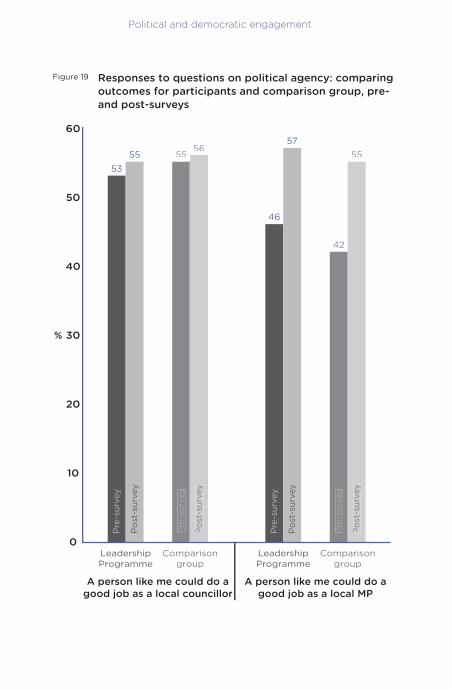
Engaging in politics via social media Social media in their various forms provide a powerfulplatform for becoming knowledgeable and engaged withpolitics. UpRising recognises the emerging importance ofsocial media platforms in reaching and motivating people whomay be interested in social change but not engaging with it viatraditional means. The organisation has therefore developed itsprogrammes to help build skills around digital story-telling andcampaigning. For example, the social action campaigns run byLeadership Programme participants often include a significantsocial media strategy.
For this reason, we included some questions in our surveyto measure how often UpRising participants are using socialmedia to raise awareness about social and political issues, aswell as their confidence in using social media for campaigning.
The survey results show that over the course of theprogramme there was an increase in the prevalence of using
Political and democratic engagement
Figure 19 Responses to questions on political agency: comparingoutcomes for participants and comparison group, pre-and post-surveys
LeadershipProgramme
Comparisongroup
LeadershipProgramme
Comparisongroup
50
40
30
20
10
0
A person like me could do agood job as a local councillor
A person like me could do agood job as a local MP
%
Pre-
surv
ey
Post
-sur
vey
Pre-
surv
ey
Post
-sur
vey
5355 55
56
Pre-
surv
ey
Post
-sur
vey
Pre-
surv
ey
Post
-sur
vey
55
42
57
46
60
67
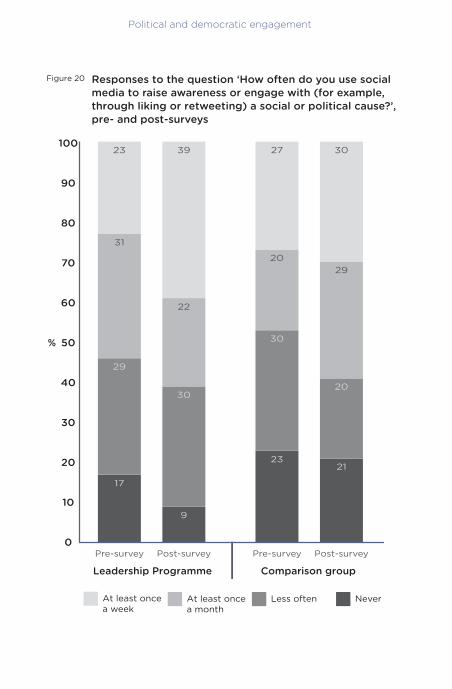
social media to promote issues and causes among LeadershipProgramme participants. For example, the proportion usingsocial media at least once a week to engage in a social orpolitical issue increased by 16 percentage points, from 23 percent to 39 per cent of participants. By comparison, there was a4 percentage point increase observed for the comparisongroup, from 27 per cent to 30 per cent. However, it is unclearwhether the change in participants’ use of social media wassimply that related to the programme, or whether it reflects anincrease in general social media use to promote causes andissues they care about.
The results are summarised in figure 20.Participants of the Leadership Programme became more
confident through the programme in using social media toorganise a campaign. Before the programme 79 per cent ofLeadership Programme participants felt confident doing so;over the course of the programme this figure increased by 12percentage points to 91 per cent.
SummaryOur surveys show an increase in political and democraticengagement among Leadership Programme participants on avariety of measures over the course of the programme. Moreparticipants reported having a significant interest in politicsafter taking part, and more reported being certain to vote andgave positive responses about whether they could help to effectpolitical change than in the pre-survey. There were also positivechanges in respondents’ use of social media to engage withsocial and political causes. However, it is unclear what theindependent impact of the programme was on these measures,particularly during an election year. There were similar changesamong the comparison group on the majority of measures.
Political and democratic engagement
Figure 20 Responses to the question ‘How often do you use socialmedia to raise awareness or engage with (for example,through liking or retweeting) a social or political cause?’,pre- and post-surveys
80
70
60
50
40
30
90
20
10
0Pre-survey Post-survey
Leadership Programme Comparison group
Pre-survey Post-survey
%
10023
31
17
39 27 30
2920
22
9
23
At least oncea week
Less often NeverAt least once a month
21
29
30
30
20
5 Community leaders:Outcomes Frameworkfor Youth Social Action
69
Social action is a core part of UpRising’s work. We found inour qualitative research with UpRisers (explored in the nextchapter) that social action is a key draw for many applicants.Over the course of the Leadership Programme participantswork in groups to plan a social action campaign, delivered atthe end of the nine months and drawing on the knowledge andskills sessions that come before.
A variety of social action projects were delivered as part ofthe 2014/15 Leadership Programme. These included:
· Minds Alrite, to increase young people’s understanding aboutmental health issues and where to seek help and advice
· Bare Necessities, to provide children from low income familieswith supplies in Tower Hamlets
· Generation of Today, to change negative perceptions of youngpeople in the local community
The Outcomes Framework for Youth Social ActionUpRising is one of the beneficiaries of the Cabinet Office’sYouth Social Action Fund, financial support made available toa range of youth organisations to promote social action andhelp evidence its impact. As part of the evaluation conditionsfor the Youth Social Action Fund, the Cabinet Office stipulatedthat we include a number of questions in our survey attachedto the Outcomes Framework for Youth Social Action.
The Outcomes Framework for Youth Social Action wasdeveloped by the Young Foundation, the Institute forVolunteering Research and others, to ‘capture the doublebenefit to both young people and their communities, which
young people create through youth social action’.12 Theframework measures outcomes related to:
Community leaders: Outcomes Framework for Youth Social Action
· empathy· problem solving· cooperation· ‘grit’· attitudes towards education· goals and aspirations· wellbeing· sense of community
This chapter covers our findings on each of the relevantOutcomes Framework measures. As advised by the CabinetOffice, for the majority of items in the list above we combinedrelevant survey results into composite measures. The findingsof each composite measure are presented in the next section.However, we were advised not to combine the results forquestions measuring wellbeing and those measuring sense ofcommunity – the findings for these are presented in separatesections below.
Unless otherwise stated, all scores related to theOutcomes Framework are given on a 0–10 scale (where 0 isequal to not at all, and 10 completely). As in chapter 3, inpresenting outcomes we foreground changes in the mean scoreon each measure before and after taking part in the LeadershipProgramme – and we include the results of the comparisongroup for rough comparison only. Further details on outcomes(including the change in the proportion of participantsanswering positively and negatively on each survey question)are available in Appendix D.
Findings: composite measuresOur survey analysis found that participants started from strongbaseline positions on the majority of composite measures in theOutcomes Framework, and we measured little to no change onmost items. Table 2 summarises our survey findings on each ofthe composite measures.
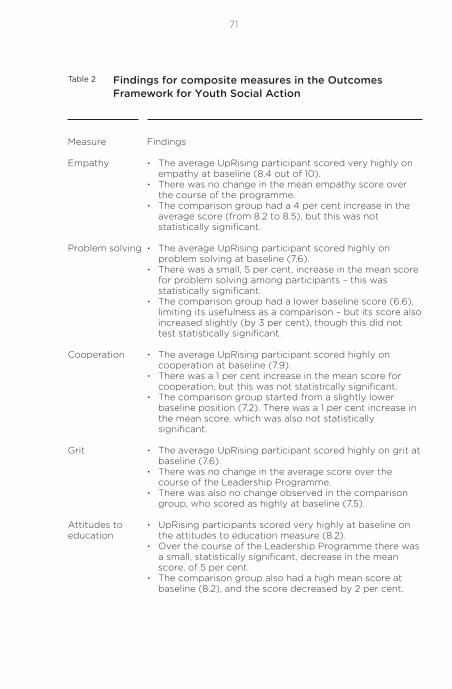
71
Table 2 Findings for composite measures in the OutcomesFramework for Youth Social Action
Measure Findings
Empathy · The average UpRising participant scored very highly onempathy at baseline (8.4 out of 10).
· There was no change in the mean empathy score overthe course of the programme.
· The comparison group had a 4 per cent increase in theaverage score (from 8.2 to 8.5), but this was notstatistically significant.
Problem solving · The average UpRising participant scored highly onproblem solving at baseline (7.6).
· There was a small, 5 per cent, increase in the mean scorefor problem solving among participants – this wasstatistically significant.
· The comparison group had a lower baseline score (6.6),limiting its usefulness as a comparison – but its score alsoincreased slightly (by 3 per cent), though this did nottest statistically significant.
Cooperation · The average UpRising participant scored highly oncooperation at baseline (7.9).
· There was a 1 per cent increase in the mean score forcooperation, but this was not statistically significant.
· The comparison group started from a slightly lowerbaseline position (7.2). There was a 1 per cent increase inthe mean score, which was also not statisticallysignificant.
Grit · The average UpRising participant scored highly on grit atbaseline (7.6).
· There was no change in the average score over thecourse of the Leadership Programme.
· There was also no change observed in the comparisongroup, who scored as highly at baseline (7.5).
Attitudes to · UpRising participants scored very highly at baseline oneducation the attitudes to education measure (8.2).
· Over the course of the Leadership Programme there wasa small, statistically significant, decrease in the meanscore, of 5 per cent.
· The comparison group also had a high mean score atbaseline (8.2), and the score decreased by 2 per cent.

WellbeingThe questions on wellbeing asked respondents about lifesatisfaction, as well as how anxious or happy they felt on theprevious day. The wellbeing measures yielded the mostsubstantial positive change of all the Outcomes Frameworkitems. In part this may be because there was more scope forchange on these measures, as the average scores on these itemswere lower at baseline.
We observed the following outcomes for participants, allof which were statistically significant:
Community leaders: Outcomes Framework for Youth Social Action
Table 2 Findings for composite measures in the OutcomesFramework for Youth Social Action – continued
Measure Findings
Goals and plans · The average UpRising participant scored very highly onthe aggregate goals or plans measure at baseline (8.3).
· There was a small, 2 per cent, increase in the mean scoreover the course of the programme, but this was notstatistically significant.
· The comparison group had a much lower baseline score(6.9), limiting its usefulness as a comparison. The group’smean score rose by 3 per cent, which was also notstatistically significant.
· a 26 per cent increase in the mean score for life satisfaction(from 5.7 to 7.2)
· a 22 per cent increase in the mean score for feeling that thingsin one’s life are worthwhile (from 6.4 to 7.8)
· a 20 per cent increase in the mean score for level of happinessyesterday (from 5.9 to 7.1)
There was also, however, an 11 per cent increase in themean score for level of anxiety yesterday (from 3.8 to 4.2) –though this was not significant.
The results of the comparison group surveys show that there was substantially less change over the survey period

73
on the first three wellbeing questions, though in contrast to the participant group there was a decrease in anxiety, albeit from a higher baseline. This is summarised in figures 21and 22.
Community engagementThe community engagement questions attached to theOutcomes Framework asked participants to report howfrequently they were undertaking certain types of activities forthe community before and after taking part in UpRising. Theseactivities were: giving unpaid help at a local club, group,organisation or place of worship; raising money for a charity;organising a petition or event to support a local or nationalissue; and helping other people or improve the localcommunity.
The most significant change was observed for participantsundertaking an activity at least once a month to help otherpeople or improve the community. The proportion ofLeadership Programme participants who had done so increasedby 29 percentage points over the course of the programme,from 30 per cent of participants having done so before takingpart in UpRising to 59 per cent of participants after. Incontrast, there was a 2 percentage point decrease in theproportion of the comparison group undertaking an activity atleast once a month to help other people or improve thecommunity, from 28 per cent of the group to 26 per cent.
It is important to note, however, that it is unclear whetherthese increases were mainly based on the social actioncampaign work participants did on the programme, rather thancommunity activity undertaken outside the programme.
Other changes observed for participants were:· a 12 percentage point increase in the proportion of participants
who said they were organising a petition or event to support alocal or national issue at least once a month, from 11 per cent to23 per cent
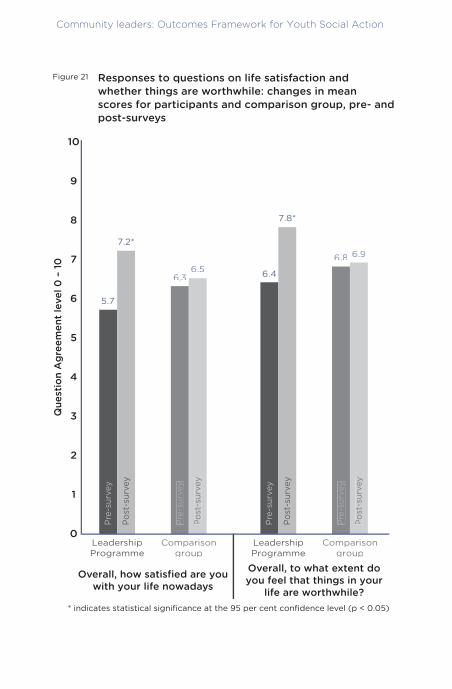
Community leaders: Outcomes Framework for Youth Social Action
Figure 21 Responses to questions on life satisfaction and whether things are worthwhile: changes in mean scores for participants and comparison group, pre- andpost-surveys
8
7
6
5
4
3
9
2
1
0LeadershipProgramme
Comparisongroup
LeadershipProgramme
Comparisongroup
Que
stio
n A
gree
men
t le
vel 0
– 10
10
Overall, how satisfied are youwith your life nowadays
Overall, to what extent doyou feel that things in your
life are worthwhile?
5.7
7.2*
6.36.5
6.96.8
7.8*
6.4
Pre-
surv
ey
Post
-sur
vey
Pre-
surv
ey
Post
-sur
vey
Pre-
surv
ey
Post
-sur
vey
Pre-
surv
ey
Post
-sur
vey
* indicates statistical significance at the 95 per cent confidence level (p < 0.05)
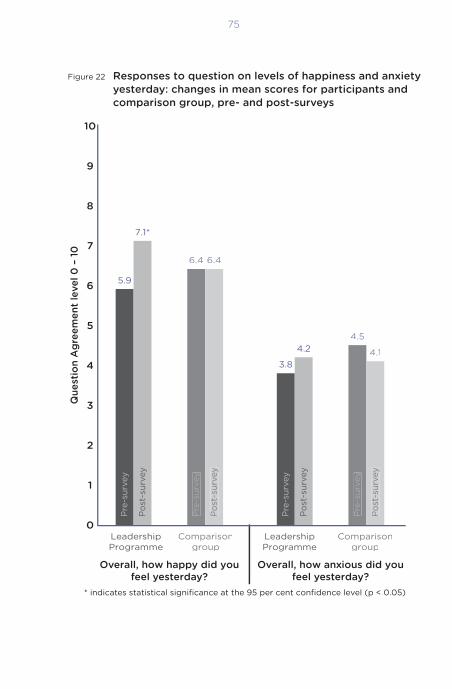
75
Figure 22 Responses to question on levels of happiness and anxietyyesterday: changes in mean scores for participants andcomparison group, pre- and post-surveys
8
7
6
5
4
3
9
2
1
0LeadershipProgramme
Comparisongroup
Overall, how happy did youfeel yesterday?
Overall, how anxious did youfeel yesterday?
LeadershipProgramme
Comparisongroup
Que
stio
n A
gree
men
t le
vel 0
– 10
5.9
7.1*
6.4 6.4
4.1
4.54.2
3.8
10Pr
e-su
rvey
Post
-sur
vey
Pre-
surv
ey
Post
-sur
vey
Pre-
surv
ey
Post
-sur
vey
Pre-
surv
ey
Post
-sur
vey
* indicates statistical significance at the 95 per cent confidence level (p < 0.05)

Community leaders: Outcomes Framework for Youth Social Action
Figure 23 The proportion of Leadership Programme participantsand comparison group who had undertaken an activityat least once a month to help other people or improvethe community, pre- and post-surveys
70
0
60
50
40
30
20
10
Leadership Programme Comparison group
2628
59
30
%
Pre
-sur
vey
Pos
t-su
rvey
Pre
-sur
vey
Pos
t-su
rvey

· a 4 percentage point increase in the proportion of participantsgiving unpaid help to a local club, group, organisation or placeof worship at least once a month, from 54 per cent ofparticipants to 58 per cent
No change was seen in the proportion of participantsraising money for charity at least once a month, with 23 percent doing so before and after the programme.
SummaryThe Outcomes Framework for Youth Social Action contains anumber of tested measures that correlate with successfulemployment outcomes. The results of our pre- and post-surveyson these items show that participants of UpRising’s LeadershipProgramme scored highly for almost all of these measures atbaseline, and little to no change was observed on the majorityof items. The most substantial positive changes were seen inrelation to participants’ wellbeing, and on certain measures ofcommunity engagement.
77


79
6 The voices of UpRisers
In order to gain a better understanding of the experience oftaking part in UpRising’s Leadership Programme, Demosconducted four focus groups with recent UpRising alumni forthis report. These were intended to supplement the findings oftwo focus groups we held with alumni for the March interimreport.
For the purposes of our evaluation, the focus groups weredesigned to help us answer the following questions:
· To what extent do participants think UpRising’s theory ofchange is valid?
· Does UpRising benefit its participants on each of thecomponents of the theory of change (knowledge, networks,skills and confidence)?
· What medium and longer-term impacts does UpRising have onparticipants?
· What improvements would participants make to theLeadership Programme?
The two focus groups in Birmingham and London for theinterim report were held with alumni from a range of cohortswho had participated since 2008. The groups captured anumber of insights on each of the questions above. Broadly,there was agreement among UpRisers that:
· the theory of change was valid· participating in the programme had improved their knowledge,
networks, skills and confidence· the programme had improved their employment prospects· participating would allow them greater scope to go on to fulfil
their leadership ambitions in future

It was clear from those two groups and conversations withUpRising staff that the structure of the UpRising programmehas changed in recent years. For this report, additional focusgroups were held with recent alumni in Birmingham andLondon, and we conducted a further two in Bedford andStoke-on-Trent. We intended to structure the discussions moreclosely around UpRising’s current curriculum and to elicitmore detailed feedback and recommendations from recentparticipants. We had planned to include only last year’sparticipants, but the focus groups also included some lessrecent alumni who provided valuable insight into how theLeadership Programme has changed.
In this chapter we briefly outline the background ofparticipants and motivations, before looking at eachprogramme component (roughly mapping their journeythrough the programme). In each section we include somerecommendations – these are from the participants themselves,not Demos.
Focus group participantsAs an ice-breaker we asked alumni to tell us what they are nowdoing, and what social action project they had been involved inwhen participating in UpRising.
The UpRising alumni in our focus groups worked in arange of occupations, including as junior managers andconsultants in business and in third sector jobs (includingyouth development programmes with similar goals toUpRising). Two participants had taken up paid positions atUpRising after graduating, and a further two continued a closerelationship in a voluntary capacity, which should be borne inmind in what follows. Other focus group members werestudying at university when the focus groups were held.
Focus group participants had undertaken a diverse rangeof social action projects when participating in UpRising. Whilemany felt they had not achieved all of their objectives, thesocial action projects were generally spoken about withenthusiasm. The projects included:
The voices of UpRisers

81
· a careers advice project, building education skills and linksbetween schools and businesses
· training young people to be interpreters for their mother andfather whose first language was not English
· a demonstration-based cookery project to encourage healthyeating in local communities
· a mobile ‘blood bank’ to boost blood donor registration· an UpRising-inspired project to help youth offenders become
informed about job opportunities available to them · campaigning for people with disabilities to become more
involved in sport locally· a social media campaign to counter negative stereotypes about
young people
Motivations for taking partParticipants in the focus groups often first heard aboutUpRising by word of mouth, or through taking part in anotherprogramme with a social action focus. Some had seenadvertisements at university. Focus group participantsdescribed a number of motivations for signing up. Themajority spoke of a desire to become more effective incampaigning on national and local issues, and to improve theirindividual leadership prospects both within and outside theirjobs.
One focus group participant from London spoke about agap between the social goals he wanted to achieve and theknowledge of how to achieve them:
I felt like there was a lot of stuff I wanted to do but I didn’t know how todo it – so a lot about understanding how power works at different levelsand things like that. I thought [UpRising] would help me achieve thethings I actually wanted to achieve.
In line with the findings of the focus groups we held for the interim report, many of the UpRisers we spoke to felt strongly about social issues and were engaged in theircommunities in a variety of ways before taking part in
The voices of UpRisers
UpRising. Many said they were most motivated by the socialaction component of the programme, as demonstrated bycomments made by two focus group members fromBirmingham:
I wanted to learn a little bit more about social action and it’s a good wayto develop yourself as well… I wanted to be more authentic about what Iwas talking about in terms of the social action and the leadership thingswere a happy bonus. [Leadership] may have taken more of a role but Iinitially started for the social action.
There was also stuff specifically around socially conscious leadership,leadership of the heart. And I always knew that was something I’d like todo, although I wasn’t quite sure what that would be in. So I think that wasthe pull for me.
A Bedford focus group member agreed:
I was public and community minded before but I didn’t have theaspiration. I was in a low level job and didn’t have the competence or theaspiration to realise I could do it.
One member of the London focus group explained that for people from under-represented backgrounds UpRising offers a unique opportunity to become involved in social action:
Loads of people I know who did it did it because they wanted to makesocial change but essentially they weren’t from the kind of backgroundwhere they were going to have access to the same people that you do inUpRising.
While learning how to undertake effective social actionwas the top priority for many in the focus groups, others weremotivated more by developing their leadership andemployability skills, and became interested in social actionthrough following the programme. Someone in theBirmingham focus group observed:

83
I didn’t know about the social action campaign before, all I knewabout was the leadership training so I just felt it would be an opportunityfor me to learn more skills and meet people from different places.
This was echoed in a comment by a member of theBedford focus group:
To me it was a lot to do with personal benefit and being able to learnthrough knowledge and skills sessions and meet people. But I wanted to dothe social action part as well.
Overview of the programme componentsDuring the focus groups we asked participants to talk usthrough their journey on the Leadership Programme, relatingtheir experiences of each programme component and reflectingon whether and how each component had benefitted them.After this discussion we asked participants to decidecollectively how beneficial each programme component was fortheir development over the course of the programme on a 0–10scale. This provided a measure of which parts of theprogramme were felt to be most and least beneficial, andenabled us to see which components were easiest and mostdifficult for participants to agree on.
Figure 24 contextualises the sections that follow, showingthe results of that exercise.
The leadership retreatThe leadership retreat is designed to introduce UpRisers tosome of the key concepts and theories of leadership. Theretreat was popular among focus group participants in thedifferent UpRising regions, with participants from each regionmarking it from 7 to 10 when reflecting on how much they feltit was of benefit (figure 24).
The leadership retreat consists of a number of talks andpractical activities. One of the focus group participantsexplained that the leadership retreat has changed in format in

The vo
ices of U
pR
isersFigure 24 The extent to which participants felt components of the Leadership Programme benefitted them (0 =
not much at all, 10 = a great deal)
Birmingham did not provide a score on social action campaign and networking.
876543 9210 10
0 = not much at all, 10 = a great deal
London Birmingham Bedford Stoke
Leadershipretreat
Knowledgesessions
Skillssessions
Mentoring
Social actioncampaign
Coaching
Networking
Peersupport
85
the last few years, and now features more practical tasks forparticipants; in discussion it was clear that these were popularand considered beneficial. Several participants reported thatundertaking these practical tasks during the retreat had beenan important first step for them in becoming more self-confident. One alumnus from Birmingham described the firsttime he had to speak in public:
I was absolutely petrified where we had a task at the beginning at theretreat which was to talk in front of the cohort and it was a presentationthat we had to deliver. I felt really challenged, really challenged myself,and I remember going up to the leaders and saying this is a big step for meand I’m not going to be able to do this. But I think there were lots of littletools and building blocks and mechanisms and that encouragement to helpyou overcome those obstacles.
Another from Stoke had similar anxieties, and talkedabout how the retreat helped as a first step in getting used to working in groups and communicating effectively with people:
I found it very difficult because that was at the start of the whole thing andI wasn’t that confident before, so meeting so many people and being mixedin to groups and having to do activities with people that I’d never metbefore… I don’t think any of us were [confident, from Stoke], not great at talking at people we hadn’t met before, but we got better and better and better.
Focus group participants said that the retreat wasinformative, and got them thinking about the complexities ofleadership. But this also led to some of their ongoing issueswith what leadership means and should be, notably, where onedraws the line between leadership for the purpose of personaladvancement and leadership for the benefit of society. OneLondon focus group member commented:
I personally felt sometimes there was a conflict between genuine socialchange and earning lots of money… I felt like the word ‘leadership’ was

almost related to this weird idea of success that to me was nothing to dowith social change.
While UpRising attempts to keep the idea of leadershipbroad, some UpRisers also reflected on what type of leadersUpRising is likely to produce, and what this means for stayingtrue to one’s background. A Bedford focus group memberobserved:
Is UpRising transformative in individuals and communities, or does itreproduce certain kinds of people from diverse backgrounds? If we enterinto positions of power as more than just ‘show cases’, will we still do it in20 and 30 years? Are we going to remember our roots and be able torepresent ourselves? Or are we going to become people who just fit in topositions of power like everyone else? Are we going to be able to change the system?
The voices of UpRisers
In a similar vein, one participant from Bedfordquestioned whether politics should be seen as the ‘pinnacle ofpower and change’ on the programme, or whether theemphasis should shift to community-based leadership. Others,for whom an interest in politics was a primary motivation fortaking part in the programme, disagreed.
Box 2 Recommendation: UpRising should create furtheropportunities for participants to work with UpRisersfrom different regionsUpRisers felt that having joint leadership retreats wasbeneficial. One participant from Birmingham spoke about the value of starting the programme with theManchester cohort:
Yeah, because there was a lot of synergy between the citiesanyway, we noticed that a lot of the problems they were facingin Manchester were like a lot of the issues we’re facing inBirmingham. We had that really good relationship and

connection because we were able to mix and there was awillingness to want to exchange ideas and creativity and talkabout their experiences.
Alumni from Birmingham felt that having this kind oflink throughout the programme would be beneficial. One said:
For me personally having that mashup and that mix was key.We have to be able to talk to people from different regions,communicating and collaborating, all in a room. It’simportant… I think we need to be careful of falling in to thetrap of just seeing leadership through the lens of your city oryour local community.
Knowledge and skills sessionsFollowing the leadership retreat participants undertake aprogramme of six knowledge and six skills sessions. These aredelivered to the entire cohort. Alongside this, participants areput into ‘social action groups’ to begin planning how they willdeliver a campaign (discussed in the next section).
As outlined in chapter 3, the knowledge sessions aredesigned to enable participants to gain a greater understandingof how power operates in the UK – covering the majorinstitutions and actors across business, politics, the publicsector and third sector – and includes visits and roundtableswith key individuals and organisations. The skills sessions aredesigned to equip participants with the skills to becomeeffective leaders and project managers, and able to run asuccessful social action campaign.
Focus group participants spoke positively about theknowledge and skills sessions, but it was clear that differentsessions appealed to different people. There were manydisagreements among participants in the focus groups as towhich were most beneficial, though they tended to agree thatthe breadth of issues covered by the knowledge sessions wasabout right, and that there was a logical order to them, goingfrom macro to micro issues.
87

The most memorable aspect of these sessions for manywas meeting leaders and gaining insight into their personaljourneys. Often these leaders were not from privilegedbackgrounds. A Stoke focus group member commented:
The voices of UpRisers
I think it’s been interesting to know what they’ve done to get where theyare and how you didn’t need to have a silver spoon in your mouth to dowhat they’re doing to get where they are.
Some participants spoke about the hints and tips in theskills sessions that helped with organisation and management,which they still use now. One focus group participant inLondon noted the importance of the practical exercises forgrowing in self-confidence:
You realise, yeah, there’s a certain level of pop psychology to it, but at theend of the day it gave confidence to a group of people that don’t haveconfidence.
Box 3 Recommendation: UpRising should build in morereflection time at the end of each knowledge sessionand each skills sessionWhile the majority of focus group participants found theknowledge and skills sessions useful, some found it difficult totake what they had learned and apply it to their social actioncampaign. Members of the Bedford, Birmingham and Londonfocus groups all considered whether there should be more timedevoted to reflecting on how the taught content applies to theircampaign, as well as their leadership journey in general.
A focus group member from London reflected on whymany of the social action campaigns did not achieve all of theirobjectives, and thought that short practical tasks at the end ofsessions would make participants more prepared to undertakethem. A London focus group member said:
I think it was not having the practice. You had all these ideasbut you didn’t know what to do with it. Whereas I feel like if

they had a practical element to each of the sessions you would bemore [prepared].
A member of the Birmingham focus group wanted moretime for reflection after each session:
I think… you need to be able to have time at the end as a cohortto discuss. I don’t think we always did that… For the sessionsthey had some good things in there, but how do I extrapolatethat? Say I wanted to start a campaign generally, how would Iuse [that session]?
This was discussed in the Birmingham focus group,where there was agreement that there should be an additionalforum for reflection on the programme at the end beforegraduation. One participant commented:
Collectively we’ve learnt a heck of a lot but this is the first timewe’ve come in to a space to actually evaluate that. That’swhat’s missing. After our social action campaign, before thegraduation, to actually come back collectively and evaluate theprogramme and how it’s benefitted us and where that fits in ourjourney.
The social action campaignThe social action campaign is a major part of the LeadershipProgramme. As stated earlier, the social action campaign is themain draw of the programme for many prospective UpRisers,and the delivery of the campaign marks its culmination.Having been put into social action groups at the leadershipretreat, participants are expected to draw on what they learnfrom the knowledge and skills sessions to plan and execute asuccessful campaign on an issue they identify in their localcommunity. The list of campaigns given at the beginning ofthis chapter provides a useful snapshot of the types of activitiesour focus group participants were involved in.
89
Focus group participants described slightly differentarrangements for the social action campaign. The social actiongroups were relatively small, consisting of between five and tenpeople. Most UpRising campaigns do not receive financialsupport from the organisation, and participants must figureout how to finance their campaign. However, in London thereis a Dragon’s Den-type competition with funding available tothe most promising and well-developed campaign proposal.This was a popular approach among participants at theLondon focus group, as the competition was felt to reflect therealities of applying for project funding and to drive up thestandard of campaign proposals. One London focus groupmember said:
The voices of UpRisers
It really reflects the real-case scenario and what happens in the world. You won’t get funding for all your projects, there’s a competitive elementthere. So there’s a lot of work that happens in those two weeks or threeweeks because everyone wants the funding because it raises the profile ofyour project.
The clearest message to emerge from the focus groups wasquite simple. Running a successful social action campaign isextremely hard – it requires perseverance and commitmentfrom everyone involved; and it needs a productive groupdynamic.
Those in our focus groups tended to feel that theircampaigns had not achieved all of their objectives. Some putthis down to not having enough time. Others started withambitious objectives and found that these had to be adapted towhat was achievable. A member of the Birmingham focusgroup, whose campaign group provided social media trainingto a local third sector organisation, said:
In terms of social action, young people passed on skills to a group thatneeded those skills. They didn’t quite know about social media and also abit of project planning about what they wanted from their centre,stakeholder mapping that we’d done in the programme. So that was a

good way to pass on what we’d learnt… We had bigger plans but it didn’tquite come off. But it was still a success and it still meant a lot to them.
The different levels of perceived success in the campaignscontributed to the spread of responses in the diagram towardsthe start of this chapter (outlining what focus group members’responses were when asked how much the campaign hadbenefitted them).
Some focus group members described some of theparticular challenges created by putting together the socialaction groups so early on in the process, and the potential forclashing personalities on the programme. One from theLondon focus group said:
[UpRisers] all come on to the programme knowing what they want tochange. They don’t want to compromise a lot of the time; they have theirspecific area of interest. How do you group those people? How do youmatch their personalities?
Failures of communication skills and commitment wereseen as key reasons for why campaigns were not as successful ashoped. London focus group members commented:
In my group we knew what we had to do but one of the reasons it fell apartwas to do with communication. Half the group just dropped off.
We didn’t really think as a group… we had some productive moments andsome really unproductive moments.
Someone in the Birmingham focus group told us:
We just had different people from different backgrounds in the group who were either too busy or weren’t committing as much as you neededthem to.
The fact that some individuals remain committed and putthe skills they have learned to use, while others do not stay
91

motivated, may explain why our pre- and post-surveys – whenlooking beyond changes in the mean – tended to show a‘strong impact’ group on measures in the Outcomes Frame-work for Youth Social Action, and equally a group where someof the relevant measures decreased (see appendices B and D).
While several focus group participants felt their projectshad not achieved the desired outcomes, they still felt there wereclear personal benefits from undertaking a campaign. OneBirmingham focus group member said:
One thing about the social action campaigns in terms of personallearning, it’s the process that you go through that you can take quite a bitout of. Even if your campaign has been a bit of a failure, you still wouldhave gone through a process to get to that point. For me, even though itwasn’t great, I got quite a bit from that process in terms of understandingwhere different people are coming from, how to effectively plan meetings,how to do it in a diplomatic way.
Another focus group participant in London felt inspiredto try to do more beyond the programme:
Now even though my social action campaign that I did last year fell apart,it’s given me inspiration to help people who come from my background.The background I’m talking about is people with autism because I haveautism myself, and what I’m going to do this year is more in the autismcommunity like form better leadership because I feel the organisations arethere but leadership is just lacking.
The voices of UpRisers
Box 4 Recommendation: UpRising should introduce newsessions where social action groups in a region meetand discuss the progress of the projectsParticipants of the London focus group felt that UpRisingcould do more to get different social action groups to supportone another. They felt that providing these opportunities couldcreate both a collaborative element – sharing advice and tips –and also a useful competitive element to keep people motivated:

There should be some of the sessions where we are in groups. Allof us discussing the progress of our individual projects there.Because I felt I didn’t know what other people were up to andwhether we could help each other beyond our group. And it alsocreates a bit of competition. If I know that everyone’s ahead I’llthink, ‘Why isn’t our group doing this?’ That aspect lacked…I’m saying it’s all the groups together, presenting to each other.So other people can see the difficulties you’ve encountered, theprogress you’ve made.
To go along with the competition aspect, we decided to startdoing something in one of the classes for my Masters which ispeer marking. Peer marking each other’s social actionprogrammes I think would be beneficial, you’re talking to eachother about potential pitfalls, why you’re not actually at thestage you should be at, why that group is at that stage, whatproblems you’re facing as a group, what the other group cangive you in terms of solutions. Talking to each other, feelingeach other’s problems out, helping each other out and maybewith a mediator there to give a bit more expertise.
Independently, a participant of the Bedford focus groupalso identified the same gap:
There wasn’t much overlap where you talked about yourcampaign with the whole group so most of the time we didn’tknow what the rest of the year were doing… Which is sillybecause you could have been utilising each other.
Coaching and mentoringUpRising participants have access to a professional coach fromthe early stages of the programme. The coaches are there tohelp UpRisers identify personal strengths and weaknesses, totalk through anxieties, and to set personal goals. Having acoach is not mandatory.
Mentors are provided in the later stages of theprogramme, and are recruited to help participants gain insight
93

into the kind of occupation they may be interested in pursuingas a career. Participants provide information about the type ofmentor they would like, and UpRising attempts to recruit asuitable mentor with that in mind.
Many people found the coaching element of the programme extremely valuable. One participant from London said:
The voices of UpRisers
I feel like that aspect is much more important than the social actioncampaign… I had this opportunity to really understand my potential andmy weaknesses, whatever I had inside that I wasn’t willing to share. Andthe effect of this is ongoing to this day.
This view was reiterated by a participant fromBirmingham who said:
I didn’t know what I was doing with myself and the coach was someonewho asked you questions about what you actually want so you have tothink about your own answers and not seek out the answers from someoneelse… We’d set goals and if I hadn’t achieved them I had to give answersfor why not and that was great for my development and my confidence inmy own ability.
Another from Bedford was surprised at the positiveimpact of having a coach, and still uses some of the techniquesthe coach taught him:
I came to it thinking it was going to be… a waste of my time. But I thoughtthat she asked fantastic questions and made me feel incredibly positiveevery time I got off the phone with her. She was really helpful in coming upwith some techniques I still use today to make sure I prioritise things thatare going to be good for my medium-term goals as well as ticking boxes forpeople at work and friends and family.
The experience of having a personal coach was notuniformly positive, however, and it was clear from thediscussions we had with participants that some ‘clicked’ withtheir coach and others did not. One participant from

Birmingham felt he and his coach simply did not connect:‘Although I respect her coaching style, I don’t think it was theright style for me.’
Others felt they had missed out because they did not havea coach. Some focus group members expressed concern thatsome people in their cohort did not have the confidence to putthemselves forward for a coach, and suggested this could be anarea for UpRising to do more. A focus group participant fromLondon thought that people with lack of confidence should beprioritised:
If it’s not for everyone then it should be for the ones that most need it: forthe ones that have confidence problems; that have problems understandingtheir potential. They might not recognise it and you need that discussion.
Because of the range of experiences with coaches by focusgroup participants, the impact scores on the benefits ofcoaching tended to fall around the mid-point (figure 24).
The impact of the mentors similarly divided people in thefocus groups. The importance of having a mentor wasemphasised by several of the ‘people in power’ we interviewedfor our interim report, who felt that these mentors had offeredcrucial guidance and support on their path to success. Some ofthe same points made in that report were reiterated byparticipants in our focus groups. Some felt they had receivedexcellent support, had gained greater understanding of therelevant sector, and had been helped with applying for jobs.Others cautioned that some mentors were selected who did nothave the time to fulfil their commitment properly, andquestioned whether high profile mentors were always the bestchoice. A Birmingham focus group member commented:
If you can get someone high profile to be a mentor that’s amazing, butmaybe that’s not always the best person… Maybe it’s someone in middlemanagement or someone who’s been doing it for a few years and is on theway to leadership, who understands that journey a bit better.
95

Box 5 Recommendation: UpRising should provide additionalhelp and guidance to some participants when matchingthem with a mentorParticipants of the London focus group suggested that peoplefrom certain backgrounds – for example from families with lowaspiration – may need more support than others when thinkingabout their future career and what type of mentor would bemost beneficial to them. One said that the process of matchingparticipants to mentors could therefore have done with somemore guidance for those individuals:
The people who got good mentors – they were really confidentand were like ‘I want this person at the top of this thing’… Thepoint is if you’re from a family where your parents didn’t work,you’re from a community where a lot of your friends’ parentsdon’t work, a lot of people at school didn’t work or whatever,you don’t have as much of an idea about what different jobs areavailable and the different routes that you might take to get towhere you want to go.
Networking and peer relationshipsThe concept of networking polarised opinion, as it did ourprevious focus groups for the interim report. Some participantsfelt networking – defined loosely as being able to meet peopleand form constructive relationships – was a vital skill for beinga successful leader, and that UpRising offers the opportunitiesfor people to grow as effective networkers who may not be ableto learn those skills from parents or other role models. Othersfound this aspect of the programme made them feel quiteartificial.
Where there was widespread agreement was in theimportance of peer relationships on the programme. While insome respects – mentioned above – relationships could bestrained by the challenges of taking part in UpRising, in largerpart the peer network of UpRisers was said to be a source ofstrength and confidence for participants. One focus groupparticipant in Birmingham put it as follows:
The voices of UpRisers

I think it’s because we all have a common thread between us all whichlinked us. I think our cohort had a strong bond and we were able tounderstand each [other’s] position and ambitions and where we weregoing and ideas, and we were able to bounce those ideas off each other,and that was what cemented that network and interaction andcollaboration between us. I think that was really useful and taking thataway really helped us individually grow and mould and shape ourthoughts about our own directions, collectively.
Box 6 Recommendation: UpRising should ensure that UpRisingalumni are used effectively across the regions fordelivering the UpRising programme to new participantsSeveral alumni stated that they want to be more involved inUpRising after taking part in the programme. One fromBedford said that they could be mentors to next year’sparticipants:
If we were to be mentors, our experience and our knowledgewould be valued. It’s about bringing us back in andmaintaining this whole empowerment with the alumni.
A participant from Stoke agreed:
Next year when it’s a new lot of people maybe we could be thecoaches. Use our experience to help them through theirprogramme. Maybe every year the people who have just finishedthe year before could be asked to be coaches for the new lot. Ormaybe just come in for a day and say their experiences andwhat we recommend them doing. Or maybe talk about socialaction campaigns and how we did ours.
UpRising is actually beginning already to offeropportunities to alumni to deliver programmes for youngerparticipants, with a Pass It On programme piloting inBirmingham this year. This programme involves UpRisingalumni delivering summer schools and workshops to 10–20-year-olds, focusing on identifying issues in the local
97
community, developing leadership skills, and running digitalsocial action campaigns.
Life beyond UpRisingAsked to consider life beyond UpRising, a Bedford focusgroup member commented:
The voices of UpRisers
UpRising made me able to look at the community and think about theactual change I could make rather than looking so far out to thingsthat you can’t really change. UpRising showed you how to do that:how to manage a project, how to network, build something.
UpRisers were on the whole very positive about theirexperiences on the programme. Several felt that it was tooearly to tell what kind of impact UpRising would have onthem in the long term, and whether ultimately it would helpthem to reach positions of leadership and influence.However, many felt it had had a significant impact in theshort term, as one Birmingham focus group member noted:
In answer to your question about the theory of change and how do webecome those leaders… and measuring the impact, I think we’re allstill figuring that out. Talking to previous cohorts and alumni, none ofus are at where we want to be. Many of us are aspiring leaders and it’shard to say whether UpRising will contribute to that in the future butwe know how it’s impacted us where we are at currently.
In line with the interim report, several participants inour focus groups reported that they emerged from theprogramme with a new-found self-confidence, and somespoke about how taking part in UpRising had directlycontributed to their employment outcomes following theprogramme. One participant from Bedford had found a jobrelated to her social action campaign:
The project that I managed with my team is now part of the work I doevery single day in my job. I get paid for that thing that I wanted to do

for free, and honestly if I hadn’t had that experience of UpRising – andthe contacts and the confidence that I did that project, and did it well andcould do it again – I don’t think I would have got that job.
A participant from Stoke reflected on her newly foundself-confidence:
It’s given us the skills, the confidence, the mindset, the knowledge to beable to use those skills in making ourselves something afterwards. I’d feel alot more confident now in a job interview. Before the idea of going to a jobinterview terrified me. I went to my first one about a week ago, my firstone in years, and I sailed through it.
Focus group participants did not refer to any social actionprojects that they were pursuing in their own time, thoughseveral were now in jobs that had an emphasis on communityengagement. One Birmingham focus group member felt thathe wanted to continue developing skills through UpRising,and put forward the idea of an alumni programme (beyondhelping to deliver the programme to the next cohort ofUpRisers).
We continued to question participants about UpRising’stheory of change, and whether participants feel theorganisation’s long-term vision is achievable. Severalparticipants considered this in light of the types of people ontheir programme and whether UpRising was recruiting thecorrect people. Reflecting on how to maximise impact in linewith UpRising’s theory of change, there were two types ofresponses from focus group participants. One focus groupmember in London, who remains affiliated with UpRising, feltthat the organisation is very good at targeting those fromunder-represented backgrounds – and specifically those whoneed help, not individuals from those backgrounds who havealready got the tools and confidence for success. She said:
It is great at creating the environment that people from more well-offbackgrounds have for people from less well-off backgrounds. And so for me,as an example, I had some of the knowledge and some of the skills, [but]
99

there was no way I was ever going to get that network unless I didUpRising.
Others thought UpRising had the right ideas aboutrecruiting young people from diverse backgrounds, but feltthat if it is going to realise its theory of change the organisationneeds to do even more to reach under-represented groups.
The voices of UpRisers

Conclusion
101
UpRising has an ambitious vision for social change. Theorganisation seeks to equip its participants – recruited fromdiverse backgrounds – with the knowledge, networks, skillsand confidence to be effective leaders and change makers insociety. As more people from under-represented backgroundsascend to positions of authority, leaders in the UK will betterrepresent the country’s growing diversity.
Our evaluation of UpRising has sought to measure theoutcomes of taking part in UpRising for participants over theshort term, and to assess the programme’s medium- andpotential longer-term impacts. This report has focused on theshort-term outcomes of taking part in UpRising,supplementing our interim report published earlier this year,which looked at the medium and longer term. For this reportwe have measured changes according to UpRising’s theory ofchange – looking at four key ‘ingredients’ of success thatUpRising attempts to develop in its participants: knowledge,networks, skills and confidence. We have also measuredchanges in UpRising participants’ political and democraticengagement around the May 2015 general election – anotherpriority for the organisation. We have looked at a range ofmeasures of interest to the Cabinet Office in the context ofyouth social action, including how participants score onwellbeing, cooperation, ‘grit’ and other measures. And thisquantitative insight has been supplemented by the qualitativefeedback on the programme from our focus group participants.
The findings presented in the preceding chapters showthat the Leadership Programme appears to have led tosignificant positive outcomes in knowledge, networks, skillsand confidence of the 2014/15 cohort. The average participantscored more positively – and by a statistically significant
margin – on all survey questions relating to having knowledge,networks, skills and confidence, with more participants scoringpositively on these measures after the programme than before.While the comparison group is very small, and differed inimportant ways from the participant group, substantially lesschange was observed in the comparison group over a similartime period.
The level of political and democratic engagement ofLeadership Programme participants also increased over thecourse of the programme. They were more interested in politicsafterwards, more likely to vote, more likely to feel they couldeffect change through being involved in politics, and morelikely to use social media to engage with social and politicalcauses. However, it is important to reiterate that it is unclear towhat extent these outcomes can be attributed to theprogramme – particularly during an election year – as therewere similar changes in the comparison group on the majorityof measures.
UpRisers are clearly a motivated group of young peopleto begin with, who come to the programme feeling confident inmany of their skills and attributes already. Participants scoredthemselves very highly at baseline on the measures we includedfrom the Outcomes Framework for Youth Social Action –empathy, cooperation skills, grit and others – leaving less roomfor improvements on these measures. Leadership Programmeparticipants made little to no improvement on the majority ofthese measures. The exceptions were for wellbeing and somemeasures of community engagement, where there weresubstantial improvements for Leadership Programmeparticipants relative to the comparison group.
The evaluation in its entirety shows a positive picture forthe impact UpRising is having in preparing its participantswith the tools for success. Feedback from UpRisers in ourfocus groups suggested that many felt they had benefitted fromtheir work with UpRising, often years after completing theprogramme. Many had taken the knowledge and skills learnedand had found jobs where they were using them successfullyand making a difference to their communities. At the same
Conclusion

time, a lot of uncertainty was expressed about the future andhow to maximise the usefulness of what one learns throughtaking part in UpRising. It will be some time until the longer-term impact of the Leadership Programme is known.
When asked how to improve the Leadership Programme,UpRisers we spoke to said they thought that the organisationmust continue to do more to recruit participants from under-represented backgrounds. In summary, they made thefollowing recommendations for programme improvements.UpRising should:
103
· create further opportunities for participants to work withUpRisers from different regions
· build in more reflection time at the end of each knowledgesession and each skills session
· introduce new sessions where social action groups in a regionmeet to discuss the progress of the projects
· provide additional help and guidance to some participantswhen matching them with a mentor
· ensure that UpRising alumni are used effectively across theregions to deliver the programme to new participants
Several of these recommendations would build onpositive steps UpRising is already taking. UpRising shouldalso continue to develop further its evaluation efforts – inparticular seeking to increase its recruitment in order to make amore robust comparison group possible. This will enable theorganisation to improve its impact measurement through bettermeans of attribution, building on the positive results from ourindependent evaluation.


105
Appendix A Characteristicsof Leadership Programmeparticipants and comparisongroup
Figures 25–30 compare the characteristics of the surveysample of Leadership Programme participants with thecomparison group.

Figure 25 The gender of participants in the Leadership Programmeand comparison group
Gender
Appendix A Characteristics of Leadership Programme
80
0
60
50
40
30
20
10
Male Female
71
66
29
34
%
Leadership Programme surveys (n = 133)
Comparison group surveys (n = 56)
70

Age10
7
Figure 26 The age of participants in the Leadership Programme and comparison group
19 20 21 22 23 24 25 >25
17 17
6
14
24
17
12
20
17 17
11
9
7
4
6
4
25
0
5
10
15
20
%
Age
Leadership Programme surveys (n = 133) Comparison group surveys (n = 56)
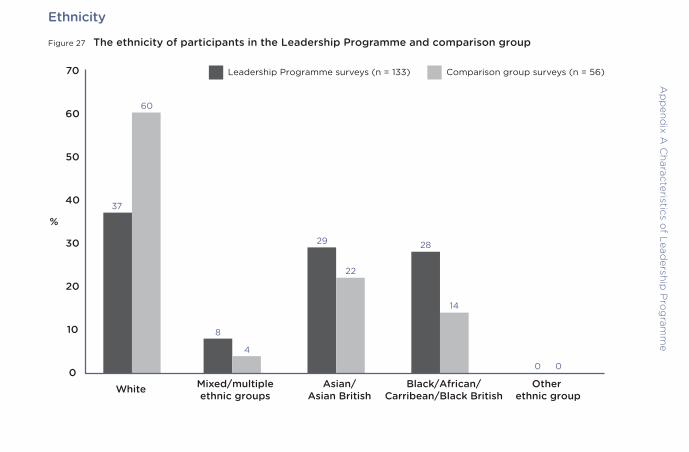
EthnicityA
pp
endix A
Characteristics o
f Leadership
Pro
gram
me
White Mixed/multipleethnic groups
Asian/Asian British
Black/African/Carribean/Black British
Other ethnic group
%
70
0
30
20
40
50
60
0
14
28
22
29
4
8
60
37
10
0
Leadership Programme surveys (n = 133) Comparison group surveys (n = 56)
Figure 27 The ethnicity of participants in the Leadership Programme and comparison group
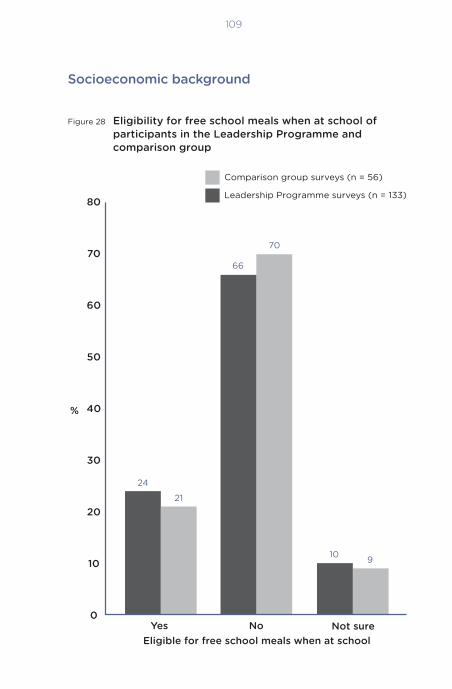
Socioeconomic background
109
%
80
0
30
20
40
50
60
10
Yes No
10
66
24
Not sureEligible for free school meals when at school
70
21
9
70
Leadership Programme surveys (n = 133)
Comparison group surveys (n = 56)
Figure 28 Eligibility for free school meals when at school ofparticipants in the Leadership Programme andcomparison group
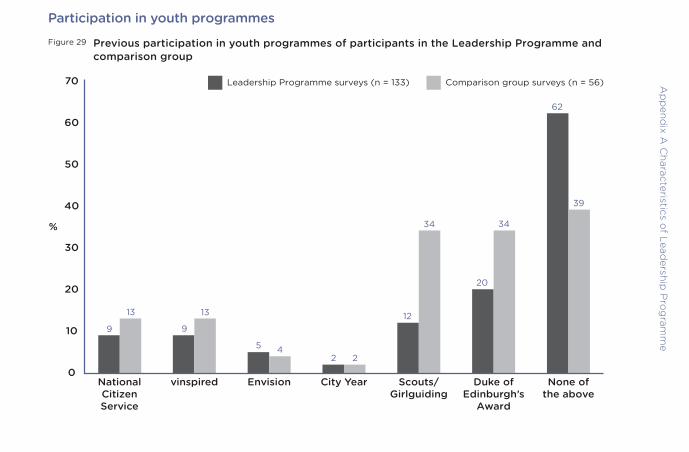
Figure 29 Previous participation in youth programmes of participants in the Leadership Programme andcomparison group
Participation in youth programmesA
pp
endix A
Characteristics o
f Leadership
Pro
gram
me
NationalCitizenService
vinspired Envision City Year Scouts/Girlguiding
Duke ofEdinburgh’s
Award
None ofthe above
%
70
0
30
20
40
50
60
10
62
20
12
25
99
Leadership Programme surveys (n = 133) Comparison group surveys (n = 56)
39
3434
24
1313
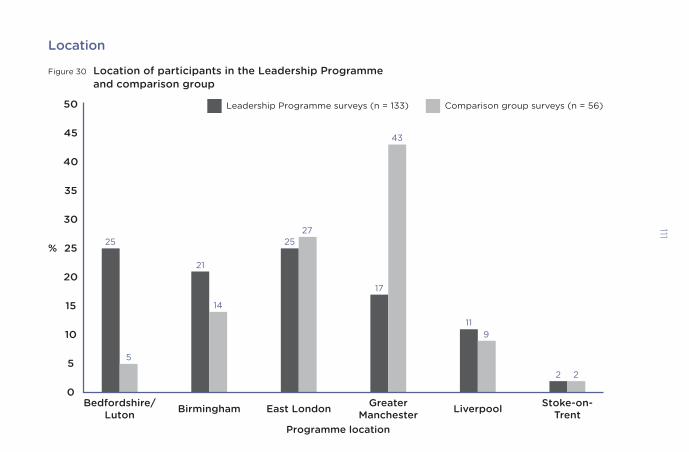
Figure 30 Location of participants in the Leadership Programmeand comparison group
Location111
Programme location
%
50
0
15
10
20
25
30
5
Bedfordshire/Luton Birmingham East London Greater
Manchester Liverpool Stoke-on-Trent
25
5
14
21
2725
2
9
2
11
43
17
35
40
45
Leadership Programme surveys (n = 133) Comparison group surveys (n = 56)

Ap
pend
ix B D
etailed o
utcom
e measures
Appendix B Detailed outcome measures forUpRising’s theory of change
Knowledge
Table 3 Detailed outcomes for knowledge survey questions
Mean scores Paired differences Impact groups Agreement before Nand after
Measure Pre- Post- Change Std Sig. (2- Change Negative No Positive Agree Agree Percen-survey survey in mean devia- tailed) in mean change change change pre- post- tage
tion (%) (%) (%) (%) survey survey point(%) (%) change
I know how Pa 5.2 6.8 1.6* 2.6 0.000 31 18 18 64 44 80 +36pp 126to influence Cb 3.9 4.1 0.2 2.3 0.475 5 38 23 40 30 32 +2pp 53decisions affecting my local area
I understand P 7.1 8.1 1.0* 1.9 0.000 14 20 20 60 82 94 +12pp 125my own C 6.1 6.5 0.4 2.6 0.240 7 35 27 38 62 69 +7pp 55strengths and weaknesses as a leader

113
Table 3 Detailed outcomes for knowledge survey questions – continued
Mean scores Paired differences Impact groups Agreement before Nand after
Measure Pre- Post- Change Std Sig. (2- Change Negative No Positive Agree Agree Percen-survey survey in mean devia- tailed) in mean change change change pre- post- tage
tion (%) (%) (%) (%) survey survey point(%) (%) change
I have a good P 7.2 8.0 0.8* 2.0 0.000 11 23 21 57 81 95 +13pp 129understanding C 6.7 7.1 0.4 2.6 0.263 6 35 17 48 74 76 +2pp 54of what life is like for people who are different to me
I understand P 6.0 7.3 1.3* 2.5 0.000 22 21 20 59 66 83 +17pp 129the key issues C 5.4 5.3 –0.1 2.4 0.778 –2 49 20 31 51 53 +2pp 55affecting my local community
Aggregate P 6.4 7.6 1.2* 1.6 0.000 19 19 6 75 66 91 +25pp 119C 5.5 5.7 0.2 1.6 0.500 4 51 6 43 49 49 0pp 49
a participant; b comparison group member* indicates statistical significance at the 95 per cent confidence level (p < 0.05)
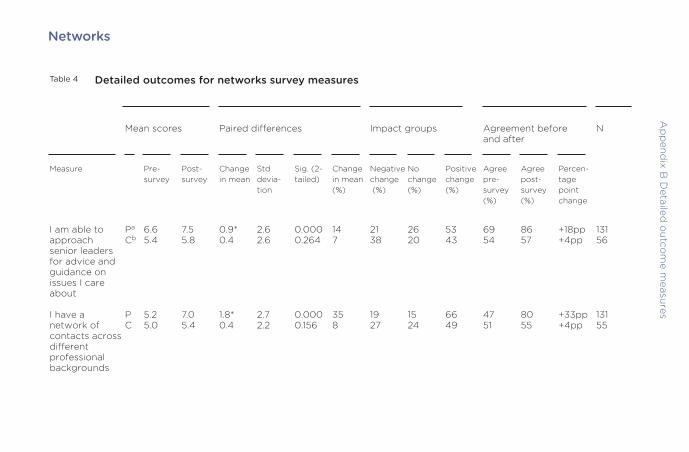
Ap
pend
ix B D
etailed o
utcom
e measures
Networks
Table 4 Detailed outcomes for networks survey measures
Mean scores Paired differences Impact groups Agreement before Nand after
Measure Pre- Post- Change Std Sig. (2- Change Negative No Positive Agree Agree Percen-survey survey in mean devia- tailed) in mean change change change pre- post- tage
tion (%) (%) (%) (%) survey survey point(%) (%) change
I am able to Pa 6.6 7.5 0.9* 2.6 0.000 14 21 26 53 69 86 +18pp 131approach Cb 5.4 5.8 0.4 2.6 0.264 7 38 20 43 54 57 +4pp 56senior leaders for advice and guidance on issues I care about
I have a P 5.2 7.0 1.8* 2.7 0.000 35 19 15 66 47 80 +33pp 131network of C 5.0 5.4 0.4 2.2 0.156 8 27 24 49 51 55 +4pp 55contacts across different professional backgrounds

115
Table 4 Detailed outcomes for networks survey measures – continued
Mean scores Paired differences Impact groups Agreement before Nand after
Measure Pre- Post- Change Std Sig. (2- Change Negative No Positive Agree Agree Percen-survey survey in mean devia- tailed) in mean change change change pre- post- tage
tion (%) (%) (%) (%) survey survey point(%) (%) change
If I see a P 4.8 6.6 1.8* 2.6 0.000 38 18 14 69 38 75 +38pp 130problem in my C 3.8 3.9 0.1 2.4 0.783 3 38 16 46 25 30 +5pp 56local area I can get other people involved in fixing it
I have a P 6.2 7.5 1.3* 2.6 0.000 21 27 15 59 60 89 +28pp 131network of C 6.1 6.1 0.0 2.7 0.961 0 38 22 40 62 67 +5pp 55peers who support my ambitions
Aggregate P 5.7 7.2 1.5* 1.9 0.000 26 19 3 78 45 82 +37pp 130C 5.1 5.3 0.2 1.7 0.417 4 41 7 52 41 35 –6pp 54
a participant; b camparison group member* indicates statistical significance at the 95 per cent confidence level (p <0.05)

SkillsA
pp
endix B
Detailed
outco
me m
easures
Table 5 Detailed outcomes for skills survey measures
Mean scores Paired differences Impact groups Agreement before Nand after
Measure Pre- Post- Change Std Sig. (2- Change Negative No Positive Agree Agree Percen-survey survey in mean devia- tailed) in mean change change change pre- post- tage
tion (%) (%) (%) (%) survey survey point(%) (%) change
I am a strong Pa 6.5 7.3 0.8* 1.9 0.000 12 16 36 48 67 80 +13pp 128public speaker Cb 5.4 5.6 0.2 1.9 0.441 4 35 18 47 55 49 –5pp 55
I consider a P 7.6 8.0 0.4* 1.5 0.002 5 23 31 45 92 95 +3pp 128range of C 7.1 7.6 0.5 2.0 0.105 7 29 27 44 80 80 0pp 55different solutions to a problem
I understand P 7.2 8.2 0.9* 1.7 0.000 13 19 25 57 84 98 +14pp 129what my main C 7.1 7.2 0.1 2.4 0.821 1 35 31 35 82 80 2pp 55skills are

117
Table 5 Detailed outcomes for skills survey measures – continued
Mean scores Paired differences Impact groups Agreement before Nand after
Measure Pre- Post- Change Std Sig. (2- Change Negative No Positive Agree Agree Percen-survey survey in mean devia- tailed) in mean change change change pre- post- tage
tion (%) (%) (%) (%) survey survey point(%) (%) change
I have the P 7.0 7.8 0.8* 2.2 0.000 11 27 22 51 80 90 +10pp 129research skills C 6.9 6.8 –0.1 3.4 0.871 –1 42 19 40 72 70 –2pp 53to find out the needs within my local area
I am able to P 7.2 8.0 0.7* 1.7 0.000 10 18 31 51 82 90 +8pp 129manage teams C 6.5 6.5 0.0 2.0 0.890 0% 33 30 37 69 59 –9pp 54of people
I know what P 7.0 8.0 1.0* 2.2 0.000 14 23 22 56 77 91 +14pp 124it takes to C 6.4 6.9 0.6 2.5 0.096 9 29 29 43 70 73 +4pp 56manage a project from start to finish
Aggregate P 7.1 7.9 0.8* 1.3 0.000 11 25 7 69 76 92 +16pp 122C 6.7 6.7 0.0 1.4 0.973 0 53 8 39 67 69 +2pp 49
a participant; b comparison group member * indicates statistical significance at the 95 per cent confidence level (p <0.05)
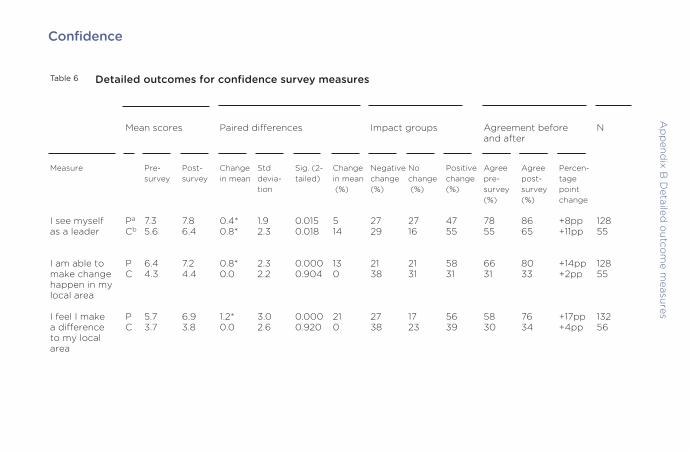
ConfidenceA
pp
endix B
Detailed
outco
me m
easures
Table 6 Detailed outcomes for confidence survey measures
Mean scores Paired differences Impact groups Agreement before Nand after
Measure Pre- Post- Change Std Sig. (2- Change Negative No Positive Agree Agree Percen-survey survey in mean devia- tailed) in mean change change change pre- post- tage
tion (%) (%) (%) (%) survey survey point(%) (%) change
I see myself Pa 7.3 7.8 0.4* 1.9 0.015 5 27 27 47 78 86 +8pp 128as a leader Cb 5.6 6.4 0.8* 2.3 0.018 14 29 16 55 55 65 +11pp 55
I am able to P 6.4 7.2 0.8* 2.3 0.000 13 21 21 58 66 80 +14pp 128make change C 4.3 4.4 0.0 2.2 0.904 0 38 31 31 31 33 +2pp 55happen in my local area
I feel I make P 5.7 6.9 1.2* 3.0 0.000 21 27 17 56 58 76 +17pp 132a difference C 3.7 3.8 0.0 2.6 0.920 0 38 23 39 30 34 +4pp 56to my local area

119
Table 6 Detailed outcomes for confidence survey measures
Mean scores Paired differences Impact groups Agreement before Nand after
Measure Pre- Post- Change Std Sig. (2- Change Negative No Positive Agree Agree Percen-survey survey in mean devia- tailed) in mean change change change pre- post- tage
tion (%) (%) (%) (%) survey survey point(%) (%) change
I can do most P 8.0 8.3 0.3* 1.6 0.046 4 29 27 44 92 93 +1pp 131things if I try C 7.1 7.5 0.3 1.8 0.194 4 26 27 47 84 85 +2pp 55
I am confident P 8.2 8.4 0.2 1.7 0.207 2 28 34 38 92 94 +2pp 133about having C 6.9 7.4 0.4 2.0 0.122 6 29 21 50 84 86 +2pp 56a go at things that are new to me
I am confident P 7.2 7.7 0.5* 1.7 0.001 7 26 27 47 85 88 +2pp 129about C 6.5 7.0 0.5 1.9 0.050 8 27 27 46 70 80 +11pp 56explaining my ideas clearly
Aggregate P 7.1 7.7 0.6* 1.3 0.000 8 30 7 62 81 89 +7pp 122C 5.7 6.1 0.3 1.3 0.066 5 43 4 54 54 61 +7pp 54
a participant; b comparison group member* indicates statistical significance at the 95 per cent confidence level (p < 005)

Appendix C Summary of the OutcomesFramework for Youth Social ActionFigure 31 Summary of Outcomes Framework for Youth Social Action
Ap
pend
ix C S
umm
ary of O
utcom
es
Cooperation
Grit
Empathy
Problem solving
I feel bad when somebody gets their feelings hurt
I try to understand what other people go through
I can work out my problems
I can do most things if I try
I know where to go for help with a problem
I am confident about having a go at things that are new to me
I often figure out different ways of doing things
I feel able to have an impact on the world around me
I can work with someone who has different opinions to me
I enjoy working together with other students my age
I am confident about explaining my ideas clearly
I am able to compromise and resolve differences of opinion
If something goes wrong I am able to bounce back and carry on
Once I have started a task, I like to finish it
I can continue to work on things despite distractions
I am a hard worker
If someone is not a success in life it's usually their own fault
Construct Outcome measure

Figure 31 Summary of Outcomes Framework for Youth Social Action
121
Wellbeing
Education and attainment
Community
Goals and aspirations
The following list contains some examples of volunteering activities. Over the last sixth months, how regularly have you participated in a volunteering opportunity, like those listed, outside school hours?*- Give unpaid help at a local club, group, organisation or place of worship- Raise money for charity- Organise a petition or event to support a local or national issue- An activity to help other people or improve the local community
I feel motivated to take action on issues in my community
Generally speaking, would you say that most people can be trusted, or that you can't be too careful in dealing with people?*
Overall, how satisfied are you with your life nowadays?
Overall, how happy did you feel yesterday?
Overall, to what extent do you feel that things in your life are worthwhile?
Overall, how anxious did you feel yesterday?
I'm not interested in doing any more learning
Studying to gain qualifications is important to me
I have goals and plans for the future
A range of different career options are open to me
*Not a 0–10 scale item
Construct Outcome measure
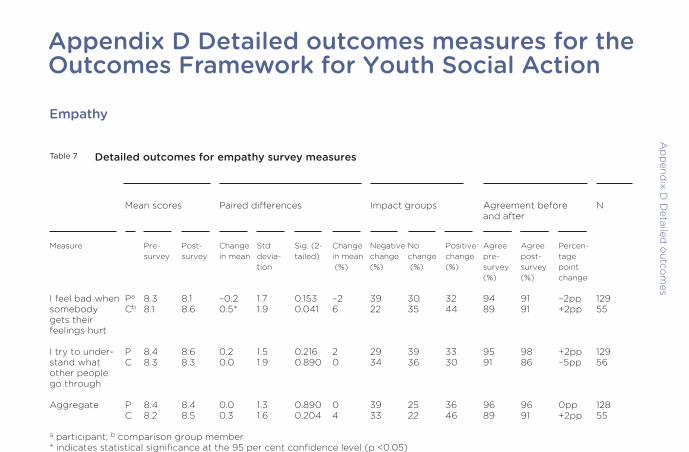
Appendix D Detailed outcomes measures for theOutcomes Framework for Youth Social Action
Empathy
Ap
pend
ix D D
etailed o
utcom
es
Table 7 Detailed outcomes for empathy survey measures
Mean scores Paired differences Impact groups Agreement before Nand after
Measure Pre- Post- Change Std Sig. (2- Change Negative No Positive Agree Agree Percen-survey survey in mean devia- tailed) in mean change change change pre- post- tage
tion (%) (%) (%) (%) survey survey point(%) (%) change
I feel bad when Pa 8.3 8.1 –0.2 1.7 0.153 –2 39 30 32 94 91 –2pp 129somebody Cb 8.1 8.6 0.5* 1.9 0.041 6 22 35 44 89 91 +2pp 55gets their feelings hurt
I try to under- P 8.4 8.6 0.2 1.5 0.216 2 29 39 33 95 98 +2pp 129 stand what C 8.3 8.3 0.0 1.9 0.890 0 34 36 30 91 86 –5pp 56other people go through
Aggregate P 8.4 8.4 0.0 1.3 0.890 0 39 25 36 96 96 0pp 128C 8.2 8.5 0.3 1.6 0.204 4 33 22 46 89 91 +2pp 55
a participant; b comparison group member* indicates statistical significance at the 95 per cent confidence level (p <0.05)

123
Table 8 Detailed outcomes for community survey
Mean scores Paired differences Impact groups Agreement before Nand after
Measure Pre- Post- Change Std Sig. (2- Change Negative No Positive Agree Agree Percen-survey survey in mean devia- tailed) in mean change change change pre- post- tage
tion (%) (%) (%) (%) survey survey point(%) (%) change
I feel motivated Pa 7.8 7.9 0.1 2.0 0.729 1 31 32 37 93 94 +1pp 131to take action Cb 5.1 5.2 0.1 2.1 0.660 2 34 14 52 45 48 +3pp 56on issues in my community
a participant; b comparison group member
Community

Problem-solvingA
pp
endix D
Detailed
outco
mes
Table 9 Detailed outcomes for problem-solving survey
Mean scores Paired differences Impact groups Agreement before Nand after
Measure Pre- Post- Change Std Sig. (2- Change Negative No Positive Agree Agree Percen-survey survey in mean devia- tailed) in mean change change change pre- post- tage
tion (%) (%) (%) (%) survey survey point(%) (%) change
I can work out Pa 7.4 7.8 0.4* 1.8 0.011 5 28 27 45 85 89 +4pp 131my problems Cb 7.0 6.9 –0.1 2.6 0.878 –1 42 18 40 76 80 +4pp 55
I can do most P 8.0 8.3 0.3* 1.6 0.046 4 29 27 44 92 93 +1pp 131things if I try C 7.1 7.5 0.3 1.8 0.194 4 26 27 47 84 85 +2pp 55
I know where P 6.6 7.4 0.8* 2.3 0.000 12 26 16 58 74 87 +12pp 129to go for help C 6.0 6.1 0.1 2.1 0.656 2 26 33 41 59 63 +4pp 54with a problem
I am confident P 8.2 8.4 0.2 1.7 0.207 2 28 34 38 92 94 +2pp 133about having C 6.9 7.4 0.4 2.0 0.122 6 29 21 50 84 86 +2pp 56a go at things that are new to me
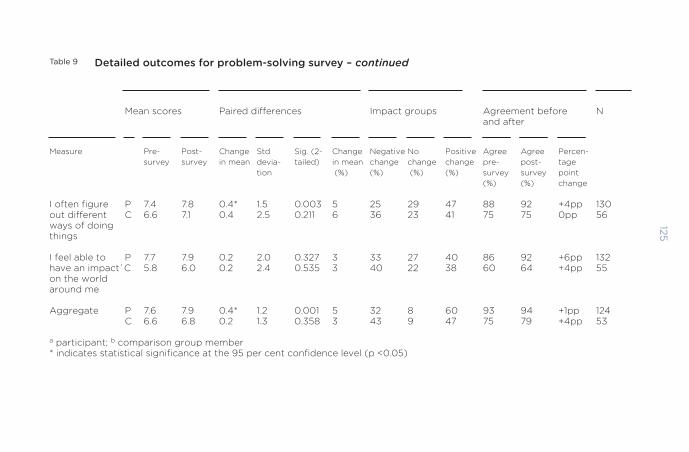
125
Table 9 Detailed outcomes for problem-solving survey – continued
Mean scores Paired differences Impact groups Agreement before Nand after
Measure Pre- Post- Change Std Sig. (2- Change Negative No Positive Agree Agree Percen-survey survey in mean devia- tailed) in mean change change change pre- post- tage
tion (%) (%) (%) (%) survey survey point(%) (%) change
I often figure P 7.4 7.8 0.4* 1.5 0.003 5 25 29 47 88 92 +4pp 130out different C 6.6 7.1 0.4 2.5 0.211 6 36 23 41 75 75 0pp 56ways of doingthings
I feel able to P 7.7 7.9 0.2 2.0 0.327 3 33 27 40 86 92 +6pp 132have an impact`C 5.8 6.0 0.2 2.4 0.535 3 40 22 38 60 64 +4pp 55on the world around me
Aggregate P 7.6 7.9 0.4* 1.2 0.001 5 32 8 60 93 94 +1pp 124C 6.6 6.8 0.2 1.3 0.358 3 43 9 47 75 79 +4pp 53
a participant; b comparison group member* indicates statistical significance at the 95 per cent confidence level (p <0.05)

CooperationA
pp
endix D
Detailed
outco
mes
Table 10 Detailed outcomes for cooperation survey questions
Mean scores Paired differences Impact groups Agreement before Nand after
Measure Pre- Post- Change Std Sig. (2- Change Negative No Positive Agree Agree Percen-survey survey in mean devia- tailed) in mean change change change pre- post- tage
tion (%) (%) (%) (%) survey survey point(%) (%) change
I can work with Pa 8.2 8.2 0.0 1.6 0.911 0 36 27 37 98 97 –1pp 129someone who Cb 7.7 7.7 0.0 1.9 1.000 0 42 24 35 87 93 +5pp 55has different opinions to me
I enjoy working P 8.3 8.0 –0.3 1.7 0.065 –4 35 40 25 95 90 –5pp 130together with C 7.0 7.1 0.1 2.3 0.866 1 36 31 33 71 75 +4pp 55other students my age
I am confident P 7.2 7.7 0.5* 1.7 0.001 7 26 27 47 85 88 +2pp 129about C 6.5 7.0 0.5 1.9 0.050 8 27 27 46 70 80 +11pp 56explaining my ideas clearly
I am able to P 8.0 8.1 0.1 1.5 0.354 1 35 29 36 96 96 0pp 128compromise C 7.6 7.5 –0.1 1.9 0.718 –1 36 35 29 85 89 +4pp 55and resolve differences of opinion
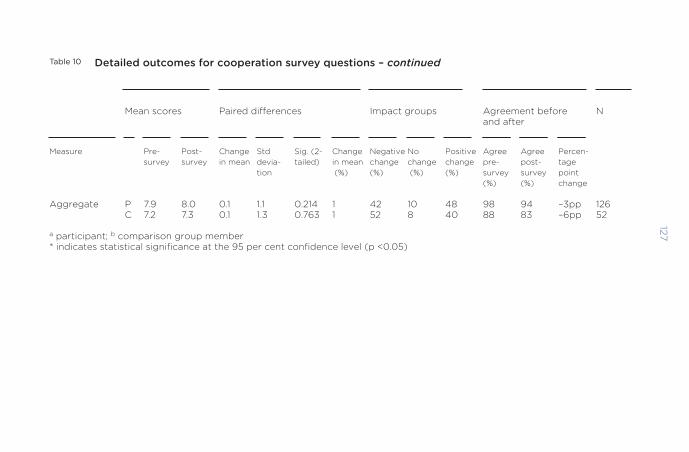
127
Table 10 Detailed outcomes for cooperation survey questions – continued
Mean scores Paired differences Impact groups Agreement before Nand after
Measure Pre- Post- Change Std Sig. (2- Change Negative No Positive Agree Agree Percen-survey survey in mean devia- tailed) in mean change change change pre- post- tage
tion (%) (%) (%) (%) survey survey point(%) (%) change
Aggregate P 7.9 8.0 0.1 1.1 0.214 1 42 10 48 98 94 –3pp 126C 7.2 7.3 0.1 1.3 0.763 1 52 8 40 88 83 –6pp 52
a participant; b comparison group member* indicates statistical significance at the 95 per cent confidence level (p <0.05)
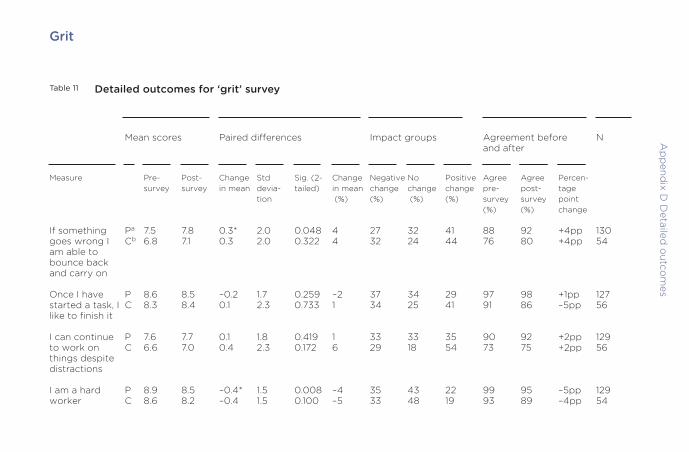
GritA
pp
endix D
Detailed
outco
mes
Table 11 Detailed outcomes for ‘grit’ survey
Mean scores Paired differences Impact groups Agreement before Nand after
Measure Pre- Post- Change Std Sig. (2- Change Negative No Positive Agree Agree Percen-survey survey in mean devia- tailed) in mean change change change pre- post- tage
tion (%) (%) (%) (%) survey survey point(%) (%) change
If something Pa 7.5 7.8 0.3* 2.0 0.048 4 27 32 41 88 92 +4pp 130goes wrong I Cb 6.8 7.1 0.3 2.0 0.322 4 32 24 44 76 80 +4pp 54 am able to bounce back and carry on
Once I have P 8.6 8.5 –0.2 1.7 0.259 –2 37 34 29 97 98 +1pp 127started a task, I C 8.3 8.4 0.1 2.3 0.733 1 34 25 41 91 86 –5pp 56like to finish it
I can continue P 7.6 7.7 0.1 1.8 0.419 1 33 33 35 90 92 +2pp 129to work on C 6.6 7.0 0.4 2.3 0.172 6 29 18 54 73 75 +2pp 56things despite distractions
I am a hard P 8.9 8.5 –0.4* 1.5 0.008 –4 35 43 22 99 95 –5pp 129worker C 8.6 8.2 –0.4 1.5 0.100 –5 33 48 19 93 89 –4pp 54
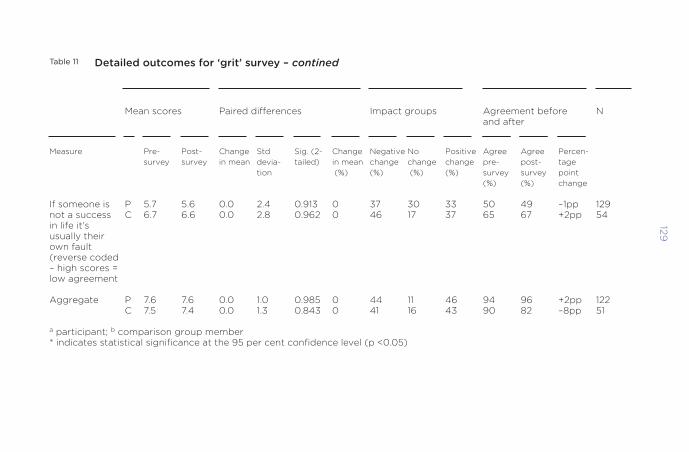
129
Table 11 Detailed outcomes for ‘grit’ survey – contined
Mean scores Paired differences Impact groups Agreement before Nand after
Measure Pre- Post- Change Std Sig. (2- Change Negative No Positive Agree Agree Percen-survey survey in mean devia- tailed) in mean change change change pre- post- tage
tion (%) (%) (%) (%) survey survey point(%) (%) change
If someone is P 5.7 5.6 0.0 2.4 0.913 0 37 30 33 50 49 –1pp 129not a success C 6.7 6.6 0.0 2.8 0.962 0 46 17 37 65 67 +2pp 54in life it’s usually their own fault (reverse coded – high scores = low agreement
Aggregate P 7.6 7.6 0.0 1.0 0.985 0 44 11 46 94 96 +2pp 122C 7.5 7.4 0.0 1.3 0.843 0 41 16 43 90 82 –8pp 51
a participant; b comparison group member* indicates statistical significance at the 95 per cent confidence level (p <0.05)

Ap
pend
ix D D
etailed o
utcom
esWellbeing
Table 12 Detailed outcomes for wellbeing survey measures
Mean scores Paired differences Impact groups Agreement before Nand after
Measure Pre- Post- Change Std Sig. (2- Change Negative No Positive Agree Agree Percen-survey survey in mean devia- tailed) in mean change change change pre- post- tage
tion (%) (%) (%) (%) survey survey point(%) (%) change
Overall, how Pa 5.7 7.2 1.5* 2.1 0.000 26 12 17 71 58 84 +26pp 133satisfied are Cb 6.3 6.5 0.1 2.4 0.646 2 22 37 41 67 70 +4pp 54you with your life nowadays
Overall, how P 5.9 7.1 1.2* 2.3 0.000 20 22 14 64 65 79 +14pp 131happy did you C 6.4 6.4 0.0 3.0 0.929 0 32 32 37 69 61 –7pp 54feel yesterday?
Overall, to P 6.4 7.8 1.4* 2.3 0.000 22 14 18 69 70 85 +15pp 131what extent do C 6.8 6.9 0.2 2.4 0.650 3 40 15 44 71 71 0pp 52you feel that things in your life are worthwhile?

131
Table 12 Detailed outcomes for wellbeing survey measures – continued
Mean scores Paired differences Impact groups Agreement before Nand after
Measure Pre- Post- Change Std Sig. (2- Change Negative No Positive Agree Agree Percen-survey survey in mean devia- tailed) in mean change change change pre- post- tage
tion (%) (%) (%) (%) survey survey point(%) (%) change
Overall, how P 3.8 4.2 0.4 3 0 098 11 35 17 48 32 35 +3pp 132anxious did C 4.5 4.1 –0.4 3.2 0.402 –9 56 6 39 43 41 –2pp 54you feel yesterday?’
a participant; b comparison group member* indicates statistical significance at the 95 per cent confidence level (p <0.05)
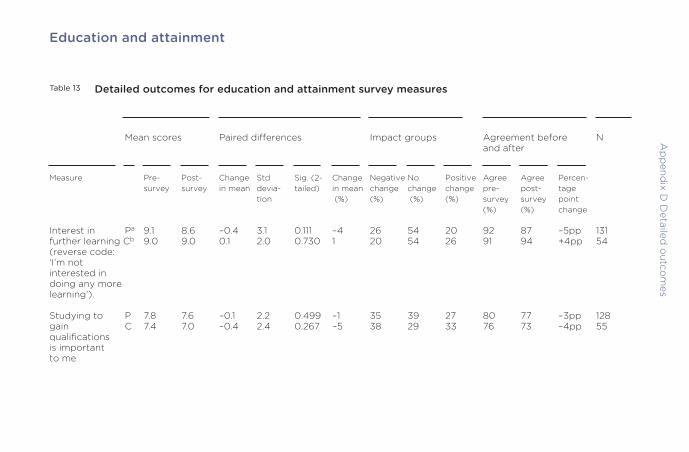
Ap
pend
ix D D
etailed o
utcom
esEducation and attainment
Table 13 Detailed outcomes for education and attainment survey measures
Mean scores Paired differences Impact groups Agreement before Nand after
Measure Pre- Post- Change Std Sig. (2- Change Negative No Positive Agree Agree Percen-survey survey in mean devia- tailed) in mean change change change pre- post- tage
tion (%) (%) (%) (%) survey survey point(%) (%) change
Interest in Pa 9.1 8.6 –0.4 3.1 0.111 –4 26 54 20 92 87 –5pp 131further learning Cb 9.0 9.0 0.1 2.0 0.730 1 20 54 26 91 94 +4pp 54(reverse code: ‘I’m not interested in doing any more learning’).
Studying to P 7.8 7.6 –0.1 2.2 0.499 –1 35 39 27 80 77 –3pp 128gain C 7.4 7.0 –0.4 2.4 0.267 –5 38 29 33 76 73 –4pp 55qualifications is importantto me
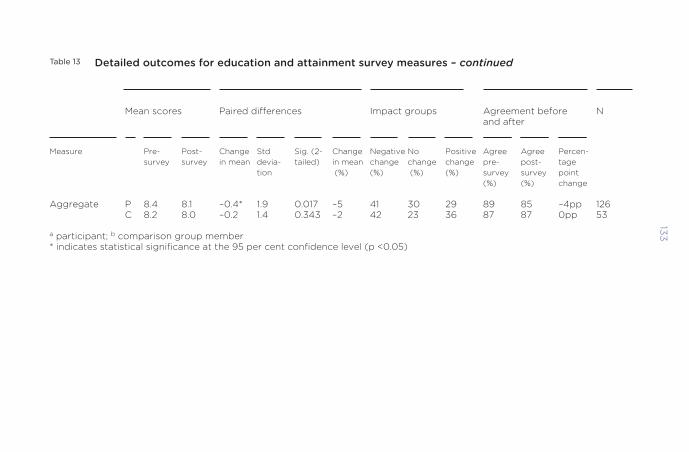
133
Table 13 Detailed outcomes for education and attainment survey measures – continued
Mean scores Paired differences Impact groups Agreement before Nand after
Measure Pre- Post- Change Std Sig. (2- Change Negative No Positive Agree Agree Percen-survey survey in mean devia- tailed) in mean change change change pre- post- tage
tion (%) (%) (%) (%) survey survey point(%) (%) change
Aggregate P 8.4 8.1 –0.4* 1.9 0.017 –5 41 30 29 89 85 –4pp 126C 8.2 8.0 –0.2 1.4 0.343 –2 42 23 36 87 87 0pp 53
a participant; b comparison group member* indicates statistical significance at the 95 per cent confidence level (p <0.05)
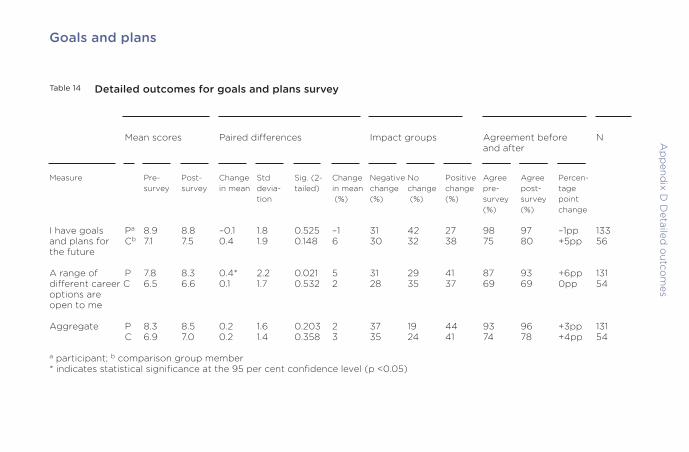
Ap
pend
ix D D
etailed o
utcom
esGoals and plans
Table 14 Detailed outcomes for goals and plans survey
Mean scores Paired differences Impact groups Agreement before Nand after
Measure Pre- Post- Change Std Sig. (2- Change Negative No Positive Agree Agree Percen-survey survey in mean devia- tailed) in mean change change change pre- post- tage
tion (%) (%) (%) (%) survey survey point(%) (%) change
I have goals Pa 8.9 8.8 –0.1 1.8 0.525 –1 31 42 27 98 97 –1pp 133and plans for Cb 7.1 7.5 0.4 1.9 0.148 6 30 32 38 75 80 +5pp 56the future
A range of P 7.8 8.3 0.4* 2.2 0.021 5 31 29 41 87 93 +6pp 131different career C 6.5 6.6 0.1 1.7 0.532 2 28 35 37 69 69 0pp 54options are open to me
Aggregate P 8.3 8.5 0.2 1.6 0.203 2 37 19 44 93 96 +3pp 131C 6.9 7.0 0.2 1.4 0.358 3 35 24 41 74 78 +4pp 54
a participant; b comparison group member* indicates statistical significance at the 95 per cent confidence level (p <0.05)
135
Notes
1 J Birdwell, L Reynolds and I Wybron, The Power of Uprising: Aninterim report, Demos, 2015, www.demos.co.uk/files/Power_of_Uprising_-_web2.pdf?1427373903 (accessed 9 Jun2016).
2 Ibid.
3 Sutton Trust, ‘The parliamentary privilege: the MPs 2015,Research Brief, May 2015, www.suttontrust.com/researcharchive/parliamentary-privilege-the-mps-2015/(accessed 9 Jun 2016).
4 UK Political Info, ‘Current female members of parliament’, nd,www.ukpolitical.info/female-members-of-parliament.htm(accessed 9 Jun 2016).
5 Commission on Social Mobility and Child Poverty, ElitistBritain, 2014, https://www.gov.uk/government/uploads/system/uploads/attachment_data/file/347915/Elitist_Britain_-_Final.pdf (accessed 9 Jun 2016).
6 Birdwell et al, The Power of Uprising.
7 Ibid.
8 The style of the logic model here is an adaptation based on thefollowing sources: S Barkman, Utilizing the Logic Model forProgram Design and Evaluation, Purdue University, 2002,www.humanserviceresearch.com/youthlifeskillsevaluation/LogicModel.pdf (accessed 9 Jun 2016), and NatCen SocialResearch, Office for Public Management and NewPhilanthropy, Evaluation of National Citizen Service: Findings fromthe evaluations of the 2012 summer and autumn NCS programmes,2013, www.natcen.ac.uk/media/205475/ncs_evaluation_report_2012_combined.pdf (accessed 9 Jun 2016).
9 The National Archives, ‘Ethnic group’, nd,http://ons.gov.uk/ons/guide-method/measuring-equality/equality/ethnic-nat-identity-religion/ethnic-group/index.html(accessed 9 Jun 2016).
10 DfE, ‘Schools, pupils and their characteristics: January 2014’,Statistical First Release, Dept for Education, 12 Jun 2014,https://www.gov.uk/government/uploads/system/uploads/attachment_data/file/410543/2014_SPC_SFR_Text_v102.pdf (accessed 9 Jun 2016).
11 This shows a considerably higher strength of feeling thanamong the general population, with 32 per cent of respondentsto Hansard’s 2014 Audit of Political Engagement agreeing. SeeHansard Society, Audit of Political Engagement 11: The 2014 reportwith a focus on the accountability and conduct of MPs, 2014,www.hansardsociety.org.uk/wp-content/uploads/2014/04/Audit-of-Political-Engagement-11-2014.pdf (accessed 9 Jun2016).
12 Young Foundation, Scoping a Quality Framework for Youth SocialAction: The campaign for youth social action, 2013,http://youngfoundation.org/wp-content/uploads/2013/08/Scoping-a-Quality-Framework-for-Youth-Social-Action-FINAL.pdf (accessed 9 Jun 2016).
Notes

References
137
Barkman S, Utilizing the Logic Model for Program Design andEvaluation, Purdue University, 2002,www.humanserviceresearch.com/youthlifeskillsevaluation/LogicModel.pdf (accessed 9 Jun 2016).
Birdwell J, Reynolds L and Wybron I, The Power of Uprising: Aninterim report, Demos, 2015, www.demos.co.uk/files/Power_of_Uprising_-_web2.pdf?1427373903 (accessed 9 Jun2016).
Commission on Social Mobility and Child Poverty, ElitistBritain, 2014, https://www.gov.uk/government/uploads/system/uploads/attachment_data/file/347915/Elitist_Britain_-_Final.pdf (accessed 9 Jun 2016).
DfE, ‘Schools, pupils and their characteristics: January 2014’,Statistical First Release, Dept for Education, 12 Jun 2014,https://www.gov.uk/government/uploads/system/uploads/attachment_data/file/410543/2014_SPC_SFR_Text_v102.pdf(accessed 9 Jun 2016).
Hansard Society, Audit of Political Engagement 11: The 2014 reportwith a focus on the accountability and conduct of MPs, 2014,www.hansardsociety.org.uk/wp-content/uploads/2014/04/Audit-of-Political-Engagement-11-2014.pdf (accessed 9 Jun2016).
NatCen Social Research, Office for Public Management andNew Philanthropy, Evaluation of National Citizen Service: Findingsfrom the evaluations of the 2012 summer and autumn NCSprogrammes, 2013, www.natcen.ac.uk/media/205475/ncs_evaluation_report_2012_combined.pdf (accessed 9 Jun2016).
National Archives, ‘Ethnic group’, nd, http://ons.gov.uk/ons/guide-method/measuring-equality/equality/ethnic-nat-identity-religion/ethnic-group/index.html (accessed 9 Jun2016).
Sutton Trust, ‘The parliamentary privilege: the MPs 2015,Research Brief, May 2015, www.suttontrust.com/researcharchive/parliamentary-privilege-the-mps-2015/(accessed 9 Jun 2016).
UK Political Info, ‘Current female members of parliament’, nd,www.ukpolitical.info/female-members-of-parliament.htm(accessed 9 Jun 2016).
Young Foundation, Scoping a Quality Framework for Youth SocialAction: The campaign for youth social action, 2013,http://youngfoundation.org/wp-content/uploads/2013/08/Scoping-a-Quality-Framework-for-Youth-Social-Action-FINAL.pdf (accessed 9 Jun 2016).
References

139
Licence to Publish
Demos – Licence to PublishThe work (as defined below) is provided under the terms of this licence (‘licence’). The work isprotected by copyright and/or other applicable law. Any use of the work other than asauthorised under this licence is prohibited. By exercising any rights to the work provided here,you accept and agree to be bound by the terms of this licence. Demos grants you the rightscontained here in consideration of your acceptance of such terms and conditions.
1 DefinitionsA ‘Collective Work’ means a work, such as a periodical issue, anthology or encyclopedia, in
which the Work in its entirety in unmodified form, along with a number of other contributions,constituting separate and independent works in themselves, are assembled into a collectivewhole. A work that constitutes a Collective Work will not be considered a Derivative Work (asdefined below) for the purposes of this Licence.
B ‘Derivative Work’ means a work based upon the Work or upon the Work and other pre-existing works, such as a musical arrangement, dramatisation, fictionalisation, motion pictureversion, sound recording, art reproduction, abridgment, condensation, or any other form inwhich the Work may be recast, transformed, or adapted, except that a work that constitutes aCollective Work or a translation from English into another language will not be considered aDerivative Work for the purpose of this Licence.
C ‘Licensor’ means the individual or entity that offers the Work under the terms of this Licence.D ‘Original Author’ means the individual or entity who created the Work.E ‘Work’ means the copyrightable work of authorship offered under the terms of this Licence.F ‘You’ means an individual or entity exercising rights under this Licence who has not previously
violated the terms of this Licence with respect to the Work, or who has received expresspermission from Demos to exercise rights under this Licence despite a previous violation.
2 Fair Use RightsNothing in this licence is intended to reduce, limit, or restrict any rights arising from fair use,first sale or other limitations on the exclusive rights of the copyright owner under copyrightlaw or other applicable laws.
3 Licence GrantSubject to the terms and conditions of this Licence, Licensor hereby grants You a worldwide,royalty-free, non-exclusive, perpetual (for the duration of the applicable copyright) licence toexercise the rights in the Work as stated below:
A to reproduce the Work, to incorporate the Work into one or more Collective Works, and toreproduce the Work as incorporated in the Collective Works;
B to distribute copies or phonorecords of, display publicly, perform publicly, and performpublicly by means of a digital audio transmission the Work including as incorporated inCollective Works; The above rights may be exercised in all media and formats whether nowknown or hereafter devised. The above rights include the right to make such modifications asare technically necessary to exercise the rights in other media and formats. All rights notexpressly granted by Licensor are hereby reserved.
4 RestrictionsThe licence granted in Section 3 above is expressly made subject to and limited by thefollowing restrictions:
A You may distribute, publicly display, publicly perform, or publicly digitally perform the Workonly under the terms of this Licence, and You must include a copy of, or the UniformResource Identifier for, this Licence with every copy or phonorecord of the Work Youdistribute, publicly display, publicly perform, or publicly digitally perform. You may not offer orimpose any terms on the Work that alter or restrict the terms of this Licence or the recipients’exercise of the rights granted here under. You may not sublicence the Work. You must keepintact all notices that refer to this Licence and to the disclaimer of warranties. You may notdistribute, publicly display, publicly perform, or publicly digitally perform the Work with anytechnological measures that control access or use of the Work in a manner inconsistent withthe terms of this Licence Agreement. The above applies to the Work as incorporated in aCollective Work, but this does not require the Collective Work apart from the Work itself tobe made subject to the terms of this Licence. If You create a Collective Work, upon noticefrom any Licensor You must, to the extent practicable, remove from the Collective Work anyreference to such Licensor or the Original Author, as requested.
B You may not exercise any of the rights granted to You in Section 3 above in any manner thatis primarily intended for or directed towards commercial advantage or private monetarycompensation. The exchange of the Work for other copyrighted works by means of digital

filesharing or otherwise shall not be considered to be intended for or directed towardscommercial advantage or private monetary compensation, provided there is no payment ofany monetary compensation in connection with the exchange of copyrighted works.
C If you distribute, publicly display, publicly perform, or publicly digitally perform the Work orany Collective Works, You must keep intact all copyright notices for the Work and give theOriginal Author credit reasonable to the medium or means You are utilising by conveying thename (or pseudonym if applicable) of the Original Author if supplied; the title of the Work ifsupplied. Such credit may be implemented in any reasonable manner; provided, however, thatin the case of a Collective Work, at a minimum such credit will appear where any othercomparable authorship credit appears and in a manner at least as prominent as such othercomparable authorship credit.
5 Representations, Warranties and DisclaimerA By offering the Work for public release under this Licence, Licensor represents and warrants
that, to the best of Licensor’s knowledge after reasonable inquiry:i Licensor has secured all rights in the Work necessary to grant the licence rights hereunder
and to permit the lawful exercise of the rights granted hereunder without You having anyobligation to pay any royalties, compulsory licence fees, residuals or any other payments;
ii The Work does not infringe the copyright, trademark, publicity rights, common law rights orany other right of any third party or constitute defamation, invasion of privacy or othertortious injury to any third party.
B except as expressly stated in this licence or otherwise agreed in writing or required byapplicable law, the work is licenced on an ‘as is’ basis, without warranties of any kind, eitherexpress or implied including, without limitation, any warranties regarding the contents oraccuracy of the work.
6 Limitation on LiabilityExcept to the extent required by applicable law, and except for damages arising from liabilityto a third party resulting from breach of the warranties in section 5, in no event will Licensorbe liable to you on any legal theory for any special, incidental, consequential, punitive orexemplary damages arising out of this licence or the use of the work, even if Licensor hasbeen advised of the possibility of such damages.
7 TerminationA This Licence and the rights granted hereunder will terminate automatically upon any breach
by You of the terms of this Licence. Individuals or entities who have received CollectiveWorks from You under this Licence, however, will not have their licences terminated providedsuch individuals or entities remain in full compliance with those licences. Sections 1, 2, 5, 6, 7,and 8 will survive any termination of this Licence.
B Subject to the above terms and conditions, the licence granted here is perpetual (for theduration of the applicable copyright in the Work). Notwithstanding the above, Licensorreserves the right to release the Work under different licence terms or to stop distributing theWork at any time; provided, however that any such election will not serve to withdraw thisLicence (or any other licence that has been, or is required to be, granted under the terms ofthis Licence), and this Licence will continue in full force and effect unless terminated as statedabove.
8 MiscellaneousA Each time You distribute or publicly digitally perform the Work or a Collective Work, Demos
offers to the recipient a licence to the Work on the same terms and conditions as the licencegranted to You under this Licence.
B If any provision of this Licence is invalid or unenforceable under applicable law, it shall notaffect the validity or enforceability of the remainder of the terms of this Licence, and withoutfurther action by the parties to this agreement, such provision shall be reformed to theminimum extent necessary to make such provision valid and enforceable.
C No term or provision of this Licence shall be deemed waived and no breach consented tounless such waiver or consent shall be in writing and signed by the party to be charged withsuch waiver or consent.
D This Licence constitutes the entire agreement between the parties with respect to the Worklicenced here. There are no understandings, agreements or representations with respect tothe Work not specified here. Licensor shall not be bound by any additional provisions thatmay appear in any communication from You. This Licence may not be modified without themutual written agreement of Demos and You.
141

header

“UpRising aims to openpathways to power fortalented young people fromdiverse backgrounds…”
EVALUATION OF UPRISING’SLEADERSHIP PROGRAMME
Ian Wybron
UpRising is a UK-wide youth leadership developmentorganisation, aiming to open pathways to power for talentedyoung people from diverse and under-representedbackgrounds.
This report marks the culmination of a year-longindependent evaluation of UpRising conducted by Demos,which began in summer 2014. The evaluation sought tomeasure the outcomes of UpRising’s flagship nine-monthLeadership Programme. This report focuses on the short-termoutcomes of the programme, measured primarily through apre- and post- survey of the 2014/15 cohort of UpRisers. Thesurvey findings are supplemented with qualitative insightsfrom four focus groups held with recent participants.
Ian Wybron is a senior researcher at Demos.
Evaluation of U
pRising’s L
eadership Programm
e|
Ian Wybron
978-1-911192-00-8 £10© Demos 2016
Evaluation cover 11/7/16 12:49 pm Page 1