evaluation of virtual planning as a tool for prosthodontic treatment · evaluation of virtual...
TRANSCRIPT

Evaluation of Virtual Planning as
a Tool for Prosthodontic Treatment
Jaafar Abduo
BDS (Otago), DClinDent (Otago), MRACDS
This thesis is presented for the degree of
Doctor of Philosophy
of The University of Western Australia
School of Anatomy, Physiology and Human Biology
School of Computer Science and Software Engineering
2015

ii
Abstract
Background: Any prosthodontic treatment should be preceded with thorough planning to
ensure its viability. In the era of digital dentistry, there has been interest to execute the
planning procedure digitally. In order to accept the digital planning, it should provide an
outcome that is, at least, similar to that produced by the conventional methods.
Objective: To compare digital planning, in the form of digital wax-up, with the outcome of
conventional wax-up in relation to precision, axial contour, occlusion and aesthetics.
Materials and Methods: A total of 25 dental arch models of 15 patients were collected. Each
set of models was duplicated twice. One set received conventional wax-up and the other was
used for the digital wax-up. The pre-treatment models and the conventional wax-up models
were converted to digital models after scanning by a micro-CT scanner. This allowed for a
direct digital comparison between all the models. In order to evaluate the impact of each
diagnostic wax-up on precision, axial contour, occlusion and aesthetics, the following digital
tools were implemented: image registration and virtual measurements.
Results: After the wax-up modifications, the dentitions were returned to a more natural
status. The conventional and digital wax-ups were similar in relation to precision, contour,
occlusion and aesthetics. At the gingival level, the digital wax-up appeared to be slightly more
accurate than the conventional wax-up. On the contrary, the accuracy of the occlusal contacts
for the digital wax-up was slightly inferior to the occlusal contacts of the conventional wax-up.
The axial contour increase was greater for the digital wax-up; however, the actual difference
was minimal. In terms of occlusal contact number and area, and lateral occlusal relationship;
the two wax-ups yielded similar outcomes. The two wax-ups had equally altered the aesthetic
value to the teeth; however, the digital wax-up appeared to have an advantage of providing
more natural and symmetrical appearance.
Conclusion: Digital wax-up appears to be very promising in planning for prosthodontic
treatment. In general the outcomes of the two wax-ups were comparable.

iii
Table of Contents
Abstract .......................................................................................................................................... ii
Table of Contents .......................................................................................................................... iii
List of Tables ................................................................................................................................. ix
List of Figures ................................................................................................................................. x
List of Abbreviations .................................................................................................................... xv
Acknowledgements ..................................................................................................................... xvi
Statement of Candidate Contribution ....................................................................................... xvii
Publications Arising from Thesis ............................................................................................... xviii
Chapter One.................................................................................................................................. 1
1. Introduction and Literature Review ...................................................................................... 1
1.1. Introduction .................................................................................................................. 2
1.2. Literature Review .......................................................................................................... 4
1.3. Prosthesis Requirements .............................................................................................. 6
1.4. The Rationale of Digital Dentistry ................................................................................. 7
1.5. Diagnostic Wax-Up ........................................................................................................ 9
1.5.1. Selecting the most suitable treatment ............................................................... 10
1.5.2. Controlling the tooth preparation ...................................................................... 11
1.5.3. Provisional restoration ........................................................................................ 13
1.5.4. Enhanced communication .................................................................................. 14
1.6. Requirements of Ideal Wax-Up ................................................................................... 15
1.6.1. Precision .............................................................................................................. 15
1.6.2. Aesthetic ............................................................................................................. 16
1.6.3. Contour ............................................................................................................... 21
1.6.4. Intercuspal occlusal contacts .............................................................................. 24
1.6.5. Lateral occlusion scheme .................................................................................... 27
1.6.6. Vertical dimension of occlusion .......................................................................... 30
1.7. Conventional Wax-Up Protocol .................................................................................. 32
1.8. Digital Wax-Up Protocol .............................................................................................. 35
1.9. Contributions of the thesis ......................................................................................... 37
Chapter Two ............................................................................................................................... 39
2. Safety of Increasing Vertical Dimension of Occlusion: A Systematic Review ..................... 39

iv
2.1 Abstract ....................................................................................................................... 40
2.2. Introduction ................................................................................................................ 41
2.3. Materials and Methods ............................................................................................... 41
2.4. Results ......................................................................................................................... 43
2.4.1. Study search ........................................................................................................ 43
2.2.1. Description of studies ......................................................................................... 43
2.2.2. Studies classification ........................................................................................... 44
2.2.3. Studies summary ................................................................................................. 45
2.3. Discussion .................................................................................................................... 50
2.3.1. Magnitude of VDO increase ................................................................................ 50
2.3.2. Adaptation period ............................................................................................... 52
2.3.3. Method of increasing VDO .................................................................................. 53
2.3.4. Occlusion scheme ............................................................................................... 54
2.4. Conclusions ................................................................................................................. 55
Chapter Three ............................................................................................................................. 56
3. Lateral Occlusion Schemes in Natural and Minimally Restored Permanent Dentition: A
Systematic Review ...................................................................................................................... 56
3.1. Abstract ....................................................................................................................... 57
3.2. Introduction ................................................................................................................ 58
3.3. Materials and Methods ............................................................................................... 59
3.3.1. Search strategy and selection criteria ................................................................. 59
3.3.2. Literature assessment ......................................................................................... 60
3.3.3. Study classification .............................................................................................. 60
3.3.4. Qualitative analysis ............................................................................................. 61
3.4. Results ......................................................................................................................... 61
3.4.1. Literature search ................................................................................................. 61
3.4.2. Description of studies ......................................................................................... 62
3.4.3. Studies outcome ................................................................................................. 63
3.5. Discussion .................................................................................................................... 73
3.5.1. Magnitude of excursion ...................................................................................... 73
3.5.2. Age effect ............................................................................................................ 74
3.5.3. Static occlusal relationship.................................................................................. 75
3.5.4. TMD relationship................................................................................................. 76
3.5.5. Further considerations ........................................................................................ 77
3.6. Conclusions ................................................................................................................. 78

v
Chapter Four ............................................................................................................................... 79
4. Impact of Lateral Occlusion Schemes: A Systematic Review .............................................. 79
4.1. Abstract ....................................................................................................................... 80
4.2. Introduction ................................................................................................................ 81
4.3. Materials and Methods ............................................................................................... 81
4.3.1. Search strategy and selection criteria ................................................................. 81
4.3.2. Studies classification ........................................................................................... 82
4.4. Results ......................................................................................................................... 83
4.4.1. Literature search ................................................................................................. 83
4.4.2. Description of studies ......................................................................................... 83
4.4.3. Studies’ outcome ................................................................................................ 84
4.5. Discussion .................................................................................................................... 95
4.5.1. Physiological implications of lateral occlusion scheme ...................................... 95
4.5.2. Long-term effect of lateral occlusion scheme .................................................... 98
4.5.3. Ideal lateral occlusion scheme .......................................................................... 100
4.6. Conclusions ............................................................................................................... 102
Chapter Five .............................................................................................................................. 103
5. Aims of the Study and Hypotheses ................................................................................... 103
5.1. Aims........................................................................................................................... 104
5.2. Hypotheses ............................................................................................................... 105
Chapter Six ................................................................................................................................ 106
6. Materials and Methods ..................................................................................................... 106
6.1. Patient Recruitments ................................................................................................ 107
6.2. Pre-Treatment Models .............................................................................................. 107
6.3. Conventional Wax-Up ............................................................................................... 109
6.4. Virtual Articulation .................................................................................................... 111
6.5. Digital Wax-Up .......................................................................................................... 111
6.6. Analysis ..................................................................................................................... 113
6.6.1. Image Registration ............................................................................................ 113
6.6.2. Virtual measurements ....................................................................................... 114
Chapter Seven .......................................................................................................................... 116
7. Precision of Digital Prosthodontic Planning for Oral Rehabilitation ................................. 116
7.1. Abstract ..................................................................................................................... 117
7.2. Introduction .............................................................................................................. 118
7.3. Materials and Methods ............................................................................................. 119

vi
7.3.1. Conventional wax-up ........................................................................................ 119
7.3.2. Digital wax-up ................................................................................................... 120
7.3.3. Analysis ............................................................................................................. 121
7.3.4. Image registration ............................................................................................. 121
7.3.5. Gingival margin measurements ........................................................................ 123
7.3.6. Statistical analysis ............................................................................................. 124
7.4. Results ....................................................................................................................... 124
7.4.1. Image Registration ............................................................................................ 124
7.4.2. Gingival Margins................................................................................................ 125
7.5. Discussion .................................................................................................................. 128
7.6. Conclusions ............................................................................................................... 131
Chapter Eight ............................................................................................................................ 132
8. Influence of Conventional and Digital Wax-Ups on Axial Tooth Contour ......................... 132
8.1. Abstract ..................................................................................................................... 133
8.2. Introduction .............................................................................................................. 134
8.3. Materials and Methods ............................................................................................. 135
8.3.1. Conventional wax-up ........................................................................................ 135
8.3.2. Digital wax-up ................................................................................................... 136
8.3.3. Analysis ............................................................................................................. 137
8.3.4. Statistical analysis ............................................................................................. 138
8.4. Results ....................................................................................................................... 138
8.4.1. Inter-arch location (maxillary vs. mandibular teeth) ........................................ 139
8.4.2. Intra-arch location (anterior vs. posterior) ....................................................... 139
8.4.3. Tooth location (mid-tooth vs. line angle) .......................................................... 141
8.5. Discussion .................................................................................................................. 144
8.6. Conclusions ............................................................................................................... 146
Chapter Nine ............................................................................................................................. 147
9. Effect of Prosthodontic Planning on Intercuspal Occlusal Contacts: Comparison of Digital
and Conventional Planning ....................................................................................................... 147
9.1. Abstract ..................................................................................................................... 148
9.2. Introduction .............................................................................................................. 149
9.3. Materials and Methods ............................................................................................. 150
9.3.1. Conventional wax-up ........................................................................................ 150
9.3.2. Digital wax-up ................................................................................................... 151
9.3.3. Analysis ............................................................................................................. 152

vii
9.3.4. Statistical analysis ............................................................................................. 154
9.4. Results ....................................................................................................................... 155
9.4.1. Contact number ................................................................................................ 155
9.4.2. Contact area ...................................................................................................... 156
9.4.3. Contact accuracy ............................................................................................... 157
9.5. Discussion .................................................................................................................. 158
9.6. Conclusions ............................................................................................................... 162
Chapter Ten .............................................................................................................................. 163
10. Effect of Prosthodontic Planning on Lateral Occlusion Scheme: A Comparison between
Conventional and Digital Planning ............................................................................................ 163
10.1. Abstract ................................................................................................................. 164
10.2. Introduction .......................................................................................................... 165
10.3. Materials and Methods ......................................................................................... 166
10.3.1. Conventional wax-up ........................................................................................ 167
10.3.2. Digital wax-up ................................................................................................... 168
10.3.3. Virtual simulation of lateral movement ............................................................ 168
10.3.4. Analysis ............................................................................................................. 169
10.4. Results ................................................................................................................... 170
10.4.1. Prevalence of lateral occlusion scheme ............................................................ 170
10.4.2. Number of contacting teeth ............................................................................. 171
10.4.3. Percentage of each contacting tooth ................................................................ 173
10.5. Discussion .............................................................................................................. 176
10.6. Conclusions ........................................................................................................... 180
Chapter Eleven ......................................................................................................................... 181
11. Impact of Prosthodontic Planning on Dental Aesthetics: An Objective Evaluation of
Aesthetic Parameters ................................................................................................................ 181
11.1. Abstract ................................................................................................................. 182
11.2. Introduction .......................................................................................................... 183
11.3. Materials and Methods ......................................................................................... 184
11.3.1. Conventional wax-up ........................................................................................ 184
11.3.2. Digital wax-up ................................................................................................... 185
11.3.3. Analysis ............................................................................................................. 186
11.3.4. Statistics ............................................................................................................ 188
11.4. Results ................................................................................................................... 189
11.4.1. Perceived frontal proportion ............................................................................ 189
11.4.2. Actual dimensions ............................................................................................. 189

viii
11.4.3. Perceived symmetry ......................................................................................... 190
11.4.4. Actual symmetry ............................................................................................... 191
11.5. Discussion .............................................................................................................. 193
11.6. Conclusions ........................................................................................................... 197
Chapter Twelve ......................................................................................................................... 198
12. General Discussion and Conclusions ............................................................................. 198
12.1. Research Methodology ......................................................................................... 199
12.2. Tooth Surface Alteration ....................................................................................... 200
12.2.1. Axial surface ...................................................................................................... 200
12.2.2. Occlusal Surface ................................................................................................ 203
12.3. Accuracy ................................................................................................................ 208
12.3.1. Gingival accuracy............................................................................................... 208
12.3.2. Occlusion accuracy ............................................................................................ 209
12.3.3. Digital processing precision .............................................................................. 209
12.4. Future Research .................................................................................................... 216
12.5. Conclusions ........................................................................................................... 218
References ................................................................................................................................ 219
Appendix ................................................................................................................................... 237
Appendix A ............................................................................................................................ 238
Appendix B ............................................................................................................................ 240
Appendix C ............................................................................................................................ 249
Appendix D ............................................................................................................................ 261
Appendix E ............................................................................................................................ 276
Appendix F ............................................................................................................................ 288
Appendix G ............................................................................................................................ 297
Appendix H ............................................................................................................................ 304
Appendix I ............................................................................................................................. 319
Appendix J ............................................................................................................................. 329
Appendix K ............................................................................................................................ 337
Appendix L ............................................................................................................................. 347
Appendix M ........................................................................................................................... 355

ix
List of Tables
Table 1—1 Determinants of crown preparation ........................................................................................ 12
Table 2—1 Selection criteria used in the review ........................................................................................ 42
Table 2—2 Summary of studies increasing the VDO by removable method and partial arch coverage ... 47
Table 2—3 Summary of studies increasing the VDO by removable method and complete arch coverage
........................................................................................................................................................... 48
Table 2—4 Summary of studies increasing the VDO by fixed method and partial arch coverage ............. 48
Table 2—5 Summary of studies increasing the VDO by fixed method and complete arch coverage ........ 49
Table 3—1 Summary of the included studies ............................................................................................ 69
Table 3—2 Summary of the studies that included static occlusal relationship ......................................... 72
Table 4—1 Inclusion criteria....................................................................................................................... 82
Table 4—2 Implications of lateral occlusion scheme on muscle EMG activity .......................................... 89
Table 4—3 Implications of lateral occlusion scheme on mandibular movement ...................................... 91
Table 4—4 Summary of studies that established the lateral occlusion scheme by composite restorations
........................................................................................................................................................... 92
Table 4—5 Summary of studies that established the lateral occlusion scheme by fixed dental and
implant prostheses ............................................................................................................................ 93
Table 6—1 Selection criteria .................................................................................................................... 107
Table 8—1 The mean and standard deviation (SD) for the maxillary and mandibular teeth after each
diagnostic wax-up ............................................................................................................................ 139
Table 8—2 The mean and standard deviation (SD) for the anterior and posterior teeth after each
diagnostic wax-up ............................................................................................................................ 140
Table 8—3 The mean and standard deviation (SD) for the maxillary anterior and posterior teeth, and
mandibular anterior and posterior teeth ........................................................................................ 140
Table 9—1 CNT mean and standard deviation (SD) for the pre-treatment, conventional wax-up and
digital wax-up casts ......................................................................................................................... 155
Table 9—2 CAT mean and standard deviation (SD) for the pre-treatment, conventional wax-up and
digital wax-up casts ......................................................................................................................... 156
Table 9—3 Contact accuracy mean and standard deviation (SD) for the pre-treatment, conventional
wax-up and digital wax-up casts...................................................................................................... 158
Table 10—1 Inclusion criteria................................................................................................................... 166

x
List of Figures
Figure 1-1 Examples of dental conditions that indicate fixed prosthodontic treatment. (A) Teeth
discoloration, (B) deficient dental morphology, (C) failed and unaesthetic restorations, and (D)
worn dentition. .................................................................................................................................... 4
Figure 1-2 Clinical images illustrating the amount of tooth preparation required for prosthodontic
treatment. (A) Pre-treatment situation, and (B) prepared dentition. ................................................. 7
Figure 1-3 Diagnostic wax-up was used to alter the teeth with composite restorative material. (A) Pre-
treatment presentation. (B) Diagnostic wax-up. (D) The modified dentition by composite
restorative material. The new contours can subsequently control the tooth preparation. ............. 11
Figure 1-4 Comparison between the traditional crown preparation and restorative-driven crown
preparation. (A) The initial tooth situation. (B) The crown preparation can be executed according
the initial tooth surface. (C) Alternatively, a diagnostic wax-up can be established on a dental
model. (D) On the diagnostic wax-up model, a silicone index is fabricated. (E) This silicone index is
used intra-orally to dictate the tooth preparation, which might be more conservative. (F)
Eventually, the final tooth preparation and crown design is objectively determined according to the
wax-up. .............................................................................................................................................. 13
Figure 1-5 An example of the usefulness of the diagnostic wax-up in fabrication of provisional
restorations. (A) A pre-treatment situation. (B) The diagnostic wax-up planned to improve the
overall dental condition. (C) According to the diagnostic wax-up, provisional restorations were
fabricated and inserted. In this situation, the provisional restorations restored patient comfort,
aesthetic and function. In addition, they allow the patient the critique the anticipated treatment.
(D) definitive prostheses were fabricted according to the approved provisional restorations. ....... 14
Figure 1-6 From the wax-up, silicone indices can be produced (A, B) and used by the manufacturing
technician to control the final prostheses contour (C). ..................................................................... 15
Figure 1-7 An example of aesthetic improvement by the diagnostic wax-up. (A) Pre-treatment models.
(B) Wax-up models. ........................................................................................................................... 17
Figure 1-8 Frontal image that illustrates the PFP. As the tooth moves distally, it is perceived to be
smaller. .............................................................................................................................................. 18
Figure 1-9 An example of a compromised clinical presentation that requires gingival tissues restoration.
(A) A diagnostic wax-up that incorporates gingival tissues. (B) Definitive prosthesis with pink
porcelain that replaces the missing gingival tissues was constructed according to the wax-up. ..... 20
Figure 1-10 (A) A straight profile in the gingival third facilitates establishing a properly contoured
prosthesis. (B) Widening the profile gingivally is associated with over-contoured prostheses. ....... 22
Figure 1-11 (A) Frontal and occlusal views of pre-treatment anterior teeth that clearly shows deficient
tooth morphology. (B) Similar views after the wax-up indicate establishment of natural
morphology. ...................................................................................................................................... 33

xi
Figure 1-12 (A) Prior to the treatment, the teeth can be worn, fractured or heavily restored. (B) the wax-
up establishes natural occlusal anatomy such as cusps, grooves and fossae. .................................. 34
Figure 1-13 (A) The adjacent teeth should exhibit similar axial contour. (B) In situations where a tooth
deviate from the contour of the adjacent teeth, there might be aesthetic, functional and hygienic
implications. ...................................................................................................................................... 35
Figure 1-14 Examples of average virtual teeth that can be used in digital designing of the dentition. ..... 36
Figure 2-1 (A) A dentition that suffers from tooth wear. (B) As a result, the teeth are short and in edge-
to-edge relationship. (C) The definitive prostheses involved 3 mm increase of the VDO. Increasing
the VDO allowed for significant aesthetic improvement, correction of anterior tooth relationship,
establishment of a natural overjet and overbite, and lengthening the anterior teeth. .................... 50
Figure 2-2 The impact of tooth wear on the anterior tooth relationship. (A) Natural relationship of
anterior teeth with intact crowns. (B) Tooth wear resulting in the development of a class III (edge-
to-edge) incisal relationship. (C) Increasing the VDO allowed for restoring an adequate anterior
tooth relationship. ............................................................................................................................. 51
Figure 3-1 The relationship between the prevalence of each lateral occlusion scheme and age after
complete excursion (A) and partial excursion (B). The lines represent the age range of each study.
........................................................................................................................................................... 65
Figure 3-2 The relationship between the prevalence of each lateral occlusion scheme and age for Class I
occlusion. ........................................................................................................................................... 66
Figure 3-3 The relationship between the prevalence of each lateral occlusion scheme and age for Class II
occlusion. ........................................................................................................................................... 67
Figure 3-4 The relationship between the prevalence of each lateral occlusion scheme and age for Class III
occlusion. ........................................................................................................................................... 68
Figure 6-1 STL image construction from DICOM images. (A) An example of single slice DICOM image. (B)
The process of STL image construction ........................................................................................... 108
Figure 6-2 (A) Actual pre-treatment maxillary and mandibular casts. (B) Virtual pre-treatment models.
......................................................................................................................................................... 108
Figure 6-3 The micro-CT scanner validation process. (A) A maxillary model scanned by the laser scanner.
(B) The same model after scanning by the micro-CT scanner. (B) A colour-coded map generated
after registering the two STL images, which confirms the similarity between the two images...... 109
Figure 6-4 Examples of conventional wax-up. (A) Pre-treatment situation illustrating irregular and
rotated teeth. (B) Wax-up of the two central incisors. (C) Pre-treatment situation of generalized
tooth wear. (D) Wax-up of the whole maxillary teeth. ................................................................... 110
Figure 6-5 (A) Completed conventional wax-up model. (B) Virtual conventional wax-up model. ........... 110
Figure 6-6 (A) The articulation process. The maxillary and mandibular virtual models before articulation.
(B) The virtual silicone registration indices that can fit on the buccal aspects of articulated models.
(C) The maxillary and mandibular models were repositioned according to the silicone indices by the
process of image registration. (D) The articulated maxillary and mandibular models after the
removal of silicone indices. ............................................................................................................. 111

xii
Figure 6-7 Examples of the available virtual teeth. As the anterior maxillary teeth are key teeth in
obtaining ideal aesthetics, many teeth shapes are available for clinician use. ............................... 112
Figure 6-8 Series of images that illustrate the digital teeth fitting. (A) Pre-treatment model. (B)
Commencement of the digital wax-up. (C) Completed digital wax-up of the anterior maxillary teeth.
......................................................................................................................................................... 112
Figure 6-9 An example of the process of image registration. (A) A pre-treatment model. (B) The model
after the dental modifications. (C) The models were superimposed by the process of image
registration. As the soft tissues were not altered, they were used as a reference to control the
registration process. (D) Colour-coded map can be implemented to quantify the differences
between the two models. ............................................................................................................... 114
Figure 6-10 Images illustrating the use of the software for virtual measurements. (A) The virtual ruler
can be implemented to measure the distance between the different coordinates that represent
tooth dimension. (B) An example of occlusal area quantification. ................................................. 114
Figure 7-1 Conventional wax-up: (A) Pre-treatment models. (B) Conventional wax-up models. (C)
Scanned conventional wax-up models. ........................................................................................... 120
Figure 7-2 Digital wax-up. (A) Scanned pre-treatment models. (B) Scanned physiological teeth. (C) Digital
wax-up models. ............................................................................................................................... 121
Figure 7-3 The segmentation process that yielded soft tissue model and tooth-gingiva junction model.
(A) Original model. (B) Selected soft tissue. (C) Selected tooth-gingiva junction. (D) Final soft tissue
model. (E) Final junction model....................................................................................................... 123
Figure 7-4 Example of locating the points of measurement around the gingival margin of a lateral incisor.
The black point is located on the mid-tooth area and the red points are on the proximal areas... 124
Figure 7-5 Colour-coded maps of each diagnostic wax-up after fitting on the pre-treatment model. (A)
Conventional wax-up. (B) Magnified section of conventional wax-up. (C) Digital wax-up. (C)
Magnified section of digital wax-up. ............................................................................................... 125
Figure 7-6 The box plot diagrams of the gingival margins for each tooth category. (A) Mid-tooth area of
the maxillary teeth. (B) Proximal area of the maxillary teeth. (C) Mid-tooth area of the mandibular
teeth. (D) Proximal area of the mandibular teeth. .......................................................................... 128
Figure 8-1 Conventional wax-up procedure: (A) Pre-treatment models. (B) Conventional wax-up models.
(C) Scanned conventional wax-up models....................................................................................... 136
Figure 8-2 Digital wax-up procedure: (A) Scanned pre-treatment models. (B) Scanned physiological
teeth. (C) Digital wax-up models. .................................................................................................... 137
Figure 8-3 (A) An image illustrating the extracted three labial planes. (B) A magnified image outlining the
five vertical measurements on each plane. (C) A cross sectional view of an extracted plane on the
pre-treatment model (black line) and the corresponding plane on the post-treatment model (red
line). ................................................................................................................................................. 138
Figure 8-4 Bar diagrams illustrating the contour alteration of each tooth category after each wax-up: C =
conventional wax-up and D = digital wax-up. (A) Maxillary mid-tooth region. (B) Maxillary line angle
region. (C) Mandibular mid-tooth region. (D) Mandibular line angle region. ................................. 143

xiii
Figure 9-1 Example of the virtual pre-treatment (A), conventional wax-up (B) and digital wax-up (C)
casts. ................................................................................................................................................ 152
Figure 9-2 Colour-coded map illustrating the contact number and contact area for the pre-treatment (A),
conventional wax-up (B) and digital wax-up (C) casts. The calculation of the CNT and CAT will
compensate the increase of the number of teeth after the wax-ups. ............................................ 153
Figure 9-3 Determination of the contact number and area according to the colour-coded map. The
number of occlusal contacts was established by counting the areas coloured with yellow or a
warmer colour. The same areas were extracted and measured to quantify the occlusal area. ..... 153
Figure 9-4 Measurement of the occlusal discrepancies. If the contact surfaces are overlapping the (A),
the maximal distance is measured which indicates a positive error (occlusal interferences). In a
situation where the surfaces are not contacting (B), the minimal distance between the surfaces are
measured and reflect a negative error (non-contacting surfaces). ................................................. 154
Figure 9-5 Box plot diagram of the CNT values for the anterior and posterior teeth of pre-treatment,
conventional wax-up and digital wax-up casts. ............................................................................... 156
Figure 9-6 Box plot diagram of the CAT values (mm2) for the anterior and posterior teeth of pre-
treatment, conventional wax-up and digital wax-up casts. ............................................................ 157
Figure 9-7 Box plot diagram of the contact accuracy values (mm) for the anterior and posterior teeth of
pre-treatment, conventional wax-up and digital wax-up casts. ...................................................... 158
Figure 10-1 Example of the evaluated virtual models. (A) Pre-treatment model. (B) Conventional wax-up
model. (C) Digital wax-up model. .................................................................................................... 167
Figure 10-2 An example of virtual simulation of lateral movement. (A) Maximal intercuspation. (B) 0.5
mm excursion. (C) 1.0 mm excursion. (D) 2.0 mm excursion. (E) 3.0 mm excursion. The red colour
indicates the existing contacts. ....................................................................................................... 169
Figure 10-3 Proportion of each lateral occlusion scheme in each excursive position. (A) Pre-treatment
models. (B) Conventional wax-up models. (C) Digital wax-up models. ........................................... 171
Figure 10-4 The mean number of contacting teeth for all the models in each excursive position. (A)
Maxillary arch. (B) Mandibular arch. ............................................................................................... 172
Figure 10-5 Percentage of the contacting teeth in each excursive position for all the models. (A) Pre-
treatment maxillary arch. (B) Pre-treatment mandibular arch. (C) Conventional wax-up maxillary
arch. (D) Conventional wax-up mandibular arch. (E) Digital wax-up maxillary arch. (F) Digital wax-up
mandibular arch. ............................................................................................................................. 175
Figure 11-1 An example of the evaluated models: A, Actual pre-treatment model. B, Actual conventional
wax-up model. C, Virtual pre-treatment model. D, Virtual conventional wax-up model. E, Digital
wax-up model. ................................................................................................................................. 186
Figure 11-2 A frontal image illustrating the separation of the anterior teeth for both sides. The horizontal
lines represent the perceived width of each tooth. ........................................................................ 187
Figure 11-3 Measurement of the W:H ratio: A, Central incisor. B, Lateral incisor. C, Canine. The vertical
line is the height and the horizontal line is the width. .................................................................... 188

xiv
Figure 11-4 PFP of the lateral incisors and canines for the pre-treatment, conventional wax-up and
digital wax-up models. The GP values were added for comparison. .............................................. 189
Figure 11-5 W:H ratio of all the teeth for the central incisors, lateral incisors and canines of all the
models. ............................................................................................................................................ 190
Figure 11-6 Perceived asymmetry percentage of central incisors, lateral incisors and canines of the pre-
treatment, conventional wax-up and digital wax-up models. ......................................................... 191
Figure 11-7 Actual asymmetry percentage of the central incisors, lateral incisors and canines for the pre-
treatment, conventional wax-up and digital wax-up models. A, The actual width asymmetry. B, The
actual height asymmetry. ................................................................................................................ 193
Figure 12-1 Frontal virtual images of (A) conventional wax-up model and (B) digital wax-up model. It is
clear that the teeth of the digital wax-up model exhibited more defined features which might
enhance the overall aesthetics. ....................................................................................................... 203
Figure 12-2 Examples of digital (A) maxillary and (B) mandibular posterior teeth that illustrate the well-
defined occlusal anatomy. ............................................................................................................... 207
Figure 12-3 An example of the effect of dental model simplification. (A) The originally scanned model is
composed of dense points. (B) The model after 50% decimation. (C), 25% decimation. (D) 12.5%
decimation. (E) 6.75% decimation model. The decimation primarily affects flat surfaces. Excessive
decimation causes greater the loss in the resolution...................................................................... 211
Figure 12-4 The effect of bur diameter in line angle production. (A) Sharp virtual line angle cannot be
produced by rounded bur. Therefore, surface inaccuracy will occur on the milled restoration in the
form of (B) negative error after over-milling of the sharp corner, or (C) positive error after under-
milling of the sharp corner. ............................................................................................................. 213
Figure 12-5 The effect of layered production on the surface accuracy. (A) Smooth surface is ideal for
dental models. (B) Thick layers will increase the prominence of surface stepping. (C and D) As the
layers thickness is reduced the surface accuracy will increase. The corrugated surface (occlusal
surface) is more affected by the steps than the vertical surfaces. .................................................. 215
Figure 12-6 (A) An example of a maxillary model produced from the conventional method. (B) A virtual
image of the same model. (C) The same model after production by 3D printing. (D) A magnified
image of the buccal surface of the 3D printed model illustrating the model layers that may
influence the surface quality. .......................................................................................................... 216

xv
List of Abbreviations
3D Three Dimensional
BBO Bilaterally balanced occlusion
CAD Computer-aided design
CAT Contact area per tooth
CAM Computer-aided manufacturing
CGO Canine-guided occlusion
CNC Computer numeric control
CNT Contact number per tooth
CR Centric relation
DICOM Digital imaging and communication medicine
ED Euclidean distance
EMG Electromyography
GFO Group function occlusion
GP Golden proportion
mm Millimetre
µm Micrometre
MPO Mutually-protected occlusion
Micro-CT Micro-computed tomography
PFP Perceived frontal proportion
STL Stereolithography
TMD Temporomandibular joint disorder
TMJ Temporomandibular joint
VDO Vertical dimension of occlusion
W:H Width-to-height ratio

xvi
Acknowledgements
First, the completion of this thesis could not have been possible without the help of many
people. I was fortunate to receive great guidance from my supervisors, Professors Mohammed
Bennamoun, Marc Tennant and John McGeachie. Upon my arrival to Western Australia, I was
fortunate to have made contact with Mohammed who was happy to work with me. Although
we are in different disciplines, a common interest was established which had led to the
development of this research project. He was an excellent mentor. It was a pleasure to work
with Marc and John who had provided insightful ideas in executing the research. They were
very approachable throughout the research period and were a significant source of support
and encouragement.
I wish to express my gratitude to my external supervisor, Dr Patrick Henry for his vital role in
sharing his clinical and technical experience and providing invaluable assistance in conducting
this research. It was a privilege to receive feedback from a world-class clinician.
I am thankful to the technical team of the Oral Health Centre of Western Australia for their
laboratory support. They were very efficient and contributed to a high quality laboratory work.
I am grateful to the staff of the Centre for Microscopy, Characterization & Analysis of the
University of Western Australia for facilitating the micro-CT access, training and technical
support.
I am grateful to my colleagues and mentors at the University of Western Australia, the
University of Otago and Melbourne University. I appreciate the advices of Assistant Professor
Syed Shamsul Islam, Professor Michael Swain, Professor Karl Lyons, Professor Peter Parashos
and Associate Professor Roy Judge. They had provided brilliant ideas and support throughout
my PhD journey.
I would like to acknowledge the financial support of the following grants: Research
Development Award from the University of Western Australia, the Australian Prosthodontic
Society and the Raine Medical Research Foundation.
My sincere gratitude goes to my parents for their infinite care and support. I am grateful to my
wife, for her understanding and believing in me. Special thanks for my daughters Aminah and
Maryam.
xvii
Statement of Candidate Contribution
I hereby declare that all of the included work in this thesis is entirely my own, except some
laboratory work performed by the dental technicians at the Oral Health Centre of Western
Australia, which I have indicated in the thesis accordingly. The research was conducted under
the supervision of Professor Mohammed Bennamoun, Professor Marc Tennant, Professor John
McGeachie and Dr Patrick Henry. For the co-authored published work, my contribution was
80%. Contributions with other colleagues are mentioned accordingly and listed as co-
authorships in the published papers.

xviii
Publications Arising from Thesis
Abduo J, Lyons K. Clinical considerations for increasing occlusal vertical dimension: a
review. Australian Dental Journal. 2012; 57:2-10. (Part of Chapter 1)
Abduo J. Safety of increasing vertical dimension of occlusion: a systematic review.
Quintessence International. 2012; 43:369-380. (Chapter 2)
Abduo J, Tennant M, McGeachie J. Lateral occlusion schemes in natural and minimally
restored permanent dentition: a systematic review. Journal of Oral Rehabilitation. 2013;
40:788-802. (Chapter 3)
Abduo J, Tennant. Impact of lateral occlusion schemes: a systematic review. Journal of
Prosthetic Dentistry. 2015; 114:193-204. (Chapter 4)
Abduo J. Virtual prosthodontic planning for oral rehabilitation: a pilot study. CI Health.
2012; 34-42. (Part of Chapter 6)
Abduo J, Bennamoun M. Three-dimensional image registration as a tool for forensic
odontology: a preliminary investigation. American Journal of Forensic Medicine and
Pathology. 2013; 34:260-266. (Part of Chapter 6)
Abduo J, Bennamoun M, Tennant M, McGeachie J. Precision of virtual prosthodontic
planning for oral rehabilitation. British Journal of Applied Sciences and Technology. 2014;
4:3915-3929. (Chapter 7)
Abduo J, Bennamoun M, Tennant M. Influence of conventional and digital wax-ups on axial
tooth contour. International Journal of Periodontics and Restorative Dentistry. 2015;
35:e50-e59. (Chapter 8)
Abduo J, Bennamoun M, Tennant M, McGeachie J. Effect of prosthodontic planning on
intercuspal occlusal contacts: comparison of digital and conventional planning. Computers
in Biology and Medicine. 2015; 60:143-150. (Chapter 9)
Abduo J, Bennamoun M, Tennant M, McGeachie J. Effect of prosthodontic planning on
lateral occlusion scheme: a comparison between conventional and digital planning. Journal
of Applied Oral Science. 2015; 23:196-205. (Chapter 10)

xix
Abduo J, Bennamoun M, Tennant M, McGeachie J. Impact of digital prosthodontic
planning on dental esthetics: biometric analysis of esthetic parameters. Journal of
Prosthetic Dentistry. 2015; Accepted. (Chapter 11)
Abduo J, Lyons K, Bennamoun M. Trends in computer-aided manufacturing in
prosthodontics: a review of the available streams. International Journal of Dentistry. 2014;
Accepted. (Part of Chapter 12)

1
Chapter One
1. Introduction and Literature Review
Part of this chapter was published in the following article:
Abduo J, Lyons K. Clinical considerations for increasing occlusal vertical dimension: a review.
Australian Dental Journal. 2012; 57:2-10. (Appendix B)

2
1.1. Introduction
Gradually, dentistry is moving towards the digital era, where computerized technologies are
becoming an integral part of dental treatment. Disciplines, such as prosthodontics,
orthodontics, and oral surgery, were significantly influenced by digital dentistry. In industry,
the benefits of computerized engineering technologies include high precision, simpler
fabrication protocol and minimal human intervention. These advantages make digital
technologies ideal for quality assurance, precision production and cost effective manufacturing
(van Noort, 2012). Because of this, it is no surprise that the digital technology has been
adopted in dentistry (Miyazaki and Hotta, 2011). Today, digital dentistry is the only means of
producing durable tooth-coloured and metal-free components in dental practice. Further, it
provides the option of chair-side fabrication of indirect restorations.
One of the recent applications of digital dentistry is the virtual prosthodontic planning in the
form of diagnostic wax-up. In prosthodontics, diagnostic wax-up simulates the proposed
treatment and allows for visualization of the final outcome. Therefore, it is a useful tool to
decide on the most suitable treatment (Magne and Belser, 2004; Gurel, 2007). Subsequently,
the diagnostic wax-up will dictate the definitive treatment. Conventionally, wax-up involves
altering the tooth morphology on actual diagnostic dental model. Although this method has
been used for many years and the profession is very familiar with it, it suffers from some
limitations. Further, it is common for the clinician to omit the diagnostic wax-up step or to
leave it to the dental technicians to decide. The reason behind this is that wax-up is a time
consuming process and requires special training and artistic abilities. The technicians might
have the expertise in developing aesthetically looking dental morphology; however, they
commonly lack the visualization of the biological parameters. This is mainly important in
relation to the fact that they are not the operators who are directly dealing with patients.
Therefore, the predictable application of the diagnostic wax-up is limited to clinicians with
special level of training.
Today’s patients are aesthetically conscious and have high dental expectations. In the era of
multimedia expansion, clinical procedures in dentistry appear to be increasingly market-
driven. In addition, there is continuous release of new dental materials and fabrication
techniques. As a result, the clinician is confronted with a plethora of treatment options that
can address a specific dental problem. Failure of meeting patient aesthetic and functional
demands can result in major patient’s disappointment, or even legal litigations. Therefore,
more emphasis should be placed on the diagnostic wax-up to allow the patient to visualize and
appraise the final outcome prior to any irreversible treatment. On the basis of accurate

3
planning, the patient will be able to provide consent after being fully informed by observing
the diagnostic wax-up outcome.
Recently, with the advent of laser scanning, virtual planning, rapid prototyping, and computer-
aided design and computer-aided manufacturing (CAD/CAM), digital dentistry was proposed as
a tool for virtual wax-up (Beuer et al., 2008; Probst and Mehl, 2008). It involves digital tooth
contour alteration and obtaining natural tooth contour and dimensions. It is expected that
digital wax-up can be accomplished in a time-efficient and well-controlled fashion. In addition,
it is likely that the digital wax-up will overcome the problems of the conventional wax-up such
as time consumption and the requirement of high technical skills. Further, it is a valid tool for
precise alteration quantification (Abduo et al., 2014b). As the virtual models can be transferred
through the internet, dentists will have greater access for diagnostic wax-ups, even if the
computerized centre location is distant. However, currently, there has been very minimal
research to evaluate the validity and feasibility of digital diagnostic wax-up. For the digital wax-
up to be recommended for routine use, it should provide an outcome that is at least
comparable to the conventional wax-up method. Therefore, qualitative and quantitative
comparisons between conventional wax-up and digital wax-up are necessary.
The research experiments presented in this thesis are early in the digital wax-up field. A
method of executing a digital wax-up is proposed. The obtained digital wax-up outcome is
compared against the conventional wax-up outcome. This was applied to the variables that
can be affected by the diagnostic wax-up, namely: precision, contour, occlusion and aesthetics.
The obtained outcome will improve the current understanding of digital wax-up and will be
used to recommend further refinements of this technique.
4
1.2. Literature Review
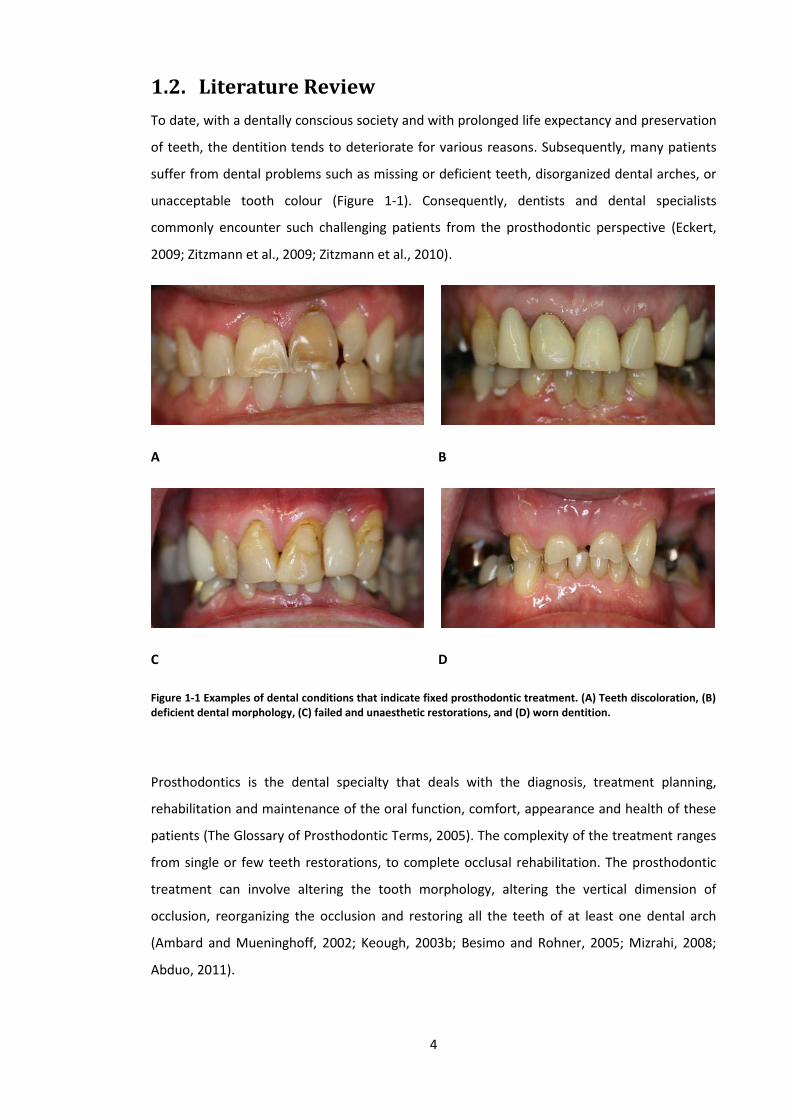
To date, with a dentally conscious society and with prolonged life expectancy and preservation
of teeth, the dentition tends to deteriorate for various reasons. Subsequently, many patients
suffer from dental problems such as missing or deficient teeth, disorganized dental arches, or
unacceptable tooth colour (Figure 1-1). Consequently, dentists and dental specialists
commonly encounter such challenging patients from the prosthodontic perspective (Eckert,
2009; Zitzmann et al., 2009; Zitzmann et al., 2010).
A B
C D
Figure 1-1 Examples of dental conditions that indicate fixed prosthodontic treatment. (A) Teeth discoloration, (B) deficient dental morphology, (C) failed and unaesthetic restorations, and (D) worn dentition.
Prosthodontics is the dental specialty that deals with the diagnosis, treatment planning,
rehabilitation and maintenance of the oral function, comfort, appearance and health of these
patients (The Glossary of Prosthodontic Terms, 2005). The complexity of the treatment ranges
from single or few teeth restorations, to complete occlusal rehabilitation. The prosthodontic
treatment can involve altering the tooth morphology, altering the vertical dimension of
occlusion, reorganizing the occlusion and restoring all the teeth of at least one dental arch
(Ambard and Mueninghoff, 2002; Keough, 2003b; Besimo and Rohner, 2005; Mizrahi, 2008;
Abduo, 2011).

5
Any prosthodontic treatment should enhance patient comfort, function and aesthetics. Equally
important, treatment should not induce damage to the remaining natural tissues. Historically,
a major emphasis was placed on the mechanical features related to the prosthesis. Although
this has been shown to be beneficial in several laboratory studies, a great portion of the
clinical complications in fixed prosthodontics has been biological in nature such as caries and
periodontal diseases (Gavelis et al., 1981; Felton et al., 1991; Jacobs and Windeler, 1991).
Further, it appears that as the complexity of the prosthodontic treatment increases, there is an
increase in biological complications (De Backer et al., 2008). Many of the encountered
problems are avoidable if proper case selection and treatment planning were followed (Steele
et al., 2002). As a result, the contemporary literature pertaining to fixed prosthodontic
treatment acknowledges the importance of outlining feasible objectives of prosthodontic
treatment prior to the commencement of the treatment (Ahmad, 2010). This will insure
patient satisfaction of the treatment.
With the ever-increasing public aesthetic demands, many patients request elective dental
treatment (Ahmad, 2010; Kelleher, 2012). On the other hand, many new materials and
products are continuously released that are highly aesthetics, such as composites and
ceramics. The combination of increasing patient demand and the persistent marketing of
aesthetic products had caused a shift of treatment modality from being genuinely justifiable to
purely elective and centred on aesthetic enhancement (Ahmad, 2010; Kelleher, 2012). Dental
conditions such as diastema, chipping, tooth wear, black triangles and irregular teeth position
in otherwise healthy dentition might constitute deviation from what is perceived to be natural
and aesthetic. Some clinicians advocate fixed prosthodontic treatment due to its profitability,
high aesthetic impact and reliability. Although elective treatment is justifiable, the clinician
should balance the aesthetic advantages against the biological and mechanical costs. It is not
uncommon for patients to request prosthodontic treatment, such as veneers and crowns,
purely for aesthetic enhancement. While prosthodontic treatment is ideal for many patients
with these problems, it entails irreversibly preparing many of the visible teeth in the smile (loss
of up to 30% - 70% of natural tooth structure) (Hancocks, 2011). As a consequence of tooth
structure reduction, the rate of biological complications might arise, such as pulpal damage,
tooth fracture, periodontal complications, tooth loss or infection (Goodacre et al., 2003a).
Ethically, the advantages and disadvantages of dental treatment should be well illustrated to
the patients before embarking into the definitive treatment (Ahmad, 2010; Kelleher, 2012). In
situations where the benefits of prosthodontic treatment are not clearly outweighing the
complications, it should be validated by a diagnostic wax-up (Magne and Douglas, 1999a; b;
Magne and Belser, 2004). A diagnostic wax-up permits the visualization of what is achievable

6
by the fixed prosthodontic treatment. It allows the clinician to formulate the balance of all the
achievable factors from the biological, mechanical and aesthetic perspectives.
1.3. Prosthesis Requirements
In order for prosthesis to fulfil its function, it should be durable, aesthetic, cleansibale and
maintainable by the patient. Many prostheses fail because of poor case selection,
inappropriate treatment techniques and inadequate oral hygiene.
Like most of the oral diseases, fixed prostheses failure is accentuated by the deficient hygiene
practice (Lang, 1995; Donovan and Cho, 2001; Gracis et al., 2001). In many instances, the
patient might fail maintain the cleanliness of the prosthesis. However, it is not uncommon for
biological complications to arise as a result of non-cleansible prosthesis design, which can
hinder regular home care practice by the patient (Becker and Kaldahl, 1981; Croll, 1989). On
the other hand, excessive hard tissue reduction should be avoided as this has been shown to
contribute to pulpal complications. Following invasive tooth preparation, additional
periodontal and/or endodontic therapy might become necessary.
Mechanical durability can be ensured by considering factors related to space provided for the
prosthesis components and cementation. Prosthesis material durability is obtained from
controlled abutment tooth preparation to accommodate sufficient material bulk for the final
prosthesis (Goodacre et al., 2001). This will also avoid the risk of over-contouring of the
prosthesis. Uncontrolled abutment tooth reduction will not only compromise tooth vitality,
but will also render the abutment tooth susceptible to mechanical failure. Abutment tooth
preparation with minimal taper and adequate length ensures that retention and resistance
forms are established which will enhance the cementation integrity. In addition, durability of
the prosthesis is optimised by the choice of material for the final prosthesis (Wataha, 2001;
2002). In general, a material that produces a rigid prosthesis is ideal to resist fracture and
deformation in thin section.
In relation to aesthetics, the prosthesis should blend inconspicuously within the surrounding
oral and facial structures. Several dental features will determine the aesthetics of a prosthesis
including tooth dimension, colour, morphology, proportions, symmetry and emergence profile.
In addition, the prosthesis should also integrate naturally with the gingival features (Gracis et
al., 2001; Jorgensen and Nowzari, 2001). Situations such as teeth malalignment, edentulous
areas and compromised dento-gingival dimensions will pose significant challenges to the
restoration of natural aesthetics.
7
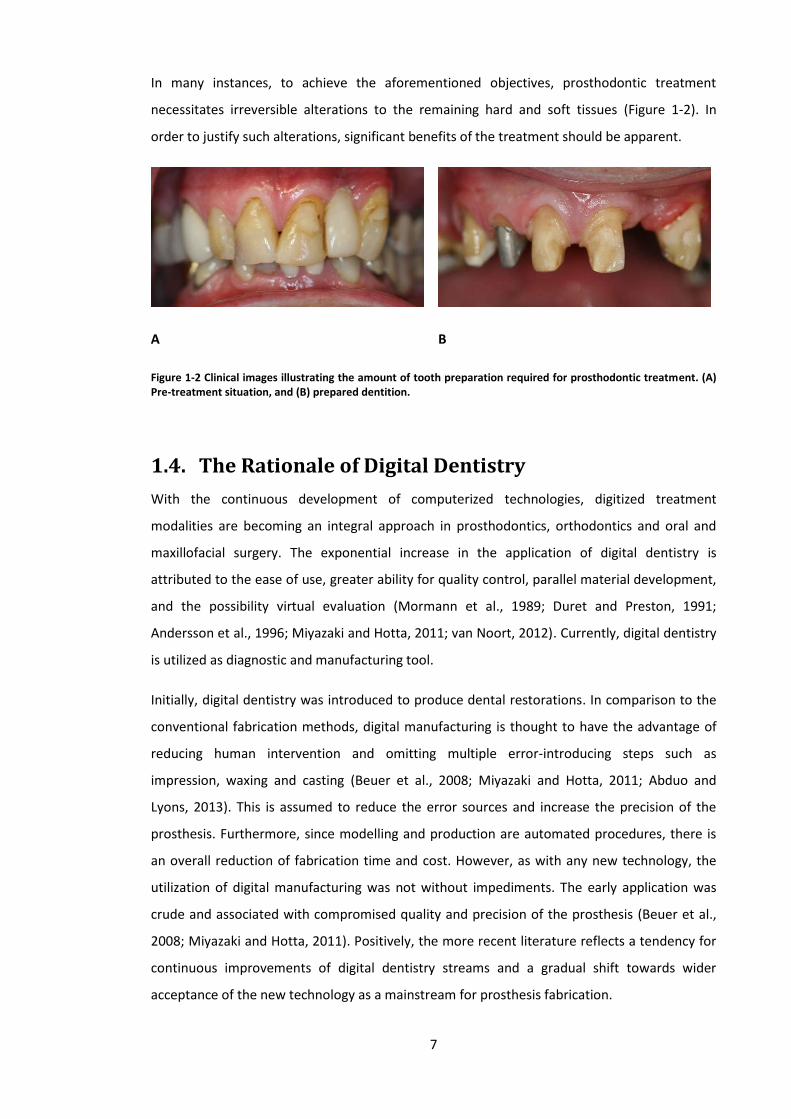
In many instances, to achieve the aforementioned objectives, prosthodontic treatment
necessitates irreversible alterations to the remaining hard and soft tissues (Figure 1-2). In
order to justify such alterations, significant benefits of the treatment should be apparent.
A B
Figure 1-2 Clinical images illustrating the amount of tooth preparation required for prosthodontic treatment. (A) Pre-treatment situation, and (B) prepared dentition.
1.4. The Rationale of Digital Dentistry
With the continuous development of computerized technologies, digitized treatment
modalities are becoming an integral approach in prosthodontics, orthodontics and oral and
maxillofacial surgery. The exponential increase in the application of digital dentistry is
attributed to the ease of use, greater ability for quality control, parallel material development,
and the possibility virtual evaluation (Mormann et al., 1989; Duret and Preston, 1991;
Andersson et al., 1996; Miyazaki and Hotta, 2011; van Noort, 2012). Currently, digital dentistry
is utilized as diagnostic and manufacturing tool.
Initially, digital dentistry was introduced to produce dental restorations. In comparison to the
conventional fabrication methods, digital manufacturing is thought to have the advantage of
reducing human intervention and omitting multiple error-introducing steps such as
impression, waxing and casting (Beuer et al., 2008; Miyazaki and Hotta, 2011; Abduo and
Lyons, 2013). This is assumed to reduce the error sources and increase the precision of the
prosthesis. Furthermore, since modelling and production are automated procedures, there is
an overall reduction of fabrication time and cost. However, as with any new technology, the
utilization of digital manufacturing was not without impediments. The early application was
crude and associated with compromised quality and precision of the prosthesis (Beuer et al.,
2008; Miyazaki and Hotta, 2011). Positively, the more recent literature reflects a tendency for
continuous improvements of digital dentistry streams and a gradual shift towards wider
acceptance of the new technology as a mainstream for prosthesis fabrication.

8
Alongside computer-aided systems development, new materials have emerged for prostheses
fabrication. Modern machines can utilize a broad array of metals, ceramics and resins. Of most
interest in prosthodontics are the high-strength ceramics (alumina and zirconia) that
constitute a durable metal-free restoration material and can only be produced by digital
manufacturing (Sadan et al., 2005; Denry and Kelly, 2008). Prior to digital manufacturing,
metal-free restorations were prone to fracture and primarily reliable for single anterior tooth
restorations. To date, with the aid of digital manufacturing, high-strength ceramics prosthesis
can be produced, and the indications of ceramic restorations were expanded to include multi-
unit prostheses and posterior teeth restorations.
Digital manufacturing systems have subsequently been developed to fabricate implant
components and prostheses (Kollar et al., 2008; Abduo and Lyons, 2013). Today, utilizing
computerized technologies to fabricate implant components and prostheses is an acceptable
treatment modality. Materials such as ceramics, metals (base metal alloys and titanium),
resins, and waxes can be processed by the available systems (Beuer et al., 2008; Kollar et al.,
2008; Miyazaki et al., 2009).
A recent application of digital manufacturing is the fabrication of removable prostheses.
Removable partial denture metal frameworks can be produced directly from metal (Eggbeer et
al., 2005; Williams et al., 2006; Han et al., 2010) or, alternatively, a resin pattern framework
can be formed and then cast using conventional fabrication methods (Williams et al., 2004; Wu
et al., 2012). Different computerized protocols have been proposed for the fabrication of
complete denture bases (Maeda et al., 1994; Sun et al., 2009; Kanazawa et al., 2011; Goodacre
et al., 2012; Kattadiyil et al., 2013), and are very useful for fabricating facial prosthesis (Davis,
2010), as the morphologies can be easily obtained by mirror image or average face form
(Ciocca and Scotti, 2004; Feng et al., 2010b) so that a more realistic and natural prosthesis can
be manufactured (Feng et al., 2010a). A map of the surface morphology and colour can be
saved virtually which facilitates future prosthesis fabrication. As extra-oral scanning is a
possibility, the whole experience will also be much more comfortable to the patient (Runte et
al., 2002; Feng et al., 2010a). The automated process will significantly reduce the reliance on
technical skill and human variation. With the available systems, facial prosthesis can be
produced from resin or wax (Chen et al., 1997; Runte et al., 2002; Feng et al., 2010a).
Subsequently, it is invested and transformed to surgical grade silicone.
More recently, digital dentistry is utilized for diagnostic purposes. For example, computerized
technologies are used to plan and idealize surgical implant treatment (Cassetta et al., 2012;
Farley et al., 2013; Vieira et al., 2013). Due to the precision that can be achieved with the aid of

9
information from 3D digital radiographs, implant dimensions and placement locations can be
determined using planning software without violation of critical anatomical features. Further,
the need for bone and/or soft tissue grafting can be established.
Due to versatility of computer-aided design (CAD), digital diagnostic wax-up has been
hypothesized to reduce the difficulties of prosthodontic treatment planning. In this field the
virtual pre-treatment model can be altered digitally to simulate the prosthodontic treatment.
Once the digital wax-up is completed by a computer-aided design (CAD) software, the data is
transferred to a computer-aided manufacturing (CAM) software that controls the production
unit. The aim of CAM process is to produce an accurate physical model as designed by the CAD
software. Although, virtual systems to modify natural teeth are available commercially, their
use has been restricted to design and fabricate provisional restorations (Lin et al., 2013).
Further, very minimal research was conducted on that field (Abduo, 2012). In addition, several
authors have described dental model’s analysis and surveying for removable partial denture
framework design (Williams et al., 2006; Han et al., 2010). This feature will locate the ideal
path of insertion and abutment tooth undercuts and subsequently, the ideal location of
components and prosthesis design will be selected.
An application of digital dentistry that is currently under investigation is the quantification of
the effect of the proposed prosthodontic treatment prior to the active treatment phase. This
takes advantage of the software precision in measurements and quantification. On the 3D
models, volumes and distances can be precisely measured (Davis et al., 2012), and in the
dental practice, analysis of tooth preparation can occur prior to prosthesis fabrication. In some
instances, where the tooth preparation is not ideal or restoration thickness is minimal,
modifications of the tooth preparation can be recommended to reduce the risk of mechanical
failure of the prosthesis. Such feature can be coupled with a digital wax-up to ensure any tooth
preparation will facilitate the planned restoration (Abduo, 2012).
1.5. Diagnostic Wax-Up
According to the Glossary of Prosthodontic Terms (2005), diagnostic wax-up is defined as
waxing of intended restorative contours on dental casts for the purpose of evaluation and
planning restorations. Eventually, optimal clinical and laboratory procedures that can achieve
the desired aesthetic and function can be determined. Normally, wax addition technique is
implemented to develop a wax pattern through organized sequential addition of wax to shape
the individual components to the desired anatomic form (The Glossary of Prosthodontic

10
Terms, 2005). In the dental laboratory, the diagnostic wax-up alters the shape and form of
teeth by preparing dental models, reducing part of the teeth and building the contours with
wax (Davies et al., 2001; Jacobs et al., 2002; Abduo, 2011). The outcome of this “trial”
treatment can be demonstrated to the patient for approval or suggestion of any further
modifications. In this manner, the patient will be more informed of the final outcome.
Subsequently, the diagnostic wax-up will facilitate the “outcome-based treatment” which
implies that the magnitude of irreversible alteration to hard or soft tissues is dictated by the
final outcome rather than the initial patient presentation (Magne and Belser, 2004; Gurel,
2007). This is accomplished clinically by preparing the tooth according to the anticipated final
restoration design as determined by the diagnostic wax-up. In addition, provisional
restorations can be fabricated following the diagnostic wax-up contour and, should the
provisional restorations outcome satisfy the patient, the definitive restorations will be
fabricated to resemble the diagnostic wax-up (Magne and Belser, 2004; Gurel, 2007; Reshad et
al., 2008). In fixed prosthodontics, the diagnostic wax-up is used for the following purposes:
1.5.1. Selecting the most suitable treatment
During the process of diagnostic wax-up, it is important for the operator to objectively
consider what can be achieved in a given clinical scenario. Multiple treatment options can be
considered. As all the process is conducted on dental models via diagnostic wax, it has the
advantage of being reversible. The treatment that can be incorporated with the dental wax-up
can be alteration of tooth shape and form, occlusion alterations, replacement of missing teeth
and orthodontic tooth movement (Morgan et al., 1975; Tarantola and Becker, 1993; Simon and
Magne, 2008). In some situations, tooth extraction and soft tissue alterations can be
considered (Simon and Magne, 2008). It is recommended that through the process of wax-up,
the operator should aim for feasible and conservative treatment, yet without compromising
the patient’s needs.
Some authors had suggested using the information from the wax-up for a direct mock-up
technique, where the shape of the teeth is temporarily altered by direct application of
composite restorative material on unprepared teeth with the aid of silicone matrix (Reshad et
al., 2008). The aim of this step is to allow better 3D visualization of the outcome by the
clinician and the patient, even over a period of time (Figure 1-3). Therefore, the diagnostic
wax-up will be better correlated to the patient dentition and avoid an outcome that appears
ideal on casts but not corresponding optimally to the patient’s appearance (Simon and Magne,
2008).

11
A B C
Figure 1-3 Diagnostic wax-up was used to alter the teeth with composite restorative material. (A) Pre-treatment presentation. (B) Diagnostic wax-up. (D) The modified dentition by composite restorative material. The new contours can subsequently control the tooth preparation.
1.5.2. Controlling the tooth preparation
Whenever a tooth is prepared, it is important to achieve enough clearance to accommodate a
durable and physiological restoration, without over sacrificing natural tooth structure. Ideal
tooth preparation is achieved by controlled tooth surface reduction, maintaining occlusal
surface morphology, obtaining minimal preparation taper and preserving vertical preparation
height (Preston, 1976; Henry, 1978; Goodacre et al., 2001). Implementation of these features
ensures mechanical durability through even prosthesis material thickness and adequate
retention and resistance form in the abutment tooth preparation. Adequate material thickness
also allows for enhanced aesthetics of the prosthesis. Following strict preparation protocol will
also minimise unnecessary tooth reduction and maintain the greatest distance possible
between the external preparation surface and the pulp space. To provide an optimal crown
preparation, a combination of techniques can be applied (Table 1—1).

12
Table 1—1 Determinants of crown preparation
Determinant Description Initial tooth morphology
The final preparation is dependent on the external tooth surface. Controlled reduction can be enhanced by
Depth groove
Indices Opposing dentition Used as a guide to ensure sufficient occlusal clearance exists in the
centric and eccentric mandibular position Applied restorative material
Different restorative materials require different reduction
Metal: - Functional surface: 1.5 mm - Non-functional surface: 1 mm - Margin: 0.3-0.5 mm
Ceramic: - Functional surfaces: 2 mm - Non-function: 1.5 mm - Margin: 1-1.5 mm
Metal-ceramic: - Functional: 2 mm - Non-functional: 1.5 mm - Margin: 1.3-1.5 mm
Prosthesis design Partial coverage prosthesis requires less coverage than full coverage prosthesis
Planned morphological alterations
The external definitive prosthesis surface dictates the final preparation. Accurate reduction can be enhanced by
Diagnostic wax-up
Indices
Prosthodontic treatment driven by diagnostic wax-up is advantageous by selecting the
treatment on the basis of addressing patient concerns rather than on the existing dental
situation (Davies et al., 2001; Magne and Belser, 2004). The possible implication of this
approach is deviation from the classical recommendation for reducing the tooth surfaces prior
to crown restoration. In this situation, the amount of reduction is dictated by the wax-up
contour (Morgan et al., 1975; Simon and Magne, 2008). This means, some surfaces will be
under-prepared, while other surfaces might be over-prepared. This will ensure adequate
thickness of restoration materials can be used without compromising the dental appearance.
Hence the term “outcome-based treatment” which implies that the magnitude of irreversible
tooth preparation is dictated by the planned final outcome rather than the initial tooth
morphology (Magne and Belser, 2004; Gurel, 2007). Clinically, this can be accomplished by
using indices, direct mock-up technique, and temporary alteration of the tooth shape with
composite or provisional restoration materials (Reshad et al., 2008). This approach potentially
allows for more tooth structure preservation, which will lead to more predictable
biomechanics and bonding (Figure 1-4).

13
A B C D E F
Figure 1-4 Comparison between the traditional crown preparation and restorative-driven crown preparation. (A) The initial tooth situation. (B) The crown preparation can be executed according the initial tooth surface. (C) Alternatively, a diagnostic wax-up can be established on a dental model. (D) On the diagnostic wax-up model, a silicone index is fabricated. (E) This silicone index is used intra-orally to dictate the tooth preparation, which might be more conservative. (F) Eventually, the final tooth preparation and crown design is objectively determined according to the wax-up.
1.5.3. Provisional restoration
After final tooth preparation for fixed prosthesis, provisional restoration has to be fitted on the
teeth to protect the tooth and temporarily restore function and aesthetics (Preston, 1976;
Henry, 1978). Given that the diagnostic wax-up is completed according to high standards, it
will be used to fabricate the provisional restoration. The details from the diagnostic wax-up
can be transferred intra-orally via silicone index. Thus, the diagnostic wax-up will act as a
template for the provisional restoration (Tarantola and Becker, 1993). The additional
advantage of this process is allowing the patient to further critique the planned treatment
(Reshad et al., 2008). At this stage, amendments of the provisional restorations are possible,
and the definitive prostheses will be fabricated to mimic the approved provisional restoration
(Figure 1-5).

14
A B
C D
Figure 1-5 An example of the usefulness of the diagnostic wax-up in fabrication of provisional restorations. (A) A pre-treatment situation. (B) The diagnostic wax-up planned to improve the overall dental condition. (C) According to the diagnostic wax-up, provisional restorations were fabricated and inserted. In this situation, the provisional restorations restored patient comfort, aesthetic and function. In addition, they allow the patient the critique the anticipated treatment. (D) definitive prostheses were fabricted according to the approved provisional restorations.
1.5.4. Enhanced communication
As the whole treatment can be visualized physically, the patient is better informed about the
final treatment outcome. From the legal perspective, the patient has to be fully informed
about the likely treatment outcome (Tarantola and Becker, 1993; Reshad et al., 2008; Simon
and Magne, 2008). This is very important since the prosthodontic treatment will cause an
irreversible alteration to the remaining natural tooth structure. Further, the dental technician
can follow the contour of the diagnostic wax-up when fabricating the definitive prosthesis
(Reshad et al., 2008; Simon and Magne, 2008) (Figure 1-6).

15
A B C
Figure 1-6 From the wax-up, silicone indices can be produced (A, B) and used by the manufacturing technician to control the final prostheses contour (C).
Therefore, it is clear from what has been mentioned earlier that diagnostic wax-up is a useful
tool in the contemporary prosthodontic treatment and the clinician should consider
implementing it routinely to increase the predictability of the treatment and achieve a
mutually satisfactory outcome (Reshad et al., 2008; Simon and Magne, 2008). In addition, it
has to be completed according to high standards. However, the diagnostic wax-up is a time
consuming procedure and requires high artistic abilities which might prevent its incorporation
in busy dental practices (Tarantola and Becker, 1993). In most of the situations, the diagnostic
wax-up is completed by a dental technician who is experienced in manipulating wax (Simon
and Magne, 2008). However, the technician tends to complete the wax-up without seeing the
patient, which might render the wax-up a guess work (Simon and Magne, 2008). As a result,
the relationship between the wax-up and the extra-oral features (lips, facial structures) will not
be taken in account. Thus, even if it looks good on the cast, there might be some uncertainty
(Simon and Magne, 2008).
1.6. Requirements of Ideal Wax-Up
From the technical aspects, several wax-up methods were proposed. All the methods were
centered on addition of inlay wax and carving it to the ideal shape (Tarantola and Becker,
1993). The axial surface, occlusal surface and tooth gingiva relationship may be altered by the
waxing procedure. Regardless, of the method of the wax-up, there are few requirements that
should be fulfilled in relation to precision, contour, occlusion and aesthetics:
1.6.1. Precision
In order to ensure applicability of diagnostic wax-up, it should be accurately transferable to the
mouth (Romeo and Bresciano, 2003). In many cases, unprepared teeth or the surrounding soft

16
tissues act as a reference landmark. This mandates that the wax extension should be confined
to areas that will be modified. Unless the soft tissues will be modified, the wax extension
should terminate to the junction between hard and soft tissue (gingival margin). As stated
earlier, indices are used to transfer the wax-up information to the mouth and to the working
models. These indices are used as an aid for controlling the preparation, provisional
restoration fabrication and definitive prosthesis construction. Unnecessary overflowing of wax
will not only affect the final appearance of the diagnostic wax-up, but will significantly affect
the seating of the indices, and subsequent provisional and definitive prostheses fabrication.
Hence, the usefulness of the diagnostic wax-up is reduced (Magne and Belser, 2004).
In addition, further inaccuracy could occur through materials manipulation. The process of
producing pre-treatment models or casts is based on intra-oral full-arch impression and
pouring this impression. Normally for diagnostic procedure, an alginate impression with stock
tray is taken. Due to the presence of many steps and several materials, there will be an
inevitable degree of distortion. For example, the dimensional changes of alginate impressions
was reported to be in the range of 1% to 6 % (Nassar et al., 2012; Todd et al., 2013). Further,
the recorded surface and dimensional accuracy are subjected to changes following the
disinfection protocol (Walker et al., 2010; Nassar et al., 2011; Rentzia et al., 2011). Likewise,
following pouring, the dental stone suffers from additional dimensional distortion (Michalakis
et al., 2012). The final discrepancy is the accumulated error of all the steps and the materials.
Greater accuracy can be achieved by using different materials and techniques, such as rubber
impression materials and special trays (Faria et al., 2008; Schaefer et al., 2012). However, the
greater accuracy from these techniques justifies their application for working model for
definitive prosthesis fabrication. From the clinical aspect, diagnostic models obtained from
alginate and type III dental stone are completely acceptable for the diagnostic purpose (Davies
et al., 2001), and the familiarity of the clinicians with the process can offset the problem of
distortion. Therefore, any newly proposed wax-up protocol should exhibit at least similar
accuracy to currently used wax-up protocol.
1.6.2. Aesthetic
It is acknowledged that prosthodontic treatment will improve aesthetics. Restoring anterior
teeth can optimise their dimensions, display and shade (Raj, 2013). The existence of teeth
appearance in harmony is associated with greater aesthetic perception (Lombardi, 1973; Levin,
1978). Therefore, the wax-up should enhance the dental aesthetics on the diagnostic model
(Figure 1-7).

17
A B
Figure 1-7 An example of aesthetic improvement by the diagnostic wax-up. (A) Pre-treatment models. (B) Wax-up models.
Achieving appropriate dental aesthetics is based on the understanding of the operator of the
aesthetic parameters. Although the acceptable aesthetic appearance is known for its
subjectivity, many authors recommended following objective guidelines. These guidelines are
thought to reflect harmony of dentition in the aesthetic zone and were established from
naturally perceived dental aesthetics (Raj, 2013). Some of the commonly discussed variables
are the perceived frontal proportion (PFP), tooth morphology, the relationship between teeth
and soft tissue and tooth colour (Gillen et al., 1994; Raj, 2013).
Consistent PFP was proposed to infer that there is a relationship between teeth aesthetics and
mathematical proportion (Levin, 1978). The rationale was repeated proportion between the
maxillary anterior teeth is associated with greater harmony and aesthetics (Lombardi, 1973). In
addition, the presence of known recurrent values may simplify achieving good aesthetic
outcome of the restorative treatment. According to the PFP of the maxillary anterior teeth, the
apparent size of the teeth becomes progressively smaller from the midline distally. Levin had
postulated that the ideal PFPs of the lateral incisors and canines to central incisors are 62%
and 38% respectively (Levin, 1978). He named that proportion as the golden proportion (GP).
However, this assumption has not been confirmed by other studies which had shown lack of
coincidence with GP and the generally wider perceived maxillary lateral incisors and canines
has been observed by several earlier studies on natural dentition (Hasanreisoglu et al., 2005;
Ali Fayyad et al., 2006; Persson et al., 2006). Preston had found that in relation to the central
incisors, the PFP of the lateral incisors and canines were 66.2% and 55.6% respectively
(Persson et al., 2006). Similarly, Hasanreisoglu et al. found that the lateral incisors and canines
proportions were 65.9% and 52.3% respectively (Hasanreisoglu et al., 2005). Ali Fayyad et al.
reported that the GP had only existed in 31.3-27.1% of their evaluated population (Ali Fayyad
et al., 2006). Even after treatment, the evidence of development of a recurrent ratio is
minimal. Pini et al. had analysed the existence of GP following prosthodontic and orthodontic

18
treatment of lateral incisors agenesis (Pini et al., 2012). They did not confirm the existence of
GP for the majority of their treated patients. Thus, it could be speculated there is no recurrent
mathematical proportion, and the lateral incisors and, mainly, the canines tend be larger than
what has been proposed by GP (Ward, 2007).
Figure 1-8 Frontal image that illustrates the PFP. As the tooth moves distally, it is perceived to be smaller.
Interestingly, several authors had critiqued the aesthetic value of GP after observing that the
GP did not coincide with the majority of beautiful smiles. Rosenstiel et al. had altered frontal
image by software to incorporate GP. They found that dentists tend to rank frontal images
with GP as less attractive (Rosenstiel et al., 2000). In a follow-up study, they found that lay
persons had minimal preference for images coinciding with GP (Rosenstiel and Rashid, 2002).
Similarly, Mahshid et al. found no relation between GP and what is perceived to be aesthetics
(Mahshid et al., 2004). Basting et al. found that dentists preferred greater proportions than
what has been proposed in GP (Basting et al., 2006). Further, Ward had confirmed that
dentists tend to prefer larger proportions than GP (Ward, 2007). Among the limitations of GP is
the appearance of excessively wide central incisors, which is equivalent to the perceived width
of the lateral incisors and canines (Ward, 2007). Therefore, not only GP rarely exists naturally,
the utilization of GP is not a reliable method to achieve desirable aesthetics of the anterior
maxillary teeth. Like many aspects in nature, instead of being mathematically determined, the
acceptable proportion for the anterior teeth appears to fit within a range.
The tooth morphology is frequently determined by the width-to-height (W:H) ratio, embrasure
appearance, edges roundness and incisal edge location. Deficient or worn down teeth are
expected to have greater W:H ratio than intact teeth (Magne et al., 2003). On the contrary,
lengthening the teeth allows increasing teeth display, restoring anterior teeth relationship and
restoring natural anatomy (Abduo and Lyons, 2012). In a study on natural non-restored young

19
dentition, Gillen et al. found the W:H ratio of the central incisors, lateral incisors and canines
to be 90.2%, 83.9% and 82.5% respectively (Gillen et al., 1994). Likewise, Sterret et al. found
the ranges to be 85-86%, 76-79% and 77-81% (Sterrett et al., 1999). Hasanreisoglu et al. had
found very similar W:H values (89-91%, 82-83% and 83-87% respectively) (Hasanreisoglu et al.,
2005). Zlateri et al. had found slightly less W:H ratio (82.9%, 78.1% and 81.2%) respectively
(Zlataric et al., 2007). Similar outcome was observed by Pini et al, who evaluated the W:H ratio
of the restored anterior dentition that suffered from agenesis of the lateral incisors (Pini et al.,
2013). Due to the minor variation in the outcome of these studies, strict adherence to a
specific proportion should be avoided.
Dental symmetry has significant impact on dental aesthetics. After evaluation of several
smiles, Durgekar et al. had found that lay persons tend to prefer symmetrical smiles (Durgekar
et al., 2010). Similarly, Machado et al. had established that minor unilateral vertical
discrepancies can be perceived as unaesthetic (Machado et al., 2013). Naturally, there should
be relative similarity between contralateral teeth (Mavroskoufis and Ritchie, 1980). The most
symmetrical teeth are the central incisors (Ward, 2001; Hasanreisoglu et al., 2005). The
symmetry tends to reduce as the tooth becomes away from the central incisor (Hasanreisoglu
et al., 2005). The importance of central incisors symmetry was emphasized by several
investigations. In a web-based survey, Brunzel et al. had proved that symmetrical position of
the central incisors is crucial while minor discrepancy in lateral incisors position can be
tolerated (Brunzel et al., 2006). Yet, in the natural dentition, absolute symmetry of the central
incisors is very unlikely (Mavroskoufis and Ritchie, 1980; Gillen et al., 1994). Mavroskoufis and
Ritchie had found that 60% of young individuals had an accumulated central incisors
discrepancy of more than 0.2 mm (Mavroskoufis and Ritchie, 1980). In an aesthetic appraisal
by lay persons and orthodontists, it was found that minor perceived vertical discrepancy of the
incisal edges (0.5 mm) within the central incisors was detected by different investigator
groups. However, vertical discrepancy in the lateral incisor was acceptable by the orthodontist
up to 0.5 mm, while the lay persons had accepted discrepancy of up to 1 mm (Machado et al.,
2013). On the contrary to the incisors, Pinho et al. had found that even 2 mm perceived
asymmetry of the canine cusp tip was acceptable by orthodontists and lay persons (Pinho et
al., 2007). Therefore, through the wax-up, planning of a uniform symmetry will improve the
dental aesthetics. Achieving symmetry is more critical for teeth closer to the midline. Yet,
reasonable deviation from absolute symmetry is not necessary perceived as unaesthetic.
The gingival morphology is more significant for patients with average to high lip line (Sonick,
1997; Camargo et al., 2001; Mehta and Lim, 2010). The dental appearance is likely to be more
aesthetic if the gingival contour is symmetrical and follows the contour of the upper lip (Kois,

20
1994; Sonick, 1997; Donovan and Cho, 2001). The gingival height of the central incisors should
be similar to the canines, while the gingival height of the lateral incisors should more incisal
than the central incisors. On the labial aspect of maxillary anterior teeth, the peak convexity of
the gingival margin should be positioned distal to the long axis of the tooth. The interdental
papilla should exhibit knife-edge morphology and occupy the interdental embrasure gingival to
the contact point. In most of the situations, the definitive prosthodontic treatment has
minimal influence on the gingival aesthetics, unless surgical gingival re-contouring is planned.
In these situations, diagnostic wax-up can include gingival modifications (Kois, 1996; Kois and
Phillips, 1997; Lee and Jun, 2000). Gingival morphological modifications can be incorporated
into the wax-up by extending the wax teeth to the anticipated postsurgical gingival margin. An
index produced from the wax-up can be used by the surgeon to indicate the planned gingival
margin (Lee and Jun, 2000; Lee, 2004). From this margin, a biologic width of 2 mm should be
preserved (Gargiulo et al., 1961). Where the gingival tissues are deficient, gingival
augmentation procedure can be considered (Nowzari, 2001). Alternatively, in some cases, pink
porcelain is incorporated in the prosthesis and can be evaluated by diagnostic wax-up (Vryonis,
1981) (Figure 1-9).
A B
Figure 1-9 An example of a compromised clinical presentation that requires gingival tissues restoration. (A) A diagnostic wax-up that incorporates gingival tissues. (B) Definitive prosthesis with pink porcelain that replaces the missing gingival tissues was constructed according to the wax-up.
Overall, although the literatures do not support a specific recipe for dental aesthetics, the use
of combination of variables as guides to establish dental aesthetics is reasonable (Gillen et al.,
1994). It is clear that dental aesthetic is perceived differently between different individuals.
This emphasizes the significance of incorporating diagnostic wax-up in contemporary dental
practice. As each patient can provide feedback about the anticipated dental aesthetics, the
challenge of subjectivity is reduce. Thus, a mutual satisfaction between the clinician and
patient can be reached (Magne and Belser, 2004). In addition, further aesthetic evaluation of

21
the wax-up can take place in the form of provisional restorations or composite restorations
(Magne and Belser, 2004; Gurel, 2007).
1.6.3. Contour
The contour and profile of a prosthesis contributes to whether the prosthesis will blend
harmoniously with the adjacent teeth and gingival tissues. The tooth contour has significant
relevance on the invasiveness of tooth preparation, the cleanliness of the prosthesis, and the
overall aesthetics. In the process of prosthodontic treatment, a specific amount of tooth
structure on different surfaces should be removed to provide sufficient space for the crown
restoration. This space is necessary to ensure that there is enough bulk of the prosthesis
material for aesthetics, mechanical durability and adequate contour of the crown (Becker and
Kaldahl, 1981; Goodacre et al., 2001). It has been speculated that, the ideal prosthesis contour
should follow the contour of the remaining tooth structure without prominent convexity. This
feature will ensure that the prosthesis blends harmoniously with the adjacent teeth (Becker
and Kaldahl, 1981).
The emergence profile, which is the axial contour of the prosthesis from the base of the
gingival sulcus to the supragingival aspect, should exhibit a straight profile (Croll, 1989) (Figure
1-10). Such a contour will render the tooth more cleansable at the critical regions (Sackett and
Gildenhuys, 1976; Becker and Kaldahl, 1981; Sorensen, 1989). On the other hand, excessive
over-contouring of the gingival third of the crown can alter the biologic relationship between
the tooth and the periodontium, impede adequate cleaning and contribute to gingival
inflammation (Sackett and Gildenhuys, 1976; Sorensen, 1989; Broadbent et al., 2006).
However, it is not uncommon for tooth contour to be altered following prosthetic treatment
(Meijering et al., 1998; Vasconcelos et al., 2009) and, in many instances, altering the tooth
contour may be desirable and is perceived as an objective of the treatment.

22
A B
Figure 1-10 (A) A straight profile in the gingival third facilitates establishing a properly contoured prosthesis. (B) Widening the profile gingivally is associated with over-contoured prostheses.
In the literature, three concepts for establishing axial tooth contour were described:
duplication of original tooth anatomy, under-contouring, and over-contouring. Preserving the
original tooth contour is thought to be biocompatible with its surrounding environment (Croll,
1989; Vasconcelos et al., 2009). The drawback of this concept is tooth modifications following
the treatment are restricted to the pre-treatment tooth contour. Under-contouring the crowns
is another method based on the clinical observation that the gingival tissues will likely to be
maintained as they are self-cleansible (Perel, 1971; Tjan et al., 1980; Becker and Kaldahl,
1981). However, this method is impractical as it could affect the appearance, crown thickness
and preparation invasiveness (Tjan et al., 1980). This could explain why this method is not
favoured. The third method is contouring the restoration according to pre-treatment planning
in the form of diagnostic wax-up (Magne et al., 2003; Magne and Belser, 2004; Gurel, 2007).
The rationale behind this method is the tooth preparation is dictated by the final volume of
crown restoration rather than the existing tooth contour. Therefore, there is a tendency for
this method to be more conservative, but could result in over-contoured surfaces.
Several studies have confirmed the contour alteration following the restorative treatment
(Meijering et al., 1998; Vasconcelos et al., 2009). With the aid of contact scanner and image
registration, Meijering et al. found the dimensions of the veneered teeth were unintentionally
increased, resulting in over-contoured labial surfaces (Meijering et al., 1998). In the same
study, the increase in the labial contour was in the range of 0.33 mm to 0.59 mm. Further, they
found that the increase tends to be greater incisally. Similarly, a contact profilometer study by
Vasconcelos et al. found the contour of all the veneered teeth significantly increased from the
original contour by 0.37 mm to 0.44 mm. They also found that the increase of the contour was

23
directly related to the distance from the gingival margin (Vasconcelos et al., 2009). They
indicated that there is a tendency for the manufacturing technician to produce over-contoured
restorations. From the technical perspective, producing over-contoured restorations might be
desirable since it will facilitate tooth shape improvement, provide more material space for
natural shade matching, and increase restoration bulk and durability (Goodacre et al., 2001).
It has been postulated that an enlarged tooth contour will inhibit adequate home care and
hinder self-cleansing abilities, which will inevitably contribute to increased gingival
inflammation, periodontal complications and subsequent caries (Sackett and Gildenhuys,
1976; Sorensen, 1989; Broadbent et al., 2006). From an anatomical perspective, Burch et al.
recommended that the maximal convexity should occur on the gingival third of the crown of
the restored tooth and should not exceed 0.5 mm (Burch and Miller, 1973). In a dog study,
Perel increased the contour on the labial aspect 0.5 mm above the gingival margin. The over-
contoured restorations resulted in gingival inflammation (Perel, 1971). However, this outcome
was refuted by another dog study which found that as long as professional oral hygiene is
properly executed, periodontal health is minimally influenced by the over-contoured crowns
(Kohal et al., 2003). A follow-up study by the same investigators confirmed that the microbial
composition was slightly affected by the over-contoured crown (Kohal et al., 2004). In a human
split-mouth study, Ehlrich and Hochman provided up to 1 mm over-contoured crowns on one
side and under-contoured crowns on the other side. After a period of 4 months, the
periodontal status between the two sides was found to be similar (Ehrlich and Hochman,
1980). Likewise, Sundh and Kohler (Sundh and Kohler, 2002), on 6 patients, tried three
experimental crowns with different emergence profiles. After one week of normal oral hygiene
practice, all the experimental crowns exhibited similar plaque quantity and quality. Further,
the plaque quality was similar to the contralateral control teeth. The conclusion was that an
increased emergence profile did not contribute to increased plaque accumulation. Therefore,
it appears that as long as adequate oral hygiene can be maintained, reasonable over-
contouring (up to 1 mm) will not contribute to periodontal complications.
It is likely that over-contouring the teeth will increase their aesthetics. This could be attributed
to the greater aesthetic demand and the attempt to improve the tooth dimensions (Magne
and Belser, 2004). This has been confirmed by Ehlrich and Hochman who reported that 3 out
of 4 participants preferred the over-contoured crowns over the under-contoured crowns
(Ehrlich and Hochman, 1980). Slight over-contouring of anterior teeth might be advantageous
from the conservative perspective. Since the anterior teeth have less tooth structure available
for the preparation than posterior teeth, there is a clinical preference to minimize the amount
of tooth reduction (Goodacre et al., 2001). For example, the cervical dentine thickness for the

24
mandibular incisors in some regions is about 1.5 mm (Katz and Tamse, 2003). Therefore, a
shoulder or chamfer of 1 mm width will sacrifice a major proportion of the remaining teeth
and can lead to pulpal complications. Alternatively, under-preparation and slight over-
contouring of the crown restoration might be a conservative approach. Consequently,
diagnostic wax-up is strongly recommended in situations where significant tooth contour
alteration is to take place. An index constructed according to the diagnostic wax up can be
utilized to ensure the preparation is restoratively-driven and adequate for the final crown
volume, rather than the initial tooth contour (Magne and Belser, 2004; Gurel, 2007). From the
biological aspect, maintaining the cleanliness of the anterior teeth is very feasible. Therefore, it
could be envisaged that slightly over-contoured anterior teeth will not hinder regular patient
home care, and the advantages of reasonable over-contouring of anterior crown restorations
exceeds the potential risk.
On the other hand, it is advantageous for the posterior teeth, especially molars, to have
minimal contour increase. From the aesthetic perspective, since most of the posterior teeth
are not in the aesthetic zone, there is minimal merit in significantly altering their labial
contour. Further, there will be no clinical advantage of increasing the contour of the posterior
teeth to realign them (Bryant, 2003). In addition, for posterior teeth, it is more important to
avoid prominent convexity as they are more difficult to clean than anterior teeth. The
importance of a straight profile for posterior teeth is even greater in situations where the
furcation is exposed. The fabricated crown form should have a flat emergence profile coronally
so that there is no undercut to trap food or plaque (Yuodelis et al., 1973; Becker and Kaldahl,
1981), and the crown should re-create the contours of the furcation, to merge or blend with
the coronal aspects of the crown to minimise cleaning difficulty in these areas.
Therefore, the contour of the prosthesis should be carefully considered during the diagnostic
wax-up. Through the wax-up procedure, the contour is easily changed on the waxed surfaces.
The best combination of prosthesis durability, cleansibility and aesthetics should be selected
by the treating clinician.
1.6.4. Intercuspal occlusal contacts
Occlusal contacts in maximal intercuspation position are thought to be essential for
maintaining teeth alignment, stability of the mandible and efficiency of mastication, since
maximal teeth contacts occur in this position (Yurkstas and Manly, 1949; Becker and Kaiser,
1993; Wiskott and Belser, 1995; Hidaka et al., 1999; Owens et al., 2002; Wang and Mehta,
2013). As many patients requiring prosthodontic treatment have deficient occlusal surface due
25
to wear, fracture and old restorations, it is important to idealise the occlusal contacts through
the wax-up procedure. The occlusal surface is comprised of positive features, such as cusp tips
and ridges, and negative features such as grooves and fossae. This morphology dictates the
quality and quantity of occlusal contacts. Several variables were commonly used to describe
the quality of occlusal contacts at maximal intercuspation. For example, pattern of contacts,
number of contacts and surface area of the occlusal contacts (Julien et al., 1996; Owens et al.,
2002).
In terms of occlusal contact pattern, in normal dentitions, the mandibular buccal cusp should
fit into the central fossae and embrasures of the maxillary teeth and the maxillary palatal cusps
into the central fossae and embrasures of the mandibular teeth (Stuart, 1964; Lundeen, 1971;
Wiskott and Belser, 1995). Historically, several authors stated the desire to attain cusp-to-fossa
contact as opposed to cusp-to-marginal ridge contact (Lucia, 1962; Stuart, 1964). The rationale
behind this preference is the cusp-to-fossa relationship is more likely to maintain the stability
of teeth by directing the occlusal forces vertically along the long axis of the tooth, as the cusps
are nested in the fossae (Wang and Mehta, 2013). Further, this arrangement will reduce the
risk of food impaction. On the contrary, cusp-to-marginal ridge relationship is thought to be
associated with greater lateral contacts elements, and the food is likely to be packed
proximally. Thus, teeth will be less stable and might be vulnerable to proximal contacts
opening (Lucia, 1962). However, although this appears to be mechanically sound (Lucia, 1962;
Stuart, 1964), there is no clinical evidence supporting this claim (Wang and Mehta, 2013).
In designing the cusp-to-fossa relationship, two conflicting theories were discussed. The first
theory is the cusp tripodization which states that the cusp-to-fossa contacts are limited to
three points (tripodal contacts) on the sides of the cusps but with no contact on the cusp tip
(The Glossary of Prosthodontic Terms, 2005). This theory was proposed by the gnathologist for
the hope of maintaining the cusp tip by protecting it from wear, yet without compromising the
direction of vertical forces (Lucia, 1962). Eventually, stable cusp-to-fossa relationship is
achieved. However, although such relationship will facilitate producing very natural anatomy,
it is very difficult to establish artificially (Wang and Mehta, 2013). The alternative method is
the cusp-to-fossa contact through the cusp tip which is favoured by Pankey-Mann-Schuyler
(PMS) theory. According to this philosophy, it is acceptable for cusp tip to occlude against
widened fossa. The rationale behind this technique is allowing a degree of freedom in
eccentric movement uninfluenced by tooth inclines. Thus, the risk of interferences
development is reduced while loading the teeth vertically (Schuyler, 1963; Davies and Gray,
2001). Further, it is easier to produce teeth with such simpler scheme than the gnathology
theory (Schuyler, 1963; Davies and Gray, 2001). This explains why this view took preference

26
over the gnathology theory (Darveniza, 2001). As the cusp tip occludes against central fossa,
the design ensures that contacts on inclines do not occur, which will further enhance the
stability (Darveniza, 2001). Although what has been proposed by these philosophies is based
on sound mechanical understanding, there lack of actual clinical evidence (Koyano et al., 2012;
Wang and Mehta, 2013). Since natural dentition has combination of contacting surfaces and
inclines has been observed (Hochman and Ehrlich, 1987; Wiskott and Belser, 1995), it might be
that the cusp-to-fossa relationship has been overrated in the earlier literature. Currently, cusp-
to-fossa relationship is preferred, without negating the use of cusp-to-marginal ridge
relationship (Becker and Kaiser, 1993; Koyano et al., 2012).
As the amount of contacting surfaces indicates the active chewing surfaces (Wiskott and
Belser, 1995), the contact number and contact area have been used frequently as a measure of
the adequacy of dental occlusion. In the literature, the contact number (McNamara and Henry,
1974; Korioth, 1990b; Ciancaglini et al., 2002; Delong et al., 2002) and area (Hidaka et al.,
1999; Owens et al., 2002; Iwase et al., 2011) were heavily investigated and quantified. Most of
the studies had evaluated the contact number and area of intact natural dentition in young
individuals. However, occlusion features are dynamic and subject to change with aging and
dental treatment. Restoration, tooth wear and fracture will inevitably affect the tooth
morphology and subsequently the contact number and area will change in the intercuspal
position overtime (Yi et al., 1996). To date, most of the research was centred on the contact
number and area of the natural dentition. However, evaluation of the occlusal changes over
time was minimally investigated.
In relation to the contact number, Becker and Kaiser recommended that each tooth should
have at least one contact (Becker and Kaiser, 1993). On natural dentition of young individuals,
DeLong et al. and Korioth found that each tooth had about 1.5 – 1.75 contacts per tooth
(Korioth, 1990a; Delong et al., 2002). On the other hand, earlier studies on occlusal contact
area revealed significant variations (Hidaka et al., 1999; Delong et al., 2002; Alkan et al., 2006;
Iwase et al., 2011). The variation of the occlusal contact area measurements is very likely to be
due to differences of the methods applied for area quantification (Owens et al., 2002). Slight
vertical discrepancies between the opposing models can lead to prominent alterations in the
contact area (Wilding et al., 1992; Hidaka et al., 1999). A commonly applied method for
recording the contact area is the use of occlusal medium. The drawback of this method is the
ease of introduction of minimal vertical displacement, which can cause significant
underestimation of the contact area. On the contrary, virtual quantification of occlusal contact
area can potentially cause slight overlapping of the models (Iwase et al., 2011), which will
overestimate the contact area.

27
The location of the tooth in the arch appears to be a strong determinant of the occlusal
contact number and area for the pre-treatment and post-treatment models. The posterior
teeth exhibit greater contact number and area than anterior teeth (Ehrlich and Taicher, 1981;
McDevitt and Warreth, 1997). On natural young individual dentition, McNamara and Henry
found 8 times more contact on posterior teeth compared to the anterior teeth (McNamara
and Henry, 1974). Similarly, another study found that the posterior teeth had 3 times more
contacts than the anterior teeth (Ciancaglini et al., 2002). On the restored dentition (Yi et al.,
1996), it has been found that the posterior teeth had twice the contact number than the
anterior teeth. In relation to the contact area, the posterior teeth were found to consistently
have greater contact area than the anterior teeth (Yurkstas and Manly, 1949; Owens et al.,
2002). Similarly to what has been mentioned earlier, it is likely that the implemented
methodologies influence the area outcome. The more profound contacts on the posterior
teeth are due to greater area, cuspal morphology and interdigitation of the opposing teeth.
The anterior teeth, on the other hand, have more confined surfaces and incisal edges. This
observation fits with the mutually-protected occlusion concept, where the posterior teeth
prevent excessive contact of the anterior teeth in maximal intercuspation (Beyron, 1964; The
Glossary of Prosthodontic Terms, 2005).
Nevertheless, the true impact of contact number and area is still to be determined. After more
than 10 years of prosthetic treatment, Yi and Carlsson found an average of 1 contact per tooth
(Yi et al., 1996), yet no abnormal physiological consequences were observed. This was further
supported by several studies on shortened dental arch that confirmed that although the
number of total occlusal contacts is less than the complete dentition contact, the patient can
function within normal physiological abilities (Kanno and Carlsson, 2006).
Therefore, after the wax-up process, adequate intercuspal occlusal contacts should be present.
According to the available literature, this involves accurate interdigitation at maximal
intercuspation, posterior teeth with cuspal morphology and at least single contact on each
opposed tooth.
1.6.5. Lateral occlusion scheme
Among the conjectured principles for the prosthodontic treatment is the selection of the
lateral occlusion scheme that can be implemented in prosthesis design. Through prosthodontic
treatment, the lateral occlusion scheme can be controlled by altering teeth morphologies,
alignments and orientations. For dentate patients, the available lateral occlusion schemes are
canine-guided occlusion (CGO), group function occlusion (GFO) and bilaterally balanced

28
occlusion (BBO) (Thornton, 1990). CGO is defined as a mutually-protected articulation, in
which the vertical and horizontal overlap of the canine teeth disengages the posterior teeth in
the lateral movement of the mandible (The Glossary of Prosthodontic Terms, 2005). On the
other hand, GFO is distinguished by the existence of multiple contacts between the maxillary
and mandibular teeth in lateral movement on the working side (The Glossary of Prosthodontic
Terms, 2005). The simultaneous, anterior and posterior occlusal contact of teeth in centric and
eccentric positions is called BBO (The Glossary of Prosthodontic Terms, 2005). Anecdotally,
several claims have been made supporting each lateral occlusion philosophy. For example,
CGO will protect posterior teeth laterally while the anterior teeth are protected in the centric
position; hence the term “mutually-protected occlusion”. The canines were considered ideal
guidance teeth because of their strategic location, anatomy and proprioceptive properties
(Rinchuse et al., 2007). Conversely, GFO has been assumed to facilitate a wide distribution of
occlusal forces over many teeth instead of single tooth; therefore, a more comfortable,
efficient and functional occlusion can be established (Thornton, 1990). Nevertheless, there is a
lack of compelling evidence indicating the superiority of any philosophy (Becker and Kaiser,
1993; Turp et al., 2008).
Through the diagnostic wax-up procedure it is possible to plan for lateral occlusion scheme
alterations. This can be done by altering the morphologies of the canines and posterior teeth.
However, among the limitations of proposing rigid criteria for the lateral occlusion scheme is
the possible discrepancy between the classical definitions and what is considered to be a
physiological occlusion. According to the Glossary of Prosthodontic Terms (2005), any
occlusion that is in harmony with functions of the masticatory system is deemed physiological.
This could potentially mean that as long as the lateral occlusion scheme is not contributing to
mechanical, biological or aesthetic problems, it can be deemed as physiological occlusion.
A recent systematic review on natural dentition indicated a clear heterogeneity of lateral
occlusion scheme prevalence between the available studies on lateral occlusion scheme of the
natural dentition (Abduo et al., 2013). Due to the variation of each lateral occlusion scheme
prevalence after partial and complete excursive movements, it could be postulated that true
CGO or GFO hardly, if ever, exists in nature and the classical criteria might not be applicable.
However, there is an overall consistency on the factors associated with lateral occlusion
schemes, such as magnitude of excursion, static occlusal relationship and age effect.
All the studies that compared different degrees of excursion found that the CGO prevalence is
lower after partial excursion than after complete excursion (Yaffe and Ehrlich, 1987; Ingervall
et al., 1991; Ogawa et al., 1998; Al-Nimri et al., 2010). Likewise, the opposite was observed for
29
GFO. This observation was attributed to the greater number of sole canine contacts on the
working side after complete excursion; while the prevalence of premolar and molar contacts,
in addition to canine contacts, are greater on the working side after partial excursion (Ogawa
et al., 1998).
With aging, there is a decline of CGO prevalence. On the contrary, the prevalence of GFO
followed an opposite pattern. Such alterations support that occlusion is dynamic, adaptive and
subjected to changes with time (Beyron, 1954; Panek et al., 2008). The aging effect can be
primarily attributed to tooth wear, which is a physiological phenomenon and can increase the
number of lateral tooth contacts (Ingervall, 1972; Ingervall et al., 1991).
In terms of masticatory function, there is some evidence of the cross sectional studies that the
lateral occlusion scheme has influence on chewing cycle, chewing velocity, condylar loading
and EMG activities (Belser and Hannam, 1985; Jemt et al., 1985; Okano et al., 2002; Okano et
al., 2005; Okano et al., 2007). However, significant long-term functional difference cannot be
established. The clinical studies revealed that patients have the capacity to adapt to CGO or
GFO as new lateral occlusion scheme (Dahl and Krogstad, 1985; Gross and Ormianer, 1994;
Ormianer and Gross, 1998; Ormianer and Palty, 2009). The applied lateral occlusion scheme
appears to have a minimal impact on patient’s comfort, and biological or mechanical
complications (Yi et al., 1996; Hemmings et al., 2000; Redman et al., 2003; Poyser et al., 2007;
Schmidlin et al., 2009; Attin et al., 2012; Al-Khayatt et al., 2013). Instead, mechanical
complications are associated with other risk factors such as bruxism, restorative material
properties and implant prosthesis occluding against implant prosthesis.
Historically, temporomandibular joint disorder (TMD) was commonly attributed to occlusal
factors; however, the available studies revealed that there is no causative relationship
between lateral occlusion schemes and TMD development (Weinberg, 1964; Ingervall et al.,
1991; Donegan et al., 1996; Kahn et al., 1999). Therefore, the current state of evidence
indicates that occlusal treatment will not prevent or treat TMD. Instead, non-occlusal
treatment is considered more justifiable and conservative (De Boever et al., 2000a; b; Koh and
Robinson, 2003; Liu et al., 2012; Turp and Schindler, 2012).
Since the long-term studies have confirmed that patients with CGO or GFO can function
comfortably, a bench mark lateral occlusion scheme cannot be proposed, as stated by earlier
reports (Becker and Kaldahl, 1981; Turp et al., 2008). Consequently, it is recommended to
implement flexibility and broader principles in occlusion design (Becker and Kaldahl, 1981;
Turp et al., 2008; Carlsson, 2010). Therefore, for the diagnostic wax-up, instead of adhering to
a preconceived occlusion scheme when complex restorative treatment is indicated, the

30
clinician should consider an occlusion scheme that is practical, simple, conservative and allows
aesthetic treatment (Becker and Kaiser, 1993; Wiskott and Belser, 1995; Bryant, 2003;
Carlsson, 2010). Therefore, when executing a diagnostic wax-up, CGO and GFO are acceptable.
The lateral interferences should be avoided, as they might contribute to increased patient
awareness and excessive prosthesis loading (Becker and Kaiser, 1993; De Boever et al., 2000a;
b).
1.6.6. Vertical dimension of occlusion
The Glossary of Prosthodontic Terms (2005) defines the vertical dimension as the distance
between two selected anatomic points. The vertical dimension when the mandibular teeth are
occluding with the maxillary teeth is defined as the vertical dimension of occlusion (VDO). The
VDO for dentate individuals is mainly determined by the remaining dentition, hence loss of
tooth substance might influence the VDO. A loss of VDO can significantly influence patient
function, comfort and aesthetics (Turner and Missirlian, 1984).
In some cases, vertical dimension alteration can be incorporated within the diagnostic wax-up
(Morgan et al., 1975). Increasing the VDO from the clinical perspective has been reported to
facilitate the treatment of patients presenting with generalized and complex dental
abnormalities such as generalized tooth wear and significant occlusal irregularities (Johansson
and Omar, 1994; Keough, 2003b; Johansson et al., 2008). However, prior to VDO alterations,
series of comprehensive extra-oral and intra-oral assessments should be followed. Extra-orally,
features such as magnitude of VDO loss, facial profile and aesthetics, and status of the
temporomandibular joint (TMJ) should be considered.
Intra-oral assessment is more relevant to the prosthodontic treatment and involves examining
the remaining tooth structure and occlusion status. The prognosis of a dental restoration is
directly determined by the amount of remaining tooth structure (Goodacre et al., 2001). For
generalized loss of vertical tooth height, the clinician is faced with the dilemma of limited
remaining tooth structure that can retain the restoration. The original tooth height determines
the active preparation height, which can be defined as the vertical distance between the
preparation margin and the occlusal-axial line angle. In order to avoid compromising the
preparation height, increasing the VDO should be considered to provide adequate space to
accommodate the restorative material. The merit behind this technique is more prominent in
generalized loss of tooth height manifested from tooth wear

31
The final preparation height is a critical determinant of the need and the magnitude of the
VDO increase. It has been recommended that the minimal tooth preparation height should be
3 to 4 mm (Maxwell et al., 1990; Parker et al., 1993; Goodacre et al., 2001). If this dimension is
not available, adjunctive treatment, such as VDO increase, should be considered.
Patients with a worn anterior dentition suffer from a loss of clinical crown height and the
possibility of development of an edge-to-edge incisal relationship (Crothers and Sandham,
1993; Johansson et al., 2008). As a result, the aesthetic appearance is affected and the anterior
tooth guidance is lost (Sarita et al., 2003). In these situations, increasing the VDO rectifies the
anterior tooth relationship, by re-establishing an overjet and overbite, and facilitating the
establishment of anterior tooth guidance (Keough, 2003a; Vence, 2007). Anterior tooth
guidance is desirable as it is believed to protect the posterior teeth in eccentric movements
(Becker and Kaiser, 1993; Pokorny et al., 2008; Carlsson, 2009).
Increasing VDO has been considered by some authors to be a hazardous procedure that can
violate a patient’s dental physiology and adaptation (Tench, 1938; Schuyler, 1939). The basis of
such claims is the thought that VDO occurs at a specific level that should be maintained
through an individual’s life (Turner and Missirlian, 1984). The anticipated consequences of
increasing the VDO are hyperactivity of the masticatory muscles, elevation in occlusal forces,
bruxism and TMD (Tench, 1938; Schuyler, 1939; Turner and Missirlian, 1984). On the other
hand, multiple articles have challenged the hypothesis of the negative implications of
increasing VDO (Carlsson et al., 1979; Dahl and Krogstad, 1982; 1985; Gross and Ormianer,
1994; Ormianer and Gross, 1998; Ormianer and Palty, 2009). In general, their outcomes reflect
the safety, patient adaptation and predictability of increasing the VDO. This is true in relation
to TMJ and masticatory muscle health.
In relation to the magnitude of increasing the VDO, an increase of up to 5 mm inter-incisally is
a feasible alteration (Carlsson et al., 1979; Dahl and Krogstad, 1982; 1985; Gross and Ormianer,
1994; Ormianer and Gross, 1998; Ormianer and Palty, 2009). Such outcomes support the
assumption of other investigations that physiological VDO occurs at a range, commonly known
as the comfort zone, rather than a specific constant level. Subsequently, it could be expected
that the patient can adapt to an alteration in VDO as long as it is confined to this zone. The
possible adaptation mechanisms to an increased VDO could be masticatory muscle
lengthening and relaxation, dentoalveolar maturation, or a combination of these two
mechanisms (Ormianer and Gross, 1998). However, from the clinical perspective, it is wise to
keep the VDO increase to minimal, as this will simplify the restorative treatment. This is more

32
important when arch discrepancy exists, such as in Angle Class II and III occlusions (Jensen,
1990a; c).
Currently, the clinical techniques to assess VDO loss are of limited predictability and reliability.
Therefore, they cannot be used reliably to estimate the magnitude of increasing VDO (Rivera-
Morales and Mohl, 1991; 1992). Instead, the factors that should be considered as
determinants for increasing the VDO are the remaining tooth structure, the space available for
the restoration, occlusal variables and aesthetics. All of these factors can be evaluated by the
diagnostic wax-up and further validated by intra-oral provisional restorations. Since any
restorative material can be applied on the occlusal surface in a space of 2 mm (Hemmings et
al., 2000; Goodacre et al., 2001), a 4 mm interarch space will be adequate for comprehensive
rehabilitation. Subsequently, a VDO increase greater than 5 mm inter-incisally is rarely
indicated from the clinical perspective. From the available studies, the negative consequences
of increased VDO are of a minimal nature and most of the signs and symptoms resolve within
two weeks. Therefore, it is wise to consider a probationary increase of the VDO, with a fixed
provisional restorations or composite build-ups, fabricated according to the wax-up, for a
period of a few weeks before the provision of the definitive prostheses.
1.7. Conventional Wax-Up Protocol
To complete the conventional diagnostic wax-up, the following steps should be followed
(Magne et al., 1993):
1. Obtaining diagnostic models: impressions for the diagnostic models are normally taken by
alginate impression material and stock tray (Romeo and Bresciano, 2003). The impressions
are poured by dental stone. The diagnostic models should be accurate, and represent the
patient’s dental arches.
2. Mounting diagnostic models on dental articulator: generally, semi-adjustable or fully-
adjustable articulator is used (Romeo and Bresciano, 2003). Dental facebow can be used to
mount the maxillary model; however, its use is debatable (Carlsson, 2009). Alternatively,
due to the lack of evidences, arbitrary articulation is assumed to be sufficient.
3. Altering the tooth form: the tooth form is executed by addition of dental wax and/or
trimming external surfaces (Magne et al., 1993; Cutbirth, 2001; Kois et al., 2008). The
tooth alteration tends to be restricted to area of treatment (Chen and Raigrodski, 2008).
Further, missing teeth can be replaced by wax or acrylic teeth.

33
Currently, the conventional wax-up protocol has been considered the gold standard for many
years. However, all the involved steps require considerable human intervention and
manipulation of materials that may also exhibit inherent processing shrinkage and/or
expansion (Wataha and Messer, 2004; Sadan et al., 2005). This can translate to increased
processing errors, and inaccuracies, as well as increased time and cost. Further, considerable
skill is required to produce a wax-up of good quality (Pietrobon and Paul, 1997; Romeo and
Bresciano, 2003). The problems of the conventional protocol are however offset by the
familiarity of the processes by the operators.
For the anterior teeth, two tooth alteration methods are available: additive waxing on the
labial surface (Magne and Douglas, 1999b) and using prefabricated wax pattern (Magne et al.,
1996). The former method is more suitable for veneers or full coverage crown restorations
planning, while the other method is best suited to replace missing teeth. Prior to the wax
addition, the magnitude of tooth alterations should be determined. This involves locating the
incisal edge and the transitional line angle between the facial and proximal surfaces (Magne
and Douglas, 1999a; Curry, 1998; Romeo and Bresciano, 2003). The initial contour is obtained
by addition of vertical and horizontal lobes that dictate the overall tooth outlines (Romeo and
Bresciano, 2003). At the last stage, tooth outline, final contour, interproximal contacts and
surface texture are refined (Magne and Douglas, 1999a; Pietrobon and Paul, 1997) (Figure 1-
11).
A B
Figure 1-11 (A) Frontal and occlusal views of pre-treatment anterior teeth that clearly shows deficient tooth morphology. (B) Similar views after the wax-up indicate establishment of natural morphology.

34
For posterior tooth form alteration, it is recommended to develop positive and negative
features such as cusps, ridges, grooves and fossae (Figure 1-12). On the contrary to simple and
flat surfaces, these features will establish natural tooth appearance and ideal pattern of
occlusal contacts. When the cusps are properly formed, they should be convex on all the
surfaces and contact the opposing teeth in several and well-distributed locations. On the other
hand, flat opposing surfaces will produce fewer and large contact areas (Shillingburg et al.,
2000).
A B
Figure 1-12 (A) Prior to the treatment, the teeth can be worn, fractured or heavily restored. (B) the wax-up establishes natural occlusal anatomy such as cusps, grooves and fossae.
Shillingburg et al. discussed their method in executing the wax-up (Shillingburg et al., 2000).
Prior to waxing, the occlusal surface can be reduced for about 1.5 mm. This will provide space
for the wax addition. On the occlusal surface, a wax cone is added on the position of each
cusp, starting with the functional cusps. The cones are added with the aid of heated
instrument. This is followed by adding a triangular ridge that extends from the cusp tip to the
central groove. The triangular ridge is narrow at the cusp and wide at its base in the central
groove. After the addition of the triangular ridges, the axial contours are finalized (Shillingburg
et al., 2000). In general, the contour of the adjacent teeth and the occlusal contacts with the
opposing tooth are used as a guide (Figure 1-13). An alternative method is the addition of wax
in excess and carving the desired morphology from the wax to remove the unwanted wax
(Davies et al., 2001).

35
A B
Figure 1-13 (A) The adjacent teeth should exhibit similar axial contour. (B) In situations where a tooth deviates from the contour of the adjacent teeth, there might be aesthetic, functional and hygienic implications.
1.8. Digital Wax-Up Protocol
More recently, with the advent of laser scanning, virtual planning, rapid prototyping and
computer-aided design and manufacturing, it is hypothesized that diagnostic planning can be
accomplished in time-efficient and well-controlled fashion (Abduo, 2012). With the aid of a
scanning system, the actual pre-treatment models can be converted to virtual models (Yoshida
et al., 2011). Multiple alterations can be executed and assessed virtually with 3D designing
software (Bootvong et al., 2010). After attaining the ideal tooth morphology, new actual
models can be printed by rapid prototyping technology. In addition, natural dental staining can
be applied to the printed model to mimic the anticipated final outcome. As an alternative way,
the diagnostic wax-up can be used directly to produce provisional restorations (Guth et al.,
2012; Lin et al., 2013).
The digital diagnostic wax-up protocol is assumed to exhibit several advantages (Abduo, 2012;
Abduo and Lyons, 2013). As the process is completely computerized, the need of technician
involvement and high technical skills is minimal. As a result, minimal time will be consumed
and there will be no material wastage. Eventually, multiple treatment proposals can be
evaluated with no additional costs. Most of the 3D softwares allow quantification of tooth
alteration which enhances the precision of the prosthodontic treatment. As all the models are
digitized, the wax-up can be conducted in distant centers and transferred electronically to the
treatment clinician. This feature will also allow distant consultation.
Several algorithmic approaches were proposed to model natural teeth (Rekow et al., 1991;
Mehl et al., 2005b; Ender et al., 2011). The techniques available can be summarized as follows:
occlusal generated path, approximation of defect margins, fitting normalized intact tooth
surfaces, fitting average tooth, scanning manually waxed tooth, and mirror image of the
contralateral tooth.
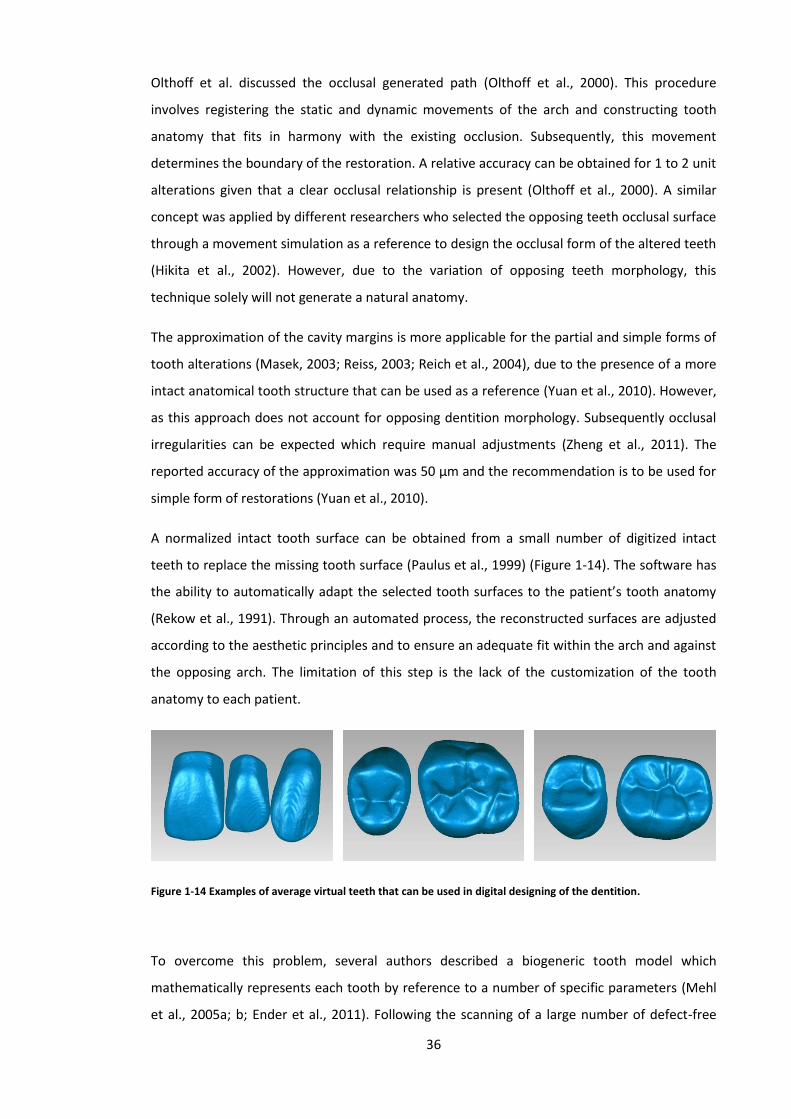
36
Olthoff et al. discussed the occlusal generated path (Olthoff et al., 2000). This procedure
involves registering the static and dynamic movements of the arch and constructing tooth
anatomy that fits in harmony with the existing occlusion. Subsequently, this movement
determines the boundary of the restoration. A relative accuracy can be obtained for 1 to 2 unit
alterations given that a clear occlusal relationship is present (Olthoff et al., 2000). A similar
concept was applied by different researchers who selected the opposing teeth occlusal surface
through a movement simulation as a reference to design the occlusal form of the altered teeth
(Hikita et al., 2002). However, due to the variation of opposing teeth morphology, this
technique solely will not generate a natural anatomy.
The approximation of the cavity margins is more applicable for the partial and simple forms of
tooth alterations (Masek, 2003; Reiss, 2003; Reich et al., 2004), due to the presence of a more
intact anatomical tooth structure that can be used as a reference (Yuan et al., 2010). However,
as this approach does not account for opposing dentition morphology. Subsequently occlusal
irregularities can be expected which require manual adjustments (Zheng et al., 2011). The
reported accuracy of the approximation was 50 µm and the recommendation is to be used for
simple form of restorations (Yuan et al., 2010).
A normalized intact tooth surface can be obtained from a small number of digitized intact
teeth to replace the missing tooth surface (Paulus et al., 1999) (Figure 1-14). The software has
the ability to automatically adapt the selected tooth surfaces to the patient’s tooth anatomy
(Rekow et al., 1991). Through an automated process, the reconstructed surfaces are adjusted
according to the aesthetic principles and to ensure an adequate fit within the arch and against
the opposing arch. The limitation of this step is the lack of the customization of the tooth
anatomy to each patient.
Figure 1-14 Examples of average virtual teeth that can be used in digital designing of the dentition.
To overcome this problem, several authors described a biogeneric tooth model which
mathematically represents each tooth by reference to a number of specific parameters (Mehl
et al., 2005a; b; Ender et al., 2011). Following the scanning of a large number of defect-free

37
teeth, an “average tooth” was statistically calculated which essentially represent a number of
parameters commonly present in any tooth, such as fossae, grooves and cusp tips. Therefore,
these parameters can be used to compare the average tooth to any natural tooth. Through the
reconstruction process, the differences between each individual tooth and the average tooth
were measured to obtain a list of typical deviations from the average. Tooth reconstruction
was then accomplished by matching the specific features of the average tooth and the list of
the calculated deviations. This method was proven to be efficient in reconstructing the full
anatomic tooth design (Mehl et al., 2005a; b; Ender et al., 2011). Ender et al. found that the
biogeneric method provided a more natural and a faster determination of the surface
morphology compared to a simple selection from a range of teeth (Ender et al., 2011). In
addition, recent studies found that combining the biogeneric methodology in conjunction with
the opposing teeth anatomy resulted in more accurate occlusal contacts (Fasbinder and
Poticny, 2010).
For anterior teeth, where the morphology is much less complex, a mirror image can be
obtained from the contralateral tooth, rotated and translated to fit the locations of the defect
(Probst and Mehl, 2008). However, this technique requires an acceptable contralateral tooth
and assumes a perfect symmetry which is not necessarily a natural appearance.
Similar to the conventional wax-up protocol, the teeth morphology of the opposing arch
greatly affects the restoration anatomy. Since the final restoration anatomy is dependent on
the opposing arch, the scanning accuracy of the opposing arch is mandatory.
Despite the clear merit of digital diagnostic wax-up, the amount of research on this subject is
very minimal and this technology remains in its infancy. In order to justify the routine use of
digital diagnostic wax-up, it should be at least as reliable to the conventional wax-up in terms
of accuracy, aesthetics and practicality.
1.9. Contributions of the thesis
Since this thesis is a thesis by publications, it is composed of series of coherent papers. There
are three types of generated papers: literature review, methods validation and actual
experimentation.
Part of Chapter 1 was published as a clinical literature review that summarizes the factors that
should be considered prior to complex prosthodontic treatment. Chapters 2 to 4 are
systematic reviews that outline the current state of evidence about some variables that can be

38
influenced by the diagnostic wax-up of complex prosthodontic treatment. For example, the
vertical dimension of occlusion (Chapter 2) and the lateral occlusion scheme. The later was
investigated at two levels: lateral occlusion scheme of natural and minimally restored dentition
(Chapter 3) and lateral occlusion scheme of the restored dentition (Chapter 4).
The materials and methods section (Chapter 6) was published in two papers. The first
publication is a conference paper which was a pilot study. It summarized the tests that were
implemented for the rest of the thesis and allowed for technique refinement. An additional
paper was published strictly on the image registration feature of the methodology. To
demonstrate the potential accuracy of the image registration process, it was implemented as a
forensic odontology tool. The same method was used to compare the digital wax-up to the
conventional wax-up. The outcome of this paper confirmed the validity of the digital
comparison of virtual models.
Chapters 7 to 11 list the experiments that compared the digital and the conventional wax-ups.
The comparison was based on the features that can be influenced by the diagnostic wax-up.
Therefore, wax-up precision (Chapter 7), tooth contour (Chapter 8), intercuspal occlusal
contacts (Chapter 9), lateral occlusion scheme (Chapter 10), and dental aesthetics (Chapter
11). As such experiments have not been conducted in earlier literature; the outcome of this
thesis is expected to be an original contribution to the field.
The general discussion section (Chapter 12) critiqued the outcome of the study and discussed
the methodology limitations. Further, the future applications and modifications were
proposed. The manufacturing procedure of digital dentistry was also discussed and published
in a narrative review.

39
Chapter Two
2. Safety of Increasing Vertical Dimension of
Occlusion: A Systematic Review
This chapter was published in the following article:
Abduo J. Safety of increasing vertical dimension of occlusion: a systematic review.
Quintessence International. 2012; 43:369-380. (Appendix C)

40
2.1 Abstract
Objective: The purpose of this study is to review all the literature investigating the implications
of increasing the vertical dimension of occlusion (VDO).
Materials and methods: A comprehensive electronic search was conducted through PubMed
(MEDLINE) with the aid of Boolean operators to combine the following key words: ‘occlusal
vertical dimension,’ ‘increasing vertical dimension,’ ‘bite raising,’ ‘occlusal space,’ ‘resting
vertical dimension,’ ‘rest position,’ ‘altered vertical dimension,’ ‘mandibular posture,’
‘temporomandibular joint’ and ‘masticatory muscles’. The search was limited to peer-reviewed
articles written in English and published up to August 2011. Further, the literature search was
endorsed by manual searching through peer-reviewed journals and reference lists of the
selected articles.
Results: A total of 902 studies were initially retrieved but only 9 of them met the specified
inclusion criteria for the review. From the selected studies, four variables were identified to be
relevant to the topic of VDO increase: magnitude of VDO increase, method of increasing VDO,
occlusion scheme and the adaptation period.
Conclusions: Considering the limitations of this review it could be concluded that whenever
indicated, permanent increase of the VDO is a safe and predictable procedure. Intervention
with fixed restoration is more predictable and results in higher adaptation level. Negative signs
and symptoms were identified, but they were self-limiting. Due to the lack of a well-designed
study, further controlled and randomized studies are needed to confirm the outcome of this
review.
Key words: occlusal vertical dimension, patient adaptation, occlusion, occlusal splint, muscle
relaxation

41
2.2. Introduction
According to the Glossary of Prosthodontic Terms (2005), the vertical dimension is defined as
the distance between two selected anatomic or marked points. For dentate individuals, the
vertical dimension of occlusion (VDO) is largely determined by the occluding dentition (The
Glossary of Prosthodontic Terms, 2005). Subsequently, loss of tooth substance will directly
affect the VDO leading to alteration in facial morphology, function, comfort and aesthetics
(Turner and Missirlian, 1984). Although the loss of VDO is possible clinically, the original VDO
can be maintained by dentoalveolar compensatory mechanism that involves the over-eruption
of worn teeth. This dynamic nature of the stomatognathic system is considered by several
authors as adaptation mechanism of the masticatory system in response to progressive loss in
tooth substance (Murphy, 1959; Berry and Poole, 1976; Richards, 1985; Varrela, 1992;
Crothers and Sandham, 1993). However, for generalized loss of crown height due to tooth
wear, from the clinical perspective, it is advantageous to consider increasing the VDO as it will
provide space for restorative material, enhance the aesthetic tooth display, rectify anterior
teeth relationship, allow for re-establishing physiological occlusion and minimize the need for
biologically invasive clinical procedures such as crown lengthening surgery and elective
endodontic treatment (Rivera-Morales and Mohl, 1991; Johansson and Omar, 1994; Keough,
2003b; Johansson et al., 2008).
Empirically, many authors claimed that the VDO is a constant dimension through individual
life. Subsequently, they expressed concerns and reservations regarding altering the VDO
through dental rehabilitative treatment (Tench, 1938; Schuyler, 1939; Turner and Missirlian,
1984). The expected consequences of increasing the VDO are hyperactivity of masticatory
muscles, elevation of bite force and temporomandibular disorder (TMD). However, to date,
there is no compelling evidence supporting the pathological consequences of altering the VDO.
The purpose of this study is to systematically review all the clinical studies that assessed the
implications of increasing the VDO, and to identify the factors associated with patient
adaptation.
2.3. Materials and Methods
A comprehensive electronic literature search was conducted through MEDLINE (PubMed) with
the aid of Boolean operators. The outcomes of the following key words were combined:
‘occlusal vertical dimension,’ ‘increasing vertical dimension,’ ‘bite raising,’ ‘occlusal space,’
‘resting vertical dimension,’ ‘rest position,’ ‘altered vertical dimension,’ ‘mandibular posture,’

42
‘temporomandibular joint’ and ‘masticatory muscles’. No publication year limit was applied.
The purpose of the search was to obtain all the clinical studies that assessed the effect of
increasing the vertical dimension of occlusion. The search included articles published up to
August 2011 that contained all or part of the key words in their headings. The electronic search
was endorsed with manual searching through the following journals: Journal of Oral
Rehabilitation, Journal of Prosthetic Dentistry, Journal of Prosthodontics, International Journal
of Prosthodontics, International Journal of Periodontics and Restorative Dentistry, Journal of
Dentistry, Quintessence International and Journal of Prosthodontic Research. Further, the
references of each selected article were reviewed for possible inclusion. Initially, the potential
studies were selected on the basis of the relevance of the titles and abstracts. Subsequently,
the full text of the article was reviewed and cross-matched against the predefined selection
criteria (Table 2—1). The inclusion criteria were as follows: human clinical studies on dentate
and asymptomatic individuals; a minimum of 5 participants followed for at least 5 days; the
increase of VDO must be established by clinically relevant methods that might include full or
partial arch coverage. The study was excluded if it was an animal study, a study on edentate or
symptomatic individuals, or a case report.
Table 2—1 Selection criteria used in the review
Inclusion criteria Human clinical study For dentate individuals Including follow-up of at least 5 days Increasing the VDO by full or partial arch coverage On asymptomatic individuals At least 5 participants Involving permanent or temporary increase of VDO Peer reviewed journal article In English Exclusion criteria
Animal study For edentate individuals On symptomatic individuals Case report

43
2.4. Results
2.4.1. Study search
The electronic search had initially retrieved 902 articles. The analysis of titles and abstracts
excluded 838 articles, leaving only 64 articles eligible for inclusion. Following the application of
the inclusion criteria, 26 articles were considered to be suitable for full-text analysis which
then revealed that only 6 articles were acceptable for inclusion (Carlsson et al., 1979; Dahl and
Krogstad, 1985; Burnett and Clifford, 1992; Gross and Ormianer, 1994; Ormianer and Gross,
1998; Ormianer and Palty, 2009). Searching manually and through the references of the
selected articles, 3 additional articles were disclosed (Christensen, 1970; Dahl and Krogstad,
1982; Gough and Setchell, 1999). Two of the studies (Dahl and Krogstad, 1985; Ormianer and
Gross, 1998) are follow-ups of the same participants of previous experiments (Dahl and
Krogstad, 1982; Gross and Ormianer, 1994). As they provide information regarding the long-
term effect of increasing the VDO, they were included. Therefore, a total of 9 articles
(Christensen, 1970; Carlsson et al., 1979; Dahl and Krogstad, 1982; 1985; Burnett and Clifford,
1992; Gough and Setchell, 1999; Gross and Ormianer, 1994; Ormianer and Gross, 1998;
Ormianer and Palty, 2009) were considered acceptable for this systematic review (Tables 2—2,
2—3, 2—4 and 2—5).
2.2.1. Description of studies
The selected studies show significant heterogeneity in relation to study design. Therefore,
qualitative analysis of the studies was applied. One of the possible sources of this variation is
the discrepancy in the inclusion of participants. The participants ranged from healthy
individuals (Christensen, 1970; Carlsson et al., 1979; Burnett and Clifford, 1992), where no
treatment is indicated, to individuals with worn dentition (Dahl and Krogstad, 1982; 1985;
Gross and Ormianer, 1994; Gough and Setchell, 1999; Ormianer and Gross, 1998) or missing
teeth (Ormianer and Palty, 2009), where intervention is indicated. The difference between the
studies is even more prominent in relation to the technique of patient adaptation assessment.
The applied assessment techniques were:
1. Evaluation of subjective patient symptoms such as headache, clenching, grinding, muscle
and joint fatigue, soreness of teeth, cheek biting, and difficulties in chewing and speech
(Christensen, 1970; Carlsson et al., 1979; Dahl and Krogstad, 1982; 1985; Gross and
Ormianer, 1994; Gough and Setchell, 1999).

44
2. Masticatory muscles tenderness to palpation (Christensen, 1970; Carlsson et al., 1979;
Gross and Ormianer, 1994; Ormianer and Gross, 1998).
3. Electromyography (EMG) (Carlsson et al., 1979).
4. Objective Speech and closest speaking space evaluation (Burnett and Clifford, 1992).
5. Interocclusal space measurement (Gross and Ormianer, 1994; Ormianer and Gross, 1998).
6. Radiographic measurement of the vertical dimension with the aid of tantalum implants
inserted in the mandible and maxilla (Dahl and Krogstad, 1982; 1985).
7. Evaluation of mechanical and biological complications associated with restored teeth or
implants (Gough and Setchell, 1999; Ormianer and Palty, 2009).
2.2.2. Studies classification
For the purpose of uniformity, the studies were classified in to the two broad categories,
according to the prosthetic concept for increasing the VDO; fixed (Tables 2—2 and 2—3) or
removable (Tables 2—4 and 2—5) method. From the identified studies, the fixed method is
comprised from provisional restorations, composite build-ups, onlays and definitive fixed
restorations. The removable method involved increasing the VDO by an occlusal splint or
removable partial denture. Alternatively, by the experimental studies, the removable occlusal
splint was temporarily cemented on one of the arches to ensure continuous splint wearing.
For each category, the increase in the VDO was accomplished by either fully or partially
covering the arch. The partial arch coverage was further divided into anterior teeth coverage
or posterior teeth coverage. The anterior teeth coverage was based on treatment concept
where the partial increase of the VDO intended to orthodontically extrude the posterior teeth
and intrude the anterior teeth commonly known as the “Dahl concept” (Dahl and Krogstad,
1982).
In addition, the following variable were reported from each study; magnitude of the VDO
increase, duration of follow-up after increasing the VDO, occlusion scheme, adaptation level
and adaptation period.
Wherever possible, the exact magnitude of the VDO increase was recorded from each study.
The duration of treatment follow-up after increasing the VDO was discretely classified into the
following:

45
1. Experimental duration: up to 1 week
2. Short-term duration: up to 1 month
3. Medium-term duration: from one month to 2 years
4. Long-term duration: over 2 years
The occlusion scheme was classified as follows:
1. Static relationship: the maxilla-mandibular relationship after increasing the VDO.
2. Dynamic relationship: the form of guidance after increasing the VDO. In general, from the
selected studies, the dynamic occlusal relationship can be mutually-protected occlusion,
group function occlusion or bilaterally balanced occlusion.
3. The adaptation level is defined as the proportion of the participants who adapted to the
increase in the VDO. The adaptation period is the time required for the VDO increase-
related symptoms to resolve.
2.2.3. Studies summary
In general, the VDO increase range was from 2 mm to 5 mm. The studies clearly stated that the
static occlusal relationship after increasing the VDO was according to centric relation (CR). In
relation to the dynamic occlusal relationship, three studies established bilaterally balanced
occlusion (Christensen, 1970; Carlsson et al., 1979; Burnett and Clifford, 1992), four studies
established mutually-protected occlusion (Dahl and Krogstad, 1982; 1985; Gross and
Ormianer, 1994; Ormianer and Gross, 1998), and one study established unilateral group
function on premolars and molars (Ormianer and Palty, 2009). One study did not clarify the
dynamic occlusal relationship (Gough and Setchell, 1999). Regarding the duration of the
studies, three studies were of experimental nature and followed the participants for up to 1
week (Christensen, 1970; Carlsson et al., 1979; Burnett and Clifford, 1992). One study was a
short-term study that followed the participants for up to 1 month (Gross and Ormianer, 1994).
Two studies were classified as medium-term studies and followed the participants in average
for less than 2 years (Dahl and Krogstad, 1982; Gough and Setchell, 1999). The other studies
were long-term studies and followed the participants for more than 2 years (Dahl and
Krogstad, 1985; Ormianer and Gross, 1998; Ormianer and Palty, 2009).

46
Most of the studies agreed that patient adaptation can be obtained after increasing the VDO.
Only one study reported no adaptation to VDO increase (Christensen, 1970). For the other
studies, the adaptation level was 86-100% for the removable method and 100% for the fixed
method. The adaptation period ranged from 2 days to 3 months.

47
Table 2—2 Summary of studies increasing the VDO by removable method and partial arch coverage
Study (year) Study details Method Main findings Design N Duration VDO
increase (mm)
Occlusion Assessment method
Adaptation rate (%)
Adaptation period
Further comments
Static Dynamic
Posterior teeth coverage Christensen (1970) P 20 7 days 4 CR BBO -Subjective symptoms
-Muscles tenderness 0 No adaptation -Development of TMD signs and symptoms
-Development of clenching, grinding, soreness of teeth, cheek biting, speech difficulties and chewing limitations -Muscle and joint fatigue
Carlsson et al. (1979)
P 6 7 days 4 CR BBO -Subjective symptoms -Muscles tenderness -Radiographic evaluation -EMG
86 1-2 days -Development of clenching, speech difficulties and discomfort -No implication on muscles tenderness -Reduction of EMG activities -New interocclusal distance was established -One participant could not adapt to the intervention
Anterior teeth coverage Dahl and Krogstad (1982)
P 20 6-14 months 1.8-4.7 CR MPO -Radiographic evaluation of inserted tantalum implants -Subjective symptoms
100 2 weeks -Development of speech difficulties and chewing limitations with lisping being the most prominent -No symptoms of dysfunction or pain -Teeth over-eruption was more prominent than intrusion especially for younger participants -The average increase in VDO after the completion of the treatment was 1.9 mm
Gough and Setchell (1999)
R 11 5.9 months and up to 4.1 years
Variable CR NA -Subjective symptoms -Patient compliance -Biological complications
91% NA -One patient could not wear the appliance -Minimal signs of functional discomfort -Minimal pulpal and periodontal symptoms and vitality loss
NA, not available; P, prospective; R, retrospective; CR, centric relation; BBO, bilaterally balanced occlusion; MPO, mutually-protected occlusion.

48
Table 2—3 Summary of studies increasing the VDO by removable method and complete arch coverage
Study (year)
Study details Method Main findings Design N Duration VDO
increase (mm)
Occlusion Assessment method Adaptation rate (%)
Adaptation period
Further comments
Static Dynamic Burnett and Clifford (1992)
P 6 5 days 4 CR BBO -CSS NA NA
-Up to 1 mm reduction in CSS -Significant reduction of CSS after increasing VDO
NA, not available; P, prospective; CR, centric relation; BBO, bilaterally balanced occlusion; CSS, closest speaking space.
Table 2—4 Summary of studies increasing the VDO by fixed method and partial arch coverage
Study (year)
Study details Method Main findings Design N Duration VDO
increase (mm)
Occlusion Assessment method Adaptation rate (%)
Adaptation period
Further comments
Static Dynamic
Anterior teeth coverage Dahl and Krogstad (1985)
P 20 67 months and up to 5.5 years
1.8-4.7 CR MPO -Radiographic evaluation of inserted tantalum implants
100 NA -Variable long-term individual response to adaptation -Reduction of the increased VDO through the treatment period (1.73 mm after 6 months and 1.52 mm after 67 months)
Gough and Setchell (1999)
R 39 5.9 months and up to 4.1 years
Variable CR NA -Subjective symptoms -Patient compliance -Biological complications
100 NA -Greater patient compliance with fixed appliance than removable appliance -Minimal signs of function discomfort -Minimal pulpal and periodontal symptoms and vitality loss
NA, not available; P, prospective; R, retrospective; CR, centric relation; MPO, mutually-protected occlusion.
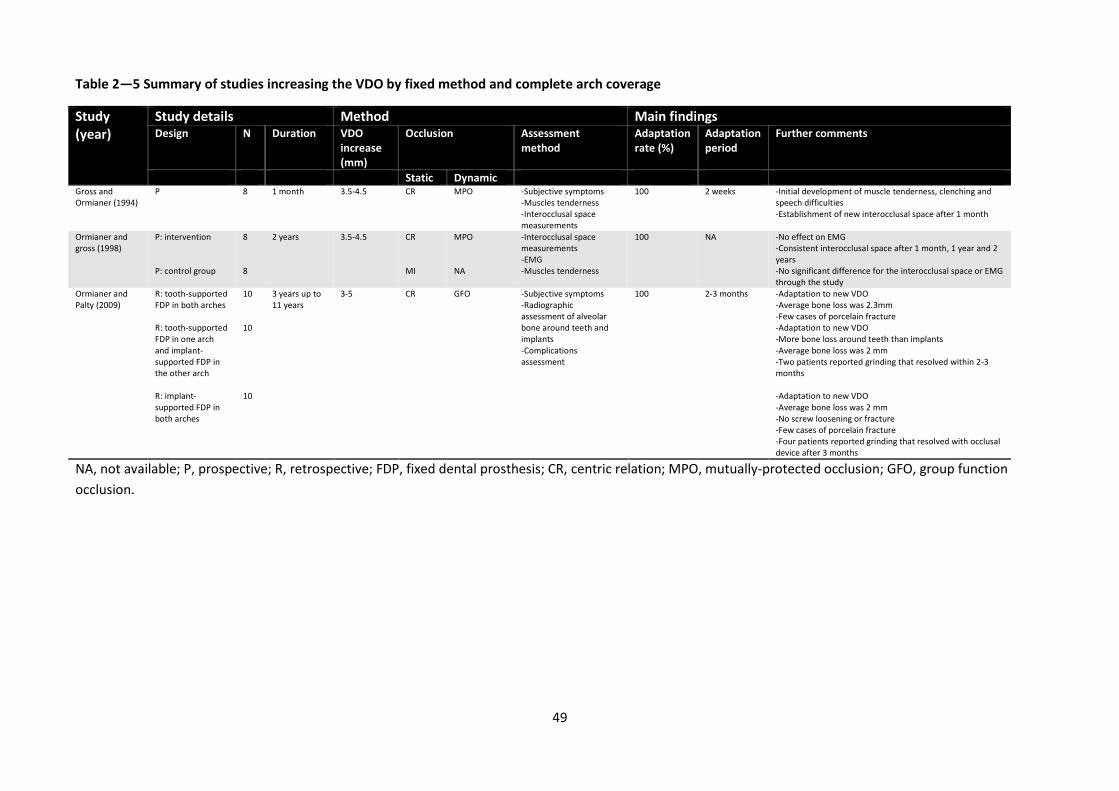
49
Table 2—5 Summary of studies increasing the VDO by fixed method and complete arch coverage
Study (year)
Study details Method Main findings Design N Duration VDO
increase (mm)
Occlusion Assessment method
Adaptation rate (%)
Adaptation period
Further comments
Static Dynamic Gross and Ormianer (1994)
P 8 1 month 3.5-4.5 CR MPO -Subjective symptoms -Muscles tenderness -Interocclusal space measurements
100 2 weeks -Initial development of muscle tenderness, clenching and speech difficulties -Establishment of new interocclusal space after 1 month
Ormianer and gross (1998)
P: intervention
8 2 years 3.5-4.5 CR MPO -Interocclusal space measurements -EMG -Muscles tenderness
100 NA -No effect on EMG -Consistent interocclusal space after 1 month, 1 year and 2 years
P: control group 8 MI NA -No significant difference for the interocclusal space or EMG through the study
Ormianer and Palty (2009)
R: tooth-supported FDP in both arches
10 3 years up to 11 years
3-5 CR GFO -Subjective symptoms -Radiographic assessment of alveolar bone around teeth and implants -Complications assessment
100 2-3 months -Adaptation to new VDO -Average bone loss was 2.3mm -Few cases of porcelain fracture
R: tooth-supported FDP in one arch and implant-supported FDP in the other arch
10 -Adaptation to new VDO -More bone loss around teeth than implants -Average bone loss was 2 mm -Two patients reported grinding that resolved within 2-3 months
R: implant-supported FDP in both arches
10 -Adaptation to new VDO -Average bone loss was 2 mm -No screw loosening or fracture -Few cases of porcelain fracture -Four patients reported grinding that resolved with occlusal device after 3 months
NA, not available; P, prospective; R, retrospective; FDP, fixed dental prosthesis; CR, centric relation; MPO, mutually-protected occlusion; GFO, group function
occlusion.

50
2.3. Discussion
Although the included articles provide information regarding patient adaptation to increased
VDO, they suffer from lack of randomization and control. In addition, the therapy was applied
to a limited number of participants and there is a lack of agreeable subjective and objective
signs and symptoms assessments. Therefore, the results should be interpreted with caution.
In general, the outcomes of the studies reflect the adaptation of the masticatory system after
increasing VDO in a time-dependent fashion. The emphasis of the discussion is placed on
potential factors influencing the adaptation to the increase in the VDO; namely the magnitude
of VDO increase, adaptation period, method of increasing the VDO and occlusion scheme.
2.3.1. Magnitude of VDO increase
Several authors mentioned the merit of increasing the VDO as a method to facilitate the
restorative treatment and enhance dental aesthetics (Rivera-Morales and Mohl, 1991; Keough,
2003b). These advantages are even more obvious for a dentition suffering from prominent
tooth wear (Figure 2-1) (Johansson and Omar, 1994; Johansson et al., 2008). However, to date,
there are no clear objective guidelines that determine the ideal increase of the VDO which can
be physiologically accepted by the patient (Turner and Missirlian, 1984; Rivera-Morales and
Mohl, 1991). A commonly measured clinical variable is the freeway space (FWS) that is the
difference in vertical dimension between when the mandible is at rest and when the mandible
is in occlusion (The Glossary of Prosthodontic Terms, 2005). The rationale behind measuring
the FWS is to determine how the VDO can be altered. An FWS of 2 mm has been suggested as
the physiological space, and therefore an FWS of more than 2 mm indicates that the VDO can
be safely increased (Turner and Missirlian, 1984).
A B C
Figure 2-1 (A) A dentition that suffers from tooth wear. (B) As a result, the teeth are short and in edge-to-edge relationship. (C) The definitive prostheses involved 3 mm increase of the VDO. Increasing the VDO allowed for significant aesthetic improvement, correction of anterior tooth relationship, establishment of a natural overjet and overbite, and lengthening the anterior teeth.

51
Interestingly, several of the included studies in this systematic review reported patients’
adaptation even after increasing the VDO beyond the FWS (Carlsson et al., 1979; Gross and
Ormianer, 1994; Ormianer and Gross, 1998; Ormianer and Palty, 2009). Therefore, this
systematic review supports the observation of many authors that concluded the physiological
posture of the mandible occurs at a zone commonly named as the “comfort zone” rather than
a specific constant location (Tryde et al., 1977; Rivera-Morales and Mohl, 1991; Abekura et al.,
1996).
Despite the selected studies revealed that patients can adapt to an increase of VDO of up to 5
mm, it is impossible to determine the upper limit since there is a lack of evidence in relation to
a greater increase in the VDO. Nevertheless, from the clinical perspective, it is difficult to
recommend a greater increase in the VDO due to its significant impact on the horizontal
relationship of the teeth (Keough, 2003b; Johansson et al., 2008). As a consequence, greater
clinical expertise is necessary to manage these cases. The emerging complexities are mainly
related to loss of anterior teeth guidance, excessive increase in the overjet and loss of lip
competence (Keough, 2003b). Such complexities are, however, advantageous in the case of
severely worn dentition where a class III incisal relationship or collapsed lower third of the face
might be evident (Figure 2-2) (Turner and Missirlian, 1984; Johansson et al., 2008).
A B C
Figure 2-2 The impact of tooth wear on the anterior tooth relationship. (A) Natural relationship of anterior teeth with intact crowns. (B) Tooth wear resulting in the development of a class III (edge-to-edge) incisal relationship. (C) Increasing the VDO allowed for restoring an adequate anterior tooth relationship.
Therefore, until clear guidelines are established in relation to the ideal magnitude of increasing
the VDO, empirical clinical procedures should be employed and is largely variable between
individual patients. It is also wise to consider increasing the VDO to the minimal level required
to address patient functional and aesthetic needs.

52
2.3.2. Adaptation period
In general, the short-, medium- and long-term studies reported resolution of signs and
symptoms of maladaptation throughout the period of the studies. However, the experimental
studies disclosed less level of adaptation (Christensen, 1970; Carlsson et al., 1979; Burnett and
Clifford, 1992). This is anticipated from the short follow-up period (5-7 days) and the nature of
studies, where the occlusal splint is temporary cemented on the remaining teeth. Nonetheless,
the outcome of the experimental studies indicated that the immediate acceptance to
increasing the VDO can be related to masticatory muscles lengthening and relaxation. This
statement is supported by Carlsson et al. who found reduction of EMG activities after
increasing the VDO (Carlsson et al., 1979). After a period of 1 month, the short-term study
(Gross and Ormianer, 1994) obtained high adaptation level after increasing the VDO. The
clinical significance of this observation is that permanent restoration can be predictably
delivered after a period of 1 month. Likewise, the medium-term studies further proved the
stability of increased VDO and the dentoalveolar maturation (Dahl and Krogstad, 1982; Gough
and Setchell, 1999). In addition, the long-term study that partially covered the anterior arch
segment reported that occlusal stability was achieved due to orthodontic movement
manifested as intrusion of the occluding segments of the arch and over-eruption of the non-
occluding segments of the arch (Dahl and Krogstad, 1985). Although complete relapse of the
altered VDO did not occur, an average of 0.4 mm reduction of the increased VDO was
observed (Dahl and Krogstad, 1985). On the contrary, the long-term study that covered the
whole arch found that the relapse of VDO to its original value was minimal (Ormianer and
Gross, 1998). This indicated that muscle relaxation and increase in muscle length were the
primary adaptation mechanisms rather than alterations in dentoalveolar dimensions. This is
even endorsed by the finding of Ormianer and Palty that reported patient adaptation even
when the implant support was utilized (Ormianer and Palty, 2009). Therefore, it could be
speculated that the VDO increase after partial coverage of the arch will lead to dentoalveolar
alterations, while the complete coverage will immediately establish the occlusion with minimal
alterations in the dentoalveolar complex. The clinical significance of this finding is that
complete coverage of the arch will manage the patient in a more predictable and time
controlled fashion.
Since the majority of the studies reported resolution of signs and symptoms within 1-2 weeks,
it is wise to consider a probationary period of a few weeks before the placement of complex
definitive restorations. Throughout this period, the patient can be thoroughly reviewed and
the restoration adjusted accordingly.

53
2.3.3. Method of increasing VDO
Since the studies (Christensen, 1970; Carlsson et al., 1979; Dahl and Krogstad, 1982; Gough
and Setchell, 1999) that increased the VDO by removable method reported development of
signs and symptoms, it could be speculated that the removable method, suffered from a
greater level of complications and limited patient compliance. After covering the mandibular
molars only, Christensen reported development of multiple complications that led him to the
conclusion that increasing VDO can lead to joint and muscle derangement (Dahl and Krogstad,
1982). However, due confining the occlusal coverage to mandibular molars only, the
intervention protocol in this study seems more similar to creating an occlusal interferences
rather than increasing the VDO. This is in accordance with other investigations that found
experimental introduction of occlusal interferences caused short-term clinical signs and
symptoms (Seligman and Pullinger, 1991; Christensen and Rassouli, 1995a; b). Carlsson et al.
anticipated that the subjective signs and symptoms after increasing the VDO are associated
with the discomfort from wearing the splint rather than a direct effect of the VDO increase
(Carlsson et al., 1979). Likewise, the phonetic difficulties reported by Burnett and Clifford could
be due to covering the incisal surfaces of mandibular anterior teeth, which is significantly
associated with phonetics (Burnett and Clifford, 1992). Although the removable splint provided
by Dahl and Krogstad achieved high level of acceptance, lisping was the most commonly
reported complaint, which can be the result of covering the palatal surfaces of the maxillary
anterior teeth (Dahl and Krogstad, 1982; 1985). However, the complaints associated with their
metal splint were limited in comparison with the previously mentioned studies that applied
acrylic splints (Christensen, 1970; Carlsson et al., 1979; Burnett and Clifford, 1992). Due to the
better fit and smoother finish, the metal splint contributes to greater comfort, adaptation and
less interference with patient function.
After comparing fixed and removable methods for increasing the VDO, Gough and Setchell
found that the fixed method was more predictable and comfortable to the patient (Gough and
Setchell, 1999). Consequently, for the rehabilitation procedure where the VDO increase is
indicated, it is wise to reconsider the benefit of wearing the removable splint, since it does not
provide a predictable indication for patient acceptance or adaptation. In general, the
significant splint limitations are patient discomfort, interference with speech and the lack of
aesthetic assessment. Nevertheless, the splint should still be considered when the patient
presents with TMD signs and symptoms before embarking into definitive rehabilitation (Dao
and Lavigne, 1998; Al-Ani et al., 2005).
In relation to the fixed method, all the studies reported consistent and predictable patient
adaptation. Where the restorations are tooth-supported, the most commonly reported

54
symptoms are the subjective grinding and clenching, which has the tendency to resolve within
1-2 weeks. For implant-supported prostheses, extended adaptation period (2-3 months) was
reported (Ormianer and Palty, 2009). A possible explanation of this finding is that patients
were initially edentulous and suffered from considerable reduction in the occlusal force, even
with conventional complete dentures (Zarb, 1983). However, several authors established that
after the replacement of the conventional complete dentures by implant-supported
prostheses, the occlusal force increased dramatically (Lindquist and Carlsson, 1985; Carr and
Laney, 1987). Subsequently, these patients might experience immediate improvement of the
occlusal force that can manifest clinically as increased grinding and clenching. Another
explanation of increased grinding and clenching is the lack of sensory input from the
periodontal ligament that hinders rapid patient adaptation after increasing the VDO. Similar
findings were observed by few studies (Gartner et al., 2000; Weiner et al., 2004; Hsieh et al.,
2010), however, the clinical significance of this statement is doubtful. Therefore, when
implant-supported prosthesis is used to increase the VDO, it adds further variables that can
influence patient adaptation. In the same study, the authors (Ormianer and Palty, 2009)
reported more mechanical failure for implant-supported prostheses in comparison to tooth-
supported prostheses which supports the implication of the lack of sensory input from the
periodontal ligament.
After comparing the fixed and removable methods of increasing the VDO, it seems the fixed
method is more predictable. The main advantages of the fixed method are the
reestablishment of original tooth morphology and the fixed nature of the restoration. As a
result, minimal interference will be introduced to patient comfort and function. Subsequently,
it is more feasible to assess patient function, aesthetics and phonetics.
2.3.4. Occlusion scheme
At the increased VDO, the included studies achieved a static occlusal relationship in the CR
position which is in accordance with all the studies pertaining to occlusion reestablishment
(Becker and Kaiser, 1993; Turp et al., 2008; Carlsson, 2009). CR establishment has been
advocated since it is a reproducible position and indicated for cases that require extensive
occlusal rehabilitation as might occur after increasing the VDO (Becker and Kaiser, 1993;
Keshvad and Winstanley, 2001). Therefore, whenever increasing the VDO, it is wise to consider
CR reestablishment, even if there is a lack of compelling evidence.
In relation to the dynamic occlusion relationship, mutually-protected occlusion and group
function occlusion were considered as acceptable elements of healthy occlusion (Becker and

55
Kaiser, 1993; Turp et al., 2008). In general, for the mutually-protected occlusion and group
function occlusion, the studies revealed the possibility of safe application of such schemes.
Despite the limitation of sound evidences, bilaterally balanced occlusion was discouraged due
to the possible risk of inducing parafunctional activities. This was supported by EMG studies
that revealed increased muscle activities with the introduction of balanced contacts
(MacDonald and Hannam, 1984; Wood and Tobias, 1984). The included studies in this review
that applied the bilaterally balanced occlusion reported greater incidence subjective symptoms
(Christensen, 1970; Carlsson et al., 1979). However, with the lack of a controlled group, it is
difficult to state that the symptoms were associated with the occlusal scheme.
2.4. Conclusions
Within the limitations of this systematic review, the following can be concluded:
1. Whenever indicated, permanent increase of VDO of up to 5 mm is a safe and predictable
procedure without detrimental consequences. According to the included studies, the
associated signs and symptoms were self-limiting with tendency to resolve within two
weeks.
2. Increasing VDO with a form of fixed restorations is preferable since it enhances patient
function, acceptance, and adaptation and allows for aesthetic evaluation. A removable
splint provoked more signs and symptoms that appear to be associated with the appliance
rather than the actual VDO increase. The signs and symptoms are more prominent with
acrylic splints than metal splints.
3. Because of the limited number of available studies and the significant heterogeneity of the
experimental design, well-controlled and robustly designed clinical studies are needed to
validate the outcome of this review.

56
Chapter Three
3. Lateral Occlusion Schemes in Natural and
Minimally Restored Permanent Dentition: A
Systematic Review
This chapter was published in the following article:
Abduo J, Tennant M, McGeachie J. Lateral occlusion schemes in natural and minimally restored
permanent dentition: a systematic review. Journal of Oral Rehabilitation. 2013; 40:788-802.
(Appendix D)

57
3.1. Abstract
Objective: Clinicians commonly encounter the dilemma of which lateral occlusion scheme is
most suitable for a specific patient. The aim of this review is to evaluate the prevalence of the
lateral occlusion schemes that exist naturally.
Materials and methods: An electronic search was completed through PubMed (MEDLINE),
Google Scholar and Cochrane Library. The search was confined to peer-reviewed studies
published in English, up to April 2013. The literature search was supplemented by manual
searching through the bibliography lists of the selected studies.
Results: The initial search retrieved a total of 575 studies. After applying the selection criteria,
only 12 studies were suitable for inclusion. The Critical Appraisal Skills Programme (CASP) tools
were utilized to appraise the quality of the studies. The prevalence of canine-guided, group
function and balanced occlusions was reported. Overall, there was a clear variability between
the studies. The prevalence of the lateral occlusion scheme appears to be influenced by the
following factors: (1) the magnitude of excursion, (2) an individual’s age and (3) the static
occlusal relationship.
Conclusions: During complete excursion, the canine-guided occlusion tends to be more
frequently observed. After partial excursion, the most prevalent lateral occlusion scheme was
group function occlusion. With aging, the prevalence of canine-guided occlusion tends to be
reduced and the prevalence of group function occlusion is increased. Dentition that is closer to
Class II occlusion exhibits mainly canine-guided occlusion, while for Class III occlusion, group
function occlusion is more prevalent. The studies revealed no relationship between the lateral
occlusion scheme and TMD development.
Key words: lateral occlusion, canine-guided occlusion, group function occlusion, balanced
occlusion, Angle’s classification, excursion

58
3.2. Introduction
For patients requiring comprehensive prosthodontic treatment, many rehabilitation
philosophies have been proposed. Each philosophy aims to produce functional, comfortable
and aesthetic occlusion. Among the conjectured principles for the prosthodontic treatment is
the selection of the lateral occlusion scheme that can be implemented in prosthesis design.
Through prosthodontic treatment, the lateral occlusion scheme can be controlled by altering
teeth morphologies, alignments and orientations. For dentate patients, the available lateral
occlusion schemes are canine-guided occlusion, group function occlusion and balanced
occlusion (Thornton, 1990). The canine-guided occlusion is defined as a mutually-protected
articulation, in which the vertical and horizontal overlap of the canine teeth disengages the
posterior teeth in the lateral movement of the mandible (The Glossary of Prosthodontic Terms,
2005). On the other hand, group function occlusion is distinguished by the existence of
multiple contacts between the maxillary and mandibular teeth in lateral movement on the
working side (The Glossary of Prosthodontic Terms, 2005). The simultaneous, anterior and
posterior occlusal contact of teeth in centric and eccentric positions is called bilaterally
balanced occlusion (The Glossary of Prosthodontic Terms, 2005). Anecdotally, several claims
have been made supporting each lateral occlusion philosophy. For example, canine-guided
occlusion will protect posterior teeth laterally while the anterior teeth are protected in the
centric position; hence the term “mutually-protected occlusion”. The canines were considered
ideal guidance teeth because of their strategic location, anatomy and proprioceptive
properties (Rinchuse et al., 2007). Conversely, group function occlusion has been claimed to
facilitate a wide distribution of occlusal forces over many teeth instead of single tooth;
therefore, a more comfortable, efficient and functional occlusion can be established
(Thornton, 1990). Nevertheless, there is a lack of compelling evidence indicating the
superiority of any philosophy (Becker and Kaiser, 1993; Turp et al., 2008).
Among the limitations of proposing rigid criteria for the lateral occlusion scheme is the
possible discrepancy between the classical definitions and what is considered to be a
physiological occlusion. According to the Glossary of Prosthodontic Terms (2005), any
occlusion that is in harmony with functions of the masticatory system is deemed physiological.
This could potentially mean that as long as the lateral occlusion scheme is not contributing to
mechanical, biological or aesthetic problems, it can be deemed as physiological occlusion. It is
expected that the level of variation in lateral occlusion schemes can be obtained by observing
the occlusion features of natural dentition.

59
Therefore, it is the aim of this systematic review to evaluate the prevalence of lateral occlusion
schemes that exist in natural physiological dentition, and the possible influencing factors.
Consequently, this systematic review attempts to formulate guidelines for clinicians to
consider when they are rehabilitating the dentition. The hypotheses are: (1) the prevalence of
lateral occlusion schemes is variable, (2) there are influencing factors that can affect the
prevalence of lateral occlusion schemes, and (3) there is no implication of the lateral occlusion
scheme on abnormal physiology.
3.3. Materials and Methods
3.3.1. Search strategy and selection criteria
A comprehensive literature search was completed in April 2013. The search was conducted by
the first author through PubMed (MEDLINE), Cochrane Central Register of Controlled Trials
and Google Scholar. The search strategy through PubMed database was performed through
the Boolean operator and involved the following combinations of key words: (“lateral
occlusion” OR “dynamic occlusion” OR “excursive occlusion”) AND (“canine guided” OR “group
function” OR “balanced”) AND (“dental”) NOT (“implant”). All the articles pertaining to dental
occlusion were retrieved in Cochrane Database. The Google Scholar search engine was used to
obtain additional articles by combining the following key words: ‘dental occlusion,’ ‘lateral,’
‘dynamic,’ ‘excursive,’ ‘guidance,’ ‘canine,’ ‘group function,’ and ‘balanced.’ The electronic
search aimed to obtain all the clinical studies that evaluated the prevalence of the lateral
occlusion scheme in natural permanent dentition. The inclusion criteria were peer-reviewed
journal article or abstract proceeding, human clinical study, study evaluating natural or
minimally restored permanent dentition, study involving adult participants, study’s
participants are representative of today’s population and English language study.
Studies selection was performed in three consecutive stages; (1) articles selection according to
title relevance, (2) screening abstracts and filtering irrelevant articles, and (3) full text analysis
of the remaining articles and cross-matching against predefined inclusion criteria. The
literature search was supplemented with manual searching of the bibliographies of all the
included studies to retrieve further potentially related studies.

60
3.3.2. Literature assessment
The methodological quality of the selected studies was appraised according to the Critical
Appraisal Skills Programme (CASP) (Critical Appraisal Skills Programme (CASP)). The following
CASP tools for cross-sectional studies were implemented:
Is the sample representative of its target population?
Does the study achieve a good response rate (≥ 80%)?
Were valid and reliable outcome tools were implemented?
For every study, each CASP tool was rated as present, not present or unclear. A score mark was
allocated if the answer to the tool is present. Subsequently, on the basis of this assessment,
the quality of the studies can be rated as high (score = 3), moderate (score = 2) or low (score =
1).
3.3.3. Study classification
Since the definition of each lateral occlusion scheme varies among the studies, standardized
criteria were applied according to the Glossary of Prosthodontic Terms (2005). The applied
definitions were as follows:
Canine-guided occlusion: The vertical and horizontal overlap of the canine teeth
disengages the posterior teeth in excursive movements of the mandible.
Group function occlusion: Multiple contact relations between the maxillary and
mandibular teeth in lateral movements on the working side. As there is no specification
regarding the amounts of the present contact, two or more simultaneous contacts on the
working side were considered as group function.
Balanced occlusion: Bilateral, simultaneous, anterior, and posterior occlusal contact of
teeth in centric and eccentric positions. As this definition is almost non-existing in natural
dentition, balancing contacts, that do not interfere with smooth mandibular movements,
were considered as indicators of balanced occlusion.
Non-specified occlusion: If there is no clarification of the existing lateral occlusion scheme.
The prevalence percentage of each lateral occlusion scheme was recorded from each included
study. However, since it is expected that many patients presented with mixed lateral occlusion

61
schemes (e.g. canine-guided occlusion on one side and group function occlusion on the other
side), the prevalence of the lateral occlusion scheme in each side was considered rather than
the prevalence in the whole mouth.
Whenever possible, from each study, the three potentially influencing parameters were
recorded: the magnitude of lateral mandibular movement, the individual’s age, and the static
occlusal relationship according to Angle’s classification. The rationales behind the selection of
these parameters are as follows:
Magnitude of lateral excursion: Due to the complexity of occlusal morphology, the location
and magnitude of tooth contacts can be affected with the level of excursion (Ogawa et al.,
1998). The degree of excursion was classified in to two categories: partial (0.5-1.5 mm),
and full (2-3 mm or cusp-to-cusp position).
Age: As the patient age increases there is greater possibility of tooth wear. Subsequently,
tooth wear was found to influence the location and magnitude of tooth contacts at the
static and dynamic positions (Beyron, 1954; Panek et al., 2008).
Static occlusal relationship: Since several studies considered the anterior teeth and arch
size to contribute to the lateral occlusion schemes (Schwartz, 1986; Jensen, 1990b),
whenever possible, Angle’s classification was documented.
3.3.4. Qualitative analysis
Only the studies that illustrated the age of the participants and clearly outlined the influencing
parameters were included in the qualitative analysis. The aim of this step is to delineate the
presence or absence of a linear relationship between the prevalence of lateral occlusion
schemes and the different parameters: magnitude of excursion, age and static occlusal
relationship. Scatter diagrams were employed accordingly. Due to the lack of age average in
most of the studies, the age range was represented in lines within the scatter diagrams.
3.4. Results
3.4.1. Literature search
A total of 575 articles were obtained after the initial electronic search. From this literature
pool, 452 articles were excluded after the analysis of the titles’ relevance. Screening the
abstracts excluded an additional 72 articles, leaving 51 articles suitable for full text analysis.

62
Following cross-matching against the inclusion criteria, 9 articles were considered for inclusion.
Manual searching through bibliography lists of the selected articles disclosed an additional 3
articles suitable for inclusion. Therefore, a total of 12 articles were deemed suitable for
inclusion for this review. Since some studies evaluated several parameters, the relevant
information about the prevalence of the lateral occlusion scheme was extracted.
3.4.2. Description of studies
According to CASP tools, the studies’ appraisal scores ranged from high to moderate. Nine
studies evaluated the prevalence of lateral occlusion schemes for individuals with no
significant restorative work or missing teeth, other than third molars (Tables 3—1 and 3—2)
(Weinberg, 1964; Scaife and Holt, 1969; Ingervall, 1972; Guevara and Ismail, 1976; Yaffe and
Ehrlich, 1987; Ogawa et al., 1998; Al-Hiyasat and Abu-Alhaija, 2004; Panek et al., 2008; Al-
Nimri et al., 2010). One study included participants with few missing teeth (less than 2 teeth),
history of restorative work and orthodontic treatment (Ingervall et al., 1991). Two studies
measured the prevalence of lateral occlusion schemes for temporomandibular disorder
patients (TMD) and TMD-free patients (Donegan et al., 1996; Kahn et al., 1999). Two studies
evaluated the prevalence of TMD in the evaluated participants (Weinberg, 1964; Ingervall et
al., 1991).
The selected studies evaluated the lateral occlusion scheme by eccentric movement in the
range of 0.5 mm to 3 mm from the maximal intercuspation position. Eight studies (Weinberg,
1964; Scaife and Holt, 1969; Ingervall, 1972; Guevara and Ismail, 1976; Donegan et al., 1996;
Kahn et al., 1999; Al-Hiyasat and Abu-Alhaija, 2004; Panek et al., 2008) applied complete
excursion and four studies applied complete and partial excursion (Yaffe and Ehrlich, 1987;
Ingervall et al., 1991; Ogawa et al., 1998; Al-Nimri et al., 2010).
Five studies specified the static occlusal relationship (Scaife and Holt, 1969; Guevara and
Ismail, 1976; Yaffe and Ehrlich, 1987; Al-Hiyasat and Abu-Alhaija, 2004; Al-Nimri et al., 2010).
Three of them included all Angle’s classifications (Scaife and Holt, 1969; Al-Hiyasat and Abu-
Alhaija, 2004; Al-Nimri et al., 2010), while the other two were primarily for Class I occlusion
(Guevara and Ismail, 1976; Yaffe and Ehrlich, 1987).
Nine studies stated the participants’ age (Scaife and Holt, 1969; Ingervall, 1972; Guevara and
Ismail, 1976; Yaffe and Ehrlich, 1987; Ingervall et al., 1991; Ogawa et al., 1998; Al-Hiyasat and
Abu-Alhaija, 2004; Panek et al., 2008; Al-Nimri et al., 2010). In general, the age of the

63
participants of all the studies ranged from 14 to 63 years. Only one study clearly outlined four
age categories (Panek et al., 2008).
The evaluation approaches applied by the studies to assess the lateral occlusion schemes
were:
Clinical evaluation of patient occlusion with the aid of a disclosing medium (e.g.
articulating paper, articulating wax or alginate indicator material).
Clinical evaluation of patient occlusion with the aid of an articulating medium (e.g. dental
floss, maylar strip or shimstock).
Visualization of tooth contacts (e.g. visual observation or cinematic motion picture).
Evaluation of articulated models on adjustable articulators.
3.4.3. Studies outcome
Overall, there is a clear heterogeneity between the included studies due to the differences in
methodology and the selection criteria of the participants. This heterogeneity reflects on the
significant variation in the prevalence of each lateral occlusion scheme. The prevalence of
canine-guided, group function and balanced occlusions were 6-74%, 26-74% and 3-16%
respectively. The outcome of the studies will be listed according to the following headings:
magnitude of excursion (Table 3—1), age effect, static occlusal relationship (Table 3—2 ), and
TMD relationship.
Magnitude of excursion. The studies confirmed the variation in the lateral occlusion pattern
with different degrees of excursion. With partial excursion, there is a greater tendency for
more tooth contact on the working and non-working sides. While complete excursion caused a
reduction of tooth contacts except on the canines (Yaffe and Ehrlich, 1987; Ingervall et al.,
1991; Ogawa et al., 1998; Al-Nimri et al., 2010). After complete excursion, the prevalence of
canine-guided occlusion was in the range of 17-74%, and the prevalence of group function
occlusion was in the range of 26-68%. After partial excursion, the canine guidance prevalence
ranged from 6% to 26% and the group function occlusion ranged from 45-74%. Similar
prevalence of balanced occlusion was observed following complete (3-16%) and partial
excursions (3-14%).

64
All the studies that compared different degrees of excursion found that the canine-guided
occlusion prevalence is lower (by 20-70%) after partial excursion than the prevalence after
complete excursion (Yaffe and Ehrlich, 1987; Ingervall et al., 1991; Ogawa et al., 1998; Al-Nimri
et al., 2010). Likewise, the opposite was observed for group function occlusion (the prevalence
after complete excursion was 40-80% of the prevalence after partial excursion). This
observation was attributed to the greater number of canine contacts on the working side after
complete excursion; while the prevalence of premolar and molar contacts, in addition to
canine contacts, are greater on the working side after partial excursion (Ogawa et al., 1998).
Overall, there is a discrepancy between reporting the prevalence of balanced occlusion and
non-working side interferences. The studies that evaluated specifically the prevalence of
balanced occlusion found that there is no major difference in prevalence after partial or
complete excursion. However, the studies that measured the prevalence of non-working side
interferences found the prevalence to be high. Ingervall found that 20% of the participants had
unilateral non-working side contacts and 64% had bilateral non-working side contacts after
complete excursion (Ingervall, 1972). After partial excursion, Ingervall et al., in another study,
found that half of their participants exhibited non-working side contacts, which was greater
than the prevalence with complete excursion (Ingervall et al., 1991). Ogawa et al. found the
frequency of non-working side interferences decreased after complete excursion (about 50%
less) (Ogawa et al., 1998). The most frequent non-working side contacts existed more
commonly on the 2nd molar, followed by the 1st molar (Ingervall et al., 1991; Ogawa et al.,
1998).
Age effect. A pattern of occlusion schemes alteration was detected as an individual’s age
increases. With aging, there is a decline of canine-guided occlusion prevalence (Figure 3-1).
This has been clearly demonstrated by Panek et al. after evaluating four age categories (Panek
et al., 2008). In general, canine-guided occlusion tends to be a dominant occlusion scheme (60-
70%) for adolescents and young adults. Two studies slightly deviated from that tendency and
reported a lower prevalence of canine-guided occlusion for young adults (about 33.5%)
(Ingervall, 1972; Ingervall et al., 1991). Nevertheless, these studies revealed that canines were
still the most commonly involved teeth in lateral occlusion. For adolescents, the prevalence of
canine-guided occlusion was 61.5%. 32-73.4% of young adults had canine-guided occlusion.
For middle aged individuals, the canine-guided occlusion prevalence was 38.4%. Elders had the
lowest canine guidance prevalence (17.9%).

65
A
B
Figure 3-1 The relationship between the prevalence of each lateral occlusion scheme and age after complete excursion (A) and partial excursion (B). The lines represent the age range of each study.
On the contrary, the prevalence of group function occlusion followed an opposite pattern.
Overall, there is an increase of group function occlusion prevalence with aging. The
adolescents had the least prevalence of group function occlusion (15.5%) while the elders had

66
the greatest (67.9%). The group function occlusion for young adults was in the range of 25.5%
to 63.5%. Middle aged individuals had a group function occlusion prevalence of 48.9%.
The prevalence of balanced occlusion did not appear to be affected by age, and it was in the
range of 3-13.6% for all age categories.
Static occlusal relationship. In general, there is a relationship between the static and dynamic
occlusions after complete excursion (Scaife and Holt, 1969; Al-Hiyasat and Abu-Alhaija, 2004;
Al-Nimri et al., 2010). However, after partial excursion, no relationship was established
between static and dynamic occlusions (Al-Nimri et al., 2010).
For Class I occlusion (Figure 3-2), the canine guidance prevalence was 48.5-67.6% following
complete excursion. This was more than the prevalence for group function occlusion (23.5-
51.5%). The prevalence of balanced occlusion was low (1-9.2%). Following partial excursion,
the prevalence of canine-guided occlusion was much lower than for complete excursion (16.1-
30.6%). The group function occlusion was prominently more prevalent (36.7-83.9%). The
prevalence of balanced occlusion was similar to that of complete excursion (11.2%). However,
Al-Nimri et al. study found a greater prevalence of non-specified occlusion schemes after
partial excursion (Al-Nimri et al., 2010).
Figure 3-2 The relationship between the prevalence of each lateral occlusion scheme and age for Class I occlusion.

67
For Class II occlusion (Figure 3-3), the canine guidance prevalence was consistently higher than
for Class I (71.3-85.6%) following complete excursion. The prevalence of group function
occlusion was less than for Class I (10-24.1%). The prevalence of balanced occlusion was similar
to Class I (0-13.5%). The two studies that differentiated between Class II Division 1 or Class II
Division 2 did not reveal a significant difference in the prevalence of canine and group function
occlusion (Al-Hiyasat and Abu-Alhaija, 2004; Al-Nimri et al., 2010). Following partial excursion,
the prevalence of canine guidance was prominently less (11.8-39.3%), the prevalence of group
function occlusion was higher (46.4-55.9%) and the prevalence of balanced occlusion was
similar (3.5-17.6%) (Al-Nimri et al., 2010) to the prevalence after complete excursion.
Figure 3-3 The relationship between the prevalence of each lateral occlusion scheme and age for Class II occlusion.
For Class III occlusion (Figure 3-4), the prevalence of canine guidance was about half than for
Class I (16.7-32.5%) after complete excursion. The prevalence of group function occlusion was
higher than Class I (31.3-76.7%). In addition, the prevalence of balanced occlusion was more
than for Class I (19-36.2%). After partial excursion, the prevalence of canine-guided occlusion
was 11.1%, the prevalence of group function was 47.2%, and the prevalence of balanced
occlusion was 22.2%. Thus, it appears that the lateral occlusion is not markedly affected by the
degree of excursion for Class III occlusion (Al-Nimri et al., 2010).

68
Figure 3-4 The relationship between the prevalence of each lateral occlusion scheme and age for Class III occlusion.
Therefore, canine-guided occlusion tends to be dominant for Class II occlusion, followed by
Class I occlusion. Class III occlusion exhibited mainly group function occlusion.
TMD relationship. The included studies revealed that there is no relationship between lateral
occlusion schemes and TMD incidence. The two studies that evaluated the relationship
between lateral occlusion schemes and TMD incidence did not find a clear relationship
(Weinberg, 1964; Ingervall et al., 1991). Further, the two studies that evaluated the prevalence
of lateral occlusion scheme for TMD symptomatic and asymptomatic participants also did not
reveal a clear relationship (Donegan et al., 1996; Kahn et al., 1999). Donegan et al. did not find
a relationship between the incidence of TMD symptoms and presence or absence of canine-
guided occlusion (Donegan et al., 1996). Although Kahn et al. detected that canine-guided
occlusion tends to be more prevalent for TMD patients, this association was not statistically
significant (Kahn et al., 1999).
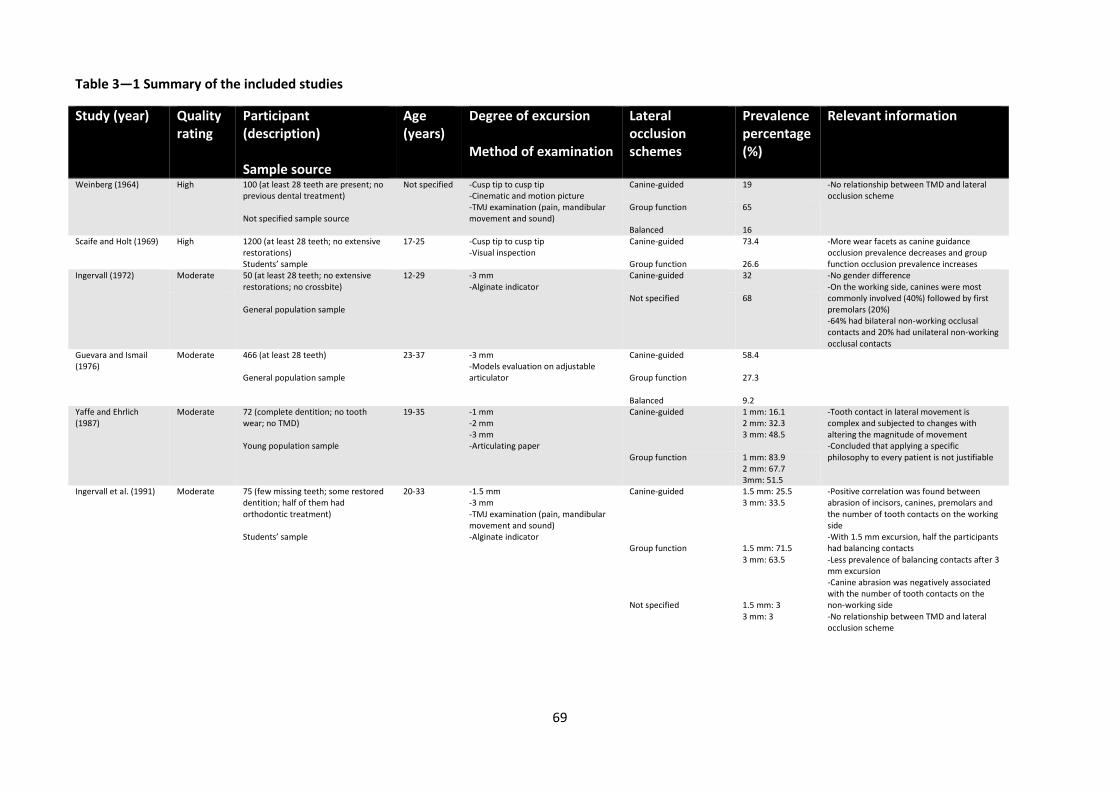
69
Table 3—1 Summary of the included studies
Study (year) Quality rating
Participant (description) Sample source
Age (years)
Degree of excursion Method of examination
Lateral occlusion schemes
Prevalence percentage (%)
Relevant information
Weinberg (1964) High 100 (at least 28 teeth are present; no previous dental treatment) Not specified sample source
Not specified -Cusp tip to cusp tip -Cinematic and motion picture -TMJ examination (pain, mandibular movement and sound)
Canine-guided
19 -No relationship between TMD and lateral occlusion scheme
Group function
65
Balanced 16 Scaife and Holt (1969) High 1200 (at least 28 teeth; no extensive
restorations) Students’ sample
17-25 -Cusp tip to cusp tip -Visual inspection
Canine-guided
73.4 -More wear facets as canine guidance occlusion prevalence decreases and group function occlusion prevalence increases Group function 26.6
Ingervall (1972) Moderate 50 (at least 28 teeth; no extensive restorations; no crossbite) General population sample
12-29 -3 mm -Alginate indicator
Canine-guided
32 -No gender difference -On the working side, canines were most commonly involved (40%) followed by first premolars (20%) -64% had bilateral non-working occlusal contacts and 20% had unilateral non-working occlusal contacts
Not specified 68
Guevara and Ismail (1976)
Moderate 466 (at least 28 teeth) General population sample
23-37 -3 mm -Models evaluation on adjustable articulator
Canine-guided
58.4
Group function
27.3
Balanced 9.2 Yaffe and Ehrlich (1987)
Moderate 72 (complete dentition; no tooth wear; no TMD) Young population sample
19-35 -1 mm -2 mm -3 mm -Articulating paper
Canine-guided 1 mm: 16.1 2 mm: 32.3 3 mm: 48.5
-Tooth contact in lateral movement is complex and subjected to changes with altering the magnitude of movement -Concluded that applying a specific philosophy to every patient is not justifiable Group function 1 mm: 83.9
2 mm: 67.7 3mm: 51.5
Ingervall et al. (1991)
Moderate 75 (few missing teeth; some restored dentition; half of them had orthodontic treatment) Students’ sample
20-33 -1.5 mm -3 mm -TMJ examination (pain, mandibular movement and sound) -Alginate indicator
Canine-guided
1.5 mm: 25.5 3 mm: 33.5
-Positive correlation was found between abrasion of incisors, canines, premolars and the number of tooth contacts on the working side -With 1.5 mm excursion, half the participants had balancing contacts -Less prevalence of balancing contacts after 3 mm excursion -Canine abrasion was negatively associated with the number of tooth contacts on the non-working side -No relationship between TMD and lateral occlusion scheme
Group function
1.5 mm: 71.5 3 mm: 63.5
Not specified 1.5 mm: 3 3 mm: 3

70
Donegan et al. (1996) Moderate 46 (asymptomatic) Students’ sample
Not specified -Cusp tip to cusp tip -Clinical examination -TMJ examination (sound) -Maylar strip
Canine-guided
30 -No relationship between TMD and lateral occlusion scheme
Absence of canine-guided
70
46 (symptomatic; TMJ sound) General population sample of matched age to the asymptomatic group
Canine-guided
22
Absence of canine-guided 78
Ogawa et al. (1998) Moderate 86 (at least28 teeth; no orthodontic treatment; no cuspal restoration) Students’ sample
20-29 -0.5 mm -1 mm -2 mm -3 mm -Shimstock
Canine-guided 9.3 -On the working side, from 0.5 to 3 mm the frequency of canine contacts increased -On the working side, from 0.5 to 3 mm the frequency of premolars and molars contact decreased -On the non-working side, the contacts were mainly on second molar followed by first molar -On the non-working side, greater contacts after 0.5 mm movement. -On the non-working side, the number of contacts decreased as the lateral movement increased
Group function 45.3
Balanced 41.8 Kahn et al. (1999) Moderate 82 (asymptomatic)
General population sample
Not specified -3 mm -Questionnaire -Clinical examination -Articulating paper and dental floss
Canine-guided 34.4 -Slightly more canine guidance for symptomatic group -No relationship between TMD and lateral occlusion scheme
Group function 64.6
263 (Symptomatic; TMD) General population sample of matched age to the asymptomatic group
Canine-guided 47.5 Group function 52.5
Al-Hiyasat and Abu-Alhaija (2004)
High 447 (at least 28 teeth; no major restorations; no orthodontic treatment) School students’ sample
14-17 -Cusp tip to cusp tip -Clinical examination -Shimstock
Canine-guided
65.1 -The lateral occlusion scheme is affected by incisors relationship
Group function 21.3
Balanced 13.6

71
Panek et al. (2008)
High 834 (complete dentition; no more than single missing tooth; simple restorations; no cuspal involvement; no fixed or removable prosthesis) General population sample
20-29 -2 mm -Clinical examination -Articulation paper
Canine-guided 47.2 -No gender difference -There is an effect of age on lateral occlusion scheme -Recommended canine guidance for young and group function for older patients -The prevalence of balanced occlusion is minimal in all age groups
Group function 35.5 Balanced 9.4
30-39 Canine-guided 47.4 Group function 40.3 Balanced 9.3
40-49 Canine-guided 38.4 Group function 48.9 Balanced 6
50-63 Canine-guided 17.9 Group function 67.9 Balanced
10.7
Al-Nimri et al. (2010) Moderate 94 (at least 28 teeth; no orthodontic treatment; no occlusal adjustment; no major restorations; canines are in the line of the arch) Students’ sample
21-30 -0.5 mm -3 mm -Clinical examination -Shimstock
Canine-guided 0.5: 21.9 3: 59.6
-No gender difference -At 3 mm excursion, there is a relationship between dynamic and different static occlusal relationship -At 0.5 mm excursion, the incisor, canine and molar relationships were not related to dynamic occlusion
Group function 0.5: 45.3 3: 23.9
Balanced 0.5: 13.9 3: 3.2
Not specified 0.5: 13.8 3: 11.7
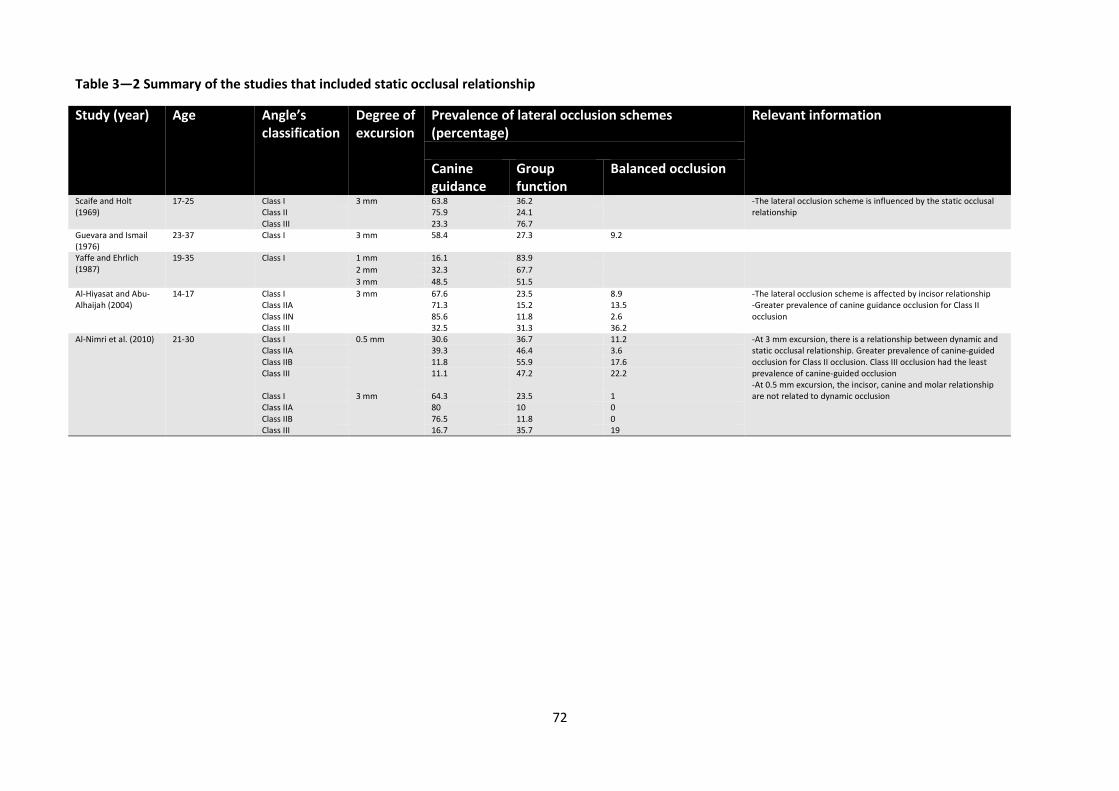
72
Table 3—2 Summary of the studies that included static occlusal relationship
Study (year) Age Angle’s classification
Degree of excursion
Prevalence of lateral occlusion schemes (percentage)
Relevant information
Canine guidance
Group function
Balanced occlusion
Scaife and Holt (1969)
17-25 Class I 3 mm 63.8 36.2 -The lateral occlusion scheme is influenced by the static occlusal relationship
Class II 75.9 24.1 Class III 23.3 76.7
Guevara and Ismail (1976)
23-37 Class I 3 mm 58.4 27.3 9.2
Yaffe and Ehrlich (1987)
19-35 Class I 1 mm 16.1 83.9 2 mm 32.3 67.7
3 mm 48.5 51.5
Al-Hiyasat and Abu-Alhaijah (2004)
14-17 Class I 3 mm 67.6 23.5 8.9 -The lateral occlusion scheme is affected by incisor relationship -Greater prevalence of canine guidance occlusion for Class II occlusion
Class IIA 71.3 15.2 13.5 Class IIN 85.6 11.8 2.6 Class III 32.5 31.3 36.2
Al-Nimri et al. (2010) 21-30 Class I 0.5 mm 30.6 36.7 11.2 -At 3 mm excursion, there is a relationship between dynamic and static occlusal relationship. Greater prevalence of canine-guided occlusion for Class II occlusion. Class III occlusion had the least prevalence of canine-guided occlusion -At 0.5 mm excursion, the incisor, canine and molar relationship are not related to dynamic occlusion
Class IIA 39.3 46.4 3.6 Class IIB 11.8 55.9 17.6 Class III
11.1 47.2 22.2
Class I 3 mm 64.3 23.5 1 Class IIA 80 10 0 Class IIB 76.5 11.8 0 Class III 16.7 35.7 19

73
3.5. Discussion
It can be observed that there is variation between the included studies in reporting the
prevalence of lateral occlusion schemes. This variation can be attributed to methodological
differences and participant selection (Rinchuse et al., 2007). This heterogeneity prevented the
conduction of proper meta-analysis. Nevertheless, there is an overall consistency on the
factors associated with lateral occlusion schemes, such as magnitude of excursion, static
occlusal relationship and age effect. Therefore, the hypotheses that the prevalence of lateral
occlusion schemes is variable and there are influencing factors on the prevalence of lateral
occlusion schemes were accepted. This review also accepts the hypothesis that there is no
implication of the lateral occlusion scheme on abnormal physiology. Each point will be
discussed separately.
3.5.1. Magnitude of excursion
It is clear from the included studies that the recorded lateral occlusion scheme is influenced by
the degree of excursion. Partial excursion is associated with a greater prevalence of multiple
teeth contacts on the working side and non-working side than for complete excursion (Yaffe
and Ehrlich, 1987; Ingervall et al., 1991; Ogawa et al., 1998; Al-Nimri et al., 2010). The different
effect of degree of excursion on the tooth contact pattern is related to teeth morphology and
positional factors.
After partial excursion, the numerous tooth contacts indicate that the cusp-to-fossa contact
occurs on a range rather than in one distinguished location. This appears to support the earlier
recommendation of Schuylar who proposed the concept of “freedom of movement in centric
occlusion”, where the mandible can move for a short distance (about 1 mm) in the same
horizontal level while maintaining tooth contact. After this short distance, the actual disclusion
will commence. It was envisaged that this design will promote smooth multidirectional
mandibular movement and patient comfort (Schuyler, 1963). Further maturation and wear of
the dentition will widen the area range of cusp-to-fossa contacts which was observed in a
clinical follow-up study by Beyron (Beyron, 1954). Eventually, more tooth contacts will exist
after complete excursion, which will manifest as a greater group function occlusion prevalence
after aging (will be discussed later).
Physiologically, broad occlusal contact areas were found to be helpful in mitigating excessive
occlusal forces on teeth (Hidaka et al., 1999), which might contribute to the dissipation of
sudden lateral forces on teeth. It could also be speculated that the greater contacts at less
lateral movement (1-1.5 mm) enhance the occlusal phase of the chewing cycle (where occlusal

74
contacts occur and the pathway taken by the mandible is determined by the morphology of
the teeth) (Wang and Mehta, 2013). Therefore, it is the posterior teeth that take a
predominant role in guiding the chewing movement and the effect of anterior teeth is more
important at greater lateral movement. Previously, the term progressive occlusion was
discussed, where the initial lateral movement is dictated by a few posterior teeth, in addition
to canines, and the complete lateral movement is controlled primarily by canines (DiPietro,
1977; Goldstein, 1979). Such scheme appears to be more physiologically relevant than genuine
mutually-protected occlusion, where the canine teeth are expected to control the all the
lateral movements. This complex relationship might have a protective role in tolerating lateral
forces (Yaffe and Ehrlich, 1987).
Due to the variation of each lateral occlusion scheme prevalence after partial and complete
excursive movements, it could be postulated that true canine-guided occlusion or group
function occlusion hardly, if ever, exists in nature and the classical criteria might not be
applicable. In support with other investigators, there is a need to propose criteria of what
constitutes an acceptable lateral occlusion scheme (Yaffe and Ehrlich, 1987; Ogawa et al.,
1998).
Although the pattern of tooth contacts depends on the degree of lateral movement, and the
prevalence of group function is relatively high at all movement levels, this systematic review
illustrates the importance of canines in the lateral occlusion scheme. Canines were the most
frequently involved teeth on the working side (40-75%) (Ingervall, 1972; Yaffe and Ehrlich,
1987; Ingervall et al., 1991; Ogawa et al., 1998). The importance of canines can also be
illustrated from the prominent wear facets that existed on the canines of patients with group
function occlusion (Weinberg, 1964; Scaife and Holt, 1969). Further, a positive correlation was
observed between canine wear and the number of tooth contacts on the working side
(Ingervall et al., 1991). This corroborates the protective role of canines on the rest of the
dentition.
3.5.2. Age effect
This review indicates that occlusion is dynamic, adaptive and subjected to changes with time
(Panek et al., 2008). The aging effect can be primarily attributed to tooth wear, which is
commonly a physiological phenomenon. In general, canine-guided occlusion was observed to
be common in adolescence and young age. Although two studies found group function
occlusion to be dominant for this group, the average number of working dental contacts on
individual teeth was only two, and the canine tooth was commonly associated with guidance

75
(Ingervall, 1972; Ingervall et al., 1991). This scheme, despite it being a group function
occlusion, is not significantly deviating from canine guidance. Likewise, if all the contacts were
summed, canine contacts would be the most common (Ingervall, 1972; Yaffe and Ehrlich, 1987;
Ingervall et al., 1991; Ogawa et al., 1998).
Young patients and adolescents tend to have pointy and sharp canines. This will manifest in
steep anterior tooth guidance, which will, subsequently increase the prevalence of canine-
guided occlusion. As tooth wear progresses on the canines, the guidance angle will become
shallower, the exiting contacts will be widened, and the posterior tooth contacts will be
established. Subsequently, the canine guidance is progressively modified during young
adulthood and replaced by group function that becomes the occlusal pattern in middle age.
Scaife and Holt found that 13.8% of their canine-guided participants had visible wear facets
while 52.8% of the group function participants had visible wear facets. This endorses that
group function occlusion is associated with tooth wear more than for canine-guided occlusion.
Likewise, Weinburg found that since canines and premolars are commonly associated with
lateral guidance, they were the most common teeth to be influenced by tooth wear in full
dentition (Weinberg, 1964). The findings of these studies indicate that the teeth controlling
the lateral movement were most susceptible to tooth wear. Clinically, this phenomenon was
observed by Beyron who found after 8 to 12 years of follow up, that the number of lateral
contacts increased which was also relevant to dentition wear (Beyron, 1954).
The acknowledged dynamic nature of occlusion had caused the emergence of several concepts
to restore the dentition. Panek et al. suggested canine-guided occlusion for younger patients
and group function occlusion for older patients (Panek et al., 2008). Others suggested
confirming the existing occlusion scheme (Yaffe and Ehrlich, 1987). Although such concepts are
logical, it is difficult to assume that problems could arise if different schemes are provided
(Becker and Kaiser, 1993; Turp et al., 2008).
3.5.3. Static occlusal relationship
The outcome of this systematic review outlines a correlation between the static and dynamic
occlusion (Scaife and Holt, 1969; Al-Hiyasat and Abu-Alhaija, 2004; Al-Nimri et al., 2010). This
correlation could emerge because of differences in arch sizes and teeth arrangement.
Subsequently, the tooth-to-tooth relationship will be altered, which could manifest as altered
anterior tooth guidance. The steepness or shallowness of the anterior tooth guidance will
eventually dictate the amount of posterior tooth contacts in excursive movements (Schwartz,
1986; Jensen, 1990b). This observation was confirmed by Al-Hiyasat and Abu-Alhaija, who
76
found that the most critical static occlusion feature that affects the lateral occlusion scheme
was anterior tooth relationship (Al-Hiyasat and Abu-Alhaija, 2004).
The observation of this review indicates that, after complete excursion, Class II lateral
occlusion tends to be dominated by canine guidance, while the prevalence of canine guidance
tends to be the lowest for Class III occlusion. For Class II occlusion, the anterior teeth exhibit
prominent vertical overlap, which causes steep anterior tooth guidance that hinders the
posterior teeth with minimal contacts laterally, hence a high prevalence of canine-guided
occlusion. On the other hand, Class III dentition tends to exhibit minimal anterior teeth
overlap, an edge-to-edge relationship or cross bite; which reduces the influence of anterior
teeth on lateral occlusion, hence a greater prevalence of group function and balanced
occlusion (Jensen, 1990a).
It appears that the Class II occlusion was the most affected by partial excursion and exhibited a
significant reduction in canine guidance. On the contrary, Class III was not markedly affected
by the degree of excursion (Al-Nimri et al., 2010). This confirms that during partial excursion,
the posterior teeth are playing a dominant role in controlling the occlusion. For Class III
occlusion the role of the posterior teeth will continue after the complete excursion. Therefore,
regardless of the static occlusal relationship, at partial excursion, the posterior teeth will
dictate the lateral movements.
However, one of the limitations of the studies included in this systematic review is a lack in
illustrating the effect of severity of angle classification (extreme Class II or Class III). This was
postulated to be a contributing significant variation in lateral occlusion schemes and each
patient can present with a unique scenario (Jensen, 1990b).
3.5.4. TMD relationship
Historically, TMD was commonly attributed to occlusal factors; however, a causative
relationship between occlusion parameters and TMD development has not been definitely
delineated. In a multiple logistic regression, Pullinger et al. established that the occlusal factors
were related to TMD development in 15% of cases only (Pullinger et al., 1993). This systematic
review illustrates that the incidence of TMD is not related to the lateral occlusion scheme
(Donegan et al., 1996; Kahn et al., 1999). This finding is in accordance with the TMD clinical
research (Seligman and Pullinger, 1991) that found that altering the occlusal variable is not
related to TMD developments.
77
Likewise, several studies, including systematic reviews, revealed no strong evidence supporting
the superiority of occlusal treatment over any other treatment modalities (e.g. cognitive
behavioural, pharmacological, or physical therapies) (De Boever et al., 2000a; b; Koh and
Robinson, 2003; Liu et al., 2012; Turp and Schindler, 2012). In addition, altering the lateral
occlusion scheme will not necessarily prevent or reduce the incidence of TMD. Therefore, it
could be established that the lateral occlusion scheme is not an influencing factor to TMD
development and altering the occlusion scheme for the aim of preventing TMD solely is not
justifiable.
3.5.5. Further considerations
Although the topic of lateral occlusion schemes has been a subject of numerous investigations
in the last few decades, this systematic review supports the view that there is no lateral
occlusion scheme that can be considered as a gold standard for every patient (Becker and
Kaiser, 1993; Turp et al., 2008). Further, the review revealed that an occlusion that perfectly
fulfils all of the features of any defined lateral occlusion scheme is rarely observed clinically for
an individual patient. Likewise, the prevalence of the non-working side contacts, which were
thought to be associated with pathological consequences, was high. Therefore, the deviation
from the perfectionist standards of the lateral occlusion scheme does not necessarily mean
that the occlusion is not physiological (The Glossary of Prosthodontic Terms, 2005). This finding
is in accordance with other experts who confirmed that ideal occlusions are seldom observed
in real life (Woda et al., 1979; Jensen, 1990b; Carlsson, 2010). Yet, the dentition is functioning
within its physiological capabilities (Carlsson, 2010).
Similarly, the clinical studies did not reveal differences in the restoration performance
following the establishment of any form of lateral occlusion scheme. Yi et al. found no
difference in patients’ satisfaction if their full-arch prosthesis exhibited canine-guided, group
function or balanced occlusion (Yi et al., 1996). Further, the prospective studies that
implemented canine-guided occlusion (Ormianer and Gross, 1998) or group function occlusion
(Attin et al., 2012) did not find a pathological association with any occlusion scheme.
Therefore, it appears that not only can patients present with variable lateral occlusion
schemes that can still be considered as physiologic occlusion, but also restoring their dentition
according to different schemes can be perfectly acceptable. This indicates that the significance
of the lateral occlusion scheme was heavily overrated in the earlier literature.
Due to the variation between the prevalence of each occlusion scheme, the lack of
pathological association and great individual abilities to adapt to occlusal alterations; flexible
78
and practical occlusion practice should be implemented. Likewise, broader definitions of
acceptable, natural or therapeutic occlusion should be accepted (Becker and Kaiser, 1993; Turp
et al., 2008). Therefore, it could be safe to state that there is no benchmark lateral occlusion
scheme that can be applied to every patient. Instead, the acceptable occlusal criteria can
present as a range of variables that incorporate different occlusion parameters. In the context
of this review, canine-guided occlusion or group function can both be biologically acceptable.
As a clinical guide, instead of implementing a specific occlusion scheme, if complex restorative
work is to take place, the clinicians should consider an occlusion scheme that renders the final
treatment conservative, aesthetic, practical and simple (Becker and Kaiser, 1993; Wiskott and
Belser, 1995; Bryant, 2003; Carlsson, 2009). Additional influential factors on the selection of
lateral occlusion schemes that have not been thoroughly investigated clinically are the
condition of the abutment teeth and the ease of construction. The current state of research
provides minimal information about the impact of the lateral occlusion scheme on
compromised abutments from the endodontic and periodontic perspectives. Likewise, the
effect of lateral occlusion on restorative material has not been well delineated. Clearly, these
areas demand further clinical investigations.
3.6. Conclusions
Within the limitations of this systematic review, the following points can be emphasised:
1. A genuine lateral occlusion scheme is rarely occurring in nature. The lateral occlusion is
dynamic and subjected to changes with time. An individual could have different occlusion
at different phases of the life.
2. Canine-guided occlusion or group function occlusion with multidirectional freedom of
occlusal contact movement multidimensional freedom of tooth contact in mandibular
excursion are equally acceptable. The pathological or therapeutic effect of any occlusion
scheme cannot be established. The presence of non-working side contacts is common and
should be preserved in the non-restored dentition.
3. Young individuals tend to have a canine-guided occlusion and older individuals tend to
have group function occlusion. Canine-guided occlusion is more dominant for Class II
occlusion and group function occlusion is more prevalent for Class III occlusion. Although it
is difficult to set a rigid recipe for occlusion rehabilitation, these observations can be
utilized as a treatment guide for therapeutic occlusion.
79
Chapter Four
4. Impact of Lateral Occlusion Schemes: A
Systematic Review
This chapter was published in the following article:
Abduo J, Tennant. Impact of lateral occlusion schemes: a systematic review. Journal of
Prosthetic Dentistry. 2015; 114:193-204. (Appendix E)
80
4.1. Abstract
Objective: Although several lateral occlusion philosophies were proposed in the literature,
there is a lack of compelling evidence supporting any scheme. The aim of this systematic
review was to investigate the clinical implications of different lateral occlusion schemes.
Materials and methods: A literature search was completed through PubMed (MEDLINE),
Google Scholar and Cochrane Library, up to January 2014. The literature search aimed to
retrieve two studies categories; Group 1: comparative studies; Group 2: clinical outcome
studies. The inclusion criteria were peer-reviewed human clinical studies published in English.
The search was further supplemented by manual searching through the reference lists of the
selected studies.
Results: The initial search revealed a total of 680 studies; however, after applying the inclusion
criteria, 26 studies were found suitable for the analysis (13 for Group 1 and 13 for Group 2).
The most commonly evaluated lateral occlusion schemes were canine-guided occlusion (CGO)
and group function occlusion (GFO). Group 1 studies evaluated the impact of lateral occlusion
schemes on muscular electromyographic (EMG) activity, condylar displacement, chewing and
mandibular movement. Group 2 studies evaluated the impact of restored occlusion on
longevity, patient’s comfort and pathological consequences. CGO was associated with
narrower chewing and less EMG activity of the masticatory muscles during clenching. GFO was
associated with wider mandibular movement and quicker chewing. During chewing, there was
no difference in EMG activity between the two lateral occlusion schemes. Further, the long-
term studies indicated that there is no difference between the two schemes in patient’s
comfort and restoration longevity.
Conclusions: Although there are immediate differences between the different lateral occlusion
schemes, patients have the capability to successfully adapt to CGO or GFO. The occlusion
scheme might influence the masticatory muscles activity, condylar displacement, chewing and
mandibular movement. However, since the long-term studies reflect patients’ acceptance for
occlusion alteration, the clinical significance of these differences is yet to be determined.
Key words: lateral occlusion; canine-guided occlusion; group function occlusion; balanced
occlusion; excursion

81
4.2. Introduction
When restoring a patient’s dentition, the clinician encounters a clinical dilemma of which
occlusion scheme should be established. In the literature, many occlusion rehabilitation
philosophies have been proposed. In general, the available lateral occlusion schemes are
canine-guided occlusion (CGO), group function occlusion (GFO) and bilateral balanced
occlusion (BBO) (Thornton, 1990). Although at maximal intercuspation they might have similar
occlusal contacts, they differ in the amount of contacts during lateral movement. The CGO is
distinguished by the prominent vertical and horizontal overlap of the canine teeth that
prevents posterior tooth contacts in the lateral movement of the mandible (The Glossary of
Prosthodontic Terms, 2005). Dentition with GFO exhibits multiple contacts between the
maxillary and mandibular teeth in lateral movement on the working side (The Glossary of
Prosthodontic Terms, 2005). In addition to the occlusal contacts of GFO, BBO has additional
posterior tooth contact on the non-working side (The Glossary of Prosthodontic Terms, 2005).
Although each lateral occlusion philosophy has its advocates (Thornton, 1990; Rinchuse et al.,
2007), the amount of clinical evidence supporting the superiority of any philosophy is limited
(Becker and Kaiser, 1993; Turp et al., 2008).
Instead of rigidly following a preconceived lateral occlusion philosophy, it is worthy to ask the
question of what the influence of the lateral occlusion scheme is on patient’s comfort,
masticatory system physiology and prosthesis longevity. Therefore, this systematic review
aims to investigate the clinical implications of lateral occlusion schemes on the restored
dentitions. The null hypotheses being: there is no effect of lateral occlusion scheme on
patient’s comfort and masticatory physiology, and there is no effect of lateral occlusion
scheme on restoration longevity.
4.3. Materials and Methods
4.3.1. Search strategy and selection criteria
An electronic literature search was accomplished in January 2014 through PubMed (MEDLINE),
Google Scholar and Cochrane Central Registrar of Controlled Trials. Through the PubMed
database, the Boolean operator was used to combine the following key words: (‘lateral
occlusion’ OR ‘dynamic occlusion’ OR ‘excursive occlusion’) AND (‘canine guided’ OR ‘canine
protected’ OR ‘group function’ OR ‘balanced’) AND (‘dental’) OR (‘implant’). All the articles
related to dental occlusion were retrieved from the Cochrane Database. The Google Scholar
search engine was used to retrieve additional articles by combining the following key words:

82
dental occlusion, lateral, dynamic, excursive, guidance, canine, group function, balanced,
implant, restoration, fixed and prosthesis. No publication year limit was applied. The purpose
of the search was to obtain all the clinical studies that evaluated the impact of lateral occlusion
schemes. This involved impact on physiological response, longevity and patient’s acceptance.
Studies selection was performed in three stages: (1) studies selection according to the
relevance of the title; (2) studies selection according to the abstract relevance; (3) full text
analysis and cross-matching against predefined inclusion criteria (Table 4—1). In addition, the
literature search was endorsed with manual searching of the bibliographies of all the included
studies.
Table 4—1 Inclusion criteria
Peer-reviewed journal article Human clinical study Adult participants Asymptomatic participants The occlusion alterations were executed by fixed restoration/prosthesis Cross sectional, retrospective or prospective study English language publication
4.3.2. Studies classification
Two studies categories were considered for this review.
Group 1: Comparative studies. Where the study compares multiple lateral occlusion
schemes.
Group 2: Clinical outcome studies. Where the study describes the applied occlusion
scheme for the restored dentition.
The definition of each lateral occlusion scheme was adopted from the Glossary of
Prosthodontic Terms (2005):
CGO: The vertical and horizontal overlap of the canine teeth disengages the posterior
teeth in excursive movements of the mandible.
GFO: Multiple contact relations between the maxillary and mandibular teeth in lateral
movements on the working side. As there is no specification regarding the amounts of the
present contact, two or more simultaneous contacts on the working side were considered
as GFO.

83
BBO: Bilateral, simultaneous, anterior, and posterior occlusal contact of teeth in centric
and eccentric positions. As this definition rarely exists naturally, balancing contacts, that
do not interfere with smooth mandibular movements, were considered as indicators of
BBO.
4.4. Results
4.4.1. Literature search
The electronic search yielded a total of 680 articles. After the analysis of titles’ relevance, 621
articles were excluded. Abstracts’ screening excluded an additional 24 articles. Thus, 35 articles
were suitable for full-text analysis. Cross-matching against the inclusion criteria rendered a
total of 16 articles suitable for inclusion. Manual searching through the references of the
selected articles revealed additional 10 articles suitable for inclusion. Therefore, a total of 26
articles were included in this review. Through all of the studies, only the relevant information
about the lateral occlusion schemes was extracted. Non-physiological occlusions were
excluded from the analysis.
4.4.2. Description of studies
From the 26 studies, 13 studies were comparative studies (Group 1), and 13 of them were
long-term studies (Group 2).
Group 1 studies evaluated the immediate response to alteration of the lateral occlusion
scheme by the following methods:
Electromyography (EMG) (Table 4—2): where the electrical activities of masticatory
muscles were recorded. This method was used to evaluate the effect of the lateral
occlusion scheme on muscle response to different mandibular movements.
Mandibular movement (Table 4—3): evaluated the impact of lateral occlusion on
mandibular movement or condylar position when the teeth are in function.
The participants were requested to undertake the following movements:
Physiological: chewing, sliding from intercuspal position to edge-to-edge position
(eccentric grinding), and sliding from edge-to-edge position to intercuspal position
(concentric grinding).

84
Non-physiological: maximal clenching in the intercuspal position, maximal clenching in the
edge-to-edge position and submaximal edge-to-edge clenching. The aim of these
movements was to simulate the muscle reaction to parafunctional activities.
The studies either selected patients with existing occlusion or experimentally altered the
occlusion by bonding occlusal overlay or altering the prosthesis. The evaluated occlusion
schemes were: CGO, GFO and BBO. Some studies considered semi-group function occlusion
(sGFO) in which the canines and the first premolars controlled the lateral movements.
Group 2 studies are long-term studies that reported the applied occlusion scheme in the
prostheses/restorations design. Although not specifically evaluating the impact of the lateral
occlusion scheme, they investigated the patients’ response, restoration longevity and
complications in situations closer to the routine clinical practice. The lateral occlusion scheme
was achieved by composite restorations (Table 4—4), fixed dental prostheses and implant
prostheses (Table 4—5). In several studies, the lateral occlusion scheme was altered in
conjunction with increasing the vertical dimension of occlusion (VDO). The implemented
occlusion schemes were CGO, GFO and BBO.
4.4.3. Studies’ outcome
Group 1: Comparative studies: Five studies evaluated the effect of altering the lateral occlusion
scheme on chewing and mandibular movement (Belser and Hannam, 1985; Jemt et al., 1985;
Okano et al., 2002; Okano et al., 2005; Salsench et al., 2005). One of which was for unaltered
natural occlusions (Salsench et al., 2005), three were for altered occlusion (Belser and
Hannam, 1985; Okano et al., 2002; Okano et al., 2005) and one was for restored dentition with
fixed implant prosthesis (Jemt et al., 1985).
Belser and Hannam found that altering GFO to CGO narrowed the envelop of mandibular
movements, while the muscle coordination during chewing was not altered (Belser and
Hannam, 1985). Likewise, Jemt et al. found CGO was associated with a slightly steeper
movement path than GFO during chewing (Jemt et al., 1985). Further, their participants
reported GFO to be more comfortable than CGO. Salsench et al. demonstrated that
participants with CGO had the steepest lateral guidance angle, while participants with GFO had
less overbite (Salsench et al., 2005).
In terms of chewing speed, Jemt et al. found GFO to be associated with greater mandibular
velocity than CGO (Jemt et al., 1985). Salsench et al. found that the duration of chewing is
influenced by the occlusion scheme, and CGO had a longer chewing cycle than GFO. As the

85
mastication height was similar between GFO and CGO, it was indicative that GFO had a greater
velocity than CGO (Salsench et al., 2005).
In relation to the condylar displacement, maximal edge-to-edge clenching caused the condyles
to displace regardless of the lateral occlusion scheme (Okano et al., 2002). However, the
lateral occlusion scheme altered the magnitude and direction of the condyles displacement.
On the working side, there is an insignificant total displacement between the different
occlusion schemes, while on the non-working side, GFO caused the greatest displacement,
followed by sGFO, CGO and BBO respectively. There was an insignificant difference between
CGO and BBO or GFO. The most prominent displacement was vertical on the non-working side.
Interestingly, another study by the same investigators applied submaximal edge-to-edge
clenching and found different results (Okano et al., 2005). CGO caused the greatest condylar
displacement, followed by sGFO, GFO and BBO respectively. On the working side, there was a
significant difference between CGO and GFO or BBO. On the non-working side, the significant
difference was between CGO and BBO. They attributed the difference between the two
studies to the difference in the magnitude of clenching force.
A total of 10 studies evaluated the effect of altering the lateral occlusion scheme on muscles
activities by muscle EMG activity measurements (Belser and Hannam, 1985; Akoren and
Karaagaclioglu, 1995; Okano et al., 2002; Valenzuela et al., 2006; Miralles et al., 2007; Okano et
al., 2007; Campillo et al., 2008; Gutierrez et al., 2010; Rodriguez et al., 2011; Valenzuela et al.,
2012). 7 studies evaluated the effect of natural lateral occlusal scheme on EMG activity
(Akoren and Karaagaclioglu, 1995; Valenzuela et al., 2006; Miralles et al., 2007; Campillo et al.,
2008; Gutierrez et al., 2010; Rodriguez et al., 2011; Valenzuela et al., 2012), while the other
studies experimentally altered the occlusion (Belser and Hannam, 1985; Okano et al., 2002;
Okano et al., 2007). The evaluated muscles were the masseter, anterior temporalis, posterior
temporalis, suprahypoid, infrahyoid and sternocleidomastoid muscles.
On unaltered dentition, Akoren and Karaagaclioglu found no difference in the masseter and
anterior temporalis muscles EMG activities between participants with CGO and GFO during
chewing (Akoren and Karaagaclioglu, 1995). However, during eccentric clenching, the anterior
temporalis muscle had greater EMG activity with group occlusion, while the masseter EMG
activity was not influenced. Campillo et al. confirmed that the masseter muscle was minimally
affected during maximal intercuspal clenching, eccentric grinding, maximal edge-to-edge
clenching and concentric grinding (Campillo et al., 2008). Rather, the mandibular position was
the most influencing where clenching in the intercupsal position induced the greatest EMG
activity. Gutierrez et al. found GFO caused a significantly higher EMG activity for the anterior

86
temporalis muscle than CGO during eccentric and concentric grinding, and edge-to-edge
clenching (Gutierrez et al., 2010). For the suprahyoid and infrahoid muscles, Valenzuela et al.
found GFO caused insignificantly greater activities than CGO during eccentric, concentric
grinding and edge-to-edge clenching (Valenzuela et al., 2006; Valenzuela et al., 2012). A similar
outcome was confirmed for the sleeping position by Miralles et al. (Miralles et al., 2007) For
the sternocleidomastoid muscle, Rodriguez et al. found significantly lower activity for CGO
than GFO during eccentric grinding, concentric grinding and edge-to-edge clenching (Rodriguez
et al., 2011). The aforementioned studies found significant effects of the type of activity,
where clenching generally caused more EMG activity than grinding. These studies suggested
that jaw stability is more critical to the reduction of muscle EMG activity than the lateral
occlusion scheme.
The studies that deliberately altered the occlusion scheme found similar outcomes to the
studies on unaltered dentition. Belser and Hannam confirmed that CGO caused a significant
reduction of temporalis and masseter muscles EMG activity (by 50%) during clenching, while
mastication did not alter the EMG activity (Belser and Hannam, 1985). Okano et al. also found
less combined temporalis and masseter muscles EMG activities for CGO followed by sGFO, GFO
and BBO during maximal clenching in edge-to-edge position (Okano et al., 2002). CGO
produced significantly less activity than for all other occlusion schemes. In addition, with sGFO,
the EMG activity was found to be significantly less than BBO. In another study, Okano et al.
confirmed their previous observation (Okano et al., 2007). However, no statistical difference
was observed for the masseter muscle EMG activity for any scheme. For anterior and posterior
temporalis muscles, no significant difference on the working side was observed. On the non-
working side, the CGO caused significantly less EMG activity than GFO and BBO for the anterior
temporalis muscle. For the posterior temporalis muscle, CGO caused significantly less EMG
activity than BBO.
From the included studies, it appears that CGO is associated with a narrowing chewing cycle
laterally, and steeper mandibular motion. GFO appears to increase the velocity of chewing.
There are indications that the presence of more tooth contacts can reduce the loads on the
condyle on the working and non-working sides during clenching. There is a tendency for CGO
to cause less EMG activity than other occlusion schemes. In addition, the EMG activity tends to
increase with increasing the number of posterior tooth contacts and the cross-arch contacts.
However, during physiological movements like chewing and grinding, this difference appears
to be minimal. The most commonly influenced muscle is the anterior temporalis muscle.

87
Group 2: Long-term clinical studies: Seven studies evaluated the long-term outcome of the
modified occlusion scheme by fixed prostheses (Dahl and Krogstad, 1985; Gross and Ormianer,
1994; Yi et al., 1996; Ormianer and Gross, 1998; Kinsel and Lin, 2009; Ormianer and Palty,
2009; Sierpinska et al., 2013). Four of them were solely for fixed prostheses supported by
teeth (Dahl and Krogstad, 1985; Gross and Ormianer, 1994; Yi et al., 1996; Ormianer and
Gross, 1998; Sierpinska et al., 2013). One study was for implant prostheses (Kinsel and Lin,
2009) and one study included tooth- and implant-supported prostheses (Ormianer and Palty,
2009). Six studies evaluated the long-term outcome of the modified occlusion scheme by
composite restorations (Hemmings et al., 2000; Redman et al., 2003; Poyser et al., 2007;
Schmidlin et al., 2009; Attin et al., 2012; Al-Khayatt et al., 2013). Only two studies attempted to
find the implications of the existing lateral occlusion scheme (Yi et al., 1996; Kinsel and Lin,
2009).
Three studies provided CGO (Dahl and Krogstad, 1985; Gross and Ormianer, 1994; Ormianer
and Gross, 1998) by fixed prosthesis and four studies by composite restorations (Hemmings et
al., 2000; Redman et al., 2003; Poyser et al., 2007; Al-Khayatt et al., 2013). None of the studies
reported biological or mechanical complications associated with the provided occlusion
schemes. Further, patient acceptance of the new occlusion scheme was reported (Gross and
Ormianer, 1994; Ormianer and Gross, 1998). The composite restorations suffered from some
mechanical degradation in the form of wear, chipping and margin deterioration over a period
of 3 to 6 years. However, the failure cannot be attributed to the applied lateral occlusion
scheme. Instead, material properties and bruxism appear to be more influential on the success
of composite restorations (Hemmings et al., 2000; Redman et al., 2003).
For GFO, two studies restored the occlusion by fixed prosthesis (Ormianer and Palty, 2009;
Sierpinska et al., 2013) and two studies altered the occlusion by composite (Schmidlin et al.,
2009; Attin et al., 2012). Similar to CGO, all the studies reported patient acceptance to the new
occlusion, and biological or mechanical complications were not attributed to the occlusion
scheme. The composite restoration studies reported surface deterioration and mechanical
complications which were not related to the occlusion scheme (Schmidlin et al., 2009; Attin et
al., 2012). Sierpinska et al. reported that following prostheses insertion, the muscle EMG
activity during maximal clenching within the temporalis, masseter and digastric muscles had
decreased, while the EMG activity for sternocleidomastoid muscle had increased. After 3
months of function, the EMG activity was restored to pre-treatment levels (Sierpinska et al.,
2013).

88
One study evaluated the incidence of lateral occlusion schemes for periodontally-treated
restored dentition with cross-arch fixed dental prosthesis (Yi et al., 1996). They found that 51%
of their patients had GFO, 16% had CGO and 14% had mixed occlusion. The prevalence of BBO
was 19%. They noted that most of the patients were satisfied with their function in terms of
mastication, aesthetics, phonetics and comfort. They found that patients with limited
supporting tissues (less than 70%) had more difficulties chewing hard foods. No relationship
was observed between the occlusion scheme and dysfunction or subjective function.
Interestingly, they reported that CGO tended to be the dominant scheme if the dentition is
ideal. When there is no mobility, and more than 50% of the supporting periodontium remains,
GFO tends to be more frequent. BBO was found to be associated with very mobile teeth. As
the prostheses were stable, they postulated that the occlusal variable cannot contribute to the
long-term result. Another study evaluated the lateral occlusion as a factor for implant-
supported prosthesis complications (Kinsel and Lin, 2009). The most commonly applied
occlusion scheme was CGO (82.2%). Patients with GFO were found to have about three times
more mechanical complications than those with CGO. However, the most prominent risk
factors for mechanical complications were the presence of bruxism and an implant prosthesis
opposing another implant prosthesis. Similarly, Ormianer and Palty reported that more
mechanical complications occurred for implant prosthesis opposing another implant prosthesis
when compared to implant prosthesis opposing restored natural dentition, or when all
prostheses are supported by natural teeth (Ormianer and Palty, 2009).
From the previous studies, it appears that patients have the capacity to adapt to CGO or GFO
as new lateral occlusion scheme. The selected lateral occlusion scheme appears to have a
minimal impact on patient’s comfort, and biological or mechanical complications. Instead,
mechanical complications are associated with other risk factors such as bruxism, restorative
material properties and implant prosthesis occluding against implant prosthesis.

89
Table 4—2 Implications of lateral occlusion scheme on muscle EMG activity
Study (year)
Study design
Participant (description) Existing occlusion scheme
Evaluated movements
Evaluated muscles
Occlusion alteration method
Lateral occlusion scheme
Duration of alteration
Relevant information
Belser and Hannam (1985)
Cross-sectional
12 (intact dentition, no masticatory dysfunction) Natural GFO
-Chewing -Maximal vertical clenching and eccentric grinding
-Anterior temporalis -Posterior temporalis -Masseter
-Bonded metal overlays -No VDO increase
CGO GFO
NA -CGO significantly reduced EMG activity during clenching, but not during mastication
Akoren and Karaagaclioglu (1995)
Cross-sectional
30 (intact dentition, no masticatory dysfunction, no previous treatment) 15 CGO 15 GFO
-Chewing -Eccentric grinding
-Anterior temporalis -Masseter
-No alteration CGO GFO
NA -No significant difference between the occlusion schemes during chewing -During eccentric clenching, GFO increased EMG activity of anterior temporalis, but there was no effect on masseter
Okano et al. (2002)
Cross-sectional
20 (intact dentition, no masticatory dysfunction) Natural CGO
-Maximal edge-to-edge clenching
-Anterior temporalis -Posterior temporalis -Masseter
-Bonded metal overlays -No VDO increase
CGO GFO sGFO BBO
NA -Statistically significant effect of lateral occlusion scheme on EMG activity, on the working and non-working side -CGO caused lowest EMG activity. Increasing posterior teeth contacts resulted in increased total EMG activity -Balancing contacts caused greater EMG activity than other occlusion schemes
Valenzuela et al. (2006)
Cross-sectional
40 (intact dentition, no masticatory dysfunction, no previous treatment) 20 CGO 20 GFO
-Eccentric grinding -Edge to edge clenching -Concentric grinding
-Supra-hyoid -Infra-hyoid
-No alteration CGO GFO
NA -GFO is associated with insignificantly more EMG activity -The location of the jaw and the function is more influential on EMG activity than the occlusion scheme. More EMG activity for clenching than grinding
Miralles et al. (2007)
Cross-sectional
40 (intact dentition, no masticatory dysfunction, no previous treatment) 20 CGO 20 GFO
-Edge to edge clenching -Concentric grinding -Eccentric grinding
-Supra-hyoid -Infra-hyoid
-No alteration CGO GFO
NA -GFO is associated with insignificantly more EMG activity -The location of the jaw and the function is more influential on EMG activity than the occlusion scheme. More EMG activity for clenching than grinding
Okano et al. (2007)
Cross-sectional
20 (intact dentition, no masticatory dysfunction) Natural CGO
-Maximal edge-to-edge clenching
-Anterior temporalis -Posterior temporalis -Masseter
-Bonded metal overlays -No VDO increase
CGO GFO sGFO BBO
NA -There is significant difference between the different occlusion schemes -Masseter activities remained the same -Significant increase for the anterior temporalis EMG for GFO and BBO -Increasing posterior teeth contacts resulted in increased total EMG activity

90
Campillo et al. (2008)
Cross-sectional
30 (intact dentition, no masticatory dysfunction, no previous treatment) 15 CGO 15 GFO
-Maximal intercuspal clenching -Eccentric grinding -Maximal edge-to-edge clenching -Concentric grinding
-Masseter -No alteration CGO GFO
NA -No significant difference between the occlusion schemes -The location of the jaw and the function is more influential on EMG activity than the occlusion scheme. More EMG activity for clenching than grinding
Gutierrez et al. (2010)
Cross-sectional
30 (intact dentition, no masticatory dysfunction, no previous treatment) 15 CGO 15 GFO
-Eccentric grinding -Maximal edge-to-edge clenching -Concentric grinding
-Anterior temporalis -No alteration CGO GFO
NA -CGO was associated with significantly less EMG activity than GFO
Rodriguez et al. (2011)
Cross-sectional
28 (intact dentition, no masticatory dysfunction, no previous treatment) 14 CGO 14 GFO
-Eccentric grinding -Maximal edge-to-edge clenching -Concentric grinding
-Sternocleido-mastoid
-No alteration CGO GFO
NA -Significantly lower activity was observed with CGO than GFO
Valenzuela et al. (2012)
Cross-sectional
30 (intact dentition, no masticatory dysfunction, no previous treatment) 15 CGO 15 GFO
-Eccentric grinding -Maximal edge-to-edge clenching -Concentric grinding
-Supra-hyoid -Infra-hyoid
-No alteration CGO GFO
NA -No significant difference between the occlusion schemes
CGO, canine-guided occlusion; GFO. Group function occlusion; sGFO, semi-group function occlusion; BBO, bilaterally balanced occlusion; VDO, vertical dimension of occlusion; EMG, electromyography; NA, not applicable.

91
Table 4—3 Implications of lateral occlusion scheme on mandibular movement
Study (year)
Study design
Participant (description) Existing occlusion scheme
Method of evaluation
Occlusion alteration method
Lateral occlusion scheme
Duration of alteration
Relevant information
Belser and Hannam (1985)
Cross-sectional
30 (intact dentition, no masticatory dysfunction, no previous treatment) Natural GFO
-Jaw movement during chewing
-Bonded metal overlays -No VDO increase
CGO GFO
NA -CGO is associated with narrower chewing movement
Jemt et al. (1985)
Cross-over 5 (fixed maxillary implant prosthesis opposed by natural dentition)
-Jaw movement during chewing
-Occlusion alteration of the maxillary implant prosthesis
CGO GFO
4 months 5 months
-Slightly steeper movement path was noted for CGO than GFO GFO was associated with more chewing cycle variation, lateral mandibular displacement and mandibular velocity. -All the participants found GFO to be more comfortable
Okano et al. (2002)
Cross-sectional
20 (intact dentition, no masticatory dysfunction) Natural CGO
-3D condylar displacement during maximal edge-to-edge clenching
-Bonded metal overlays -No VDO increase
CGO GFO sGFO BBO
NA -On the working side, the condylar displacement was similar for all the occlusion schemes -Clenching with GFO caused significantly greater superior displacement of the non-working side condyle -Clenching with BBO caused significantly less superior displacement on the non-working side -On the non-working side, there was similarity between CGO and sGFO
Okano et al. (2005)
Cross-sectional
20 (intact dentition, no masticatory dysfunction) Natural CGO
-3D condylar displacement during submaximal edge-to-edge clenching
-Bonded metal overlays -No VDO increase
CGO GFO sGFO BBO
NA -On the working side, the condylar displacement with CGO was greater than for GFO or BBO. This difference was insignificant with sGFO -For the non-working side, BBO was associated with the least condylar displacement followed by GFO. The statistical difference was between BBO and CGO
Salsench et al. (2005)
Cross-sectional
53 (intact dentition, no masticatory dysfunction, no previous treatment) 36 CGO or anterior protected occlusion 17 GFO
-Duration of masticatory cycle during chewing
-No alteration CGO GFO
NA -CGO had highest lateral guidance angle and greatest chewing cycle duration -GFO had less total duration of mastication -The masticatory height for CGO and GFO was similar
CGO, canine-guided occlusion; GFO. Group function occlusion; sGFO, semi-group function occlusion; BBO, bilaterally balanced occlusion; VDO, vertical dimension of occlusion; NA, not applicable.

92
Table 4—4 Summary of studies that established the lateral occlusion scheme by composite restorations
Study (year)
Study design
Participant (description)
Method of evaluation
Occlusion alteration method
Lateral occlusion scheme
Duration of alteration
Relevant information
Hemmings et al. (2000)
Prospective 16 (dentition with tooth wear)
-Evaluated restoration longevity -Subjective patient evaluation
-Composite build-up -VDO increase
CGO 30 months -Success rate of composite restoration was 89.4% -The restorative material has impact on the survival of the restoration -Good patient satisfaction
Redman et al. (2003)
Prospective 31 (dentition with tooth wear)
-Evaluated restoration longevity -Subjective patient evaluation
-Composite build-up -VDO increase
CGO Up to 6 years -No restoration failure in the 1st
year -Half of the failures occurred in the 5th year -The failure is related to bruxism and material properties -Bulk fracture was not common -80% had evidence of wear
Poyser et al. (2007)
Prospective 14 (dentition with tooth wear)
-Evaluated restoration longevity -Subjective patient evaluation
-Composite build-up -VDO increase
CGO 2.5 years -6% complete loss of restoration -High level of patient satisfaction -Material loss was due to wear
Schmidlin et al. (2009)
Prospective 7 (dentition with tooth wear)
-Evaluated restoration longevity -Subjective patient evaluation
-Composite build-up -VDO increase
GFO 3 years -Most of the restorations maintained anatomic form (97%) -All patients demonstrated good to excellent acceptance to the treatment
Attin et al. (2012)
Prospective 7 (dentition with tooth wear)
-Evaluated restoration longevity -Subjective patient evaluation
-Composite build-up -VDO increase
GFO 5.5 years -86% of the restorations had good anatomic form -All restorations were adequate -No signs of masticatory dysfunction -After 3 years, no deterioration of surface texture -After 5 years, 28% of the restorations had some surface deterioration
Al-Khayatt et al. (2013)
Prospective 15 (dentition with tooth wear)
-Evaluated restoration longevity -Subjective patient evaluation
-Composite build-up -VDO increase
CGO 7 years -The approximate survival rate of the restoration was 85% -The patients were satisfied with the treatment
CGO, canine-guided occlusion; GFO. Group function occlusion; VDO, vertical dimension of occlusion.

93
Table 4—5 Summary of studies that established the lateral occlusion scheme by fixed dental and implant prostheses
Study (year)
Study design
Participant (description)
Method of evaluation
Occlusion alteration method
Lateral occlusion scheme
Prosthesis support
Duration of alteration
Relevant information
Dahl and Krogstad (1985)
Prospective 20 (dentition with tooth wear)
-Clinical evaluation -Subjective patient evaluation
-Anterior teeth crowns according to Dahl concept -VDO increase
CGO Teeth Up to 5.5 years -None of the restored teeth had endodontic complications -No crown had to be replaced due to excessive wear -No development of masticatory dysfunction symptoms
Gross and Ormianer (1994)
Prospective 8 (dentition with tooth wear and no signs of masticatory dysfunction)
-Subjective patient evaluation -Masticatory system evaluation
-Provisional restorations -VDO increase
CGO Teeth 1 month -All participants adapted to the new occlusion scheme
Yi et al. (1996) Retrospective 34 (patients history of periodontal disease)
-Evaluation of the incidence of each occlusion scheme -Subjective patient evaluation
-Cross-arch prostheses -Flattened occlusal morphologies
CGO: 16% GFO: 51% GFO and CGO: 14% BBO: 19%
Teeth and implants
More than 10 years
-None of the examined occlusal variables were related to the long-term results -The great majority of patients were satisfied with the function of their prostheses -Subjective function was not significantly influenced by occlusal variables
Ormianer and Gross (1998)
Prospective 8 (dentition with tooth wear and no signs of masticatory dysfunction)
-Masticatory system evaluation
-Definitive prostheses -VDO increase
CGO Teeth 2 years -All participants adapted to the new occlusion scheme
Kinsel and Lin (2009)
Retrospective 152 (single and multiple-unit implant prostheses)
-Evaluated the incidence of ceramic chipping
-Single implant crown or fixed dental prosthesis
CGO: 82% GFO: 18%
Implants Variable -The ceramic chipping were significantly associated with opposing implant prostheses, bruxism and not wearing occlusal device -For CGO, 15.9% of the patients experience ceramic fracture and 5.3% of implants had ceramic fracture -For GFO, 51.9% of patients experienced ceramic fracture and 16.1% of implants had ceramic fracture -At patient level, significantly more complications with GFO that CGO. At implant level, there was no significant difference between the two schemes
Ormianer and Palty (2009)
Retrospective 30 (natural dentition and whole arch implant prosthesis) 10 (natural dentition in both arches) 10 (natural dentition in one arch against implant prosthesis in the opposing arch) 10 (implant prostheses in both arches)
-Subjective patient evaluation -Radiographic assessment of alveolar bone around teeth and implants -Evaluated restoration longevity
-Definitive prostheses -VDO increase
GFO Teeth Implants
2-3 months -All participants adapted to the new occlusion scheme -More bone loss and tooth failure with prosthesis supported by natural dentition in the two arches -More mechanical complications such as veneer fracture was for patients with implant prosthesis in the two arches

94
Sierpinska et al. (2013)
Prospective 50 (dentition with tooth wear)
-EMG (anterior temporalis, superficial masseter, anterior digastric, sternocleidomastois) -Digital occlusion examination
-Definitive prostheses -VDO increase
GFO Teeth
3 months -The mean value of functional EMG activity during clenching immediately post-treatment decreased compared to pre-treatment -After 3 months, no side effects in the form of masticatory dysfunction, chewing, and comfort -After 3 months period of adaptation, the post-treatment EMG activity had increased to levels similar to pre-treatment levels
CGO, canine-guided occlusion; GFO. Group function occlusion; BBO, bilaterally balanced occlusion; VDO, vertical dimension of occlusion.
95
4.5. Discussion
It is observed from this systematic review that the lateral occlusion scheme has an impact on
muscle activity, chewing and mandibular movements. CGO appears to exhibit some protective
role, while GFO results in quicker chewing. Therefore, the hypothesis that there is no effect of
lateral occlusion scheme on the patient’s comfort and masticatory physiology is rejected.
However, long-term studies have revealed an equivocal outcome in relation to the long-term
effects of lateral occlusion. Thus, the hypothesis that there is no effect of the lateral occlusion
scheme on restoration longevity is accepted. Consequently, the observed difference between
the lateral occlusion schemes could be of significance at an experimental level, while clinically,
the significance of the difference is questionable.
4.5.1. Physiological implications of lateral occlusion scheme
Uncontrolled dynamic occlusion was classically believed to precipitate pathological
consequences. As the mandible slides along cuspal inclines, the forces are distributed to the
teeth, supporting structure, muscles of mastication and the temporomandibular joint (TMJ)
(Suit et al., 1976; Ogawa et al., 1996). Therefore, uncontrolled forces due to the occlusion
scheme or parafunctional activities might affect the physiological balance (Ramfjord, 1961).
From the included studies, there are indications that CGO exhibits some protective roles for
posterior teeth, masticatory muscles and the TMJ complex. On the other hand, it was observed
that GFO is more efficient for chewing and is more comfortable.
The narrowness of the chewing cycle of CGO could be attributed to the presence of more
overbite between the anterior teeth (Jemt et al., 1985; Salsench et al., 2005). This feature
could translate clinically to less magnitude of lateral mandibular movement and, as a result,
less posterior tooth contact laterally (Wang and Mehta, 2013). Eventually, with CGO, the
posterior teeth will be subjected to less oblique forces and tensile stresses which are more
traumatic to tooth structure (Palamara et al., 2000; Palamara et al., 2006). Instead, the
posterior teeth will receive vertical forces primarily (Akoren and Karaagaclioglu, 1995). This
could potentially support the protective role of canines in mutually-protected occlusion.
On the other hand, although the muscle coordination is similar to CGO (Belser and Hannam,
1985), GFO was distinguished by the wider range of lateral movement in the occlusal phase of
chewing. This was attributed to the less overbite observed for GFO as a result of canine wear
(Salsench et al., 2005). It could be speculated that the posterior teeth will be subjected to
more stresses laterally. However, some authors have proposed that as tooth wear proceeds,
the surface contact area between teeth increases as well, which might dissipate the occlusal

96
forces, rendering them less susceptible to future wear in comparison with pointy cusps
(Seligman and Pullinger, 1995; Hidaka et al., 1999).
The included studies evaluated the risk of temporomandibular joint disorder (TMD)
development by condylar displacement and muscle EMG activity. The condylar displacement
has been investigated to estimate TMJ loading where a larger upward displacement of the
condyle could be associated with a larger compressive load within the TMJ (Okano et al.,
2002). The outcome of this review indicates that clenching contributes to upward condylar
movements, which coincides with other investigations (Ito et al., 1986; Kuboki et al., 1996). In
addition, the occlusion scheme influences the magnitude of condylar displacement (Okano et
al., 2002; Okano et al., 2005) when the mandible is in edge-to-edge position. Regardless of the
clenching level, BBO caused the least vertical condylar displacement. Such an observation
could be related to the upward mandibular movement being resisted by the bilateral posterior
tooth contacts (Baba et al., 2000; Seedorf et al., 2009). It has been postulated that balancing
contacts might protect against compressive TMJ loading, causing fewer incidence of joint
noises (Minagi et al., 1997; Okano et al., 2002). However, during maximal clenching, CGO
caused less non-working condylar displacement than GFO, and was similar to BBO (Okano et
al., 2002). This could be due to the inability to clench with the heavy occlusal force in the edge-
to-edge position with CGO in comparison to GFO. As the canine is the primary tooth in contact
laterally, the occlusal loads will be concentrated on the canines, leading to the excessive
stimulation of the mechanoreceptors (Ottenhoff et al., 1992; Wang and Mehta, 2013) which
will reduce muscle contraction (Hayasaki et al., 2002). On the contrary, with GFO, due to the
additional contacts laterally, participants were able to induce more occlusal loads during
maximal clenching. Such an observation is confirmed by all the included EMG studies, that
indicated participants were able to produce greater EMG activity during edge-to-edge
clenching (Okano et al., 2002; Okano et al., 2007; Gutierrez et al., 2010). However, for
submaximal clenching, CGO caused a more superior condylar displacement than GFO (Okano
et al., 2005). The difference between the magnitudes of clenching could be related to
mandibular deformation after maximal clenching on the non-working side and subsequent
condylar elevation (Korioth and Hannam, 1994). As the participants were able to exert more
maximal clenching with GFO, mandibular deformation might occur leading to more upward
non-working condylar displacement. Despite the statistically significant difference between the
two schemes, the clinical impact is yet to be determined. Since the maximal displacement is
about 0.6-0.8 mm, attributing adverse TMJ consequences to such displacement is questionable
(Okano et al., 2002; Okano et al., 2005).
97
EMG activity is a commonly used as an indicator of muscle activity in research (Gonzalez et al.,
2011; Hugger et al., 2012); where large EMG activity induced by clenching or parafunctional
activities can be indicative of muscle fatigue (Lerman, 1973; Christensen, 1981). Selective
occlusion alteration is thought to alleviate signs and symptoms of TMJ (Belser and Hannam,
1985), which is based on the assumption that certain occlusal interferences may act as triggers
in the development of bruxism or cause pain in the masticatory muscles by disturbing their
pattern of activity; however, the physiologic processes that ensue are poorly understood
(Hannam et al., 1977). Still, providing an occlusion scheme that can reduce the EMG activity of
muscles of mastication during function or parafunction is desirable. This systematic review
indicates that it is very likely that altering the lateral occlusion scheme influences the EMG
activity during parafunctional activities, while normal physiological function (chewing) was
found to minimally influence the muscles activity. In addition, masticatory muscles were
influenced by the lateral occlusion scheme differently, with the anterior temporalis muscle
being the most affected. In support to the protective role of CGO, several studies found that
CGO is associated with less EMG activity during parafunctional activities (Okano et al., 2002;
Okano et al., 2007; Gutierrez et al., 2010), while BBO was clearly associated with the greatest
EMG activity (Okano et al., 2002; Okano et al., 2007). Overall, as the number of contacts
increased on the working side, the magnitude of EMG activity also increased (Okano et al.,
2002; Okano et al., 2007). This could be due to the inability of patients to exert excessive
clenching forces where there are fewer teeth contacts. Interestingly, the significant effect of
different occlusion schemes on muscle activities was not always observed from all the studies.
Some muscles (anterior temporalis and sternocleidomastoid) (Gutierrez et al., 2010; Rodriguez
et al., 2011) appear to be more affected than others (masseter, infrahyoid and suprahyoid)
(Valenzuela et al., 2006; Miralles et al., 2007; Campillo et al., 2008; Valenzuela et al., 2012).
Further, the dynamic position appears to play a significant role for muscles activities. For
example, parafunctional activities, primarily edge-to-edge, were responsible for the greatest
increase in EMG activities. Clinically, muscle activities will be more complex as there is no
standardized position for parafunctional activities. Further, a genuine specific lateral occlusion
scheme is not commonly occurring. For example, many people have GFO for the first 1-2 mm
excursion followed by established CGO in the edge-to-edge position (Abduo et al., 2013). In
addition, balancing contacts were found to be very common within the normal population
(Abduo et al., 2013), which could lead to a deviation from the outcome of the experiments
included that are based on ideal scenarios or experimental set-up.
In terms of function, there are some signs that GFO facilitates quicker chewing. This could be
attributed to the greater tooth contacts during lateral movements, and greater freedom in

98
lateral movement. Similar observations were made from the chewing experiment by Buschang
et al, who found participants with a deep bite had slower chewing and a narrowing chewing
pattern (Buschang et al., 2007).
For natural dentition, there is no evidence that lateral occlusion scheme influences patient’s
satisfaction (Yi et al., 1996). However, for implant-supported prostheses, GFO might be more
comfortable to patients with fixed maxillary implant-supported prosthesis over a period of a
few months (Jemt et al., 1985). This could be related to the lack of proprioception for the
implant-supported prosthesis, and the greater freedom for mandibular movement. Such
findings could support the recommendation of a greater freedom of movement.
4.5.2. Long-term effect of lateral occlusion scheme
From the long-term studies, this systematic review supports that there is no relationship
between lateral occlusion scheme and dysfunction. According to Yi and Carlsson, CGO, GFO,
and BBO were not related to dysfunction development (Yi et al., 1996). The other studies
confirmed that for asymptomatic individuals, the lateral occlusion scheme can be altered
without causing patient discomfort or dysfunction development. This applies to CGO and GFO
and for tooth- and implant-supported prosthesis. Although the patient might be aware of the
occlusion alteration, patient adaptation was reported after a brief period following prostheses
insertion (a few weeks to a few months) (Dahl and Krogstad, 1985; Gross and Ormianer, 1994;
Ormianer and Gross, 1998; Ormianer and Palty, 2009). However, patient awareness of the
alteration has been primarily attributed to the increase of the VDO. This has been clearly
demonstrated by Sierpinska et al. who found that following an increase of VDO, the EMG
activity of masticatory muscles had reduced immediately. Following a 3 months period, the
EMG activity was restored to similar levels to the pre-treatment EMG activity (Sierpinska et al.,
2013). This also supports that the altered EMG activity detected by the earlier studies is due to
experimental design with no true clinical significance, and the EMG activity might be restored
to closer to base line record.
The outcome of this review supports that there is no causative relationship between the
lateral occlusion scheme and TMD development. This is in accordance with the multiple logistic
regression analysis that found that only for 15% of cases, the occlusal factors were related to
TMD development (Pullinger et al., 1993). Further, Seligman and Pullinger established that
altering the occlusal variable is not necessarily associated with TMD developments (Seligman
and Pullinger, 1991). Likewise, the current state of evidence indicates that occlusal treatment
will not prevent or treat TMD. Instead, non occlusal treatment is considered more justifiable

99
and conservative (De Boever et al., 2000a; b; Koh and Robinson, 2003; Liu et al., 2012; Turp
and Schindler, 2012). Therefore, altering the occlusion scheme by restoration to solely prevent
or treat TMD is not acceptable according to the current level of evidence.
In addition, this review cannot find a clear relationship between the lateral occlusion scheme
and mechanical complications of the restorative treatment for tooth supported restoration or
prosthesis. CGO and GFO appear to have a satisfactory outcome for composite restorations
and for fixed prostheses for up to 5 years. For composite, restoration degradation was
observed in relation to wear, surface roughness, marginal integrity and staining (Hemmings et
al., 2000; Redman et al., 2003; Poyser et al., 2007; Schmidlin et al., 2009; Attin et al., 2012; Al-
Khayatt et al., 2013). However, this is not necessarily related to the occlusion scheme. Instead,
it appears to be related to the restorative material which is in accordance with other clinical
trials (Kopperud et al., 2012; Pallesen et al., 2013). Hemmings et al. found the success was
dependent on the composite brand (Hemmings et al., 2000). Likewise, Redman et al. found the
marginal fracture was affected by the composite materials used (Redman et al., 2003). Other
than the occlusion scheme, bruxism appears to contribute to the failure rate of the composite
restorations (Redman et al., 2003). Therefore, a relationship between restoration/prosthesis
longevity and lateral occlusion scheme cannot be established at this stage. Preferably, this
relationship should further be validated by a comparative long-term clinical trial.
Biomechanically, Implant-supported prosthesis differs from tooth prosthesis in the lack of the
periodontal ligament and its proprioceptive capabilities (Kim et al., 2005). Several authors
confirmed that teeth are more sensitive in detecting occlusal interferences than implants
(Jacobs and van Steenberghe, 1993; Mericske-Stern et al., 1995). In addition, the cushioning
effect of the periodontal ligament will render the tooth twenty times more mobile more than
the implant (Kim et al., 2005). Therefore, it is expected that the risk of overloading is greater
for implants than teeth. However, whether altering the occlusion scheme will cause a
significant overloading of the implants is yet to be answered. Further, it is not yet known if the
occlusion on oral implants should be different from that of teeth (Carlsson, 2009).
For fixed dental prosthesis supported by implants, there are some signs that GFO is associated
with greater mechanical complications in the form of ceramic chipping than CGO (Kinsel and
Lin, 2009). However, the authors did not attribute the increased rate of ceramic chipping to
the GFO. In general, for implant prosthesis, it is recommended to alleviate the implant
prosthesis from lateral contacts during excursion and maintaining contacts on natural teeth
(Taylor et al., 2000; Kim et al., 2005), which is envisaged to minimize the non-axial loading of
implant components, which puts them at greater risk for mechanical failure through micro

100
movement or flexure (Taylor et al., 2000). Thus, CGO would be beneficial to alleviate the
contacts on posterior implant prosthesis. On the contrary, with more extensive implant
prosthesis, it is rather difficult to alleviate all of the implant prosthesis from lateral contacts
during excursion, which mandates GFO. However, systematic reviews revealed that multi-unit
implant prosthesis has a tendency to have more mechanical complications than single implant
prosthesis (Goodacre et al., 2003b). For example, over a period of 5 years, the incidence of
ceramic veneer fracture was 3.5% (Jung et al., 2012) for single implant prosthesis and 13.5%
for fixed dental prosthesis (Pjetursson et al., 2012). The effect of the prosthesis extension
could contribute to the observed difference in incidence of ceramic chipping. Still, the
implication of the lateral occlusion scheme on major complications such as screw
complications, implant fracture, and components fracture is yet to be investigated. Therefore,
the current evidence does not answer the question of whether the implant occlusion should
differ from natural teeth occlusion or not (Carlsson, 2009). More critically contributing factors
to veneer complications are the presence of bruxism and the opposing occlusion. There is an
agreement between the two included studies that bruxism and opposing prosthesis supported
by implants contribute to the increased incidence of veneer chipping (Kinsel and Lin, 2009;
Ormianer and Palty, 2009). Therefore, a recommendation was made to wear an occlusal splint
for protection against the parafunctional activities. It is very likely that the lateral occlusion
scheme is a less critical factor for implant overloading than the parafunctional activities or
opposing dentition.
4.5.3. Ideal lateral occlusion scheme
This systematic review revealed that although the different lateral occlusion schemes illicit
different immediate responses, the long-term effect of any scheme cannot be confirmed. Since
the long-term studies have confirmed that patients with CGO or GFO can function comfortably,
a bench mark lateral occlusion scheme cannot be proposed, as stated by earlier reports
(Becker and Kaiser, 1993; Turp et al., 2008). This also fits with a recent systematic review that
reports a significant variation of the lateral occlusion scheme for the physiological non-
restored dentition, and that a genuine lateral occlusion scheme rarely occurs naturally (Abduo
et al., 2013). This supports the view that the impact of the lateral occlusion schemes was
overrated in the earlier literature (Carlsson, 2010). Consequently, in accordance with several
investigators, it is recommended to implement flexibility and broader principles in occlusion
design (Becker and Kaiser, 1993; Turp et al., 2008; Abduo et al., 2013). Therefore, as a clinical
guide, instead of adhering to a preconceived occlusion scheme when complex restorative
treatment is indicated, the clinician should consider an occlusion scheme that is practical,
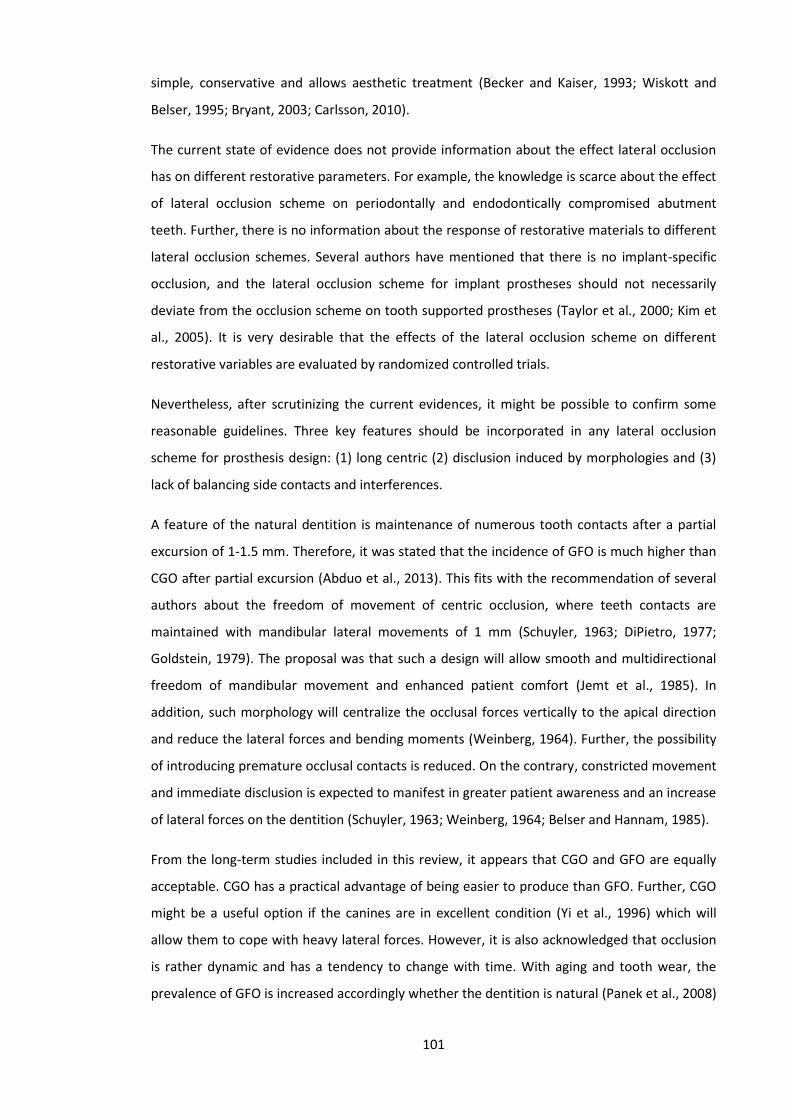
101
simple, conservative and allows aesthetic treatment (Becker and Kaiser, 1993; Wiskott and
Belser, 1995; Bryant, 2003; Carlsson, 2010).
The current state of evidence does not provide information about the effect lateral occlusion
has on different restorative parameters. For example, the knowledge is scarce about the effect
of lateral occlusion scheme on periodontally and endodontically compromised abutment
teeth. Further, there is no information about the response of restorative materials to different
lateral occlusion schemes. Several authors have mentioned that there is no implant-specific
occlusion, and the lateral occlusion scheme for implant prostheses should not necessarily
deviate from the occlusion scheme on tooth supported prostheses (Taylor et al., 2000; Kim et
al., 2005). It is very desirable that the effects of the lateral occlusion scheme on different
restorative variables are evaluated by randomized controlled trials.
Nevertheless, after scrutinizing the current evidences, it might be possible to confirm some
reasonable guidelines. Three key features should be incorporated in any lateral occlusion
scheme for prosthesis design: (1) long centric (2) disclusion induced by morphologies and (3)
lack of balancing side contacts and interferences.
A feature of the natural dentition is maintenance of numerous tooth contacts after a partial
excursion of 1-1.5 mm. Therefore, it was stated that the incidence of GFO is much higher than
CGO after partial excursion (Abduo et al., 2013). This fits with the recommendation of several
authors about the freedom of movement of centric occlusion, where teeth contacts are
maintained with mandibular lateral movements of 1 mm (Schuyler, 1963; DiPietro, 1977;
Goldstein, 1979). The proposal was that such a design will allow smooth and multidirectional
freedom of mandibular movement and enhanced patient comfort (Jemt et al., 1985). In
addition, such morphology will centralize the occlusal forces vertically to the apical direction
and reduce the lateral forces and bending moments (Weinberg, 1964). Further, the possibility
of introducing premature occlusal contacts is reduced. On the contrary, constricted movement
and immediate disclusion is expected to manifest in greater patient awareness and an increase
of lateral forces on the dentition (Schuyler, 1963; Weinberg, 1964; Belser and Hannam, 1985).
From the long-term studies included in this review, it appears that CGO and GFO are equally
acceptable. CGO has a practical advantage of being easier to produce than GFO. Further, CGO
might be a useful option if the canines are in excellent condition (Yi et al., 1996) which will
allow them to cope with heavy lateral forces. However, it is also acknowledged that occlusion
is rather dynamic and has a tendency to change with time. With aging and tooth wear, the
prevalence of GFO is increased accordingly whether the dentition is natural (Panek et al., 2008)
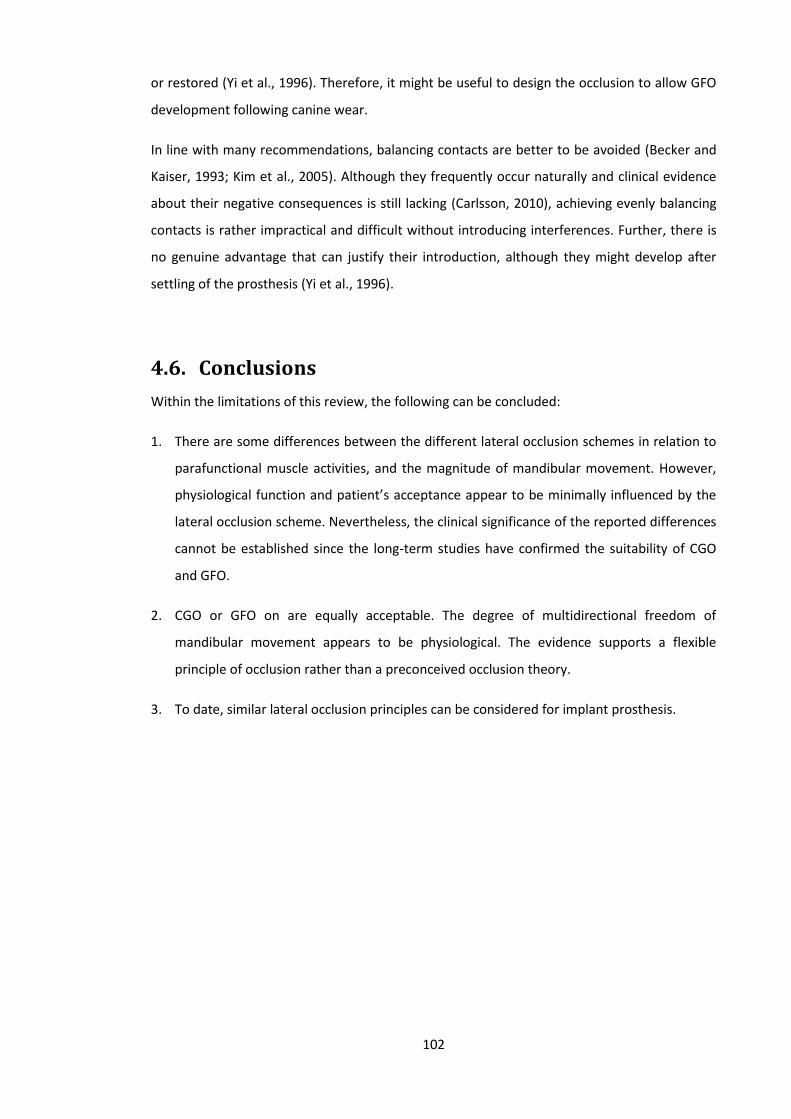
102
or restored (Yi et al., 1996). Therefore, it might be useful to design the occlusion to allow GFO
development following canine wear.
In line with many recommendations, balancing contacts are better to be avoided (Becker and
Kaiser, 1993; Kim et al., 2005). Although they frequently occur naturally and clinical evidence
about their negative consequences is still lacking (Carlsson, 2010), achieving evenly balancing
contacts is rather impractical and difficult without introducing interferences. Further, there is
no genuine advantage that can justify their introduction, although they might develop after
settling of the prosthesis (Yi et al., 1996).
4.6. Conclusions
Within the limitations of this review, the following can be concluded:
1. There are some differences between the different lateral occlusion schemes in relation to
parafunctional muscle activities, and the magnitude of mandibular movement. However,
physiological function and patient’s acceptance appear to be minimally influenced by the
lateral occlusion scheme. Nevertheless, the clinical significance of the reported differences
cannot be established since the long-term studies have confirmed the suitability of CGO
and GFO.
2. CGO or GFO on are equally acceptable. The degree of multidirectional freedom of
mandibular movement appears to be physiological. The evidence supports a flexible
principle of occlusion rather than a preconceived occlusion theory.
3. To date, similar lateral occlusion principles can be considered for implant prosthesis.

103
Chapter Five
5. Aims of the Study and Hypotheses

104
5.1. Aims
The central aim of this thesis is to compare the outcome of conventional and digital wax-ups
for prosthodontic treatment in relation to precision, aesthetics, contour, and occlusion. These
parameters were included because they are the critical features in any diagnostic wax-up.
The specific aims of this research:
Develop a form of digital wax-up.
Develop a tool for comparison.
Actual comparison between digital and conventional.

105
5.2. Hypotheses
The research has the following null hypotheses:
Hypothesis 1
There is no difference between conventional and digital wax-ups in relation to precision.
Hypothesis 2
There is no difference between conventional and digital wax-ups in relation to contour
alterations.
Hypothesis 3
There is no difference between conventional and digital wax-ups in relation to the maximal
intercuspal occlusal relationship (static occlusion).
Hypothesis 4
There is no difference between conventional and digital wax-ups in relation to dynamic
occlusal relationship.
Hypothesis 5
There is no difference between conventional and digital wax-ups in relation to aesthetics.

106
Chapter Six
6. Materials and Methods
The methodology described in this chapter was described in the following articles:
Abduo J. Virtual prosthodontic planning for oral rehabilitation: a pilot study. CI Health. 2012;
34-42. (Appendix F)
Abduo J, Bennamoun M. Three-dimensional image registration as a tool for forensic
odontology: a preliminary investigation. American Journal of Forensic Medicine and Pathology.
2013; 34:260-266. (Appendix G)

107
6.1. Patient Recruitments
A human research ethics approval was obtained from the Human Research Ethics Committee
of The University of Western Australia (RA/44/1/5079). Models of 15 patients receiving fixed
prosthodontic treatment were collected according to pre-determined selection criteria (Table
6—1). From all the models, a total of 238 teeth required fixed prostheses. For all the patients,
diagnostic wax-up prior to the prosthetic treatment was performed. The treatments were
provided at the Oral Health Centre of Western Australia.
Table 6—1 Selection criteria
Fixed prosthodontic treatment in the form of crowns or bridges Diagnostic wax-up is needed The planned prostheses were completely supported by natural teeth No removable or implant prostheses
6.2. Pre-Treatment Models
For each patient, maxillary and mandibular impressions were taken by irreversible hydrocolloid
impression material (Alginate, GC America, IL, USA). Whenever indicated, an intra-oral occlusal
relation record was taken by polyvinyl siloxane registration material (GC Exabite, GC America,
IL, USA). The impressions were poured by dental stone (Buff Stone, Adelaide Moulding &
Casting Supplies, South Australia, Australia). These models comprised the pre-treatment dental
situations. All the models were duplicated twice by reversible hydrocolloid material (Magafeel,
MKM System, Haanova, Slovakia). One set of models were treated by conventional wax-up and
the other by digital wax-up.
The pre-treatment models were scanned by a micro-CT scanner (SkyScan, Bruker micro-CT,
Kontich, Belgium) (12 µm resolution, 360o scanning, 70 KV source voltage, 1.0 mm Al filtration).
The micro-CT scanner was used in this study as an alternative to 3D surface scanner due to its
availability in The University of Western Australia. The advantage of micro-CT scanning is the
ability to produce an accurate image that exhibits a dimensional error of 0.1% (Waring et al.,
2012). Virtual 3D Stereolithography (STL) images of the maxillary and mandibular models were
constructed from the Digital Imaging and Communication Medicine (DICOM) images with the
aid of a DICOM viewing program (CTvox, Bruker micro-CT, Kontich, Belgium) (Figure 6-1). The
STL images of the pre-treatment models were used for the digital wax-up and the subsequent
analysis (Figure 6-2).

108
A B
Figure 6-1 STL image construction from DICOM images. (A) An example of single slice DICOM image. (B) The process of STL image construction
A
B
Figure 6-2 (A) Actual pre-treatment maxillary and mandibular casts. (B) Virtual pre-treatment models.
To ensure the STL images obtained from micro-CT scanning are at least equivalent to the
images provided by a commercial scanner, the micro-CT scanner precision was validated. A
single model was sent to a commercial dental laboratory for scanning by a laser surface
scanner with an accuracy of 20 µm (3Shape D-640, Wieland-Imes, Pforzheim, Germany). The

109
laser surface scanner was used as it is the benchmark scanner for dental models (Persson et
al., 2006). The same model was scanned by the micro-CT scanner, and the two STL images
were compared. The comparison revealed a similar outcome by the two scanners, which
confirms the reliability of the micro-CT scanner (dimensional error of less than 0.0 mm) (Figure
6-3).
A B C
Figure 6-3 The micro-CT scanner validation process. (A) A maxillary model scanned by the laser scanner. (B) The same model after scanning by the micro-CT scanner. (B) A colour-coded map generated after registering the two STL images, which confirms the similarity between the two images.
6.3. Conventional Wax-Up
The actual models of each patient were articulated on a semi-adjustable articulator (Whip Mix,
Louiseville, KY, USA) using the intra-oral occlusal record. Average values were used for the
articulator setting. To facilitate the subsequent digital evaluation, silicone material putty
(Dental Speedex Putty, Coltene/Whaledent AG, Altstatten, Switzerland) was applied on the
buccal aspects on the posterior teeth of the articulated models. The silicone registration
indices were scanned by the micro-CT scanner to obtain virtual registration indices.
The conventional wax-up was completed by the additive waxing technique, where the inlay
wax (VITA Zahnfabrik, Bad Sackingen, Germany) was applied to modify tooth morphology. In
some situations, the external surfaces of the teeth were trimmed. The wax-up aimed to
replace the missing tooth structures, establish natural tooth morphology, achieve symmetry
between the two sides, and obtain even bilateral occlusal contacts and a physiological lateral
occlusal scheme (canine-guided or group function occlusions) (Figure 6-4). All the conventional
wax-ups were completed by an experienced dental technician with fixed prosthodontics (more
than 10 years of experience). One clinician was responsible for approving the diagnostic wax-
ups. Following the completion of the conventional wax-up, silicone putty was applied on the
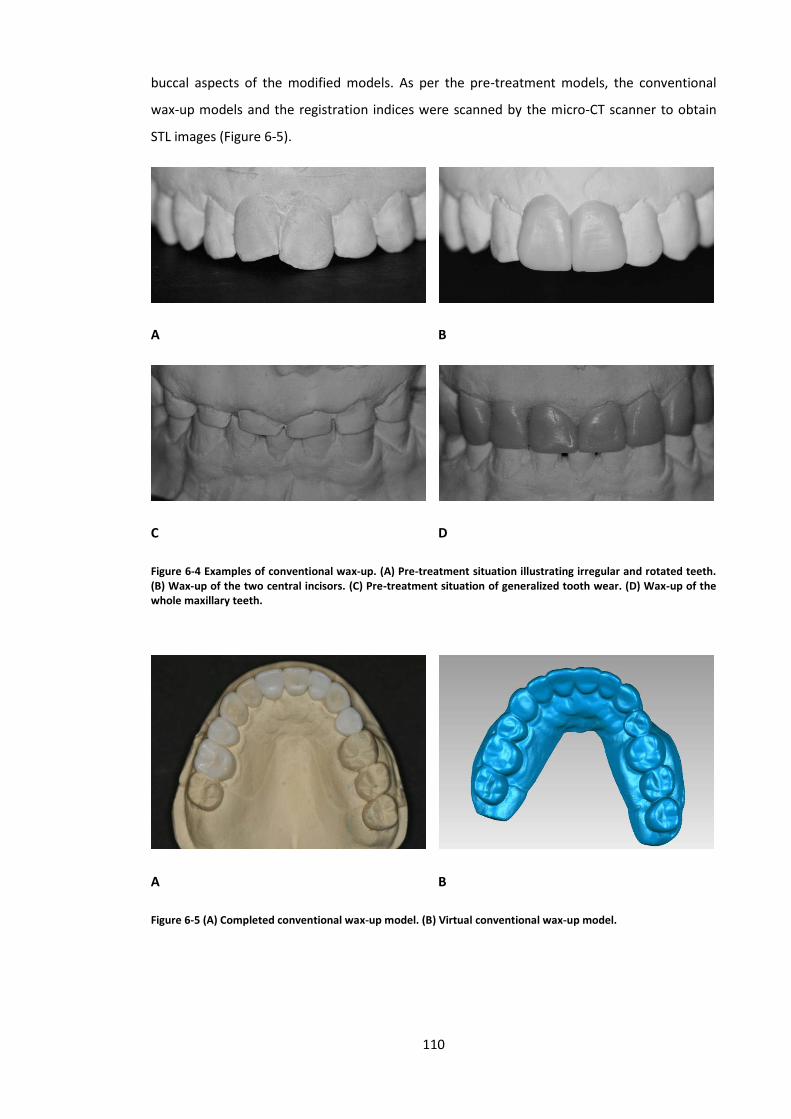
110
buccal aspects of the modified models. As per the pre-treatment models, the conventional
wax-up models and the registration indices were scanned by the micro-CT scanner to obtain
STL images (Figure 6-5).
A B
C D
Figure 6-4 Examples of conventional wax-up. (A) Pre-treatment situation illustrating irregular and rotated teeth. (B) Wax-up of the two central incisors. (C) Pre-treatment situation of generalized tooth wear. (D) Wax-up of the whole maxillary teeth.
A B
Figure 6-5 (A) Completed conventional wax-up model. (B) Virtual conventional wax-up model.

111
6.4. Virtual Articulation
With the aid of the virtual silicone indices, the pre-treatment and conventional wax-up models
were articulated through the process of image registration. A 3D rendering software package
(Geomagic Studio, Raindrop Geomagic Inc., Research Triangle Park, NC, USA) was used for the
registration process (Delong et al., 2002). Eventually, the silicone indices were deleted digitally,
and the two models were digitally articulated (Figure 6-6).
A B
C D
Figure 6-6 (A) The articulation process. The maxillary and mandibular virtual models before articulation. (B) The virtual silicone registration indices that can fit on the buccal aspects of articulated models. (C) The maxillary and mandibular models were repositioned according to the silicone indices by the process of image registration. (D) The articulated maxillary and mandibular models after the removal of silicone indices.
6.5. Digital Wax-Up
The maxillary and mandibular virtual pre-treatment models of each patient were used for the
digital wax-up procedure. The virtual pre-treatment models were articulated according to the
articulated conventional wax-up models. This was achieved by superimposing the virtual pre-
treatment models on the virtually articulated conventional wax-up models. The unaltered
tissues were used for the registration. The Geomagic Studio software was used to complete
the digital wax-up. To obtain aesthetic tooth morphology, physiological teeth moulds
(Phonares Teeth, Ivoclar Vivadent AG, Schaan, Liechtenstein) were scanned by the micro-CT
scanner (Figure 6-7).

112
Figure 6-7 Examples of the available virtual teeth. As the anterior maxillary teeth are key teeth in obtaining ideal aesthetics, many teeth shapes are available for clinician use.
Each tooth was fitted virtually on the model with the aim of obtaining ideal teeth
arrangement, emergence profile, symmetry and aesthetics. Since the gingival-tooth junction
demarcates the most apical extension of tooth modification, it was marked on the virtual pre-
treatment models. The virtual tooth alignment involved size alteration, rotation and
translation. This was followed by ensuring that ideal occlusal contacts existed. This was
achieved by locating the cusps within the opposing fossae. For each case, a similar occlusion
scheme was established to what would have been implemented in the conventional wax-up
(Figure 6-8). After the completion of the wax-up, the scanned model and the virtual teeth were
merged to formulate a single model, which improves the computation speed of the
subsequent analysis.
A B C
Figure 6-8 Series of images that illustrate the digital teeth fitting. (A) Pre-treatment model. (B) Commencement of the digital wax-up. (C) Completed digital wax-up of the anterior maxillary teeth.
113
6.6. Analysis
Since all the models (pre-treatment, conventional wax-up and digital wax-up models) are
digital, all the analyses were completed digitally. The details of each analysis are presented
within the relevant experimental chapter. However, the mandatory steps for digital analysis
are discussed in this section: image registration and virtual quantification.
6.6.1. Image Registration
Several authors have discussed the image registration process which implements algorithms to
automatically align and estimate similarities between two 3D images in a process commonly
called image registration (Williams et al., 1999; Williams and Bennamoun, 2001; Mian et al.,
2006; Abduo and Bennamoun, 2013). For this project, a similar approach was used to compare
and align the different models. The virtual image registration of the different models was
performed by Geomagic Studio software. The alignment process is composed of three
sequential steps: point-to-point registration, global registration, and the calculation of the 3D
euclidean distances (EDs) between the two models. The point-to-point registration determines
the initial approximate orientation of the two images by manually locating common
anatomical landmarks, such as cusp tip, fossa, groove or gingival margin. A correspondence of
at least three points was selected. These points are selected on unaltered surfaces. The global
registration is based on the Iterative Closest Point algorithm (Besl and McKay, 1992), and it
aims to align the meshes according to the best-fit principle. As a function of the software, the
deviations between two images were represented as the average 3D EDs of 2000 random
corresponding points on the common surfaces of the two meshes. The absolute deviation
values were used in the study to solely indicate the magnitude of the deviations. Therefore,
the less mean distance between the meshes, the better the fit between the two meshes. This
quantitative measure provides an estimate of the similarity between the 2 images.
Qualitatively, the discrepancy distribution between the different models can be illustrated in
colour-difference maps to locate the dimensional positive and negative differences (Figure 6-
9). The threshold value was set at 1 mm. The warm colours represent positive deviations,
whereas the cold colours represent negative deviations. The green colour indicates an optimal
match.

114
A B
C D
Figure 6-9 An example of the process of image registration. (A) A pre-treatment model. (B) The model after the dental modifications. (C) The models were superimposed by the process of image registration. As the soft tissues were not altered, they were used as a reference to control the registration process. (D) Colour-coded map can be implemented to quantify the differences between the two models.
6.6.2. Virtual measurements
A key advantage of digital measurements is the accurate quantification. This involves the
measurements of the distance between two spatial points and calculation of specified surface
area (Figure 6-10). As the measurements occur on 3D virtual models, the models can be
magnified. This will facilitate accurate location of the area of interest. The distance and area
measurements were conducted using the feature of 3D rendering software.
A B
Figure 6-10 Images illustrating the use of the software for virtual measurements. (A) The virtual ruler can be implemented to measure the distance between the different coordinates that represent tooth dimension. (B) An example of occlusal area quantification.

115
Several authors reported that the advantages of digital measurements over physical
measurements are accuracy, convenience, consistency and less chance of errors (Redlich et al.,
2008; Dalstra and Melsen, 2009; Prasad and Al-Kheraif, 2013). Redlich et al. demonstrated that
3D virtual measurements were, at least, similar to manual measurements (Redlich et al., 2008).
Furthermore, Dalstra et al. reported that virtual model measurements suffered from less
variability than manual model measurements (Dalstra and Melsen, 2009). Prasad and Al-
Kheraif compared measurements obtained from travelling microscope and micro-CT. They
found that the virtual measurements of the micro-CT slices were more consistent than
travelling microscope measurements (Prasad and Al-Kheraif, 2013). This superior accuracy
could be attributed to the ability of enlarging the models to locate the points of interest
precisely, and the software ability to measure the distance between coordinates accurately
(Quintero et al., 1999; Kusnoto and Evans, 2002). This will eventually overcome the difficulties
of measuring the dimensions of extremely fine features.

116
Chapter Seven
7. Precision of Digital Prosthodontic Planning for
Oral Rehabilitation
This chapter was published in the following article:
Abduo J, Bennamoun M, Tennant M, McGeachie J. Precision of virtual prosthodontic planning
for oral rehabilitation. British Journal of Applied Sciences and Technology. 2014; 4:3915-3929.
(Appendix H)

117
7.1. Abstract
Objective: Recently, digital wax-up is proposed as a tool to aid prosthodontic planning.
Accuracy is a requirement of the diagnostic wax-up in order for its information to be
transferrable clinically. The purpose of this study is to evaluate the precision of digital
prosthodontic planning in the form of digital wax-up.
Materials and Methods: Twenty-five dental arch models of 15 patients were collected. The
models were duplicated twice to allow for the execution of conventional wax-up and digital
wax-up. The conventional wax-up involved tooth modification with inlay wax. The digital wax-
up was based on fitting average tooth forms on virtual pre-treatment models. For the analysis,
the conventional wax-up models were converted to digital models. All the wax-up models
were segmented to yield soft tissue and tooth-gingiva models. With the aid of the 3D image
registration process, the segmented models were superimposed on the pre-treatment models
to evaluate the accuracy of fit. Further, the gingival margin discrepancies of each wax-up
protocol were evaluated.
Results: The image registration process revealed less discrepancies for the digital wax-up (soft
tissue = 0.11mm, tooth-gingiva junction = 0.11mm) than the conventional wax-up (soft tissue =
0.18mm, tooth-gingiva junction = 0.20mm). Similarly, the gingival margin discrepancies were
less for the digital wax-up. However, the patterns of discrepancies were similar for the two
wax-up protocols.
Conclusion: In terms of accuracy and transferability, the digital wax-up is comparable to the
conventional wax-up.
Key words: wax-up; digital; micro-CT; dental model; image registration

118
7.2. Introduction
Prosthodontic treatment is frequently indicated to manage aesthetic and functional problems.
In many instances, the treatment necessitates irreversible alterations to the existing teeth. In
order to justify such alterations, a significant benefit of the treatment should be apparent. In
an aesthetically conscious society, the patient’s aesthetic needs should be predictably
incorporated into the prosthodontic treatment. Therefore, to reach a satisfactory outcome,
comprehensive diagnostic planning and wax-up should be conducted before embarking on the
definitive prosthodontic rehabilitation.
Diagnostic wax-up simulates the prosthodontic treatment and allows for visualization of the
outcome and helps in deciding on the most adequate treatment plan for a specific case
(Magne and Belser, 2004; Gurel, 2007). The outcome of this “trial” treatment can be
demonstrated to the patient for approval or suggestion of any further modifications. In this
manner, the patient will be more informed of the final outcome. Subsequently, the diagnostic
wax-up will facilitate the “outcome-based treatment” which implies that the magnitude of
irreversible alteration to the teeth is dictated by the final outcome rather than the initial
patient presentation (Magne and Belser, 2004; Gurel, 2007). In addition, the provisional
restorations can be fabricated according to the diagnostic wax-up, and should the provisional
outcome satisfy the patient, the definitive prostheses will be fabricated to resemble the
diagnostic wax-up (Magne and Belser, 2004; Gurel, 2007).
The wax-up involves altering the teeth of diagnostic models to improve tooth morphology,
contour, vertical dimension and horizontal tooth width. The ideal diagnostic wax-up should be
precise, applicable and transferable. In order for the wax-up information to be precisely
transferrable intra-orally, the surrounding soft tissues should act as a reference landmark. This
mandates that the soft tissues are not to be altered through the wax-up process. Instead, the
modifications should be confined to the hard tissues. However, since the clinical crown
emerges from the gingival tissues, the tooth contour should be minimally affected on the
cervical area. Subsequently, the contour alteration should increase gradually towards the
occlusal surface.
More recently, with the advent of laser scanning, virtual planning, rapid prototyping and
computer-aided design and manufacturing, it is hypothesized that digital prosthodontic
planning can be accomplished in a time-efficient and well-controlled fashion. Digital wax-up
was proposed as a tool to plan for prosthodontic treatment instead of conventional wax-up
(Abduo, 2012). It is envisioned that the digital wax-up will overcome the problems of the
conventional wax-up such as time consumption and the requirement of high technical skills.

119
This study aims to evaluate the accuracy of digital diagnostic wax-up. The null hypothesis is
that the two wax-up protocols exhibit similar accuracy.
7.3. Materials and Methods
Human research ethics approval was obtained from the Human Research Ethics Committee of
The University of Western Australia (RA/4/1/5097). Twenty five dental arch models of 15
patients requiring prosthodontic treatment were collected. From the models’ pool, a total of
238 teeth required fixed prosthodontic treatment. Consequently, diagnostic wax-up prior to
the prosthetic treatment was indicated.
Maxillary and mandibular impressions were taken by irreversible hydrocolloid impression
material (Alginate, GC America, IL, USA). Whenever indicated, an occlusal relation record was
taken by polyvinyl siloxane material (GC Exabite, GC America, IL, USA). The impressions were
poured by dental stone (Buff Stone, Adelaide Moulding & Casting Supplies, South Australia,
Australia). These models comprised the pre-treatment situation. Each model was duplicated
twice by reversible hydrocolloid material (Magafeel, MKM System, Haanova, Slovakia). One set
of models were treated by conventional wax-up and the other by digital wax-up.
7.3.1. Conventional wax-up
The actual models of each patient were articulated on a semi-adjustable articulator (Whip Mix,
Louiseville, KY, USA) using the intra-oral occlusal record. Average values were used for the
articulator setting. The conventional wax-up was completed by the addition of inlay wax (VITA
Zahnfabrik, Bad Sackingen, Germany) on the teeth contour. In some cases, the external
surfaces of the teeth were trimmed. The wax-up aimed to replace the missing tooth structures,
establish natural tooth morphology, achieve symmetry between the two sides, and obtain
even bilateral occlusal contacts and a physiological lateral occlusal scheme (canine-guided or
group function occlusions) (Figure 7-1). The conventional wax-ups were completed by an
experienced dental technician.
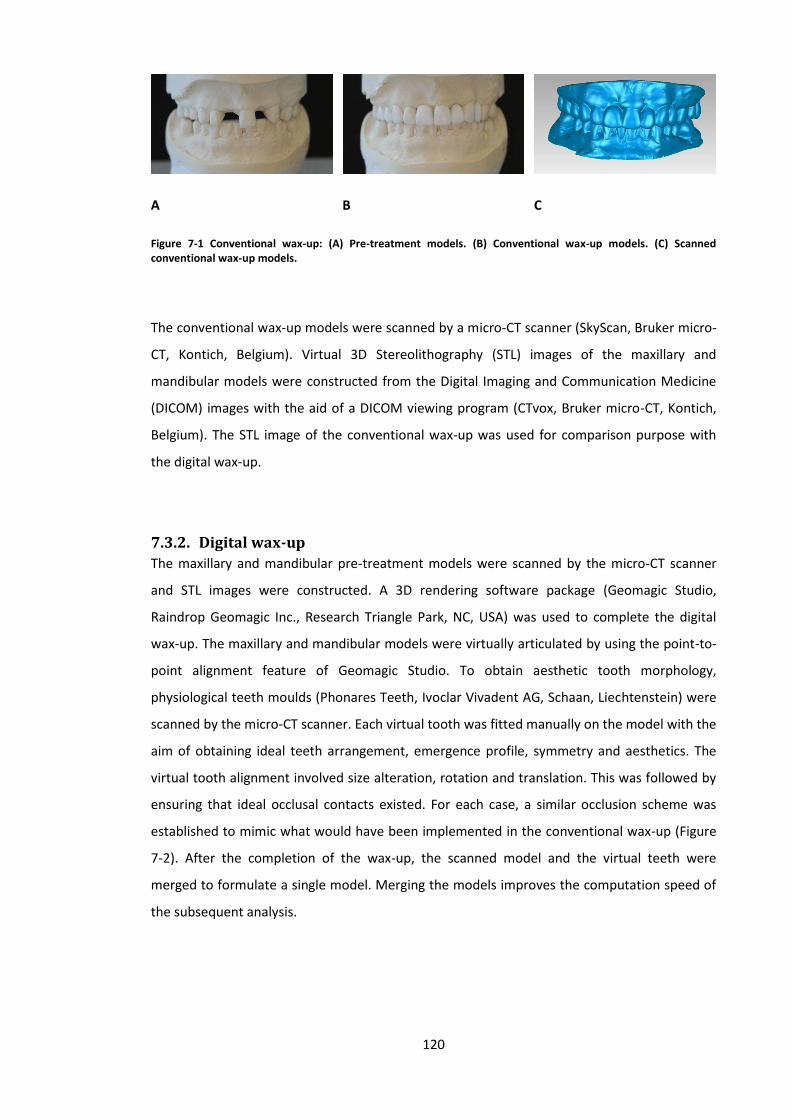
120
A B C
Figure 7-1 Conventional wax-up: (A) Pre-treatment models. (B) Conventional wax-up models. (C) Scanned conventional wax-up models.
The conventional wax-up models were scanned by a micro-CT scanner (SkyScan, Bruker micro-
CT, Kontich, Belgium). Virtual 3D Stereolithography (STL) images of the maxillary and
mandibular models were constructed from the Digital Imaging and Communication Medicine
(DICOM) images with the aid of a DICOM viewing program (CTvox, Bruker micro-CT, Kontich,
Belgium). The STL image of the conventional wax-up was used for comparison purpose with
the digital wax-up.
7.3.2. Digital wax-up
The maxillary and mandibular pre-treatment models were scanned by the micro-CT scanner
and STL images were constructed. A 3D rendering software package (Geomagic Studio,
Raindrop Geomagic Inc., Research Triangle Park, NC, USA) was used to complete the digital
wax-up. The maxillary and mandibular models were virtually articulated by using the point-to-
point alignment feature of Geomagic Studio. To obtain aesthetic tooth morphology,
physiological teeth moulds (Phonares Teeth, Ivoclar Vivadent AG, Schaan, Liechtenstein) were
scanned by the micro-CT scanner. Each virtual tooth was fitted manually on the model with the
aim of obtaining ideal teeth arrangement, emergence profile, symmetry and aesthetics. The
virtual tooth alignment involved size alteration, rotation and translation. This was followed by
ensuring that ideal occlusal contacts existed. For each case, a similar occlusion scheme was
established to mimic what would have been implemented in the conventional wax-up (Figure
7-2). After the completion of the wax-up, the scanned model and the virtual teeth were
merged to formulate a single model. Merging the models improves the computation speed of
the subsequent analysis.

121
A B C
Figure 7-2 Digital wax-up. (A) Scanned pre-treatment models. (B) Scanned physiological teeth. (C) Digital wax-up models.
7.3.3. Analysis
For the direct comparison between the conventional and digital wax-ups, all the models were
remeshed with a density of 0.1 mm, and the base of the models where trimmed to a similar
extension. All the measurements were completed digitally (DeLong et al., 2003; Redlich et al.,
2008; Abduo and Bennamoun, 2013). In order to compare the conventional wax-up and the
digital wax-up, the following variables were considered: image registration of the soft tissues,
image registration of tooth-gingiva junctions and measurements of the gingival margin
extensions.
The purpose of the image registration of the soft tissue was to indicate the accuracy of the
unaltered structures that can be used as a reference for intra-oral application. The tooth-
gingiva junctions’ evaluation will quantify the effect of the wax-up on tooth emergence profile.
Such information is relevant to the hygienic feature of the proposed treatment. The
measurements of gingival margin extensions aimed to locate and quantify the possible impact
of each wax-up on the gingival margins. This information reflects the precision of each wax-up
of the different regions in the arch. For all the measurements, absolute values between the
images were used. This was to avoid any under-estimation of the mean discrepancy between
the images by combining positive and negative values. Therefore, the less the mean distance
between the wax-up and the pre-treatment model, the better the accuracy of the wax-up.
7.3.4. Image registration
As mentioned by several authors, image registration involves the automatic alignment of two
3D images to estimate any similarities or discrepancies (DeLong et al., 2003; Abduo and
Bennamoun, 2013). In this study, the 3D image of each wax-up was registered against the 3D
pre-treatment image. The registration process was performed by Geomagic Studio Software
through three sequential steps: (1) point-to-point registration, (2) global registration and (3)

122
calculation of the 3D Euclidean distance (ED). The point-to-point registration determines the
initial approximate orientation of the pre-treatment and the wax-up images by manually
locating at least three common landmarks. The global registration is based on the Iterative
Closest Point algorithm (Abduo and Bennamoun, 2013), and it aims to align the meshes
according to the best-fit principle. The deviation between two aligned points was determined
by the 3D ED value. The following equation was utilized to calculate the ED between a pre-
treatment image point (AP) and a corresponding wax-up image point (AW) in 3D coordinates
(x, y and z).
𝐸𝐷(𝐴𝑃, 𝐴𝑊) = √(𝐴𝑃𝑥 − 𝐴𝑊𝑥)2 + (𝐴𝑃𝑦 − 𝐴𝑊𝑦)2 + (𝐴𝑃𝑧 − 𝐴𝑊𝑧)2 (1)
As a function of the software, the final deviation between the pre-treatment and wax-up
images were represented as an average 3D EDs of 2000 random corresponding points of the
common surfaces of the two images. This quantitative measurement provides an estimate of
the similarity between the two images.
In order to register the wax-up images to pre-treatment images, the segmentation function of
the Geomagic Studio Software was employed. The segmentation of each wax-up model
yielded two structures: (1) soft tissue and (2) tooth-gingiva junction (Figure 7-3). To obtain the
images of the soft tissues, the segmentation was executed at the junction between the teeth
and the gingiva. The tooth-gingiva junction image was comprised of the 0.5 mm cervical teeth
portion and the 0.5 mm coronal gingival portion. Subsequently, each segmented structure was
registered against the corresponding pre-treatment model. The segmentation ensured that
the registration process was restricted to the soft tissues and the tooth-gingiva junction
without the influence of the altered teeth.

123
A B C
D E
Figure 7-3 The segmentation process that yielded soft tissue model and tooth-gingiva junction model. (A) Original model. (B) Selected soft tissue. (C) Selected tooth-gingiva junction. (D) Final soft tissue model. (E) Final junction model.
The accuracy of the segmented soft tissue of each wax-up was qualitatively evaluated against
the pre-treatment model by the colour-difference map. This map allows the determination of
the locations of the dimensional positive and negative deviations from the pre-treatment
model. The threshold value was set at 1 mm. The warm colours represent positive deviations,
whereas the cold colours represent negative deviations. The green colour indicates an optimal
match.
7.3.5. Gingival margin measurements
Following the image registration of the segmented soft tissues, the extensions of the gingival
margins were measured from the wax-up model to the gingival margins of the pre-treatment
model. For each tooth, the margins were measured at six locations: mesio-buccal, mid-buccal,
disto-buccal, mesio-lingual, mid-lingual and disto-lingual (Figure 7-4). For each location, a
digital point was located on the pre-treatment model and the corresponding location of the
wax-up model. Subsequently, the distance between the points was measured, which reflects
the accuracy of the gingival margins.

124
Figure 7-4 Example of locating the points of measurement around the gingival margin of a lateral incisor. The black point is located on the mid-tooth area and the red points are on the proximal areas.
7.3.6. Statistical analysis
The difference of image registration and gingival margin measurements of the conventional
wax-up and digital wax-up was evaluated by the t-test analysis (P value = .01). In relation to the
gingival margins, the following variables were evaluated: location on the arch (anterior vs.
posterior), and location on the tooth (mid-tooth vs. proximal).
In box plot diagrams, the gingival margin measurements of incisors, canines, premolars and
molars of the maxillae and mandibles were plotted. Further, the differences between the wax-
ups were compared for each tooth type.
7.4. Results
7.4.1. Image Registration
Overall, after global registrations, the conventional wax-up exhibited a greater ED than digital
wax-up. In relation to the soft tissues accuracy, the conventional wax-up had an average ED of
0.18 mm (SD = 0.04) and the digital wax-up had an average ED of 0.11 mm (SD = 0.01mm). The
difference between the two wax-ups was statistically significant (P < .001). The ED for tooth-
gingiva junction was 0.20 mm (SD = 0.05mm) for conventional wax-up and 0.11 mm (SD =
0.04mm) for digital wax-up. Likewise, there was a significant statistical difference (P < .001).
The qualitative evaluation of colour maps revealed consistency in all the included cases (Figure
7-5). The conventional wax-ups generally exhibited a good fit on the soft tissues distant from
the gingival margins. Overall, some islands of distortion were observed but confined to
0.25mm. It appears that the discrepancies are associated with the corrugated areas, while the
smooth surfaces had better fit. However, most of the discrepancies occurred on the gingival

125
margins. The most affected areas were the interdental papillae. Conversely, the soft tissues of
the digital wax-ups exhibited an optimal fit on the pre-treatment models. The areas of
distortion were confined to the gingival marginal area.
A B
C D
Figure 7-5 Colour-coded maps of each diagnostic wax-up after fitting on the pre-treatment model. (A) Conventional wax-up. (B) Magnified section of conventional wax-up. (C) Digital wax-up. (C) Magnified section of digital wax-up.
7.4.2. Gingival Margins
The mean gingival margin discrepancies for all locations was slightly higher for the
conventional wax-up (mean = 0.45mm, SD = 0.16mm) than for the digital wax-up (mean =
0.40mm, SD = 0.17mm). This difference was statistically insignificant. A comparison of the
proximal margins revealed that the conventional wax-up (mean = 0.59mm, SD = 0.20mm) had
insignificantly greater gingival margin discrepancies than the digital wax-up (mean = 0.51mm,
SD = 0.23mm). On the contrary, the mid-tooth measurements revealed insignificantly greater
values for digital wax-up (mean = 0.20mm, SD = 0.10mm) than the conventional wax-up (mean
= 0.16mm, SD = 0.13mm).

126
Comparing the gingival margin discrepancies around the anterior teeth revealed insignificantly
greater discrepancies for the conventional wax-up (mean = 0.47mm, SD = 0.40mm) than for
the digital wax-up (mean = 0.43, SD = 0.43mm). Mid-tooth comparison, revealed insignificantly
greater values for conventional wax-up (mean 0.30 mm, SD = 0.26mm) than digital wax-up
(mean = 0.27mm, SD = 0.23mm). Likewise, the proximal gingival margins of the conventional
wax-up (mean = 0.62mm, SD = 0.45mm) had insignificantly greater discrepancy than digital
wax-up (mean = 0.58 mm, SD = 0.51mm). For both of the wax-ups, the proximal gingival
margin values were significantly greater than mid-tooth values (P < .001).
Posteriorly, the conventional wax-up (mean = 0.38mm, SD = 0.45mm) had greater
discrepancies than the digital wax-up (mean = 0.33, SD = 0.43mm). This difference was
statistically insignificant. At the mid-tooth, the digital wax-up (mean = 0.18mm, SD = 0.13mm)
was not statistically different from the conventional wax-up (mean = 0.13, SD = 0.13mm). At
the proximal areas, the conventional wax-up (mean = 0.56mm, SD = 0.43mm) had significantly
greater discrepancies (P < .001) than digital wax-up (mean = 0.45mm, SD = 0.44mm). Similar to
the anterior segments, both of the wax-ups showed significantly greater proximal gingival
margin values than the mid-tooth values (P < .001).
For the different teeth, the box plot diagrams illustrate that there is similarity in the pattern of
the gingival margin discrepancies magnitude for the conventional and digital diagnostic wax-
ups (Figure 7-6). After comparing the two wax-up protocols for the different maxillary and
mandibular teeth there was no statistically significant difference. The exception was the
proximal areas of the maxillary and mandibular molars which were highly significant (P < .001).
A
0
0.5
1
1.5
2
2.5
3
Co
nve
nti
on
al
Dig
ital
Co
nve
nti
on
al
Dig
ital
Co
nve
nti
on
al
Dig
ital
Co
nve
nti
on
al
Dig
ital
Incisors Canines Premolars Molars

127
B
C
0
0.5
1
1.5
2
2.5
3
Co
nve
nti
on
al
Dig
ital
Co
nve
nti
on
al
Dig
ital
Co
nve
nti
on
al
Dig
ital
Co
nve
nti
on
al
Dig
ital
Incisors Canines Premolars Molars
0
0.5
1
1.5
2
2.5
3
Co
nve
nti
on
al
Dig
ital
Co
nve
nti
on
al
Dig
ital
Co
nve
nti
on
al
Dig
ital
Co
nve
nti
on
al
Dig
ital
Incisors Canines Premolars Molars

128
D
Figure 7-6 The box plot diagrams of the gingival margins for each tooth category. (A) Mid-tooth area of the maxillary teeth. (B) Proximal area of the maxillary teeth. (C) Mid-tooth area of the mandibular teeth. (D) Proximal area of the mandibular teeth.
7.5. Discussion
Several authors proposed methods for CAD modelling of dental restorations. In general, the
modelling process is composed of restoration space calculations and algorithmic
approximation of the virtual restoration that exhibits a natural anatomy (Rekow et al., 1991).
The estimation of the virtual restorations can take the form of fitting an average tooth (Paulus
et al., 1999; Mehl et al., 2005a; b; Ender et al., 2011) and mirror imaging of the contralateral
tooth (Probst and Mehl, 2008). In this study, an average tooth mould was used to modify the
pre-treatment tooth contour. To enhance the applicability of the digital wax-up, actual models
can be produced by rapid prototyping technology. The printed model is envisioned to provide
direct guidance to the involved dental clinician and technician.
In the presence of multiple treatment options to manage complex patient presentations, it is
critical for the clinician and the patient to be fully aware of the treatment outcome prior to
commencement. This becomes even more important with today’s high aesthetic expectations.
Consequently, an accurate diagnostic wax-up will facilitate the clinician-patient
communication and allow the patient to provide an informed consent prior to the treatment.
Since the diagnostic wax-up is time consuming and requires special training and artistic
abilities, many clinicians provide prosthodontic treatment without an accurate and
representative wax-up. Thus, it is speculated that the introduced digital diagnostic wax-up will
0
0.5
1
1.5
2
2.5
3
Co
nve
nti
on
al
Dig
ital
Co
nve
nti
on
al
Dig
ital
Co
nve
nti
on
al
Dig
ital
Co
nve
nti
on
al
Dig
ital
Incisors Canines Premolars Molars

129
alleviate many of the difficulties associated with conventional wax-up. In addition, the digital
wax-up exhibits several advantages that justify its application. For example, the process is
completed digitally and requires no physical materials which present a significant economical
benefit (Miyazaki and Hotta, 2011; van Noort, 2012). The pre-treatment models are not
altered and can be preserved with the patient’s record (Hans, 2002; Abduo and Bennamoun,
2013). This will alleviate the difficulties of preserving records, which should be kept for 5 to 10
years (Abduo and Bennamoun, 2013). In addition, there are no restrictions on the
transferability of the virtual models, which will facilitate rapid and remote consultations
between clinicians (Hans, 2002; Mayers et al., 2005; Redlich et al., 2008). With the aid of
software analysis, it is possible to evaluate the implications of the proposed diagnostic wax-up
on oral tissues, which is a useful feature to analyse the feasibility of the proposed treatment
(Davis et al., 2012). It is expected that this feature will enhance patient communication, and
the reviewing of the proposed dental treatment with relative ease. Further, from the practical
perspective, the adequacy of tooth preparation can be quantitatively evaluated by the
software and any additional modifications can be proposed (Hans, 2002; Mayers et al., 2005;
Redlich et al., 2008; Davis et al., 2012).
In this study, all the measurements were completed digitally. Several authors reported that the
advantages of digital measurements over physical measurements are accuracy, convenience,
consistency and less chance of errors (Redlich et al., 2008; Dalstra and Melsen, 2009; Prasad
and Al-Kheraif, 2013). Redlich et al. demonstrated that 3D virtual measurements were similar
to manual measurements (Redlich et al., 2008). Furthermore, Dalstra et al. reported that
virtual model measurements suffered from less variability than actual model measurements
(Dalstra and Melsen, 2009). Prasad and Al-Kheraif compared measurements obtained from
travelling microscope and micro-CT. They found that the virtual measurements of the micro-CT
slices were more consistent than travelling microscope measurements (Prasad and Al-Kheraif,
2013). This superior accuracy could be attributed to the ability of enlarging the models to
locate the points of interest precisely, and the software ability to measure the distance
between coordinates accurately (Quintero et al., 1999; Kusnoto and Evans, 2002). This will
eventually overcome the problems of measuring the dimensions of extremely fine features.
ED measurements in this study (about 0.20 mm) were within the expected range found by
other investigators using a similar experimental set-up. For example, superimposing duplicated
dental models revealed that the ED ranged from 0.15 to 0.17 mm in one study (Abduo and
Bennamoun, 2013). Additionally, Bell et al. found the average ED between actual and digital
models was 0.27 mm (Bell et al., 2003). Hirogaki et al. found the difference between actual and

130
digital models was within 0.30 mm (Hirogaki et al., 2001). Ayoub et al. found the models
digitization accuracy to be 0.20 mm (Ayoub et al., 1997).
The overall outcome of this study reflects the feasibility of digital wax-up. This is clear from its
comparability to the conventional wax-up protocol, which is the standard practice. This applies
to all the evaluated parameters of the study such as the anterior and posterior arch segments,
and the different locations around each tooth. Therefore, it could be expected that the
transferability and accuracy of the two wax-ups are similar. Both of them will produce
relatively similar restoration contours. This might potentially indicate that to a similar
situation, each wax-up will yield a similar outcome.
In terms of accuracy and transferability to the mouth, there are mathematical indications that
the digital wax-up is more accurate than the conventional wax-up. This is illustrated by the
lower ED values for the soft tissue and tooth-gingiva junction images, and the generally lower
discrepancies at the gingival margin. Although the null hypothesis is rejected, the outcome of
this study should be interpreted with caution as the base of the digital wax-up models was
composed from the pre-treatment model, while the conventional wax-up required additional
steps such as model duplication and second scanning. The duplication process involves using
duplicating material and pouring with stone model, which inevitably accumulates errors in the
form of expansion and shrinking (DeLong et al., 2003). The other source of inaccuracies is the
scanning that involves rendering and surface noise control to eliminate poorly located points.
Although rendering improves the quality of the image, it will inevitably influence the accuracy
of the final image (DeLong et al., 2003). However, from the clinical perspective, this difference
is most likely to be insignificant as the EDs for both wax-ups are minimal, which might be
acceptable for diagnostic wax-up.
The two wax-ups revealed that the proximal areas are more susceptible to discrepancies than
the mid-tooth areas (about twice the discrepancies). This was clearly observed from the
gingival margin measurements and the qualitative map analysis. Such findings could be
associated with more contour modifications and increased tooth emergence profile at the
proximal area compared with the middle of the tooth. An additional contributing factor is the
potential discrepancies in the impression procedure when the proximal area is recorded by
impression, due to the presence of excessive undercuts. Further, discrepancies can be caused
by the experimental design. For example, it is more difficult to virtually segment and quantify
corrugated regions compared to smooth regions (Redlich et al., 2008). On linear surfaces, such
as the mid-tooth area, it is easier to locate the points of interest (Zilberman et al., 2003), while
on the corrugated regions, such as the proximal areas, it might be difficult to locate the points

131
of interest, resulting in more inconsistencies of measurements (Santoro et al., 2003; Zilberman
et al., 2003). Still, such discrepancies can be of minimal clinical relevance as the wax-up is
primarily used for provisional restoration fabrication, which can be predictably modified
clinically in the proximal areas (Magne and Belser, 2004).
The presented digital wax-up protocol did not incorporate the alteration of the gingival
architecture, which might be indicated prior to periodontal surgery (Nowzari, 2001).
Therefore, the results of this study cannot be generalized to such clinical presentations.
However, with the increased popularity of 3D digital imaging of hard tissues (Misch et al.,
2006), it is a possibility to integrate bone and soft tissue morphologies with the pre-treatment
model. With such information, the root anatomy and bone-soft tissue relationship can be
clearly visualized (Pinsky et al., 2006). Subsequently, in addition to tooth contour
modifications, the bone and the soft tissues can be altered by the digital wax-up. The obtained
information could further increase the accuracy of the computer-guided surgery.
In the future, in addition to the accuracy and transferability of the digital wax-up, the occlusion
contacts and the contour modifications should be quantified. In addition, the implications on
the dental aesthetics should be evaluated. Although there are some good indications that
digital prosthodontic planning is a valid procedure, prior to its routine application, this
approach should be refined. The applicability and efficiency of this approach can further
improve through the automation of the tooth modification process.
7.6. Conclusions
Within the limitations of this study, the following can be concluded that the digital
prosthodontic planning in the form of digital wax-up appears to be a promising treatment
planning tool in fixed prosthodontics. The outcome of the digital wax-up is comparable to the
outcome of the conventional wax-up in terms of accuracy and transferability.

132
Chapter Eight
8. Influence of Conventional and Digital Wax-Ups
on Axial Tooth Contour
This chapter was published in the following article:
Abduo J, Bennamoun M, Tennant M. Influence of conventional and digital wax-ups on axial
tooth contour. International Journal of Periodontics and Restorative Dentistry. 2015; 35:e50-
e59. (Appendix I)
133
8.1. Abstract
Objective: The aim of this study was to evaluate the impact of conventional and digital
diagnostic wax-up on the axial tooth contour.
Materials and Methods: Dental models of fifteen patients were collected. Each model
received conventional wax-up and digital wax-up. The conventional wax-up was based on
tooth modification with dental wax on actual models. The digital wax-up involved fitting an
average tooth form on virtual pre-treatment models. Each wax-up model was digitally
superimposed on the corresponding pre-treatment model. For each modified tooth, analysis
planes were extracted at three locations: mesial line angle, mid-tooth and distal line angle. The
impacts of the following variables were evaluated: inter-arch location (maxilla vs. mandible),
intra-arch location (anterior vs. posterior), tooth category (incisors, canines, premolars and
molars) and tooth location (mid-tooth vs. line angle).
Results: The axial contour of the modified teeth increased following each wax-up, and this
increase was directly proportional to the distance from the gingival margin. There is a clear
tendency for the digital wax-up to cause a greater contour increase than the conventional wax-
up. The anterior teeth were associated with a greater tooth contour increase than posterior
teeth and the contour of the molars was the least affected.
Conclusion: Although the conventional wax-up contour alteration was significantly less than
for the digital wax-up, the actual difference is minimal.
Key words: prosthodontics, planning, wax-up, profile, micro-CT

134
8.2. Introduction
Fixed prosthodontic treatment is useful in improving tooth colour and morphology. However, a
significant drawback of the treatment is the necessity of irreversible tooth preparation. Ideally,
the prosthodontic treatment benefits should outweigh the disadvantages. One of the tools
used to evaluate the usefulness of fixed prosthodontic treatment is the diagnostic wax-up
(Magne and Belser, 2004), which aims to simulate the possible prosthodontic treatment on
dental models. Consequently, the modified models can be demonstrated to the patient for
prior approval. This tool is highly recommended in this age, where the population is very
aesthetically conscious (Gurel, 2007). In addition, the diagnostic wax-up facilitates the
“outcome-based treatment,” which implies the amount of tooth preparation is dictated by the
final outcome rather than the existing tooth morphology. Traditionally, the diagnostic wax-up
is executed on pre-treatment models and involves tooth modification and addition of wax until
the correct tooth shape is obtained.
It has been recommended that whenever a tooth is restored, the restoration should blend,
harmoniously with the existing tooth contour (Becker and Kaldahl, 1981; Croll, 1989), in a way
that the restoration cleanliness, durability and aesthetics are achieved (Goodacre et al.,
2003b). Three concepts of restoring the axial tooth contour were discussed in the literature:
preserving the original tooth contour, under-contouring and over-contouring. The rationale
behind maintaining the original contour is that the existing contour tends to be more
physiological and less likely to interfere with regular cleaning (Becker and Kaldahl, 1981; Croll,
1989). However, maintaining the original contour means the final shape modifications will be
subtle. Some authors described the merit of under-contouring which might render gingival
tissues more self-cleansible and maintainable (Perel, 1971; Tjan et al., 1980). However, this
approach is impractical as it could dramatically affect the appearance, crown thickness and
preparation invasiveness (Tjan et al., 1980). Over-contouring can occur if the final restoration
volume is greater than the initial tooth volume (Magne and Belser, 2004; Gurel, 2007). It has
the advantage of allowing for significant crown aesthetic improvement, especially if major
dentition irregularities existed (Cohen, 1995). Therefore, since diagnostic wax-up is
implemented prior to complex treatment, it could be associated with over-contouring the
prostheses. However, we do not yet have data about the impact of diagnostic wax-up on axial
tooth contour.
Recently, digital dentistry is growing in prosthodontics and has been utilized to execute a
diagnostic wax-up (Abduo, 2012). The procedure involves scanning, virtual modelling and
CAM. When compared to conventional wax up, the digital wax-up is an attractive option as it

135
can be reversible, time-efficient, and cost-effective. This study aims to evaluate and compare
the impact of conventional and digital wax-ups on axial tooth contour. The null hypotheses are
that the wax-ups will increase the tooth contour, and the digital wax-up alterations will be
similar to the conventional wax-up alterations.
8.3. Materials and Methods
A human research ethics approval was obtained from the Human Research Ethics Committee
of The University of Western Australia (RA/44/1/5079). Models of 15 patients receiving fixed
prosthodontic treatment were collected. For all the patients, diagnostic wax-up was indicated.
From all the models, a total of 238 teeth required fixed prostheses. For all the patients,
diagnostic wax-up prior to the prosthetic treatment was performed. The treatments were
provided at the Oral Health Centre of Western Australia.
An impression of each arch was taken by irreversible hydrocolloid impression material
(Alginate, GC America, IL, USA). Whenever indicated, an occlusal relation record was taken by
polyvinyl siloxane registration material (GC Exabite, GC America, IL, USA). The impressions
were poured by dental stone (Buff Stone, Adelaide Moulding & Casting Supplies, South
Australia, Australia). These models comprised the pre-treatment dental situation. All the
models were duplicated twice by reversible hydrocolloid material (Magafeel, MKM System,
Haanova, Slovakia). One set of models were treated by conventional wax-up and the other by
digital wax-up.
8.3.1. Conventional wax-up
The actual models of each patient were articulated on a semi-adjustable articulator (Whip Mix,
Louiseville, KY, USA) using the intra-oral occlusal record. Average values were used for the
articulator setting. The conventional wax-up was completed by the additive waxing technique,
where the wax was applied to modify tooth morphology. In some situations, the external
surfaces of the teeth were trimmed. The wax-up aimed to replace the missing tooth structures,
establish natural tooth morphology, achieve symmetry between the two sides, and obtain
even bilateral occlusal contacts and a physiological lateral occlusal scheme (canine-guided or
group function occlusions) (Figure 8-1). All the conventional wax-ups were completed by an
experienced dental technician.

136
A B B
Figure 8-1 Conventional wax-up procedure: (A) Pre-treatment models. (B) Conventional wax-up models. (C) Scanned conventional wax-up models.
The conventional wax-up models were scanned by a micro-CT scanner (SkyScan, Bruker micro-
CT, Kontich, Belgium). Virtual 3D Stereolithography (STL) images of the maxillary and
mandibular models were constructed from the Digital Imaging and Communication Medicine
(DICOM) images with the aid of a DICOM viewing program (CTvox, Bruker micro-CT, Kontich,
Belgium). The STL image of the conventional wax-up was used for the subsequent analysis.
8.3.2. Digital wax-up
The maxillary and mandibular pre-treatment models were scanned by the micro-CT scanner
and STL images were constructed. A 3D rendering software package (Geomagic Studio,
Raindrop Geomagic Inc., Research Triangle Park, NC, USA) was used to complete the digital
wax-up. The maxillary and mandibular models were virtually articulated by using the point-to-
point alignment feature of Geomagic Studio. To obtain aesthetic tooth morphology,
physiological teeth moulds (Phonares Teeth, Ivoclar Vivadent AG, Schaan, Liechtenstein) were
scanned by the micro-CT scanner. As mentioned by earlier investigation (Abduo, 2012), each
virtual tooth was fitted manually on the model with the aim of obtaining ideal teeth
arrangement, emergence profile, symmetry and aesthetics. Since the gingival-tooth junction
demarcates the most apical extension of tooth modification, it was marked on the virtual pre-
treatment models. The virtual tooth alignment involved size alteration, rotation and
translation. This was followed by ensuring that ideal occlusal contacts existed. For each case, a
similar occlusion scheme was established to mimic what would have been implemented in the
conventional wax-up (Figure 8-2). After the completion of the wax-up, the scanned model and
the virtual teeth were merged to formulate a single model, which improves the computation
speed of the subsequent analysis.

137
A B C
Figure 8-2 Digital wax-up procedure: (A) Scanned pre-treatment models. (B) Scanned physiological teeth. (C) Digital wax-up models.
8.3.3. Analysis
For the direct comparison between the pre-treatment and the wax-ups models, all the models
were remeshed with a density of 0.1 mm. All the measurements were completed digitally. In
order to quantify the tooth contour alteration, each wax-up model was overlapped on the
corresponding pre-treatment model. The overlapping of models involved the automatic
alignment of two 3D images to ensure exact 3D orientation (Bell et al., 2003; Abduo and
Bennamoun, 2013). The overlapping process was performed by a 3D rendering software
package (Geomagic Studio, Raindrop Geomagic Inc., Research Triangle Park, NC, USA) through
two sequential steps: (1) point-to-point registration, and (2) global registration. The point-to-
point registration determines the initial approximate orientation of the pre-treatment and the
wax-up model images by manually locating at least three common landmarks. The points were
selected on unaltered portions of the models. The global registration is based on the Iterative
Closest Point algorithm (Bell et al., 2003), and it aims to align the meshes according to the
best-fit principle.
Following the image overlapping, on each crowned tooth, three virtual planes were located on
the labial aspect: (1) mid-tooth, (2) mesial line angle, and (3) distal line angle (Figure 8-3A).
Only the labial surfaces were evaluated as they are the most influenced surfaces by the
prosthodontic treatment. In addition, the lingual surface of many crowns was located
supragingivally which does not critically alter the tooth contour. The discrepancy between the
models was measured in the most apical 3 mm of the clinical crown. This dimension was
selected as it tends to exhibit the greatest convexity on the labial surfaces (Becker and Kaldahl,
1981; Croll, 1989). Five levels were selected in relation to the gingival margin: 0.0, 0.5, 1.0, 2.0,
and 3.0 mm, where 0.0 mm level is the gingival margin (Figure 8-3B and 3C). For each location,
a digital point was located on the pre-treatment model and the corresponding location of the
wax-up model. Subsequently, the distance between the points was measured. A minimal
magnitude indicates a close match between the models, while a great magnitude indicates

138
significant surface alteration following the wax-up modifications. Positive values indicate that
the wax-up modification increased the tooth contour while negative values indicate that the
wax-up modification reduced the tooth contour.
A B C
Figure 8-3 (A) An image illustrating the extracted three labial planes. (B) A magnified image outlining the five vertical measurements on each plane. (C) A cross sectional view of an extracted plane on the pre-treatment model (black line) and the corresponding plane on the post-treatment model (red line).
8.3.4. Statistical analysis
At each level, the average contour alteration and standard deviation was calculated. The
effects of the following dentition variables on tooth contour were evaluated: inter-arch effect
(maxillary vs. mandibular arches), intra-arch location (anterior vs. posterior location), tooth
category (incisors, canines, premolars and molars) and tooth surface location (mid-tooth vs.
line angle). To evaluate the presence of a significant difference, a series of t-tests were
conducted (P value = .01). The difference between the different vertical locations was
evaluated by the one-way ANOVA test. In addition, the contour alterations for each tooth
category were plotted in bar diagrams.
8.4. Results
Following each wax-up, the modified models showed wider labial tooth contours compared
with the pre-treatment models. A consistent pattern was observed for all the wax-ups where
the contour increase was directly proportional to the distance from the gingival margin. For
every wax-up, the difference between all the levels was statistically significant. For the
conventional wax-up, at 0.0, 0.5, 1.0, 2.0 and 3.0 mm levels, the mean values (standard
deviation) were 0.05 mm (0.14), 0.14 mm (0.24), 0.20 mm (0.29), 0.30 mm (0.36) and 0.37 mm
(0.43) respectively. The values for the digital wax-up were 0.08 mm (0.14), 0.18 mm (0.40),
0.25 mm (0.27), 0.33 mm (0.33), and 0.39 mm (0.41) from the gingival margin. The digital wax-
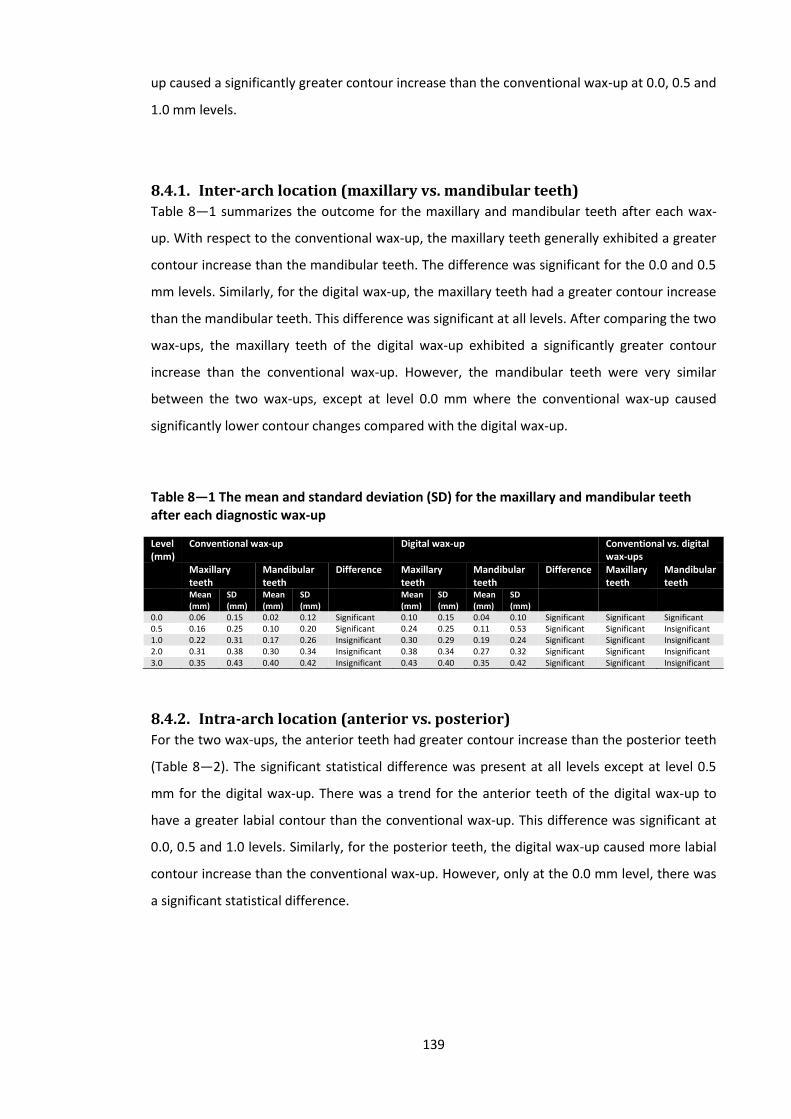
139
up caused a significantly greater contour increase than the conventional wax-up at 0.0, 0.5 and
1.0 mm levels.
8.4.1. Inter-arch location (maxillary vs. mandibular teeth)
Table 8—1 summarizes the outcome for the maxillary and mandibular teeth after each wax-
up. With respect to the conventional wax-up, the maxillary teeth generally exhibited a greater
contour increase than the mandibular teeth. The difference was significant for the 0.0 and 0.5
mm levels. Similarly, for the digital wax-up, the maxillary teeth had a greater contour increase
than the mandibular teeth. This difference was significant at all levels. After comparing the two
wax-ups, the maxillary teeth of the digital wax-up exhibited a significantly greater contour
increase than the conventional wax-up. However, the mandibular teeth were very similar
between the two wax-ups, except at level 0.0 mm where the conventional wax-up caused
significantly lower contour changes compared with the digital wax-up.
Table 8—1 The mean and standard deviation (SD) for the maxillary and mandibular teeth after each diagnostic wax-up
Level (mm)
Conventional wax-up Digital wax-up Conventional vs. digital wax-ups
Maxillary teeth
Mandibular teeth
Difference Maxillary teeth
Mandibular teeth
Difference Maxillary teeth
Mandibular teeth
Mean (mm)
SD (mm)
Mean (mm)
SD (mm)
Mean (mm)
SD (mm)
Mean (mm)
SD (mm)
0.0 0.06 0.15 0.02 0.12 Significant 0.10 0.15 0.04 0.10 Significant Significant Significant 0.5 0.16 0.25 0.10 0.20 Significant 0.24 0.25 0.11 0.53 Significant Significant Insignificant 1.0 0.22 0.31 0.17 0.26 Insignificant 0.30 0.29 0.19 0.24 Significant Significant Insignificant 2.0 0.31 0.38 0.30 0.34 Insignificant 0.38 0.34 0.27 0.32 Significant Significant Insignificant 3.0 0.35 0.43 0.40 0.42 Insignificant 0.43 0.40 0.35 0.42 Significant Significant Insignificant
8.4.2. Intra-arch location (anterior vs. posterior)
For the two wax-ups, the anterior teeth had greater contour increase than the posterior teeth
(Table 8—2). The significant statistical difference was present at all levels except at level 0.5
mm for the digital wax-up. There was a trend for the anterior teeth of the digital wax-up to
have a greater labial contour than the conventional wax-up. This difference was significant at
0.0, 0.5 and 1.0 levels. Similarly, for the posterior teeth, the digital wax-up caused more labial
contour increase than the conventional wax-up. However, only at the 0.0 mm level, there was
a significant statistical difference.
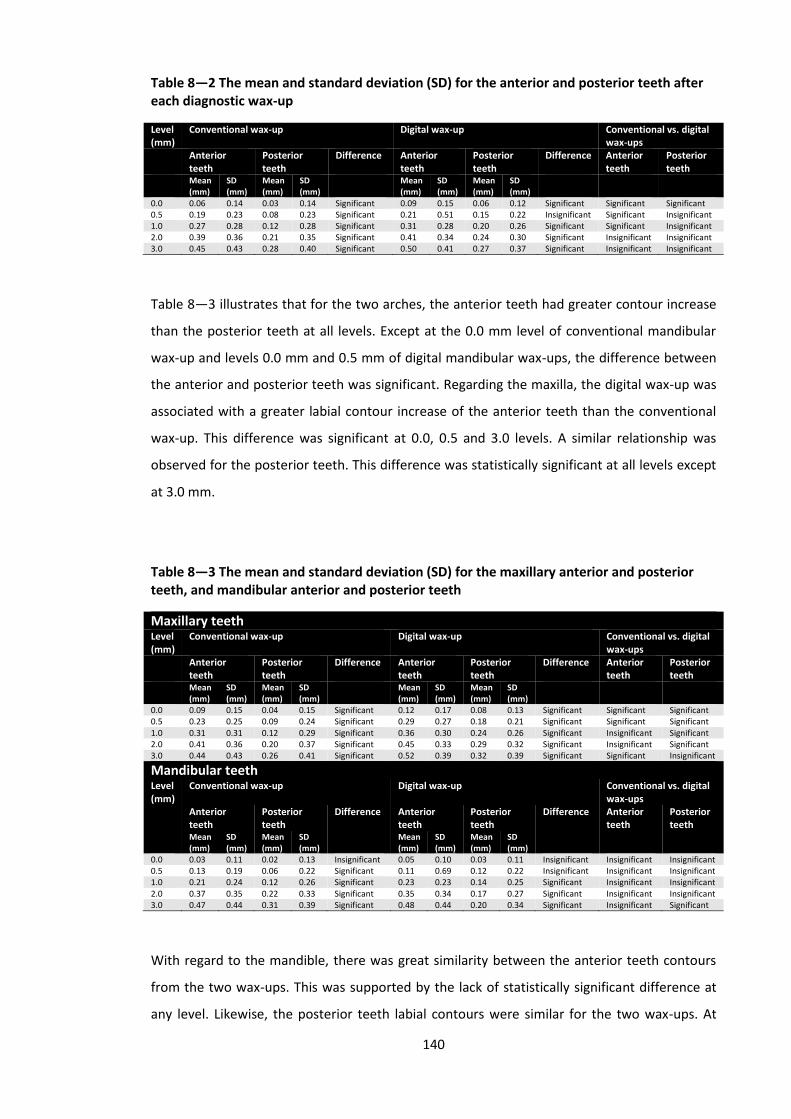
140
Table 8—2 The mean and standard deviation (SD) for the anterior and posterior teeth after each diagnostic wax-up
Level (mm)
Conventional wax-up Digital wax-up Conventional vs. digital wax-ups
Anterior teeth
Posterior teeth
Difference Anterior teeth
Posterior teeth
Difference Anterior teeth
Posterior teeth
Mean (mm)
SD (mm)
Mean (mm)
SD (mm)
Mean (mm)
SD (mm)
Mean (mm)
SD (mm)
0.0 0.06 0.14 0.03 0.14 Significant 0.09 0.15 0.06 0.12 Significant Significant Significant 0.5 0.19 0.23 0.08 0.23 Significant 0.21 0.51 0.15 0.22 Insignificant Significant Insignificant 1.0 0.27 0.28 0.12 0.28 Significant 0.31 0.28 0.20 0.26 Significant Significant Insignificant 2.0 0.39 0.36 0.21 0.35 Significant 0.41 0.34 0.24 0.30 Significant Insignificant Insignificant 3.0 0.45 0.43 0.28 0.40 Significant 0.50 0.41 0.27 0.37 Significant Insignificant Insignificant
Table 8—3 illustrates that for the two arches, the anterior teeth had greater contour increase
than the posterior teeth at all levels. Except at the 0.0 mm level of conventional mandibular
wax-up and levels 0.0 mm and 0.5 mm of digital mandibular wax-ups, the difference between
the anterior and posterior teeth was significant. Regarding the maxilla, the digital wax-up was
associated with a greater labial contour increase of the anterior teeth than the conventional
wax-up. This difference was significant at 0.0, 0.5 and 3.0 levels. A similar relationship was
observed for the posterior teeth. This difference was statistically significant at all levels except
at 3.0 mm.
Table 8—3 The mean and standard deviation (SD) for the maxillary anterior and posterior teeth, and mandibular anterior and posterior teeth
Maxillary teeth Level (mm)
Conventional wax-up Digital wax-up Conventional vs. digital wax-ups
Anterior teeth
Posterior teeth
Difference Anterior teeth
Posterior teeth
Difference Anterior teeth
Posterior teeth
Mean (mm)
SD (mm)
Mean (mm)
SD (mm)
Mean (mm)
SD (mm)
Mean (mm)
SD (mm)
0.0 0.09 0.15 0.04 0.15 Significant 0.12 0.17 0.08 0.13 Significant Significant Significant 0.5 0.23 0.25 0.09 0.24 Significant 0.29 0.27 0.18 0.21 Significant Significant Significant 1.0 0.31 0.31 0.12 0.29 Significant 0.36 0.30 0.24 0.26 Significant Insignificant Significant 2.0 0.41 0.36 0.20 0.37 Significant 0.45 0.33 0.29 0.32 Significant Insignificant Significant 3.0 0.44 0.43 0.26 0.41 Significant 0.52 0.39 0.32 0.39 Significant Significant Insignificant
Mandibular teeth Level (mm)
Conventional wax-up Digital wax-up Conventional vs. digital wax-ups
Anterior teeth
Posterior teeth
Difference Anterior teeth
Posterior teeth
Difference Anterior teeth
Posterior teeth
Mean (mm)
SD (mm)
Mean (mm)
SD (mm)
Mean (mm)
SD (mm)
Mean (mm)
SD (mm)
0.0 0.03 0.11 0.02 0.13 Insignificant 0.05 0.10 0.03 0.11 Insignificant Insignificant Insignificant 0.5 0.13 0.19 0.06 0.22 Significant 0.11 0.69 0.12 0.22 Insignificant Insignificant Insignificant 1.0 0.21 0.24 0.12 0.26 Significant 0.23 0.23 0.14 0.25 Significant Insignificant Insignificant 2.0 0.37 0.35 0.22 0.33 Significant 0.35 0.34 0.17 0.27 Significant Insignificant Insignificant 3.0 0.47 0.44 0.31 0.39 Significant 0.48 0.44 0.20 0.34 Significant Insignificant Significant
With regard to the mandible, there was great similarity between the anterior teeth contours
from the two wax-ups. This was supported by the lack of statistically significant difference at
any level. Likewise, the posterior teeth labial contours were similar for the two wax-ups. At

141
level 3.0 mm, the conventional wax-up caused a significantly greater labial contour increase
than the digital wax-up.
8.4.3. Tooth location (mid-tooth vs. line angle)
Figure 8-4 illustrates the contour alterations for each tooth category for the mid-tooth and line
angle locations. Regardless of the arch and the tooth category, the graphs showed consistent
pattern of contour increase with the increasing level of measurement. Further, the two wax-
ups showed similar pattern of contour alterations for all the teeth.
A
-0.4
-0.2
0
0.2
0.4
0.6
0.8
1
1.2
C D C D C D C D
Incisors Canines Premolars Molars
Axi
al C
on
tou
r A
lte
rati
on
Tooth Category
0
0.5
1
2
3

142
B
C
-0.4
-0.2
0
0.2
0.4
0.6
0.8
1
1.2
C D C D C D C D
Incisors Canines Premolars Molars
Axi
al C
on
tou
r A
lte
rati
on
Tooth Category
0
0.5
1
2
3
-0.4
-0.2
0
0.2
0.4
0.6
0.8
1
1.2
C D C D C D C D
Incisors Canines Premolars Molars
Axi
al C
on
tou
r A
lte
rati
on
Tooth Category
0
0.5
1
2
3
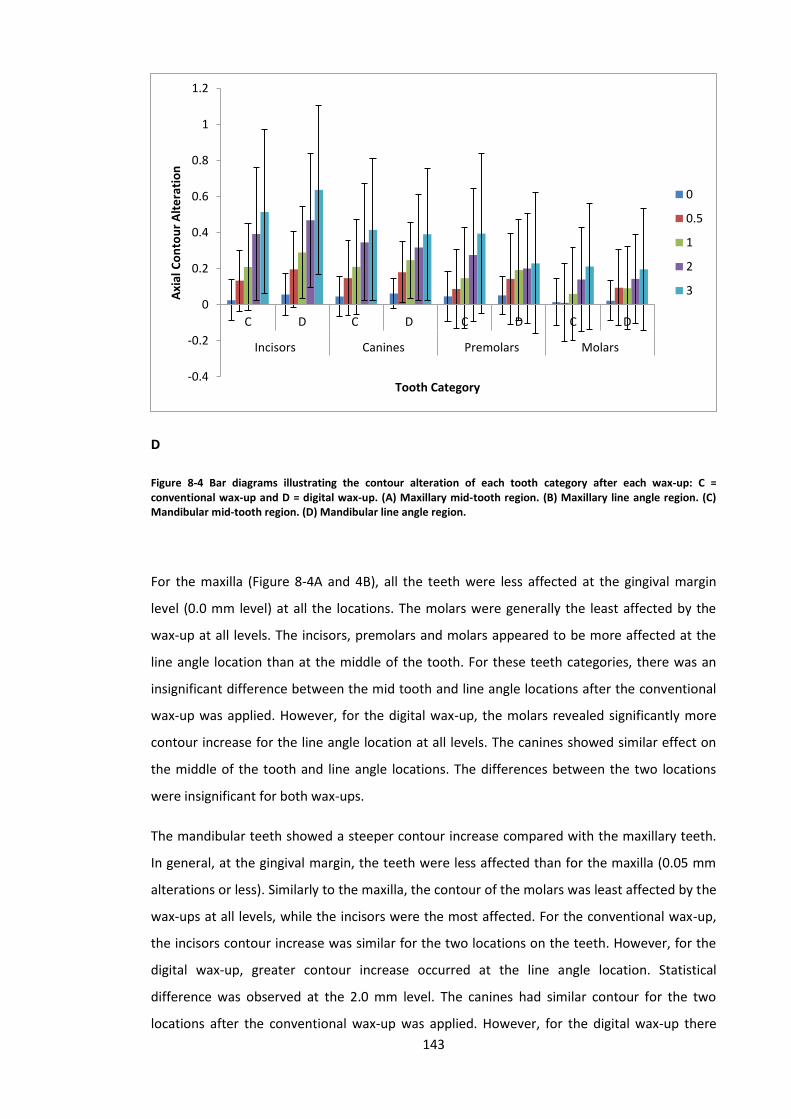
143
D
Figure 8-4 Bar diagrams illustrating the contour alteration of each tooth category after each wax-up: C = conventional wax-up and D = digital wax-up. (A) Maxillary mid-tooth region. (B) Maxillary line angle region. (C) Mandibular mid-tooth region. (D) Mandibular line angle region.
For the maxilla (Figure 8-4A and 4B), all the teeth were less affected at the gingival margin
level (0.0 mm level) at all the locations. The molars were generally the least affected by the
wax-up at all levels. The incisors, premolars and molars appeared to be more affected at the
line angle location than at the middle of the tooth. For these teeth categories, there was an
insignificant difference between the mid tooth and line angle locations after the conventional
wax-up was applied. However, for the digital wax-up, the molars revealed significantly more
contour increase for the line angle location at all levels. The canines showed similar effect on
the middle of the tooth and line angle locations. The differences between the two locations
were insignificant for both wax-ups.
The mandibular teeth showed a steeper contour increase compared with the maxillary teeth.
In general, at the gingival margin, the teeth were less affected than for the maxilla (0.05 mm
alterations or less). Similarly to the maxilla, the contour of the molars was least affected by the
wax-ups at all levels, while the incisors were the most affected. For the conventional wax-up,
the incisors contour increase was similar for the two locations on the teeth. However, for the
digital wax-up, greater contour increase occurred at the line angle location. Statistical
difference was observed at the 2.0 mm level. The canines had similar contour for the two
locations after the conventional wax-up was applied. However, for the digital wax-up there
-0.4
-0.2
0
0.2
0.4
0.6
0.8
1
1.2
C D C D C D C D
Incisors Canines Premolars Molars
Axi
al C
on
tou
r A
lte
rati
on
Tooth Category
0
0.5
1
2
3
144
was a clear increase for the line angle labial contour. Statistically, the significant difference was
at level 1.0 mm. The premolars had similar contours at the two locations for the two wax-ups.
However, there was a steeper increase of the contour for the conventional wax-up. The molars
of the conventional wax-up exhibited a similar contour alteration at the two tooth locations.
For the digital wax-up, the contour is larger at the line angle than at the middle of the tooth.
However, this difference was insignificant.
8.5. Discussion
This study suggests that regardless of the wax-up method applied, there is a tendency for the
axial tooth contour to increase. This increase appears to be directly proportional to the
distance from the gingival margin. Therefore, the hypothesis that wax-ups increase the axial
contour is accepted. A similar outcome was observed by studies evaluating the effect of fixed
prosthesis on tooth contour (Meijering et al., 1998; Vasconcelos et al., 2009). Meigering et al.
found that veneering discoloured teeth increased the labial contour and resulted in over-
contoured restorations (Meijering et al., 1998). Likewise, Vasconcelos et al. concluded that all
the veneered teeth exhibited an increase of the labial contour. In support to the current study,
they found the increase of the contour was directly related to the distance from the gingival
margin (Vasconcelos et al., 2009). Practically, the increase of labial contour could be
intentional as it will allow tooth shape improvement and will increase the restorative material
thickness for aesthetics and durability (Goodacre et al., 2001).
Overall, there is similarity between the two wax-ups; however, the clear finding was that the
digital wax-up was associated with greater contour increase, even at the gingival margin. Thus,
the hypothesis that there is no difference between the two wax-ups is rejected. The tendency
for the digital wax-up to cause greater labial contour could be due to the difficulty in locating
the gingival margin digitally on the scanned pre-treatment model. Locating the restoration
margin on virtual mesh was reported to invariably lead to a slight deviation from the exact
gingival margin (Abduo et al., 2010). Some investigators reported that a possible consequence
of this limitation is the marginal discrepancy of the digitally produced crowns in comparison to
the conventionally produced crowns (Tan et al., 2008; Han et al., 2011). On the contrary, the
conventional wax-up is based on actual and tactile feeling of the gingival margin which could
lead to a more accurate outcome. However, although for some regions the difference between
the two wax-ups is statistically significant, the actual difference is minimal and might not be of
clinical significance. On the other hand, for the digital wax-up to be applicable, it should be
transferrable to the clinic. This can be accomplished by 3D printing or milling of a physical
145
digital wax-up or production of provisional restorations (Kasparova et al., 2013). Due to the
additional processing steps, it is likely that the actual accumulated discrepancies will be greater
to what has been reported in this study. For example, dimensional distortion of 3D printed
objects could be well above 100 µm (Inokoshi et al., 2012). The impact of the total
discrepancies should be evaluated in an additional study.
In general, increasing tooth contour was discouraged by several literatures as it can impact
home care and self-cleansing abilities, which will eventually induce gingival inflammation,
periodontal complications and dental caries (Sackett and Gildenhuys, 1976; Sorensen, 1989;
Broadbent et al., 2006). According to Burch et al, the maximal convexity should exist on the
gingival third of the anatomical crown of the restored tooth and, preferably, should not exceed
0.5 mm (Burch and Miller, 1973). In an attempt to evaluate the effect of increasing tooth
contour, Perel augmented the labial contour of dogs’ teeth. The teeth with the over-contoured
restorations suffered from gingival inflammation (Perel, 1971). On the contrary, more recent
animal studies indicated that so long as professional oral hygiene is regularly maintained, the
periodontal health is likely to be preserved, even with over-contoured crowns (Kohal et al.,
2003; Kohal et al., 2004). Ehlrich and Hochman conducted a split-mouth study on four
participants. On one side of the mouth, the crowns were over-contoured by 1 mm and on the
side the crowns were under-contoured by 1 mm. After 4 months, there was no significant
difference in periodontal status between the two sides (Ehrlich and Hochman, 1980). Similarly,
on 6 patients, Sundh and Kohler evaluated three experimental crowns with different contours.
They found that after one week of regular oral hygiene practice, none of the crowns were
associated with increased plaque deposition (Sindel et al., 1999). Therefore, it could be
speculated that as long as adequate oral hygiene is maintainable, reasonable over-contouring
of up to 1 mm is not necessarily associated with periodontal complications. Since the maximal
contour recorded in this study, by the two wax-ups was less than 1 mm the modified tooth
contours are less likely to induce pathological consequences. Further, for the two wax-ups, the
linear increase of the modified teeth coronally means that the contour increase is likely to
blend smoothly with the unaltered tooth surface. This is further supported by the
measurements at the gingival margin being the least (less than 0.2 mm). Therefore, potential
implications on oral health from the two wax-ups are very unlikely.
An interesting observation in this study was the digital wax-up showing greater differences
between the mid-tooth and the proximal locations compared with conventional wax-up. This
indicates that the conventional wax-up is more consistent in providing a similar outcome
around the teeth than the digital wax-up. The most likely explanation of this observation is the
placement of a tooth with average morphology on the pre-treatment model. Thus, it is more

146
likely for the digitally modified teeth to exhibit exaggerated anatomical features (line angles,
cusp tips and marginal ridges) (Paulus et al., 1999; Mehl et al., 2005a). However, the advantage
of the high anatomical definition is the digital wax-up might be perceived as more natural and
aesthetic. Although the accuracy of the digital wax-up is slightly less than for the conventional
wax-up, for a purely diagnostic purpose, it can still be viable tool to plan for the definitive
prostheses.
Regardless of the wax-up, the maxillary teeth tend to have greater contour increase than
mandibular teeth. Likewise, the anterior teeth were more prominently affected by the wax-ups
than the posterior teeth. This could be related to the need to improve tooth aesthetics by
increasing the labial contour, (Magne and Belser, 2004) which has been perceived to be more
aesthetic by patients (Ehrlich and Hochman, 1980). From the conservative perspective, the
anterior teeth might benefit from being over-contoured which would mean less tooth
reduction is needed. Overall, there is a clinical preference to minimize the amount of tooth
reduction which could reduce the pulpal complications (Goodacre et al., 2001). Reports
pertaining to aesthetic dentistry recommended preparing the tooth according to the final
crown volume as determined by diagnostic wax-up rather than the existing tooth contour
(Magne and Belser, 2004; Gurel, 2007). One of the advantages of this approach is ensuring a
conservative tooth preparation. Further, since the anterior teeth have the advantage of being
accessible for cleaning, it is less likely for the oral health to be affected by over-contouring. On
the other hand, the posterior teeth will be advantaged by having less contour increase. This
will ensure the ease of cleanliness for less accessible areas (Becker and Kaldahl, 1981). In
addition, it is less likely for the appearance of posterior teeth to benefit from over-contouring
as they are not in the aesthetic zone.
8.6. Conclusions
Within the limitations of this study, it appears that there is an overall similarity in the pattern
of tooth modifications between the two wax-ups. The conventional wax-up was associated
with a significantly less increase of axial tooth contour than the diagnostic wax-up. However,
the actual difference was minimal. As the wax-ups are used purely for diagnostic purposes, this
difference appears to be of minimal clinical significance. The axial contour of all the modified
teeth with diagnostic wax-ups was increased. This increase was clearly proportional to the
distance from the gingival margin. The anterior teeth were much more affected by the
increase of the contour than the posterior teeth.

147
Chapter Nine
9. Effect of Prosthodontic Planning on Intercuspal
Occlusal Contacts: Comparison of Digital and
Conventional Planning
This chapter was published in the following article:
Abduo J, Bennamoun M, Tennant M, McGeachie J. Effect of prosthodontic planning on
intercuspal occlusal contacts: comparison of digital and conventional planning. Computers in
Biology and Medicine. 2015; 60:143-150. (Appendix J)

148
9.1. Abstract
Objective: Adequate occlusal contacts are critical for masticatory function. The aim of this
study is to evaluate the intercuspal occlusal contacts following conventional and digital wax-
ups.
Materials and Methods: Stone casts of fifteen patients undergoing prosthodontic treatment
were gathered. Each cast was duplicated twice, so that conventional and digital wax-ups could
be performed. To assess the occlusion, the following variables were evaluated: contact
number per tooth (CNT), contact area per tooth (CAT) and contact accuracy. Further, the
impact of tooth location in the arch was assessed.
Results: The CNT and CAT after the wax-ups increased significantly following each wax-up, and
this increase was more prominent for the posterior teeth than the anterior teeth. The
conventional wax-up was associated with lower CNT than the digital wax-up, especially for the
posterior teeth. On the other hand, the CAT was greater for the conventional wax-up than the
digital wax-up for the anterior and posterior teeth. In terms of accuracy, the two wax-ups
showed greater discrepancies than the pre-treatment casts, however, the magnitude of
discrepancy was greater for the digital wax-up.
Conclusions: The two wax-ups improved the contact number and area. Despite the statistical
variation between the wax-ups, the actual difference was minimal. Therefore, it could be
speculated that the two wax-ups produced a similar outcome.
Key words: digital dentistry, wax-up, contact number, contact area, articulation

149
9.2. Introduction
In many instances, diagnostic wax-up is advocated to determine the viability of any proposed
prosthodontic treatment (Magne and Belser, 2004; Ahmad, 2010). The wax-up is a useful tool
for selecting the ideal treatment, enhancing communication with the patient and for
provisional restoration construction. Subsequently, a good wax-up will dictate the final
prosthesis fabrication (Magne and Belser, 2004). Any diagnostic wax-up should be accurate,
aesthetic and feasible. Traditionally, the tooth surface is designed with conventional wax-up
technique as part of prosthodontic planning. The tooth contour and occlusion are modified by
the addition of wax on the external tooth surface (Ahmad, 2010). Recently, virtual designing of
the tooth surface with digital techniques was proposed as an alternative method for
prosthodontic planning (Abduo, 2012). It entails altering the tooth contour of a virtual stone
cast. To facilitate the contour alterations, several authors had proposed applicable approaches
and algorithms (Paulus et al., 1999; Mehl et al., 2005a; b; Ender et al., 2011). To ensure the
usability of the digital wax-up, the alteration process is followed by production of a physical
cast by subtractive of additive CAM (Abduo et al., 2014b). Alternatively, provisional
restorations can be produced according to the digital wax-up (Lin et al., 2013).
The digital wax-up has the advantages of not permanently altering the stone cast, quantifying
the dental modifications, simplicity of execution, and the possibility of trying different
treatments. Further, as the digital wax-up is performed using specialised software, more
clinicians can provide a wax-up, even without artistic technical abilities. However, the digital
wax-up should at least exhibit a similar accuracy to conventional wax-up.
Regardless of the type of diagnostic wax-up, the static and dynamic occlusal contacts should
be of adequate quality and accuracy. The occlusal contacts will eventually contribute to the
functional benefit and comfort of the prosthesis (Owens et al., 2002; Koyano et al., 2012).
Experimentally, the quality of the occlusal contacts can be determined by the number of
contacts, the area of the contacts and the accuracy of the contacts. Therefore, the aim of this
study is to evaluate the effect of conventional and digital wax-ups on occlusal contacts in
terms of number, area and accuracy. The null hypotheses are that the wax-ups will alter the
occlusal contacts and that there is no difference in occlusal contacts between the conventional
and virtual techniques in designing of the occlusal surface.

150
9.3. Materials and Methods
A human research ethics approval was granted from the Human Research Ethics Committee of
The University of Western Australia (RA/44/1/5079). Stone casts of 15 patients who required
fixed prosthodontic treatment were retrieved for the study. The inclusion criterion was
necessity of diagnostic wax-up prior to prosthodontic treatment that will influence the dental
occlusion. The patients were under care at the Oral Health Centre of Western Australia.
For each arch, an irreversible hydrocolloid impression (Alginate, GC America, IL, USA) was
made. An occlusal relation record was obtained using polyvinyl siloxane registration material
(GC Exabite, GC America, IL, USA) according to the centric relation position. The impressions
were poured by type III dental stone (Buff Stone, Adelaide Moulding & Casting Supplies, South
Australia, Australia). These casts comprised the pre-treatment casts. All the casts were
duplicated twice by reversible hydrocolloid duplicating materials (Magafeel, MKM System,
Haanova, Slovakia). One cast received conventional wax-up and the other cast was used for
the digital wax-up (Figure 9-1).
9.3.1. Conventional wax-up
Semi-adjustable articulator (Whip Mix, Louiseville, KY, USA) with pre-determined values was
used in this study for the wax-up as advised by some authors (Hobo and Takayama, 1997). One
set of casts were articulated according to the maximal intercuspation position and the other
set of casts were articulated according to centric relation position with the aid of the intra-oral
record. The maximal intercuspation position was used to relate the pre-treatment casts. This
position will reflect the habitual relationship which is more relevant for function prior to the
treatment (Becker et al., 2000). On the contrary, the centric relation position was used to
relate the arches prior to the wax-ups. Therefore, after the wax-up, there will be a coincidence
between centric relation and maximal intercuspation positions (Becker et al., 2000). Following
the articulation, silicone material putty (Dental Speedex Putty, Coltene/Whaledent AG,
Altstatten, Switzerland) was applied on the buccal aspects of the posterior teeth of the
mounted casts. This silicone index was used for the digital articulation of the pre-treatment
casts.
The conventional wax-up was completed by inlay wax (VITA Zahnfabrik, Bad Sackingen,
Germany) addition on the external tooth surface. In some areas, the external tooth surface
was modified by trimming. The wax-up aimed to rectify the defective tooth structure, establish
natural and aesthetic tooth morphology, and achieve symmetry between the two sides. As the
occlusion of all the teeth were altered, the alteration mechanism involved obtaining even

151
bilateral occlusal contacts and a physiological lateral occlusal scheme (canine-guided or group
function occlusion) (Becker et al., 2000; Turp et al., 2008). All the conventional wax-ups were
completed by an experienced dental technician. On the completed wax-up casts, silicone
indices were formed on the buccal aspect of the posterior teeth.
The pre-treatment and conventional wax-up casts and the associated silicone indices were
scanned by a micro-CT scanner (SkyScan, Bruker, micro-CT, Kontich, Belgium) (12 μm
resolution, 360o scanning, 70 KV source voltage, 1.0 mm Al filtration). The reported advantage
of micro-CT scanning is the possibility of producing an accurate image that exhibits a
dimensional error of 0.1% (Waring et al., 2012). Subsequently, virtual 3D Stereolithography
(STL) images of the maxillary and mandibular casts were constructed from the Digital Imaging
and Communication Medicine (DICOM) images using a DICOM viewing program (CTvox, Bruker
microCT, Kontich, Belgium). The construction procedure was based on model surface
extraction from the stacked series of DICOM images. The virtual image of the conventional
wax-up was used for the subsequent analysis (Figure 9-1B).
The virtual silicone indices were used to articulate the pre-treatment and conventional wax-up
casts digitally, using the process of image registration as illustrated by DeLong et al. (Delong et
al., 2002). A 3D rendering software package (Geomagic Studio, Raindrop Geomagic Inc.,
Research Triangle Park, NC, USA) was used for the registration process. The purpose of the
registration process is to precisely align the models that share common surfaces. As discussed
by several authors (Bell et al., 2003), the registration process involved two sequential steps: (1)
point-to-point registration and (2) global registration. The point-to-point registration is based
on coarse registration between two similar surfaces. This step was completed manually by
selecting points on common surfaces of the virtual cast and the silicone index. As a result, the
virtual models translate spatially until they reach a reach position. In this experiment, the cusp
tips and the most cervical gingival margins were selected. After the initial superimposition of
the two meshes, an automated global registration was completed. This step aimed to
approximate the best alignment of virtual cast against the virtual silicone index according to
the Iterative Closest Point Algorithm. The registration process was executed between each
arch and the corresponding virtual silicone indices. Subsequently, the virtual silicone indices
were deleted digitally, and the two virtual casts were digitally articulated.
9.3.2. Digital wax-up
The virtual pre-treatment casts were articulated according to centric relation position. This
was achieved by superimposing the virtual pre-treatment casts on the virtually articulated

152
conventional wax-up casts. The unaltered tissues were used for the registration. A 3D
rendering software (Geomagic Studio) was used to execute the digital wax-up. Virtual
physiological tooth (Phonares Teeth, Ivoclar Vivadent AG, Schaan, Liechtenstein) moulds were
used as mentioned by earlier investigation. The virtual tooth alignment involved size
alteration, rotation and translation. Each virtual tooth was fitted manually on the virtual cast
with the aim of obtaining an ideal teeth arrangement, emergence profile, symmetry and
aesthetics. Accurate occlusal interdigitation with the antagonist teeth was planned. This was
achieved by locating the cusps within the opposing fossae. For each set of casts, a similar
occlusion scheme was established to mimic what would have been implemented in the
conventional wax-up. After the completion of the wax-up, the scanned cast and the virtual
teeth were merged to formulate a single model (Figure 9-1C), which improved the
computation speed of the subsequent analysis.
A B C
Figure 9-1 Example of the virtual pre-treatment (A), conventional wax-up (B) and digital wax-up (C) casts.
9.3.3. Analysis
To ensure uniformity of the comparison between the pre-treatment and the wax-up casts, all
the casts were remeshed with a density of 0.1 mm. The casts were imported to mesh
measurement software (Meshlab Software, Visual Computing Lab, University of Pisa, Italy) to
analyse the occlusal contacts. Only the affected teeth or pontics by the prosthodontic
treatment were considered for the analysis. This involved the restored unit and the opposing
unit.
A threshold of 200 µm was selected to visualize the contacting surfaces (Delong et al., 2002;
Iwase et al., 2011). The surfaces that are opposing within a distance of 200 µm are thought to
be critical surfaces for occlusion (Delong et al., 2002). As a function of the Meshlab software,
the opposing cast surfaces were converted to color-coded 3D models according to the
Hausdorff Distance between the two meshes. This feature was used to visualize the occlusal
relationship of the opposing occlusal surfaces according to the inter-occlusal distance, where

153
the yellow colour indicated a 200 µm distance and the red colour indicated a 0 µm distance
(Figure 9-2).
A B C
Figure 9-2 Colour-coded map illustrating the contact number and contact area for the pre-treatment (A), conventional wax-up (B) and digital wax-up (C) casts. The calculation of the CNT and CAT will compensate the increase of the number of teeth after the wax-ups.
Therefore, the number of occlusal contacts was based on the number of spots coloured with
yellow (Figure 9-3A). The contact area was quantified by measuring the area with yellow
boundaries (Figure 9-3B).
A B
Figure 9-3 Determination of the contact number and area according to the colour-coded map. The number of occlusal contacts was established by counting the areas coloured with yellow or a warmer colour. The same areas were extracted and measured to quantify the occlusal area.

154
Since only the affected teeth were considered for the analysis, the contact number per tooth
(CNT) and contact area per tooth (CAT) were measured. Therefore, these variables ensured the
comparison between pre-treatment and post-treatment casts would not be influenced by the
alteration of the occlusal unit number. The following equations were implemented:
𝐶𝑁𝑇 = 𝑇𝑜𝑡𝑎𝑙 𝑛𝑢𝑚𝑏𝑒𝑟 𝑜𝑓 𝑐𝑜𝑛𝑡𝑎𝑐𝑡𝑠
𝑛 𝐶𝐴𝑇 =
𝑇𝑜𝑡𝑎𝑙 𝑐𝑜𝑛𝑡𝑎𝑐𝑡 𝑎𝑟𝑒𝑎
𝑛
where n is the number of affected teeth.
For each detected contact, the contact accuracy was measured by the digital ruler of the
software (Figure 9-4). This was executed by measuring the distance between a point of one
mesh and the corresponding point of the opposing mesh. The purpose of measuring the
contact accuracy is to evaluate the relationship of the opposing surfaces. Ideally, the surfaces
should be contacting without overlapping. If the meshes were not contacting, the measured
discrepancy was the least perpendicular distance between the two surfaces, and the value was
labelled with a negative mark. If the meshes were overlapping, the discrepancy was
determined by the greatest perpendicular distance, and the value was labelled positive. Thus
negative values mean that the surfaces are not contacting, while the positive values indicate
contact interference.
Figure 9-4 Measurement of the occlusal discrepancies. If the contact surfaces are overlapping the (A), the maximal distance is measured which indicates a positive error (occlusal interferences). In a situation where the surfaces are not contacting (B), the minimal distance between the surfaces are measured and reflect a negative error (non-contacting surfaces).
9.3.4. Statistical analysis
For the pre-treatment, conventional and digital wax-up casts, the average CNT, CAT and
accuracy were calculated. The Mann-Whitney test was performed (P = .05) to determine the
significance of the difference between the pre-treatment casts and each wax-up cast, and
between the conventional and digital wax-ups. The anterior and posterior dental units were
separated. For all the variables, the impact of each wax-up procedure on the anterior and

155
posterior teeth was evaluated. Further, the difference between the anterior and posterior
teeth was determined.
9.4. Results
A total of 310 units were analysed for the pre-treatment casts of which 112 were anterior unit
and 198 were posterior unit. Following each wax-up procedure, a total of 464 units were
included for the analysis (144 anterior units and 320 posterior units).
9.4.1. Contact number
The CNT differed significantly between the casts. The pre-treatment casts exhibited a
significantly lower CNT (mean = 1.08, SD = 0.55) than the conventional wax-up (P = .03) and
digital wax-up (P = .00) casts. The digital wax-up casts had greater CNT (mean = 1.58, SD =
0.61) than the conventional wax-up casts (mean = 1.37, SD = 0.49), however, this difference
was insignificant (P = .07).
For all the casts, the posterior teeth had a significantly greater CNT than the anterior teeth (P =
.00) (Table 9—1). Figure 9-5 illustrates the influence of tooth location on the CNT. Overall,
there is similarity in the CNT pattern between all the casts. On the anterior teeth, the pre-
treatment casts showed similar CNT to the conventional casts (P = .36). However, the pre-
treatment casts had significantly less CNT than the digital wax-up casts (P = .03). There was no
statistical difference between the conventional and digital wax-up casts (P = .29). For the
posterior teeth, the pre-treatment casts and the two wax-ups for the posterior teeth (P = .00).
The conventional wax-up casts and digital wax-up casts had similar CNT for the posterior teeth
(P = .20).
Table 9—1 CNT mean and standard deviation (SD) for the pre-treatment, conventional wax-up and digital wax-up casts
Pre-treatment Conventional Wax-Up Digital Wax-Up Mean SD Mean SD Mean SD Anterior teeth 0.78 0.37 0.90 0.45 1.03 0.45 Posterior teeth 1.41 0.61 1.89 0.55 2.15 0.59

156
Figure 9-5 Box plot diagram of the CNT values for the anterior and posterior teeth of pre-treatment, conventional wax-up and digital wax-up casts.
9.4.2. Contact area
The pre-treatment casts had lower CAT (mean = 2.95 mm2, SD = 1.75) than conventional (mean
= 5.43 mm2, SD = 3.48) or digital wax-ups (mean = 4.26 mm2, SD = 2.86). This difference was
statistically significant between the pre-treatment and conventional wax-up casts (P = .01), but
not between the pre-treatment and digital wax-up casts (P = .07). The two wax-ups had similar
CAT (P = .11).
All the casts had a significantly greater CAT for the posterior teeth than anterior teeth (P = .00)
(Table 9—2), and exhibited generally a similar CAT pattern (Figure 9-6). For the anterior region,
there was an insignificant difference between the pre-treatment casts and the conventional
wax-up (P = .72) and the digital wax-up (P = .28) casts. The conventional wax-up casts had
similar CAT to the digital wax-up (P = .20). The posterior teeth had significantly lower CAT than
the conventional wax-up (P = .00) and digital wax-up (P = .00) casts. The two wax-ups did not
differ significantly at the posterior region (P = .18).
Table 9—2 CAT mean and standard deviation (SD) for the pre-treatment, conventional wax-up and digital wax-up casts
Pre-treatment Conventional Wax-Up Digital Wax-Up Mean
(mm2) SD (mm2) Mean
(mm2) SD (mm2) Mean
(mm2) SD (mm2)
Anterior teeth 1.90 1.42 2.67 2.70 1.51 1.31 Posterior teeth 4.00 2.33 8.75 4.87 7.12 3.47

157
Figure 9-6 Box plot diagram of the CAT values (mm2) for the anterior and posterior teeth of pre-treatment,
conventional wax-up and digital wax-up casts.
9.4.3. Contact accuracy
For the whole arch, the mean contact accuracy for pre-treatment casts, conventional wax-up
and digital wax-up casts were 0.01 mm (SD = 0.16), 0.08 mm (SD = 0.15) and 0.11 mm (0.21),
respectively. The pre-treatment casts had significantly more precise contacts than the two
wax-up casts (P = .00). Overall, the two wax-up casts had similar contact precision (P = .70).
However, the digital wax-up casts appeared to have more occlusal overlap that the
conventional wax-up casts (Figure 9-7).
The posterior teeth of the pre-treatment and conventional wax-up casts had significantly less
contact discrepancy than the anterior teeth (P = .01) (Table 9—3). On the contrary, the digital
wax-up casts had significantly more contact discrepancy for the posterior teeth than the
anterior teeth (P = .00). Anteriorly, the pre-treatment casts had significantly less discrepancies
than the conventional wax-up casts (P = .00) but insignificantly less than the digital wax-up
casts (P = .19). The anterior teeth of the conventional wax-up casts had significantly more
discrepancies than the digital wax-up casts (P = .00). For the posterior teeth, the pre-treatment
casts had significantly less discrepancies than conventional and digital wax-up casts s (P = .00),
and the digital wax-up had significantly greater discrepancies than the conventional wax-up (P
= .01).

158
Table 9—3 Contact accuracy mean and standard deviation (SD) for the pre-treatment, conventional wax-up and digital wax-up casts
Pre-treatment Conventional Wax-Up Digital Wax-Up Mean
(mm) SD (mm) Mean (mm) SD (mm) Mean
(mm) SD (mm)
Anterior teeth 0.04 0.18 0.11 0.17 0.06 0.19 Posterior teeth -0.01 0.15 0.07 0.14 0.13 0.22
Figure 9-7 Box plot diagram of the contact accuracy values (mm) for the anterior and posterior teeth of pre-treatment, conventional wax-up and digital wax-up casts.
9.5. Discussion
The outcome of this study indicates that regardless of the wax-up method employed, the
planned prosthodontic treatment positively influences the number and area of occlusal
contacts. Therefore the hypothesis that the contact quality is improved by the wax-up is
accepted. The lower occlusal contact number and area for the pre-treatment casts could be
attributed to the pre-treatment dentition’s tendency to suffer from dental problems that
influence the morphology, such as large restoration, tooth wear and chipping. Such
abnormalities can affect the quality of the occlusal contact and contact area.
As this study is early in the field, it is difficult to compare its outcome with the findings of
previous studies. Instead, the obtained outcome of this study was compared to the
observations of the studies that quantified the contact number and area of ideal young
dentitions which might constitute the benchmark (McNamara and Henry, 1974; Korioth,
1990b; Ciancaglini et al., 2002; Delong et al., 2002). The earlier studies on intercuspal occlusal

159
contacts evaluated the total contact number and areas for intact dentition of young
individuals. In this study, it was necessary to measure the contact number and area per tooth
to compensate for the effect of missing teeth. To compare the outcome of this study with
earlier studies, approximate contact number and area per tooth was calculated from the
earlier studies by dividing the reported total contact number or area on the number of teeth
per arch.
Overall, the studies on natural and intact dentition revealed that the occlusal contact number
was similar to the contacts obtained following the wax-up treatment of this study (McNamara
and Henry, 1974; Korioth, 1990b; Ciancaglini et al., 2002; Delong et al., 2002). Therefore, it
might be reasonable to assume that the planned prosthodontic treatment will restore the
occlusal anatomy to a more natural anatomy and the occlusal relationship might return to the
baseline relationship. Such an observation is attributed to the more natural dental anatomy
that can be generated following the wax-up. This is in accordance with the clinicians’
recommendations on idealising intercuspal occlusal contacts with prosthodontic treatment
(Wiskott and Belser, 1995; Koyano et al., 2012). The envisioned improvement of occlusal
contacts will potentially contribute to a more stable and functional occlusion (Owens et al.,
2002). Therefore, in addition to aesthetic improvement following the prosthodontic treatment,
the oral function is more likely to improve as well.
There was a marked variation in the reported CAT from previous studies. After manual
evaluation of the contact area, Alkan et al. found less area than what has been reported in this
study for all the casts (Alkan et al., 2006), while Hidaka et al. reported outcome was similar
only to the pre-treatment casts (Hidaka et al., 1999). Conversely, in a digital study, Iwasa et al.
recorded a relatively large CAT (about 5 mm2 per tooth) (Iwase et al., 2011) which was similar
to the wax-up casts of this study. The variation in the outcome of the studies could be related
to the method of area quantification (Owens et al., 2002). It has been acknowledged that a
slight vertical discrepancy of the maxilla-mandibular tooth relationship will cause an
exponential reduction of the recorded area (Wilding et al., 1992; Hidaka et al., 1999; Delong et
al., 2002). Several of the earlier studies have applied occlusal medium to quantify the area, in
such cases, vertical displacement of the jaw will likely have occurred, resulting in an
underestimation of the contact area. On the other hand, in this study and the study by Iwasa
et al, a threshold of 200 µm was applied (Iwase et al., 2011), which was likely to overestimate
the contact area due to the risk of the models overlapping. Nevertheless, it is clear that the
wax-up process increases the CAT, which is indicative that the planned prosthodontic
treatment will increase the contact area at the occlusal phase of chewing, hence resulting in
more efficient chewing.

160
For all the evaluated casts, the location of the tooth in the arch appeared to be a strong
determinant of the quality of the occlusal variables evaluated in this study. There was a
dominance of contact number and area on the posterior teeth (two times the anterior teeth),
which corroborates several earlier investigations (Ehrlich and Taicher, 1981; McDevitt and
Warreth, 1997). On natural young individual dentition, McNamara and Henry found 8 times
more contact on posterior teeth than anterior teeth (McNamara and Henry, 1974). Similarly,
Ciancaglini et al. found the number of contacts to be 3 times greater for posterior teeth than
anterior teeth (Ciancaglini et al., 2002). On the restored dentition, Yi and Carlsson (Yi et al.,
1996) found the posterior teeth had twice the contact number than the anterior teeth, which
was similar to the pre-treatment and post-treatment casts of this study. In relation to the
posterior teeth contact area, Yurktas and Manly found that the CAT on the posterior teeth
tended to be 6.96 mm2-per-tooth (Yurkstas and Manly, 1949), which was close to the wax-up
casts of this study. On the other hand, Owens et al. found the contact area on posterior teeth
tended to be less than the wax-up casts of this study (3.16 mm2-per-tooth), and close to the
pre-treatment casts (Owens et al., 2002). In similarity to what has been mentioned earlier, it is
likely that the participant selection and the implemented methodology influenced the area
outcome. The more profound contacts on the posterior teeth are due to greater area, cuspal
morphology and interdigitation of the opposing teeth. The anterior teeth, on the other hand,
have more confined surfaces and incisal edges. Further, this finding fits with the mutually-
protected occlusion concept, where the posterior teeth prevent excessive contact of the
anterior teeth at maximum intercuspation (The Glossary of Prosthodontic Terms, 2005).
Although this finding is correct for the pre-treatment and the wax-up casts, the difference
between the anterior and posterior teeth is greater following the prosthodontic treatment,
which indicates the idealisation of the occlusion scheme following prosthodontic planning.
Thus, it could be speculated that the posterior teeth receive greater benefit in terms of contact
number and area following the prosthodontic treatment. This is advantageous from the
functional perspective, as the posterior teeth are responsible for food chewing and grinding.
Despite the similarity between the two wax-ups, there is tendency for the digital wax-up to
exhibit greater CNT than the conventional wax-ups, while for the CAT, the conventional wax-
up was associated with greater area. Since this difference is not statistically significant, the
hypothesis that there is no difference in occlusal contacts between the two wax-ups is
accepted. The observed slight difference is most likely related to the differences between the
occlusal morphology generated by each wax-up. As the digital wax-up utilizes an average tooth
form, the final tooth morphology tends to exhibit more defined and steeper anatomical
features (Ender et al., 2011). This means greater cuspal angle, more pointy cusps and deeper

161
grooves and fossae. The more defined occlusal anatomy could explain the greater contact
number and the lower area of the posterior teeth for the digital wax-up casts that was
observed in the current study. Nevertheless, in terms of occlusal contact number and area, it is
reasonable to state that the two wax-ups generated a similar outcome and the clinical
difference is likely to be insignificant.
The occlusal accuracy after each wax-up was lower than the pre-treatment casts, and this
inaccuracy was more prominent for the digital wax-up. Although the occlusion of the
conventional wax-up casts was established on physical casts, there has been greater occlusal
inaccuracy than for pre-treatment casts. This is likely to be related to the mathematical
determination of the model surface after scanning, which is associated with inevitable
inaccuracies (Persson et al., 2006). The external surface is formed of vertices connected by
accumulating triangles of polygonal mesh. This polygonal mesh is composed of flat triangles
which approximate the curved surfaces of the dental restoration (Pfeiffer, 1999; Luthardt et
al., 2002). As the conventional wax-up casts exhibit more prominent occlusal curvature than
pre-treatment casts, they will be more prone for occlusal discrepancy. On the contrary, the
pre-treatment casts have more flat surfaces, which are easier to represent digitally. As the
digital teeth have more defined occlusal anatomy for the posterior teeth, they might be more
vulnerable to loose surface accuracy. This might explain the slightly greater discrepancy of the
digital wax-up casts than the conventional wax-up casts on the posterior teeth.
Many researchers have developed computer algorithmic systems for tooth surface design. This
includes occlusal generated path, the approximation of cavity margins, fitting normalised
intact tooth surfaces (Paulus et al., 1999), the fitting of an average tooth (Mehl et al., 2005a; b;
Ender et al., 2011), and scanning a manually waxed tooth or the mirror image of the
contralateral tooth. Regardless of the technique, virtual reconstruction generally was found to
cause up to 0.5 mm vertical discrepancies of the completed restoration and in many cases, the
operator is expected to manually adjust the occlusal contacts (Ender et al., 2011). In addition,
as the digital wax-ups are yet to be produced by CAM processes, the accumulated final
inaccuracy will be greater to what has been observed in this study. Nevertheless, since in
clinical practice the wax-ups are used primarily for provisional restorations, minor occlusal
discrepancies can be modified easily in the clinic, with no major consequences on the
definitive prostheses.

162
9.6. Conclusions
Within the limitations of this study, it could be concluded that in terms of occlusal contact
number and area, the wax-up procedures significantly improved the intercuspal occlusal
morphology. For all the evaluated casts, the posterior teeth experienced greater benefit in
occlusal contact number and area. Between the two wax-ups, there were some variations in
occlusal contact number and area; however, the obtained figures were very similar. In terms of
occlusal contacts accuracy, the digital wax-up seems to be less accurate than the conventional
wax-up on the posterior teeth. Although the implication of this inaccuracy is yet to be
determined, it is likely that continuous technological improvements will enhance the digital
wax-up outcome. Therefore, the digital wax-up appeared to be comparable to conventional
wax-up. However, the production of physical models from the digital wax-up and the clinical
implications should be subjected to additional investigations.

163
Chapter Ten
10. Effect of Prosthodontic Planning on Lateral
Occlusion Scheme: A Comparison between
Conventional and Digital Planning
This chapter was published in the following article:
Abduo J, Bennamoun M, Tennant M, McGeachie J. Effect of prosthodontic planning on lateral
occlusion scheme: a comparison between conventional and digital planning. Journal of Applied
Oral Science. 2015; 23:196-205. (Appendix K)

164
10.1. Abstract
Objective: Recently, digital wax-up is proposed as a tool to aid prosthodontic planning.
However, there is no information about the effect of prosthodontic planning on lateral
occlusion scheme. This study aims to evaluate the impact of conventional and digital
prosthodontic planning on lateral occlusion scheme.
Materials and Methods: Dental models of 10 patients were collected. All models had Angle
Class I occlusion and were undergoing prosthodontic treatment that would influence the
lateral occlusion scheme. Each set of models had received both conventional wax-up and
digital wax-up. In relation to the lateral occlusion scheme, the following variables were
evaluated: the prevalence of the different lateral occlusion scheme, number of contacting
teeth and percentage of each contacting tooth. Four excursive positions on the working side
were included: 0.5, 1.0, 2.0 and 3.0 mm from the maximal intercuspation position.
Results: The lateral occlusion scheme of the two wax-up models was subjected to alterations
following excursion. There was a tendency for the prevalence of canine-guided occlusion to
increase and the prevalence of group function occlusion to decrease with increasing the
excursion. The number of contacting teeth was decreasing with the increasing magnitude of
excursion. For the 0.5 mm and 1.0 mm positions, the two wax-ups had significantly greater
contacts than the pre-treatment models, while at the 2.0 mm and 3.0 mm positions, all the
models were similar. For all models, canines were the most commonly contacting teeth,
followed by the teeth adjacent to them. No difference was observed between the two wax-ups
in relation to the number of contacting teeth.
Conclusion: Although the prosthodontic planning had influenced the pattern of the lateral
occlusion scheme and contacts, there was no difference between the conventional and digital
prosthodontic planning.
Key words: wax-up, canine-guided occlusion, group function occlusion, dental model

165
10.2. Introduction
The ideal lateral occlusion scheme has been a topic of debate for many years. It has been
postulated that the lateral occlusion scheme impacts masticatory function, comfort and
aesthetics. Several authors discussed the rationale of each lateral occlusion scheme (Thornton,
1990; Rinchuse et al., 2007). It is common throughout prosthodontic treatment, that the
lateral occlusion scheme be altered by controlling morphologies, alignments and orientations
of teeth. The two commonly applied schemes are canine-guided occlusion and group function
occlusion. The canine-guided occlusion is a mutually-protected occlusion where the vertical
and horizontal overlap of the canine teeth causes disengagement of the posterior teeth in the
lateral movement of the mandible (The Glossary of Prosthodontic Terms, 2005). The group
function occlusion is based on multiple contacts between the maxillary and mandibular teeth
in lateral movement on the working side (The Glossary of Prosthodontic Terms, 2005). It has
been speculated that canine-guided occlusion protects the posterior teeth laterally because of
the canines’ strategic location, anatomy and proprioceptive properties (Rinchuse et al., 2007).
On the other hand, group function occlusion might contribute to a wide distribution of occlusal
forces on several teeth instead of a single tooth; thus, the occlusion can be more comfortable
and functional (Thornton, 1990). However, true clinical evidence supporting either scheme is
still lacking, therefore, both schemes are deemed acceptable (Becker and Kaiser, 1993; Turp et
al., 2008).
More recently, there has been a discussion about the limitations of defining each lateral
occlusion scheme, as the occlusal presentation is more complex naturally (Ogawa et al., 1998).
For example, with different degrees of excursion, the lateral occlusion scheme might differ.
Further, any functional occlusion is subjected to changes with time, yet without manifestation
of physiological abnormalities (Abduo et al., 2013). It is also acknowledged that most patients
are comfortable with their existing dentition and occlusion. Thus, the occlusion scheme can be
considered physiological even if it does not fit into any specific category.
Fixed prosthodontic treatment is indicated to alter the tooth morphology, which can
eventually alter the lateral occlusion scheme. To date, the authors are not aware of any study
that evaluated the impact of fixed prosthodontic treatment on the lateral occlusal scheme. The
purpose of this observational study is to evaluate the effect of two forms of fixed
prosthodontic planning (conventional and digital diagnostic wax-ups) on lateral occlusion
scheme. Further the frequency of each tooth contact will be quantified. The null hypotheses
are that the prosthodontic planning will change the lateral occlusion scheme and the

166
frequency of teeth contacts, and there will be a difference between the two forms of
prosthodontic planning.
10.3. Materials and Methods
Models of 10 patients who required fixed prosthodontic treatment (crowns or fixed partial
dentures) were collected for this study. Table 10-1 summarizes the inclusion criteria. The
treatment indications were managements of heavily restored dentition, tooth wear, aesthetic
problems and short-span edentulous area. For all models, the diagnostic wax-up had an
influence on the lateral occlusion scheme. The patients received the treatment at the Oral
Health Centre of Western Australia and a human research ethics approval was obtained from
the Human Research Ethics Committee of The University of Western Australia (RA/44/1/5079).
Table 10—1 Inclusion criteria
Requirements of fixed prosthodontic treatment in the form of crowns or fixed partial dentures in at least one arch Diagnostic wax-up is indicated prior to the treatment Angle Class I occlusal relationship Well-distributed occlusal contacts Absence of TMD The planned prosthesis is completely supported by natural teeth No removable or implant prosthesis
An irreversible hydrocolloid impression (Alginate, GC America, IL, USA) was taken for each arch
and an occlusal relation record was obtained by polyvinyl siloxane registration material (GC
Exabite, GC America, IL, USA) according to the centric relation position. All the impressions
were poured by type III dental stone (Buff Stone, Adelaide Moulding & Casting Supplies, South
Australia, Australia). These casts comprised the pre-treatment models. All the models were
duplicated twice by reversible hydrocolloid duplicating materials (Magafeel, MKM System,
Haanova, Slovakia). On one model, the conventional wax-up was executed and the other
model was used for the digital wax-up (Figure 10-1).

167
A B C
Figure 10-1 Example of the evaluated virtual models. (A) Pre-treatment model. (B) Conventional wax-up model. (C) Digital wax-up model.
10.3.1. Conventional wax-up
On a semi-adjustable articulator (Whip Mix, Louiseville, KY, USA), one set of duplicated models
were articulated according to maximal intercuspation to represent the pre-treatment
articulation. The other set were used for the conventional wax-up and were articulated
according to centric relation position with the aid of the intra-oral record. Therefore, after the
wax-up, there will be a coincidence between centric relation and maximal intercuspation
positions (Becker et al., 2000). Silicone material putty (Dental Speedex Putty,
Coltene/Whaledent AG, Altstatten, Switzerland) was applied on to the buccal aspects of the
posterior teeth of the mounted models. This silicone index was used for the digital articulation
of the pre-treatment models.
The conventional wax-up procedure involved inlay wax addition on the external tooth surface
with the aim of rectifying the defective tooth structure, obtaining natural and aesthetic tooth
morphology, achieving symmetry between the two sides, and obtaining even bilateral occlusal
contacts. For some patients, an increase in the vertical dimension of occlusion was necessary.
All the conventional wax-ups were completed by an experienced dental technician. The dental
technician was advised to produce group function lateral occlusion scheme for the initial
excursions with no steep occlusion guidance. On the completed wax-up models, silicone
indices were formed on the buccal aspect of the posterior teeth.
A micro-CT scanner (SkyScan, Bruker, micro-CT, Kontich, Belgium) was used to scan the
conventional wax-up models and the associated silicone indices. The generated Digital Imaging
and Communication Medicine (DICOM) image were used to construct virtual 3D
Stereolithography (STL) images of the maxillary and mandibular models by a DICOM viewing
program (CTvox, Bruker micro-CT, Kontich, Belgium). The virtual image of the conventional
wax-up was used for the subsequent analysis.
168
In order to digitally articulate the models, the image registration process by 3D rendering
software package (Geomagic Studio, Raindrop Geomagic Inc., Research Triangle Park, NC, USA)
was applied. Initially, corresponding points on common surfaces between the model and the
silicone indices were selected to approximate the positions of the images. This was followed by
implementing the Iterative Closest Point Algorithm which re-orients the models according to
the best fit principles. The same process was repeated for the other silicone index and the
opposing arch. Eventually, the silicone indices were deleted digitally, and the two models were
digitally articulated.
10.3.2. Digital wax-up
The digital wax-up has been discussed in earlier report (Abduo, 2012). In summary, the pre-
treatment models and the associated silicone indices were scanned and converted to virtual
images. The virtual pre-treatment models were articulated according to the centric relation
position. This was achieved by superimposing the virtual pre-treatment models on the virtually
articulated conventional wax-up models. The unaltered tissues were used for the registration.
A 3D rendering software (Geomagic Studio) was used to execute the digital wax-up. The pre-
treatment models were articulated by the process of Image Registration. Virtual physiological
teeth (Phonares Teeth, Ivoclar Vivadent AG, Schaan, Liechtenstein) were used to alter the
teeth morphologies. The virtual tooth alignment involved size alteration, rotation and
translation. Each virtual tooth was fitted manually on the model with the aim of obtaining ideal
teeth arrangement, emergence profile, symmetry and aesthetics. After the completion of the
wax-up, the scanned model and the virtual teeth were merged to generate a single model,
which enhanced the computation speed of the subsequent analysis.
10.3.3. Virtual simulation of lateral movement
For each set of articulated models, the occlusion scheme was evaluated for each working side
separately. Four horizontal excursive positions were considered: 0.5 mm, 1.0 mm, 2.0 mm and
3.0 mm (Figure 10-2). The lateral movement was simulated virtually by moving the mandibular
arch in the working side horizontally for each specified location. This was followed by gradually
moving the mandible vertically away from the maxilla by 0.05 mm increments. Once all the
contacts on the working side disappeared, the mandible was moved by 0.05 mm vertically
towards the maxilla (DeLong et al., 2003). This process detected the existing working side
contacts that dictate the lateral occlusion scheme. Due to the limitation of this process in
detecting non-working side contacts, only the working side contacts were considered.

169
Depending on the detected contacts, three occlusion schemes were considered: (1) canine-
guided occlusion, (2) group function occlusion, and (3) single tooth-guided occlusion. Canine-
occlusion was recorded if the lateral contact occurred on a canine tooth. The occlusion is
considered group function occlusion if more than two teeth in one arch were contacting
laterally. In situations where the lateral contact occurred on a single tooth other than the
canine, the lateral occlusion scheme was considered to be single tooth-guided occlusion.
A B C D E
Figure 10-2 An example of virtual simulation of lateral movement. (A) Maximal intercuspation. (B) 0.5 mm excursion. (C) 1.0 mm excursion. (D) 2.0 mm excursion. (E) 3.0 mm excursion. The red colour indicates the existing contacts.
10.3.4. Analysis
For each position, three variables were evaluated: (1) the prevalence of each lateral occlusion
scheme (2) the average number of the contacting teeth and (3) the percentage of each
contacting tooth. All the variables were blotted in bar diagrams. For the last two variables, the
maxillary and mandibular teeth contacts were distinguished. In addition, for the average
number of contacting teeth, the Kruskall-Wallis test was used to determine the presence of a
statistical difference between the different positions (P value = .05). When a significant
difference was observed, the Mann-Whitney test was used for post-hoc analysis. Further, the
difference in the number of teeth in contacts between the pre-treatment models and each of
the two wax-up models, and between the two wax-up models was evaluated by the Mann-
Whitney test (P value = .05). The same test was applied to evaluate the difference between
maxillary and mandibular arches for each position.

170
10.4. Results
10.4.1. Prevalence of lateral occlusion scheme
As the excursion increases, the lateral occlusion scheme changes for all the evaluated models
(Figure 10-3). Overall, the models exhibited similar patterns of lateral occlusion alterations. For
the pre-treatment models, the prevalence of canine-guided occlusion had increased minimally
through the excursion (from 30% to 45%). There was a tendency for the group function
occlusion to reduce with increased excursion (from 65% to 20%). The single tooth occlusion
had a tendency to increase with increased lateral excursion.
A
B
0%
10%
20%
30%
40%
50%
60%
70%
80%
90%
100%
0.5 1 2 3
Pe
rce
nta
ge (
%)
Lateral Occlusion Position
Single tooth-guided occlusion
Group function occlusion
Canine-guided occlusion
0%
10%
20%
30%
40%
50%
60%
70%
80%
90%
100%
0.5 1 2 3
Pe
rce
nta
ge (
%)
Lateral Occlusion Position
Single tooth-guided occlusion
Group function occlusion
Canine-guided occlusion

171
C
Figure 10-3 Proportion of each lateral occlusion scheme in each excursive position. (A) Pre-treatment models. (B) Conventional wax-up models. (C) Digital wax-up models.
For the two wax-up models, there was a consistent and gradual increase of canine-guided
occlusion (from 20% to 60% for conventional wax-up, and 0% to 65% for digital wax-up) and
reduction of group function occlusion (from 75% to 15% for conventional wax-up, and 95% to
29% for digital wax-up) with increased excursion. It appears that the single tooth occlusion had
minimally increased as the excursion increased. The overall patterns for the two wax-ups were
similar, except that the conventional wax-up had a slightly more even pattern of alteration,
while the digital wax-up exhibited steeper occlusion alterations.
10.4.2. Number of contacting teeth
Regardless of the evaluated model, there was a clear pattern of reduction of the average
number of teeth in contact with increasing the degree of excursion (Figure 10-4). For the pre-
treatment models, there was a slight reduction of number of teeth in contact with increasing
the degree of excursion, yet there was a statistical difference between all the positions, except
between the 1.0 mm and 2.0 mm positions. For the two wax-ups, there was a clear nominal
reduction of number of teeth in contact with increasing the excursion. A statistically significant
difference was observed between all the positions, except between the 2.0 and 3.0 mm
positions for the digital wax-up. Between the maxillary and mandibular arches, no statistically
significant difference was observed in any position for pre-treatment and the two wax-up
models.
0%
10%
20%
30%
40%
50%
60%
70%
80%
90%
100%
0.5 1 2 3
Pe
rce
nta
ge (
%)
Lateral Occlusion Position
Single tooth-guided occlusion
Group function occlusion
Canine-guided occlusion

172
A
C
Figure 10-4 The mean number of contacting teeth for all the models in each excursive position. (A) Maxillary arch. (B) Mandibular arch.
At the 0.5 mm and 1.0 mm excursion position, the pre-treatment models had significantly less
teeth contacting than the two wax-up models. However, at the 2.0 mm and 3.0 mm positions,
there had been no difference between the pre-treatment and the two wax-up models. At all
the positions, there had been no statistical difference between the conventional and digital
wax-ups.
0
0.5
1
1.5
2
2.5
3
3.5
4
0.5 1 2 3
Me
an N
um
be
r o
f C
on
tact
ing
Tee
th
Lateral Occlusion Position
Pre-treatment
Conventional wax-up
Digital wax-up
0
0.5
1
1.5
2
2.5
3
3.5
4
0.5 1 2 3
Me
an N
um
be
r o
f C
on
tact
ing
Tee
th
Lateral Occlusion Position
Pre-treatment
Conventional wax-up
Digital wax-up

173
10.4.3. Percentage of each contacting tooth
For all the arches of all the models, and almost at all positions, the canines had the tendency to
be the dominant contacting tooth. Further, it appears that the contacts decreased gradually
from canines to the more anterior teeth and from the canines to the posterior teeth. However,
there were some differences in the frequency and patterns of contacts (Figure 10-5).
A
B
0
10
20
30
40
50
60
70
80
90
CentralIncisor
lateralIncisor
Canine FirstPremolar
SecondPremolar
First Molar SecondMolar
Pe
rce
nta
ge o
f C
on
tact
ing
Tee
th (
%)
Tooth Category
0.5
1
2
3
0
10
20
30
40
50
60
70
80
90
CentralIncisor
lateralIncisor
Canine FirstPremolar
SecondPremolar
First Molar SecondMolar
Pe
rce
nta
ge o
f C
on
tact
ing
Tee
th (
%)
Tooth Category
0.5
1
2
3

174
C
D
0
10
20
30
40
50
60
70
80
90
CentralIncisor
lateralIncisor
Canine FirstPremolar
SecondPremolar
First Molar SecondMolar
Pe
rce
nta
ge o
f C
on
tact
ing
Tee
th (
%)
Tooth Category
0.5
1
2
3
0
10
20
30
40
50
60
70
80
90
CentralIncisor
lateralIncisor
Canine FirstPremolar
SecondPremolar
First Molar SecondMolar
Pe
rce
nta
ge o
f C
on
tact
ing
Tee
th (
%)
Tooth Category
0.5
1
2
3
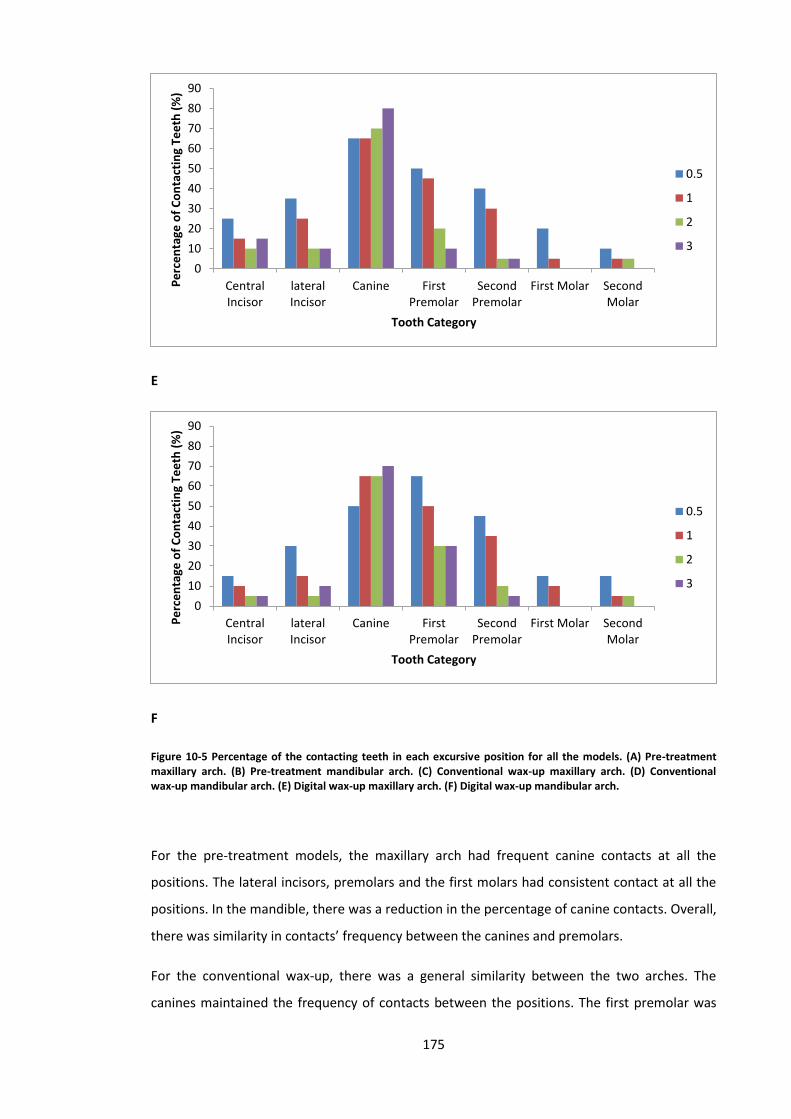
175
E
F
Figure 10-5 Percentage of the contacting teeth in each excursive position for all the models. (A) Pre-treatment maxillary arch. (B) Pre-treatment mandibular arch. (C) Conventional wax-up maxillary arch. (D) Conventional wax-up mandibular arch. (E) Digital wax-up maxillary arch. (F) Digital wax-up mandibular arch.
For the pre-treatment models, the maxillary arch had frequent canine contacts at all the
positions. The lateral incisors, premolars and the first molars had consistent contact at all the
positions. In the mandible, there was a reduction in the percentage of canine contacts. Overall,
there was similarity in contacts’ frequency between the canines and premolars.
For the conventional wax-up, there was a general similarity between the two arches. The
canines maintained the frequency of contacts between the positions. The first premolar was
0
10
20
30
40
50
60
70
80
90
CentralIncisor
lateralIncisor
Canine FirstPremolar
SecondPremolar
First Molar SecondMolar
Pe
rce
nta
ge o
f C
on
tact
ing
Tee
th (
%)
Tooth Category
0.5
1
2
3
0
10
20
30
40
50
60
70
80
90
CentralIncisor
lateralIncisor
Canine FirstPremolar
SecondPremolar
First Molar SecondMolar
Pe
rce
nta
ge o
f C
on
tact
ing
Tee
th (
%)
Tooth Category
0.5
1
2
3

176
the second tooth in the frequency of contacts. For all the remaining teeth, it was clear that the
frequency of contacts had a tendency to decrease with increasing the excursion position. The
mandibular canines were distinguished in the slight reduction of frequency with increased
excursion.
In relation to the digital wax-up, the two arches showed similar patterns and frequency. The
frequency of the canines contacts had increased with excursion, while the remaining teeth
contact frequency had decreased significantly with excursion.
10.5. Discussion
This study indicates that conventionally and digitally planned prosthodontic treatment
influences the lateral occlusion in relation to the prevalence of each scheme at different
positions, and the contacting teeth type and quantity. Therefore, the hypothesis that the
prosthodontic planning will impact the dynamic occlusion was accepted. Such a finding
supports that the lateral occlusion scheme should be carefully considered before and after the
treatment.
In this study, multiple lateral locations were considered in order to provide an insight about
the possible contact pattern from the immediate excursion to the maximal excursion (about 3
mm) (Ogawa et al., 1998). This was found to be more clinically relevant than only evaluating
the lateral occlusion at maximal excursion (Suit et al., 1976; Woda et al., 1979). Guiding
contacts at the 3 mm position might occur primarily during parafunctional activity and bruxism
in the edge-to-edge position. However, occlusal guiding during mastication and physiological
movement tend to occur within 0.5 mm from the maximal intercuspation (Ogawa et al., 1996;
1997). Therefore, the range evaluated in this study covers functional and parafunctional jaw
movement.
In relation to the prevalence of each lateral occlusion scheme, it is clear that with greater
excursion, the prevalence of canine-guided occlusion tends to increase. This was in accordance
with the studies that evaluated the prevalence of each lateral occlusion scheme at different
positions for the natural dentitions of young participants (Yaffe and Ehrlich, 1987; Al-Nimri et
al., 2010). Yaffe and Ehlrich evaluated the prevalence of the different lateral occlusion schemes
at 1.0, 2.0 and 3.0 mm excursions (Yaffe and Ehrlich, 1987). They found that the prevalence of
canine-guided occlusion had increased from 16.1% to 48.6%, and the group function occlusion
had reduced from 83.9% to 51.5%. A similar finding was observed by Al-Nimri et al., when they
evaluated the prevalence of the lateral occlusion scheme at 0.5 and 3 mm positions. They

177
found the prevalence of canine-guided occlusion had increased from 21.9% to 59.6%, and the
prevalence of group function had reduced from 45.3% to 23.9% (Al-Nimri et al., 2010).
Although the present study had evaluated the lateral occlusion scheme of restored dentitions,
overall, the figures were supporting to the outcome of the earlier studies. The differences in
documenting the prevalence of each occlusion scheme could be related to the different
classification and recording methods of the lateral occlusion scheme (Ogawa et al., 1998;
Abduo et al., 2013). In addition, it is important to emphasize that a single lateral occlusion
scheme did not exist for any model for the entire excursive path. Therefore, in accordance
with all the published clinical studies, true canine-guided occlusion or group function occlusion
seldom exists clinically (Woda et al., 1979; Becker and Kaiser, 1993; Turp et al., 2008; Abduo et
al., 2013).
The dynamic nature of the lateral occlusion scheme at the different arch positions is attributed
to teeth morphological factors. In the initial phase of excursion, the cusps are articulated
against wider fossa surfaces (Schuyler, 1963). As excursion progresses the total contact area
reduces, thus more teeth will be discluded. This observation supports the concepts of
“progressive occlusion”, where many teeth initially control the occlusion, followed by primarily
the canines during the maximal excursion (DiPietro, 1977; Goldstein, 1979). This occlusion
scheme appears to be more physiologically relevant than a single occlusion scheme that
controls the lateral movement through the entire excursion. This complex relationship might
have a protective role in tolerating lateral forces (Yaffe and Ehrlich, 1987). Physiologically, it is
thought that such an arrangement is advantageous in facilitating smooth multidirectional
movement of the mandibular arch, which might reduce the risk of patient discomfort
(Schuyler, 1963). Further, broad occlusal contact areas were found to be helpful in mitigating
excessive occlusal forces on teeth (Hidaka et al., 1999), which might contribute to the
dissipation of sudden lateral forces on the teeth. In addition, the greater prevalence of group
function occlusion means that greater contacts at less lateral movement can enhance the
occlusal phase of chewing (Wang and Mehta, 2013).
The pattern of lateral occlusion scheme alteration with different excursion was observed for
the pre-treatment and wax-up models. However, the wax-up models had more consistent
gradual occlusion scheme changes. This might be due to the pre-treatment dentitions suffering
from morphological abnormalities, such as tooth wear or failed restorations. Subsequently, a
wider contact area between worn down teeth might be evident and will maintain a greater
number of contacts, even after maximal excursion (Beyron, 1954). Whereas the dentitions of
the wax-up models had restored natural dental morphology and less prominent wear facets,
which can produce steeper articulation and cause a consistent reduction of the total number

178
of tooth contacts during excursion. This was evident in the initial phases of excursion (0.5-1.0
mm) where the contacts quantity was significantly greater for the two wax-up models than at
the later stages of excursion. In addition, it was clear that the proportion of canine-guided
occlusion at later stages of excursion was greater for the two wax-ups than the pre-treatment
models. This was also likely to be related to restoring the cuspal morphology of the canines to
the original canine morphologies. The studies that evaluated the implication of individual age
on excursion scheme confirmed that the younger the individual, the greater the prevalence of
canine-guided occlusion (Panek et al., 2008; Abduo et al., 2013). This was attributed to the
prominent dental morphology and less cuspal wear of the young dentitions (Abduo et al.,
2013; Panek et al., 2008). Therefore, it could be speculated that the planned prosthodontic
treatment can return the dentition occlusion scheme closer to its original state. Between the
two wax-ups, some differences were observed, but not to a significant level. Thus, it is difficult
to assume that a different wax-up protocol will produce a different outcome on the final
treatment. Therefore, the hypothesis that there will be a difference between the two
prosthodontic planning procedures was rejected.
It is clear that at all positions, the canines had the greatest number of contacts. The significant
contribution of canines was observed even after partial excursion, where group function
occlusion was dominating. This reflects the importance of canines for lateral occlusion scheme
development. This finding corroborates the observation by several earlier investigations
(Ingervall, 1972; Yaffe and Ehrlich, 1987; Ingervall et al., 1991; Ogawa et al., 1998). Ogawa et
al., on natural and young dentition, found that the canines were contacting in about 70% of
the excursive positions (Ogawa et al., 1998), which was similar to the outcome of our pre-
treatment models of the present study. Such a finding supports the protective role of canines
during the lateral occlusal movements. The dominance of canines is related to two factors: the
canine’s morphology and position. The canines are innately long teeth, which tend to have
more prominent cuspal morphology, which controls the articulation against the opposing
teeth (Rinchuse et al., 2007). As the excursion starts, the canines are in contact, however with
increased excursion, the canines will play a greater role and it is more likely for the other teeth
to disclude. As the working side condyle rotate and the non-working side condyle slides, the
working side canine is positioned in the corner, where interferences control the occlusal
guidance (D'Amico, 1961). The importance of the location in the arch explains the reason why
the teeth immediately adjacent to the canine tend to have frequent occlusal contacts.
Likewise, as the teeth are more distant from the canines, they are less likely to be in contact on
the working side (D'Amico, 1961; Ogawa et al., 1998). Although some investigators had found
group function was more common, for a great portion of their participants, the group function

179
occlusion was composed of canine and premolar occlusion, which reinforces the importance of
the location in the arch (Weinberg, 1964; Ingervall, 1972; Ingervall et al., 1991). The strategic
importance of canines is further supported by being the most vulnerable teeth for attrition
(Weinberg, 1964; Rinchuse et al., 2007). Therefore, regardless of the observed lateral occlusion
scheme, it could be stated that the canines are significant teeth to control the lateral occlusion
(Rinchuse et al., 2007).
Following the prosthodontic planning, it was clear that the frequency of the canine contact
was increased, followed primarily by the first premolars. As stated earlier, this was attributed
to restoring the original canine cuspal morphology, while the canines of pre-treatment models
suffered from greater tooth wear (Beyron, 1954). Therefore, after the prosthodontic planning
a greater protective role of canines was more evident. The two wax-ups were very similar in
the prevalence of the lateral occlusion scheme and the pattern of occlusal contacts frequency.
However, for the digital wax-up, there appeared to be an exaggerated role of the canine teeth
from the greater frequency of canine contacts. The most likely explanation is the well-defined
dental morphologies that can be attained digitally by the software (Mehl et al., 2005a). On the
other hand, this means that the digital wax-up can produce a steeper lateral occlusion than the
conventional wax-up, which can result in more restricted lateral movement. Although this can
have clinical implications, like patient’s discomfort (Schuyler, 1963), such assumption should
be confirmed by additional study.
Despite the lack of a significant statistical difference between the two wax-up protocols
applied in this study, it is important to reinforce that the digital wax-up is still in its early phase
of application and requires additional investigation. For example, for the digital wax-up to be
applicable clinically, the models have to be produced by CAM, which will inevitably influence
the accuracy of the lateral occlusal contacts. Further, the methodology of this study is limited
by not considering the non-working side contacts, which could influence the observed lateral
occlusion scheme. The omission of observing the non-working side contacts was necessary, as
virtual modelling of the condylar movement is very imprecise (Schierz et al., 2014). However,
as the digital wax-up is associated with steeper occlusal surfaces, the likelihood of developing
non-working side contacts is higher.

180
10.6. Conclusions
Given the limitations of the present study, the following can be concluded:
1. The prosthodontic planning had influenced the pattern of the lateral occlusion scheme.
The influence of the alteration tends to be more prominent at the initial stages of
excursion.
2. For all the models, the initial phase of excursion involved a greater number of contacting
teeth and higher prevalence of group function occlusion than maximal excursion. Canine-
guided occlusion tends to be more prevalent at the later stage of excursion.
3. Overall, the difference in the number and pattern of contacts is very minimal between the
two wax-ups.

181
Chapter Eleven
11. Impact of Prosthodontic Planning on Dental
Aesthetics: An Objective Evaluation of Aesthetic
Parameters
This chapter was published in the following article:
Abduo J, Bennamoun M, Tennant M, McGeachie J. Impact of digital prosthodontic planning on
dental esthetics: biometric analysis of esthetic parameters. Journal of Prosthetic Dentistry.
2015; Accepted. (Appendix L)

182
11.1. Abstract
Objective: Improving dental aesthetics is one of the main objectives of prosthodontic
treatment. Recently, digital diagnostic wax-up has been proposed as an alternative to
conventional diagnostic wax-up; however, the impact on aesthetics has not been evaluated.
This study aims to evaluate the impact of diagnostic wax-ups on objective dental aesthetic
variables, and to compare the aesthetic outcome achieved by different wax-up procedures.
Materials and Methods. Three objective variables were evaluated: perceived frontal
proportion (PCP), width-to-height (W:H) ratio and symmetry. Maxillary models of thirteen
patients were collected. All of them had maxillary anterior teeth that required prosthodontic
treatment. Two forms of diagnostic wax-ups were executed: conventional and digital wax-ups.
Measurements of the aesthetic variables were conducted digitally. For the PCP, a frontal image
was taken and the width of each tooth was measured. Subsequently, the PCP values of the
lateral incisor to central incisor, and of the canine to central incisor were calculated. In
addition, on the digital model, the height and width of each tooth was measured to calculate
the W:H ratio. Using the previous measurements, the symmetry between the right and left
sides was determined.
Results: No consistent or recurrent PCP was detected for any model. The diagnostic wax-ups
did not alter the PCP of the pre-treatment models. The diagnostic wax-ups had restored the
W:H ratio to what is assumed to be a natural ratio. The symmetry had improved after the
diagnostic wax-ups. There was no significant difference between the two diagnostic wax-ups.
Conclusions. The diagnostic wax-ups had improved the aesthetic variables of the anterior
maxillary teeth. The wax-up procedures had yielded very similar outcomes from the aesthetic
perspective. The digital diagnostic wax-up appears to be a reasonable alternative, but further
investigations are desirable to ensure its practicality.
Key words: diagnostic wax-up, perceived aesthetics, frontal proportion, width-to-height ratio

183
11.2. Introduction
Optimizing dental aesthetics is one of the key indications of prosthodontic treatment.
Restoring anterior teeth can improve their dimensions, display and shade (Raj, 2013). Today’s
population is more aesthetically driven than ever, and many of the dental patients request
dental treatment solely to improve their aesthetics. Several dental aesthetic variables were
discussed in the literature. For example, frontal view teeth proportion, symmetry, width-to-
height (W:H) ratio, teeth arrangement, morphology and location (Gillen et al., 1994; Raj, 2013).
Although the literature does not support specific criteria for dental aesthetics, the use of such
variables as guides to establish dental aesthetics has been proposed (Gillen et al., 1994). It is
acknowledged that the maxillary anterior teeth are the most influential teeth for dental
aesthetics, and their presence in harmony is associated with greater aesthetic perception
(Lombardi, 1973; Levin, 1978). Therefore, it is common to analyse dentition aesthetics by using
objective variables that reflect harmony.
To enhance the predictability of the aesthetic outcome, clinicians frequently recommend
diagnostic wax-up prior to the definitive prosthodontic treatment (Magne and Belser, 2004).
The diagnostic wax-up involves altering the tooth morphology by addition of wax on diagnostic
model. The rationales behind the diagnostic wax-up are simulation of the possible dental
treatment, demonstration of what is achievable by the treatment, and improving the
communication with the patient and the dental technician. In addition, the wax-up can be
utilized to dictate the tooth preparation and fabricate provisional restorations (Magne and
Belser, 2004; Gurel, 2007).
Recently, with the advancement of digital dentistry, digital wax-up has been proposed as an
alternative to the conventional wax-up (Abduo, 2012). This recent form of wax-up is based on
virtual alteration of the dental morphologies. Several methods are available to modify the
tooth digitally. This involves the fitting of an average tooth, using a biogeneric library, and
mirror imaging of an intact adjacent tooth (Mehl et al., 2005b; Probst and Mehl, 2008). In
comparison to the conventional method, altering the teeth by digital methods exhibits several
advantages. Digital technologies tend to reduce materials manipulation and the number of the
involved error-introducing steps. This is assumed to reduce the overall execution time and the
accumulated inaccuracies (Beuer et al., 2008; Miyazaki and Hotta, 2011). Since the software is
an integral part of the digital wax-up, many programs allow quantification of the effect of the
proposed treatment prior to the active treatment phase. This feature can be used to
accurately critique the impact of the dental treatment, such as the aesthetic outcome,
material thickness and the potential preparation invasiveness (Abduo, 2012; Davis et al., 2012;

184
Abduo et al., 2014b). Despite all of these advantages and the initial promising outcome, a true
comparison between the conventional and digital wax-ups from the aesthetic perspective is
lacking (Mehl et al., 2005b; Probst and Mehl, 2008). The aims of this study are evaluating the
impact of diagnostic wax-ups on dental aesthetics and to compare the dental aesthetics
achieved by different wax-ups. Three objective aesthetic variables are applied: perceived
frontal proportion (PFP), width-to-height (W:H) ratio and symmetry. The null hypotheses are
the wax-up procedure will idealize the dental aesthetics and there is no difference between
the conventional and digital wax-ups.
11.3. Materials and Methods
Thirteen patients had participated in this study. All of them presented with all of their
maxillary anterior teeth and required diagnostic wax-up prior to prosthodontic treatment. The
indications for the treatment were failing restorations, tooth wear, or unaesthetic teeth. A
human research ethics approval was obtained from the Human Research Ethics Committee of
The University of Western Australia (RA/44/1/5079). The treatments were provided at the Oral
Health Centre of Western Australia.
For all of the patients, an impression of each arch was taken by irreversible hydrocolloid
impression material (Alginate, GC America, IL, USA). Type III dental stone (Buff Stone, Adelaide
Moulding & Casting Supplies, South Australia, Australia) was used to pour the impressions. The
obtained models comprised the pre-treatment dental situation (Figure 11-1A). Each model was
duplicated twice by reversible hydrocolloid material (Magafeel, MKM System, Haanova,
Slovakia). One set of models were used to apply the conventional wax-up and the other set
were used for the digital wax-up.
11.3.1. Conventional wax-up
The conventional wax-up was executed after articulating the actual models on semi-adjustable
articulator (Whip Mix, Louiseville, KY, USA). The articulator was set according to average
values. Additive waxing technique was implemented, where an inlay wax was added to modify
the external tooth surface. In some situations, the external surfaces of the teeth were reduced.
The wax-up aimed to restore the deficient tooth structures, establish natural tooth
morphology, restore symmetry, and achieve a physiological occlusion (Figure 11-1B). The
additive waxing was completed by an experienced dental technician.

185
To facilitate the digital analysis, the pre-treatment and conventional wax-up models were
scanned by a micro-CT scanner (SkyScan, Bruker micro-CT, Kontich, Belgium). The virtual 3D
Stereolithography (STL) image of the maxillary model was constructed from the Digital Imaging
and Communication Medicine (DICOM) images by a DICOM viewing program (CTvox, Bruker
micro-CT, Kontich, Belgium). The STL images of the pre-treatment and conventional wax-up
models were used for the subsequent analysis (Figure 11-1C and 1D).
11.3.2. Digital wax-up
To complete the digital wax-up, a 3D rendering software package (Geomagic Studio, Raindrop
Geomagic Inc., Research Triangle Park, NC, USA) was used. The maxillary and mandibular
models were virtually articulated through the point-to-point alignment feature of the
software. As mentioned by an earlier investigation (Abduo, 2012), digital physiological teeth
moulds (Phonares Teeth, Ivoclar Vivadent AG, Schaan, Liechtenstein) were utilized to alter the
tooth morphology. Each virtual tooth was fitted manually on the model with the purpose of
obtaining ideal teeth arrangement, emergence profile, symmetry and aesthetics. Since the
gingival-tooth junction outlines the most apical extension of tooth modification, it was
demarcated on the virtual pre-treatment models. The virtual tooth alignment process included
size alteration, rotation and translation. This was followed by ensuring that adequate occlusal
contacts existed. After the completion of the wax-up, the scanned model and the virtual teeth
were merged into a single model, which improves the computation speed of the subsequent
analysis (Figure 11-1E).

186
A B
C D
E
Figure 11-1 An example of the evaluated models: A, Actual pre-treatment model. B, Actual conventional wax-up model. C, Virtual pre-treatment model. D, Virtual conventional wax-up model. E, Digital wax-up model.
11.3.3. Analysis
The comparison between the pre-treatment models, conventional wax-up models and digital
wax-up models was conducted using three objective aesthetic variables: perceived frontal
proportion (PFP), width-to-height (W:H) ratio and symmetry. All the measurements were
completed digitally.
The PFP measurement allows comparison of the frontal mesio-distal dimension of the lateral
incisor and canine to the central incisor. Earlier studies attempted to propose a consistent PFP
maxillary anterior teeth width to dictate the dental aesthetics. The most famous guide is the
golden proportion (GP), where the perceived width of the lateral incisor is 62% of the width of
the central incisor and the perceived width of the canine is 38% of the central incisor.4 In the
present study, measuring the PFP will provide information about the perceived appearance of
all the teeth after each wax-up. Each maxillary virtual model was oriented with the occlusal
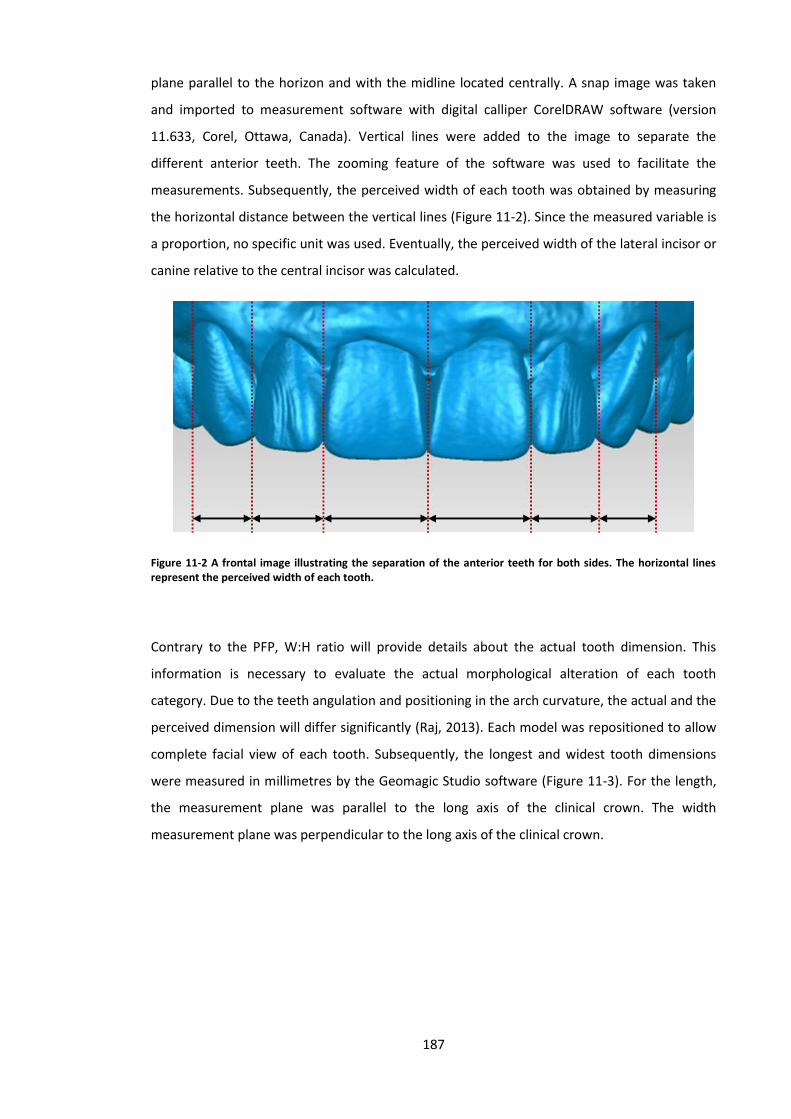
187
plane parallel to the horizon and with the midline located centrally. A snap image was taken
and imported to measurement software with digital calliper CorelDRAW software (version
11.633, Corel, Ottawa, Canada). Vertical lines were added to the image to separate the
different anterior teeth. The zooming feature of the software was used to facilitate the
measurements. Subsequently, the perceived width of each tooth was obtained by measuring
the horizontal distance between the vertical lines (Figure 11-2). Since the measured variable is
a proportion, no specific unit was used. Eventually, the perceived width of the lateral incisor or
canine relative to the central incisor was calculated.
Figure 11-2 A frontal image illustrating the separation of the anterior teeth for both sides. The horizontal lines represent the perceived width of each tooth.
Contrary to the PFP, W:H ratio will provide details about the actual tooth dimension. This
information is necessary to evaluate the actual morphological alteration of each tooth
category. Due to the teeth angulation and positioning in the arch curvature, the actual and the
perceived dimension will differ significantly (Raj, 2013). Each model was repositioned to allow
complete facial view of each tooth. Subsequently, the longest and widest tooth dimensions
were measured in millimetres by the Geomagic Studio software (Figure 11-3). For the length,
the measurement plane was parallel to the long axis of the clinical crown. The width
measurement plane was perpendicular to the long axis of the clinical crown.

188
A B D
Figure 11-3 Measurement of the W:H ratio: A, Central incisor. B, Lateral incisor. C, Canine. The vertical line is the height and the horizontal line is the width.
Utilizing the earlier measurements, two forms of symmetry were measured: perceived, and
actual. The perceived symmetry was based on calculation of the asymmetry percentage of
teeth width from the frontal view. The actual symmetry is based on measuring the asymmetry
percentage of the actual height and width of each tooth. The asymmetry percentage is
measured according to the following formula:
𝐴𝑠𝑦𝑚𝑚𝑒𝑡𝑟𝑦 𝑃𝑒𝑟𝑐𝑒𝑛𝑡𝑎𝑔𝑒 = √(𝑅𝑆𝑇𝐷 − 𝐿𝑆𝑇𝐷
𝑅𝑆𝑇𝐷 + 𝐿𝑆𝑇𝐷)
2
× 100
where RSTD is the right side tooth dimension and LSTD is the left side tooth dimension. The
less asymmetry percentage means greater symmetry.
11.3.4. Statistics
For each model, the mean and standard deviation were calculated for the PFP, W:H ratio and
asymmetry. Subsequently, the mean value for each tooth was compared between the models.
The asymmetry percentage for the different teeth was compared within each model. In
addition, the asymmetry percentage for each tooth category was compared between the
different models. To evaluate the presence of a significance difference, the Kruskall-Wallis test
was used (P = .05). The Mann-Whitney test was used as a post-hoc analysis, when a significant
difference was identified.

189
11.4. Results
11.4.1. Perceived frontal proportion
The average PFP of the lateral incisors and canines to the central incisors for all the models
were presented in Figure 11-4. The reported average lateral incisor proportion for the pre-
treatment, conventional wax-up and digital wax-up models was 65.6%, 60.8% and 60.5%
respectively. The canine proportion was 49.4%, 46.5% and 45.8% respectively. An exact match
between any model and GP (lateral incisors = 68%, canines = 38%) was not observed. However,
the PFP pattern was relatively comparable to GP. There has not been a significant difference
for neither lateral incisors not canines between the pre-treatment models and conventional
wax-up models (P = .08) and digital wax-up models (P = .08). Further, the two wax-ups
presented similar proportions statistically (P = .81).
Figure 11-4 PFP of the lateral incisors and canines for the pre-treatment, conventional wax-up and digital wax-up models. The GP values were added for comparison.
11.4.2. Actual dimensions
The W:H ratio of all the maxillary anterior teeth for all the models were presented in Figure 11-
5. For all the teeth, the pre-treatment models had the greatest W:H ratio (central incisors =
106.8%, lateral incisors = 92.2%, canines = 88.6%), followed by the conventional wax-up
models (central incisors = 88.5%, lateral incisors = 78.5%, canines = 81.2%) and the digital wax-
up models (central incisors = 82.8%, lateral incisors = 74.1%, canines = 74.5%). For the central
incisors, the pre-treatment models had a significantly greater W:H ratio than the conventional
wax-up models (P = .04) and digital wax-up models (P = .00). The lateral incisors and canines of
the pre-treatment models had significantly greater W:H ratio than the digital wax-up (P = .00
0
10
20
30
40
50
60
70
80
Pre-treatment model Conventional wax-upmodel
Digital wax-up model Golden proportion
Pe
rce
ive
d F
ron
tal P
rop
ort
ion
(%
)
Evaluated Models
Lateral incisors
Canines

190
and P = .03). However, the W:H ratio of the lateral incisors and canines did not differ
significantly between the pre-treatment and conventional wax-up models (P = .07 and P = .50).
Between the two wax-ups, there was no significant difference in the W:H ratio for the central
incisors (P = .07), lateral incisors (P = .15) or canines (P = .07).
Figure 11-5 W:H ratio of all the teeth for the central incisors, lateral incisors and canines of all the models.
11.4.3. Perceived symmetry
Figure 11-6 illustrates the asymmetry percentage of the PFP for all the anterior teeth of each
model. For all the teeth, the pre-treatment models generally exhibited greater asymmetry
than for the wax-up models. For all the models, the central incisors were the most symmetrical
followed by the lateral incisors. The canines had the greatest asymmetry percentage. For the
pre-treatment models, there has been an insignificant difference in the symmetry discrepancy
between all the teeth (P = .09). The conventional wax-up models had significant discrepancy
only between the central incisors and the canines (P = .02). The digital wax-up models revealed
a significant difference in the discrepancy between the central incisors and lateral incisors (P =
.00), and between the central incisors and canines (P = .00).
0
20
40
60
80
100
120
140
160
Pre-treatment model Conventional wax-up model Digital wax-up model
W:H
Rat
io (
%)
Evaluated Models
Central incisors
Lateral incisors
Canines

191
Figure 11-6 Perceived asymmetry percentage of central incisors, lateral incisors and canines of the pre-treatment, conventional wax-up and digital wax-up models.
After comparing the discrepancy between the models for each tooth category, the central
incisors of the digital wax-up models had significantly less discrepancy than the pre-treatment
models (P = .00) and conventional wax-up models (P = .04). However, there has been no
significant difference for the central incisors between the pre-treatment and conventional
wax-up models (P = .09). The lateral incisors and the canines asymmetry percentage did not
differ significantly between the models (P = .46 and P = .32).
11.4.4. Actual symmetry
In relation to the width symmetry, the pre-treatment models had a greater asymmetry
percentage than any wax-up models (Figure 11-7A). For the pre-treatment models, the lateral
incisors were the most asymmetrical. This difference was significant between the central
incisors and lateral incisors (P = .02). However, the difference between the central incisors and
canines, and lateral incisors and canines were insignificant (P = .49 and P = .06). There is no
significant difference between the different teeth category for the conventional wax-up (P =
.08) and digital wax-up (P = .07) models.
After comparing the teeth of the different models, the central incisors asymmetry was
significantly different between the pre-treatment models and conventional wax-up (P = .02)
and digital wax-up (P = .00). Likewise, the lateral incisors asymmetry differed significantly
between the pre-treatment models and conventional wax-up (P = .00) and digital wax-up (P =
.00) models. The central incisors and lateral incisors width asymmetry did not differ
-5
0
5
10
15
20
25
Pre-treatment model Conventional wax-up model Digital wax-up model
Asy
mm
etr
y P
erc
en
tage
(%
)
Evaluated Models
Central incisors
Lateral incisors
Canines

192
significantly between the two wax-ups (P = .46 and P = .10). The width asymmetry of the
canines was significantly greater for the pre-treatment than the digital wax-up models (P =
.03). However, there was no significant difference between the pre-treatment and
conventional wax-up models (P = .32) and between the two wax-up models (P = .48).
Similar to the teeth width, the height asymmetry of the pre-treatment models was greater
than the two wax-up models (Figure 11-7B). The lateral incisors of the pre-treatment models
had the greatest height asymmetry. This asymmetry was significantly different between the
central and lateral incisors (P = .00). Otherwise, there was no significant difference between
the canines and central incisors (P = .06) or lateral incisors (P = .34) of the pre-treatment
models. There was no statistical difference between the height asymmetry of the different
teeth category of the conventional wax-up (P = .93) or the digital wax-up (P = .30).
A
-5
0
5
10
15
20
25
Pre-treatment model Conventional wax-up model Digital wax-up model
Asy
mm
etr
y P
erc
en
tage
(%
)
Evaluated Models
Central incisors
Lateral incisors
Canines

193
B
Figure 11-7 Actual asymmetry percentage of the central incisors, lateral incisors and canines for the pre-treatment, conventional wax-up and digital wax-up models. A, The actual width asymmetry. B, The actual height asymmetry.
The height asymmetry of the central incisors and the canines was not significantly different
between the pre-treatment models and conventional wax-up models (P = .15) or digital wax-
up models (P = .66). Likewise, there was no difference between the two wax-up models (P =
.63) for the central incisors. The lateral incisors height asymmetry of the pre-treatment model
was significantly greater than the conventional wax-up models (P = .02), but not the digital
wax-up models (P = .09). However, the lateral incisors height asymmetry of the wax-up models
did not differ significantly (P = .22). For the canines, there was no difference between the pre-
treatment models and conventional wax-up models (P = .37) or digital wax-up models (P = .31).
Likewise, the canine height asymmetry was very similar between the two wax-ups for the
canines (P = .92).
11.5. Discussion
It is clear from this study that the planned prosthodontic treatment can influence the
evaluated objective aesthetic variables. This effect was very clear for the W:H ratio. Therefore,
the hypothesis that the wax-up procedure will idealize the dental aesthetics was accepted. To
a certain extent, there is an overall similarity between the two wax-ups in relation to the PFP,
W:H ratio and symmetry.
-10
-5
0
5
10
15
20
25
30
35
Pre-treatment model Conventional wax-up model Digital wax-up model
Asy
mm
etr
y P
erc
en
tage
(%
)
Evaluated Models
Central incisors
Lateral incisors
Canines

194
Historically, the GP was proposed to infer that there is a relationship between teeth aesthetics
and mathematical proportion (Levin, 1978). The rationale was that repeated proportion
between the maxillary anterior teeth is associated with greater harmony and aesthetics
(Lombardi, 1973). In addition, the presence of recurrent values may enhance the aesthetic
outcome of the restorative treatment. However, this assumption has not been confirmed by
any other study (Preston, 1993; Hasanreisoglu et al., 2005; Ali Fayyad et al., 2006). Although an
exact match with GP was not observed for any model of this study, relatively close values were
obtained. This is clear for the lateral incisors proportion which was close to what has been
prescribed for GP. However, the canines were larger, which means that the total perceived
maxillary anterior teeth width is greater to what has been assumed by GP. The lack of
coincidence with GP has been confirmed by several earlier studies on natural dentition
(Preston, 1993; Hasanreisoglu et al., 2005; Ali Fayyad et al., 2006). Preston had found that the
PFP in relation to central incisors of the lateral incisors and canines were 66.2% and 55.6%
respectively (Preston, 1993). Similarly, Hasanreisoglu et al. found the lateral incisors and
canines proportions to be 65.9% and 52.3% respectively (Hasanreisoglu et al., 2005). Ali Fayyad
et al. reported that the GP had only existed in 27.1-31.3% of their evaluated population (Ali
Fayyad et al., 2006). The minor dissimilarity between this study and other studies is related to
the inevitable variation between the evaluated population, and the method of measurements.
Nevertheless, the obtained proportion pattern of all of these studies is supportive to the
proportion values of the current study.
This study differs from earlier studies in evaluating the PFP following prosthodontic planning.
Pini et al. had analysed the existence of GP following the treatment of lateral incisors agenesis
(Pini et al., 2012). The treatment was implant placement or orthodontic movement followed
by canines recontouring. They did not confirm the existence of GP for the majority of their
treated cases. Similar to the present study, the GP tended to exist more frequently between
centrals and laterals, and less commonly between laterals and canines. Thus, it could be
speculated that there is no recurrent mathematical proportion, and the canines tend be larger
than what has been proposed by GP (Ward, 2007).
Interestingly, several authors had critiqued the aesthetic value of GP. It appears that the GP
did not coincide with the majority of attractive smiles. Rosenstiel et al. had altered frontal
image by software to incorporate GP. They found that dentists tend to rank frontal images
with GP as less attractive (Rosenstiel et al., 2000). In a follow-up study, they found that lay
persons had minimal preference for images coinciding with GP (Rosenstiel and Rashid, 2002).
Similarly, Mahshid et al. found no relation between GP and what is perceived to be aesthetics
(Mahshid et al., 2004). Basting et al. found that dentists preferred greater proportion than the

195
GP (Basting et al., 2006). Further, Ward had confirmed that dentists tend to prefer larger
proportions than GP (Ward, 2007). One of the clear limitations of GP is the appearance of
excessively wide central incisors, which is equivalent to the perceived width of the lateral
incisor and canine (Ward, 2007). Therefore, not only does GP rarely exist naturally, the
utilization of GP is not a reliable method to achieve desirable aesthetics of the anterior
maxillary teeth. Like many aspects in nature, instead of being mathematically determined, the
acceptable proportion for the anterior teeth appears to fit within a range.
The present study adds that PFP of the planned treatment will be dictated by pre-treatment
PFP, even if the tooth dimension is altered. Maintaining the PFP is likely to be due to the teeth
location in the curved arch and their relation to the observer’s view (Ward, 2001;
Hasanreisoglu et al., 2005). For example, from the frontal view, the entire labial surface of the
central incisor is visible, while for the canine, it is primarily the mesial half of the tooth. The
perceived lateral incisor view is dependent on its rotation within the arch. Therefore, it could
be speculated that the interest in establishing a repeatable proportion has been overrated in
the literature. Even if a specific PFP is desirable, a significant alteration in the proportion is not
feasible.
As expected, the teeth W:H ratios of the pre-treatment models were greater than for wax-up
models, which is attributed to the pre-treatment condition of the dentition (Magne et al.,
2003). Since following the treatment, the teeth are likely to be lengthened, the W:H ratio will
decrease. From the aesthetic perspective, lengthening the teeth is beneficial since it will
increase the teeth display, restore anterior teeth relationship and restore natural anatomy
(Abduo and Lyons, 2012). This is well supported by the fact that following the wax-up, the
anterior teeth W:H ratio is similar to natural non-deficient teeth. In a study on natural non-
restored young dentition, Gillen et al. found the W:H ratio of the central incisors, lateral
incisors and canines to be 90.2%, 83.9% and 82.5% respectively (Gillen et al., 1994). Likewise,
Sterret et al. found the ranges to be 85-86%, 76-79% and 77-81% (Sterrett et al., 1999).
Hasanreisoglu et al. had found very similar W:H values (89-91%, 82-83% and 83-87%
respectively) (Hasanreisoglu et al., 2005). Zlateri et al. had found slightly less W:H ratio (82.9%,
78.1% and 81.2%) respectively (Zlataric et al., 2007). Due to the minor variation in the outcome
of these studies, strict adherence to a specific proportion should be avoided. These
measurements are similar to the W:H ration of the wax-up dentition of the present study (83-
88%, 74-79%, and 75-81%). This supports that the restorative treatment is likely to return the
morphology to the baseline natural morphology. A similar outcome was observed by Pini et al,
who evaluated the W:H ratio of the restored anterior dentition that suffered from agenesis of
the lateral incisors (Pini et al., 2013).

196
Symmetry has been mentioned as a main determinant for dental aesthetics. After evaluation
of several smiles, Durgekar et al. had found that lay persons tend to prefer symmetrical smiles
(Durgekar et al., 2010). Similarly, Machado et al. had established that minor unilateral vertical
discrepancies can be perceived as unaesthetic (Machado et al., 2013). There is a good
indication from the present study that the symmetrical harmony is enhanced by the wax-up
procedure. This is clear from the reduction of the asymmetry percentage following the
prosthodontic planning. Two forms of symmetrical evaluation were applied. This was
necessary as the perceived frontal symmetry will differ from the actual morphological
symmetry due to the curvature of the arch and angulation of the teeth. For the actual
dimensions symmetry, the greatest vertical and horizontal discrepancy was associated with
the pre-treatment models, and the wax-ups consistently showed improvement in the
symmetry. Since, naturally, there should be relative similarity between contralateral teeth
(Mavroskoufis and Ritchie, 1980), it is clear that the diagnostic wax-ups are useful in idealizing
the aesthetic outcome of the treatment. According to the perceived symmetry, it is clear that
the central incisors were the most symmetrical for all the models, while the canines were the
least symmetrical. This is usually easily observed for the central incisors (Ward, 2001;
Hasanreisoglu et al., 2005). However, for the canines, and to a lesser extent the lateral incisors,
the position and the perceived width will significantly influence the perceived symmetry.
As the central incisors tend to be the most symmetrical in the perceived and the actual
symmetry evaluation, the outcomes of the two wax-ups are likely to be rated as aesthetic. The
importance of central incisors symmetry was emphasized by several investigations. In a web-
based survey, Brunzel et al. had proved that the symmetrical position of the central incisors is
crucial while minor discrepancy in the lateral incisors position can be tolerated (Brunzel et al.,
2006). Yet, in the natural dentition, absolute symmetry of the central incisors is very unlikely
(Mavroskoufis and Ritchie, 1980; Gillen et al., 1994). Mavroskoufis and Ritchie had found that
60% of young individuals had an accumulated central incisors discrepancy of more than 0.2
mm (Mavroskoufis and Ritchie, 1980). Therefore, minimal dimensional discrepancy between
contralateral teeth, as observed after the diagnostic wax-ups in this study, is within the natural
limit. In an aesthetic appraisal by lay persons and orthodontists, it was found that minor
perceived vertical discrepancy of the incisal edges (0.5 mm) within the central incisors was
detected by different investigator groups. However, vertical discrepancy in the lateral incisor
of up to 0.5 mm was acceptable by the orthodontist, while the lay persons had an accepted
discrepancy of up to 1 mm (Machado et al., 2013). On the contrary to the incisors, Pinho et al,
had found that even a 2 mm perceived asymmetry of the canine cusp tip was acceptable by
orthodontists and lay persons (Pinho et al., 2007). This indicates that greater symmetry is more

197
critical for teeth closer to the midline, and reasonable deviation from complete symmetry is
not necessary perceived as unaesthetic.
From the aesthetic perspective, this study indicates that the outcome of the conventional and
digital wax-ups is comparable. Digital wax-up appears to exhibit some advantages over
conventional wax-up in relation to the symmetry. However, although the perceived central
incisors symmetry is statistically greater for the digital wax-up models, the actual difference is
minimal (2%), which might not be noticeable clinically. Therefore, the hypothesis that there is
no difference in the aesthetic implications between the two wax-ups was accepted.
Nevertheless, this observation reflects the advantage of using digital technologies in obtaining
dental morphologies. For example, mathematical determination of tooth contour and utilizing
the contralateral mirror image feature will ensure a consistent and symmetrical outcome
(Probst and Mehl, 2008).
It is important to note that for the digital wax-up to be applicable, it should be transferrable to
the clinic. Physical models of the digital wax-up can be produced by 3D printing or milling
(Kasparova et al., 2013). However, it is likely that the actual accumulated discrepancies will
influence the outcomes reported in this study. For example, dimensional error of models
produced by 3D printing can be greater than 100 µm (Inokoshi et al., 2012).
11.6. Conclusions
Within the limitations of this study, it can be concluded that the diagnostic wax-ups had a
positive impact on the aesthetic variables. Despite the aesthetic improvements, the PFP was
minimally affected and no recurrent PFP was observed. The anterior teeth morphology in the
form of the W:H ratio was restored by the wax-ups to natural morphology. There are
indications that the perceived and the actual symmetry had improved following the diagnostic
wax-ups. In terms of tooth dimensions, proportions and symmetry, there is a greater similarity
between the two wax-up protocols. From the aesthetic perspective, digital planning appears to
be very promising. As dental aesthetics are perceived differently, the clinical evaluation of the
aesthetic outcome of each wax-up protocol is yet to be investigated.

198
Chapter Twelve
12. General Discussion and Conclusions
Part of this chapter was published in the following article:
Abduo J, Lyons K, Bennamoun M. Trends in computer-aided manufacturing in prosthodontics:
a review of the available streams. International Journal of Dentistry. 2014; Accepted.
(Appendix M)
199
The series of conducted research confirm that the diagnostic wax-up alters the pre-treatment
dental models in relation to all the evaluated variables. This observation emphasizes the merit
of conducting diagnostic wax-up. The advantages were observed from the aesthetic and
occlusion perspectives. There is tendency for the planned prosthodontic treatment to return
the dentition to its original and physiological state. Further, the two diagnostic wax-ups were
generally similar in relation to contour, aesthetics and occlusion. Some differences were
observed in relation to accuracy; however, it is very likely to be of subclinical significance.
12.1. Research Methodology
This research utilized the advantages of digital measurements tool. In industry, the digital tools
are frequently utilized to evaluate the precision of workpieces which is mandatory quality
assurance tool (Abduo et al., 2014b). This was feasible in the current research since all the
evaluated models were digital. Over the physical measurements, the advantages of digital
measurements were accuracy, convenience and consistency (Redlich et al., 2008; Dalstra and
Melsen, 2009; Prasad and Al-Kheraif, 2013). Through the software, it is possible to magnify the
models to allow accurate location of the point(s) of interest (Quintero et al., 1999; Kusnoto
and Evans, 2002). This will overcome the problems of measuring the dimensions of very fine
features. Further, the measurements can be repeated which insures the reliability (Delong et
al., 2002; DeLong et al., 2003). In addition, utilizing the digital tool allows accurate
quantification of the distortion, area and dimensions, which are impossible to evaluate
physically (Iwase et al., 2011; Abduo and Bennamoun, 2013).
On the contrary, the digital measurements suffer from some limitations. The accuracy of the
digital quantification is largely dependent on the accuracy of the scanning, model processing
and mesh density. In addition, as the points of interest will be located digitally, positional
inaccuracy on the mesh is inevitable. The issue of accuracy will be discussed in more details in
the accuracy part of the discussion.
200
12.2. Tooth Surface Alteration
From the morphological perspective, two surfaces were altered: the axial and the occlusal
surfaces. These surfaces are critical for dental aesthetics, hygiene and function. As one of the
key purposes of prosthodontic treatment is to improve the appearance and function, the
implications of any wax-up on these two surfaces are very important.
12.2.1. Axial surface
It is clear that the diagnostic wax-up had improved the appearance of teeth. However, the
improvement in dental aesthetics is likely to be related to altering the tooth morphology
rather than the arrangement. For example, significant aesthetic improvement was observed
after contour alteration, restoring dental anatomy, symmetry refinement and modifying W:H
ratio. However, the perceived proportion was not affected by the wax-up, which indicates
minimal effect on teeth arrangement. It is not unusual for the tooth anatomy to be modified
through the prosthodontic treatment (Magne and Douglas, 1999a; b; Magne and Belser, 2004).
This was clear after the tooth contour evaluation, especially for the anterior teeth. For
example, it has been observed from this study that the teeth were widened as they emerge
from the gingival tissue. The effect of the wax-up on anterior teeth contour coincides with the
observation of studies that evaluated the effect of prosthodontic treatment on tooth contour
(Meijering et al., 1998; Vasconcelos et al., 2009). This is thought to be advantageous since it
increases the teeth display. In a split-mouth study on four participants, Ehlrich and Hochman
found the participants had preferred the over-contoured crowns by 1 mm over under-
contoured crowns (Ehrlich and Hochman, 1980). In addition, altering the facial tooth
morphology will allow elimination of anterior teeth discrepancies such as anatomical
limitations, asymmetry, and W:H ratio. This confirms the advantages of prosthodontic
treatment on dental aesthetics.
From the hygienic perspective, increasing the tooth contour has been related to gingival
inflammation, periodontal complication and dental caries (Perel, 1971; Sackett and
Gildenhuys, 1976; Sorensen, 1989; Broadbent et al., 2006). On the contrary, more recent
studies consistently indicated that as long as adequate cleanliness is maintained, the
periodontal complications are likely to be prevented, even with over-contoured crowns
(Ehrlich and Hochman, 1980; Sindel et al., 1999; Kohal et al., 2003; Kohal et al., 2004).
Therefore, according to the published clinical studies, it appears that reasonable over-
contouring of up to 1 mm is not likely to be associated with biological complications. Since the
maximal contour recorded in this study, by the two wax-ups was less than 1 mm, the modified

201
tooth contours are less likely to induce pathological consequences. Further, the linear increase
of the modified teeth contour coronally means that the contour increase is likely to blend
smoothly with the unaltered tooth surface. This is further supported by the measurements at
the gingival margin being the least (less than 0.2 mm). Therefore, potential implications on oral
health from the two wax-ups are very unlikely.
An additional advantage of widening the teeth is the facilitation of the conservative
preparation of the anterior teeth. When the tooth is prepared for fixed prosthesis, a
considerable amount of tooth surface is reduced to accommodate the prosthesis. This space is
necessary for the durability and the aesthetics of the restoration. After the wax-up, the
preparation can be executed according to the planned restoration surfaces rather than existing
surfaces (Magne and Belser, 2004; Gurel, 2007). This merit was confirmed by the current
research for the anterior teeth. Since the anterior teeth tend to have less tooth substance than
posterior teeth, they will benefit significantly from any conservative measure. This will reduce
the risk of pulpal and mechanical complications (Goodacre et al., 2001). Further, since the
anterior teeth have the advantage of being accessible for cleaning, it is less likely for the oral
health to be affected by over-contouring.
On the other hand, an interesting observation of this research is that the contour of the molar
teeth was minimally affected. This is likely to be advantageous as it will maintain the ease of
cleaning of the less accessible areas (Becker and Kaldahl, 1981). In addition, it is less likely for
the appearance of posterior teeth to benefit from over-contouring as they are not in the
aesthetic zone.
The quantitative evaluation of this study had revealed that the prosthodontic treatment had
restored the W:H ratio of the maxillary anterior teeth to the natural dimensions. Before the
wax-up, the W:H ratio was greater, which might be due to the pre-treatment condition of the
dentition (Magne et al., 2003). While after the treatment, the teeth are likely to be lengthened
which might reduce the W:H ratio. This is associated with greater tooth display and aesthetic
appearance (Abduo and Lyons, 2012). The studies that evaluated the W:H ratio for the central
incisors, lateral incisors and canines of the natural dentition revealed similar dimensions to
what has been observed in this research after the wax-up (Gillen et al., 1994; Sterrett et al.,
1999; Hasanreisoglu et al., 2005; Zlataric et al., 2007). Therefore, after the wax-up, the anterior
teeth W:H ratio will be similar to the W:H ratio of natural non-deficient teeth. Similarly, our
research confirmed the observation of Pini et al. after the management of lateral incisors
agenesis (Pini et al., 2013).

202
In terms of anterior teeth symmetry, the present research indicated that the symmetrical
harmony was enhanced after the wax-up. This was observed for the actual and the perceived
symmetry, and the vertical and horizontal tooth symmetry. Since, naturally, there should be
relative similarity between contralateral teeth (Mavroskoufis and Ritchie, 1980), it is clear that
the diagnostic wax-ups are useful in idealizing the aesthetic outcome of the treatment.
Dentition with greater symmetry is perceived as more aesthetic (Durgekar et al., 2010;
Machado et al., 2013)
A new observation of the research is that the wax-up or had minimal influence on the
positional variable such as the PFP, and the PFP of the pre-treatment dentition tend to
determine the post-treatment PFP. Similar outcome was observed by Pini et al. who analysed
the PFP following the lateral incisors agenesis (Pini et al., 2012). Maintaining the PFP is likely to
be due to the teeth location in the curved arch and their relation to the observer’s view (Ward,
2001; Hasanreisoglu et al., 2005). For example, from the frontal view, the entire labial surface
of the central incisor is visible, while for the canine, it is primarily the mesial half of the tooth.
The perceived lateral incisor view is dependent on its rotation within the arch. Therefore, it
could be speculated that the interest in establishing a repeatable proportion has been
overrated in the literature. Even if a specific PFP is desirable, a significant alteration in the
proportion is not possible by prosthodontic treatment.
After comparing the two wax-ups, there is an overall similarity. This applies to the contour,
W:H ratio, PFP and symmetry. The contour of the digital wax-up tends to be greater than the
conventional wax-up. On the other hand, the contour around the conventional wax-up teeth
tends to be more consistent than the digital wax-up. This difference between the two wax-ups
was statistically significant; however, the actual difference is minimal. Therefore, the clinical
impact of this difference is most likely minimal. Therefore, the hypothesis that the
conventional and digital wax-ups cause similar contour alterations is accepted. The tendency
for the digital wax-up to cause greater labial contour could be due to the difficulty in locating
the gingival margin digitally on the scanned pre-treatment model (Tan et al., 2008; Abduo et
al., 2010; Han et al., 2011). This is more difficult than the actual and physical location of the
gingival margin as per the conventional wax-up.
In relation to symmetry, the digital wax-up was associated with greater symmetry than the
conventional wax-up. Similar to the contour, the actual difference in the symmetry is minimal,
which might not be noticeable clinically. Thus the hypothesis that the aesthetic effects of the
conventional and digital wax-ups are similar was accepted. Nevertheless, this observation
reflects the advantage of using digital technologies in obtaining consistent and symmetric

203
dental morphologies. This might be attributed to the mathematical determination of tooth
contour and utilizing the contralateral mirror image feature (Probst and Mehl, 2008). An
additional advantage of the digital wax-up was the better overall contour and sharper
appearance. This is likely to be related to the utilization of physiological teeth moulds which
were rated as highly aesthetic and normally used for definitive prosthesis. Other researchers
found that the digitally modified teeth tend to exhibit exaggerated anatomical features (line
angles, cusp tips and marginal ridges) (Paulus et al., 1999; Mehl et al., 2005a). The advantage
of the high anatomical definition is the digital wax-up might be perceived as more natural and
aesthetic (Figure 12-1). On the contrary, the conventional wax-up is based on manual wax
handling which might hinder development of optimal aesthetic appearance. Nevertheless, in
clinical practice, this effect is not very critical as the definitive prosthesis is provided at greater
definition and aesthetics.
A B
Figure 12-1 Frontal virtual images of (A) conventional wax-up model and (B) digital wax-up model. It is clear that the teeth of the digital wax-up model exhibited more defined features which might enhance the overall aesthetics.
12.2.2. Occlusal Surface
In relation to the occlusal surface, the two wax-ups had caused prominent occlusal alterations,
and returned the teeth to more to what is thought to be natural morphology. This was true for
the static and dynamic occlusion. In relation to the static occlusion, the occlusion quality was
evaluated from quantifying the contact number and area. Regardless of the wax-up procedure,
the contact number, contact area had significantly increased after the wax-up, which supports
that the planned prosthodontic treatment positively influences the number and area of
occlusal contacts. The lower occlusal contact number and area for the pre-treatment models
could be attributed to the pre-treatment dentition’s tendency to suffer from dental problems
that influence the morphology, such as large restoration, tooth wear and chipping. Such
abnormalities can affect the quality of the occlusal contact and contact area.

204
Overall, the studies on natural and intact dentition revealed that the intercuspal occlusal
contact number was similar to the contact number obtained following the wax-up treatment
of this study (McNamara and Henry, 1974; Korioth, 1990b; Ciancaglini et al., 2002; Delong et
al., 2002). Thus, it might be reasonable to assume that the planned prosthodontic treatment
will restore the occlusal anatomy to a more natural anatomy and the occlusal relationship
might return to the baseline relationship. Such an observation is attributed to the more natural
dental anatomy that can be generated following the wax-up. This is in accordance with the
clinicians’ recommendations on idealising static occlusal contacts with prosthodontic
treatment (Wiskott and Belser, 1995; Koyano et al., 2012). The envisioned improvement of
occlusal contacts will potentially contribute to a more stable and functional occlusion (Owens
et al., 2002). Therefore, in addition to aesthetic improvement following the prosthodontic
treatment, the oral function is more likely to improve as well.
In relation to the occlusal contact area, there was a marked variation from previous studies.
Studies on physical measurements of the occlusal area found less area than what has been
reported in this study (Hidaka et al., 1999; Delong et al., 2002; Alkan et al., 2006). Conversely,
studies that measured the area digitally recorded a relatively large contact area (Iwase et al.,
2011) which was similar to the wax-up models of this study. The variation in the outcome of
the studies could be related to the method of area quantification (Owens et al., 2002). It has
been acknowledged that a slight vertical discrepancy of the maxilla-mandibular tooth
relationship will cause an exponential reduction of the recorded area (Wilding et al., 1992;
Hidaka et al., 1999). Several of the earlier studies have applied occlusal medium to quantify the
area, in such cases, vertical displacement of the jaw will likely have occurred, resulting in an
underestimation of the contact area. On the other hand, digital evaluation of the area is likely
to overestimate the contact area due to the risk of the models overlapping (Iwase et al., 2011).
Nevertheless, it is clear that the wax-up process increases the contact area, which is indicative
that the planned prosthodontic treatment will increase the contact area at the occlusal phase
of chewing, hence resulting in more efficient chewing.
A significant determining factor of the contact number and area was the location of the tooth
in the arch. There was a dominance of contact number and area on the posterior teeth (two
times the anterior teeth), which corroborates several earlier investigations on natural
dentition (Ehrlich and Taicher, 1981; McDevitt and Warreth, 1997) and restored dentition (Yi
et al., 1996). Likewise, similar relationship was observed for the contact area of the natural
dentition (Yurkstas and Manly, 1949; Owens et al., 2002). The more profound contacts on the
posterior teeth are due to greater area, cuspal morphology and interdigitation of the opposing
teeth. The anterior teeth, on the other hand, have more confined surfaces and incisal edges.

205
Further, this finding fits with the mutually-protected occlusion concept, where the posterior
teeth prevent excessive contact of the anterior teeth at maximum intercuspation (The Glossary
of Prosthodontic Terms, 2005). Although this finding is correct for the pre-treatment and the
wax-up models, the difference between the anterior and posterior teeth is greater following
the prosthodontic treatment, which indicates the idealisation of the occlusion scheme
following prosthodontic planning. Thus, it could be speculated that the posterior teeth receive
greater benefit in terms of contact number and area following the prosthodontic treatment
than the anterior teeth. This is advantageous from the functional perspective, as the posterior
teeth are responsible for food chewing and grinding.
In relation to the effect on the lateral occlusion scheme, the two wax-ups had influenced the
lateral occlusion in relation to the prevalence of each scheme at different position. Further,
there has been an effect on the contacting teeth type and quantity. Wide range of eccentric
movements was selected in this study (Ogawa et al., 1998) as this will cover full functional and
parafunctional movements such as chewing, grinding and bruxism (Suit et al., 1976; Woda et
al., 1979; Ogawa et al., 1996; 1997).
In terms of the prevalence of each lateral occlusion scheme, it is clear that with greater
excursion, the prevalence of CGO tends to increase. This was in accordance with the studies
that evaluated the prevalence of each lateral occlusion scheme at different positions for the
natural dentitions of young participants (Yaffe and Ehrlich, 1987; Al-Nimri et al., 2010).
Although the present study had evaluated the lateral occlusion scheme of restored dentitions,
overall, the figures were supporting to the outcome of the earlier studies. The differences in
documenting the prevalence of each occlusion scheme could be related to the different
classification and recording methods of the lateral occlusion scheme (Ogawa et al., 1998;
Abduo et al., 2013). In addition, it is important to emphasize that a single lateral occlusion
scheme did not exist for any model for the entire excursive path. Therefore, in accordance
with all the published clinical studies, true CGO or GFO seldom exists clinically (Woda et al.,
1979; Becker and Kaiser, 1993; Turp et al., 2008; Abduo et al., 2013), even after restoring the
dentition.
The dynamic nature of the lateral occlusion scheme at the different arch positions is attributed
to teeth morphological factors. In the initial phase of excursion, the cusps are articulated
against wider fossa surfaces (Schuyler, 1963). As excursion progresses the total contact area
reduces, thus more teeth will be discluded. The pattern of lateral occlusion scheme alteration
with different excursion was observed for the pre-treatment and wax-up models. However,
the wax-up models had more consistent gradual occlusion scheme changes. This might be due

206
to the pre-treatment dentitions suffering from morphological abnormalities, such as tooth
wear or failed restorations. Subsequently, a wider contact area between worn down teeth
might be evident and will maintain a greater number of contacts, even after maximal excursion
(Beyron, 1954). Whereas the dentitions of the wax-up models had restored natural dental
morphology and less prominent wear facets, which can produce steeper articulation and cause
a consistent reduction of the total number of tooth contacts during excursion. This was
evident in the initial phases of excursion (0.5-1.0 mm) where the contacts quantity was
significantly greater for the two wax-up models than at the later stages of excursion. In
addition, it was clear that the proportion of CGO at later stages of excursion was greater for
the two wax-ups than the pre-treatment models. This was also likely to be related to restoring
the cuspal morphology of the canines to the original canine morphologies. The studies that
evaluated the implication of individual age on excursion scheme confirmed that the younger
the individual, the greater the prevalence of CGO (Panek et al., 2008; Abduo et al., 2013). This
was attributed to the prominent dental morphology and less cuspal wear of the young
dentitions (Panek et al., 2008; Abduo et al., 2013). Following the prosthodontic planning, it was
clear that the frequency of the canine contact was increased, followed primarily by the first
premolars. This was attributed to restoring the original canine cuspal morphology, while the
canines of pre-treatment models suffered from greater tooth wear (Beyron, 1954). Therefore,
it could be speculated that the planned prosthodontic treatment can return the dentition
occlusion scheme closer to what is expected to be the original state.
After comparing the two wax-ups there was an overall similarity in the static and lateral
occlusion schemes. Therefore, the hypotheses that there is no difference between the
conventional and digital wax-up in relation to static and dynamic occlusal relationships were
accepted. For the static occlusion, there is tendency for the digital wax-up to exhibit greater
contact number than the conventional wax-ups, while for the contact area, the conventional
wax-up was associated with greater area. However, the difference was not statistically
significant. Likewise, the two wax-ups induced similar prevalence of the lateral occlusion
scheme and the pattern of occlusal contacts frequency. However, the digital wax-up appeared
to have an exaggerated role of the canine teeth from the greater frequency of canine contacts.
Yet, this difference was not to a statistical significant level. The observed slight difference is
most likely related to the differences between the occlusal morphology generated by each
wax-up. The dental morphologies that can be attained digitally by the software tend to be well
defined (Mehl et al., 2005a). As the digital wax-up utilizes an average tooth form, the final
tooth morphology tends to exhibit more defined and steeper anatomical features (Ender et al.,
2011). This means greater cuspal angle, more pointy cusps and deeper grooves and fossae

207
(Figure 12-2). The more defined occlusal anatomy could explain the greater contact number
and the lower area of the posterior teeth for the digital wax-up models that was observed in
the current study. Further, the greater prevalence of CGO tends to develop with more defined
canine anatomy. Therefore, in terms of occlusion rehabilitation, it is reasonable to state that
the two wax-ups generated a similar outcome.
A B
Figure 12-2 Examples of digital (A) maxillary and (B) mandibular posterior teeth that illustrate the well-defined occlusal anatomy.
Despite the lack of a significant statistical difference between the two wax-up protocols
applied in this study, it is important to reinforce that the digital wax-up is still in its early phase
of application and requires additional investigation. For example, this study did not consider
non-working side contacts, which could influence the observed lateral occlusion scheme. The
omission of observing the non-working side contacts was necessary, as virtual modelling of the
condylar movement is very imprecise (Schierz et al., 2014). Several authors had acknowledged
that one of the limitations of the available CAD/CAM systems is lack of a reliable virtual
articulation system that can simulate dynamic motion (Kordass et al., 2002; Rohrle et al., 2009;
Koralakunte and Aljanakh, 2014). To overcome this problem, few reports on virtual articulators
were published with promising outcome (Kordass et al., 2002; Fang and Kuo, 2008;
Solaberrieta et al., 2013; Solaberrieta et al., 2014b). Yet, after comparing the virtual
articulation with the conventional articulation, greater deviation in the dynamic motion was
observed with the virtual articulation (Solaberrieta et al., 2014a). As a result the authors had
concluded that the level of accuracy of the virtual articulator in simulating dynamic motion
might be acceptable for orthodontic treatment, but not for prosthodontic treatment
(Solaberrieta et al., 2014a).

208
12.3. Accuracy
The precision of digital dentistry has been an interest since the introduction of this technology.
For it to be accepted, it has to exhibit similar accuracy to conventional protocol. Digital
dentistry is thought to have the advantage of omitting several steps, which will reduce the
inaccuracy contributed from each step. In this research project, the accuracy was evaluated at
two levels: gingival and occlusal levels. Both of these levels dictate the treatment outcome,
usability of the wax-up and transferring the information intra-orally. Good wax-up will ensure
accurate evaluation and minimal adjustments.
12.3.1. Gingival accuracy
The gingival accuracy was evaluated in this research as it represents the effect of wax-up on
the unaltered surface. The digital protocol is more accurate than the conventional protocol
(Abduo et al., 2014a). This difference is most likely mathematical and related to the method of
accuracy evaluation. The conventional wax-up required additional steps such as model
duplication and subsequent scanning. The additional material and steps will inevitably add
errors in the form of dimensional changes (DeLong et al., 2003). On the contrary, the digital
wax-up was conducted directly on the virtual pre-treatment model, which will reduce the
chance of inaccuracies. Nevertheless, despite the statistical difference, the actual difference is
minimal which might not have a clinical implication. As a result, the hypothesis that the
precision of the two wax-ups is similar can be accepted in relation to the gingival tissues.
On the other hand, the digital wax-up appears to be more deficient in locating the wax-up
margin than the conventional wax-up. This was observed from the contour study, where the
contour increase was greater on the gingival margin for the digital wax-up than for the
conventional wax-up. Locating the restoration margin on virtual mesh was reported to
invariably lead to a slight deviation from the exact gingival margin (Abduo et al., 2010). This
might contribute to greater inconsistency of the contour alteration of the digitally modified
teeth. Some investigators reported that a possible consequence of this limitation is the
marginal discrepancy of the digitally produced crowns in comparison to the conventionally
produced crowns (Tan et al., 2008; Han et al., 2011). On the contrary, the conventional wax-up
is based on actual and tactile feeling of the gingival margin which could lead to a more
accurate outcome.

209
12.3.2. Occlusion accuracy
From the occlusal perspective, the digital wax-up had greater inaccuracy than the conventional
wax-up. Therefore, the hypothesis that there is no difference between conventional and digital
wax-ups in relation to occlusion precision is rejected. The greater discrepancy of the digital
wax-up is very likely to be related to the mathematical determination of the dental anatomy.
The external surface of the digital teeth is formed of vertices connected by accumulating
triangles of polygonal mesh. This polygonal mesh is composed of flat triangles which
approximate the curved surfaces of the dental restoration. Although the polygonal mesh is
necessary to virtually modify the dental anatomy, it could introduce some discrepancies in the
approximation of curves. The effect of the polygonal mesh is further accentuated by the
presence of prominent curvature of the teeth which is evident with the digital wax-up (Pfeiffer,
1999; Luthardt et al., 2002). Further, it is likely for the opposing meshes to overlap during the
digital modelling as opposed to the actual determination of the occlusal contacts on
conventional wax-up. Many researchers have developed computer algorithmic systems for
tooth surface design (Paulus et al., 1999; Mehl et al., 2005a; b; Ender et al., 2011). In
accordance with the outcome of this research, regardless of the tooth modification technique,
virtual reconstruction generally was found to cause up to 0.5 mm vertical discrepancies of the
completed restoration and in many cases, the operator is expected to manually adjust the
occlusal contacts (Ender et al., 2011). Therefore, although the digital wax-up anatomy is very
natural and well-defined, it might be responsible for greater occlusal discrepancies. In
addition, as the digital wax-ups are yet to be produced by CAM processes, the accumulated
final inaccuracy will be greater to what has been observed in this study. The problem of further
processing of the digital wax-up will be discussed in the following section. Nevertheless, since
in clinical practice the wax-ups are used primarily for provisional restorations, minor occlusal
discrepancies can be modified easily in the clinic, with no major consequences on the
definitive prostheses (Magne and Douglas, 1999a; b; Magne and Belser, 2004).
12.3.3. Digital processing precision
The rationale of digital protocol in reducing the inaccuracy by omitting manufacturing steps
and reducing materials is logical, however, it is strongly dependent on the involved steps. The
adequacy of the digital model is largely dependent on the reliability of the scanning procedure.
The scanning procedure and the surface generation are associated with some discrepancies
(Persson et al., 2006). The virtual model will initially be represented as a point cloud that is
used to form the model boundary representation. The reconstruction procedure commences
as the adjacent points are connected with straight lines using fitting algorithms. Eventually, a

210
continuous surface is obtained in the form of triangulated mesh or polygonal 3D model. Still, at
this stage, the surface suffers from noise that requires elimination, which might further
influence the surface accuracy. Curved surfaces are represented with numerous flat surfaces.
True mathematical sphere can then be obtained by extrapolating the points according to the
algorithmic principle of curve of best fit (Willer et al., 1998; Pfeiffer, 1999; Luthardt et al.,
2002) to form the surface boundary. Therefore, in principles, the greater the vertices recorded
for the point cloud, the closer the curve of best fit represents the overall morphology (Rudolph
et al., 2007). Further, exaggerated curvature is prone to greater loss of details.
The initially scanned image is very complex, detailed and with an enormous size, which makes
its manipulation very difficult. To enhance the software performance, the virtual model can be
simplified by a process of decimation (Willer et al., 1998; Persson et al., 2006), whereby the
number of points is selectively reduced to minimise the overall size of the 3D polygonal image.
The effect of the decimation is more prominent on flat surfaces where less number of points is
needed compared to curved surfaces. Therefore, while reducing the image size, the overall
geometry of the polygonal 3D model is not affected (Figure 12-3A, 3B, 3C and 3D). The
drawback of excessive decimation is the possibility of virtual rounding the sharp edges and the
actual surface irregularities which will cause inaccuracy of the virtual model (Figure 12-3E)
(Willer et al., 1998; Persson et al., 2006).
A
B

211
C
D
E
Figure 12-3 An example of the effect of dental model simplification. (A) The originally scanned model is composed of dense points. (B) The model after 50% decimation. (C), 25% decimation. (D) 12.5% decimation. (E) 6.75% decimation model. The decimation primarily affects flat surfaces. Excessive decimation causes greater the loss in the resolution.
Even after the completion of the digital wax-up by the software, it has to be produced into a
physical model. Once the digital wax-up model is completed by the software, the data is
transferred to a CAM software that controls the production unit. The aim of CAM process is to
produce an accurate model as represented by the software. Actual model can be produced by
subtractive or additive manufacturing.

212
Subtractive manufacturing is based on milling the workpiece from a larger blank by a computer
numeric controlled (CNC) machine. The CAM software automatically translates the CAD model
into tool path for the CNC machine. This involves computation of the commands series that
dictate the CNC milling, including sequencing, milling tools, and tool motion direction and
magnitude (Rekow et al., 1991). Due to the unevenness of the features of dental morphology,
the milling machines combine burs with different sizes. The accuracy of tool positioning has
been reported to be within 10 µm (Rekow et al., 1991). The CAM software also incorporates
compensation steps for the cutter tool diameter which ensures that the milling bur reaches
the desired surface without sacrificing necessary segment of the workpiece (Rekow et al.,
1991; Ortorp et al., 2011). The dental CNC machines are composed of multiaxis milling devices
to facilitate the 3D milling of dental workpieces.
A key advantage of milling is ensuring the durability of the workpiece since it is milled from an
industrial grade blank. Milling can reduce fabrication flaws in dental prostheses, by relying
more on the tighter quality control processing of the material manufacturer rather than
commercial laboratory (Rekow and Thompson, 2005) so that manufacturing deficiencies, such
as porosities and inhomogeneous consistency, are reduced (Sadan et al., 2005; Denry and
Kelly, 2008; Abduo and Lyons, 2013). On the other hand, milling was found to be associated
with surface damage in the form of surface micro-fractures, chipping defects, and altered
surface quality (Sindel et al., 1998; Ezugwu et al., 2003; Abele and Frohlich, 2008; Rekow et al.,
2011) and could constitute a point for crack propagation within the restoration under occlusal
forces (Sindel et al., 1998). The cutting conditions also cause excessive vibrations, especially in
thin edges (Terminasov and Yokhontov, 1959). The extent of the damage is dependent on the
material of the workpiece (Xu et al., 1998) and ranges from 15 to 60 µm (Sindel et al., 1999;
Luthardt et al., 2004; Kim et al., 2010).
The accuracy of digital dentistry has been heavily evaluated by quantifying the fit of digitally
produced dental restorations in comparison with conventional restoration. There is an overall
tendency for the restorations produced by conventional methods to exhibit better fit than
milled restorations. This applies to milled metal (Tan et al., 2008; Han et al., 2011) and ceramic
restorations (Abduo et al., 2010; Aboushelib et al., 2012). The production of the fine details by
milling is largely dependent on the diameter of the smallest milling bur which is normally
about 1 mm (Rekow et al., 1991; Beuer et al., 2008; Ortorp et al., 2011); however, smaller
diameter milling burs do not appear to produce fine detail for accuracy (Bornemann et al.,
2002; Tinschert et al., 2004). Ortorp et al. reported that, in order to mill the angle with a
diameter less than the diameter of the smallest fitting bur, a drill compensation feature has to

213
be incorporated within the software to provide room for the bur movement (Figure 12-4)
(Ortorp et al., 2011).
A B E
Figure 12-4 The effect of bur diameter in line angle production. (A) Sharp virtual line angle cannot be produced by rounded bur. Therefore, surface inaccuracy will occur on the milled restoration in the form of (B) negative error after over-milling of the sharp corner, or (C) positive error after under-milling of the sharp corner.
Additive manufacturing systems have recently been introduced as a method to construct
dental models and defined as the process of joining materials to make objects from 3D model
data, usually layer upon layer (Webb, 2000; Davis, 2010; van Noort, 2012). Once the CAD
design is finalized, it is segmented into multislice images. For each millimetre of material, there
are 5–20 layers, which the machine lays down as successive layers of liquid or powder material
that are fused to create the final shape. This is followed by workpiece refinement to remove
the excess materials and supporting arms. Similar to the subtractive systems, a form of CNC
machine is used with a processing head that moves in two axes (𝑥- and 𝑧-axes) and the
specimen platform or the processing head moves in the vertical axis (𝑦-axis) (Choi and Chan,
2004; Choi and Cheung, 2005).
Originally, the additive manufacturing methods were implemented to fabricate prototype
models and patterns with reliable accuracy and repeatability that could be produced in a short
time. In prosthodontics, additive manufacturing can fabricate a preproduction pattern (wax or
plastic) that can be transformed to definitive workpieces in metals, resins, or ceramics (Webb,
2000; Davis, 2010; van Noort, 2012). The application of additive manufacturing in dentistry is
useful due to its ability to produce a variety of shapes that conform to any biological shape,
such as teeth. The additive systems used in dentistry are stereolithography, selective laser
sintering or melting, and 3D printing. Regardless of the method, all share the following
features that distinguish them from subtractive manufacturing:

214
Incremental vertical object build-up.
No material wastage.
Large objects production.
Passive production (i.e., no force application).
Fine details production.
These features make them ideal methods for dental models fabrication. The dental models can
be produced by stereolithography or 3D printing. Stereolithography produces the solid layers
using a concentrated ultraviolet light beam that moves on a curable liquid polymer pool. As
the first layer is polymerized, a platform is lowered a few microns and the next layer is cured.
This process is repeated until the whole solid object is completed. The object is then rinsed
with a solvent and placed in an ultraviolet oven to thoroughly cure the resin. In dentistry,
stereolithography is routinely used to produce resin objects such as surgical templates, facial
prosthesis patterns, occlusal splints, burnout resin patterns, and investing flasks (Chang et al.,
2006; Mandelaris and Rosenfeld, 2008; Bi et al., 2013; Salmi et al., 2013).
3D printing extrudes material from a nozzle that solidifies as soon as it is deposited on the
manufacturing platform. The layer pattern is achieved through horizontal nozzle movement
and interrupted material flow. This is followed by vertical movement for the sequential layer
deposition. There are a range of materials that can be used for 3D printing. This includes
thermoplastic materials, such as waxes, resins, or fused filament, which pass through a heated
nozzle and solidifies immediately after extrusion. Alternatively, liquid ceramic or resin
materials with a binder can be printed (Sun et al., 2009; Inokoshi et al., 2012), which, following
deposition, solidifies immediately (Ebert et al., 2009; Silva et al., 2011). Some systems also
allow for multicolour production (Inokoshi et al., 2012). This approach is used in dentistry to
fabricate dental models, facial prosthesis patterns, acrylic prostheses, investing flasks, and
castable or ceramic frameworks (Sun et al., 2009; Silva et al., 2011; Inokoshi et al., 2012).
In comparison to subtractive processing, this method is more economical since it does not
result in any material wastage, and any unused material is completely reusable for future
processing (Webb, 2000; Davis, 2010). In addition, there is minimal restriction on the ability to
fabricate large workpieces (such as whole arch model), which is not the case with subtractive
methods that are more suitable for smaller workpieces (Chen et al., 1997; Runte et al., 2002;
Feng et al., 2010a). Additive manufacturing also allows the fabrication of workpieces with
different consistencies and material properties (Ebert et al., 2009).
Among the advantages of additive manufacturing is the ability to produce customized models
that represent patient hard and/or soft tissues (Webb, 2000; Davis, 2010). The workpieces can

215
include detailed morphology, sharp corners, undercuts, or voids. Because no drilling tool is
involved, no compensation feature is required as is necessary for the subtractive
manufacturing. Further, the whole production process is passive and involves no force
application. However, due to the production procedure, which involves sequential layering,
the external surface tends to have stepped and coarse morphology representing each
fabrication layer along the construction direction (Choi and Chan, 2004). Such stepping
adversely affects the surface texture and the overall dimensional accuracy of the workpiece
(Choi and Chan, 2004), which might influence the surface quality (Williams et al., 2004;
Williams et al., 2006) (Figure 12-5). The vertical walls were minimally affected by stepping
while the corrugated or sloping surfaces are more prominently influenced (Vandenbroucke
and Kruth, 2007). Therefore, concerns were raised regarding the accuracy of the occlusal
surface of prostheses produced using this technique (Silva et al., 2011). The accuracy of
additive technique is dependent on layer thickness and the width of curing beam. The thinner
the layers and the narrower the curing beam, the more accurate the final product; however,
increasing the number of layers and reducing the diameter of the beam will exponentially
increase the fabrication time (Kathuria, 1999; Khaing et al., 2001; Choi and Chan, 2004).
A B C D
Figure 12-5 The effect of layered production on the surface accuracy. (A) Smooth surface is ideal for dental models. (B) Thick layers will increase the prominence of surface stepping. (C and D) As the layers thickness is reduced the surface accuracy will increase. The corrugated surface (occlusal surface) is more affected by the steps than the vertical surfaces.
In the dental literature, there are a limited number of studies that have evaluated the accuracy
of prostheses fabricated by additive manufacturing. Salmi et al. reported the dimensional
accuracy of occlusal splits fabricated by stereolithography to be 0.3 mm (Salmi et al., 2013). In
relation to 3D printing, Ebert et al. reported that this method allows the fabrication of very
accurate ceramic workpieces (Ebert et al., 2009), and the production of sections of 100 µm is
feasible. Silva et al. reported that the tolerance of the fabricated workpiece is less than 25 µm
(Silva et al., 2011). In comparison, an evaluation of the dimensional errors of printed dentures
found a mean deviation of 5 µm, but dimensional distortions of up to several 100 µm were
detected (Inokoshi et al., 2012). With regular advancement and development in these
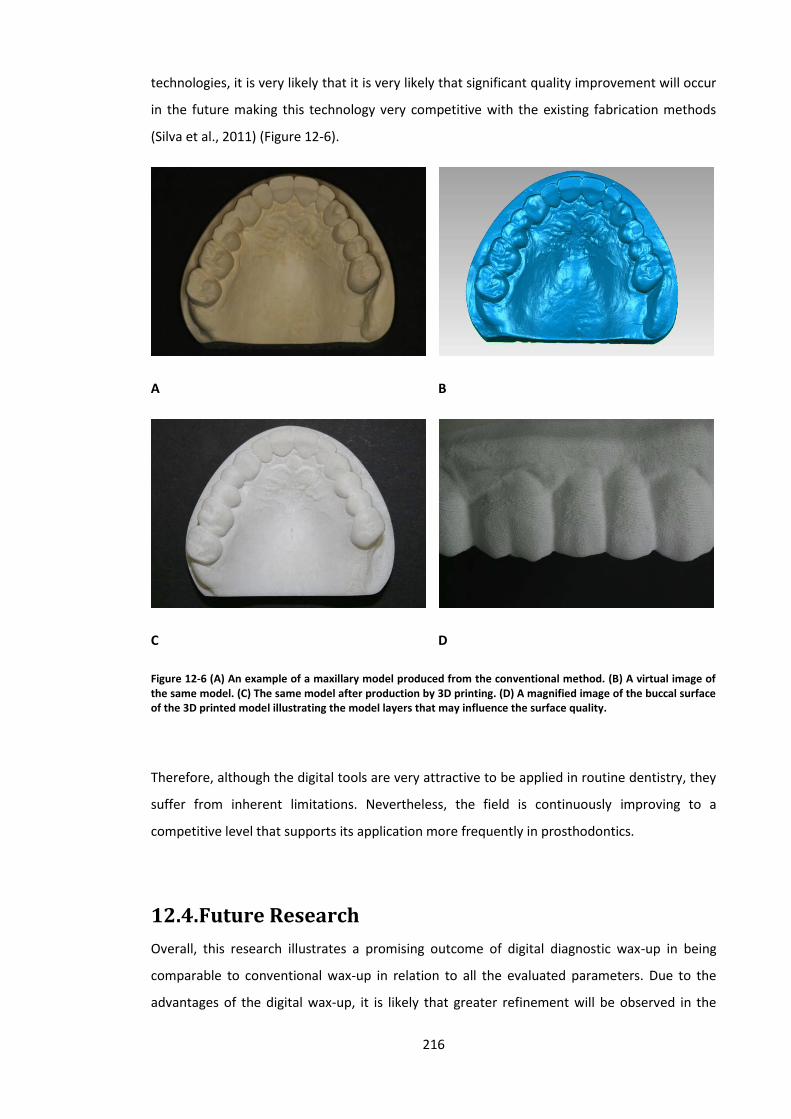
216
technologies, it is very likely that it is very likely that significant quality improvement will occur
in the future making this technology very competitive with the existing fabrication methods
(Silva et al., 2011) (Figure 12-6).
A B
C D
Figure 12-6 (A) An example of a maxillary model produced from the conventional method. (B) A virtual image of the same model. (C) The same model after production by 3D printing. (D) A magnified image of the buccal surface of the 3D printed model illustrating the model layers that may influence the surface quality.
Therefore, although the digital tools are very attractive to be applied in routine dentistry, they
suffer from inherent limitations. Nevertheless, the field is continuously improving to a
competitive level that supports its application more frequently in prosthodontics.
12.4. Future Research
Overall, this research illustrates a promising outcome of digital diagnostic wax-up in being
comparable to conventional wax-up in relation to all the evaluated parameters. Due to the
advantages of the digital wax-up, it is likely that greater refinement will be observed in the

217
future. While the outcome of digital wax-up is promising, recommendations to alter the
current protocol should be based on additional evidence. The research field will benefit from
further experimentation in three aspects: clinical appraisal, protocol validation and innovative
improvements.
Clinically, the performance and the advantages of the digital wax-up should be evaluated. This
will clinically validate the pros and cons of the digital wax-up that were observed in this study,
and will determine the clinical significance of the differences detected between the two wax-
up protocols. This series of experiments provided an outcome of objective analyses of
accuracy, occlusion and aesthetics. However, as discussed earlier, individuals vary in their
perception of their dentitions in terms of comfort and appearance. Thus, future subjective
investigations are necessary to evaluate the actual impact of digital planning and treatment on
the masticatory system and adaptation. Further, it is of necessity to analyse the subjective
patient appraisal of the aesthetic. This is best evaluated by a patient preference survey on
dental aesthetics following each wax-up.
Protocols involving digital dentistry should be evaluated for practicality and cost-effectiveness.
While it is tempting to utilize digital technology, it is known that the involved equipment
requires a significant initial investment. Alternatively, clinicians may opt to outsourcing some
of the digital protocol steps and the computer-aided production using commercially available
systems. Nevertheless, the question remains, will digital wax-up be more convenient and
efficient than conventional wax-up? Factors that can influence the practicality and cost-
effectiveness of the digital wax-up are the complexity of the case, the number of involved
teeth and access to a digital laboratory.
Recently, more innovative applications of digital dentistry have been suggested. For example,
digital modelling can be further exploited by the incorporation of digital colouring and digital
tooth shade determination (van Noort, 2012). This will provide additional simplification and
predictability of the clinical protocol. In addition, with the aid of the software, mathematical
modelling can be employed to select the best prosthesis material and design. At the industrial
level, digital manufacturing systems are now available to produce a workpiece from different
materials. It is not unlikely for such technologies to be utilized to produce dental prostheses
from multiple materials in the near future.

218
12.5. Conclusions
In conclusion, this research confirms the implications of diagnostic wax-up on teeth contours,
aesthetics and occlusion. Following the wax-up procedure, the dentition is restored to a state
that is close to the benchmark condition. After comparing the digital wax-up to the
conventional wax-up, the following points can be concluded:
Overall, the two wax-ups are very similar in relation to precision, contour, static occlusion,
lateral occlusion and aesthetics.
At the virtual level, the digital wax-up is slightly more accurate than the conventional wax-
up around the gingival tissues. This observation is yet to be confirmed after physical
production of the digital wax-up model. However, for the occlusion, the digital modelling
appears to be slightly more deficient in obtaining accurate occlusal contacts than the
conventional wax-up.
The digital wax-up had caused more axial contour increase than the conventional wax-up.
Yet, the magnitude of this difference is minimal.
In relation to the intercuspal occlusal contact number and area, the two wax-ups had
yielded similar outcome. Similarly, the lateral occlusal relationship was similarly affected
by the two wax-ups.
In relation to the evaluated aesthetic variables, the digital wax-up had the advantage of
the ease of obtaining natural and symmetrical appearance.

219
References
Abduo J, Lyons K, Swain M (2010). Fit of zirconia fixed partial denture: a systematic review. J Oral Rehabil 37:866-876. Abduo J (2011). An innovative prostheses design for rehabilitation of severely mutilated dentition: a case report. J Adv Prosthodont 3:37-42. Abduo J (2012). Virtual prosthodontic planning for oral rehabilitation: a pilot study. New trends of computational intellegence in health applications. Sydney:34-42. Abduo J, Lyons K (2012). Clinical considerations for increasing occlusal vertical dimension: a review. Aust Dent J 57:2-10. Abduo J, Bennamoun M (2013). Three-dimensional image registration as a tool for forensic odontology: a preliminary investigation. Am J Forensic Med Pathol 34:260-266. Abduo J, Lyons K (2013). Rationale for the use of CAD/CAM technology in implant prosthodontics. Int J Dent 768121. Abduo J, Tennant M, McGeachie J (2013). Lateral occlusion schemes in natural and minimally restored permanent dentition: a systematic review. J Oral Rehabil 40:788-802. Abduo J, Bennamoun M, Tennant M, McGeachie J (2014a). Precision of Digital Prosthodontic Planning for Oral Rehabilitation. Br J Appl Sci Technol 4:3915-3929. Abduo J, Lyons K, Bennamoun M (2014b). Trends in computer-aided manufacturing in prosthodontics: a review of the available streams. Int J Dent 783948. Abekura H, Tokuyama H, Hamada T, Morimoto T (1996). Comfortable zone of the mandible evaluated by the constant stimuli method. J Oral Rehabil 23:330-335. Abele E, Frohlich B (2008). High speed milling of titanium alloys. APEM 3:131-140. Aboushelib MN, Elmahy WA, Ghazy MH (2012). Internal adaptation, marginal accuracy and microleakage of a pressable versus a machinable ceramic laminate veneers. J Dent 40:670-677. Ahmad I (2010). Risk management in clinical practice. Part 5. Ethical considerations for dental enhancement procedures. Br Dent J 209:207-214. Akoren AC, Karaagaclioglu L (1995). Comparison of the electromyographic activity of individuals with canine guidance and group function occlusion. J Oral Rehabil 22:73-77. Al-Ani Z, Gray RJ, Davies SJ, Sloan P, Glenny AM (2005). Stabilization splint therapy for the treatment of temporomandibular myofascial pain: a systematic review. J Dent Edu 69:1242-1250. Al-Hiyasat AS, Abu-Alhaija ES (2004). The relationship between static and dynamic occlusion in 14-17-year-old school children. J Oral Rehabil 31:628-633. Al-Khayatt AS, Ray-Chaudhuri A, Poyser NJ, Briggs PF, Porter RW, Kelleher MG et al. (2013). Direct composite restorations for the worn mandibular anterior dentition: a 7-year follow-up of a prospective randomised controlled split-mouth clinical trial. J Oral Rehabil 40:389-401. Al-Nimri KS, Bataineh AB, Abo-Farha S (2010). Functional occlusal patterns and their relationship to static occlusion. Angle Orthod 80:65-71. Ali Fayyad M, Jamani KD, Agrabawi J (2006). Geometric and mathematical proportions and their relations to maxillary anterior teeth. J Contemp Dent Pract 7:62-70. Alkan A, Keskiner I, Arici S, Sato S (2006). The effect of periodontitis on biting abilities. J Periodontol 77:1442-1445. Ambard A, Mueninghoff L (2002). Planning restorative treatment for patients with severe Class II malocclusions. J Prosthet Dent 88:200-207.

220
Andersson M, Carlsson L, Persson M, Bergman B (1996). Accuracy of machine milling and spark erosion with a CAD/CAM system. J Prosthet Dent 76:187-193. Attin T, Filli T, Imfeld C, Schmidlin PR (2012). Composite vertical bite reconstructions in eroded dentitions after 5.5 years: a case series. J Oral Rehabil 39:73-79. Ayoub AF, Wray D, Moos KF, Jin J, Niblett TB, Urquhart C et al. (1997). A three-dimensional imaging system for archiving dental study casts: a preliminary report. Int J Adult Orthodon Orthognath Surg 12:79-84. Baba K, Akishige S, Yaka T, Ai M (2000). Influence of alteration of occlusal relationship on activity of jaw closing muscles and mandibular movement during submaximal clenching. J Oral Rehabil 27:793-801. Basting RT, da Trindade Rde C, Florio FM (2006). Comparative study of smile analysis by subjective and computerized methods. Oper Dent 31:652-659. Becker CM, Kaldahl WB (1981). Current theories of crown contour, margin placement, and pontic design. J Prosthet Dent 45:268-277. Becker CM, Kaiser DA (1993). Evolution of occlusion and occlusal instruments. J Prosthodont 2:33-43. Becker CM, Kaiser DA, Schwalm C (2000). Mandibular centricity: centric relation. J Prosthet Dent 83:158-160. Bell A, Ayoub AF, Siebert P (2003). Assessment of the accuracy of a three-dimensional imaging system for archiving dental study models. J Orthod 30:219-223. Belser UC, Hannam AG (1985). The influence of altered working-side occlusal guidance on masticatory muscles and related jaw movement. J Prosthet Dent 53:406-413. Berry DC, Poole DF (1976). Attrition: possible mechanisms of compensation. J Oral Rehabil 3:201-206. Besimo CE, Rohner HP (2005). Three-dimensional treatment planning for prosthetic rehabilitation. Int J Periodontics Restorative Dent 25:81-87. Besl PJ, McKay ND (1992). A method for registration of 3-D shapes. IEEE T Pattern Anal 14:239-256. Beuer F, Schweiger J, Edelhoff D (2008). Digital dentistry: an overview of recent developments for CAD/CAM generated restorations. Br Dent J 204:505-511. Beyron H (1964). Occlusal Relations and Mastication in Australian Aborigines. Acta Odontol Scand 22:597-678. Beyron HL (1954). Occlusal changes in adult dentition. J Am Dent Assoc 48:674-686. Bi Y, Wu S, Zhao Y, Bai S (2013). A new method for fabricating orbital prosthesis with a CAD/CAM negative mold. J Prosthet Dent 110:399-408. Bootvong K, Liu Z, McGrath C, Hagg U, Wong RW, Bendeus M et al. (2010). Virtual model analysis as an alternative approach to plaster model analysis: reliability and validity. Eur J Orthod 32:589-595. Bornemann G, Lemelson S, Luthardt R (2002). Innovative method for the analysis of the internal 3D fitting accuracy of Cerec-3 crowns. Int J Comput Denti 5:177-182. Broadbent JM, Williams KB, Thomson WM, Williams SM (2006). Dental restorations: a risk factor for periodontal attachment loss? J Clin Periodontol 33:803-810. Brunzel S, Kern M, Freitag S, Wolfart S (2006). Aesthetic effect of minor changes in incisor angulation: an internet evaluation. J Oral Rehabil 33:430-435. Bryant SR (2003). The rationale for management of morphologic variations and nonphysiologic occlusion in the young dentition. Int J Prosthodont 16:75-77. Burch JG, Miller JB (1973). Evaluating crown contours of a wax pattern. J Prosthet Dent 30:454-458. Burnett CA, Clifford TJ (1992). A preliminary investigation into the effect of increased occlusal vertical dimension on mandibular movement during speech. J Dent 20:221-224.

221
Buschang PH, Throckmorton GS, Austin D, Wintergerst AM (2007). Chewing cycle kinematics of subjects with deepbite malocclusion. Am J Orthod Dentofacial Orthop 131:627-634. Camargo PM, Melnick PR, Kenney EB (2001). The use of free gingival grafts for aesthetic purposes. Periodontol 2000 27:72-96. Campillo MJ, Miralles R, Santander H, Valenzuela S, Fresno MJ, Fuentes A et al. (2008). Influence of laterotrusive occlusal scheme on bilateral masseter EMG activity during clenching and grinding. Cranio 26:263-273. Carlsson GE, Ingervall B, Kocak G (1979). Effect of increasing vertical dimension on the masticatory system in subjects with natural teeth. J Prosthet Dent 41:284-289. Carlsson GE (2009). Dental occlusion: modern concepts and their application in implant prosthodontics. Odontology 97:8-17. Carlsson GE (2010). Some dogmas related to prosthodontics, temporomandibular disorders and occlusion. Acta Odontol Scand 68:313-322. Carr AB, Laney WR (1987). Maximum occlusal force levels in patients with osseointegrated oral implant prostheses and patients with complete dentures. Int J Oral Maxillofac Implants 2:101-108. Cassetta M, Stefanelli LV, Giansanti M, Calasso S (2012). Accuracy of implant placement with a stereolithographic surgical template. Int J Oral Maxillofac Implants 27:655-663. Chang CC, Lee MY, Wang SH (2006). Digital denture manufacturing-an integral technologies of abrasive computer tomography, CNC machining and rapid prototyping. Int J Adv Manuf Technol 31:41-49. Chen LH, Tsutsumi S, Iizuka T (1997). A CAD/CAM technique for fabricating facial prostheses: a preliminary report. Int J Prosthodont 10:467-472. Chen YW, Raigrodski AJ (2008). A conservative approach for treating young adult patients with porcelain laminate veneers. J Esthet Restor Dent 20:223-236. Choi SH, Chan AMM (2004). A virtual prototyping system for rapid product development. Computer-Aided Design 36:401-412. Choi SH, Cheung HH (2005). A multi-material virtual prototyping system. Computer-Aided Design 37:123-136. Christensen J (1970). Effect of occlusion-raising procedures on the chewing system. Dent Pract Dent 20:233-238. Christensen LV (1981). Jaw muscle fatigue and pains induced by experimental tooth clenching: a review. J Oral Rehabil 8:27-36. Christensen LV, Rassouli NM (1995a). Experimental occlusal interferences. Part I. A review. J Oral Rehabil 22:515-520. Christensen LV, Rassouli NM (1995b). Experimental occlusal interferences. Part II. Masseteric EMG responses to an intercuspal interference. J Oral Rehabil 22:521-531. Ciancaglini R, Gherlone EF, Redaelli S, Radaelli G (2002). The distribution of occlusal contacts in the intercuspal position and temporomandibular disorder. J Oral Rehabil 29:1082-1090. Ciocca L, Scotti R (2004). CAD-CAM generated ear cast by means of a laser scanner and rapid prototyping machine. J Prosthet Dent 92:591-595. Cohen BD (1995). The use of orthodontics before fixed prosthodontics in restorative dentistry. Compendium 16:110-114. Critical Appraisal Skills Programme (CASP): Critical Appraisal Checklists. http://wwwcasp-uknet/. Croll BM (1989). Emergence profiles in natural tooth contour. Part I: Photographic observations. J Prosthet Dent 62:4-10.

222
Crothers A, Sandham A (1993). Vertical height differences in subjects with severe dental wear. Eur J Orthod 15:519-525. Curry FT (1998). Porcelain veneers: adjunct or alternative to orthodontic therapy. J Esthet Dent 10:67-74. Cutbirth ST (2001). Treatment planning for porcelain veneer restoration of crowded teeth by modifying stone models. J Esthet Restor Dent 13:29-39. D'Amico (1961). Functional occlusion of the natural teeth of man. J Prosthet Dent 11:899-915. Dahl BL, Krogstad O (1982). The effect of a partial bite raising splint on the occlusal face height. An x-ray cephalometric study in human adults. Acta Odontol Scand 40:17-24. Dahl BL, Krogstad O (1985). Long-term observations of an increased occlusal face height obtained by a combined orthodontic/prosthetic approach. J Oral Rehabil 12:173-176. Dalstra M, Melsen B (2009). From alginate impressions to digital virtual models: accuracy and reproducibility. J Orthod 36:36-41. Dao TT, Lavigne GJ (1998). Oral splints: the crutches for temporomandibular disorders and bruxism? Crit Rev Oral Biol Med 9:345-361. Darveniza M (2001). Full occlusal protection--theory and practice of occlusal therapy. Aust Dent J 46:70-79. Davies S, Gray RM (2001). What is occlusion? Br Dent J 191:235-238. Davies SJ, Gray RM, Whitehead SA (2001). Good occlusal practice in advanced restorative dentistry. Br Dent J 191:421-424. Davis BK (2010). The role of technology in facial prosthetics. Curr Opin Otolaryngol Head Neck Surg 18:332-340. Davis GR, Tayeb RA, Seymour KG, Cherukara GP (2012). Quantification of residual dentine thickness following crown preparation. J Dent 40:571-576. De Backer H, Van Maele G, De Moor N, Van den Berghe L (2008). Long-term results of short-span versus long-span fixed dental prostheses: an up to 20-year retrospective study. Int J Prosthodont 21:75-85. De Boever JA, Carlsson GE, Klineberg IJ (2000a). Need for occlusal therapy and prosthodontic treatment in the management of temporomandibular disorders. Part II: Tooth loss and prosthodontic treatment. J Oral Rehabil 27:647-659. De Boever JA, Carlsson GE, Klineberg IJ (2000b). Need for occlusal therapy and prosthodontic treatment in the management of temporomandibular disorders. Part I. Occlusal interferences and occlusal adjustment. J Oral Rehabil 27:367-379. Delong R, Ko CC, Anderson GC, Hodges JS, Douglas WH (2002). Comparing maximum intercuspal contacts of virtual dental patients and mounted dental casts. J Prosthet Dent 88:622-630. DeLong R, Heinzen M, Hodges JS, Ko CC, Douglas WH (2003). Accuracy of a system for creating 3D computer models of dental arches. J Dent Res 82:438-442. Denry I, Kelly JR (2008). State of the art of zirconia for dental applications. Dent Mater 24:299-307. DiPietro GJ (1977). A study of occlusion as related to the Frankfort-mandibular plane angle. J Prosthet Dent 38:452-458. Donegan SJ, Christensen LV, McKay DC (1996). Canine tooth guidance and temporomandibular joint sounds in non-patients and patients. J Oral Rehabil 23:799-804. Donovan TE, Cho GC (2001). Predictable aesthetics with metal-ceramic and all-ceramic crowns: the critical importance of soft-tissue management. Periodontol 2000 27:121-130. Duret F, Preston JD (1991). CAD/CAM imaging in dentistry. Curr Opin Dent 1:150-154. Durgekar SG, K N, Naik V (2010). The ideal smile and its orthodontic implications. World J Orthod 11:211-220.

223
Ebert J, Ozkol E, Zeichner A, Uibel K, Weiss O, Koops U et al. (2009). Direct inkjet printing of dental prostheses made of zirconia. J Dent Res 88:673-676. Eckert SE (2009). An evidence-based approach to the study of the consequences of partial edentulism with and without prosthodontic interventions. Int J Prosthodont 22:511-512. Eggbeer D, Bibb R, Williams R (2005). The computer-aided design and rapid prototyping fabrication of removable partial denture frameworks. Proc Inst Mech Eng H 219:195-202. Ehrlich J, Hochman N (1980). Alterations on crown contour--effect on gingival health in man. J Prosthet Dent 44:523-525. Ehrlich J, Taicher S (1981). Intercuspal contacts of the natural dentition in centric occlusion. J Prosthet Dent 45:419-421. Ender A, Mormann WH, Mehl A (2011). Efficiency of a mathematical model in generating CAD/CAM-partial crowns with natural tooth morphology. Clin Oral Investig 15:283-289. Ezugwu EO, Bonney J, Yamane Y (2003). An overview of the machinability of aeroegine alloys. J Mater Process Tech 134:233-253. Fang JJ, Kuo TH (2008). Modelling of mandibular movement. Compute Biol Med 38:1152-1162. Faria AC, Rodrigues RC, Macedo AP, Mattos Mda G, Ribeiro RF (2008). Accuracy of stone casts obtained by different impression materials. Braz Oral Res 22:293-298. Farley NE, Kennedy K, McGlumphy EA, Clelland NL (2013). Split-mouth comparison of the accuracy of computer-generated and conventional surgical guides. Int J Oral Maxillofac Implants 28:563-572. Fasbinder DJ, Poticny DJ (2010). Accuracy of occlusal contacts for crowns with chairside CAD/CAM techniques. Int J Comput Dent 13:303-316. Felton DA, Kanoy BE, Bayne SC, Wirthman GP (1991). Effect of in vivo crown margin discrepancies on periodontal health. J Prosthet Dent 65:357-364. Feng Z, Dong Y, Zhao Y, Bai S, Zhou B, Bi Y et al. (2010a). Computer-assisted technique for the design and manufacture of realistic facial prostheses. Br J Oral Maxillofac Surg 48:105-109. Feng ZH, Dong Y, Bai SZ, Wu GF, Bi YP, Wang B et al. (2010b). Virtual transplantation in designing a facial prosthesis for extensive maxillofacial defects that cross the facial midline using computer-assisted technology. Int J Prosthodont 23:513-520. Gargiulo AW, Wentz FM, Orban B (1961). Dimensions and relations of the dentogingival junction in humans. J Periodontol 32:261-267. Gartner JL, Mushimoto K, Weber HP, Nishimura I (2000). Effect of osseointegrated implants on the coordination of masticatory muscles: a pilot study. J Prosthet Dent 84:185-193. Gavelis JR, Morency JD, Riley ED, Sozio RB (1981). The effect of various finish line preparations on the marginal seal and occlusal seat of full crown preparations. J Prosthet Dent 45:138-145. Gillen RJ, Schwartz RS, Hilton TJ, Evans DB (1994). An analysis of selected normative tooth proportions. Int J Prosthodont 7:410-417. The Glossary of Prosthodontic Terms. (2005). J Prosthet Dent 94:10-92. Goldstein GR (1979). The relationship of canine-protected occlusion to a periodontal index. J Prosthet Dent 41:277-283. Gonzalez Y, Iwasaki LR, McCall WD, Jr., Ohrbach R, Lozier E, Nickel JC (2011). Reliability of electromyographic activity vs. bite-force from human masticatory muscles. Eur J Oral Sci 119:219-224. Goodacre CJ, Campagni WV, Aquilino SA (2001). Tooth preparations for complete crowns: an art form based on scientific principles. J Prosthet Dent 85:363-376.

224
Goodacre CJ, Bernal G, Rungcharassaeng K, Kan JY (2003a). Clinical complications in fixed prosthodontics. J Prosthet Dent 90:31-41. Goodacre CJ, Bernal G, Rungcharassaeng K, Kan JY (2003b). Clinical complications with implants and implant prostheses. J Prosthet Dent 90:121-132. Goodacre CJ, Garbacea A, Naylor WP, Daher T, Marchack CB, Lowry J (2012). CAD/CAM fabricated complete dentures: concepts and clinical methods of obtaining required morphological data. J Prosthet Dent 107:34-46. Gough MB, Setchell DJ (1999). A retrospective study of 50 treatments using an appliance to produce localised occlusal space by relative axial tooth movement. Br Dent J 187:134-139. Gracis S, Fradeani M, Celletti R, Bracchetti G (2001). Biological integration of aesthetic restorations: factors influencing appearance and long-term success. Periodontol 2000 27:29-44. Gross MD, Ormianer Z (1994). A preliminary study on the effect of occlusal vertical dimension increase on mandibular postural rest position. Int J Prosthodont 7:216-226. Guevara PA, Ismail YH (1976). Prevalence of cuspid protected occlusal pattern in young adult males. J Dent Res 55:103. Gurel G (2007). Porcelain laminate veneers: minimal tooth preparation by design. Dent Clin North Am 51:419-431. Guth JF, Almeida ESJS, Ramberger M, Beuer F, Edelhoff D (2012). Treatment concept with CAD/CAM-fabricated high-density polymer temporary restorations. J Esthet Restor Dent 24:310-318. Gutierrez MF, Miralles R, Fuentes A, Cavada G, Valenzuela S, Santander H et al. (2010). The effect of tooth clenching and grinding on anterior temporalis electromyographic activity in healthy subjects. Cranio 28:43-49. Han HS, Yang HS, Lim HP, Park YJ (2011). Marginal accuracy and internal fit of machine-milled and cast titanium crowns. J Prosthet Dent 106:191-197. Han J, Wang Y, Lu P (2010). A preliminary report of designing removable partial denture frameworks using a specifically developed software package. Int J Prosthodont 23:370-375. Hancocks S (2011). The ethics of cosmetics. Br Dent J 211:501. Hannam AG, De Cou RE, Scott JD, Wood WW (1977). The relationship between dental occlusion, muscle activity and associated jaw movement in man. Arch Oral Biol 22:25-32. Hans M (2002). When will 3-dimensional (3D) imaging become practical in private practice? I enjoy using digital imaging now but wonder how quickly the current technology will become obsolete. Am J Orthod Dentofacial Orthop 122:14A. Hasanreisoglu U, Berksun S, Aras K, Arslan I (2005). An analysis of maxillary anterior teeth: facial and dental proportions. J Prosthet Dent 94:530-538. Hayasaki H, Sawami T, Saitoh I, Nakata S, Yamasaki Y, Nakata M (2002). Length of the occlusal glide at the lower incisal point during chewing. J Oral Rehabil 29:1120-1125. Hemmings KW, Darbar UR, Vaughan S (2000). Tooth wear treated with direct composite restorations at an increased vertical dimension: results at 30 months. J Prosthet Dent 83:287-293. Henry PJ (1978). Interrelationship of clinical and technical services in restorative dentistry. Aust Dent J 23:26-36. Hidaka O, Iwasaki M, Saito M, Morimoto T (1999). Influence of clenching intensity on bite force balance, occlusal contact area, and average bite pressure. J Dent Res 78:1336-1344. Hikita K, Uchiyama Y, Iiyama K, Duret F (2002). Function and clinical application of dental CAD/CAM "GN-1". Int J Comput Dent 5:11-23. Hirogaki Y, Sohmura T, Satoh H, Takahashi J, Takada K (2001). Complete 3-D reconstruction of dental cast shape using perceptual grouping. IEEE Trans Med Imaging 20:1093-1101.

225
Hobo S, Takayama H (1997). Twin-stage procedure. Part 1: A new method to reproduce precise eccentric occlusal relations. Int J Periodontics Restorative Dent 17:112-123. Hochman N, Ehrlich J (1987). Tooth contact location in intercuspal position. Quintessence Int 18:193-196. Hsieh WW, Luke A, Alster J, Weiner S (2010). Sensory discrimination of teeth and implant-supported restorations. Int J Oral Maxillofac Implants 25:146-152. Hugger S, Schindler HJ, Kordass B, Hugger A (2012). Clinical relevance of surface EMG of the masticatory muscles. (Part 1): Resting activity, maximal and submaximal voluntary contraction, symmetry of EMG activity. Int J Comput Dent 15:297-314. Ingervall B (1972). Tooth contacts on the functional and nonfunctional side in children and young adults. Arch Oral Biol 17:191-200. Ingervall B, Hahner R, Kessi S (1991). Pattern of tooth contacts in eccentric mandibular positions in young adults. J Prosthet Dent 66:169-176. Inokoshi M, Kanazawa M, Minakuchi S (2012). Evaluation of a complete denture trial method applying rapid prototyping. Dent Mater J 31:40-46. Ito T, Gibbs CH, Marguelles-Bonnet R, Lupkiewicz SM, Young HM, Lundeen HC et al. (1986). Loading on the temporomandibular joints with five occlusal conditions. J Prosthet Dent 56:478-484. Iwase Y, Saitoh I, Okamoto A, Nakakura-Ohshima K, Inada E, Yamada C et al. (2011). Do occlusal contact areas of maximum closing position during gum chewing and intercuspal position coincide? Arch Oral Biol 56:1616-1623. Jacobs DJ, Steele JG, Wassell RW (2002). Crowns and extra-coronal restorations: considerations when planning treatment. Br Dent J 192:257-260. Jacobs MS, Windeler AS (1991). An investigation of dental luting cement solubility as a function of the marginal gap. J Prosthet Dent 65:436-442. Jacobs R, van Steenberghe D (1993). Comparison between implant-supported prostheses and teeth regarding passive threshold level. Int J Oral Maxillofac Implants 8:549-554. Jemt T, Lindquist L, Hedegard B (1985). Changes in chewing patterns of patients with complete dentures after placement of osseointegrated implants in the mandible. J Prosthet Dent 53:578-583. Jensen WO (1990a). Occlusion for the Class III jaw relations patient. J Prosthet Dent 64:566-568. Jensen WO (1990b). Effects of comparative jaw size on mandibular movement and occlusion. J Prosthet Dent 64:174-179. Jensen WO (1990c). Occlusion for the Class II jaw relations patient. J Prosthet Dent 64:432-434. Johansson A, Omar R (1994). Identification and management of tooth wear. Int J Prosthodont 7:506-516. Johansson A, Johansson AK, Omar R, Carlsson GE (2008). Rehabilitation of the worn dentition. J Oral Rehabil 35:548-566. Jorgensen MG, Nowzari H (2001). Aesthetic crown lengthening. Periodontol 2000 27:45-58. Julien KC, Buschang PH, Throckmorton GS, Dechow PC (1996). Normal masticatory performance in young adults and children. Arch Oral Biol 41:69-75. Jung RE, Zembic A, Pjetursson BE, Zwahlen M, Thoma DS (2012). Systematic review of the survival rate and the incidence of biological, technical, and aesthetic complications of single crowns on implants reported in longitudinal studies with a mean follow-up of 5 years. Clin Oral Implants Res 23:2-21. Kahn J, Tallents RH, Katzberg RW, Ross ME, Murphy WC (1999). Prevalence of dental occlusal variables and intraarticular temporomandibular disorders: molar relationship, lateral guidance, and nonworking side contacts. J Prosthet Dent 82:410-415.

226
Kanazawa M, Inokoshi M, Minakuchi S, Ohbayashi N (2011). Trial of a CAD/CAM system for fabricating complete dentures. Dent Mater J 30:93-96. Kanno T, Carlsson GE (2006). A review of the shortened dental arch concept focusing on the work by the Kayser/Nijmegen group. J Oral Rehabil 33:850-862. Kasparova M, Grafova L, Dvorak P, Dostalova T, Prochazka A, Eliasova H et al. (2013). Possibility of reconstruction of dental plaster cast from 3D digital study models. Biomed Eng Online 31:12-49. Kathuria YP (1999). Microstructuring by selective laser sintering of metallic powder. Surf Coatings Technol 116-119:643-647. Kattadiyil MT, Goodacre CJ, Baba NZ (2013). CAD/CAM complete dentures: a review of two commercial fabrication systems. J Calif Dent Assoc 41:407-416. Katz A, Tamse A (2003). A combined radiographic and computerized scanning method to evaluate remaining dentine thickness in mandibular incisors after various intracanal procedures. Int Endod J 36:682-686. Kelleher M (2012). Ethical issues, dilemmas and controversies in 'cosmetic' or aesthetic dentistry. A personal opinion. Br Dent J 212:365-367. Keough B (2003a). Occlusion-based treatment planning for complex dental restorations: part 2. Int J Periodont Restorative Dent 23:325-335. Keough B (2003b). Occlusion-based treatment planning for complex dental restorations: Part 1. Int J Periodont Restorative Dent 23:237-247. Keshvad A, Winstanley RB (2001). An appraisal of the literature on centric relation. Part III. J Oral Rehabil 28:55-63. Khaing MW, Fuh JYH, Lu L (2001). Direct metal laser sintering for rapid tooling: processing and characterisation of EOS parts. J Mater Process Technol 113:269-272. Kim JW, Covel NS, Guess PC, Rekow ED, Zhang Y (2010). Concerns of hydrothermal degradation in CAD/CAM zirconia. J Dent Res 89:91-95. Kim Y, Oh TJ, Misch CE, Wang HL (2005). Occlusal considerations in implant therapy: clinical guidelines with biomechanical rationale. Clin Oral Implants Research 16:26-35. Kinsel RP, Lin D (2009). Retrospective analysis of porcelain failures of metal ceramic crowns and fixed partial dentures supported by 729 implants in 152 patients: patient-specific and implant-specific predictors of ceramic failure. J Prosthet Dent 101:388-394. Koh H, Robinson PG (2003). Occlusal adjustment for treating and preventing temporomandibular joint disorders. Cochrane Database Syst Rev 1:CD003812. Kohal RJ, Gerds T, Strub JR (2003). Effect of different crown contours on periodontal health in dogs. Clinical results. J Dent 31:407-413. Kohal RJ, Pelz K, Strub JR (2004). Effect of different crown contours on periodontal health in dogs. Microbiological results. J Dent 32:153-159. Kois DE, Schmidt KK, Raigrodski AJ (2008). Esthetic templates for complex restorative cases: rationale and management. J Esthet Restor Dent 20:239-248. Kois JC (1994). Altering gingival levels: the restorative connection. Part I: biologic variables. J Esthet Dent 6:3-9. Kois JC (1996). The restorative-periodontal interface: biological parameters. Periodontol 2000 11:29-38. Kois JC, Phillips KM (1997). Occlusal vertical dimension: alteration concerns. Compend Contin Educ Dent 18:1169-1174. Kollar A, Huber S, Mericske E, Mericske-Stern R (2008). Zirconia for teeth and implants: a case series. Int J Periodont Restorative Dent 28:479-487.

227
Kopperud SE, Tveit AB, Gaarden T, Sandvik L, Espelid I (2012). Longevity of posterior dental restorations and reasons for failure. Eur J Oral Sci 120:539-548. Koralakunte PR, Aljanakh M (2014). The role of virtual articulator in prosthetic and restorative dentistry. J Clin Diagn Res 8:25-28. Kordass B, Gartner C, Sohnel A, Bisler A, Voss G, Bockholt U et al. (2002). The virtual articulator in dentistry: concept and development. Dent Clin North Am 46:493-506. Korioth TW (1990a). Analysis of working-side occlusal contacts. Int J Prosthodont 3:349-355. Korioth TW (1990b). Number and location of occlusal contacts in intercuspal position. J Prosthet Dent 64:206-210. Korioth TW, Hannam AG (1994). Deformation of the human mandible during simulated tooth clenching. J Dent Res 73:56-66. Koyano K, Tsukiyama Y, Kuwatsuru R (2012). Rehabilitation of occlusion - science or art? J Oral Rehabil 39:513-521. Kuboki T, Azuma Y, Orsini MG, Takenami Y, Yamashita A (1996). Effects of sustained unilateral molar clenching on the temporomandibular joint space. Oral Surg Oral Med Oral Pathol Oral Radiol Endod 82:616-624. Kusnoto B, Evans CA (2002). Reliability of a 3D surface laser scanner for orthodontic applications. Am J Orthod Dentofacial Orthop 122:342-348. Lang NP (1995). Periodontal considerations in prosthetic dentistry. Periodontol 2000 9:118-131. Lee EA, Jun SK (2000). Achieving aesthetic excellence through an outcome-based restorative treatment rationale. Pract Periodontics Aesthet Dent 12:641-648. Lee EA (2004). Aesthetic crown lengthening: classification, biologic rationale, and treatment planning considerations. Pract Proced Aesthet Dent 16:769-778. Lerman MD (1973). A unifying concept of the TMJ pain-dysfunction syndrome. J Am Dent Assoc 86:833-841. Levin EI (1978). Dental esthetics and the golden proportion. J Prosthet Dent 40:244-252. Lin WS, Harris BT, Ozdemir E, Morton D (2013). Maxillary rehabilitation with a CAD/CAM-fabricated, long-term interim and anatomic contour definitive prosthesis with a digital workflow: A clinical report. J Prosthet Dent 110:1-7. Lindquist LW, Carlsson GE (1985). Long-term effects on chewing with mandibular fixed prostheses on osseointegrated implants. Acta Odontol Scand 43:39-45. Liu HX, Liang QJ, Xiao P, Jiao HX, Gao Y, Ahmetjiang A (2012). The effectiveness of cognitive-behavioural therapy for temporomandibular disorders: a systematic review. J Oral Rehabil 39:55-62. Lombardi RE (1973). The principles of visual perception and their clinical application to denture esthetics. J Prosthet Dent 29:358-382. Lucia VO (1962). The gnathological concept of articulation. Dent Clin of North Am 15:183-197. Lundeen HC (1971). Occlusal morphologic considerations for fixed restorations. Dent Clin North Am 15:649-661. Luthardt R, Weber A, Rudolph H, Schone C, Quaas S, Walter M (2002). Design and production of dental prosthetic restorations: basic research on dental CAD/CAM technology. Int J Comput Dent 5:165-176. Luthardt RG, Holzhuter MS, Rudolph H, Herold V, Walter MH (2004). CAD/CAM-machining effects on Y-TZP zirconia. Dent Mater 20:655-662. MacDonald JW, Hannam AG (1984). Relationship between occlusal contacts and jaw-closing muscle activity during tooth clenching: Part I. J Prosthet Dent 52:718-728. Machado AW, Moon W, Gandini LG, Jr. (2013). Influence of maxillary incisor edge asymmetries on the perception of smile esthetics among orthodontists and laypersons. Am J Orthod Dentofacial Orthop 143:658-664.

228
Maeda Y, Minoura M, Tsutsumi S, Okada M, Nokubi T (1994). A CAD/CAM system for removable denture. Part I: Fabrication of complete dentures. Int J Prosthodont 7:17-21. Magne P, Magne M, Belser U (1993). Natural and restorative oral esthetics. Part I: Rationale and basic strategies for successful esthetic rehabilitations. J Esthet Dent 5:161-173. Magne P, Magne M, Belser U (1996). The diagnostic template: a key element to the comprehensive esthetic treatment concept. Int J Periodont Restorative Dent 16:560-569. Magne P, Douglas WH (1999a). Rationalization of esthetic restorative dentistry based on biomimetics. J Esthet Dent 11:5-15. Magne P, Douglas WH (1999b). Additive contour of porcelain veneers: a key element in enamel preservation, adhesion, and esthetics for aging dentition. J Adhes Dent 1:81-92. Magne P, Gallucci GO, Belser UC (2003). Anatomic crown width/length ratios of unworn and worn maxillary teeth in white subjects. J Prosthet Dent 89:453-461. Magne P, Belser UC (2004). Novel porcelain laminate preparation approach driven by a diagnostic mock-up. J Esthet Restor Dent 16:7-16. Mahshid M, Khoshvaghti A, Varshosaz M, Vallaei N (2004). Evaluation of "golden proportion" in individuals with an esthetic smile. J Esthet Restor Dent 16:185-192. Mandelaris GA, Rosenfeld AL (2008). A novel approach to the antral sinus bone graft technique: the use of a prototype cutting guide for precise outlining of the lateral wall. A case report. Int J Periodont Restorative Dent 28:569-575. Masek R (2003). Designing in 3D--a more visual approach to Cerec correlation. Int J Comput Dent 6:75-82. Mavroskoufis F, Ritchie GM (1980). Variation in size and form between left and right maxillary central incisor teeth. J Prosthet Dent 43:254-257. Maxwell AW, Blank LW, Pelleu GB, Jr. (1990). Effect of crown preparation height on the retention and resistance of gold castings. Gen Dent 38:200-202. Mayers M, Firestone AR, Rashid R, Vig KW (2005). Comparison of peer assessment rating (PAR) index scores of plaster and computer-based digital models. Am J Orthod Dentofacial Orthop 128:431-434. McDevitt WE, Warreth AA (1997). Occlusal contacts in maximum intercuspation in normal dentitions. J Oral Rehabil 24:725-734. McNamara DC, Henry PJ (1974). Terminal hinge contact in dentitions. J Prosthet Dent 32:405-411. Mehl A, Blanz V, Hickel R (2005a). A new mathematical process for the calculation of average forms of teeth. J Prosthet Dent 94:561-566. Mehl A, Blanz V, Hickel R (2005b). Biogeneric tooth: a new mathematical representation for tooth morphology in lower first molars. Eur J Oral Sci 113:333-340. Mehta P, Lim LP (2010). The width of the attached gingiva--much ado about nothing? J Dent 38:517-525. Meijering AC, Peters MC, DeLong R, Pintado MR, Creugers NH (1998). Dimensional changes during veneering procedures on discoloured teeth. J Dent 26:569-576. Mericske-Stern R, Assal P, Mericske E, Burgin W (1995). Occlusal force and oral tactile sensibility measured in partially edentulous patients with ITI implants. Int J Oral Maxillofac Implants 10:345-353. Mian AS, Bennamoun M, Owens R (2006). Three-dimensional model-based object recognition and segmentation in cluttered scenes. IEEE T Pattern Anal 28:1584-1601. Michalakis KX, Asar NV, Kapsampeli V, Magkavali-Trikka P, Pissiotis AL, Hirayama H (2012). Delayed linear dimensional changes of five high strength gypsum products used for the fabrication of definitive casts. J Prosthet Dent 108:189-195.

229
Minagi S, Ohtsuki H, Sato T, Ishii A (1997). Effect of balancing-side occlusion on the ipsilateral TMJ dynamics under clenching. J Oral Rehabil 24:57-62. Miralles R, Gallardo F, Baeza M, Valenzuela S, Ravera MJ, Ormeno G et al. (2007). Laterotrusive occlusal schemes and jaw posture tasks effects on supra- and infrahyoid EMG activity in the lateral decubitus position. Cranio 25:106-113. Misch KA, Yi ES, Sarment DP (2006). Accuracy of cone beam computed tomography for periodontal defect measurements. J Periodontol 77:1261-1266. Miyazaki T, Hotta Y, Kunii J, Kuriyama S, Tamaki Y (2009). A review of dental CAD/CAM: current status and future perspectives from 20 years of experience. Dent Mater J 28:44-56. Miyazaki T, Hotta Y (2011). CAD/CAM systems available for the fabrication of crown and bridge restorations. Aust Dent J 56:97-106. Mizrahi B (2008). Control and precision in complete arch restoration. Br Dent J 204:69-75. Morgan DW, Comella MC, Staffanou RS (1975). A diagnostic wax-up technique. J Prosthet Dent 33:169-177. Mormann WH, Brandestini M, Lutz F, Barbakow F (1989). Chairside computer-aided direct ceramic inlays. Quintessence Int 20:329-339. Murphy T (1959). Compensatory mechanisms in facial height adjustment to functional tooth attrition. Aust Dent J 5:312-323. Nassar U, Aziz T, Flores-Mir C (2011). Dimensional stability of irreversible hydrocolloid impression materials as a function of pouring time: a systematic review. J Prosthet Dent 106:126-133. Nassar U, Hussein B, Oko A, Carey JP, Flores-Mir C (2012). Dimensional accuracy of 2 irreversible hydrocolloid alternative impression materials with immediate and delayed pouring. J Can Dent Assoc 78:c2. Nowzari H (2001). Aesthetic osseous surgery in the treatment of periodontitis. Periodontol 2000 27:8-28. Ogawa T, Koyano K, Suetsugu T (1996). The relationship between inclination of the occlusal plane and jaw closing path. J Prosthet Dent 76:576-580. Ogawa T, Koyano K, Suetsugu T (1997). Characteristics of masticatory movement in relation to inclination of occlusal plane. J Oral Rehabil 24:652-657. Ogawa T, Ogimoto T, Koyano K (1998). Pattern of occlusal contacts in lateral positions: canine protection and group function validity in classifying guidance patterns. J Prosthet Dent 80:67-74. Okano N, Baba K, Akishige S, Ohyama T (2002). The influence of altered occlusal guidance on condylar displacement. J Oral Rehabil 29:1091-1098. Okano N, Baba K, Ohyama T (2005). The influence of altered occlusal guidance on condylar displacement during submaximal clenching. J Oral Rehabil 32:714-719. Okano N, Baba K, Igarashi Y (2007). Influence of altered occlusal guidance on masticatory muscle activity during clenching. J Oral Rehabil 34:679-684. Olthoff LW, Van Der Zel JM, De Ruiter WJ, Vlaar ST, Bosman F (2000). Computer modeling of occlusal surfaces of posterior teeth with the CICERO CAD/CAM system. J Prosthet Dent 84:154-162. Ormianer Z, Gross M (1998). A 2-year follow-up of mandibular posture following an increase in occlusal vertical dimension beyond the clinical rest position with fixed restorations. J Oral Rehabil 25:877-883. Ormianer Z, Palty A (2009). Altered vertical dimension of occlusion: a comparative retrospective pilot study of tooth- and implant-supported restorations. Int J Oral Maxillofac Implants 24:497-501. Ortorp A, Jonsson D, Mouhsen A, Vult von Steyern P (2011). The fit of cobalt-chromium three-unit fixed dental prostheses fabricated with four different techniques: a comparative in vitro study. Dent Mater 27:356-363.

230
Ottenhoff FA, van der Bilt A, van der Glas HW, Bosman F (1992). Peripherally induced and anticipating elevator muscle activity during simulated chewing in humans. J Neurophysiol 67:75-83. Owens S, Buschang PH, Throckmorton GS, Palmer L, English J (2002). Masticatory performance and areas of occlusal contact and near contact in subjects with normal occlusion and malocclusion. Am J Orthod Dentofacial Orthop 121:602-609. Palamara D, Palamara JE, Tyas MJ, Messer HH (2000). Strain patterns in cervical enamel of teeth subjected to occlusal loading. Dent Mater 16:412-419. Palamara JE, Palamara D, Messer HH, Tyas MJ (2006). Tooth morphology and characteristics of non-carious cervical lesions. J Dent 34:185-194. Pallesen U, van Dijken JW, Halken J, Hallonsten AL, Hoigaard R (2013). A prospective 8-year follow-up of posterior resin composite restorations in permanent teeth of children and adolescents in Public Dental Health Service: reasons for replacement. Clin Oral Investig 18:819-827. Panek H, Matthews-Brzozowska T, Nowakowska D, Panek B, Bielicki G, Makacewicz S et al. (2008). Dynamic occlusions in natural permanent dentition. Quintessence Int 39:337-342. Parker MH, Calverley MJ, Gardner FM, Gunderson RB (1993). New guidelines for preparation taper. J Prosthodont 2:61-66. Paulus D, Wolf M, Meller S, Niemann H (1999). Three-dimensional computer vision for tooth restoration. Med Image Anal 3:1-19. Perel ML (1971). Axial crown contours. J Prosthet Dent 25:642-649. Persson A, Andersson M, Oden A, Sandborgh-Englund G (2006). A three-dimensional evaluation of a laser scanner and a touch-probe scanner. J Prosthet Dent 95:194-200. Pfeiffer J (1999). Dental CAD/CAM technologies: the optical impression (II). Int J Comput Dent 2:65-72. Pietrobon N, Paul SJ (1997). All-ceramic restorations: a challenge for anterior esthetics. J Esthet Dent 9:179-186. Pinho S, Ciriaco C, Faber J, Lenza MA (2007). Impact of dental asymmetries on the perception of smile esthetics. Am J Orthod Dentofacial Orthop 132:748-753. Pini NP, de-Marchi LM, Gribel BF, Ubaldini AL, Pascotto RC (2012). Analysis of the golden proportion and width/height ratios of maxillary anterior dentition in patients with lateral incisor agenesis. J Esthet Restor Dent 24:402-414. Pini NP, De-Marchi LM, Gribel BF, Pascotto RC (2013). Digital analysis of anterior dental esthetic parameters in patients with bilateral maxillary lateral incisor agenesis. J Esthet Restor Dent 25:189-200. Pinsky HM, Dyda S, Pinsky RW, Misch KA, Sarment DP (2006). Accuracy of three-dimensional measurements using cone-beam CT. Dentomaxillofac Radiol 35:410-416. Pjetursson BE, Thoma D, Jung R, Zwahlen M, Zembic A (2012). A systematic review of the survival and complication rates of implant-supported fixed dental prostheses (FDPs) after a mean observation period of at least 5 years. Clin Oral Implants Res 23:22-38. Pokorny PH, Wiens JP, Litvak H (2008). Occlusion for fixed prosthodontics: a historical perspective of the gnathological influence. J Prosthet Dent 99:299-313. Poyser NJ, Briggs PF, Chana HS, Kelleher MG, Porter RW, Patel MM (2007). The evaluation of direct composite restorations for the worn mandibular anterior dentition - clinical performance and patient satisfaction. J Oral Rehabil 34:361-376. Prasad R, Al-Kheraif AA (2013). Three-dimensional accuracy of CAD/CAM titanium and ceramic superstructures for implant abutments using spiral scan microtomography. Int J Prosthodont 26:451-457. Preston JD (1976). A systematic approach to the control of esthetic form. J Prosthetic Dent 35:393-402. Preston JD (1993). The golden proportion revisited. J Esthet Dent 5:247-251.

231
Probst FA, Mehl A (2008). CAD reconstruction using contralateral mirrored anterior teeth: a 3-dimensional metric and visual evaluation. Int J Prosthodont 21:521-523. Pullinger AG, Seligman DA, Gornbein JA (1993). A multiple logistic regression analysis of the risk and relative odds of temporomandibular disorders as a function of common occlusal features. J Dent Res 72:968-979. Quintero JC, Trosien A, Hatcher D, Kapila S (1999). Craniofacial imaging in orthodontics: historical perspective, current status, and future developments. Angle Orthod 69:491-506. Raj V (2013). Esthetic paradigms in the interdisciplinary management of maxillary anterior dentition-a review. J Esthet Restor Dent 25:295-304. Ramfjord SP (1961). Dysfunctional temporomandibular joint and muscle pain. J Prosthet Dent 11:353-374. Redlich M, Weinstock T, Abed Y, Schneor R, Holdstein Y, Fischer A (2008). A new system for scanning, measuring and analyzing dental casts based on a 3D holographic sensor. Orthod Craniofac Res 11:90-95. Redman CD, Hemmings KW, Good JA (2003). The survival and clinical performance of resin-based composite restorations used to treat localised anterior tooth wear. Br Dent J 194:566-572. Reich S, Troeltzsch M, Denekas T, Wichmann M (2004). Generation of functional Cerec 3D occlusal surfaces: a comparison of two production methods relevant in practice. Int J Comput Dent 7:229-238. Reiss B (2003). Occlusal surface design with Cerec 3D. Int J Comput Dent 6:333-342. Rekow D, Thompson VP (2005). Near-surface damage--a persistent problem in crowns obtained by computer-aided design and manufacturing. P I Mech Eng H 219:233-243. Rekow ED, Erdman AG, Riley DR, Klamecki B (1991). CAD/CAM for dental restorations--some of the curious challenges. IEEE Trans Biomed Eng 38:314-318. Rekow ED, Silva NR, Coelho PG, Zhang Y, Guess P, Thompson VP (2011). Performance of dental ceramics: challenges for improvements. J Dent Res 90:937-952. Rentzia A, Coleman DC, O'Donnell MJ, Dowling AH, O'Sullivan M (2011). Disinfection procedures: their efficacy and effect on dimensional accuracy and surface quality of an irreversible hydrocolloid impression material. J Dent 39:133-140. Reshad M, Cascione D, Magne P (2008). Diagnostic mock-ups as an objective tool for predictable outcomes with porcelain laminate veneers in esthetically demanding patients: a clinical report. J Prosthet Dent 99:333-339. Richards LC (1985). Dental attrition and craniofacial morphology in two Australian aboriginal populations. J Dent Res 64:1311-1315. Rinchuse DJ, Kandasamy S, Sciote J (2007). A contemporary and evidence-based view of canine protected occlusion. Am J Orthod Dentofacial Orthop 132:90-102. Rivera-Morales WC, Mohl ND (1991). Relationship of occlusal vertical dimension to the health of the masticatory system. J Prosthet Dent 65:547-553. Rivera-Morales WC, Mohl ND (1992). Restoration of the vertical dimension of occlusion in the severely worn dentition. Dent Clin North Am 36:651-664. Rodriguez K, Miralles R, Gutierrez MF, Santander H, Fuentes A, Fresno MJ et al. (2011). Influence of jaw clenching and tooth grinding on bilateral sternocleidomastoid EMG activity. Cranio 29:14-22. Rohrle O, Waddell JN, Foster KD, Saini H, Pullan AJ (2009). Using a motion-capture system to record dynamic articulation for application in CAD/CAM software. J Prosthodont 18:703-710. Romeo G, Bresciano M (2003). Diagnostic and technical approach to esthetic rehabilitations. J Esthet Restor Dent 15:204-216. Rosenstiel SF, Ward DH, Rashid RG (2000). Dentists' preferences of anterior tooth proportion--a web-based study. J Prosthodont 9:123-136.

232
Rosenstiel SF, Rashid RG (2002). Public preferences for anterior tooth variations: a web-based study. J Esthet Restor Dent 14:97-106. Rudolph H, Luthardt RG, Walter MH (2007). Computer-aided analysis of the influence of digitizing and surfacing on the accuracy in dental CAD/CAM technology. Comput Biol Med 37:579-587. Runte C, Dirksen D, Delere H, Thomas C, Runte B, Meyer U et al. (2002). Optical data acquisition for computer-assisted design of facial prostheses. Int J Prosthodont 15:129-132. Sackett BP, Gildenhuys RR (1976). The effect of axial crown overcontour on adolescents. J Periodontol 47:320-323. Sadan A, Blatz MB, Lang B (2005). Clinical considerations for densely sintered alumina and zirconia restorations: Part 1. Int J Periodont Restorative Dent 25:213-219. Salmi M, Paloheimo KS, Tuomi J, Ingman T, Makitie A (2013). A digital process for additive manufacturing of occlusal splints: a clinical pilot study. J R Soc Interface 10:20130203. Salsench J, Martinez-Gomis J, Torrent J, Bizar J, Samso J, Peraire M (2005). Relationship between duration of unilateral masticatory cycles and the type of lateral dental guidance: a preliminary study. Int J Prosthodont 18:339-346. Santoro M, Galkin S, Teredesai M, Nicolay OF, Cangialosi TJ (2003). Comparison of measurements made on digital and plaster models. Am J Orthod Dentofacial Orthop 124:101-105. Sarita PT, Kreulen CM, Witter DJ, van't Hof M, Creugers NH (2003). A study on occlusal stability in shortened dental arches. Int J Prosthodont 16:375-380. Scaife RR, Holt JE (1969). Natural occurrence of cuspid guidance. J Prosthet Dent 22:225-229. Schaefer O, Schmidt M, Goebel R, Kuepper H (2012). Qualitative and quantitative three-dimensional accuracy of a single tooth captured by elastomeric impression materials: an in vitro study. J Prosthet Dent 108:165-172. Schierz O, Klinger N, Schon G, Reissmann DR (2014). The reliability of computerized condylar path angle assessment. Int J Comput Dent 17:35-51. Schmidlin PR, Filli T, Imfeld C, Tepper S, Attin T (2009). Three-year evaluation of posterior vertical bite reconstruction using direct resin composite--a case series. Oper Dent 34:102-108. Schuyler C (1939). Problems associated with opening the bite which would contraindicate it as a common procedure. J Am Dent Assoc 26:734-740. Schuyler CH (1963). The function and importance of incisal guidance in oral rehabilitation. 1963. J Prosthet Dent 13:1011-1029. Schwartz H (1986). Occlusal variations for reconstructing the natural dentition. J Prosthet Dent 55:101-105. Seedorf H, Weitendorf H, Scholz A, Kirsch I, Heydecke G (2009). Effect of non-working occlusal contacts on vertical condyle position. J Oral Rehabil 36:435-441. Seligman DA, Pullinger AG (1991). The role of functional occlusal relationships in temporomandibular disorders: a review. J Craniomandib Disord 5:265-279. Seligman DA, Pullinger AG (1995). The degree to which dental attrition in modern society is a function of age and of canine contact. J Orofac Pain 9:266-275. Shillingburg HT, Wilson EL, Morrison JT (2000). Review of waxing technique. In: Guide to Occlusal Waxing. HT Shillingburg editor. Illinoise: Quintessence Publishing Co., pp. 17-25. Sierpinska T, Kuc J, Golebiewska M (2013). Morphological and Functional Parameters in Patients with Tooth Wear before and after Treatment. Open Dent J 7:55-61. Silva NR, Witek L, Coelho PG, Thompson VP, Rekow ED, Smay J (2011). Additive CAD/CAM process for dental prostheses. J Prosthodont 20:93-96.

233
Simon H, Magne P (2008). Clinically based diagnostic wax-up for optimal esthetics: the diagnostic mock-up. J Calif Dent Assoc 36:355-362. Sindel J, Petschelt A, Grellner F, Dierken C, Greil P (1998). Evaluation of subsurface damage in CAD/CAM machined dental ceramics. J Mater Sci Mater Med 9:291-295. Sindel J, Frankenberger R, Kramer N, Petschelt A (1999). Crack formation of all-ceramic crowns dependent on different core build-up and luting materials. J Dent 27:175-181. Solaberrieta E, Minguez R, Barrenetxea L, Etxaniz O (2013). Direct transfer of the position of digitized casts to a virtual articulator. J Prosthet Dent 109:411-414. Solaberrieta E, Minguez R, Barrenetxea L, Otegi JR, Szentpetery A (2014a). Comparison of the accuracy of a 3-dimensional virtual method and the conventional method for transferring the maxillary cast to a virtual articulator. J Prosthet Dent 113:191-197. Solaberrieta E, Otegi JR, Minguez R, Etxaniz O (2014b). Improved digital transfer of the maxillary cast to a virtual articulator. J Prosthet Dent 112:921-924. Sonick M (1997). Esthetic crown lengthening for maxillary anterior teeth. Compend Contin Educ Dent 18:807-812. Sorensen JA (1989). A rationale for comparison of plaque-retaining properties of crown systems. J Prosthet Dent 62:264-269. Steele JG, Wassell RW, Walls AW (2002). Changing patterns and the need for quality. Br Dent J 192:144-148. Sterrett JD, Oliver T, Robinson F, Fortson W, Knaak B, Russell CM (1999). Width/length ratios of normal clinical crowns of the maxillary anterior dentition in man. J Clin Periodontol 26:153-157. Stuart CE (1964). Good occlusion for natural teeth. J Prosthet Dent 14:716-724. Suit SR, Gibbs CH, Benz ST (1976). Study of gliding tooth contacts during mastication. J Periodontol 47:331-334. Sun Y, Lu P, Wang Y (2009). Study on CAD&RP for removable complete denture. Comput Methods Programs Biomed 93:266-272. Sundh B, Kohler B (2002). An in vivo study of the impact of different emergence profiles of procera titanium crowns on quantity and quality of plaque. Int J Prosthodont 15:457-460. Tan PL, Gratton DG, Diaz-Arnold AM, Holmes DC (2008). An in vitro comparison of vertical marginal gaps of CAD/CAM titanium and conventional cast restorations. J Prosthodont 17:378-383. Tarantola GJ, Becker IM (1993). Definitive diagnostic waxing with light-cured composite resin. J Prosthet Dent 70:315-319. Taylor TD, Belser U, Mericske-Stern R (2000). Prosthodontic considerations. Clin Oral Implants Res 11:101-107. Tench R (1938). Dangers in reconstructing involving increase of the vertical dimension of the lower third of the human face. J Am Dent Assoc 25:566-570. Terminasov YS, Yokhontov AG (1959). Distortion of lattice structure of metals by grinding. Met Sci Heat Treat 1:19-23. Thornton LJ (1990). Anterior guidance: group function/canine guidance. A literature review. J Prosthet Dent 64:479-482. Tinschert J, Natt G, Hassenpflug S, Spiekermann H (2004). Status of current CAD/CAM technology in dental medicine. Int J Comput Dent 7:25-45. Tjan AH, Freed H, Miller GD (1980). Current controversies in axial contour design. J Prosthet Dent 44:536-540. Todd JA, Oesterle LJ, Newman SM, Shellhart WC (2013). Dimensional changes of extended-pour alginate impression materials. Am J Orthod Dentofacial Orthop 143:55-63.

234
Tryde G, Stoltze K, Fujii H, Brill N (1977). Short-term changes in the perception of comfortable mandibular occlusal positions. J Oral Rehabil 4:17-21. Turner KA, Missirlian DM (1984). Restoration of the extremely worn dentition. J Prosthet Dent 52:467-474. Turp JC, Greene CS, Strub JR (2008). Dental occlusion: a critical reflection on past, present and future concepts. J Oral Rehabil 35:446-453. Turp JC, Schindler H (2012). The dental occlusion as a suspected cause for TMDs: epidemiological and etiological considerations. J Oral Rehabil 39:502-512. Valenzuela S, Baeza M, Miralles R, Cavada G, Zuniga C, Santander H (2006). Laterotrusive occlusal schemes and their effect on supra- and infrahyoid electromyographic activity. Angle Orthod 76:585-590. Valenzuela S, Portus C, Miralles R, Campillo MJ, Santander H, Fresno MJ et al. (2012). Bilateral supra- and infrahyoid EMG activity during eccentric jaw clenching and tooth grinding tasks in subjects with canine guidance or group function. Cranio 30:209-217. van Noort R (2012). The future of dental devices is digital. Dent Mater 28:3-12. Vandenbroucke B, Kruth JP (2007). Selective laser melting of biocompatible metals for rapid manufacturing of medical parts. Rapid Prototyping J 13:196-203. Varrela J (1992). Dimensional variation of craniofacial structures in relation to changing masticatory-functional demands. Eur J Orthod 14:31-36. Vasconcelos FS, Neves AC, Silva-Concilio LR, Cunha LG, Rode Sde M (2009). Influence of anatomic reference on the buccal contour of prosthetic crowns. Braz Oral Res 23:230-235. Vence BS (2007). Predictable esthetics through functional design: the role of harmonious disclusion. J Esthet Restor Dent 19:185-191. Vieira DM, Sotto-Maior BS, Barros CA, Reis ES, Francischone CE (2013). Clinical accuracy of flapless computer-guided surgery for implant placement in edentulous arches. Int J Oral Maxillofac Implants 28:1347-1351. Vryonis P (1981). Esthetics and function in multiple unit bridges. Quintessence Dent Technol 5:237-241. Walker MP, Burckhard J, Mitts DA, Williams KB (2010). Dimensional change over time of extended-storage alginate impression materials. Angle Orthod 80:1110-1115. Wang M, Mehta N (2013). A possible biomechanical role of occlusal cusp-fossa contact relationships. J Oral Rehabil 40:69-79. Ward DH (2001). Proportional smile design using the recurring esthetic dental (red) proportion. Dent Clin North Am 45:143-154. Ward DH (2007). A study of dentists' preferred maxillary anterior tooth width proportions: comparing the recurring esthetic dental proportion to other mathematical and naturally occurring proportions. J Esthet Restor Dent 19:324-337. Waring CS, Bax JS, Samarabandu A, Holdsworth DW, Fenster A, Lacefield JC (2012). Traceable micro-CT scaling accuracy phantom for applications requiring exact measurement of distances or volumes. Med Phys 39:6022-6027. Wataha JC (2001). Principles of biocompatibility for dental practitioners. J Prosthet Dent 86:203-209. Wataha JC (2002). Alloys for prosthodontic restorations. J Prosthet Dent 87:351-363. Wataha JC, Messer RL (2004). Casting alloys. Dent Clin North Am 48:499-512. Webb PA (2000). A review of rapid prototyping (RP) techniques in the medical and biomedical sector. J Med Eng Technol 24:149-153. Weinberg LA (1964). A cinematic study of centric and eccentric occlusions. J Prosthet Dent 14:290-293.

235
Weiner S, Sirois D, Ehrenberg D, Lehrmann N, Simon B, Zohn H (2004). Sensory responses from loading of implants: a pilot study. Int J Oral Maxillofac Implants 19:44-51. Wilding RJ, Adams LP, Lewin A (1992). Absence of association between a preferred chewing side and its area of functional occlusal contact in the human dentition. Arch Oral Biol 37:423-428. Willer J, Rossbach A, Weber HP (1998). Computer-assisted milling of dental restorations using a new CAD/CAM data acquisition system. J Prosthet Dent 80:346-353. Williams J, Bennamoun M, Latham S (1999). Multiple view 3D registration: a review and a new technique. IEEE SMC 99 Conf Proc IEEE Int Conf 3:497-502. Williams J, Bennamoun M (2001). Simultaneous registration of multiple corresponding point sets. Comput Vis Image Und 81:117-142. Williams RJ, Bibb R, Rafik T (2004). A technique for fabricating patterns for removable partial denture frameworks using digitized casts and electronic surveying. J Prosthet Dent 91:85-88. Williams RJ, Bibb R, Eggbeer D, Collis J (2006). Use of CAD/CAM technology to fabricate a removable partial denture framework. J Prosthet Dent 96:96-99. Wiskott HW, Belser UC (1995). A rationale for a simplified occlusal design in restorative dentistry: historical review and clinical guidelines. J Prosthet Dent 73:169-183. Woda A, Vigneron P, Kay D (1979). Nonfunctional and functional occlusal contacts: a review of the literature. J Prosthet Dent 42:335-341. Wood WW, Tobias DL (1984). EMG response to alteration of tooth contacts on occlusal splints during maximal clenching. J Prosthet Dent 51:394-396. Wu F, Wang X, Zhoa X, Zhang C, Gao B (2012). A study on the fabrication method of removable partial denture framework by computer-aided design and rapid prototyping. Rapid Prototyping J 18:318-323. Xu CN, Akiyama M, Nonaka K, Watanabe T (1998). Electrical power generation characteristics of PZT piezoelectric ceramics. IEEE Trans Ultrason Ferroelect Freq Control 45:1065-1070. Yaffe A, Ehrlich J (1987). The functional range of tooth contact in lateral gliding movements. J Prosthet Dent 57:730-733. Yi SW, Carlsson GE, Ericsson I, Wennstrom JL (1996). Long-term follow-up of cross-arch fixed partial dentures in patients with advanced periodontal destruction: evaluation of occlusion and subjective function. J Oral Rehabil 23:186-196. Yoshida Y, Yamaguchi S, Kawamoto Y, Noborio H, Murakami S, Sohmura T (2011). Development of a multi-layered virtual tooth model for the haptic dental training system. Dent Mater J 30:1-6. Yuan T, Liao W, Dai N, Cheng X, Yu Q (2010). Single-Tooth Modeling for 3D Dental Model. Int J Biomed Imaging :535329. Yuodelis RA, Weaver JD, Sapkos S (1973). Facial and lingual contours of artificial complete crown restorations and their effects on the periodontium. J Prosthet Dent 29:61-66. Yurkstas A, Manly RS (1949). Measurement of occlusal contact area effective in mastication. Am J Orthod 35:185-195. Zarb GA (1983). The edentulous milieu. J Prosthet Dent 49:825-831. Zheng S-X, Li J, Sun Q-F (2011). A novel 3D morphing approach for tooth occlusal surface reconstruction. Computer-Aided Design 43:293-302. Zilberman O, Huggare JA, Parikakis KA (2003). Evaluation of the validity of tooth size and arch width measurements using conventional and three-dimensional virtual orthodontic models. Angle Orthod 73:301-306. Zitzmann NU, Rohner U, Weiger R, Krastl G (2009). When to choose which retention element to use for removable dental prostheses. Int J Prosthodont 22:161-167.

236
Zitzmann NU, Krastl G, Hecker H, Walter C, Waltimo T, Weiger R (2010). Strategic considerations in treatment planning: deciding when to treat, extract, or replace a questionable tooth. J Prosthet Dent 104:80-91. Zlataric DK, Kristek E, Celebic A (2007). Analysis of width/length ratios of normal clinical crowns of the maxillary anterior dentition: correlation between dental proportions and facial measurements. Int J Prosthodont 20:313-315.

237
Appendix
All removed, with the exception of Appendix A, due to copyright restrictions.

238
Appendix A

239