evaluation of work zone split traffic symbol sign - … of work zone split traffic symbol sign ......
TRANSCRIPT

Final Report Prepared for Missouri Department of Transportation August 2017 Project TR201613 Report cmr17-009
Evaluation of Work Zone Split Traffic Symbol Sign
Prepared by:
Praveen Edara, Associate Professor (Principal Investigator) Carlos Sun, Henry Brown (Co-Principal Investigators) University of Missouri-Columbia
Shawn Leight CBB

TECHNICAL REPORT DOCUMENTATION PAGE
1. Report No.
cmr 17-009
2. Government Accession No. 3. Recipient’s Catalog No.
4. Title and Subtitle
Evaluation of Work Zone Split Traffic Symbol Sign
5. Report Date
July 17, 2017
Published: August 2017
6. Performing Organization Code
7. Author(s)
Praveen Edara https://orcid.org/0000-0003-2707-642X, Carlos Sun
https://orcid.org/0000-0002-8857-9648, Henry Brown, Shawn Leight, Emmanuel
Nketah https://orcid.org/0000-0001-6678-5128
8. Performing Organization Report No.
9. Performing Organization Name and Address
University of Missouri-Columbia
Department of Civil & Environmental Engineering
E 2509 Lafferre Hall, Columbia, MO 65211
10. Work Unit No.
11. Contract or Grant No.
MoDOT project # TR201613
OST Part of #DTRT13-G-UTC37
12. Sponsoring Agency Name and Address
Midwest Transportation Center Missouri Department of Transportation (SPR)
2711 S. Loop Drive, Suite 4700 Construction and Materials Division
Ames, IA 50010-8664 P.O. Box 270, Jefferson City, MO 65102
Office of the Assistant Secretary for Research and Technology
1200 New Jersey Avenue, SE
Washington, DC 20590
13. Type of Report and Period Covered
Final Report (May 15, 2016 to January 30,
2017)
14. Sponsoring Agency Code
15. Supplementary Notes
Conducted in cooperation with the U.S. Department of Transportation, Federal Highway Administration. MoDOT research reports
are available in the Innovation Library at http://www.modot.org/services/or/byDate.htm. This report is available at
https://library.modot.mo.gov/RDT/reports/TR201613/
16. Abstract Effective signage that is easy to understand facilitates safe driving through a work zone. While the guidance for work zone signage in the
Manual on Uniform Traffic Control Devices (MUTCD) is suitable for many conditions, there may be instances where alternative signage
may be more effective at enhancing safety. This project evaluated the use of alternative signage for closure of a middle lane in a freeway
work zone on a bridge rehabilitation project on I-170 in St. Louis, Missouri. The alternative signage displays the lane arrangement in a
single sign while the MUTCD signage shows the movements to the left and the right sides of the work area on separate signs. The
evaluation of the alternative signage included stakeholder and driver surveys, operational and safety analyses, and the collection and
analysis of field videos to assess driver behavior. The analysis of field videos showed that drivers may have adapted to the alternative
signs as the rate of lane changes decreased between the early and late periods of construction. Stakeholder interviews found that
personnel from MoDOT and the contractor generally thought that the alternative sign communicated information more clearly but had
mixed opinions on whether the use of the sign improved safety. Drivers did not express any concerns regarding the use of the alternative
sign through a website that collects feedback on MoDOT work zones. A review of crash data found that crash patterns during the work
zone period were similar to the crash patterns before the work zone was in place, and the use of the alternative sign did not appear to be a
contributing factor in any work zone crashes. Analysis of RITIS traffic data found that the use of the alternative sign did not have an
impact on travel times in the vicinity of the work zone. Overall, the evaluation found that the alternative sign communicates information
clearly and does not cause any adverse impacts to work zone safety and operations.
17. Key Words
Lane changing; Lane use control signals; Work zone safety; Work
zone traffic control. Alternative signage; MUTCD; work zone
signage; safety
18. Distribution Statement
No restrictions. This document is available through the
National Technical Information Service, Springfield, VA
22161.
19. Security Classif. (of this report)
Unclassified.
20. Security Classif. (of this page)
Unclassified.
21. No. of Pages
105
22. Price
Form DOT F 1700.7 (8-72) Reproduction of completed page authorized
EVALUATION OF WORK ZONE SPLIT
TRAFFIC SYMBOL SIGN
Final Report
February 2018
Principal Investigator
Praveen Edara, Associate Professor
University of Missouri-Columbia
Co-Principal Investigators
Carlos Sun, Professor
Henry Brown, Research Engineer
University of Missouri-Columbia
Shawn Leight
Vice President/Chief Operations Officer
CBB Transportation Engineers and Planners
Research Assistants
Farzaneh Azadi and Yohan Chang
Authors
Praveen Edara, Carlos Sun, Henry Brown, Shawn Leight, and Emmanuel Nketah
Sponsored by
Missouri Department of Transportation,
Midwest Transportation Center, and
U.S. Department of Transportation
Office of the Assistant Secretary for Research and Technology
A report from
Institute for Transportation
Iowa State University
2711 South Loop Drive, Suite 4700
Ames, IA 50010-8664
Phone: 515-294-8103 / Fax: 515-294-0467
http://www.intrans.iastate.edu

v
TABLE OF CONTENTS
ACKNOWLEDGMENTS ............................................................................................................. ix
EXECUTIVE SUMMARY ........................................................................................................... xi
CHAPTER 1. INTRODUCTION ....................................................................................................1
1.1 Motivation ......................................................................................................................1 1.2 Overview of MUTCD Guidance on Warning Signs ......................................................1 1.3 Overview of I-170 Work Zone ......................................................................................3 1.4 Methodology Overview .................................................................................................8
CHAPTER 2. VIDEO DATA COLLECTION AND ANALYSIS .................................................9
2.1 Overview of Video Data ................................................................................................9 2.2 Video Data Collection..................................................................................................16
2.3 Analysis of Video Data ................................................................................................22
CHAPTER 3. STAKEHOLDER INTERVIEWS ..........................................................................43
3.1 Overview and Methodology ........................................................................................43
3.2 Summary of Results .....................................................................................................45
CHAPTER 4. DRIVER SURVEY ................................................................................................50
CHAPTER 5. CRASH DATA ANALYSIS ..................................................................................53
5.1 Overview and Methodology ........................................................................................53 5.2 Results of Crash Data Analysis....................................................................................56
5.3 Summary of Results of Crash Data Analysis ...............................................................69
CHAPTER 6. TRAVEL TIME ANALYSIS .................................................................................70
6.1 Introduction ..................................................................................................................70 6.2 Travel Time Data .........................................................................................................70
6.3 Study Area ...................................................................................................................73 6.4 Performance Measurement for Travel Time Analysis .................................................74 6.5 Travel Time Analysis ...................................................................................................75
CHAPTER 7. CONCLUSIONS ....................................................................................................78
REFERENCES ..............................................................................................................................79
APPENDIX A: CRASH DATA OUTPUT....................................................................................81
vi
LIST OF FIGURES
Figure ES.1. Horizontal alignment warning signs from MUTCD Section 6F............................... xi Figure ES.2. Alternative warning signs evaluated in this project .................................................. xi
Figure 1.1. Horizontal alignment warning signs from MUTCD Section 6F ...................................2 Figure 1.2.a. Alternative warning sign evaluated in this project .....................................................2 Figure 1.2.b. Optional alternative warning sign ..............................................................................2 Figure 1.3. Work zone site location map .........................................................................................3 Figure 1.4. Traffic control plan and signage for southbound I-170 .................................................5
Figure 1.5. Traffic control plan and signage for northbound I-170 .................................................6 Figure 1.6. Work zone split sign on northbound I-170 ....................................................................7 Figure 1.7. Gore point on northbound I-170 ....................................................................................7 Figure 2.1. Camera locations and views map ................................................................................11
Figure 2.2. Screenshot of northbound front view stationary video................................................12 Figure 2.3. Screenshot of northbound back view stationary video ................................................12
Figure 2.4. Screenshot of southbound front view stationary video ...............................................13 Figure 2.5. Screenshot of southbound back view stationary video................................................13 Figure 2.6. Screenshot of front view northbound drive-through video .........................................14
Figure 2.7. Screenshot of side view northbound drive-through video ...........................................15 Figure 2.8. Screenshot of front view southbound drive-through video .........................................15
Figure 2.9. Screenshot of front view southbound drive-through video .........................................16 Figure 2.10. Screenshots from northbound cameras before split sign placement
(11/30/2016) .......................................................................................................................17
Figure 2.11. Screenshot from northbound camera before split sign placement (12/3/2016) .........17 Figure 2.12. Screenshots from northbound cameras before split sign placement (12/6/2016) ......17
Figure 2.13. Screenshots from northbound drive-through cameras before split sign
placement (12/6/2016) .......................................................................................................18
Figure 2.14. Screenshots from southbound cameras during early construction with split
signs (12/7/2016) ...............................................................................................................19
Figure 2.15. Screenshots from southbound cameras during early construction with split
signs (12/10/2016) .............................................................................................................19 Figure 2.16. Screenshots from southbound drive-through cameras during early construction
with split signs (12/8/2016) ...............................................................................................20 Figure 2.17. Screenshots from northbound cameras during late construction with split signs
(12/15/2016) .......................................................................................................................21 Figure 2.18. Screenshots from northbound cameras during late construction with split signs
(12/17/2016) .......................................................................................................................21 Figure 2.19. Screenshots from northbound drive-through cameras during late construction
with split signs (12/15/2016) .............................................................................................22 Figure 2.20. Tractor-trailer making aggressive lane change causing queue (early
construction, northbound, morning peak) ..........................................................................37
Figure 2.21. Tractor-trailer making aggressive lane change causing following vehicle to
change lanes (early construction, northbound, morning peak) ..........................................38 Figure 2.22. Lane change near the gore example 1 (late construction, southbound, midday) ......39 Figure 2.23. Lane change near the gore example 2 (late construction, southbound, midday) ......39
vii
Figure 2.24. Vehicle driving through lane closure area to outside lane (early construction,
southbound, midday)..........................................................................................................40 Figure 2.25. Vehicle driving through lane closure area to middle lane (early construction,
southbound, midday)..........................................................................................................41 Figure 2.26. Multiple vehicles driving through lane closure area (early construction,
southbound, midday)..........................................................................................................41 Figure 2.27. Vehicle stopped in gore area (late construction, southbound, night) ........................42 Figure 4.1. MoDOT “Rate Our Work Zones” survey ....................................................................51
Figure 5.1. Beginning of southbound I-170 segment for safety analysis ......................................54 Figure 5.2. End of southbound I-170 segment for safety analysis .................................................54 Figure 5.3. Beginning of northbound I-170 segment for safety analysis .......................................55 Figure 5.4. End of northbound I-170 segment for safety analysis .................................................55 Figure 5.5. Crashes by month for I-170 southbound .....................................................................57
Figure 5.6. Crashes by type for I-170 southbound.........................................................................58 Figure 5.7. Crashes by severity for I-170 southbound ...................................................................59
Figure 5.8. Crashes by light condition for I-170 southbound ........................................................60 Figure 5.9. Crashes by road surface condition for I-170 southbound ............................................61
Figure 5.10. Crashes by month for I-170 northbound ...................................................................62 Figure 5.11. Crashes by type for I-170 northbound .......................................................................63
Figure 5.12. Crashes by severity for I-170 northbound .................................................................64 Figure 5.13. Crashes by light condition for I-170 northbound ......................................................65 Figure 5.14. Crashes by road surface condition for I-170 northbound ..........................................66
Figure 5.15. Crashes during work zone period by type .................................................................68 Figure 6.1. RITIS data query interface and detector deployment in St. Louis area.......................71
Figure 6.2. Screenshot of RITIS output .........................................................................................72
Figure 6.3. RITIS data description .................................................................................................73
Figure 6.4. Study area for operational analysis using RITIS .........................................................74 Figure 6.5. Average travel time difference from three-week average travel time (HATT) ...........77
Figure 6.6. Average travel time difference from year ago travel time (HYTT) ............................77
viii
LIST OF TABLES
Table 1.1. Work zone split sign (Stage 2) construction schedule for December 2016 ....................4 Table 2.1. Work zone split sign (Stage 2) data collection schedule ..............................................10
Table 2.2. Summary of video monitoring time periods used for analysis .....................................23 Table 2.3. Results for sign visibility from drive-through videos ...................................................25 Table 2.4. Observed traffic flows ..................................................................................................26 Table 2.5. Observed lane changes before gore point .....................................................................28 Table 2.6. Percent change in lane change rate by time period .......................................................30
Table 2.7. Distribution of lane changes by time period .................................................................32 Table 2.8. Distribution of vehicles by initial and final lane ...........................................................34 Table 2.9. Time headways for lane changes before gore point .....................................................36 Table 3.1. List of questions for stakeholder interviews .................................................................44
Table 3.2. Summary of interview responses from MoDOT personnel ..........................................46 Table 3.3. Summary of interview responses from contractor personnel .......................................48
Table 5.1. Crashes by month for I-170 southbound.......................................................................56 Table 5.2. Crashes by month for I-170 northbound .......................................................................62 Table 5.3. Summary of crashes during work zone period .............................................................67
Table 5.4. Dates for work zone and alternative sign......................................................................68 Table 6.1. AADT for the study routes in 2015 ..............................................................................74
Table 6.2. Dates used for HATT and HYTT analyses ...................................................................75 Table 6.3. Calculated HATT and HYTT differences (seconds per mile) ......................................76 Table A.1. TMS Accident Browser output from selected fields for 2015 and 2016 crashes ........81
ix
ACKNOWLEDGMENTS
The authors would like to thank the sponsors for their financial support and technical assistance.
The sponsors included the Missouri Department of Transportation (MoDOT), the Midwest
Transportation Center, and the U.S. Department of Transportation Office of the Assistant
Secretary for Research and Technology.
The authors appreciate the guidance provided by Jen Harper (MoDOT), Lee Hillner (MoDOT),
Niall Jansson (MoDOT), Dan Smith (MoDOT), Julie Stotlemeyer (MoDOT), and Marc
Thornsberry, (Federal Highway Administration). The authors thank Lee Hillner and Niall
Jansson for helping to coordinate the field work and camera placement. The authors also express
their gratitude to the MoDOT and contractor personnel who participated in the stakeholder
interviews. The authors appreciate the efforts of Carson Bettendorf, Jacob Kaltenbronn, Jeremy
Metz, John Perlik, and Eunice Wang in processing the video data.

xi
EXECUTIVE SUMMARY
Effective signage that is easily understood facilitates safe driving through a work zone. The
Manual on Uniform Traffic Control Devices (MUTCD) (FHWA 2009) provides guidance on
signage for temporary traffic control (TTC) in work zones. While the MUTCD guidance is
suitable for many conditions, there may be instances where alternative signage may be more
effective at enhancing safety.
In this project, the use of alternative signage for closure of a middle lane in a freeway work zone
was evaluated based on its implementation at a work zone for a Missouri bridge rehabilitation
project on I-170 near I-70 in December 2016. The work zone activity called for the shifting of
three lanes, two lanes around one side and one lane around the other side of the work area.
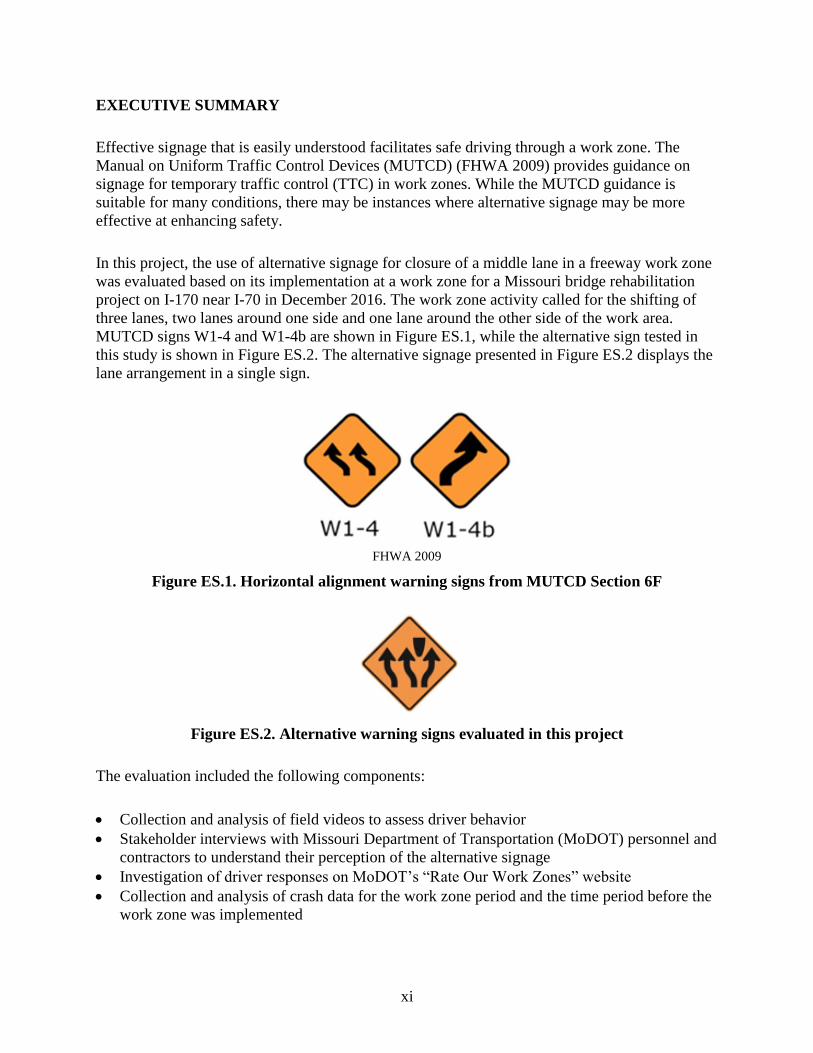
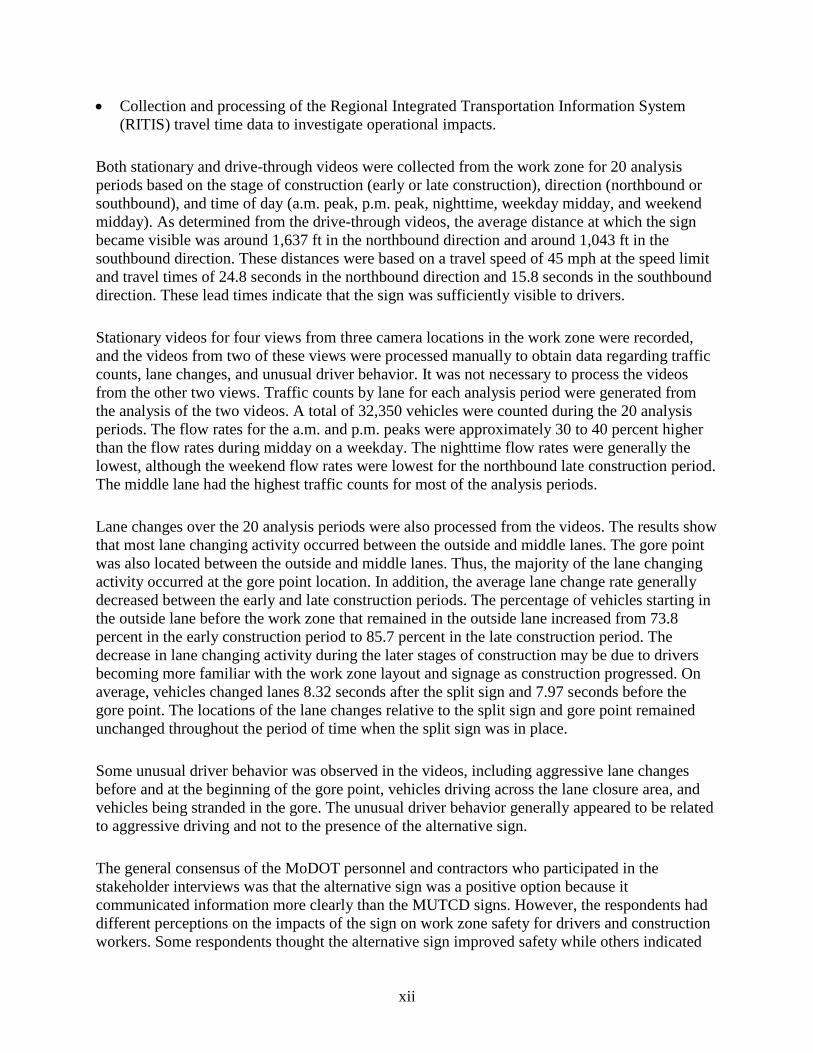
MUTCD signs W1-4 and W1-4b are shown in Figure ES.1, while the alternative sign tested in
this study is shown in Figure ES.2. The alternative signage presented in Figure ES.2 displays the
lane arrangement in a single sign.
FHWA 2009
Figure ES.1. Horizontal alignment warning signs from MUTCD Section 6F
Figure ES.2. Alternative warning signs evaluated in this project
The evaluation included the following components:
Collection and analysis of field videos to assess driver behavior
Stakeholder interviews with Missouri Department of Transportation (MoDOT) personnel and
contractors to understand their perception of the alternative signage
Investigation of driver responses on MoDOT’s “Rate Our Work Zones” website
Collection and analysis of crash data for the work zone period and the time period before the
work zone was implemented
xii
Collection and processing of the Regional Integrated Transportation Information System
(RITIS) travel time data to investigate operational impacts.
Both stationary and drive-through videos were collected from the work zone for 20 analysis
periods based on the stage of construction (early or late construction), direction (northbound or
southbound), and time of day (a.m. peak, p.m. peak, nighttime, weekday midday, and weekend
midday). As determined from the drive-through videos, the average distance at which the sign
became visible was around 1,637 ft in the northbound direction and around 1,043 ft in the
southbound direction. These distances were based on a travel speed of 45 mph at the speed limit
and travel times of 24.8 seconds in the northbound direction and 15.8 seconds in the southbound
direction. These lead times indicate that the sign was sufficiently visible to drivers.
Stationary videos for four views from three camera locations in the work zone were recorded,
and the videos from two of these views were processed manually to obtain data regarding traffic
counts, lane changes, and unusual driver behavior. It was not necessary to process the videos
from the other two views. Traffic counts by lane for each analysis period were generated from
the analysis of the two videos. A total of 32,350 vehicles were counted during the 20 analysis
periods. The flow rates for the a.m. and p.m. peaks were approximately 30 to 40 percent higher
than the flow rates during midday on a weekday. The nighttime flow rates were generally the
lowest, although the weekend flow rates were lowest for the northbound late construction period.
The middle lane had the highest traffic counts for most of the analysis periods.
Lane changes over the 20 analysis periods were also processed from the videos. The results show
that most lane changing activity occurred between the outside and middle lanes. The gore point
was also located between the outside and middle lanes. Thus, the majority of the lane changing
activity occurred at the gore point location. In addition, the average lane change rate generally
decreased between the early and late construction periods. The percentage of vehicles starting in
the outside lane before the work zone that remained in the outside lane increased from 73.8
percent in the early construction period to 85.7 percent in the late construction period. The
decrease in lane changing activity during the later stages of construction may be due to drivers
becoming more familiar with the work zone layout and signage as construction progressed. On
average, vehicles changed lanes 8.32 seconds after the split sign and 7.97 seconds before the
gore point. The locations of the lane changes relative to the split sign and gore point remained
unchanged throughout the period of time when the split sign was in place.
Some unusual driver behavior was observed in the videos, including aggressive lane changes
before and at the beginning of the gore point, vehicles driving across the lane closure area, and
vehicles being stranded in the gore. The unusual driver behavior generally appeared to be related
to aggressive driving and not to the presence of the alternative sign.
The general consensus of the MoDOT personnel and contractors who participated in the
stakeholder interviews was that the alternative sign was a positive option because it
communicated information more clearly than the MUTCD signs. However, the respondents had
different perceptions on the impacts of the sign on work zone safety for drivers and construction
workers. Some respondents thought the alternative sign improved safety while others indicated
xiii
that the safety level was the same because they did not think that drivers pay attention to the
signs. Respondents did not think that the use of the alternative sign had any effect on work zone
delays. The interviewees, both MODOT and contractor staff, were generally positive in their
assessment of the alternative sign.
The survey responses from MoDOT’s “Rate our Work Zones” survey were reviewed to
determine if drivers gave any feedback regarding the use of the alternative signs. Drivers who
completed the survey did not express any concerns regarding the use of the new split signs on the
I-170 project.
Crash data from 2015 and 2016 were reviewed to assess possible safety impacts of the use of the
alternative signage. A total of 265 crashes occurred in 2015 and 2016 on this section of I-170
between I-70 and St. Charles Rock Road. The most common types of crashes were rear-end, out
of control, and passing crashes. The number of crashes generally decreased from 2015 to 2016,
and there were 13 crashes on this section of I-170 while the work zone was in place. The crash
patterns during the work zone period were similar to the crash patterns before the work zone was
in place. Almost all of the crashes during the work zone period were due to lane changing,
passing, or rear-end collisions, although there was one crash caused by a vehicle losing control.
A detailed review of the crash reports found that the use of the alternative sign did not appear to
be a contributing factor to any of these crashes.
Travel time data from RITIS were processed to assess any operational impacts due to the use of
the alternative sign. Travel time analysis was conducted on the I-170 work zone segment and in
the vicinity of the work zone segment, including sections of I-170 upstream and downstream
from the work zone and adjacent routes (I-70 and Natural Bridge Road). The analysis compared
travel times during the period the alternative sign was in place (October 27, 2016 to November
16, 2016) with the time period from one year earlier. The results showed that there were no
significant travel time differences between the two time periods. Thus, the use of the alternative
sign did not have any adverse impacts on operations in the vicinity of the work zone.
The investigation of the use of the alternative sign on the I-170 project found that the alternative
sign has great potential for use on freeway work zones with lane closures in the middle lane. The
stakeholders believed that it communicated information more effectively to drivers, and the use
of the sign did not appear to create any adverse impacts on operations or safety.

1
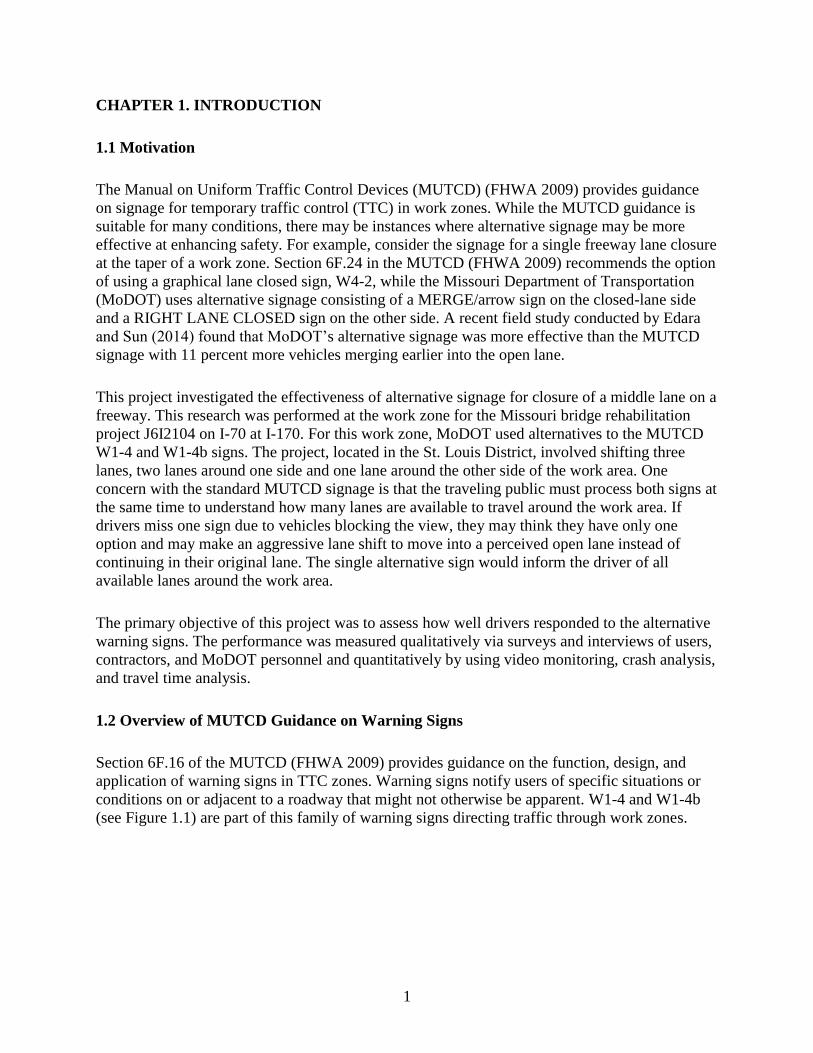
CHAPTER 1. INTRODUCTION
1.1 Motivation
The Manual on Uniform Traffic Control Devices (MUTCD) (FHWA 2009) provides guidance
on signage for temporary traffic control (TTC) in work zones. While the MUTCD guidance is
suitable for many conditions, there may be instances where alternative signage may be more
effective at enhancing safety. For example, consider the signage for a single freeway lane closure
at the taper of a work zone. Section 6F.24 in the MUTCD (FHWA 2009) recommends the option
of using a graphical lane closed sign, W4-2, while the Missouri Department of Transportation
(MoDOT) uses alternative signage consisting of a MERGE/arrow sign on the closed-lane side
and a RIGHT LANE CLOSED sign on the other side. A recent field study conducted by Edara
and Sun (2014) found that MoDOT’s alternative signage was more effective than the MUTCD
signage with 11 percent more vehicles merging earlier into the open lane.
This project investigated the effectiveness of alternative signage for closure of a middle lane on a
freeway. This research was performed at the work zone for the Missouri bridge rehabilitation
project J6I2104 on I-70 at I-170. For this work zone, MoDOT used alternatives to the MUTCD
W1-4 and W1-4b signs. The project, located in the St. Louis District, involved shifting three
lanes, two lanes around one side and one lane around the other side of the work area. One
concern with the standard MUTCD signage is that the traveling public must process both signs at
the same time to understand how many lanes are available to travel around the work area. If
drivers miss one sign due to vehicles blocking the view, they may think they have only one
option and may make an aggressive lane shift to move into a perceived open lane instead of
continuing in their original lane. The single alternative sign would inform the driver of all
available lanes around the work area.
The primary objective of this project was to assess how well drivers responded to the alternative
warning signs. The performance was measured qualitatively via surveys and interviews of users,
contractors, and MoDOT personnel and quantitatively by using video monitoring, crash analysis,
and travel time analysis.
1.2 Overview of MUTCD Guidance on Warning Signs
Section 6F.16 of the MUTCD (FHWA 2009) provides guidance on the function, design, and
application of warning signs in TTC zones. Warning signs notify users of specific situations or
conditions on or adjacent to a roadway that might not otherwise be apparent. W1-4 and W1-4b
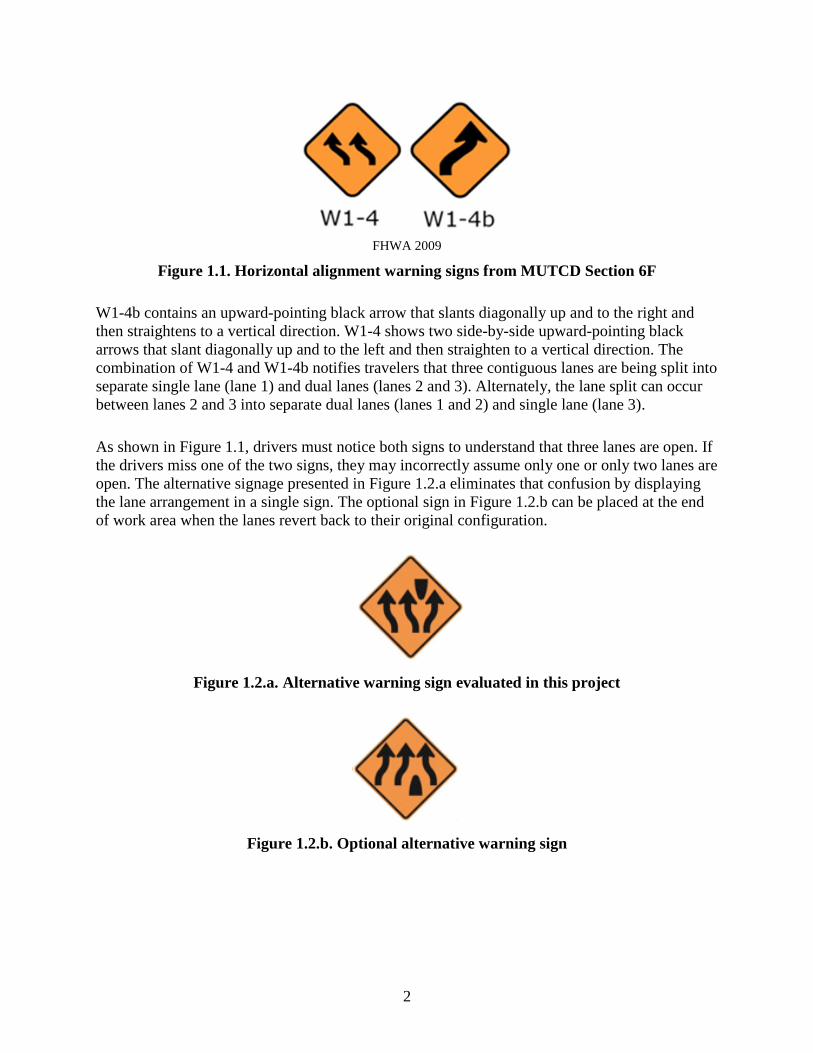
(see Figure 1.1) are part of this family of warning signs directing traffic through work zones.
2
FHWA 2009
Figure 1.1. Horizontal alignment warning signs from MUTCD Section 6F
W1-4b contains an upward-pointing black arrow that slants diagonally up and to the right and
then straightens to a vertical direction. W1-4 shows two side-by-side upward-pointing black
arrows that slant diagonally up and to the left and then straighten to a vertical direction. The
combination of W1-4 and W1-4b notifies travelers that three contiguous lanes are being split into
separate single lane (lane 1) and dual lanes (lanes 2 and 3). Alternately, the lane split can occur
between lanes 2 and 3 into separate dual lanes (lanes 1 and 2) and single lane (lane 3).
As shown in Figure 1.1, drivers must notice both signs to understand that three lanes are open. If
the drivers miss one of the two signs, they may incorrectly assume only one or only two lanes are
open. The alternative signage presented in Figure 1.2.a eliminates that confusion by displaying
the lane arrangement in a single sign. The optional sign in Figure 1.2.b can be placed at the end
of work area when the lanes revert back to their original configuration.
Figure 1.2.a. Alternative warning sign evaluated in this project
Figure 1.2.b. Optional alternative warning sign

3
1.3 Overview of I-170 Work Zone
A work zone located on I-170 south of I-70 was selected as an ideal field site for investigating
the use of the alternative warning signs. Figure 1.3 illustrates the general location of the work
zone split traffic symbol sign project relative to the surrounding area.
Imagery © 2016 Google Map data © 2016 Google
Figure 1.3. Work zone site location map
The work zone was part of MoDOT project J6I2104, which included 12 bridge rehabilitations at
the interchange of I-70 and I-170. The work zone began on November 30, 2016 and ended on
December 31, 2016.
The work zone was divided into three stages, with the alternative split signs in use during the
second stage. As shown in the construction schedule in Table 1.1, the southbound work zone
split sign was posted December 7, 2016 and the northbound split sign was posted December 10,
2016.

4
Table 1.1. Work zone split sign (Stage 2) construction schedule for December 2016
Sunday Monday Tuesday Wednesday Thursday Friday Saturday
Dec 4 Dec 5 Dec 6 Dec 7
SB Day 1
Dec 8
SB Day 2
Dec 9
SB Day 3
Dec 10
SB Day 4
NB Day 1
Dec 11
SB Day 5
NB Day 2
Dec 12
SB Day 6
NB Day 3
Dec 13
SB Day 7
NB Day 4
Dec 14
SB Day 8
NB Day 5
Dec 15
SB Day 9
NB Day 6
Dec 16
SB Day 10
NB Day 7
Dec 17
SB Day 11
NB Day 8
Dec 18
SB Day 12
NB Day 9
Dec 19
SB Day 13
NB Day 10
Dec 20
SB Day 14
NB Day 11
Dec 21
SB Day 15
NB Day 12
Dec 22 Dec 23 Dec 24
Both signs were removed on December 21, 2016. During the second stage of the project, one
lane of traffic (lane 3) shifted to the right while two lanes of traffic (lanes 1 and 2) shifted to the
left.
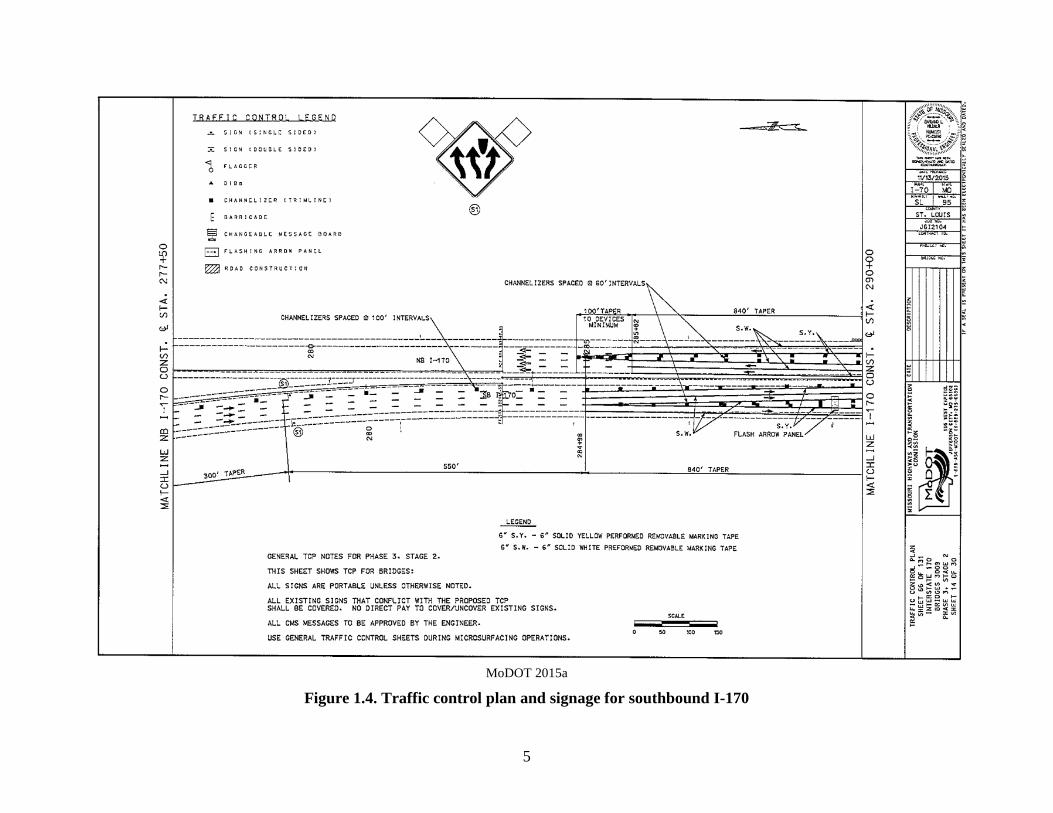
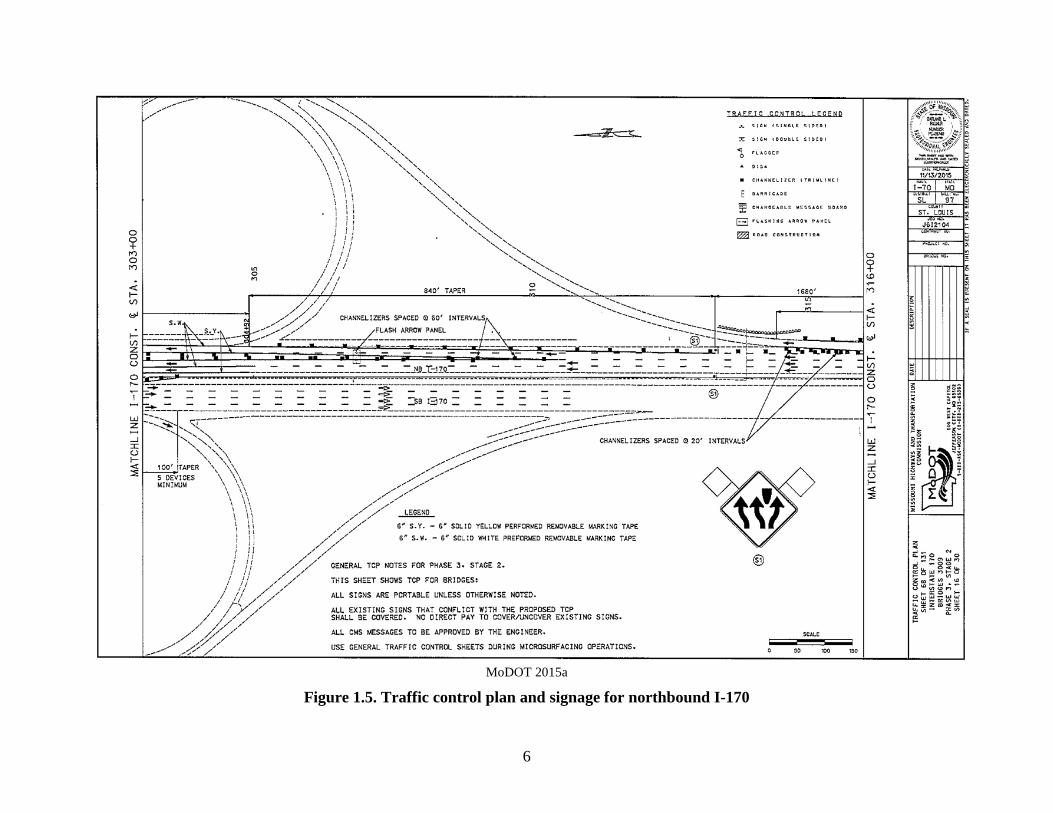
Figures 1.4 and 1.5 are sheets from the project traffic control plans that show the layout of the
signage and markings in the split area. As shown in the figures, channelizers, white and yellow
preformed removable marking tape, and an arrow board were used along with the split sign to
delineate the vehicle paths for each lane.
5
MoDOT 2015a
Figure 1.4. Traffic control plan and signage for southbound I-170
6
MoDOT 2015a
Figure 1.5. Traffic control plan and signage for northbound I-170
7
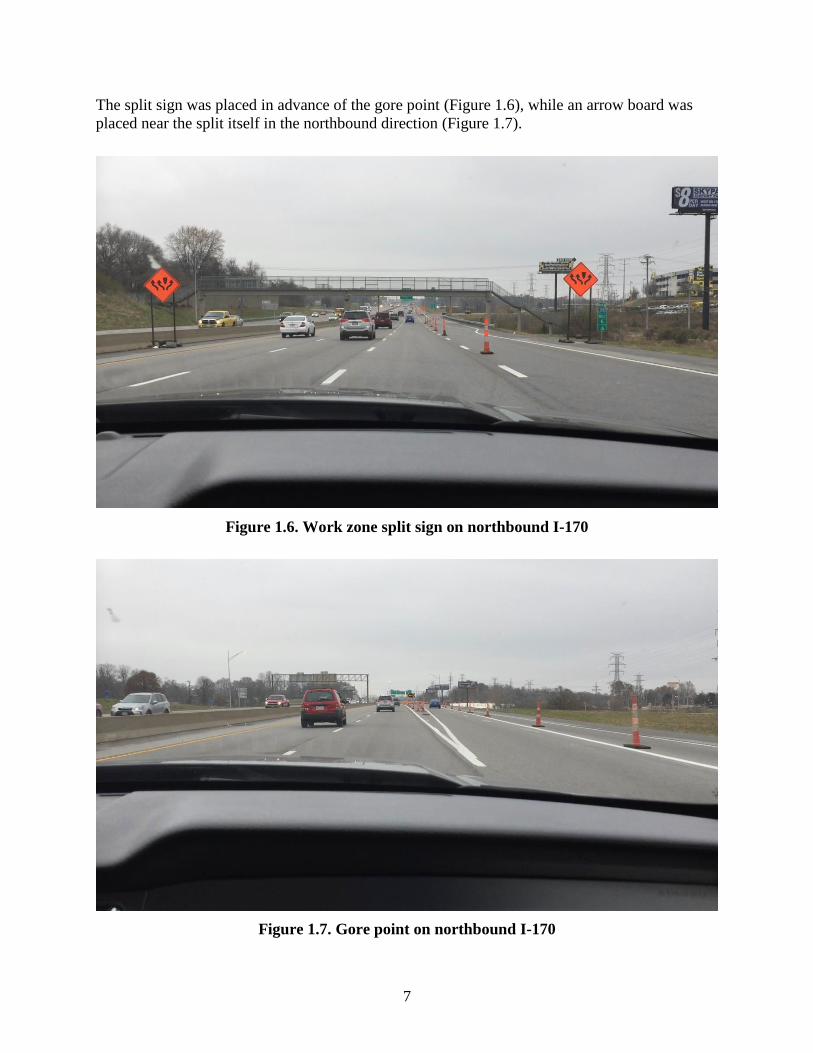
The split sign was placed in advance of the gore point (Figure 1.6), while an arrow board was
placed near the split itself in the northbound direction (Figure 1.7).
Figure 1.6. Work zone split sign on northbound I-170
Figure 1.7. Gore point on northbound I-170

8
In the field deployment, the optional sign shown in Figure 1.2.b was not utilized. The lanes
tapered over a length of 840 ft at the beginning of the split.
1.4 Methodology Overview
Both qualitative and quantitative measures were used to evaluate the effectiveness of the
alternative signs. The methods used for the assessment are as follows:
Collection and analysis of drive-through videos to understand the driver’s perspective and
evaluate sign visibility
Collection and processing of stationary videos to assess driver behavior
Stakeholder interviews with contractor and MoDOT personnel to learn their views on the
effectiveness of the signs
Driver survey to obtain opinions about the signs’ effectiveness from drivers who travelled
through the work zone
Analysis of crash data for the work zone period and time period prior to the work zone
commencement
Travel time analysis for the work zone period and time period prior to the work zone
commencement
The rest of this report is as follows. Chapter 2 presents the methodology and results for the drive-
through and stationary videos. The stakeholder interviews are discussed in Chapter 3, while the
driver survey is described in Chapter 4. The crash data and travel time analyses are presented in
Chapters 5 and 6, respectively. Chapter 7 includes the conclusions and summary of findings from
the research.
9
CHAPTER 2. VIDEO DATA COLLECTION AND ANALYSIS
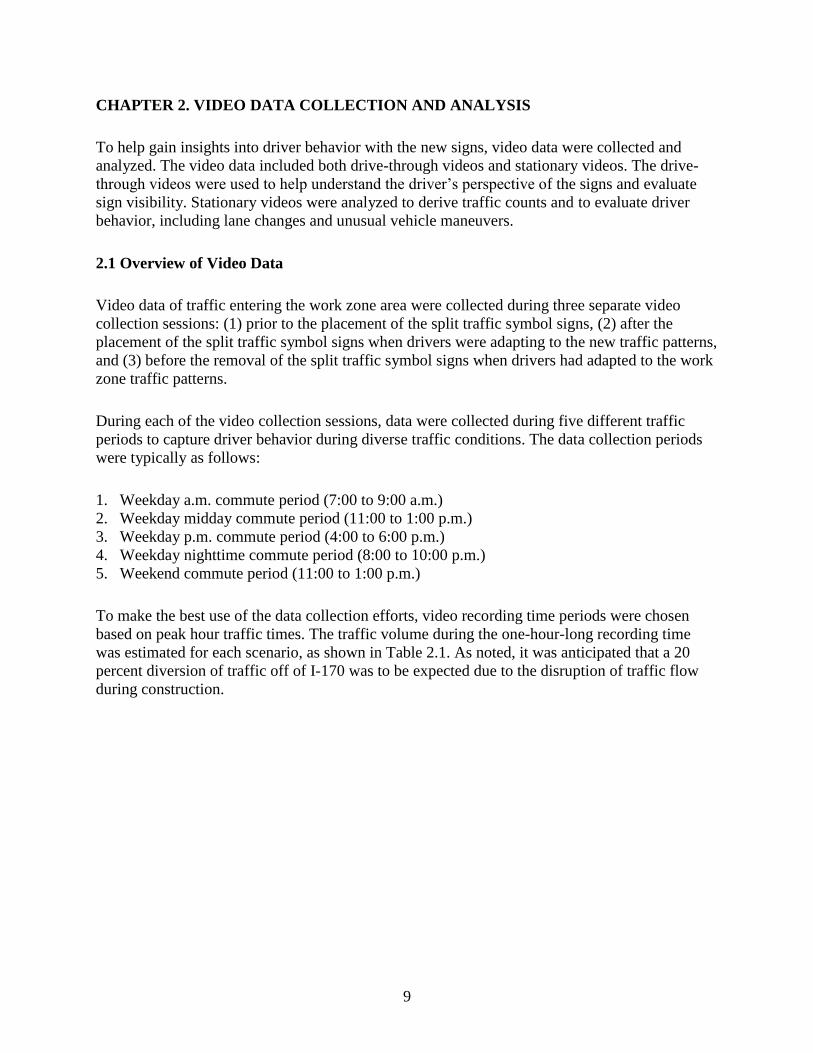
To help gain insights into driver behavior with the new signs, video data were collected and
analyzed. The video data included both drive-through videos and stationary videos. The drive-
through videos were used to help understand the driver’s perspective of the signs and evaluate
sign visibility. Stationary videos were analyzed to derive traffic counts and to evaluate driver
behavior, including lane changes and unusual vehicle maneuvers.
2.1 Overview of Video Data
Video data of traffic entering the work zone area were collected during three separate video
collection sessions: (1) prior to the placement of the split traffic symbol signs, (2) after the
placement of the split traffic symbol signs when drivers were adapting to the new traffic patterns,
and (3) before the removal of the split traffic symbol signs when drivers had adapted to the work
zone traffic patterns.
During each of the video collection sessions, data were collected during five different traffic
periods to capture driver behavior during diverse traffic conditions. The data collection periods
were typically as follows:
1. Weekday a.m. commute period (7:00 to 9:00 a.m.)
2. Weekday midday commute period (11:00 to 1:00 p.m.)
3. Weekday p.m. commute period (4:00 to 6:00 p.m.)
4. Weekday nighttime commute period (8:00 to 10:00 p.m.)
5. Weekend commute period (11:00 to 1:00 p.m.)
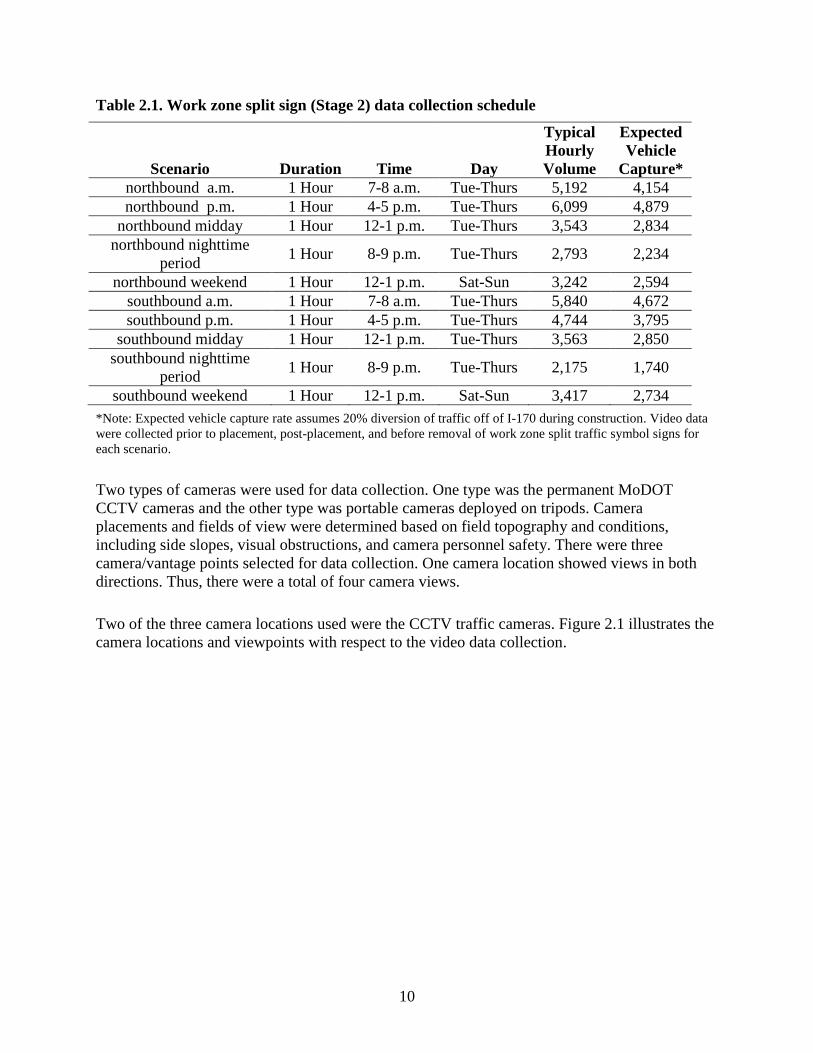
To make the best use of the data collection efforts, video recording time periods were chosen
based on peak hour traffic times. The traffic volume during the one-hour-long recording time
was estimated for each scenario, as shown in Table 2.1. As noted, it was anticipated that a 20
percent diversion of traffic off of I-170 was to be expected due to the disruption of traffic flow
during construction.
10
Table 2.1. Work zone split sign (Stage 2) data collection schedule
Scenario Duration Time Day
Typical
Hourly
Volume
Expected
Vehicle
Capture*
northbound a.m. 1 Hour 7-8 a.m. Tue-Thurs 5,192 4,154
northbound p.m. 1 Hour 4-5 p.m. Tue-Thurs 6,099 4,879
northbound midday 1 Hour 12-1 p.m. Tue-Thurs 3,543 2,834
northbound nighttime
period 1 Hour 8-9 p.m. Tue-Thurs 2,793 2,234
northbound weekend 1 Hour 12-1 p.m. Sat-Sun 3,242 2,594
southbound a.m. 1 Hour 7-8 a.m. Tue-Thurs 5,840 4,672
southbound p.m. 1 Hour 4-5 p.m. Tue-Thurs 4,744 3,795
southbound midday 1 Hour 12-1 p.m. Tue-Thurs 3,563 2,850
southbound nighttime
period 1 Hour 8-9 p.m. Tue-Thurs 2,175 1,740
southbound weekend 1 Hour 12-1 p.m. Sat-Sun 3,417 2,734
*Note: Expected vehicle capture rate assumes 20% diversion of traffic off of I-170 during construction. Video data
were collected prior to placement, post-placement, and before removal of work zone split traffic symbol signs for
each scenario.
Two types of cameras were used for data collection. One type was the permanent MoDOT
CCTV cameras and the other type was portable cameras deployed on tripods. Camera
placements and fields of view were determined based on field topography and conditions,
including side slopes, visual obstructions, and camera personnel safety. There were three
camera/vantage points selected for data collection. One camera location showed views in both
directions. Thus, there were a total of four camera views.
Two of the three camera locations used were the CCTV traffic cameras. Figure 2.1 illustrates the
camera locations and viewpoints with respect to the video data collection.
11
Imagery © 2016 Google Map data © 2016 Google
Figure 2.1. Camera locations and views map
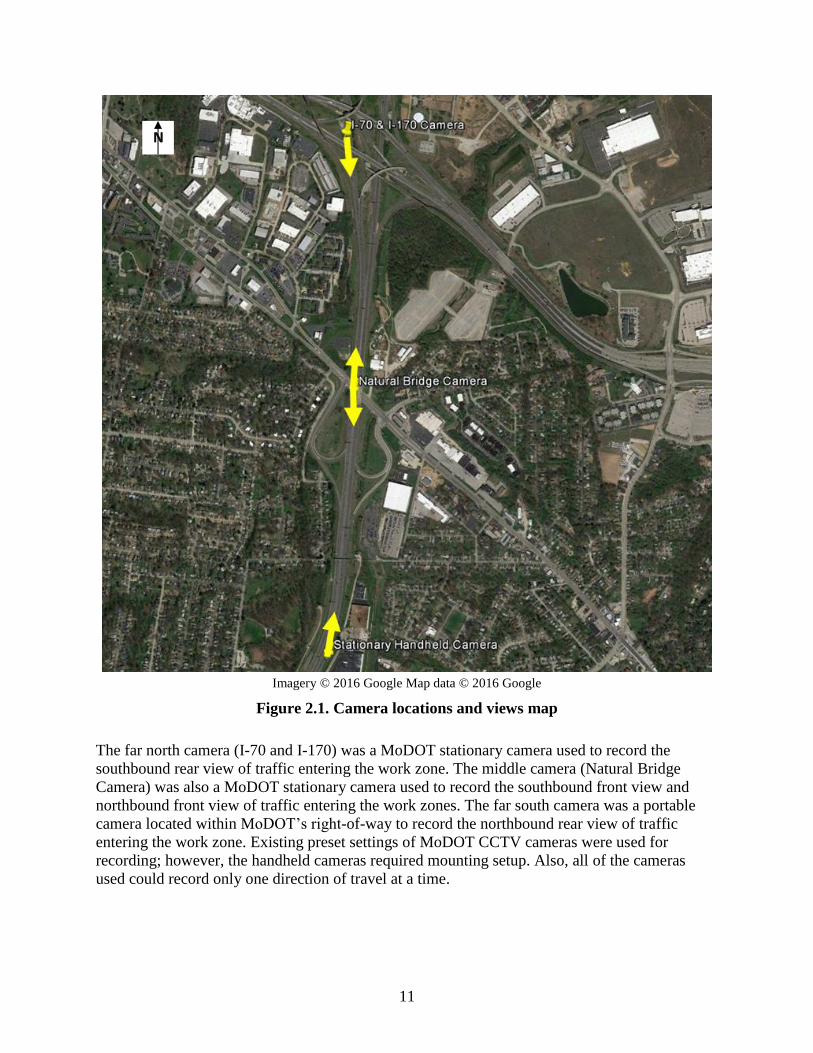
The far north camera (I-70 and I-170) was a MoDOT stationary camera used to record the
southbound rear view of traffic entering the work zone. The middle camera (Natural Bridge
Camera) was also a MoDOT stationary camera used to record the southbound front view and
northbound front view of traffic entering the work zones. The far south camera was a portable
camera located within MoDOT’s right-of-way to record the northbound rear view of traffic
entering the work zone. Existing preset settings of MoDOT CCTV cameras were used for
recording; however, the handheld cameras required mounting setup. Also, all of the cameras
used could record only one direction of travel at a time.
12
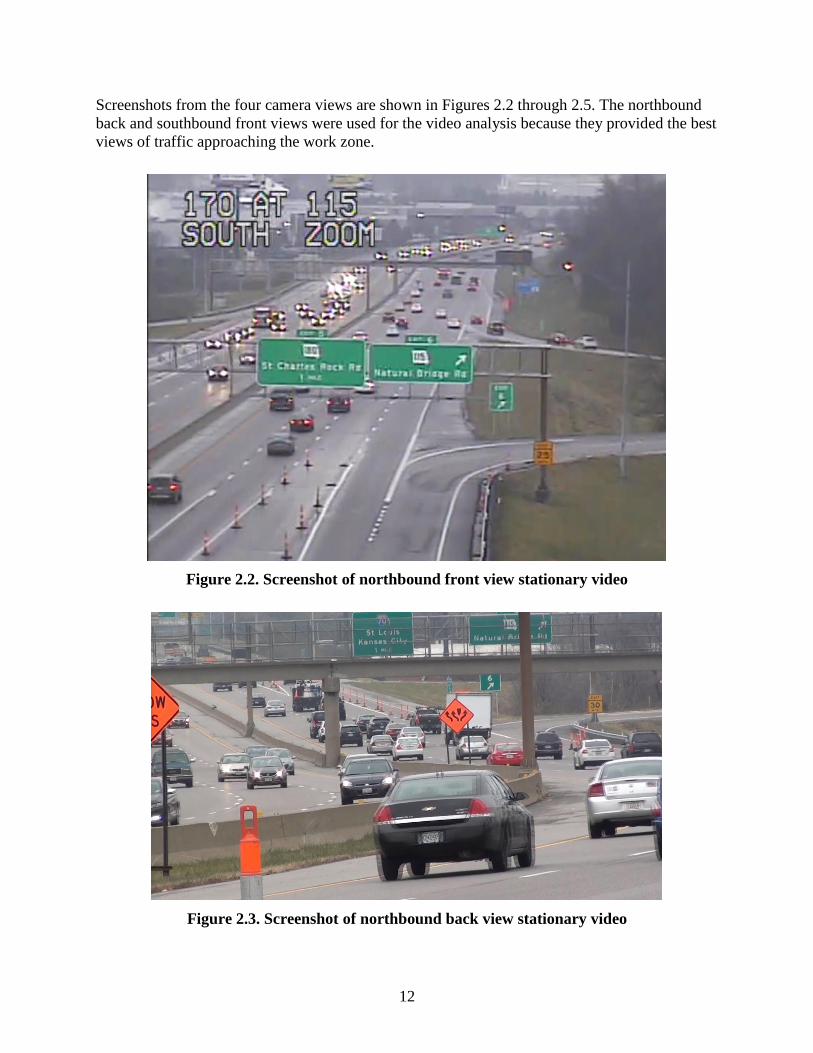
Screenshots from the four camera views are shown in Figures 2.2 through 2.5. The northbound
back and southbound front views were used for the video analysis because they provided the best
views of traffic approaching the work zone.
Figure 2.2. Screenshot of northbound front view stationary video
Figure 2.3. Screenshot of northbound back view stationary video

13
Figure 2.4. Screenshot of southbound front view stationary video
Figure 2.5. Screenshot of southbound back view stationary video

14
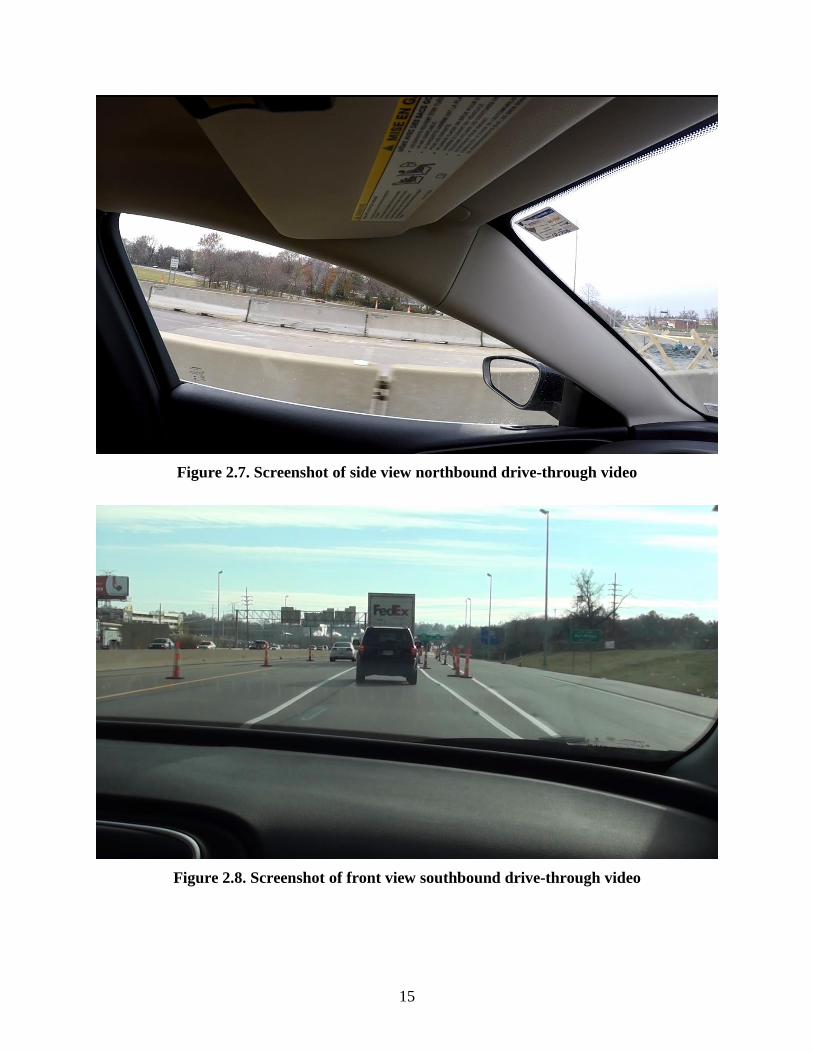
In addition to the stationary cameras, two cameras were mounted inside a test vehicle to capture
views of drivers travelling through the work zone. A GoPro HERO5 Black 4K Ultra HD Action
Camera was mounted to the center rear view mirror inside the vehicle to capture a side view of
vehicles progressing through the work zone, and a handheld recording camera was mounted to
the passenger seat to capture a driving view of vehicles progressing through the work zone. A
minimum of two drive-through videos per scenario were captured. A total of 60 drive-through
videos were collected during the earlier construction period, while 48 drive-through videos were
collected during the later construction period. Sample screenshots for the videos can be seen in
Figures 2.6 through 2.9.
Figure 2.6. Screenshot of front view northbound drive-through video
15
Figure 2.7. Screenshot of side view northbound drive-through video
Figure 2.8. Screenshot of front view southbound drive-through video
16
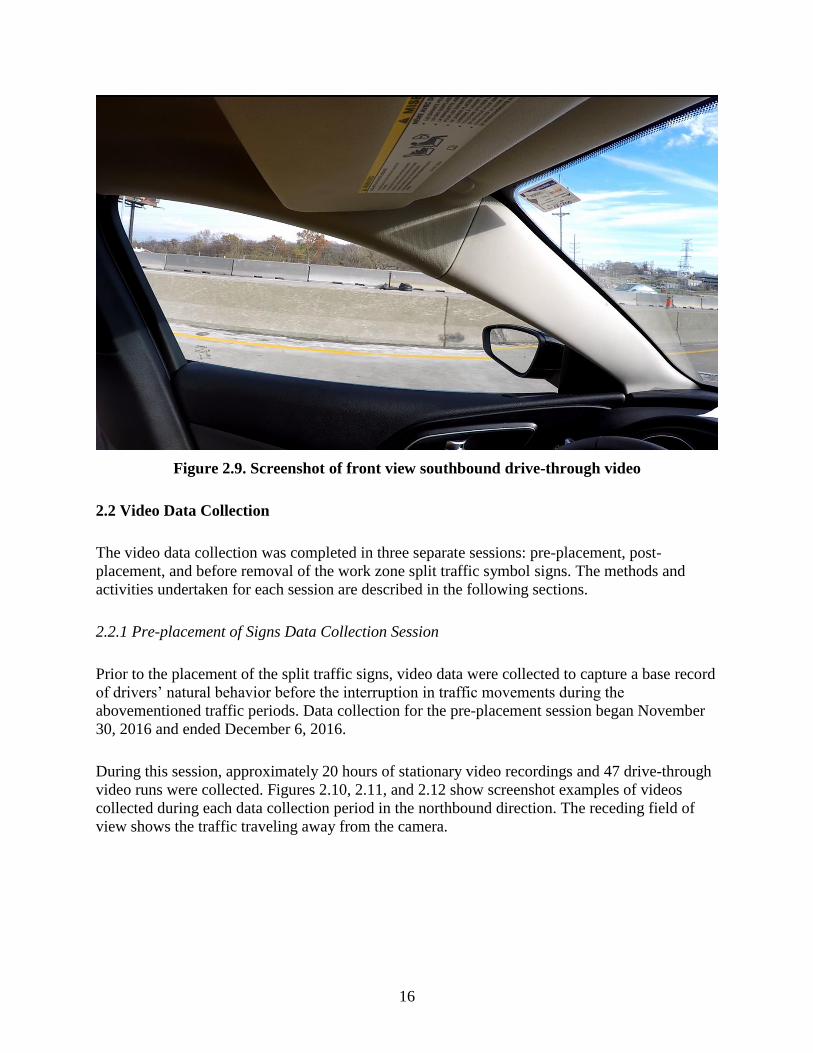
Figure 2.9. Screenshot of front view southbound drive-through video
2.2 Video Data Collection
The video data collection was completed in three separate sessions: pre-placement, post-
placement, and before removal of the work zone split traffic symbol signs. The methods and
activities undertaken for each session are described in the following sections.
2.2.1 Pre-placement of Signs Data Collection Session
Prior to the placement of the split traffic signs, video data were collected to capture a base record
of drivers’ natural behavior before the interruption in traffic movements during the
abovementioned traffic periods. Data collection for the pre-placement session began November
30, 2016 and ended December 6, 2016.
During this session, approximately 20 hours of stationary video recordings and 47 drive-through
video runs were collected. Figures 2.10, 2.11, and 2.12 show screenshot examples of videos
collected during each data collection period in the northbound direction. The receding field of
view shows the traffic traveling away from the camera.

17
Figure 2.10. Screenshots from northbound cameras before split sign placement
(11/30/2016)
Figure 2.11. Screenshot from northbound camera before split sign placement (12/3/2016)
Figure 2.12. Screenshots from northbound cameras before split sign placement (12/6/2016)
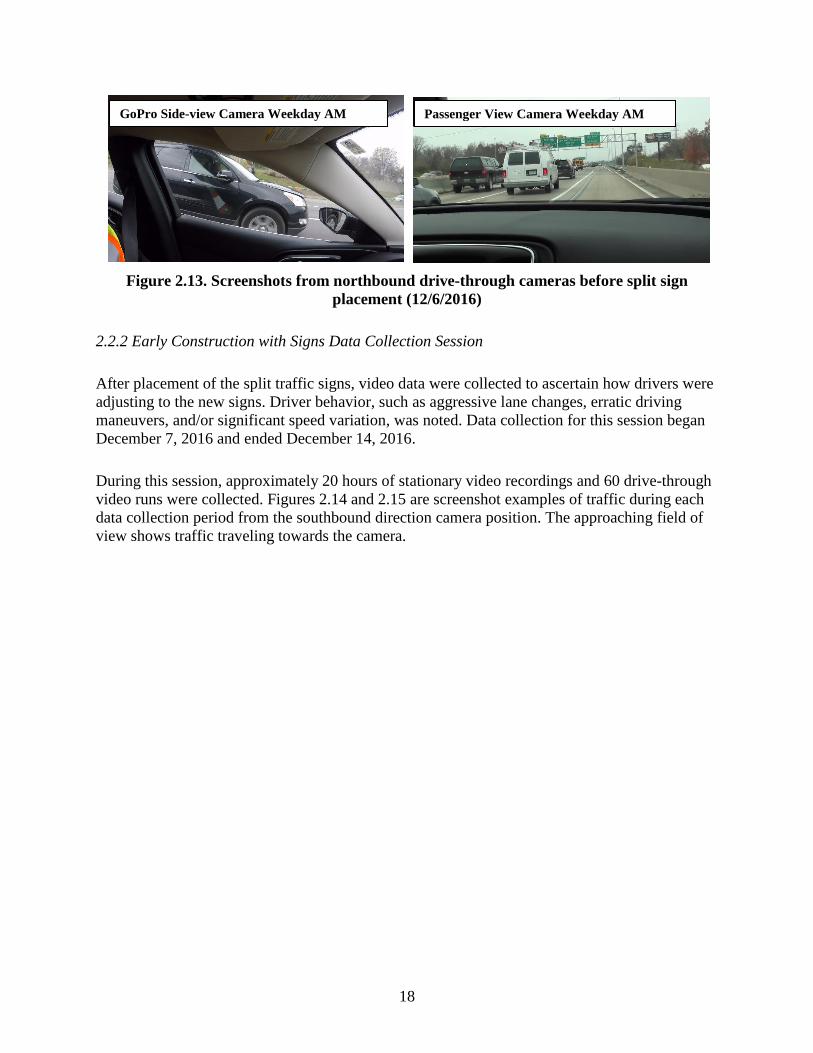
Figure 2.13 shows screenshot examples of the drive-through camera views during the
northbound a.m. peak commute period.
Stationary Handheld
Camera Weekend Midday
Stationary Handheld
Camera Weekday Midday
Stationary Handheld
Camera Weekday Nighttime
Stationary Handheld
Camera Weekday AM
Stationary Handheld
Camera Weekday PM
18
Figure 2.13. Screenshots from northbound drive-through cameras before split sign
placement (12/6/2016)
2.2.2 Early Construction with Signs Data Collection Session
After placement of the split traffic signs, video data were collected to ascertain how drivers were
adjusting to the new signs. Driver behavior, such as aggressive lane changes, erratic driving
maneuvers, and/or significant speed variation, was noted. Data collection for this session began
December 7, 2016 and ended December 14, 2016.
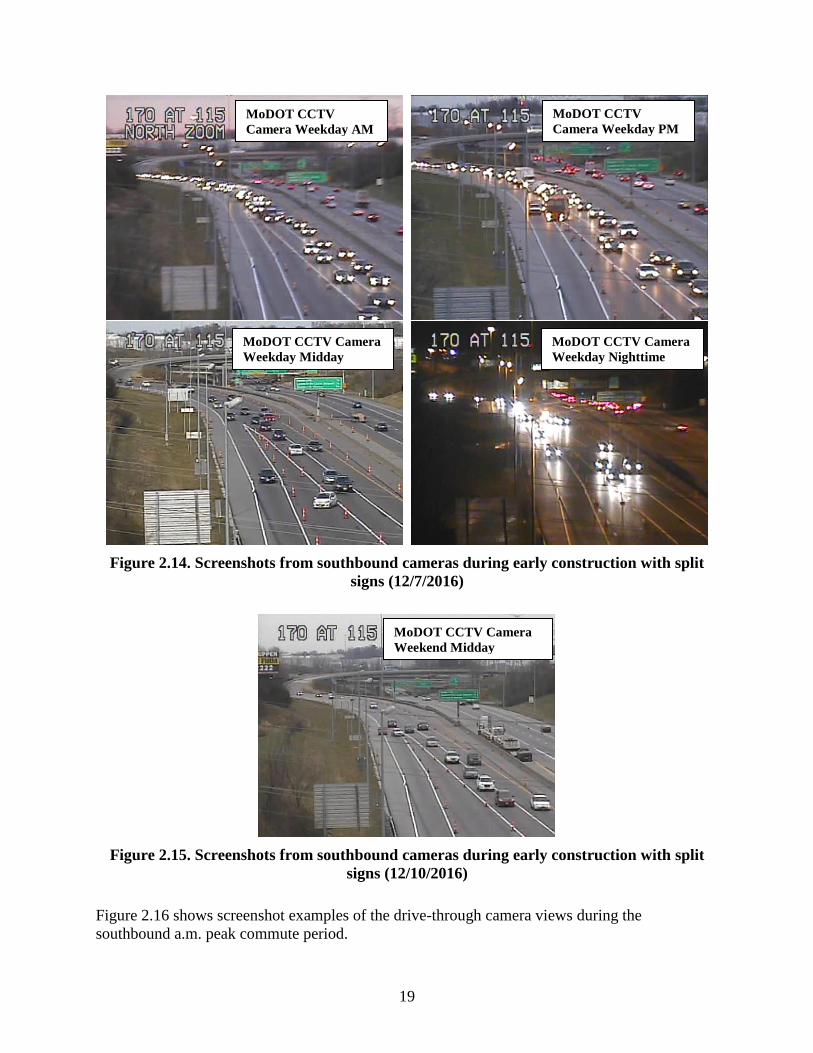
During this session, approximately 20 hours of stationary video recordings and 60 drive-through
video runs were collected. Figures 2.14 and 2.15 are screenshot examples of traffic during each
data collection period from the southbound direction camera position. The approaching field of
view shows traffic traveling towards the camera.
GoPro Side-view Camera Weekday AM Passenger View Camera Weekday AM
19
Figure 2.14. Screenshots from southbound cameras during early construction with split
signs (12/7/2016)
Figure 2.15. Screenshots from southbound cameras during early construction with split
signs (12/10/2016)
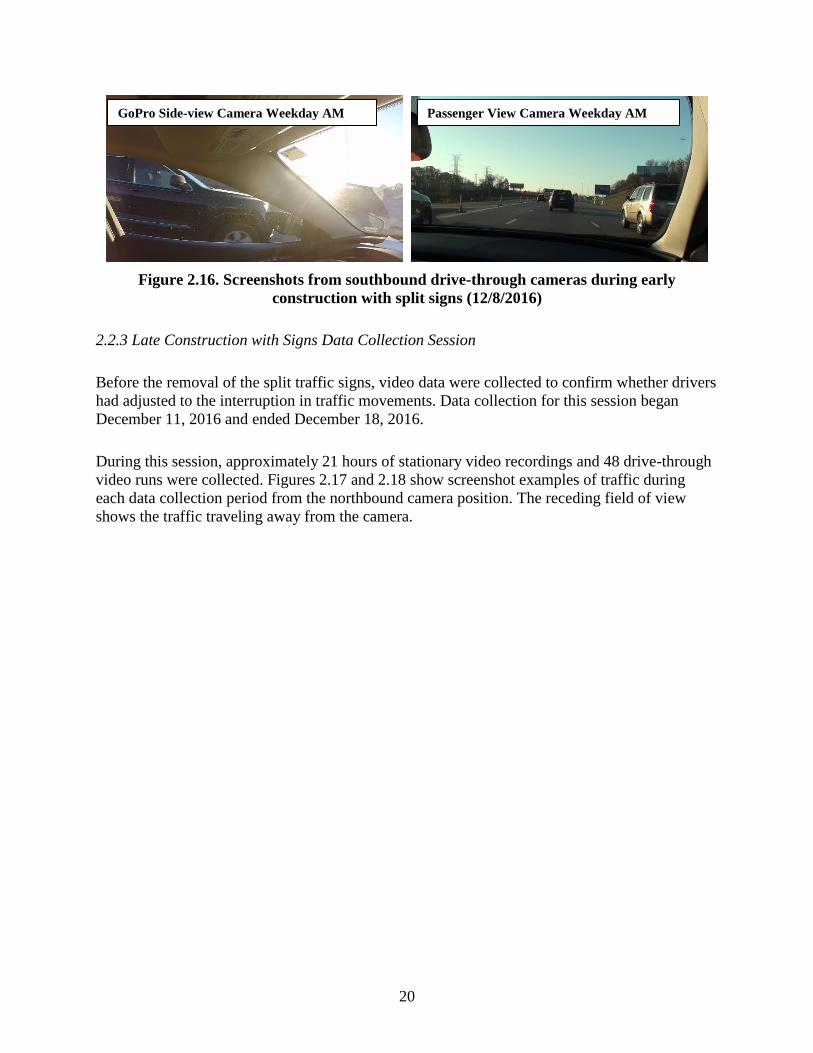
Figure 2.16 shows screenshot examples of the drive-through camera views during the
southbound a.m. peak commute period.
MoDOT CCTV
Camera Weekday AM
MoDOT CCTV
Camera Weekday PM
MoDOT CCTV Camera
Weekday Midday
MoDOT CCTV Camera
Weekday Nighttime
MoDOT CCTV Camera
Weekend Midday
20
Figure 2.16. Screenshots from southbound drive-through cameras during early
construction with split signs (12/8/2016)
2.2.3 Late Construction with Signs Data Collection Session
Before the removal of the split traffic signs, video data were collected to confirm whether drivers
had adjusted to the interruption in traffic movements. Data collection for this session began
December 11, 2016 and ended December 18, 2016.
During this session, approximately 21 hours of stationary video recordings and 48 drive-through
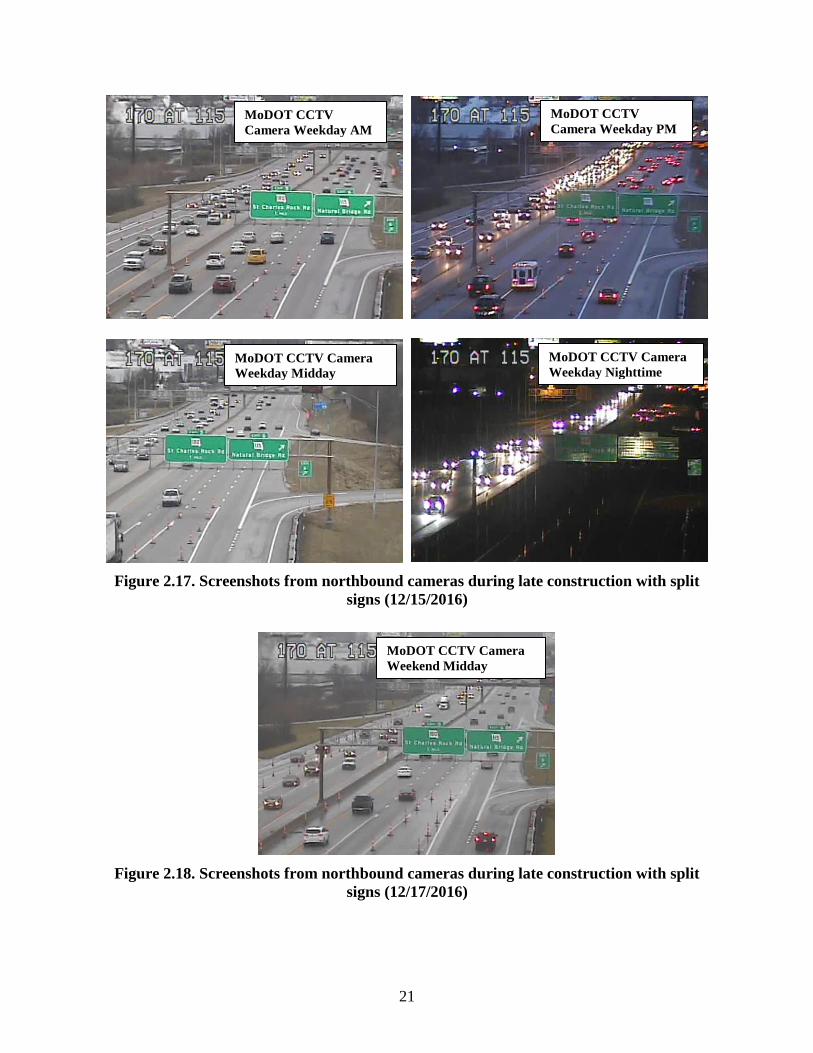
video runs were collected. Figures 2.17 and 2.18 show screenshot examples of traffic during
each data collection period from the northbound camera position. The receding field of view
shows the traffic traveling away from the camera.
GoPro Side-view Camera Weekday AM Passenger View Camera Weekday AM
21
Figure 2.17. Screenshots from northbound cameras during late construction with split
signs (12/15/2016)
Figure 2.18. Screenshots from northbound cameras during late construction with split
signs (12/17/2016)
MoDOT CCTV
Camera Weekday AM
MoDOT CCTV
Camera Weekday PM
MoDOT CCTV Camera
Weekday Midday
MoDOT CCTV Camera
Weekday Nighttime
MoDOT CCTV Camera
Weekend Midday
22
Figure 2.19 shows screenshot examples of the drive-through camera views during a weekday
evening.
Figure 2.19. Screenshots from northbound drive-through cameras during late construction
with split signs (12/15/2016)
2.3 Analysis of Video Data
Both the stationary and drive-through field videos were processed visually to generate traffic
counts and assess how drivers reacted to the new signs. The evaluation of driver behavior
included lane changes and aggressive driver maneuvers. In addition, the visibility of the signs
was estimated from the drive-through videos.
2.3.1 Time Periods
Table 2.2 summarizes the time periods that were used for the analysis.
GoPro Side-view Camera Weekday
PM
Passenger View Camera Weekday PM

23
Table 2.2. Summary of video monitoring time periods used for analysis
Time
Period ID Direction
Construction
Period
Traffic
Period
Drive-Through
Video Date
Stationary
Video Date
1 NB early a.m. peak 12/13/16 12/13/16
2 NB early p.m. peak 12/13/16 12/13/16
3 NB early midday 12/14/16 12/13/16
4 NB early night 12/13/16 12/13/16
5 NB early weekend 12/11/16 12/11/16
6 SB early a.m. peak 12/9/16 12/7/16
7 SB early p.m. peak 12/8/16 12/7/16
8 SB early midday 12/9/16 12/7/16
9 SB early night 12/8/16 12/7/16
10 SB early weekend 12/11/16 12/10/16
11 NB late a.m. peak 12/15/16 12/15/16
12 NB late p.m. peak 12/15/16 12/14/16
13 NB late midday 12/15/16 12/15/16
14 NB late night 12/15/16 12/15/16
15 NB late weekend 12/18/16 12/18/18
16 SB late a.m. peak 12/13/16 12/13/16
17 SB late p.m. peak 12/13/16 12/13/16
18 SB late midday 12/14/16 12/13/16
19 SB late night 12/13/16 12/13/16
20 SB late weekend 12/18/16 12/11/16
These time periods account for two directions. In addition, driver behavior during the earlier and
later stages of the work zone was analyzed separately to determine if drivers behaved differently
after becoming familiar with the new work zone split signs.
2.3.2 Performance Measures
2.3.2.1 Performance Measures for Drive-Through Videos
The drive-through videos were used to understand the driver’s perspective, observe any unusual
driver behavior, and assess the visibility of the sign. The following time stamps were recorded
from the front view videos: time stamp at which the split sign was first visible to the driver, time
stamp when the vehicle passed the split sign, and time stamp when the vehicle passed the gore
point. These time stamps were used to calculate the time headway for sign visibility and the
travel time from the split sign to the gore nose. The time headway for sign visibility was
calculated as the difference between the times when the vehicle passed the split sign and when
the split sign first became visible. The travel time between the gore nose and split sign was
calculated as the difference between the times when the vehicle passed the gore point and the
split sign.
24
2.3.2.2 Performance Measures for Stationary Videos
Various performance measures were obtained through the visual processing of the stationary
videos. These performance measures are as follows:
Vehicle counts by lane
Number of lane changes by initial and final lane
Time headway between lane change location and split sign
Time headway between lane change location and gore point
For each of the 20 video monitoring time periods, vehicle counts by lane were recorded in 5-
minute intervals until a minimum of 1,500 vehicles were counted for each time period. Once
1,500 vehicles were counted, the traffic counts were completed for the current 5-minute interval.
In addition, the following data were recorded for each lane change in advance of the work zone:
initial lane position, final lane position, time stamp when lane changing vehicle passed the split
sign, time stamp when the vehicle started to change lanes, and time stamp when the lane
changing vehicle passed the gore point. These data were used to derive the total number of lane
changes, their distribution by lane, and the location of the lane changes relative to the split sign
and gore nose. The analysis period for the lane changing corresponded to the period of time for
the vehicle counts.
In addition to these performance measures, any unusual driver behavior such as aggressive lane
changes was noted for the time period during which the traffic counts were recorded. The time
stamp for the unusual driver behavior was recorded, and screenshots were captured for each
event.
2.4 Results of Video Data Analysis
2.4.1 Sign Visibility
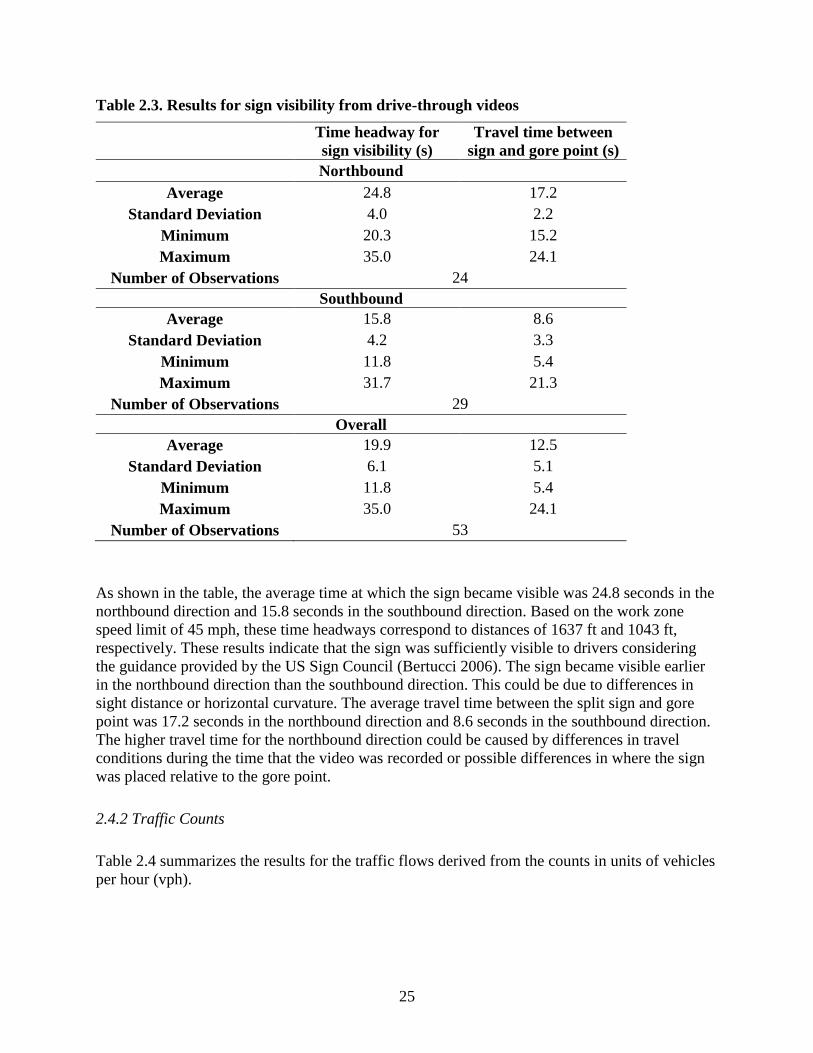
The results for sign visibility and the travel time between the sign and the gore point based on the
drive-through videos are shown in Table 2.3.
25
Table 2.3. Results for sign visibility from drive-through videos
Time headway for
sign visibility (s)
Travel time between
sign and gore point (s)
Northbound
Average 24.8 17.2
Standard Deviation 4.0 2.2
Minimum 20.3 15.2
Maximum 35.0 24.1
Number of Observations 24
Southbound
Average 15.8 8.6
Standard Deviation 4.2 3.3
Minimum 11.8 5.4
Maximum 31.7 21.3
Number of Observations 29
Overall
Average 19.9 12.5
Standard Deviation 6.1 5.1
Minimum 11.8 5.4
Maximum 35.0 24.1
Number of Observations 53
As shown in the table, the average time at which the sign became visible was 24.8 seconds in the
northbound direction and 15.8 seconds in the southbound direction. Based on the work zone
speed limit of 45 mph, these time headways correspond to distances of 1637 ft and 1043 ft,
respectively. These results indicate that the sign was sufficiently visible to drivers considering
the guidance provided by the US Sign Council (Bertucci 2006). The sign became visible earlier
in the northbound direction than the southbound direction. This could be due to differences in
sight distance or horizontal curvature. The average travel time between the split sign and gore
point was 17.2 seconds in the northbound direction and 8.6 seconds in the southbound direction.
The higher travel time for the northbound direction could be caused by differences in travel
conditions during the time that the video was recorded or possible differences in where the sign
was placed relative to the gore point.
2.4.2 Traffic Counts
Table 2.4 summarizes the results for the traffic flows derived from the counts in units of vehicles
per hour (vph).

26
Table 2.4. Observed traffic flows
Time
Period ID Direction
Construction
Period
Traffic
Period
Duration
of Counts
(min)
Flow rate (vph)
Lane 3* Lane 2* Lane 1* Total
1 NB early a.m. peak 25 1106 1310 1510 3926
2 NB early p.m. peak 25 1128 1399 1531 4058
3 NB early midday 33 710 1220 1028 2958
4 NB early night 45 499 1059 681 2239
5 NB early weekend 35 590 1089 914 2592
6 SB early a.m. peak 25 168 1687 1793 3648
7 SB early p.m. peak 25 418 1824 1560 3802
8 SB early midday 40 426 1559 884 2868
9 SB early night 55 193 981 464 1637
10 SB early weekend 35 490 1479 926 2895
11 NB late a.m. peak 20 1287 1590 1650 4527
12 NB late p.m. peak 20 1218 1896 1950 5064
13 NB late midday 33 765 1207 1115 3087
14 NB late night 30 764 1292 972 3028
15 NB late weekend 45 567 892 583 2041
16 SB late a.m. peak 25 1001 1570 1687 4258
17 SB late p.m. peak 25 691 1658 1502 3852
18 SB late midday 35 502 1406 941 2849
19 SB late night 62 273 777 353 1402
20 SB late weekend 40 381 1259 744 2384
* Note: Lane 1 adjacent to median, lane 2 middle, lane 3 adjacent to outside shoulder

27
The flow rates for the a.m. and p.m. peaks were approximately 30 to 40 percent higher than the
flow rates during midday on a weekday. The nighttime flow rates were generally the lowest,
although the weekend flow rates were lowest for the northbound late construction period. The
middle lane had the highest traffic counts for most of the analysis periods. The high flow rates
for all time periods confirm that I-170 is a busy urban freeway corridor.
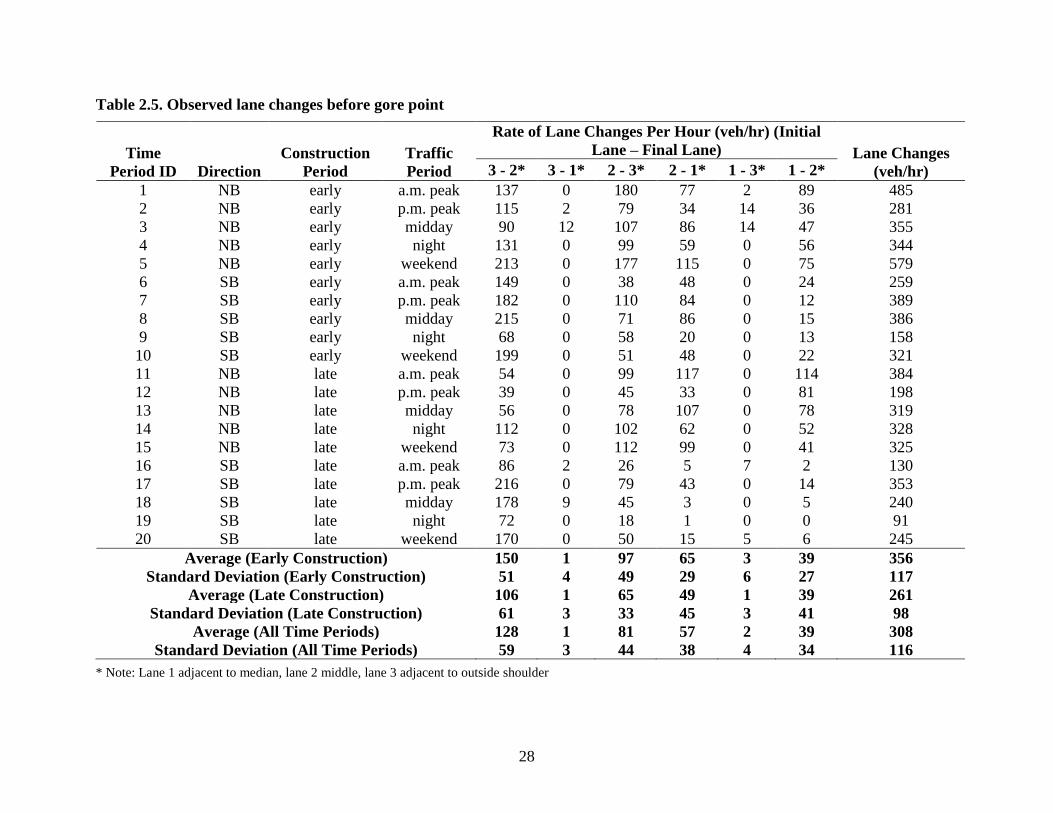
2.4.3 Lane Changes
Table 2.5 summarizes the results for the number of lane changes per hour before the gore point
by initial and final lane. Lane 1 is the median lane, lane 2 is the middle lane, and lane 3 is the
outside lane.
28
Table 2.5. Observed lane changes before gore point
Time
Period ID Direction
Construction
Period
Traffic
Period
Rate of Lane Changes Per Hour (veh/hr) (Initial
Lane – Final Lane) Lane Changes
(veh/hr) 3 - 2* 3 - 1* 2 - 3* 2 - 1* 1 - 3* 1 - 2*
1 NB early a.m. peak 137 0 180 77 2 89 485
2 NB early p.m. peak 115 2 79 34 14 36 281
3 NB early midday 90 12 107 86 14 47 355
4 NB early night 131 0 99 59 0 56 344
5 NB early weekend 213 0 177 115 0 75 579
6 SB early a.m. peak 149 0 38 48 0 24 259
7 SB early p.m. peak 182 0 110 84 0 12 389
8 SB early midday 215 0 71 86 0 15 386
9 SB early night 68 0 58 20 0 13 158
10 SB early weekend 199 0 51 48 0 22 321
11 NB late a.m. peak 54 0 99 117 0 114 384
12 NB late p.m. peak 39 0 45 33 0 81 198
13 NB late midday 56 0 78 107 0 78 319
14 NB late night 112 0 102 62 0 52 328
15 NB late weekend 73 0 112 99 0 41 325
16 SB late a.m. peak 86 2 26 5 7 2 130
17 SB late p.m. peak 216 0 79 43 0 14 353
18 SB late midday 178 9 45 3 0 5 240
19 SB late night 72 0 18 1 0 0 91
20 SB late weekend 170 0 50 15 5 6 245
Average (Early Construction) 150 1 97 65 3 39 356
Standard Deviation (Early Construction) 51 4 49 29 6 27 117
Average (Late Construction) 106 1 65 49 1 39 261
Standard Deviation (Late Construction) 61 3 33 45 3 41 98
Average (All Time Periods) 128 1 81 57 2 39 308
Standard Deviation (All Time Periods) 59 3 44 38 4 34 116
* Note: Lane 1 adjacent to median, lane 2 middle, lane 3 adjacent to outside shoulder
29
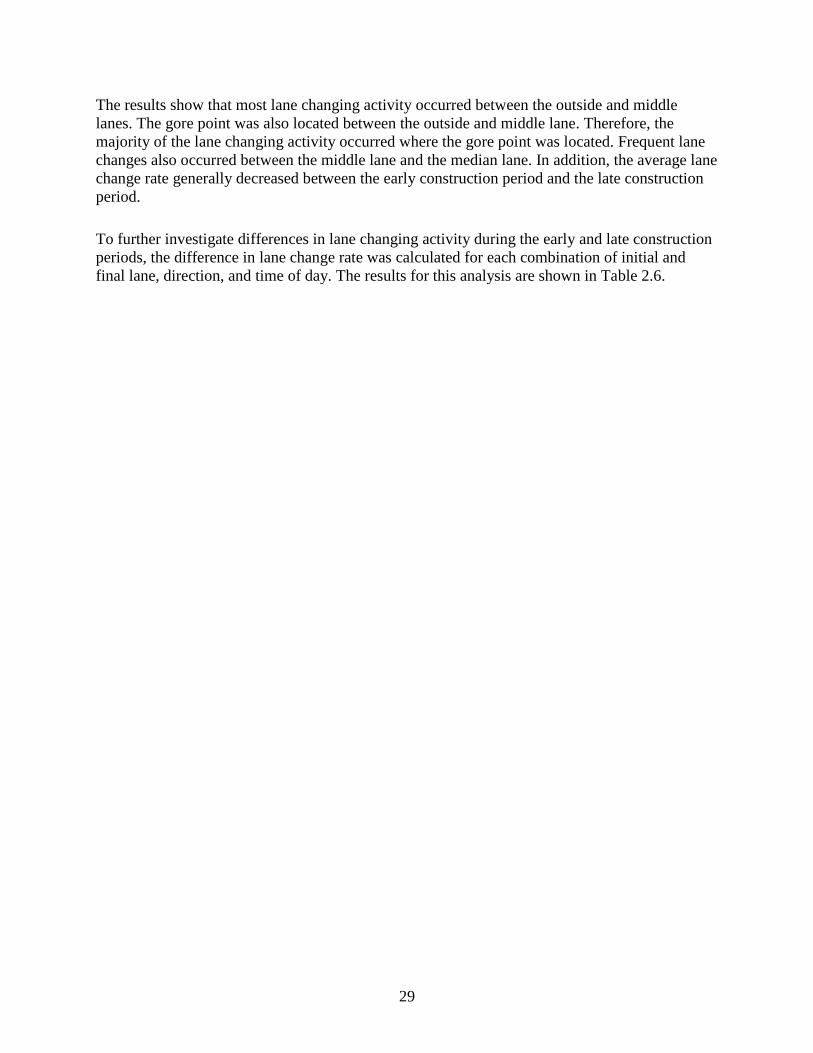
The results show that most lane changing activity occurred between the outside and middle
lanes. The gore point was also located between the outside and middle lane. Therefore, the
majority of the lane changing activity occurred where the gore point was located. Frequent lane
changes also occurred between the middle lane and the median lane. In addition, the average lane
change rate generally decreased between the early construction period and the late construction
period.
To further investigate differences in lane changing activity during the early and late construction
periods, the difference in lane change rate was calculated for each combination of initial and
final lane, direction, and time of day. The results for this analysis are shown in Table 2.6.
30
Table 2.6. Percent change in lane change rate by time period
Direction
Traffic
Period
Percent Change in Lane Change Rate**
3 - 2* 3 - 1* 2 - 3* 2 - 1* 1 - 3* 1 – 2*
NB a.m. peak -60.5 *** -45.0 52.3 -100.0 28.4
NB p.m. peak -66.1 -100.0 -43.2 -1.8 -100.0 125.0
NB midday -37.3 -100.0 -27.3 24.8 -100.0 66.7
NB night -15.8 *** 3.4 5.7 *** -7.1
NB weekend -65.5 *** -36.6 -14.1 *** -45.2
SB a.m. peak -41.9 *** -31.3 -90.0 *** -90.0
SB p.m. peak 18.4 *** -28.3 -48.6 *** 20.0
SB midday -16.9 *** -36.8 -96.0 *** -65.7
SB night 6.6 *** -69.7 -95.0 *** -100.0
SB weekend -14.8 *** -3.7 -68.8 *** -73.1
All Time Periods -29.5 -22.1 -32.7 -25.9 -61.6 1.2
* Note: Lane 1 adjacent to median, lane 2 middle, lane 3 adjacent to outside shoulder
** Note: Negative value indicates decrease from early construction to late construction
*** Note: No lane changes in early construction period
31
In comparing the late construction time period to the early construction time period, it can be
seen that the rate of lane changing from the outside lane to the middle lane decreased for all time
periods except for the southbound p.m. peak and nighttime periods. The rate of lane changing
from the middle lane to the outside lane also decreased for all time periods except for the
northbound nighttime period. Lane changes between the middle and median lanes also generally
decreased during the latter stages of construction although they increased during the northbound
a.m. peak and daytime periods.
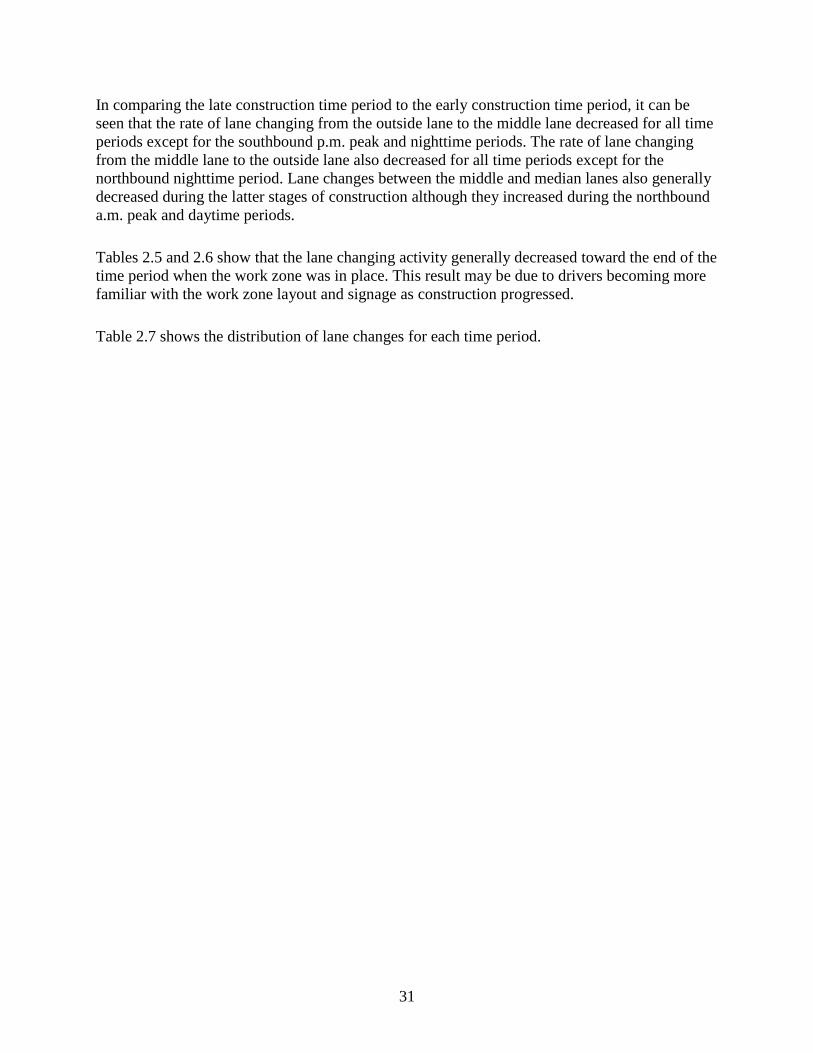
Tables 2.5 and 2.6 show that the lane changing activity generally decreased toward the end of the
time period when the work zone was in place. This result may be due to drivers becoming more
familiar with the work zone layout and signage as construction progressed.
Table 2.7 shows the distribution of lane changes for each time period.
32
Table 2.7. Distribution of lane changes by time period
Time
Period
ID Direction
Construction
Period
Traffic
Period
Total No. of
Lane Changes
Duration
(min)
Percent of Total Lane Changes (Initial
Lane – Final Lane)
3-2* 3-1* 2-3* 2-1* 1-3* 1–2*
1 NB early a.m. peak 202 25 28.2 0.0 37.1 15.8 0.5 18.3
2 NB early p.m. peak 117 25 41.0 0.9 28.2 12.0 5.1 12.8
3 NB early midday 182 31 25.3 3.3 30.2 24.2 3.8 13.2
4 NB early night 258 45 38.0 0.0 28.7 17.1 0.0 16.3
5 NB early weekend 338 35 36.7 0.0 30.5 19.8 0.0 13.0
6 SB early a.m. peak 108 25 57.4 0.0 14.8 18.5 0.0 9.3
7 SB early p.m. peak 162 25 46.9 0.0 28.4 21.6 0.0 3.1
8 SB early midday 257 40 55.6 0.0 18.3 22.2 0.0 3.9
9 SB early night 145 55 42.8 0.0 36.6 12.4 0.0 8.3
10 SB early weekend 187 35 62.0 0.0 16.0 15.0 0.0 7.0
11 NB late a.m. peak 128 20 14.1 0.0 25.8 30.5 0.0 29.7
12 NB late p.m. peak 66 20 19.7 0.0 22.7 16.7 0.0 40.9
13 NB late midday 176 33 17.6 0.0 24.4 33.5 0.0 24.4
14 NB late night 164 30 34.1 0.0 31.1 18.9 0.0 15.9
15 NB late weekend 244 45 22.5 0.0 34.4 30.3 0.0 12.7
16 SB late a.m. peak 54 25 66.7 1.9 20.4 3.7 5.6 1.9
17 SB late p.m. peak 147 25 61.2 0.0 22.4 12.2 0.0 4.1
18 SB late midday 140 35 74.3 3.6 18.6 1.4 0.0 2.1
19 SB late night 93 62 79.6 0.0 19.4 1.1 0.0 0.0
20 SB late weekend 163 40 69.3 0.0 20.2 6.1 1.8 2.5
Early Construction Time Periods 1956 341 42.1 0.4 27.3 18.4 0.9 10.9
Late Construction Time Periods 1375 335 40.5 0.4 25.0 18.6 0.4 15.1
All Time Periods 3331 675 41.4 0.4 26.3 18.5 0.7 12.7
* Note: Lane 1 adjacent to median, lane 2 middle, lane 3 adjacent to outside shoulder
33
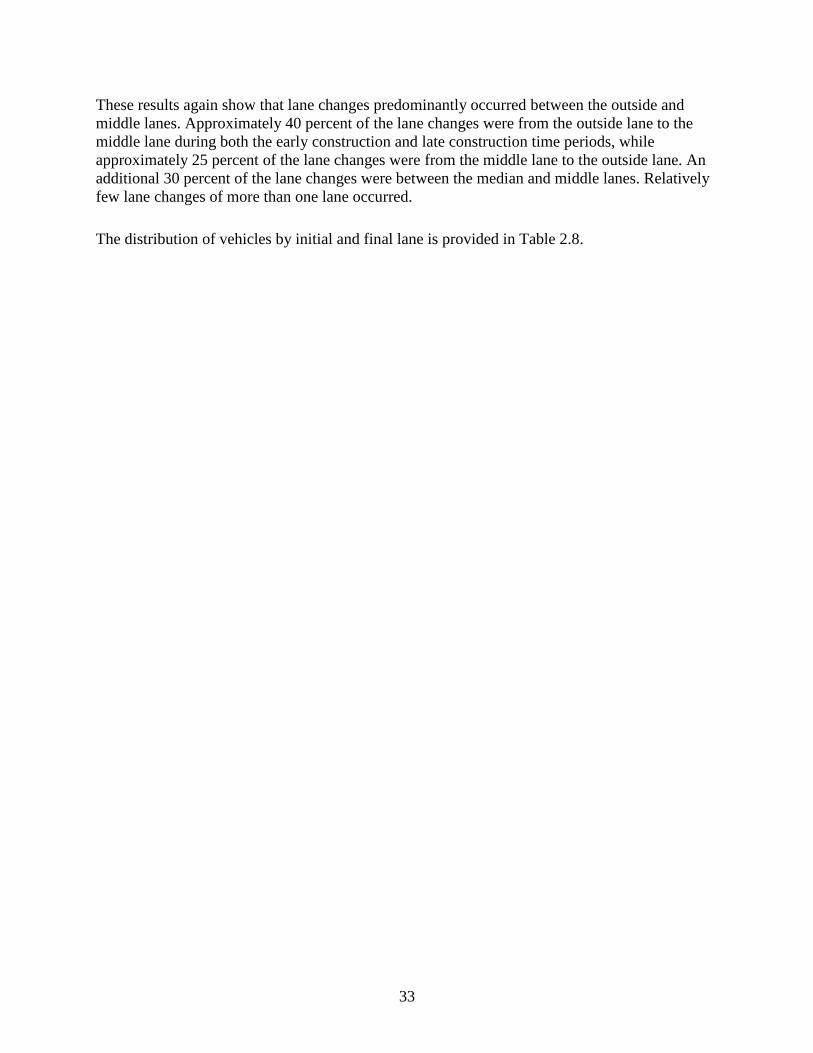
These results again show that lane changes predominantly occurred between the outside and
middle lanes. Approximately 40 percent of the lane changes were from the outside lane to the
middle lane during both the early construction and late construction time periods, while
approximately 25 percent of the lane changes were from the middle lane to the outside lane. An
additional 30 percent of the lane changes were between the median and middle lanes. Relatively
few lane changes of more than one lane occurred.
The distribution of vehicles by initial and final lane is provided in Table 2.8.
34
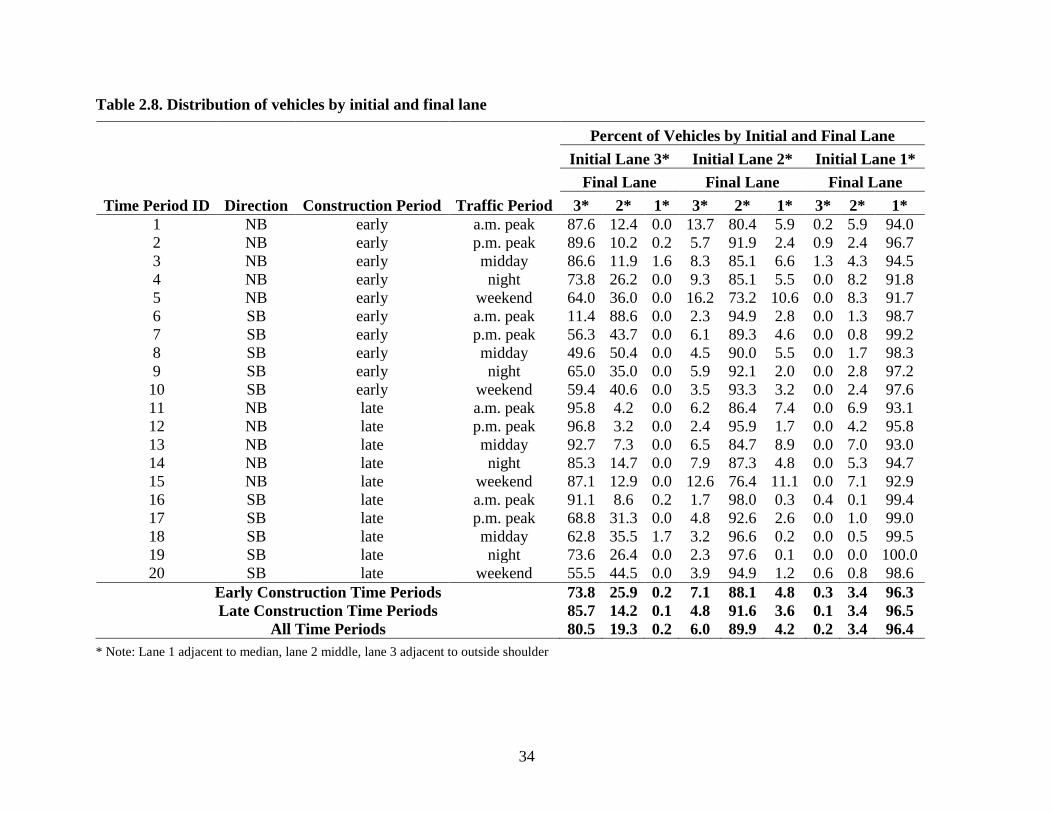
Table 2.8. Distribution of vehicles by initial and final lane
Time Period ID Direction Construction Period Traffic Period
Percent of Vehicles by Initial and Final Lane
Initial Lane 3* Initial Lane 2* Initial Lane 1*
Final Lane Final Lane Final Lane
3* 2* 1* 3* 2* 1* 3* 2* 1*
1 NB early a.m. peak 87.6 12.4 0.0 13.7 80.4 5.9 0.2 5.9 94.0
2 NB early p.m. peak 89.6 10.2 0.2 5.7 91.9 2.4 0.9 2.4 96.7
3 NB early midday 86.6 11.9 1.6 8.3 85.1 6.6 1.3 4.3 94.5
4 NB early night 73.8 26.2 0.0 9.3 85.1 5.5 0.0 8.2 91.8
5 NB early weekend 64.0 36.0 0.0 16.2 73.2 10.6 0.0 8.3 91.7
6 SB early a.m. peak 11.4 88.6 0.0 2.3 94.9 2.8 0.0 1.3 98.7
7 SB early p.m. peak 56.3 43.7 0.0 6.1 89.3 4.6 0.0 0.8 99.2
8 SB early midday 49.6 50.4 0.0 4.5 90.0 5.5 0.0 1.7 98.3
9 SB early night 65.0 35.0 0.0 5.9 92.1 2.0 0.0 2.8 97.2
10 SB early weekend 59.4 40.6 0.0 3.5 93.3 3.2 0.0 2.4 97.6
11 NB late a.m. peak 95.8 4.2 0.0 6.2 86.4 7.4 0.0 6.9 93.1
12 NB late p.m. peak 96.8 3.2 0.0 2.4 95.9 1.7 0.0 4.2 95.8
13 NB late midday 92.7 7.3 0.0 6.5 84.7 8.9 0.0 7.0 93.0
14 NB late night 85.3 14.7 0.0 7.9 87.3 4.8 0.0 5.3 94.7
15 NB late weekend 87.1 12.9 0.0 12.6 76.4 11.1 0.0 7.1 92.9
16 SB late a.m. peak 91.1 8.6 0.2 1.7 98.0 0.3 0.4 0.1 99.4
17 SB late p.m. peak 68.8 31.3 0.0 4.8 92.6 2.6 0.0 1.0 99.0
18 SB late midday 62.8 35.5 1.7 3.2 96.6 0.2 0.0 0.5 99.5
19 SB late night 73.6 26.4 0.0 2.3 97.6 0.1 0.0 0.0 100.0
20 SB late weekend 55.5 44.5 0.0 3.9 94.9 1.2 0.6 0.8 98.6
Early Construction Time Periods 73.8 25.9 0.2 7.1 88.1 4.8 0.3 3.4 96.3
Late Construction Time Periods 85.7 14.2 0.1 4.8 91.6 3.6 0.1 3.4 96.5
All Time Periods 80.5 19.3 0.2 6.0 89.9 4.2 0.2 3.4 96.4
* Note: Lane 1 adjacent to median, lane 2 middle, lane 3 adjacent to outside shoulder

35
The table confirms that lane changing decreased during the later construction period, especially
lane changing from the outside lane. The percentage of vehicles starting in the outside lane
before the work zone that remained in the outside lane increased from 73.8 percent in the early
construction period to 85.7 percent in the late construction period. Conversely, 25.9 and 14.2
percent of these vehicles switched to the middle lane in the early and late construction periods,
respectively. The percentage of middle lane vehicles remaining in the middle lane increased from
88.1 percent to 91.6 percent between the early construction and late construction periods. Lane
changes by vehicles in the median lane were relatively infrequent, in that approximately 96
percent of these vehicles remained in the median lane during both the early construction and late
construction time periods. The results from Table 2.8 indicate that drivers may have become
more familiar with the work zone layout and signage as the construction progressed and
therefore tended to stay in their lane more frequently than during the early stages of the work
zone implementation.
In addition to the number of lane changes by lane, the locations of the lane changes relative to
the split sign and gore point were also analyzed. Table 2.9 summarizes the time headways
between the lane change and split sign and between the lane change and the gore point.
36
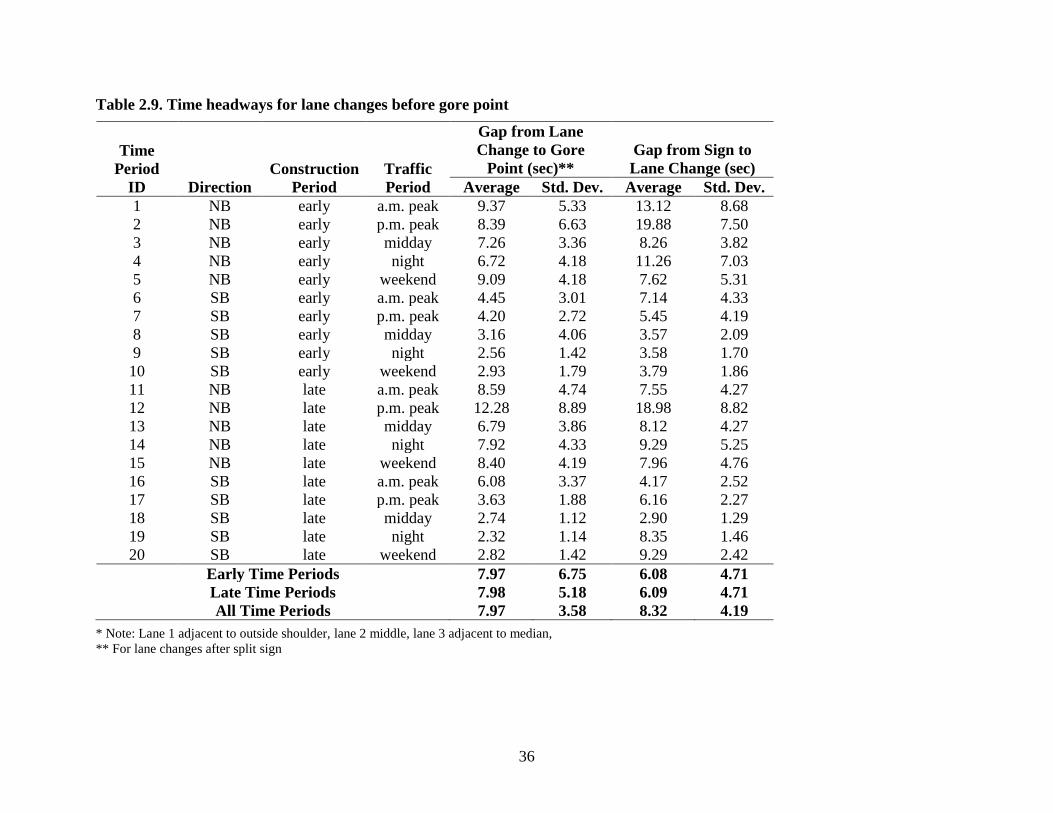
Table 2.9. Time headways for lane changes before gore point
Time
Period
ID Direction
Construction
Period
Traffic
Period
Gap from Lane
Change to Gore
Point (sec)**
Gap from Sign to
Lane Change (sec)
Average Std. Dev. Average Std. Dev.
1 NB early a.m. peak 9.37 5.33 13.12 8.68
2 NB early p.m. peak 8.39 6.63 19.88 7.50
3 NB early midday 7.26 3.36 8.26 3.82
4 NB early night 6.72 4.18 11.26 7.03
5 NB early weekend 9.09 4.18 7.62 5.31
6 SB early a.m. peak 4.45 3.01 7.14 4.33
7 SB early p.m. peak 4.20 2.72 5.45 4.19
8 SB early midday 3.16 4.06 3.57 2.09
9 SB early night 2.56 1.42 3.58 1.70
10 SB early weekend 2.93 1.79 3.79 1.86
11 NB late a.m. peak 8.59 4.74 7.55 4.27
12 NB late p.m. peak 12.28 8.89 18.98 8.82
13 NB late midday 6.79 3.86 8.12 4.27
14 NB late night 7.92 4.33 9.29 5.25
15 NB late weekend 8.40 4.19 7.96 4.76
16 SB late a.m. peak 6.08 3.37 4.17 2.52
17 SB late p.m. peak 3.63 1.88 6.16 2.27
18 SB late midday 2.74 1.12 2.90 1.29
19 SB late night 2.32 1.14 8.35 1.46
20 SB late weekend 2.82 1.42 9.29 2.42
Early Time Periods 7.97 6.75 6.08 4.71
Late Time Periods 7.98 5.18 6.09 4.71
All Time Periods 7.97 3.58 8.32 4.19
* Note: Lane 1 adjacent to outside shoulder, lane 2 middle, lane 3 adjacent to median,
** For lane changes after split sign
37
On average, vehicles changed lanes 8.32 seconds after the split sign and 7.97 seconds before the
gore point. Based on the work zone speed limit of 45 mph, these time headways correspond to
distances of 549 ft and 526 ft, respectively. In comparing the values between the early and late
construction time periods, it can be seen that the average values for both time headways are
nearly identical. This result indicates that the locations of the lane changes relative to the split
sign and gore point remained unchanged throughout the period of time when the alternative split
sign was in place.
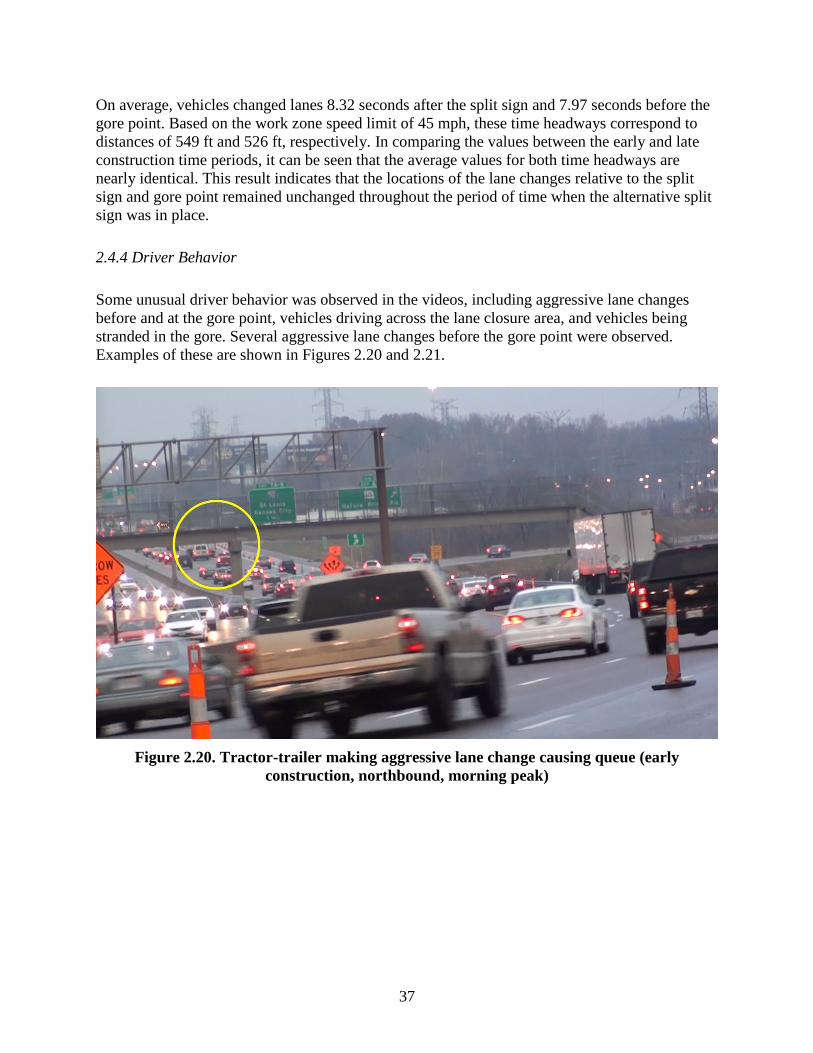
2.4.4 Driver Behavior
Some unusual driver behavior was observed in the videos, including aggressive lane changes
before and at the gore point, vehicles driving across the lane closure area, and vehicles being
stranded in the gore. Several aggressive lane changes before the gore point were observed.
Examples of these are shown in Figures 2.20 and 2.21.
Figure 2.20. Tractor-trailer making aggressive lane change causing queue (early
construction, northbound, morning peak)
38
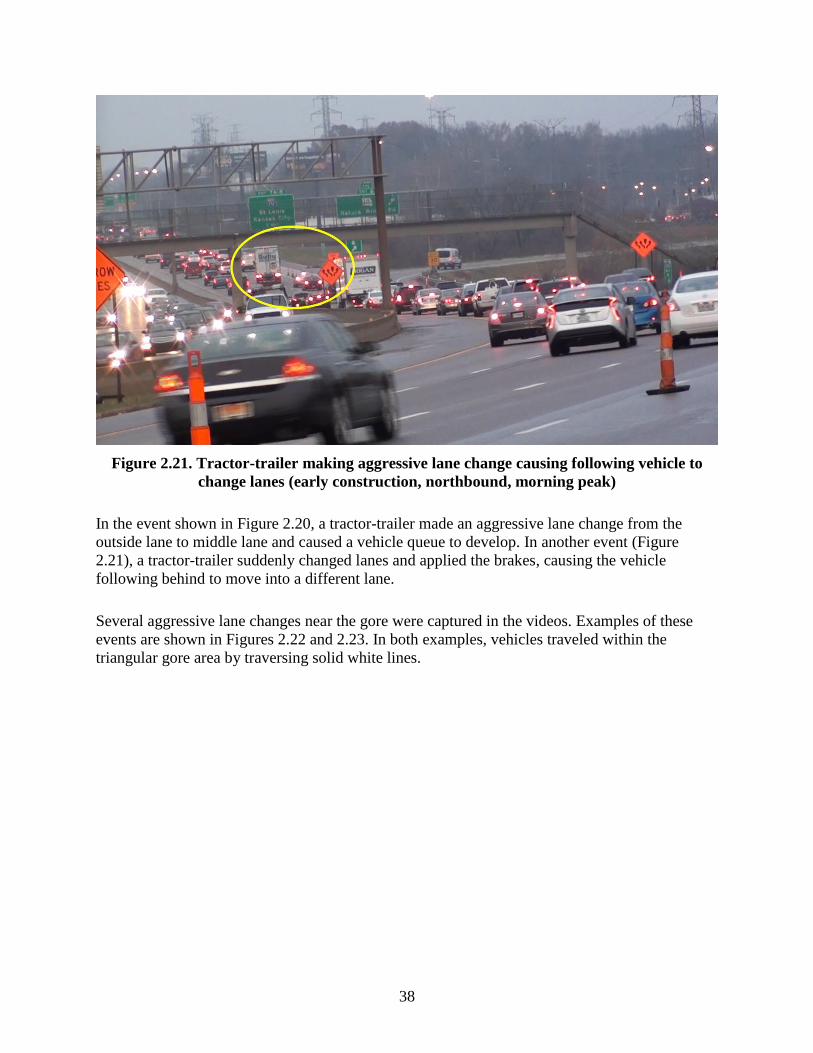
Figure 2.21. Tractor-trailer making aggressive lane change causing following vehicle to
change lanes (early construction, northbound, morning peak)
In the event shown in Figure 2.20, a tractor-trailer made an aggressive lane change from the
outside lane to middle lane and caused a vehicle queue to develop. In another event (Figure
2.21), a tractor-trailer suddenly changed lanes and applied the brakes, causing the vehicle
following behind to move into a different lane.
Several aggressive lane changes near the gore were captured in the videos. Examples of these
events are shown in Figures 2.22 and 2.23. In both examples, vehicles traveled within the
triangular gore area by traversing solid white lines.

39
Figure 2.22. Lane change near the gore example 1 (late construction, southbound, midday)
Figure 2.23. Lane change near the gore example 2 (late construction, southbound, midday)
40
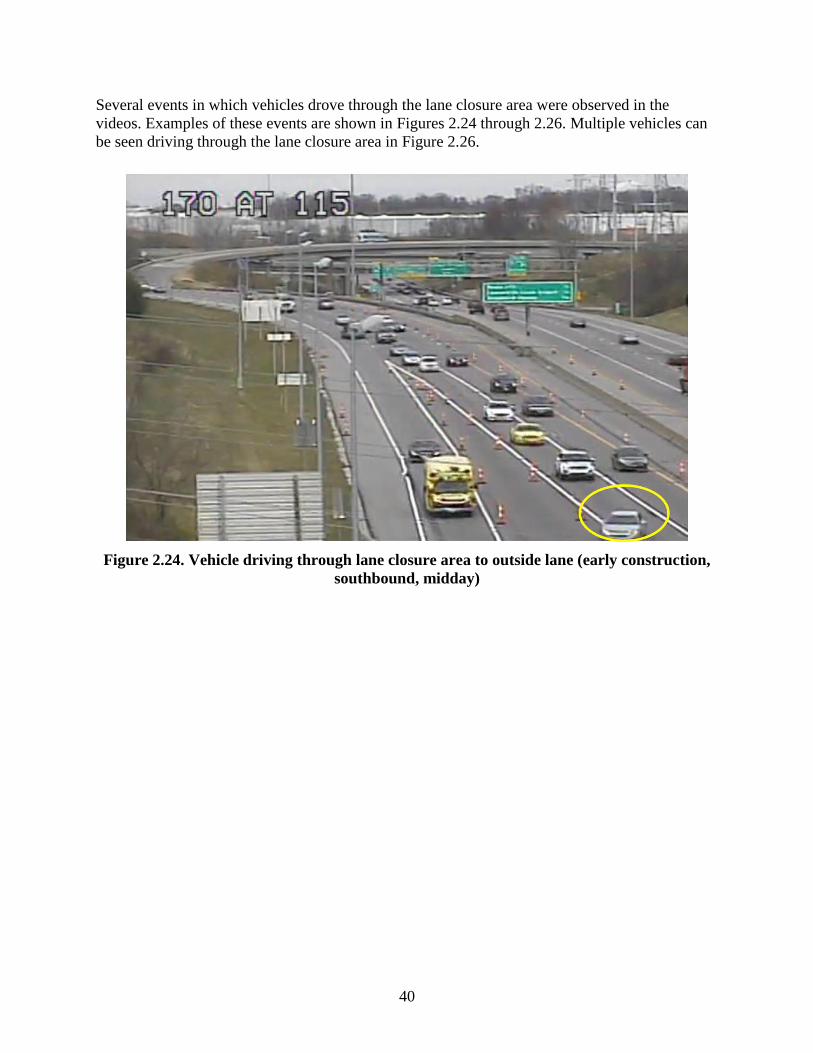
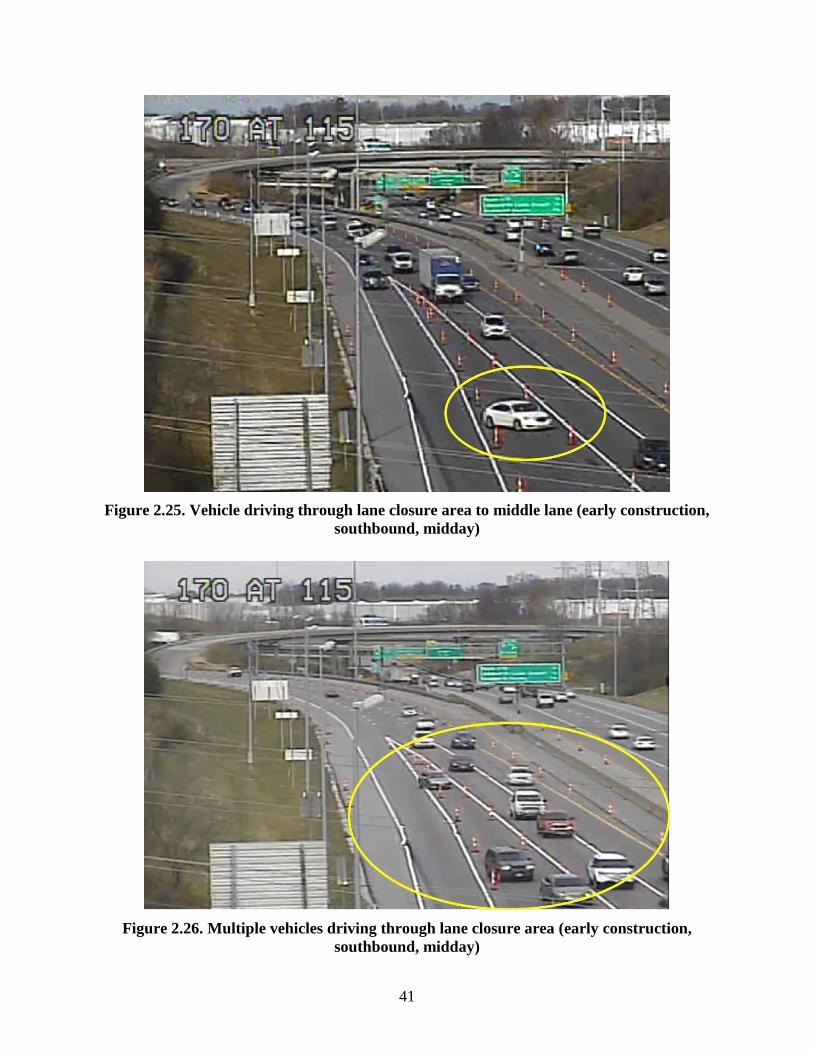
Several events in which vehicles drove through the lane closure area were observed in the
videos. Examples of these events are shown in Figures 2.24 through 2.26. Multiple vehicles can
be seen driving through the lane closure area in Figure 2.26.
Figure 2.24. Vehicle driving through lane closure area to outside lane (early construction,
southbound, midday)
41
Figure 2.25. Vehicle driving through lane closure area to middle lane (early construction,
southbound, midday)
Figure 2.26. Multiple vehicles driving through lane closure area (early construction,
southbound, midday)
42
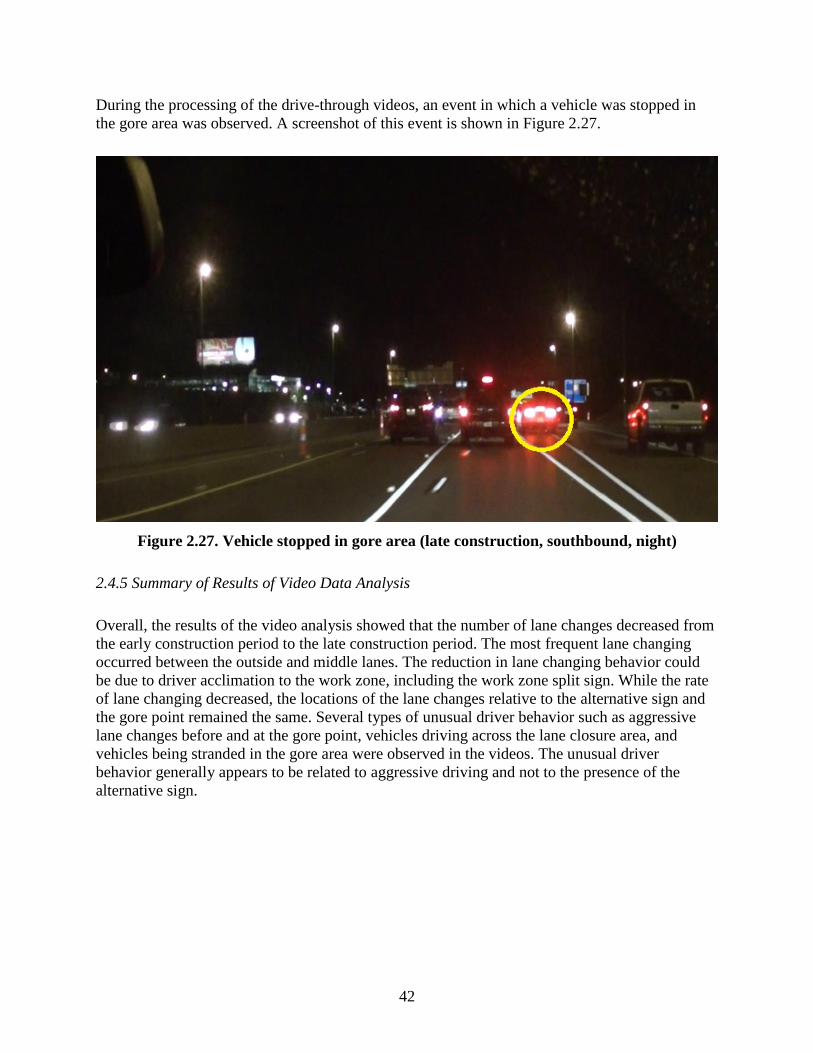
During the processing of the drive-through videos, an event in which a vehicle was stopped in
the gore area was observed. A screenshot of this event is shown in Figure 2.27.
Figure 2.27. Vehicle stopped in gore area (late construction, southbound, night)
2.4.5 Summary of Results of Video Data Analysis
Overall, the results of the video analysis showed that the number of lane changes decreased from
the early construction period to the late construction period. The most frequent lane changing
occurred between the outside and middle lanes. The reduction in lane changing behavior could
be due to driver acclimation to the work zone, including the work zone split sign. While the rate
of lane changing decreased, the locations of the lane changes relative to the alternative sign and
the gore point remained the same. Several types of unusual driver behavior such as aggressive
lane changes before and at the gore point, vehicles driving across the lane closure area, and
vehicles being stranded in the gore area were observed in the videos. The unusual driver
behavior generally appears to be related to aggressive driving and not to the presence of the
alternative sign.
43
CHAPTER 3. STAKEHOLDER INTERVIEWS
3.1 Overview and Methodology
To gain further insights into the possible impacts of using the alternative sign, the research team
conducted interviews with stakeholders for the project. Two groups of stakeholders were
involved in the investigation of the work zone split traffic signs: the contractor personnel group
and MoDOT personnel group. In total, there were four contractors and five MoDOT personnel
respondents interviewed within each group for the investigation. The purpose of the interviews
was to obtain the perspectives of the two groups on the effectiveness of the signs. Each person
responded to a set of questions tailored towards their experience, knowledge, and usage of the
split traffic work zone signs. Their responses were reported and documented.
In contrast to the stakeholders’ participation described in the proposal, which anticipated two
rounds of interviews—one after the placement of the signs and the other before the removal of
the signs—only one round of interviews was completed due to the shortness of the construction
schedule.
The interviews included questions about the interviewees’ experience with work zones
containing middle lane closures, their observations of driver behavior under both the MUTCD
sign and the alternative sign, and their opinions on whether the use of the alternative sign helped
to improve safety. Interviewees were also asked if they had any suggestions for ways in which
the implementation of the alternative sign could be improved. A complete list of interview
questions is shown in Table 3.1.
44
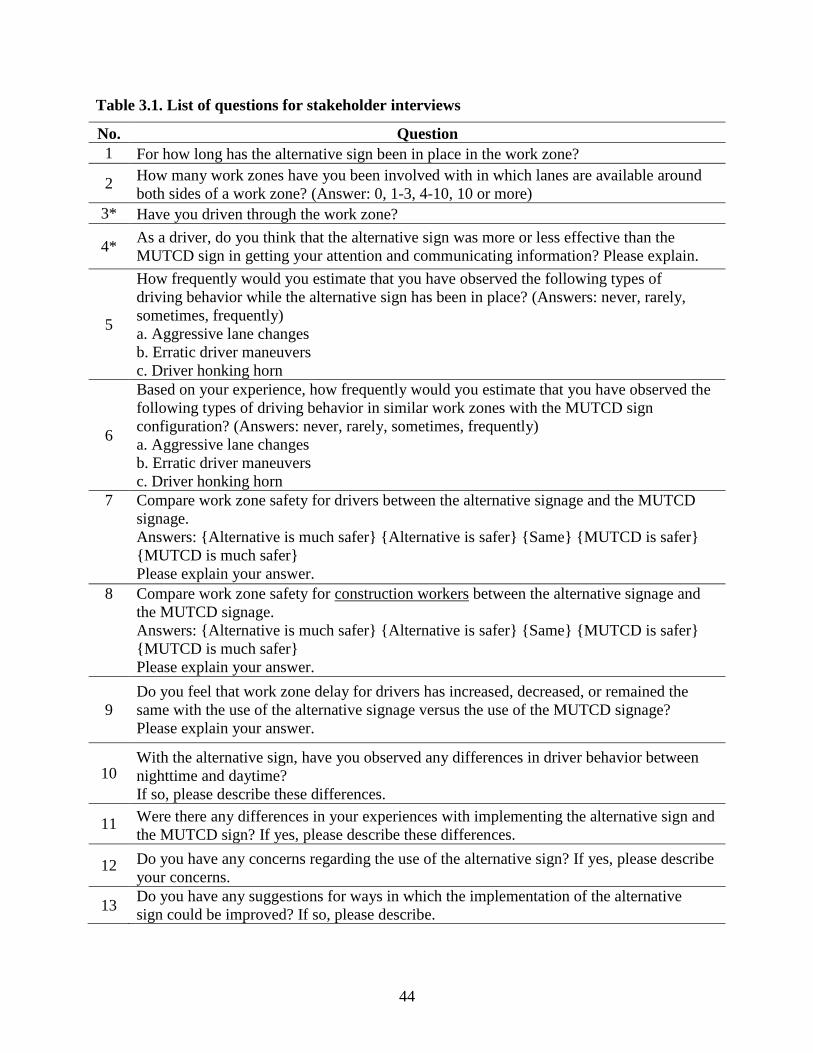
Table 3.1. List of questions for stakeholder interviews
No. Question
1 For how long has the alternative sign been in place in the work zone?
2 How many work zones have you been involved with in which lanes are available around
both sides of a work zone? (Answer: 0, 1-3, 4-10, 10 or more)
3* Have you driven through the work zone?
4* As a driver, do you think that the alternative sign was more or less effective than the
MUTCD sign in getting your attention and communicating information? Please explain.
5
How frequently would you estimate that you have observed the following types of
driving behavior while the alternative sign has been in place? (Answers: never, rarely,
sometimes, frequently)
a. Aggressive lane changes
b. Erratic driver maneuvers
c. Driver honking horn
6
Based on your experience, how frequently would you estimate that you have observed the
following types of driving behavior in similar work zones with the MUTCD sign
configuration? (Answers: never, rarely, sometimes, frequently)
a. Aggressive lane changes
b. Erratic driver maneuvers
c. Driver honking horn
7 Compare work zone safety for drivers between the alternative signage and the MUTCD
signage.
Answers: {Alternative is much safer} {Alternative is safer} {Same} {MUTCD is safer}
{MUTCD is much safer}
Please explain your answer.
8 Compare work zone safety for construction workers between the alternative signage and
the MUTCD signage.
Answers: {Alternative is much safer} {Alternative is safer} {Same} {MUTCD is safer}
{MUTCD is much safer}
Please explain your answer.
9
Do you feel that work zone delay for drivers has increased, decreased, or remained the
same with the use of the alternative signage versus the use of the MUTCD signage?
Please explain your answer.
10 With the alternative sign, have you observed any differences in driver behavior between
nighttime and daytime?
If so, please describe these differences.
11 Were there any differences in your experiences with implementing the alternative sign and
the MUTCD sign? If yes, please describe these differences.
12 Do you have any concerns regarding the use of the alternative sign? If yes, please describe
your concerns.
13 Do you have any suggestions for ways in which the implementation of the alternative
sign could be improved? If so, please describe.
45
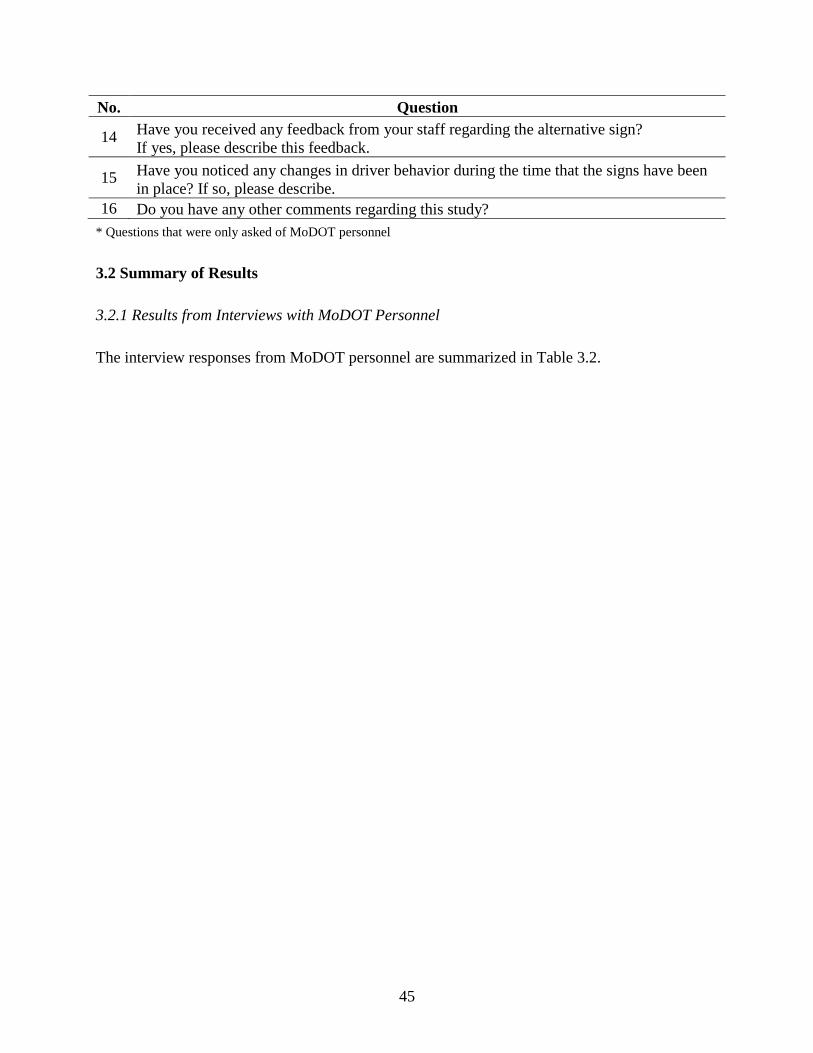
No. Question
14 Have you received any feedback from your staff regarding the alternative sign?
If yes, please describe this feedback.
15 Have you noticed any changes in driver behavior during the time that the signs have been
in place? If so, please describe.
16 Do you have any other comments regarding this study?
* Questions that were only asked of MoDOT personnel
3.2 Summary of Results
3.2.1 Results from Interviews with MoDOT Personnel
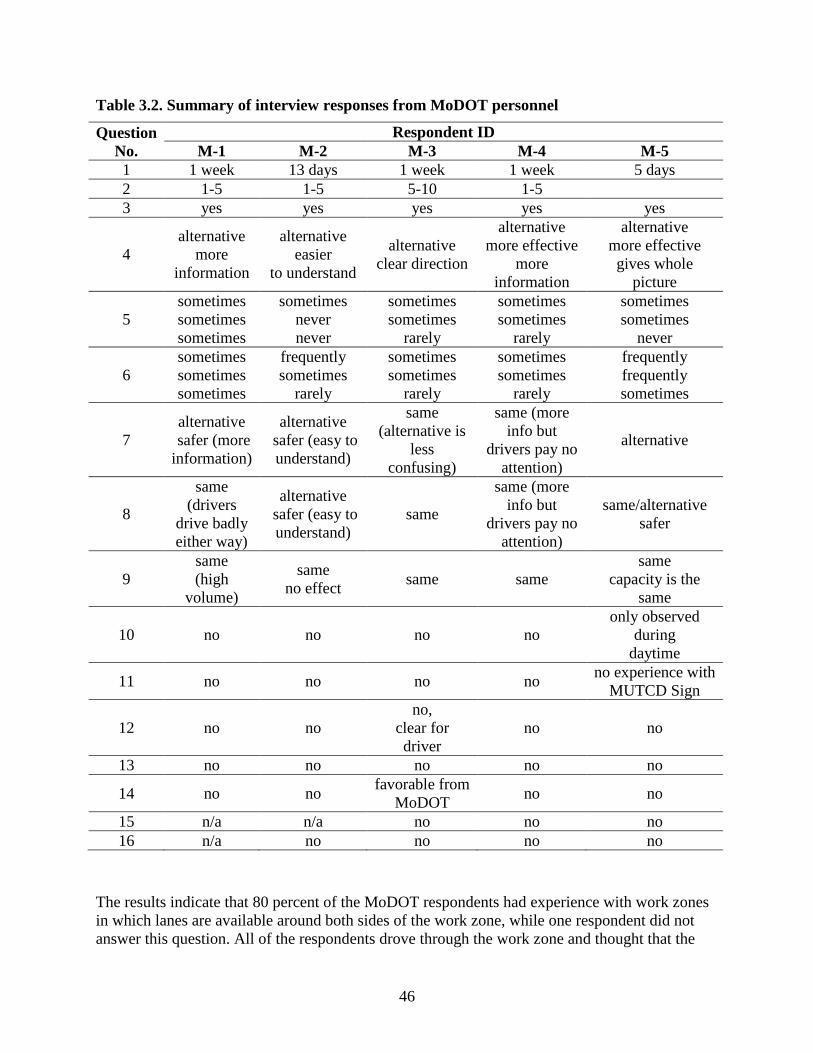
The interview responses from MoDOT personnel are summarized in Table 3.2.
46
Table 3.2. Summary of interview responses from MoDOT personnel
Question
No.
Respondent ID
M-1 M-2 M-3 M-4 M-5
1 1 week 13 days 1 week 1 week 5 days
2 1-5 1-5 5-10 1-5
3 yes yes yes yes yes
4
alternative
more
information
alternative
easier
to understand
alternative
clear direction
alternative
more effective
more
information
alternative
more effective
gives whole
picture
5
sometimes
sometimes
sometimes
sometimes
never
never
sometimes
sometimes
rarely
sometimes
sometimes
rarely
sometimes
sometimes
never
6
sometimes
sometimes
sometimes
frequently
sometimes
rarely
sometimes
sometimes
rarely
sometimes
sometimes
rarely
frequently
frequently
sometimes
7
alternative
safer (more
information)
alternative
safer (easy to
understand)
same
(alternative is
less
confusing)
same (more
info but
drivers pay no
attention)
alternative
8
same
(drivers
drive badly
either way)
alternative
safer (easy to
understand)
same
same (more
info but
drivers pay no
attention)
same/alternative
safer
9
same
(high
volume)
same
no effect same same
same
capacity is the
same
10 no no no no
only observed
during
daytime
11 no no no no no experience with
MUTCD Sign
12 no no
no,
clear for
driver
no no
13 no no no no no
14 no no favorable from
MoDOT no no
15 n/a n/a no no no
16 n/a no no no no
The results indicate that 80 percent of the MoDOT respondents had experience with work zones
in which lanes are available around both sides of the work zone, while one respondent did not
answer this question. All of the respondents drove through the work zone and thought that the
47
alternative sign was more effective than the MUTCD sign at getting their attention and
communicating information. As for driver behavior with the new sign, all respondents sometimes
observed aggressive lane changes while 80 percent of respondents sometimes observed erratic
driver maneuvers. Drivers honking their horns was seen less frequently; 40 percent of MoDOT
respondents never observed this behavior and 40 percent rarely observed it. For driver behavior
with the MUTCD sign, 40 percent of MoDOT respondents frequently observed aggressive lane
changes while 60 percent observed these changes sometimes. MoDOT respondents also
indicated that they observed erratic driver maneuvers frequently (20 percent) or sometimes (80
percent). Instances of drivers honking their horns were observed sometimes (40 percent) or
rarely (60 percent) by the MoDOT respondents.
The MoDOT respondents were somewhat divided on the comparison of perceived safety
between the alternative and MUTCD signs. The majority (60 percent) of MoDOT respondents
thought that the alternative sign was safer for drivers because they perceived that it provided
more information. However, 40 percent of respondents felt that the alternative sign and MUTCD
sign provided the same level of work zone safety for drivers. One respondent expressed the
opinion that the signs provide the same level of safety because drivers do not pay attention to the
signs. For construction worker safety, 80 percent of respondents indicated that the two signs
provided the same level of safety. Reasons provided for this belief included the opinion that
drivers do not pay attention to the signs and drivers still drive badly regardless of the signage.
The remaining respondents (20 percent) indicated that the alternative sign was safer for
construction workers with one reason given being that it was easy to understand.
All of the MoDOT respondents indicated that the work zone delay was the same for both the
alternative signage and the MUTCD signage. Most of the respondents (80 percent) did not
observe any differences in driver behavior between nighttime and daytime, while one respondent
had only observed the work zone during the daytime. None of the respondents with familiarity in
using both signs noted any differences in their experience with implementing them. The MoDOT
respondents did not notice any changes in driver behavior during the time that the signs were in
place. Finally, the MoDOT respondents did not express any additional concerns regarding the
use of the alternative signs.
3.2.2 Results from Interviews with Contractor Personnel
Table 3.3 summarizes the interview responses from the contractor personnel.
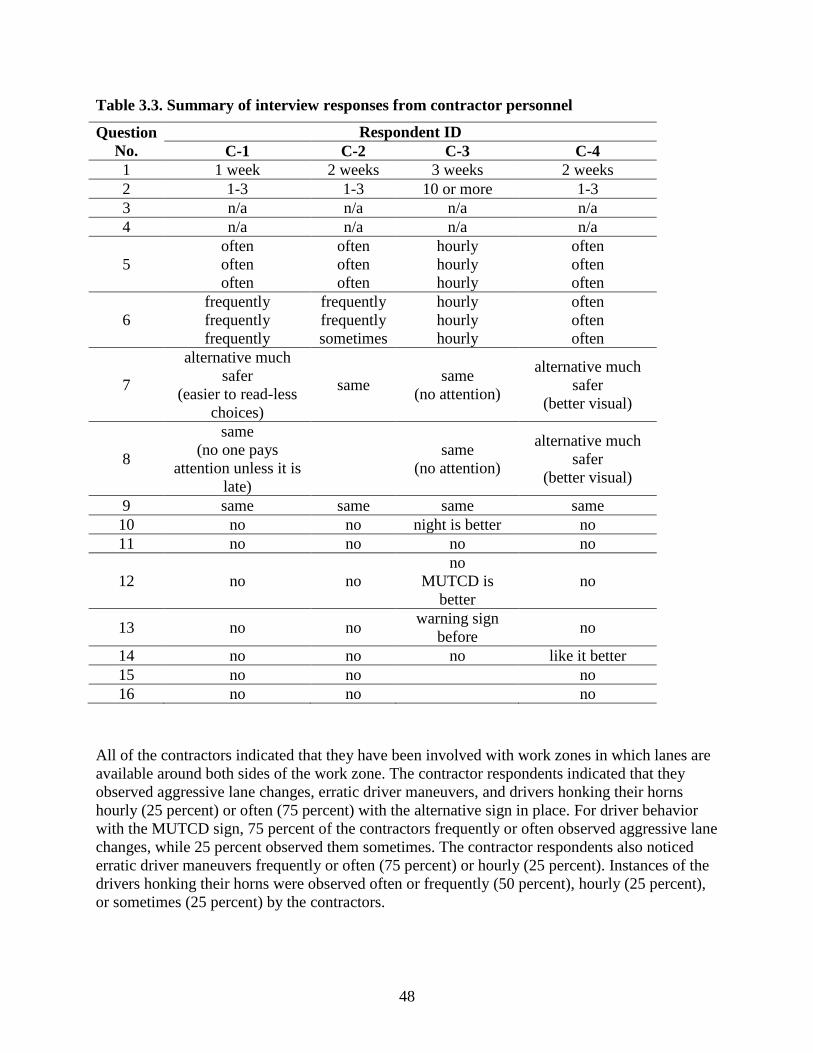
48
Table 3.3. Summary of interview responses from contractor personnel
Question
No.
Respondent ID
C-1 C-2 C-3 C-4
1 1 week 2 weeks 3 weeks 2 weeks
2 1-3 1-3 10 or more 1-3
3 n/a n/a n/a n/a
4 n/a n/a n/a n/a
5
often
often
often
often
often
often
hourly
hourly
hourly
often
often
often
6
frequently
frequently
frequently
frequently
frequently
sometimes
hourly
hourly
hourly
often
often
often
7
alternative much
safer
(easier to read-less
choices)
same same
(no attention)
alternative much
safer
(better visual)
8
same
(no one pays
attention unless it is
late)
same
(no attention)
alternative much
safer
(better visual)
9 same same same same
10 no no night is better no
11 no no no no
12 no no
no
MUTCD is
better
no
13 no no warning sign
before no
14 no no no like it better
15 no no no
16 no no no
All of the contractors indicated that they have been involved with work zones in which lanes are
available around both sides of the work zone. The contractor respondents indicated that they
observed aggressive lane changes, erratic driver maneuvers, and drivers honking their horns
hourly (25 percent) or often (75 percent) with the alternative sign in place. For driver behavior
with the MUTCD sign, 75 percent of the contractors frequently or often observed aggressive lane
changes, while 25 percent observed them sometimes. The contractor respondents also noticed
erratic driver maneuvers frequently or often (75 percent) or hourly (25 percent). Instances of the
drivers honking their horns were observed often or frequently (50 percent), hourly (25 percent),
or sometimes (25 percent) by the contractors.
49
The contractors were evenly split on their perception of whether the alternative sign was safer for
drivers or provided the same level of safety as the MUTCD sign. Some contractors felt that the
alternative provided clearer visuals, while others believed that drivers do not pay attention to the
signs. One contractor (25 percent) responded that the alternative sign was safer for construction
workers because it provided better visual information, while two contractors (50 percent)
indicated that the two signs provided the same level of safety for construction workers because
drivers do not pay attention to the signs.
All of the contractor respondents indicated that the work zone delay was the same for the
alternative signs and MUTCD signs. Most of the respondents (75 percent) did not observe any
differences in driver behavior between nighttime and daytime, while one respondent thought that
driver behavior was better at night. The contractor respondents did not note any differences in
their experience with implementing the alternative signs and the MUTCD signs, and they did not
observe any changes in driver behavior during the time that the signs were in place. One
contractor indicated that his or her staff liked the alternative sign better, while another contractor
expressed the opinion that the MUTCD sign is better. Regarding suggestions for improvement of
the implementation of the alternative sign, one contractor suggested the use of another warning
sign before the work zone.
3.2.3 Overall Summary of Stakeholder Interview Results
The overall results from the interviews with both MoDOT and contractor personnel can be
summarized as follows:
Respondents generally thought that the alternative sign was a good idea but were divided on
whether the use of the alternative sign improved work zone safety for drivers and
construction workers when compared to the MUTCD sign. Some respondents thought the
alternative sign improved safety because they perceived that it communicated information
more clearly and was easier to understand. Other respondents indicated that the level of
safety was the same because they do not think that drivers pay attention to the signs.
Based on the responses, the use of the alternative sign has no effect on work zone delay.
Interviewees believed that the use of the alternative sign has almost no effect on the driving
behavior of people because the rates of aggressive lane changes, erratic maneuvers, and horn
honking are much the same with the alternative sign and the MUTCD sign.
Changes in driver behavior during the time that the alternative signs were in place were not
observed by the respondents.
Feedback from MoDOT and contractor staff regarding the use of the alternative sign was
generally positive.

50
CHAPTER 4. DRIVER SURVEY
The research team also sought the opinions of another important stakeholder group, drivers.
MoDOT’s “Rate Our Work Zones” survey (MoDOT 2013) is a web-based work zone customer
survey that records driver perceptions of work zones across Missouri. As shown in Figure 4.1,
the survey asks drivers to comment on the timeliness of warning of work zone presence; clarity
of signs, striping, and other temporary traffic control devices; and perception of delay and safety
while driving through the work zone.

51
MoDOT 2013
Figure 4.1. MoDOT “Rate Our Work Zones” survey
52
The research team requested the survey responses from MoDOT for December 2016 from the St.
Louis region. There were only two survey responses for the St. Louis region in the month of
December 2016. These responses concerned work zones on US 40 and I-44. Therefore, drivers
did not express any concerns regarding the use of the new split signs on the I-170 project in the
survey.
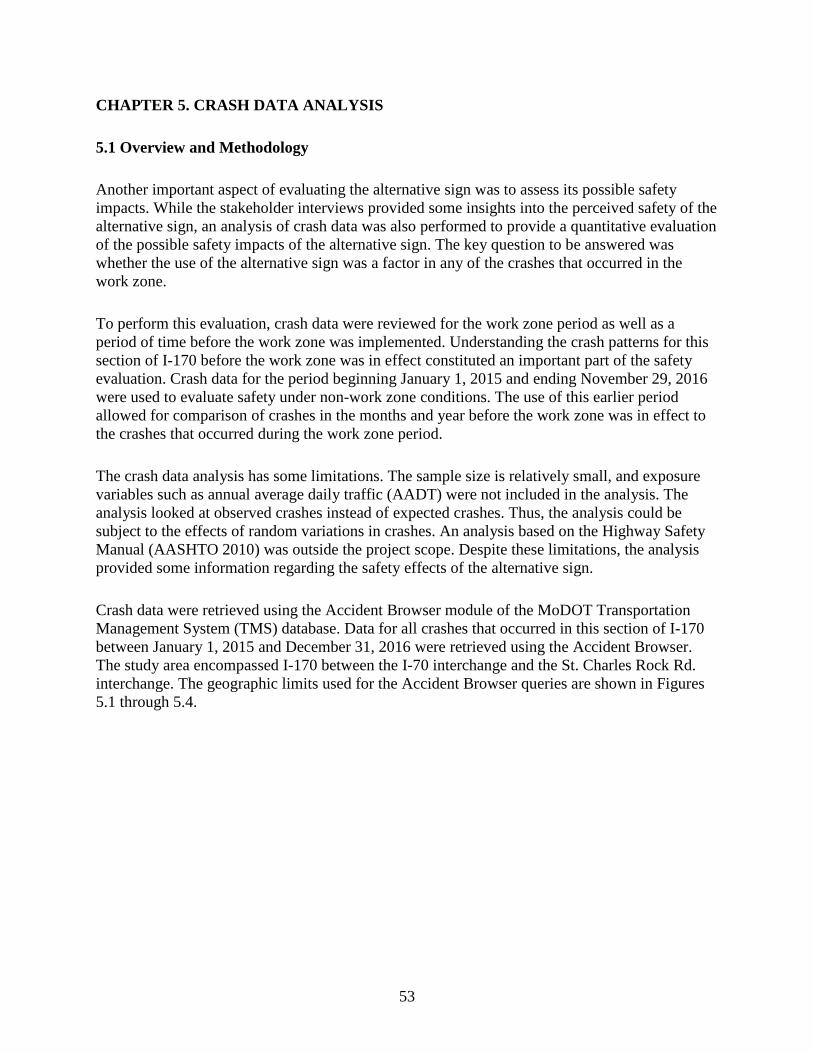
53
CHAPTER 5. CRASH DATA ANALYSIS
5.1 Overview and Methodology
Another important aspect of evaluating the alternative sign was to assess its possible safety
impacts. While the stakeholder interviews provided some insights into the perceived safety of the
alternative sign, an analysis of crash data was also performed to provide a quantitative evaluation
of the possible safety impacts of the alternative sign. The key question to be answered was
whether the use of the alternative sign was a factor in any of the crashes that occurred in the
work zone.
To perform this evaluation, crash data were reviewed for the work zone period as well as a
period of time before the work zone was implemented. Understanding the crash patterns for this
section of I-170 before the work zone was in effect constituted an important part of the safety
evaluation. Crash data for the period beginning January 1, 2015 and ending November 29, 2016
were used to evaluate safety under non-work zone conditions. The use of this earlier period
allowed for comparison of crashes in the months and year before the work zone was in effect to
the crashes that occurred during the work zone period.
The crash data analysis has some limitations. The sample size is relatively small, and exposure
variables such as annual average daily traffic (AADT) were not included in the analysis. The
analysis looked at observed crashes instead of expected crashes. Thus, the analysis could be
subject to the effects of random variations in crashes. An analysis based on the Highway Safety
Manual (AASHTO 2010) was outside the project scope. Despite these limitations, the analysis
provided some information regarding the safety effects of the alternative sign.
Crash data were retrieved using the Accident Browser module of the MoDOT Transportation
Management System (TMS) database. Data for all crashes that occurred in this section of I-170
between January 1, 2015 and December 31, 2016 were retrieved using the Accident Browser.
The study area encompassed I-170 between the I-70 interchange and the St. Charles Rock Rd.
interchange. The geographic limits used for the Accident Browser queries are shown in Figures
5.1 through 5.4.
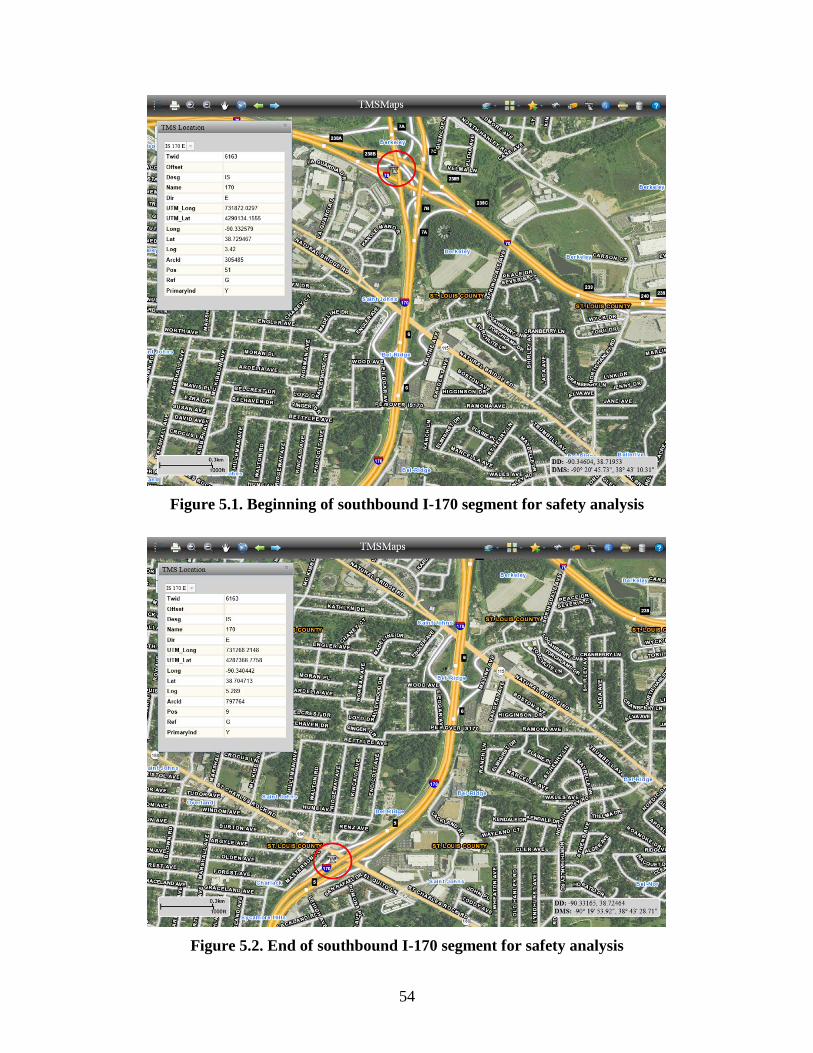
54
Figure 5.1. Beginning of southbound I-170 segment for safety analysis
Figure 5.2. End of southbound I-170 segment for safety analysis
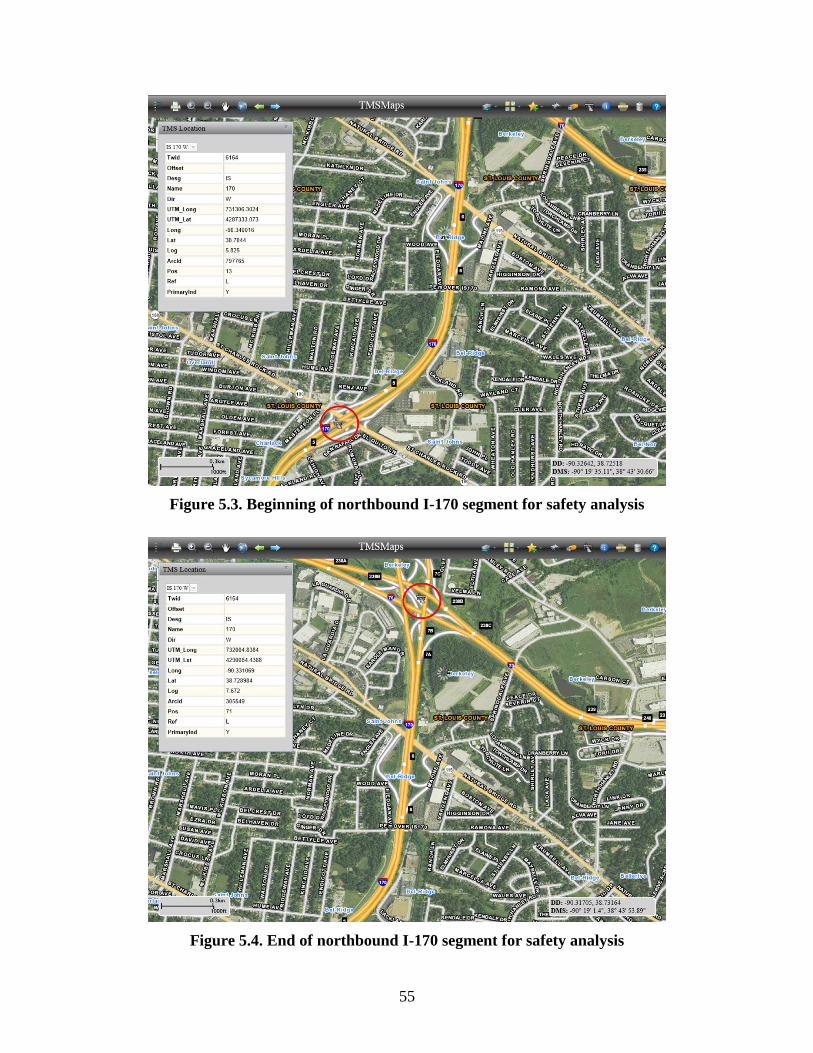
55
Figure 5.3. Beginning of northbound I-170 segment for safety analysis
Figure 5.4. End of northbound I-170 segment for safety analysis
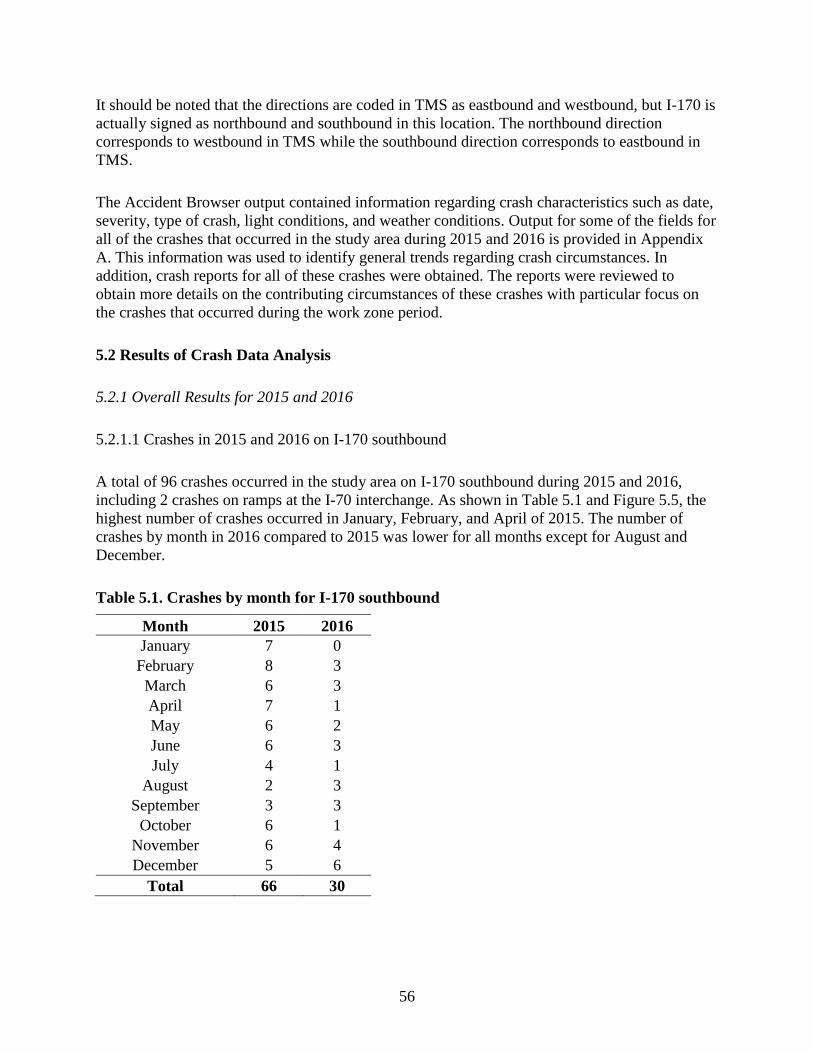
56
It should be noted that the directions are coded in TMS as eastbound and westbound, but I-170 is
actually signed as northbound and southbound in this location. The northbound direction
corresponds to westbound in TMS while the southbound direction corresponds to eastbound in
TMS.
The Accident Browser output contained information regarding crash characteristics such as date,
severity, type of crash, light conditions, and weather conditions. Output for some of the fields for
all of the crashes that occurred in the study area during 2015 and 2016 is provided in Appendix
A. This information was used to identify general trends regarding crash circumstances. In
addition, crash reports for all of these crashes were obtained. The reports were reviewed to
obtain more details on the contributing circumstances of these crashes with particular focus on
the crashes that occurred during the work zone period.
5.2 Results of Crash Data Analysis
5.2.1 Overall Results for 2015 and 2016
5.2.1.1 Crashes in 2015 and 2016 on I-170 southbound
A total of 96 crashes occurred in the study area on I-170 southbound during 2015 and 2016,
including 2 crashes on ramps at the I-70 interchange. As shown in Table 5.1 and Figure 5.5, the
highest number of crashes occurred in January, February, and April of 2015. The number of
crashes by month in 2016 compared to 2015 was lower for all months except for August and
December.
Table 5.1. Crashes by month for I-170 southbound
Month 2015 2016
January 7 0
February 8 3
March 6 3
April 7 1
May 6 2
June 6 3
July 4 1
August 2 3
September 3 3
October 6 1
November 6 4
December 5 6
Total 66 30

57
Figure 5.5. Crashes by month for I-170 southbound
The most common types of crashes were rear-end crashes, with 25 crashes in 2015 and 13
crashes in 2016, followed by passing and out of control crashes. A graph of crashes by type is
shown in Figure 5.6. As shown in the figure, the rates for rear-end and out of control crashes
decreased considerably in 2016 compared to 2015.
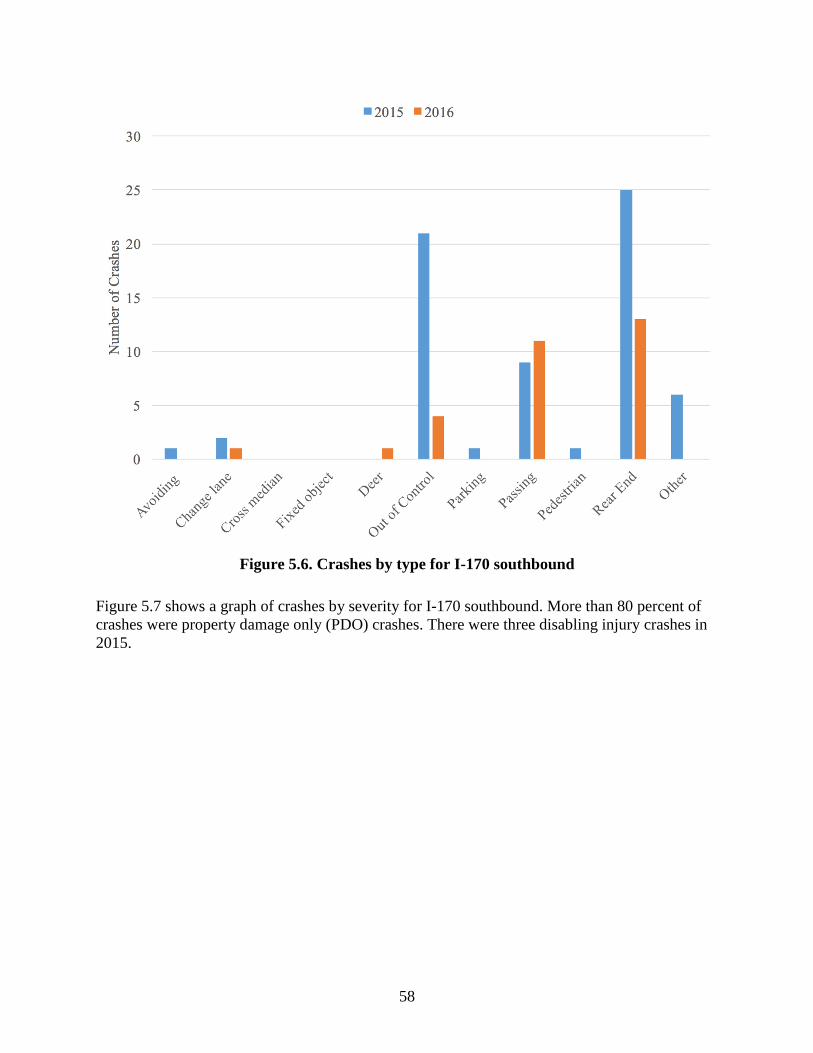
58
Figure 5.6. Crashes by type for I-170 southbound
Figure 5.7 shows a graph of crashes by severity for I-170 southbound. More than 80 percent of
crashes were property damage only (PDO) crashes. There were three disabling injury crashes in
2015.
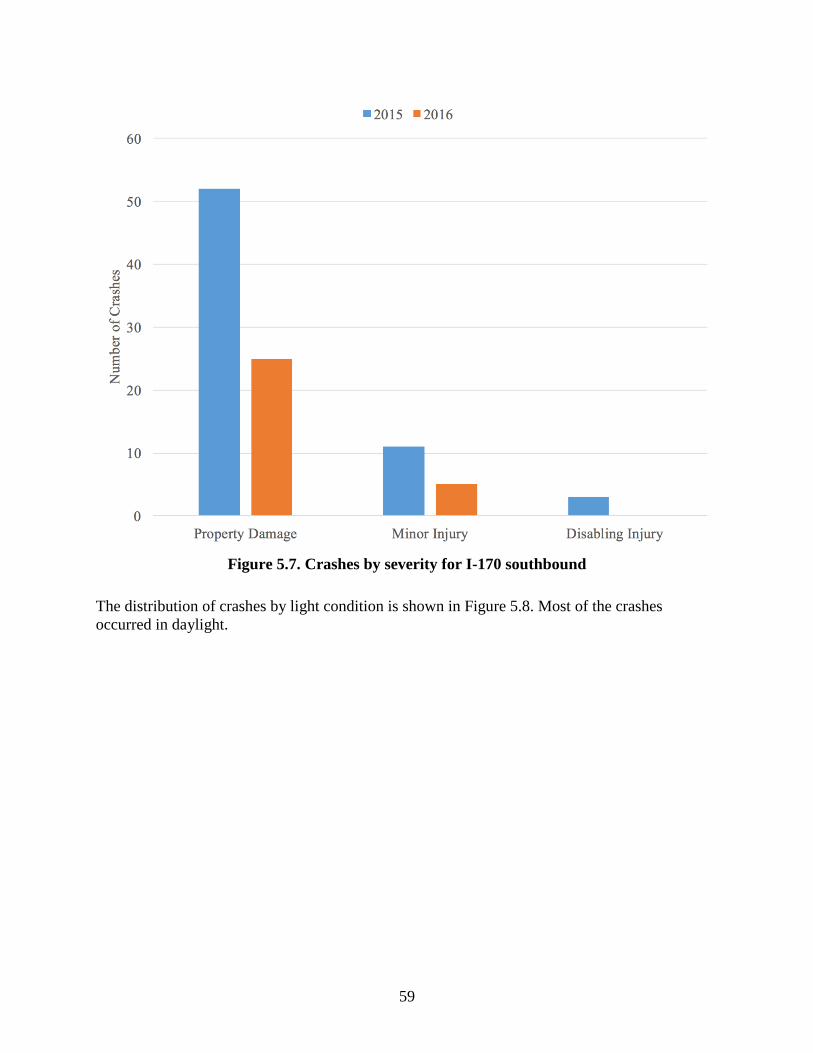
59
Figure 5.7. Crashes by severity for I-170 southbound
The distribution of crashes by light condition is shown in Figure 5.8. Most of the crashes
occurred in daylight.
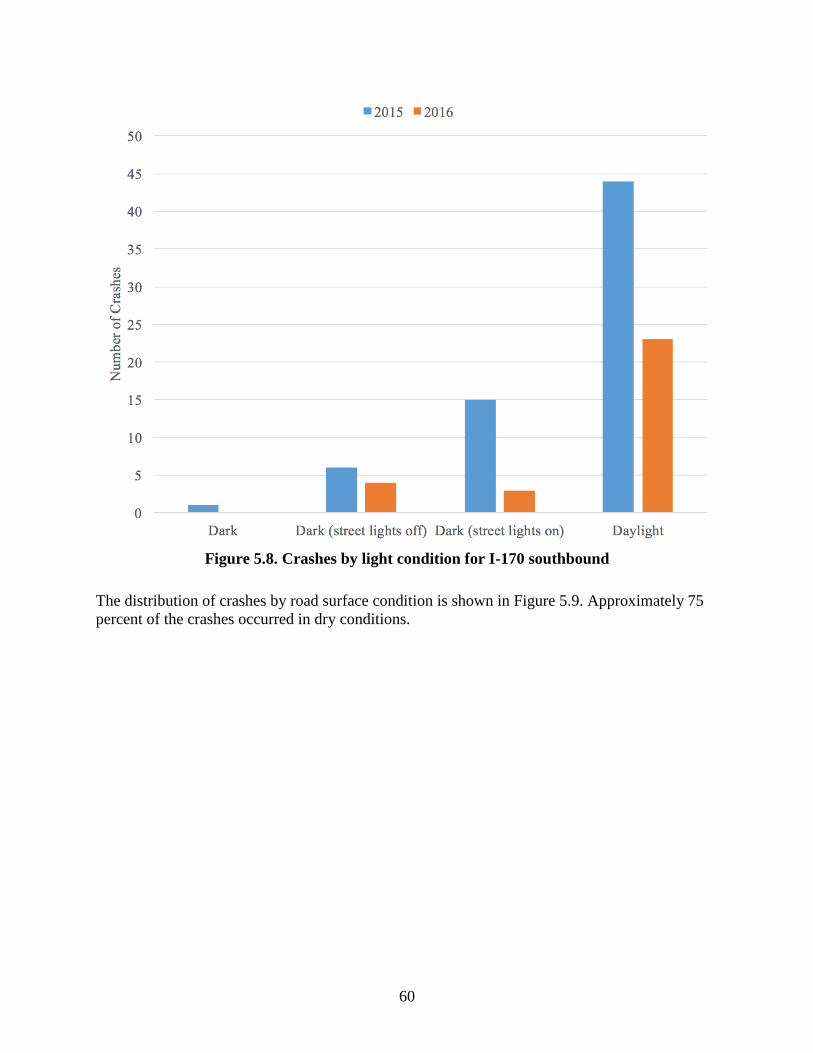
60
Figure 5.8. Crashes by light condition for I-170 southbound
The distribution of crashes by road surface condition is shown in Figure 5.9. Approximately 75
percent of the crashes occurred in dry conditions.

61
Figure 5.9. Crashes by road surface condition for I-170 southbound
5.2.1.2 Crashes in 2015 and 2016 on I-170 northbound
A total of 169 crashes occurred in the study area on I-170 northbound during 2015 and 2016,
including two crashes on ramps at the I-70 interchange. As shown in Table 5.2 and Figure 5.10,
the highest number of crashes occurred in September 2015 and November 2015. The number of
crashes by month in 2016 compared to 2015 was the same or lower for most months except for
January, March, and August.
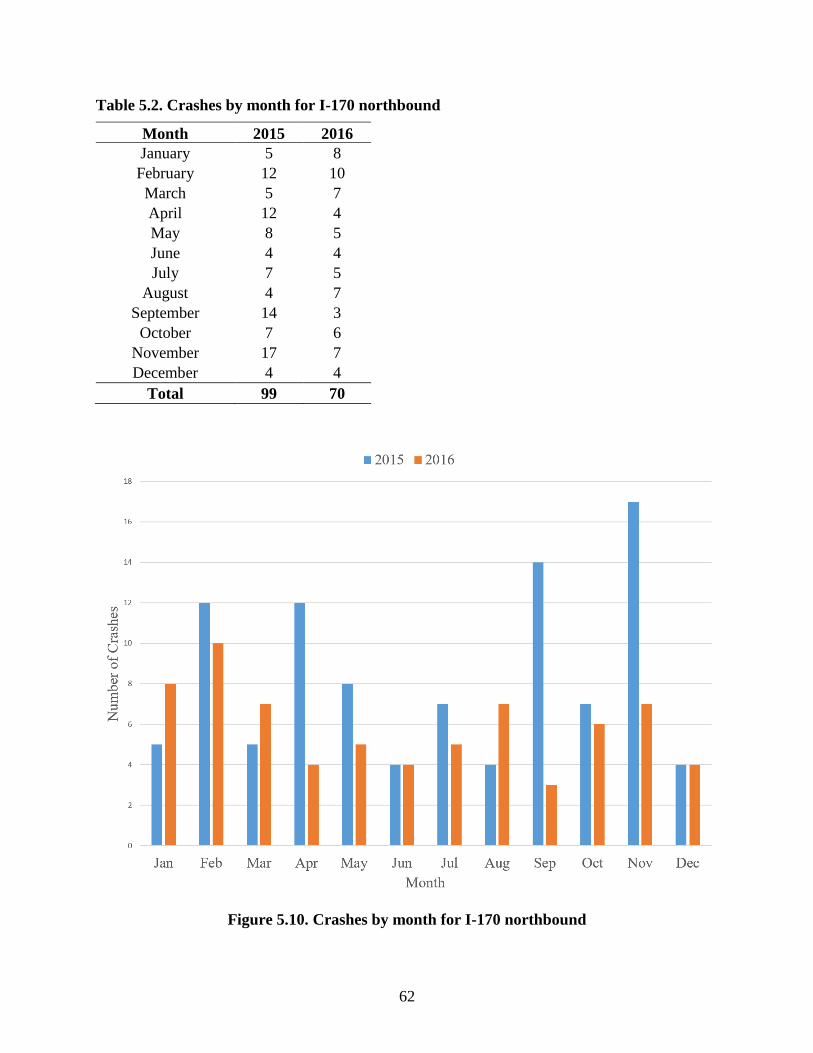
62
Table 5.2. Crashes by month for I-170 northbound
Month 2015 2016
January 5 8
February 12 10
March 5 7
April 12 4
May 8 5
June 4 4
July 7 5
August 4 7
September 14 3
October 7 6
November 17 7
December 4 4
Total 99 70
Figure 5.10. Crashes by month for I-170 northbound
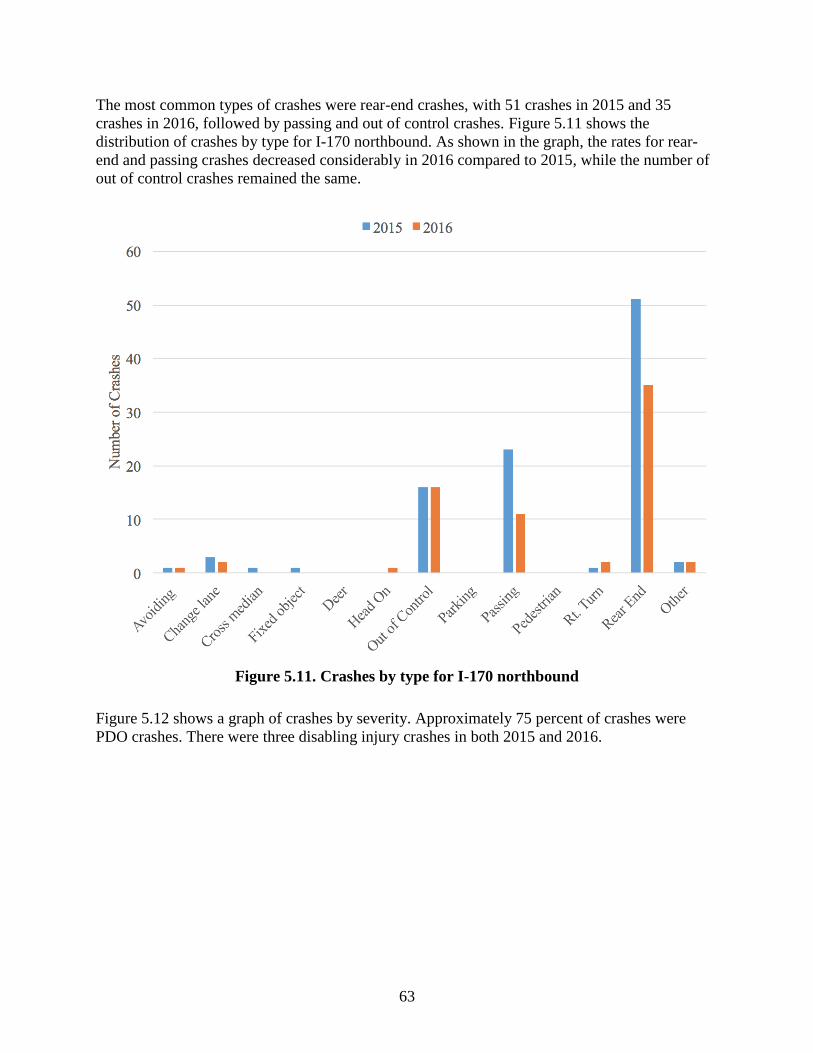
63
The most common types of crashes were rear-end crashes, with 51 crashes in 2015 and 35
crashes in 2016, followed by passing and out of control crashes. Figure 5.11 shows the
distribution of crashes by type for I-170 northbound. As shown in the graph, the rates for rear-
end and passing crashes decreased considerably in 2016 compared to 2015, while the number of
out of control crashes remained the same.
Figure 5.11. Crashes by type for I-170 northbound
Figure 5.12 shows a graph of crashes by severity. Approximately 75 percent of crashes were
PDO crashes. There were three disabling injury crashes in both 2015 and 2016.
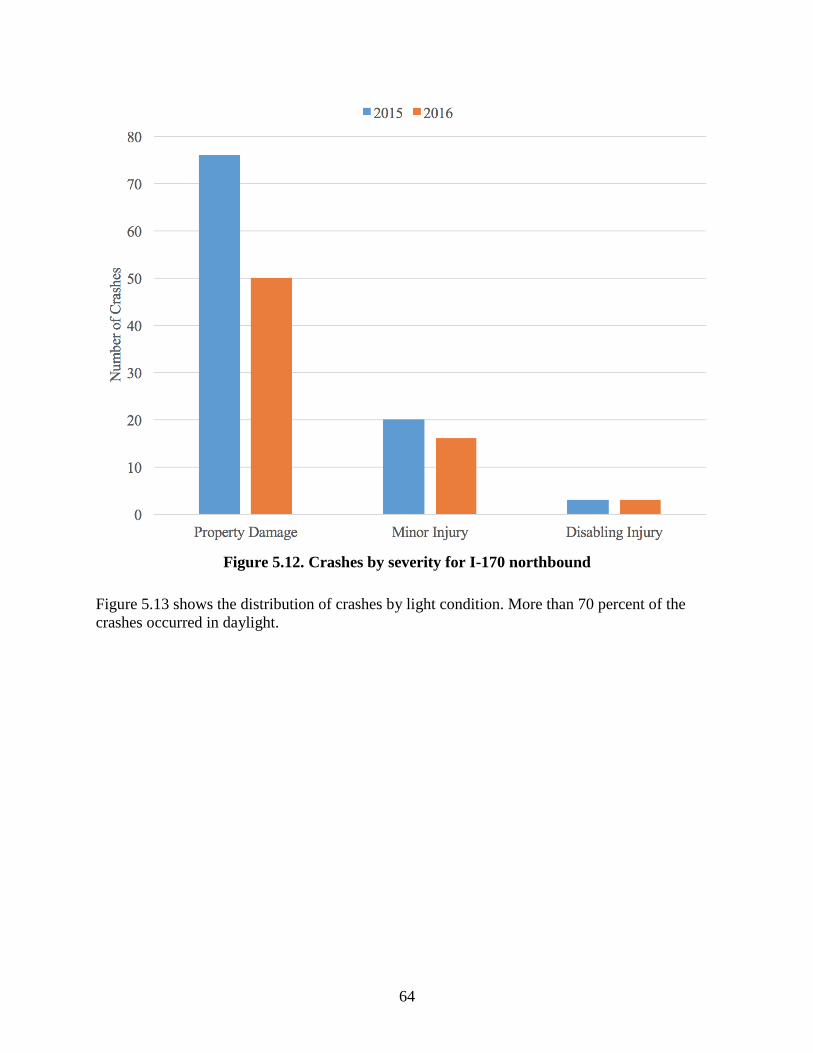
64
Figure 5.12. Crashes by severity for I-170 northbound
Figure 5.13 shows the distribution of crashes by light condition. More than 70 percent of the
crashes occurred in daylight.

65
Figure 5.13. Crashes by light condition for I-170 northbound
The distribution of crashes by road surface condition is shown in Figure 5.14. Approximately 75
percent of the crashes occurred in dry conditions.
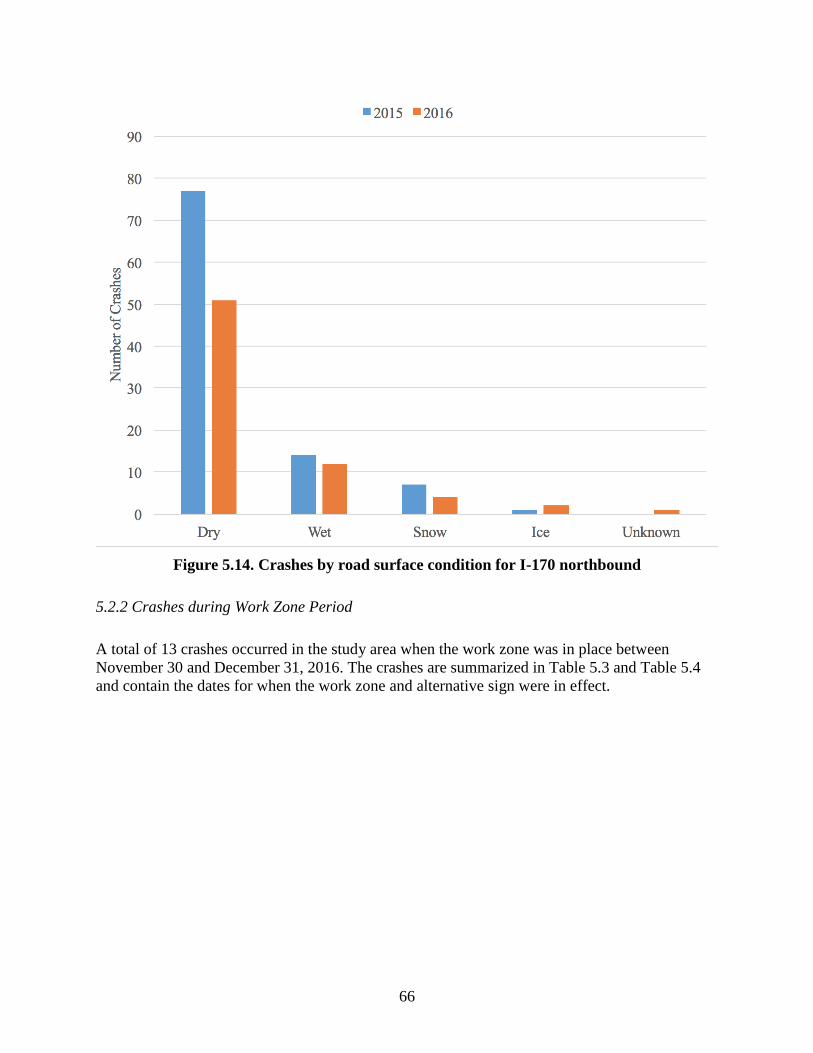
66
Figure 5.14. Crashes by road surface condition for I-170 northbound
5.2.2 Crashes during Work Zone Period
A total of 13 crashes occurred in the study area when the work zone was in place between
November 30 and December 31, 2016. The crashes are summarized in Table 5.3 and Table 5.4
and contain the dates for when the work zone and alternative sign were in effect.

67
Table 5.3. Summary of crashes during work zone period
Travelway Log Crash Class Date Severity Rating* Description
IS 170 E 4.015 PASSING 12/1/2016 PDO Vehicles collided on side near closed lane area for
work zone.
IS 170 E 4.614 PASSING 12/8/2016 PDO Collision during lane change.
IS 170 E 3.695 PASSING 12/19/2016 PDO
Lane encroachment. Unclear if crash occurred near
EB I-70 entrance ramp or just before construction gore
point.
IS 170 E 3.558 REAR-END 12/21/2016 MI Rear-end collision due to traffic slowdown.
IS 170 E 3.862 PASSING 12/23/2016 PDO Collision during lane change in traffic slowdown.
IS 170 E 3.583 OUT OF CONTROL 12/27/2016 MI Vehicle swerved to avoid striking a squirrel and struck
guardrail.
IS 170 W 7.124 REAR-END 11/30/2016 PDO Rear-end collision in stopped traffic.
IS 170 W 7.473 REAR-END 11/30/2016 PDO Rear-end collision in stopped traffic.
IS 170 W 7.548 REAR-END 11/30/2016 PDO Rear-end collision due to another driver who was
driving recklessly.
IS 170 W 7.049 REAR-END 12/12/2016 PDO Rear-end collision after vehicle followed construction
truck into work area.
IS 170 W 5.869 PASSING 12/16/2016 I Vehicle slid on ice, causing collision with another
vehicle.
IS 170 W 6.943 CHANGING LANE 12/19/2016 MI Vehicle collision due to lane change in advance of
split in icy road conditions.
IS 170 W 6.558 REAR-END 12/20/2016 PDO Rear-end collision in heavy work zone traffic.
IS = Interstate
* PDO = Property Damage Only, MI = Minor Injury, I = Injury
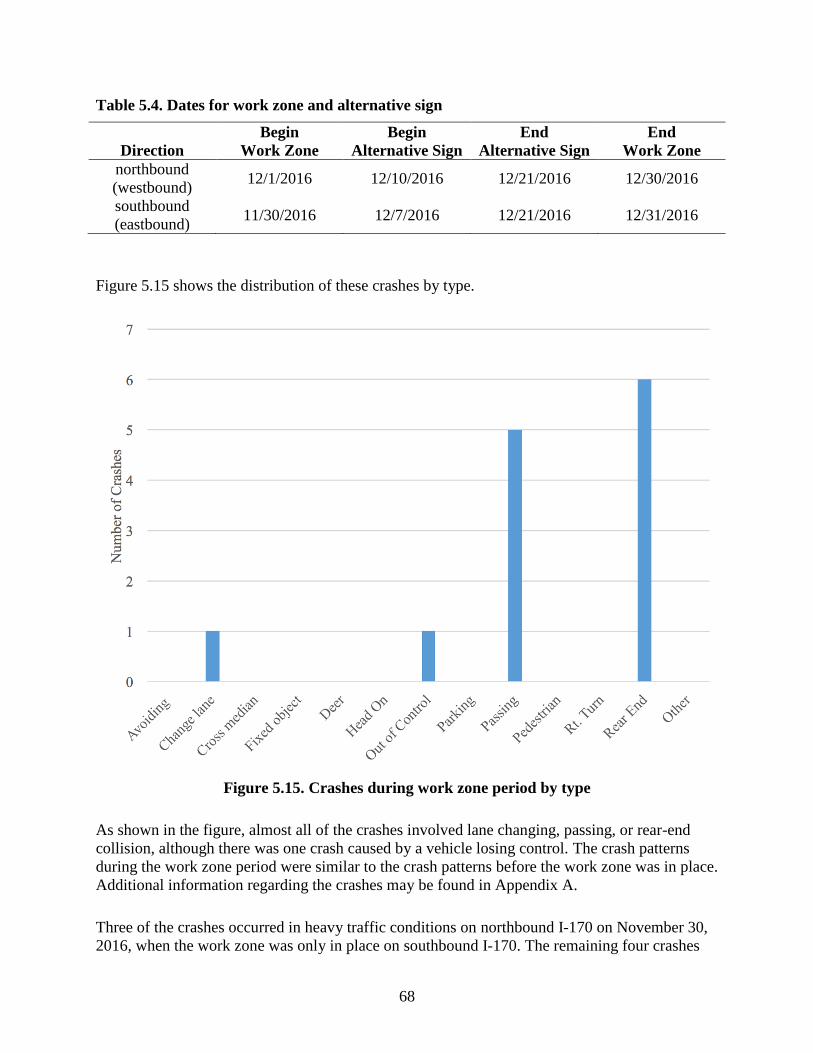
68
Table 5.4. Dates for work zone and alternative sign
Direction
Begin
Work Zone
Begin
Alternative Sign
End
Alternative Sign
End
Work Zone
northbound
(westbound) 12/1/2016 12/10/2016 12/21/2016 12/30/2016
southbound
(eastbound) 11/30/2016 12/7/2016 12/21/2016 12/31/2016
Figure 5.15 shows the distribution of these crashes by type.
Figure 5.15. Crashes during work zone period by type
As shown in the figure, almost all of the crashes involved lane changing, passing, or rear-end
collision, although there was one crash caused by a vehicle losing control. The crash patterns
during the work zone period were similar to the crash patterns before the work zone was in place.
Additional information regarding the crashes may be found in Appendix A.
Three of the crashes occurred in heavy traffic conditions on northbound I-170 on November 30,
2016, when the work zone was only in place on southbound I-170. The remaining four crashes
69
on northbound I-170 occurred during the time period when the alternative sign was in place.
Factors that contributed to these crashes included heavy traffic conditions, icy road conditions,
lane changing, and a vehicle following a construction truck into the work area. The crash on
northbound I-170 on December 19, 2016 occurred as a result of a collision between vehicles
during a lane change maneuver in advance of the work zone split. However, the road conditions
at the time of the crash were icy, and there is no indication in the crash report that driver
confusion or the use of the alternative sign was a contributing factor in the crash.
A total of six crashes occurred on southbound I-170 between November 30 and December 31,
2016, with three of the crashes taking place while the alternative sign was in place. Two of the
six crashes occurred during traffic slowdowns, while another crash was caused by a vehicle
swerving to avoid a collision with a squirrel. One crash happened near the lane closure area
before the alternative sign was in place. Two of the crashes that occurred while the alternative
sign was being used were due to lane encroachment, while the third crash was a rear-end
collision during a traffic slowdown. There is no indication from the crash reports that driver
confusion or the use of the alternative sign played a role in any of these crashes.
5.3 Summary of Results of Crash Data Analysis
It does not appear that the use of the alternative split sign affected the crash patterns on this
section of I-170. The number of crashes in 2016 was generally lower than the number of crashes
in 2015. On southbound I-170, there was one more crash in December 2016 compared to
December 2015, and there were two more crashes in December 2016 compared to November
2016. These variations are likely due to the random fluctuations in the number of crashes. On
northbound I-170, the number of crashes per month remained the same between December 2015
and December 2016. In addition, there were three fewer crashes in December 2016 compared to
November 2016. In reviewing the combined crash statistics in both directions, there was one
more crash in December 2016 compared to December 2015 and one less crash in December
2016 compared to November 2016.
The predominant types of crashes that occurred on this stretch of I-170 during the non-work zone
period were rear-end, passing, and out of control. This crash pattern mirrors the types of crashes
that occurred during the work zone period from November 30, 2016 to December 31, 2016.
During the work zone period, 46 percent of the crashes were rear-end and 38 percent were
passing. A total of 13 crashes occurred during this time period, although three of these crashes
took place on northbound I-170 when the work zone was only in place on southbound I-170.
While there were some crashes due to lane changing or passing when the alternative sign was in
place, the use of the alternative sign does not appear to have been a contributing factor to these
crashes based on the information contained in the crash reports.
70
CHAPTER 6. TRAVEL TIME ANALYSIS
6.1 Introduction
In addition to the safety analysis, the operations of the work zone with the alternative sign were
assessed. To perform this analysis, travel times between the work zone period with the
alternative sign and the non-work zone period were compared. As previously shown in Table
5.4, the alternative sign was in place on southbound I-170 for 15 days (between December 7 and
December 21, 2016) and on northbound I-170 for 12 days (between December 10 and December
21, 2016).
6.2 Travel Time Data
To analyze the travel time impacts for the presence of the work zone and alternative work zone
split signage, adjacent segments around the work zone location (within a two-mile radius) were
queried from the RITIS database. (MoDOT obtains travel data from RITIS for various roadways
in Missouri.) Travel time data from RITIS were used on a previous project to develop a data-
driven traffic impact assessment tool for work zones (Edara et al. 2017).
Figure 6.1 shows a screenshot of a RITIS data query window, including a coverage map of the
St. Louis area and criteria for the query, including date, time, duration, and data format.
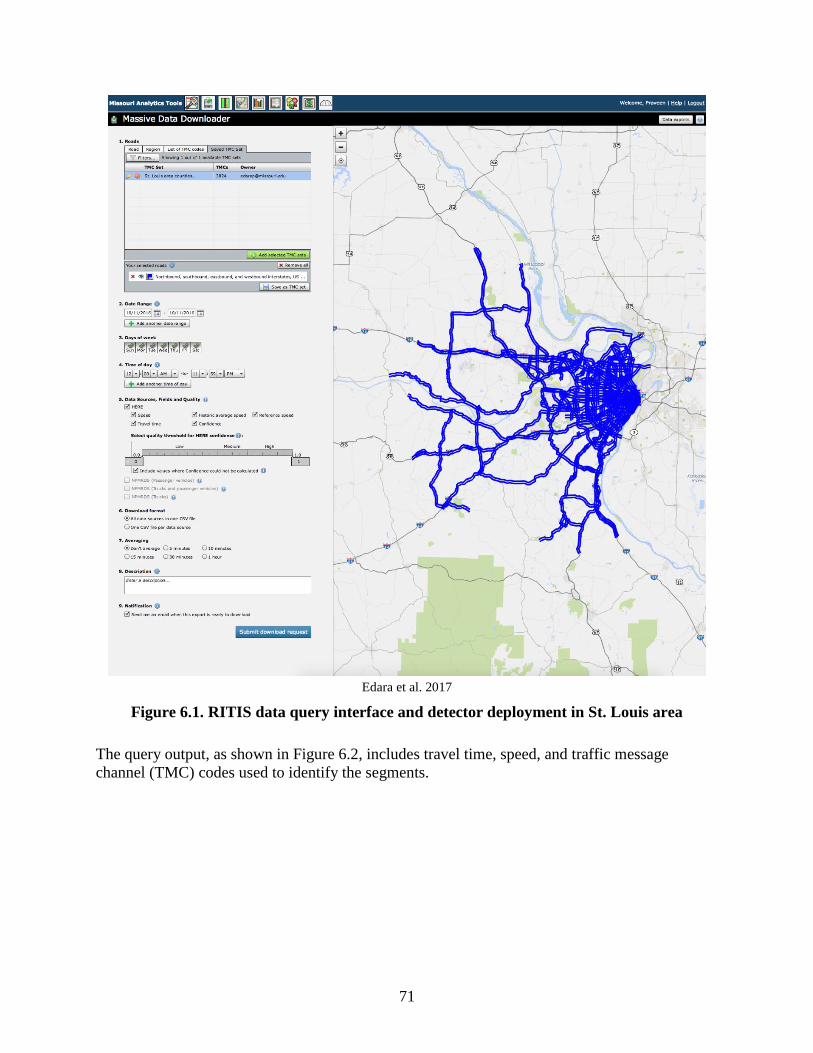
71
Edara et al. 2017
Figure 6.1. RITIS data query interface and detector deployment in St. Louis area
The query output, as shown in Figure 6.2, includes travel time, speed, and traffic message
channel (TMC) codes used to identify the segments.
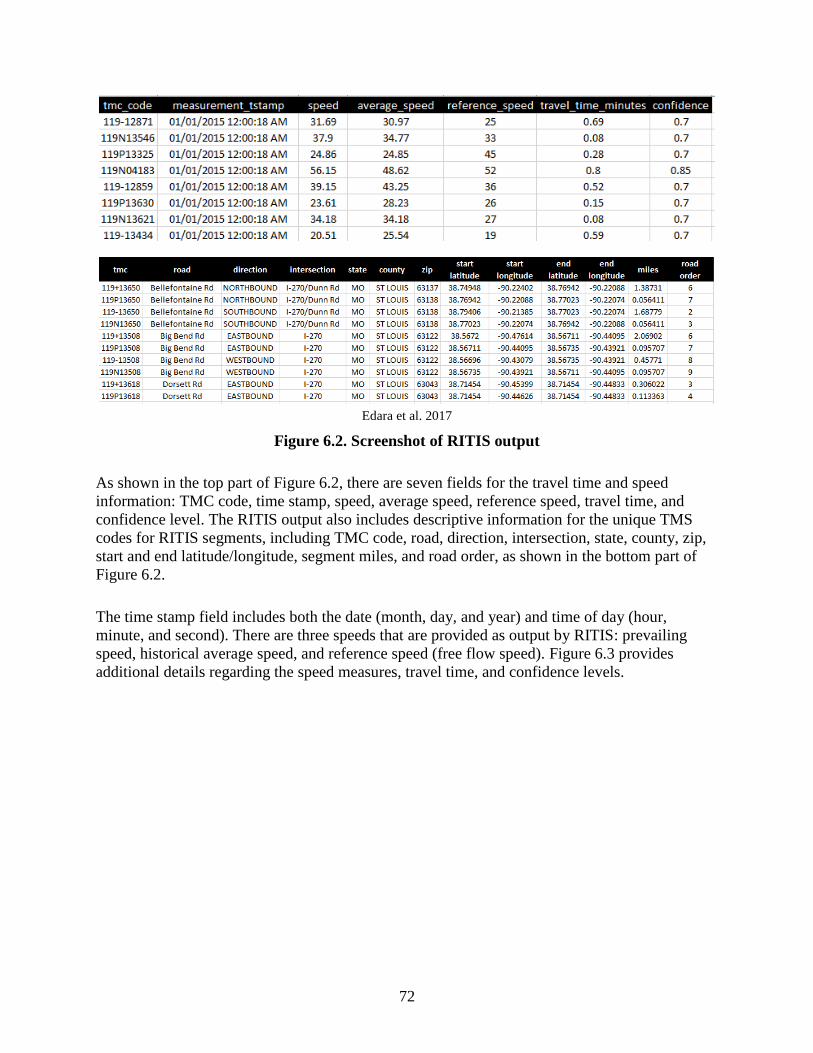
72
Edara et al. 2017
Figure 6.2. Screenshot of RITIS output
As shown in the top part of Figure 6.2, there are seven fields for the travel time and speed
information: TMC code, time stamp, speed, average speed, reference speed, travel time, and
confidence level. The RITIS output also includes descriptive information for the unique TMS
codes for RITIS segments, including TMC code, road, direction, intersection, state, county, zip,
start and end latitude/longitude, segment miles, and road order, as shown in the bottom part of
Figure 6.2.
The time stamp field includes both the date (month, day, and year) and time of day (hour,
minute, and second). There are three speeds that are provided as output by RITIS: prevailing
speed, historical average speed, and reference speed (free flow speed). Figure 6.3 provides
additional details regarding the speed measures, travel time, and confidence levels.
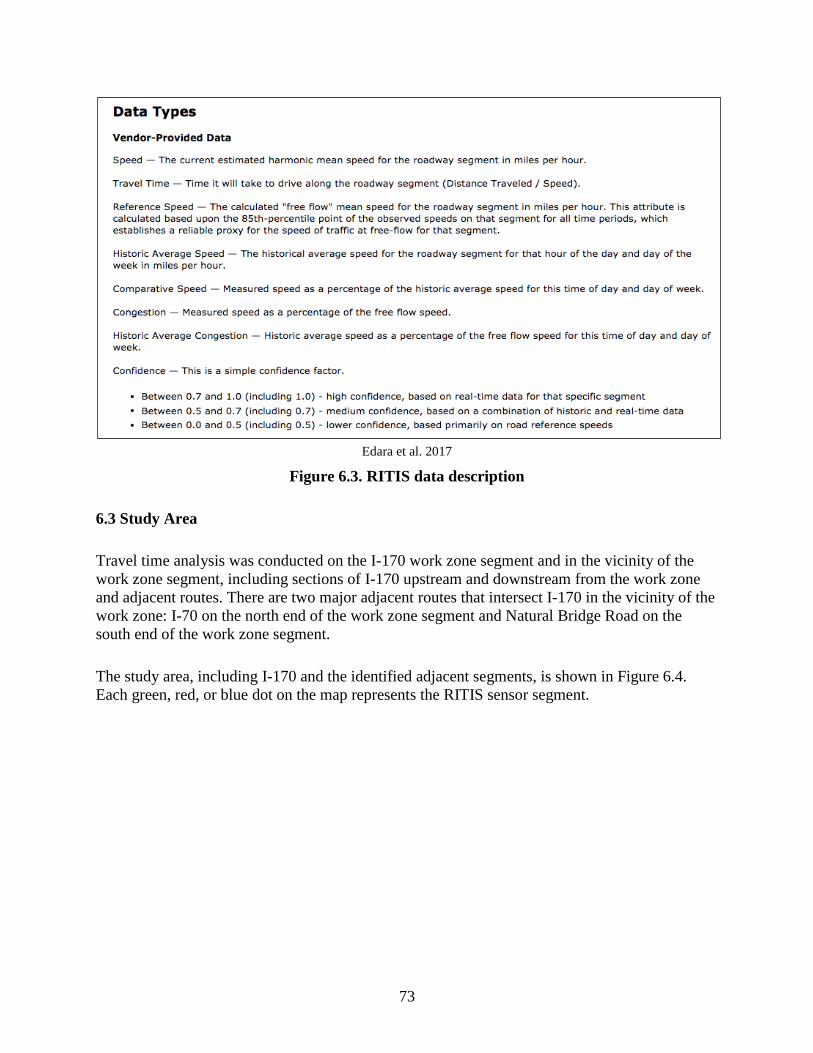
73
Edara et al. 2017
Figure 6.3. RITIS data description
6.3 Study Area
Travel time analysis was conducted on the I-170 work zone segment and in the vicinity of the
work zone segment, including sections of I-170 upstream and downstream from the work zone
and adjacent routes. There are two major adjacent routes that intersect I-170 in the vicinity of the
work zone: I-70 on the north end of the work zone segment and Natural Bridge Road on the
south end of the work zone segment.
The study area, including I-170 and the identified adjacent segments, is shown in Figure 6.4.
Each green, red, or blue dot on the map represents the RITIS sensor segment.

74
Google Maps
Figure 6.4. Study area for operational analysis using RITIS
The AADT values for these routes are presented in Table 6.1. I-70 and I-170 have quite similar
AADT values for both total traffic and number of trucks.
Table 6.1. AADT for the study routes in 2015
Route Traffic Truck
I-170 113,253 15,440
I-70 133,231 11,613*
Natural Bridge Road 13,017 NA
*A closest upstream/downstream observation
Source: MoDOT 2015b
6.4 Performance Measurement for Travel Time Analysis
Two measures using historical information were utilized for quantifying the operational impacts
of the work zone: travel time difference analysis based on historical three-week average travel
time for the segment (HATT) and travel time difference analysis based on travel time for the
segment one year ago (HYTT). Since the HATT needs to include travel time information for
only non-work zone days, the three weeks prior the first day of work zone, between October 27,
2016 and November 16, 2016, were used. The time period between November 17 and 29, 2016
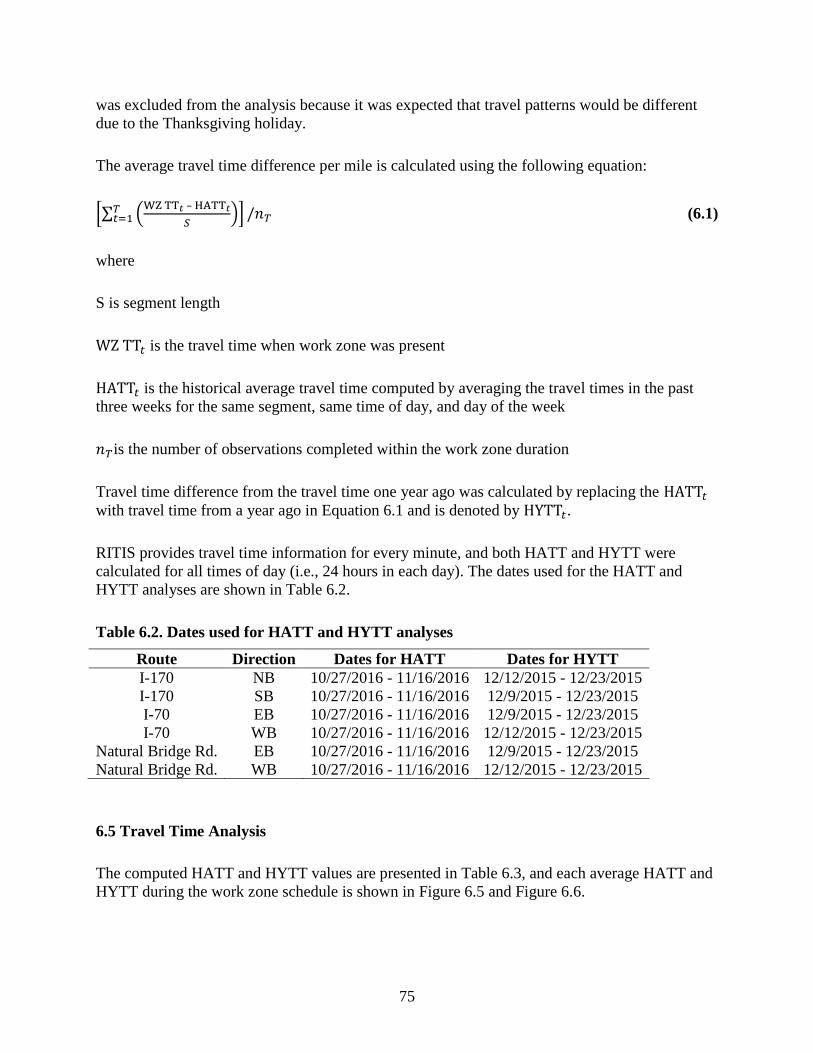
75
was excluded from the analysis because it was expected that travel patterns would be different
due to the Thanksgiving holiday.
The average travel time difference per mile is calculated using the following equation:
[∑ (WZ TT𝑡 – HATT𝑡
𝑆)𝑇
𝑡=1 ] /𝑛𝑇 (6.1)
where
S is segment length
WZ TT𝑡 is the travel time when work zone was present
HATT𝑡 is the historical average travel time computed by averaging the travel times in the past
three weeks for the same segment, same time of day, and day of the week
𝑛𝑇is the number of observations completed within the work zone duration
Travel time difference from the travel time one year ago was calculated by replacing the HATT𝑡
with travel time from a year ago in Equation 6.1 and is denoted by HYTT𝑡.
RITIS provides travel time information for every minute, and both HATT and HYTT were
calculated for all times of day (i.e., 24 hours in each day). The dates used for the HATT and
HYTT analyses are shown in Table 6.2.
Table 6.2. Dates used for HATT and HYTT analyses
Route Direction Dates for HATT Dates for HYTT
I-170 NB 10/27/2016 - 11/16/2016 12/12/2015 - 12/23/2015
I-170 SB 10/27/2016 - 11/16/2016 12/9/2015 - 12/23/2015
I-70 EB 10/27/2016 - 11/16/2016 12/9/2015 - 12/23/2015
I-70 WB 10/27/2016 - 11/16/2016 12/12/2015 - 12/23/2015
Natural Bridge Rd. EB 10/27/2016 - 11/16/2016 12/9/2015 - 12/23/2015
Natural Bridge Rd. WB 10/27/2016 - 11/16/2016 12/12/2015 - 12/23/2015
6.5 Travel Time Analysis
The computed HATT and HYTT values are presented in Table 6.3, and each average HATT and
HYTT during the work zone schedule is shown in Figure 6.5 and Figure 6.6.
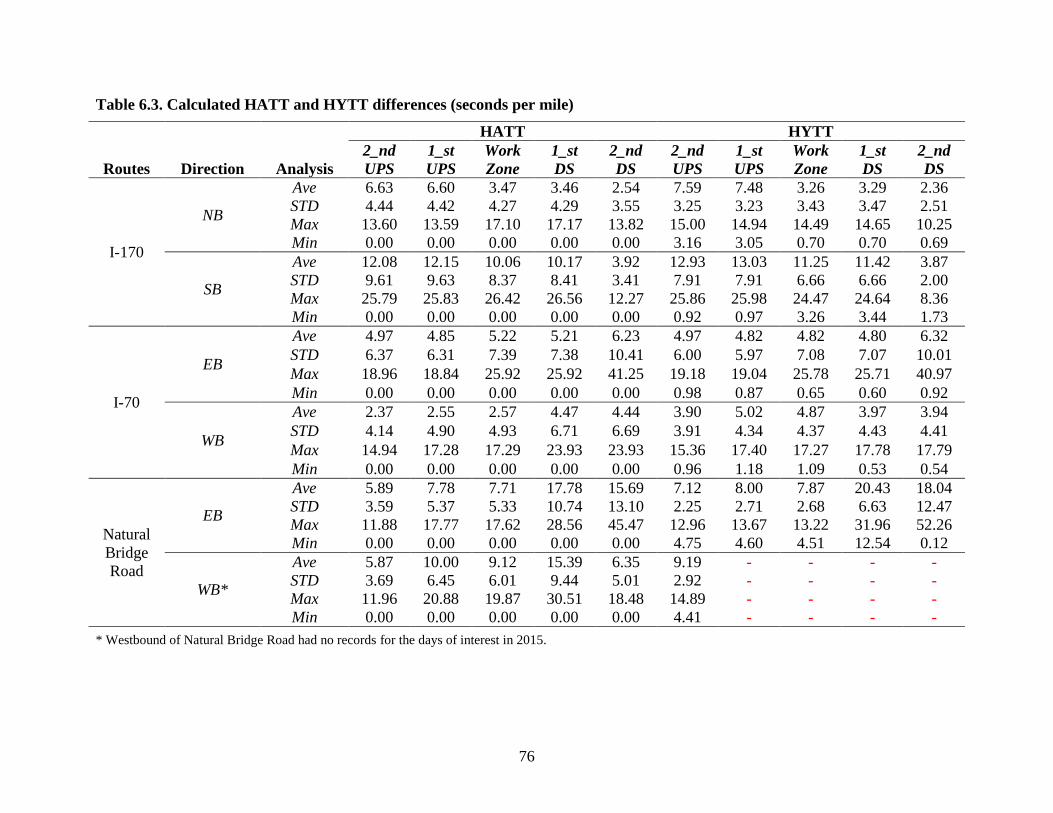
76
Table 6.3. Calculated HATT and HYTT differences (seconds per mile)
Routes Direction Analysis
HATT HYTT
2_nd
UPS
1_st
UPS
Work
Zone
1_st
DS
2_nd
DS
2_nd
UPS
1_st
UPS
Work
Zone
1_st
DS
2_nd
DS
I-170
NB
Ave 6.63 6.60 3.47 3.46 2.54 7.59 7.48 3.26 3.29 2.36
STD 4.44 4.42 4.27 4.29 3.55 3.25 3.23 3.43 3.47 2.51
Max 13.60 13.59 17.10 17.17 13.82 15.00 14.94 14.49 14.65 10.25
Min 0.00 0.00 0.00 0.00 0.00 3.16 3.05 0.70 0.70 0.69
SB
Ave 12.08 12.15 10.06 10.17 3.92 12.93 13.03 11.25 11.42 3.87
STD 9.61 9.63 8.37 8.41 3.41 7.91 7.91 6.66 6.66 2.00
Max 25.79 25.83 26.42 26.56 12.27 25.86 25.98 24.47 24.64 8.36
Min 0.00 0.00 0.00 0.00 0.00 0.92 0.97 3.26 3.44 1.73
I-70
EB
Ave 4.97 4.85 5.22 5.21 6.23 4.97 4.82 4.82 4.80 6.32
STD 6.37 6.31 7.39 7.38 10.41 6.00 5.97 7.08 7.07 10.01
Max 18.96 18.84 25.92 25.92 41.25 19.18 19.04 25.78 25.71 40.97
Min 0.00 0.00 0.00 0.00 0.00 0.98 0.87 0.65 0.60 0.92
WB
Ave 2.37 2.55 2.57 4.47 4.44 3.90 5.02 4.87 3.97 3.94
STD 4.14 4.90 4.93 6.71 6.69 3.91 4.34 4.37 4.43 4.41
Max 14.94 17.28 17.29 23.93 23.93 15.36 17.40 17.27 17.78 17.79
Min 0.00 0.00 0.00 0.00 0.00 0.96 1.18 1.09 0.53 0.54
Natural
Bridge
Road
EB
Ave 5.89 7.78 7.71 17.78 15.69 7.12 8.00 7.87 20.43 18.04
STD 3.59 5.37 5.33 10.74 13.10 2.25 2.71 2.68 6.63 12.47
Max 11.88 17.77 17.62 28.56 45.47 12.96 13.67 13.22 31.96 52.26
Min 0.00 0.00 0.00 0.00 0.00 4.75 4.60 4.51 12.54 0.12
WB*
Ave 5.87 10.00 9.12 15.39 6.35 9.19 - - - -
STD 3.69 6.45 6.01 9.44 5.01 2.92 - - - -
Max 11.96 20.88 19.87 30.51 18.48 14.89 - - - -
Min 0.00 0.00 0.00 0.00 0.00 4.41 - - - -
* Westbound of Natural Bridge Road had no records for the days of interest in 2015.
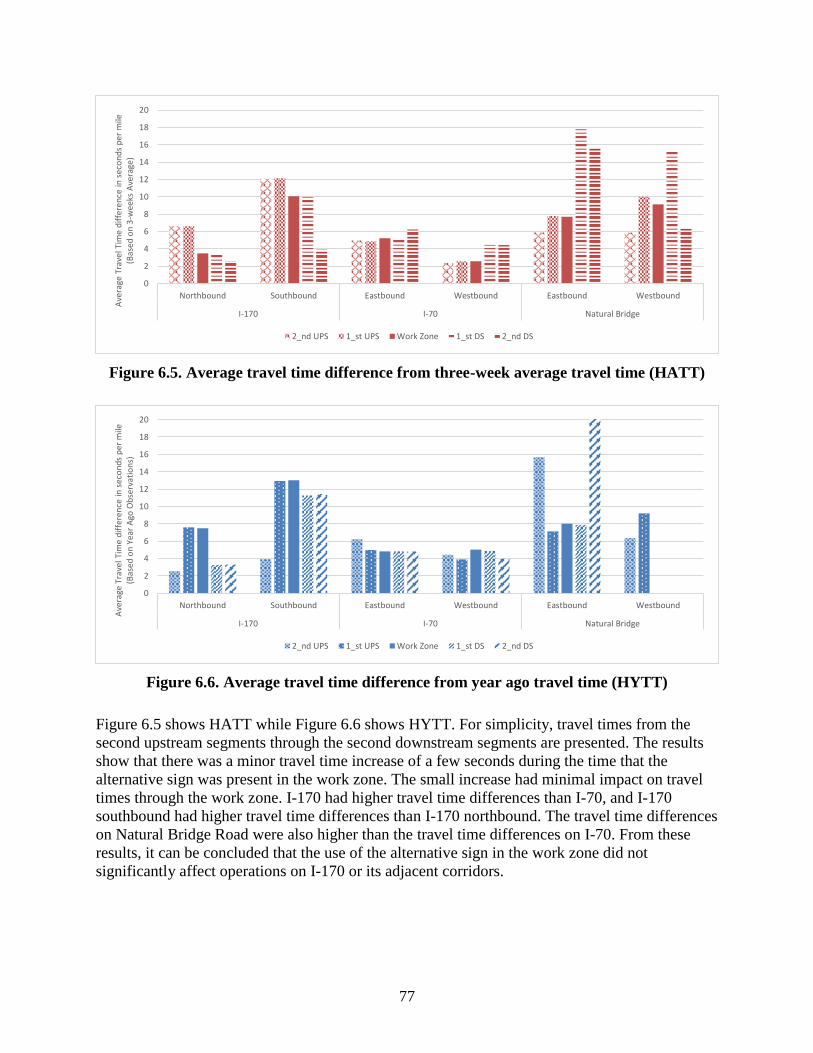
77
Figure 6.5. Average travel time difference from three-week average travel time (HATT)
Figure 6.6. Average travel time difference from year ago travel time (HYTT)
Figure 6.5 shows HATT while Figure 6.6 shows HYTT. For simplicity, travel times from the
second upstream segments through the second downstream segments are presented. The results
show that there was a minor travel time increase of a few seconds during the time that the
alternative sign was present in the work zone. The small increase had minimal impact on travel
times through the work zone. I-170 had higher travel time differences than I-70, and I-170
southbound had higher travel time differences than I-170 northbound. The travel time differences
on Natural Bridge Road were also higher than the travel time differences on I-70. From these
results, it can be concluded that the use of the alternative sign in the work zone did not
significantly affect operations on I-170 or its adjacent corridors.
0
2
4
6
8
10
12
14
16
18
20
Northbound Southbound Eastbound Westbound Eastbound Westbound
I-170 I-70 Natural Bridge
Ave
rage
Tra
vel T
ime
dif
fere
nce
in s
eco
nd
s p
er m
ile
(Bas
ed o
n 3
-wee
ks A
vera
ge)
2_nd UPS 1_st UPS Work Zone 1_st DS 2_nd DS
0
2
4
6
8
10
12
14
16
18
20
Northbound Southbound Eastbound Westbound Eastbound Westbound
I-170 I-70 Natural Bridge
Ave
rage
Tra
vel T
ime
dif
fere
nce
in s
eco
nd
s p
er m
ile
(Bas
ed o
n Y
ear
Ago
Ob
serv
atio
ns)
2_nd UPS 1_st UPS Work Zone 1_st DS 2_nd DS

78
CHAPTER 7. CONCLUSIONS
In this project, the use of alternative signage for closure of a middle lane in a freeway work zone
was evaluated based on its implementation at the work zone for the Missouri bridge
rehabilitation project J6I2104 on I-I70 between I-70 and Natural Bridge Road. The work zone
included the shifting of three lanes, two lanes around one side of the work area and one lane
around the other side. The evaluation of the alternative signage included the collection and
analysis of field videos to assess driver behavior, stakeholder interviews, driver surveys, and
operational and safety analyses. The findings from the study can be summarized as follows:
Drivers seemed to generally accept the alternative signage because no concerns regarding the
use of the sign were submitted through the MoDOT driver survey website.
The use of the alternative sign did not create any adverse safety impacts. Crash patterns
during the work zone period were similar to the crash patterns before the work zone was in
place, and the use of the alternative sign did not appear to be a contributing factor in any
work zone crashes.
Lane changing behavior decreased as the construction progressed.
Instances of aggressive driver behavior were observed in the videos, but these instances do
not appear to be related to the use of the alternative sign.
The use of the alternative sign did not cause any adverse operational impacts in the work
zone and surrounding area.
MoDOT personnel and contractors familiar with the project believed that the sign helped to
communicate information clearly but had mixed perceptions on whether the use of the sign
improved safety. Some respondents believed that drivers simply do not pay attention to signs.
In summary, the investigation of the use of the alternative sign on the I-170 project found that the
alternative sign has great potential for use on freeway work zones with lane closures in the
middle lane. The stakeholders believed that it communicated information more effectively to
drivers, and the use of the sign did not appear to create any adverse impacts for operations or
safety.
79
REFERENCES
AASHTO. 2010. Highway Safety Manual (HSM) 2010. American Association of State Highway
and Transportation Officials, Washington, DC.
Bertucci, A. 2006. Sign Legibility Rules of Thumb. US Sign Council, Bristol, PA.
Edara, P., Y. Chang, C. Sun, and H. Brown. 2017. Data-Driven Traffic Impact Assessment Tool
for Work Zones. Smart Work Zone Deployment Initiative. Iowa Department of
Transportation and Midwest Transportation Center, Ames, IA.
Edara, P., C. Sun, and Z. Zhu. 2014. Investigation of Alternative Work Zone Merging Sign
Configurations. Missouri Department of Transportation, Jefferson City, MO.
FHWA. 2009. Manual on Uniform Traffic Control Devices for Streets and Highways (MUTCD).
Federal Highway Administration, Washington, DC.
MoDOT. 2013. MoDOT Work Zone Customer Survey. Missouri Department of Transportation,
Jefferson City, MO. http://www.modot.org/workzones/Comments.htm. Accessed April
25, 2017.
MoDOT. 2015a. Construction Plans for Job No. J6I2104, Route 70, St. Louis County. Missouri
Department of Transportation, Jefferson City, MO.
MoDOT. 2015b. Traffic Volume Map. Missouri Department of Transportation, Jefferson City,
MO. http://www.modot.org/safety/trafficvolumemaps.htm. Accessed April 17, 2017.

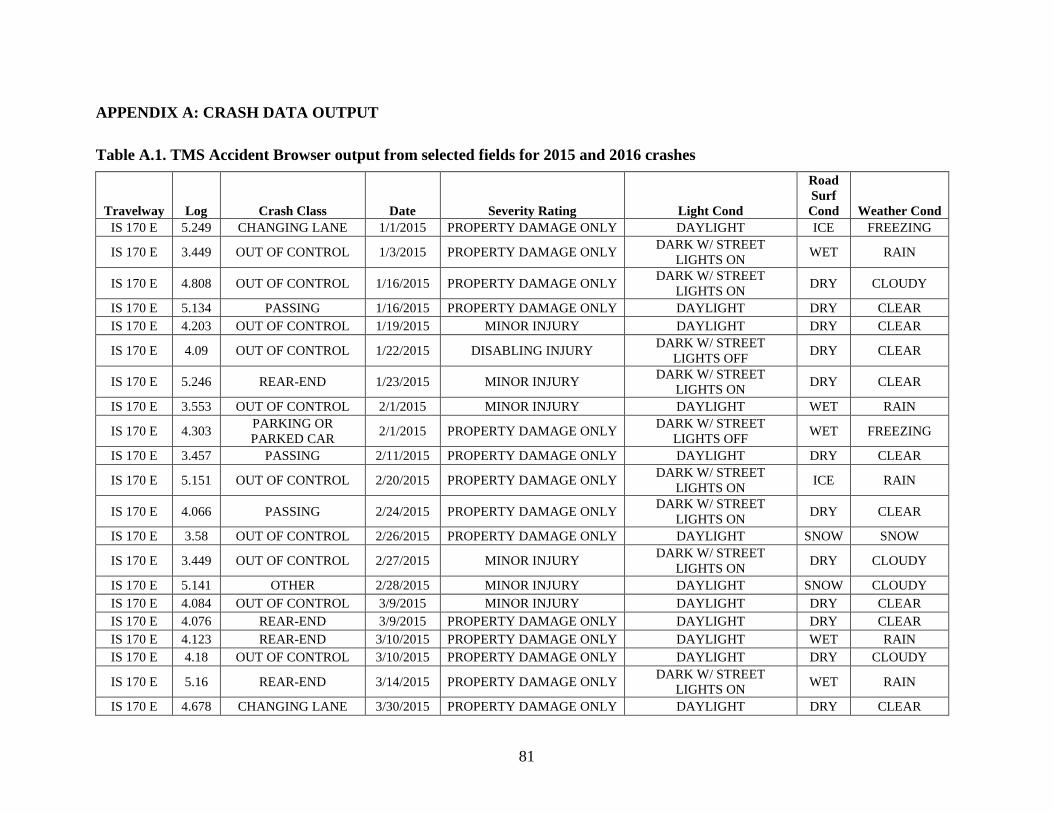
81
APPENDIX A: CRASH DATA OUTPUT
Table A.1. TMS Accident Browser output from selected fields for 2015 and 2016 crashes
Travelway Log Crash Class Date Severity Rating Light Cond
Road
Surf
Cond Weather Cond
IS 170 E 5.249 CHANGING LANE 1/1/2015 PROPERTY DAMAGE ONLY DAYLIGHT ICE FREEZING
IS 170 E 3.449 OUT OF CONTROL 1/3/2015 PROPERTY DAMAGE ONLY DARK W/ STREET
LIGHTS ON WET RAIN
IS 170 E 4.808 OUT OF CONTROL 1/16/2015 PROPERTY DAMAGE ONLY DARK W/ STREET
LIGHTS ON DRY CLOUDY
IS 170 E 5.134 PASSING 1/16/2015 PROPERTY DAMAGE ONLY DAYLIGHT DRY CLEAR
IS 170 E 4.203 OUT OF CONTROL 1/19/2015 MINOR INJURY DAYLIGHT DRY CLEAR
IS 170 E 4.09 OUT OF CONTROL 1/22/2015 DISABLING INJURY DARK W/ STREET
LIGHTS OFF DRY CLEAR
IS 170 E 5.246 REAR-END 1/23/2015 MINOR INJURY DARK W/ STREET
LIGHTS ON DRY CLEAR
IS 170 E 3.553 OUT OF CONTROL 2/1/2015 MINOR INJURY DAYLIGHT WET RAIN
IS 170 E 4.303 PARKING OR
PARKED CAR 2/1/2015 PROPERTY DAMAGE ONLY
DARK W/ STREET
LIGHTS OFF WET FREEZING
IS 170 E 3.457 PASSING 2/11/2015 PROPERTY DAMAGE ONLY DAYLIGHT DRY CLEAR
IS 170 E 5.151 OUT OF CONTROL 2/20/2015 PROPERTY DAMAGE ONLY DARK W/ STREET
LIGHTS ON ICE RAIN
IS 170 E 4.066 PASSING 2/24/2015 PROPERTY DAMAGE ONLY DARK W/ STREET
LIGHTS ON DRY CLEAR
IS 170 E 3.58 OUT OF CONTROL 2/26/2015 PROPERTY DAMAGE ONLY DAYLIGHT SNOW SNOW
IS 170 E 3.449 OUT OF CONTROL 2/27/2015 MINOR INJURY DARK W/ STREET
LIGHTS ON DRY CLOUDY
IS 170 E 5.141 OTHER 2/28/2015 MINOR INJURY DAYLIGHT SNOW CLOUDY
IS 170 E 4.084 OUT OF CONTROL 3/9/2015 MINOR INJURY DAYLIGHT DRY CLEAR
IS 170 E 4.076 REAR-END 3/9/2015 PROPERTY DAMAGE ONLY DAYLIGHT DRY CLEAR
IS 170 E 4.123 REAR-END 3/10/2015 PROPERTY DAMAGE ONLY DAYLIGHT WET RAIN
IS 170 E 4.18 OUT OF CONTROL 3/10/2015 PROPERTY DAMAGE ONLY DAYLIGHT DRY CLOUDY
IS 170 E 5.16 REAR-END 3/14/2015 PROPERTY DAMAGE ONLY DARK W/ STREET
LIGHTS ON WET RAIN
IS 170 E 4.678 CHANGING LANE 3/30/2015 PROPERTY DAMAGE ONLY DAYLIGHT DRY CLEAR

82
Travelway Log Crash Class Date Severity Rating Light Cond
Road
Surf
Cond Weather Cond
IS 170 E 5.255 OUT OF CONTROL 4/1/2015 PROPERTY DAMAGE ONLY DAYLIGHT DRY CLEAR
IS 170 E 5.265 OUT OF CONTROL 4/13/2015 PROPERTY DAMAGE ONLY DAYLIGHT WET CLOUDY
IS 170 E 3.439 REAR-END 4/13/2015 PROPERTY DAMAGE ONLY DAYLIGHT WET RAIN
IS 170 E 5.246 REAR-END 4/18/2015 PROPERTY DAMAGE ONLY DAYLIGHT DRY CLEAR
IS 170 E 3.477 OUT OF CONTROL 4/25/2015 PROPERTY DAMAGE ONLY DAYLIGHT WET RAIN
IS 170 E 5.246 REAR-END 4/27/2015 PROPERTY DAMAGE ONLY DAYLIGHT DRY CLEAR
IS 170 E 5.227 REAR-END 4/28/2015 PROPERTY DAMAGE ONLY DAYLIGHT DRY CLEAR
IS 170 E 5.246 REAR-END 5/6/2015 PROPERTY DAMAGE ONLY DAYLIGHT DRY CLEAR
IS 170 E 4.191 REAR-END 5/6/2015 PROPERTY DAMAGE ONLY DAYLIGHT DRY CLEAR
IS 170 E 3.872 REAR-END 5/6/2015 PROPERTY DAMAGE ONLY DAYLIGHT DRY CLEAR
IS 170 E 5.283 PASSING 5/19/2015 PROPERTY DAMAGE ONLY DAYLIGHT DRY CLEAR
IS 170 E 4.746 OUT OF CONTROL 5/21/2015 PROPERTY DAMAGE ONLY DAYLIGHT DRY CLEAR
IS 170 E 4.897 REAR-END 5/28/2015 PROPERTY DAMAGE ONLY DARK W/ STREET
LIGHTS OFF DRY CLEAR
IS 170 E 4.191 REAR-END 6/7/2015 PROPERTY DAMAGE ONLY DARK W/ STREET
LIGHTS ON DRY CLEAR
IS 170 E 4.468 OTHER 6/8/2015 PROPERTY DAMAGE ONLY DAYLIGHT DRY CLEAR
IS 170 E 4.124 OTHER 6/12/2015 PROPERTY DAMAGE ONLY DAYLIGHT DRY CLEAR
IS 170 E 4.05 OUT OF CONTROL 6/13/2015 PROPERTY DAMAGE ONLY DAYLIGHT DRY CLEAR
IS 170 E 4.047 PASSING 6/19/2015 PROPERTY DAMAGE ONLY DAYLIGHT WET RAIN
IS 170 E 3.958 OTHER 6/25/2015 PROPERTY DAMAGE ONLY DAYLIGHT DRY CLEAR
IS 170 E 3.477 REAR-END 7/9/2015 MINOR INJURY DAYLIGHT WET CLEAR
IS 170 E 4.085 PASSING 7/23/2015 PROPERTY DAMAGE ONLY DAYLIGHT DRY CLEAR
IS 170 E 4.099 REAR-END 7/28/2015 MINOR INJURY DAYLIGHT DRY CLOUDY
IS 170 E 4.064 REAR-END 7/30/2015 PROPERTY DAMAGE ONLY DAYLIGHT DRY CLEAR
IS 170 E 3.477 REAR-END 8/11/2015 PROPERTY DAMAGE ONLY DAYLIGHT DRY CLEAR
IS 170 E 3.439 PASSING 8/27/2015 PROPERTY DAMAGE ONLY DAYLIGHT DRY CLEAR
IS 170 E 3.449 PASSING 9/5/2015 DISABLING INJURY DAYLIGHT DRY CLEAR
IS 170 E 4.48 OTHER 9/25/2015 PROPERTY DAMAGE ONLY DAYLIGHT WET CLOUDY
IS 170 E 3.46 REAR-END 9/30/2015 PROPERTY DAMAGE ONLY DARK W/ STREET
LIGHTS ON DRY UNKNOWN
IS 170 E 5.255 REAR-END 10/1/2015 MINOR INJURY DAYLIGHT DRY CLEAR
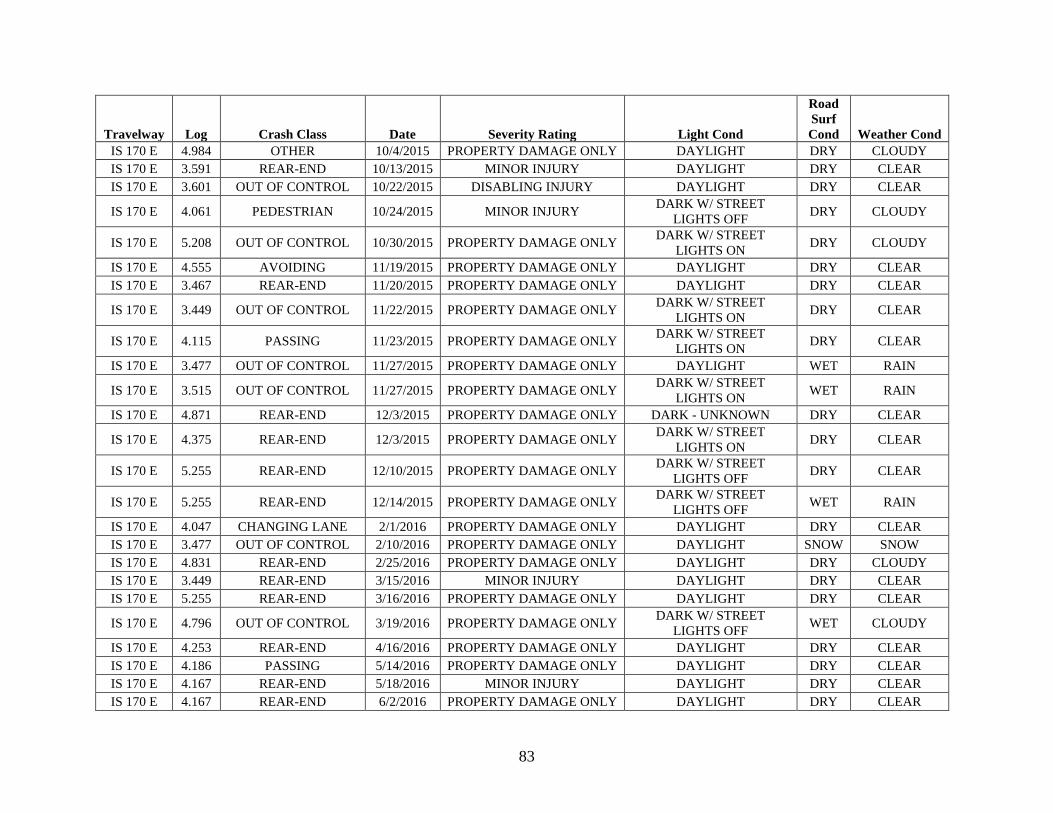
83
Travelway Log Crash Class Date Severity Rating Light Cond
Road
Surf
Cond Weather Cond
IS 170 E 4.984 OTHER 10/4/2015 PROPERTY DAMAGE ONLY DAYLIGHT DRY CLOUDY
IS 170 E 3.591 REAR-END 10/13/2015 MINOR INJURY DAYLIGHT DRY CLEAR
IS 170 E 3.601 OUT OF CONTROL 10/22/2015 DISABLING INJURY DAYLIGHT DRY CLEAR
IS 170 E 4.061 PEDESTRIAN 10/24/2015 MINOR INJURY DARK W/ STREET
LIGHTS OFF DRY CLOUDY
IS 170 E 5.208 OUT OF CONTROL 10/30/2015 PROPERTY DAMAGE ONLY DARK W/ STREET
LIGHTS ON DRY CLOUDY
IS 170 E 4.555 AVOIDING 11/19/2015 PROPERTY DAMAGE ONLY DAYLIGHT DRY CLEAR
IS 170 E 3.467 REAR-END 11/20/2015 PROPERTY DAMAGE ONLY DAYLIGHT DRY CLEAR
IS 170 E 3.449 OUT OF CONTROL 11/22/2015 PROPERTY DAMAGE ONLY DARK W/ STREET
LIGHTS ON DRY CLEAR
IS 170 E 4.115 PASSING 11/23/2015 PROPERTY DAMAGE ONLY DARK W/ STREET
LIGHTS ON DRY CLEAR
IS 170 E 3.477 OUT OF CONTROL 11/27/2015 PROPERTY DAMAGE ONLY DAYLIGHT WET RAIN
IS 170 E 3.515 OUT OF CONTROL 11/27/2015 PROPERTY DAMAGE ONLY DARK W/ STREET
LIGHTS ON WET RAIN
IS 170 E 4.871 REAR-END 12/3/2015 PROPERTY DAMAGE ONLY DARK - UNKNOWN DRY CLEAR
IS 170 E 4.375 REAR-END 12/3/2015 PROPERTY DAMAGE ONLY DARK W/ STREET
LIGHTS ON DRY CLEAR
IS 170 E 5.255 REAR-END 12/10/2015 PROPERTY DAMAGE ONLY DARK W/ STREET
LIGHTS OFF DRY CLEAR
IS 170 E 5.255 REAR-END 12/14/2015 PROPERTY DAMAGE ONLY DARK W/ STREET
LIGHTS OFF WET RAIN
IS 170 E 4.047 CHANGING LANE 2/1/2016 PROPERTY DAMAGE ONLY DAYLIGHT DRY CLEAR
IS 170 E 3.477 OUT OF CONTROL 2/10/2016 PROPERTY DAMAGE ONLY DAYLIGHT SNOW SNOW
IS 170 E 4.831 REAR-END 2/25/2016 PROPERTY DAMAGE ONLY DAYLIGHT DRY CLOUDY
IS 170 E 3.449 REAR-END 3/15/2016 MINOR INJURY DAYLIGHT DRY CLEAR
IS 170 E 5.255 REAR-END 3/16/2016 PROPERTY DAMAGE ONLY DAYLIGHT DRY CLEAR
IS 170 E 4.796 OUT OF CONTROL 3/19/2016 PROPERTY DAMAGE ONLY DARK W/ STREET
LIGHTS OFF WET CLOUDY
IS 170 E 4.253 REAR-END 4/16/2016 PROPERTY DAMAGE ONLY DAYLIGHT DRY CLEAR
IS 170 E 4.186 PASSING 5/14/2016 PROPERTY DAMAGE ONLY DAYLIGHT DRY CLEAR
IS 170 E 4.167 REAR-END 5/18/2016 MINOR INJURY DAYLIGHT DRY CLEAR
IS 170 E 4.167 REAR-END 6/2/2016 PROPERTY DAMAGE ONLY DAYLIGHT DRY CLEAR

84
Travelway Log Crash Class Date Severity Rating Light Cond
Road
Surf
Cond Weather Cond
IS 170 E 4.086 REAR-END 6/26/2016 PROPERTY DAMAGE ONLY DARK W/ STREET
LIGHTS ON DRY CLEAR
IS 170 E 3.592 PASSING 6/28/2016 PROPERTY DAMAGE ONLY DAYLIGHT DRY CLEAR
IS 170 E 4.08 PASSING 8/5/2016 PROPERTY DAMAGE ONLY DAYLIGHT DRY CLEAR
IS 170 E 4.088 REAR-END 8/12/2016 PROPERTY DAMAGE ONLY DARK W/ STREET
LIGHTS OFF WET RAIN
IS 170 E 5.255 REAR-END 8/30/2016 PROPERTY DAMAGE ONLY DAYLIGHT DRY CLOUDY
IS 170 E 4.092 PASSING 9/2/2016 PROPERTY DAMAGE ONLY DAYLIGHT UNKN UNKNOWN
IS 170 E 4.594 PASSING 9/10/2016 PROPERTY DAMAGE ONLY DAYLIGHT DRY CLOUDY
IS 170 E 5.024 PASSING 9/28/2016 PROPERTY DAMAGE ONLY DARK W/ STREET
LIGHTS OFF DRY CLOUDY
IS 170 E 4.108 REAR-END 10/18/2016 PROPERTY DAMAGE ONLY DAYLIGHT DRY CLOUDY
IS 170 E 5.153 DEER 11/9/2016 PROPERTY DAMAGE ONLY DAYLIGHT DRY CLEAR
IS 170 E 4.508 PASSING 11/27/2016 PROPERTY DAMAGE ONLY DAYLIGHT DRY CLOUDY
IS 170 E 4.985 REAR-END 11/28/2016 MINOR INJURY DARK W/ STREET
LIGHTS OFF WET RAIN
IS 170 E 4.985 REAR-END 11/28/2016 PROPERTY DAMAGE ONLY DARK W/ STREET
LIGHTS ON WET RAIN
IS 170 E 4.015 PASSING 12/1/2016 PROPERTY DAMAGE ONLY DAYLIGHT DRY CLEAR
IS 170 E 4.614 PASSING 12/8/2016 PROPERTY DAMAGE ONLY DAYLIGHT DRY CLEAR
IS 170 E 3.695 PASSING 12/19/2016 PROPERTY DAMAGE ONLY DAYLIGHT DRY CLEAR
IS 170 E 3.558 REAR-END 12/21/2016 MINOR INJURY DAYLIGHT DRY CLEAR
IS 170 E 3.862 PASSING 12/23/2016 PROPERTY DAMAGE ONLY DAYLIGHT DRY CLOUDY
IS 170 E 3.583 OUT OF CONTROL 12/27/2016 MINOR INJURY DARK W/ STREET
LIGHTS ON DRY CLEAR
IS 170 W 6.989 OUT OF CONTROL 1/4/2015 MINOR INJURY DAYLIGHT WET CLOUDY
IS 170 W 7.623 REAR-END 1/15/2015 PROPERTY DAMAGE ONLY DAYLIGHT DRY CLEAR
IS 170 W 7.511 REAR-END 1/20/2015 PROPERTY DAMAGE ONLY DARK W/ STREET
LIGHTS ON DRY CLEAR
IS 170 W 6.396 REAR-END 1/27/2015 PROPERTY DAMAGE ONLY DAYLIGHT DRY CLEAR
IS 170 W 5.865 REAR-END 1/31/2015 PROPERTY DAMAGE ONLY DAYLIGHT DRY CLEAR
IS 170 W 7.621 REAR-END 2/4/2015 PROPERTY DAMAGE ONLY DARK W/ STREET
LIGHTS ON SNOW FREEZING
IS 170 W 6.979 OUT OF CONTROL 2/4/2015 PROPERTY DAMAGE ONLY DARK - UNKNOWN SNOW SNOW
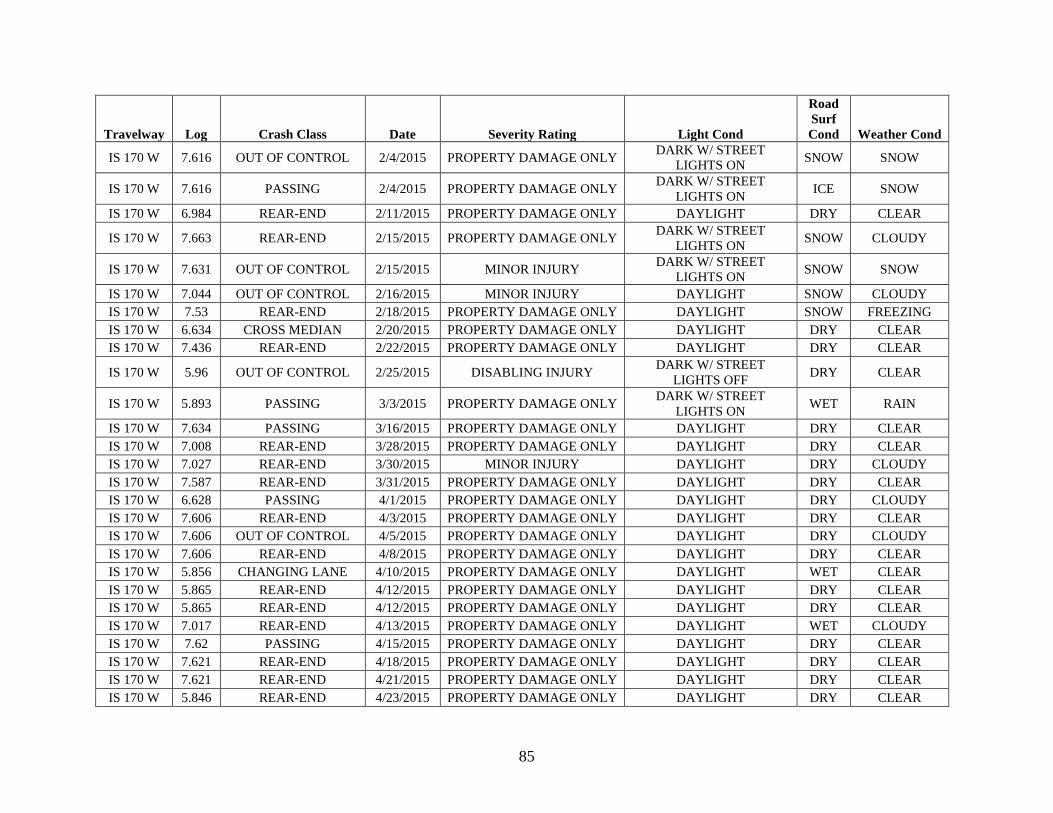
85
Travelway Log Crash Class Date Severity Rating Light Cond
Road
Surf
Cond Weather Cond
IS 170 W 7.616 OUT OF CONTROL 2/4/2015 PROPERTY DAMAGE ONLY DARK W/ STREET
LIGHTS ON SNOW SNOW
IS 170 W 7.616 PASSING 2/4/2015 PROPERTY DAMAGE ONLY DARK W/ STREET
LIGHTS ON ICE SNOW
IS 170 W 6.984 REAR-END 2/11/2015 PROPERTY DAMAGE ONLY DAYLIGHT DRY CLEAR
IS 170 W 7.663 REAR-END 2/15/2015 PROPERTY DAMAGE ONLY DARK W/ STREET
LIGHTS ON SNOW CLOUDY
IS 170 W 7.631 OUT OF CONTROL 2/15/2015 MINOR INJURY DARK W/ STREET
LIGHTS ON SNOW SNOW
IS 170 W 7.044 OUT OF CONTROL 2/16/2015 MINOR INJURY DAYLIGHT SNOW CLOUDY
IS 170 W 7.53 REAR-END 2/18/2015 PROPERTY DAMAGE ONLY DAYLIGHT SNOW FREEZING
IS 170 W 6.634 CROSS MEDIAN 2/20/2015 PROPERTY DAMAGE ONLY DAYLIGHT DRY CLEAR
IS 170 W 7.436 REAR-END 2/22/2015 PROPERTY DAMAGE ONLY DAYLIGHT DRY CLEAR
IS 170 W 5.96 OUT OF CONTROL 2/25/2015 DISABLING INJURY DARK W/ STREET
LIGHTS OFF DRY CLEAR
IS 170 W 5.893 PASSING 3/3/2015 PROPERTY DAMAGE ONLY DARK W/ STREET
LIGHTS ON WET RAIN
IS 170 W 7.634 PASSING 3/16/2015 PROPERTY DAMAGE ONLY DAYLIGHT DRY CLEAR
IS 170 W 7.008 REAR-END 3/28/2015 PROPERTY DAMAGE ONLY DAYLIGHT DRY CLEAR
IS 170 W 7.027 REAR-END 3/30/2015 MINOR INJURY DAYLIGHT DRY CLOUDY
IS 170 W 7.587 REAR-END 3/31/2015 PROPERTY DAMAGE ONLY DAYLIGHT DRY CLEAR
IS 170 W 6.628 PASSING 4/1/2015 PROPERTY DAMAGE ONLY DAYLIGHT DRY CLOUDY
IS 170 W 7.606 REAR-END 4/3/2015 PROPERTY DAMAGE ONLY DAYLIGHT DRY CLEAR
IS 170 W 7.606 OUT OF CONTROL 4/5/2015 PROPERTY DAMAGE ONLY DAYLIGHT DRY CLOUDY
IS 170 W 7.606 REAR-END 4/8/2015 PROPERTY DAMAGE ONLY DAYLIGHT DRY CLEAR
IS 170 W 5.856 CHANGING LANE 4/10/2015 PROPERTY DAMAGE ONLY DAYLIGHT WET CLEAR
IS 170 W 5.865 REAR-END 4/12/2015 PROPERTY DAMAGE ONLY DAYLIGHT DRY CLEAR
IS 170 W 5.865 REAR-END 4/12/2015 PROPERTY DAMAGE ONLY DAYLIGHT DRY CLEAR
IS 170 W 7.017 REAR-END 4/13/2015 PROPERTY DAMAGE ONLY DAYLIGHT WET CLOUDY
IS 170 W 7.62 PASSING 4/15/2015 PROPERTY DAMAGE ONLY DAYLIGHT DRY CLEAR
IS 170 W 7.621 REAR-END 4/18/2015 PROPERTY DAMAGE ONLY DAYLIGHT DRY CLEAR
IS 170 W 7.621 REAR-END 4/21/2015 PROPERTY DAMAGE ONLY DAYLIGHT DRY CLEAR
IS 170 W 5.846 REAR-END 4/23/2015 PROPERTY DAMAGE ONLY DAYLIGHT DRY CLEAR
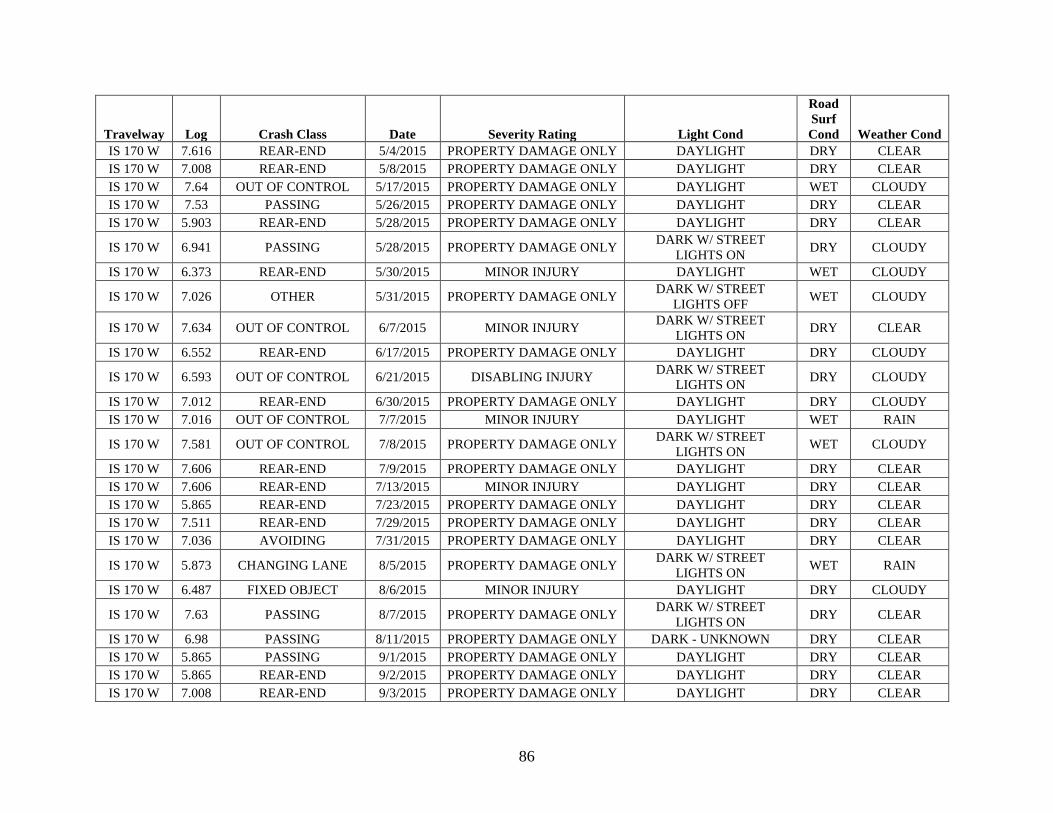
86
Travelway Log Crash Class Date Severity Rating Light Cond
Road
Surf
Cond Weather Cond
IS 170 W 7.616 REAR-END 5/4/2015 PROPERTY DAMAGE ONLY DAYLIGHT DRY CLEAR
IS 170 W 7.008 REAR-END 5/8/2015 PROPERTY DAMAGE ONLY DAYLIGHT DRY CLEAR
IS 170 W 7.64 OUT OF CONTROL 5/17/2015 PROPERTY DAMAGE ONLY DAYLIGHT WET CLOUDY
IS 170 W 7.53 PASSING 5/26/2015 PROPERTY DAMAGE ONLY DAYLIGHT DRY CLEAR
IS 170 W 5.903 REAR-END 5/28/2015 PROPERTY DAMAGE ONLY DAYLIGHT DRY CLEAR
IS 170 W 6.941 PASSING 5/28/2015 PROPERTY DAMAGE ONLY DARK W/ STREET
LIGHTS ON DRY CLOUDY
IS 170 W 6.373 REAR-END 5/30/2015 MINOR INJURY DAYLIGHT WET CLOUDY
IS 170 W 7.026 OTHER 5/31/2015 PROPERTY DAMAGE ONLY DARK W/ STREET
LIGHTS OFF WET CLOUDY
IS 170 W 7.634 OUT OF CONTROL 6/7/2015 MINOR INJURY DARK W/ STREET
LIGHTS ON DRY CLEAR
IS 170 W 6.552 REAR-END 6/17/2015 PROPERTY DAMAGE ONLY DAYLIGHT DRY CLOUDY
IS 170 W 6.593 OUT OF CONTROL 6/21/2015 DISABLING INJURY DARK W/ STREET
LIGHTS ON DRY CLOUDY
IS 170 W 7.012 REAR-END 6/30/2015 PROPERTY DAMAGE ONLY DAYLIGHT DRY CLOUDY
IS 170 W 7.016 OUT OF CONTROL 7/7/2015 MINOR INJURY DAYLIGHT WET RAIN
IS 170 W 7.581 OUT OF CONTROL 7/8/2015 PROPERTY DAMAGE ONLY DARK W/ STREET
LIGHTS ON WET CLOUDY
IS 170 W 7.606 REAR-END 7/9/2015 PROPERTY DAMAGE ONLY DAYLIGHT DRY CLEAR
IS 170 W 7.606 REAR-END 7/13/2015 MINOR INJURY DAYLIGHT DRY CLEAR
IS 170 W 5.865 REAR-END 7/23/2015 PROPERTY DAMAGE ONLY DAYLIGHT DRY CLEAR
IS 170 W 7.511 REAR-END 7/29/2015 PROPERTY DAMAGE ONLY DAYLIGHT DRY CLEAR
IS 170 W 7.036 AVOIDING 7/31/2015 PROPERTY DAMAGE ONLY DAYLIGHT DRY CLEAR
IS 170 W 5.873 CHANGING LANE 8/5/2015 PROPERTY DAMAGE ONLY DARK W/ STREET
LIGHTS ON WET RAIN
IS 170 W 6.487 FIXED OBJECT 8/6/2015 MINOR INJURY DAYLIGHT DRY CLOUDY
IS 170 W 7.63 PASSING 8/7/2015 PROPERTY DAMAGE ONLY DARK W/ STREET
LIGHTS ON DRY CLEAR
IS 170 W 6.98 PASSING 8/11/2015 PROPERTY DAMAGE ONLY DARK - UNKNOWN DRY CLEAR
IS 170 W 5.865 PASSING 9/1/2015 PROPERTY DAMAGE ONLY DAYLIGHT DRY CLEAR
IS 170 W 5.865 REAR-END 9/2/2015 PROPERTY DAMAGE ONLY DAYLIGHT DRY CLEAR
IS 170 W 7.008 REAR-END 9/3/2015 PROPERTY DAMAGE ONLY DAYLIGHT DRY CLEAR

87
Travelway Log Crash Class Date Severity Rating Light Cond
Road
Surf
Cond Weather Cond
IS 170 W 5.865 REAR-END 9/9/2015 PROPERTY DAMAGE ONLY DAYLIGHT DRY CLOUDY
IS 170 W 7.452 REAR-END 9/11/2015 MINOR INJURY DAYLIGHT DRY CLEAR
IS 170 W 5.968 OUT OF CONTROL 9/14/2015 MINOR INJURY DAYLIGHT DRY CLEAR
IS 170 W 5.865 REAR-END 9/15/2015 PROPERTY DAMAGE ONLY DAYLIGHT DRY CLEAR
IS 170 W 6.657 PASSING 9/17/2015 PROPERTY DAMAGE ONLY DAYLIGHT DRY CLEAR
IS 170 W 7.628 REAR-END 9/18/2015 MINOR INJURY DAYLIGHT DRY CLEAR
IS 170 W 6.513 PASSING 9/19/2015 PROPERTY DAMAGE ONLY DAYLIGHT DRY CLEAR
IS 170 W 7.606 PASSING 9/22/2015 PROPERTY DAMAGE ONLY DAYLIGHT DRY CLEAR
IS 170 W 5.865 PASSING 9/24/2015 PROPERTY DAMAGE ONLY DAYLIGHT DRY CLEAR
IS 170 W 7.644 REAR-END 9/29/2015 PROPERTY DAMAGE ONLY DAYLIGHT WET CLOUDY
IS 170 W 5.835 REAR-END 9/30/2015 PROPERTY DAMAGE ONLY DAYLIGHT DRY CLEAR
IS 170 W 7.027 OUT OF CONTROL 10/6/2015 PROPERTY DAMAGE ONLY DARK W/ STREET
LIGHTS ON DRY CLOUDY
IS 170 W 5.903 PASSING 10/6/2015 PROPERTY DAMAGE ONLY DAYLIGHT DRY CLEAR
IS 170 W 6.547 PASSING 10/8/2015 PROPERTY DAMAGE ONLY DAYLIGHT DRY CLEAR
IS 170 W 6.723 PASSING 10/8/2015 PROPERTY DAMAGE ONLY DARK W/ STREET
LIGHTS ON DRY CLEAR
IS 170 W 7.411 REAR-END 10/13/2015 PROPERTY DAMAGE ONLY DAYLIGHT DRY CLEAR
IS 170 W 7.396 PASSING 10/18/2015 MINOR INJURY DARK W/ STREET
LIGHTS OFF DRY CLEAR
IS 170 W 5.865 REAR-END 10/24/2015 PROPERTY DAMAGE ONLY DAYLIGHT DRY CLOUDY
IS 170 W 7.031 OTHER 11/2/2015 PROPERTY DAMAGE ONLY DAYLIGHT DRY CLEAR
IS 170 W 5.865 REAR-END 11/3/2015 PROPERTY DAMAGE ONLY DAYLIGHT DRY CLEAR
IS 170 W 5.865 REAR-END 11/5/2015 MINOR INJURY DAYLIGHT DRY CLEAR
IS 170 W 5.865 RIGHT TURN RIGHT
ANGLE COLLISION 11/6/2015 MINOR INJURY DAYLIGHT DRY CLEAR
IS 170 W 7.125 PASSING 11/10/2015 PROPERTY DAMAGE ONLY DARK W/ STREET
LIGHTS ON DRY CLEAR
IS 170 W 6.998 PASSING 11/11/2015 MINOR INJURY DARK W/ STREET
LIGHTS ON DRY CLOUDY
IS 170 W 7.208 PASSING 11/13/2015 PROPERTY DAMAGE ONLY DAYLIGHT DRY CLEAR
IS 170 W 7.431 REAR-END 11/17/2015 MINOR INJURY DARK W/ STREET
LIGHTS ON WET RAIN
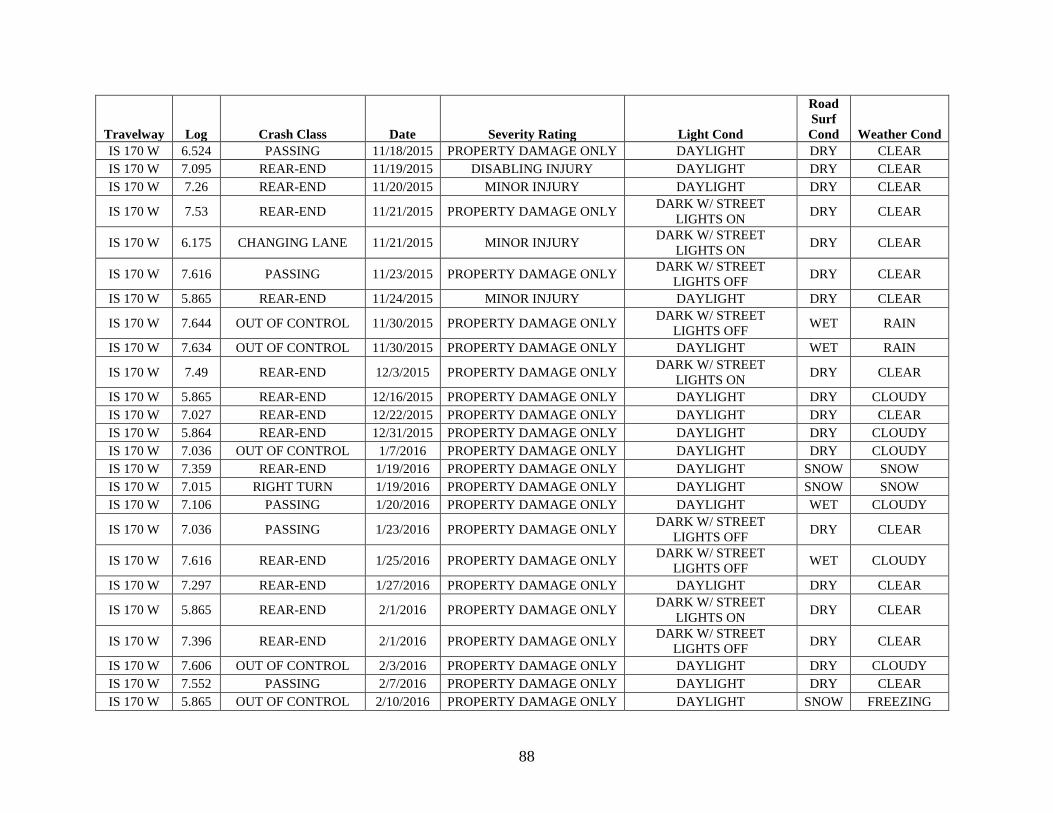
88
Travelway Log Crash Class Date Severity Rating Light Cond
Road
Surf
Cond Weather Cond
IS 170 W 6.524 PASSING 11/18/2015 PROPERTY DAMAGE ONLY DAYLIGHT DRY CLEAR
IS 170 W 7.095 REAR-END 11/19/2015 DISABLING INJURY DAYLIGHT DRY CLEAR
IS 170 W 7.26 REAR-END 11/20/2015 MINOR INJURY DAYLIGHT DRY CLEAR
IS 170 W 7.53 REAR-END 11/21/2015 PROPERTY DAMAGE ONLY DARK W/ STREET
LIGHTS ON DRY CLEAR
IS 170 W 6.175 CHANGING LANE 11/21/2015 MINOR INJURY DARK W/ STREET
LIGHTS ON DRY CLEAR
IS 170 W 7.616 PASSING 11/23/2015 PROPERTY DAMAGE ONLY DARK W/ STREET
LIGHTS OFF DRY CLEAR
IS 170 W 5.865 REAR-END 11/24/2015 MINOR INJURY DAYLIGHT DRY CLEAR
IS 170 W 7.644 OUT OF CONTROL 11/30/2015 PROPERTY DAMAGE ONLY DARK W/ STREET
LIGHTS OFF WET RAIN
IS 170 W 7.634 OUT OF CONTROL 11/30/2015 PROPERTY DAMAGE ONLY DAYLIGHT WET RAIN
IS 170 W 7.49 REAR-END 12/3/2015 PROPERTY DAMAGE ONLY DARK W/ STREET
LIGHTS ON DRY CLEAR
IS 170 W 5.865 REAR-END 12/16/2015 PROPERTY DAMAGE ONLY DAYLIGHT DRY CLOUDY
IS 170 W 7.027 REAR-END 12/22/2015 PROPERTY DAMAGE ONLY DAYLIGHT DRY CLEAR
IS 170 W 5.864 REAR-END 12/31/2015 PROPERTY DAMAGE ONLY DAYLIGHT DRY CLOUDY
IS 170 W 7.036 OUT OF CONTROL 1/7/2016 PROPERTY DAMAGE ONLY DAYLIGHT DRY CLOUDY
IS 170 W 7.359 REAR-END 1/19/2016 PROPERTY DAMAGE ONLY DAYLIGHT SNOW SNOW
IS 170 W 7.015 RIGHT TURN 1/19/2016 PROPERTY DAMAGE ONLY DAYLIGHT SNOW SNOW
IS 170 W 7.106 PASSING 1/20/2016 PROPERTY DAMAGE ONLY DAYLIGHT WET CLOUDY
IS 170 W 7.036 PASSING 1/23/2016 PROPERTY DAMAGE ONLY DARK W/ STREET
LIGHTS OFF DRY CLEAR
IS 170 W 7.616 REAR-END 1/25/2016 PROPERTY DAMAGE ONLY DARK W/ STREET
LIGHTS OFF WET CLOUDY
IS 170 W 7.297 REAR-END 1/27/2016 PROPERTY DAMAGE ONLY DAYLIGHT DRY CLEAR
IS 170 W 5.865 REAR-END 2/1/2016 PROPERTY DAMAGE ONLY DARK W/ STREET
LIGHTS ON DRY CLEAR
IS 170 W 7.396 REAR-END 2/1/2016 PROPERTY DAMAGE ONLY DARK W/ STREET
LIGHTS OFF DRY CLEAR
IS 170 W 7.606 OUT OF CONTROL 2/3/2016 PROPERTY DAMAGE ONLY DAYLIGHT DRY CLOUDY
IS 170 W 7.552 PASSING 2/7/2016 PROPERTY DAMAGE ONLY DAYLIGHT DRY CLEAR
IS 170 W 5.865 OUT OF CONTROL 2/10/2016 PROPERTY DAMAGE ONLY DAYLIGHT SNOW FREEZING
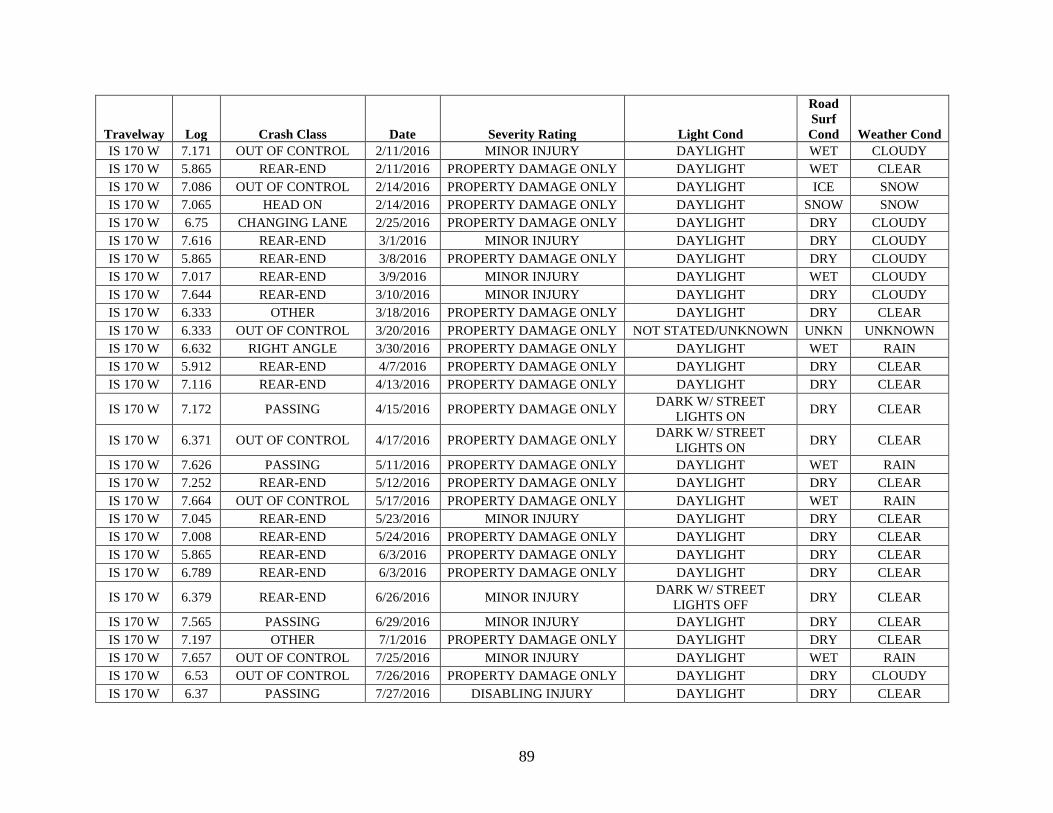
89
Travelway Log Crash Class Date Severity Rating Light Cond
Road
Surf
Cond Weather Cond
IS 170 W 7.171 OUT OF CONTROL 2/11/2016 MINOR INJURY DAYLIGHT WET CLOUDY
IS 170 W 5.865 REAR-END 2/11/2016 PROPERTY DAMAGE ONLY DAYLIGHT WET CLEAR
IS 170 W 7.086 OUT OF CONTROL 2/14/2016 PROPERTY DAMAGE ONLY DAYLIGHT ICE SNOW
IS 170 W 7.065 HEAD ON 2/14/2016 PROPERTY DAMAGE ONLY DAYLIGHT SNOW SNOW
IS 170 W 6.75 CHANGING LANE 2/25/2016 PROPERTY DAMAGE ONLY DAYLIGHT DRY CLOUDY
IS 170 W 7.616 REAR-END 3/1/2016 MINOR INJURY DAYLIGHT DRY CLOUDY
IS 170 W 5.865 REAR-END 3/8/2016 PROPERTY DAMAGE ONLY DAYLIGHT DRY CLOUDY
IS 170 W 7.017 REAR-END 3/9/2016 MINOR INJURY DAYLIGHT WET CLOUDY
IS 170 W 7.644 REAR-END 3/10/2016 MINOR INJURY DAYLIGHT DRY CLOUDY
IS 170 W 6.333 OTHER 3/18/2016 PROPERTY DAMAGE ONLY DAYLIGHT DRY CLEAR
IS 170 W 6.333 OUT OF CONTROL 3/20/2016 PROPERTY DAMAGE ONLY NOT STATED/UNKNOWN UNKN UNKNOWN
IS 170 W 6.632 RIGHT ANGLE 3/30/2016 PROPERTY DAMAGE ONLY DAYLIGHT WET RAIN
IS 170 W 5.912 REAR-END 4/7/2016 PROPERTY DAMAGE ONLY DAYLIGHT DRY CLEAR
IS 170 W 7.116 REAR-END 4/13/2016 PROPERTY DAMAGE ONLY DAYLIGHT DRY CLEAR
IS 170 W 7.172 PASSING 4/15/2016 PROPERTY DAMAGE ONLY DARK W/ STREET
LIGHTS ON DRY CLEAR
IS 170 W 6.371 OUT OF CONTROL 4/17/2016 PROPERTY DAMAGE ONLY DARK W/ STREET
LIGHTS ON DRY CLEAR
IS 170 W 7.626 PASSING 5/11/2016 PROPERTY DAMAGE ONLY DAYLIGHT WET RAIN
IS 170 W 7.252 REAR-END 5/12/2016 PROPERTY DAMAGE ONLY DAYLIGHT DRY CLEAR
IS 170 W 7.664 OUT OF CONTROL 5/17/2016 PROPERTY DAMAGE ONLY DAYLIGHT WET RAIN
IS 170 W 7.045 REAR-END 5/23/2016 MINOR INJURY DAYLIGHT DRY CLEAR
IS 170 W 7.008 REAR-END 5/24/2016 PROPERTY DAMAGE ONLY DAYLIGHT DRY CLEAR
IS 170 W 5.865 REAR-END 6/3/2016 PROPERTY DAMAGE ONLY DAYLIGHT DRY CLEAR
IS 170 W 6.789 REAR-END 6/3/2016 PROPERTY DAMAGE ONLY DAYLIGHT DRY CLEAR
IS 170 W 6.379 REAR-END 6/26/2016 MINOR INJURY DARK W/ STREET
LIGHTS OFF DRY CLEAR
IS 170 W 7.565 PASSING 6/29/2016 MINOR INJURY DAYLIGHT DRY CLEAR
IS 170 W 7.197 OTHER 7/1/2016 PROPERTY DAMAGE ONLY DAYLIGHT DRY CLEAR
IS 170 W 7.657 OUT OF CONTROL 7/25/2016 MINOR INJURY DAYLIGHT WET RAIN
IS 170 W 6.53 OUT OF CONTROL 7/26/2016 PROPERTY DAMAGE ONLY DAYLIGHT DRY CLOUDY
IS 170 W 6.37 PASSING 7/27/2016 DISABLING INJURY DAYLIGHT DRY CLEAR
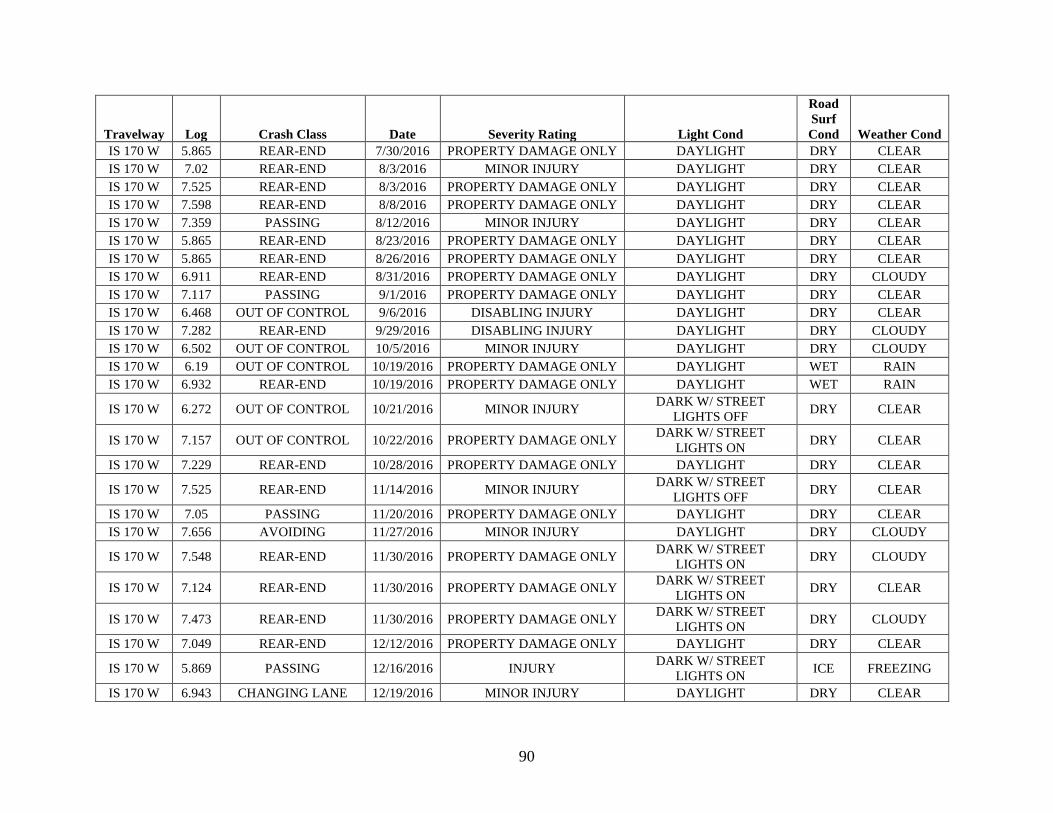
90
Travelway Log Crash Class Date Severity Rating Light Cond
Road
Surf
Cond Weather Cond
IS 170 W 5.865 REAR-END 7/30/2016 PROPERTY DAMAGE ONLY DAYLIGHT DRY CLEAR
IS 170 W 7.02 REAR-END 8/3/2016 MINOR INJURY DAYLIGHT DRY CLEAR
IS 170 W 7.525 REAR-END 8/3/2016 PROPERTY DAMAGE ONLY DAYLIGHT DRY CLEAR
IS 170 W 7.598 REAR-END 8/8/2016 PROPERTY DAMAGE ONLY DAYLIGHT DRY CLEAR
IS 170 W 7.359 PASSING 8/12/2016 MINOR INJURY DAYLIGHT DRY CLEAR
IS 170 W 5.865 REAR-END 8/23/2016 PROPERTY DAMAGE ONLY DAYLIGHT DRY CLEAR
IS 170 W 5.865 REAR-END 8/26/2016 PROPERTY DAMAGE ONLY DAYLIGHT DRY CLEAR
IS 170 W 6.911 REAR-END 8/31/2016 PROPERTY DAMAGE ONLY DAYLIGHT DRY CLOUDY
IS 170 W 7.117 PASSING 9/1/2016 PROPERTY DAMAGE ONLY DAYLIGHT DRY CLEAR
IS 170 W 6.468 OUT OF CONTROL 9/6/2016 DISABLING INJURY DAYLIGHT DRY CLEAR
IS 170 W 7.282 REAR-END 9/29/2016 DISABLING INJURY DAYLIGHT DRY CLOUDY
IS 170 W 6.502 OUT OF CONTROL 10/5/2016 MINOR INJURY DAYLIGHT DRY CLOUDY
IS 170 W 6.19 OUT OF CONTROL 10/19/2016 PROPERTY DAMAGE ONLY DAYLIGHT WET RAIN
IS 170 W 6.932 REAR-END 10/19/2016 PROPERTY DAMAGE ONLY DAYLIGHT WET RAIN
IS 170 W 6.272 OUT OF CONTROL 10/21/2016 MINOR INJURY DARK W/ STREET
LIGHTS OFF DRY CLEAR
IS 170 W 7.157 OUT OF CONTROL 10/22/2016 PROPERTY DAMAGE ONLY DARK W/ STREET
LIGHTS ON DRY CLEAR
IS 170 W 7.229 REAR-END 10/28/2016 PROPERTY DAMAGE ONLY DAYLIGHT DRY CLEAR
IS 170 W 7.525 REAR-END 11/14/2016 MINOR INJURY DARK W/ STREET
LIGHTS OFF DRY CLEAR
IS 170 W 7.05 PASSING 11/20/2016 PROPERTY DAMAGE ONLY DAYLIGHT DRY CLEAR
IS 170 W 7.656 AVOIDING 11/27/2016 MINOR INJURY DAYLIGHT DRY CLOUDY
IS 170 W 7.548 REAR-END 11/30/2016 PROPERTY DAMAGE ONLY DARK W/ STREET
LIGHTS ON DRY CLOUDY
IS 170 W 7.124 REAR-END 11/30/2016 PROPERTY DAMAGE ONLY DARK W/ STREET
LIGHTS ON DRY CLEAR
IS 170 W 7.473 REAR-END 11/30/2016 PROPERTY DAMAGE ONLY DARK W/ STREET
LIGHTS ON DRY CLOUDY
IS 170 W 7.049 REAR-END 12/12/2016 PROPERTY DAMAGE ONLY DAYLIGHT DRY CLEAR
IS 170 W 5.869 PASSING 12/16/2016 INJURY DARK W/ STREET
LIGHTS ON ICE FREEZING
IS 170 W 6.943 CHANGING LANE 12/19/2016 MINOR INJURY DAYLIGHT DRY CLEAR
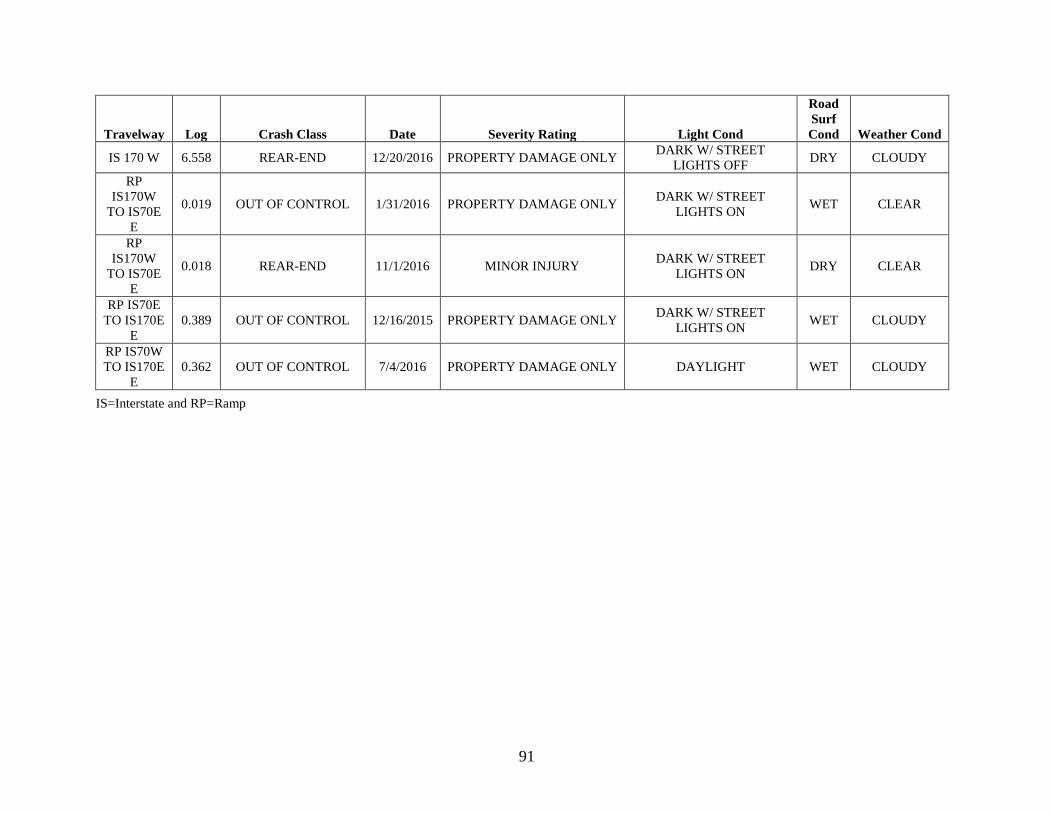
91
Travelway Log Crash Class Date Severity Rating Light Cond
Road
Surf
Cond Weather Cond
IS 170 W 6.558 REAR-END 12/20/2016 PROPERTY DAMAGE ONLY DARK W/ STREET
LIGHTS OFF DRY CLOUDY
RP
IS170W
TO IS70E
E
0.019 OUT OF CONTROL 1/31/2016 PROPERTY DAMAGE ONLY DARK W/ STREET
LIGHTS ON WET CLEAR
RP
IS170W
TO IS70E
E
0.018 REAR-END 11/1/2016 MINOR INJURY DARK W/ STREET
LIGHTS ON DRY CLEAR
RP IS70E
TO IS170E
E
0.389 OUT OF CONTROL 12/16/2015 PROPERTY DAMAGE ONLY DARK W/ STREET
LIGHTS ON WET CLOUDY
RP IS70W
TO IS170E
E
0.362 OUT OF CONTROL 7/4/2016 PROPERTY DAMAGE ONLY DAYLIGHT WET CLOUDY
IS=Interstate and RP=Ramp