evaluation ofarcview-gisas a learning tool at the
TRANSCRIPT
Evaluation of ArcView-GIS as a Learning Tool at the
University of KwaZulu-Natal
By
NHLANGANISO BIYELA
(961086789)
Submitted in partial fulfilment of the requirements for the degree of Masters in Digital
Media, in the Centre for Information Technology in Higher Education at the University
of KwaZulu-Natal.
JUNE 2005
SUPERVISOR: Professor Alan Amory

Declaration
I Nhlanganiso Biyela hereby declare that, this dissertation for the Masters of Digital
Media Degree submitted by me at the ITed, University of KWAZULU-NATAL has not,previously been submitted for a degree or diploma at this or any University, and that it is
my work. All reference materials contained herein have been duly acknowledged.
Date 2.. &:7 I 0 <t / ?-OV re,
11
Signed:
~Nhlanganiso Biyela

Dedication
• To God for giving me wisdom, courage and endurance in all my academic
endeavours
• To the most precious and wonderful memory of my late mother, Miss Rebecca
Thembi Biyela, who passed away at the dawn of the finalisation of this work.
Thank you for believing in me and listening to my every dream. Without your
never-ending love, interest, guidance, motivatidn and support I would not have
come this far. May your memories live on.
111
Acknowledgements
This piece of work owes its existence to the support and assistance offered by dearest
friends and colleagues. I am sincerely grateful to the following:
• Professor Alan Amory at Centre for Information Technology in Higher Education
who supervised this project
• Mr Steven Yates who was a consultant at Centre for Information Technology in
Higher Education supervised me initially and all the study material you availed.
• Mr Thato Foko a PhD a student at Centre for Information Technology in Higher
Education mentored me in challenges which face researchers
• Mr Frank Sokolic lecturer and a technician at Geography and Environmental,Sciences help me by granting me access in GIS LANS for gathering the data.
• All my classmates at Centre for Information Technology in Higher Education, for
the invaluable information which culminated into a successful completion of this
project.
• My late dearest mother Miss Rebecca Thembi Biyela for sacrificing everything in
order to make me a better man.
• My wonderful fiance Philile Nsibande and my wonderful son Luyanda for
motivation, support, patience, understanding and allowing me to grow and
explore, for trusting and believing in me. Benefits are to come I promise.
• To my beloved mother in law Mrs Dons Thenjiwe Masuku for support,
motivation and patience. Your love and patience will defiantly be rewarded.
IV
Abstract
The objective ofthe research project is to investigate the use of ArcView-GIS (a
Geographical Information Systems software package) to promote cognitive development,
at the University of KwaZulu-Natal. To understand the impact of ArcView-GIS as a
learning tool will require an understanding of how it is used, what learning goals are held
by educators and students and the type of assessments used to evaluate student
achievement. It is argued that the use of GIS software promotes development of a wide
range of skills. A research instrument to measure skills related to visualization, language,
mathematics and logics was used to evaluate learners from a number of different groups
which included science undergraduates, humanities undergraduates and GIS students (2
groups: one group took the test after the completion and the other group prior to the GIS
course). In addition GIS experts and students evaluated the user interface of ArcVIew
GIS. Results show that those learners exposed to GIS performed better in all the skills
evaluated than any of the other groups. Also, experts and GIS students found the software
interface satisfactory. The findings suggest that ArcView-GIS can support higher-order
thinking by engaging students in authentic, complex tasks within an appropriate learning
context.
v

TABLE OF CONTENTS
Declaration 11
Dedication 111
Acknowledgements iv
Abstract v
TABLE OF CONTENTS vi
LIST OF FIGURES , viii
CHAPTER 1 - INTRODUCTION 1
1.1 Introduction 1
1.2 Background of study 1
1.3 Statement of the problem 2
1.4 Major research questions 2
1.5 Major research questions 3
CHAPTER 2 - LITERATURE REVIEW 4
2.1 Introduction 4
2.2 Skills in South Africa 4
2.3 Theoretical framework 5
2.3.1 Cognitive Development .' 5
2.3.2 Human Computer Interaction (HCI) 9
2.4 ArcView-GIS literature 19
2.5 Conclusion 27
CHAPTER 3 - RESEARCH METHODOLOGy 28
3.1 Introduction 28
3.2 Methodology 28
3.3 Evaluation 30
3.4 Assessment of students' performance 30
3.5 Assessment of ArcView-GIS 31
3.6 The sample "f 32
3.7 Instruments 33
3.8 Secondary sources 33
VI

3.9 Primary sources 34,3.10.1 Observation 34
3.10.2 Interviews 35
3.10.3 Questionnaires 36
3.10.4 Tests 37
3.11 Conclusion 38
CHAPTER 4 - RESUTLS AND DISCUSSION 39
4.1 Introduction 39
4.2.1 Participants 40
4.2.2 Results 40
4.3.1 Questionnaire 49
4.4.1 Interview ' 54
4.4.2 Validity of analyses 55
4.4.3 Results from interviews 56
4.5.1 Triangulation 58
4.5.2 Observation of the students 58
4.6 Conclusion 59
CHAPTER 5 - CONCLUSIONS, LIMITAnONS AND RECOMMENDAnONS 60
5.1 Introduction 60
5.2 Answers to the research questions 60
5.3 Limitations 64
5.4 Recommendations 65,5.5 Conclusion 66
List of references 67
Appendix 1. Modified Questionnaire for Human Computer Interaction and Cognitive
Development Questionnaire 79
Appendic 2. Modified Evaluation Interview Protocol.. 81
Appendic 3. Skills test 82
vu
Figure 3.1
Figure 4.1
Figure 4.2
Figure 4.3
Figure 4.4
Figure 4.5
Figure 4.6
Figure 4.7
Figure 4.8
Figure 4.9
Figure 4.10
Figure 4.11
Figure 4.12
LIST OF FIGURES
Data collection methods 32
An example of a box plot. 39
Box plot displays of the 2-dimensional visualization skills assessment of
GIS, Human Science and Natural Science students 41
Box plot displays of the 3-dimensional visualization skills assessment of
GIS, Human Science and Natural Science students 42
Box plot displays of the 2-dimensional to 3-d visualization skills assessment
of GIS, Human Science and Natural Science students 43
Box plot displays of the logical and numerical skills assessment of GIS,
Human Science and Natural Science students 44
Box plot displays of the sentence structuring skills assessment of GIS,
Human Science and Natural Science students 45
Box plot displays of the written expression skills assessment of GIS,
Human Science and Natural Science students 46
Box plot displays of the reading comprehension skills assessment ofGIS,
Human Science and Natural Science students 47
The scatter graph shows the coursework mark and skills test scores of
Natural Science, Human Science and GIS students 48
Bar graph showing lecturers Ca) and students Cb) responses related to HCI
questions C. - Strongly agree plus agree; 0 - Neutral; • - Disagree plus
strongly disagree) 49
Bar graph showing lecturers Ca) and students Cb) responses related to
cognitive development questions C. - Strongly agree plus agree; 0 -
Neutral; • - Disagree plus strongly disagree) 52
Cognitive development of GIS students derived by NVivo 57
Vlll
CHAPTER 1- INTRODUCTION
1.1 Introduction
This chapter provides an introduction to and outline of the rest of the dissertation. The
purpose of this dissertation is to investigate whether ArcView-GIS (a Geographical
Information Systems software package) promotes cognitive development in students
studying a GIS course at the University of KwaZulu-Natal. Some of the features of
ArcView-GIS that might promote the learning ofGIS will be discussed and will then be,
evaluated. Tests, as well as interviews, are used to determine whether ArcView-GIS
promotes cognitive development. In particular this investigation examines the
knowledge, skills and attitudes of the participants before and after the use of ArcView
GIS.
1.2 Background of study
As mentioned above, this dissertation investigates whether ArcView-GIS promotes
cognitive development in students studying a GIS course at the University of KwaZulu
Natal.
ArcView-GIS is a desktop Geographic Information System (GIS) from the
Environmental Systems Research Institute (ESRI). A GIS is a database that links
information to location, allowing the user to visualize, explore, query and analyze
geographic data spatially (ESRI homepage 2004).
ArcView-GIS works with views, tables, charts, layouts, and scripts stored in one file
called a project. A project file stores information about the contents and status of each
project component, including storage locations of the data sets used in the project. The
actual data are not stored in the project file. Hence, if any data set is updated, the updates
are also reflected in the ArcView-GIS project. However, this also means that data sets
cannot be moved to another location without updating the project file. A view is an
interactive map that enables display, exploration, queries and analysis of geographic data.
Tables and charts work in a fairly similar manner as a simple spreadsheet in the sense that
1

the tables include data records with several columns, and that charts can be created from
the values in data columns. The strength of the ArcView-GIS tables and charts is the
connection to the geographic data in the view. A layout is the framework for preparing
graphical output, such as maps, charts, and table records, for hardcopy printing or to be
saved on files for import into word processors or publishing applications. A script is the
component of an ArcView-GIS project that contains AVENUE code. AVENUE is an
object-oriented programming language, from which ArcView-GIS is developed (ESRI
homepage 2004).
The project files also include information on the display status, screen location, size etc.
ofthe various component windows. The ArcView-GIS user's interface also includes
menu, button and tool bars at the top ofthe ArcView-GIS window. These vary for each,ArcView-GIS component, and the menu, button and tool bars shown in the ArcView-GIS
window are always the ones for the active window. The ArcView-GIS window also
includes a status bar at the bottom of the window. The ArcView-GIS interface is stored in
the file 'default.apr' in the 'etc' sub-directory below the ArcView-GIS installation folder
(ESRI homepage 2004).
1.3 Statement of the problem
This dissertation uses tests, questionnaires, observations, as well as interviews to
determine whether ArcView-GIS promotes cognitive development, with the view of
giving recommendations to improve the situation and environment.,
1.4 Major research questions
• Does ArcView-GIS provide a user-friendly interface for learners to engage with
GIS knowledge?
• Does ArcView-GIS meet its aim in terms of its functions?
• Did students change in terms of knowledge, skills and attitudes after finishing the
GIS course?
2
1.5 Major research questions
Chapter 1 briefly introduces the research questions and includes a description of
ArcView-GIS. The next chapter discuses the need for skills in the South Africa market,
investigates cognitive development, human-computer interaction (HCI) theories,
relationship of technology with cognitive development,theories, and also gives a general
review of literature of ArcView-GIS. Chapter 3 presents the research methodology from
the view point of the eclectic mixed-methods pragmatic paradigm. Chapter 4 presents the
analysis of the data collected using the mix methodological approach. This dissertation
closes with a conclusion in Chapter 5 along with suggestions for improvement and
presents the limitations in the study.
3
CHAPTER 2 - LITERATURE REVIEW
2.1 Introduction
This chapter deals with theories of cognitive development and human-computer
interaction (HCI) that form the cornerstone of this research on the evaluation of
ArcView-GIS by users (experts and students). It also looks at the debates and arguments
that have taken place about the software that support cognitive development and
constructivist learning principles.
The first part of the chapter will briefly discuss the need for skills in South Africa, and
then discuss some of the theories of cognitive development and HCI theory. This chapter
will also discuss the relationship of technology with cognitive development theories,
argue if ArcView-GIS is appropriate for learning GIS and discuss user interfaces and
usability issues related to the software. The discussion of user interface and usability•
issues will help in the evaluation of the effectiveness of the software, as it will help to
determine whether there is any change in knowledge, skills and attitudes in students.
2.2 Skills in South Africa
In South Africa today there is a great need for the deve~opment of a skilled and
technically sophisticated work force. As South Africa's rating on the world
competitiveness scale drops i.e. there are less skilled people in South Africa compared to
many other countries, so this need becomes greater and more vital. In this study, South
Africa was reported to be right at the bottom of a list of 41 countries in terms of the
number of skilled people per country (Sunday Times, November 24, 1996.).
Knowledge of GIS is one such technical kind of knowledge that is required in South
Africa as is evidenced by the many weekly job advertisements in the National Sunday
Times newspaper. GIS can provide many fundamental thinking skills which underpin
scientific and technical thought. One of the guiding principles of the new education
curriculum in South Africa, which was introduced in 1998, is to develop such scientific
4

skills (Further Education and Training Act, 1998). Thus there is a need more than ever
before to educate effectively in computer software such as ArcView-GIS.
Graduates also need to be technically literate, and to have well-developed critical
thinking and problem-solving skills. The new Education Department curriculum
emphasises these skills over the old-style curriculum's emphasis on memorisation of
content (Further Education and Training Act, 1998). It is claimed that ArcView-GIS
might provide skills to individuals to make better decisions about Geography related
developments (Goodchild, 2000). In this study ArcView-GIS will be evaluated in order to
know whether it does indeed promote spatial and visual perception skills related to
cognition.
2.3 Theoretical framework
2.3.1 Cognitive Development
The study of cognition can be subdivided into problem solving and reasoning (Dix,
1998). In discussing cognitive development, two main theories will be discussed that
branch from constructivism. Constructivism is a theory of pedagogy that is based on the
emphasis of learners who will create and develop ideas from their constructed knowledge
(Piaget, 1970). The two strands of constructivism discussed here are cognitive
constructivism of Jean Piaget and social constructivism of Lev Vygotsky.
In Piaget's cognitive development theory there is a belief that humans cannot be spoon
fed information to learn from but instead knowledge construction depends on: what is
already known, previous experience, organization of these experiences beliefs that the
individual uses to interpret the reality of objects and events encountered, and also be able
to create mental models (schemas which the individual uses to represent the world and
designate action). This adaptation is driven by a biological drive to obtain balance
between schemas and the environment (Piaget, 1970). Piaget (1970) hypothesizes that
humans have schemas that they use to adapt to the environment, those schemas are
quickly replaced with constructed schemas (Piaget, 1970). Piaget (1970) described two
cognitive processes that are essential to the individual to progress from stage to stage,
5
namely assimilation and accommodation. The overall focus of cognitive development is
intelligence (Piaget, 1970). Schemata are intellectual structures. Assimilation involves the
interpretation of events in terms of existing cognitive structures, whereas accommodation
refers to changing the cognitive structures to make sense of the environment and
equilibration is a balance between assimilation and accommodation to form new internal,
mental structures which learners would use to further evaluate the external world in the
future development.
Suchmann (1962) agrees with Piaget's concepts of constructivist learning, active
participation, and the concepts of disequilibrium, believed that learners are internally
motivated to learn. Anything that is puzzling or unknown is bound to place the mind in a
state of disequilibrium, thus causing the learner to seek new knowledge so that the mind
can be in the state of equilibrium again.
Vygotsky (1971) believes that cognitive development takes place through social and
collaborative activity that cannot be taught. Bruner (19J1) supported Vygotsky, in that
cognitive development depends on social interaction. Bruner (1966) argues that
instruction should aid humans in their thinking and humans can perform a task when
given instructions and assistance i.e. cognitive development can take place if individuals
are scaffold. For Vygotsky (1971), "scaffolding" is the process of providing a learner
with a good deal of support during the time they are learning something. This support is
reduced as the learner becomes able to deal with the task independently, resulting in their
taking on increasing responsibility for their own learning.
Bruner (1977) argues that learners should be encouraged to discover things for
themselves. This author stressed the importance of learning, how to learn which the,
author understood as the ability to transfer the knowledge or skills from one situation to
another. "Learning should not only take us somewhere, it should allow us later to go
further more easily" (Bruner, 1977). Bruner (1983) further explains that the act of
learning involves three processes: acquisition of information, transformation adjusting the
6
knowledge to particular tasks and evaluation by checking whether the adjustment of
knowledge is appropriate for the task.
If opportunities to learn new things are presented to learners, they will learn and develop.
According to Donaldson (1978) young learners should be given opportunities to learn
based on their inborn curiosity. Donaldson (1978) uses the term 'imaginative embedding'
to characterise the process in which the learners fit the problem or task in a real world
context and she believes that this process is an important part of making sense of logical
problems.
Feuerstein (1980) believed that cognitive structures may be modified to develop their full
potential (structural cognitive modifiability). Cognitive modifiability (Feuerstein, 1980)
refers to structural changes, or the changes of the state of the organism, brought about by
a deliberate program of intervention that will facilitate the generation of continuous
growth by rendering the organism receptive and sensitive to internal and external sources
of stimulation. Donaldson (1978) also discussed researches which prove that children do
better on cognitive tasks if these tasks appear in a context that makes human sense to the
child. She particularly emphasises the ability of a child to place a task in a socially
meaningful context.
Feuerstein (1980) proposes the concept of "mediators". Mediation is characterised by
certain features. It is related to empowering the learner to acquire knowledge, skills or
strategies, to become more autonomous and to develop as independent thinkers.
Feuerstein (1980) describes mediation as the way in which stimuli emitted by the
environment are transformed by a mediating agent, usually a parent, sibling or other
caregiver. Feuerstein (1980) agrees with other constructivism theorists that the learner is
an active participant in constructing knowledge. Feuerstein (1980) argues that mediation
shapes students the way they perceive the environment.
7

Vygotsky and Piaget have a critical difference in their views of cognitive development.
Vygotsky's main and basic criticism of Piaget is that t¥nking develops from the social
level to the individual, while it is opposite for Piaget.
The main difference between Piaget and Vygotsky lies in the ability to learn, to construct
and there are inborn familiarities. Piaget sees the individual as the source of learning and
that children learn by continuous interaction and experience with their environment, the
egocentric speech is valuable for logical thinking but it can also obscure the meaning.
Instead Vygotsky emphasises that one cannot learn without the verbal interaction and
activity with others.
It has been shown that learning is more effective when it is activity-based rather than
passively received (Brown, 1989). The active "constructing" or "doing" of tasks leads to
discovery. The concept of discovery learning is not new. Discovery learning can be
described as experimentation with some extrinsic intervention -- clues, coaching, a
framework to help learners get to a reasonable conclusion. It has appeared many times in
educational philosophy. Dewey (1938) stated that "there is an intimate and necessary
relation between the processes of actual experience and education". It is also supported
by learning theorists/psychologists such as Piaget, Bruner, and Papert, "In so far as
possible, a method of instruction should have the objective of leading the child to
discover for himself' (Dewey 1938).
Bruner (1961) believes that discovery learning assists ~earners to take responsibility for
their own learning, emphasizes exploring, experimenting, doing research, asking
questions, and helps students remember important facts.
Cognitive development has been labeled cognitive theory because cognitive development
is facilitated by activities or situations that engage learners and require adaptation
(Bruner, 1999). Much has been researched and written by many eminent leaders in the
field of cognition. For example the phenomenon of human learning has been studied for
centuries and it is generally agreed that two main streams exist in learning research,
8
namely learning as behaviour and learning as cognition. Both schools of thought are
relevant and should be viewed on a continuum, where, in any given learning
environment, the appropriate strategy is chosen depending on the expected learning
outcome (Tapscott, 1998).
Tapscott (1998) explains how students construct know~edge from information presented.
A student works on the processes by selecting relevant information, organizing links
which are made between the selected pieces of information and integrating links between
the new information and prior knowledge to evaluate the information. Once this process
has been completed, one can say that knowledge has been created and learning has taken
place.
In order to create knowledge, students need to do something with the information. They
need to interact with the information. On interacting with information, they may notice a
lack of knowledge and that will force them to search for more information to do away
with deficiency. Tapscott (1998) added that information is something which affects and,
transforms the recipient's state of knowledge when perceived.
Human Computer Interaction (HCI) is another concept which contributes to cognitive
development. "HCI is the parts of a computer system (hardware and software) that the
user can see, feel and hear and can use to control the computer" (Preece, 1994). It allows
the exchange of information between the user and the computer.
2.3.2 Human Computer Interaction (HeI)
Cognitive and social constructivism theories have contributed immensely to the
understanding of cognitive development. Human Computer Interaction (HCI) is another
concept which contributes to cognitive development because HCI incorporates metaphors
which are used to allow the user to be better able to predict the outcomes of new
interactions (Murrell, 2001). "Metaphor also allows the designers to work with a model
which will guide the development in a consistency of interactions and representations"
(Murrell, 2001).
9
According to Preece (1994), the empirical study ofHCI is rooted in experimental
cognitive psychology. Cognitive psychology is the study of how people think and learn.
The goal of cognitive psychology is to understand the psychological processes involved
in the acquisition and use of knowledge by people. This includes domains such as
perception, attention, memory, learning, thinking, and the importance of social and
environmental influences on those domains. The importance of this definition is that it
stresses the need for scientific analysis and includes processes. HCI and cognitive
psychology are related in the sense that information about human characteristics is,needed to guide design towards features that are compatible with memory capabilities,
the nature of human learning of facts and skills, the methods of cognitive psychology can
be used to evaluate designs and the user interface features (Preece, 1994).
HCI is concerned with studying and improving the many factors that influence the
effectiveness and efficiency of computer use. It combines techniques from psychology,
computer science, and ergonomics (Preece, 1994).
The purpose of the study of HCI is to enhance the quality of the interaction between
human and machine and to systematically apply knowledge about human purposes,
capabilities, and limitations, and machine capabilities and limitations, so as to extend our
reach, so as to enable us to do things we could not do before (Preece, 1994).
HCI makes the computer technology more usable to people and requires an
understanding of four things: (a) the computer technology, (b) the people who interact
with it, (c) what is meant by 'more usable,' (d) and the work that people are trying to
perform by using the technology (Dix 1998). The aim ofHCI is also to provide a safe,
comfortable, and satisfying experience for the user (Preece, 1994).
HCI has shaped modem computing in the sense that computer interfaces contain elements
such as the mouse, windows, icons and various graphic'al user interfaces. HCI is the
10
study, planning, and design of how people and computers work together so that a person's
needs are satisfied in the most effective way.
The user interface is the part of a computer and its software that people can see, hear,
touch, talk to, or otherwise understand or direct. The user interface has essentially two
components: input and output. Input is how a person communicates their needs or desires
to the computer. Output is how the computer conveys the results of its computations and
requirements to the user (Galitz, 2002). According to Preece (1994) for the computer to
be usable it must comprise the extent, to which it can be used by specified users to
achieve specified goals with effectiveness, efficiency and satisfaction in a specified
context of use, where:
<) Effectiveness measures the accuracy and completeness with which users achieve
specified goals;
<) Efficiency measures the resources expended in relation to the accuracy and
completeness with which users achieve goals;
<) Satisfaction measures the freedom from discomfort, and positive attitudes towards
the use of the software (Preece, 1994).
In order for a computer or software to be effective, "its user interface must not throw a
panel full of buttons, labels, and scrollbars onto the screen. Instead, it must look right and
it must act right" (Preece, 1994).
Through interaction with the user interface, users construct their own mental models of
the system, how it is organized, and how it behaves. If all goes well in the human,computer interface design, the user interface and the models on which it is organized will
seem familiar and understandable to the user because they have been presented clearly
and simply through the user interface and because, ultimately, they are based upon how
the users work and understand their own work (Preece, 1994).
The software should be usable, without help or instruction, by a user who has knowledge
and experience in the application domain but no prior experience with the system,
meaning that the software must support the user without having to read manuals. The
11

software should not interfere with or impede efficient use by a skilled user, who has
substantial experience with the software, but support the expert user's needs and as well
support the beginner (Preece, 1994).
The software should facilitate and support continuous advancement in knowledge, skills
and accommodate progressive change in usage as the l\Ser gains experience with the
system (Preece, 1994).This means that some connection is needed between the simpler
and the more advanced facilities, which the details of the user interface, should actively
aid the user in understanding and using additional features and acquiring new skills.
Instead of leaving users on their own to cope with advanced but arbitrary features that are
difficult to learn, good software helps users to become power users for example, by
furnishing shortcuts that are naturally related to the longer means preferred by beginners.
The software should support the real work that users are trying to accomplish by making
it easier, simpler, faster, or more fun or by making new things possible. The software
should go beyond supporting established ways of working; it must open new possibilities
(Constantine and Lockwood, 1999).
Software should be suited to the real conditions and actual environment of the operational
context within which it will be deployed and used. Software should be easy to learn how
to use, and, once learned, remembering how to use it should be easy as well. In fact there
must be relationship between technology and cognitive development theories. The
software must be designed to support the cognitive development (Constantine and
Lockwood, 1999). Perhaps the area of development most researched in relation to
computer use has been that of cognitive development. The question that has been raised,
"how are these technologies affecting learner's minds?" Are they being used as tools to
enhance and hasten cognitive development, or are they detracting from and inhibiting
intellectual growth in some way? The answers, at best, have been very mixed.,
Cognitive development theories have been used to explain the relationship between
learner's computer use and development, for example, the theory of constructivist
purported by Piaget (1970).
12
2.3.3 Relationship of Technology with Cognitive Development Theories
Constructivism concerns the process of how students create meaning and knowledge in
the world as well as the results of the constructive process. How students construct
knowledge depends upon what they already know, their previous experiences, how they
have organized those experiences into knowledge structures such as schema and mental
models, and the beliefs they use to interpret the objects and events they encounter in the
world. Cognitive tools help learners organize, restructure, and represent what they know.
Constructivists seek to create learning environments wherein learners use cognitive tools
to help themselves construct their own knowledge repr~sentations.
Cognitive constructivist theory inspired scholars like Papert and Bruner. Papert's work in
the area of educational technology resulted in creation of LOGO. Papert (1993)
constructed the LOGO project to assist cognitive development in learners. He used the
theoretical ideas of Piaget (1970) as a basis for the design of software which facilitated
the process of cognitive development. Papert (1993) developed a number of powerful
ideas e.g. turtle graphics, for the design of computer based learning environments. The
ideas were embodied in the design of the language LOGO and the learning interactions it
was used to support. Papert (1993) introduced LOGO to assist learner's cognitive
development. The best known feature of LOGO is Turtle Graphics. The turtle is a small
floor robot which responds to commands written in LOGO. Alternatively, and more
abstractly, the turtle may be represented by the cursor on the computer screen. A program
is a set of instructions the learner gives to the turtle to do a task, such as draw a rectangle
or a triangle. In a subsequent program the learner may combine these procedures to create
more complex shapes, such as the drawing of a house (Boyle 1997).
Papert (1993) was particularly concerned with introducing children to mathematics.
Many mathematical concepts seem too difficult for learners to grasp. The turtle graphics
was a transitional object which allows the learners to make sense of tasks in terms of
everyday familiar experience, but supports them in moving into the world of the abstract.
Within LOGO mistakes are treated not as errors but as opportunities to learn. Making
13
errors a productive part of the learning process is another important theme of cognitive
development (Boyle 1997).
According to Fowler (2001) students possess different kinds of minds and therefore learn,
remember, perform, and understand in different ways. Gardner (1991) argues that we are
all able to know the world through language, logical-mathematical analysis, spatial
representation, musical thinking, the use of the body to solve problems or to make things,
an understanding of other individuals, and an understanding of ourselves. Where
individuals differ is in the strength of these intelligences - the so-called profile of
intelligences -and in the ways in which such intelligences are invoked and combined to
carry out different tasks, solve diverse problems, and progress in various domains
(Gardner, 1991).
Cognitive and behaviourist theories provide the explanatory structure within which to
understand cognitive development. Cognitive learning is demonstrated by knowledge
recall and intellectual skills: comprehending information, organizing ideas, analyzing and
synthesizing data, applying knowledge, choosing among alternatives in problem-solving
and evaluating ideas or actions. Piaget (1971) explained that learning deals with our
mental processes such as thinking, learning, remembering, and feeling. The focuses are
on how people perceive, process, store and retrieve information. The behaviorists focus
on what can be observed and reject the notion of scientifically measuring what goes on
inside a subject's brain; cognitive theorists are most interested in the mental processes and
feel that these processes can be studied empirically. While these processes cannot be
seen, their effects can be observed and measured. Both the work of Piaget and Vygotsky,provide a framework for intervention (Riddle & Dabbagh 1999).
Behaviourists represent one of the key principles of positivism: that knowledge of the
world can only change from observation of objective facts and phenomena. Cognitivists
argue that a person's response to stimuli is individual and depends on their cognitive state
and the mental processes occurring (Dalgarno, 1996). The acknowledgement of a
reciprocal relationship between learning and memory 'what we learn' is affected by its
meaningfulness. The meaningfulness is determined by what is remembered and that
14

memory is affected by what we learn (Winn and Snyder, 1996) and between knowledge
and environment has led to a philosophical shift within educational psychology, from
objectivism to constructivism.
The students need to search for meaning and understanding from the information they
interact with in order to cognitively develop instead of memorising facts for tests or,examinations. They need to learn when, where and why to use information received as
well as how to recognise meaningful patterns in the information in order to cognitively
develop in the subject matter (Tapscott, 1998).
The students need to apply some form of cognitive strategy in order to solve given
problems. If applied successfully, the cognitive strategy should lead to mastery of the
subject matter. Students need to think about and discuss their own approach to learning,
and be willing to explore alternatives. For learners to be able expand their cognitive
development they need to become autonomous and they need to think about learning
itself. A common misconception is that a person becomes autonomous on becoming an
adult. This is rarely the case, as discussed by Steyn (1998). The student needs to be
convinced that they need to become an independent lifelong learner (Tapscott, 1998).
Visualisation is a process for putting (complex) images into minds e.g. the shape of a
mountain, images of street maps, memory of street names, verbal directions. According
to Rieber (1995) visualisation is a key cognitive strategy which plays an important role in
discovery and problem solving e.g. the information acquired through visualisation can be
used to make simple route-finding decisions. In that case people learn about space and
the objects and routes within space. Visualisation, therefore, has tremendous value in GIS
because of spatial data which is always manipulated by the GIS people. Also, many of
the problems presented in GIS require the manipulation of objects, or elements. Leutner
(1993) argues that manipulation of objects stimulates learning and training. Through a
process of visualization, a GIS can be used to produce images not just maps, but
drawings, animations, and other cartographic products. These images allow researchers to
15
view their subjects in ways that they never could before. The images often are helpful in
conveying the technical concepts of a GIS to nonscientists.
Information is cognitively processed in an electronic information environment. In
problem solving, studies indicate that while working in a technology enriched learning
environment, evaluation of information measured against Bloom's Cognitive Taxonomy
was found to be significantly higher, analysis and synthesis of information were found to
be generally higher. Creativity by learners exploring the unknown, taking individual
initiative to find solutions, was also exhibited (Bloom, 1956). Bloom's taxonomy of
cognitive objectives, originated by Benjamin Bloom and collaborators in the 1950's,,describes several categories of cognitive learning. Three "domains" of educational
activities were identified. Psychomotor Domain Taxonomy which is characterized by
progressive levels ofbehaviors from observation to mastery of a physical skills.
Cognitive Domain involves knowledge and the development of intellectual attitudes and
skills. Affective Domain Taxonomy: lists levels of commitment (indicating affect) from
lowest to highest
Eventually, Bloom and co-workers established a hierarchy of educational objectives,
which is generally referred to as Bloom's Taxonomy, and which attempts to divide
cognitive objectives into subdivisions ranging from the simplest behaviour to the most
complex.
The focus of this research is on the assumption that ArcView-GIS helps student to
develop cognitively in GIS. The theoretical framework which informs a developmental
approach to the evaluation of how ArcView-GIS helps students to develop in GIS is
derived from a synthesis of work of Tapscott (1998) where the author explains the
influences of computers on students. Cognitive learning is concerned with human
information processing, integration of new with prior knowledge, meta cognition, internal
schemata, retention and transfer of learning, and the use of cognitive strategies.
According to Tapscott, (1998) (see Table 1) computers can facilitate the process of
learning by
16
• Supplementing limited working memory by making large amounts of information
immediately available for the learners use,
• Making relevant, previously learned information available simultaneously with
the acquisition of new information,
• Enabling learners to quickly retrieve previously learned information that is needed
to help them in learning specific new information, and
• Prompting the learner to structure, integrate, and inter, and interconnect new ideas
with previous ones.
The influence of computers on students are summarised in Table 1. The psychomotor,
cognitive and affective perspectives used in Table 1 to examine the influences were
selected by Tapscott (1998).
17
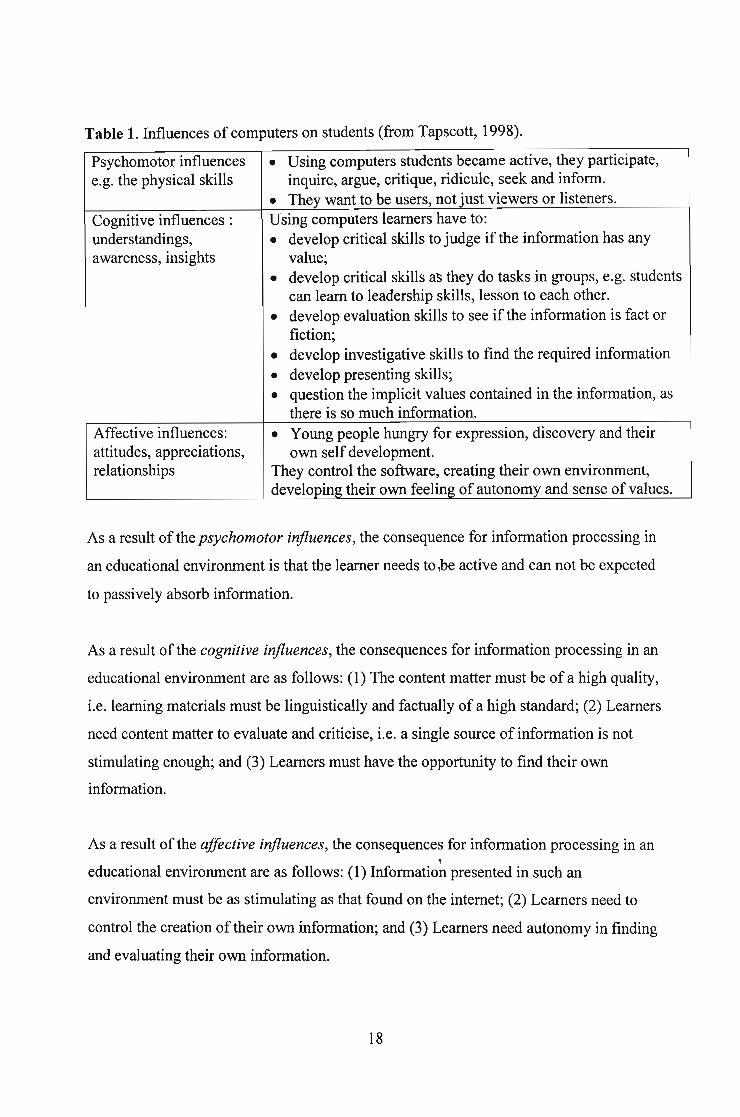
Table 1. Influences of computers on students (from Tapscott, 1998).
Psychomotor influences • Using computers students became active, they participate,e.g. the physical skills inquire, argue, critique, ridicule, seek and inform.
• They want to be users, not just viewers or listeners.Cognitive influences: Using computers learners have to:understandings, • develop critical skills to judge if the information has anyawareness, insights value;
• develop critical skills a~ they do tasks in groups, e.g. studentscan learn to leadership skills, lesson to each other.
• develop evaluation skills to see if the information is fact orfiction;
• develop investigative skills to find the required information
• develop presenting skills;
• question the implicit values contained in the information, asthere is so much information.
Affective influences: • Young people hungry for expression, discovery and theirattitudes, appreciations, own self development.relationships They control the software, creating their own environment,
developing their own feeling of autonomy and sense of values.
As a result of the psychomotor influences, the consequence for information processing in
an educational environment is that the learner needs to,be active and can not be expected
to passively absorb information.
As a result of the cognitive influences, the consequences for information processing in an
educational environment are as follows: (1) The content matter must be of a high quality,
i.e. learning materials must be linguistically and factually of a high standard; (2) Learners
need content matter to evaluate and criticise, i.e. a single source of information is not
stimulating enough; and (3) Learners must have the opportunity to find their own
information.
As a result of the affective influences, the consequences for information processing in an,
educational environment are as follows: (1) Information presented in such an
environment must be as stimulating as that found on the internet; (2) Learners need to
control the creation of their own information; and (3) Learners need autonomy in finding
and evaluating their own information.
18
Cognitive tools activate complex cognitive learning strategies and critical thinking. These
tools not only extend the mind, they have the potential to reorganize mental functioning
(Pea, 1985). When using cognitive tools, learners engage in knowledge construction
rather than knowledge reproduction. Cognitive tools are also intended to be used by
students to represent knowledge and solve problems while pursuing investigations that
are relevant to their own lives. Cognitive tools empower learners to design their own
representations of knowledge rather than absorbing knowledge representations
preconceived by others.
Technology is defined as "any object or process of human origin that can be used to
convey media" Reeves (1998). According to Reeves (1998), learning "with" technology
is referred to in terms such as cognitive tools. This author believes that technology can
have positive effects on learning. Computer-based cognitive tools have been intentionally
adapted or developed to function as intellectual partners to enable and facilitate critical
thinking and higher order learning. Computer software programs are examples of
exceptionally powerful cognitive tools. Also referred to as cognitive technologies,
technologies of the mind. Examples of cognitive tools include: databases, spreadsheets,
the statistics tool SPSS and Microsoft Office (Reeves 1998).
Reeves (1998) outlined the foundations for using software as cognitive tools as follows:
• Cognitive tools will have their greatest effectiveness when they are applied within
constructivist learning environments;
• Cognitive tools empower learners to design their own representations of
knowledge rather than absorbing representations preconceived by others;
• Cognitive tools can be used to support the deep reflective thinking that is
necessary for meaningful learning;
• Cognitive tools have two kinds of important cognitive effects, those which are
with the technology in terms of intellectual partnerships and those that are afthe
technology in terms of the cognitive residue tha.t remains after the tools are used;
19
• Cognitive tools enable mindful, challenging learning rather than the effortless
learning promised but rarely realized by other instructional innovations;
• The source of the tasks or problems to which cognitive tools are applied should be
learners, guided by teachers and other resource~ in the learning environment;
• Ideally, tasks or problems for the application of cognitive tools will be situated in
realistic contexts with results that are personally meaningful for learners;
• Using multimedia construction programs as cognitive tools engages many skills in
learners such as: project management skills, research skills, organization and
representation skills, presentation skills, and reflection skills; and
• Research concerning the effectiveness of constructivist learning environments
such as microworlds, classroom-based learning environments, and virtual,
collaborative environments show positive results across a wide range of
indicators.
According to Tapscott (1998) computers can facilitate the process oflearning by:
• Supplementing limited working memory by making large amounts of information
immediately available for the learners to use;
• Making relevant, previously learned information available simultaneously with
the acquisition ofnew information;
• Enabling the learner to quickly retrieve previously learned information that is
needed to help them in learning specific new information; and
• Prompting the learner to structure, integrate, and interconnect new ideas with
preVIOUS ones.
2.4 ArcView-GIS literature
Many articles have been written about ArcView-GIS, but few explained how ArcView
GIS helps students to develop cognitively in a GIS. The articles have explained ArcView
GIS as a specialized tool to manipulate, retrieve, view, store and analyse spatial data. All
features in a spatial database are comprised of geographic points, such as polygons,
points and lines. These elements are linked to a table that uniquely identifies each feature
and its location in a coordinate system. Data can be mapped and analyzed, and linked to
20
attribute data in one-to-one or many-to-one relationships. An ArcView-GIS combines
layers of information about a place to give one a better understanding of that place. The
layer chosen depends on the purpose of the map, such as analyzing environmental
damage, or viewing similar crimes in a city to detect patterns. In a GIS, geographic data
is described explicitly in terms of geographic coordinates, namely, latitude and longitude
or grid coordinates, or implicitly in terms of a street address or postal code. A GIS
translates implicit geographic data into an explicit map location. This process is called,geocoding. A GIS system also has a database manager, usually a relational database
management system (RDBMS) (ESRI, 2004).
ArcView-GIS introduces students to a new way of seeing, thinking, and interacting with
the world around them. Using ArcView, students explore course content in a way that
enhances logical, mathematical, linguistic, spatial, and interpersonal intelligences. Doing
GIS projects is thought to improve critical thinking skills such as analyzing, synthesizing,
and evaluating. For example students learn in no time to work with data geographically:
seeing patterns they could not see before, revealing hidden trends and distributions, and
gaining new insights. Working geographically enables you to understand relationships
between the forces that drive your business so you will,make better decisions and get the
power you need to solve problems faster (Braus, 1998).
ArcView-GIS provides students with powerful learning tools that can be developed into
marketable skills. According to Raymond (1994) graduates have found jobs because of
their ArcView-GIS training which helped them develop skills. "ArcView-GIS enables
students to take relatively simple classroom activities and extend them beyond the walls
of University into the community" (Braus 1998).
According to Braus (1998) computers and maps have a natural appeal to students and the
learning process is enriched when tasks or work of students can be used in "real life"
applications e.g. students are given environmental impact assessment projects. ArcView-,GIS can be used in a variety of creative ways in a learning environment, for example the
students may be asked to generated traffic data and map out a group of possible freeway
routes. Presenting results and ideas is easy with ArcView-GIS. Students can make
21

,publication-quality maps and create interactive displays by linking charts, tables,
drawings, photographs, and other files. Communicating geographically is a powerful way
to inform .e.g. if people inform or locating a particular place for development, they use
maps to describe the position.
ArcView-GIS draws from many different disciplines. It also integrates many
technologies in one package, (e.g. spreadsheets and databases, but the main use is that the
software has made it easier for students to draw maps.
There are also barriers to the use of ArcView-GIS. For ArcView-GIS to be used by more
students, effective use of ArcView-GIS requires computer literacy. Students have to be,
fairly technologically oriented or have good support. Students must overcome issues
ranging from discomfort with computer technology. The student must be trained to use
computer technology (Braus, 1998).
According to Dawson (2004) computer skills come with regular use of the computer. The
real skills of educational value, social and personal skills, must be developed during
group interaction and the processing of information during authentic and challenging
educational projects. By using ArcView-GIS students actually learn how to do statistical
functions of selected database fields. In ArcView-GIS students are also exposed to
statistical analysis tools concepts for example correlation, average, maximum, minimum
and count. To learn more about statistical concepts a student can go to the help menu and,search for statistical concepts. In that way ArcView-GIS does help students to develop
the skill and knowledge in the field of statistics and students begins to understand the
concepts and be able to use them correctly when performing statistics (Dawson, 2004).
Using ArcView-GIS is beneficial not only in developing computer literacy but also
provides training in the process of research including gathering, preparing, storing, and
analyzing data and presenting the results of analysis using a variety of methods. These
are skills valuable in both academic and business settings. In addition to interacting with
data in a new way, students learn teamwork because GIS projects typically require a high
level of cooperation, because GIS uses data sets which require consultation between
22
different stakeholders. The importance of GIS to education is being recognized
throughout the world (Braus, 1998).
Students develop their spatial knowledge when using ArcView-GIS. Understanding of
relative locations of the students' residential country can be considered basic
prerequisites that enable them to establish a framework in which further knowledge can
be accumulated. Goodchild (1990) noted that only by mastering location and place could
the student proceed to higher order geographical concept. Investigating learners'
development of understanding of their country's geographical space is important for
cartographers as this small-scale spatial information, which may be stored into the
learners mind, comes mainly from maps. In the last decade there has been a renewed
interest in learners' recall and understanding of the geographical units.
One of the most important functions of a spatial information system is that it enables the
integration of databases from different sources and scales (Landis, 1993). The integration
of information allows appropriate indicators to be developed (e.g. per capita funding for
development).
According to Landis (1993), one of the most useful functions of spatial information or a
GIS is the production of thematic maps. A thematic map is a map depicting selected
kinds of information relating to one or more specific themes. Examples are soil type, land
classification, population density and rainfall maps (Walker, 1993). Over the last year,
South Africa has seen a marked increase in the use of mapped information in decision
making. The overlaying of different layers of spatial information is another function that
enables people to gain an understanding of the spatial relationship between features and
enables information from one layer to be integrated with another. Overlay is a
transparent sheet placed over artwork, in register with the work it covers; this is used to
call out other color components of the work, instructions or corrections. A good example
of this is the overlaying of census information with satellite imagery to show where areas
of environmental degradation occur in relation to where populations with different socio
economic characteristics reside. Information from point locations (e.g. crime incidence,
23

schools, health facilities, development projects, social surveys, etc) can also be overlaid
to get a better understanding of a particular area.
A GIS software use tools for the handling, collecting, managing, analysis and modeling
of geographic data. A GIS is strength lies in its ability to combine computer-assisted
mapping with statistical analysis of spatial data to perform spatial modeling. A GIS can
integrate a wide variety of disciplines including agriculture, computing, economics, and
geography. It can assist in the analysis ofmany social and scientific problems on a
global, national and local level. A GIS is used as the integration of spatial data acquired
at different scales and times, and in different formats into a single database. It can be used
for the enhancement of measurement, mapping, monitoring and modeling of spatial
phenomena. Using a GIS improves our understanding of the world (ESRI homepage
2004).
A key concept for any GIS is to be able to ask 'what if?' type questions. This enables the
decision-maker to derive a variety of solutions to different problems. The swift retrieval
of data sets which shows the spatial relationships between features is also very significant
and assists with the interpretation of the data. The abili~y to produce maps showing
particular combinations of features is also a very valuable asset. Thus, the analysis
capability, data management capability and the cartographic capability all help to
enhance the ability to manipulate and use data more efficiently (ESRI homepage 2004).
A GIS helps develop students' critical thinking and problem solving skills so they will
become more involved in their community and more responsible global citizens.
According to the World Health Organisation (1999) GIS "provide an excellent means of
analysing epidemiological data, revealing trends, dependencies and inter-relationships
that would be more difficult to discover in tabular format". The technology provides a
mechanism to integrate different data sets, analyse their spatial and statistical
components, and model possible scenarios, thereby supporting interdisciplinary research.
Its use will encourage the ongoing collection and analysis of accurate spatial and
statistical data for disease control and resource distribution. Its use requires appropriate
24

data, mechanisms for distribution, as well as expertise and technical support (Medical
Research Centre, 2001).
According to Hazel Baker (1997) ArcView-GIS helps students to find employment for
example GIS graduates are finding employment with ease, to the extent that most have
jobs to go to as soon as they finish university. According to Hazel (1997) knowledge of a
GIS is the technical knowledge that is needed by most companies.
ArcView-GIS may also help learners improve their reporting skills. ArcView-GIS may
help by performing a number of valuable functions e.g. pre-processinglevaluating data,
data displaying: display of spatial and editing of data and analysis of data: spatial and,attribute query. They can also be used for producing multiple drafts of documents small
data files, notices and research papers. The types of features are exploited include adding
graphs, using comments and accessing external data. ArcView-GIS also helps students to
analyze data by being reliable and accurate in numerical analysis. ArcView-GIS helps
students to stay focused on their work by finding facts easily without leaving the work at
hand, using the new research task pane. It brings electronic dictionaries, thesauruses, and
online research sites into work to help students to find information and incorporate
information into their work. Some functionality in the research task pane requires a
connection to the Internet. ArcView-GIS also finds the help needed by a student from the
'getting started' and 'help' task panes. Students can also access ArcView-GIS Online
assistance on the ArcView-GIS Online Web site. It provides help and assistance articles
that are updated regularly from requests and issues of other users (ESRI homepage 2004).
It is a tool that is structured in the way that may enhance the students mind and improve
the knowledge of the GIS course material. ArcView-GIS promotes using systems
customized to the students' prior knowledge and enhances student learning, ArcViiew
GIS is being designed with the philosophy and pedagogy reinforcing the inquiry-based
approach to learning and it offers a collection of research-based inquiry technology, from
probe, to Internet resources, all in an effort to support with the specific tools that
researchers and students need. Also, it emphasizes hands-on problem solving.
25

Students have limitations to working memory because working memory can naturally
handle less than seven ideas (larger numbers of ideas can be 'chunked' into less than
seven larger pieces for thinking about in working memory) (Miller, 1956). ArcView-GIS
can serve as an extender for working memory, holding larger numbers of ideas in an,
organized format for reflection and revision (Saloman, 1993). ArcView-GIS also presents
coherent patterns in the form of a Graphic User Interface (GUI) that helps learners
remember events, ideas and relations between observations and derived inferences. Also
multiple forms of representation help provide multiple accesses to ideas. A GUI is the
collection of controls that you use to interact with a project component. In ArcView-GIS
each GUI is comprised of a menu bar, a button bar, a tool bar and a set of popup menus.
A user can customize the default GUIs and create new GUIs. Each GUI is associated with
a specific project component (ESRI homepage 2004).
ArcView-GIS gives students practice activities that are authentic to the GIS e.g.
geographical search and spatial analysis; which makes it likely that students will be better
able to perform in the GIS course. The authentic task would help learners in practical
activities relevant within realistic scenarios. Cognitive learning theory indicates that the
ways in which knowledge, skills, and attitudes are initially learned affect the degree to
which these abilities can be used in other contexts. If knowledge, skills and attitudes are
learned in a context of use, they will be used in similar contexts. Otherwise, it is left up to
learners to generate connections between problems and solutions. Whenever transfer to
real-world contexts is of primary concern, situating interactive learning in relevant
contexts may be advantageous, although the research support for this is still weak
(Reeves & Hedberg 2000). The students benefit from opportunities to use and apply their
knowledge and skills in a variety of contexts. ArcView-GIS also supports students to,develop evidence-based (case-based) reasoning to support or refute their scientific ideas.
That support of ArcView-GIS gives students practice in deciding when it is appropriate
to use particular knowledge and skills being acquired. Based upon Perkin's (1985)
"knowledge as the design" pedagogy, learners undertake a task or solve a problem using
software as a cognitive tool to support their problem-solving processes and ultimately to
present their solutions to others. "Cognitive tools empower learners to design their own
26
representations of knowledge rather than absorbing knowledge representations
preconceived by others" this is not a highly motivating process, but there is also good
evidence that authorship result in ownership of the ideas in the representations (Reeves
1996).
According to Feuerstein (1979) Piaget's theory of human cognition provides the
explanatory structure within which to understand the different stages in the development
of human cognition. Piaget outlined several principles for building cognitive structures.
During all development stages, in relating the theory to ArcView-GIS, the students
experience their environment using whatever mental maps they have constructed. If the
experience is a repeated one, it fits easily or is assimilated into the student's cognitive
structure so that he or she maintains mental "equilibrium." If the experience is different or
new, the student loses equilibrium, and alters their cognitive structure to accommodate
the new conditions. This way, the student erects more and more adequate cognitive
structures.
ArcView-GIS also helps students in analysing the data in the GIS course and gives the
solutions to any given task for GIS course e.g. the location of the best route or the,shortest point to a certain place. By this tool a student is developing in skill and
knowledge because a tool is helping a student to solve that particular problem.
Using ArcView-GIS in a structured setting is not beneficial only in developing computer
literacy but also provides training in the process of research including gathering,
preparing, storing, and analyzing data and presenting the results of analysis using a
variety of methods. These are skills valuable in academic settings (Johnson, 2000).
It is argued that ArcView-GIS helps students to perform tasks that they are incapable of
completing on their own. With this in mind, scaffolding where the software continually
adjusts the level of its help in response to the student level of performance is an effective
form of helping a student to develop cognitively. Scaffolding not only produces
immediate results, but also instills the skills necessary for independent problem solving in
27
the future. Scaffolding means the provision of transitiop.al support structures in learning
(ESRI homepage 2004).
2.5 Conclusion
The chapter successfully dwelled on thoroughly giving an insight into the cognitive
development, human computer interaction theories and relationship of technology with
cognitive development theories ArcView-GIS literature. It was evident from the literature
review that ArcView-GIS is thought to promotes cognitive development. Having
discussed the ArcView-GIS, the next chapter will come with research methodology. The
research methodology is going to test the above-mentioned literature.
28
CHAPTER 3 - RESEARCH METHODOLOGY
3.1 Introduction
Software systems such as ArcView-GIS are to guide developmental decisions. A system
is successful if it assists in achieving the set goals. The'outcome of evaluating software
should be to provide a picture of how users can carry out the desired tasks, e.g. using
statistical software to perform the statistics. The control that a software designer has is in
the structuring of the human-computer dialogue. These issues are primarily cognitive
issues, and thus the focus of software evaluation deals mostly with cognitive evaluation.
This chapter will investigate in detail methodology that will be used in this research in
the evaluation of ArcView-GIS. It also examines methods of data collection and the role
players who were consulted during the data collection stages.
3.2 Methodology
The evaluation process detailed in this chapter describes the evaluation of ArcView-GIS
at the implementation phase. According to the evaluation framework proposed by Bain
(1999), the focus of evaluation at this stage is summative and aims to establish the
educational appropriateness of the product and whether the learning outcomes are as
intended. The methodology is determined from peer review, formative monitoring of
student involvement and experiences with the environment, and student learning
outcomes. In order to do this it is necessary to collect data from a number of sources,
generally using different methods. The data collected will be validated by "triangulation"
and "bracketing" methods. Triangulation refers to the use of more than one approach to
the investigation of a research question in order to enhance confidence in the ensuing
findings. According to Reeves and Hedberg (2003) triangulation derives from surveying,,where it refers to the use of a series of triangles to map out an area. Bracketing on the
other hand means "using multiple meseasures to provide a range of estimates of the value
of a variable" (Reeves and Hedberg, 2003). "Triangulation" and "bracketing" methods
has a subtle but important difference. The method used forms what may be termed an
eclectic mixed-methods pragmatic paradigm as described by (Reeves and Hedberg,
2003). The method allows for a "mixed approach to data production and analysis, with
29

both qualitative and quantitative information obtained in the evaluation process" (Reeves
and Hedberg, 2003).
Reeves and Hedberg (2003) identified four paradigms of research that include the Analytic
Empirical-Positivist-Quantitative Paradigm (AEPQP), Constructivist-Hermeneutic-Interpretive
Qualitative Paradigm (CHIQP), Critical Theory-Neomarxist-Postmodern-Praxis Paradigm
(CTNPPP) and the Eclectic-Mixed Methods-Pragmatic Paradigm (EMMPP).
The AEPQP rests on the belief in a separate material reality, which can be objectively
measured and explained through controlled experimentation. This paradigm has been
criticized on the grounds that it is difficult to set up controlled conditions, it is possibly
unethical and the tests themselves may be unrepresentative of important learning
outcomes (Reeves and Hedberg, 2003). It is a quantitative strategy. It is concerned with
proving or disproving a hypothesis, not on how a phenomenon occurred.
The CHIQP offers an alternative approach for investigating complex social processes,
without resorting to a single viewpoint or mathematical model (Reeves and Hedberg,
2003). The interpretive nature of this paradigm means that such approaches are
concerned with human observation and qualitative methods. It differs from AEPQP about
the nature of reality from those of proponents of the quantitative paradigm. CHIQP has
been criticized for producing findings that are too subjective, lacking in generalisability
or being too difficult to produce (Reeves and Hedberg, 2003).
The CTNPPP emerged as an alternative to the reductionist view ofthe positivist
paradigm and the subjective views of interpretivist paradigms and focuses on action,
rather than analytical modeling or description (Reeves and Hedberg, 2003). The CTNPPP
condemn the AEPQP as reactionary and criticize the CHIQP as unengaged. The CTNPPP
put its emphasis on criticism and deconstruction. The Neomarxist faction of this,
paradigm view themselves as the forces of liberation engaged in an on-going conflict
with the powers of oppression (Reeves and Hedberg, 2003).
30
The EMMPP uses multiple methods in evaluation "where its strength lies in its openness
to borrowing the methods of the other three paradigms to collect information and solve a
problem" (Reeves and Hedbererg, 2003).
Paradigms are meaningful only within the context of their use and one approach is not
necessarily preferable to another when it comes to particular problem-solving
requirements. In EMMPP the focus is on practical problems rather than on issues of
reality and theories of society. It acknowledges the weakness of current evaluation tools,
and is more capable of handling the complexity of human learning and provides a variety
of qualitative and quantitative strategies/techniques and approaches (yielding a variety of
quantitative and qualitative data) (Reeves and Hedberg, 2003). The EMMPP approach is
more capable of handling the complexity of modem society and technology, and the
EMMPP strategy is recommended because it works better than other paradigms (Reeves
and Hedberg, 2003).
3.3 Evaluation
The software was examined in three ways: (i) Through an assessment of students'
performance, by administering a specially designed test, comparing students who had
used the program with those who had not; (ii) By canvassing the subjective opinions of
students and instructors about the program by means of a specially designed
questionnaire, interviews; and (iii) Through expert assessment of the software.,
Therefore, this multi-faceted approach ensures that a broad view is taken during the
evaluation, and establishes the educational appropriateness of the product, that is whether
the learning outcomes are as intended.
3.4 Assessment of students' performance
Altogether, seven sets of realistic scenarios were devised. These made use of drawings,
angles, and language to describe an operational problem. Students were required to solve
31
problems based on these scenarios, using paper and pencil. During assessment, each
student completed all scenario problems. The assessment was controlled in all groups so
that no student encountered any problem. Students who had used the program were
compared with others who had not used the program. This allows the author to look at the
effect of using the program on students' performance. ,
3.5 Assessment of ArcView-GIS
Students who are familiar with the system were asked to complete a questionnaire aimed
at eliciting their views of the software in terms of its effectiveness, the level of interest in
use, human computer interaction, cognitive development, and overall subjective rating.
The questionnaires used appear in Appendix 1 at the end.
ArcView-GIS experts at the University of KwaZulu-Natal were also used in the
assessment of ArcView-GIS. It is also important to view the software from the user's
perspective, as a complete integrated, functional experience.
ArcView-GIS was evaluated in terms of meeting its aim in terms of its functions. In the
research process, it is highly unlikely that the necessary data will be found in only one of
these sources. More often, the relevant material is compiled from several different
sources, in order to obtain a better understanding of the subject under study. Two types of
data sources can be used, namely, primary sources and secondary sources (Fig. 3.1).
32
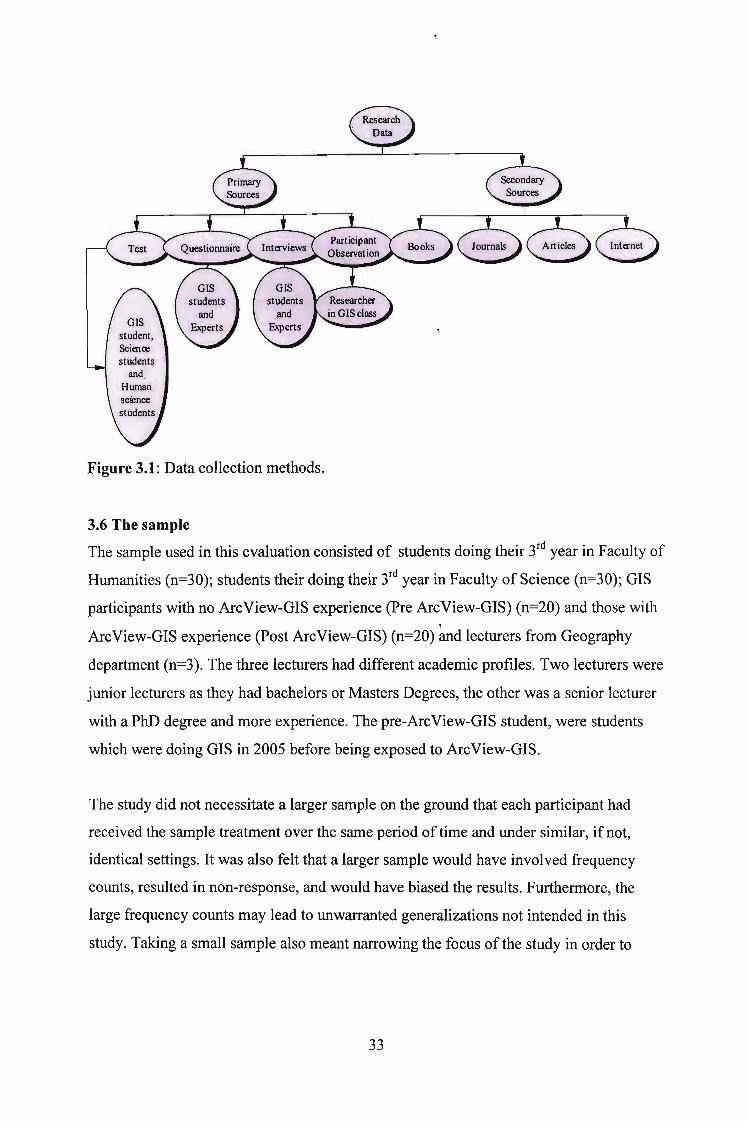
Figure 3.1: Data collection methods.
3.6 The sample
The sample used in this evaluation consisted of students doing their 3rd year in Faculty of
Humanities (n=30); students their doing their 3rd year in Faculty of Science (n=30); GIS
participants with no ArcView-GIS experience (Pre ArcView-GIS) (n=20) and those with,
ArcView-GIS experience (Post ArcView-GIS) (n=20) and lecturers from Geography
department (n=3). The three lecturers had different academic profiles. Two lecturers were
junior lecturers as they had bachelors or Masters Degrees, the other was a senior lecturer
with a PhD degree and more experience. The pre-ArcView-GIS student, were students
which were doing GIS in 2005 before being exposed to ArcView-GIS.
The study did not necessitate a larger sample on the ground that each participant had
received the sample treatment over the same period of time and under similar, ifnot,
identical settings. It was also felt that a larger sample would have involved frequency
counts, resulted in non-response, and would have biased the results. Furthermore, the
large frequency counts may lead to unwarranted generalizations not intended in this
study. Taking a small sample also meant narrowing the focus of the study in order to
33
investigate whether the knowledge, skills and attitudes of the participants changed after
using ArcView-GIS.
Participants were informed about the purpose of the research, the way data would be
collected, and the various phases of the research study.
3.7 Instruments
Effectiveness data can be derived from questionnaires, interviews, observations and other
methods. The effectiveness of ArcView-GIS was evaluated in the following categories:
skills, knowledge and attitudes.
According to Reeves (1998) knowledge takes many forms. Most knowledge is conceptual,
in nature. The meaning of knowledge is changing. The change of meaning of knowledge
has implications for how effectiveness evaluations are conducted (Reeves and Hedberg
2003).
The skills are also different. Skills are generally regarded as being more important
knowledge.
The attitude includes factors such as motivation, moral values and prejudices. Sometimes
people are purposefully deceitful in reporting attitudes but more often they just do not
know how they feel or are unable to express their attitudes.
3.8 Secondary sources
Data collected using the secondary sources comprises textbooks, magazines, newspaper
articles and handbooks. The advantages of using secondary sources include that less cost
and less time is used than in primary research investigation. In this study, secondary
sources of information are utilised primarily in the construction of a conceptual
framework, which will be used to provide background information on the study. The
information collected was from the following sources: books, journal articles,
reports/documents, maps and the intemet.
34
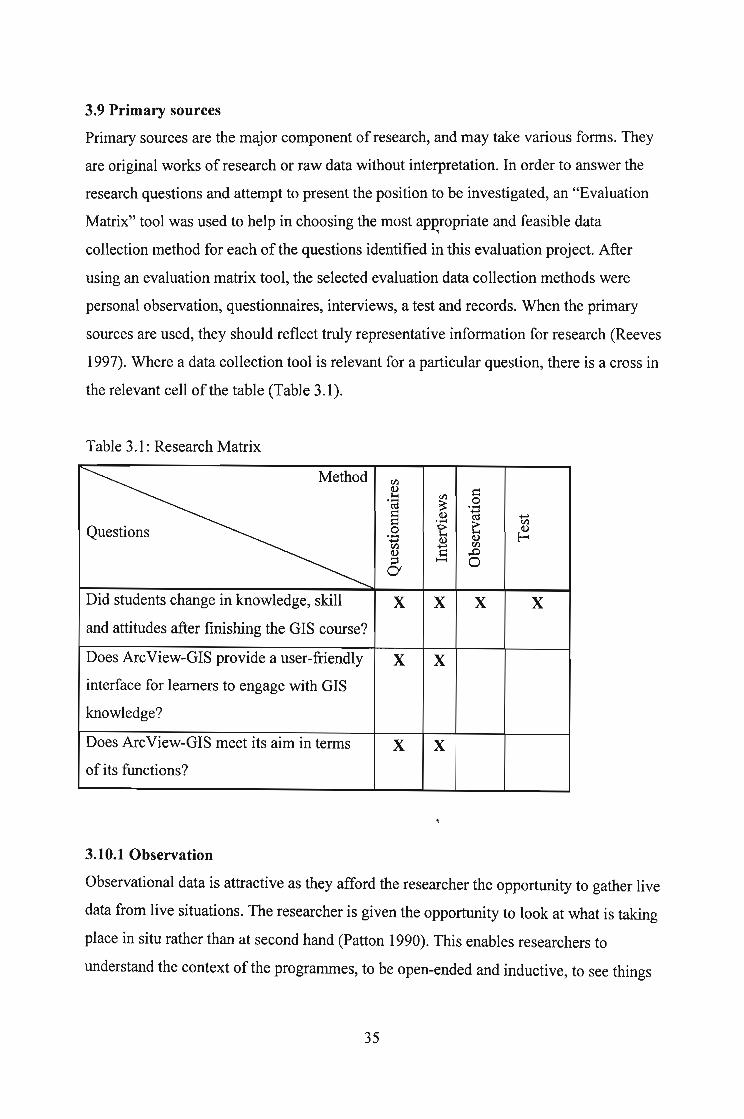
3.9 Primary sources
Primary sources are the major component of research, and may take various forms. They
are original works of research or raw data without interpretation. In order to answer the
research questions and attempt to present the position to be investigated, an "Evaluation
Matrix" tool was used to help in choosing the most appropriate and feasible data,collection method for each ofthe questions identified in this evaluation project. After
using an evaluation matrix tool, the selected evaluation data collection methods were
personal observation, questionnaires, interviews, a test and records. When the primary
sources are used, they should reflect truly representative information for research (Reeves
1997). Where a data collection tool is relevant for a particular question, there is a cross in
the relevant cell ofthe table (Table 3.1).
Table 3.1: Research Matrix
Method tIlQ) s::1-0 tIl.- ~
0CI1 .-S Q) ~ ......- t:
tIl
Questions 0 't: Q).- Q) E-<..... Q)tIl i:l
tIlQ) ,.0;:j ...... 0Cl
Did students change in knowledge, skill X X X X
and attitudes after finishing the GIS course?
Does ArcView-GIS provide a user-friendly X X
interface for learners to engage with GIS
knowledge?
Does ArcView-GIS meet its aim in terms X X
of its functions?
3.10.1 Observation
Observational data is attractive as they afford the researcher the opportunity to gather live
data from live situations. The researcher is given the opportunity to look at what is taking
place in situ rather than at second hand (Patton 1990). This enables researchers to
understand the context of the programmes, to be open-ended and inductive, to see things
35
that might otherwise be unconsciously missed, to discover things that participants might
not freely talk about in interview situations, to move beyond perception based data (e.g.
opinions in interviews) and to access personal knowledge. Morrison (1993) argue that
observations enables the researcher to gather data on (i) The physical setting e.g. physical
environment and its organization; (ii) Human setting e.g. the organization of people, the
characteristics and make up of the groups or individuals being observed, for instance
gender, class. (iii)The interactional setting (e.g. the interactions that are taking place,
formal, informal, planned, unplanned, verbal, nonverbal act); (iv) The programme setting
(e.g. the resources and their organization, pedagogic styles, curricula and their
organization).
Observation can be conducted in an informal or a highly structured way. In a structured
observation a set oftasks is set and the performance of the users is observed. A check list
of points for observation may be drawn up beforehand. The performance of the user on
the system is recorded against this check list. Informal observation in the field is often
conducted to assess system acceptability. This is a useful general check. As researcher,
the author was in an ideal position to collect this kind of information. Many informal
discussions with students during and after their time on the GIS Practical were held.
Observation was aimed to discover the behaviour of students in the context of their
everyday living experiences personal observation was recorded and related to the
research proposal. An informal observation was carried out by the researcher in
University of KwaZulu-Natal (Howard College) in the GIS laboratory, and lecture venues
during the GIS practical and lecture sessions. The observation period fell over fifteen
weeks, from the 17 February 2003 to 26 May 2003.
3.10.2 Interviews
Interviews are powerful tools for collecting data about the effectiveness of software.
They are a useful way to gain a rich understanding of users' reactions to a system
(Reeves and Hedberg, 2003). Interviews were conducted with the lecturers, technician
and students of the GIS course after spending some time working with the ArcView-GIS
36
software. All the interviews took place at the GIS department and in agreement with
participants to record the conversation verbatim. Four GIS students and the three
lecturers from GIS department were interviewed. Each participant took about 30 minutes
to interview, depending on how much they could chat about ArcView-GIS experience.
The responses were important because they gave views about whether students felt there
were changes in their skills, knowledge and attitudes after using ArcView-GIS.
Interviewing is an effective research tool for collecting information and opinions
(Brewerton and Millward, 2001). It is a face to face interpersonal role situation and relies
on the research question being asked. Unlike questionnaires, which have a set of fixed
questions and responses. The explanatory power of interviews can therefore be unlimited.
The advantages of interviewing are flexible, rich data, and co-operation. The,
disadvantages of interviewing are that it can be time-consuming, costly, and open to bias.
Brewerton and Millward (2001 :69) describe three types of interviews: (i) Structured
interviews involve a prescribed set of questions which the researcher asks in a fixed
order. This method ensures rapid data coding and analysis, and guaranteed coverage of
the area of interest (Brewerton and Millward, 2001). (ii) Unstructured interviews allow
the researcher to address any of a given number of topics, which may be of interest to the
research. Questions and their order are not fixed and may evolve during the interview
process (Brewerton and Millward, 2001). (iii) Semi-structured interviews incorporate
elements of both quantifiable, fixed-choice response and the facility to explore and probe
in more depth certain areas of interest (Brewerton and Millward, 2001).
In the context of this study, semi-structured interviews have been undertaken by the
researcher because of its advantages as stated above (see Appendix 2).
3.10.3 Questionnaires
Questionnaires are one of the most frequently used methods of collecting effective data.
These responses are important as the knowledge, skills, and attitudes of students
(cognitive development) after using ArcView-GIS in GIS course and user-friendly
interface for learners to engage with GIS knowledge is being researched.
37
A questionnaire is probably the most commonly used tool within the social sciences
(Brewerton and Millward 2001). It is a printed list of questions which respondents are
asked to answer. Low cost, minimal recourse requirements and potentially large sample
capturing abilities make questionnaires an attractive research option. A questionnaire is
usually standardized, and is an indispensable tool when primary information is required
about people, their behaviour, and opinions. The sampling design ofthe questionnaire
generally includes random sampling, systematic sampling, stratified random sampling,
and cluster sampling.
Most questionnaires require respondents to provide some background information
relating to themselves, race, and educational level. But questionnaires used in this
research required respondent to provide two types of information namely Human
Computer Interaction which requires respondents to provide information relating to
ArcView-GIS software. The second part of the questionnaire requires respondent to
provide cognitive development information i.e. skills, ~owledge and attitudes gained
from ArcView-GIS software.
3.10.4 Tests
Testing is also accepted as an effectiveness evaluation strategy. The purposes of a test are
several, for example to diagnose a student's strengths, weaknesses and difficulties, to
measure achievement, to measure aptitude and potential, to identify readiness for a
programme. Tests are normally designed to discover whether students have the essential
prerequisites to begin the programme e.g. in terms of knowledge, skills, understandings.
The type oftest which is used in this project takes two forms. It is a diagnostic test and a
summative test. Diagnostic testing is an in-depth test to discover particular strengths,
weaknesses and difficulties that a student is experienciiIg, and is designed to expose
causes and specific areas of weakness and strength. It is a criterion-referenced.
The summative testing is the test given at the end of the programme, and is designed to
measure achievement, outcomes, or mastery. This might be criterion referenced or norm-
38

referenced, depending to some extent on the use to which the results will be put (e.g. to
award certificates or grades, to identify achievement of specific objectives).
The kind oftest which will be used is short answer, true-false, simple multiple choice,
and complex multiple choice. Like any other method, a tests method has its own
advantages and disadvantages in terms of acceptability, feasibility, reliability, validity
and security. A paper-pencil test was conducted. This paper-pencil test requires the
students from Faculty of Humanitities, Faculty of Science and GIS to demonstrate the
knowledge, skills/ or attitudes they posses. The test me,thod helped to test whether
ArcView-GIS contributed to students cognitive development. According to Reeves and
Hedberg (2003) it is more difficult and expensive to use performance tests, but the
validity of this method is usually high. The literacy and communication research
instruments were taken from skills assesment tools designed by Foko (2003) (Appendix
3).
3.11 Conclusion
Data collected from participant observation, questionnaires and interviews are presented
separately in chapter 4. Collection of data plays a very significant role in moving forward
the research. Data analysis can produce new insight and information by careful
description which will form the basis for evaluation and recommendations to be made. In
the collection of data from the participant, confidentiality was assured. Participants had
an option of quitting at any stage.
In the analysis of data, specialised software packages for quantitative and qualitative data
analyses were used namely SPSS (SPSS Inc) for quantitative analysis and QSR NVivo
for qualitative analysis.
39

CHAPTER 4 - RESUTLS AND DISCUSSION
4.1 Introduction
This chapter presents and analyses the research findings. An important part of this study
is to summarise and evaluate these results according to different criteria as well as to
make recommendations.
Numerical analyses were conducted using SPSS (SPSS Inc). In most cases, the
comparison of mean and box plot (see Fig. 4.1) are used in the analysis of data.
100 ...------------,.-------------,
80
60
40
20
30
Natural Science
'cf!. 0 ...--------------L,,.=...-------------lN=
STUDENTS
Figure 4.1. An example of a box plot.
A box plot (also called a box-and-whiskers plot) is a visual representation of the "spread"
summary of a set of data. Box plots allow you to focus on the relative positions of different
sets of data and thereby compare them more easily.
According to NetMBA.com (2005) a box plot is interpreted as follows:
40
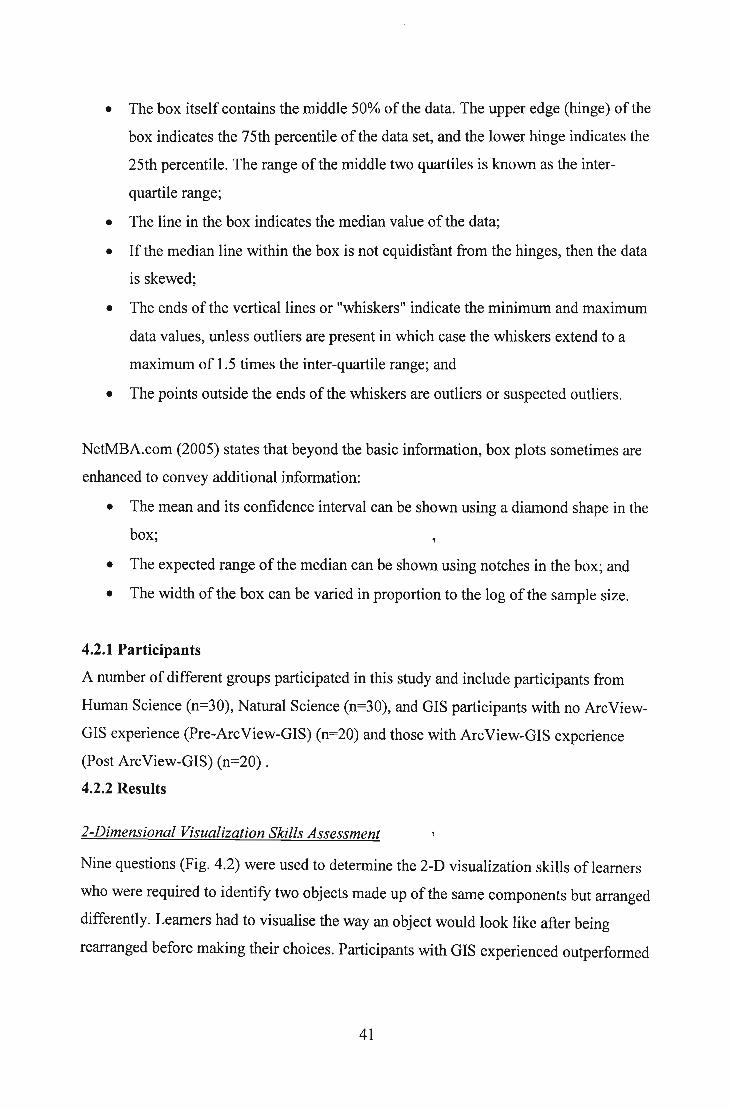
• The box itself contains the middle 50% of the data. The upper edge (hinge) of the
box indicates the 75th percentile of the data set, and the lower hinge indicates the
25th percentile. The range of the middle two quartiles is known as the inter
quartile range;
• The line in the box indicates the median value of the data;
• If the median line within the box is not equidisfant from the hinges, then the data
is skewed;
• The ends of the vertical lines or "whiskers" indicate the minimum and maximum
data values, unless outliers are present in which case the whiskers extend to a
maximum of 1.5 times the inter-quartile range; and
• The points outside the ends of the whiskers are outliers or suspected outliers.
NetMBA.com (2005) states that beyond the basic information, box plots sometimes are
enhanced to convey additional information:
• The mean and its confidence interval can be shown using a diamond shape in the
box;
• The expected range of the median can be shown using notches in the box; and
• The width of the box can be varied in proportion to the log of the sample size.
4.2.1 Participants
A number of different groups participated in this study and include participants from
Human Science (n=30), Natural Science (n=30), and GIS participants with no ArcView
GIS experience (Pre-ArcView-GIS) (n=20) and those with ArcView-GIS experience
(Post ArcView-GIS) (n=20) .
4.2.2 Results
2-Dimensional Visualization Skills Assessment
Nine questions (Fig. 4.2) were used to determine the 2-D visualization skills of learners
who were required to identify two objects made up of the same components but arranged
differently. Learners had to visualise the way an object would look like after being
rearranged before making their choices. Participants with GIS experienced outperformed
41

Human Science, Natural Science faculties and GIS students with no ArcView-GIS
experience. GIS student scored 84.5%, students from Human Science scored 53.3%,
Natural Science students scored 70.9% and GIS students with no ArcView-GIS
experience scored 53.4%. The overall mean for this section was 64.9%.
80
0
60
*1240
"*19
20
~ 00
N= 20 30 30 20
100 ...-----...,....-----------,------,-------,
R:>st ArcView -GIS Natural Science
Human Sciences Pre ArcView -GIS
STUDENTS
Figure 4.2. Box plot displays of the 2-dimensional visualization skills assessment of GIS,
Human Science and Natural Science students.
3-Dimensional Visualization Skills Assessment
Fourteen questions were used to determine the 3-D visualisation skills ofleamers (Fig.
4.3). These exercises required the matching of similar figures viewed from different
angles. Still in this section GIS students outperformed the Human Science and Natural
Science faculties. GIS student scored 80.9% students from Human Science scored 48.4%,
Natural Science students scored 71.1% and GIS students with no ArcView-GIS,
experience scored 63.5%. The overall mean for this section was 64.7%
42
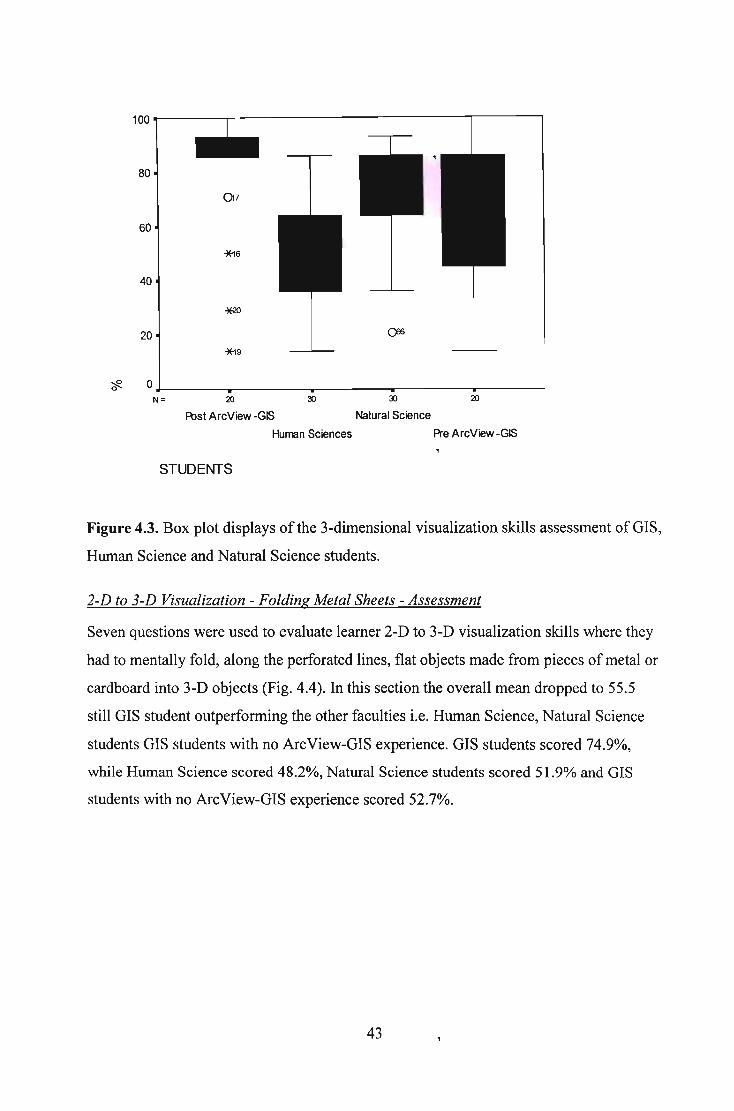
20
60
80
*'16
40
07
100 ----..,.---------------,------,
~ 0J-- -r- ----,r-- ---.- --.- ---'
N= 20 ~ ~ 20
FOst ArcView -GIS Natural Science
Human Sciences Pre ArcView -GIS
STUDENTS
Figure 4.3. Box plot displays of the 3-dimensional visualization skills assessment of GIS,
Human Science and Natural Science students.
2-D to 3-D Visualization - Folding Metal Sheets - Assessment
Seven questions were used to evaluate learner 2-D to 3-D visualization skills where they
had to mentally fold, along the perforated lines, flat objects made from pieces of metal or
cardboard into 3-D objects (Fig. 4.4). In this section the overall mean dropped to 55.5
still GIS student outperforming the other faculties i.e. Human Science, Natural Science
students GIS students with no ArcView-GIS experience. GIS students scored 74.9%,
while Human Science scored 48.2%, Natural Science students scored 51.9% and GIS
students with no ArcView-GIS experience scored 52.7%.
43
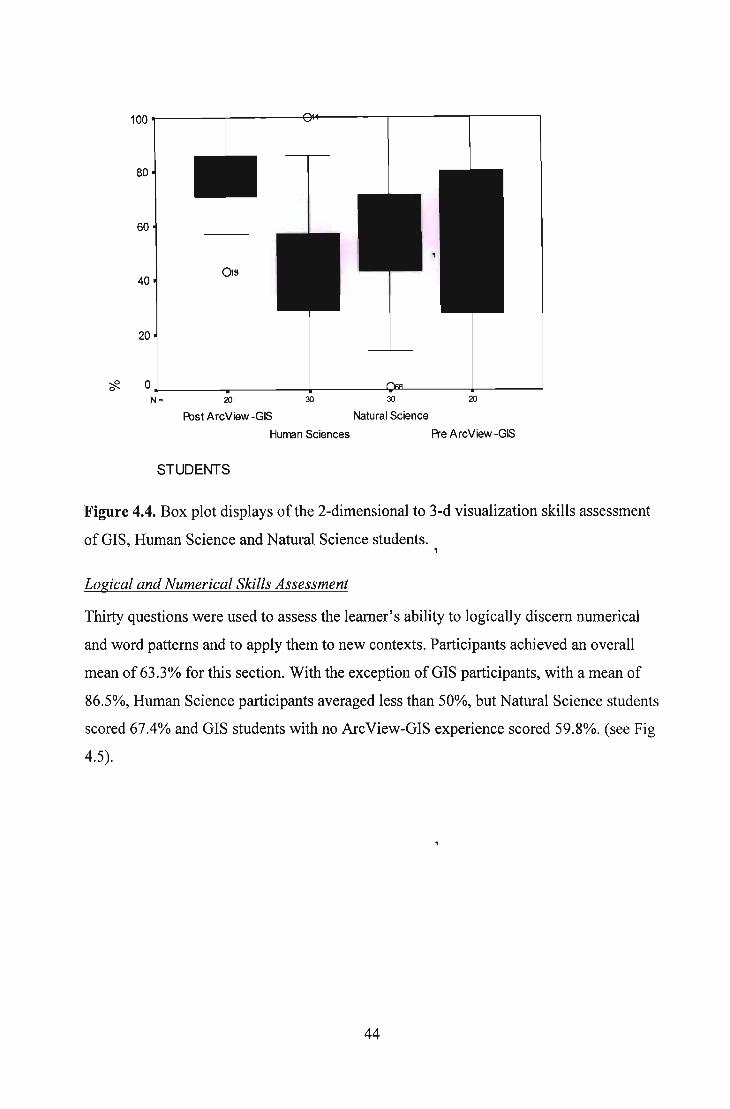
Os40
60
80
100_---.-----~~---__r----_r---_,
20
"#. 0~---_.___---____,1__---_Y:ll1----_r_-----'N= 20 30 30 20
~st ArcView -GIS Natural Science
Human Sciences Pre ArcView -GIS
STUDENTS
Figure 4.4. Box plot displays of the 2-dimensional to 3-d visualization skills assessment
of GIS, Human Science and Natural Science students.
Logical and Numerical Skills Assessment
Thirty questions were used to assess the learner's ability to logically discern numerical
and word patterns and to apply them to new contexts. Participants achieved an overall
mean of 63.3% for this section. With the exception of GIS participants, with a mean of
86.5%, Human Science participants averaged less than 50%, but Natural Science students
scored 67.4% and GIS students with no ArcView-GIS experience scored 59.8%. (see Fig
4.5).
44
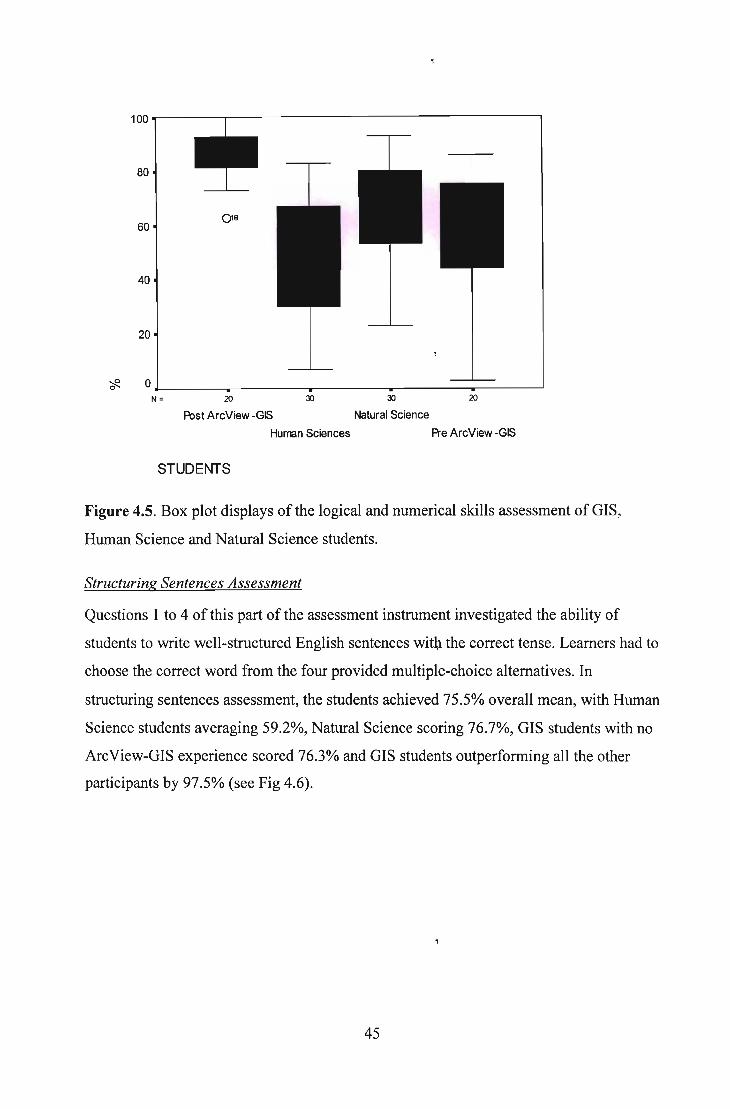
100..-----,-----------------------,
80
20
60
40
cF. 0.l-- -.-- r-- ---.- -.- --'
N= 20 30 30 20
A:lst ArcView -GIS Natural Science
Human Sciences Pre ArcView -GIS
STUDENTS
Figure 4.5. Box plot displays of the logical and numerical skills assessment of GIS,
Human Science and Natural Science students.
Structuring Sentences Assessment
Questions 1 to 4 of this part of the assessment instrument investigated the ability of
students to write well-structured English sentences with the correct tense. Learners had to
choose the correct word from the four provided multiple-choice alternatives. In
structuring sentences assessment, the students achieved 75.5% overall mean, with Human
Science students averaging 59.2%, Natural Science scoring 76.7%, GIS students with no
ArcView-GIS experience scored 76.3% and GIS students outperforming all the other
participants by 97.5% (see Fig 4.6).
45
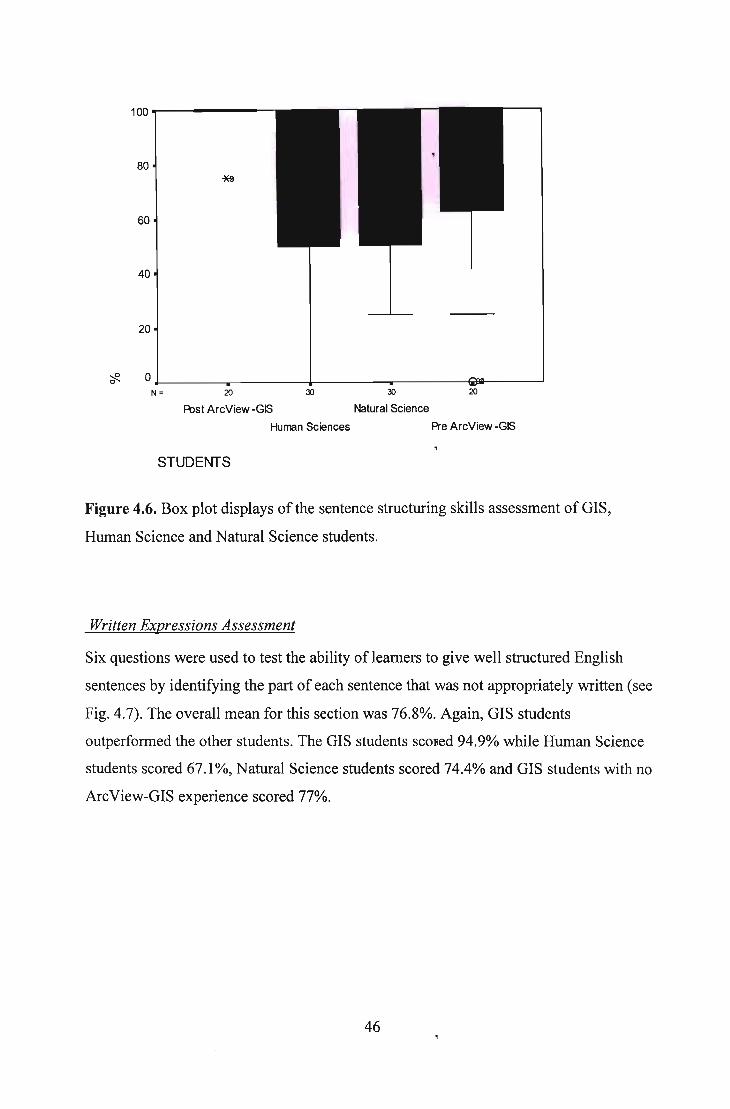
100.,..-------
80
60
40
20
cf? 0~---....._----~---___r----~1------'N= 20 30 30 20
Post ArcView -GIS Natural Science
Human Sciences Pre ArcView -GIS
STUDENTS
Figure 4.6. Box plot displays of the sentence structuring skills assessment of GIS,
Human Science and Natural Science students.
Written Expressions Assessment
Six questions were used to test the ability of learners to give well structured English
sentences by identifying the part of each sentence that was not appropriately written (see
Fig. 4.7). The overall mean for this section was 76.8%. Again, GIS students
outperformed the other students. The GIS students sCOlied 94.9% while Human Science
students scored 67.1 %, Natural Science students scored 74.4% and GIS students with no
ArcView-GIS experience scored 77%.
46
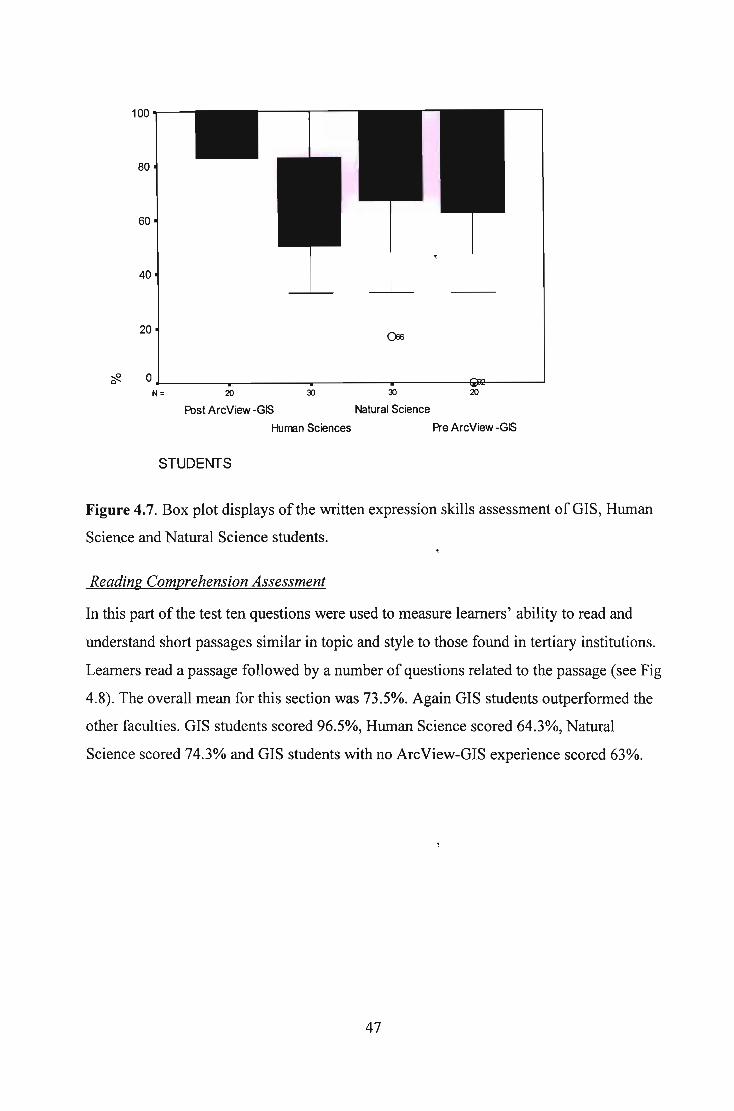
100---
80
60
40
20
"#. O~ ....-- r-- ---.- ~;!--__---'
N= 20 30 30 20
F\:lst ArcView -GIS Natural Science
Human Sciences Pre ArcView -GIS
STUDENTS
Figure 4.7. Box plot displays of the written expression skills assessment ofGIS, Human
Science and Natural Science students.
Reading Comprehension Assessment
In this part of the test ten questions were used to measure learners' ability to read and
understand short passages similar in topic and style to those found in tertiary institutions.
Learners read a passage followed by a number of questions related to the passage (see Fig
4.8). The overall mean for this section was 73.5%. Again GIS students outperformed the
other faculties. GIS students scored 96.5%, Human Science scored 64.3%, Natural
Science scored 74.3% and GIS students with no ArcView-GIS experience scored 63%.
47

100 ot---
80
60
40
20
?F. 0"- ..-- --... -.- -. --'N= 20 ~ ~ 20
R>st ArcView -GIS Natural Science
Human Sciences Pre ArcView -GIS
STUDENTS
Figure 4.8. Box plot displays of the reading comprehension skills assessment ofGIS,
Human Science and Natural Science students.
The most important results are those that reveal differences in student's performances as
a result of using the ArcView-GIS software. The differences between GIS students and
Human Science together with Natural Science students, are very clear-cut: the scatter plot
graph shows the comparison of students from GIS, Human Science and Natural Science
performance in coursework mark and skills test.
Scatter plot graph (Fig. 4.9) shows the relationship between two variables by displaying
data points on a two-dimensional graph. They provide information about the relationship
between two variables: strength, shape -linear, carved etc, direction -positive or
negative, presence of outliers (NetMBA.com, 2005).
The results revealed that GIS students have a significant difference between their
coursework mark and skills test. In their skills test they scored 89.9% and scored 65.7%,
in their coursework. The software was clearly effective in improving student's
48

performance, if taking into cognisance the great difference of skills test vs. coursework
mark of GIS student and the GIS skills test scores vs. Human Science and Natural
Science skills test scores.
Human Science students in their skills test scored 59% and in their coursework marks
scored 60.7%. The score revealed no significant difference in skills test and coursework
scores in Human Science students. Natural Science students scored 62.5% in their
coursework marks and scored 69.8% in the skills test.
These results clearly indicate that while the GIS students performed much better in skills
evaluation, the performance in normal course work was not different from the other
groups.
100 r---------------...
80 0 0 • •~ •00 • .\= ...• it' 0 •• ••
6d 0• @O • ~.. ._.
0 -t:;ceO 0 -::> ·Ci0 • etc. • • 0
40
STUDENTS
20 • Natural ScienceCl)~
o Hurran Science0:::c:t::2: 0 • Post-ArcView -GIS
0 20 40 60 80 100
0/0SKILLS
Figure 4.9. The scatter graph shows the coursework mark and skills test scores ofNatural
Science, Human Science and GIS students.
49

4.3.1 Questionnaire
In analysis of data from Human Computer Interaction and Cognitive Development
Questionnaire, descriptive statistics was used in SPSS (SPSS Inc). Twenty students and
three lecturers from GIS department completed the questionnaires (see Appendix 1).
1
0.9
0.8
0.7
0.6
0.5
0.4
0.3
0.2
0.1>-(J 0cQ)::s 0.9C'"Q)L. 0.8u.
0.7
0.6
0.5
0.4
0.3
0.2
0.1
0
1 2 3 4 5 6 7 8 9 10
Questions
Figure 4.10. Bar graph showing lecturers (a) and students (b) responses related to HCIq~estions (. - Strongly agree plus agree; 0 - Neutral; • - Disagree plus stronglydIsagree).
50
The specific HCI and cognitive development attributes that were investigated in order to
establish the participants' perception of the HCI of ArcView-GIS, included general
usefulness/utility, effectiveness and efficiency, reliability, ease of use, error management,
consistency and compatibility, learnability and user satisfaction. The following section
will provide a short overview of the questionnaire results shown in the bar graphs figures
10 and 11 as it pertained to the participants' perception of the HCI and cognitive
development of ArcView-GIS.
Firstly results related to Fig. 4.10 are discussed:
Question 1
The students and lecturers have different views on visibility of ArcView-GIS status. Most,
of the students agreed that the ArcView-GIS always keep them informed about what is
going on through appropriate feedback within reasonable time, but most of lecturers
disagreed. The visibility of the ArcView-GIS status referred to the degree to which a
product enables a user to achieve his or her goals and is an assessment of the user's
motivation for using the product.
Question 2
The response by both students and lecturers to the language used to label screen
information (i.e. user interface) is simple and familiar to the user was significantly
positive. This response indicates a good screen layout with effective use of fonts and
colour. The implication is that the screens are legible and easy to follow. No significant
navigation problems were indicated.
Question 3
A positive response was also recorded by both the students and lecturers to the ArcView
GIS capabilities, which indicates that the ArcView-GIS allow users to easily correct, or
recover from, mistakes or errors.
Question 4
The majority of the students regarded the ArcView-GIS as easy to use, while the majority
of the lecturers were neutral. Few lecturers were positive about the ArcView-GIS. Ease
of use referred to the effortlessness and user-friendliness ofthe system.
Question 5
51

The majority of the students agreed that the ArcView-GIS are consistent and compatible
while the majority of the lecturers were neutral. Few lecturers were positive about the
ArcView-GIS. Consistency referred to the ability of the ArcView-GIS to respond to user
inputs in a consistent way and to perform similar tasks 'in similar ways. Compatibility
referred to the degree to which the system's method of operation matched with the user's
expectations.
Question 6
All the lecturers agreed that ArcView-GIS is reliable. However a few students disagreed.
Reliability referred to the dependability of the system and the repeatability, without
failure, of completing tasks while using the system.
Question 7
Both the students and lecturers agreed that the ArcView-GIS was flexible and effective of
use. There were few students and lecturers which were natural and disagreed with the
students. Flexibility and efficiency of use referred to that the ArcView-GIS can cater both,inexperienced and experienced users.
Question 8
More lectures then the students agreed that the ArcView-GIS was aesthetic and
minimalist in design. Few lecturers and student disagreed with the statement. Aesthetic
and minimalist design referred to that the ArcView-GIS did not offer more than is
required for the user to perform a task, but it was aesthetically pleasing.
Question 9
Also more lectures than the students agreed that the ArcView-GIS had error messages
which were useful. There were few lecturers and students who disagreed and few
students who were neutral. Error messages should be expressed in plain language (no
codes), precisely indicate the problem, and constructively suggest a solution.
Question 10
The students and lecturers have different views that it is easy to find, or search for,
information provided by ArcView-GIS. Most lecturers were positive, while students were
not.
52
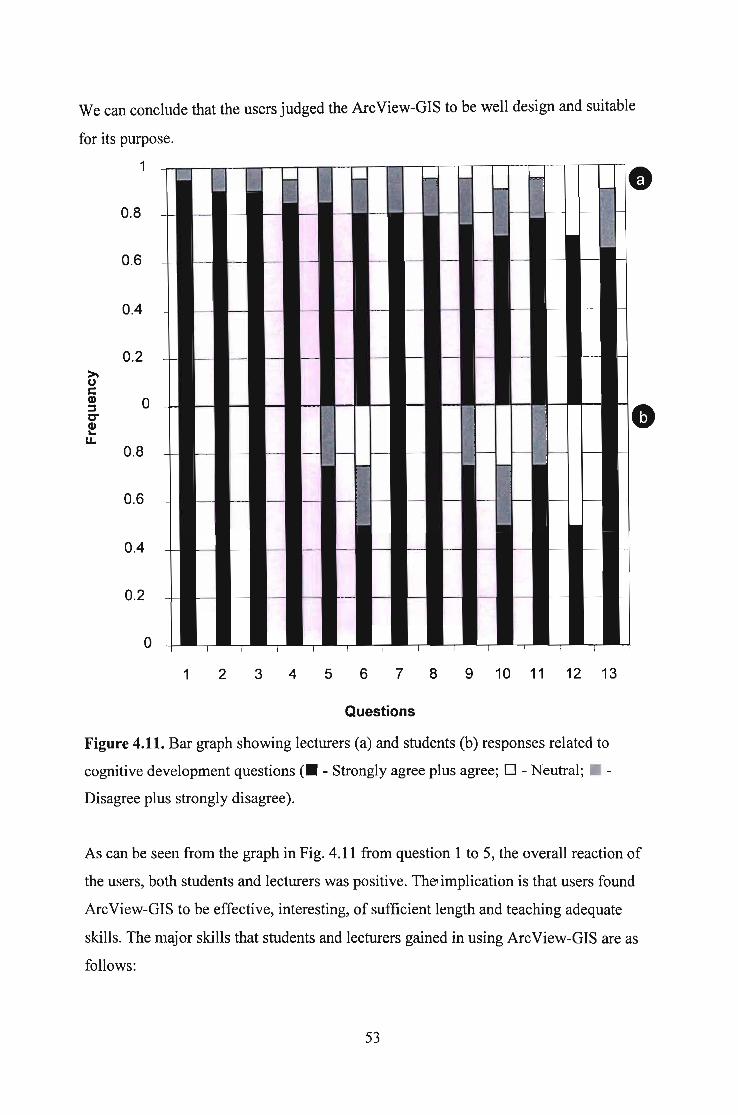
We can conclude that the users judged the ArcView-GIS to be well design and suitable
for its purpose.
1
0.8
0.6
0.4
0.2>.0c(I) 0;:,C"(I)..u.
0.8
0.6
0.4
0.2
0
1 2 3 4 5 6 7 8 9 10 11 12 13
Questions
Figure 4.11. Bar graph showing lecturers (a) and students (b) responses related to
cognitive development questions (. - Strongly agree plus agree; 0 - Neutral; •
Disagree plus strongly disagree).
As can be seen from the graph in Fig. 4.11 from question 1 to 5, the overall reaction of
the users, both students and lecturers was positive. The implication is that users found
ArcView-GIS to be effective, interesting, of sufficient length and teaching adequate
skills. The major skills that students and lecturers gained in using ArcView-GIS are as
follows:
53
•
•
•
•
•
Research Skills:
a Determining the nature of the problem and how research should be
organized.
a Searching for information using text, electronic and pictorial information
sources.
a Analyzing and interpreting all the information collected to identify and
interpret patterns
Research Skills
a Determining the nature of the problem and how research should be
organized.
a Searching for information using text, el~ctronic and pictorial information
sources.
a Analyzing and interpreting all the information collected to identify and
interpret patterns.
Presentation Skills
a Mapping the design onto the presentation and implementing the ideas.
a Attracting and maintaining the interests of the intended audiences.
a Improved visualization and spatial reasoning skills.
Organization and Representation Skills
a Deciding how to segment and sequence information to make it
understandable.,
a Deciding how information will be represented (text, pictures, movies,
audio, etc.).
a Deciding how the information will be organized (hierarchy, sequence) and
how it will be linked.
Reflection Skills
a Evaluating the program and the process used to create it.
a Revising the design of the program using feedback
An overall response was again positive in knowledge gained from question 6 to 10 by
students in ArcView-GIS. Two negative aspects were that identified as not helpful.
54
Concept presented in the course and deeper understanding of geographical and
environmental knowledge which lecturers felt that those aspects were not helpful.
Students and lecturers agreed that ArcView-GIS helped them to gain a deeper
understanding of geographical and environmental kno~ledge. The bottom line was that
by establishing an environment where creative thinking about the content is combined
with real-world assignment, students learned the content, enjoyed the learning process,
and recognized that they had created something useful. Furthermore ArcView-GIS
helped them to understand spatial, location, and geographical information. This study
illustrates the principle that: "Cognitive tools empower learners to design their own
representations of knowledge rather than absorbing knowledge representations
preconceived by others" (Perkins, 1986).
There was a positive attitude towards ArcView-GIS by both students and lecturers
agreeing that ArcView-GIS is a valuable learning experience. Furthermore they agreed
that ArcView-GIS changed the way they perceived and interpreted maps. Except in
question 12 where one lecturer disagreed saying ArcView-GIS did not made him change
the way he viewed social and environment issues.
4.4.1 Interview
After obtaining information from tests and questionnaires, the task was to continue to
discover as much as possible about the ArcView-GIS software. The adoption of the
interview method is to enable the researcher to obtain a richer understanding through
direct procedure, which would allow the interviewee more scope for elaboration and
general discussion on the research issues. The interviews were conducted with three
lecturers and five students, who volunteered, involved ~n GIS course. These semi
structured interviews provide qualitative information, which is based on their in-depth
knowledge and experience relating to the study. This process entailed probing for
substantial responses.
Interviews were undertaken during the research period, between the 12 and 13 October
2004. Each interviewee was asked the same questions (Appendix 2).
55
The data from interviews were imported into QSR NVivo, a qualitative data analysis
software package; the qualitative data were analyzed via three techniques derived from
grounding theory: coding, memo writing and the network display (Morse and Richards
2002). The coding phase of the analysis progressed in three stages (Glaser and Strauss
1990): open (i.e. broad coding of general themes), axial (i.e. a more refined coding of
themes) and selective coding. For the memo writing analysis, memos were written at the
initial reading of the transcripts and during all phases of analyses to higWight key
questions about relationships in the data, to refine categories, and emerging analyses. In
the networks display stage of analyses, codes were used to "network display" the data
visually.
4.4.2 Validity of analyses
Qualitative theorists have proposed several criteria for judging the quality or
trustworthiness of qualitative analyses (Miles and Huberman 1994). The quality of
analyses was assessed via three criteria: credibility, transferability, and conformability
(Lincoln and Guba 1985). First, the degree to which findings were credible was assessed
by examining codes that supported key themes in the data. The goal of transferability is,to assess whether the conclusions drawn from a qualitative study can be compared with
other samples or theories. "Thick description" (Lincoln and Guba 1985) is provided to
assist others interested in assessing the transferability of the study's findings. Thick
descriptions include, but are not limited to, detailed accounts of the sample and
discussion of prior theory. Finally, conformability refers to the extent to which the study's
methods, procedures, process of data collection and analyses, and conclusions have been
described thoroughly. Provided in the results section are quotes from participants to
support the conclusions drawn. With the exception of some minor edits to improve
clarity, all quotes are provided verbatim. To protect participants' confidentiality, I have
provided pseudonyms and changed all occupations or other identifiers.
56
4.4.3 Results from interviews
Responding to an interview question about students changing in knowledge, skills and
attitudes after finishing the GIS course, all the interviewees were positive about
ArcView-GIS software, the three expects (lecturers from GIS) agreed that students
developed cognitively after using ArcView-GIS software. One of the expects from GIS
said "Students gained skills for calculations, steps or ways to follow when solving the
problem. Students became familiar with maps and became able to design maps". One of
experts from GIS said "I have seen students applying arcView-GIS in other courses and
student do improve in knowledge, skills and attitude". A technician from GIS said "Yes
students did change in knowledge because students were more capacitated after finishing
the course. They gained skills e.g. analysing, reporting, accuracy of good data,management. Students are also able to use the same skills they learned from arcView-GIS
in other software's. The students attitudes changed, for example they started to see how
important is the arcView-GIS".
Five students explained that "GIS is a good course. It helps people to understand
concepts/ images on maps. It also helps to understand features spatially. ArcView-GIS
generally provides a good platform of data management".
The experts from GIS and students interviewed articulated a variety of themes about
gained knowledge, skills and changed attitudes in ArcView-GIS namely skills gained,
solving problems, analysing, presenting, analysing maps, reporting, data management,
ArcView-GIS require computer literate, knowledge, learn through ArcView, mapping,
design maps, show information, change in knowledge, computer literate,
A network display (Fig. 4.12) illustrates the common theme of cognitive development in
GIS students. Computer literate, gained skills, data management, changed in knowledge,
design maps, reporting, gained knowledge, analysing, show information, solve problems
and attitude changed. A common theme in all the definitions of the above-mentioned
codes is ways in which the students and experts speak about aspects of the cognitive
development of GIS students. While reflecting on this network 1 realized that students
57
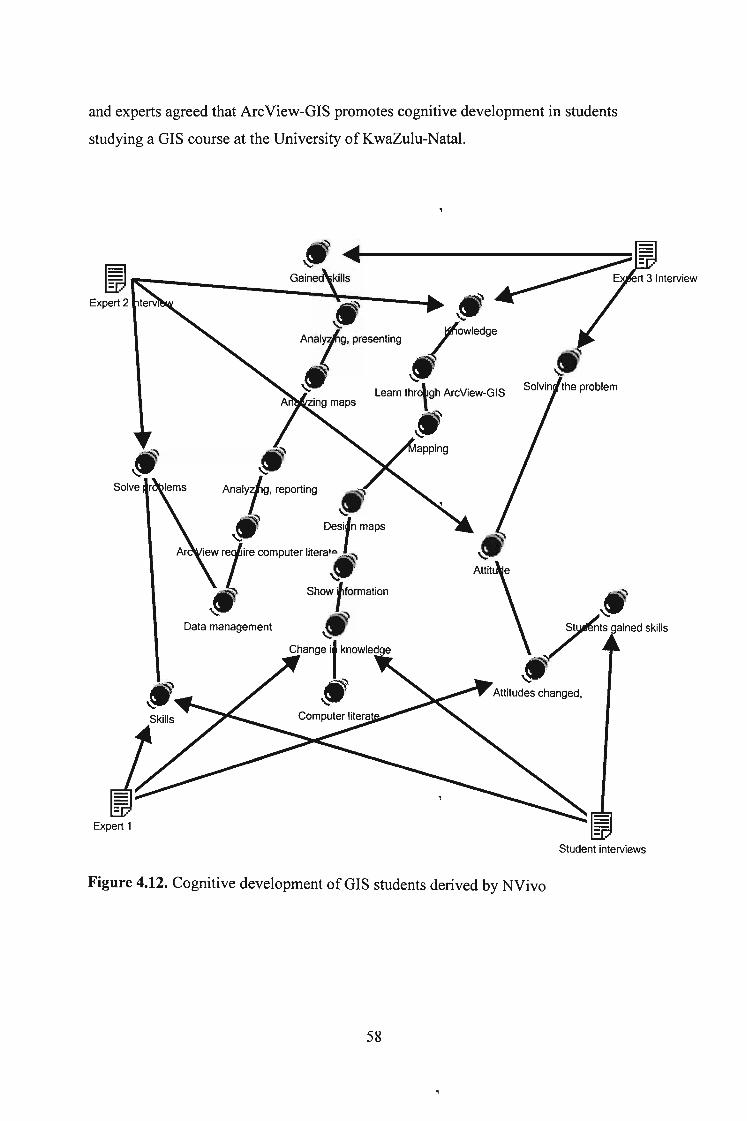
and experts agreed that ArcView-GIS promotes cognitive development in students
studying a GIS course at the University of KwaZulu-Natal.
IQ~ .....f-----------_~~-----.:~:---~Expert 2I,tp.~
\::l'p<eseol;ng "
\:: . Learn throtgh ArcView-GISzlng maps ,
'C'I
\::Vis a;"'" ,.",
Attitudes changed,
Student interviews
Figure 4.12. Cognitive development of GIS students derived by NVivo
58
4.5.1 Triangulation
In order to triangulate the findings, learners were observed as they worked on their
projects until they made their presentations.
4.5.2 Observation of the students
I had the privilege of being a student with the participants (students) for three months.
During this period I observed and got to know them so,that I was able to verify the data
in the questionnaire, I witnessed the following in the GIS class during ArcView-GIS
project sessions and practical sessions.
There was chatting that I witnessed among students during the practicals, which shows
that the ArcView-GIS also promoted communication among the students.
I have also observed some negative aspects which were encountered by students
regarding the ArcView-GIS: (1) The unstable error messages and difficulties to
understand computer jargon caused frustration to students; (2) The lack of pre-requisite
exposure to and familiarity with computers; and (3) The cost of ArcView-GIS which
prevented students to have the software at home.
Students reported that the nature of ArcView-GIS contributed to their intrinsic motivation
to progress.
The assignments required that students carry out tasks and activities in order to meet
broadly defined course objectives. This gave students considerable choice and flexibility
as to the specifics and details of the methods and materials that they used to meet the
prescribed goals. In the process they became active learners, motivated to acquire the
necessary skills to achieve the course objectives.
The ArcView-GIS project provided the opportunity for students to apply the new
knowledge they had acquired through the assignments in immediate and practical ways.
59
Each learner identified a relevant problem to work on that could have real-life application,in his or her work situation. During the three months they then monitored or solved and
reported on the problem. This process enabled students to identify the value of their
learning for themselves.
Students believed that the marks awarded to them were a fair reflection of their
knowledge, skills and abilities after completing the course. Despite the possibility that the
software did not influence learning there were other aspects which students thought were
favourably influenced. Whether the GIS course results were among their best results or
not, they all expressed enthusiasm about how much they had learnt and benefited from
the ArcView-GIS, its approach and methodology.
Student expectations of what they would gain from the GIS course included the
development of their knowledge and skills. They hoped to learn how to make better
decisions and develop cognitively. After the course students reported that they had
fulfilled these expectations. They referred to considerable academic, technical and social
learning gains as a result of the GIS course.
4.6 Conclusion
The questionnaire survey was undertaken with the purpose of the research as a key means
of obtaining information from the students and lecturers (experts). Each questionnaire
took approximately five minutes to complete. The resppnses to the questionnaires were
good and are consistent with the findings from the participant observation survey and
interview survey. Some issues outside the questionnaire were also raised and commented
on by the respondents, which can be seen as a contribution to this research. This survey
therefore provided an important input to the research.
60
CHAPTER 5 - CONCLUSIONS, LIMITATIONS AND RECOMMENDATIONS
5.1 Introduction
This study evaluates whether ArcView-GIS promotes cognitive development (i.e. spatial
visual perception skills). In order to address the research problem, the following research
questions were identified and examined:
(1) Did students change in knowledge, skills and attitudes after finishing the GIS
course?
(2) Does ArcView-GIS provide a user-friendly interface for learners to engage with GIS
knowledge?
(3) Does ArcView-GIS meet its aim in terms of its functions?
This chapter concludes the research into the problem. The following section presents
answers to the identified questions.
5.2 Answers to the research questions
1. Did students change in knowledge, skills and attitudes after finishing the GIS course?
The overall response of the students and lecturers using the ArcView-GIS was extremely
positive and encouraging. Judging from the skills test and coursework mark for GIS
students, there was the improvement in GIS students. According to the literature review
ArcView-GIS has a positive impact on student in terms of skills, knowledge and
attitudes. According to ESRI homepage (2004) ArcView-GIS improves problem solving
skills and critical thinking skills such as analyzing, synthesizing, and evaluating, also
students develop their spatial knowledge when using ArcView-GIS. Furthermore, the
great difference of skills test vs. coursework mark of GIS student and the GIS skills test
scores vs. Human Science and Natural Science skills test scores showed the that GIS
students performed better meaning that ArcView-GIS had an impact on GIS students.
Research by means of participatory observation, questionnaires and interviews at
University of Kwazulu Natal has shown that ArcView-GIS have contributed in
improving students' performance.
61

In a discussion on spatial visualization, Gardner (2004) believed the following to be most
relevant to the skill of visualization:
"(1) The ability to hold and compare images using both 3D representations and multi
view representations ofan object, (2) The ability to manipulate 3D objects within a 3D
configuration (to rotate the object, (3) And the ability to deconstruct and manipulate
these deconstructed components ofa 3D object within a 3D configuration (unfolding and
folding, sections, embeddedfigures) - interfering mentally with the integrity ofa 3D
object".
Gardner (2004) argue that the "spatial functioning is a mental process which is associated
with the brains attempts to interpret certain types of incoming information". This
information is basically anything visual - pictures, maps, plans etc. previously
disadvantaged schools tends to produced students which performs poorly in special and
visualization constructs and in 3-D problems and those characterized by special
orientation constructs. This study found that most of the Human Science learners lacked
the ability skills to comprehend the combination of rectangles, circles and the ability to
visualize rearranged objects; GIS students performed better in combination of rectangles,
circles and the ability to visualize rearranged objects, in questions related to 2-D
visualization, 3-D visualization, 2-D flat sheets into 3-D objects. In every case GIS
students outperformed students from Human Science and Natural Science in all the tests
namely (1) 2-Dimensional Visualization Skills Assessment, (2) 3-Dimensional
Visualization Skills Assessment (3) 2-D to 3-D Visualization - Folding Metal Sheets
Assessment (4) Logical and Numerical Skills Assessment, (5) Structuring Sentences
Assessment (6) Written Expressions Assessment, (7) Reading Comprehension
Assessment. Osondo (1999) found that that the students that lacked the skills of
visualization improved the visualization skills with the increased exposure to visual
objects and advances in their studies. Thomas and Higbee (1996) argue that educators
need to include or incorporate a variety of methods in their techniques in the classroom to
stimulate visualization skills in students (Gadner 2004).
62
I can conclude that the software is effective in consolidating and adding value to the,
existing cognitive development to students. The attitude assessment revealed that, on the
whole software was popular with students and does not suffer from any major usability
problems. Experience with the software has changed the way they perceive and
interpreted maps. The software also made students to change the way they viewed social
and environmental issues.
2. Does ArcView-GIS provide a user-friendly interface for learners to engage with GIS
knowledge?
Response to this question was positive and negative. Some students and expects were
positive about the user-friendly interface and some were negative. According to
respondents in questionnaire and interviews, they found using ArcView-GIS as a
valuable learning experience. Lecturers, who might be expected to be more critical than
their students, also reacted favorably to most aspects of the software. Comments from a
few users suggested that: (1) After making mistakes with a software it must able the user
to undo many times; (2) The software must make the error messages clearer and more
meaningful; (3) Also the software mast use understandable jargon because not all
geographers understand computer jargon; (4) Also they suggested that if speed can be
improved it will be much better because sometimes; and (5) The software is too slow.
Also, the software shuts down when too much data is inputted, this was frustrating to
users. Literature review revealed that ArcView-GIS promotes using system customized to
the students' prior knowledge and enhance student learning, ArcView-GIS is being,
designed with the philosophy and pedagogy reinforcing the inquiry-based approach to
learning and it offers a collection of research-based inquiry technology, from probe, to
Internet resources, all in an effort to support with the specific tools that researchers and
students need. Also, it emphasizes hands-on problem solving. Literature review also
revealed that ArcView-GIS present coherent patterns in the form of Graphic User
Interface (GUI) that help learners remember events, ideas and relations between
observations and derived inferences.
63
According to students and lecturers response in human computer interface response in
Chapter 4, the overall ratings for students were positive (the sum of Valid Percent was
59%) and the overall ratings for lecturers were again positive, though less than with
students (the sum of Valid Percent is 55). Furthermore drawing from participatory
observation, students were comfortable with the softw(\fe because they were able to carry
out tasks or assignments given to them. This shows that ArcView-GIS provide a user
friendly interface for learners to engage with GIS knowledge.
3. Does ArcView-GIS meet its aim in terms ofitsfunctions?
Deducing from the aims of the software and the results in test, interviews, questionnaires
and participant observation (Chapter 4), the software meet its aim in terms of it functions.
Results from skills test shows that Post-ArcView-GIS students performed better then
Natural Science, Human Science and Pre-ArcView-GIS students. Furthermore the
questionnaire reveals that students agreed that ArcView-GIS improved them in skills,
knowledge and attitudes. The interviews also gave the positive response about ArcView-,
GIS software, expects also agreed that students cognitively developed after using
ArcView-GIS software. In the literature review this is also supported, ArcView-GIS
provide students with the knowledge and skills necessary to, develop practical skills
using commercial software; understand the issues concerning sources, management and
analysis of spatial data and design commercial or industrial solutions (ESRI homepage,
2004). Deducing from points above, it means indeed ArcView-GIS do meet its aim in
terms of functions i.e. improving student's knowledge, skills and attitudes.
GIS software use tools for the handling, collecting, managing, analysis and modeling of
geographic data. GIS strength lies in its ability to combine computer-assisted mapping
with statistical analysis of spatial data to perform spatial modeling. GIS can integrate a
wide variety of disciplines including agriculture, computing, economics, and geography.
It can assist in the analysis of many social and scientific problems on a global, national
and local level. GIS is used as the integration of spatial data acquired at different scales
and times, and in different formats into a single database. It can be used for the
64
enhancement of measurement, mapping, monitoring and modeling of spatial phenomena.
Using GIS improves our understanding of the world (ESRI homepage 2004).
ArcView-GIS allows a user to easily create maps, and add your own data to them. Using
ArcView-GIS's visualization tools, you can access records from existing databases and
display them on maps. It is a powerful, easy-to-use tool that enables you to visualise,
explore, query and analyse geographic data spatially. The applications of ArcViiew-GIS
allows for scaffolding that enables learners to do more advanced activities and to engage
in more advanced thinking and problem solving than they could without such help.
ArcView-GIS is one of these emerging educational technologies that develop
contextually rich student learning. Students can construct understandings of the natural
world by creating visual patterns in data (Steven, 2004). This kind of work is at the heart
of both scientific inquiry and constructivist learning. For student researchers, ArcView
GIS allows for infinite variation in their search of patterns and expands the data that can
be included in their search. Using this advanced computer application designed for
collecting, storing, manipulating, and displaying data not only expands the data students'
look at, but also how they look at it. ArcView-GIS can easily accomplish simple tasks
such as mapping location, however it can also handle more complex tasks such as,
plotting the density and/or frequency of a particular event. ArcView-GIS will allow more
sophisticated tasks, such as finding data points near a particular feature on a map. Perhaps
the most complicated and useful tasks a ArcView-GIS can undertake is displaying data
that shows change over time or displaying data using a three-dimensional perspective
(Steven, 2004).
5.3 Limitations
This study is limited by certain issues which preclude making any generalisations from
the findings. These limitations are discussed in turn below.
The study in question had limitations that warrant attention. Firstly there was a lack of
control over how respondents completed the questionnaires. As a result it become
vulnerable to factors like, for example, the time respondent had to complete the
65
questionnaire. It is possible that greater accuracy could have been achieved if the
questionnaire was completed in the presence of the researcher or his assistants. This was
not possible because the area under the survey was geographically scattered and having
other commitments.
When conducting the test respondents came from different faculties, different
background, for example GIS students mostly consisted students from previously
advantage background, and Human Science comprises students from mostly previously
disadvantage, also the Natural Science consisted the balanced of previously disadvantage
and advantaged students. That means the element of different background from the
participants may have an impact on the result of the tests. Anderson, Case and Lam
(2001) argue that South African schooling is influenced by socio-economic factors and,language proficiency.
Another limitation is that respondents from GIS could not be evaluated prior to
involvement to the program because of time and that it was difficult to know which
students who were going to do or intending to do GIS as the course prior the evaluation
of the arcView-GIS.
5.4 Recommendations
This study aimed to investigate whether ArcView-GIS promotes cognitive development
in students studying a GIS course at the University of KwaZulu-Natal. The major
findings of the research were that GIS students have gaIned knowledge, skills and applied
competencies in a number of fields related to the design of maps, analysing, development
and use of digital technologies in research. More specifically they have gained advanced
skills and insights into the use of arcView-GIS to support research activities including
project management skills, research skills, presentation skills and reflection skills. I
therefore encourage the use of the software at the university so that there are common
applications.
66
I recommend that more research should be done in this topic because there is no other
research in this topic. Researches in the field of computer-assisted education focus
mainly on the use of computer-assisted education at tertiary institutions and not in South
African high schools. The methods of collecting data for this project had a number of
limitations. The questionnaire and interviews had some limitations and some research,questions could not be answered due to the lack of appropriate information. Email
correspondence with the director of Information Technology of Education (ITEd) was
utilized as an additional data collection instrument during the writing of this dissertation.
These emails were sent to obtain supplementary information.
I recommend that the researcher should start by investigating the participants before they
even start using the software itself and after the software and see if the is improvement.
Future research should initially be restricted to a number of faculties in a predefined area.
For instance, research can be done at selected faculties in the greater University of
KwaZulu-Natal area. If the research is viable, it can be extended to more broadly defined
area, which could include a larger number of faculties such as management faculties.
I also recommend that the course must also done in high schools in South Africa as it is
the case in oversees e.g. in Canada.
5.5 Conclusion
The literature review has been found to be adequate for this project. Recommendations
for further research have been made based on previous researches.
It is my belief that the research question has been answered in this thesis to such an
extent that more students and educators will have an interest in using arcView-GIS or,even do the course in GIS. It is also my belief that the research has been ethnically done
and the findings are valid and authentic, reliable and credible.
67
List of references
Bain OB, (1998). From centrally mandated to locally demanded service: the RussianCase. Higher Education. 35:49-47
Baker, H, 1997, Education for the Spatial Information Industries, Issue 25
http://www.gisuser.com.aulGU/contentl1997/GU25/gu25 education.html
Blignault, P., McDonald, T. & Tolmie, J. The influence ofexperience, culture and
spatial visualization ability on users' attitudes and anxiety towards computer use.
Paper presented at 2000 Information Resources Management Association
International Conference, Pennsylvania State University, and 21 May 2000.
Bloom, B.S. (Ed.) (1956) Taxonomy of educational objectives: The classification of
educational goals: Handbook I, cognitive domain. New York; Toronto: Longmans,
Green.
Boyle T. (1997) Designfor multimedia learning. Prentice Hall.
Borchers, J., Deussen, 0., Klinger, A. & Knorzer, C. (1996). Layout rules for graphical
web documents. Computers & Graphics. 20,3,415-426.
Borsook, T.K. & Higginbotham-Wheat, N. (1991). Interactivity: What it is and what it
can do for computer-based instruction? Educational Technology. October, 1991,
11-17.
Braus, P, 1998.http://www.directionsmag.com/features.php?feature id=6, 15 June 2003
Briner, M, 1999, learning theories,
http://www.dean.usma.edulmath/activities/cape/Constructivism/501Ieam.htm
access on 09 June 2004
Brinkley, D. (1997). Educating the Generation Called "X". [Online] Available
http://members.aol.com/genXcoal/genXcoal.htm 24 May 2003.
Brosnan, M. & Lee, W. (1998). A cross-cultural comparison of gender differences in
computer attitudes and anxieties: the United Kingdom and Hong Kong. Computers
in Human Behaviour. 14,4,559-577.
Brown, B.L. (1997), New learning strategies for Generation X. ERIC Document No.
411414. ERIC C1earinghouse on Adult, Career, and Vocational Education,
Columbus, Ohio.
68
Bump, 1. (1999). Left vs. right side of the brain: Hypermedia and the New Puritanism.
Currents in Electronic Literacy. Fall, 2. [Online1 Available
http://www.cwrl.utexas.edu/currents/fall99/bump.html 20 January 2004.
Burrell, S. (2000). Introducing the great digital divide. The Age. [Online] Available
http://www.theage.com.au/bus/20000216/A20778-2000Feb15.html 5 May 2003.
Bruner, J. (1961). The Process of Education. Cambridge, MA: Harvard University Press.
Bruner, J. (1966). Toward a Theory ofInstruction. Cambridge, MA: Harvard University
Press.
Bruner (1972) The relevance ofeducation.
Edited by Anita Gil. Allen and Unwin. London
Bruner, J. (1973). Going Beyond the Information Given. New York: Norton.
Bruner, J. S. (1977). The process of education. Cambridge: Harvard University Press.,
Bruner,1. (1983). Child's Talk: Learning to Use Language. New York: Norton.
Bruner, J. (1986). Actual Minds, Possible Worlds.
Cambridge, MA: Harvard University Press.
Bruner, 1. (1990). Acts of Meaning. Cambridge, MA: Harvard University Press.
Chua, S.L., Chen, D. & Wong, A.F.L. (1999).
Computer anxiety and its correlates: a meta-analysis. Computers in Human
Behavior. 15,5,609-623.
Clifford, P., Friesen, S. & Jacobsen, D.M. (1998).
An expanding view of literacy: Hypermedia in the middle school.
Ed-Media and Telecom 98: Germany, June 20-25, 1998. [Online] Available
http://rocky-main.rockyview.ab.ca/bpeak/reseaJich/galileo/edmedia.html 3 January
2001.
Codrington, G. (1997). Generations:
From Silent, through Boomer and X; to Millennial. [Online] Available
http://home.pix.za/gc/gcI2/generations.htm13 February 2004.
Codrington, G. (2000). Mind the gap. Style, November 2000,34-41.
Coiro, J. (2000). Reading. How reading affects literacy.
[Online] Available http://209.52.l89.2/article.cfmlreading/30891 15 March
2004.
69
Commonwealth Education Media Centre for Asia (CEMCA),
2001 http://www.cemca.org/EMHandbook/section9.pdf 15 June 2003
Cooper, K.J. (2000). Internet at school is changing work of students--and teachers.
The Washington Post. [On1ine] Available http://www.washingtonpost.com/wp
dyn/artic1es/Al1928-2000Sep4.html 20 November 2003.
Csikszentmiha1yi, M. (1990). Flow: The psychology ofoptimal experience.
New York: Harper and Row.
Dalgamo, B. (1996). Constructivist computer assisted learning:
theory and techniques. Making New Connections: proceedings ofASCILITE '96
University of Adelaide, 127-148.
Department of Education. (2000).
National curriculumframeworkfor further education and training: Draft
document. [Pretoria: The Dept., Gov. Printer].
Dawson, M.R.W. (2004). Minds And Machines:
Connectionism And Psychological Modeling. Blackwell Publishing.
John Dewey (1938) Logic: The Theory ofInquiry, Ne\\, York: Henry Holt and Company
John Dewey (1938) Experience and Education, New York: Macmillan Company.
Dix, A. (1998). Human-computer interaction. London: Prentice Hall.
Donaldson, M. (1978) Children's Minds. Fontana: London
Doyle, C.S. (1995). Information literacy in an information society.
ERIC Digest. Emergency Librarian. 22,.4,30-32.
Dunham Academy http://www.giftedschool.org/default.htm access in 09 June 2004
Eagleton, M.B. (1999). Reading Online -
Benefits and challenges ofa student designed school website. [Online] Available
http://www.readingonline/artic1es/art.index 2 February 2003.
Foko,T, and Amory, A, (2003) Playing Games in Education: Development,
Evaluationand Use of an Assessment Tool to Measure Player Skills, Centre for
Information Technology in Higher Education (ITEd),University of KwaZulu
Natal, unpublished dissertation
Fajou, S. (n.d.) Computer anxiety.
70
[Online] Available http://www.edfac.usyd.edu.auJprojects/comped/Fajou.html
24 February 2004.
Feuerstein , R, Hoffman, M., & Miller, R (1980).
Instrumental Enrichment. Baltimore: University Park Press.
Feuerstein, Rand Minsker, Y. (1993). Mediated learning experiences:
guidelines for parents. Hadassah-Wizo-Canada Research Institute. Jerusalem.
Israel.
Gadner (2004), Spatial Intelligence http://www.ul.ie/-mearsa/9519211/ 20 August 2004
Galitz (2002) The Essential Guide to User Interface Design:,An Introduction to GUI Design Principles and Techniques, Second Edition, Wiley
Computer Publishing
Gardner-Bonneau, D. 1. (1991)
Human-computer interface considerations in the design of the Monitor and
Control Software (MCS). Proceedings of the 36th Annual Air Traffic, Control
Association Fall Conference
Gilster, P. (1997, Digital literacy. New York: Wiley.
Ginn, W.Y. (1995). Jean Piaget-
intellectual development. [Online] Available
http://129.7.160.l15/INST5931/Piaget1.html 11 December 2002.
Glaser and Strauss 1990, The Discovery ofGrounded Theory. Chocago: Aldine.
Maguire, David J., Goodchild, Michael, F. and David W.
Rhind (Hrsg. 1991): Geographical Information Systems, Principles and
Applications. Longman, Harlow, Essex, UK.
Goodchild, M., 1992. Geographical Information Science.
International Journal ofGeographical Information Systems, 6(1 ):31-46
Golledge, RG., 1987. "Environmental cognition", in D. Stokols and 1. Altman,
editors, Handbook ofenvironmental psychology. Wiley, New York, 131-174.
Reviews 25 years of research in geography, psychology, and related disciplines.
Hackbarth, S. (1993). The Educational Technology handbook:
A comprehensive guide. New York: Educational Technology Publications.,Hopson, M. H. (1998).
71
Effects ofa technology enriched learning environment on student development of
higher order thinking skills. Doctoral dissertation, University ofNorth Texas,,Denton. [Online] Available
http://129.120.113.30/research/dissert/hopson/abstract.htm10 February 2002.
Howarth, M. (1997). Visual elements and container metaphors for multi-media.
British Journal ofEducational Technology. 28,2, 125-133.
Howe, N. & Jackson, R. (1998).
Facing facts alert: Here comes the Millennial Generation. Concord Coalition. 4,
8. [Online] Available
http://www.concordcoalition.org/facing facts/alert v4 n8.html 25 May 2002.
Hugo, J, 1996, revised July 2000,
Visual Literacy and software design, http://www.chi
sa.org.za/articles/vislit2.htm#Layout 13 February 2003
Johnson, D, (2000).
Learning and Teaching Information Technology
Computer Skills in Context, http://www.libraryinstruction.comlinfo-tech.html 20
June 2004
Kalata, P. (1996). Generational clash in the Academy:
Whose culture is it anyway? ERIC Document No. 397874. ERIC Clearinghouse
on Adult, Career, and Vocational Education, Columbus, Ohio.
Korte, George. 1996. "Weighing GIS Benefits with Financial Analysis
." Government Finance Review, October, p. 49-52.(and also in GIS World, July
1996, p. 48-52)
Koutnik, Mike. 1996. "The Benefits of GIS in Local Government:
Examples From ESRI's User Community." Environmental Systems Research
Institute, Inc. (Unpublished)
Landis (1993), GIS Capabilities, Uses, and Organizational Issues.
" Profitingfrom a Geographic Information System. Gilbert Castle, Ill, editor.
GIS World Publications.
Lankard, RA. (1995). Career development in Generation.x; Myths and realities.
72
ERIC Document No. 388801. ERIC Clearinghouse on Adult, Career, and
Vocational Education, Columbus, Ohio.
Ledbetter, M., Carder Hunt and Don Anderson. 1997.
"Blueprints for a Citywide GIS: Scottsdale's Award-Winning System Provides a
Profitable Example." GIS World, November, 62-64.
Larry, L, (1999), Constantine, Lucy A.D, Lockwood. ,
Leutner, D. (1993). Guided discovery learning with computer-based simulation games:
effects of adaptive and non-adaptive instructional support. Learning and
Instruction, 3, 113-132.
Vygotsky, (1971), The Psychology ofArt. Cambridge MA: MIT.
Vygotsky, (1987). The Collected Works. Problems oJGeneral Psychology. vol1. New
York: Plenum Caity's qPress.
Vygotsky, (1993), The Collected Works. Fundamentals oJDeJectology. vol2. New York:
Plenum Press.
Liteck, Charles R. 1981. "Intangibles in CostlBenefit Analysis." Journal oJSystems
Management, Vol. 32, No. 2, 15-17.
Leland, c.H., & Harste, lC. (1994). Multiple ways of knowing:
Curriculum in a new key. Language Arts, 71, 337-344. In Betts, J.D. (2000).
Funds of knowledge: Adolescent contributions. AERA Annual Meeting [Online]
Available http://www.u.arizona.edu/-bettsj/MAECfok.htm 5 January 2002.
Lemke, J.L. (1992). Intertextuality and educational research.
Linguistics and Education, 4 (3/4), 257-267. In Eagleton, M.B. (1999). Reading
Online - Benefits and challenges of a student designed school website. [Online]
Available http://www.readingonline/articles/art.index 2 January 2002.
Leu, D.J. (1997). Exploring literacy on the Internet:
uestion: Literacy as deixis on the Internet. The. Reading Teacher. 51,1,62-67.
Lincoln and Guba 1985, Naturalistic Inquiry. Beverly Hills, CA: Sage.
Lynne Fowler, Jocelyn Armarego, 2001, Maurice Allen School of Engineering Murdoch
University Murdoch WA 6150 access in 30 august 2004
http://wwweng.murdoch.edu.au/-Iynne/cse200 l.pdf
73
Mark, D.M., and AD. Frank, editors, 1991. Cognitive and linguistic aspects of
geographic space. Kluwer Academic Publishers, Dordrecht, The Netherlands.
Contains many chapters examining cognitive and linguistic issues in GIS from a
variety of disciplines.
Mayer, R.E. & Gallini, J.K. (1990). When is an illustration worth ten thousand words?
Journal ofEducational Psychology. 82,4, 715-726.
Mayer, R.E. (1999). Multimedia aids to problem-solving transfer. International Journal
ofEducational Research. 31, 611-623.
McCluskey, A (1996). Learning in the information society. Connected. [Online]
Available http://www.connected.org/learnllearning.html 6 January 2002.
Medical Research Centre (MRC), 2001http://www.mrc.ac.za/services/giscentre.htm
Miles and Huberman 1994) Qualitative Data Analysis: An Expanded Sourcebook.
Thousand Oaks, CA: Sage.
Miller, G.A (1956). The magical number seven, plus or minus two: Some limits on our
capacity for processing information. Psychological Review, 63, 81-97.
Montgomery, K.C. (1996). Children in the Digital Age. The American Prospect. 27,
1996. [Online] Available http://www.reseau
medias.ca/eng/issues/priv/resource/digkids.htm 25 April 2002.
Montello, D.R., and S.M. Freundschuh, 1995. "Sources of spatial knowledge and their
implications for GIS: An introduction", Geographical Systems 2: 169-176.
Concise overview of several perceptual and cognitive issues relevant to GIS.
Murrell, 2001 Interactive Instructional Material Research and Resources,
http://www.und.ac.za/users/murrell/classrm/theoryed.html 14 June 2003
NetMBAcom, (2005) Box Plots, http://www.netmba.com/statistics/plot/box/ accessed on
8 March 2005
News24.com (2000). E-mail: the demise of grammar. News24.com. [Online]
Available http://www.24.comlNews24/Technology/Infotech/O.1113.2-13
45_905873,00.html 8 October 2002.
Nintendo Generation: Reinventing schools: The technology is now. [n.d.] [Online]
Available http://www.nap.edu/html/techgaplNintendo.html 27 April 2003.,
Norman, D. (1988). The Psychology ofEveryday Things. Basic Books.
74

Oxford Modern English dictionary. (1995). London: Oxford University Press.
Papert, S. (1993). The children's machine: Rethinking in the age ofthe computer. New
York: Basic Books.
Osondo, J (1999) Visualisation Skills, Unpublished dissertation
Perkin's (1985)
Piaget, J. (1962) Comments on Vygotsky's critical remarks concerning 'The
Language and Thought ofthe Child', and 'Judgment and Reasoning in the
Child' (Cambridge Massachusetts, The M.I.T.).
Pea, Roy D. 1985. Beyond amplification: Using the computer to reorganize
mental functioning. Educational Psychologist, 20(4): 167-82.
Piolat, A., Roussey, 1. & Thunn, O. (1997). Effects of screen presentation on text
reading and revising. International Journal ofl!uman-Computer Studies. 47,
565-589.
Pirie, M. & Worcester, R.M. (1997). The Millennial Generation. Book review of ...
[Online] Available http://www.adamsmith.org.uk/policy/publications/the-liberal
outlook.htm 25 June 2002.
Plug, C., Meyer, W'F., Louw, D.A. & Gouws, L.A. 1991. Psigologiewoordeboek
Johannesburg: Lexicon.
Preece, J,1994, Human-Computer Interaction, Englend
Raymond (1994) Directions Magazine
http://www.directionsmag.com/features.asp?feature id=6 25 June 2003
RDBMS) (ESRI, 2004). Available http://www.esri.com/index.html accessed on 25 June
2004
Reeves, T.C. (1994). Systematic Evaluation Procedures for Interactive multimedia for
Education and Training. In Reisman, S (Ed) Multimedia Computing: Preparing
for the 21st century. Harrisburg, PA: Idea Group.
Reeves, T.C. (1997). Evaluation Tools Available online:
http://mime1.marc.gatech.edu/MM Tools/evaluation.htm124 April 2004
Reeves, 1998, The I impact of Media and Technology in Schools, A Research Report
prepared for The Brtelsmann Foundation,
75
Reeves, T.C. & Hedberg, J.G. (2001) Evaluating interactive learning systems. Athens
GA: University of Georgia, College of Education.
Reinking, D. (n.d.). Electronic literacy. [Online] Available
http://curry.edschool.virginia.edu/go/clic/nrrc/reinking.html 3 January 2002.
Riddle, E,M, Dabbagh, N, 1999,
http://.chd.gse.gmu.edu/immersion/knowledgebase/theoriests/constructivism/vygo,tsky.htm 13 April 2004
Rieber, L.P. (1995). A Historical review ofVisualisation in human cognition
Educational Technology, Research and Development.
Rosario, J. (n.d.). Compiling a self-study guide. Durban: Marist Brother's College.
Rose, C. & Nicholl, MJ. (1997). Accelerated learningfor the 21st century: The 6-step
plan to unlock your M A S T ER mind. London: Judy Piatkus.
Rosen, L.D. & Weil, M.M. (1995). Adult and teenage use of consumer, business, and
entertainment technology: Potholes on the information superhighway? Journal
ofConsumer Affairs. 29, 1,55-84.
Ross, T.W. (1993). Bloom and hypertext: Parallel taxonomies? ED-TECH Review,
Autumn/Winter, 1993, 11-16.
Rushkoff, D. (1999). Playing the future: What we can learn from digital kids. New
York: Riverhead Books.
Saloman, 1993, Instructional Philosophy Lkearning,
http://www.biologylessons.sdsu.edu/ta/philosophy/learning.html accessed in
28July 2003
Salomon, G. (1997). Novel constructivist learning environments and novel technologies:
Some issues to be concerned with. Keynote address at EARL! Meeting, Athens,
1997. [Online] Available
http://cyber.law.harvard.edu/cybercon98/wcm/sal_article.html 30 September
1999.
Schenk, D. (1997). Data smog: Surviving the information glut. London: Abacus.
Simms, R. (1998). !nteractivity: Aforgotten art? [Online] Available
http://itechl.coe.uga.edu/itforum/paperl O/paperl O.html 27 November 2003.
Steyn-Ross and D.A. Steyn-Ross, 9th Australasian Remote Sensing and Photogrammetry
76
Conference, Sydney, 20 - 24 July, 1998.
Suchman, L. (1987) Plans and situated actions. Cambridge University PressSunday
Times, (1996). Our Students finish bottom of the class in Mathematics and
Science. November 24, 1996.
Sutcliffe, AG. (1995). Human-computer interface design. London: Macmillan.
Steven B. (2004) Creating Environments that support Teaching and Learning using GIS
http://www. COGNITIVE GIS.htm Access in 2003-august-27
Strauss, AL & Corbin, J. (1990), Basics ofQualitative Research: Grounded theory
procedures and techniques. Newbury Park: Sage
Tapscott, D. (1998). Growing up digital: The rise ofthe Net Generation. New York:
McGraw-Hill.
Thomas, P.V., & Higbee, J.L. (1996). Enhancing mathematics achievement through
collaborative problem solving. The Learning Assistance Review, 1 (1),38-46.
Thomson, K. (1999). Millennial rising Generations: A Missoulian celebrate 2000
special section. [Online] Available http://www.missoulian.com/gen/mill1.htm
25 June 2003
TIP, 1994, http://tip.psychology.org/theories.html access in 2003-august-27
Topping, K.J. (1997). Reading Online - International Perspectives: Electronic literacy
in school and home: A look into the future. [Online] Available
http://www.readingonline.org/internationaVfuture/ 3 January 2004.,Tversky, B., 1992. "Distortions in cognitive maps", Geoforum 23:131-138. Readable and
concise review of research on the structure of cognitive maps, patterns of
distortions, etc.
Tseng, H., Tiplady, B., Macleod, H.A & Wright, P. (1998). Computer anxiety: a
comparison of pen-based personal digital assistants, conventional computer and
paper assessment of mood and performance. British Journal ofPsychology. 89,
4,599.
Tuman, M. (1992). Word Perfect: Literacy in the computer age. London: Falmer. In
Vaughan, T. (1998). Multimedia: Making it work. New York: McGraw-Hill.
(Vygotsky, 1930), Mind and Society, Harvard University Press)
Walker, R. ed(1993) AGI Standards Committee GIS D1ctionary. Associationfor
77

Geographic Information
Weil, M.W. & Rosen, L.D. (1995). The psychological impact of technology from a
global perspective: A study of technological sophistication and technophobia in
university students from twenty-three countries. Computers in Human Behavior.
11, 1,95-133.
Wilhelm, J.D. (1995). Creating the missing links: Student designed learning on
hypermedia. English Journal. 84, 6, 34-40. In Eagleton, M.B. (1999). Reading
Online - Benefits and challenges of a student designed school website. [Online]
Available http://www.readingonline/articles/art.index 2 January 2004.
Wurman, RS. (1989). Information anxiety. New York: Doubleday.
Winn, W., Snyder, D. (1996). Cognitive perspectives in psychology. Jonassen, 112-142.
Wishart, J. & Blease, D. (1999). Theories underlying perceived changes in teaching and
learning after installing a computer network in a secondary school. British
Journal ofEducational Technology. 30, 1, 1999,25-41.
World Health Organization Report (1999). Health Systems: Improving performance.
Geneva: World Health Organization. 1999.
Yeo, S., Loss, R, Zadnik, M., Harrison, A. & Treagust, D. (1998). Interactive
multimedia: What students really learn? In Black, B. & Stanley, N. (Eds),
Teaching and learning in changing times, 341-347. Proceedings of the 7th
Annual Teaching Learning Forum, The University of Westem Australia, February
1998. Perth, UWA. TL Forum 1998. [Online] Available
http://cleo.murdoch.edu.au/asu/pubs/tf\lf/tlf98/yeo.html 5 February 2004.
Zeffane, R & Cheek, B. (1995). The differential use of written, computer-based and
verbal information in an organizational context~ An empirical exploration.
Information & Management. 28,2, 107-121.
ESRI Homepage[Online] Available http://www.esri.com/index.html accessed on 25 June
2003
.,.
78

79

Appendix 1. Modified Questionnaire for Human Computer Interaction and
Cognitive Development Questionnaire
Please circle the numbers that most appropriately reflect your impressions about using
ArcView-GIS
PART 1: Human Computer Interaction
Statement Disagree Agree1. The software always keep users informed about what
is going on, through appropriate feedback within1 2 3 4 5
reasonable time. ,
2. The language used to label screen information (Le.1 2 3 4 5
user interface) was simple and familiar to the user.3. The software allows users to easily correct, or recover
1 2 3 4 5from, mistakes or errors.
4. The same, or similar, steps are used to performed1 2 3 4 5
related tasks.5. It is easy to make mistakes. 1 2 3 4 56. Objects, actions and options were always visible. 1 2 3 4 57. There were keyboard shortcuts in the arcView-GIS
1 2 3 4 5software
8. The software did not offer more than is required forthe user to perform a task, but it is aesthetically
1 2 3 4 5pleasing.
9. Error messages are useful.,
1 2 3 4 510. It is easy to find, or search for, information provided
1 2 3 4 5by ArcView-GIS
PART 2: COGNITIVE DEVELOPMENT
Statement Disagree Agree1. ArcView-GIS helped me to develop better decisions making
skills which helped me solve GIS problems more 1 2 3 4 5quickly.
2. ArcView-GIS helped me to develop my data presenting skills 1 2 3 4 53. Working with ArcView-GIS allowed me to create,
query, map, and analyze spatial data easily. 1 2 3 4 5
4. Working with ArcView-GIS improved myvisualization and spatial reasoning skills. I 2 3 4 5
5. Working with ArcView-GIS improved my analytical 1 2 3 4 5
80

solving problem skills.6. ArcView-GIS helped me to gain a deeper understanding of
1 2 3 4 5geographical and environmental knowledge.7. ArcView-GIS helped me understand spatial data and the
relationships between spatial, location and/or 1 2 3 4 5geographical information.
8. ArcView-GIS helped me understand that spatial data can berepresented as polygons, lines and points (raster and 1 2 3 4 5vector data).
9. ArcView-GIS helped me understand that the earth is neitherflat nor round, but is curved 1 2 3 4 5
10. ArcView-GIS helped me to better understand concepts1 2 3 4 5
presented in the GIS course.11. Experience with ArcView-GIS has changed the way I 1 2 3 4 5
perceived and interpreted maps.12. Experience with ArcView-GIS made me change the 1 2 3 4 5
way I viewed social and environmental issues.13. Using ArcView-GIS was a valuable learning 1 2 3 4 5
experience.,
13. What is the best feature of the ArcView-GIS software?
14. How would you improve the ArcView-GIS software?
15. Please write any other comments about this GIS course on the back of this sheet.
81
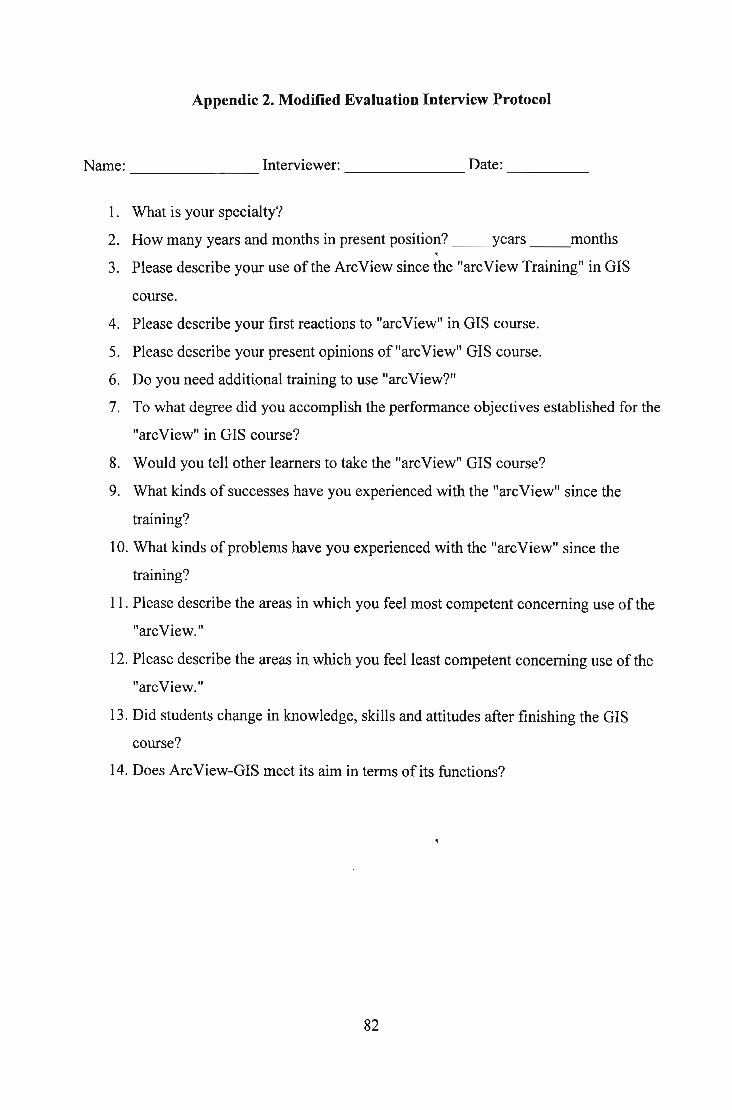
Appendic 2. Modified Evaluation Interview Protocol
Name: Interviewer: Date:-------- -------- -----
1. What is your specialty?
2. How many years and months in present position? years __months,
3. Please describe your use of the ArcView since the "arcView Training" in GIS
course.
4. Please describe your first reactions to "arcView" in GIS course.
5. Please describe your present opinions of "arcView" GIS course.
6. Do you need additional training to use "arcView?"
7. To what degree did you accomplish the performance objectives established for the
"arcView" in GIS course?
8. Would you tell other learners to take the "arcView" GIS course?
9. What kinds of successes have you experienced with the "arcView" since the
training?
1O. What kinds of problems have you experienced with the "arcView" since the
training?
11. Please describe the areas in which you feel most competent concerning use of the
"arcView."
12. Please describe the areas in which you feel least competent concerning use of the
"arcView."
13. Did students change in knowledge, skills and attitudes after finishing the GIS
course?
14. Does ArcView-GIS meet its aim in terms of its functions?
82
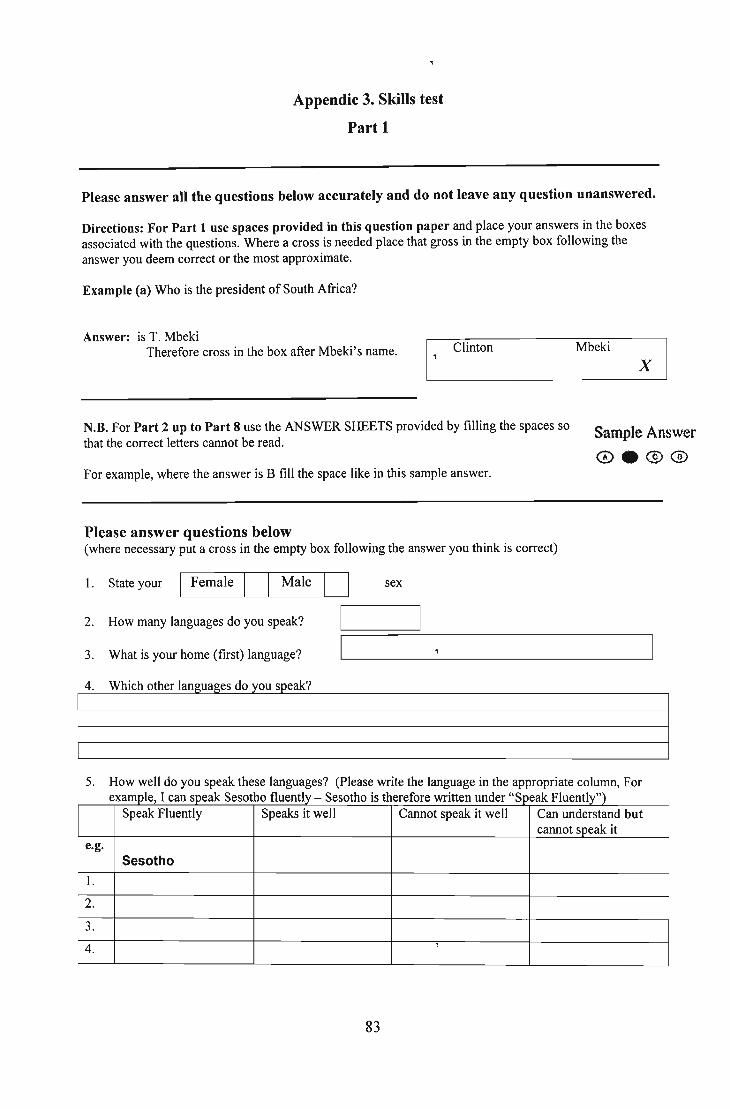
Appendic 3. Skills test
Part 1
Please answer all the questions below accurately and do not leave any question unanswered.
Directions: For Part 1 use spaces provided in this question paper and place your answers in the boxesassociated with the questions. Where a cross is needed place that gross in the empty box following theanswer you deem correct or the most approximate.
Example (a) Who is the president of South Africa?
Answer: is T. MbekiTherefore cross in the box after Mbeki's name. I Clinton D Mbeki n
,--'------' ~~
N.B. For Part 2 up to Part 8 use the ANSWER SHEETS provided by filling the spaces sothat the correct letters cannot be read.
For example, where the answer is B fill the space like in this sample answer.
Sample Answer
0e@>@
Please answer questions below(where necessary put a cross in the empty box following the answer you think is correct)
sex1. State your I Female D Male
2. How many languages do you speak?
3. What is your home (first) language?
DI==========~ --1 ---
4. Which other languages do you speak?I------------.j5. How well do you speak these languages? (Please write the language in the appropriate column, For
Iexample, I can speak Sesotho fluently - Sesotho is therefore written under "Speak Fluently")Speak Fluently Speaks it well Cannot speak it well Can understand but
cannot speak ite.g.
Sesotho
1.
2.
3.
4.,
83
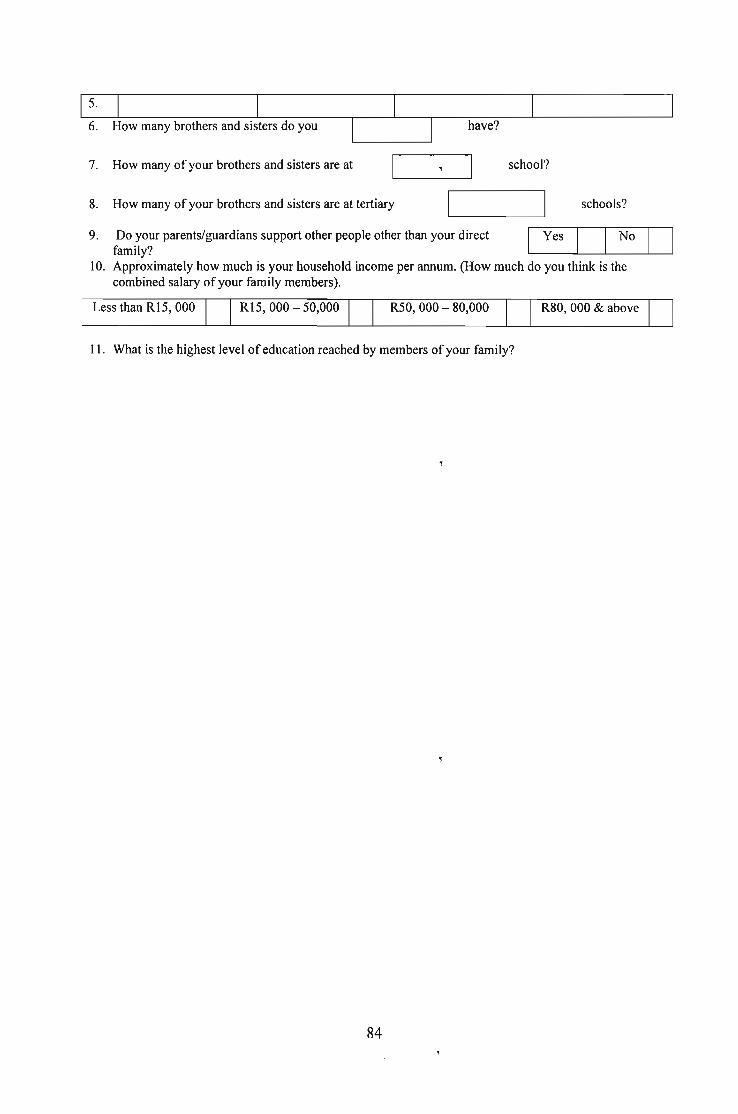
5.
6. How many brothers and sisters do you
7. How many of your brothers and sisters are at
have?
school?
8. How many of your brothers and sisters are at tertiary schools?
Yes D No D'----
Do your parents/guardians support other people other than your directfamily?
10. Approximately how much is your household income per annum. (How much do you think is thecombined salary of your family members).
9.
Less than R15, 000 R15, 000 - 50,000 R50, 000 - 80,000 R80, 000 & above
11. What is the highest level of education reached by members of your family?
84
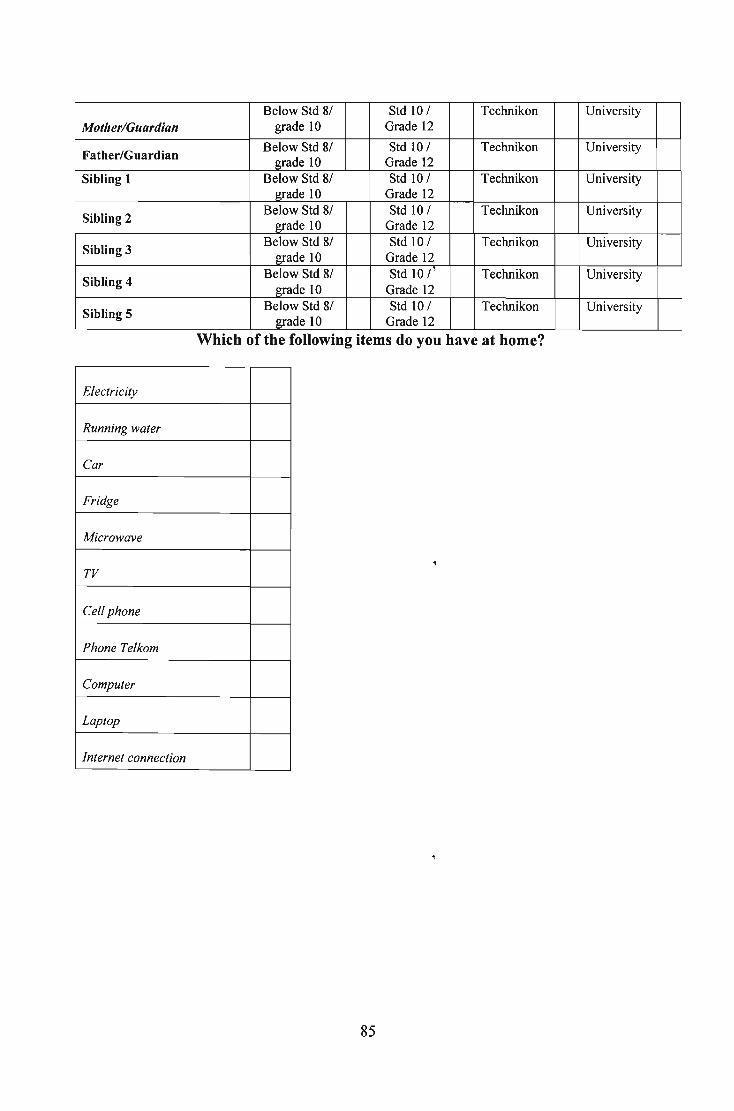
Below Std 8/ Std 10 / Technikon UniversityMother/Guardian grade 10 Grade 12
Father/GuardianBelow Std 8/ Std 10/ Technikon University
grade 10 Grade 12Sibling 1 Below Std 8/ Std 10/ Technikon University
grade 10 Grade 12
Sibling 2Below Std 8/ Std 10 / Technikon University
grade 10 Grade 12
Sibling 3Below Std 8/ Std 10 / Technikon University
grade 10 Grade 12
Sibling 4Below Std 8/ Std 10/ Technikon University
grade 10 Grade 12
Sibling 5Below Std 8/ Std 10/ Technikon University
grade 10 Grade 12
Which of the following items do you have at home?
Electricity
Running water
Car
Fridge
Microwave
TV
Cell phone
Phone Telkom
Computer
Laptop
Internet connection
85
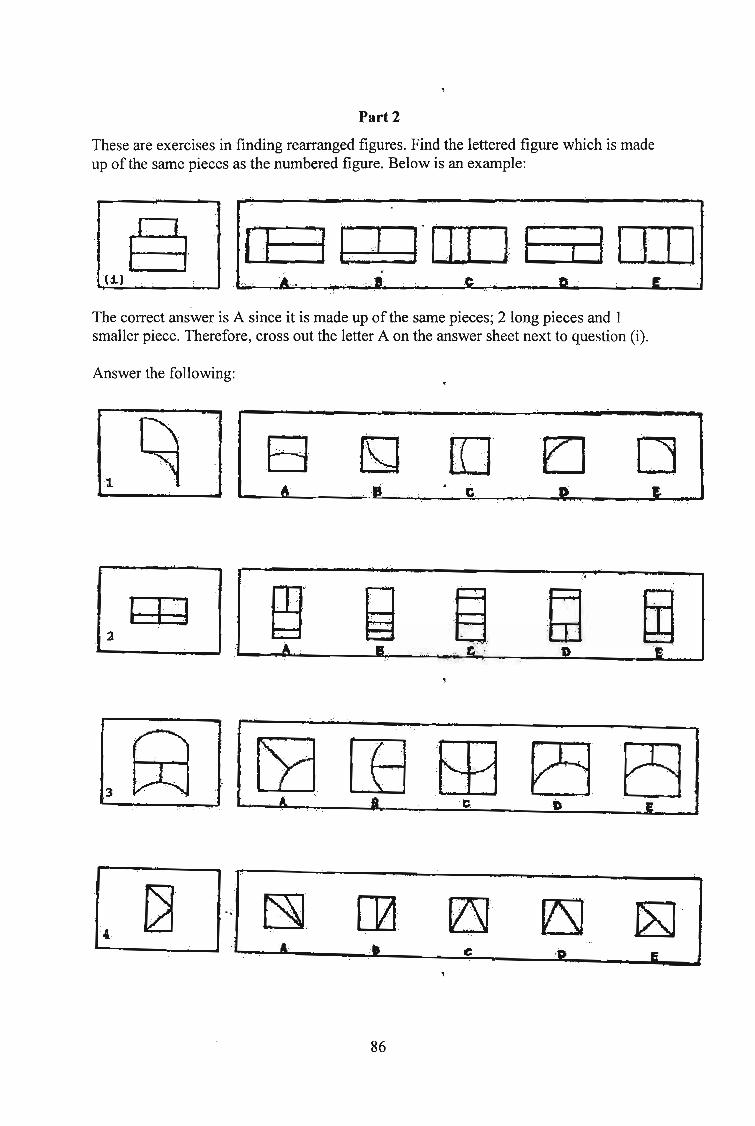
Part 2
These are exercises in finding rearranged figures. Find the lettered figure which is madeup of the same pieces as the numbered figure. Below is an example:
.§~,,'. ' ;.
:~. .
(J.;) ."
IE I t-rrfTM Fi3 DJJ".0: ":b=::==:I LLLJ =::m: __..'
The correct answer is A since it is made up of the same pieces; 2 long pieces and 1smaller piece. Therefore, cross out the letter A on the answer sheet next to question (i).
Answer the following:
.~.~
r:::l.C]>.
~.... ,::
",
. ,
';A.:;:
"'..;'.....(." :; ..'-.".
f:3.,tj, i~':,'
A••~>...'
, "j,
,At:d
'.\\.
0 ·'.' .
ffi;~: .
.~.,., "
",
.,
:III
86
~."':.)' :'. " .. '.
" ,,' ,~-<
, .,"
'~.'.. '."/. ~ .
, '.
;. ,I •
iD.

.-----,. .....---- .._.--------..,
I~ ,~' fIt .~ ~ ~6.' . A". '8" ·c .. I) . '1[,'.
~@, ~ eB ,~ ~ I81~ .... . ; D.. ~ C, .. .r:.
-~ .......
, rh frA, ~D ~ lIJ-,,a~ ~, "., , ,'e·' ,>D" LJ?J
". . ' .
,.
,. . "
'. ~. . . ."g., " fi): ~'.~/ .. (!3 (fr, ' ..
9 ...' . . <. . .. ' '. '.. .' .
• A..., ~. b - .~
87

Part 3
Each page of the test is divided into two by a heavy black line. Above the line there arefive different sets of blocks, lettered A,B,C,D and E. Below the line are different sets ofblocks, but viewed from other angles. The drawings below the line are the test questions.Study each question carefully and decide which one of the five drawings above the line,is a drawing of the same set of blocks. There is only one correct answer for eachquestion.
Question (ii) below is an example. B is a drawing of the same set of blocks but viewedfrom another angle. Therefore, cross out letter B on the answer sheet next to number (ii).
Answer from question no. 10 to no. 23
88

a b
It
d
10
1'2
W''..'' .. . '.
. ,". ,.' ".".,
" , ,~.
89
14
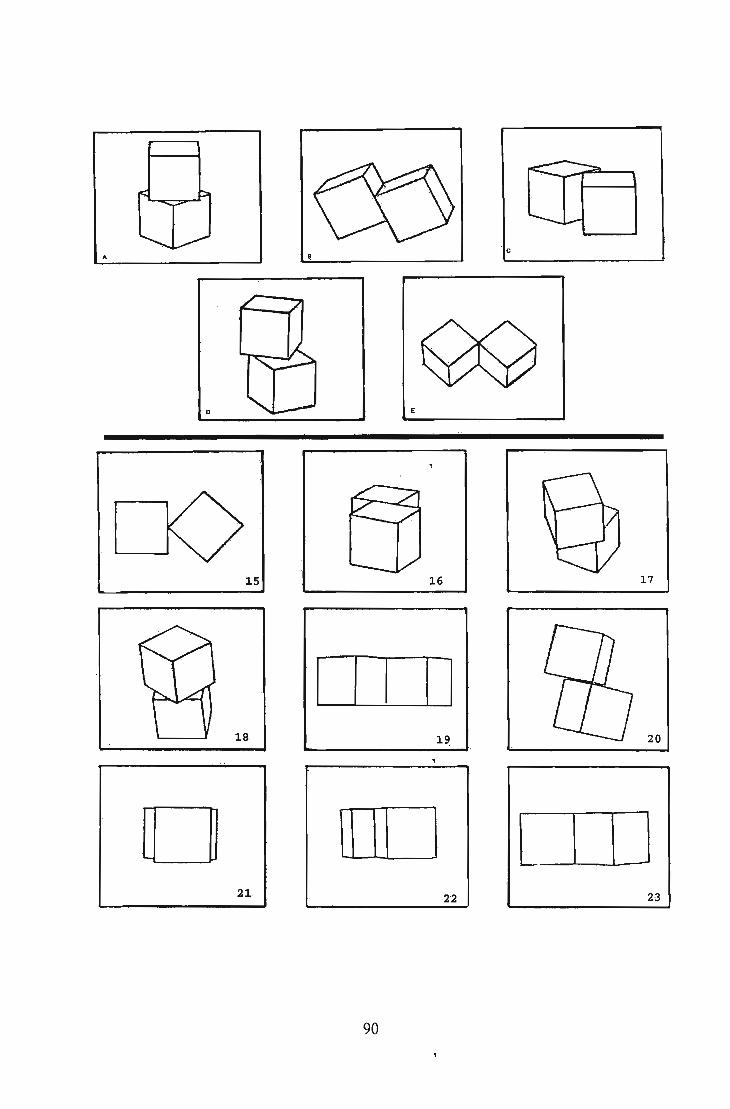
I ,....I
I I
JI
IDJITJD21
lB
o
90
Part 4
These are exercises in finding objects made from pieces of metal or cardboard. In theexample below, on the left is a drawing which represents a flat piece of metal. The dottedlines indicate where the metal is to be bent. On the right are drawings of four objects. Ineach exercise, only one object can be made by bending the metal piece. Therefore, in theexample (iii) cross out A on the answer sheet next to number (iii).
For example (Hi)
91
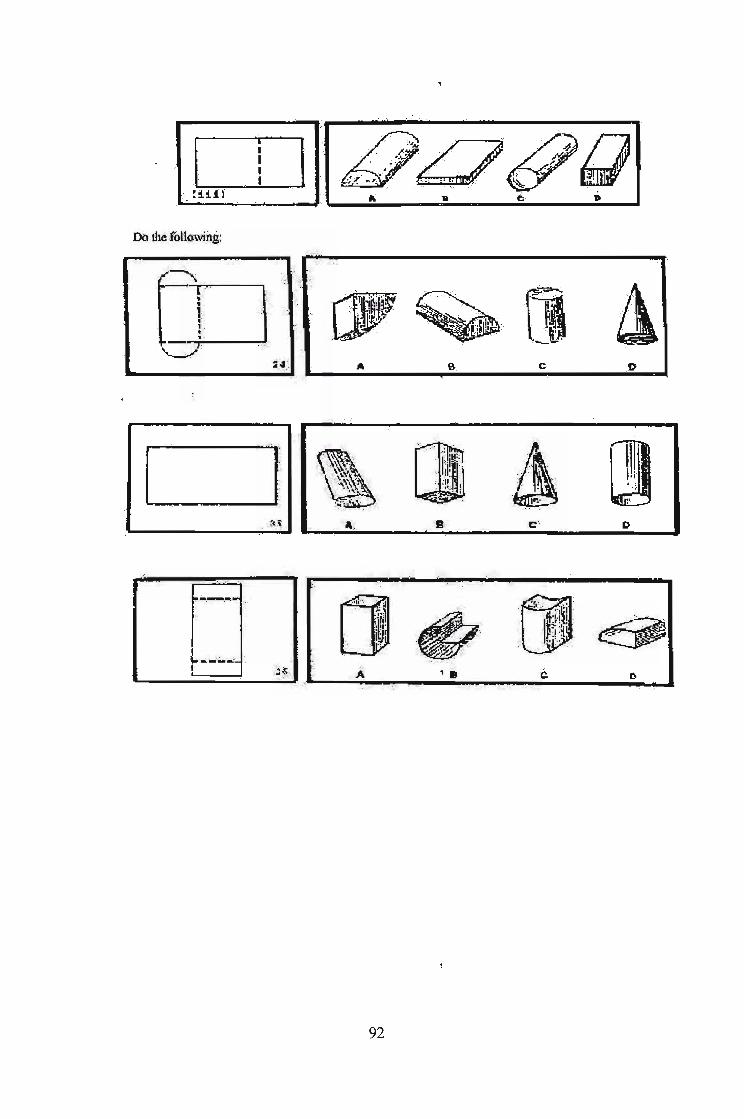
." -.\ '
.'....;. ',. ...;,
B, "C,
t1"< ~.. ./ '<~ ..
~:: :<< ,'.
A. '.
... V,,
>
[ f t\ [J'i' ",i'; ,: . !., '~ .< ,~ ....:.
'~ • <•• I~~~ , ' ':,.'.". "
, ,:(,~ " ,,';. 's,: ~" I)
92

~~i :~,.,,,
" ....',
EjI':' '",' "-'.' 'A;"· . ..(.
".'.'.' '.;....'.'...~ I ">;, ." .-,', . ,":'
","'.. '.,
,. ".> _ r
'j.;D "~I
'E!!.
{~.., ~.
93
QJ.: .... "~... J~"',' ~ .,,". j>-'-. '",- . ",'
"'" "'~ h ':
',' .</
11
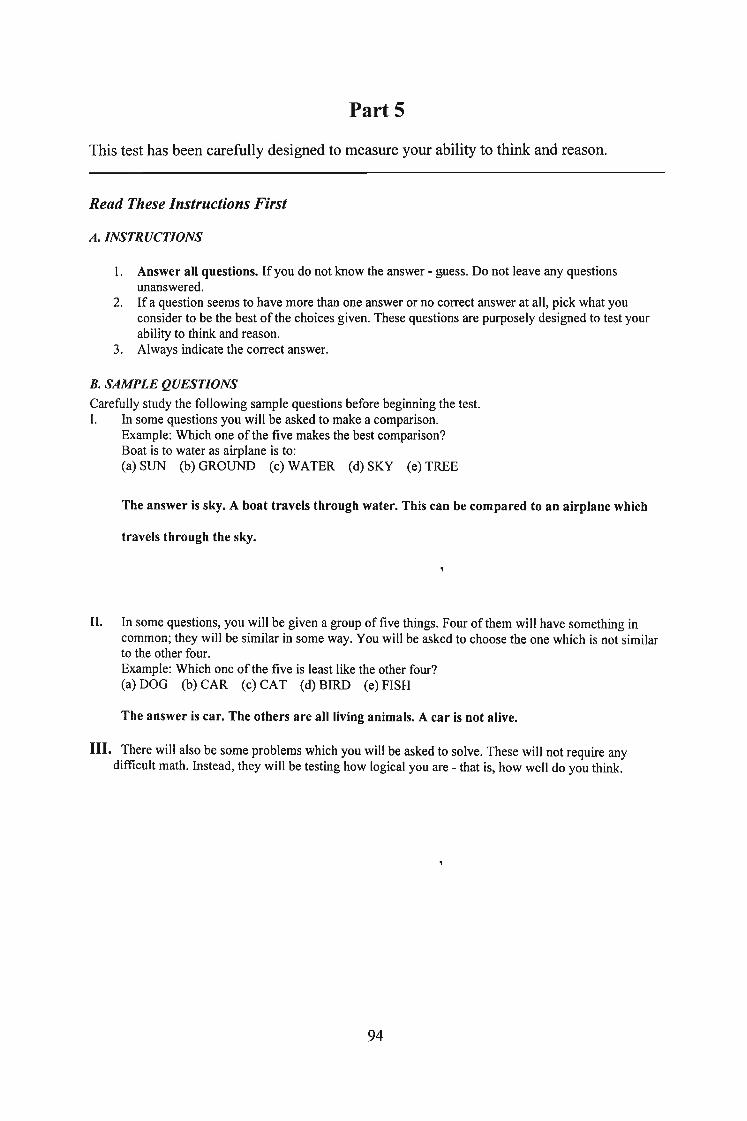
Part 5
This test has been carefully designed to measure your ability to think and reason.
Read These Instructions First
A. INSTRUCTIONS
1. Answer all questions. If you do not know the answer - guess. Do not leave any questionsunanswered.
2. If a question seems to have more than one answer or no correct answer at all, pick what youconsider to be the best of the choices given. These questions are purposely designed to test yourability to think and reason.
3. Always indicate the correct answer.
B. SAMPLE QUESTIONS
Carefully study the following sample questions before beginning the test.I. In some questions you will be asked to make a comparison.
Example: Which one of the five makes the best comparison?Boat is to water as airplane is to:(a) SUN (b) GROUND (c) WATER (d) SKY (e) TREE
The answer is sky. A boat travels through water. This can be compared to an airplane which
travels through the sky.
11. In some questions, you will be given a group of five things. Four of them will have something incommon; they will be similar in some way. You will be asked to choose the one which is not similarto the other four.Example: Which one of the five is least like the other four?(a) DOG (b) CAR (c) CAT (d) BIRD (e) FISH
The answer is car. The others are all living animals. A car is not alive.
Ill. There will also be some problems which you will be asked to solve. These will not require anydifficult math. Instead, they will be testing how logical you are - that is, how well do you think.
94
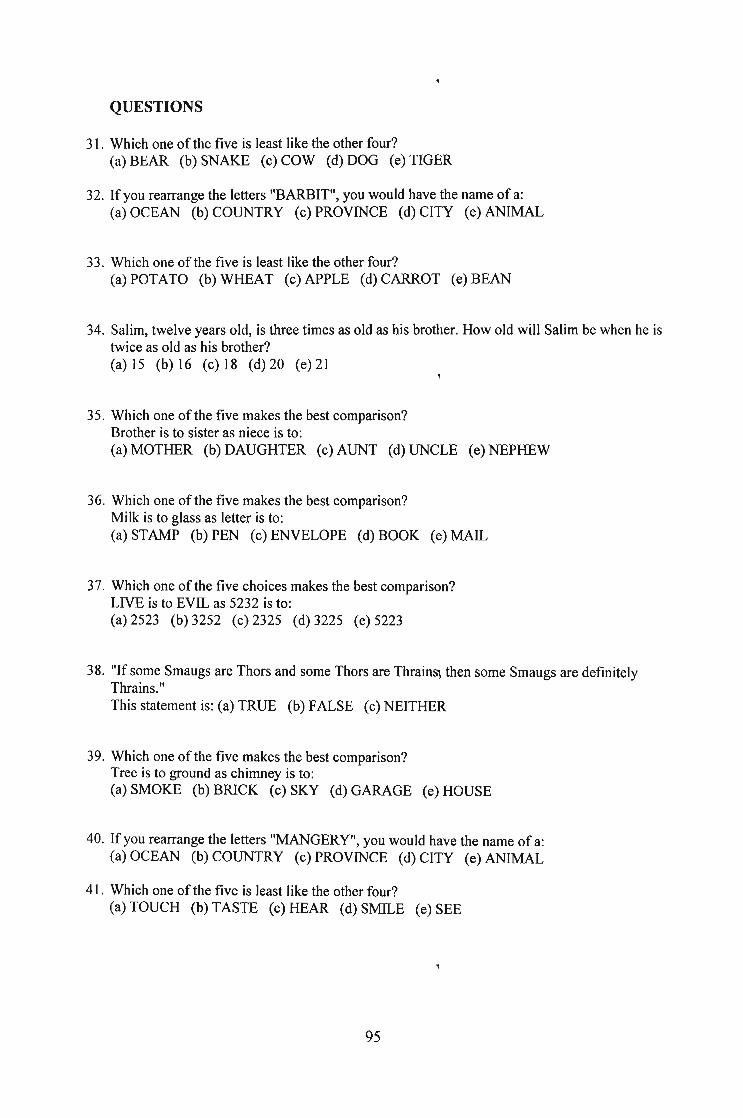
QUESTIONS
31. Which one of the five is least like the other four?(a) BEAR (b) SNAKE (c) COW (d) DOG (e) TIGER
32. If you rearrange the letters "BARBIT", you would have the name of a:(a) OCEAN (b) COUNTRY (c) PROVINCE (d) CITY (e) ANIMAL
33. Which one of the five is least like the other four?(a) POTATO (b) WHEAT (c) APPLE (d) CARROT (e) BEAN
34. Salim, twelve years old, is three times as old as his brother. How old will Salim be when he istwice as old as his brother?(a) 15 (b) 16 (c) 18 (d) 20 (e) 21
35. Which one of the five makes the best comparison?Brother is to sister as niece is to:(a) MOTHER (b) DAUGHTER (c) AUNT (d) UNCLE (e) NEPHEW
36. Which one of the five makes the best comparison?Milk is to glass as letter is to:(a) STAMP (b) PEN (c) ENVELOPE (d) BOOK (e) MAIL
37. Which one of the five choices makes the best comparison?LIVE is to EVIL as 5232 is to:(a) 2523 (b)3252 (c) 2325 (d) 3225 (e) 5223
38. "If some Smaugs are Thors and some Thors are ThrainSj then some Smaugs are definitelyThrains."This statement is: (a) TRUE (b) FALSE (c) NEITHER
39. Which one ofthe five makes the best comparison?Tree is to ground as chimney is to:(a) SMOKE (b) BRICK (c) SKY (d) GARAGE (e) HOUSE
40. If you rearrange the letters "MANGERY", you would have the name of a:(a) OCEAN (b) COUNTRY (c) PROVINCE (d) CITY (e) ANIMAL
41. Which one of the five is least like the other four?(a) TOUCH (b) TASTE (c) HEAR (d) SMILE (e) SEE
95

42. Sipho is taller than Peter, and Bill is shorter than Sipho.Which of the following statements would be most accurate?(a) Bill is taller than Peter.(b) Bill is shorter than Peter.(c) Bill is as tall as Peter. ,(d) It is impossible to tell whether Bill or Peter is taller.
43. Which one the five is least like the other four?(a) STOCKING (b) DRESS (c) SHOE (d) WALLET (e) HAT
44. Which one of the five makes the best comparison?CAACCAC is to 3113313 as CACAACAC is to:(a) 13133131 (b) 13133313 (c) 31311131 (d)31311313 (e)31313113
45. If you rearrange the letters "RAPIS", you would have the name of a:(a) OCEAN (b) COUNTRY (c) PROVINCE (d) CITY (e) ANIMAL
46. "If some Bifurs are Bofurs and all Gloins are Bofurs, then some Bifurs are definitely Gloins."This statement is: (a) TRUE (b) FALSE (c) NEITHER
47. Which one of the five makes the best comparison? Water is to ice as milk is to:(a) HONEY (b) CHEESE (c) CEREAL (d) COFFEE (e) COOKIE
48. The price of an article was cut 20% for a sale. By what percent must the item be increased toagain sell the article at the original price?(a) 15% (b) 20% (c) 25% (d) 30% (e) 40%
49. Which one of the five is least like the other four?(a) BOTTLE (b) CUP (c) TUB (d) FUNNEL (e) BOWL
50. Musa had a number of cookies. After eating one, she gave half the remainder to her sister.After eating another cookie, she gave half of what was left to her brother. Musa now had onlyfive cookies left. How many cookies did she start with?,(a) 11 (b) 22 (c) 23 (d) 45 (e) 46
51. Which one of the five is least like the other four?(a) COPPER (b) IRON (c) BRASS (d) TIN (e) LEAD
52. Which one of the five makes the best comparison?Belt is to buckle as shoe is to:(a) SOCK (b) TOE (c) FOOT (d) LACE (e) SOLE
96
53. "If all Wargs are Twerps and no Twerps are Gollums, then no Gollums are definitely Wargs."This statement is: (a) TRUE (b) FALSE (c) NEITHER
54. Which one of the five makes the best comparison?Finger is to hand as leaf is to:(a) TREE (b) BRANCH (c) BLOSSOM (d) TWIG (e) BARK
55. "John's mother sent him to the store to get 9 large cans of peaches. John could only carry 2cans at a time. How many trips to the store did John have to make?,(a) 4 (b) 4'i'2 (c) 5 (d) 'i'2 (e) 6
56. Zola was both 13th highest and 13th lowest in a spelling contest.How many people were in the contest?(a) 13 (b) 25 (c) 26 (d) 27 (e) 28
57. Which one ofthe five is least like the other four?(a) HAM (b) LIVER (c) SALMON (d) PORK (e) BEEF
58. "If all Fleeps are Sloops and all Sloops are Loopies, then all Fleeps are defmitely Loopies."This statement is: (a) TRUE (b) FALSE (c) NEITHER
59. Which one ofthe five is least like the other four?(a) CM (b) KILOMETRE (c) ACRE (d) METRE (~) MILLIMETRE
60. Sipho received R0.41 change from a purchase in the supermarket.Ifhe received six coins, three of the coins had to be:(a) CENTS (b) FIVE CENTS (c) TEN-CENTS (d) TWENTY CENTS (e) FIFTY CENTS
97
Example]
Part 6
StructureThis section is designed to measure your ability to recognize language that is appropriatefor standard written English.
Directions: Questions 1-4 are incomplete sentences. Beneath each sentence you will seefour words or phrases, marked A, B, C, and D. Choose the one word or phrase that bestcompletes the sentence.
Look at the following examples:
Sample Answera:>e@@
Geysers have often been compared to volcanoes they both emit hotliquids from below the Earth's surface.A. due toB. becauseC. in spite ofD. regardless of
The sentence should read, "Geysers have often been compared to volcanoes because theyboth emit hot liquids from below the Earth's surface." Therefore, you should chooseanswer B.
ExampleII
During the early period of ocean navigation, any need forsophisticated instruments and techniques.A. so that hardlyB. where there hardly wasC. hardly wasD. there was hardly
Sample Answer
0@®.
The sentence should read, "During the early period of ocean navigation, there was hardlyany need for sophisticated instruments and techniques." Therefore, you should chooseanswerD.
98
QUESTIONS
61. Refrigerating meats the spread of bacteria.
A. retardsB. retardingC. to retardD. is retarded
62. Throughout the animal kingdom, bigger than the elephant.
A. whale is only theB. only the whale isC. is the whale onlyD. only whale is the
63. The fact money orders can usually be easily cashed has made them apopular form of payment.
A. ofB. thatC. is thatD. which is
64. The constitution of South Africa gives parliament to pass laws.
A. the powerB. has the powerC. the power isD. of the power
99
Sample Answer.(!)@@
Part 7
Written Expression
This section is designed to measure your ability to recognize language that is appropriatefor standard written English.
Directions: In questions 5-10, each sentence has four underlined words or phrases. Thefour underlined parts of the sentence are marked A, B, C, and D. Identify the oneunderlined word or phrase that must be changed in order for the sentence to be correct.
Look at the following examples:
ExanrplelGuppies are sometimes call rninbow fish be~ause
A B Cof the males' bri~tcolors.
oThe sentence should read, "Guppies are sometimes called rainbow fish because of themales' bright colours." Therefore, you should choose answer A.
Exampk 11 Sample Answer'Serving severul term in Congress. Shirley (3) • @ @
A BChisholm became an ;mponant United States
I,. . C
polUclan.D ,
The sentence should read, "Serving several terms in Congress, Shirley Chisholm becamean important United States politician." Therefore, you should choose answer B.
QUESTIONS
65. Electrical disturbances on Earth are frequently caused with storms on the surface of the sun.
A BeD66. Dr. Dart, a teacher in South Africa, identification the Taung Skull as hominid and believed it
A
represented the "missing link" between apes and humans.B
A B
67. A deficient of folic acid is rarely found in humans because the vitamin is contained in a widevariety
A B
100
c D

of foods.
68. The gopher digs with the strong claws of its two front foot and with its overhanging frontteeth.
A B c D
69. The cosmonaut and the world's second space tourist, Mark Shuttleworth, displayedexcitement about
them plans for genetic experiments in space.
A B c
D70. As two nuclei move closer together, their mutual electrostatic potential energy becomes more
large
A B c oand more positive.
101
Part 8
Reading ComprehensionThis section is designed to measure your ability to read and understand short passagessimilar in topic and style to those found in tertiary institutions.
Directions: In this section you will read a passage which is followed by a number ofquestions about it. You are to choose the one best answer, A, B, C, or D, to eachquestion.
Answer all questions about the information in a passage on the basis of what is stated orimplied in that passage.
SAMPLE PASSAGE AND QUESTIONS
The railroad was not the first institution to impose
regularity on society, or to draw attention to the
importance of precise timekeeping. For as long as
Line merchants have set out their wares at daybreak and
(5) communal festivities have been celebrated, people have
been in rough agreement with their neighbours as to the
time of day. The value of this tradition is today more
apparent than ever. Were it not for public acceptance of
a single yardstick of time, social life would be unbearably
(10) chaotic: the massive daily transfers of goods, services,
and information would proceed in fits and starts; the
very fabric of modern society would begin to unravel.
Example I Sample Ans\ver
0®e®What is the main idea of the passage?A. In modern society we must make more time for our neighbours.B. The traditions of society are timeless.C. An accepted way ofmeasuring time is essential for the smooth functioning
of society.D. D. Society judges people by the times at which they conduct certain
activities.
102
The main idea of the passage is that societies need to agree about how time is measuredin order to function smoothly. Therefore, you should choose answer C.
ExampleII
In line 7, the phrase "this tradition" refers toA. the practice of starting the business day at dawnB. friendly relations between neighbours 'C. the railroad's reliance on time schedulesD. people's agreement on the measurement of time
Sample Answer
@@@.
The phrase "this tradition" refers to the preceding clause, "people have been in roughagreement with their neighbours as to the time of day." Therefore, you should chooseanswerD.
READ PASSAGETwo young men, John and Charles, were on their way back to their homevillage of Bahati, 18 kilometres outside ofNakuru, Kenya. They begantalking about all the problems they had encountered in Nairobi since theirarrival six months before. Like so many Kenyan youth from the rural areasthey had left their village after finishing Form Four and tried to find jobs inNairobi. John got ajob washing dishes in a small restaurant. Charles was agood handy man and got occasional work as a day labourer in an outdoorgarage. It was not much but it was a start.
John and Charles joined a group of young men connected to one of themain opposition parties called "Movement for a New Kenya." Theircharismatic leader regularly spoke out against the bribery and corruption inthe government. They often participated in protest rallies. The politicalrallies were exciting and the youth volunteered a lot of their free time.Several times violence took place after the political rallies. The two youngmen enjoyed the ferment of the big city, but they didn't have enoughmoney to go to nightspots and bars regularly.
Then everything started to go wrong. One day there was a big riot indowntown Nairobi and three people were killed. The "movement's" leaderwas arrested and put in detention. The government declared him an"Enemy of the State." The two young men were dejected. Their hopes for a"New Kenya" were dashed.
103
To make matters worse, John's picture appeared in the coverage of the riotin one of the daily newspapers. When his boss heard about it, John wasimmediately fired. (6)Then their small flat was broken into and they lostmost of their belongings. After Charles had malaria three times, the garagedid not want him back. John and Charles started bumming around.
When their money finally ran out they decided to return to their village.Near Naivaisha the bus had a flat tyre and everyone had to get out. Whilewaiting by the road John and Charles struck up a conversation with oneman. They explained how they put their hopes in one of the mainopposition parties but now their leader was in detention. The "movement"was in disarray. The stranger said that he was a lawyer and asked themsome challenging questions about their commitment to bringing aboutsocial change in Kenya. The lawyer said that he wasn't taken in by some ofthe fast-talking politicians and their many promises. Bat he was committedto work for change from the grassroots up and to be a "voice of thevoiceless. "
The lawyer mentioned several important African stories and novels thatcontain a lot of wisdom for today's world. He gave the example of sharinga meal together. He said fast food restaurants in Nairobi destroyed thevalue of eating together in a relaxed family-style way and explained how ameal is perhaps the most basic and ancient symbol of friendship, love andunity. The stranger used the African proverb "relationship is in the eatingtogether" to explain how a pleasant meal can build community and trust.He talked about the human and spiritual values in sharing together. Johnand Charles followed his words very intently. Then they shared their ownviews. But when they got to Nakuru with a quick wave the man was outthe door and gone. The two youths sat amazed. Now he was gone.
QUESTIONS
71. The passage primarily discussesa) bus tripb) Kenyan politicsc) lawyerd) riots
72. The word "they" in line 2 refers toa) bus driver and the flat tyreb) tripc) John and Charlesd) Meals
73. The word "charismatic" in line 11 is closest in meaning to
104

a) insensitiveb) evilc) uninterestingd) appealing
74. According to the passage the two young men enjoyeda) buzz of the cityb) moneyc) their governmentd) girls
75. The phrase "bumming around" in line 29 is closest in meaning toa) running from one place to anotherb) sitting down and doing nothingc) singing riot songsd) sharing foot
76. The author mentions all of the following as important to change in society EXCEPTa) change taking place from grassroots level upwardb) fast talking politiciansc) representing the "voices of the voiceless"d) community sharing
77. John and Charles joined thea) church groupsb) ruling partyc) rioting groups of villagesd) one of the opposition parties
78. Which of the following best describes the political change led by the ordinary peoplea) commitment to work for change from grassroots up.b) sharing a meal togetherc) "relationship is in the eating together"d) reading several books which contain wisdom and value for human life.
79. The phrase" was out the door" is closest in meaning toa) leavingb) kicking out the doorc) opening the door very widelyd) standing outside the door.
80. Where in the passage is it illustrated that the bus had problemsa) line 18b) line 25c) line 31d) line 49
End
Thank you very much for your participation in this exercise
105