evaluation report | 201 - civicspark
TRANSCRIPT

Submitted to:CivicSparkLocal Government Commission 980 9th Street, Suite 1700 Sacramento, CA 95814
Submitted by:LPC Consulting Associates, Inc. 1451 River Park Dr., Suite 100 Sacramento, CA 95815www.lpc-associates.com
Evaluation Report | 2019
November 2019
Table of Contents
Section 1 Background & Introduction ................................................................................... 1
Section 2 Program Description & Implementation ................................................................ 2
2.1 Program Overview............................................................................................................................. 2
2.2 Program Implementation .................................................................................................................. 4
Section 3 Methodology ........................................................................................................ 5
3.1 Survey Tool and Data Collection ......................................................................................................... 5
3.2 Analysis ............................................................................................................................................... 6
Section 4 Climate Capacity Assessment Results .................................................................... 7
4.1 Knowledge Development .................................................................................................................. 7
4.2 Goal Achievement ........................................................................................................................... 10
4.3 Volunteer Engagement ................................................................................................................... 12
Section 5 Conclusion and Next Steps .................................................................................. 14
Attachment A | Climate Capacity Assessment Results by Year ............................................. 15

CivicSpark Evaluation Report 2019
LPC Consulting Associates, Inc. 1
Section 1 Background & Introduction In recent decades, climate change has become a cause for concern in communities around the world. The
effects of climate change, which include rising temperatures and extreme weather events, have started
to negatively impact people and the environment in myriad ways. The Environmental Protection Agency
(EPA) acknowledges that these changes in the planet’s climate “affect people’s health and quality of life,
including where people can live, what kinds of crops are most viable, what kinds of businesses can thrive
in certain areas, and the condition of buildings and infrastructure” (Climate Change Indicators in the
United States, 2016). It is likely that over time the harmful impacts of climate change will only broaden
and worsen if steps are not taken to counteract their effects.
In California specifically, the impact of climate change is readily apparent, with drought and severe
wildfires plaguing the state. In 2006, the California legislature enacted a set of ambitious climate change
goals aimed at reducing greenhouse gas emissions by 40 percent below 1990 levels before the year 2030.
The integrated plan proposes a multi-pronged approach to achieve this objective, employing climate
action strategies that include increasing renewable electricity production, reducing vehicle petroleum use,
and bolstering the energy efficiency of existing infrastructure.
While participation from almost all sectors of the economy is required to accomplish these sweeping
goals, a large portion of the responsibility for implementing climate action strategies falls to local
government agencies. At the local level, these agencies are on the front line of planning, researching, and
implementing programs geared toward combating climate change. However, many agencies are not
equipped with the tools and resources necessary to effectively carry out these efforts. For instance, local
governments are often without dedicated staffing, data, formal plans, or mechanisms to track progress
on initiatives. While the statewide climate goals are integral for preserving California’s ecological and
economic systems, the achievement of these goals will not be possible without local governments that
have the capacity required to mitigate climate change at the community level.
To address these capacity issues, the CivicSpark program is designed to bolster the ability of local
governments across the State to effectively respond to climate change. As a Governor’s Initiative
AmeriCorps program administered by the Local Government Commission (LGC), CivicSpark engages skilled
AmeriCorps members to work collaboratively with government agencies on projects to advance local
climate change initiatives. The program model leverages the strengths and experience of AmeriCorps
members to accelerate climate action by providing agencies with: (1) tangible products with actionable
information and resources, (2) volunteer engagement support, and (3) tools and methods to integrate
climate action into new and existing local programs. CivicSpark also aims to generate a more effective and
sustainable statewide response to climate change through the development of regional networks and
resource sharing platforms that enable local governments to align efforts and learn from one another.
Over time, it is the hope that the technical assistance and resources CivicSpark offers to these agencies
will result in healthier and more resilient communities across the state.
To examine outcomes related to CivicSpark’s intervention design, LGC contracted with LPC Consulting
Associates, Inc. (LPC) to analyze performance data from the Climate Capacity Assessment survey, which
measures changes in capacity among local government agencies before and after program participation.
This report presents a summary of Climate Capacity Assessment survey results from the first three years
of implementation.

CivicSpark Evaluation Report 2019
LPC Consulting Associates, Inc. 2
Section 2 Program Description & Implementation The Local Government Commission launched the CivicSpark program in 2014 to address the pressing need
for a concerted response to climate change throughout the state of California. To this end, CivicSpark
engages AmeriCorps members to work with local governments in order to build agencies’ capacity to
effectively implement climate action projects. The following sections describe key elements of the
program, and a snapshot of implementation during the first three program years.
2.1 Program Overview
Theory of Change Each year, CivicSpark places 50 Climate Action Members with local government agencies in need of
technical assistance and support on climate action projects. During the 11-month service
year, CivicSpark Members work in collaboration with their host agency to complete climate action
research, planning, and implementation projects, all of which build the capacity of local governments to
address specific climate change needs. Through this experience, not only do local governments receive
dedicated project support, but CivicSpark Members are able to gain valuable professional development
experience as well as access to a network of colleagues in the climate action field. Ultimately, it is expected
that the concerted efforts of CivicSpark Members throughout the state will improve California’s response
to climate change and produce a cohort of young professionals with the skills necessary to become leaders
in the climate action field.
Program Regions CivicSpark Members serve across California and are organized into eight geographic regions, which have
included: Sierra Nevada, Central Coast, Los Angeles, North Coast, San Joaquin Valley, San Francisco Bay
Area, Sacramento, and Southern California. Each region has a regional team consisting of a Regional
Coordinator and the CivicSpark Members placed in that area of the state.
CivicSpark Members All Members possess a four-year college degree and bring relevant experience to their CivicSpark
fellowship. Most CivicSpark Members are recent college graduates and have previous training in
environment-related fields. Over the course of the 11-month fellowship, Climate Action Members spend
1,700 hours working full-time with their host agency on climate action projects and professional
development. For their participation, Members receive a small stipend and an education award, as well
as professional development training and connection to a network of contacts in the climate field. During
the program, Members also have access to intensive mentorship and statewide networking opportunities.
Partner Agencies To maximize program effectiveness, CivicSpark works with local government agencies, such as cities,
schools, and public departments, that demonstrate a “capacity need.” Although CivicSpark receives grant
funding to offset the cost of project support, participation in the program requires a fiscal contribution
from partner agencies based on the amount of Member time dedicated to a project.

CivicSpark Evaluation Report 2019
LPC Consulting Associates, Inc. 3
Intervention Outline CivicSpark Members deliver service by working on a range of climate change mitigation and adaption
projects for beneficiaries during the program year. While project topics vary, all Members provide support
to their host agencies through the same four-step process:
1. Gap Assessment: Members collect primary and secondary data to determine current climate change needs
2. Service Projects: Members implement a specific research, planning, or implementation project based on gap assessment results
3. Volunteer Engagement: Members establish new volunteer programs or enhance pre-existing programs relevant to climate change
4. Transitioning Expertise: Members provide training to staff and share project results with key stakeholders to sustain progress
As mentioned, the projects that CivicSpark Members work on during their fellowship all focus on building
the community’s response to climate change at the local level but vary widely in terms of scope and topic
area. Examples of project topics completed during the first three years of implementation include:
sustainable transportation, energy efficiency, solar procurement, urban forestry, sea level rise, climate
action planning and implementation, greenhouse gas inventories, benchmark tracking, complete streets
plans, and community campaigns. Via these projects, Members gain hands-on experience while advancing
local agencies’ climate action initiatives.
CivicSpark Performance Measures The CivicSpark intervention’s performance measure goals for beneficiaries include a minimum number of
hours of capacity building service (the output goal) and self-reported achievement of goals or results (the
outcome goals). Performance measures are included for two specific programmatic areas, capacity
building and volunteer engagement, listed below.
1. Capacity Building Goals
• 86 local governments will receive at least 200 hours of capacity building services from
Members.
• 73 local governments that receive at least 200 hours of capacity building services will meet
at least one of their gap assessment goals.
• 73 local governments that receive at least 200 hours of capacity building services will
report that capacity building activities provided by Members helped to make the
organization more effective.
2. Volunteer Engagement Goals
• 48 local governments will receive a minimum of 50 hours of volunteer system setup and
support services from members.
• 24 local governments that receive volunteer system setup and support will implement
effective volunteer management practices as a result of service.

CivicSpark Evaluation Report 2019
LPC Consulting Associates, Inc. 4
2.2 Program Implementation
Over the first three years of the program, 125 CivicSpark Members completed the program. These
Members completed 268 capacity building projects for public agency beneficiaries to help build
California’s response to climate change.

CivicSpark Evaluation Report 2019
LPC Consulting Associates, Inc. 5
Section 3 Methodology
The primary objective of the CivicSpark program is to build the capacity of local government agencies to
more effectively address climate change, by supporting these entities on a variety of projects designed to
protect the environment. To measure outcomes associated with the primary intervention, CivicSpark
conducted a nonexperimental outcome evaluation using pre- and post-survey data. A Climate Capacity
Assessment survey collected information on partner agencies’ ability to address climate change both
before and after the program to determine the immediate impact of the program on organizational
capacity and goal achievement. The focus of this evaluation was to provide preliminary evidence of the
effects of the CivicSpark intervention on participating local government agencies.
The evaluation was principally focused on examining CivicSpark’s primary performance measure
outcomes. A paired sample analysis assessed variations in pre- and post- service knowledge and capacity
across a census of CivicSpark beneficiaries (local government agencies) that met CivicSpark’s output goal
(at least 200 hours of service). With this sample, the analysis also examined variations in beneficiary
capacity improvement by level of achievement of CivicSpark’s primary outcome goal (achievement of
capacity building goals). In addition, the evaluation included outcomes for CivicSpark’s secondary
performance measure – volunteer engagement.
3.1 Survey Tool and Data Collection
The pre- and post-service Climate Capacity Assessment survey, developed and administered by LGC,
contained four overarching topic areas: (1) policy knowledge, which included seven questions about
knowledge of specific climate-related policies; (2) structure and support for action, which included four
questions about stakeholder and community support; (3) personal understanding of impacts and
solutions, which included six questions about near- and long-term climate change impacts as well as
available solutions; and (4) training received, which included nine questions about climate change training
in which agency staff participated . LGC developed these four categories as a gauge of baseline capacity
that was independent of CivicSpark service, but also in consideration of capacity areas that would be
sensitive to the impacts of program participation.
The post-service Climate Capacity Assessment, in addition to re-measuring the aforementioned
categories, also collected program outcomes related to capacity building goal achievement and volunteer
engagement. At program end, respondents were asked to rate the degree to which the agency reached
its goals in the realms of project development, staff development, diffusion of knowledge, and volunteer
engagement.
The Climate Capacity Assessment was administered online to a census of participating agencies at the
beginning and end of the 11-month service term. Data collection methodology was the same at both
points in time, in order to minimize unintended differences in responses. In years one through three of
the CivicSpark program, 268 agency representatives completed both the pre- and the post-survey (80 in
year one, 81 in year two, and 107 in year three). A post-hoc power analysis indicates that this sample size
generally had sufficient statistical power (β≤0.20, α=0.05) to detect the observed changes in capacity and
goal achievement among beneficiaries.

CivicSpark Evaluation Report 2019
LPC Consulting Associates, Inc. 6
3.2 Analysis
LGC provided three years of Climate Capacity Assessment data to the external evaluator, LPC Consulting
Associates, Inc., for analysis. Aggregate pre- and post-score averages were calculated and a Wilcoxon
signed-rank test was run for each survey question to determine whether differences between pre- and
post-capacity scores were statistically significant. The Wilcoxon test is similar to a paired sample t-test,
but performed when the data does not follow a normal distribution, and tests whether there is a
difference in the overall distribution, not just between pairs of data.
Next, the analysis examined whether changes in climate knowledge and understanding during the service
term varied by local governments that achieved their stated goals and those that did not meet their goals.
The average change in pre- and post-ratings for each of the four overarching categories of knowledge and
understanding (policy factors, internal structure and support for action, personal understanding, and
training) were compared across agencies that “fully met” or “exceeded” at least two of three capacity
building goals (n=156), and those that did not (n=112). A one-tailed Mann-Whitney U test was used to
test the difference in the average change in pre- and post-scores for each group.
The following section of this report presents the results of the Climate Capacity Assessment, which provide
insight about the degree to which CivicSpark is building the capacity of local government agencies that
participate in the program.

CivicSpark Evaluation Report 2019
LPC Consulting Associates, Inc. 7
Section 4 Climate Capacity Assessment Results
To measure program outcomes, the CivicSpark evaluation included a Climate Capacity Assessment survey
that collected information on partner agencies’ capacity to address climate change both before and after
the program. This section presents the results of the Capacity Assessment related to (1) knowledge
development, (2) goal achievement, and (3) volunteer engagement.
4.1 Knowledge Development
The first portion of the Capacity Assessment collected information on partners’ knowledge and
understanding of various climate change issues, as well as community support for climate change
initiatives. For each topic area (policy factors, personal understanding, training, and internal structure and
support), partners were asked to rate their agency on a scale of 1 to 5, where 1 represented no
understanding or support and 5 represented deep understanding or support. Figure 1 displays the
aggregate average pre- and post-scores of CivicSpark partners in each area of knowledge development.
As shown, all areas of development increased over the course of the CivicSpark program. Knowledge of
policy factors and personal understanding of climate issues increased 0.3 points (on a scale of 1-5), while
training increased by 0.2 points and internal structure and support increased by a smaller amount (0.1
points). A comparison of three years of survey data shows that knowledge development ratings were
relatively similar across program years, thus this report presents the aggregate analysis for each topic area
(for data by year, see Attachment A).
Figure 1 | Average Pre- and Post-Ratings of Agency Capacity (Years 1-3) (1=lowest level and 5=highest level)
Knowledge of Climate Change Policy The Capacity Assessment measured partners’ familiarity with state policies and climate action approaches
in order to assess changes in agency awareness of climate-related legislation and familiarity with action
and adaptation planning over time. Survey respondents were asked to rank their level of familiarity with
various policy mechanisms and strategies on a scale from 1 to 5, where 1 represented “not familiar” and
5 represented “very familiar.”
As shown in Figure 2, partners reported an increase in knowledge on each item assessed, and this increase
was statistically significant at the 0.05 level for all but one policy factor. Partners reported the greatest
positive change in knowledge of Safeguarding California (0.44 increase) and the Adaptation Planning
Guide (0.37 increase). There was less improvement related to knowledge of legislative bills and the
California Environmental Quality Act. However, pre-survey results indicated that partner knowledge of
3.6 3.9
3.2 3.5
2.8 3.0
3.7 3.8
Personal Understanding of Climate Action
Knowledge of Policy Factors
Training Received
Internal Structure and Support for Climate Initiatives
Pre
Post

CivicSpark Evaluation Report 2019
LPC Consulting Associates, Inc. 8
these items was high (3.51 and above) before the program, which may explain the smaller positive change
in these areas.
Figure 2 | Change in Agencies’ Knowledge of Climate Change Policy Factors (Years 1-3)
(ratings are on a scale of 1 to 5)
Personal Understanding of Climate Action The Capacity Assessment also captured changes in respondents’ understanding of various topics related
to climate change, in terms of how climate change affects the community, what the community needs,
and what steps can be taken to address climate change issues. These are critical areas of understanding
for effectively planning and implementing climate action initiatives, as well as for sustaining these efforts.
Respondents were asked to rank their level of understanding of the various climate change topics on a
scale from 1 to 5, where 1 represented “little understanding” and 5 represented “deep understanding.”
Partners reported a positive increase in understanding on each topic assessed, and this increase was
statistically significant at the 0.05 level for all items except one, as shown in Figure 3. Based on survey
results, partners showed the greatest improvement in understanding of the long term steps (0.33
increase) and where the community is most vulnerable to anticipated impacts from climate change (0.25
increase). Partners reported the smallest positive gain in understanding what can be done to reduce
greenhouse gas emission in their community. Considering this was the only item of personal
understanding that did not show a statistically significant increase, this could be an area that CivicSpark
can further support and enhance in upcoming service years.
Figure 3 | Change in Agencies’ Personal Understanding of Climate Action Issues (Years 1-3)
(ratings are on a scale of 1 to 5)
0.05
0.18*
0.19*
0.23*
0.32*
0.37*
0.44*
CA Environmental Quality Act
Assembly Bill 32
General Climate Action Planning
Senate Bill 375
General Adaptation Planning
The Adaption Planning Guide
Safeguarding California
*p<0.05
0.08
0.17*
0.21*
0.25*
0.25*
0.33*
What can be done to reduce emissions
How climate change affects community
Necessary resources to respond
Near term steps to take
Where the community is most vulnerable
Long term steps to take
*p<0.05

CivicSpark Evaluation Report 2019
LPC Consulting Associates, Inc. 9
Training on Climate Action Tools Staff training on the tools and methods needed to effectively plan and implement climate protection
initiatives is essential to local governments’ ability to respond to climate issues at the community level.
As such, the CivicSpark Capacity Assessment asked respondents to report the amount of training agency
staff received before and after participation in the program. Respondents ranked the amount of training
they or their staff received on a scale from 1 to 5, where 1 represented “not trained” and 5 represented
“very well trained.”
Overall, partners rated participation in training lower than any of the other climate capacity areas included
in the assessment (an average of 2.8 on the pre-survey and 3.0 on the post-survey). This does not
necessarily come as a surprise, as government personnel often wear many hats and have little time to
spend in training sessions. Although training remained the lowest-rated capacity area at the conclusion of
the program, partners did report an increase in training on each of the nine areas assessed, all but three
of which were statistically significant at the 0.05 level. As displayed in Figure 4, the greatest positive
change was training on the Adaptation Planning Guide and ways to access funding for tools to assess and
measure climate change action. Training on The Governor’s Office of Planning and Research (OPR) General
Plan Guidelines, planning for active transportation, and water conversation showed the least amount of
change over the course of the program. The small improvement related to water conservation training
was likely a result of a relatively high average rating on the pre-survey (3.53), although this was not the
case for training on OPR guidelines (2.79) or planning for active transportation (3.19).
Figure 4 | Change in Agencies’ Training on Climate Action Tools and Methods (Years 1-3) (ratings are on a scale of 1 to 5)
Internal Structure and Support for Climate Action Initiatives The Capacity Assessment also measured change in perceived support for climate initiatives within the
agency and in the community at large. Respondents rated the level of support for moving forward with
climate action efforts on a scale from 1 to 5, where 1 represented “not at all supported” and 5 represented
“very well supported.”
0.06
0.09
0.11
0.17*
0.18*
0.29*
0.31*
0.32*
0.35*
Water conservation
Planning for active transportation
OPR General Plan Guidelines
Other training
Complete Streets
Cal-Adapt
SEEC ClearPath suite
Ways to access funding and tools
Adaptation Planning Guide
*p<0.05

CivicSpark Evaluation Report 2019
LPC Consulting Associates, Inc. 10
On average, participating agencies experienced a slight positive change in support over the course of the
program as shown in Figure 5. However, few of these changes were statistically significant. While support
from department heads, elected officials, and the city manager all increased, these increases were
relatively small and none were statistically significant at a 0.05 level. The only significant increase was in
support from community members, which is particularly encouraging because one of the focuses of
CivicSpark Members is to engage the community in climate project efforts.
Figure 5 | Change in Agencies’ Support for Climate Action Initiatives (Years 1-3) (ratings are on a scale of 1 to 5)
4.2 Goal Achievement
At the beginning of the CivicSpark program, all partner agencies develop specific goals they hope to
achieve during the service term. The post-program Climate Capacity Assessment measured the degree to
which partner agencies met these three types of goals:
• Project development goals (i.e., completion of research project, program implementation, completion of planning document)
• Staff development goals (i.e., agency staff receive training and technical assistance, engage in climate change campaigns, or gain deeper understanding of community needs)
• Diffusion of knowledge goals (i.e., provide results to elected officials, engage key stakeholders in continued work, complete action plan for continued project work)
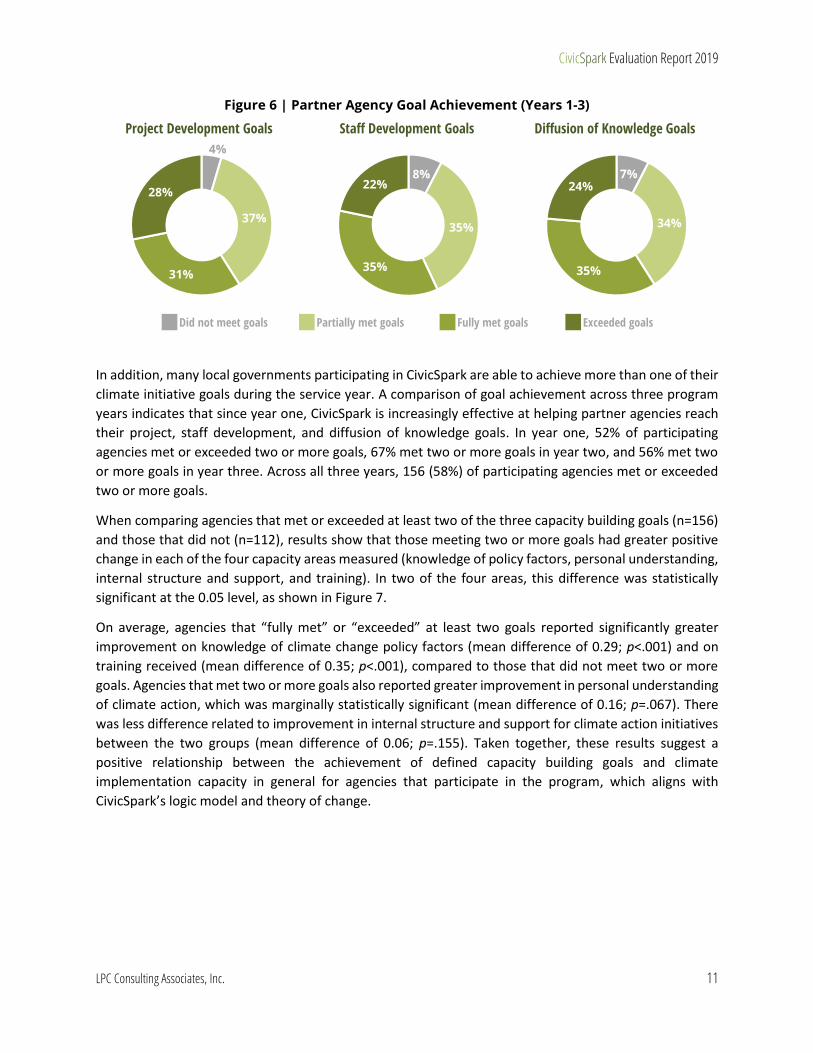
Results show that a majority of partner agencies met or exceeded their climate initiative goals in each of
the three areas over the course of the CivicSpark program, as shown in Figure 6. Across three program
years, 158 partners (59%) met or exceeded diffusion of knowledge goals, 158 (59%) met or exceeded
project goals, and 152 (57%) met or exceeded staff development goals. Approximately one-third of
partner agencies reported partially meeting their goal in each of the three areas, and only a small portion
(8% and fewer) did not meet each intended goal. Overall, 193 (72%) of participating agencies met or
exceeded at least one of their stated goals.
0.01
0.01
0.03
.10*
City Manager
Elected Officials
Department Heads
Community Members
*p<0.05
CivicSpark Evaluation Report 2019
LPC Consulting Associates, Inc. 11
Figure 6 | Partner Agency Goal Achievement (Years 1-3)
Did not meet goals Partially met goals Fully met goals Exceeded goals
In addition, many local governments participating in CivicSpark are able to achieve more than one of their
climate initiative goals during the service year. A comparison of goal achievement across three program
years indicates that since year one, CivicSpark is increasingly effective at helping partner agencies reach
their project, staff development, and diffusion of knowledge goals. In year one, 52% of participating
agencies met or exceeded two or more goals, 67% met two or more goals in year two, and 56% met two
or more goals in year three. Across all three years, 156 (58%) of participating agencies met or exceeded
two or more goals.
When comparing agencies that met or exceeded at least two of the three capacity building goals (n=156)
and those that did not (n=112), results show that those meeting two or more goals had greater positive
change in each of the four capacity areas measured (knowledge of policy factors, personal understanding,
internal structure and support, and training). In two of the four areas, this difference was statistically
significant at the 0.05 level, as shown in Figure 7.
On average, agencies that “fully met” or “exceeded” at least two goals reported significantly greater
improvement on knowledge of climate change policy factors (mean difference of 0.29; p<.001) and on
training received (mean difference of 0.35; p<.001), compared to those that did not meet two or more
goals. Agencies that met two or more goals also reported greater improvement in personal understanding
of climate action, which was marginally statistically significant (mean difference of 0.16; p=.067). There
was less difference related to improvement in internal structure and support for climate action initiatives
between the two groups (mean difference of 0.06; p=.155). Taken together, these results suggest a
positive relationship between the achievement of defined capacity building goals and climate
implementation capacity in general for agencies that participate in the program, which aligns with
CivicSpark’s logic model and theory of change.
4%
37%
31%
28%
Project Development Goals
8%
35%
35%
22%
Staff Development Goals
7%
34%
35%
24%
Diffusion of Knowledge Goals

CivicSpark Evaluation Report 2019
LPC Consulting Associates, Inc. 12
35%
51%44%
Year 1 Year 2 Year 3
41%
54%47%
Year 1 Year 2 Year 3
Figure 7 | Capacity Gains among Agencies that Met 2+ Goals and Agencies that Did Not Meet
2+ Goals (Years 1-3)
4.3 Volunteer Engagement
The Climate Capacity Assessment also measured the degree to which CivicSpark helped partner agencies
build and sustain their volunteer engagement capacity, which is a secondary performance measure for
the CivicSpark program. Based on aggregate survey results, over half (55%) of participating agencies
reported meeting or exceeding implementation goals related to the volunteer engagement strategy
identified at the beginning of the program. Another 22% “somewhat” met their goals, and 24% did not
meet their implementation goals with regard to volunteer engagement. Overall, 44% of partners reported
that their use of volunteers for climate change activities increased and almost half (47%) said that their
volunteer engagement approaches improved as a result of CivicSpark support. Compared to the other
goal areas (i.e., project development, staff development, and diffusion of knowledge), these findings
suggest that volunteer engagement outcomes were less robust than other goal areas.
While aggregate three-year survey results indicate that the volunteer engagement component of the
CivicSpark program is not as strong as other capacity-building areas, when comparing year one data to
years two and three, it appears that this element has improved. Figure 8 displays the percentage of
partners reporting an increase in use of volunteers and an improvement in volunteer engagement
approaches by year. A larger portion of the agencies in years two and three achieved these outcomes, as
compared to those in year one. It will be useful for CivicSpark staff to identify what is working well with
volunteer engagement, as well as closely examine why this capacity area does not show the same degree
of positive change as other components to inform program improvement.
Figure 8 | Volunteer Engagement Outcomes by Program Year
< .010.12
0.08 < .010.07
0.28
0.38*0.36*
Internal Structure and Support
for Climate Initiatives
Personal Understanding of
Climate Action
Knowledge of Policy Factors Training
*p<0.05
use of volunteers
increased
volunteer engagement
approaches improved
% of partners reporting their…

CivicSpark Evaluation Report 2019
LPC Consulting Associates, Inc. 13
4.4 Overall Impact on Effectiveness
Lastly, participating agencies agreed that support from CivicSpark
increased the effectiveness and efficiency of their agency’s climate
action work. Across years one through three, 226 partners (86%)
reported that CivicSpark’s capacity building activities increased the
effectiveness of their work, and 223 (85%) said the capacity building
activities increased the efficiency with which they implemented their
climate action initiatives.
of partner agencies reported
that CivicSpark increased the
effectiveness of their climate
action work
86%

CivicSpark Evaluation Report 2019
LPC Consulting Associates, Inc. 14
Section 5 Conclusion and Next Steps
Based on three years of Climate Capacity Assessment data, it is evident that CivicSpark has had a positive
impact on the local government agencies that participate in the program and is achieving the performance
measure goals. Through CivicSpark, partner agencies received direct support for climate action projects,
which resulted in increased capacity to respond to climate change in four areas of organizational capacity
– understanding of climate action, knowledge of policy factors, internal structure and support, and
training – based on a paired sample analysis of pre- and post-survey data. Furthermore, a clear majority
of partners met or exceeded their project development, staff development, and diffusion of knowledge
goals. Agencies that met two or more of their goals reported significantly greater improvement in capacity
related to policy knowledge (p<0.001), training (p<0.001), and understanding of climate action (p=0.067),
when compared to agencies that did not meet two or more goals, which provides preliminary indication
of the intervention’s impact on beneficiaries, in line with the program theory of change.
One area of focus moving forward may be in the realm of volunteer engagement. Although volunteer
engagement in climate action projects is a secondary performance measures for the CivicSpark program,
survey results show that outcomes related to volunteerism were not as strong as achievements in other
areas. Because it is likely that AmeriCorps Members do not come to CivicSpark with prior community
engagement expertise or experience, the program may benefit from additional training for Members on
basic volunteer engagement strategies and best practices for implementing community outreach and
engagement campaigns.
While results from the Climate Capacity Assessment pre- and post-survey captured a number of
immediate positive outcomes, this nonexperimental methodology does not allow CivicSpark to make
determinations about whether positive change among partner agencies was attributable to the program
itself or due more so to a set of external factors (e.g., community education campaigns, fluctuations in
funding, etc.) experienced by all local governments. To address this, CivicSpark is currently in the process
of implementing a quasi-experimental evaluation to assess program outcomes and eliminate alternative
explanations for the findings. This study, which is in progress with the 2019/20 CivicSpark cohort of
partner agencies, includes a comparison group of local governments that are not in the program. The
quasi-experimental design is intended to strengthen the validity of evaluation findings by seeking to
eliminate confounding factors that could contribute to the capacity changes described in this report.
Results of the quasi-experimental evaluation will be forthcoming in late 2020.

CivicSpark Evaluation Report 2019
15
Attachment A | Climate Capacity Assessment Results by Year
Knowledge and Understanding*
Year 1 Average
Pre Score Average
Post Score Change
Policy Factors (n=80) 3.22 3.54 .32
Internal Structure and Support for Action (n=80) 3.68 3.76 .08
Personal Understanding (n=80) 3.53 3.90 .37
Training (n=80) 2.66 3.00 .34
Year 2 Average
Pre Score Average
Post Score Change
Policy Factors (n=81) 3.23 3.49 .26
Internal Structure and Support for Action (n=81) 3.78 3.77 -.01
Personal Understanding (n=81) 3.69 3.90 .21
Training (n=81) 2.80 2.98 .18
Year 3 Average
Pre Score Average
Post Score Change
Policy Factors (n=107) 3.28 3.47 .19
Internal Structure and Support for Action (n=107) 3.70 3.75 .05
Personal Understanding (n=107) 3.71 3.80 .09
Training (n=107) 2.79 2.92 .13
Years 1 - 3 Average
Pre Score Average
Post Score Change
Policy Factors (n=268) 3.25 3.50 .25
Internal Structure and Support for Action (n=268) 3.72 3.76 .04
Personal Understanding (n=268) 3.65 3.86 .21
Training (n=268) 2.75 2.96 .21
*Average pre- and post-scores were calculated by averaging the average ratings for each question within a topic area category across all respondents in the sample.

CivicSpark Evaluation Report 2019
16
Capacity Building Goals
Year 1 Did not meet
goals Partially
met goals Fully met
goals Exceeded
goals
Staff Development Goals (n=80) 8% 44% 38% 11%
Project Goals (n=80) 4% 44% 38% 15%
Diffusion of Knowledge Goals (n=80) 6% 39% 48% 8%
Year 2 Did not meet
goals Partially
met goals Fully met
goals Exceeded
goals
Staff Development Goals (n=81) 2% 28% 54% 15%
Project Goals (n=81) 2% 31% 44% 22%
Diffusion of Knowledge Goals (n= 81) 1% 28% 53% 17%
Year 3 Did not meet
goals Partially
met goals Fully met
goals Exceeded
goals
Staff Development Goals (n=107) 13% 35% 46% 7%
Project Goals (n=107) 7% 36% 41% 17%
Diffusion of Knowledge Goals (n= 107) 13% 34% 47% 7%
Years 1 - 3 Did not meet
goals Partially
met goals Fully met
goals Exceeded
goals
Staff Development Goals (n=268) 8% 35% 35% 22%
Project Goals (n=268) 4% 37% 31% 28%
Diffusion of Knowledge Goals (n=268) 7% 34% 35% 24%
Program Effectiveness
Year 1 Yes No
Did CivicSpark increase the effectiveness of your work? (n=79) 84% 16%
Did CivicSpark increase efficiency of your work? (n=78) 82% 18%
Year 2 Yes No
Did CivicSpark increase the effectiveness of your work? (n=80) 90% 10%
Did CivicSpark increase efficiency of your work? (n=80) 90% 10%
Year 3 Yes No
Did CivicSpark increase the effectiveness of your work? (n=103) 85% 15%
Did CivicSpark increase efficiency of your work? (n=103) 84% 16%
Years 1 - 3 Yes No
Did CivicSpark increase the effectiveness of your work? (n=262) 86% 14%
Did CivicSpark increase efficiency of your work? (n=261) 85% 15%

CivicSpark Evaluation Report 2019
17
Volunteer Engagement Goals
Year 1 Did not meet
goals Somewhat met Goals Met goals
Exceeded goals
Was the volunteer engagement strategy successfully implemented? (n=80)
33% 25% 38% 5%
Year 2 Did not meet
goals Somewhat met Goals Met goals
Exceeded goals
Was the volunteer engagement strategy successfully implemented? (n=81)
17% 25% 51% 7%
Year 3 Did not meet
goals Somewhat met Goals Met goals
Exceeded goals
Was the volunteer engagement strategy successfully implemented? (n=98)
21% 16% 49% 13%
Years 1 - 3 Did not meet
goals Somewhat met Goals Met goals
Exceeded goals
Was the volunteer engagement strategy successfully implemented? (n=258)
24% 22% 46% 9%
Volunteer Engagement Outcomes
Year 1 Yes No
Did your use of volunteers increase as a result of CivicSpark? (n=79) 35% 65%
Did your volunteer approaches improve as a result? (n=80) 41% 59%
Year 2 Yes No
Did your use of volunteers increase as a result of CivicSpark? (n=81) 51% 49%
Did your volunteer approaches improve as a result? (n=81) 54% 46%
Year 3 Yes No
Did your use of volunteers increase as a result of CivicSpark? (n=98) 45% 55%
Did your volunteer approaches improve as a result? (n=98) 47% 53%
Years 1-3 Yes No
Did your use of volunteers increase as a result of CivicSpark? (n=258) 44% 56%
Did your volunteer approaches improve as a result? (n=259) 47% 53%