evaluation schools challenge cymru quantitative analysis
TRANSCRIPT

Evaluation of Schools Challenge Cymru
A quantitative analysis of pupil-
level data
Mae’r ddogfen yma hefyd ar gael yn Gymraeg.
This document is also available in Welsh.
© Crown Copyright Digital ISBN 978-1-78859-243-7
SOCIAL RESEARCH NUMBER:
54/2017
PUBLICATION DATE:
29/09/2017

Evaluation of SCC
A QUANTITATIVE ANALYSIS OF PUPIL-LEVEL DATA
Dan Hardy and Marian Morris
SQW
Views expressed in this report are those of the researcher and not necessarily those of the Welsh Government
For further information please contact:
Joanne Starkey
Knowledge and Analytical Services
Welsh Government
Cathays Park Cardiff
CF10 3NQ
0300 025 0377
Welsh Government Social Research, 2017

Evaluation of SCC A quantitative analysis of pupil-level data
1
Contents
Glossary ..................................................................................................... 2
1. Introduction ............................................................................................. 3
2. Overview of pupil-level data.................................................................... 6
3. Multilevel (hierarchical) analysis of pupil-level data .............................. 33
4. Assessing the performance of P2S schools ......................................... 50
Annex A: Technical annex ........................................................................ 63

Evaluation of SCC A quantitative analysis of pupil-level data
2
Glossary
SCC Schools Challenge Cymru
PtS Pathways to Success
KS3, KS4 Key Stage 3, Key Stage 4
NPD National Pupil Database
L2I Level 2 inclusive
CPS Capped Points Scores
FSM Free School Meals
SEN Special Educational Needs

Evaluation of SCC A quantitative analysis of pupil-level data
3
1. Introduction
1.1 This paper uses an extract (2009/10 to 2015/16) from the National Pupil
Database to assess progress made by Pathways to Success (PtS) schools in
improving pupil outcomes following their inclusion in SCC. The analysis was
conducted in three parts. First, a descriptive overview of the data was carried
out, focussing on the four years of data prior to the introduction of SCC in
2014 and comparing this to the following academic years (i.e. 2014/2015 and
2015/2016). Second, a hierarchical (multilevel) process of modelling took
place in order to analyse the principal factors shaping performance at the
level of the pupil and the school. Finally, a forecasting model (using
econometric techniques) was developed, in order to predict how PtS schools
might have performed without the SCC intervention. These forecasts were
then compared with the recorded performance of the PtS schools.
1.2 Analysis was performed on a range of pupil outcomes, including attainment,
attendance, and unauthorised absence rates. Three measures of attainment
were analysed: English, Maths and Level 2 Inclusive (L2I1). Although data on
attainment in Welsh and Capped Points Scores (CPS) are presented in the
descriptive statistics section, longitudinal analysis was not undertaken,
because:
insufficient data on attainment in Welsh were available to undertake
econometric analysis, as too few pupils in the 39 PtS schools studied
the language to develop outcome models for this subject
CPS is a Key Stage 4 (KS4) measure of academic outcome and no
similar measure exists at Key Stage 3 (KS3) against which to draw a
comparison and track pupil progress2. Since the econometric models
relied on past attainment scores for pupils, longitudinal analysis with
CPS as the outcome could not be carried out.
1.3 For all measures of attainment, the outcome variable is binary and measures
whether or not a pupil achieved the expected level of attainment at a given
Key Stage3.
1 This is a composite measure of five GCSEs at grade A*-C, including English or Welsh first
language and mathematics. As this is a KS4 measure of attainment, and we are interested in progress over time, we use a proxy for L2I at KS3, which indicates whether a pupil attains the expected level of achievement in English/Welsh and Maths. 2 This is also the case for L2, but, in this case, a proxy measure (described above) represents
a good match. It is for this reason that we limit the analysis to attainment in L2I. 3 For example, the outcome variable for KS3 Maths would be “1” is a pupil achieved a Level 5
or above, and a “0” if the pupil fell below this level.
Evaluation of SCC A quantitative analysis of pupil-level data
4
1.4 The analysis of learning outcomes, attendance, and unauthorised absence
rates included a range of pupil-level characteristics in order to understand the
extent to which SCC intervention may have affected specific sub-populations
of pupils. These sub-groups included analysis by gender, ethnicity, Free
School Meal (FSM) eligibility, and Special Educational Need (SEN) status.
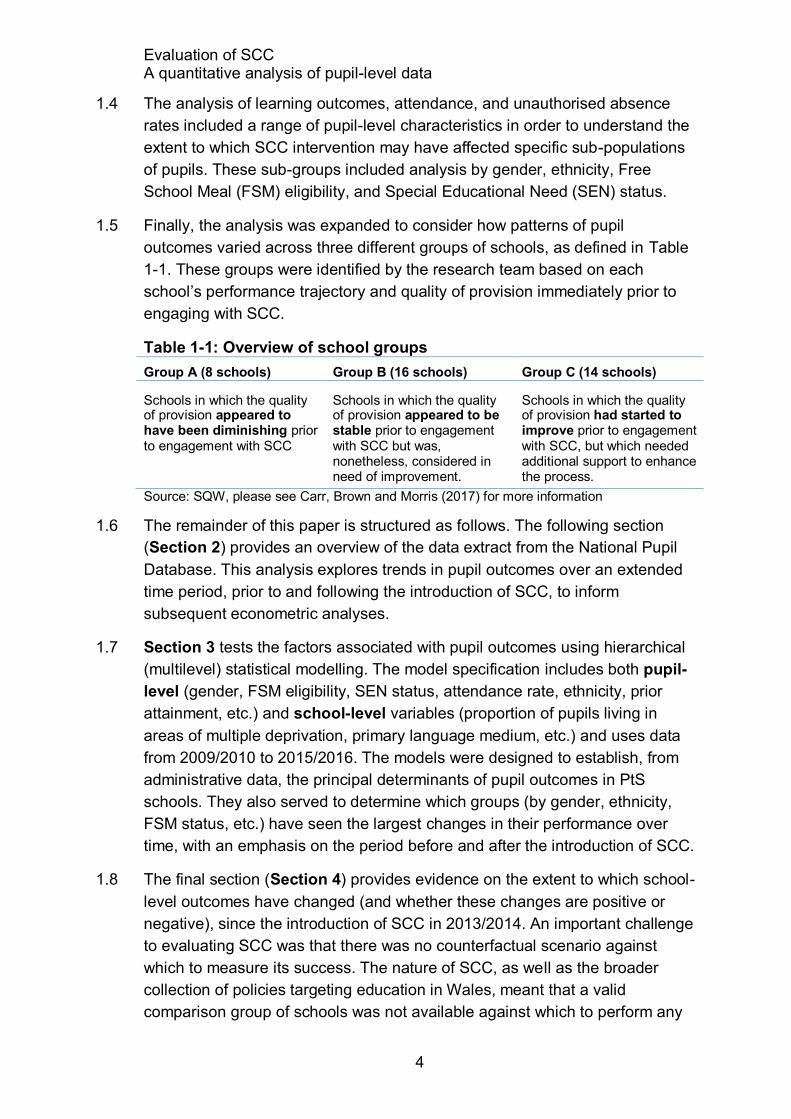
1.5 Finally, the analysis was expanded to consider how patterns of pupil
outcomes varied across three different groups of schools, as defined in Table
1-1. These groups were identified by the research team based on each
school’s performance trajectory and quality of provision immediately prior to
engaging with SCC.
Table 1-1: Overview of school groups
Group A (8 schools) Group B (16 schools) Group C (14 schools)
Schools in which the quality of provision appeared to have been diminishing prior to engagement with SCC
Schools in which the quality of provision appeared to be stable prior to engagement with SCC but was, nonetheless, considered in need of improvement.
Schools in which the quality of provision had started to improve prior to engagement with SCC, but which needed additional support to enhance the process.
Source: SQW, please see Carr, Brown and Morris (2017) for more information
1.6 The remainder of this paper is structured as follows. The following section
(Section 2) provides an overview of the data extract from the National Pupil
Database. This analysis explores trends in pupil outcomes over an extended
time period, prior to and following the introduction of SCC, to inform
subsequent econometric analyses.
1.7 Section 3 tests the factors associated with pupil outcomes using hierarchical
(multilevel) statistical modelling. The model specification includes both pupil-
level (gender, FSM eligibility, SEN status, attendance rate, ethnicity, prior
attainment, etc.) and school-level variables (proportion of pupils living in
areas of multiple deprivation, primary language medium, etc.) and uses data
from 2009/2010 to 2015/2016. The models were designed to establish, from
administrative data, the principal determinants of pupil outcomes in PtS
schools. They also served to determine which groups (by gender, ethnicity,
FSM status, etc.) have seen the largest changes in their performance over
time, with an emphasis on the period before and after the introduction of SCC.
1.8 The final section (Section 4) provides evidence on the extent to which school-
level outcomes have changed (and whether these changes are positive or
negative), since the introduction of SCC in 2013/2014. An important challenge
to evaluating SCC was that there was no counterfactual scenario against
which to measure its success. The nature of SCC, as well as the broader
collection of policies targeting education in Wales, meant that a valid
comparison group of schools was not available against which to perform any

Evaluation of SCC A quantitative analysis of pupil-level data
5
tests for evidence of convergence, or otherwise. Therefore, we adopted an
‘experimental’ approach that used a forecasting model to develop a ‘synthetic’
counterfactual scenario.
1.9 The objective of the approach was to make, for each school, a prediction
about how it would have performed in each year after the introduction of SCC
if the intervention had not taken place. We explored a range of forecasting
models to contrast their effectiveness. These included simple projections
using time-series attainment data and more complex ‘conditional’ forecasts
using known data about pupils to inform the predictions made (see Section
4).
1.10 We then used the outputs from these models to compare the recorded
performance since the introduction of SCC. It is important to emphasise the
experimental nature of this approach, which due to the volatility of attainment
data at the school-level, means that particular attention needs to be paid to
the statistical significance and confidence intervals presented around any of
the results.

Evaluation of SCC A quantitative analysis of pupil-level data
6
2. Overview of pupil-level data
2.1 The purpose of this section is to provide an overview of the pupil-level data
and present broad trends (over time and by cohort groups) in terms of
attainment, attendance and absence. Particular emphasis was placed on pre-
and post-SCC years to understand the extent to which improvements in pupil-
level outcomes could be observed. It is important to note that, due to the
nature of the intervention (which was focused on school improvement), the
level of ‘treatment’ received by pupils taking examinations from 2014/2015
onwards (the year SCC was introduced) varies considerably. For example, a
pupil sitting a GCSE (KS4) examination in the 2014/2015 academic year
would have very limited exposure to SCC-related change in schools. A pupil
sitting a KS4 examination in the 2015/2016 academic year, however, would
have been in an SCC-supported school for most of their KS4 studies (Years
10 and 11). Because schools focused on different aspects of school
improvement4, we do not distinguish by intensity of ‘treatment’ in any of the
analysis that follows. Finally, as part of the data preparation process, and for
simplicity of analysis, the examined dataset only comprises pupils who
completed Key Stage teacher assessments and/or public examinations at the
expected time intervals (three years between KS2 and KS3, two years
between KS3 and KS4)5.
Structure of the data
2.2 The extract of the National Pupil Database provided by the Welsh
Government comprises 78,966 unique pupils enrolled in the 39 SCC-engaged
schools. The data covers the period 2006/2007 to 2015/2016, as presented in
Table 2-1 (intervention years are demarcated by the shaded rows). The table
is structured by year (rows) and Key Stage (columns).
4 See Carr, C, Brown S and Morris M, 2017
5 As a result, 88 pupils (who either sat public examinations a year early or were not entered
into their GCSEs with their cohort) were removed from the dataset.

Evaluation of SCC A quantitative analysis of pupil-level data
7
Table 2-1: Pupil numbers by academic year and Key Stage
SCC status Year KS2 KS3 KS4 Total
Pre-intervention
2006/07 6,574 6,974 7,138 20,686
2007/08 6,869 6,778 7,217 20,864
2008/09 6,391 6,664 7,167 20,222
2009/10 5,983 6,795 6,929 19,707
2010/11 5,605 7,019 6,751 19,375
2011/12 5,630 6,530 6,909 19,069
2012/13 5,168 6,110 7,113 18,391
2013/14 5,741 6,637 12,378
Post-intervention
2014/15 5,787 6,208 11,995
2015/16 5,314 5,831 11,145
Total 42,220 63,712 67,900 173,832
Source: SQW
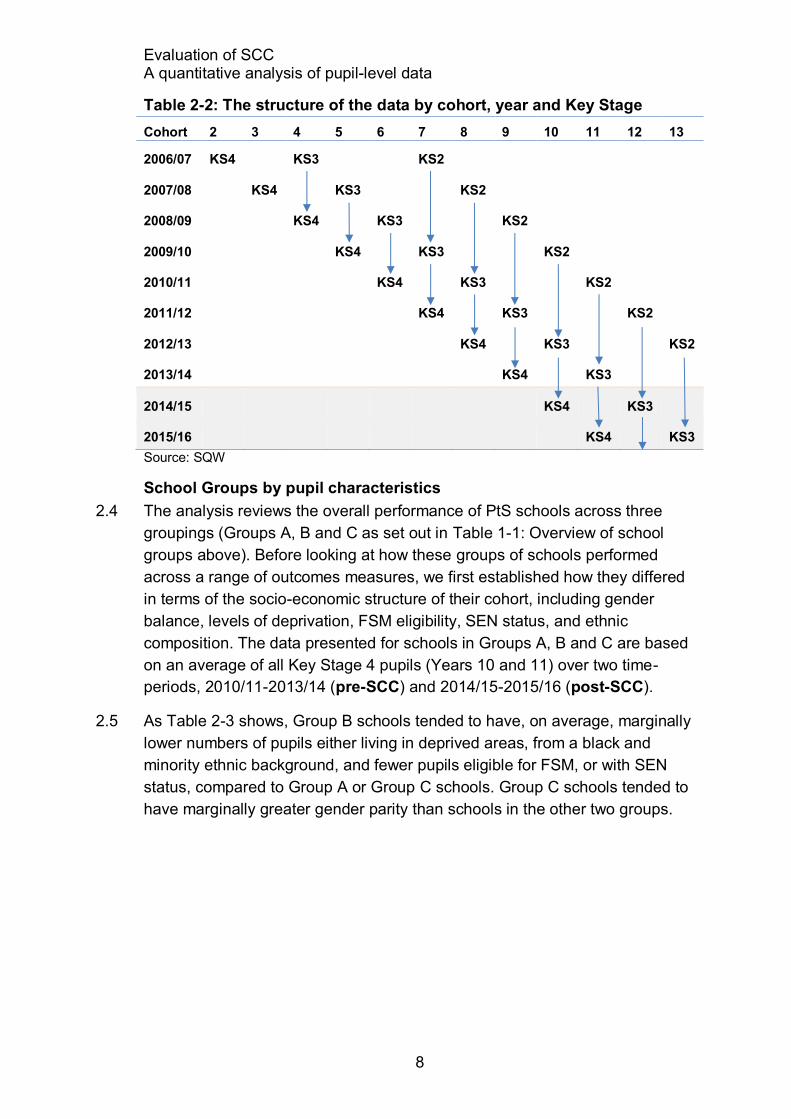
2.3 Table 2-2 illustrates the structure of the data by cohort (columns) and years
(rows), indicating the year in which a particular Key Stage was completed by a
particular cohort. The intervention years are, again, demarcated by shading.
In terms of support intensity, the table illustrates how Cohorts 11 and 13 (two
years of SCC support, post KS3) would have had a greater exposure to PtS
interventions than Cohort 10 (one year post-KS3), and Cohort 12 (one year
pre-KS3). The red highlighting shows the data extracts that are used in the
multilevel and forecasting models.
Evaluation of SCC A quantitative analysis of pupil-level data
8
Table 2-2: The structure of the data by cohort, year and Key Stage
Cohort 2 3 4 5 6 7 8 9 10 11 12 13
2006/07 KS4
KS3
KS2
2007/08
KS4
KS3
KS2
2008/09
KS4
KS3
KS2
2009/10
KS4
KS3
KS2
2010/11
KS4
KS3
KS2
2011/12
KS4
KS3
KS2
2012/13
KS4
KS3
KS2
2013/14 KS4 KS3
2014/15
KS4
KS3
2015/16
KS4
KS3
Source: SQW
School Groups by pupil characteristics
2.4 The analysis reviews the overall performance of PtS schools across three
groupings (Groups A, B and C as set out in Table 1-1: Overview of school
groups above). Before looking at how these groups of schools performed
across a range of outcomes measures, we first established how they differed
in terms of the socio-economic structure of their cohort, including gender
balance, levels of deprivation, FSM eligibility, SEN status, and ethnic
composition. The data presented for schools in Groups A, B and C are based
on an average of all Key Stage 4 pupils (Years 10 and 11) over two time-
periods, 2010/11-2013/14 (pre-SCC) and 2014/15-2015/16 (post-SCC).
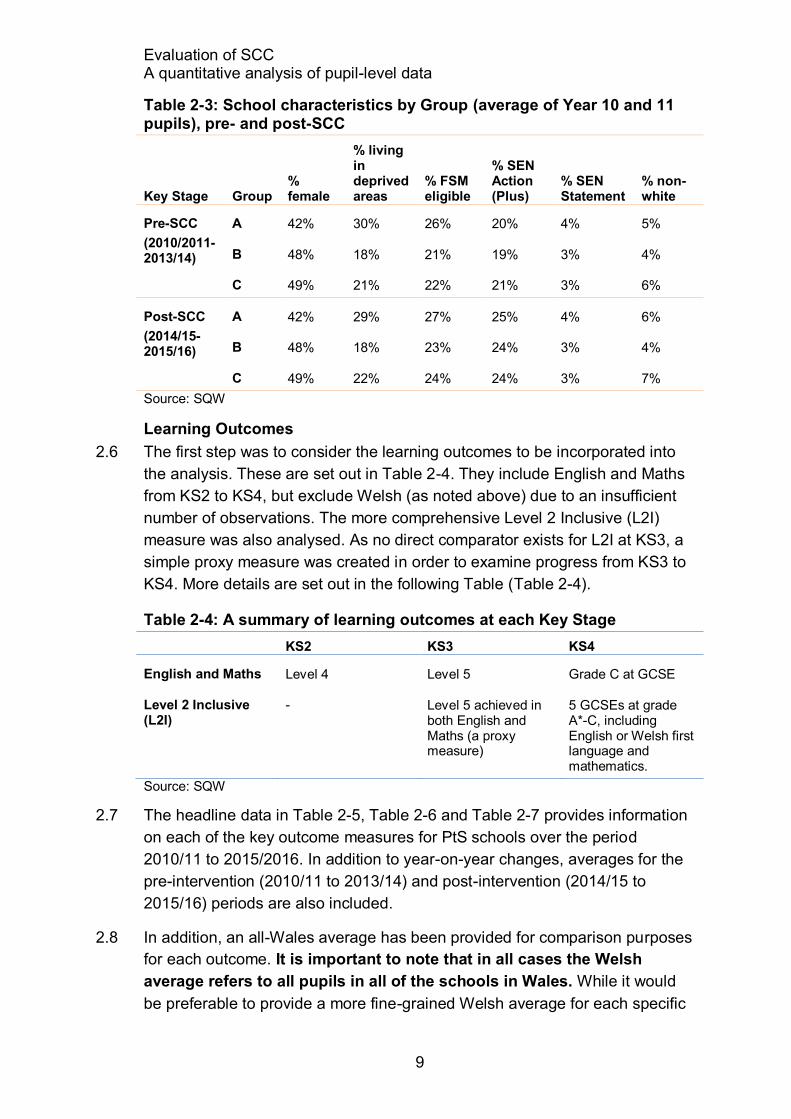
2.5 As Table 2-3 shows, Group B schools tended to have, on average, marginally
lower numbers of pupils either living in deprived areas, from a black and
minority ethnic background, and fewer pupils eligible for FSM, or with SEN
status, compared to Group A or Group C schools. Group C schools tended to
have marginally greater gender parity than schools in the other two groups.
Evaluation of SCC A quantitative analysis of pupil-level data
9
Table 2-3: School characteristics by Group (average of Year 10 and 11 pupils), pre- and post-SCC
Key Stage Group % female
% living in deprived areas
% FSM eligible
% SEN Action (Plus)
% SEN Statement
% non-white
Pre-SCC
(2010/2011-2013/14)
A 42% 30% 26% 20% 4% 5%
B 48% 18% 21% 19% 3% 4%
C 49% 21% 22% 21% 3% 6%
Post-SCC
(2014/15-2015/16)
A 42% 29% 27% 25% 4% 6%
B 48% 18% 23% 24% 3% 4%
C 49% 22% 24% 24% 3% 7%
Source: SQW
Learning Outcomes
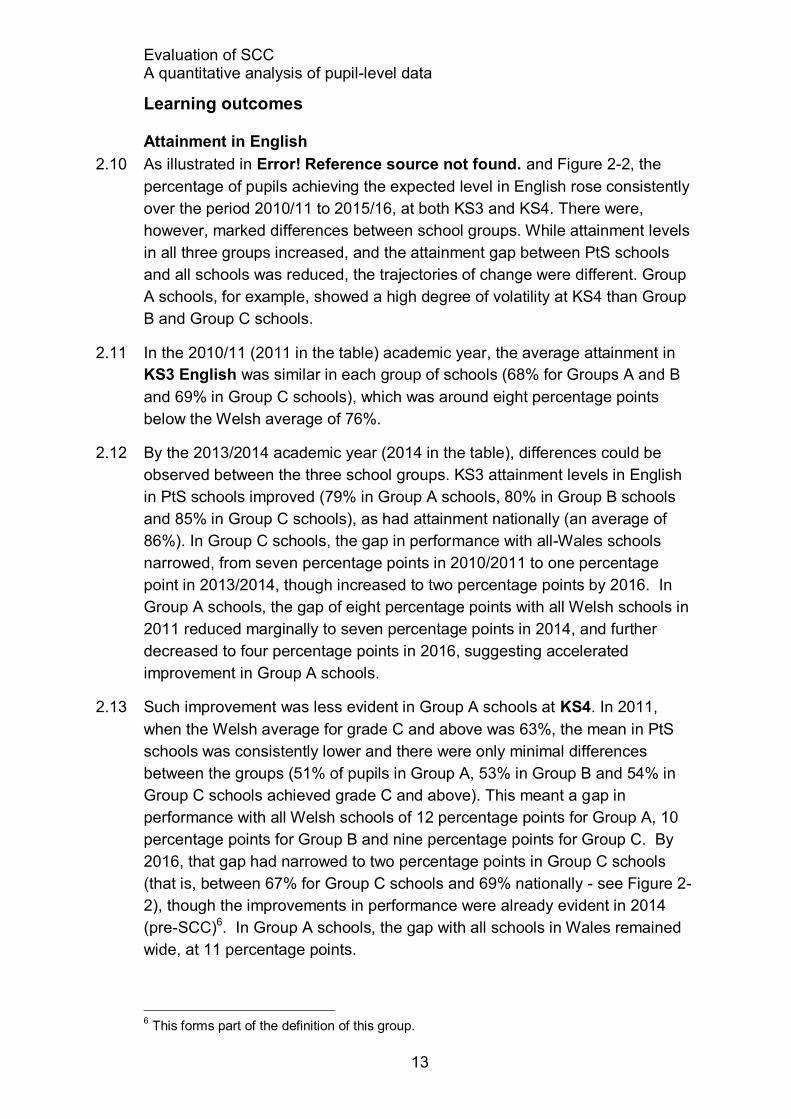
2.6 The first step was to consider the learning outcomes to be incorporated into
the analysis. These are set out in Table 2-4. They include English and Maths
from KS2 to KS4, but exclude Welsh (as noted above) due to an insufficient
number of observations. The more comprehensive Level 2 Inclusive (L2I)
measure was also analysed. As no direct comparator exists for L2I at KS3, a
simple proxy measure was created in order to examine progress from KS3 to
KS4. More details are set out in the following Table (Table 2-4).
Table 2-4: A summary of learning outcomes at each Key Stage
KS2 KS3 KS4
English and Maths Level 4 Level 5 Grade C at GCSE
Level 2 Inclusive (L2I)
- Level 5 achieved in both English and Maths (a proxy measure)
5 GCSEs at grade A*-C, including English or Welsh first language and mathematics.
Source: SQW
2.7 The headline data in Table 2-5, Table 2-6 and Table 2-7 provides information
on each of the key outcome measures for PtS schools over the period
2010/11 to 2015/2016. In addition to year-on-year changes, averages for the
pre-intervention (2010/11 to 2013/14) and post-intervention (2014/15 to
2015/16) periods are also included.
2.8 In addition, an all-Wales average has been provided for comparison purposes
for each outcome. It is important to note that in all cases the Welsh
average refers to all pupils in all of the schools in Wales. While it would
be preferable to provide a more fine-grained Welsh average for each specific

Evaluation of SCC A quantitative analysis of pupil-level data
10
group we analysed (for example, for FSM eligible, SEN status pupils, etc.),
complete sub-group data (at pupil level) for all of the schools in Wales were
not available to the team at the time of the analysis. Therefore, where we
make comparisons of FSM eligible pupils in PtS schools to the Welsh
average, for example, we are not comparing this group to all FSM pupils in
Wales, but rather to all pupils in Wales.
2.9 In the remainder of this section, a detailed descriptive overview of the learning
outcomes (English, Maths and L2I), attendance and unauthorised absence
data are provided. It is important to note that differences discussed in this
section are descriptive and not based on any statistical tests or analyses of
variance. Such statistical comparisons are reserved for subsequent sections
using hierarchical and econometric modelling.

Evaluation of SCC A quantitative analysis of pupil-level data
11
Table 2-5: Maths and English outcomes at KS3 and KS4 in PtS and all Welsh schools from 2010/11 to 2015/16
English Maths
KS3 KS4 KS3 KS4
PtS Wales PtS Wales PtS Wales PtS Wales
2010/11 value 69% 76% 53% 63% 73% 78% 46% 57%
N 6,885 - 6,115 - 6,885 - 6,112 -
2011/12 value 73% 79% 55% 62% 77% 81% 48% 58%
N 6,406 - 6,273 - 6,406 - 6,331 -
2012/13 value 78% 83% 53% 63% 81% 84% 49% 60%
N 5,989 - 6,552 - 5,989 - 6,656 -
2013/14 value 82% 86% 59% 66% 84% 87% 54% 62%
N 5,630 - 6,267 - 5,630 - 6,259 -
2014/15 value 83% 88% 61% 69% 86% 89% 56% 64%
N 5,701 - 5,898 - 5,701 - 5,902 -
2015/16 value 86% 89% 63% 69% 88% 90% 61% 67%
N 5,220 - 5,604 - 5,220 - 5,620 -
Source: SQW and StatsWales
Table 2-6: Welsh, L2I and CPS outcomes at KS3 and KS4 in PtS and all Welsh schools from 2010/11 to 2015/16
Welsh L2I Capped Points Score
KS4 KS4 KS3 KS4
PtS Wales PtS Wales PtS Wales PtS Wales
2010/11 value 55% 81% 60% 75% 35% 50% 286 312
N 6,748 - 109 - 6,640 - 6,640 -
2011/12 value 63% 84% 73% 74% 37% 51% 301 324
N 6,246 - 132 - 6,787 - 6,787 -
2012/13 value 68% 88% 53% 74% 38% 53% 307 333
N 5,860 - 110 - 6,984 - 6,984 -
2013/14 value 74% 90% 56% 74% 45% 55% 323 341
N 5,514 - 142 - 6,503 - 6,503 -
2014/15 value 77% 91% 55% 75% 48% 58% 329 344
N 5,548 - 111 - 6,079 - 6,079 -
2015/16 value 78% 92% 68% 75% 52% 60% 334 345
N 5,067 - 107 - 5,718 - 5,718 -
Source: SQW and StatsWales

Evaluation of SCC A quantitative analysis of pupil-level data
12
Table 2-7: Attendance and unauthorised absence outcomes at KS3 and KS4 in PtS and all Welsh schools from 2010/11 to 2015/16
Attendance Unauthorised absence
KS3* KS4* All KS3* KS4* All
PtS PtS Wales PtS PtS Wales
2010/11 value 91% 90% 91% 1.6% 2.8% 1.5%
N 18,879 6,427 - 18,879 6,427 -
2011/12 value 92% 90% 92% 1.5% 3.2% 1.4%
N 17,699 13,124 - 17,699 13,124 -
2012/13 value 92% 91% 93% 1.4% 2.8% 1.3%
N 16,973 12,930 - 16,973 12,930 -
2013/14 value 93% 92% 94% 1.5% 2.6% 1.3%
N 16,171 12,073 - 16,171 12,073 -
2014/15 value 93% 92% 94% 1.8% 2.8% 1.3%
N 10,662 11,330 - 10,662 11,330 -
2015/16 value 93% 93% 94% 2.1% 2.5% 1.3%
N 5,093 11,020 - 5,093 11,020 -
Source: SQW and StatsWales
Evaluation of SCC A quantitative analysis of pupil-level data
13
Learning outcomes
Attainment in English
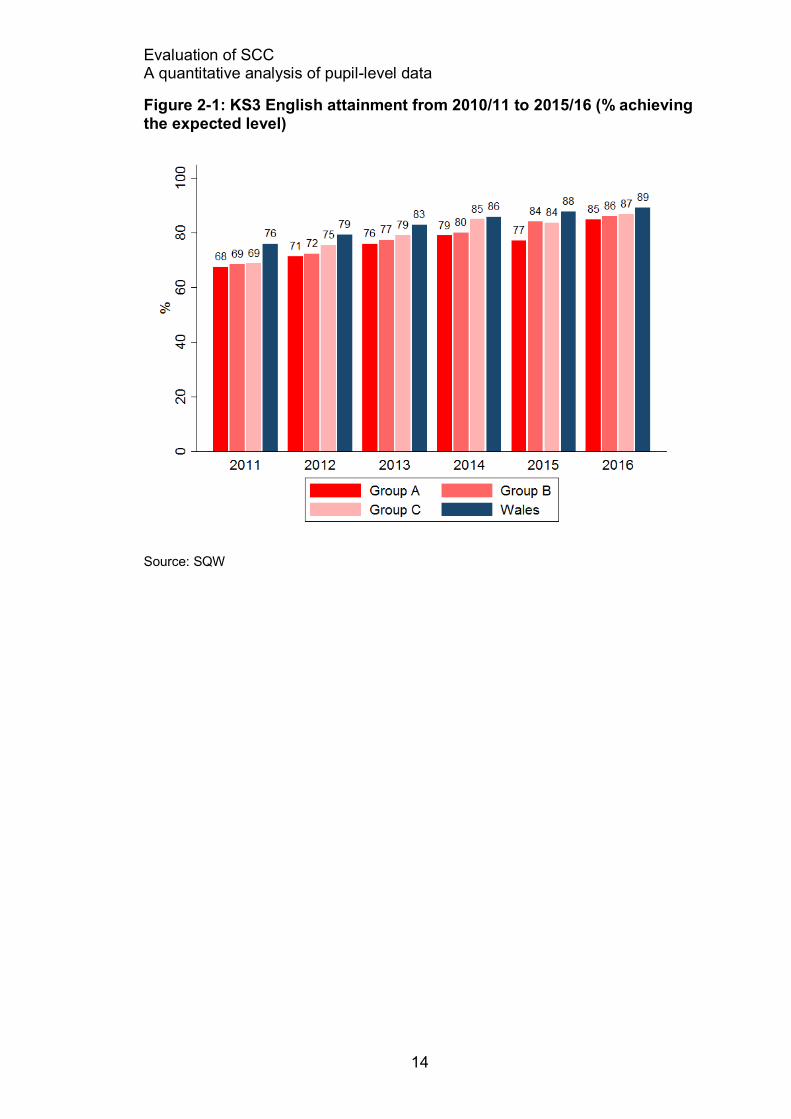
2.10 As illustrated in Error! Reference source not found. and Figure 2-2, the
percentage of pupils achieving the expected level in English rose consistently
over the period 2010/11 to 2015/16, at both KS3 and KS4. There were,
however, marked differences between school groups. While attainment levels
in all three groups increased, and the attainment gap between PtS schools
and all schools was reduced, the trajectories of change were different. Group
A schools, for example, showed a high degree of volatility at KS4 than Group
B and Group C schools.
2.11 In the 2010/11 (2011 in the table) academic year, the average attainment in
KS3 English was similar in each group of schools (68% for Groups A and B
and 69% in Group C schools), which was around eight percentage points
below the Welsh average of 76%.
2.12 By the 2013/2014 academic year (2014 in the table), differences could be
observed between the three school groups. KS3 attainment levels in English
in PtS schools improved (79% in Group A schools, 80% in Group B schools
and 85% in Group C schools), as had attainment nationally (an average of
86%). In Group C schools, the gap in performance with all-Wales schools
narrowed, from seven percentage points in 2010/2011 to one percentage
point in 2013/2014, though increased to two percentage points by 2016. In
Group A schools, the gap of eight percentage points with all Welsh schools in
2011 reduced marginally to seven percentage points in 2014, and further
decreased to four percentage points in 2016, suggesting accelerated
improvement in Group A schools.
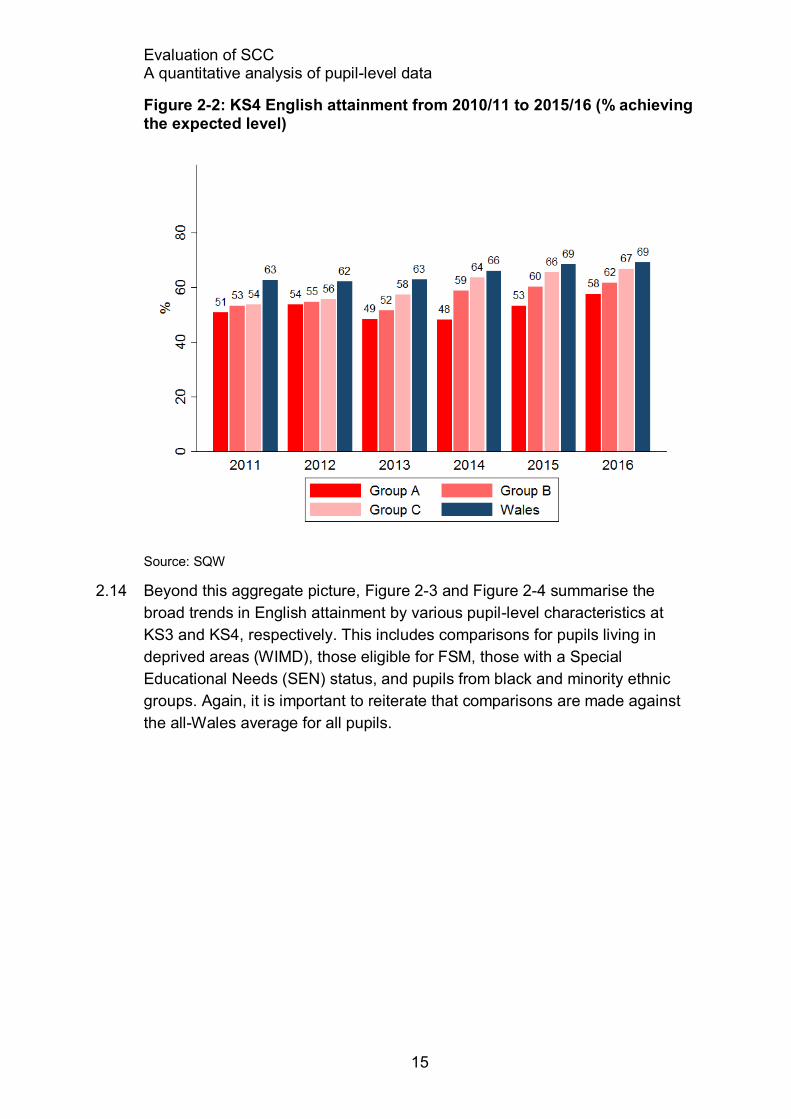
2.13 Such improvement was less evident in Group A schools at KS4. In 2011,
when the Welsh average for grade C and above was 63%, the mean in PtS
schools was consistently lower and there were only minimal differences
between the groups (51% of pupils in Group A, 53% in Group B and 54% in
Group C schools achieved grade C and above). This meant a gap in
performance with all Welsh schools of 12 percentage points for Group A, 10
percentage points for Group B and nine percentage points for Group C. By
2016, that gap had narrowed to two percentage points in Group C schools
(that is, between 67% for Group C schools and 69% nationally - see Figure 2-
2), though the improvements in performance were already evident in 2014
(pre-SCC)6. In Group A schools, the gap with all schools in Wales remained
wide, at 11 percentage points.
6 This forms part of the definition of this group.
Evaluation of SCC A quantitative analysis of pupil-level data
14
Figure 2-1: KS3 English attainment from 2010/11 to 2015/16 (% achieving the expected level)
Source: SQW
Evaluation of SCC A quantitative analysis of pupil-level data
15
Figure 2-2: KS4 English attainment from 2010/11 to 2015/16 (% achieving the expected level)
Source: SQW
2.14 Beyond this aggregate picture, Figure 2-3 and Figure 2-4 summarise the
broad trends in English attainment by various pupil-level characteristics at
KS3 and KS4, respectively. This includes comparisons for pupils living in
deprived areas (WIMD), those eligible for FSM, those with a Special
Educational Needs (SEN) status, and pupils from black and minority ethnic
groups. Again, it is important to reiterate that comparisons are made against
the all-Wales average for all pupils.

Evaluation of SCC A quantitative analysis of pupil-level data
16
Figure 2-3: Attainment in KS3 English by a range of characteristics for each Group, pre- and post-SCC (% difference relative to the all-pupil Welsh average)
Source: SQW

Evaluation of SCC A quantitative analysis of pupil-level data
17
Figure 2-4: Attainment in KS4 English by a range of characteristics for each Group, pre- and post-SCC (% difference relative to the all-pupil Welsh average)
Source: SQW
2.15 For pupils living in disadvantaged areas (as indicated by the WIMD), the
attainment differential with respect to the Welsh average was lowest for Group
C schools; in other words, the performance of disadvantaged pupils in Group
C was closer to the Welsh average (for all pupils) than the performance of
disadvantaged pupils in Group A or Group B schools.
2.16 By contrast, pupils residing in deprived areas and attending Group A schools
were at the biggest disadvantage with respect to the Welsh average at both
KS3 and KS4. Moreover, this gap increased over time. This pattern was very
similar for pupils eligible for FSM, with the one difference being that the gap
with respect to the Welsh average was reduced for all groups at KS3 (but by a
much larger margin for Group C relative to Group A schools).
2.17 For Action (Plus) and SEN Statemented pupils at KS3, the data showed
evidence of convergence over time towards the Welsh average – with the sole
exception of Statemented pupils in Group C schools (where the gap widened
by one percentage point). The story was less positive at KS4, where the gap
remained the same or widened for all groups of pupils except those on Action
Plus in Group C schools, where the gap narrowed by four percentage points
post-SCC . This data snapshot, however, does not take into consideration any

Evaluation of SCC A quantitative analysis of pupil-level data
18
broader trends in attainment for SEN pupils in Wales, as comparisons are
made with respect to the overall Welsh average.
2.18 Finally, in terms of minority ethnic (non-white) pupils, there are indications that
Group C schools – incidentally, also the group of schools with the largest
proportion of black and minority ethnic, pupils – made considerable strides in
terms of increased attainment over time. Pupils in this group moved from a
position of lagging behind the Welsh average (over three percentage points
below the Welsh average in KS4 English) to exceeding it in the post-SCC
years (to almost four percentage points above). Minority ethnic, non-white
pupils in all school groups at both KS3 and KS4 either converged towards, or
exceeded, the Welsh average during the post-intervention period.
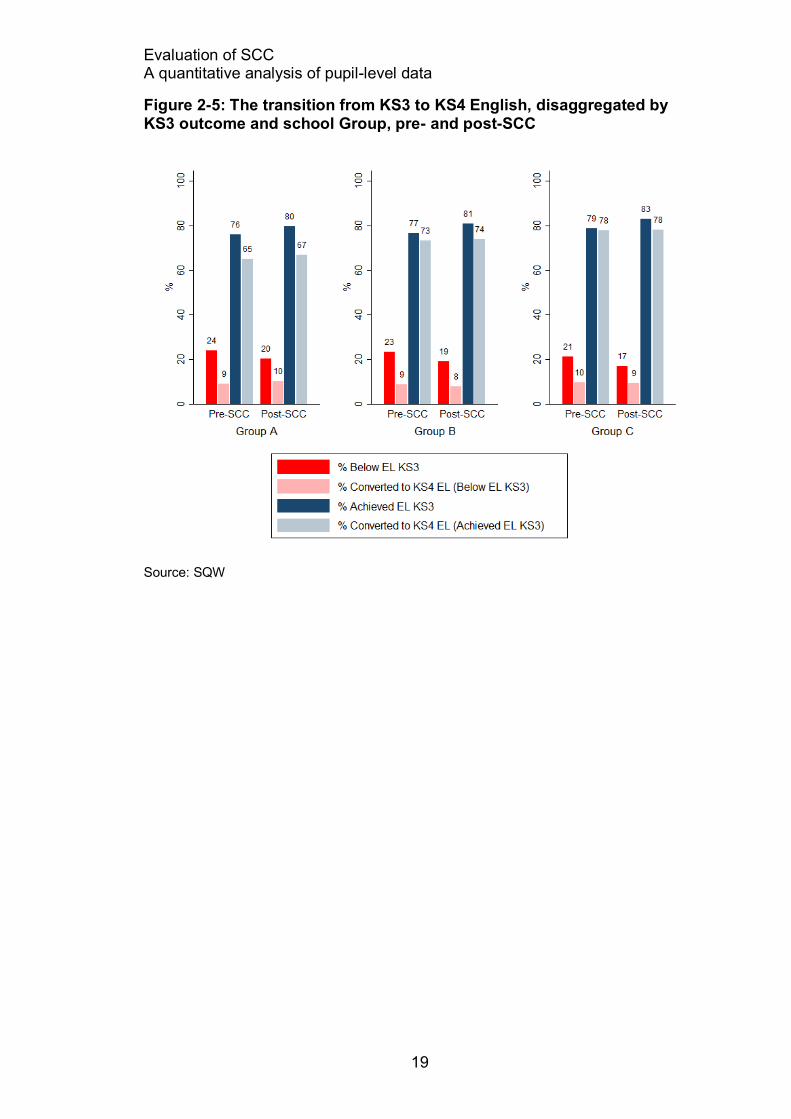
2.19 Figure 2-5 presents the transition from KS3 to KS4 English, differentiating
between pupils who achieved the expected level at KS3 and those who did
not. The figure shows a few things of note. First, that over time more pupils
achieved the expected level at KS3 in English (with an improvement from
76% to 80% in Group A schools, from 77% to 81% in Group B schools and
79% to 83% in Group C schools). Second, the figure illustrates the very low
conversion rate for pupils who did not achieve the expected level at KS3 (less
than one in ten pupils who failed to achieve the expected level at KS3 went on
to achieve the expected level at KS4). Finally, across the three groups of
schools, Group C achieved the most favourable outcomes for its pupils, and
strengthened this position over time, achieving both the highest proportion of
pupils achieving the expected level at KS3, and the highest conversion rate
for these pupils in terms of their KS4 outcome. In the two years since the
launch of SCC, nearly four fifths (78%) of pupils who achieved the expected
level at KS3 went on to achieve the expected level at KS4, compared to two
thirds (67%) of pupils in Group A schools.
Evaluation of SCC A quantitative analysis of pupil-level data
19
Figure 2-5: The transition from KS3 to KS4 English, disaggregated by KS3 outcome and school Group, pre- and post-SCC
Source: SQW
Evaluation of SCC A quantitative analysis of pupil-level data
20
Attainment in Maths
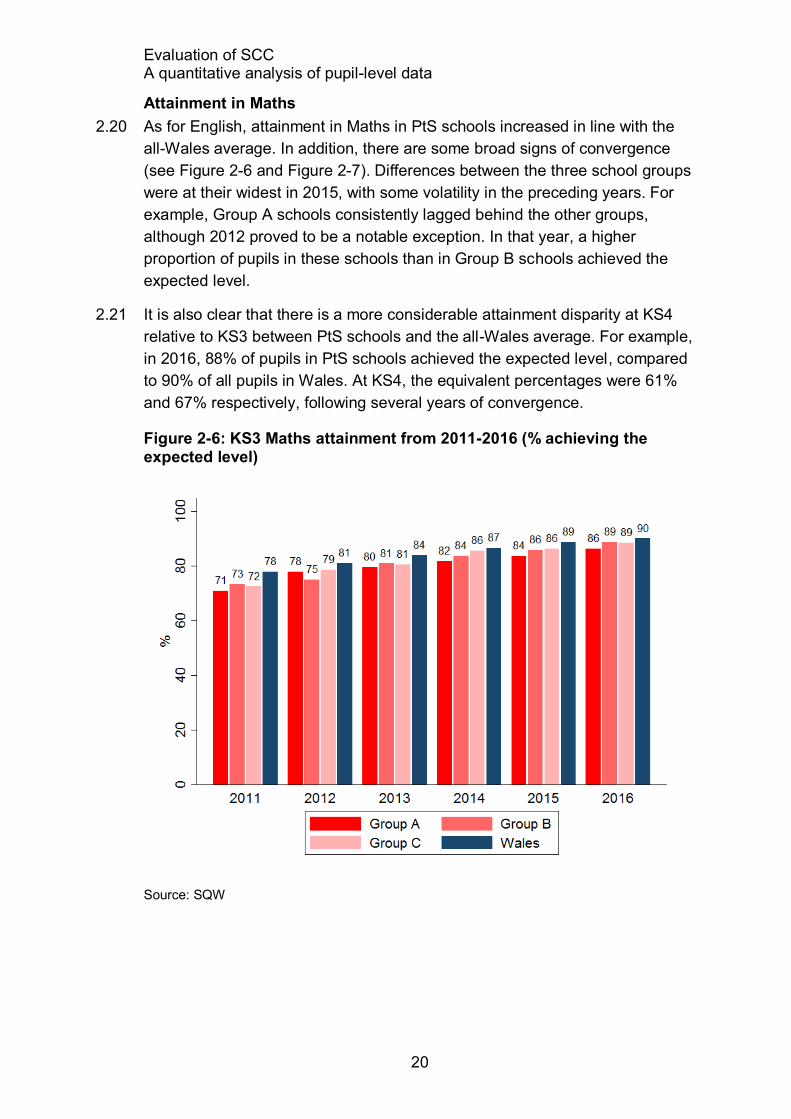
2.20 As for English, attainment in Maths in PtS schools increased in line with the
all-Wales average. In addition, there are some broad signs of convergence
(see Figure 2-6 and Figure 2-7). Differences between the three school groups
were at their widest in 2015, with some volatility in the preceding years. For
example, Group A schools consistently lagged behind the other groups,
although 2012 proved to be a notable exception. In that year, a higher
proportion of pupils in these schools than in Group B schools achieved the
expected level.
2.21 It is also clear that there is a more considerable attainment disparity at KS4
relative to KS3 between PtS schools and the all-Wales average. For example,
in 2016, 88% of pupils in PtS schools achieved the expected level, compared
to 90% of all pupils in Wales. At KS4, the equivalent percentages were 61%
and 67% respectively, following several years of convergence.
Figure 2-6: KS3 Maths attainment from 2011-2016 (% achieving the expected level)
Source: SQW

Evaluation of SCC A quantitative analysis of pupil-level data
21
Figure 2-7: KS4 Maths attainment from 2011-2016 (% achieving the expected level)
Source: SQW
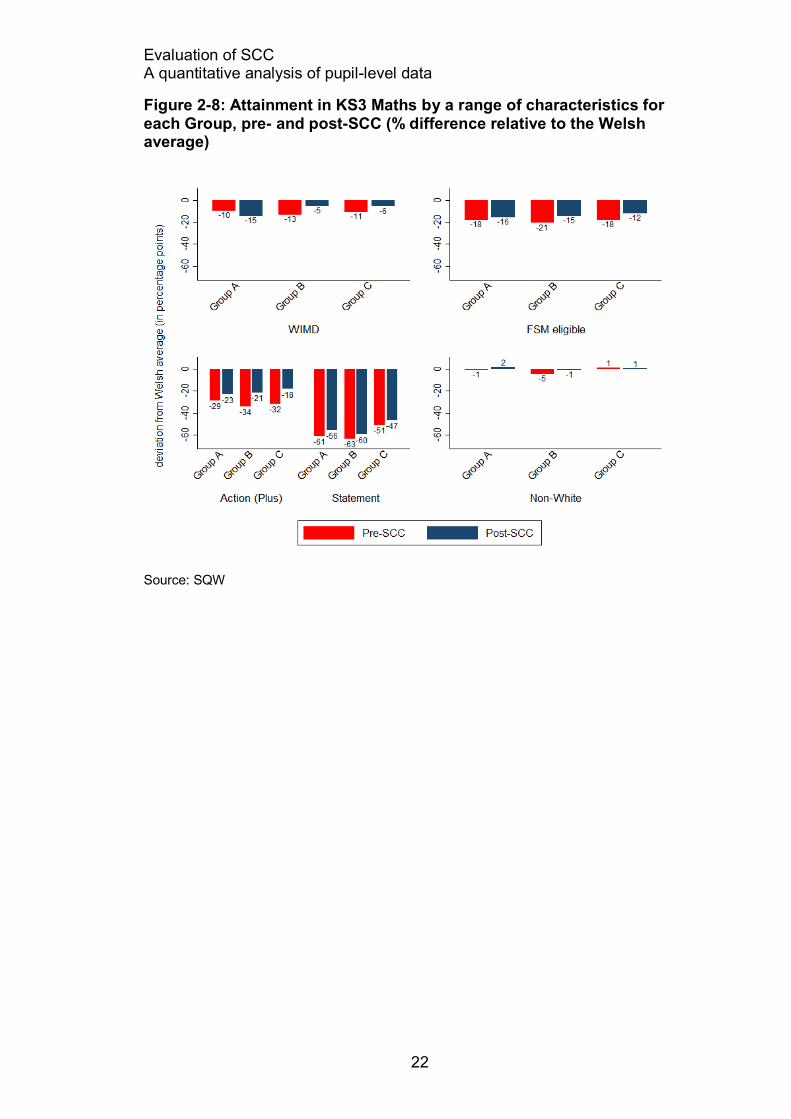
2.22 Figure 2-8 and Figure 2-9 present pre- and post-SCC attainment trends for
Maths at KS3 and KS4, respectively, for pupils residing in areas of
deprivation, those eligible for FSM, those with SEN, and non-white pupils.
Evaluation of SCC A quantitative analysis of pupil-level data
22
Figure 2-8: Attainment in KS3 Maths by a range of characteristics for each Group, pre- and post-SCC (% difference relative to the Welsh average)
Source: SQW

Evaluation of SCC A quantitative analysis of pupil-level data
23
Figure 2-9: Attainment in KS4 Maths by a range of characteristics for each Group, pre- and post-SCC (% difference relative to the Welsh average)
Source: SQW
2.23 In terms of pupils residing in the 10% most deprived regions in Wales
(WIMD), there is evidence to suggest that some PtS schools have started to
converge with the Welsh average since the introduction of SCC. Pupils in
Group C schools closed the gap with respect to the Welsh average by the
greatest margin, but pupils in Group A schools diverged, with a growing gap
between those schools and the Welsh average, at both KS3 and KS4. For
pupils eligible for FSM, patterns are similar to pupils living in deprived areas.
2.24 For SEN status pupils, the data show some convergence between the PtS
schools and the Welsh average over time for pupils with Action (Plus) and
Statement SEN status at KS3. At KS4 there is evidence of divergence for
Group A schools (greater for statemented pupils), limited change for Group B
schools, and convergence for Group C schools.
2.25 Finally, in terms of black and minority ethnic non-white pupils, there are mixed
patterns across the school groups. This is most likely due to the small
proportion of such non-white pupils in Welsh schools, which averaged 5.4% of
pupils across all PtS schools in 2016 (a range of from less than one per cent
to over 23% in individual schools). The data suggest that black and minority
ethnic non-white pupils fare better in Maths in Group C schools (where this

Evaluation of SCC A quantitative analysis of pupil-level data
24
group performs above the Welsh average, the only group to do so). More
generally, black and minority ethnic, non-white pupils tend to outperform white
pupils.
2.26 Finally, in terms of the conversion rate from KS3 to KS4 in Maths, Figure 2-10
illustrates broadly similar patters to those presented for English. It is notable,
however, that the pupils who fail to achieve the expected level at KS3 are very
unlikely to go on to reach the expected level at KS4 (only around 3% of such
pupils are successful). Across all PtS schools, the proportion of pupils who
were successful in achieving the expected level at KS3 and subsequently
achieved to the expected level at KS4, increased post-SCC. This was highest
for pupils in Group C schools.
Figure 2-10: The transition from KS3 to KS4 Maths, disaggregated by KS3 outcome and school Group, pre- and post-SCC
Source: SQW

Evaluation of SCC A quantitative analysis of pupil-level data
25
Attainment in Welsh
2.27 For attainment in Welsh, this analysis focusses on KS3 results alone, as very
few pupils in PtS schools sat a Welsh KS4 examination (107 pupils in 2016).
As noted above, it is for this reason that we do not analyse attainment in
Welsh in the later econometric modelling sections.
2.28 As illustrated in Figure 2-11, PtS schools have converged towards the Welsh
average over time. In Group C schools, for example, the percentage of pupils
achieving the expected level in KS3 Welsh increased from 57% in 2010/2011
to 80% by 2015/16, halving the gap with the Welsh average from 24
percentage points to 12 percentage points over this period. It is notable that
the differences between the three schools groups are at their lowest in the
2015/16 academic year.
Figure 2-11: KS3 Welsh attainment from 2011-2016 (% achieving the expected level)
Source: SQW
2.29 In terms of specific pupil characteristics, Figure 2-12 shows that Group C
schools made the most progress in reducing disparities with respect to the
Welsh average over time, particularly for pupils living in deprived areas
(WIMD), with FSM eligibility and on Action (Plus) SEN status. For pupils with
a Statement of SEN, and also for black and minority ethnic, non-white pupils,
patterns across school groups were more nuanced. In both cases, Group A
schools made the most progress, while Group B schools made less. In those

Evaluation of SCC A quantitative analysis of pupil-level data
26
schools, the gap between black and minority ethnic, non-white pupils and the
Welsh average increased. However, it is important to restate the fact that
black and minority ethnic, non-white pupils represent only a small proportion
of the pupils in these schools.
Figure 2-12: Attainment in KS3 Welsh across a range of characteristics for each Group, pre- and post-SCC (% difference relative to the Welsh average)
Source: SQW

Evaluation of SCC A quantitative analysis of pupil-level data
27
Attainment in L2I
2.30 As the SCC intervention is not designed to target attainment in English and
Maths specifically, we also present analysis of the L2I composite measure of
attainment. The patterns presented in Figure 2-13 are broadly consistent with
the attainment measures presented previously for English and Maths.
2.31 As Figure 2-13 shows, differences between the three schools groups in the
2010/11 academic year were minimal (a differential of one percentage point),
increasing substantially by 2013/14 (a differential of 14 percentage points
between Group A and C schools). This gap fell to approximately five
percentage points by the 2015/16 academic year. Over this period, the gap
between PtS schools and the Welsh average fell considerably, from around
15 percentage points in 2010/11 for Group C schools to six percentage points
in 2015/16. It is notable that for Group B and C schools, the gap with respect
to the Welsh average had been increasing prior to the introduction of SCC.
For Group A schools, the majority of progress was made in the 2015/16
academic year (that is, post SCC).
Figure 2-13: L2I attainment from 2011-2016 (% achieving the expected level)
Source: SQW
Evaluation of SCC A quantitative analysis of pupil-level data
28
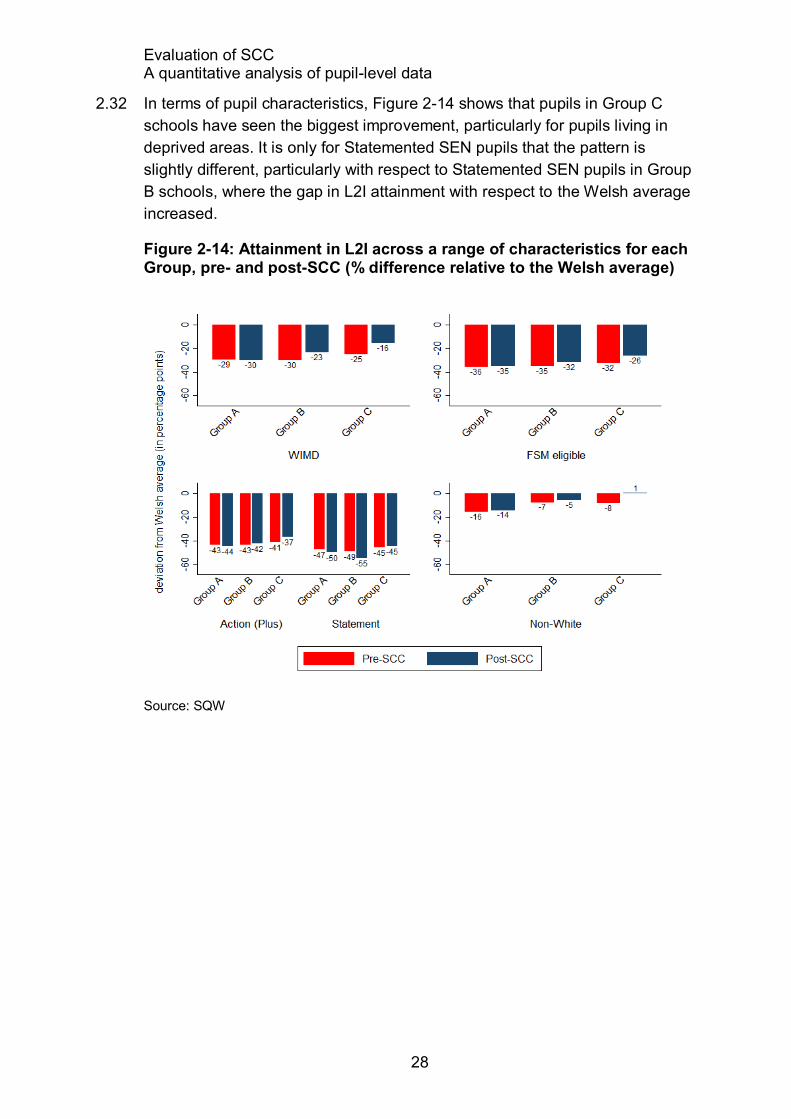
2.32 In terms of pupil characteristics, Figure 2-14 shows that pupils in Group C
schools have seen the biggest improvement, particularly for pupils living in
deprived areas. It is only for Statemented SEN pupils that the pattern is
slightly different, particularly with respect to Statemented SEN pupils in Group
B schools, where the gap in L2I attainment with respect to the Welsh average
increased.
Figure 2-14: Attainment in L2I across a range of characteristics for each Group, pre- and post-SCC (% difference relative to the Welsh average)
Source: SQW

Evaluation of SCC A quantitative analysis of pupil-level data
29
Attendance rate
2.33 There are very limited differences in attendance rates across PtS schools,
and between PtS schools and the Welsh average, across the full time period
under analysis (a maximum disparity of 3%), as illustrated in Figure 2-15.
Figure 2-15: Attendance rate from 2011-2016 (%)
Source: SQW
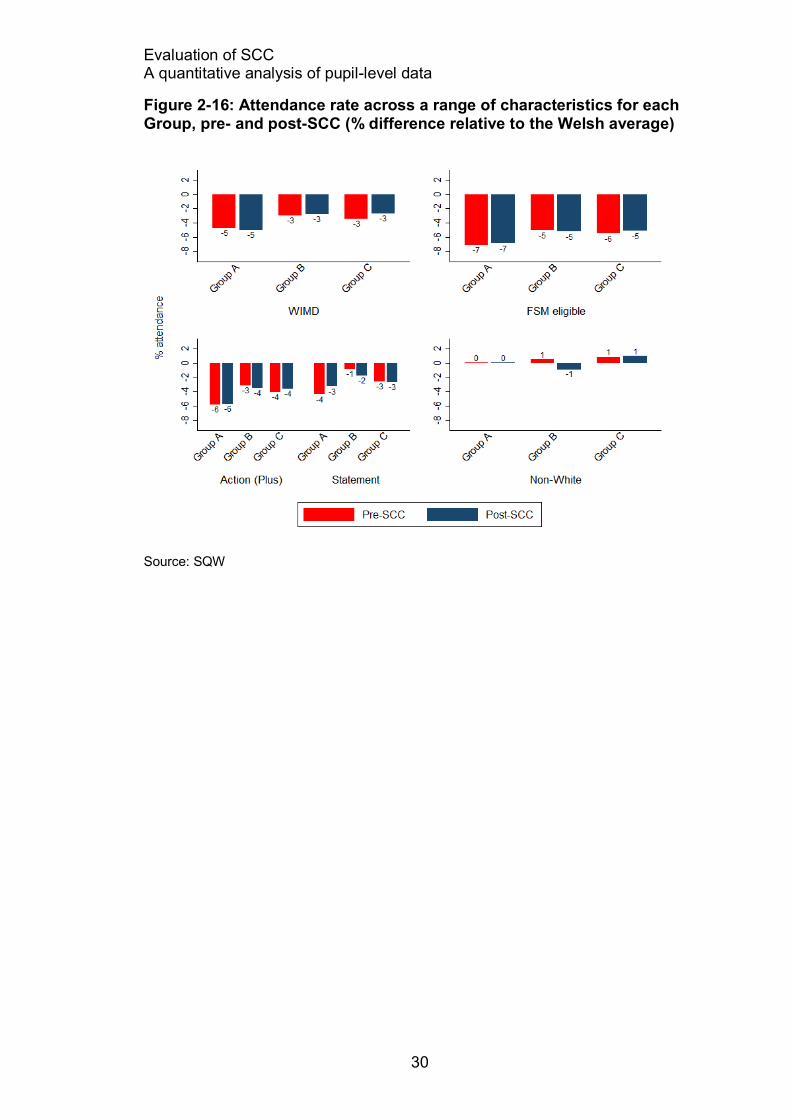
2.34 More interestingly, however, there are differences by pupil characteristics
across school groups. In terms of pupils living in deprived areas (WIMD), only
Group C schools made progress in reducing their attendance disparity with
respect to the Welsh average (see Figure 2-16). A similar story is true for
FSM eligible pupils. In terms of SEN status, the data show that Group A
schools have the largest disparity with respect to the Welsh average, both
before and after the introduction of SCC. However, for Statemented SEN
pupils this gap has fallen by around one percentage point over the two time
periods presented.
Evaluation of SCC A quantitative analysis of pupil-level data
30
Figure 2-16: Attendance rate across a range of characteristics for each Group, pre- and post-SCC (% difference relative to the Welsh average)
Source: SQW

Evaluation of SCC A quantitative analysis of pupil-level data
31
Unauthorised absence rate
2.35 Unauthorised absence rates are higher in Group A schools by a clear margin,
and were consistently more than double the Welsh average rate. As Figure
2-17 shows, there has been mixed progress over time for pupils in these
schools, initially showing some signs of convergence, before increasing to a
time-period maximum of 3.9% in the 2014/15 academic year. This figure fell to
3.5% in the 2015/2016 academic year. For Group B and C schools, the
patterns are similarly mixed, although the differential with respect to the Welsh
average is far less. In both cases, unauthorised absence rates were on a
downward trajectory from 2010/11 to 2013/14, but then increased in the
2014/15 and 2015/16 academic years, after the introduction of SCC. This is a
challenging finding, since reducing unauthorised absence was central to
action planning in most PtS schools. In some instances (possibly most), the
increase may have reflected better monitoring (with fewer instances of truancy
passing un-recorded). In others, however, it may have reflected a higher level
of challenge (both pastorally and academically) to pupils leading to an
apparent rise in unauthorised absence.
Figure 2-17: Unauthorised absence rate from 2011-2016 (%)
Source: SQW
Evaluation of SCC A quantitative analysis of pupil-level data
32
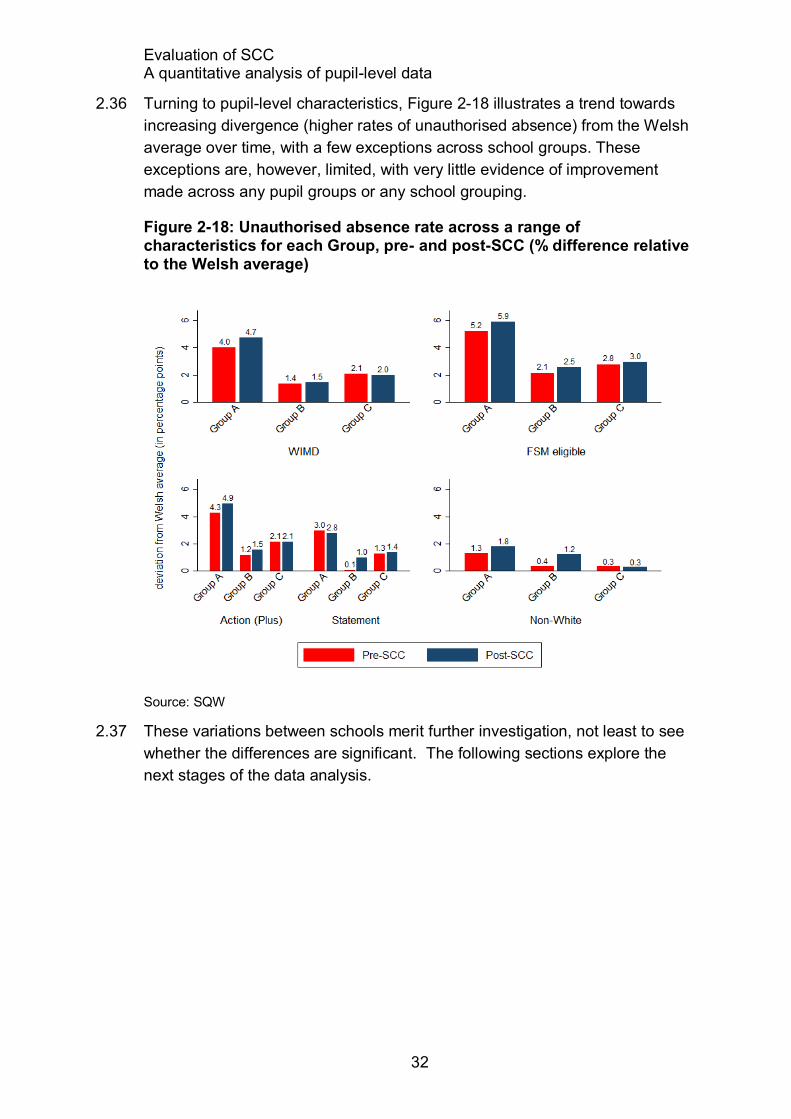
2.36 Turning to pupil-level characteristics, Figure 2-18 illustrates a trend towards
increasing divergence (higher rates of unauthorised absence) from the Welsh
average over time, with a few exceptions across school groups. These
exceptions are, however, limited, with very little evidence of improvement
made across any pupil groups or any school grouping.
Figure 2-18: Unauthorised absence rate across a range of characteristics for each Group, pre- and post-SCC (% difference relative to the Welsh average)
Source: SQW
2.37 These variations between schools merit further investigation, not least to see
whether the differences are significant. The following sections explore the
next stages of the data analysis.

Evaluation of SCC A quantitative analysis of pupil-level data
33
3. Multilevel (hierarchical) analysis of pupil-level data
3.1 The descriptive overview of the pupil-level data provides indications of
differences in pupil outcomes across a variety of categories, including the
different groups of PtS schools. This section presents a series of multivariate
models in order to provide further evidence of the relative role, in statistical
terms, of a range of factors in driving pupil-level outcomes.
The data and approach
3.2 This analysis focusses on three measures of attainment (English, Maths, and
L2I), as well as attendance and unauthorised absence outcomes. Few pupils
in these schools took Welsh as a first language, which means the sample size
was too small to carry out a robust econometric analysis of Welsh language
attainment.
3.3 The approach taken is that of multilevel modelling. This statistical approach
enables both pupil-level and school-level drivers of pupil outcomes to be
analysed together in order to identify the main factors in the available data
(from the NPD) that appeared to be associated with higher levels of
attainment and attendance.
3.4 Each of the models included a series of variables at school level, such as
level of deprivation (proportion of pupils in lowest 10% of WIMD), gender
parity of the cohort, proportion of pupils eligible for FSM and proportion of
pupils with SEN status (see Table 3-1). At pupil level, variables included
gender, FSM eligibility, prior attainment and attendance.
3.5 Some variables, therefore, were both background variables (to explore the
impact of attendance on attainment, for example) and outcome variables (to
explore the association between FSM and attendance). Finally, the models
were all run with a full set of time variables, to assess significant differences
on a year-by-year basis, pre- and post- SCC.
3.6 The available variables at pupil- and school- level are set out in Table 3-1.

Evaluation of SCC A quantitative analysis of pupil-level data
34
Table 3-1: Variable list
Pupil-level School-level
Gender Gender ratio (% female)
Ethnicity Ethnicity (% non-white)
FSM eligibility FSM eligibility (% eligible for FSM)
SEN status SEN status (% with SEN status)
Attendance Attendance (% school average)
Live in deprived area (10% WIMD rank) Proportion of pupils that live in lowest 10% of WIMD ranked LSOAs
Prior attainment Primary language medium
Group (assigned)
School size (pupil numbers)
Source: SQW
3.7 The modelling was conducted in two steps:
The first was to specify a model of pupil-level performance (such as
attainment in maths) to form the basis of subsequent analysis
(including the forecasting models – see Section 4).
The second step was to use this model to test a range of time-
interaction effects on the full range of pupil-characteristics, including
ethnicity, SEN status, FSM eligibility and living in a deprived area (the
lowest 10% of WIMD ranked LSOAs).
3.8 From the models, it was possible to identify the factors that appeared to be
most closely associated with higher attainment and attendance, controlling for
all other variables in the models. We should emphasise that the models were
exploratory and, since they were limited to the data available in the NPD,
could not be fully explanatory.
3.9 All models were run in Stata, making use of binary (Stata command “melogit”)
and continuous outcome variables (Stata command “mixed”). All models
were run with “robust” standard errors (that, is the estimates are robust to
some types of misspecification so long as the observations are independent).
3.10 It is important to note that all models presented in this section include the all-
pupil Welsh average as a variable. This is included to control for a broad
trend towards increasing attainment over time. In other words, year on year, a
greater proportion of pupils achieved the expected level, on average, across
all Welsh schools. We control for this trend in order to better distinguish
specific trends – such as any evidence of convergence – from this broader

Evaluation of SCC A quantitative analysis of pupil-level data
35
pattern of rising attainment, and making it easier to compare results over time.
This variable is omitted from the figures for ease of presentation.
3.11 The results of the multilevel models are presented in the form of charts that
plot the point estimate (coefficient7) and the confidence interval that surrounds
them. A variable can be considered statistically significant where this
confidence interval does not bisect the vertical line at zero. If the estimate is to
the right of this zero-line, the association with the outcome variable can be
considered positive (where statistically significant) and to the left, negative.
3.12 Finally, and relatedly, for ease of interpretation throughout this section,
explanatory variables (i.e. gender) are interpreted in terms of being more or
less likely to be associated with outcome variables (i.e. attainment in English).
For example, if the gender variable (coded as female=1, male=0) is positive
and significant in the model, this would be understood as saying that being
female means it is more likely that the outcome variable is achieved. It is
important to note that, from a technical standpoint, the models produce results
in terms of odds-ratios, and increased/decreased odds.
3.13 Each chart is divided into three sections. The first set of coefficients at the top
of each chart refer to key variables of interest, the second set refer to pupil-
level factors, and the final set to school-level factors. For time-variables it is
important to note that they are treated as categorical, dummy variables and
the year 2009/2010 is the baseline year. In other words, all results should be
interpreted in terms of their relationship to the performance of a particular
outcome in 2009/2010.
3.14 Following each overview chart, a second set of four charts is presented to
focus on specific interaction effects. The purpose of these additional charts is
to reveal any important dynamics over time. Four interactions are focussed
on, and these are living in a deprived area, FSM eligibility, SEN status, and
ethnicity. Each chart forms an extension of the main chart preceding it but, for
presentational purposes, only the key interaction variables are presented.
Attainment in English
3.15 The baseline model for KS3 attainment in English is presented in Figure 3-1
and shows a strong positive association between KS2 English attainment
(att_eng_ks2) and KS3 attainment. In other words, higher attainment at KS3
is strongly associated with higher attainment at KS2. The time trend variables
(2010.year-2015.year) further indicate that, over time the likelihood of
attaining the expected level in KS3 English amongst pupils in these schools
has decreased (once all other variables are taken into account). Given that
7 Full multilevel model output tables are presented in the annex (in the form of odds-ratio’s, as
opposed to model coefficients in the charts) for ease of interpretation.

Evaluation of SCC A quantitative analysis of pupil-level data
36
the models take the change in average Welsh attainment over time into
account, this suggests that the rate of improvement in KS3 results since 2010
in PtS schools may be slower than the national average, though the findings
are neither large nor statistically significant.
Figure 3-1: Baseline model for KS3 English
Source: SQW
3.16 In terms of pupil-level characteristics, being female, of ethnic minority status
(non-white) and having higher rates of attendance are all associated with
higher rates of attainment, while FSM eligibility, SEN status and living in a
deprived area (wimd10) are all associated with lower rates of attainment. All
of these coefficients are statistically significant.
3.17 Finally, in terms of school-level factors, four are significant in terms of
increasing the likelihood of achieving the expected level in KS3 English
across schools. Some of these are expected: pupils in schools with higher
rates of attendance (sch_attend) do better than pupils in schools with low
average attendance, for instance. Others are more challenging: pupils in
schools with a higher proportion of SEN pupils (sch_sen) do better than their
peers, as do pupils in schools with a higher proportion of pupils living in
deprived areas (sch_wimd10), and being a Welsh language-medium school
(land_2). Clearly there are other variables at work here.

Evaluation of SCC A quantitative analysis of pupil-level data
37
3.18 Figure 3-2 takes a more focussed look at interaction effects between four key
variables (WIMD, FSM eligibility, SEN status and ethnicity) individually and
over time. The objective is to see how the relationship between each of these
factors has altered over time. The results provide some evidence that SEN
Action (Plus) (1.sen) and Statement (2.sen) pupils are falling further behind at
KS3 (particularly in 2016), and that for both categories of SEN the trend is
towards a reduced likelihood of achieving the expected level in KS3 English.
Most of these results are not statistically significant and (as can be seen) are
surrounded by large confidence intervals. The opposite trend is apparent for
FSM and ethnic minority status pupils, where the likelihood of achieving the
expected level of attainment appears to increase over time. In both cases,
however, the results are statistically insignificant.
Figure 3-2: A focus on interaction effects for KS3 English
Source: SQW
3.19 For KS4 English, many of the patterns associated with KS3 attainment also
hold, with a few exceptions. As can be seen in Figure 3-3, prior attainment
remains highly positively associated with increased chances of achieving the
expected level in KS4 English. The evidence shows that, relative to the base
year (2009/2010) and taking into account changes in the Welsh national
average, there has been little change in performance over time, with the
exception of 2013 (the year pre-SCC) where attainment was lower, but has
since recovered.

Evaluation of SCC A quantitative analysis of pupil-level data
38
3.20 Across pupil-level variables, the patterns remain fully consistent with the KS3
findings. For the school-level variables, the patterns broadly remain the same,
although the pupils in schools with a high proportion of SEN pupils have a
greater likelihood of higher attainment in KS3 English. This does not mean
that the SEN pupils do better, but that their peers, on average, do better than
pupils in other schools.
Figure 3-3: Baseline model for KS4 English
Source: SQW
3.21 In terms of interaction effects, Figure 3-4 presents a range of different trends,
although none are statistically significant. For each of the variables (WIMD,
FSM, SEN and Ethnicity), there are signs of improvement in the PtS schools
in recent years compared to the baseline year 2009/2010. This trend is most
clearly seen for the WIMD and FSM analysis, showing a general increase in
the chances of achieving the expected level in KS4 English over time (even
controlling for the upward trend in attainment seen across Wales as a whole).
For SEN status and ethnicity variables, it is only in recent years (2015/2016
especially) that this positive trend is observed.

Evaluation of SCC A quantitative analysis of pupil-level data
39
Figure 3-4: A focus on interaction effects for KS4 English
Source: SQW

Evaluation of SCC A quantitative analysis of pupil-level data
40
Attainment in Maths
3.22 Figure 3-5 presents the multilevel model results for attainment in Maths at
KS3. The picture is broadly consistent with the patterns observed for KS3
English.
Figure 3-5: Baseline model for KS3 Maths
Source: SQW
3.23 One feature of Figure 3-6 that stands out is the decreased likelihood of pupils
with a Statement of SEN achieving the expected level in KS3 Maths.
Following a brief (though not significant) recovery in 2013/2014, these have
deteriorated. For all other interaction effects the results appear to be mixed
and very few of the coefficients are statistically significant.

Evaluation of SCC A quantitative analysis of pupil-level data
41
Figure 3-6: A focus on interaction effects for KS3 Maths
Source: SQW
3.24 Unlike the finding in the models for English or for KS3 Maths, boys had a
greater chance of achieving the expected level in KS4 Maths. As shown in
Figure 3-7, it is also clear than prior attainment matters for individual pupil’s
attainment in KS4 Maths, as does the pupil’s own attendance rate. Consistent
with the preceding models, being eligible for FSM or having SEN is
associated with a lower likelihood of attaining the expected level. At the
school-level, two variables are statistically significant. Pupils in schools with a
higher proportion of FSM eligible pupils are less likely to achieve the expected
level in KS3 Maths, while being in a school with a higher proportion of SEN
status pupils is positively associated with the same outcome.

Evaluation of SCC A quantitative analysis of pupil-level data
42
Figure 3-7: Baseline model for KS4 Maths
Source: SQW
3.25 In terms of interaction effects, Figure 3-8 provides a mixed picture across the
variables of interest. There are encouraging signs for FSM eligible pupils and
for SEN Statemented pupils, with coefficients moving in a more positive
direction in recent years. However, only the former (for FSM pupils) is
statistically significant, and only for 2015/2016. For the latter (SEN), this
improvement is the opposite of the trend previously noted for KS3 Maths.

Evaluation of SCC A quantitative analysis of pupil-level data
43
Figure 3-8: A focus on interaction effects for KS4 Maths
Source: SQW

Evaluation of SCC A quantitative analysis of pupil-level data
44
Attainment in L2 inclusive (of English/Welsh and Maths)
3.26 As there is no equivalent measure of L2I (Level 2 inclusive) available at KS3,
a composite variable is created to represent the best equivalent proxy with the
data available. This variable simply indicates whether a pupil achieved the
expected level in both English and Maths at KS3. As presented in Figure 3-9,
this measure of prior attainment is clearly associated with KS4 L2I
performance, as would be expected.
Figure 3-9: Baseline model for L2I
Source: SQW
3.27 In terms of pupil-level characteristics, higher rates of attainment are
associated with high rates of attendance, with being female, and with non-
white pupils. Lower levels of attainment are associated with pupils eligible for
FSM, those with SEN status, and pupils living in deprived areas.
3.28 At the school-level, pupils in schools with high proportions of FSM eligible
pupils are associated with lower rates of L2I attainment, while pupils attending
schools with higher proportions of SEN status pupils are associated with
higher attainment.
3.29 The full set of interaction effects are presented in Figure 3-10. For each of the
characteristics focussed upon, the patterns are mixed. While there are some
indications that WIMD and FSM eligible pupils are improving over time (i.e.
closing the gap relative to non-WIMD and FSM ineligible pupils, respectively),
these trends are volatile and do not reach statistical significance.

Evaluation of SCC A quantitative analysis of pupil-level data
45
Figure 3-10: A focus on interaction effects for L2I
Source: SQW

Evaluation of SCC A quantitative analysis of pupil-level data
46
Attendance
3.30 All the attendance models control for prior attendance in the previous year,
but for presentational purposes this variable is omitted from the figures.
Relative to the baseline year (2009/2010), pupil-level attendance has been
higher in each subsequent year, but the rate of improvement has been
declining. In terms of pupil-level characteristics, being female is associated
with lower rates of attendance, as is being eligible for FSM, living in a
deprived area, and having SEN (although only Action [Plus] status pupils)
(see Figure 3-11). Non-white pupils are associated with higher rates of
attendance. At the school level, the patterns are consistent with the preceding
analysis. Schools in which there are high proportions of FSM eligible pupils
are negatively associated with good attendance, while schools with a high
proportion of SEN status pupils are positively associated with good
attendance.
Figure 3-11: Baseline model for attendance rates
Source: SQW
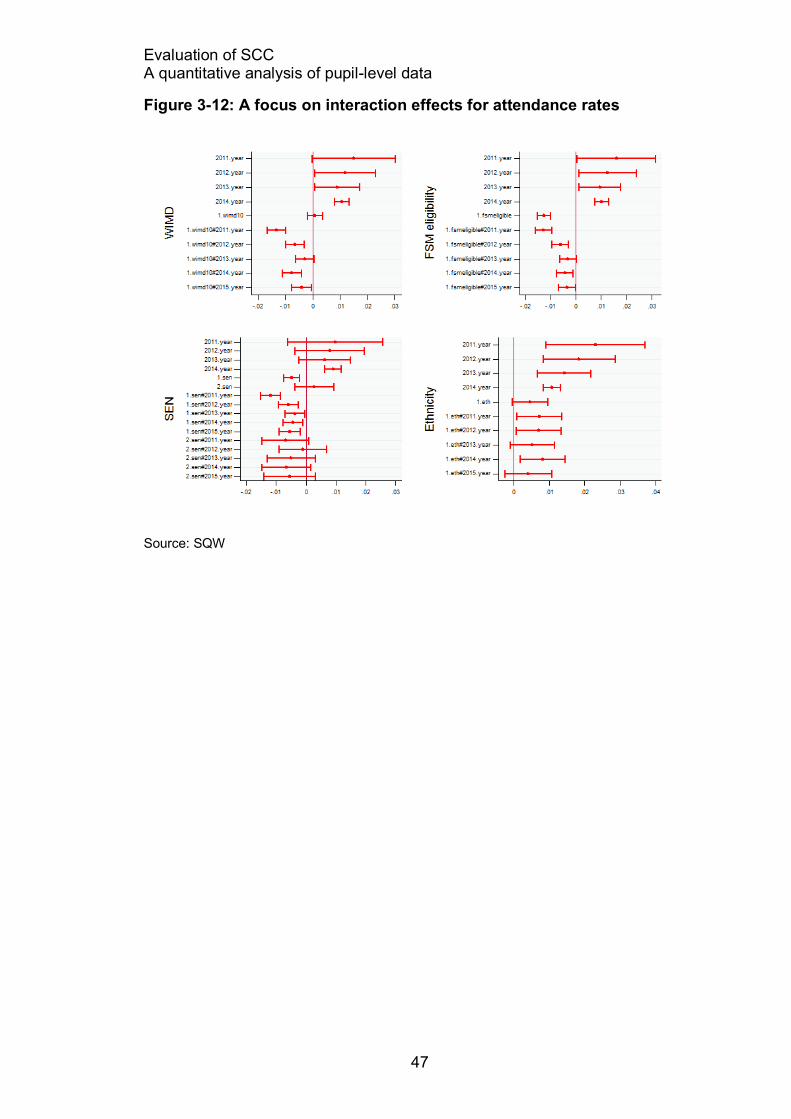
3.31 The interaction effects, as presented in Figure 3-12, suggest that for FSM
eligible pupils, as well as those living in the 10% most deprived regions, the
difference with respect to non-FSM and non-WIMD10 pupils, respectively, has
been decreasing over time. In terms of the attendance of SEN status and non-
white pupils, the patterns are much more mixed.
Evaluation of SCC A quantitative analysis of pupil-level data
47
Figure 3-12: A focus on interaction effects for attendance rates
Source: SQW

Evaluation of SCC A quantitative analysis of pupil-level data
48
Unauthorised absence
3.32 Figure 3-13 shows that high levels of unauthorised absence are associated
with pupils who are eligible for FSM, those with SEN status (both Statement
and Action [Plus]), and those living in a deprived area, At the school-level,
pupils in schools with high proportions of FSM eligible pupils have significantly
higher levels of unauthorised attendance. The only factor associated with
lower rates of unauthorised absence is being from a minority ethnic or non-
white group of pupils.
Figure 3-13: Baseline model for unauthorised absence rates
Source: SQW
3.33 In terms of interactions effects, Figure 3-14 shows mixed patterns for FSM
eligible and non-white pupils over time. For pupils with SEN status, there is
some evidence of increasing rates of absence for both Statemented and
Action (Plus) pupils and similar evidence for pupils living in deprived areas.

Evaluation of SCC A quantitative analysis of pupil-level data
49
Figure 3-14: A focus on interaction effects for unauthorised absence rates
Source: SQW

Evaluation of SCC A quantitative analysis of pupil-level data
50
4. Assessing the performance of P2S schools
4.1 The principal challenge to overcome in assessing the performance of P2S
schools is establishing a valid counterfactual scenario against which to judge
their performance. Due to the nature of the intervention, as well as the mix of
additional interventions taking place across schools, it was not possible to
select a set of comparison schools against which to make comparisons or to
test for differences using econometric methods. Accordingly, the approach
adopted was experimental, creating a counterfactual scenario by analysing
the trajectory of PtS schools prior to the onset of the SCC intervention and
then using an econometric methodology to forecast the performance of these
schools over subsequent years. We take these predictions and compare them
to the reported results for each of the PtS schools. Various forecasting
methods were trialled as part of this process, from straightforward linear
trends of historic data, to conditional forecasting models that factor in the
nature and characteristics (including past performance) of the cohort of pupils
in each school in each forecasted year.
4.2 From a technical standpoint, the forecasting models and analyses were
conducted in Stata using a combination of the commands “xtreg” and
“forecast”. Together, these commands enable the development of models to
describe the performance of PtS schools prior to the introduction of SCC in
2014/15, and then use this information to predict future values of the various
outcomes (attainment, attendance, unauthorised absence).
4.3 As seen in the earlier analysis, trends in each of the outcome measures are
volatile. On top of this, the relatively small sample size (39 schools) and a
limited range of data available on pupil characteristics (that which is in the
NPD), means that the results presented should be treated with caution, with
attention paid to the confidence intervals that surround the estimates. In light
of these issues, and to provide the best possible indication of trends in PtS
school outcomes, four variations of the forecasting model are presented, as
set out in Table 4-1.

Evaluation of SCC A quantitative analysis of pupil-level data
51
Table 4-1: Forecasting models
Model Description
Model 1 (unconditional) A simple model that incorporates a time trend using 5 years of data (2009/10-2013/14).
Model 2 (simple conditional) A baseline forecast model that incorporates a time trend, incorporating the prior attainment of each pupil-cohort and Welsh average attainment trajectory, using 5 years of data (2009/10-2013/14)*
Model 3 (extended conditional) Similar to Model 2, but additionally incorporating some pupil-cohort characteristics (including gender balance, proportion of SEN pupils, and proportion of pupils living in deprived areas [lowest 10% WIMD ranked LSOAs]), using 5 years of data (2009/10-2013/14).
Model 4 (extended conditional, short time-period)
As Forecast Model 3, but using only 3 years of data (2011/12-2013/14).
Source: SQW; *for KS3 outcomes, the maximum time-period is 4 years due to the lack of availability to the team of historic KS2 data for pupils completing KS3 in 2009/10.
4.4 The first step of the forecasting process was to specify the underlying model
from which to generate forecasts. This was conducted across two time-
periods, from 2009/2010 to 2013/2014 (five years of data, four years for KS3
outcomes8) and from 2011/2012 to 2013/2014 (three years of data). As some
outcomes are particularly volatile over time, this approach was adopted in
order to understand how sensitive the models would be to this volatility, and to
shed some light on the most appropriate time-horizon over which to forecast
school performance, where possible. The remainder of this section proceeds
with analysis and discussion of the preferred specification (Model 3 –
extended conditional), unless otherwise stated. This model was preferred as
it generally provided the best model fit across all outcome variables (see
Table 4-2), suggesting that a longer time-horizon was (marginally) preferred
for making forecasts, most likely because it was better at smoothing the
volatility inherent in the data. Full model outputs are presented in the technical
annex (presented in Table A-1 to Table A-4).
4.5 Focussing on the Model 3 specification, the results show that the model fit
varied across the outcome measures, ranging from 0.129 for KS4 English to
0.643 for KS3 Maths. It is interesting to note that the model for predicting KS3
outcomes in English and Maths outperforms the KS4 outcomes in terms of the
goodness of fit of the model, suggesting that KS2 outcomes are a better
predictor of KS3 outcomes, than KS3 outcomes are for KS4 outcomes. This is
perhaps not surprising given that KS2 and KS3 are assessed on a similar
8 Due to the lack of availability of historic KS2 data for pupils completing KS3 in 2009/10, the
maximum data period is from 2010/11 – 2013/14.

Evaluation of SCC A quantitative analysis of pupil-level data
52
basis (teacher assessment), than KS3 and KS4 (the latter being an
independently assessed measure of performance).
Table 4-2: R-squared values for each type of model specification and outcomes variable
Model KS
3 E
ng
lish
KS
4 E
ng
lish
KS
3 M
ath
s
KS
4 M
ath
s
L2I
Att
en
dan
ce
Un
au
tho
rised
ab
sen
ce
Model 1 0.653 0.018 0.619 0.155 0.190 0.484 0.022
Model 2 0.648 0.096 0.625 0.239 0.342 0.620 0.286
Model 3 0.660 0.129 0.643 0.272 0.358 0.646 0.298
Model 4 0.607 0.195 0.629 0.227 0.397 0.635 0.170
Source: SQW
4.6 The results indicate that prior performance is a highly significant predictor of
each outcome measure, and determines a considerable proportion of the
model fit in each. It is also clear from the results that the average achievement
across Wales is important, essentially acting as a proxy-control (particularly in
terms of the attainment outcomes) for the general trend towards increasing
performance over time.
4.7 In terms of the added explanatory variables, WIMD and SEN, they feature as
statistically significant in four of the seven outcomes models. The direction of
influence, however, was not consistent across the outcomes. For example,
higher proportions of WIMD pupils are positively associated with KS3 English
performance, but significant and negatively associated with KS4 Maths (and
very close to being significant and negatively associated with KS4 English at
the 10% level). For KS3 Maths and Attendance, there is a positive association
between higher proportions of SEN status pupils and these outcomes. More
generally, the inclusion of these additional contextual variables adds modestly
to the model fit (between 1-3% increase in the goodness of fit for each
outcome – see Annex A).
4.8 The next step of the analysis is to take these underlying models as the
foundation for making forecasts for the next two years of data (for the
academic years 2014/2015 and 2015/2016). Under the preferred specification
(Model 3), these forecasts are conditional upon several factors. In addition to
the trends presented in each model for forecasted years, each school-level
prediction is based upon the prior performance of the cohort (i.e. for KS4
Maths performance, the model controls for the KS3 performance of that
cohort). It is also based on the cohort composition in terms of the proportion of
pupils living in deprived areas (WIMD, 10% most deprived) and the proportion

Evaluation of SCC A quantitative analysis of pupil-level data
53
of pupils with SEN. As described in more detail in the Annex, the tool used to
make these forecasts is the “forecast” command in Stata, an in-built
forecasting management tool. It is important to note that forecasts are made
at the school-level, but using information from the full set of schools to make
forecasts. For presentational purposes, we then aggregate the school-level
forecasts into Groups. The Group variables do not enter into the model
specifications in any way, and are only used as the basis for the post-
estimation analysis.
4.9 Figure 4-1presents a comparison of the forecasts of each model specification
for each outcome variable. Above all, the models show that small changes to
the specification can alter the forecasts considerably. As illustrated in more
detail in the annex, Model 3 is the preferred option, largely because the
underlying specifications generally fit the data better.
Evaluation of SCC A quantitative analysis of pupil-level data
54
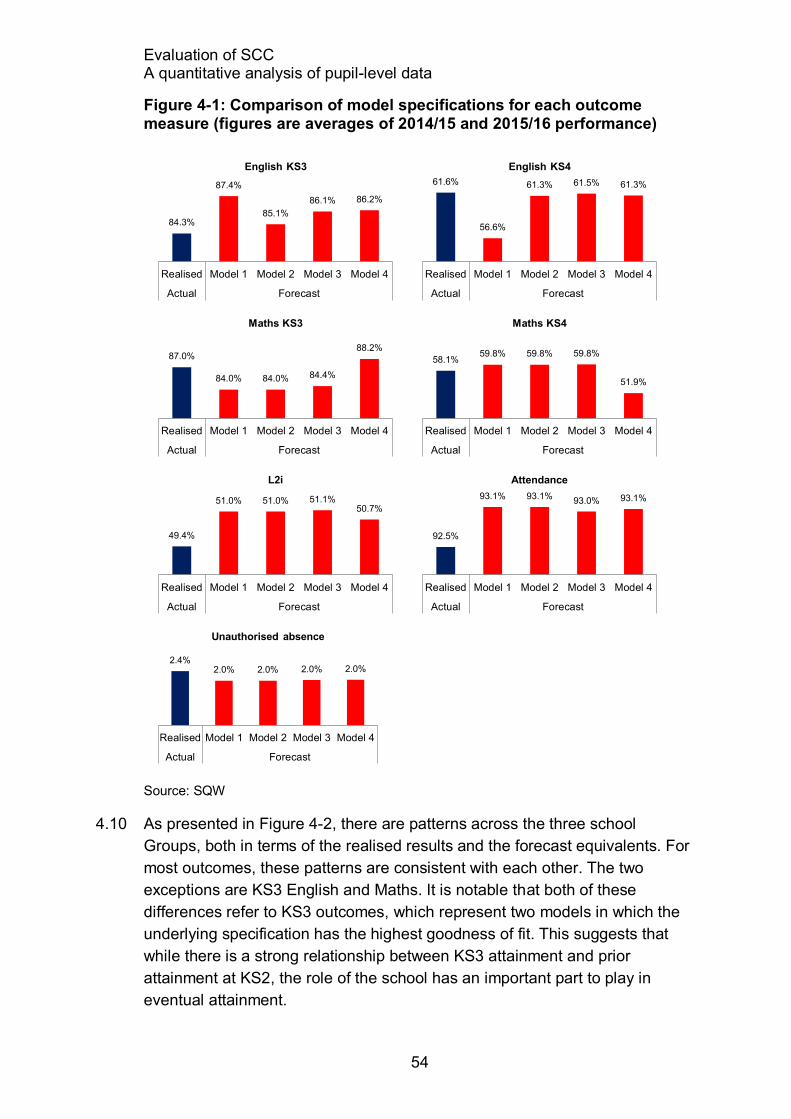
Figure 4-1: Comparison of model specifications for each outcome measure (figures are averages of 2014/15 and 2015/16 performance)
Source: SQW
4.10 As presented in Figure 4-2, there are patterns across the three school
Groups, both in terms of the realised results and the forecast equivalents. For
most outcomes, these patterns are consistent with each other. The two
exceptions are KS3 English and Maths. It is notable that both of these
differences refer to KS3 outcomes, which represent two models in which the
underlying specification has the highest goodness of fit. This suggests that
while there is a strong relationship between KS3 attainment and prior
attainment at KS2, the role of the school has an important part to play in
eventual attainment.
84.3%
87.4%
85.1%
86.1% 86.2%
Realised Model 1 Model 2 Model 3 Model 4
Actual Forecast
English KS3
61.6%
56.6%
61.3% 61.5% 61.3%
Realised Model 1 Model 2 Model 3 Model 4
Actual Forecast
English KS4
87.0%
84.0% 84.0% 84.4%
88.2%
Realised Model 1 Model 2 Model 3 Model 4
Actual Forecast
Maths KS3
58.1% 59.8% 59.8% 59.8%
51.9%
Realised Model 1 Model 2 Model 3 Model 4
Actual Forecast
Maths KS4
49.4%
51.0% 51.0% 51.1% 50.7%
Realised Model 1 Model 2 Model 3 Model 4
Actual Forecast
L2i
92.5%
93.1% 93.1% 93.0% 93.1%
Realised Model 1 Model 2 Model 3 Model 4
Actual Forecast
Attendance
2.4% 2.0% 2.0% 2.0% 2.0%
Realised Model 1 Model 2 Model 3 Model 4
Actual Forecast
Unauthorised absence

Evaluation of SCC A quantitative analysis of pupil-level data
55
Figure 4-2: Comparison of realised outcomes and forecasts for each outcome measure (figures are averages of 2014/15 and 2015/16 performance), based on the preferred specification (Model 3)
Source: SQW
4.11 For the majority of outcomes, the Groups underperform against the forecasts,
with a few exceptions (Group C in KS4 English and Maths, and all Groups in
KS3 Maths). Group C are the highest performing schools in both realised and
forecast results, and Group A is be the poorest performing. More detailed
analysis on each outcome is provided below.
81.0%
88.8% 85.3% 86.6% 85.2% 84.1%
Actu
al
Fo
reca
st
Actu
al
Fo
reca
st
Actu
al
Fo
reca
st
Group A Group B Group C
English KS3
55.2% 55.0% 60.2% 61.2% 66.9% 65.5%
Actu
al
Fo
reca
st
Actu
al
Fo
reca
st
Actu
al
Fo
reca
st
Group A Group B Group C
English KS4
85.2% 85.2%
87.7%
85.1%
87.4%
83.2%
Actu
al
Fo
reca
st
Actu
al
Fo
reca
st
Actu
al
Fo
reca
st
Group A Group B Group C
Maths KS3
53.7% 56.1%
58.5% 60.1% 60.1% 61.7%
Actu
al
Fo
reca
st
Actu
al
Fo
reca
st
Actu
al
Fo
reca
st
Group A Group B Group C
Maths KS4
43.8% 46.8% 48.6% 51.2% 53.4% 53.4%
Actu
al
Fo
reca
st
Actu
al
Fo
reca
st
Actu
al
Fo
reca
st
Group A Group B Group C
L2I
91.8% 92.1% 92.6%
93.5% 92.7%
93.1%
Actu
al
Fo
reca
st
Actu
al
Fo
reca
st
Actu
al
Fo
reca
st
Group A Group B Group C
Attendance
3.6% 3.4%
2.0% 1.6% 2.2% 1.8%
Actu
al
Fore
cast
Actu
al
Fore
cast
Actu
al
Fore
cast
Group A Group B Group C
Unauthorised absence
Evaluation of SCC A quantitative analysis of pupil-level data
56
Attainment in English
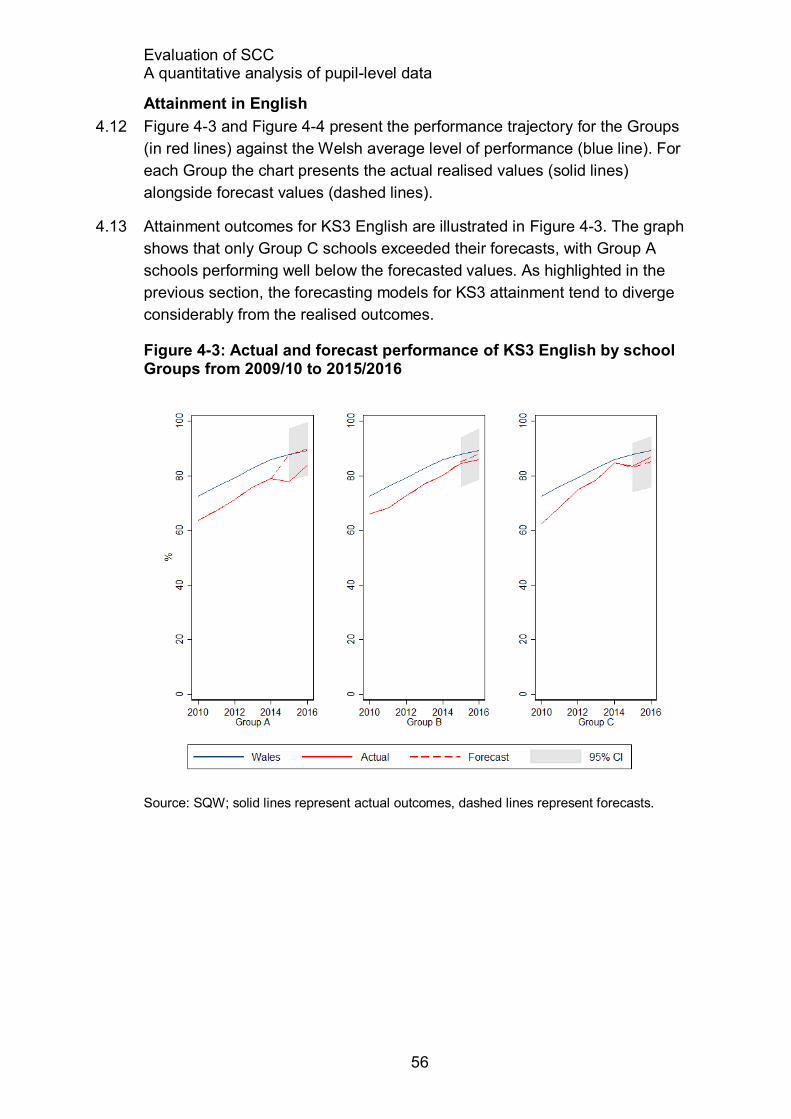
4.12 Figure 4-3 and Figure 4-4 present the performance trajectory for the Groups
(in red lines) against the Welsh average level of performance (blue line). For
each Group the chart presents the actual realised values (solid lines)
alongside forecast values (dashed lines).
4.13 Attainment outcomes for KS3 English are illustrated in Figure 4-3. The graph
shows that only Group C schools exceeded their forecasts, with Group A
schools performing well below the forecasted values. As highlighted in the
previous section, the forecasting models for KS3 attainment tend to diverge
considerably from the realised outcomes.
Figure 4-3: Actual and forecast performance of KS3 English by school Groups from 2009/10 to 2015/2016
Source: SQW; solid lines represent actual outcomes, dashed lines represent forecasts.

Evaluation of SCC A quantitative analysis of pupil-level data
57
4.14 For KS4 English attainment, Figure 4-4 shows clear differences between the
Groups, and relatively well-aligned forecasts in relation to realised results.
Group A and C schools both exceeded their forecast performance and have
converged with the Welsh average, while Group B have similarly made
progress, albeit just below their forecasted level. It is also notable that both
the forecasts and the realised results conform to the patterns expected for the
three groups.
Figure 4-4: Actual and forecasted performance of KS4 English by school Groups from 2009/10 to 2015/2016
Source: SQW; solid lines represent actual outcomes, dashed lines represent forecasts.
Attainment in Maths
4.15 Turning to KS3 Maths attainment, Figure 4-5 presents a mixed picture,
consistent with the challenge associated with forecasts at KS3. Forecasts for
each group (based on the composition of the cohort) predicted strong
performance decreases and divergence from the Welsh average, while in
reality the PtS schools, on average, kept pace.

Evaluation of SCC A quantitative analysis of pupil-level data
58
Figure 4-5: Actual and forecasted performance of KS3 Maths by school Groups from 2009/10 to 2015/2016
Source: SQW; solid lines represent actual outcomes, dashed lines represent forecasts.
4.16 The forecasts across the school Groups for KS4 Maths suggests that all
would raise their performance and converge with the Welsh average at a
relatively fast pace. As presented in Figure 4-6, while the school Groups did
improve and converge with the Welsh average, none of the Groups did so at
the forecasted rate.

Evaluation of SCC A quantitative analysis of pupil-level data
59
Figure 4-6: Actual and forecasted performance of KS4 Maths by school Groups from 2009/10 to 2015/2016
Source: SQW; solid lines represent actual outcomes, dashed lines represent forecasts.

Evaluation of SCC A quantitative analysis of pupil-level data
60
Attainment in L2I
4.17 As for KS4 English and Maths attainment, the broader L2I measure of
performance shows a link between actual and forecast results in the expected
order across groups. As presented in Figure 4-7, none of the groups, on
average, achieved their forecasted levels of attainment by the second year
(although Group C schools did exceed their forecast in the first year).
Figure 4-7: Actual and forecasted performance of L2I by school Groups from 2009/10 to 2015/2016
Source: SQW; solid lines represent actual outcomes, dashed lines represent forecasts.

Evaluation of SCC A quantitative analysis of pupil-level data
61
Attendance
4.18 If we focus on realised performance, the data show that Group C schools
outperformed Group B over the intervention period, while Group A closed the
performance gap by a modest margin (see Figure 4-8). With respect to the
Welsh average, the PtS schools, on average, saw attendance rates decline
immediately after the intervention was implemented, with most recovering in
the following year. In terms of the forecasting model, the prediction was that
all schools would increase their attendance rates at a pace more or less
consistent with the Welsh average. Comparing the realised and forecasted
performance plots, it is only Group A schools that reached their forecast
attendance levels by the 2nd year. They still, however, continue to lag behind
Group B and Group C schools.
Figure 4-8: Actual and forecasted performance of attendance by school Groups from 2009/10 to 2015/2016
Source: SQW analysis of Stats Wales data. Solid lines represent actual outcomes, dashed lines represent forecasts. Note that the axis has been collapsed between zero and 80% to enable variations in the data to be seen.

Evaluation of SCC A quantitative analysis of pupil-level data
62
Unauthorised absence
4.19 As illustrated in Figure 4-9, the forecasting model predicts that unauthorised
absence rates would increase for all PtS schools and diverge from the Welsh
average. Comparing this to the actual performance across school Groups and
the evidence shows that Group A schools countered this predicted trend.
Following a large increase in unauthorised absence rates after the
introduction of SCC, they subsequently reduced them below the forecast
level. Group B and C schools both had higher rates of unauthorised absence
than forecast, however.
Figure 4-9: Actual and forecasted performance of unauthorised absence by school Groups from 2009/10 to 2015/2016
Source: SQW; solid lines represent actual outcomes, dashed lines represent forecasts.

Evaluation of SCC A quantitative analysis of pupil-level data
63
Annex A: Technical annex
Table A-1: Full model outputs for each outcome variable for the period
2009/10-2013/14 for the preferred model specification (Model 1)
K
S3 E
nglis
h
KS
4 E
nglis
h
KS
3 M
ath
s
KS
4 M
ath
s
L2I
Atte
nd
ance
Una
uth
ori
sed
abse
nce
(2010/11-2013/14)
(2009/10-2013/14)
(2010/11-2013/14)
(2009/10-2013/14)
(2009/10-2013/14)
(2009/10-2013/14)
(2009/10-2013/14)
Year 0.0408*** 0.00527 0.0322*** 0.0150*** 0.0157*** 0.00502*** -0.000710
(0.000) (0.159) (0.000) (0.000) (0.000) (0.000) (0.260)
Constant -81.39*** -10.05 -64.06*** -29.66*** -31.26*** -9.195*** 1.450
(0.000) (0.181) (0.000) (0.000) (0.000) (0.000) (0.252)
N 227 225 227 225 225 228 228
R-squared 0.653 0.018 0.619 0.155 0.190 0.484 0.022
Source: SQW
Table A-2: Full model outputs for each outcome variable for the period 2009/10-2013/14 for the preferred model specification (Model 2)
KS
3 E
nglis
h
KS
4 E
nglis
h
KS
3 M
ath
s
KS
4 M
ath
s
L2I
Atte
nd
ance
Una
uth
ori
sed
abse
nce
(2010/11-2013/14)
(2009/10-2013/14)
(2010/11-2013/14)
(2009/10-2013/14)
(2009/10-2013/14)
(2009/10-2013/14)
(2009/10-2013/14)
Prior performance
0.387*** 0.215*** 0.215*** 0.297*** 0.272*** 0.338*** 0.525***
(0.000) (0.008) (0.004) (0.001) (0.000) (0.000) (0.000)
Wales average
1.369 1.183** 3.699** 3.375*** 2.698*** 1.095*** 0.108
(0.463) (0.019) (0.026) (0.005) (0.000) (0.000) (0.941)
Year -0.00706 -0.00833 -0.0722 -0.0462** -0.0312*** -0.00166 -0.000396
(0.910) (0.151) (0.113) (0.015) (0.003) (0.199) (0.747)
Constant -0.616 -0.294 -1.964* -1.422** -0.990*** -0.395* 0.0109
(0.583) (0.298) (0.066) (0.013) (0.001) (0.054) (0.704)
N 190 225 190 225 225 228 228
R-squared 0.648 0.096 0.625 0.239 0.342 0.620 0.286
Source: SQW

Evaluation of SCC A quantitative analysis of pupil-level data
64
Table A-3: Full model outputs for each outcome variable for the period
2009/10-2013/14 for the preferred model specification (Model 3)
KS
3 E
nglis
h
KS
4 E
nglis
h
KS
3 M
ath
s
KS
4 M
ath
s
L2I
Atte
nd
ance
Una
uth
ori
sed
abse
nce
(2010/11-2013/14)
(2009/10-2013/14)
(2010/11-2013/14)
(2009/10-2013/14)
(2009/10-2013/14)
(2009/10-2013/14)
(2009/10-2013/14)
Prior performance
0.377*** 0.197** 0.234*** 0.313*** 0.268*** 0.297*** 0.511***
(0.000) (0.015) (0.000) (0.000) (0.000) (0.000) (0.000)
Wales average
0.879 1.114** 3.134* 3.244*** 2.650*** 1.129*** 0.284
(0.667) (0.027) (0.061) (0.005) (0.000) (0.000) (0.849)
Year 0.00573 -0.00320 -0.0619 -0.0444** -0.0298*** -0.00227 -0.000482
(0.933) (0.683) (0.178) (0.016) (0.008) (0.110) (0.698)
Gender 0.0969 -0.0308 0.339 0.601 0.0905 0.105** -0.0298
(0.850) (0.948) (0.388) (0.153) (0.826) (0.032) (0.424)
WIMD 0.842* -1.051 0.204 -0.803* -0.682 -0.0806 0.0721
(0.058) (0.100) (0.628) (0.078) (0.132) (0.103) (0.244)
SEN 0.157 -0.136 0.457* 0.223 0.115 0.0753*** 0.00338
(0.590) (0.689) (0.033) (0.436) (0.709) (0.008) (0.892)
Constant -0.577 0.0233 -1.906* -1.522** -0.884** -0.436** 0.00582
(0.652) (0.955) (0.080) (0.019) (0.025) (0.049) (0.888)
N 190 225 190 225 225 228 228
R-squared 0.660 0.129 0.643 0.272 0.358 0.646 0.298
Source: SQW

Evaluation of SCC A quantitative analysis of pupil-level data
65
Table A-4: Full model outputs for each outcome variable for the period 20011/13-2013/14 for the preferred model specification (Model 4)
KS
3 E
nglis
h
KS
4 E
nglis
h
KS
3 M
ath
s
KS
4 M
ath
s
L2I
Atte
nd
ance
Una
uth
ori
sed
abse
nce
(2010/11-2013/14)
(2009/10-2013/14)
(2010/11-2013/14)
(2009/10-2013/14)
(2009/10-2013/14)
(2009/10-2013/14)
(2009/10-2013/14)
Prior performance
0.272** 0.252** 0.122 0.260** 0.215** 0.0837 0.306***
(0.011) (0.020) (0.192) (0.019) (0.011) (0.287) (0.008)
Wales average
0.942 0.636 1.106 -3.911 1.706* 0.907* 1.452
(0.728) (0.292) (0.632) (0.235) (0.069) (0.074) (0.443)
Year 0.00609 0.00632 -0.000717 0.0847 -0.00469 0.000206 -0.000170
(0.946) (0.626) (0.991) (0.147) (0.797) (0.957) (0.900)
Gender -0.0577 1.569* 0.352 0.468 0.749 0.140 -0.0658
(0.919) (0.089) (0.491) (0.487) (0.248) (0.119) (0.366)
WIMD 0.884* -0.711 0.245 -0.682 -0.707 -0.00608 0.0249
(0.050) (0.459) (0.604) (0.402) (0.286) (0.946) (0.781)
SEN 0.155 -0.440 0.563* 0.265 -0.0734 0.0758 0.00459
(0.621) (0.471) (0.055) (0.558) (0.880) (0.171) (0.912)
Constant -0.484 -0.534 -0.587 1.937 -0.782 -0.0875 0.0203
(0.767) (0.382) (0.686) (0.234) (0.181) (0.848) (0.685)
N 152 151 152 151 151 152 152
R-squared 0.607 0.195 0.629 0.227 0.397 0.635 0.170
Source: SQW