evaluation study of the immediate intervention/underperforming
TRANSCRIPT

Evaluation Study of the Immediate Intervention/Underperforming Schools Program and the High Achieving/Improving Schools Program of the Public Schools Accountability Act of 1999
Final Report Submitted to:
John Boivin, Contract Monitor Evaluation Unit Policy and Evaluation Division California Department of Education 1430 N Street, Suite 4206 Sacramento, CA 95814
Submitted by:
Jennifer O’Day, Ph.D., Principal Investigator & Project Director Catherine Bitter, M.A., Project Manager June 30, 2003


Evaluation Study of the Public Schools Accountability Act of 1999 i
Acknowledgments
We wish to extend our appreciation to the district and school administrators, teachers, and all interview and survey respondents participating in this evaluation. We attribute the success of this evaluation effort to the valuable input provided by the participants.
The Evaluation Study of the Immediate Intervention/Underperforming Schools Program and the High Performing/Improving Schools Program of the Public Schools Accountability Act of 1999 was conducted by the American Institutes for Research, in partnership with Policy Analysis for California Education (PACE) and EdSource. Researchers at PACE contributed to the qualitative field study of II/USP schools and provided valuable commentary on policy implications and other aspects of this final report.1 EdSource has provided valuable feedback on instrumentation and interpretation of findings and will spearhead the writing of a condensed version of this report for a lay audience. We would like to thank the staff at these organizations for their hard work and cooperation. We wish to acknowledge in particular the efforts of Diane Hirshberg who has been an integral part of the qualitative research team since the study’s inception. We would also like to thank Bruce Fuller, Betsey Woody, Emi Kuboyama, and Diane Steinberg of PACE; and Trish Williams, Mary Perry, Brian Edwards, and Adam Pelavin of EdSource.
We wish to acknowledge the invaluable assistance of key project staff who contributed to this study. We would especially like to thank our senior advisor, Michael Garet, for his guidance in the design of the study and analysis and interpretation of the achievement data.
Special thanks go to Yu Zhang for his untiring work on the statewide achievement analyses, to Kerstin Le Floch for leading the design of case study and survey instruments and conducting site visits, to Susan Cole for her analysis and writing contributions to the qualitative case studies, and to Beverly Farr who served as Project Director during the first 10 months of the study.
Thanks are also due to Tricia Tulipano and Abigail Stewart-Teitelbaum for conducting site visits and assisting with the case study analysis; to Larry Gallagher for conducting the longitudinal achievement analyses; to Jamie Shkolnik and Priyanka Anand for conducting the cost analyses; to Matthew Gaertner for administering and analyzing surveys; and to Roger Levine for helpful guidance during the survey administration and analysis processes.
The following individuals also assisted with a number of research tasks: Freya Makris, Ben Martinez, Kassandra Chaney, Marisa Cohn, Hilary Cederquist, and Regina Waugh. Thank you all. We wish to thank Estherlyn Juanitas, Lee Carlson, Sandra Smith, and Ed Schrufer who provided much appreciated administrative support throughout the project. Finally special thanks go to Jean Wolman and Michelle Bullwinkle for their work in the editing and production of this report.
Four districts supplied us with specially compiled student data sets for the longitudinal analysis of achievement. We want to express our gratitude to the districts for cooperating in the research and to their staff who assembled the data for us.
Finally, we wish to acknowledge the guidance and input provided by the project Advisory Group, as well as John Boivin and other staff of the CDE. We especially want to thank Anne
1 PACE did not participate in the analysis of student achievement patterns.
Acknowledgments
ii Evaluation Study of the Public Schools Accountability Act of 1999
Just for her support and invaluable feedback throughout the project and Marshall Smith for providing external review and suggestions for the final report.
Evaluation Advisory Board Members
Holly Covin Jacobson (California School Boards Association)
Brian Edwards (Office of the Secretary), Phase 1
Stu Greenfeld (Superintendent of Washington Unified School District)
Lisa Horwitch (Senate Education Committee)
Robert Manwaring/Victoria Carreon (Legislative Analyst’s Office)
Lynette Nyaggah (California Teachers Association)
Jeannie Oropeza /Mohammed Wardak (Department of Finance)
David Sanchez (Principal of Liggett Elementary in Los Angeles Unified School District)
Lisa Tyrell (1st grade teacher at Glenwood Elementary School in Robla School District)
Louise Waters (Assistant Superintendent of Accountability, Oakland Unified School District)
Chuck Weis (Ventura County Superintendent of Schools; PSAA Advisory Committee)

Evaluation Study of the Public Schools Accountability Act of 1999 iii
Table of Contents
Acknowledgments .......................................................................................................................... i
Table of Contents.......................................................................................................................... iii
List of Exhibits .............................................................................................................................. vi
Executive Summary...................................................................................................................... ix
Chapter 1. Overview and Conceptual Framework ......................................................................1
Introduction ..................................................................................................................................1 Research Questions................................................................................................................1 Organization of This Report ....................................................................................................2 Organization of Chapter 1 .......................................................................................................2
PSAA—Legislative and Programmatic Background....................................................................2 Political and Legislative History...............................................................................................3 PSAA Components .................................................................................................................5
PSAA—Teasing Out the Theory of Action...................................................................................9 Conceptual Framework for the Evaluation ................................................................................14
Relevant Literature ................................................................................................................14 Overview of Study Design .........................................................................................................17
General Conceptual Approach..............................................................................................17 Components of the Study Design: Addressing the Research Questions..............................18
Conclusion .................................................................................................................................20
Chapter 2. Methodology ..............................................................................................................21
Introduction ................................................................................................................................21 Case Studies of II/USP Schools ................................................................................................25
Purpose .................................................................................................................................25 Sample Selection ..................................................................................................................25 Instrument Development .......................................................................................................27 Site Visit Administration.........................................................................................................27 Data Analysis.........................................................................................................................28
Surveys of Principals and Teachers (Level 3) and of District Personnel and External Support Providers (Level 2).....................................................................................................................28
Purpose .................................................................................................................................28 Sample Selection ..................................................................................................................29 Survey Instrument Development...........................................................................................32 Survey Administration ...........................................................................................................32 Survey Response Rates........................................................................................................33
Student Achievement Analyses.................................................................................................34 II/USP Analyses.....................................................................................................................35 GPA Analyses .......................................................................................................................36
Chapter 3. The Effect of II/USP on Student Achievement........................................................37
Overview....................................................................................................................................37 Statewide Trends in Achievement .............................................................................................38
Analysis Strategy and Method...............................................................................................38 Results: Impact of Program Participation on Average Achievement ...................................44 Results: Disaggregated Effects of II/USP on Selected Student Sub-Populations ...............64
Longitudinally Linked Student-Level Analyses ..........................................................................72 Trends Across Schools .........................................................................................................72

Table of Contents
iv Evaluation Study of the Public Schools Accountability Act of 1999
Variation Among Schools ......................................................................................................73 Summary of Achievement Findings...........................................................................................75
Chapter 4. II/USP: Identification and the Planning Year ..........................................................77
Introduction ................................................................................................................................77 Identification for II/USP ..............................................................................................................78
II/USP: A Voluntary Program?...............................................................................................79 Reactions to the Designation of II/USP.................................................................................80 Subsequent Response to II/USP...........................................................................................82
External Evaluators....................................................................................................................84 Selection of External Evaluators ...........................................................................................85 Role of External Evaluator.....................................................................................................86 External Evaluators’ Rapport with Stakeholders ...................................................................87
Needs Assessment and Action Plan .........................................................................................90 Input from Stakeholders ........................................................................................................91 Spearheading/Writing of the Action Plan ..............................................................................93 Familiarity with and Salience of the Action Plan ...................................................................93 Strategies for School Improvement .......................................................................................94
Planning Year Expenditures ......................................................................................................96 Conclusion .................................................................................................................................97
Chapter 5. Implementation Years .............................................................................................101
Introduction ..............................................................................................................................101 II/USP, Instructional Coherence, and Student Achievement...................................................102
Instructional Coherence and Student Outcomes ................................................................102 Contribution of II/USP to Coherence...................................................................................108
What Facilitates or Impedes the Link Between Instructional Coherence and II/USP?............109 Intervention Strength ...........................................................................................................109 Other Mediating Influences .................................................................................................112
II/USP Sanctions and Motivation to Improve ...........................................................................122 Awareness and Acceptance of Potential Sanctions............................................................122 Perceived Likelihood of Sanctions ......................................................................................123
Resource Allocation.................................................................................................................126 Implementation Activities Supported by II/USP Funds........................................................126 Matching Funds...................................................................................................................128 Sufficiency of Resources.....................................................................................................128 Opportunities Provided by II/USP Funds ............................................................................129
Summary and Conclusions......................................................................................................130
Chapter 6. Governor’s Performance Award ............................................................................133
Introduction ..............................................................................................................................133 Achievement Analyses ............................................................................................................134
Effect of GPA on Recipient Schools....................................................................................134 Systemic Incentive Effect of GPA on Statewide Achievement............................................135
Saliency of Awards ..................................................................................................................137 GPA Expenditures ...................................................................................................................140 Conclusions .............................................................................................................................142
Chapter 7. Conclusions and Implications ...............................................................................145
Introduction ..............................................................................................................................145 Central Findings and Implications for Policy............................................................................145
Attention to Student Achievement Outcomes .....................................................................146 The Impact of PSAA on Student Achievement ...................................................................148 District Policy and Context ..................................................................................................150 Coordinated Action and Instructional Coherence................................................................152
Lessons Specific to the Design and Implementation of II/USP and GPA ...............................154

Table of Contents
Evaluation Study of the Public Schools Accountability Act of 1999 v
Identification of Low Performing Schools ............................................................................154 School Improvement Planning ............................................................................................155 Resources ...........................................................................................................................156 II/USP and GPA Incentives .................................................................................................158
Conclusion ...............................................................................................................................159
References..................................................................................................................................161
Appendix A: Analysis Methods and Supplementary Tables for Chapter 3
Appendix B: Supplementary Methodology Details
Appendix C (see accompanying volume) C-1: Construct Matrix C-2: Case Study Site Visit Instruments C-3: Consent Form C-4: Survey Instruments C-5: Case Study Analysis Forms

Evaluation Study of the Public Schools Accountability Act of 1999 vi
List of Exhibits
Exhibit 1.1: Distribution of schools selected for II/USP by grade level ............................................7 Exhibit 1.2: Summary of legislative and administrative modifications for each II/USP cohort.........8 Exhibit 1.3: Timeline for II/USP Cohorts (State and CSRD-funded) and GPA ................................9 Exhibit 1.4: Simplified accountability theory of action model .........................................................10 Exhibit 1.5: PSAA Theory of Action ...............................................................................................12 Exhibit 1.6: Theory of Action: CA Public Schools Accountability Act (Underlying assumptions of the policy)................................................................................................................................12 Exhibit 2.1: Overview of the data collection strands ......................................................................23 Exhibit 2.2: Overview of evaluation methods by research question ..............................................24 Exhibit 2.3: Distribution of II/USP case study schools ...................................................................26 Exhibit 2.4: Distribution of survey schools .....................................................................................30 Exhibit 2.5 Survey response rates .................................................................................................33 Exhibit 3.1: Demographic background characteristics of Cohort 1 II/USP, CSRD, and comparison elementary schools .................................................................................................44 Exhibit 3.2: API, SAT-9 mathematics, and SAT-9 reading scores: Estimated average achievement for Cohort 1 II/USP and comparison Elementary schools in 1998, 1999, 2000, 2001, and 2002 (Source: California Department of Education; see Appendix A for models.) ..................................................................................................................................47 Exhibit 3.3: API, SAT-9 mathematics, and SAT-9 reading Scores: Estimated average achievement for Cohort 2 II/USP and comparison Elementary schools in 1998, 1999, 2000, 2001, and 2002 (Source: California Department of Education; see Appendix A for models.) .................................................................................................................................49 Exhibit 3.4: API, SAT-9 mathematics, and SAT-9 reading scores: Estimated average achievement for Cohort 1 II/USP and comparison Middle schools in 1998, 1999, 2000, 2001, and 2002 (Source: California Department of Education; see Appendix A for models.) .................................................................................................................................51 Exhibit 3.5: API, SAT-9 mathematics, and SAT-9 reading scores: Estimated average achievement for Cohort 2 II/USP and comparison Middle schools in 1998, 1999, 2000, and 2001 (Source: California Department of Education; see Appendix A for models.) .................................................................................................................................52 Exhibit 3.6: API, SAT-9 mathematics, and SAT-9 reading scores: Estimated average achievement for Cohort 1 II/USP and comparison High schools in 1998, 1999, 2000, 2001, and 2002 (Source: California Department of Education; see Appendix A for models.) .................................................................................................................................54 Exhibit 3.7: API, SAT-9 mathematics, and SAT-9 reading scores: Estimated average achievement for Cohort 2 II/USP and comparison High schools in 1998, 1999, 2000, 2001, and 2002 (Source: California Department of Education; see Appendix A for models.) .................................................................................................................................55 Exhibit 3.8. API Effect Size of II/USP Participation, By Cohort......................................................56 Exhibit 3.9: Percent of Cohort 1 II/USP, CSRD, and comparison Elementary schools meeting schoolwide growth target in 2000, 2001, and 2002 ......................................................58 Exhibit 3.10: Percent of Cohort 2 II/USP, CSRD, and comparison Elementary schools meeting schoolwide growth target in 2000, 2001, and 2002 ......................................................58 Exhibit 3.11: Difference in percent of Cohort 1, 2, and 3 II/USP and comparison schools meeting growth target .................................................................................................................59 Exhibit 3.12: Distribution of API growth for II/USP and comparison Elementary schools, 1999-2000 ...................................................................................................................................60

List of Exhibits
Evaluation Study of the Public Schools Accountability Act of 1999 vii
Exhibit 3.14: District influence on API, SAT-9 mathematics, and SAT-9 reading scores: Estimated average achievement for Cohort 2 II/USP and comparison Elementary schools in 1998, 1999, 2000, 2001, and 2002 .........................................................................................63 Exhibit 3.15: Estimated SAT-9 reading scores for English learners and other students in Cohort 1 II/USP and comparison Elementary schools (Source: California Department of Education; see Appendix A for models.).....................................................................................66 Exhibit 3.16: Change in achievement gap between English learner and fluent English elementary students, SAT-9 reading and mathematics scores, 1998-2002, by cohort and program................................................................................................................................67 Exhibit 3.17: Estimated SAT-9 reading scores for regular education (“Regular”) and special education (“IEP”) students in Cohort 1 II/USP and comparison Elementary schools ....68 Exhibit 3.18: Change in achievement gap between special education and regular education elementary students, SAT-9 reading and mathematics scores, 1998-2002, by cohort and program.....................................................................................................................69 Exhibit 3.19: Estimated SAT-9 reading scores for students eligible for free and reduced price lunch (FRPL) and regular students in Title I II/USP and comparison Elementary schools (Cohort 1).......................................................................................................................70 Exhibit 3.21: Trends in longitudinal achievement growth in II/USP and comparison schools in three case study districts, SAT-9 reading ...............................................................................73 Exhibit 3.22-a. Estimated NCE growth on SAT-9 reading, Cohort 1 case study elementary schools (Data provided by case study districts; all names are pseudonyms) ...........................74 Exhibit 3.22-b. Estimated NCE growth on SAT-9 reading, Cohort 2 case study elementary schools (Data provided by case study districts; all names are pseudonyms) ..............................74 Exhibit 3.22-c. Estimated NCE growth on SAT-9 mathematics, Cohort 3 case study elementary schools (Data provided by case study districts; all names are pseudonyms) ........75 Exhibit 4.1: Number and percent of schools eligible, applied, and selected for II/USP.................78 Exhibit 4.2 Expectations of II/USP principals and teachers, as reported in surveys .....................84 Exhibit 4.3: District role in selecting External Evaluator.................................................................86 Exhibit 4.4 Tasks completed by external evaluators......................................................................87 Exhibit 4.5 Principals’ and teachers’ descriptions of the external evaluators ................................90 Exhibit 4.6: Data used for the development of the school’s Action Plan .......................................92 Exhibit 4.7: Improvement strategies for II/USP schools.................................................................95 Exhibit 4.8: Average percentage of II/USP funds (including CSRD) spent on each category* .....96 Exhibit 4.9: Planning year expenditures by cohort—II/USP (including CSRD)..............................97 Exhibit 4.10: Relationship between planning year experiences and subsequent outcomes in Cohort 1 and 2 case study schools.............................................................................................99 Exhibit 5.1: Case study schools by level of instructional coherence ...........................................104 Exhibit 5.2: Student achievement outcomes for case study schools: Cohorts 1 and 2 ...............105 Exhibit 5.3: Summary of outcomes by cohort: Cohorts 1 and 2 ..................................................106 Exhibit 5.4: Student outcomes by instructional coherence in Cohort 1 and 2 case study schools ......................................................................................................................................107 Exhibit 5.5: II/USP teachers’ and principals’ expectations of sanctions (sorted by reported likelihood) ..................................................................................................................................125 Exhibit 5.6: Average percent of II/USP funds (excluding CSRD) spent on each category* ........126 Exhibit 5.7: Average percent of II/USP funds spent on each category, by funding source .........127 Exhibit 5.8: Difficulty in obtaining matching funds........................................................................128 Exhibit 5.9: What II/USP and CSRD funds allowed schools to do that they otherwise could not have done* ..........................................................................................................................130 Exhibit 6.1-a: Percent distribution of schools earning GPAs for the 1999-2000 school year, by decile and level.....................................................................................................................134 Exhibit 6.1-b: Total percentage of schools earning GPAs for the 1999-2000 school year, by level ......................................................................................................................................134

List of Exhibits
viii Evaluation Study of the Public Schools Accountability Act of 1999
Exhibit 6.2: Parameter estimates, multi-level model for effect of GPAs on API ..........................135 Exhibit 6.3: Percentages of California schools, by level, that did meet or would have met their API schoolwide growth targets in 1999 (pseudo-targets), 2000, 2001, and 20021, 2 ........136 Exhibit 6.4: Teachers’ and principals’ expectations of results from meeting API targets*...........139 Exhibit 6.5: Average percent of GPA funds spent on school-related activities............................140 Exhibit 6.6: Average percent of GPA funds spent on school-related activities, by high and low API decile* ..........................................................................................................................141 Exhibit 6.7: Average percent of GPA funds spent on school-related activities, by program type* .........................................................................................................................................142

Evaluation Study of the Public Schools Accountability Act of 1999 ix
Executive Summary
The recent nationwide move to hold schools accountable for student performance is not an entirely new phenomenon, but it is significant in that it is so closely linked to the call for a systemic, standards-based overhaul of education. As part of this reform, states and districts are designing new approaches to holding schools and districts accountable for accomplishing their missions, or more particularly for moving the children in their charge closer to achieving state standards in key academic domains. Following this trend, California state lawmakers spent much of the late 1990s attempting to put the elements of a standards-based accountability system in place. The result was the Public Schools Accountability Act (PSAA) of 1999, which incorporates three central components designed to encourage improvement of practice and student learning. These components are: The Academic Performance Index (API); The Immediate Intervention/Underperforming Schools Program (II/USP); and The High Achieving/Improving Schools Program (HA/ISP), including the Governor’s Performance Award (GPA) program.
The Immediate Intervention/Underperforming Schools Program (II/USP) provides funds to low performing schools in the state to create and implement an Action Plan for school improvement. The funding currently comes from two different sources: state funds appropriated for II/USP (“Action Plan Schools”) and funds from the federal Comprehensive School Reform Demonstration (CSRD) program. In the first year of funding, II/USP schools develop a school Action Plan with the required assistance of a state-approved External Evaluator. State-funded schools have the following two years to implement their Action Plan, while CSRD-funded schools have the following three years to implement a research-based school reform model. Schools that participate in the II/USP are potentially subject to sanctions at the end of the implementation period should they not improve student performance.
The Governor’s Performance Award (GPA) program is an incentive program that awards schools that meet their schoolwide API growth targets, show comparable growth among all significant ethnic and economically disadvantaged subgroups, and satisfy participation rates. Recipient schools decide how to use the funds, with approval of local governing boards. No monies have been appropriated for awards since the second cycle; nor, given the current state budget crisis, are any future awards expected.
In December 2001, American Institutes for Research (AIR), in partnership with Policy Analysis for California Education (PACE) and EdSource, contracted with the California Department of Education to conduct the legislatively mandated independent evaluation of the Immediate Intervention/Underperforming Schools Program (II/USP) and the High Achieving/Improving Schools Program (HA/ISP) of the Public Schools Accountability Act (PSAA) of 1999. The evaluation addresses the impact of II/USP and GPA as well as factors that contributed to or hindered achievement growth in participating schools.
The Approach
Our approach to this study built on a firm conceptual base that incorporated both the intentions of the policy and what we know from prior research and theory. We began with the policy’s implicit “theory of action” which includes the following primary assumptions.

Executive Summary
x Evaluation Study of the Public Schools Accountability Act of 1999
PSSA Assumptions/Theory of Action:
• Aligning the accountability system with academic goals and setting specific targets for improving outcomes will focus public and educator attention on improving academic achievement.
• Data from the API provide a valid indication of a school’s performance (relative to other schools in the state and to an absolute standard) and of progress over time. The weighting formula for the API as well as the inclusion of subgroup targets will ensure accountability for all students and encourage movement toward narrowing the ethnic, linguistic, and social class achievement gaps within schools and across the state.
• Educators have demonstrated insufficient will to improve and thus need external incentives. Threats (sanctions) and promises (rewards) will increase educator motivation and effort to effect change and improve student learning.
• Attention and planning at the school site will result in coordinated and aligned strategies, which will in turn increase instructional coherence and effectiveness, thereby improving student achievement. Consultants from outside the school (External Evaluators) will provide valuable expertise and independent insights in the planning process.
• The additional resources during the planning and implementation years (with local matching funds) will be useful and sufficient for schools to implement their improvement plans.
Based on prior literature and research we anticipated that the results of the policy in individual schools would be mediated by a variety of factors – local district context, school capacity, strength of implementation strategies, and leadership at the school site. We developed a conceptual framework based on these factors to guide our data collection and analysis efforts.
For this evaluation, we utilized a multi-level, multi-method approach that allowed us to look across cohorts at various stages of implementation, to triangulate perspectives and data from multiple actors, to combine depth and breadth in our data and analyses, and to begin to link outcomes with aspects of program design and implementation, as well as with a variety of antecedent conditions. To answer the research questions we analyzed achievement trends using data from all II/USP, CSRD, and relevant comparison schools across the state; administered surveys to district administrators, external support providers, and teachers and principals of II/USP, GPA, and comparison schools; and conducted in-depth data collection at 21 case study schools across the three cohorts of II/USP and CSRD.
What Did We Learn?
We first provide our central cross-cutting findings concerning PSAA and factors influencing the progress of low performing schools. We then turn to the specific design features of the II/USP and GPA programs, drawing lessons of relevance for future accountability efforts.
Executive Summary
Evaluation Study of the Public Schools Accountability Act of 1999 xi
What Was the Impact of PSAA and its Components?
Attention to Student Achievement
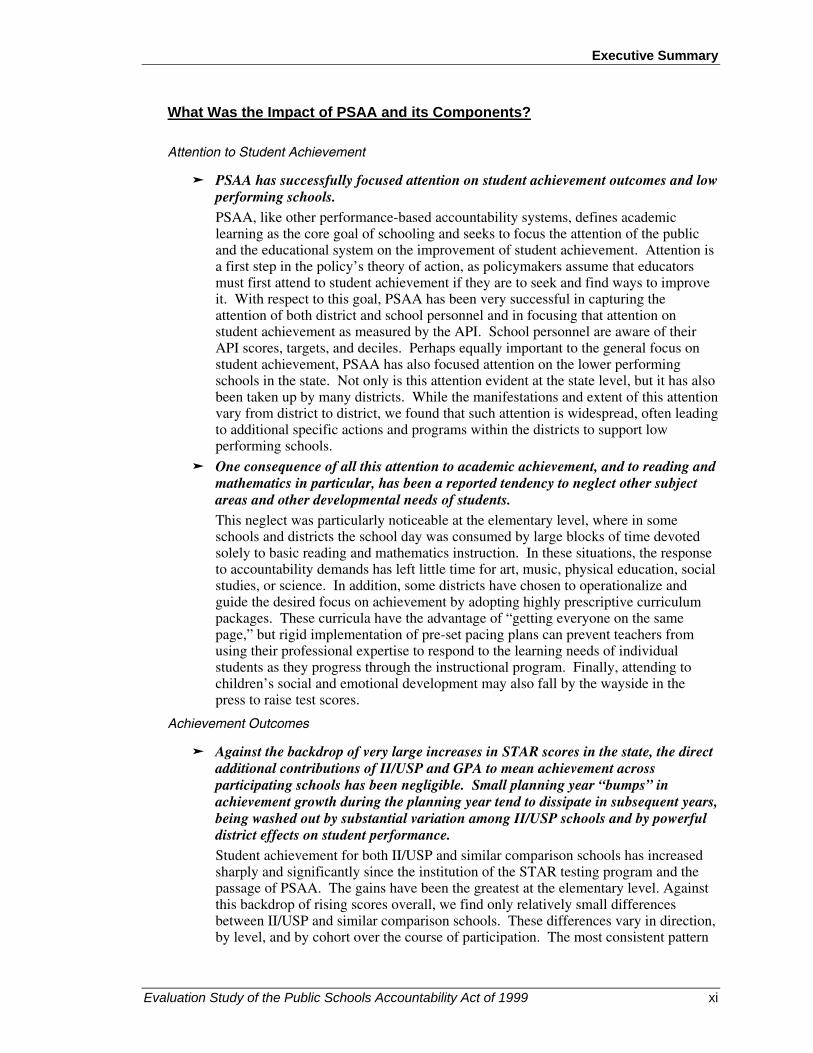
PSAA has successfully focused attention on student achievement outcomes and low performing schools. PSAA, like other performance-based accountability systems, defines academic learning as the core goal of schooling and seeks to focus the attention of the public and the educational system on the improvement of student achievement. Attention is a first step in the policy’s theory of action, as policymakers assume that educators must first attend to student achievement if they are to seek and find ways to improve it. With respect to this goal, PSAA has been very successful in capturing the attention of both district and school personnel and in focusing that attention on student achievement as measured by the API. School personnel are aware of their API scores, targets, and deciles. Perhaps equally important to the general focus on student achievement, PSAA has also focused attention on the lower performing schools in the state. Not only is this attention evident at the state level, but it has also been taken up by many districts. While the manifestations and extent of this attention vary from district to district, we found that such attention is widespread, often leading to additional specific actions and programs within the districts to support low performing schools.
One consequence of all this attention to academic achievement, and to reading and mathematics in particular, has been a reported tendency to neglect other subject areas and other developmental needs of students. This neglect was particularly noticeable at the elementary level, where in some schools and districts the school day was consumed by large blocks of time devoted solely to basic reading and mathematics instruction. In these situations, the response to accountability demands has left little time for art, music, physical education, social studies, or science. In addition, some districts have chosen to operationalize and guide the desired focus on achievement by adopting highly prescriptive curriculum packages. These curricula have the advantage of “getting everyone on the same page,” but rigid implementation of pre-set pacing plans can prevent teachers from using their professional expertise to respond to the learning needs of individual students as they progress through the instructional program. Finally, attending to children’s social and emotional development may also fall by the wayside in the press to raise test scores.
Achievement Outcomes
Against the backdrop of very large increases in STAR scores in the state, the direct additional contributions of II/USP and GPA to mean achievement across participating schools has been negligible. Small planning year “bumps” in achievement growth during the planning year tend to dissipate in subsequent years, being washed out by substantial variation among II/USP schools and by powerful district effects on student performance. Student achievement for both II/USP and similar comparison schools has increased sharply and significantly since the institution of the STAR testing program and the passage of PSAA. The gains have been the greatest at the elementary level. Against this backdrop of rising scores overall, we find only relatively small differences between II/USP and similar comparison schools. These differences vary in direction, by level, and by cohort over the course of participation. The most consistent pattern

Executive Summary
xii Evaluation Study of the Public Schools Accountability Act of 1999
is a small positive “bump” in growth for II/USP Cohort 1 and 2 schools relative to the non-II/USP comparison counterparts in the planning year (Year 1) of the program. The estimated difference is on the magnitude of 0.11 to 0.14 standard deviations, or about 8-9 API points at the elementary level and 7-8 points for high schools. Evaluated in the context of the substantial overall gains noted above, these growth advantages seem tiny.2 When viewed as constituting from 50 to 80 percent of the average API growth target for these schools in the relevant year, the gains appear somewhat more meaningful. In any case, for most (though not all) groups, the small jumpstart for II/USP schools begins to dissipate after the first year. In addition, we find no significant effect of II/USP participation on a school’s likelihood of meeting API growth targets, nor any impact of GPA awards on subsequent API scores.
One possible explanation for the little overall effect is that II/USP has both a direct effect on participating schools and an unmeasured indirect effect on non-participating schools by way of the attention it brings to performance in general and to low performing schools in particular. To the extent that this is the case, the direct effect of II/USP on participating schools would be mitigated by the indirect effect of the program funds and PSAA on non-participating schools. A second possible explanation for the program’s limited effect stems from the wide variation in achievement trends among II/USP schools, such that some appeared to benefit substantially from program participation and funding and others gained little or even lost ground. This wide variation suggests that the effects of II/USP may be mediated by other factors outside the program, including the influence of district context and internal school capacity.
What Factors Contribute to or Hinder Achievement Growth in II/USP Schools?
Local districts significantly influence instructional practice and achievement trends in low performing schools – both II/USP and non-II/USP – and appear to mediate the effects of II/USP participation. Consistent with the conceptual framework for this evaluation, we found a substantial district influence in all aspects of our investigation, with that influence varying by the extent and nature of the district action. For example, many districts determined which schools would participate in the program, in some cases requiring that all eligible schools in their jurisdiction apply. In addition, some districts played an active role in selecting the External Evaluators. Some districts set up or required supports during implementation, including external assistance, professional development, and monitoring.
The influence of district context and actions was not limited to those directly related to II/USP. Our analysis of achievement reveals a large, statistically significant contribution (positive and negative) of district membership on both II/USP and comparison schools – at least in the four districts identified in the analysis.3 Our case studies reveal that this influence came in large part through instructionally related policies for all underperforming schools (or for schools at all performance levels).
2 For high schools, which gained only 18 points on average across the four years, the II/USP planning year advantage
is considerably more noticeable. The real story here, however, is that there has been so little improvement in high schools, a consistent pattern throughout the country.
3 In order to detect an effect, we used only the four districts with the largest numbers of II/USP schools. These were LA, Oakland, San Francisco, and San Diego.

Executive Summary
Evaluation Study of the Public Schools Accountability Act of 1999 xiii
A school’s ability to develop a coordinated and coherent instructional program is a key factor in its ability to meet and surpass academic growth targets. A central goal of the II/USP planning process was to develop greater coordination and alignment of goals, activities, and resources at the school site. Instructional coherence, an outgrowth of such alignment, has long been found to be a key component of effective school organizations. Our case study data indicate a strong association between instructional coherence and growth in student achievement, while both case study and survey data reveal substantial variation among schools in their ability to develop a coherent instructional program. The planning process alone did not have a discernible influence on the development of instructional coherence. However, the strategies that schools adopted or that districts mandated contributed differentially to later coherence. Strategies that had internal consistency as well as sufficient specificity to provide common direction to school personnel, especially if they had legitimacy among the professionals in the school and some form of regular monitoring, were more likely to be implemented in a consistent and coherent fashion throughout the school.
In addition to the district influence noted above, internal capacity at the school site played a major role in the school’s ability to develop instructional coherence. Two aspects of this capacity stand out: collaboration and professional community among teachers, and instructional leadership by the principal or other leaders at the school site. Where teachers already had or established regular means of collaborating on instructional practice, and where they had guidance and monitoring of their progress by instructional leaders, they were better able to institute common curriculum and instructional approaches across classrooms and grades. Principals often played a key role in this process though they were not always the direct source of instructional leadership, which was sometimes provided by other administrators or resource teachers.
What Lessons Have We Learned About Specific Design and Implementation Features of II/USP and GPA?
Identification of Low Performing Schools
The assumption of voluntary participation in II/USP was not realized for the majority of schools; however, the lack of voluntarism did not appear to have any long-term effect on improvement efforts or achievement gains. One difference between II/USP and similar accountability programs in other jurisdictions is that participation in II/USP is assumed to be voluntary. The state identifies schools that are eligible for the program, and then schools apply to participate. Selection is random from the pool of applicants. The rationale for voluntary participation is that it will lead to greater buy-in and motivation on the part of participating schools. In practice, participation was often mandated by the district. While some schools resented both the label “under-performing” and the lack of choice in participation, the lack of voluntarism did not seem to influence ultimate improvement efforts or achievement. We therefore conclude that voluntarism was not a significant aspect of the policy design.

Executive Summary
xiv Evaluation Study of the Public Schools Accountability Act of 1999
II/USP eligibility criteria did not target schools most in need. Other issues in the identification of II/USP schools concern the eligibility criteria. One criterion was that schools rank in the bottom half of the state in their API score. The second is that they fail to make either their schoolwide or their subgroup targets for one year. Taken together, these two criteria led to a large number of schools being identified for potential participation. This policy design has the advantage of getting the attention of a broader range of schools (schools in the middle performance levels as well as low performers) but has the disadvantage of potentially drawing in schools that have less need of the additional resources and assistance. Schools that had previously made all their targets but missed on one subgroup goal were given equal eligibility with those that had failed to make any targets on multiple occasions. In addition, the policy assumes that schools will improve by roughly the same amount every year. In fact, growth was less even. Some schools made very large gains one year, followed by a year of consolidation and a small gain the next. The API currently has no means for averaging improvement over a period of time longer than one year.
School Improvement Planning
Although External Evaluators, districts, and schools implemented the planning year provisions specified in the PSAA, school improvement planning did not necessarily lead to instructional coherence or improved achievement outcomes for II/USP schools. II/USP, like similar policies elsewhere, places considerable emphasis and faith in the school improvement planning process. We found that faith to be somewhat misguided. Although generally implemented according to legislative specifications, the planning process failed to make good on its initial promise. For one thing, the quality and depth of the planning year experiences varied greatly, as did the quality and capacity of External Evaluators and their organizations. However, even where External Evaluators were strong and the planning process was generally considered successful, influence on subsequent practice was often minimal. We believe that one main reason for the lack of relationship between planning and changes in either practice or outcomes is that the planning process was divorced from implementation in many respects. Moreover, we contend that this separation is a flaw in the design of the policy.
Resources
Delays in state dispersal of funds hampered both the planning and implementation activities in II/USP schools and the use of GPA funds by award recipients. In both cases, schools often received the funds so late that they were unable to use them in the ways intended. Planning in II/USP schools was hampered by late arrival of funds to pay the External Evaluators coupled with the tight deadlines for carrying out the required activities before the plan had to be submitted to the state. Similar delays in subsequent years meant that schools were often unable to implement all of the activities laid out in their Action Plans, especially if those activities involved professional development or purchases to occur before the start of fall semester.

Executive Summary
Evaluation Study of the Public Schools Accountability Act of 1999 xv
Schools spent program monies as expected, with II/USP spending being somewhat more directly related to instruction than that of GPA funds. Both II/USP and GPA provide additional funds intended either to assist schools in developing and implementing improvement efforts or to reward schools for achieving improvement targets. We found that II/USP schools spent their funds on goods and services directly related to instruction, including support providers, professional development and release time, instructional materials, and instructional personnel. GPA schools, particularly those in the upper deciles, were more likely to spend their award money on one time purchases related to technology or facilities than were II/USP schools.
With respect to the adequacy of II/USP funds, most respondents believed that the monies allocated for planning were sufficient, but that funds for implementation were not. One reason for the perceived inadequacy of implementation funds may rest in the design of the eligibility criteria. More specifically, II/USP funds were spread across a broad range of schools (those in the bottom half of the achievement distribution who hadn’t met their targets) rather than being concentrated on those in most apparent need. In addition, the use of a single year’s targets as an eligibility criterion may have contributed to the selection of some schools that did not really require the proffered assistance. The High Priority Schools Grant Program (HPSG) program, by contrast, concentrates program dollars on the bottom decile of schools – those most in need. A possible trade-off in such an approach may be that the lowest achieving schools do not necessarily have the capacity to use the additional funds well. On the other hand, if monies were spread to fewer schools, grants to individual schools could be larger. With larger grants and more district attention, the lowest performing schools may be able to build the requisite capacity over time.
Time and information were resources in high demand and often in short supply in II/USP schools. Time and information were both in high demand in II/USP schools. Time was not only constrained by various deadlines and late dispersal of funds, particularly in the planning year; it was also limited because of the sheer number of demands on schools and the overwhelming emphasis on reading and mathematics instruction. School-level respondents complained repeatedly about the allocation of long blocks of time to highly specified mathematics and literacy instruction such that they did not have time to spend teaching other subjects or addressing student other developmental needs. Additionally, some school personnel pointed to the lack of sufficient information about the II/USP program as an impediment either to buy-in at the school site or appropriate implementation.
II/USP and GPA Incentives
Neither the threatened severe sanctions of II/USP nor the potential awards promised through the GPA program were salient among school personnel. The PSAA theory of action anticipates that both the threat of sanctions should a school fail to improve and the promise of financial rewards should a school meet its growth targets will serve to increase schools’ attention and motivation to improve student achievement. In order for these threats and promises to have their desired effect, however, they must be salient to school staff, i.e., staff must be aware of the

Executive Summary
xvi Evaluation Study of the Public Schools Accountability Act of 1999
incentives and believe they will be implemented under the conditions outlined by the state. Though stakeholders were oftentimes well aware of the threat of sanctions for II/USP schools, they held mixed views on the ability of such threats to instill motivation for improvement. Some school staff believed the punitive nature of II/USP was disheartening, rather than motivating. In addition, school staff were skeptical that severe sanctions would actually be imposed by the state. In contrast, the less severe consequences like a public hearing or a state assistance team were deemed more likely to occur.
In the case of the GPA program, we found both the awareness and saliency of awards – therefore their motivating power – to be minimal. Though recipient schools were pleased to have received the rewards and found them to be a nice acknowledgement of their hard work, they did not believe the awards had been a strong motivating factor to improve instruction. In addition, we found that the majority of school staff did not expect that their school would actually receive awards if their outcomes improved.
Policy Implications
To conclude, we consider implications of these findings for future policy activity. In doing so, we recognize that the II/USP and the GPA programs either are in hiatus (GPA) or have been replaced by a substantially altered version of the original policy (II/USP). However, we believe that the lessons learned from II/USP should be relevant to the current High Priority Schools Grant Program (HPSG) as well as to state efforts to implement the accountability and assistance provisions of the federal No Child Left Behind Act (NCLB). In addition, we believe that it would be beneficial to continue following the progress of II/USP schools to gain a better understanding of the longer term effects of this program on school improvement and student achievement.
General Recommendations
We have three overarching policy recommendations derived from the findings of this study.
1. Keep the attention on student learning and low performing schools.
PSAA and related standards-based policies have been very successful in capturing the attention of the education community and the general public and focusing that attention on student outcomes in general and on low performing schools in particular. We urge that this attention continue. More specifically, we suggest:
• As the state moves to respond to NCLB, it should continue to use the API as an indicator of school level performance. The API has not only garnered statewide attention but is beginning to gain wider professional acceptance through its incorporation of the California Standards Tests (CST). Moving to an entirely new system of school accountability would fuel perceptions of policy instability, which in turn tend to undermine the impact of state efforts. This recommendation does not preclude modification of the API to incorporate additional measures, as has occurred with the roll out of the CST.
• The state should continue – and perhaps sharpen – its focus on its lowest performing schools. We have found that the impact of this focus extends well beyond the schools directly participating in specific assistance programs. At the same time, we

Executive Summary
Evaluation Study of the Public Schools Accountability Act of 1999 xvii
believe that the direct effect of participation in such programs might be enhanced if scarce state funds were concentrated on the schools in greatest need, as in the High Priority Schools Grant program (see below).
• Both the state and local districts should consider ways to balance attention to core academic goals with attention to other developmental and academic needs of students. We also encourage CDE to track – through its evaluations or other indicators – the degree to which accountability measures inhibit schools’ ability to address these other concerns.
2. Recognize the influential role districts play in facilitating or constraining school improvement, and incorporate mechanisms into the accountability policies to encourage positive and productive actions at the district level.
One of the key findings of this study was the powerful influence of district context in conditioning schools’ achievement growth. Yet II/USP did little to harness and direct district influence or to hold districts accountable for ensuring the success of their II/USP schools. We argue that accountability policies in the future should proactively anticipate districts’ influence by building a role for district leadership directly into the school accountability policy.
• At the very least any school accountability policy involving potential sanctions for low performing schools should require not only district sign-off on the school’s improvement plan but the submission of a separate district plan detailing how the district will support and monitor the schools throughout the program.
• The state’s move toward district-level accountability might also include incentives to districts (e.g., reduced regulatory requirements) for improved performance in district schools.
3. Establish state and local policy environments that encourage and support instructional coherence at school sites.
Instructional coherence was the most consistent predictor of student school-level growth in student achievement in our case study schools. Both districts and the state can contribute to the development of instructional coherence by creating policy environments that motivate and support it.
State level:
• Alignment of standards, assessments, professional development programs, and other instructional policies, are important. This alignment process is underway in California – as demonstrated by the increased emphasis on the California Standards Test in the API – and should continue.
• Policy stability, consistency, and transparency are also important for promoting coherence. Frequent changes in accountability policies and programs engender confusion and mistrust, while burdensome and conflicting requirements for multiple plans and reporting siphon off school energy and attention from more instructionally relevant tasks. We caution against sweeping or erratic changes in policy as the state moves to respond to NCLB requirements or changes in the political landscape.

Executive Summary
xviii Evaluation Study of the Public Schools Accountability Act of 1999
District level:
• District personnel and external support providers should place priority on helping schools develop internal capacity and a coherent instructional program.
• School improvement planning efforts and assistance from external agents – including the district – should be geared in this direction and monitored for their effectiveness.
• Improvement efforts should seek to foster instructional collaboration and professional community among teachers through a common focus on student learning.
• Districts should pay particular attention to the deployment and development of instructionally strong leaders – and teachers – in low performing schools.
Specific Design Recommendations
Below we summarize recommendations with regard to four key components of II/USP and GPA: identification of low performing schools, school improvement planning, resources, and incentives.
Identification of low performing schools
• To ensure greater reliability in the identification process, the state should base eligibility for accountability programs on more than one year’s trend in achievement growth.
• Given the current fiscal climate, we further urge the state to target scarce discretionary resources to the lowest performing schools, as it does in the High Priority Schools Grant program, rather than the broad range of performance levels, as was the case for II/USP.
School Improvement Planning Processes
• Program design should incorporate ways to capitalize and expand on initial attention to outcomes generated by planning year activities. Monitoring and assistance during implementation may be essential to realizing long term effects.
• Schools could be encouraged to develop multi-year contracts with external support providers, with those providers assuming some form of accountability for the progress of the schools in their charge.
• Improvement plans should be evaluated and approved based on the coherence of the improvement strategies and their alignment with instructional goals.
• Other options would bring the district into the planning and implementation picture to a greater extent through district plans, support for implementation, and accountability for school outcomes.
Resources
• The state should streamline the allocation process to ensure that funds arrive in schools in a timely manner if they expect the accountability program to produce desired results.
• We urge the state to continue the practice begun in the High Priority School Grants program of concentrating funds in the schools most in need of improvement – that is, those in the lowest decile(s) of performance.

Executive Summary
Evaluation Study of the Public Schools Accountability Act of 1999 xix
Incentives
• In order for incentives, either punitive or rewarding in nature, to instill attention and motivation among school staff, the incentives should be realistic in scope, fair, and implemented consistently across years.
• We would not argue for the most severe sanctions to actually be implemented at this time, especially given the lack of research evidence as to their effectiveness, but would caution the state against making empty promises or threats in the future.
• Additional resources and assistance for improvement efforts, combined with attention to outcomes, may be more powerful incentives than extrinsic rewards and sanctions.

Executive Summary
xx Evaluation Study of the Public Schools Accountability Act of 1999

Evaluation Study of the Public Schools Accountability Act of 1999 1
Chapter 1. Overview and Conceptual Framework4
Introduction
The recent nationwide move to hold schools accountable for student performance is not an entirely new phenomenon, but it is significant in that it is so closely linked to the call for a systemic, standards-based overhaul of education. As part of this reform, states and districts are designing new approaches to holding schools and districts accountable for accomplishing their missions, or more particularly for moving the children in their charge closer to achieving state standards in key academic domains. In the 1990s states fashioned an array of accountability programs aimed at creating consequences for poor performance and incentives for improved or exceptional performance (EdSource, 2001; Fuhrman, 1999). Following this trend, California state lawmakers spent much of the late 1990s attempting to put the elements of a standards-based accountability system in place. The result was the Public Schools Accountability Act (PSAA) of 1999, which incorporates three central components designed to encourage improvement of practice and student learning. These components are: The Academic Performance Index (API); The Immediate Intervention/Underperforming Schools Program (II/USP); and The High Performing/ Improving Schools Program, including the Governor’s Performance Award (GPA) program.
Recognizing that the PSAA legislation represented a shift in state policy, the legislature called for an independent evaluation of the implementation and effects of the II/USP and GPA programs. The six research questions for this evaluation, as outlined in the original Request for Proposals, are listed below.
Research Questions
1. What are the impact on, and benefits to, students from a school’s participation in II/USP and/or GPA based on:
• Results of assessments used to determine whether or not schools have made significant progress towards meeting their growth targets per the PSAA law (Education Code Section 52058[c])?
• Results of disaggregated pupil performance data for each of the following subgroups, as specified in the PSAA law (Education Code Section 52058[c])? These subgroups include
− English language learners
− Pupils with exceptional needs
− Pupils that qualify for free or reduced price meals and are enrolled in schools that receive funds under Title I, A of the Improving America’s Schools Act (IASA) of 1994.
2. What factors contribute to schools meeting or not meeting growth targets under PSAA?
4 This chapter derives almost exclusively from O’Day (2003), with additional background information on California’s
legislative history provided by M. Perry of EdSource.

Chapter 1. Introduction
2 Evaluation Study of the Public Schools Accountability Act of 1999
3. How effectively did participating schools, school districts, and other agencies implement the API, the API for alternative schools, II/USP (especially the External Evaluator provision), and GPA components of the PSAA law?
4. What gains in student academic performance are realized from the investment of PSAA resources
• In the II/USP schools relative to comparable non-II/USP schools?
• Through GPA rewards?
• Through investment in interventions versus rewards?
5. What has been the overall impact of PSAA on school and district personnel, parents, community members, and on school and district organization and practices?
6. What unintended consequences have resulted from the implementation of the PSAA?
Organization of This Report
In December 2001, American Institutes for Research (AIR), in partnership with Policy Analysis for California Education (PACE) and EdSource, contracted with the California Department of Education to conduct an evaluation of the II/USP and GPA programs in response to these six research questions. This report is the culmination of the 19-month effort. We begin with an overview of the legislation and the evaluation design (Chapter 1), followed with a more detailed description of our research methodology (Chapter 2). Chapters 3-6 then present the main findings of the study, starting in Chapter 3 with a multi-faceted analysis of the impact of II/USP on student achievement (Research Question #1). Chapters 4 and 5 then delve into the implementation of II/USP, separating out findings for the initial planning year (Chapter 4) from those regarding subsequent (“implementation”) years of the program (Chapter 5). We then turn, in Chapter 6, to a brief analysis of the implementation and effects of the GPA program, and conclude in Chapter 7 with a discussion of our findings and their implications for policy and further research.
Organization of Chapter 1
This introductory chapter provides the conceptual and design underpinnings of the PSAA and of this evaluation. The chapter is divided into four sections. The first section presents the legislative and programmatic background to the II/USP and GPA programs. The second section outlines the implicit “theory of action” of the policy—that is, the set of assumptions underlying the model of accountability codified in the PSAA. Section three uses that theory of action and a brief outline of relevant literature to introduce the conceptual framework for the study, which provided the basis for design and instrument development. The final section outlines the main components of the design, including the levels of data collection and the relationship between specific methods and research questions.
PSAA—Legislative and Programmatic Background
The Public Schools Accountability Act of 1999 (PSAA) grew out of a 1997 report entitled, “Steering By Results.” Released by the Awards and Interventions Advisory Committee,5 this report proposed the establishment of a “comprehensive program of incentives, positive and
5 The Awards and Interventions Advisory Committee was established by the California Legislature to aid in the
development of a plan “for the establishment of incentives for the improvement of pupil academic achievement”—

Chapter 1. Introduction
Evaluation Study of the Public Schools Accountability Act of 1999 3
negative, that would have as its goal an increase in the number of students who meet or exceed [the] standards.” With the goal set for a comprehensive, statewide accountability system, Governor Gray Davis called for, sponsored, and then signed the PSAA legislation in 1999.
This action to create an accountability system marked a critical point in the education reform efforts that began in California in the 1980s, and that gained new momentum after the 1994 gubernatorial election.
Political and Legislative History
Beginning in 1983, California state leaders, particularly the Superintendent of Public Instruction, began pushing for education reform by adopting state curriculum frameworks, developing new models for professional development, adopting statewide graduation requirements, developing a statewide student assessment that placed a particular focus on writing, and undertaking other instructionally-focused reforms. Economic troubles in the early 1990s, combined with political conflicts among state leaders in Sacramento, subsequently slowed the reform momentum.
Several factors began to converge in 1994 to create an environment conducive to a re-energized and somewhat re-directed K-12 reform movement. At the level of state governance, legal settlements placed the governor-appointed State Board of Education firmly in control of education policy, diminishing the influence of the State Superintendent of Public Instruction. At the same time, concerns about school quality intensified. Both the 4th grade reading test results from the 1994 National Assessment of Educational Progress (NAEP) and the state’s soon-to-be defunct California Learning Assessment System (CLAS) tests indicated serious problems in California’s student achievement, particularly in reading.
The federal government gave an extra push for change by including a requirement for state-adopted academic standards and standards-based assessments in its 1994 Elementary and Secondary Education Act (ESEA) reauthorization. ESEA also provided a model for the subsequent creation of the state’s accountability system. California had to comply with these requirements to qualify for certain federal funds, most notably under Title I of ESEA.
In October 1995, state leaders passed Assembly Bill (AB) 265, which established a process for the development of statewide academic standards and assessments in the four core subject areas—English/language arts, mathematics, history/social science, and science. While some parts of this law were fully implemented in the ensuing years, others fell by the wayside or were replaced by other programs.
The state’s adoption of academic content standards took almost a year longer than first envisioned and created some controversy, particularly in the areas of mathematics and science. That work was finally completed in the fall of 1998.
During the same time period, California struggled to create an assessment system that could meet multiple objectives. State leaders needed to create a test that would align with the standards, but they were also committed to having student-level scores at each grade level in each subject. After trying some approaches unsuccessfully – and amid growing pressure – state lawmakers created the Standardized Testing and Reporting (STAR) Program (SB 376) toward the end of the 1997 legislative session. The State Board of Education selected the Stanford-9 as the test that all public school students in grades 2 to 11 would take in the spring of 1998. The law specified that neither English learners nor special education students were

Chapter 1. Introduction
4 Evaluation Study of the Public Schools Accountability Act of 1999
to be exempted from taking the test. The bill also called for the creation of a second assessment that would align to the academic content standards once they were finally adopted.
In California, the education and assessment of English learners has been a particular challenge. About 25 percent of the state’s students come to school needing to learn English. In 1997, lawmakers called for the development of a single English Language Development (ELD) assessment all districts would use “to assess students’ progress in acquiring fluency in English” (AB 748). Standards for the test were adopted in 1999, and it was fully implemented in 2001-02. Meanwhile, in June 1998 California voters passed Proposition 227, which required that, unless parents secure a waiver, students learning English are to be taught in “sheltered English immersion” classrooms that rely primarily on instruction in English and serve as a one-year transition to mainstream classes.
State leaders did not wait for the adoption of standards to respond to the concerns regarding student reading achievement. State revenues grew substantially beginning in early 1996, and policymakers chose to invest about $1 billion immediately to reduce class sizes at the K-3 level, and provide new textbooks and teacher professional development. Districts implemented the class-size-reduction program over about three years, beginning in the fall of 1996, with substantial negative effects on school facilities and the state’s supply of credentialed teachers. To a large degree, those schools most affected by these two problems were the schools with the highest populations of low-income and Hispanic students, many of whom are also English learners. In response, the state began investing some of its additional resources into teacher recruitment initiatives, professional development, and incentives for districts to pay higher salaries. Californians also addressed facilities funding in two ways. Voters approved a lowering of the two-thirds threshold needed for approval of local general obligation bonds to a 55 percent super-majority, and they also passed $18.1 billion in state school construction bonds between 1998 and 2002.
It was into this general environment that the PSAA was introduced in 1999. In the years since, the state has taken other major steps in its development of a standards-based education system, including the following:
• Transition to a standards-based assessment system was completed in 2002.
• Adoption of aligned instructional materials in all four core subject areas was completed in 2002, and well over $1 billion in state funds were allocated from 1999 to 2002 for school districts to use to purchase them.
• Creation of subject matter based Professional Development Institutes that created a model for district-run programs took place in 1999 and 2000.
• Creation of a training program for school principals was completed in 2001.
• Reconfiguration of the API calculation to emphasize the California Standards Test started in 2003.
With revenues flush, the state was able to provide about $680 million for incentives to schools that met newly established testing goals, as measured by the API. These incentives included about $230 million as part of the PSAA (including the GPA), plus an additional $100 million for direct financial awards to teachers and $350 million to be allocated to school

Chapter 1. Introduction
Evaluation Study of the Public Schools Accountability Act of 1999 5
sites and staffs. However, the latter two rewards were only given for one year, and the GPA for two years.
Five years of substantial increases in school funding – from 1996-97 to 2000-01—resulted in substantial investments in school facilities and a 20 percent increase in average teacher salaries. According to data from the National Education Association (NEA),6 the state increased its per-pupil expenditures from $5,327 in 1996-97 to $7,329 in 2001-02 and reduced the pupil-teacher ratio from about 23 to 1, down to 20 to 1. However, in 2001-02, California still had the highest pupil-teacher ratio (based on average daily attendance (ADA)) in the United States and was 35th in its expenditures per pupil, according to the NEA data. The current budget crisis in California, which began in 2001-02 with cuts to education during the school year, may have a serious negative impact going forward. At a minimum, the situation precludes the state from continued increases in its investment in K-12 education in the short term.
PSAA Components
As explained above, PSAA includes three major components: The Academic Performance Index (API); The Immediate Intervention/Underperforming Schools Program (II/USP); and The High Performing/Improving Schools Program, including the Governor’s Performance Award (GPA) program.
The API is the lynchpin of the whole system in that it is the basis of the targets and the identification of schools for either rewards or sanctions. The API is a numeric index assigned to each school, ranging from 200 to 1000. Initially based solely on the results of the norm-referenced SAT-9 portion of the Standardized Testing and Reporting (STAR) program, calculation of the API has more recently incorporated the California Standards Tests in English-Language Arts, Mathematics, and History-Social Science and this year gives increasing weight to these standards-based measures. The PSAA legislation calls for the use of multiple measures of performance, including attendance rates, graduation rates, as well as standards-based tests and the High School Exit Exam. Though these additional indicators are not all currently available, plans are in place to incorporate additional indicators over the next few years.
Although the API ceiling is 1000, the Board of Education set an interim performance target of 800 for all schools to achieve. This goal has dictated the basis for determining individual school API targets on a yearly basis. For a school with an API score below 800, for example, the annual performance target is to grow by five percent of the difference between its actual API score and 800. For a school with an API score of 800 or above, the target is to maintain a score of 800 or above, hopefully increasing over time as well. For a school to reach its target, it must also show comparable improvement for all numerically significant ethnic and economically disadvantaged subgroups.7
The II/USP was first implemented in the summer of 1999 when schools scoring in the bottom half of the state’s schools on the SAT-9 for two consecutive years (1998 and 1999) were invited to submit an application for participation in the program. Cohort 1 included 430 schools, representing a range of grade levels, SAT-9 deciles, and geography. Cohort 2
6 From the National Education Association’s Rankings & Estimates: Rankings of the States 2001 and Estimates of
School Statistics, various years. 7 An alternative accountability system has been established to hold schools with fewer than 100 pupils, special
education schools, and alternative schools accountable. Schools collected baseline data for this system in the 2001-02 school year.

Chapter 1. Introduction
6 Evaluation Study of the Public Schools Accountability Act of 1999
included an additional 430 schools in the fall of 2000, and 430 were included as Cohort 3 in the fall of 2001. These Cohort 2 and 3 schools had API scores in the lower five deciles8 and did not meet their API growth targets during the qualifying year. (See Exhibit 1.1 for the specific number and distributions of eligible and participating schools.)
Schools that participate in the II/USP make an explicit trade-off of additional resources over three years for potential consequences at the end of this period should those resources not result in improved student performance. More specifically, II/USP schools receive funds to create and implement an Action Plan for school improvement. The funding currently comes from two different sources: state funds appropriated for II/USP (“Action Plan Schools”) and funds from the federal Comprehensive School Reform Demonstration (CSRD) program. Additionally, schools are required to match program funds with other new or existing monies. II/USP schools are given $50,000 for the first year to develop a school Action Plan with the required assistance of a state-approved External Evaluator. State-funded schools have the following two years to implement their Action Plan, while CSRD-funded schools have the following three years to implement a research-based school reform model. Cohort 1 consisted of 350 state-funded schools and 80 CSRD-funded schools. The CSRD-funded schools in this cohort started implementation in the first year of funding; hence they did not have an External Evaluator. All Cohort 2 schools, however, received state-funded planning grants for the first year, with 47 schools receiving CSRD implementation funds in following years and 383 schools receiving state implementation funds. Cohort 3 followed the same process as Cohort 2.
With these additional resources in hand, participating schools are expected to identify barriers to student improvement and strategies to remove these barriers. They are expected to show improvement in student achievement. If they do not show improvement over the course of the funding, they are subject to local interventions (after 12 months), and eventually (after 24 months), intervention by the Superintendent of Public Instruction who will have the authority to take such actions as reassigning the principal or reorganizing or closing the school. Cohort 1 II/USP schools were scheduled to be subject to sanctions in the 2002-03 school year. However, those schools that showed some positive growth during implementation—but did not meet their growth targets—were given funding for an additional implementation year. Schools that showed no growth in either implementation year received state assistance and intervention teams.
Legislative modifications occurred across the three Cohorts of II/USP schools. Exhibit 1.2 summarizes the major aspects of the II/USP policy for each cohort and each funding source.
The High Performing/Improving Schools Program established the Governor’s Performance Award (GPA), an incentive program that awards schools that meet their growth targets, show comparable growth among all significant ethnic and economically disadvantaged subgroups, and satisfy participation rates. The first award was distributed in February 2001 and was granted on a per-pupil basis. The second award cycle was postponed until August 2002 because of state budget constraints. Although the legislation limits the award to $150 per pupil, subject to available funds, awards have not reached this level. The per-pupil award in the first year was $70; the second year, $36. Recipient schools decide how to use the funds, with approval of local governing boards. In theory, these schools may continue to receive awards if they fulfill the award criteria in subsequent years. In fact, no monies have been appropriated for awards since the second cycle: nor, given the current state budget crisis, are any future awards expected.
8 Each decile represents 10 percent of all schools.

Chapter 1. Introduction
Evaluation Study of the Public Schools Accountability Act of 1999 7
Though not within the scope of this evaluation study, the state’s High Priority Schools Grant (HPSG) Program will affect some schools that currently participate in the II/USP. The HPSG program targets schools with API scores in Decile 1 and provides planning and implementation funds for schools that apply and are selected for the program. Some Decile 1 II/USP schools are receiving funding through the HPSG program on top of their II/USP implementation funds in the 2002-03 school year. In addition, Cohort 1 Decile 1 II/USP schools that qualify for an additional year of implementation funds are receiving these funds through the HPSG Program.
Exhibit 1.3 presents the timeline for II/USP cohorts (both state-funded and CSRD) and the GPA program. Exhibit 1.2 chronicles the legislative modifications to II/USP since its inception. Understanding and accounting for these changes are necessary and challenging aspects of interpreting the policy’s effects, as the program itself has been a “moving target.”
Exhibit 1.1: Distribution of schools selected for II/USP by grade level
Cohort Funding Source Elementary Middle/
Junior High
High Other* Subtotals Totals
CSRD 56 13 10 1 80 Cohort 1
State-funded 241 65 43 1 350 430
CSRD 33 10 4 0 47 Cohort 2
State-funded 224 92 67 0 383 430
CSRD 10 1 5 0 16 Cohort 3**
State-funded 299 52 79 0 414 430
*Other includes small schools **Cohort 3 did not select CSRD schools until after our data collection and after 2002 testing.

Chapter 1. Introduction
8 Evaluation Study of the Public Schools Accountability Act of 1999
Exhibit 1.2: Summary of legislative and administrative modifications for each II/USP cohort Group Funding
Source II/USP Eligibility Application Process Selection External Evaluator (E.E.) Action Plan
State-funded
Scored in the bottom half of the statewide distribution of STAR testing in spring 1998 and spring 1999
Districts provided with list of eligible schools in Sept.1999. Districts provided state with names of schools volunteering for program in Oct. 1999.
Schools selected Oct. 1999. Random selection by grade level, considering balance across decile ranks.***
Schools could select E.E. from list of approved E.E.’s. E.E. approval process involved a written application and interviews with E.E. organization representatives and individual applicants.
Action Plan due to the SBE for approval April 15, 2000.
Cohort 1
CSRD
Eligible for CSRD program*
Schools applied for CSRD program in summer 1999.
Schools selected Sept. 1999 for CSRD and automatically placed into II/USP program.
No E.E. required. No Action Plan required. Joint district and school CSRD applications submitted.
State-funded
Districts provided with list of eligible schools in Sept. 2000. Districts provided state with names of schools volunteering for program in Oct. 2000.
Schools selected Oct. 2000. Random selection by grade level, considering balance across decile ranks.***
Action Plan with stricter guidelines than Cohort 1 due May 15, 2001.
Cohort 2
CSRD
API in the bottom five deciles in spring 2000 and did not meet growth targets in the 1999-2000 school year
II/USP schools could apply for CSRD program in spring 2001, after 1 year of planning.
Schools selected for II/USP Oct. 2000, selected for CSRD summer 2001.
Schools could select E.E. from list of approved E.E.’s. Approved list was the same as list for Cohort 1, with additional groups and individual applicants.
Joint district and school CSRD applications due May 15, 2001.
State-funded
Districts provided with list of eligible schools in Sept. 2001. District provided state with names of schools volunteering for program in Oct. 2001.
Schools selected Oct. 2001. Random selection by grade level, considering balance across decile ranks.***
Narrative Summary of Key Elements of the Action Plan due May 15, 2002.
Cohort 3
CSRD
API in the bottom five deciles in spring 2001 and did not meet growth targets in the 2000-01 school year
II/USP schools could apply for CSRD program in spring 2002, after one year of planning.
Schools selected for II/USP Oct. 2001, selected for CSRD summer 2002.**
Schools could select E.E. from new list of approved E.E.’s. E.E. approval process involved a written application and demonstrated success with underperforming schools. All individual E.E.’s had to be approved. Due to a temporary change in law, during Oct-Nov 2001 schools could select E.E. outside of the list. Use of approved E.E. list reinstated January 1, 2002.
Joint district and school CSRD applications due May 15, 2002.
* Criteria included: identified by Program Improvement and on the certified Program Improvement list due to performance on locally-determined measures; scored in bottom half of the statewide distribution of STAR testing in spring of 1998 and spring of 1999. ** See http://www.cde.ca.gov/iasa/csrd/rfa.html for a scoring rubric used in CSRD selection for 2002. *** Schools were first randomly selected from applications submitted by a state-designated date. In one year fewer applications were received, and therefore additional schools were selected from applications arriving after the initial date.

Chapter 1. Introduction
Evaluation Study of the Public Schools Accountability Act of 1999 9
Exhibit 1.3: Timeline for II/USP Cohorts (State and CSRD-funded) and GPA
Group 1999-2000 2000-2001 2001-2002 2002-2003 2003-2004 2004-2005
CSRD CSRD CSRD II/USP Cohort 1
Planning State State
Planning CSRD CSRD CSRD II/USP Cohort 2
Planning State State
Planning CSRD CSRD CSRD II/USP Cohort 3
Planning State State
GPA Year 1 award
Year 2 award
Note: 1) “CSRD” and “State” represent years that the cohort received/will receive implementation funds from either the CSRD or state-funded programs, respectively. 2) Shading indicates years in which data collection occurs for this evaluation study. 3) Cohort 1 schools that did not meet all growth targets were given an additional year of funding from the state.
PSAA—Teasing Out the Theory of Action
Although specific provisions of the II/USP legislation have undergone change over the course of the past three years, the basic elements and underlying assumptions of the program have remained intact. These assumptions are reflective of a general model of results-based school accountability that has become common across multiple jurisdictions—federal, state, and local—in the past decade. This model (termed the “new accountability” by CPRE researchers9 and codified in its most extreme form in the federal No Child Left Behind Act) identifies the school as the primary unit of accountability, holds schools accountable for producing specified results on tests of student achievement, provides extrinsic incentives for producing those results, and extends assistance and/or resources to schools that lack the capacity to do so. As part of a broader standards-based reform strategy, such models of accountability are intended to contribute to improved instruction and student achievement of common, challenging standards. Undergirding these models is a generic “theory of action” (Argyris and Schon, 1978), or set of related assumptions about the mechanisms and causal relationships through which they are to work (O’Day, 2002; Finnigan and O’Day, 2003). A very simplified representation of that theory of action might be depicted as follows in Exhibit 1.4:
9 CPRE is the Consortium for Policy Research in Education, a collaboration of education researchers at five Tier I
universities: University of Pennsylvania, Harvard University, Stanford University, University of Michigan, and University of Wisconsin-Madison. See Abelman et al. (1999) for a discussion of the “new accountability.”

Chapter 1. Introduction
10 Evaluation Study of the Public Schools Accountability Act of 1999
Exhibit 1.4: Simplified accountability theory of action model
Of course, the devil is always in the details, and the details of the PSAA model are central to an understanding of its specific theory of action and ultimately of its effects. Several examples may clarify the implications of some of those details for the evaluation efforts.
Like other results-based systems, for instance, PSAA seeks to garner the attention of educators and the public through the establishment of specific school-level targets for student performance. But exactly whose attention is being garnered and to what is that attention being directed? The characteristics of the API targets represent certain choices that California policy makers made and certain assumptions about the behavior that those choices might engender. Several types of performance are woven into the API targets:
• Performance relative to other schools. This is the norm-referenced aspect of the API. Interestingly, California, unlike some other states, chose to consider a broad range of schools as potentially low performing—that is, all schools ranking in the bottom half (Deciles 1-5) of the state’s total population of schools.
• Performance relative to an absolute standard—that is, a score of 800 on the Academic Performance Index. The fact that the API is an index is itself important as it incorporates multiple subjects, different measures, and an increased weighting over time of assessments aligned with the California content standards.
• Performance relative to past performance—that is, growth over time toward the absolute standard of 800 API.
• Performance disaggregated by “numerically significant subgroups”
Several implications ensue from California’s approach to target setting. For one thing, a large number of schools face the potential for being identified as underperforming—a much greater
Results-based Accountability Policy
Garner attention (of educators/ public) to outcome goals through ■ Targets ■ Planning ■ Consequences
Enhance motivation to improve ■ Identification/labeling
process ■ Consequences (rewards
and sanctions)
Develop capacity (educator and school) ■ External assistance ■ Allocation/ re-
allocation of resources
Improved Instruction
Improved Student Achievement

Chapter 1. Introduction
Evaluation Study of the Public Schools Accountability Act of 1999 11
proportion of schools than has been the case in most prior state systems. The assumption/hope is that the potential for identification will encourage improvement efforts across this broad range of schools. However, lessons from the implementation of the Kentucky Education Reform Act suggest that not only highly-ranked but also mid-ranked schools may balk at the notion that they are “underperforming” and may thus question the legitimacy of the accountability criteria. To the extent that the identification is perceived as illegitimate, response on the part of school staffs may be less than positive. We discuss these reactions in our case study schools in Chapters 4 and 5 of this report.
Another PSAA assumption is that the API growth targets will push schools not only to improve the average level of performance every year, but to do so across multiple subjects and for all their students, especially the lowest-performing students.10 Yet, the fact that schools may be identified if even one subgroup fails to achieve the comparable growth target may result in the over-identification of schools and again reduce the legitimacy and effectiveness of the program in the schools identified. The recent reauthorization of ESEA – the No Child Left Behind Act of 2001 – faces a similar potential problem.
PSAA has other unique design features that reflect sometimes subtle aspects of its underlying theory of action and have important implications for the evaluation. For example, an integral part of the II/USP program is that it is intended to be voluntary. By applying for the program, schools are expected to trade off the possibility of additional resources for the potential for sanctions down the road, should those resources not produce the desired improvement. Yet, if—as our case study data would seem to indicate (Chapter 4)—the voluntary nature of the program is shattered by district requirements for participation, the increased motivation expected from schools “opting into” the system may never be realized. It was critical for our evaluation team to understand the assumptions behind this expected voluntarism and to investigate not only whether those assumptions are valid but also the degree to which that voluntarism has been attained.
Other features of the policy that merit particular attention include the heavy emphasis on the role of planning, the expected contributions of “External Evaluators,” and the incorporation of positive consequences (monetary rewards) for meeting targets (See Chapters 4, 5 and 6). Taken together, the assumptions behind these and other components of the policy, form the policy’s overall “theory of action.” Exhibits 1.5 and 1.6 provide two representations of our attempts to understand this theory of action, one a graphic depiction of assumed relationships among components and the other a delineation of assumptions. These representations were instrumental in the development of the conceptual frame and the design of this evaluation.
10 The API formula rewards growth from the bottom upward more heavily than growth from the middle upward,
creating an incentive for schools to provide the most help to pupils with the lowest scores.
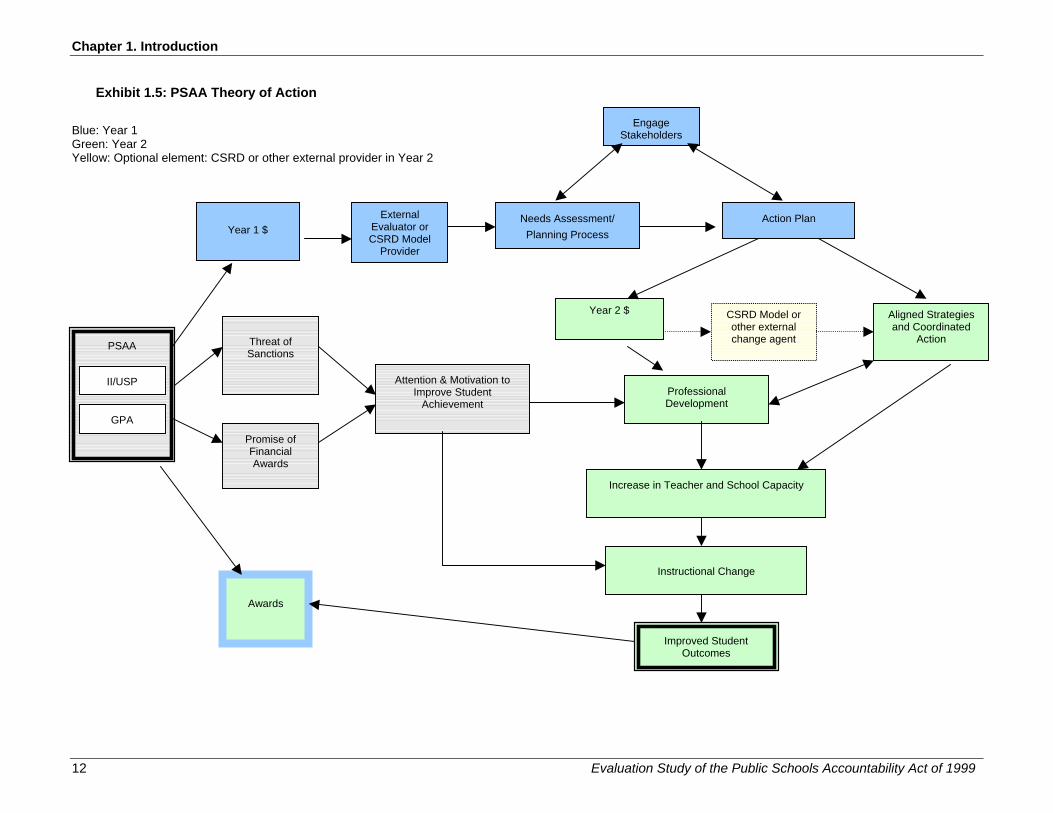
Chapter 1. Introduction
12 Evaluation Study of the Public Schools Accountability Act of 1999
Exhibit 1.5: PSAA Theory of Action
Blue: Year 1 Green: Year 2 Yellow: Optional element: CSRD or other external provider in Year 2
Year 1 $
External Evaluator or CSRD Model
Provider
Needs Assessment/ Planning Process
Action Plan
Engage Stakeholders
Year 2 $ Aligned Strategies and Coordinated
Action
Professional Development
Instructional Change
Promise of Financial Awards
Threat of Sanctions
Attention & Motivation to Improve Student
Achievement
Increase in Teacher and School Capacity
Improved Student Outcomes
Awards
PSAA
II/USP
GPA
CSRD Model or other external change agent
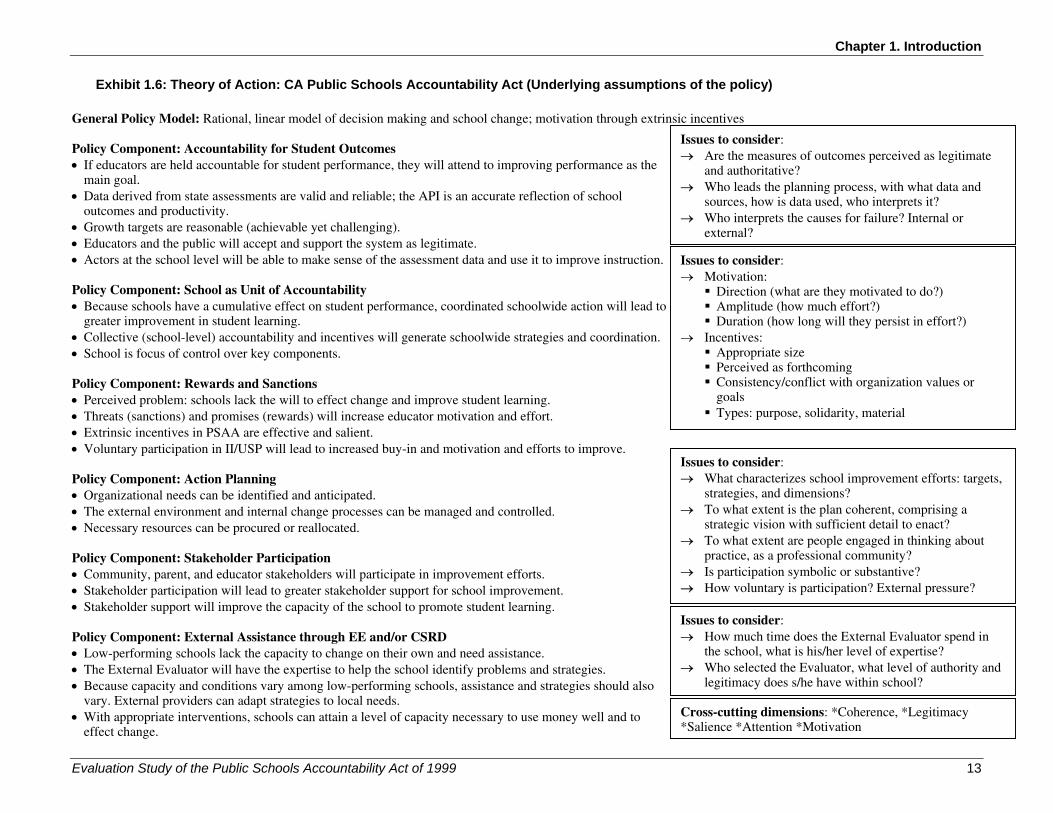
Chapter 1. Introduction
Evaluation Study of the Public Schools Accountability Act of 1999 13
Exhibit 1.6: Theory of Action: CA Public Schools Accountability Act (Underlying assumptions of the policy) General Policy Model: Rational, linear model of decision making and school change; motivation through extrinsic incentives Policy Component: Accountability for Student Outcomes • If educators are held accountable for student performance, they will attend to improving performance as the
main goal. • Data derived from state assessments are valid and reliable; the API is an accurate reflection of school
outcomes and productivity. • Growth targets are reasonable (achievable yet challenging). • Educators and the public will accept and support the system as legitimate. • Actors at the school level will be able to make sense of the assessment data and use it to improve instruction. Policy Component: School as Unit of Accountability • Because schools have a cumulative effect on student performance, coordinated schoolwide action will lead to
greater improvement in student learning. • Collective (school-level) accountability and incentives will generate schoolwide strategies and coordination. • School is focus of control over key components. Policy Component: Rewards and Sanctions • Perceived problem: schools lack the will to effect change and improve student learning. • Threats (sanctions) and promises (rewards) will increase educator motivation and effort. • Extrinsic incentives in PSAA are effective and salient. • Voluntary participation in II/USP will lead to increased buy-in and motivation and efforts to improve. Policy Component: Action Planning • Organizational needs can be identified and anticipated. • The external environment and internal change processes can be managed and controlled. • Necessary resources can be procured or reallocated. Policy Component: Stakeholder Participation • Community, parent, and educator stakeholders will participate in improvement efforts. • Stakeholder participation will lead to greater stakeholder support for school improvement. • Stakeholder support will improve the capacity of the school to promote student learning. Policy Component: External Assistance through EE and/or CSRD • Low-performing schools lack the capacity to change on their own and need assistance. • The External Evaluator will have the expertise to help the school identify problems and strategies. • Because capacity and conditions vary among low-performing schools, assistance and strategies should also
vary. External providers can adapt strategies to local needs. • With appropriate interventions, schools can attain a level of capacity necessary to use money well and to
effect change.
Issues to consider: → Are the measures of outcomes perceived as legitimate
and authoritative? → Who leads the planning process, with what data and
sources, how is data used, who interprets it? → Who interprets the causes for failure? Internal or
external?
Issues to consider: → How much time does the External Evaluator spend in
the school, what is his/her level of expertise? → Who selected the Evaluator, what level of authority and
legitimacy does s/he have within school?
Cross-cutting dimensions: *Coherence, *Legitimacy *Salience *Attention *Motivation
Issues to consider: → Motivation:
Direction (what are they motivated to do?) Amplitude (how much effort?) Duration (how long will they persist in effort?)
→ Incentives: Appropriate size Perceived as forthcoming Consistency/conflict with organization values or goals Types: purpose, solidarity, material
Issues to consider: → What characterizes school improvement efforts: targets,
strategies, and dimensions? → To what extent is the plan coherent, comprising a
strategic vision with sufficient detail to enact? → To what extent are people engaged in thinking about
practice, as a professional community? → Is participation symbolic or substantive? → How voluntary is participation? External pressure?

Chapter 1. Introduction
14 Evaluation Study of the Public Schools Accountability Act of 1999
Conceptual Framework for the Evaluation
Outlining the policy’s theory of action is only the first step in designing an appropriate research strategy. We also needed to “interrogate” the PSAA model in light of relevant theory and research. (See “Issues to consider” in Exhibit 1.6 for an illustration of the interrogation process.) Our goal was to understand the research basis for the policy as well as to identify factors that might attenuate its effects. Given space constraints, we can present but a bare outline of the relevant literature here.
Relevant Literature
Support for the PSAA theory of action comes from a variety of sources, including extensive research on the influence of motivation and capacity on employee performance (Rowan, 1996), on the role of attention in organizational behavior (March, 1994), on the positive impact of goal-setting on performance (Locke and Latham, 1990), and on the use of collective incentives in situations requiring cooperation in the performance of complex tasks (Mohrman and Lawler, 1996; Odden and Kelley, 1997). These bodies of research lend credence to the policy’s combination of incentives and assistance, to the use of specific API growth targets, and to the focus on the school (rather than individual educators) as the unit of accountability.
More specific to results-based accountability, some evidence is beginning to accumulate that teachers are “working harder” in response to the accountability measures and are attending to externally set student-learning goals (Finnigan and Gross, 2001; Kelley, Odden, Milanowski and Henemann, 2000; O’Day, 2002). A number of jurisdictions (Chicago, Kentucky, Texas, North Carolina) are also attributing observed gains in student test scores in large part to the institution of results-based accountability, though researchers debate whether these gains are real or the results of increased familiarity with the test or teaching to the test.11 Grissmer et al. (2000) assert that NAEP scores validate state evidence of improved achievement in Texas and Maryland, states that, along with North Carolina, established testing and accountability programs in the 1990s.
Much of the literature on accountability, however, suggests that its impact on school organizations, teacher motivation, and student achievement is highly variable, depending on prior achievement levels and schools’ internal norms of accountability (DeBray, Parson, and Woodworth, 2001; Elmore, 2001), on various dimensions of initial organizational capacity (Gwynne and Easton, 2001; O’Day 2002), and on individuals’ expectations for success (Lawler, 1994; O’Day, 1996). Moreover, despite the popularity of using external support providers (like PSAA’s External Evaluators) in school reform efforts, the research on their effectiveness is limited and equivocal. Even in the private sector, where $15 billion is spent annually on management consulting (Micklethwait and Wooldridge, 1996), there is a virtual void in research or evaluation of the effectiveness of outside consultants. In education, factors such as support provider capacity, intensity and target of assistance, and intervention strength all seem to mediate the impact of external assistance (Fullan, 1991; Loucks-Horsley and Mundry, 1991; Chimerine, Haslam, and Laguarda, 1994; Finnigan and O’Day, 2003).12
In addition to literature cited above, we also examined research on instructional and organizational capacity and on professional development. Discussions of organizational
11 For alternative perspectives on this issue, see Grissmer, Flannigan, Kawata, & Williamson, 2000; Haney, 2000;
Klein, Hamilton, McCaffrey & Stecher, 2000; and Koretz & Barron, 1998 12 See Finnigan & O’Day, 2003 for a fuller discussion of the research on external assistance.
Chapter 1. Introduction
Evaluation Study of the Public Schools Accountability Act of 1999 15
capacity are particularly relevant to the design and assumptions underlying PSAA and II/USP. Beginning with the effective schools research and continuing through literature on organizational learning and complexity, analysts have delineated various aspects of organizational capacity (Purkey and Smith, 1983; Levine and Lezotte, 1990; O’Day, Goertz, and Floden, 1995; Newmann and Wehlage, 1995; Mohrman and Lawler, 1996). Much of this literature has examined the characteristics of high performing schools, on the assumption that these are characteristics that should be promoted in less successful ones. These characteristics included such things as a shared vision focused on student learning and common strategies for engendering that learning, a culture of professional collaboration and collective responsibility, high quality curriculum and systematic monitoring of student learning, strong instructional leadership (usually from the principal), and adequate resources. More recent research has especially noted the importance of professional community (McLaughlin and Talbert, 1993; Newmann and Wehlage, 1995) in which information and authority are shared (Mohrman and Lawler, 1996; Darling-Hammond, 1996).
Cohen and Ball (1999) have brought together this broad organizational focus with prior work on teacher knowledge and skills to try to tease out the complex interplay of the individual and organizational aspects of instructional capacity. They argue that, at its base, instructional capacity is “a function of the interaction among [teachers, students, and educational materials], not the sole province of any single one, such as teachers’ knowledge or skill, or curriculum”. Moreover, because the instructional unit (teachers-students-materials) is nested within the organization, interaction with and management of the environment is integral to understanding instructional capacity. Relevant aspects of the instructional environment are the level of instructional coordination among classrooms and individuals, opportunities for professional and organizational learning, the prevailing normative structures in the school, the ways in which teaching and learning are monitored and incentives provided for improvement, and the level and type of resources available. Cohen and Ball (1999) further suggest that those who intervene in schools to build instructional capacity vary in the components of the instructional unit or school environment that they target for change as well as in their strategies for addressing them. Prior research on interventions in low performing schools found this delineation of intervention targets and strategies particularly useful for understanding the role and impact of external change agents (Finnigan and O’Day, 2003).
Synthesizing this review of the literature and applying it to our earlier delineation of the PSAA theory of action, our research team developed the conceptual framework depicted in abbreviated form in Exhibit 1.7. This conceptual framework along with the research questions specified in the RFP, provided the basis for the design of all aspects of the instrument development, data collection and analysis.

Chapter 1. Introduction
16 Evaluation Study of the Public Schools Accountability Act of 1999
PSAA
State Context
District Context: Policies, data, technical
assistance, role of officials Community Context
Initi
al S
choo
l Cap
acity
External
Evaluator Planning Process
Action Plan
Collective Attention to Outcomes and Will to
Improve
External Change Agents:
- External Evaluator - CSRD Model Provider
Intervention Strategies:
- Targets (of the intervention, i.e. students, teachers, skills…) -Implementation Strategies - Dimensions (coherence, legitimacy, prescriptiveness, authority…)
School Capacity:
- Vision - Learning beliefs/ focus
- Leadership - Professional community
- Human and material resources
- Climate - Supportive structures
- Availability and use of information
Change in Instruction:
- Focus - Amount - Coordination- Content - Pedagogy
Changes
in Student Test
Scores
School-level Stakeholders- Individual teachers (role,
capacity, dispositions, beliefs)
- Principal - Other school staff
Implementation of Rewards and Sanctions
Salience of Threats & Promises
Individual and Aggregate Student Characteristics
Denotes planning year
Denotes post planning years
Denotes variables exogenous to school
Denotes variables endogenous to school
Exhibit 1.7: Conceptual Framework

Chapter 1. Introduction
Evaluation Study of the Public Schools Accountability Act 17
Overview of Study Design
The study design derives from the research questions posed by the CDE, our understanding of the policy theory of action, and the conceptual model we developed to investigate the factors that might influence variation in program implementation and outcomes.
General Conceptual Approach
This evaluation utilizes a mixed methodology, longitudinal approach that enables us to examine student achievement across three cohorts of II/USP schools and to track changes in program implementation over the full period of implementation. While the quantitative data allows us to assess the relationships between program implementation and outcomes, the qualitative data will allow us to explain quantitative findings, identify issues not captured through the quantitative approaches, and highlight the processes of implementation.
To design this study, we have taken into account the evolution of the PSAA programs, the complexity of the state and district context, and the multiple factors that can affect the implementation of a complicated accountability system with numerous components. Our deliberations led us to develop an approach that would answer the research questions by examining the implementation and impact at a series of embedded levels.
Level 1. Statewide achievement trends. An analysis of achievement data for all California schools is necessary to give us a full picture of the achievement context and allow us to use school- and student-level demographic and programmatic indicators to analyze overall relationships among academic achievement and participation in the PSAA. For our analyses of the impact of the II/USP and CSRD programs, we use API and SAT-9 data from all II/USP and CSRD schools and from comparison schools that applied (Cohort 1) or were eligible to apply (Cohorts 2 and 3) for the II/USP program. For our analyses of the impact of the GPA program, we use data from all schools in California.
Level 2. Districts and external support providers. Understanding implementation and collecting data on a range of indicators from districts that have II/USP schools will provide a landscape for district contextual factors. In addition, understanding the role of and strategies used by External Evaluators and CSRD model providers is essential to understanding implementation, since much of the impact of the programs will be mediated by the providers working with schools. Thus, we surveyed all of the External Evaluators and CSRD model providers, and three district administrators from half the districts with at least one II/USP school.
Level 3. School-level (broad sample) This level of data collection is designed to give us greater understanding of implementation at the school level. For this purpose, we administered surveys to principals and teachers in a stratified random sample of II/USP schools in all three cohorts and to matched comparison schools as well. We determined that gathering data from all three cohorts would give us insights about variations at different stages of implementation. We also administered surveys to a sample of 130 GPA and comparison schools.
Level 4. School-level (case-study sample) We have completed in-depth data collection and analysis of a sample of 21 case study schools, examining carefully their Action Plans, interviewing key personnel at the school site and district, conducting focus groups with leadership teams and parents, and interviewing the External Evaluator associated with the

Chapter 1. Introduction
18 Evaluation Study of the Public Schools Accountability Act
school. Information about characteristics of good plans will contribute to our set of effectiveness indicators. Initial case study analyses helped us to refine study constructs and develop survey items relevant to implementation. For the case study schools, in districts where the data were available, we also conducted analyses of linked longitudinal student-level data on SAT-9. These analyses enrich the base of information for answering Research Question 1.
Components of the Study Design: Addressing the Research Questions
Below we outline the data collection methods we have used to address each research question. Specific sampling frames for the case studies and the school surveys appear in Chapter 2.
Research Question 1: What are the impact on and benefits to students from a school’s participation in II/USP and/or GPA, based on a) achievement of annual API growth targets and b) disaggregated assessment results for English Language Learners (ELs), pupils with exceptional needs, and pupils who qualify for free or reduced-price meals and attend Title I schools?
Both the II/USP and the GPA are designed to enhance student achievement, but are designed to do so via different means. The II/USP focuses resources on underperforming schools to support reform and capacity-building efforts; the GPA program rewards schools for growth and may act as an incentive for schools to strive toward reaching their annual performance targets. Research Question 1 addresses the extent to which participation in the II/USP program and receipt of a GPA are related to increases in student performance as measured by the API. We are approaching this question in two ways. First, we collected 1999, 2000, 2001, and 2002 APIs; student-level SAT-9 scores for 1998, 1999, 2000, 2001, and 2002; and indicators for II/USP and GPA participation for all public schools in California. Using these data, we analyzed overall relationships between school-level achievement trends and participation in II/USP and GPA, as well as achievement trends for ELs, pupils with exceptional needs, pupils who qualify for free or reduced-price meals, and students who attend Title I schools. Analytic issues and our findings are discussed in Chapter 3 and Appendix A.
The second type of analysis conducted to answer Research Question 1 involved longitudinally linked student-level SAT-9 scores, for 1998 through 2002, for a sub-set of the 21 case study schools, as well as non-II/USP matched comparison schools. Although we originally intended to collect data and conduct analyses for all case study schools and matched comparisons, we were able to obtain longitudinally linked data for all five years from only three of our case study districts.
Research Question 2: What factors contribute to schools meeting or not meeting growth targets under PSAA?
To understand the nature of the relationships between participation in PSAA and student achievement, we must consider district-, school-, and student-level factors that may influence this relationship. (See conceptual framework, Exhibit 1.7.) For example, how do district-level reform policies support II/USP interventions? How do school governance or resource allocation practices moderate the effectiveness of the II/USP interventions and GPA participation in improving student achievement? Does student mobility influence
Chapter 1. Introduction
Evaluation Study of the Public Schools Accountability Act 19
achievement trends in PSAA schools, and does this depend on other student or school characteristics?
To address Research Question 2, we analyzed the assessment data described under Research Question 1 in combination with student-level indicators of race/ethnicity; participation in ESL, bilingual, and special education programs; grade retention and mobility gathered from districts; as well as school and district indicators related to resources, demographic composition, and program participation. We also analyzed the extent to which district and school policies, practices, and capacities, as assessed via surveys, may moderate the relationships between program involvement and achievement.
Research Question 3: How effectively did participating schools, school districts, and other agencies implement the API, II/USP (especially the External Evaluator provision), and GPA components of the PSAA?
The key issue in this question concerns the dynamics and quality of II/USP implementation. The implementation process is critical to program effectiveness, and it is important to determine what and how school and district factors influence implementation of the reforms intended under PSAA. To address this question, we evaluated implementation using data on school practices derived from school-level surveys, site visits, and surveys of the External Evaluators who worked with II/USP schools. We analyzed the key sets of relationships depicted in our conceptual framework and elaborated more fully in the construct matrix used to guide instrument development and cross-case and survey analyses.
Research Question 4: What gains in student academic performance are realized from the investment in PSAA resources a) in the II/USP schools relative to non-II/USP schools; b) through the GPA rewards; and c) through the investment in interventions versus rewards?
The focus of this question is on the impact on academic achievement of the resources that are invested in schools that participate in the II/USP and GPA programs. Resources in this case include both fiscal awards and the supports and structures provided. Although both II/USP schools and GPA schools—some of which overlap both programs—receive funding, the purposes of and eligibility for funding vary across these programs.
Because the complex array of intervening variables makes attributing achievement outcomes to investments in these programs (beyond the overall impact on achievement revealed in the response to Research Question 1) unfeasible, we focused our response to Question 4 on a largely descriptive analysis of the ways in which schools actually spent the money they received from II/USP, CSRD, and GPA. We used survey data from school principals to determine what kinds of planning and implementation activities were supported with program funds, whether and how these differed by program, by year of implementation, and by cohort. From our interview and survey data, we also were able to report where schools found the required matching funds and what activities would likely not have occurred had program funds not been obtained.
Research Question 5: What has been the overall impact of PSAA on school and district personnel, parents, community members, and on school and district organization and practices?
Both the II/USP and the GPA are likely to influence the educational practices and attitudes of administrators, teachers, and parents. Depending upon their nature, these practices and attitudes may or may not support improvements in academic achievement. Using data

Chapter 1. Introduction
20 Evaluation Study of the Public Schools Accountability Act
gathered via district and school surveys and from interviews and focus groups conducted as part of the case studies, we assessed stakeholders’ reform-related attitudes (e.g., commitment to the reform, trust in the processes and leadership guiding the reform) and their motivation to initiate, participate, and sustain changes that may be necessary to improve student achievement.
Research Question 6: What unintended consequences have resulted from the implementation of the PSAA?
As noted above, both the II/USP and the GPA programs are likely to influence the educational practices and attitudes of administrators, teachers, and parents. Some of these changes may be negative or unexpected. For example, a middle-school principal may cancel programs or reduce class time in content areas other than mathematics and language arts in an effort to achieve the API growth target and earn a GPA. To evaluate these and other types of unintended consequences, some of which may be positive, we analyzed data gathered from district and school surveys and from the interviews and focus groups conducted during site visits with case study schools.
Conclusion
As stated in the introduction, the purpose of this chapter has been to outline briefly the general approach and design of the II/USP and GPA evaluation. We now turn in Chapter 2 to a more detailed discussion of the design and methodology, including major decisions on a variety of data collection and analysis issues.
Evaluation Study of the Public Schools Accountability Act of 1999 21
Chapter 2. Methodology
Introduction
This chapter provides an overview of the evaluation methodology, which we discuss in greater detail in Appendix A (achievement analyses) and in Appendix B (case study and survey analyses).
We had two goals in constructing the design and methods used in this evaluation.
First, we sought to respond directly to each of the research questions outlined in the RFP, ensuring defensible methods and robust results. Because of the breadth of the evaluation charge, several challenges confronted us in this endeavor, the resolution of which determined out multi-method approach. For example:
• The charge to evaluate both implementation and outcomes required the collection and analysis of data both on student achievement and on processes within and across schools.
• The II/USP and CSRD programs are implemented across several years, and meaningful change in school sites takes considerable time; yet the time for the evaluation was limited to 19 months, including refinement of design and analysis of results. Since we could not follow schools longitudinally over the course of their participation, we had to approximate the implementation of the program over time by collecting data on each cohort of schools cross-sectionally.
• School change and policy implementation are complex and context-dependent processes that require collection of rich, qualitative data to understand interconnections between school context, program, instruction, and student achievement. At the same time, results of the evaluation need to be generalizable across multiple contexts, requiring broader, more representative samples than are possible through case study and other qualitative methods.
• II/USP and school improvement involve multiple actors and constituents and it was important for the evaluation team to understand the issues and effects of the program from these multiple perspectives.
To address these and other challenges, we needed a multi-level, multi-method approach that would allow us to look across cohorts at various stages of implementation, to triangulate perspectives and data from multiple actors, to combine depth and breadth in our data and analyses, and to begin to link outcomes with aspects of program design and implementation, as well as with a variety of antecedent conditions. Our solution was the multi-level approach outlined in Chapter 1 of this report. To review, the four levels of the evaluation design are:
Level 1. Analysis of statewide achievement trends using data from all II/USP, CSRD, and relevant comparison schools across the state
Level 2. Surveys of district administrators and external assistance providers across the state to understand the broad landscape of district contextual factors and the range in roles and strategies of CSRD and II/USP assistance providers

Chapter 2. Methodology
22 Evaluation Study of the Public Schools Accountability Act of 1999
Level 3. Surveys of teachers and principals in a broad and representative sample of II/USP, CSRD, GPA, and comparison schools to understand the range of school-level responses to PSAA programs
Level 4. In-depth data collection from a limited sample of 21 case study schools spread across three cohorts, two programs (state-funded II/USP and federally-funded CSRD), and two levels of schooling (elementary and secondary).
Exhibits 2.1 and 2.2 summarize the data collection methods used for each of these Levels. Both tables link the data collection methods with the six research questions that were outlined in the Introduction.
As important to the study design as the data sources and general methods, of course, was the content of those data and our analysis. Our second goal in our design, therefore, was to build the evaluation on a firm conceptual base that incorporated both the intentions of the policy and what we know from prior research and theory. As discussed in Chapter 1, we began with the policy’s “theory of action” and used relevant theoretical and empirical literature to interrogate that theory of action and develop the conceptual model for the study.
From this conceptual framework and the methodological approach outlined above, we developed a construct matrix to guide our data collection at all four levels of the study design. This matrix served to operationalize the conceptual framework and to ensure that the content of our data reflected the research questions and the relevant knowledge base. The matrix identified a) key constructs from the conceptual framework for which we required information, b) the levels of the system and respondents who could provide that information (ensuring triangulation of data from multiple sources), and c) the instruments (e.g., surveys and protocols) to be used in obtaining the required data. For reference, we include a copy of the construct matrix in Appendix C.
We now turn to an overview of the more specific methods used throughout this study. More detailed description of those methods can be found in Appendices A and B. We have organized this discussion in three main parts. The first describes the methods employed in the case studies of II/USP and CSRD schools (Level 4 above). The second delineates survey methodology for the broad sample of principals and teachers (Level 3) and for district and external assistance providers (Level 2). Finally we outline the achievement analyses (Level 1) to which we then turn in detail in Chapter 3.
In each section below, we discuss the purpose of the methods used, the sample selection process, administration activities and challenges, and data analysis methods.
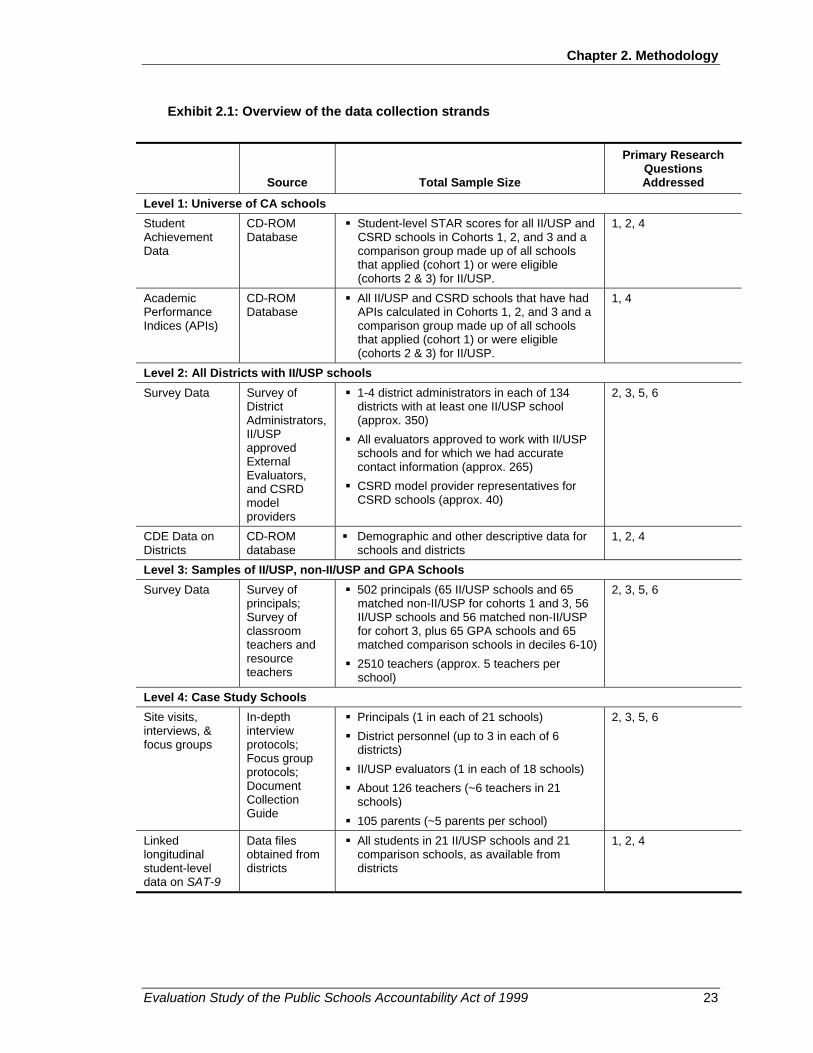
Chapter 2. Methodology
Evaluation Study of the Public Schools Accountability Act of 1999 23
Exhibit 2.1: Overview of the data collection strands
Source Total Sample Size
Primary Research Questions Addressed
Level 1: Universe of CA schools Student Achievement Data
CD-ROM Database
Student-level STAR scores for all II/USP and CSRD schools in Cohorts 1, 2, and 3 and a comparison group made up of all schools that applied (cohort 1) or were eligible (cohorts 2 & 3) for II/USP.
1, 2, 4
Academic Performance Indices (APIs)
CD-ROM Database
All II/USP and CSRD schools that have had APIs calculated in Cohorts 1, 2, and 3 and a comparison group made up of all schools that applied (cohort 1) or were eligible (cohorts 2 & 3) for II/USP.
1, 4
Level 2: All Districts with II/USP schools Survey Data Survey of
District Administrators, II/USP approved External Evaluators, and CSRD model providers
1-4 district administrators in each of 134 districts with at least one II/USP school (approx. 350) All evaluators approved to work with II/USP
schools and for which we had accurate contact information (approx. 265) CSRD model provider representatives for
CSRD schools (approx. 40)
2, 3, 5, 6
CDE Data on Districts
CD-ROM database
Demographic and other descriptive data for schools and districts
1, 2, 4
Level 3: Samples of II/USP, non-II/USP and GPA Schools Survey Data Survey of
principals; Survey of classroom teachers and resource teachers
502 principals (65 II/USP schools and 65 matched non-II/USP for cohorts 1 and 3, 56 II/USP schools and 56 matched non-II/USP for cohort 3, plus 65 GPA schools and 65 matched comparison schools in deciles 6-10) 2510 teachers (approx. 5 teachers per
school)
2, 3, 5, 6
Level 4: Case Study Schools Site visits, interviews, & focus groups
In-depth interview protocols; Focus group protocols; Document Collection Guide
Principals (1 in each of 21 schools) District personnel (up to 3 in each of 6 districts) II/USP evaluators (1 in each of 18 schools) About 126 teachers (~6 teachers in 21 schools) 105 parents (~5 parents per school)
2, 3, 5, 6
Linked longitudinal student-level data on SAT-9
Data files obtained from districts
All students in 21 II/USP schools and 21 comparison schools, as available from districts
1, 2, 4

Chapter 2. Methodology
24 Evaluation Study of the Public Schools Accountability Act of 1999
Exhibit 2.2: Overview of evaluation methods by research question
Evaluation Methods Case Study Site Visits
Research Questions
CDE Data on Schools and
Districts
Student-Level STAR
Data API data
Linked Longitudinal
Student-level Data Interviews
Focus Groups
Classroom Observations
Written Survey Data - Districts - External Evaluators - CSRD Model Providers - Principals - Teachers
1
2 3 4
5 6

Chapter 2. Methodology
Evaluation Study of the Public Schools Accountability Act of 1999 25
Case Studies of II/USP Schools
Purpose
As discussed briefly in Chapter 1, we completed in-depth data collection and analysis for a sample of 21 schools across six California school districts. Our purpose was to obtain in-depth information on the context, implementation, and effects of II/USP from the perspectives of those most directly involved—school personnel and parents, as well as district administrators and external evaluators working with the school. More specifically, we planned the case study component of this study in order to understand:
• Factors that contribute to schools meeting or not meeting growth targets under PSAA. We examined the extent to which district and school policies, practices, and capacities moderate the relationships between program involvement and achievement. (Research Question 2)
• How effectively participating schools, school districts, and other agencies implement the API, II/USP (especially the External Evaluator provision), and GPA components of the PSAA. We evaluated implementation using data on school practices derived from the site visit interviews and classroom observations. (Research Question 3)
• The overall impact of PSAA on school and district personnel, parents, community members, and on school and district organization and practices. By interviewing key stakeholders at both the case study schools and districts, we were able to assess the PSAA’s primary outcomes at the classroom, school, and district levels. (Research Question 5)
• Unintended consequences resulting from the implementation of the PSAA. During visits to case study schools, we gathered information on the effects of PSAA, both intended and unintended, as seen through the eyes of key stakeholders. (Research Question 6)
Sample Selection
District contextual factors shape the implementation and impact of II/USP. Thus, in order to study the program’s implementation and outcomes, we examined districts representing different local contexts. To achieve adequate diversity, we based our selection of case study schools primarily on the three dimensions shown in Exhibit 2.3—II/USP cohort, funding source, and grade level. We also considered several secondary criteria, including geographic location, school and district size, CSRD model, and diversity of student population. Within the constraints imposed by these criteria, we chose districts and schools through random selection.13
Inclusion of schools from each of the three cohorts provided perspectives on three different stages of II/USP implementation. This resulted in a richer understanding of how schools prepare for, engage in, and plan to sustain the reforms intended by the PSAA. In addition, since modifications were made to II/USP administrative procedures each year (see Exhibit 1.2), it was important to include schools that represented each iteration of the II/USP selection, planning, and implementation processes.
13 One district was selected with certainty due to the II/USP participation of a large percentage of schools from that
district.
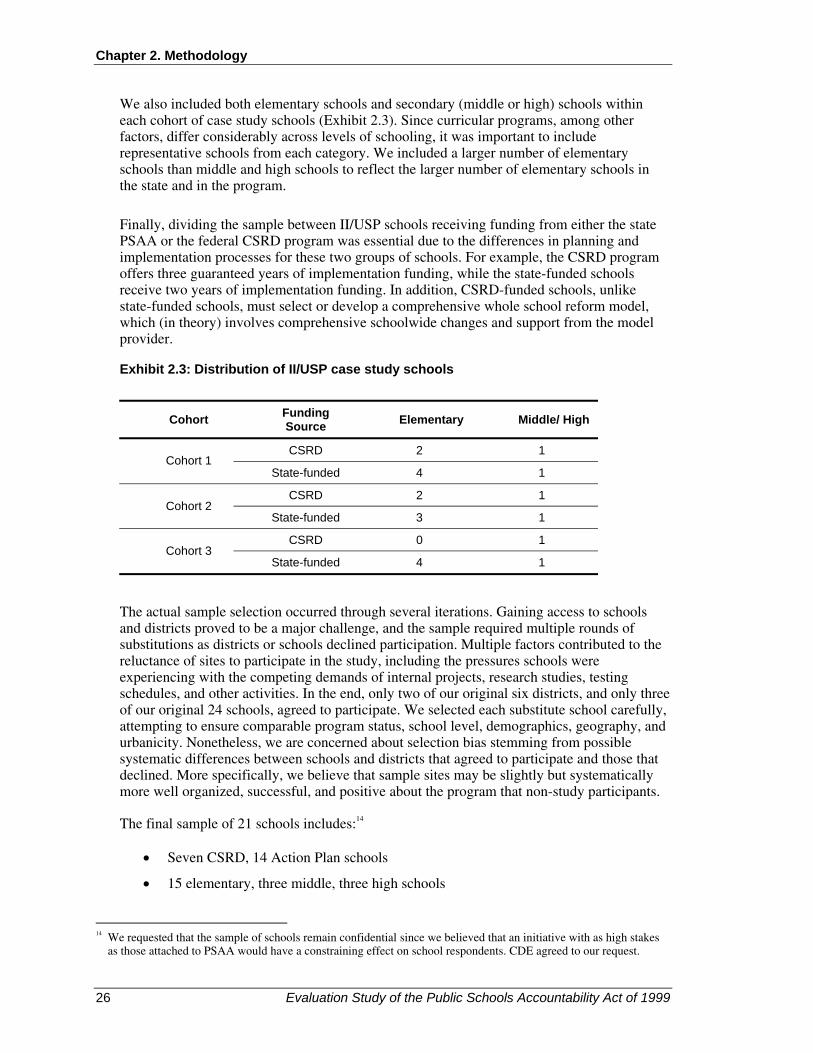
Chapter 2. Methodology
26 Evaluation Study of the Public Schools Accountability Act of 1999
We also included both elementary schools and secondary (middle or high) schools within each cohort of case study schools (Exhibit 2.3). Since curricular programs, among other factors, differ considerably across levels of schooling, it was important to include representative schools from each category. We included a larger number of elementary schools than middle and high schools to reflect the larger number of elementary schools in the state and in the program.
Finally, dividing the sample between II/USP schools receiving funding from either the state PSAA or the federal CSRD program was essential due to the differences in planning and implementation processes for these two groups of schools. For example, the CSRD program offers three guaranteed years of implementation funding, while the state-funded schools receive two years of implementation funding. In addition, CSRD-funded schools, unlike state-funded schools, must select or develop a comprehensive whole school reform model, which (in theory) involves comprehensive schoolwide changes and support from the model provider.
Exhibit 2.3: Distribution of II/USP case study schools
Cohort Funding Source Elementary Middle/ High
CSRD 2 1 Cohort 1
State-funded 4 1
CSRD 2 1 Cohort 2
State-funded 3 1
CSRD 0 1 Cohort 3
State-funded 4 1
The actual sample selection occurred through several iterations. Gaining access to schools and districts proved to be a major challenge, and the sample required multiple rounds of substitutions as districts or schools declined participation. Multiple factors contributed to the reluctance of sites to participate in the study, including the pressures schools were experiencing with the competing demands of internal projects, research studies, testing schedules, and other activities. In the end, only two of our original six districts, and only three of our original 24 schools, agreed to participate. We selected each substitute school carefully, attempting to ensure comparable program status, school level, demographics, geography, and urbanicity. Nonetheless, we are concerned about selection bias stemming from possible systematic differences between schools and districts that agreed to participate and those that declined. More specifically, we believe that sample sites may be slightly but systematically more well organized, successful, and positive about the program that non-study participants.
The final sample of 21 schools includes:14
• Seven CSRD, 14 Action Plan schools
• 15 elementary, three middle, three high schools
14 We requested that the sample of schools remain confidential since we believed that an initiative with as high stakes
as those attached to PSAA would have a constraining effect on school respondents. CDE agreed to our request.

Chapter 2. Methodology
Evaluation Study of the Public Schools Accountability Act of 1999 27
• Eight Cohort 1 schools, seven Cohort 2 schools, six Cohort 3 schools
• Nine northern, six mid-, six southern California schools
• Six different CSRD models; range of External Evaluators
• 15 urban, four suburban/urban fringe, three rural schools
• Nine Decile 1 schools, four Decile 2 schools, four Decile 3 schools, two Decile 4 schools, two Decile 5 schools (based on year that school began participation)
Instrument Development
Using our conceptual framework and construct matrix as guides, we developed an extensive set of site visit instruments to ensure that we were collecting complete and comparable data across sites. To develop the interview protocols, we specified key constructs and variables at district, school, and classroom levels, reviewed existing protocols from prior research, and pilot tested the instruments with a small sample of principals and teachers. More detailed discussion of the instrument development and pre-site visit activities appears in Appendix B. Appendix C includes copies of all instruments and forms developed for this study. The instruments developed for the site visits included:
• Principal interview protocol
• Teacher interview protocol
• Resource teacher interview protocol
• External Evaluator interview protocol
• CSRD model provider interview protocol
• District staff interview protocol
• Leadership/Action Plan team focus group protocol
• Parent focus group protocol
• Document collection guide
• Classroom observation guide
• School observation guide
Site Visit Administration
Because of the difficulty gaining access to case study sites, visits occurred in both spring (11 schools) and fall (10 schools) of 2002. A two-person research team with at least one senior researcher visited each school for two days to interview the principal and four to six teachers at each site and to conduct focus groups and classroom observations. Either during the visit or on a separate occasion, site visitors also interviewed approximately three district administrators knowledgeable about II/USP and the External Evaluator or CSRD model assistance provider for each school. AIR and PACE staff worked with the school contacts to choose teachers for interviews. In most cases, researchers interviewed one resource teacher, four randomly selected teachers from a range of grade levels, and one teacher whom the principal expected to have an interesting or strong viewpoint about the II/USP policy. In

Chapter 2. Methodology
28 Evaluation Study of the Public Schools Accountability Act of 1999
many cases, we were able to interview the teachers’ union representative for the school. All interviewers used the developed protocols to guide interviews with school and district staff and (with permission) audio-taped interviews to ensure accuracy of notes. Respondents participated voluntarily and signed informed consent forms. Interviews generally lasted 30-60 minutes.
In addition, research teams conducted two focus group sessions, one with parents and the other with the school’s leadership team, and observed four to six mathematics and/or literacy lessons. Appendix B describes site visit preparation and administration procedures in greater detail.
Data Analysis
Post-Visit Write-ups and De-briefing Sessions
After each site visit, the research team utilized audiotape recordings when possible to expand on and clean the interview notes and typed up any hand-written notes they may have taken. Using these notes, classroom observations, and other documents collected at each school site, researchers wrote extensive summaries of their site visits, each approximately 10-15 pages. To construct this write-up, site visitors read each interview and summarized the primary themes of the interview in a one-page summary form (included in Appendix C). The visitors then completed an analysis matrix by filling in information related to the primary constructs in the conceptual framework. Summarizing the data in matrix form allowed the research team members to identify patterns and evidence along the dimensions of the conceptual framework. The site visit analysis matrix is included in Appendix C. Using the information compiled in the matrix and the detailed interview notes, the site visitors summarized the most salient themes and addressed specific template questions using supporting evidence for each case study school. These school-level write ups were then used in a cross-case study analysis, described below. The outline for the case study write-ups is also included in Appendix C.
Cross-Case Study Analysis
We summarized information for each case study school in a cross-case matrix that outlined constructs from the conceptual framework. The matrix followed a similar format to that used for the individual case study analyses and allowed us to examine commonalities and differences across all 21 case studies. To identify themes and patterns, we held several cross-case analysis meetings with key research staff to discuss individual constructs related to the theory of action and conceptual framework for the study. We used the student achievement analysis results, the survey analysis results, and prior research in the field of school accountability to inform our discussions and frame our analysis.
Surveys of Principals and Teachers (Level 3) and of District Personnel and External Support Providers (Level 2)
Purpose
As discussed in Chapter 1, we developed and administered surveys to key stakeholders throughout California. This component of the study was aimed at collecting data related to the same research questions as those addressed by the case studies, but generalizable to the larger population of schools in California. In order to collect information from a variety of perspectives, we administered surveys to the following respondent types:

Chapter 2. Methodology
Evaluation Study of the Public Schools Accountability Act of 1999 29
• School principals
• Elementary and secondary teachers
• District administrators
• External Evaluators
• CSRD model providers
The surveys were developed to clarify and validate themes identified through the case study site visits, as well as to provide information on the Governor’s Performance Award program. The survey questions were also tied to the conceptual framework for the study, exploring constructs that directly related to the implementation of the PSAA, as well to constructs related to contextual factors that may mediate the implementation of PSAA in schools and districts.
Sample Selection
Sample selection methods differed for each type of survey. We review sampling procedures by type briefly below.
School-level Surveys (Teachers and Principals)
In order to collect data on the implementation, impact, and outcomes of II/USP, we administered surveys to teachers and principals at II/USP schools throughout California, as well as to a group of comparison schools with similar characteristics that did not receive II/USP funds. Comparison schools were included to gain a better understanding of changes in attitudes and outcomes that resulted specifically from II/USP. To assess the impact of the Governor’s Performance Award, we also included a sample of upper decile schools that received GPA’s due to meeting growth targets in the 1999-2000 school year, and a similar sample that did not receive GPA’s for that school year. Given II/USP timing and eligibility criteria, we assumed that some sampled II/USP schools and some non-II/USP comparison schools in Cohorts 1 and 3 earned a GPA in the 1999-2000 school year. Therefore, we naturally had a sample of GPA schools in the lowest five deciles within the II/USP and comparison school samples for Cohorts 1 and 3.
To achieve adequate diversity in our II/USP survey sample, we selected II/USP schools based on the same three dimensions used for the case study selection: II/USP cohort, funding source, and grade level. Once again, we believed that inclusion of schools from each of the three cohorts provided perspectives on three different stages of II/USP implementation. At the time of survey administration (fall 2002), most Cohort 1 schools had completed their final implementation year; Cohort 2 schools were in their second year of implementation funding; and Cohort 3 schools were in their first implementation year. We also included elementary schools and middle/high schools within each cohort of schools, as well as schools receiving state-funded II/USP grants and schools receiving federal CSRD funding.
We administered surveys to principals and a sample of teachers in each of 502 schools. The schools included 65 II/USP schools and 65 non-II/USP matched comparison schools in each of the three II/USP cohorts. For Cohorts 1 and 2, we included 40 II/USP elementary schools and 25 II/USP middle or high schools in each cohort. Although this ratio was over-representative of the II/USP population, this sampling process served to enhance the precision of estimates for the secondary school sample. Twenty-five of the schools in each cohort
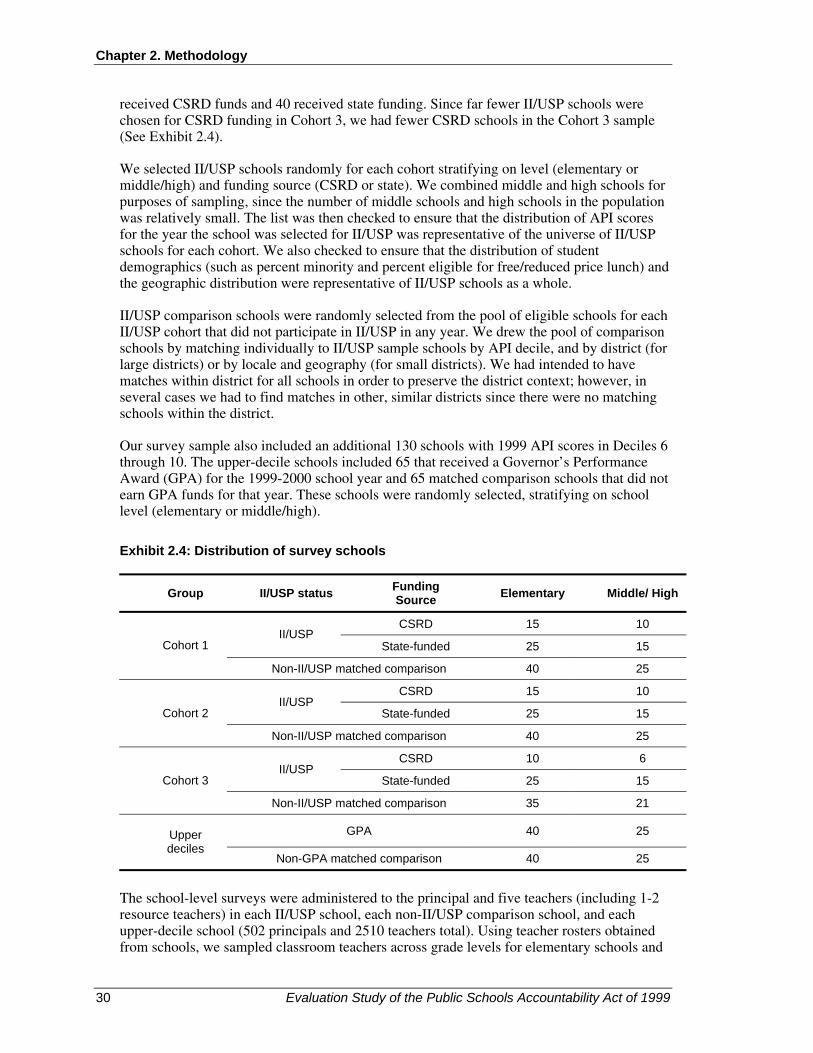
Chapter 2. Methodology
30 Evaluation Study of the Public Schools Accountability Act of 1999
received CSRD funds and 40 received state funding. Since far fewer II/USP schools were chosen for CSRD funding in Cohort 3, we had fewer CSRD schools in the Cohort 3 sample (See Exhibit 2.4).
We selected II/USP schools randomly for each cohort stratifying on level (elementary or middle/high) and funding source (CSRD or state). We combined middle and high schools for purposes of sampling, since the number of middle schools and high schools in the population was relatively small. The list was then checked to ensure that the distribution of API scores for the year the school was selected for II/USP was representative of the universe of II/USP schools for each cohort. We also checked to ensure that the distribution of student demographics (such as percent minority and percent eligible for free/reduced price lunch) and the geographic distribution were representative of II/USP schools as a whole.
II/USP comparison schools were randomly selected from the pool of eligible schools for each II/USP cohort that did not participate in II/USP in any year. We drew the pool of comparison schools by matching individually to II/USP sample schools by API decile, and by district (for large districts) or by locale and geography (for small districts). We had intended to have matches within district for all schools in order to preserve the district context; however, in several cases we had to find matches in other, similar districts since there were no matching schools within the district.
Our survey sample also included an additional 130 schools with 1999 API scores in Deciles 6 through 10. The upper-decile schools included 65 that received a Governor’s Performance Award (GPA) for the 1999-2000 school year and 65 matched comparison schools that did not earn GPA funds for that year. These schools were randomly selected, stratifying on school level (elementary or middle/high).
Exhibit 2.4: Distribution of survey schools
Group II/USP status Funding Source Elementary Middle/ High
CSRD 15 10 II/USP
State-funded 25 15 Cohort 1
Non-II/USP matched comparison 40 25
CSRD 15 10 II/USP
State-funded 25 15 Cohort 2
Non-II/USP matched comparison 40 25
CSRD 10 6 II/USP
State-funded 25 15 Cohort 3
Non-II/USP matched comparison 35 21
GPA 40 25 Upper deciles
Non-GPA matched comparison 40 25
The school-level surveys were administered to the principal and five teachers (including 1-2 resource teachers) in each II/USP school, each non-II/USP comparison school, and each upper-decile school (502 principals and 2510 teachers total). Using teacher rosters obtained from schools, we sampled classroom teachers across grade levels for elementary schools and

Chapter 2. Methodology
Evaluation Study of the Public Schools Accountability Act of 1999 31
included department heads/teacher leaders for mathematics, English/language arts, science, and/or social studies for middle and high schools. For the schools for which we were unable to obtain rosters, we asked principals to select the teachers. At the elementary level, we asked principals to randomly select four teachers across grade levels and one resource teacher. At the secondary level, we asked the principal to distribute the survey to lead teachers or department heads in English, mathematics, science, and/or social studies, and to one resource teacher.
District Surveys
The study team surveyed district staff who were knowledgeable experts in curriculum and instruction, assessment and evaluation, and federal and state programs in half of the public school districts with at least one school participating in one of the three II/USP cohorts (134 districts). We first selected the 20 districts that had the largest number of II/USP schools. All of these districts had 11 or more II/USP schools. We then selected the remaining 114 districts through simple random sampling of districts with at least one II/USP school.
We obtained names for up to four district staff members, including II/USP, curriculum/instruction, Title I, and accountability representatives by placing calls to II/USP district representatives. In some cases we obtained all four names, in other cases there were fewer staff members responsible for these programs.15 We administered an on-line survey to the 358 contacts we obtained, ranging from one to four representatives per district.
External Assistance Provider Surveys
We originally planned to survey all External Evaluators who worked with II/USP schools and CSRD model providers who worked with at least one school in the II/USP program. Obtaining full contact information for all of these individuals, especially for those from large model providers or from External Evaluating organizations that were approved in the first year of II/USP, was a challenge.
As a result, we administered surveys to 265 External Evaluators and 37 CSRD model providers. The External Evaluator surveys addressed the planning year processes undertaken at the schools involved in II/USP, including the needs assessment process and the writing of the Action Plan, and their opinions of the state accountability program. The CSRD model provider survey addressed similar issues, but focused on the implementation of the CSRD model in the schools and the assistance provided by the model providers.16
15 It should be noted that we were unable to obtain contact information for relevant staff at five districts in our original
sample. We replaced those districts with districts of similar geography, urbanicity, and II/USP participation. We obtained contact information for all five of the replacement districts.
16 Due to a low sample size, coupled with a low response rate, we were unable to analyze the data obtained from the CSRD model provider survey.

Chapter 2. Methodology
32 Evaluation Study of the Public Schools Accountability Act of 1999
Survey Instrument Development
The survey development process started in late summer 2002. AIR’s process for instrument development consisted of four steps: 1) identify key constructs and variables to assess, 2) review existing survey instruments, 3) develop items to measure the constructs and variables, and 4) map each instrument to each research question and construct. In general, we preferred to use items from existing instruments that had been tested in the field and for which the reliability properties had already been established. To facilitate this task, AIR has established a Cyber Library of Education Survey Instruments (CLESI) that catalogues hundreds of survey instruments searchable by construct, scale, or keyword, and includes known reliability statistics. These questions were often used or tailored for use in this study. The survey instruments were pilot-tested and revised to ensure their effectiveness.17 In addition, drafts of the survey instruments were distributed to project team members, CDE staff, and the Advisory Board for review and comment. We revised the surveys in light of this feedback.
The design of survey instruments was enhanced by insights gained during case study site visits conducted in spring 2001. Portions of the II/USP surveys focused on the planning and implementation processes required as part of II/USP participation. All surveys also focused on school improvement strategies implemented at the school level, changes in school-level outcomes observed over the past few years, and supports from the district and state for school improvement. To better understand school context variables that may mediate a school’s ability to implement school improvement strategies, we also focused on educators’ perceptions of school leadership, resources, instructional practices, professional development, strategies and services for special populations, technical assistance, and school culture. External assistance providers (External Evaluators and CSRD model providers) were administered a survey aimed at gaining an understanding of the providers’ general strategies and approaches in providing assistance and guidance to II/USP and CSRD schools. Surveys relied on concrete, behavioral indicators to understand actual practice, including the influence of attitudes on practice.
Survey Administration
Teacher and Principal Surveys
We sent out packets of surveys to all schools in our sample (502 schools) during the week of November 11, 2002. Each packet was addressed to the principal of the school. We worked to ensure a high response rate by including cover letters and supporting materials that accurately conveyed the importance and benefits of participation.
Our budget had limited funds for respondent incentives. We therefore worked to find an incentive structure that best took advantage of the available funds. For the initial round of survey mailings to schools, respondents were offered the opportunity to qualify for a monetary bonus incentive. We offered 60 monetary bonuses of $100 each to randomly chosen respondents who sent their surveys back to us postmarked by the end of November. We made this decision in consultation with our contract monitor and the legal counsel at CDE and with our pilot survey respondents.
Due to lower-than-expected response rates on the teacher and principal surveys, we spent the following three months following up with non-respondents by faxing reminders to individual teachers and telephoning and sending e-mails to principals, offering additional incentives for
17 To pilot test surveys, researchers utilized methods developed in AIR’s Cognitive Survey Laboratory.
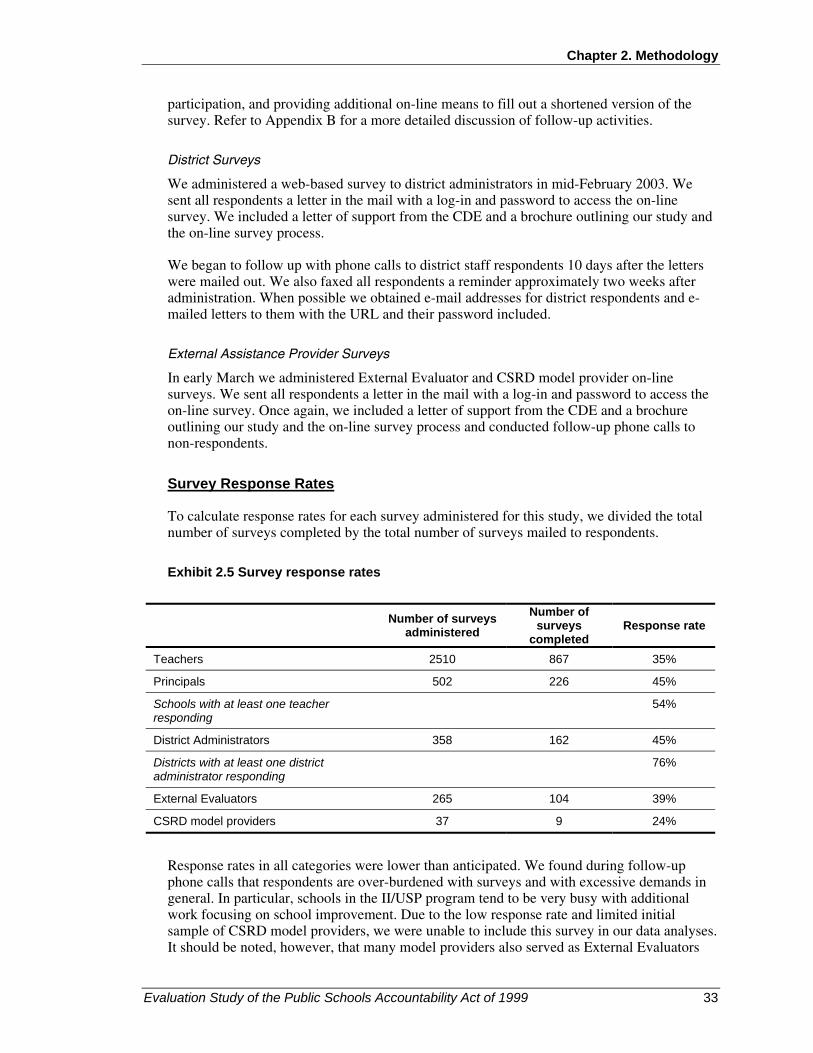
Chapter 2. Methodology
Evaluation Study of the Public Schools Accountability Act of 1999 33
participation, and providing additional on-line means to fill out a shortened version of the survey. Refer to Appendix B for a more detailed discussion of follow-up activities.
District Surveys
We administered a web-based survey to district administrators in mid-February 2003. We sent all respondents a letter in the mail with a log-in and password to access the on-line survey. We included a letter of support from the CDE and a brochure outlining our study and the on-line survey process.
We began to follow up with phone calls to district staff respondents 10 days after the letters were mailed out. We also faxed all respondents a reminder approximately two weeks after administration. When possible we obtained e-mail addresses for district respondents and e-mailed letters to them with the URL and their password included.
External Assistance Provider Surveys
In early March we administered External Evaluator and CSRD model provider on-line surveys. We sent all respondents a letter in the mail with a log-in and password to access the on-line survey. Once again, we included a letter of support from the CDE and a brochure outlining our study and the on-line survey process and conducted follow-up phone calls to non-respondents.
Survey Response Rates
To calculate response rates for each survey administered for this study, we divided the total number of surveys completed by the total number of surveys mailed to respondents.
Exhibit 2.5 Survey response rates
Number of surveys administered
Number of surveys
completed Response rate
Teachers 2510 867 35%
Principals 502 226 45%
Schools with at least one teacher responding
54%
District Administrators 358 162 45%
Districts with at least one district administrator responding
76%
External Evaluators 265 104 39%
CSRD model providers 37 9 24%
Response rates in all categories were lower than anticipated. We found during follow-up phone calls that respondents are over-burdened with surveys and with excessive demands in general. In particular, schools in the II/USP program tend to be very busy with additional work focusing on school improvement. Due to the low response rate and limited initial sample of CSRD model providers, we were unable to include this survey in our data analyses. It should be noted, however, that many model providers also served as External Evaluators

Chapter 2. Methodology
34 Evaluation Study of the Public Schools Accountability Act of 1999
and were therefore administered an External Evaluator survey rather than the CSRD model provider survey.
To ensure that we did not receive a biased teacher and/or principal response, we conducted a non-response bias analysis. This analysis was conducted to determine the differences between questionnaire respondents and the overall population from which they were sampled. Because respondents from secondary schools were selected purposefully and not randomly (i.e., department heads in these schools were sampled whenever possible) the possibility of response bias existed only for elementary school teachers and principals in the sample. Survey respondents were compared with the overall population from which they were sampled, across a variety of demographic characteristics, including gender, race/ethnicity, and years experience as a practitioner. With regard to these demographic indicators, the study team found no statistically significant differences between those who responded and the overall population from which they were sampled, thus revealing no evidence of response bias in the elementary school teacher or principal samples.
Student Achievement Analyses
In addition to the case study and survey data, we conducted analyses of student achievement to examine statewide and school-level achievement trends resulting from the implementation of the II/USP and GPA programs. As explained in Chapter 1, our primary research question (Research Question 1) for this portion of the study was:
What are the impact on, and benefits to, students from a school’s participation in II/USP and/or GPA based on:
• Results of assessments used to determine whether or not schools have made significant progress towards meeting their growth targets per the PSAA law (Education Code Section 52058[c])?
• Results of disaggregated pupil performance data for each of the following subgroups, as specified in the PSAA law (Education Code Section 52058[c])? These subgroups include:
− English language learners
− Pupils with exceptional needs
− Pupils that qualify for free or reduced price meals and are enrolled in schools that receive funds under Title I, A of the Improving America’s Schools Act (IASA) of 1994
Our analyses utilized statewide Stanford Achievement Test (SAT-9) results in reading and mathematics from 1998 through 2002. We also utilized school-level API scores from 1999, and growth scores from 2000, 2001, and 2002 to create synthetic APIs for analyses (see more on “synthetic APIs” below). We analyzed the data to look for significant impacts of participation in state-funded II/USP or CSRD for each of the three cohorts of schools at the elementary, middle, and high school levels. The pool of comparison schools used for the first cohort consisted of schools that applied but were not selected for II/USP in 1999. Since the pools of eligible applicants were too small for Cohorts 2 and 3, we instead used all eligible schools in 2000 and 2001, respectively, as comparison groups for these two cohorts. CSRD and state-funded schools were analyzed separately due to the differences in selection criteria for funding source. Finally, we collected longitudinally linked student-level SAT-9 scores from 13 elementary case study schools in three urban districts and from matched comparison

Chapter 2. Methodology
Evaluation Study of the Public Schools Accountability Act of 1999 35
schools. In Chapter 3 and Appendix A, we outline the analytic challenges in selecting comparison schools.
We pursued four primary analytic approaches for the analysis of II/USP and two approaches for the analysis of the GPA program. The methodologies are described briefly below and outlined in greater detail in Chapters 3 and 6, and in Appendix A.
II/USP Analyses
Statewide API analyses. A key analytic challenge in the investigation of trends in API scores over time is the change in API formulation over the years of STAR administration. After including only SAT-9 scores18 for the 1999 and 2000 APIs, the state included data from the California Standards Test for the 2001 and 2002 APIs. In any given year, two APIs were calculated—one for growth from the previous year (using the previous formulation) and another to serve as a baseline for the next year (using the new formulation). Because of these changes, the API was not comparable across three consecutive years. We anticipated this problem and developed a strategy to accommodate it that utilized a synthetic API score based on the 1999 API and the growth scores for each year. (This technique is explained in greater detail in Appendix A.) We then utilized hierarchical linear modeling (HLM), controlling for school level variables known to contribute to achievement results, such as average parent education, to analyze the trends in the synthetic APIs in II/USP and comparison schools. In addition, we utilized logistic regression techniques to determine the effect of II/USP participation on their probability of achieving API growth targets. In Appendix A, we delineate the specific models used for all achievement analyses.
Statewide aggregated SAT-9 analyses. We utilized a similar HLM approach to analyze the trends in mathematics and reading scores in II/USP and comparison schools. We were able to obtain greater precision in the SAT-9 analyses because we could control for variation in student-level factors that contribute to achievement. However, we could not cover all areas incorporated into the API, concentrating our efforts instead on SAT-9 tests in reading and mathematics. Once again we looked for significant impacts of participation in II/USP or CSRD for each of the three cohorts of schools at the elementary, middle, and high school levels. We used the same comparison groups as those used for the API analyses.
Statewide disaggregated SAT-9 analyses. We conducted further analyses of SAT-9 data disaggregated for several groups: English Learner (EL) students, special education (IEP) students, and students eligible for free or reduced price lunch in Title 1 schools. We examined the data to look for:
• Significant differences between the achievement scores of students in each of these categories and comparison students at II/USP and non-II/USP schools over time (i.e., trends in the achievement gaps within each category of school)
• Significant effects that participation in II/USP has had on these specific groups of students in comparison to other students in II/USP or CSRD schools (i.e., the effect of II/USP specifically on changes in the gaps)
Longitudinally linked student level analyses. In addition to the qualitative data gathered during the case study site visits, the study team collected longitudinally linked student-level achievement data for each of the case study elementary schools, as well as matched non-
18 It should be noted that schools are required to test all pupils except those excused by their parents.

Chapter 2. Methodology
36 Evaluation Study of the Public Schools Accountability Act of 1999
II/USP comparison schools (matched on API decile and student demographics) in three urban case study districts.19 We selected comparison schools from the limited pool of elementary schools in the case study districts that had been eligible for II/USP but never participated. The study team worked with district personnel to access these data, along with indicators for race/ethnicity, participation in bilingual or ESL programs and in special education programs, and eligibility for free or reduced-price lunch.
For these analyses we compared the growth trends in SAT-9 scores for one cohort of students who were second graders at the time of the 1999 testing and fifth graders in 2002. Using hierarchical growth modeling techniques, we looked for significant effects of participation in II/USP for this cohort of students in II/USP vs. comparison schools. Note that our longitudinal analyses are necessarily limited in scope because of the short timeframe for the program. We also used these analyses to identify more and less successful II/USP schools, based on trends in performance of this cohort. This identification provided an additional analytic dimension for our examination of the qualitative data gathered during site visits, especially in our attempts to look for key implementation strategies or contextual variables that may have contributed to success in the program.
GPA Analyses
We identified two dimensions to the analysis of the effect of GPA on achievement. One focused on the effect of the award itself on subsequent performance of schools receiving that award. The other dimension concerned the systemic effect of the promise of an award for schools that achieved their growth targets.
Regression analyses of the effect of awards on recipients. We set up two regression models to analyze the impact of GPAs distributed in the beginning of 2001 (for API growth in 1999-2000 academic year) on a school’s subsequent student performance. The first model used the 2001 API as the dependent variable and controlled for API in two prior years (1999 and 2000). The second model used the 2002 API as the dependent variable and controlled for API in 2000 and 2001. We used both the 2001 and 2002 APIs as dependent variables due to the lateness of the award distribution. Although the awards were meant for the 2000-2001 academic year, they did not arrive in schools until February or later in 2001. Their impact on 2001 scores, therefore, may be minimal with a fuller impact being realized the following year.
Descriptive analyses of systemic incentive effect of GPA. To obtain a rough picture of the systemic incentive effect of the GPA system, we calculated the proportion of all California schools that met growth targets in years 1999-00, 2000-01 and 2001-02. We also calculated a synthetic growth target for the 1998-99 school year. The difference in the proportion between years provided an indication of the effect of the GPA incentive on schools across California. We hypothesized that a large increase in the percentage of schools that met growth targets in the 1999-00 school year, compared to the 1998-99 school year, would indicate an increased incentive to meet growth targets.
19 Obtaining longitudinally linked student-level data proved to be a considerable challenge as few districts had student
data linked over time. In addition, the only common metric across the three districts was NCE scores, so we used NCE’s rather than scale scores for our analyses.

Evaluation Study of the Public Schools Accountability Act of 1999 37
Chapter 3. The Effect of II/USP on Student Achievement
Overview
We begin our investigation of the II/USP program with the punch line: the effects of program participation on student achievement. We do so both because this is the first and central research question of this evaluation and because findings we report here are explored in subsequent chapters. The research question to which this chapter responds is:
Research Question 1: What are the impact on, and benefits to, students from a school’s participation in II/USP and/or GPA based on:
1. Results of assessments used to determine whether or not schools have made significant progress towards meeting their growth targets per the PSAA law (Education Code Section 52058[c])?
2. Results of disaggregated pupil performance data for each of the subgroups specified in the PSAA law (Education Code Section 52058[c])?
To answer this question, we analyze both school-level API scores (and achievement of growth targets) and student-level SAT-9 scores for 1998-2002 for II/USP and comparison schools. Because of the multi-faceted nature of this research question, we approach the analysis from several perspectives.
We begin this chapter by reviewing a number of key analytic decisions underlying the design of our statewide analyses. We then examine the statewide trends in API and SAT-9 scores for II/USP and comparison schools at each level of schooling and across the three cohorts. We find a very large overall increase in achievement for all schools in the state – more so at the elementary level than among middle and high schools. Against this backdrop of rising scores overall, we find only very small differences between II/USP and comparison schools. These differences vary in direction and by level and cohort over the course of participation. The most consistent pattern is a small “bump” in II/USP Cohort 1 and 2 schools relative to their non-II/USP counterparts in the planning year (Year 1) of the program. This difference is on the magnitude of 0.11 to 0.14 standard deviations, or about 8-9 API points at the elementary level and 7-8 points for high schools. For most but not all groups, the additional relative gain for II/USP schools begins to dissipate after the first year. We find no significant effect of II/USP participation on a school’s likelihood of meeting its API growth targets.
We then examine the considerable variation among II/USP schools, with some experiencing very large growth during their participation and some demonstrating little or even negative growth. Districts – at least the large urban districts – appear to account for some of this variation, with the district effect on achievement ranging from two to twenty four times the size of the II/USP effect, depending on the district and the year of comparison. (We explore this district influence as well as other factors that contribute to the variation in achievement in II/USP schools in our analyses of the case study and survey data in Chapters 4 and 5.)
After consideration of the aggregate trends for II/USP schools, we then turn our attention to part ‘b’ of Research Question #1 – the disaggregated effects of II/USP participation on specified groups of students. Here we consider not only how these subgroups fared in II/USP

Chapter 3. The Effect of II/USP on Student Achievement
38 Evaluation Study of the Public Schools Accountability Act of 1999
schools, but also how changes in the relevant achievement gaps in the II/USP schools compared with those in the non-II/USP group. For example, with respect to English learners, we ask whether EL students benefited as much or more from their school’s participation in II/USP as did their non-EL schoolmates; we also asked whether the gap between EL and non-EL students closed more in II/USP schools than in comparison schools. In all schools, we found a similar slight narrowing of the gap for EL students (relative to non-EL students) but a widening of the gap for special education students (relative to regular education students). The patterns with respect to students eligible for free and reduced price lunch were more variable in both II/USP and comparison schools.
Finally, in addition to the statewide trends, we include an analysis of longitudinally linked student-level data for one cohort of students (from grade two through grade five) in II/USP and comparison schools in the three case study districts where these data were available. We found no overall benefit of II/USP for this cohort of upper grade elementary students. We end the chapter with a summary of findings.
Statewide Trends in Achievement
Analysis Strategy and Method
To address the questions above, we first had to make decisions about seven main analysis issues:
• What sample of II/USP schools should be the focus of the analysis?
• How should the sample of comparison schools be selected?
• What achievement outcome measures should be used for the analysis?
• How should the effects of II/USP be determined?
• How should the fact that some comparison schools subsequently participated in II/USP be taken into account in the analysis?
• How should sample attrition be taken into account?
• What school and student background characteristics should be controlled statistically in the analysis?
In the following sections, we briefly discuss each of these issues in turn. (The issues are examined in more detail in Appendix A.) We then move to a discussion of the results of the analyses.
Identifying the Sample of II/USP Schools
Identifying the group of schools whose “treatment” (II/USP) effect is being measured is not as straightforward as might be expected. Not only did criteria for identification differ from cohort to cohort, but funding sources and the program requirements that accompanied those funds also differed between state-funded II/USP “Action Plan” schools and II/USP schools that received federally funded CSRD grants.
As outlined in Chapter 1, three cohorts of elementary, middle, and high schools have participated in II/USP in the past four years. Cohort 1 schools qualified for II/USP by scoring in the bottom five deciles on the SAT-9 in both 1998 and 1999. They applied in the summer

Chapter 3. The Effect of II/USP on Student Achievement
Evaluation Study of the Public Schools Accountability Act of 1999 39
of 1999 and received initial planning support for the 1999-00 academic year, as well as implementation support for 2000-01 and 2001-02. Cohort 2 schools qualified by scoring in the bottom five deciles on the 2000 API and failing to meet their API growth targets in 2000. Cohort 2 schools applied in the summer of 2000 and received initial planning support for the 2000-01 year, as well as implementation support for 2001-02 and 2002-03. Cohort 3 schools qualified based on their 2001 API scores and failure to meet 2001 targets. They applied in the summer of 2001 and received initial planning support for the 2001-02 year, with implementation support for 2002-03 and 2003-04.
Not all schools followed this same pattern, however, and differences between CSRD and Action Plan schools have implications for how these analyses define the target group of schools in each cohort.
In Cohort 1, CSRD schools differ from Action Plan schools in two ways. First, Cohort 1 CSRD schools were selected in the summer of 1999, prior to the selection of the Cohort 1 Action Plan schools, using somewhat different selection criteria.20 Second, Cohort 1 CSRD schools began implementation in the fall of 1999 without a planning year or the assistance of an External Evaluator, while Action Plan schools began with a planning year. Because of these differences, we treat the Cohort 1 CSRD schools separately from Cohort 1 Action Plan schools in the analyses presented here.21
The selection process for CSRD then changed substantially for Cohorts 2 and 3. Schools participating in II/USP Cohort 2 had the opportunity to apply for CSRD in the spring of 2001, at the end of their first II/USP planning year.22 Schools were selected for CSRD participation in the summer of 2002, and those selected were scheduled to receive three years of subsequent support for implementation – one more year than Action Plan schools. We decided to treat Cohort 2 CSRD schools separately from Cohort 2 Action Plan schools because the CSRD schools are self-selected.
Selection of CSRD schools changed yet again for Cohort 3, as the pool of eligible schools extended beyond the II/USP program.23 Within II/USP, however, the selection process for Cohort 3 CSRD schools was identical to the process for Cohort 2. Cohort 3 II/USP schools had the opportunity to apply for CSRD in the spring of 2002 and were selected in the summer. Because spring 2002 is the final date for which we have achievement data, however, and at that point Cohort 3 CSRD schools had not yet been selected, we decided not to treat (prospective) CSRD schools separately for Cohort 3.
Selecting Comparison Schools
A central purpose of this evaluation is to determine whether II/USP schools have exhibited more positive achievement trends subsequent to receiving II/USP support than they would have in the absence of II/USP support. Because we cannot know for certain how well the II/USP schools would have performed in the absence of II/USP, however, we must rely on comparison schools to provide an estimate. The validity of our conclusions depends
20 In addition to the criteria applying to Cohort 1 Action Plan schools, CSRD schools were required to be on a list of
schools identified for Program Improvement. Since CSRD is a competitive federal grant program, schools also had to submit an application and plan, following the requirements of that program. Note that acceptance into CSRD was thus independent of II/USP for Cohort 1, but once in CSRD, schools were considered part of the II/USP program.
21 In our analysis models, CSRD schools are coded as both II/USP and CSRD. 22 As a consequence of this change and the fact that CSRD participation was limited only to II/USP schools in Cohort
2, no schools began the CSRD program in 2000-2001. 23 The pool of eligible schools for Cohort 3 CSRD included, for example, schools participating in the High Priority
Schools Grant program.
Chapter 3. The Effect of II/USP on Student Achievement
40 Evaluation Study of the Public Schools Accountability Act of 1999
fundamentally on the selection of an appropriate group of comparison schools, so we devote some space here to its discussion.
Ideally, we would want comparison schools to be like II/USP schools in every way except for their participation in the program. Short of random assignment, however, we have no way to ensure against systematic differences between those schools that participated and those that did not. The closest we could come to the ideal situation was to use as comparisons the pool of schools that had not only met the eligibility criteria but had also applied for the program. In this way, we could avoid any bias arising from a school’s self selection into the program. For Cohort 1, the number of schools that applied was substantially larger than the number that could be supported, so we were able to use the non-participant applicant pool as the comparison group.
We should note that this decision did not completely rule out selection bias, however, as schools not only selected themselves into the applicant pool, but a subgroup of them were selected out of the pool into the participant group by CDE. CDE selection thus provides another possible source of bias. Fortunately, by all reports, CDE selection of II/USP schools was random – though random within two main constraints set by the legislation: PSAA required participating schools be distributed relatively equally across the five deciles, and it set limits on the number of elementary, middle, and high schools to be served, resulting in the separation of the pool into these three levels prior to selection.24 Since our analysis also separated schools by level, that constraint was not problematic. What was somewhat problematic was the selection by decile group. Although schools applied in fairly even proportions across the deciles, representation of decile 1 schools in the applicant pool was slightly larger than in the II/USP group. The result was that Cohort 1 II/USP schools were somewhat less than perfectly reflective of the performance distribution in the original pool. The question is whether any of those small differences systematically influenced the relative achievement trajectories of the two groups of schools after II/USP schools received their awards. To explore this possibility, we examined the trajectories of the schools prior to the awards and found no differences in the patterns of achievement growth between Cohort 1 II/USP and comparison schools during that time (See Exhibits 3.2, 3.4, 3.6). We therefore concluded that, while selection was not perfectly random, the non-participant applicants provided a valid comparison group for Cohort 1.
We have belabored the issue of Cohort 1 comparisons because of its importance for all the achievement analyses. We also want to point out that our options for Cohorts 2 and 3 comparison schools were considerably more constrained and less ideal. For Cohorts 2 and 3 the number of schools that applied was only somewhat larger than the number that could be supported, and thus the number of schools that applied but were not selected was too small to use as a comparison. We therefore used the larger pool of eligible schools as our comparisons for Cohorts 2 and 3 (see Appendix A for detailed information on the number of elementary, middle, and high schools that applied and were selected for Cohorts 1, 2, and 3).25 This distinction between cohorts in the selection of comparison schools is important to keep
24 The other two legislative provisions did not end up affecting the selection process. One of these provisions was that
selection be based on order of application receipt. Instead, CDE set two due dates and selected randomly all schools that made the first due date. The second provision was for proportional rural and urban representation, and the condition was sufficient met through the random process.
25 Note that the difference in the size of the pool may in part be an artifact of the differing eligibility criteria for the three cohorts. Cohort 1 eligibility was based on schools scoring in the bottom half of the statewide distribution of STAR (SAT-9) testing in both 1998 and 1999. By contrast, eligibility for Cohorts 2 and 3 was based on ranking in the bottom five API deciles for one year (2000 or 2001, respectively) and not making API growth targets. In addition, participants in prior II/USP cohorts were not part of the eligible pool. As a result, the pool of schools eligible for Cohort 1 was over three times larger than that for Cohort 2.

Chapter 3. The Effect of II/USP on Student Achievement
Evaluation Study of the Public Schools Accountability Act of 1999 41
in mind, as the Cohort 2 and 3 comparison groups are more prone to selection bias. Indeed, differences between II/USP and comparison schools in Cohorts 2 and 3 were more pronounced than those for Cohort 1. Cohort 2 and 3 elementary schools, for example, were consistently lower performing and had significantly higher proportions of African American students than did comparison counterparts. Their pre-II/USP trajectories were similar, however, with the exception of Cohort 3 elementary schools, which experienced less achievement growth than their comparison counterparts prior to II/USP selection.
Based on our limited data about the schools, it is difficult to determine the existence, direction, or degree of selection bias. The demographic and prior performance levels suggest bias in favor of the comparison group. On the other hand, schools that opted into the program by applying may differ in unmeasured ways from that that did not, and these differences may contribute to greater gains in the long run. We will return to this issue later in the chapter when we discuss the district influence on achievement in Cohort 2 schools.
Determining Achievement Outcome Measures
We employed three different outcome measures for our school-level analyses, each of which meets the requirement that impact be evaluated based on the “results of assessments used to determine whether or not schools have made significant progress towards meeting their growth targets according to the PSAA law” (Research Question 1). These measures are average school-level API scores, the probability of schools meeting their API growth targets under the PSAA law, and average student-level SAT-9 scores.
API scores are available for 1999, 2000, 2001, and 2002. The method used by CDE to compute API scores changed each year, in part due to the incorporation of additional tests as the STAR system was phased in. To provide a consistent basis to measure growth in achievement, and to make it possible to include the 1998 school year in our analyses, we computed a set of transformed API scores, based on the official scores for 1999, 2000, 2001, and 2002, and SAT-9 scores for 1998. To distinguish the scores we derived from the official scores on which they are based, we refer to the scores we created as “synthetic” API scores. (The rationale for the construction of these synthetic API scores and the methods we used are discussed in detail in Appendix A.)
In addition to examining school-average API scores over the period from 1998 to 2002, we also examined the percent of schools meeting their API growth targets. Data on the percent of schools meeting growth targets are available for the spring of 2000, 2001, and 2002 – the first three years for which CDE evaluated schools in terms of API growth. (The school-level API growth targets are discussed in more detail in Appendix A.) We also considered the impact of II/USP participation on the probability of achieving growth targets, using a logistic regression model (also outlined in more detail in Appendix A).
Finally, we analyzed student-level SAT-9 scores in reading and mathematics. These scores have the advantage that they are available for all five years under study (1998-2002), they are scored on a consistent metric across the five years, and information is available on student background characteristics, making it possible to control statistically for possible differences in the characteristics of the students enrolled in II/USP and comparison schools. We analyzed SAT-9 data both for the school-level analyses and for examining the effect of II/USP on targeted sub-populations of students.

Chapter 3. The Effect of II/USP on Student Achievement
42 Evaluation Study of the Public Schools Accountability Act of 1999
Teasing Out Post-award Trends
To estimate the “effect” of II/USP participation on subsequent achievement, it is necessary to describe the achievement growth of II/USP schools before and after participation, and to compare these achievement trajectories with those observed in comparison schools. In the analyses we report, we conducted several tests to tease out the effect of II/USP support.
• Cohort 1. Since Cohort 1 schools received their initial year of funding in 1999-00, two years of data are available prior to funding (Spring of 1998 and 1999) and three years after funding (Spring of 2000, 2001, and 2002). If the II/USP and comparison schools were, indeed, similar prior to participation (as we would expect, since participating schools were randomly selected), we would anticipate that the two groups of schools should have similar achievement growth from 1998 to 1999, when participating schools began receiving II/USP funds. If receipt of funds improved performance, we would anticipate that II/USP schools should demonstrate greater growth, relative to comparison schools, between 1999 and 2002.
• Cohort 2. Since Cohort 2 schools received their initial year of funding in 2000-01, three years of data are available prior to funding (1998, 1999, and 2000), and two years after funding (2001 and 2002). If the II/USP and comparison schools were similar prior to participation, we would anticipate that the two groups of schools should have similar achievement growth prior to 2000, when participating schools began receiving II/USP funds. If the receipt of funds improved performance, we would anticipate greater growth over the period from 2000 to 2002, relative to comparison schools.
• Cohort 3. Since Cohort 3 schools received their initial year of funding in 2001-02, four years of data are available prior to funding (1998, 1999, 2000, and 2001), and one year after funding (2002). If the II/USP and comparison schools were similar prior to participation, we would anticipate that the two groups of schools should have similar achievement growth prior to 2001, when participating schools began receiving II/USP funds. If the receipt of funds improved performance, we would anticipate greater growth over the period from 2001 to 2002, relative to comparison schools.
Because the API includes somewhat different test data in the elementary, middle, and high schools grades, and because the effects of II/USP participation might differ for elementary, middle, and high schools, we conducted separate analyses by school type.
Taking Into Account the Fact that Some Comparison Schools for Cohorts 1 and 2 Subsequently Participated in II/USP
Some comparison schools for Cohort 1 II/USP schools were eligible to participate in II/USP in 2000 and/or 2001, and some of those eligible applied and participated. In fact, overall, about a third of the Cohort 1 comparison schools ultimately participated in II/USP. Similarly, some comparison schools for Cohort 2 II/USP schools were eligible to participate in 2001. (See Exhibit A1-b for the numbers involved.) Thus, the control group for both the Cohort 1 and Cohort 2 analyses includes some schools that received II/USP support in later years. (This problem does not arise for the analysis of Cohort 3 schools, because we have data only for the first year in which Cohort 3 received funds. Comparison schools would not have become eligible for participation in subsequent years until after the first year.)26
26 In addition, no Cohort 4 schools were selected for II/USP, the state having turned attention to the bottom decile of
schools (API 1) in a new program entitled the High Priority Schools Grant program.

Chapter 3. The Effect of II/USP on Student Achievement
Evaluation Study of the Public Schools Accountability Act of 1999 43
As described in Appendix A, we concluded that dropping the comparison schools that ultimately participated in II/USP from the analysis would bias the results, because these schools are atypical of the comparison schools as a whole. In particular, by definition, they were poor performers in the year that made them eligible for II/USP. Thus, omitting them would bias the estimated II/USP effect downward. On the other hand, retaining the schools could also bias the analysis, because these comparison schools received whatever benefits accrue from participating in II/USP.
We thus retained the schools, and investigated an estimation procedure to adjust the achievement outcomes for these schools to reflect their participation in II/USP. However, since adjustment had little impact on the size or significance of the relationships, we present the more straightforward unadjusted analyses throughout this chapter. For illustrative purposes, we include results of the adjusted analyses of API scores for Cohorts 1 and 2 in Appendix A (Exhibits A9-b and A10-b).
Taking Sample Attrition Into Account
Ideally, we would like to have complete data, including API scores and school background characteristics for all Cohort 1, 2, and 3 II/USP schools, CSRD schools, and comparison schools for all five years under study (1998 through 2002). In fact, quite a few schools are missing API data for at least one year. The percentage of schools missing API scores was substantially higher in 2002 than in the other years. There are many potential reasons for the lack of API scores for some schools. In some cases, schools were not included in the testing program in some years, due to small size or other school characteristics. In addition, if there were any irregularities in test administration in a school, the school did not receive an API score for that year.
Overall, the percentage of schools missing API scores for one or more years is slightly higher for comparison schools than II/USP schools. For Cohort 1, about 13 percent of the II/USP schools were missing API scores for one or more years, as were 18 percent of Cohort 1 comparison schools. For Cohort 2, 15 percent of II/USP schools were missing API scores, as were 16 percent of comparison schools; and for Cohort 3, 17 percent of schools were missing scores, as were about 19 percent of comparison schools.
For the analyses reported here, we excluded schools that lacked complete API data, because we wanted to ensure that our estimates of achievement prior to and after participation in II/USP were based on the same schools. But if schools missing data differ from those with complete data, excluding missing cases may introduce biases – especially if the rate of missing data differs for II/USP and comparison schools, as appears to be true of the data at hand.
Controlling for School and Student-level Background Characteristics
Many factors can, of course, influence student achievement each year, in addition to participation in II/USP. In an effort to control for some of the factors that may account for changes over time in performance, and that may also explain differences between II/USP and non-II/USP schools, we controlled for an extensive set of student-level and school-level variables available in the STAR and API data systems (see Appendix A, Exhibit A2-a for a list of the variables we employed).
Demographic information on the Cohort 1 II/USP and comparison elementary schools included in the analysis is displayed in Exhibit 3.1, below. The data indicate that, on average, about seven percent of the students enrolled in II/USP Cohort 1 elementary schools in 1999

Chapter 3. The Effect of II/USP on Student Achievement
44 Evaluation Study of the Public Schools Accountability Act of 1999
were Asian, 15 percent were African American, and 55 percent were Hispanic. About 75 percent were eligible for free or reduced lunch, and 40 percent were English language learners.
As shown in Exhibit 3.1, the demographic composition of the state-funded II/USP and CSRD schools included in our analysis differed somewhat from the comparison schools. In particular, Cohort 1 II/USP (non-CSRD) elementary schools enrolled fewer Hispanic students, students eligible for free or reduced lunch, and English language learners. CSRD schools, on the other hand, enrolled somewhat more students eligible for free or reduced lunch than did the comparison schools. One reason for these observed differences between Cohort 1 II/USP, CSRD, and comparison schools may be that the II/USP schools shown in Exhibit 3.1 exclude CSRD schools, and the CSRD program by design had disproportionate numbers of schools in deciles 1 and 2. The results for Cohort 1 middle and high schools, and for Cohorts 2 and 3 schools are generally similar.
Exhibit 3.1: Demographic background characteristics of Cohort 1 II/USP, CSRD, and comparison elementary schools
0
10
20
30
40
50
60
70
80
90
100
% Asian % AfricanAmerican
% Hispanic % Free lunch % Eng langlearner
% Mobility
School Background Characteristics
Perc
ent
Non-II/USPCompII/USP (non-CSRD)CSRD
Results: Impact of Program Participation on Average Achievement
We begin our discussion of results by considering the impact of II/USP program participation on overall performance of II/USP schools and students relative to non-II/USP comparison schools and students. Our questions for this part of our investigation are:
A. Do schools receiving II/USP support show positive achievement trends after receiving program funds?

Chapter 3. The Effect of II/USP on Student Achievement
Evaluation Study of the Public Schools Accountability Act of 1999 45
B. Do schools receiving II/USP support show more positive achievement trends than schools eligible for II/USP that did not apply, or those that applied but were not selected?
We use the following types of data for these analyses:
• API and SAT-9 score trajectories for II/USP, CSRD, and comparison schools, by school level and cohort
• Percentages and probability of schools achieving prescribed API growth targets
API and SAT-9 Trajectories
We organize our discussion of achievement trends primarily by level of schooling (elementary, middle, and high) because growth patterns vary substantially by level. We also consider possible differences in patterns among cohorts.
Elementary Schools The results for Cohort 1 and 2 elementary II/USP and comparison schools appear in graphic form in Exhibits 3.2 and 3.3. The graphs portray the estimated achievement trajectories for II/USP,27 CSRD, and comparison schools, controlling for all school-level background variables for which we had data. In each case, the first panel of the exhibit presents API results and the second and third panels display results for SAT-9 mathematics and SAT-9 reading scores, respectively. The graphs describe the time trajectories that would be anticipated for schools with socioeconomic and other characteristics equal to the average participating II/USP school. In other words, the graphs provide our best estimate of the achievement trajectory for II/USP and CSRD schools, net of any changes in school background, and our best estimate of the trajectory that similar comparison schools experienced. Parameter estimates for the full set of models we estimated, along with standard errors and significance tests, appear in Appendix A (Exhibits A9 – A14).
The most noticeable pattern in all the graphs is the substantial upward trajectory of achievement in all schools in the study. Controlling for demographic influences, Cohort 1 program and comparison elementary schools gained approximately 140 points over the four years between 1998 and 2002, with 101 points of this gain occurring since II/USP was introduced in 1999. One way to think about this increase is in terms of the standard deviation of API scores for this level and group. Assuming an average standard deviation of approximately 75 points (See Exhibit A3-b), this amounts to an astounding increase of roughly 1.87 standard deviations28 over four years, and 1.35 SD over the three years of II/USP. Gains for Cohorts 2 and 3 are slightly less, at approximately 107 and 117, respectively, over the four-year period.
Many factors may have contributed to the overall increase in scores – familiarity with the test (which was introduced statewide in 1998), institution of PSAA accountability and resulting attention to test scores, changes in curriculum across the state, teaching to the test, and so forth. Our purpose here is not to explain the overall rise, but to use it as a backdrop for understanding the II/USP effects in light of the statewide trends.
27 In these analyses, “II/USP schools” refers to non-CSRD II/USP schools. Schools participating in CSRD through
II/USP are referred to as “CSRD schools”. 28 Standard deviations varied by year from 71 to 81 points, with the standard deviations for II/USP school generally
being within one or two points of those for comparison schools. The average of 75 was an approximation or comparison schools.

Chapter 3. The Effect of II/USP on Student Achievement
46 Evaluation Study of the Public Schools Accountability Act of 1999
Cohort 1
In addition to the general upward trend, Exhibits 3.2 and 3.3 illustrate the direction and magnitude of improvement in II/USP and CSRD schools relative to comparison schools. The top panel of Exhibit 3.2 reveals that while Cohort 1 II/USP and comparison schools experienced almost identical achievement prior to 1999 (the difference in initial scores is not significant), II/USP elementary schools gained on average 8.7 points more than comparison schools during the planning year (1999-2000) for a statistically significant effect size of 0.11 standard deviations. Another way to look at the magnitude of this effect is to consider that the mean API target for this group of schools in 2000 was 14.4 points. A relative gain of 8.7 amounts to 60% of that average annual target. Alternatively, one could compare the size of the gain to the size of a decile ranking. Deciles in 2000 covered approximately 40 points, meaning that a school at the bottom of one decile had to gain about 40 points to move into the next decile rank. Expressed in this metric, 8.7 points is 22% of the way to the next higher decile rank. Unfortunately, however one expresses the gain, the fact is that II/USP elementary schools were unable to maintain that planning year advantage, and by 2002 comparison schools had caught up with their II/USP counterparts.
With respect to CSRD schools in Cohort 1, we note two main patterns. First, CSRD schools scored on average below both II/USP and comparison schools throughout the analysis years, consistent with CDE reports that Cohort 1 CSRD schools drew disproportionately from the lowest performing schools in the state (API 1 and 2 ranks). Like II/USP schools, however, CSRD schools improved somewhat more rapidly than the comparison schools during 1999-2000, although for CSRD schools, the steeper improvement had begun prior to the year of the CSRD support.29
Not surprisingly, the second and third panels of Exhibit 3.2, which display SAT-9 scale scores in mathematics and reading for Cohort 1 elementary schools, demonstrate trends similar to the API trajectory, although in mathematics, II/USP schools have maintained some of the planning year gain by 2002. Effects are very small, however, and in reading, the cumulative effect of II/USP in 2002 is zero. (Note: For comparison purposes, grade level effects for SAT-9 elementary students were approximately 20-25 points per grade. A 2 point increase is thus approximately 8-10% of a year’s growth.)
29 One explanation for this different pattern may be that CSRD schools had undergone the equivalent of a planning
year, but without funding, prior to submitting their CSRD application/plans.
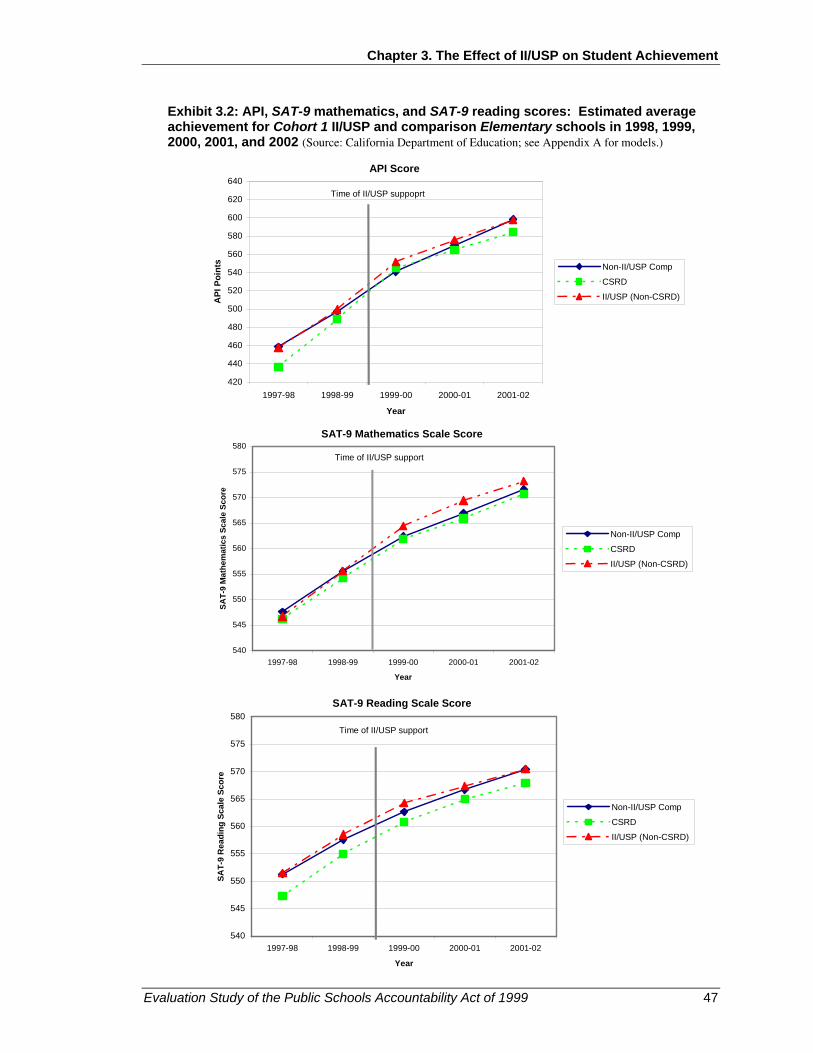
Chapter 3. The Effect of II/USP on Student Achievement
Evaluation Study of the Public Schools Accountability Act of 1999 47
Exhibit 3.2: API, SAT-9 mathematics, and SAT-9 reading scores: Estimated average achievement for Cohort 1 II/USP and comparison Elementary schools in 1998, 1999, 2000, 2001, and 2002 (Source: California Department of Education; see Appendix A for models.)
420
440
460
480
500
520
540
560
580
600
620
640
1997-98 1998-99 1999-00 2000-01 2001-02
Year
API
Poi
nts Non-II/USP Comp
CSRD
II/USP (Non-CSRD)
Time of II/USP suppoprt
540
545
550
555
560
565
570
575
580
1997-98 1998-99 1999-00 2000-01 2001-02
Year
SAT-
9 M
athe
mat
ics
Scal
e Sc
ore
Non-II/USP Comp
CSRD
II/USP (Non-CSRD)
Time of II/USP support
540
545
550
555
560
565
570
575
580
1997-98 1998-99 1999-00 2000-01 2001-02
Year
SAT-
9 R
eadi
ng S
cale
Sco
re
Non-II/USP Comp
CSRD
II/USP (Non-CSRD)
Time of II/USP support
API Score
SAT-9 Mathematics Scale Score
SAT-9 Reading Scale Score

Chapter 3. The Effect of II/USP on Student Achievement
48 Evaluation Study of the Public Schools Accountability Act of 1999
Cohort 2
Exhibit 3.3 tells a slightly different story for Cohort 2 elementary schools. The available data for Cohort 2 cover a longer period prior to II/USP participation than do the data for Cohort 1, so they provide a potentially stronger test of whether the II/USP and comparison schools were similar prior to II/USP support. However, they offer a somewhat weaker test of II/USP differences following participation.
The results for API scores, shown in the first panel of Exhibit 3.3, indicate that Cohort 2 II/USP elementary schools lagged behind the comparison schools in 1998, caught up somewhat in 1999 and lagged even further behind in 2000, the year immediately prior to II/USP participation.30 Then, as for Cohort 1, II/USP elementary schools in Cohort 2 experienced a significantly greater gain during the planning year. Again, the comparative advantage is a little over eight points, or about 0.12 standard deviations. The average API target for II/USP schools in 2001 was 11.7 points, so II/USP helped move the average school 69% of the way toward that target. Unlike Cohort 1, however, Cohort 2 elementary schools were not only able to maintain the planning year advantage but they even increased it by an additional nine points (0.14 standard deviations) in year 2 of the program (2002). The graphs for SAT-9 mathematics and reading indicate that the major portion of the gain has been in reading, though II/USP schools caught up with their non-II/USP counterparts in mathematics by 2002, after starting with an initial disadvantage in 2000. Later in the chapter, we explore a plausible explanation for the continued gain of Cohort 2 elementary schools into 2002.
With respect to Cohort 2 CSRD schools, the pattern is again both similar to and different from that of Cohort 1. Recall that Cohort 2 CSRD schools began as part of the state-funded II/USP program and applied for CSRD at the end of the planning year. Nonetheless, they appear to have experienced consistently lower achievement than other II/USP schools even before the program began. Moreover, during the planning year (2000-2001), schools that were later selected for CSRD showed less growth relative to other II/USP schools (i.e., showed slower growth). While this slower growth was not statistically significant for school-level API scores, it was significant for both SAT-9 mathematics (-1.2 points) and SAT-9 reading (-1.3 points). Once in the CSRD program, however, selected schools made up for the ground lost during the planning year, though they remained significantly lower in overall achievement than II/USP and comparison counterparts.
Cohort 3
We do not include graphs for Cohort 3 schools, as there is only one data point post-II/USP award. Unlike elementary schools in prior cohorts, however, Cohort 3 elementary schools show NO significant difference in achievement trends from comparison schools during their planning year (2001-2002).
30 The difference in pre-program scores may stem from the different criteria and pool for selecting the comparison
group for Cohort 2.
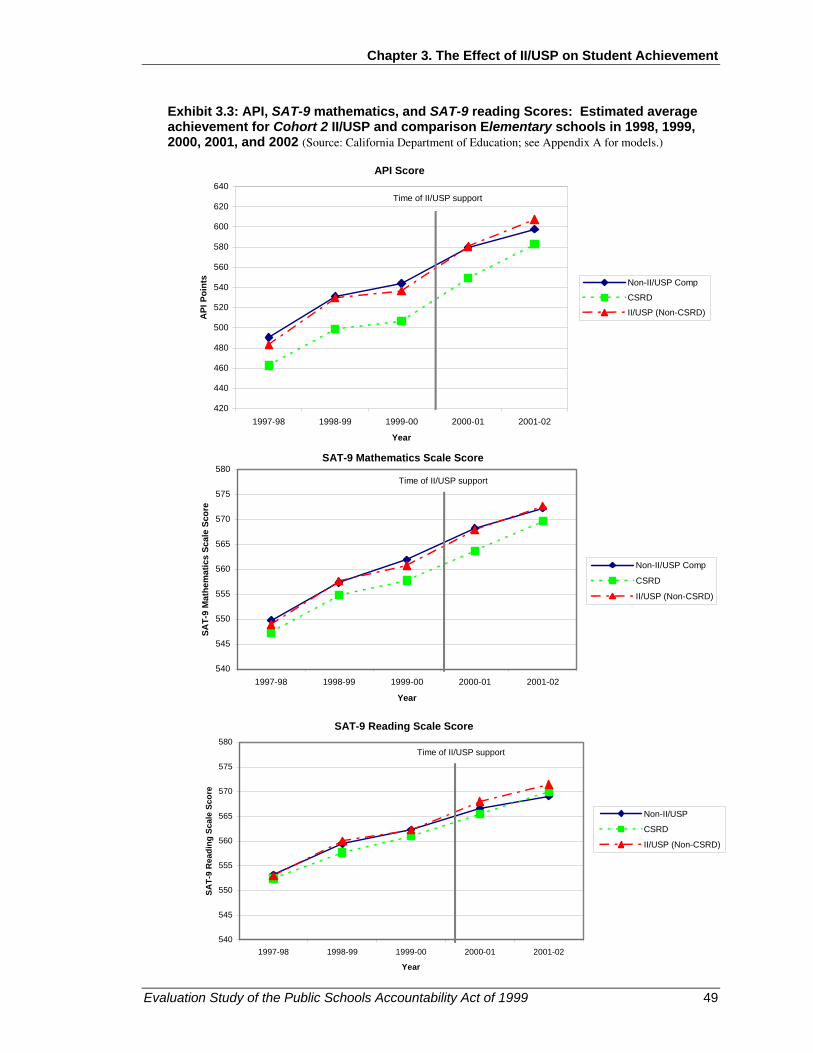
Chapter 3. The Effect of II/USP on Student Achievement
Evaluation Study of the Public Schools Accountability Act of 1999 49
Exhibit 3.3: API, SAT-9 mathematics, and SAT-9 reading Scores: Estimated average achievement for Cohort 2 II/USP and comparison Elementary schools in 1998, 1999, 2000, 2001, and 2002 (Source: California Department of Education; see Appendix A for models.)
420
440
460
480
500
520
540
560
580
600
620
640
1997-98 1998-99 1999-00 2000-01 2001-02
Year
API
Poi
nts Non-II/USP Comp
CSRD
II/USP (Non-CSRD)
Time of II/USP support
540
545
550
555
560
565
570
575
580
1997-98 1998-99 1999-00 2000-01 2001-02
Year
SAT-
9 M
athe
mat
ics
Scal
e Sc
ore
Non-II/USP Comp
CSRD
II/USP (Non-CSRD)
Time of II/USP support
540
545
550
555
560
565
570
575
580
1997-98 1998-99 1999-00 2000-01 2001-02
Year
SAT-
9 R
eadi
ng S
cale
Sco
re
Non-II/USP
CSRD
II/USP (Non-CSRD)
Time of II/USP support
API Score
SAT-9 Mathematics Scale Score
SAT-9 Reading Scale Score

Chapter 3. The Effect of II/USP on Student Achievement
50 Evaluation Study of the Public Schools Accountability Act of 1999
Middle Schools The results for Cohort 1 and 2 middle schools appear in Exhibits 3.4 and 3.5. Again, the first thing to note is the upward trend for all schools in the analysis, though the gains are predictably much smaller than at the elementary level. Cohort 1 middle schools gained an average of approximately 61 API points over the three years of the program (50 points for comparison schools) and 81 points (75 for comparison schools) since 1999 (nearly 1 standard deviation growth over four years).
Cohort 1
As for Cohort 1 elementary schools, II/USP middle schools in Cohort 1 (Exhibit 3.4) demonstrate significantly greater growth (10.8 API points) during the planning year (1999-2000) than do comparison schools. The effect size is also similar to elementary schools in this cohort (0.13 SD; and 75% of the average API growth target in 2000). Unlike elementary schools, however, Cohort 1 middle schools maintain their relative advantage during years 2 and 3 of the program. Moreover, while their API score has a slight and non-significant coefficient for 2002, both SAT-9 mathematics and reading scores for II/USP schools during that year show a slight but statistically significant increase over comparison schools.
Like their II/USP (non-CSRD) counterparts, Cohort 1 CSRD middle schools grow significantly in 1999-2000, but they then show a marked relative decline in growth in 2001. The relative decline is not significant for the API (most likely due to the small number of schools), but is significant in SAT-9 reading and mathematics.
Cohort 2
Results for Cohort 2 middle schools appear in Exhibit 3.5.
The results indicate no significant difference in growth patterns for II/USP and comparison schools, despite very small negative II/USP coefficients (see Exhibits A10-a and A13-b in Appendix A). Meanwhile, Cohort 2 CSRD middle schools start the program with somewhat higher achievement than other II/USP schools but exhibit a relative decline in the planning year and an absolute decline in 2002. Again, the declines are not statistically significant for API scores (due to small sample sizes), but are significant for SAT-9 scores in both reading and mathematics.
Cohort 3
As for elementary schools, Cohort 3 II/USP middle schools show no significant difference from comparison schools on either API or SAT-9 measures.

Chapter 3. The Effect of II/USP on Student Achievement
Evaluation Study of the Public Schools Accountability Act of 1999 51
Exhibit 3.4: API, SAT-9 mathematics, and SAT-9 reading scores: Estimated average achievement for Cohort 1 II/USP and comparison Middle schools in 1998, 1999, 2000, 2001, and 2002 (Source: California Department of Education; see Appendix A for models.)
420
440
460
480
500
520
540
560
580
600
620
640
1997-98 1998-99 1999-00 2000-01 2001-02
Year
API
Poi
nts Non-II/USP Comp
CSRD
II/USP (Non-CSRD)
Time of II/USP support
625
630
635
640
645
650
655
660
665
1997-98 1998-99 1999-00 2000-01 2001-02
Year
SAT-
9 M
athe
mat
ics
Scal
e Sc
ore
Non-II/USP Comp
CSRD
II/USP (Non-CSRD)
Time of II/USP support
API Score
SAT-9 Mathematics Scale Score
SAT-9 Reading Scale Score
625
630
635
640
645
650
655
660
665
1997-98 1998-99 1999-00 2000-01 2001-02
Year
SAT-
9 R
eadi
ng S
cale
Sco
re
Non-II/USP Comp
CSRD
II/USP (Non-CSRD)
Time of II/USP support

Chapter 3. The Effect of II/USP on Student Achievement
52 Evaluation Study of the Public Schools Accountability Act of 1999
Exhibit 3.5: API, SAT-9 mathematics, and SAT-9 reading scores: Estimated average achievement for Cohort 2 II/USP and comparison Middle schools in 1998, 1999, 2000, and 2001 (Source: California Department of Education; see Appendix A for models.)
420
440
460
480
500
520
540
560
580
600
620
640
1997-98 1998-99 1999-00 2000-01 2001-02
Year
API
Poi
nts Non-II/USP Comp
CSRD
II/USP (Non-CSRD)
Time of II/USP support
625
630
635
640
645
650
655
660
665
1997-98 1998-99 1999-00 2000-01 2001-02
Year
SAT-
9 M
athe
mat
ics
Scal
e Sc
ore
Non-II/USP Comp
CSRD
II/USP (Non-CSRD)
Time of II/USP support
625
630
635
640
645
650
655
660
665
1997-98 1998-99 1999-00 2000-01 2001-02
Year
SAT-
9 R
eadi
ng S
cale
Sco
re
Non-II/USP Comp
CSRD
II/USP (Non-CSRD)
Time of II/USP support
API Score
SAT-9 Mathematics Scale Score
SAT-9 Reading Scale Score
Chapter 3. The Effect of II/USP on Student Achievement
Evaluation Study of the Public Schools Accountability Act of 1999 53
High Schools Predictably, overall gains for high schools are much smaller than those for elementary and middle schools, as indicated by the relatively flatter slope of the lines in Exhibits 3.6 and 3.7.
Cohort 1
Interestingly, despite the slower overall growth of high schools in the state, II/USP high schools demonstrate the same relative gain over comparison schools in the planning year (1999-2000) experienced by the elementary schools and middle schools. While the .13 API effect size is not significant for high schools, this is likely due to the small number (N=43) of II/USP high schools in Cohort 1. By contrast, relative increases in SAT-9 scores for mathematics are significant in all years and for reading in both 2001 and 2002.
Cohort 1 CSRD high schools, though few in number (N=10), show substantial significant growth in 2000 (the first year of the program) to climb above both II/USP and comparison schools.
Cohort 2
Similar to Cohort 1, Cohort 2 high schools experience a significant growth advantage over comparison schools in the planning year (2001) in API (effect size (ES)=0.14), SAT-9 mathematics (ES=0.04) and SAT-9 reading (ES=0.04).
Cohort 2 CSRD high schools fare less well than their counterparts in Cohort 1, experiencing an 11-point relative decline in API in each of the program years. Because of the extremely small sample size (N=4), however, the decline is significant only for SAT-9 mathematics scores in 2001.
Cohort 3
Cohort 3 II/USP high schools show no statistically significant difference from comparison schools in API. They do demonstrate a very small but statistically significant increase in SAT-9 mathematics scores, however (ES=0.01), and similarly small relative decline in reading (ES= -0.01).

Chapter 3. The Effect of II/USP on Student Achievement
54 Evaluation Study of the Public Schools Accountability Act of 1999
Exhibit 3.6: API, SAT-9 mathematics, and SAT-9 reading scores: Estimated average achievement for Cohort 1 II/USP and comparison High schools in 1998, 1999, 2000, 2001, and 2002 (Source: California Department of Education; see Appendix A for models.)
420
440
460
480
500
520
540
560
580
600
620
640
1997-98 1998-99 1999-00 2000-01 2001-02
Year
API
Poi
nts Non-II/USP Comp
CSRD
II/USP (Non-CSRD)
Time of II/USP support
655
660
665
670
675
680
685
690
695
1997-98 1998-99 1999-00 2000-01 2001-02
Year
SAT-
9 M
athe
mat
ics
Scal
e Sc
ore
Non-II/USP Comp
CSRD
II/USP (Non-CSRD)
Time of II/USP support
655
660
665
670
675
680
685
690
695
1997-98 1998-99 1999-00 2000-01 2001-02
Year
SAT-
9 R
eadi
ng S
cale
Sco
re
Non-II/USP Comp
CSRD
II/USP (Non-CSRD)
Time of II/USP support
API Score
SAT-9 Mathematics Scale Score
SAT-9 Reading Scale Score

Chapter 3. The Effect of II/USP on Student Achievement
Evaluation Study of the Public Schools Accountability Act of 1999 55
Exhibit 3.7: API, SAT-9 mathematics, and SAT-9 reading scores: Estimated average achievement for Cohort 2 II/USP and comparison High schools in 1998, 1999, 2000, 2001, and 2002 (Source: California Department of Education; see Appendix A for models.)
420
440
460
480
500
520
540
560
580
600
620
640
1997-98 1998-99 1999-00 2000-01 2001-02
Year
API
Poi
nts Non-II/USP Comp
CSRD
II/USP (Non-CSRD)
Time of II/USP support
655
660
665
670
675
680
685
690
695
1997-98 1998-99 1999-00 2000-01 2001-02
Year
SAT-
9 R
eadi
ng S
cale
Sco
re
Non-II/USP Comp
CSRD
II/USP (Non-CSRD)
Time of II/USP support
655
660
665
670
675
680
685
690
695
1997-98 1998-99 1999-00 2000-01 2001-02
Year
SAT-
9 M
athe
mat
ics
Scal
e Sc
ore
Non-II/USP Comp
CSRD
II/USP (Non-CSRD)
Time of II/USP support
API Score
SAT-9 Mathematics Scale Score
SAT-9 Reading Scale Score
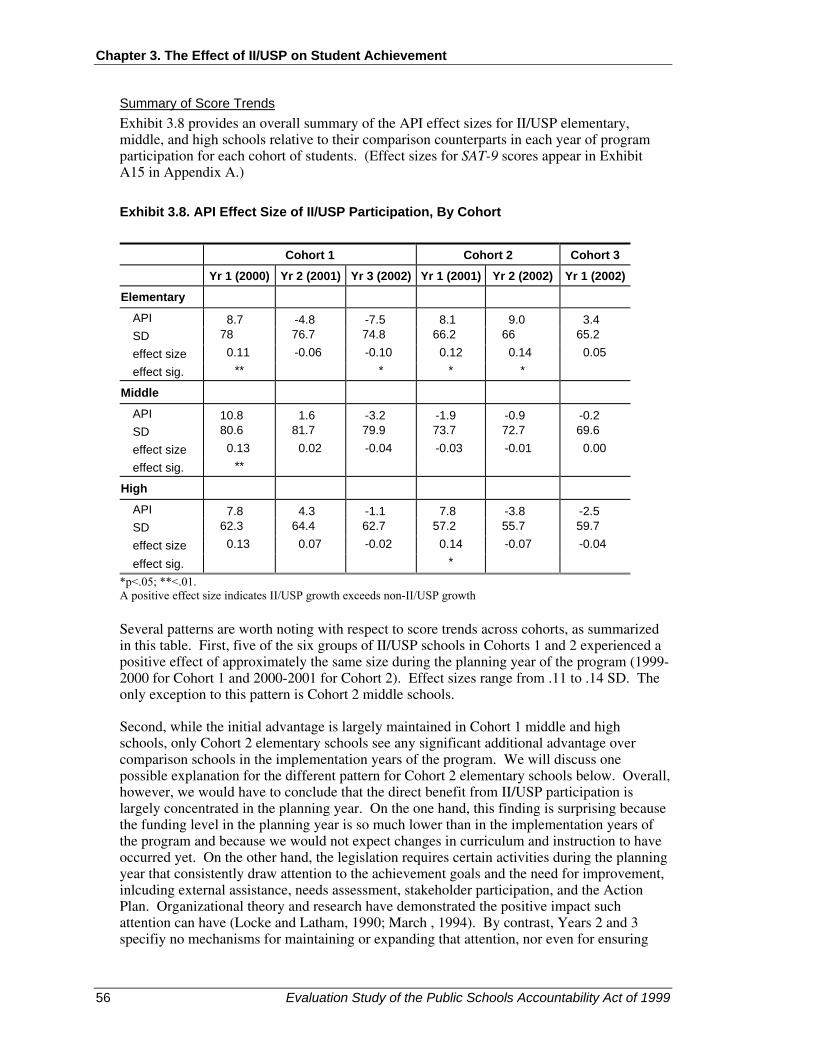
Chapter 3. The Effect of II/USP on Student Achievement
56 Evaluation Study of the Public Schools Accountability Act of 1999
Summary of Score Trends Exhibit 3.8 provides an overall summary of the API effect sizes for II/USP elementary, middle, and high schools relative to their comparison counterparts in each year of program participation for each cohort of students. (Effect sizes for SAT-9 scores appear in Exhibit A15 in Appendix A.)
Exhibit 3.8. API Effect Size of II/USP Participation, By Cohort
Cohort 1 Cohort 2 Cohort 3
Yr 1 (2000) Yr 2 (2001) Yr 3 (2002) Yr 1 (2001) Yr 2 (2002) Yr 1 (2002)
Elementary
API 8.7 -4.8 -7.5 8.1 9.0 3.4 SD 78 76.7 74.8 66.2 66 65.2 effect size 0.11 -0.06 -0.10 0.12 0.14 0.05 effect sig. ** * * *
Middle
API 10.8 1.6 -3.2 -1.9 -0.9 -0.2 SD 80.6 81.7 79.9 73.7 72.7 69.6 effect size 0.13 0.02 -0.04 -0.03 -0.01 0.00 effect sig. **
High
API 7.8 4.3 -1.1 7.8 -3.8 -2.5 SD 62.3 64.4 62.7 57.2 55.7 59.7 effect size 0.13 0.07 -0.02 0.14 -0.07 -0.04
effect sig. * *p<.05; **<.01. A positive effect size indicates II/USP growth exceeds non-II/USP growth
Several patterns are worth noting with respect to score trends across cohorts, as summarized in this table. First, five of the six groups of II/USP schools in Cohorts 1 and 2 experienced a positive effect of approximately the same size during the planning year of the program (1999-2000 for Cohort 1 and 2000-2001 for Cohort 2). Effect sizes range from .11 to .14 SD. The only exception to this pattern is Cohort 2 middle schools.
Second, while the initial advantage is largely maintained in Cohort 1 middle and high schools, only Cohort 2 elementary schools see any significant additional advantage over comparison schools in the implementation years of the program. We will discuss one possible explanation for the different pattern for Cohort 2 elementary schools below. Overall, however, we would have to conclude that the direct benefit from II/USP participation is largely concentrated in the planning year. On the one hand, this finding is surprising because the funding level in the planning year is so much lower than in the implementation years of the program and because we would not expect changes in curriculum and instruction to have occurred yet. On the other hand, the legislation requires certain activities during the planning year that consistently draw attention to the achievement goals and the need for improvement, inlcuding external assistance, needs assessment, stakeholder participation, and the Action Plan. Organizational theory and research have demonstrated the positive impact such attention can have (Locke and Latham, 1990; March , 1994). By contrast, Years 2 and 3 specifiy no mechanisms for maintaining or expanding that attention, nor even for ensuring

Chapter 3. The Effect of II/USP on Student Achievement
Evaluation Study of the Public Schools Accountability Act of 1999 57
implementation of the plans developed during Year 1. Instead, II/USP becomes primarily a funding stream rather than a specific “program.” Funding streams have historically produced few substantial results in achievement, so the lack of II/USP effect in later years is not unusual. The planning vs. implementation year pattern may have implications for future policy, however. Because planning is such a prominent feature in the design of II/USP, we have decided to devote an entire chapter of this report (Chapter 4) to the planning year and a separate chapter (Chapter 5) to school-level implmentation in subsequent years.
A third important pattern to note is that the effects over the years of the program are very small – particularly when viewed in the context of the large statewide gains in API, particularly at the elementary level.
Finally, Cohort 3 II/USP schools do not seem to be following the pattern set by Cohorts 1 and 2. This may stem from selection bias for Cohort 3 – that is, more responsive schools and districts may already have opted into the program in Cohorts 1 and 2, leaving more recalcitrant schools for Cohort 3. Alternatively, schools or intervention in Cohort 3 may differ systematically from prior cohorts in other unspecified ways. Investigation of Cohort 3 implementation and achievement patterns in later years of program participation may illuminate any such differences.
The Effect of II/USP on Meeting API Growth Targets
The preceeding discussion focused on the effect of II/USP and CSRD on scale score trends for the API and for SAT-9 mathematics and reading. However, the PSAA legislation and theory of action (Chapter 1) are predicated on the belief that setting specific and successively higher targets will help focus attention and encourage continuous action toward meeting those targets, thus improving performance over time. In addition, II/USP schools (after Cohort 1) qualified for the program on the basis of their targets rather than the size of their absolute gain in scores. For this reason, it makes sense to consider the effect of II/USP participation on the achievement of those targets as well as on relative growth.
As explained in Chapter 1, PSAA established two targets for each school. Both targets are based on the distance between the school’s baseline API for a given year and the distance between that baseline and the API goal of 800 for all schools in the state. The schoolwide target requires a five percent decrease in that distance each year. Thus, if a school’s baseline API in 2000 was 500, their schoolwide target for 2001was 15 API points – or five percent of the distance between 500 and 800. The 2002 target is then calculated from a new baseline derived from the actual score achieved in 2001. In this way, the API system incorporates a series of moving targets designed to encourage continuous annual improvement. In addition to schoolwide targets, schools must also ensure the progress of all numerically significant subgroups of students. The second (comparable growth) target requires that each such group in a school achieve at least 80 percent of the school’s annual target. Schools must meet both targets for awards. For the sake of brevity and simplicity, the analysis presented below focuses exclusively on meeting schoolwide targets.31
Exhibits 3.9 and 3.10 display the actual percentages of Cohort 1 and 2 II/USP, CSRD, and comparison schools in our sample that met their schoolwide targets for 2000-2002. Note that the differences in percentages of II/USP and comparison schools meeting targets as displayed
31 Exhibit A16 in Appendix A displays the percentages of schools meeting both targets each year. Though the pattern
is slightly different, the lack of an apparent relationship between actual growth and percentages achieving targets is also evident in the dual target analysis.

Chapter 3. The Effect of II/USP on Student Achievement
58 Evaluation Study of the Public Schools Accountability Act of 1999
in these exhibits does not neatly track the effects of II/USP on scale scores reported in the previous section.
Exhibit 3.9: Percent of Cohort 1 II/USP, CSRD, and comparison Elementary schools meeting schoolwide growth target in 2000, 2001, and 2002
Exhibit 3.10: Percent of Cohort 2 II/USP, CSRD, and comparison Elementary schools meeting schoolwide growth target in 2000, 2001, and 2002
0.00
0.10
0.20
0.30
0.40
0.50
0.60
0.70
0.80
0.90
1.00
1999-00 2000-01 2001-02
Year
Perc
ent m
eetin
g ta
rget
II/USP (non-CSRD)CSRDNon-II/USP Comp
0.00
0.10
0.20
0.30
0.40
0.50
0.60
0.70
0.80
0.90
1.00
1999-00 2000-01 2001-02
Year
Perc
ent m
eetin
g ta
rget
II/USP (non-CSRD)CSRDNon-II/USP Comp

Chapter 3. The Effect of II/USP on Student Achievement
Evaluation Study of the Public Schools Accountability Act of 1999 59
II/USP Cohort 1 elementary schools, for example, appear no more likely to make their 1999-2000 target than are comparison schools, despite a significant comparative increase in API scores that year. Cohort 2 results show a similar lack of relationship between score increases and percentages meeting targets in 2000-2001 and 2001-2002, the years of II/USP funding.32
Raw percentages of schools meeting targets, of course, is only a rough approximation of program effects. To refine our analysis, we conducted a logistic regression estimating the probability of achieving the schoolwide target, using the same school-level control variables employed in the analyses of API score trends.33 Parameter estimates and control variables for these analyses appear in Appendix A (Exhibit A18-a, -b, and -c). These results reveal no significant impact of II/USP participation on the probability of achieving growth targets for any group in any year with the exception of Cohort 2 high schools in 2001. Exhibit 3.11 provides a summary table of the actual percentage differences between II/USP and comparison schools meeting targets, along with estimated statistical significance of those differences, based on the logistic regression analysis.
Exhibit 3.11: Difference in percent of Cohort 1, 2, and 3 II/USP and comparison schools meeting growth target
Cohort 1 Cohort 2 Cohort 3
Yr 1 (2000) Yr 2 (2001) Yr 3 (2002) Yr 1 (2001) Yr 2 (2002) Yr 1 (2002)Elementary -1% -6% -11% 0% 9% -1% Middle 12% -1% 0% 4% -6% -2% High 7% 9% 2% **16% -4% 1% *p<.05; **p<.01. A positive percentage difference indicates the percentage of II/USP schools meeting growth targets exceeds the percentage of non-II/USP comparison schools meeting targets
Variation in II/USP Growth
An obvious question at this point in the analysis is why we see so little relationship between the results for scale score trends and those for meeting growth targets. The explanation, we believe, lies in the variation and distribution in II/USP growth results relative to established targets in II/USP and comparison schools. To illustrate this point, Exhibit 3.12 depicts the distribution of II/USP and comparison school growth (within 10-point ranges) for Cohort 1 elementary schools.
32 Note that approximately half the II/USP elementary schools in Cohort 2 did achieve their schoolwide (SW) targets in
2000. Because eligibility for Cohort 2 was based on not meeting one or both of either the schoolwide or the comparable growth targets, we can assume that these schools achieved the first (SW) but not the second during that year.
33 In other words we are looking for the effect of II/USP on the probability of meeting the target, net of any differences in school characteristics such as percent of students on free and reduced price lunch or EL status.

Chapter 3. The Effect of II/USP on Student Achievement
60 Evaluation Study of the Public Schools Accountability Act of 1999
Exhibit 3.12: Distribution of API growth for II/USP and comparison Elementary schools, 1999-2000
Note that the II/USP line is skewed to the right, relative to that of comparison schools. More specifically, a substantial proportion of II/USP schools exhibit very large growth scores, including three schools that gained 140-170 points during this period. By contrast, no comparison schools gained as much as 140 points. In addition, a full 20 percent of II/USP schools grew more than 70 points, whereas only 13 percent of comparison schools showed similar increases. This pattern produced a mean growth of 52.6 API points for II/USP elementary schools in this planning year, compared to an average of 45.7 points for comparison schools. Hence the significant planning year increase reported above for Cohort 1 elementary schools.
Equally important, the shape of the distribution for comparison schools peaks between 20 and 29 points, which is just above the average target of 12-18 points for these schools, while the peak for II/USP schools is much higher, in the 40-49 point range. At the same time, both groups show similarly large numbers of schools below the target range, with the resulting spread being larger for II/USP schools (SD=35.3 points) than that for comparison schools (SD=31.4 points). While the distribution patterns differ for other levels of schools and other cohorts, they evidence a similarly weak relationship between average scale score increases and percentages of schools meeting their schoolwide targets.
Two potential conclusions are apparent from this examination of growth score distribution displayed in Exhibit 3.12. The first is that a substantial minority of very high growth elementary schools in Cohort 1 pull up the estimate of mean II/USP growth for this period. Comparison schools, by contrast, cluster more closely just above the average target range. The second is that just as many II/USP schools (proportionately) show below-target (or even negative) growth as do comparison schools. Taken together, these observations imply that II/USP may be working very well for some schools but not working well (or having no impact) on others. Prior studies elsewhere have come to similar conclusions regarding the
0
0.02
0.04
0.06
0.08
0.1
0.12
0.14
0.16
0.18
-90
-60
-30 0 30 60 90 120
150
180
API growth range
Prop
ortio
n of
sch
ools
ComparisonII/USP

Chapter 3. The Effect of II/USP on Student Achievement
Evaluation Study of the Public Schools Accountability Act of 1999 61
variable impact of external accountability systems on school performance (DeBray, et al., 2001; Elmore, 2001; O’Day, 2002). Researchers have investigated school-level differences that might contribute to that variability, including internal school accountability mechanisms, professional community, and instructional coherence. We explore some of these same factors through case study and survey data in Chapters 4 and 5. Below, we pursue another line of inquiry regarding possible sources of the between-school variability.
District Influences on Variable School Performance
Another possible explanation of the performance patterns that we see, including the wide variability among II/USP schools, is that heretofore-unaccounted-for factors, other than either the II/USP program or internal school characteristics, are at work. Our case study data and prior research suggest to us that district context may mediate, or even drown out, the effects of II/USP participation. Our conceptual framework in Chapter 1 portrays the district context as such a mediating force.
To explore this hypothesized district influence on achievement trends, we expanded our API and SAT-9 analytic models to detect district effects by year, both for II/USP and for comparison schools. We chose the four districts with the largest numbers of II/USP schools – Los Angeles, Oakland, San Diego, and San Francisco – and concentrated our analyses on elementary schools in Cohorts 1 and 2. Our hope was that these groups of schools were sufficiently large to detect a significant district impact, should one in fact exist. The results of these analyses appear in tabular form in Appendix A (Exhibits A18 and A19) and are displayed graphically in Exhibits 3.13 and 3.14 below. We found that II/USP schools tended to perform fairly similarly to comparison schools within each district. Thus, for simplicity’s sake we have plotted only the II/USP schools in these districts and indicated in footnotes the few places where these differ significantly from non-II/USP comparison schools in those districts. Both sets of graphs indicate substantial variation in the growth patterns for the four districts relative to one another and to other II/USP and comparison schools. For Cohort 1 API trends, only LA (2001 and 2002) and Oakland (all years) have enough schools in the sample and sufficient effect to reach statistical significance. Oakland schools grow considerably more slowly in 2000 and 2001 but then close the gap with other districts by 16.5 points in 2002. LA shows substantial comparative advantage in both 2001 (15.4 points) and 2002 (24 points). There is no statistically significant difference in API between II/USP and comparison schools within these districts in any year, so the effect would appear to be among low performing schools districtwide.
When student-level SAT-9 scores are considered, each of the districts shows a significant and substantial impact, with San Diego demonstrating the sharpest upward trajectory in both mathematics and reading, San Francisco a relative decline in both mathematics and reading (2001 and 2002), Oakland a variable pattern but a clear upward turn in 2002, and LA a relative increase, particularly in reading. Districtwide effects are large and tend to drown out II/USP effects in these districts.
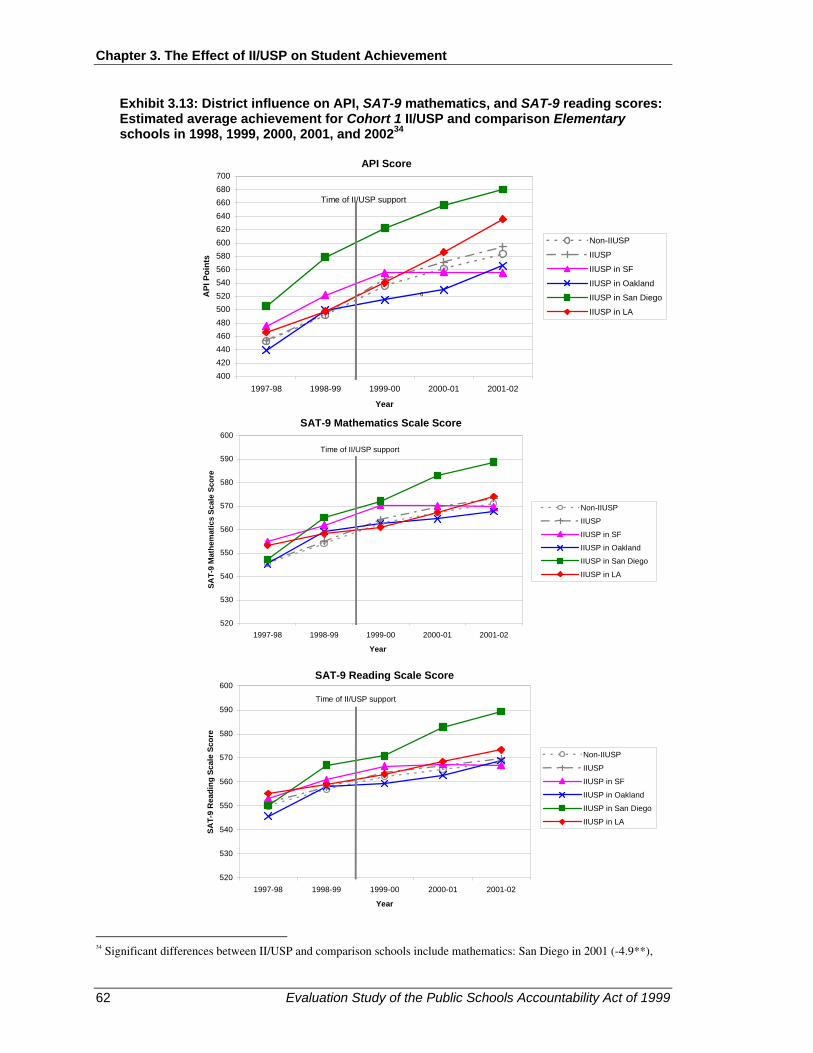
Chapter 3. The Effect of II/USP on Student Achievement
62 Evaluation Study of the Public Schools Accountability Act of 1999
Exhibit 3.13: District influence on API, SAT-9 mathematics, and SAT-9 reading scores: Estimated average achievement for Cohort 1 II/USP and comparison Elementary schools in 1998, 1999, 2000, 2001, and 200234
34 Significant differences between II/USP and comparison schools include mathematics: San Diego in 2001 (-4.9**),
400420440460480500520540560580600620640660680700
1997-98 1998-99 1999-00 2000-01 2001-02
Year
API
Poi
nts
Non-IIUSP
IIUSP
IIUSP in SF
IIUSP in Oakland
IIUSP in San Diego
IIUSP in LA
Time of II/USP support
6
520
530
540
550
560
570
580
590
600
1997-98 1998-99 1999-00 2000-01 2001-02
Year
SAT-
9 M
athe
mat
ics
Scal
e Sc
ore
Non-IIUSP
IIUSP
IIUSP in SF
IIUSP in Oakland
IIUSP in San Diego
IIUSP in LA
Time of II/USP support
520
530
540
550
560
570
580
590
600
1997-98 1998-99 1999-00 2000-01 2001-02
Year
SAT-
9 R
eadi
ng S
cale
Sco
re
Non-IIUSP
IIUSP
IIUSP in SF
IIUSP in Oakland
IIUSP in San Diego
IIUSP in LA
Time of II/USP support
API Score
SAT-9 Mathematics Scale Score
SAT-9 Reading Scale Score

Chapter 3. The Effect of II/USP on Student Achievement
Evaluation Study of the Public Schools Accountability Act of 1999 63
Exhibit 3.14: District influence on API, SAT-9 mathematics, and SAT-9 reading scores: Estimated average achievement for Cohort 2 II/USP and comparison Elementary schools in 1998, 1999, 2000, 2001, and 200235
LA in 2000 (-2.8**); reading: LA in 2000 (-1.3*)
35 Since there were no Cohort 2 comparison schools for San Francisco and Oakland, and one in LA, we are unable to report significance levels for these districts. Significant differences between II/USP and comparison schools in San Diego include mathematics in 2002 (4.6*); reading in 2000 (-5.4**)
400420440460480500520540560580600620640660680700
1997-98 1998-99 1999-00 2000-01 2001-02
Year
API
Poi
nts
Non-IIUSP
IIUSP
IIUSP in SF
IIUSP in Oakland
IIUSP in San Diego
IIUSP in LA
Time of II/USP support
520
530
540
550
560
570
580
590
600
1997-98 1998-99 1999-00 2000-01 2001-02
Year
SAT-
9 M
athe
mat
ics
Scal
e Sc
ore
Non-IIUSP
IIUSP
IIUSP in SF
IIUSP in Oakland
IIUSP in San Diego
IIUSP in LA
Time of II/USP support
520
530
540
550
560
570
580
590
600
1997-98 1998-99 1999-00 2000-01 2001-02
Year
SAT-
9 R
eadi
ng S
cale
Sco
re
Non-IIUSPIIUSPIIUSP in SFIIUSP in OaklandIIUSP in San DiegoIIUSP in LA
Time of II/USP support
API Score
SAT-9 Mathematics Scale Score
SAT-9 Reading Scale Score

Chapter 3. The Effect of II/USP on Student Achievement
64 Evaluation Study of the Public Schools Accountability Act of 1999
Cohort 2 elementary schools show an even clearer picture of the district influence on our analyses of II/USP and comparison schools. The parameter estimates given in Appendix A (Exhibits A18-b and A19-b) must be interpreted in light of the participation patterns for these districts, however, as three of the districts – LA, San Francisco, and Oakland – had virtually universal participation of eligible elementary schools in the II/USP program.36 (See Exhibit A20 for a breakdown of II/USP participation by district for each cohort and level of schooling.) Indeed, these three districts contributed 80 (31 percent) of the 257 Cohort 2 elementary schools. By contrast, there was only one eligible school among all three districts that did not participate and was thus included in the comparison group for our analyses. The growth patterns of schools in these districts will thus disproportionately influence the results regarding II/USP in Cohort 2 elementary schools. Disproportional representation could well explain the significant growth of Cohort 2 II/USP elementary schools after the planning year, as both LA and Oakland (representing 72 II/USP schools in this group) showed significant and large comparative growth in reading in 2002. Moreover, when we enter these four districts into the model, the previously reported significant increase in API and SAT-9 scores for Cohort 2 in 2002 disappears.
We will further explore this apparently substantial district influence in our findings on implementation in Chapters 4 and 5 and in our discussion of implications for policy in Chapter 7.
Results: Disaggregated Effects of II/USP on Selected Student Sub-Populations
Up to this point, we have considered only the aggregate effects of II/USP on student achievement. Although we have controlled for student background characteristics in the SAT-9 analyses, our models have assumed a simple linear additive relationship of these characteristics on achievement. In this last set of analyses, we explore potential differential effects of II/USP on different groups of students, thus responding to part “b” of Research Question 1. For these analyses, we target the three groups of students specified in the PSAA law and in the Request for Proposals for this evaluation:
• English language learners
• Pupils with exceptional needs
• Pupils that qualify for free or reduced price meals and are enrolled in schools that receive funds under Title I, A of the Improving America’s Schools Act (IASA) of 1994.
Our questions for this part of our investigation are:
A. Are there observable changes over time in the achievement gap between the identified sub-populations of students and other (“regular”) students in schools receiving II/USP support, as measured by disaggregated scores on the SAT-9 in mathematics and reading?
B. Do changes in the achievement gaps differ between schools receiving
II/USP support and schools eligible for II/USP that did not apply, or those that applied but were not selected?
36 San Diego City Schools, by contrast, had 6 elementary schools that were eligible for Cohort 2. Three participated in
II/USP and three did not, and so were part of the comparison group for this study.
Chapter 3. The Effect of II/USP on Student Achievement
Evaluation Study of the Public Schools Accountability Act of 1999 65
We organize this section by student subgroup. To conduct each investigation, we expanded our previous SAT-9 models to include interactions of subgroups by year and by II/USP participation. We present the results of these analyses in two ways. First, we display graphically the estimated achievement trends for the identified groups of students and other students in both II/USP and comparison schools. Our purpose in these displays is mainly illustrative, so for brevity we include graphs only for Cohort 1 elementary schools. Since gap changes are most noticeable at the elementary level and since Cohort 1 has the longest post-award trajectory, this group of schools seemed the most appropriate for presentation. Second, we summarize in tabular form the estimated changes in the achievement gap, by program, school level, and cohort, over the full four years and over the course of each cohort’s participation in II/USP. Our data for the summary tables derive from the parameter estimates and significance levels, which are reported in full in Appendix A, Exhibits A21-A23.
English Learners
Our first set of analyses investigates the impact of program participation on the achievement of English learners (EL) relative to fluent English students. This is an important question in California, given the large numbers of students in the state who begin school speaking a language other than English. It is an especially important consideration for the schools affected by II/USP, as they enroll disproportionately large percentages of English learners. Elementary schools in Cohort 1, for example, report EL enrollments of over 40 percent. We would hope that a program designed to foster improvement in such schools would not only be equally effective for EL and non-EL students, but would also serve to narrow the gap in achievement between these two groups.
The effect of II/USP – or any other program – on English learners presents substantive analytical challenges, however. In California, students are all classified into one of four categories: English Learners (EL), Redesignated Fluent English Proficient (R_FEP), Initially Fluent English Proficient (I_FEP or FEP), and English only (EO). It is the relationship between the EL and R_FEP categories that is problematic for cross-sectional analyses, as students move from one category (EL) to the other (R_FEP) based on having achieved higher levels of English proficiency and performance. Estimates for the impact of interventions on officially designated EL students may thus be systematically biased downward over time, as higher performing students move out of that category, and new students with lower levels of proficiency move in. To address this problem, we decided to recode students into only two categories rather than four. Since R_FEP students were, by definition, classified at one time as English learners, we consider them part of the English learner population for the purposes of this analysis. And because FEP students were never considered limited in their English proficiency, we classify them with English-only students even though they may be fully bilingual or at least derive from a home in which a language other than English is spoken.
Employing these definitions, Exhibit 3.15 displays the SAT-9 achievement trends in reading for Cohort 1 EL and non-EL students in II/USP and comparison schools.

Chapter 3. The Effect of II/USP on Student Achievement
66 Evaluation Study of the Public Schools Accountability Act of 1999
Exhibit 3.15: Estimated SAT-9 reading scores for English learners and other students in Cohort 1 II/USP and comparison Elementary schools (Source: California Department of Education; see Appendix A for models.)
Note the similarity in trend lines for English learners and non-English learners in both types of schools. In II/USP schools, both groups show the previously reported “bump” in the trend line during the planning year and then lose that comparative advantage over similar students in comparison schools by 2002. Note also, however, the small but statistically significant narrowing of the gap between EL and fluent English students in both II/USP and comparison schools between 1999 and 2002. On average, EL students in comparison schools gained 3.5 points more during this period than fluent English students gained. In II/USP schools the gap narrowed on average by slightly less, 3.0 points, but the difference between the types of schools was not significant.
Exhibit 3.16 summarizes the trends in the gap over time in mathematics and reading for elementary schools in all cohorts. In each case, there was a small but significant narrowing of the gap between English learners and other students in both reading and mathematics, as measured by the SAT-9. This is encouraging news for California schools. The news for II/USP is more neutral, however. Only in reading in Cohort 2 did EL students fare significantly better in II/USP schools than in comparison schools, and as noted before this may be more of a district effect (LA, Oakland, and San Diego) than an II/USP effect because of the disproportional representation of those districts in Cohort 2 elementary schools.
520
530
540
550
560
570
580
590
1997-98 1998-99 1999-00 2000-01 2001-02
Year
SAT-
9 R
eadi
ng S
cale
Sco
re
Regular in Non-IIUSPEL +R_FEP in non-IIUSPRegular in IIUSPEL + R_FEPin IIUSP
Time of II/USP support

Chapter 3. The Effect of II/USP on Student Achievement
Evaluation Study of the Public Schools Accountability Act of 1999 67
Exhibit 3.16: Change in achievement gap between English learner and fluent English elementary students, SAT-9 reading and mathematics scores, 1998-2002, by cohort and program
Cohort 1
Score Gap (Difference in score between non-EL and
EL students) Change in
Gap1
II/USP Effect on
Gap
1998 1999 2000 2001 2002 1999-2002
MATHEMATICS – Comparison Schools 7.3 7.3 7.1 6.6 5.4 -1.9**
MATHEMATICS – II/USP Schools 8.3 7.7 8.2 7.6 6.0 -1.7**
-0.1 READING – Comparison Schools 17.0 17.2 16.1 14.7 13.7 -3.5**
READING – II/USP Schools 18.5 17.1 17.0 16.0 14.0 -3.0**
-0.5
*p<.05; **p<.01. A positive effect indicates II/USP growth exceeds non-II/USP growth.
Cohort 2 Score Gap
(Difference in score between non-EL and EL students)
Change in Gap
II/USP Effect on
Gap
1998 1999 2000 2001 2002 2000-2002
MATHEMATICS – Comparison Schools 10.2 8.8 8.4 7.8 7.1 -1.3**
MATHEMATICS – II/USP Schools 7.8 6.7 6.7 6.1 4.8 -1.9**
0.6 READING – Comparison Schools 18.7 17.2 15.9 16.0 14.6 -1.2**
READING – II/USP Schools 17.4 16.1 14.9 14.3 12.7 -2.2**
1.0*
Cohort 3
Score Gap (Difference in score between non-EL and
EL students) Change in
Gap
II/USP Effect on
Gap
1998 1999 2000 2001 2002 2001-2002 MATHEMATICS – Comparison Schools 9.3 8.9 7.7 8.0 6.7 -1.3**
MATHEMATICS – II/USP Schools 9.2 8.0 5.6 6.1 5.1
-0.9**
-0.4 READING – Comparison Schools 19.1 18.4 15.8 15.6 14.4 -1.2**
READING – II/USP Schools 18.3 17.1 14.9 14.2 13.5 -0.7*
-0.5
1 The figures in the column entitled “Change in Gap” indicate how much the gap between EL students and non-EL
students increased or decreased over the course of program participation for each cohort. A negative sign indicates a decrease in the gap.

Chapter 3. The Effect of II/USP on Student Achievement
68 Evaluation Study of the Public Schools Accountability Act of 1999
Students Receiving Special Education Services
For the purposes of this evaluation, we have defined “pupils with exceptional needs” to mean students receiving special education services. The results for these students are far less positive than those for English learners presented above. As evident from the trend lines displayed in Exhibit 3.17, the gap in SAT-9 reading scores between special education students and regular education students actually increased significantly in both II/USP and comparison schools in Cohort 1. In comparison schools the increase was 4.2 points on average; in II/USP schools it was 3.0 points. The difference between the II/USP and comparison schools was not significant.
Exhibit 3.17: Estimated SAT-9 reading scores for regular education (“Regular”) and special education (“IEP”) students in Cohort 1 II/USP and comparison Elementary schools
Exhibit 3.18 expands the bad news to both subjects and all cohorts. In each case, there is a significant increase in the distance between achievement scores for regular education students and special education students to the disadvantage of students in special education. The pattern in II/USP schools is statistically identical to that in comparison schools. As for English learners, however, interpretation of the results based on the official classifications is not straightforward when analyses derive from cross-sectional data. One possibility, for example, is that attention to test scores has pulled attention away from the needs of special education students, and they are thus not benefiting from PSAA and other reform efforts to the degree regular education students are. Another possibility is that schools are referring more low performers to special education. Other explanations also exist. At the minimum, this pattern merits further investigation and potential concern among state leaders.
500
510
520
530
540
550
560
570
580
590
600
1997-98 1998-99 1999-00 2000-01 2001-02
Year
SAT-
9 R
eadi
ng S
cale
Sco
re
Regular in Non-IIUSPIEP in non-IIUSPRegular in IIUSPIEP in IIUSP
Time of II/USP support
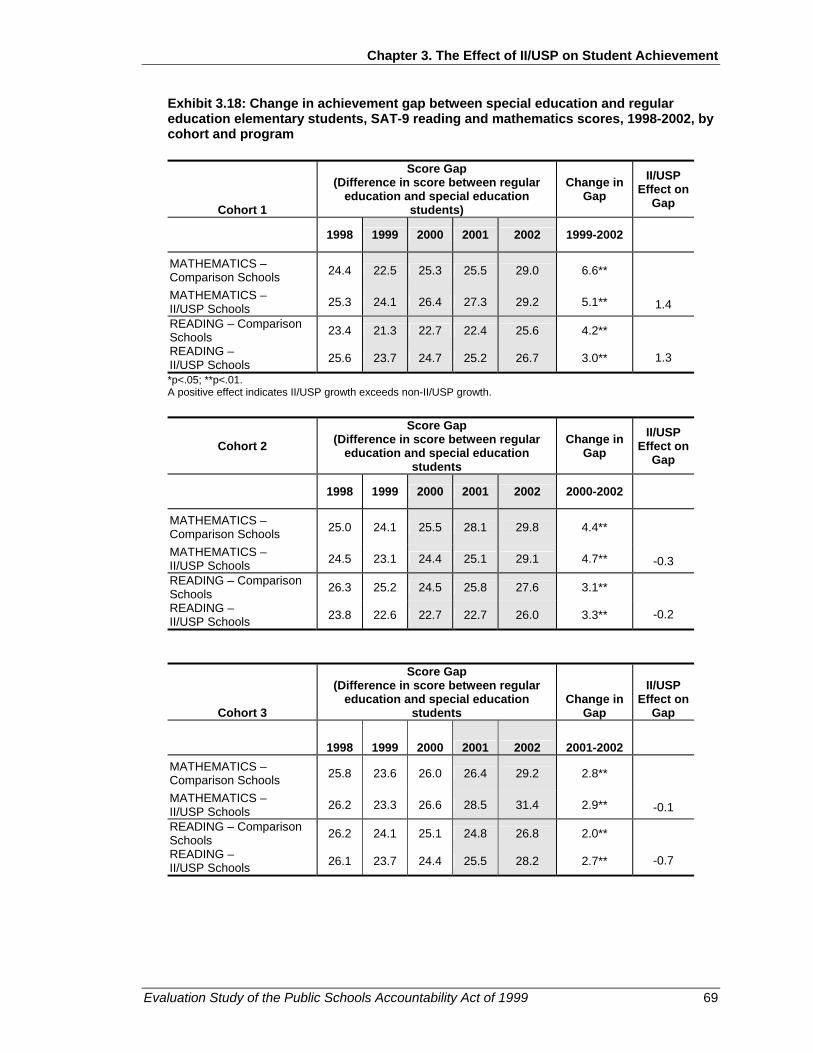
Chapter 3. The Effect of II/USP on Student Achievement
Evaluation Study of the Public Schools Accountability Act of 1999 69
Exhibit 3.18: Change in achievement gap between special education and regular education elementary students, SAT-9 reading and mathematics scores, 1998-2002, by cohort and program
Cohort 1
Score Gap (Difference in score between regular
education and special education students)
Change in Gap
II/USP Effect on
Gap
1998 1999 2000 2001 2002 1999-2002
MATHEMATICS – Comparison Schools 24.4 22.5 25.3 25.5 29.0 6.6**
MATHEMATICS – II/USP Schools 25.3 24.1 26.4 27.3 29.2 5.1**
1.4 READING – Comparison Schools 23.4 21.3 22.7 22.4 25.6 4.2**
READING – II/USP Schools 25.6 23.7 24.7 25.2 26.7 3.0**
1.3
*p<.05; **p<.01. A positive effect indicates II/USP growth exceeds non-II/USP growth.
Cohort 2 Score Gap
(Difference in score between regular education and special education
students
Change in Gap
II/USP Effect on
Gap
1998 1999 2000 2001 2002 2000-2002
MATHEMATICS – Comparison Schools 25.0 24.1 25.5 28.1 29.8 4.4**
MATHEMATICS – II/USP Schools 24.5 23.1 24.4 25.1 29.1 4.7**
-0.3 READING – Comparison Schools 26.3 25.2 24.5 25.8 27.6 3.1**
READING – II/USP Schools 23.8 22.6 22.7 22.7 26.0 3.3**
-0.2
Cohort 3
Score Gap (Difference in score between regular
education and special education students
Change in Gap
II/USP Effect on
Gap
1998 1999 2000 2001 2002 2001-2002 MATHEMATICS – Comparison Schools 25.8 23.6 26.0 26.4 29.2 2.8**
MATHEMATICS – II/USP Schools 26.2 23.3 26.6 28.5 31.4 2.9**
-0.1 READING – Comparison Schools 26.2 24.1 25.1 24.8 26.8 2.0**
READING – II/USP Schools 26.1 23.7 24.4 25.5 28.2 2.7**
-0.7

Chapter 3. The Effect of II/USP on Student Achievement
70 Evaluation Study of the Public Schools Accountability Act of 1999
Students Eligible for Free and Reduced-Price Lunch
Our last set of analyses focuses on students eligible for free and reduced price lunch in schools receiving Title I funds. Exhibit 3.19 displays the estimated trends in SAT-9 reading for free lunch and other students in II/USP and comparison Cohort 1 elementary schools. Between 1999 and 2002, the gap did not change appreciably in comparison schools. In II/USP schools, however, the gap actually increased significantly by an estimated average of 1.6 points relative to comparison schools. One interesting pattern is the lack of any “planning year effect” for students eligible for free and reduced price lunch in Cohort 1 schools. These data, of course, cannot explain why that might be the case, though one possibility is that schools serving more advantaged students may have been able to respond more quickly to their identification as low performing. We consider the role of school capacity in response to accountability later on in Chapters 4 and 5.
Exhibit 3.19: Estimated SAT-9 reading scores for students eligible for free and reduced price lunch (FRPL) and regular students in Title I II/USP and comparison Elementary schools (Cohort 1)
Exhibit 3.20 reveals a somewhat different and variable picture in mathematics and in other cohorts. Cohort 1 comparison and II/USP schools both demonstrate a significant and comparable increase in the gap between free lunch eligible and regular students in mathematics, while Cohort 2 schools show a significant narrowing of the gap in both reading and mathematics, and more so for II/USP schools than for comparison schools (again possibly influenced by trends in the large districts).
520
530
540
550
560
570
580
590
600
1997-98 1998-99 1999-00 2000-01 2001-02
Year
SAT-
9 R
eadi
ng S
cale
Sco
re
Regular in Non-IIUSPFRPL in non-IIUSPRegular in IIUSPFRPL in IIUSP
Time of II/USP support

Chapter 3. The Effect of II/USP on Student Achievement
Evaluation Study of the Public Schools Accountability Act of 1999 71
Exhibit 3.20: Change in achievement gap between FRLP and non-FRLP elementary students in Title I schools, SAT-9 reading and mathematics scores, 1998-2002, by cohort and program
Cohort 1
Score Gap (Difference in score between non-FRLP
and FRLP students) Change in
Gap II/USP
Effect on Gap
1998 1999 2000 2001 2002 1999-2002
MATHEMATICS – Comparison Schools 1.1 4.2 8.2 8.1 6.9 2.7**
MATHEMATICS - II/USP Schools 2.6 3.9 8.0 6.7 6.7 2.8**
-0.1 READING - Comparison Schools 4.2 7.2 9.6 8.3 6.8 -0.4
READING - II/USP Schools 4.4 7.2 11.1 8.2 8.4 1.2**
-1.6**
*p<.05; **p<.01. A positive effect indicates II/USP growth exceeds non-II/USP growth.
Cohort 2 Score Gap
(Difference in score between non-FRLP and FRLP students)
Change in Gap
II/USP Effect on
Gap
1998 1999 2000 2001 2002 2000-2002
MATHEMATICS – Comparison Schools 4.4 6.4 10.1 8.7 9.2 -0.9*
MATHEMATICS - II/USP Schools 2.1 10.8 13.4 12.3 10.5 -2.9**
2.0** READING - Comparison Schools 6.2 7.7 11.0 9.4 9.4 -1.6**
READING - II/USP Schools 5.7 9.8 11.2 9.6 7.0 -4.2**
2.6**
Cohort 3
Score Gap (Difference in score between non-FRLP
and FRLP students) Change in
Gap
II/USP Effect on
Gap
1998 1999 2000 2001 2002 2001-2002 MATHEMATICS – Comparison Schools 3.3 5.9 8.2 9.1 8.5 -0.6
MATHEMATICS - II/USP Schools 1.4 8.3 12.1 11.5 10.4 -1.1*
0.5 READING - Comparison Schools 5.5 7.6 9.5 9.3 9.0 -0.3
READING - II/USP Schools 4.6 8.1 11.9 10.4 9.2 -1.2**
0.9

Chapter 3. The Effect of II/USP on Student Achievement
72 Evaluation Study of the Public Schools Accountability Act of 1999
Longitudinally Linked Student-Level Analyses
The student achievement results presented thus far have all been based on cross-sectional analyses of statewide STAR data, including both API and SAT-9 scores in mathematics and reading. That is, the above findings reflect trends in the mean scores of groups of students and schools recorded at particular, but disconnected, points in time (controlling for various student and school-level characteristics that might influence those trends). Another type of analysis would model trends in individual students’ scores, linked over time, and aggregated to the school level. Analysis of longitudinally linked student-level data has the benefit of revealing trends in the actual growth trajectories for individual students in II/USP schools, relative to the growth of individual students in similar schools. Unfortunately, California does not record test scores with unique student identifiers that can connect an individual student’s score in one year with that same student’s score in another. Such longitudinally linked analysis was therefore not possible at the state level.
With some difficulty, however, we were able to obtain limited longitudinally linked data – SAT-9 reading and mathematics normal curve equivalent (NCE) scores – from three of our case study districts. We focused our data collection efforts on case study districts because we also wanted to be able to consider connections between the achievement results in these schools with implementation patterns observed during our site visits (Chapter 5). In addition, we needed districts that were large enough not only to have had several II/USP elementary schools across the three cohorts, but also to have comparison schools that were similar to II/USP schools and that had been eligible for but never participated in II/USP. These requirements greatly limited our options.
The analyses we discuss below and in the last section of Appendix A are based on data from 13 II/USP elementary schools across three cohorts (9 schools across Cohorts 1 and 2) and 22 comparison schools (15 across Cohorts 1 and 2) in these three districts. In order to follow an intact cohort through 2002, we selected all students who were in grade 5 in these schools in 2002 and had test data for each of the four years (1999, 2000, 2001, and 2002). Their first year of testing data would have been as second graders in 1999.
We fit growth curves to each individual student through four years of data (details of the model appear in the last section of Appendix A). Our intent was to examine whether these growth trajectories differed systematically between II/USP schools and comparison schools. These comparisons were made for all sample schools across the three districts, as well as within each district separately. Finally, we examined the aggregate growth curves on a school-by-school basis for II/USP schools, in order to assess the between-school variability in student growth.
Trends Across Schools
Aggregating across districts, the only statistically significant change in SAT-9 growth rate in any cohort occurs for Cohort 2 in reading in 2001, when both non-II/USP and II/USP schools show a similar slight upturn in growth. (Note that this was the planning year for Cohort 2 II/USP schools.) There was no significant difference in the increase in growth rate between students in II/USP schools and those in comparison schools. (See Exhibit 3.21 below; parameter estimates appear in Appendix A, Exhibit A24-a.)

Chapter 3. The Effect of II/USP on Student Achievement
Evaluation Study of the Public Schools Accountability Act of 1999 73
Exhibit 3.21: Trends in longitudinal achievement growth in II/USP and comparison schools in three case study districts, SAT-9 reading
Reading NCE, Cohort 2, All districts
05
101520253035404550
1999 2000 2001 2002
Comparison Schools II/USP Schools
In mathematics, students in neither II/USP nor comparison schools demonstrated any significant change in growth rates in any cohort or year. (For parameter estimates, see Appendix A, Exhibit A25).
Of course, these results should be interpreted carefully, as they derive from a single cohort of students in a total of 35 II/USP and comparison schools. Moreover, because STAR testing only begins in second grade, we have no data on growth between Kindergarten and Grade 2. For Cohort 1, our first post-program award point is in spring of third grade, so we are tracking growth for upper elementary grade students in these analyses. If schools instituted a primary grade literacy program as part of their II/USP plan, its effects would likely not show up in these data. This is the disadvantage for the longitudinal approach so soon after program implementation. Nonetheless, these data are consistent with the statewide analyses in that neither finds a large effect of II/USP.
Variation Among Schools
The longitudinal data are consistent with the statewide analyses in another respect: they confirm the high level of variability among individual schools in achievement trends for their students. Exhibits 3.22-a – 3.22-c display the school-by-school hierarchical linear model (HLM) results for SAT-9 reading in individual II/USP schools in each of the three cohorts. We use pseudonyms to maintain the confidentiality of our case study schools and districts.

Chapter 3. The Effect of II/USP on Student Achievement
74 Evaluation Study of the Public Schools Accountability Act of 1999
Exhibit 3.22a. Estimated NCE growth on SAT-9 reading, Cohort 1 case study elementary schools (Data provided by case study districts; all names are pseudonyms)
II/USP Cohort 1 Reading - fitted lines
0
10
20
30
40
50
60
1999 2000 2001 2002
Churchill
Hidalgo
Jefferson
El Madrone
Time of II/USP Support
Exhibit 3.22b. Estimated NCE growth on SAT-9 reading, Cohort 2 case study elementary schools (Data provided by case study districts; all names are pseudonyms)
II/USP Cohort 2 Reading - fitted lines
0
10
20
30
40
50
60
1999 2000 2001 2002
Renaissance
Prospect
El Puente
Lincoln
Manzanita
Time of II/USP Support

Chapter 3. The Effect of II/USP on Student Achievement
Evaluation Study of the Public Schools Accountability Act of 1999 75
Exhibit 3.22c. Estimated NCE growth on SAT-9 mathematics, Cohort 3 case study elementary schools (Data provided by case study districts; all names are pseudonyms)
IIUSP Cohort 3 Reading - fitted lines
0
10
20
30
40
50
60
1999 2000 2001 2002
Liberty
Camino
Cesar
Mann
Time of II/USP Support
Note the variation in growth trajectories among II/USP schools. In Chapter 5, we consider the relationship between student outcomes among our case study schools and variation in how those schools approached and implemented their improvement strategies. We return to these longitudinal data in that discussion, using them as one source of information on student outcomes in the relevant case study schools.
Summary of Achievement Findings
In this section we summarize our main findings from the preceding analyses. Since the achievement results will be discussed more thoroughly in the final chapter of this evaluation, in light of qualitative and survey data on program implementation, we review them here without additional explanation.
• Overall student achievement in both II/USP and comparison schools, as measured both by the school-level API and by student-level SAT-9 reading and mathematics scores, has increased sharply and significantly since the institution of the STAR testing program and the passage of the PSAA legislation. Within this context, effects of II/USP or CSRD, where observed, are quite small.
• II/USP effects appear to be concentrated in the “planning year” for Cohorts 1 and 2, with variable maintenance of those effects in subsequent years of the program.
• Unlike prior cohorts, we do not observe any “planning year effect” of II/USP participation in Cohort 3 schools. Without further data on these schools, however, it is not possible to speculate either as to the most likely reasons for their different pattern or to the long-term impact of program participation.
• Our data indicate a large and significant district influence on achievement trends in both II/USP and comparison schools. Achievement patterns vary substantially and systematically across the large urban districts with large numbers of low performing
Chapter 3. The Effect of II/USP on Student Achievement
76 Evaluation Study of the Public Schools Accountability Act of 1999
schools. Those differences appear to overwhelm II/USP effects. In the case of Cohort 2 elementary schools, the apparent continued benefit of II/USP participation may be an artifact of unrelated policies or other context influences in Los Angeles and Oakland in particular, as these districts are significantly over-represented among II/USP schools and essentially absent from the comparison group.
• The gap in achievement between English learners and English fluent students in both mathematics and reading seems to be narrowing significantly and similarly in both II/USP and comparison elementary schools in all cohorts.
• Meanwhile, the gap between special education and regular education students in reading and mathematics has increased significantly in both types of schools across all cohorts.
• Disaggregated achievement results for students eligible for free and reduced-price lunch show more variable patterns, with Cohort 2 faring better than the other cohorts with respect to a narrowing of the gap overall and a significantly more positive trend in II/USP schools.
In the next two chapters, we use these findings as a backdrop to explore the factors, both within and outside II/USP, that seem to contribute to growth patterns in individual participating schools.
Evaluation of the Public Schools Accountability Act of 1999 77
Chapter 4. II/USP: Identification and the Planning Year
Introduction
This chapter discusses findings from our case study and survey data on the activities and experiences of II/USP schools during their first year in the program. We have several reasons for devoting an entire chapter to the first year of II/USP participation, even though the small amount of state money that schools received during this year was often a fraction of what came their way during the subsequent two (or three) years of implementation awards.
One reason for our focus on the planning year derives directly from the student achievement data reported in Chapter 3. As the summary table of II/USP effect sizes (Exhibit 3.8) indicates, five of the six groups of II/USP schools in Cohorts 1 and 2 (all but Cohort 2 middle schools) experience a small “bump” of .11 to .14 standard deviations in their achievement trajectories (relative to comparison schools) during the II/USP planning year. This early effect is somewhat unexpected, as the schools would not have yet had time to implement new strategies generated by that planning process. We determined that it would be advisable to explore our other data sources for possible explanations of this “bump.”
Second, the PSAA specifies a number of actions—including the hiring of an External Evaluator, conducting a needs assessment, and developing an “Action Plan”—that II/USP schools are required to take during the planning year. Our charge to evaluate the overall implementation of the program, in turn, requires us to ascertain the extent to which those actions were taken.
Finally, II/USP is what might be called a very “front-loaded” policy, in the sense that all the programmatic specification occurs in the first year of participation. The requirements mentioned above have no counterparts in Years 2 and 3 of the program, when II/USP becomes primarily a funding stream with the expectation that funds will be used to enact the strategies and address the problems identified in the planning year. By designing the policy in this way, the state is banking on a longer-term payoff to the small investment in planning—that is, they are counting on the belief that the activities required in Year 1 will lay the groundwork for school improvement down the line. It is important to understand whether those design assumptions are producing the desired effects.
In this chapter we report findings from our case study schools and from principal, teacher, External Evaluator, and district administrator surveys. We organize the discussion somewhat chronologically with respect to the progression of activities during Year 1. We start by discussing the selection of schools for II/USP and their response to that selection. We found that II/USP was not a voluntary program for many schools and that the districts often required schools to participate. Though many schools initially resisted participation, they were often able to quickly begin focusing on the benefits of participation. In the following section we discuss the External Evaluator (including the External Evaluator’s selection, role, and rapport with stakeholders), followed by a discussion of the Action Plan planning process and improvement strategies. We found that the External Evaluators in general performed the tasks required by the legislation, but that their overall contributions to the planning process varied, along with the Action Plan development process and the overall saliency of the Action Plan. Strategies in the Action Plans typically focused on interventions related to instruction such as
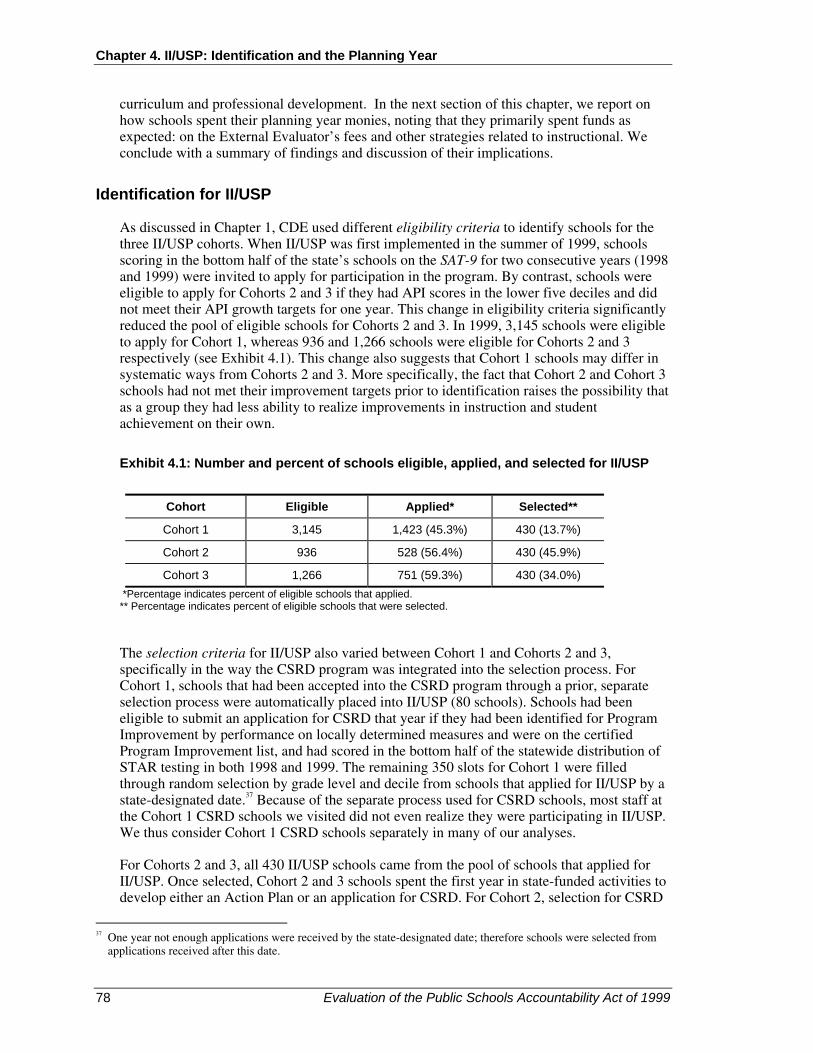
Chapter 4. II/USP: Identification and the Planning Year
78 Evaluation of the Public Schools Accountability Act of 1999
curriculum and professional development. In the next section of this chapter, we report on how schools spent their planning year monies, noting that they primarily spent funds as expected: on the External Evaluator’s fees and other strategies related to instructional. We conclude with a summary of findings and discussion of their implications.
Identification for II/USP
As discussed in Chapter 1, CDE used different eligibility criteria to identify schools for the three II/USP cohorts. When II/USP was first implemented in the summer of 1999, schools scoring in the bottom half of the state’s schools on the SAT-9 for two consecutive years (1998 and 1999) were invited to apply for participation in the program. By contrast, schools were eligible to apply for Cohorts 2 and 3 if they had API scores in the lower five deciles and did not meet their API growth targets for one year. This change in eligibility criteria significantly reduced the pool of eligible schools for Cohorts 2 and 3. In 1999, 3,145 schools were eligible to apply for Cohort 1, whereas 936 and 1,266 schools were eligible for Cohorts 2 and 3 respectively (see Exhibit 4.1). This change also suggests that Cohort 1 schools may differ in systematic ways from Cohorts 2 and 3. More specifically, the fact that Cohort 2 and Cohort 3 schools had not met their improvement targets prior to identification raises the possibility that as a group they had less ability to realize improvements in instruction and student achievement on their own.
Exhibit 4.1: Number and percent of schools eligible, applied, and selected for II/USP
Cohort Eligible Applied* Selected**
Cohort 1 3,145 1,423 (45.3%) 430 (13.7%)
Cohort 2 936 528 (56.4%) 430 (45.9%)
Cohort 3 1,266 751 (59.3%) 430 (34.0%) *Percentage indicates percent of eligible schools that applied. ** Percentage indicates percent of eligible schools that were selected.
The selection criteria for II/USP also varied between Cohort 1 and Cohorts 2 and 3, specifically in the way the CSRD program was integrated into the selection process. For Cohort 1, schools that had been accepted into the CSRD program through a prior, separate selection process were automatically placed into II/USP (80 schools). Schools had been eligible to submit an application for CSRD that year if they had been identified for Program Improvement by performance on locally determined measures and were on the certified Program Improvement list, and had scored in the bottom half of the statewide distribution of STAR testing in both 1998 and 1999. The remaining 350 slots for Cohort 1 were filled through random selection by grade level and decile from schools that applied for II/USP by a state-designated date.37 Because of the separate process used for CSRD schools, most staff at the Cohort 1 CSRD schools we visited did not even realize they were participating in II/USP. We thus consider Cohort 1 CSRD schools separately in many of our analyses.
For Cohorts 2 and 3, all 430 II/USP schools came from the pool of schools that applied for II/USP. Once selected, Cohort 2 and 3 schools spent the first year in state-funded activities to develop either an Action Plan or an application for CSRD. For Cohort 2, selection for CSRD
37 One year not enough applications were received by the state-designated date; therefore schools were selected from
applications received after this date.

Chapter 4. II/USP: Identification and the Planning Year
Evaluation of the Public Schools Accountability Act of 1999 79
was based exclusively on the applications submitted by II/USP schools. For Cohort 3, non- II/USP schools were also allowed to apply for CSRD. Thus schools were chosen from a broader range of applicants.
II/USP: A Voluntary Program?
As discussed in Chapter 1, one of the unique design features of II/USP is that the program is intended to be voluntary for schools, i.e., schools are identified as eligible and then can choose to apply or not to apply for participation after weighing the benefits of the program with potential sanctions down the road. The policy assumption is that choice, or voluntary participation, enhances the motivation and buy-in of school staff. If school staff have played an active role in deciding whether to participate in this program, they will likely be more motivated to take advantage of its opportunities. Indeed, we would expect them to welcome participation from the outset.
By contrast, most school accountability systems across the nation—including the accountability provisions of the federal NCLB Act—identify schools based on external criteria and require participation in whatever assistance and sanctions accompany that identification. Studies of these other systems have found initial defensiveness, demoralization, and resistance to participation on the part of school staff. In some cases that resistance declines as school staff recognize the opportunities such assistance might bring or as student outcomes improve over time. In other schools, the resistance and defensiveness remain, often hindering effective action (O’Day, 2002).
Because of the assumed potential benefits associated with the voluntary nature of II/USP participation, we believe it critical to understand whether that voluntarism and its benefits are truly attained. We explored this theme by asking principals at our case study schools how their schools came to participate in II/USP, particularly whether or not they volunteered. We also asked teachers at case study schools how they first found out about II/USP. We strove to generalize our case study findings by asking II/USP principals through the survey how their schools came to participate in II/USP. It should be noted that the following discussion excludes the three Cohort 1 CSRD case study schools, resulting in a sample of 18 schools. We also exclude (except where noted) Cohort 1 CSRD survey data, since these schools all applied for CSRD through a separate process.
Our case study and survey data indicate that II/USP was indeed not a voluntary program for many schools. Among our case studies, 67 percent (12 out of 18 schools) reported that they were required by their district to participate in II/USP. In these cases, principals and school staff were typically informed by district administrators that they would participate, though in a few cases the school heard the news less directly. For example, one principal of an urban elementary school said, “We were chosen by the district to participate in the II/USP program. I’m sure we were chosen to participate by the district. I read it in the paper!” Four schools, or 22 percent, of the 18 case study schools, were strongly encouraged, though not directly mandated, by their district to participate. Some of these principals expected that they would be required to participate in the future, and therefore felt that applying was the appropriate thing to do. For example, one principal said, “We volunteered because we wanted to do it, but knew we needed to do it,” and indicated that it was better to take on the challenge from the beginning as a volunteer than to be forced into the program later.
The remaining two of the 18 case study schools told us that they had indeed volunteered for the program, and with little to no district encouragement. However, a principal from one of these schools reported that when they were initially given the opportunity to be involved in
Chapter 4. II/USP: Identification and the Planning Year
80 Evaluation of the Public Schools Accountability Act of 1999
II/USP, the school voted against it. It was not until teachers were given more information about the opportunities and funds associated with the program that the school (although not eagerly) by consensus agreed to participate in II/USP.
Principals’ reports of district mandates were corroborated in the survey data. While 53 percent of principals (N=51) reported that participation in II/USP was required by their district, 13 percent reported that it was required by the state. These reports indicated that the majority of principals had not been given the opportunity to choose whether or not to apply. Small differences between the case study data and survey data could stem from our limited sample of case study districts. For example, one of our urban case study districts required that all schools eligible for Cohort 2 apply for II/USP, and one small rural district required all schools in the district to apply for II/USP when eligible. Thus a high percentage of our case study schools resided in districts that mandated participation at some point in the program.
It should be noted that district survey respondents reported a similar level of involvement in the selection of schools for II/USP. 56 percent of district respondents (N=85) reported that their district required at least some eligible schools to apply for Cohort 1. This percentage increased somewhat over the years, with 67 percent reporting such a requirement for Cohort 3 (N=97). In particular, the percentage of district respondents reporting that their district notified and required all eligible schools to apply to II/USP increased from 32.3 percent for Cohort 1 to 46.8 percent for Cohort 3.38 This role of the district—and the variation in it across time and across districts—should be kept in mind throughout our discussion of II/USP planning and implementation, especially in light of the observed district effect on achievement reported in Chapter 3.
Voluntarism is of course in the eye of the beholder and may depend on one’s role inside the school, as well as on actions or forces outside the school. In some of the case study schools that either volunteered themselves or were highly encouraged to volunteer, we found that it was the principal, rather than the full staff, that made the decision to apply. In one case study school (described above) the teachers did come to a consensus about participating in II/USP after what was reportedly a lengthy discussion of the costs and benefits of participation. In other cases, however, the principal decided (sometimes in consultation with other administrators) to apply for the program, sometimes without knowledge or input from the faculty. Thus, even for some of the volunteering schools, the widespread buy-in and motivation presumably associated with choice may still be lacking.
Reactions to the Designation of II/USP
Since our findings indicated that II/USP was not a voluntary program for most schools, we expected school staff to react to the program with initial resistance. Indeed, out of the case study schools that were highly encouraged to participate or mandated to participate by the district, only two initially welcomed participation. In one of these schools, a Cohort 1 urban school, three out of five teachers we interviewed held positive expectations about II/USP. Some of the comments from teachers included: “[I] thought it was good for the area and the school,” “[I] was up for the challenge,” “[we were] happy to get funds and the push to do better.” At the second school, though a few teachers had relatively neutral reactions to II/USP, others mentioned that it would provide an impetus to change, and that it could help
38 Recall that in Chapter 3 we raised the possibility that Cohort 3 schools might be systematically more recalcitrant, as
many were eligible for prior participation in II/USP but did not apply. The increase in the percentage of districts’ requiring participation from Cohort 1 to Cohort 3 lends some support to this premise. Such reluctance, if true, could help explain the lack of the planning year “bump” in student achievement experienced by Cohort 1 and 2 schools.

Chapter 4. II/USP: Identification and the Planning Year
Evaluation of the Public Schools Accountability Act of 1999 81
the school to focus. The majority of case study schools, however, (14 out of 18) balked at the designation as an II/USP school.
The negative reactions observed in most schools stemmed from the following areas of concern: the label of “underperforming”, the attribution of underperformance to the school and staff, the expected burden to the staff, and a distrust in state policy and support. These reactions were at times exacerbated by a lack of information and/or incorrect information provided by the state, district, or school leadership. Some teachers reported they were unclear at first of the requirements and guidelines of II/USP.
Label of “Underperforming”
Many teachers reacted negatively to the label of “underperforming,” which is part of the program title.39 Some respondents were insulted by the stigma associated with this designation. For example, respondents at one school described the process as “gee, you’re an underperforming school, we’ll just kick you in the face,” while another described it as the “Crummy School Grant.” At another school, one teacher said she felt they “were bad and were going to be put under a microscope because they were not doing their jobs.”
Some teachers thought the underperforming label was based on invalid or inappropriate criteria—i.e., primarily students’ SAT-9 scores. When asked if their school was underperforming, they accepted the term only conditionally, saying that their school was underperforming if looking at the standardized test scores. For example, one teacher in an urban school said his school was underperforming “if you look at the numbers, but how valid is that?” In some cases, even when teachers did believe their school was underperforming they did not believe the SAT-9 was a valid measure, expressing the desire to include performance indicators like portfolios, teacher evaluations, or attendance rates. Others thought that looking at individual students’ improvement (longitudinal data) would be a more valid measure. This attitude was confirmed in survey data where only 15 percent of II/USP teachers (N=321)40 reported that they thought the SAT-9 has been a fair and valid measure of the academic achievement of students in their school. In contrast, the majority of II/USP teachers (68 percent) believed the inclusion of the California Standards Tests would make the API a fairer and more valid measure of student achievement.
There was also confusion among teachers and principals as to whether the “underperforming” label was targeting the students or the teachers. For example, at one school, when asked whether their school was underperforming, a member of the leadership team stated, “If you base it on the test scores, if that’s what they are basing it on, then yes. But as a staff, I don’t think our staff is underperforming, not at all.” Meanwhile, at an urban middle school, a teacher responded: “Yes, both the teachers and the students. Everyone was doing what they wanted… I saw a lot of people leaving out sections if they didn’t want to do it. There was no buy-in on [the CSRD Model] from about half the staff. So students were getting splintered instruction.”
Attribution of Underperformance
Finally, many respondents attributed the responsibility of underperformance to causes other than their school, commenting on the socioeconomic level of the students or the students’ ability to speak English. For example one elementary teacher in an urban district said, “I
39 See Hirshberg (2003) for a more in-depth discussion of respondents’ reactions to the designation of their schools as
“underperforming.” 40 These survey data include CSRD Cohort 1 teachers.

Chapter 4. II/USP: Identification and the Planning Year
82 Evaluation of the Public Schools Accountability Act of 1999
think if they took all that money that they want to chop us for test scores or give us for good test scores and if they gave $5000 to each of the families in this neighborhood they’d see more of a jump in their test scores. In other words, I don’t think we’re the problem. We could do a better job, and we could be more a part of the solution, but I don’t think we’re the problem.” Others blamed the students’ parents for not contributing sufficiently to their education: “There is a frustration for the teachers at the school because parents are not held accountable. If parents don’t have time to read to their children, then their children take second place. As long as children take second place at home, then the school is not going to get positive results…” There were also concerns about English learners, that the designation of underperforming did not take into account the percentage of second language learners at the school: “Many parents that can’t speak English can’t help their children with homework.” Another teacher raised concerns about the test, saying, “I feel if we were to allow our students to use their native language on a test, and we taught them in their native language when we could, they would do much better, would show a lot less of an underperformance, the gap wouldn’t have been as large as it is.”
Expected Burden
Negative responses to II/USP also stemmed from the expected burden the process would place on school staff. At one rural school an elementary teacher said, “We felt like we were going to have to jump through a lot of hoops.” Survey data indicated that this was not an uncommon attitude among teachers, as over half of the II/USP teachers surveyed (56 percent) reported that they initially expected II/USP would be a burden on staff (N=210).41
Distrust of Sate Support
Respondents also expressed distrust of state support in a process such as II/USP. One teacher said she had “no expectations it would help—I don’t have a lot of confidence in the state and their programs.” At another school, teachers perceived II/USP as “more layers on top of what they were already doing.” Surveyed teachers and principals also expressed this distrust: 72 percent of II/USP teachers (N=321) and 62 percent of II/USP principals (N=82) reported that state or district education policies and procedures make it difficult for them to address the specific needs of their students and school. Sixty-six percent of II/USP teachers and 55 percent of principals reported that frequent changes in state education policies, procedures, or leadership have made school improvement difficult. These percentages were similar for teachers and principals from schools that were not participating in II/USP.
Subsequent Response to II/USP
Schools that demonstrated initial resistance or resentment towards participation in II/USP did not always maintain such resistance throughout the timeframe of participation. Nine out of the 14 case study schools that initially resisted participation in II/USP moved quickly to an emphasis on the opportunities associated with II/USP, often within the planning year. In these nine schools, the reasons cited for this often rapid change of attitude included: the realization of the resources that would be provided by II/USP, the opportunity to reflect on teaching and school goals, and principal leadership.
Resources. The resources provided through II/USP would allow many schools to do things that they otherwise would not be able to do. These opportunities helped to bring teachers on board to the program and helped them to feel more invested in participation. At one school,
41 These survey data exclude CSRD Cohort 1 teachers.
Chapter 4. II/USP: Identification and the Planning Year
Evaluation of the Public Schools Accountability Act of 1999 83
for example, teachers were told that the funds would allow the resource teacher (literacy coach) to “pull out of doing intervention and to provide assistance to teachers during the entire morning.” They also planned to hire a part-time certified tutor to provide assistance to poor readers. These, along with additional positive changes they had planned with II/USP funds, such as curricular changes and tutoring groups, helped to reduce resistance among teachers.
Opportunity to reflect. In other cases, teachers realized that participation in II/USP could result in the opportunity to reflect on teaching and to develop goals and a vision for the school. By coming together as a faculty and focusing on ways to improve, schools were able to develop a more positive attitude towards II/USP. For example, one teacher in a school that had a successful planning experience noted that when he first heard about their school’s participation, his first reaction was of anger and cynicism. He added, “The other side was, when we sat down after the second meeting or so, and we got a good idea of where this is going to go…We sat down as a group of teachers, [and said] what a great opportunity to finally get vision, and to finally get a cohesive plan!”
Leadership. In some cases strong principal leadership helped to convince teachers of the opportunities associated with II/USP in terms of the resources and time to reflect and focus on school goals. At one Cohort 3 middle school, for example, the teachers took the identification of “underperforming” very personally at first. Their concerns were lessened by the principal convincing them to look at II/USP as an opportunity: “I felt sad and defensive at first. The more [principal X] started to talk about what it meant to us -- money, support -- the less it sounded like ‘you are a crappy teacher’ and that it could be helpful, [and] the more I wanted to get involved. [The principal] … put people where their time and talents would be advanced…He asked us to put our energy in good places.”
In four of the 14 schools, reactions remained mixed, and in one, resistance was long-term. In the school experiencing long-term resistance among teachers (a Cohort 1 rural high school), teachers did not see the resources being put to good use and they did not have many opportunities to reflect during the planning year due to a poor relationship with the External Evaluator. They also had a high rate of principal turnover, weak instructional leadership, and a weak sense of community among teachers.
Our data – primarily retrospective in nature – cannot provide a complete understanding for why teachers in some schools were able to move from resistance to acceptance of the program, and teachers in others were not. We would have to track staff attitudes over the course of time in question to obtain such an understanding. One possibility, however, is that school personnel are able to hold multiple and often conflicting perspectives at the same time and may simply change their emphasis on positive or negative aspects of the program as their experience with it evolves. Our survey data lend some potential support to this hypothesis. Exhibit 4.2 shows the initial expectations for II/USP, as reported by II/USP teachers and principals. Though there were some negative expectations (such as the burden on teachers), large percentages of teachers did expect that II/USP could bring positive results. Thus these mixed expectations may provide an explanation for why in many cases teachers were able to quickly focus on the opportunities associated with II/USP despite initial resistance.

Chapter 4. II/USP: Identification and the Planning Year
84 Evaluation of the Public Schools Accountability Act of 1999
Exhibit 4.2 Expectations of II/USP principals and teachers, as reported in surveys
Positive Expectations for II/USP Principal (N=50)* Teacher (N=210)
I expected II/USP to…
Provide additional resources and expertise for our school, such as additional staff, instructional materials, technology, etc.
97.6%
85.6%
Provide additional professional development for teachers at our school
96.3% 95.7%
Provide an opportunity to reflect on how our school can improve
81.1% 97.8%
Result in higher student achievement 75.0% 87.6%
Result in greater cohesion and focus among teachers 79.8% 74.9%
Negative Expectations for II/USP
I expected II/USP to…
Put teachers’ jobs at risk
25.7%
16.1%
Put principal’s job at risk 47.4% 34.2%
Be a burden to staff 36.8% 56.0%
Open our school to additional sanctions if we don’t improve
72.1% 76.9%
*The n shown is the maximum number of respondents for this item. The n for individual subitems may vary depending on missing responses.
External Evaluators
Schools participating in II/USP were required to hire an “External Evaluator” during the planning year to assist in developing an Action Plan for school improvement. As indicated in our explication of the policy’s Theory of Action (Exhibit 1.5), the assumption underlying this requirement was that lower performing schools often lack the capacity to identify problems and institute changes on their own. They, therefore, need external “eyes” and assistance to move forward. Policymakers assume that the External Evaluators will have the needed expertise to help schools identify problems, engage stakeholders in a productive planning process, and develop a set of coordinated strategies responsive to individual school conditions and contexts.
To operationalize the process, PSAA legislation required External Evaluators to perform several tasks:
• Inform parents and legal guardians that the school is participating in II/USP and notify them of the opportunity to provide recommendations of actions to be taken to improve the performance of the school
• Hold a public meeting at the school during which they solicit feedback and recommendations from parents and legal guardians about improvement strategies for the school
• Provide technical assistance to the school site

Chapter 4. II/USP: Identification and the Planning Year
Evaluation of the Public Schools Accountability Act of 1999 85
• Work with a school community team to identify weaknesses that contribute to below average performance, make recommendations for improvement, and begin to develop an Action Plan to improve academic performance at the school.
External Evaluators (N=96) whom we surveyed reported that they typically worked with several schools and districts. They reported on average conducting work across 3.8 districts over the past three school years (1999-2000, 2000-01, and 2001-02). Individual Evaluators reported assisting on average 1.9 schools in the 1999-2000 school year, 2.33 schools in 2000-01, and 2.9 in 2001-02. The averages for the External Evaluating organizations as a whole were much larger (N=79): 9.7 in 1999-00, 14.7 in 2000-01, and 17.0 in 2001-02. The sometimes large number of schools served by External Evaluators and their organizations had several implications for the planning year process. First, many companies had to hire additional staff to serve the large number of schools with which they contracted. In addition, some schools reported that the External Evaluator did not spend enough time at the school site, suggesting that in some cases External Evaluators may have been spread too thin across multiple schools. Finally, we received some reports that it was difficult to locate an available, approved External Evaluator. The shortage of External Evaluators may indicate a limited capacity in the state to adequately serve the large number of schools identified as low performing, and may indicate the need to focus on a smaller number of schools.
Selection of External Evaluators
Successful implementation of the intended planning year processes is likely to be at least somewhat dependent on the actual quality of the External Evaluators chosen to work with schools. Recognizing this fact, the California Department of Education instituted a succession of approval processes over the past three years, through which they generated lists of approved External Evaluator organizations and individuals (see Exhibit 1.2). Based on feedback from the implementation of Cohort 1 procedures, CDE amended the approval process in 2000-2001 to require that all individuals within an External Evaluator organization be approved to work for schools. The process changed yet again in the 2001-02 school year by allowing Cohort 3 schools to choose an assistance provider that was not on the approved list, such as an individual from the county office of education, the school district, or institutions of higher education.
Our data indicate that local districts, similar to their role in determining II/USP participation, also often played a significant role in selecting External Evaluators. Schools were expected to choose an External Evaluator during the early fall of their planning year.42 However, some districts created their own shorter “approved” list of External Evaluators from which schools could choose, while others assigned External Evaluators to individual schools. In 14 (78 percent) of the 18 case study schools, the district played a strong role in choosing the External Evaluator, and in 10 (56 percent) the district chose the External Evaluator for the schools. Survey data indicated a slightly lower level of district involvement, as shown in Exhibit 4.3. Sixty-two percent of principals reported a strong district role (that either the district selected the External Evaluator or identified a group of External Evaluators from which to choose); 38 percent reported that the district chose the External Evaluator for them. Similar percentages of External Evaluators reported these selection processes based on one school with which they worked. These percentages were comparable to reports from district administrators themselves across cohorts.
42 The legislation specifies that the governing school board contract with the External Evaluator for each school.

Chapter 4. II/USP: Identification and the Planning Year
86 Evaluation of the Public Schools Accountability Act of 1999
Exhibit 4.3: District role in selecting External Evaluator
Case
studies* (N=18)
Principals (N=65)
External Evaluators
(N=97)
District Administrators
(N=148)
District played a strong role in choosing the External Evaluator 78% 62% 67%
Cohort 1: 69%
Cohort 2: 62%
Cohort 3: 73%
District chose the External Evaluator 56% 38% 30%
Cohort 1: 40%
Cohort 2: 29%
Cohort 3: 33% *Indicates the percentage of schools where respondents reported the district role as stated.
The lower percentages in the survey data may once again result from our case study schools being nested within a handful of districts. Since several of the case study districts did play a strong role in the selection of the External Evaluator, the data may over-represent this scenario. In one case study district, for example, the district required all External Evaluators who wanted to work with the Cohort 2 schools in the district to respond to a series of questions about strategies they would use with different types of schools. Based on these responses, the district chose a smaller set of External Evaluators for its schools, and then chose a specific External Evaluator to recommend at each individual school.
The surveyed External Evaluators provided greater detail about the processes used for their selection at schools. Eighty-four percent of External Evaluators reported providing documentation about their past work and expertise (N=97). Significant percentages also made presentations to the school or district (68 percent), met with the principal to discuss their qualifications (61 percent), or met with teachers to discuss their qualifications (37 percent). Sixty-one percent reported that they were assigned to work with the school by their organizations. It should be noted that respondents were allowed to choose more than one response.
Role of External Evaluator
As explained above, the PSAA specified the tasks the External Evaluators were to complete during the planning year. In our case studies and surveys, we found that to a large extent the External Evaluators completed the expected tasks during the planning year. For example, we found that large percentages of respondents reported that the External Evaluators analyzed state assessment data (SAT-9 scores) for the schools, solicited input from a variety of stakeholders, conducted a needs assessment, wrote the Action Plan, and facilitated discussions among school staff about strategies for improvement (see Exhibit 4.4).

Chapter 4. II/USP: Identification and the Planning Year
Evaluation of the Public Schools Accountability Act of 1999 87
Exhibit 4.4 Tasks completed by external evaluators
The External Evaluator…
Case Study Schools (N=18)
Principals (N=50)
External Evaluators
(N=97)
Analyzed state assessment data 89% 80.4% 89.8%
Solicited input/conducted needs assessment 100% 94.6% 95.9%
Wrote Action Plan 83% 82.9% 86.6%
Facilitated discussions among school staff about strategies
44% 79.1% 98.0%
Over half of the External Evaluators surveyed (N=97) reported that they received moderate to substantial assistance from the state in implementing their required role through clear and comprehensive descriptions of II/USP (69.8 percent), clear and comprehensive descriptions of the External Evaluator’s role (59.4 percent), and specific guidelines for the development of the Action Plan (61.1 percent). Fewer reported that the state provided moderate or substantial assistance in training for External Evaluators (24.2 percent),43 timely notification of changes in the II/USP legislation or procedures (33.3 percent), or monitoring of their work in schools (5.3 percent). Findings on the latter three forms of state assistance—particularly the lack of training—may well have implications for the overall quality of work, and for variation in that quality, among External Evaluators and may indicate a need for additional capacity building in this area.
We have found that the district context has a strong effect on student achievement (see Chapter 3) and a strong influence on the improvement strategies implemented in schools (to be discussed further in Chapter 5). Thus it is vital for External Evaluators to have a strong understanding of district context and school improvement initiatives. Approximately half of the district respondents and the External Evaluators reported that they were in regular communication with one another to facilitate the implementation of II/USP in district schools. The majority (>50 percent) of External Evaluators surveyed indicated that they met with district personnel at least once or twice a semester to discuss district context, policy, and goals; to obtain information about the context and operations of schools they served in the district; to obtain student assessment data for the schools they served in the district; and to report on their work. Forty-nine percent (N=148) of district staff reported that communication between district staff and the External Evaluator has been frequent; 45 percent reported that district staff and the External Evaluator have worked closely together to facilitate school improvement. These data suggest that greater emphasis should be placed on the communication and coordination between district staff and the External Evaluators. The latest provisions that allow district staff to serve as External Evaluators will help to provide schools with assistance providers who understand the district context.
External Evaluators’ Rapport with Stakeholders
While we found that the External Evaluators did, in general, complete the major tasks expected of them, schools did not always report positively about their overall experiences with the External Evaluators. Respondents at 28 percent (5) of our case study schools reported positive experiences with their Evaluators, and respondents at 39 percent (7) of our
43 Note: The PSAA does not require the CDE to provide training to External Evaluators.
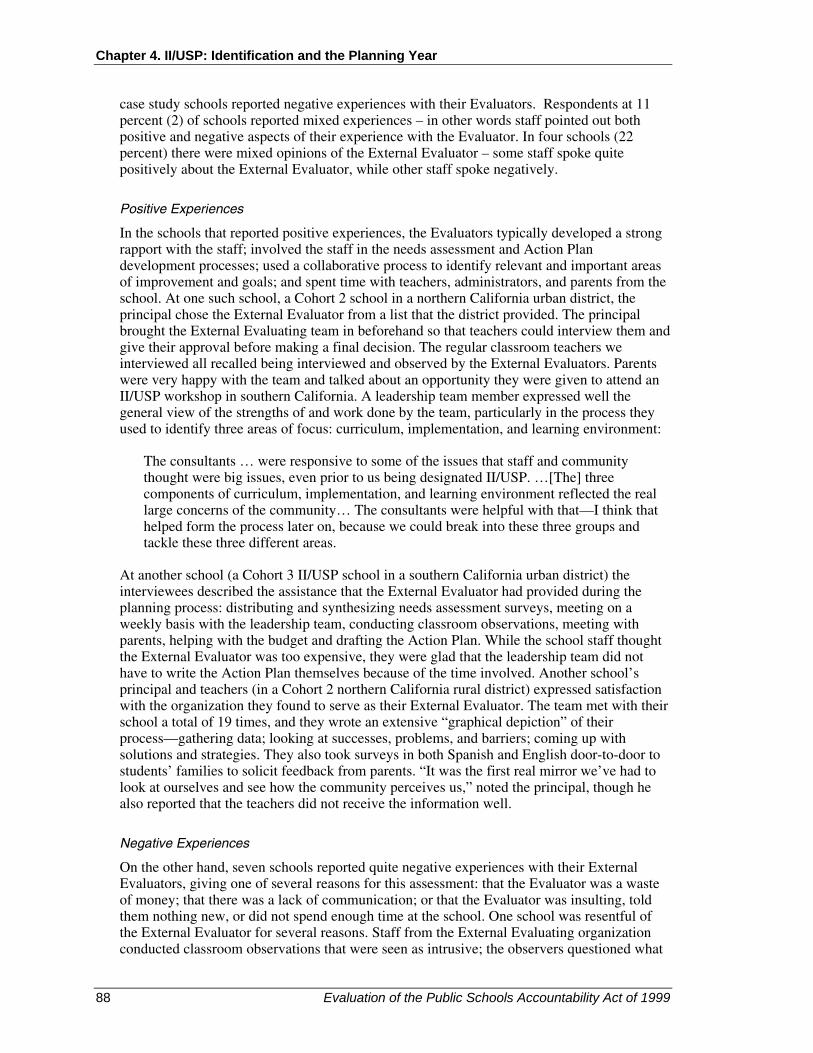
Chapter 4. II/USP: Identification and the Planning Year
88 Evaluation of the Public Schools Accountability Act of 1999
case study schools reported negative experiences with their Evaluators. Respondents at 11 percent (2) of schools reported mixed experiences – in other words staff pointed out both positive and negative aspects of their experience with the Evaluator. In four schools (22 percent) there were mixed opinions of the External Evaluator – some staff spoke quite positively about the External Evaluator, while other staff spoke negatively.
Positive Experiences
In the schools that reported positive experiences, the Evaluators typically developed a strong rapport with the staff; involved the staff in the needs assessment and Action Plan development processes; used a collaborative process to identify relevant and important areas of improvement and goals; and spent time with teachers, administrators, and parents from the school. At one such school, a Cohort 2 school in a northern California urban district, the principal chose the External Evaluator from a list that the district provided. The principal brought the External Evaluating team in beforehand so that teachers could interview them and give their approval before making a final decision. The regular classroom teachers we interviewed all recalled being interviewed and observed by the External Evaluators. Parents were very happy with the team and talked about an opportunity they were given to attend an II/USP workshop in southern California. A leadership team member expressed well the general view of the strengths of and work done by the team, particularly in the process they used to identify three areas of focus: curriculum, implementation, and learning environment:
The consultants … were responsive to some of the issues that staff and community thought were big issues, even prior to us being designated II/USP. …[The] three components of curriculum, implementation, and learning environment reflected the real large concerns of the community… The consultants were helpful with that—I think that helped form the process later on, because we could break into these three groups and tackle these three different areas.
At another school (a Cohort 3 II/USP school in a southern California urban district) the interviewees described the assistance that the External Evaluator had provided during the planning process: distributing and synthesizing needs assessment surveys, meeting on a weekly basis with the leadership team, conducting classroom observations, meeting with parents, helping with the budget and drafting the Action Plan. While the school staff thought the External Evaluator was too expensive, they were glad that the leadership team did not have to write the Action Plan themselves because of the time involved. Another school’s principal and teachers (in a Cohort 2 northern California rural district) expressed satisfaction with the organization they found to serve as their External Evaluator. The team met with their school a total of 19 times, and they wrote an extensive “graphical depiction” of their process—gathering data; looking at successes, problems, and barriers; coming up with solutions and strategies. They also took surveys in both Spanish and English door-to-door to students’ families to solicit feedback from parents. “It was the first real mirror we’ve had to look at ourselves and see how the community perceives us,” noted the principal, though he also reported that the teachers did not receive the information well.
Negative Experiences
On the other hand, seven schools reported quite negative experiences with their External Evaluators, giving one of several reasons for this assessment: that the Evaluator was a waste of money; that there was a lack of communication; or that the Evaluator was insulting, told them nothing new, or did not spend enough time at the school. One school was resentful of the External Evaluator for several reasons. Staff from the External Evaluating organization conducted classroom observations that were seen as intrusive; the observers questioned what

Chapter 4. II/USP: Identification and the Planning Year
Evaluation of the Public Schools Accountability Act of 1999 89
the teachers were doing during the lessons and critiqued the work in the class. The External Evaluator observers also failed to talk with teachers before or after the observations to find out what was going on in the classroom and why. In addition, the External Evaluator conducted the needs assessment entirely with teachers and classrooms in only two of three tracks in a large, year-round school, and omitted the third track, which had the largest number of classrooms, staff, and students. Finally, the organization did not translate their report into Spanish, so parents did not understand all of the components of the needs assessment once it was completed.
At another school, the External Evaluator was universally disliked by teachers interviewed. The phrase used most often to describe his actions was that “he took the money and ran.” According to the teachers, the Evaluator did what was required by law but did not actually incorporate any feedback from teachers. The union representative said that he met with the External Evaluator, but nothing that the teachers actually said made it into the II/USP plan. When asked what they would have liked the External Evaluator to do, one teacher said, “Anything!” and another said, “He could have worked with us.” According to two teachers, the External Evaluator simply took the accreditation application that one teacher had written, and “plagiarized” the application. More than one teacher thought his actions constituted fraud.
Mixed Experiences
In four case study schools, individual staff members had differing opinions about the External Evaluator, and in an additional two schools, respondents reported mixed experiences. For example, in one school, a Cohort 3 elementary school in a Central California urban district, the four teachers interviewed had varied responses to the External Evaluator. On the one hand, these teachers appreciated the moral support they received and the electronic data on individual students that the External Evaluator provided. The teachers said the data were designed to help them gain a better sense of students who needed to improve. However, two teachers did not find that they were able to make full use of the available data. One teacher said that “[Group X] provides data in a way that is useable, but having the time to plan around the data is the problem.” Another teacher commented that when they were presented with information from the SAT-9, they had to compare each individual student with the 32 other students, and “who has time for that?” Others found various aspects of the External Evaluator’s work to be not as efficient and useful as it could be. For example, one teacher reported that many teachers thought the first meeting with the External Evaluating group was “worthless.” She said that “having the school get together and plan together was awesome, but the all-day meetings weren’t necessary. [Group X] is not adding much as of yet.” Three of the four teachers would have liked to see more of the External Evaluating group—“they leave and don’t come back,” and they are not in the classroom enough.
The administrators in this school, on the other hand, held a more positive view of the External Evaluating group. The principal said that they “couldn’t have done it without [Group X]” and that they had “new eyes to a familiar problem.” Indeed, we did find that in three of the four case study schools that had mixed opinions of the External Evaluators, the principals spoke more positively than the teachers.
Even when schools expressed general satisfaction with the External Evaluator, they often wanted more than they had received. In one school (a Cohort 3 elementary school in a central California urban district), teachers wanted the External Evaluator to be more directive and to provide more resources and examples. As one teacher explained, she had hoped the External Evaluator would be more of a director (as in a play or movie), who would tell them their

Chapter 4. II/USP: Identification and the Planning Year
90 Evaluation of the Public Schools Accountability Act of 1999
“parts” and what they needed to do. She elaborated by saying that she wanted “the type of director who guides and lets the actors contribute and tell what they need to do to make their roles more believable.” On the other hand, at a Cohort 1 elementary school in a northern California rural district, the teachers indicated that the External Evaluator could have been more effective if he had approached them differently. Some would have appreciated it if he had started with what they were doing well—they did feel their school had strong points—and then narrowed in on what they could do better.
The survey data showed slightly more positive impressions of the External Evaluators, with over half of the respondents reporting positively about the work done by the External Evaluator (see Exhibit 4.5). Eighty-two percent of principals and 52 percent of teachers reported that the External Evaluator developed a good rapport with faculty and staff at the school. Seventy-five percent of principals and 46 percent of teachers reported that the External Evaluator spent adequate time at the school, and 63 percent of principals reported that the services provided by the External Evaluator were commensurate with the fees paid. It should be noted that the principals reported much more positive impressions of the External Evaluator than did the teachers. This is consistent with the pattern found in the case study data. District staff also reported positively, with 65 percent of them (N=148) reporting that the External Evaluator contributed important ideas to their II/USP schools, and 54 percent saying they would use the External Evaluator again for other school reform efforts.
Exhibit 4.5 Principals’ and teachers’ descriptions of the external evaluators
The External Evaluator… Percentage of Respondents
Agreeing or Strongly Agreeing
Principals (N=50)
Teachers (N=217)
Understood the issues faced by schools like ours 93.4% 67.8%
Engaged teachers in the planning process 90.7% 69.6%
Engaged parents in the planning process 88.0% 50.6%
Established good rapport with the faculty and staff of our school 81.7% 52.2%
Fulfilled expectations for the role of the External Evaluator 79.2% 46.5%
Spent adequate time at our school to learn about our needs and challenges
74.9% 46.3%
In general, many respondents indicated that the idea of having an External Evaluator was a good one. “I feel the External Evaluator is a viable and important piece to school reform,” reported one superintendent. “Our External Evaluators had the background, and they could bring a new perspective that you may not be able to see because you are so close to it.” In addition, 71 percent of surveyed district administrators reported that the provision for an External Evaluator in the PSAA legislation was “moderately” or “very” useful for the improvement of low-performing schools.
Needs Assessment and Action Plan
As stated above, the completion of an Action Plan during the first year of II/USP participation is a core component of the PSAA. As in accountability policies elsewhere, the assumption in PSAA is that underperforming schools often lack the consistency and

Chapter 4. II/USP: Identification and the Planning Year
Evaluation of the Public Schools Accountability Act of 1999 91
coordinated action necessary for organizational improvement. Strategic planning through an identification of needs and strategies to address these needs is intended to move schools toward a stronger, more thoughtful, and more collective approach to improving schools’ achievement. The plans, developed during the first year of II/USP, are supposed to guide action throughout the subsequent implementation years of the program. II/USP funds during those latter years are more substantial than planning year funds in order to support implementation.
In the planning process, schools were expected to form a team of stakeholders who worked with the External Evaluator to specify the areas of weakness for the school and develop specific strategies to address those areas of weakness. These processes were intended to be an opportunity to reflect on the school’s areas of strength and weakness, to examine data, to build collaboration and develop common school goals, and to create a plan that would be implemented in the remaining years of II/USP participation.44
Input from Stakeholders
In the majority of case study schools, input was garnered from the school community for both the needs assessment and Action Plan. In nine of the 18 case study schools (50 percent), the broad school community was involved in some way with the development of the Action Plan. In these schools, teachers were typically asked to provide input through surveys or discussions, and parents were asked to contribute recommendations for the plan. In one rural elementary school, the teachers explained that they filled out surveys, met often, discussed problems, and generated solutions. Some of the discussions evidently became heated, but some thought this was a necessary process: “I think it was very beneficial to talk about our problems, to fight—and there were fights!” In this school, several teachers did feel that their input was included in the Action Plan. One explained, “I wrote down all these things I thought would help the kids…we started doing a lot of things I suggested.” Another said, “People knew up front what we were doing and why, so everyone had time to say yea or nay.”
In five out of 18 schools (28 percent of case study schools) the school leadership team was primarily involved in the needs assessment and development of the Action Plan, with less input from other teachers. For example, at one urban elementary school in Central California, the leadership team worked with the principal, assistant principal, and External Evaluator to conduct the needs assessment and develop the Action Plan. According to the principal and teachers on the leadership team, they spent three full days as a group, analyzing school data so that they could better focus their improvement efforts. The assistant principal set the agenda for each meeting, with different teachers taking on different leadership roles throughout the process.
In a few schools (four out of 18 or 22 percent), the school community was only minimally involved in the development of the Action Plan. In these cases the school often had to rewrite the plan later, or simply did not use the plan since it did not adequately reflect the needs of the school. At one school (a Cohort 2 urban elementary school in central California), the External Evaluating team wrote a plan that the teachers and administrators did not feel was theirs at all. They scrapped the plan when it was finished, and wrote their own by themselves. At another school (a Cohort 2 urban middle school in southern California) the External Evaluating team, according to the principal, “came in, looked and saw a couple of times.” They then wrote the plan, but the principal had to edit it so much that she ended up nearly
44 Action Plans must be approved by local school boards and by the State Board of Education.
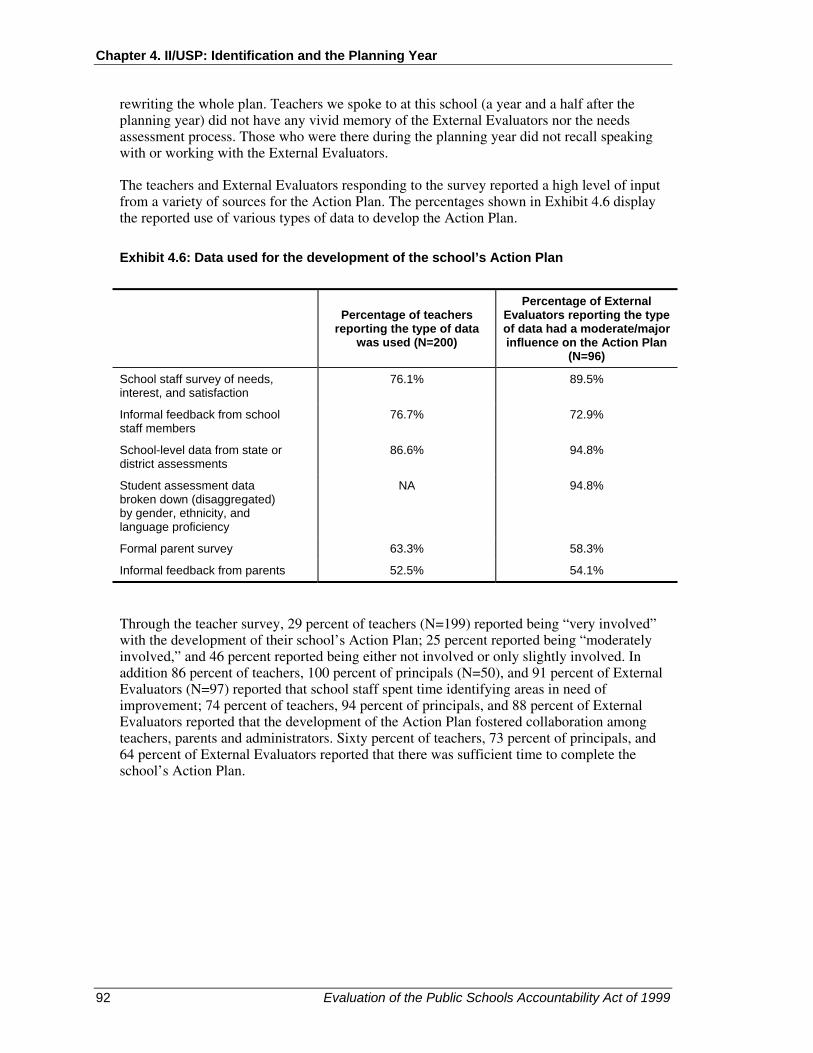
Chapter 4. II/USP: Identification and the Planning Year
92 Evaluation of the Public Schools Accountability Act of 1999
rewriting the whole plan. Teachers we spoke to at this school (a year and a half after the planning year) did not have any vivid memory of the External Evaluators nor the needs assessment process. Those who were there during the planning year did not recall speaking with or working with the External Evaluators.
The teachers and External Evaluators responding to the survey reported a high level of input from a variety of sources for the Action Plan. The percentages shown in Exhibit 4.6 display the reported use of various types of data to develop the Action Plan.
Exhibit 4.6: Data used for the development of the school’s Action Plan
Percentage of teachers
reporting the type of data was used (N=200)
Percentage of External Evaluators reporting the type of data had a moderate/major influence on the Action Plan
(N=96)
School staff survey of needs, interest, and satisfaction
76.1% 89.5%
Informal feedback from school staff members
76.7% 72.9%
School-level data from state or district assessments
86.6% 94.8%
Student assessment data broken down (disaggregated) by gender, ethnicity, and language proficiency
NA 94.8%
Formal parent survey 63.3% 58.3%
Informal feedback from parents 52.5% 54.1%
Through the teacher survey, 29 percent of teachers (N=199) reported being “very involved” with the development of their school’s Action Plan; 25 percent reported being “moderately involved,” and 46 percent reported being either not involved or only slightly involved. In addition 86 percent of teachers, 100 percent of principals (N=50), and 91 percent of External Evaluators (N=97) reported that school staff spent time identifying areas in need of improvement; 74 percent of teachers, 94 percent of principals, and 88 percent of External Evaluators reported that the development of the Action Plan fostered collaboration among teachers, parents and administrators. Sixty percent of teachers, 73 percent of principals, and 64 percent of External Evaluators reported that there was sufficient time to complete the school’s Action Plan.

Chapter 4. II/USP: Identification and the Planning Year
Evaluation of the Public Schools Accountability Act of 1999 93
Spearheading/Writing of the Action Plan
One issue in any strategic planning process is the question of who takes the lead in the process, who is involved in it, and who actually writes the plan. Differing responses to these questions may result in different levels of buy-in and later adherence to the identified strategies. In our case study schools, the External Evaluator served as the primary writer of the Action Plan in 15 schools (83 percent of the case study schools). In these cases, the teachers and other stakeholders played a minimal role in the actual writing and assembly of the Action Plan.
In contrast, in two schools (11 percent of case study schools), the teachers took the lead in writing the Action Plan. In one such school, a Cohort 2 elementary school in a northern California urban district, the Action Plan was written by school staff and parents, with some guidance by the External Evaluators. Three committees were convened to develop components of the Action Plan: a curriculum committee, an implementation committee, and a facilities/learning environment group. The planning year grant was used to not only pay for the External Evaluators, but also for parent travel and for food and child care during meetings. In the two schools where teachers spearheaded this process, the implementation of the Action Plan was largely successful—that is, we saw evidence of its implementation in the following years.
At one case study school, the Action Plan was spearheaded by administrators. The needs assessment had been conducted by the External Evaluator who administered and analyzed teacher, parent, and student surveys and analyzed student achievement data. The principal and teachers did not find this assessment of school needs beneficial in providing anything that they “didn’t already know.” A sense of hostility surrounded these comments, as they believed that money and time was wasted on this endeavor by the External Evaluator. Thus, the development and writing of the Action Plan was spearheaded by one of the vice principals, who also served on the leadership team. The principal, vice principal, and leadership team reviewed SAT-9 and district assessment data and garnered input from the whole staff and parents. They spent an entire Saturday brainstorming the development of and assembling the actual plan. According to one interviewee, “The Action Plan is a fluid document that changes every year based on data,” indicating that the plan was used and reviewed regularly.
Familiarity with and Salience of the Action Plan
Given the wide range of experiences during the needs assessment and Action Plan development processes, one would expect that familiarity with and use of the Action Plan produced during the planning year would vary considerably. This was indeed true, with half of the schools’ teachers having minimal familiarity with the plan (excluding Cohort 3 since they just finished the planning year when we visited). In some cases, this lack of familiarity stemmed from a high turnover of teachers in the school after the plan was completed. For example, one case study school, a small rural middle school in northern California, had only seven teachers when we visited towards the end of the first implementation year. That year, three of the teachers were new. Thus, nearly 50 percent of their teachers started after the Action Plan had been developed, and these teachers were not familiar at all with the contents or goals of the Action Plan nor the II/USP process in general. At another school (a Cohort 1 elementary school in an urban northern California district) with a fairly high turnover rate and an Action Plan written with little input from stakeholders, teachers did not seem familiar with the contents of the Action Plan. When asked what areas or strategies of improvement were in

Chapter 4. II/USP: Identification and the Planning Year
94 Evaluation of the Public Schools Accountability Act of 1999
the Action Plan, almost all the teachers said they could not remember and would have to look at the document to refresh their memories.
At a minority of schools, however, (4 out of 12 schools)45 the Action Plan was quite salient among teachers. In particular, at schools that applied for and received CSRD funds for implementation, the teachers were typically well aware of the model the school adopted and that the decision to apply for the model was made during the planning year. At a few schools that did not apply for CSRD but had successful planning years with significant teacher input, faculty also demonstrated a strong knowledge of the plan and its goals. At one of these schools, all of the educators interviewed talked about changes that had been brought about by an education consulting group that had been hired by the school to provide technical assistance and to help make sure the Action Plan was being implemented. One teacher at the school said, “[Consulting group Y] has helped us tremendously. They’ve helped us focus on different objectives so that all fourth grade classes are dealing with the same thing. They give us time to meet and talk about our results, our challenges, and we get to think of different ways to make it fun for the kids and different ways to help them learn. So that has been a real big help….” At this school, there was a shared vision among and between grade levels for instruction and curriculum, as a result of the implementation of the Action Plan and the work of the consulting company.
The survey data demonstrated much more familiarity with and support of the Action Plan goals and strategies among teachers: 91 percent (N=218) reported that they are familiar with the major provisions of their school’s Action Plan, and 93 percent reported being supportive of the goals and strategies in the Action Plan. We are somewhat skeptical about these numbers, however, as we believe teachers may have been providing more socially acceptable responses, on the assumption that they were supposed to be aware of the Action Plan strategies.
Strategies for School Improvement
The case study schools demonstrated the wide range of implementation strategies that have been implemented by schools participating in II/USP. It should be noted that the strategies undertaken were not always those in the Action Plan. Many schools rewrote, revised, or ignored their Action Plans due to disappointment in the plan developed by the External Evaluator, or due to changing needs (for example, attributable to district-mandated curricula). Thus, the strategies outlined here represent those that schools enacted or planned to enact, but not necessarily what was formally proposed in the Action Plan. In the case study schools, the following strategies were the most common:
• Improve the curriculum (10 of 12 schools). These schools typically made curricular adjustments to better align the curriculum to the state standards or worked to implement a district-mandated curricular package.
• Professional development/coaching (10 of 12 schools). Many schools hired literacy coaches to work closely with teachers. In particular, schools adopting reading curricula such as Open Court or CSRD models that focused on literacy hired coaches to provide professional development to teachers. Other schools provided professional development to teachers in other subject areas or for teaching English learners.
45 The total of 12 schools excludes Cohort 1 CSRD schools (because they did not have an Action Plan) and all Cohort 3
schools (because they were not yet in the process of implementing it, so salience could not be determined.)
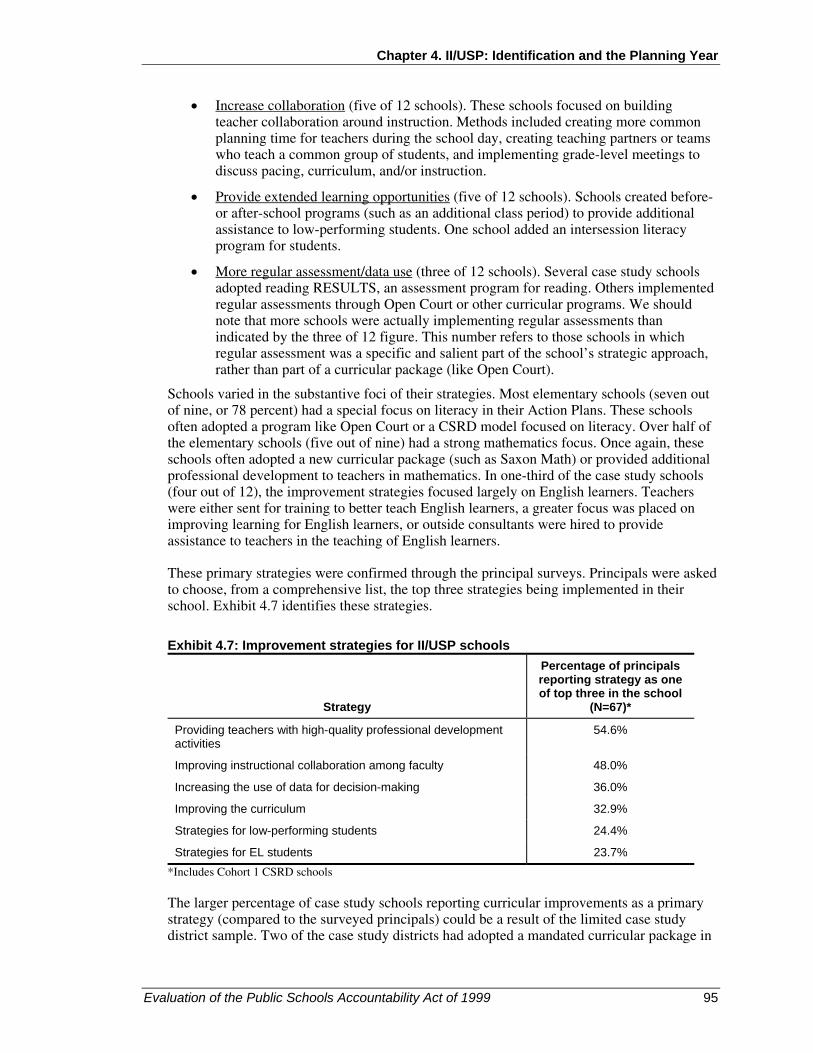
Chapter 4. II/USP: Identification and the Planning Year
Evaluation of the Public Schools Accountability Act of 1999 95
• Increase collaboration (five of 12 schools). These schools focused on building teacher collaboration around instruction. Methods included creating more common planning time for teachers during the school day, creating teaching partners or teams who teach a common group of students, and implementing grade-level meetings to discuss pacing, curriculum, and/or instruction.
• Provide extended learning opportunities (five of 12 schools). Schools created before- or after-school programs (such as an additional class period) to provide additional assistance to low-performing students. One school added an intersession literacy program for students.
• More regular assessment/data use (three of 12 schools). Several case study schools adopted reading RESULTS, an assessment program for reading. Others implemented regular assessments through Open Court or other curricular programs. We should note that more schools were actually implementing regular assessments than indicated by the three of 12 figure. This number refers to those schools in which regular assessment was a specific and salient part of the school’s strategic approach, rather than part of a curricular package (like Open Court).
Schools varied in the substantive foci of their strategies. Most elementary schools (seven out of nine, or 78 percent) had a special focus on literacy in their Action Plans. These schools often adopted a program like Open Court or a CSRD model focused on literacy. Over half of the elementary schools (five out of nine) had a strong mathematics focus. Once again, these schools often adopted a new curricular package (such as Saxon Math) or provided additional professional development to teachers in mathematics. In one-third of the case study schools (four out of 12), the improvement strategies focused largely on English learners. Teachers were either sent for training to better teach English learners, a greater focus was placed on improving learning for English learners, or outside consultants were hired to provide assistance to teachers in the teaching of English learners.
These primary strategies were confirmed through the principal surveys. Principals were asked to choose, from a comprehensive list, the top three strategies being implemented in their school. Exhibit 4.7 identifies these strategies.
Exhibit 4.7: Improvement strategies for II/USP schools
Strategy
Percentage of principals reporting strategy as one of top three in the school
(N=67)*
Providing teachers with high-quality professional development activities
54.6%
Improving instructional collaboration among faculty 48.0%
Increasing the use of data for decision-making 36.0%
Improving the curriculum 32.9%
Strategies for low-performing students 24.4%
Strategies for EL students 23.7% *Includes Cohort 1 CSRD schools
The larger percentage of case study schools reporting curricular improvements as a primary strategy (compared to the surveyed principals) could be a result of the limited case study district sample. Two of the case study districts had adopted a mandated curricular package in
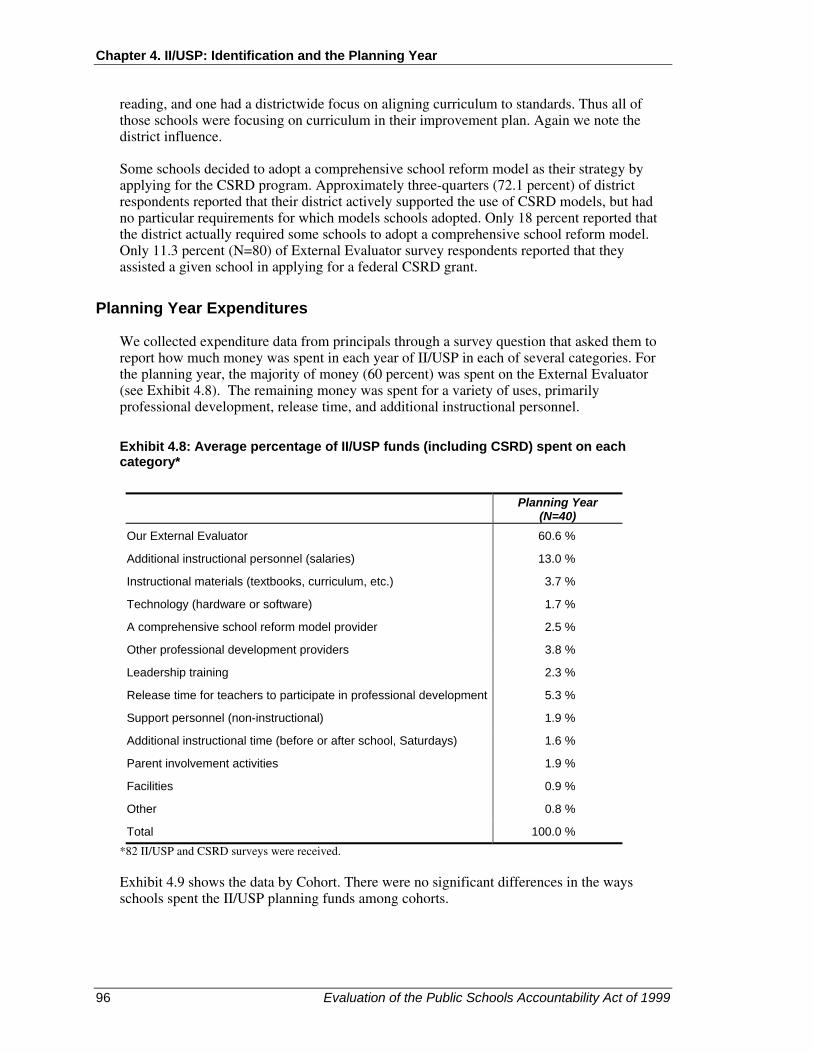
Chapter 4. II/USP: Identification and the Planning Year
96 Evaluation of the Public Schools Accountability Act of 1999
reading, and one had a districtwide focus on aligning curriculum to standards. Thus all of those schools were focusing on curriculum in their improvement plan. Again we note the district influence.
Some schools decided to adopt a comprehensive school reform model as their strategy by applying for the CSRD program. Approximately three-quarters (72.1 percent) of district respondents reported that their district actively supported the use of CSRD models, but had no particular requirements for which models schools adopted. Only 18 percent reported that the district actually required some schools to adopt a comprehensive school reform model. Only 11.3 percent (N=80) of External Evaluator survey respondents reported that they assisted a given school in applying for a federal CSRD grant.
Planning Year Expenditures
We collected expenditure data from principals through a survey question that asked them to report how much money was spent in each year of II/USP in each of several categories. For the planning year, the majority of money (60 percent) was spent on the External Evaluator (see Exhibit 4.8). The remaining money was spent for a variety of uses, primarily professional development, release time, and additional instructional personnel.
Exhibit 4.8: Average percentage of II/USP funds (including CSRD) spent on each category*
Planning Year (N=40)
Our External Evaluator 60.6 %
Additional instructional personnel (salaries) 13.0 %
Instructional materials (textbooks, curriculum, etc.) 3.7 %
Technology (hardware or software) 1.7 %
A comprehensive school reform model provider 2.5 %
Other professional development providers 3.8 %
Leadership training 2.3 %
Release time for teachers to participate in professional development 5.3 %
Support personnel (non-instructional) 1.9 %
Additional instructional time (before or after school, Saturdays) 1.6 %
Parent involvement activities 1.9 %
Facilities 0.9 %
Other 0.8 %
Total 100.0 % *82 II/USP and CSRD surveys were received.
Exhibit 4.9 shows the data by Cohort. There were no significant differences in the ways schools spent the II/USP planning funds among cohorts.

Chapter 4. II/USP: Identification and the Planning Year
Evaluation of the Public Schools Accountability Act of 1999 97
Exhibit 4.9: Planning year expenditures by cohort—II/USP (including CSRD)
Cohort 1(N=8)
Cohort 2 (N=21)
Cohort 3(N=11)
Our External Evaluator 48.8 % 65.2 % 64.1 %
Additional instructional personnel (salaries) 6.6 % 12.4 % 18.1 %
Instructional materials (textbooks, curriculum, etc.) 7.3 % 2.5 % 2.5 %
Technology (hardware or software) 5.1 % 0.5 % 0.6 %
A comprehensive school reform model provider 8.1 % 1.1 % 0.0 %
Other professional development providers 7.3 % 3.3 % 1.8 %
Leadership training 2.9 % 2.4 % 1.7 %
Release time for teachers to participate in professional development 7.8 % 4.9 % 4.2 %
Support personnel (non-instructional) 3.9 % 0.3% 2.1 %
Additional instructional time (before or after school, Saturdays) 0.0 % 2.5 % 1.7 %
Parent involvement activities 2.3 % 2.1 % 1.4 %
Facilities 0.0 % 1.3 % 1.3 %
Other 0.0 % 1.5 % 0.6 %
Total 100.0 % 100.0 % 100.0 %
Eighty-six percent of surveyed principals (N=50) reported that the resources provided to develop the Action Plan were sufficient. Similarly, 84.2 percent of surveyed External Evaluators (N=95), but only 20.4 percent of district respondents, reported that the resources provided for the planning year were adequate or more than adequate.
Conclusion
How do we summarize these findings about the planning year and what should we make of them? We suggest seven overall findings and discuss their implications below:
• Contrary to state design, II/USP was not a voluntary program for many—perhaps the majority—of schools, as districts often required participation. District-mandated participation appears to have increased with successive cohorts. Districts also often played a key, but variable, role in the selection of External Evaluators, in some cases constraining options and in others making the selection directly for individual schools or groups of schools.
• Despite being required to participate in the program, many schools were able to overcome their initial resistance to focus on the benefits of participation.
• As reported by district and school staff, as well as by External Evaluators, the External Evaluators performed the tasks required by the legislation (the needs assessment and Action Plan development), generally using student assessment data and collecting at least some stakeholder input as part of the needs assessment process.

Chapter 4. II/USP: Identification and the Planning Year
98 Evaluation of the Public Schools Accountability Act of 1999
• The quality of work and overall contributions of the External Evaluators varied greatly, as did the respondents’ assessments of the usefulness of the planning process. A majority of case study schools gave mixed or negative reviews of the External Evaluators’ contributions, and among Cohort 1 and 2 case study schools, only two reported a clearly positive evaluation of the planning process. Even where the External Evaluator had developed a fairly good relationship with stakeholders, school respondents were likely to report that the External Evaluator made only marginal contributions to their knowledge of school needs or improvement strategies. Survey respondents were generally more positive in their evaluations of the External Evaluators’ contributions.
• In only a minority of Cohort 1 and 2 schools (four of 12) were the original Action Plans salient to practitioners in Years 2 and 3 of their program participation. This suggests that the initial investment may not have had the staying power for which the policymakers might have hoped – at least not without follow-up assistance for implementation (see Chapter 5).
• The improvement strategies reported by schools in both surveys and case studies focused on interventions that were directly related to instruction, including curricular changes (often influenced or mandated by district curriculum adoptions), professional development, increasing collaboration, extending learning opportunities for low performing students, and regular monitoring of student progress through frequent assessment. Literacy, mathematics, and strategies for English Learners were the primary substantive foci among these schools.
• Schools spent planning year funds as expected – primarily to cover the cost of the External Evaluator’s services, and much less for professional development, instructional materials, and additional personnel.
How do we interpret these findings in light of the achievement trends reported in Chapter 3? We do not observe through these data any planning year activities that were either strong enough or focused enough to directly account for even the small planning year bump in achievement of II/USP schools relative to comparison schools.
Moreover, when we attempt to link our case study qualitative findings on the planning year directly to student achievement outcomes at these schools, we see no relationship between their evaluation of the planning process and improvements in student achievement. Exhibit 4.10 below displays this non-relationship. To fill in this table, we coded Cohort 1 and 2 case study schools (excluding Cohort 1 CSRD) with respect to their overall experience in the planning year—including the role of and rapport with the External Evaluator and the productiveness of the planning process, as reported by the majority of stakeholders at each school. We found only two schools with a consistently positive assessment of the planning year (column 1), two with mixed assessments (column 3), and seven with negative assessments. We also coded the student outcomes for these schools as either positive (row 1) or negative (row 2) depending on whether the schools had achieved their API targets for the planning and subsequent years.
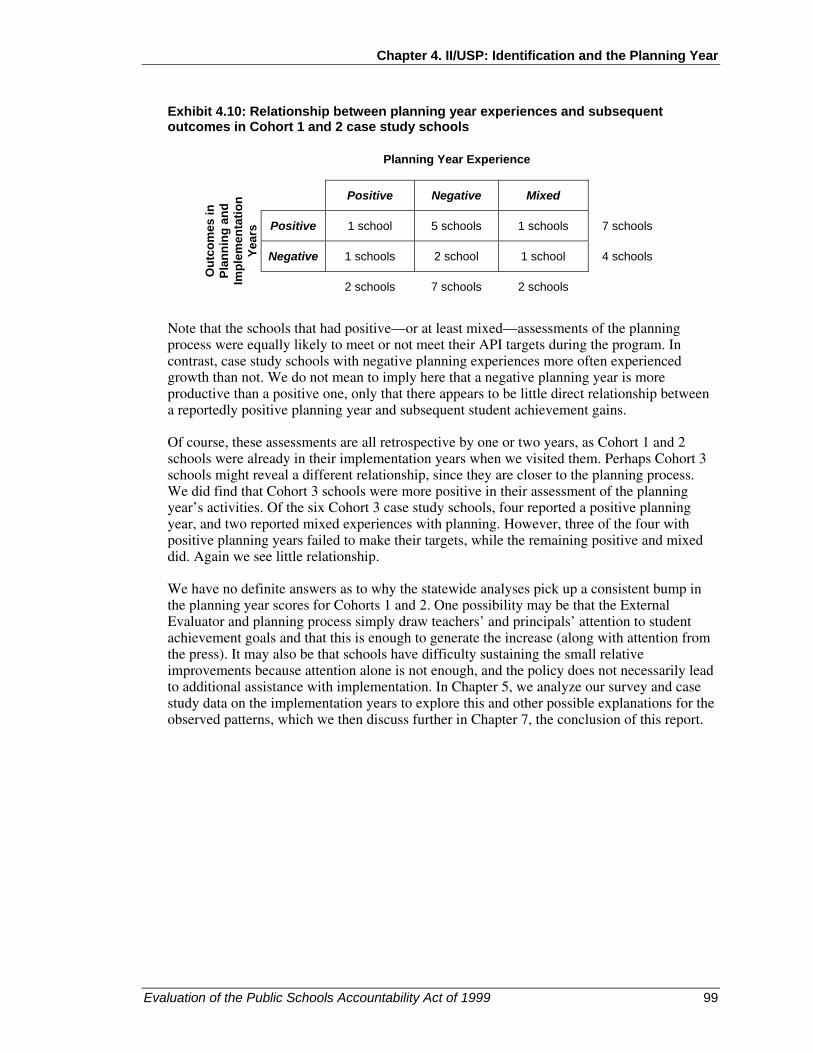
Chapter 4. II/USP: Identification and the Planning Year
Evaluation of the Public Schools Accountability Act of 1999 99
Exhibit 4.10: Relationship between planning year experiences and subsequent outcomes in Cohort 1 and 2 case study schools
Planning Year Experience
Positive Negative Mixed
Positive 1 school 5 schools 1 schools 7 schools
Negative 1 schools 2 school 1 school 4 schools
Out
com
es in
Pl
anni
ng a
nd
Impl
emen
tatio
n Ye
ars
2 schools 7 schools 2 schools
Note that the schools that had positive—or at least mixed—assessments of the planning process were equally likely to meet or not meet their API targets during the program. In contrast, case study schools with negative planning experiences more often experienced growth than not. We do not mean to imply here that a negative planning year is more productive than a positive one, only that there appears to be little direct relationship between a reportedly positive planning year and subsequent student achievement gains.
Of course, these assessments are all retrospective by one or two years, as Cohort 1 and 2 schools were already in their implementation years when we visited them. Perhaps Cohort 3 schools might reveal a different relationship, since they are closer to the planning process. We did find that Cohort 3 schools were more positive in their assessment of the planning year’s activities. Of the six Cohort 3 case study schools, four reported a positive planning year, and two reported mixed experiences with planning. However, three of the four with positive planning years failed to make their targets, while the remaining positive and mixed did. Again we see little relationship.
We have no definite answers as to why the statewide analyses pick up a consistent bump in the planning year scores for Cohorts 1 and 2. One possibility may be that the External Evaluator and planning process simply draw teachers’ and principals’ attention to student achievement goals and that this is enough to generate the increase (along with attention from the press). It may also be that schools have difficulty sustaining the small relative improvements because attention alone is not enough, and the policy does not necessarily lead to additional assistance with implementation. In Chapter 5, we analyze our survey and case study data on the implementation years to explore this and other possible explanations for the observed patterns, which we then discuss further in Chapter 7, the conclusion of this report.

Chapter 4. II/USP: Identification and the Planning Year
100 Evaluation of the Public Schools Accountability Act of 1999

Evaluation of the Public Schools Accountability Act of 1999 101
Chapter 5. Implementation Years
Introduction
This chapter focuses on the implementation years of II/USP and CSRD. We discuss patterns in the case study and survey data in light of the policy’s theory of action, the conceptual framework for this study, and the findings previously reported in Chapters 3 and 4. The analyses presented here address Research Questions 2-6, focusing in particular on the factors that seem to facilitate or hinder the contributions of II/USP and CSRD to school improvement and student achievement.
The organization of the chapter derives from the central logic of the policy’s implicit theory of action, as displayed in simplified form below:46
In the first and second sections of the chapter, we consider the set of assumed linkages between planning, instructional coherence and coordination, and improved student achievement (noted above in blue), building on the findings on the planning year (reported in Chapter 4) and extending the discussion into the implementation years. In particular, we note a strong relationship in our case study schools between a coherent instructional program and student achievement in Years 2 and 3 (consistent with the literature on effective schools). However, we find the desired influence of II/USP on instructional coherence to be mediated by a variety of internal and external conditions, including district policies and context, school capacity, and a variety of other constraints associated with the implementation of II/USP. In the chapter’s third section, we turn to the incentives accompanying II/USP participation (noted above in yellow), most notably the threatened sanctions facing II/USP schools if they do not improve. Here we find only limited salience of the sanctions for teachers and principals, even in schools completing what was to be their final year of the program. Finally, we consider how II/USP schools used their program funds in years 2 and 3 (noted in green) and what the additional resources allowed them to do that they could not have otherwise done. It should be noted that to preserve the confidentiality of our case study schools and respondents, we use pseudonyms for school names.
46 Note that we use the terms “coherent instruction” and “coherent instructional program” throughout this chapter, in
effect combining two boxes of the original theory of action graphic (Exhibit 1.5): “Aligned Strategies and Coordinated Action,” and “Instructional Change.” Alignment of goals, instructional practice, and resources were key objectives of the planning process. Instructional coherence is a manifestation of this alignment and a central goal of standards-based reform, of which PSAA is a part.
Assistance& Funding
Incentives
Attention and
Planning
Coordinated
Strategies and Coherent
Instruction
Improved Student
Achievement

Chapter 5. Implementation Years
102 Evaluation of the Public Schools Accountability Act of 1999
II/USP, Instructional Coherence, and Student Achievement
This section focuses on the posited relationship between II/USP activities, instructional coherence, and student achievement. With respect to that relationship, three findings stand out from our previous discussions:
• Despite a very small, but observable, relative increase in test scores during the planning year, II/USP schools do not on average appear to experience significant or substantial gains in student achievement from participation in the program.47 (Chapter 3)
• We find substantial variation in outcomes among II/USP schools, with some experiencing considerable and consistent growth and others experiencing little or even negative growth. (Chapter 3)
• Among case study schools, we find little relationship between the variability in student outcomes and variation in the reported strength and effectiveness of the planning year activities. (Chapter 4)
Two possible explanations arise for a weak overall relationship between the II/USP planning year and subsequent student outcomes. One is that the assumed link between II/USP planning and a coherent instructional focus is not realized, possibly because other conditions mediate that relationship. A second possibility is that the assumed link between coherent instructional focus and student achievement is not realized – or that it is delayed such that its effects do not show up within the first two years of implementation.48 To investigate these possibilities, we turn primarily to our case study data, supplemented with relevant information from the teacher and principal surveys.
Instructional Coherence and Student Outcomes
We begin with the link between instructional coherence and student outcomes because of its strong base in the research literature. Indeed, one of the most consistent findings in the empirical research on effective schools (that is, schools with higher than expected student outcomes) is that staff in these schools share a common and coherent vision for instruction, are focused on student learning, and monitor student progress (Purkey and Smith, 1983; Levine and Lezotte, 1990).
We thus posed the following two questions:
As described in Chapter 2, we based our cross-case findings on systematic analysis of case study data, using the conceptual framework and construct matrix as our guide.
47 The primary exception to this pattern is Cohort 2 elementary schools, which are disproportionately concentrated in a
few influential districts. As we demonstrate in Chapter 3, the implementation year effect for these schools disappears when the influence of the large districts is accounted for.
48 It is important to keep in mind that this evaluation covers only 1-3 years of program funding, depending on cohort. Any effects that take longer to show up will not be reflected in these analyses.
How did our case study schools vary with respect to instructional coherence?
What was the relationship between their level of instructional coherence / focus and the ensuing student outcomes?

Chapter 5. Implementation Years
Evaluation of the Public Schools Accountability Act of 1999 103
Instructional Coherence in Case Study Schools
Our first step in this analysis was to determine the levels of instructional coherence in each of our case study schools. We coded schools as having a coherent instructional program if respondents reported a common vision and strategies in core subjects; if those reported strategies were evident in our classroom observations of instruction; if they were consistent across grades and in reports of both administrators and teachers; and if there was apparent alignment between instructional content, professional development and student assessment. Using these criteria, we found approximately half (48 percent) of the 21 case study schools were implementing a coherent instructional program. Nine of these ten schools were state-funded II/USP elementary schools across Cohort 1 (four schools), Cohort 2 (three schools) and Cohort 3 (two schools), and one was a Cohort 1 CSRD elementary school. Since we examine the implementation years in this section, we will be primarily discussing only Cohort 1 and 2 schools.
In contrast to the eight Cohort 1 and 2 schools with a coherent instructional program, we found that three schools lacked any discernible instructional vision or overriding strategy. One of these was a Cohort 1 CSRD school with a home-grown “model” consisting of a hodgepodge of activities that one administrator described as “mutually reinforcing,” but which no one (including himself) could clearly articulate. The other two schools (Cohorts 1 and 2) were in similar situations, but without the claim (or funding) of a comprehensive school reform model.
Finally, four of our Cohort 1 and 2 case study schools evidenced aspects of coherence amidst some form of conflict, either internal conflict among the staff or external conflict with the district. All four were CSRD schools. In two of these schools, the faculty were split on their support for and implementation of the CSRD model. In the other two, faculty struggled to implement two coherent but conflicting instructional strategies, one selected by the school staff as the CSRD model and the other imposed by a district mandated curriculum.
Exhibit 5.1 below displays our categorization of case study schools into these three levels of instructional coherence.

Chapter 5. Implementation Years
104 Evaluation of the Public Schools Accountability Act of 1999
Exhibit 5.1: Case study schools by level of instructional coherence
Coherent Instructional Programs (C=CSRD) Cohort 1 Cohort 2
El Madrone Elementary
Churchill Elementary
Hillside Elementary
Bayview Elementary
Hidalgo Elementary
Manzanita Elementary
Lincoln Elementary
El Puente Elementary
Conflictual Instructional Programs (C=CSRD) Cohort 1 Cohort 2
Jefferson Elementary - C
Prospect Elementary - C
Renaissance Elementary - C
Ford Middle - C
Incoherent Instructional Programs (C=CSRD) Cohort 1 Cohort 2
Citrus Valley High—C
Carver High
Sherman Middle
Student Outcomes in Case Study Schools
Our next step was to independently assess the progress of our case study schools in terms of changes in student achievement. We examined student outcomes in several ways. First, we considered whether the schools had met their schoolwide and/or subgroup growth targets during participation in II/USP (three years of targets for Cohort 1, two years of targets for Cohort 2). Then, as a measure of the magnitude of change, we calculated how far each school had progressed toward the state-defined API goal of 800. For example, if a school started II/USP with an API of 400 and increased to 500 during planning and implementation, it had made 25 percent growth towards the target of 800—that is, it had reduced the distance between its initial score and the 800 goal by 25 percent. Finally, as explained in Chapter 3, in those schools for which we had data, we analyzed longitudinally linked student-level achievement scores to estimate the trajectory of a single cohort of students in each school (those who were in grade 5 in 2002). We used this latter determination simply as a validation check on the other primary analyses.
The variation in achievement growth among the 15 Cohort 1 and 2 schools in our sample was substantial. For example, the number of API points gained by each school ranged from a high of 192 points to a low of 24 in Cohort 1 schools, and from a gain of 133 points to a net loss of 18 points in Cohort 2 schools. Taking into account where schools started in their API scores, percentage reductions in the distance between their initial API and the 800 goal ranged from a 51 percent reduction to a 13 percent reduction in Cohort 1 schools and a 41 percent to a -11 percent “reduction” in Cohort 2 schools. Two schools in Cohort 1 made it halfway to their API goal in only 3 years. What is remarkable is that one of these was a Decile 1 school with nearly 400 points separating it from the goal at the outset! Contrast this example of success with the Cohort 2 school that displayed negative growth every year, despite being a higher

Chapter 5. Implementation Years
Evaluation of the Public Schools Accountability Act of 1999 105
performing Decile 5 school at the outset. See Exhibits 5.2 and 5.3 for a summary of these variations.
Based on the growth patterns of each school—as calculated by targets met, API points/distance gained, and longitudinal patterns where available—we categorized each school as experiencing High, Medium-high, or Low levels of progress in student achievement. Exhibit 5.2 displays these categorizations and the data on which we based them. Exhibit 5.3 summarizes the categorizations by cohort.
Exhibit 5.2: Student achievement outcomes for case study schools: Cohorts 1 and 2
CSRD
Met Schoolwide Targets (#
met/# possible)
Met Comparable
Growth Targets (#
met/# possible
Percentage Growth
Towards 800
Longitudinal Achievement
Analysis Pattern
Assessment of Outcomes
Cohort 1
Hillside Elementary 2/3 2/3 51% NA* High
Jefferson Elementary Y 3/3 3/3 51% Increase High
El Madrone Elementary 3/3 2/3 48% Increase High
Churchill Elementary 3/3 3/3 31% Increase High
Bayview Elementary Y 2/3 1/3 25% NA Medium-High
Citrus Valley High Y 1/3 0/3 16% NA Low
Hidalgo Elementary 1/3 1/3 15% Decrease Low
Carver High 2/3 2/3 13% NA Low
Cohort 2
Prospect Elementary Y 2/2 2/2 41% Increase High
Manzanita Elementary 2/2 2/2 37% Increase High
Lincoln Elementary 2/2 2/2 32% No change High
El Puente Elementary 2/2 1/2 26% Increase High
Renaissance Elementary Y 1/2 1/2 18% Decrease Medium-High
Ford Middle Y 0/2 0/2 3% NA Low
Sherman Middle 0/2 0/2 -11% NA Low
* NA = Not Available.

Chapter 5. Implementation Years
106 Evaluation of the Public Schools Accountability Act of 1999
Exhibit 5.3: Summary of outcomes by cohort: Cohorts 1 and 2
Cohort
Cohort 1 Cohort 2
High
4 schools Hillside Elementary Jefferson Elementary Churchill Elementary El Madrone Elementary
4 schools Prospect Elementary Manzanita Elementary Lincoln Elementary El Puente Elementary
8 schools
Medium- High
1 school
Bayview
1 school
Renaissance Elementary 2
schools
Out
com
es
Low 3 schools
Citrus Valley High Hidalgo Elementary Carver High
2 schools Ford Middle Sherman Middle
5 schools
8 schools 7 schools
Relating Outcomes to Coherence
Our last step in this part of the case study analysis was to relate the findings regarding instructional coherence to the findings regarding student outcomes. Were outcomes and coherence correlated? We found they were. (See Exhibit 5.4.)
Coherent program schools: Of the five Cohort 1 schools with coherent instructional programs, two had met all of their schoolwide and subgroup growth targets over the planning and implementation years and had achieved over 30 percent growth towards the API target of 800. Two schools had met the majority of their targets and made significant progress towards the target of 800. One school (the outlier in this analysis) had not met schoolwide and sub-group targets in only one year and had increased only 15 percent towards 800. Of the Cohort 2 schools with coherent instructional programs, we found three schools had met all schoolwide and subgroup targets during the planning year and first year of implementation; the third had met both schoolwide targets but missed one subgroup target. All had made over 20 percent growth towards the target of 800. We concluded that in the main, Cohort 1 and 2 schools that had developed coherent instructional programs had also performed at a high level during their participation in II/USP, making large strides in student achievement.
Incoherent schools: In sharp contrast, of the three case study schools from Cohorts 1 and 2 that lacked a coherent instructional focus, none had met all of its targets, and each made under 20 percent growth towards 800 during the planning and implementation years.
“Conflictual” schools: As discussed above, the remaining four case study schools had mixed levels of coherence in their instructional programs. These schools also were mixed in their student outcomes: two had made vast increases in student achievement—for example, one school’s API score grew by close to 200 points, decreasing the distance between their API score and 800 by half. Others did not make such progress—for example, one school met none of its schoolwide or subgroup targets. We should note here that the two schools that made such substantial gains had each chosen to manage the conflict in instructional program (thus increasing their instructional coherence) by placing clear priority on the district mandated curriculum over their CSRD model.

Chapter 5. Implementation Years
Evaluation of the Public Schools Accountability Act of 1999 107
Exhibit 5.4 summarizes this relationship. Note the more densely populated upper left-hand cell and lower right-hand cell in the resulting 3 X 3 matrix.
Exhibit 5.4: Student outcomes by instructional coherence in Cohort 1 and 2 case study schools
Instructional Coherence
Highly Coherent Conflictual Incoherent
High
Growth
6 schools Hillside Elementary Churchill El Madrone Manzanita Lincoln El Puente
2 schools Jefferson Prospect
0 schools
8 schools
Medium- High
Growth
1 school Bayview
1 school Renaissance
0 schools
2 schools
Out
com
es
Low
Growth
1 school Hidalgo
1 school Ford
3 schools Citrus Valley High Carver High Sherman Middle
5 schools
8 schools 4 schools 3 schools
Survey data
We found some confirmation of the relationship between coherence and student outcomes observed in our case study schools when we examined the data from teacher surveys. To explore this relationship, we created a survey index (α = 0.82) for instructional coherence based on the following questions from the teacher survey:
Do you agree or disagree with each of the following statements? (Scored on a Likert scale coded 1=Strongly Disagree—4= Strongly Agree):
• Student learning goals and targets are clearly defined.
• Our school has clear strategies for improving instruction.
• I receive specific guidance on how to improve instruction in my classroom.
• Teachers in our school are expected to use a common set of teaching methods.
• Goals and priorities for this school are clear.
• Most teachers at this school have values and philosophies of education similar to my own.
• Most of my colleagues share a focus on student learning.

Chapter 5. Implementation Years
108 Evaluation of the Public Schools Accountability Act of 1999
First, within II/USP schools, we found that instructional coherence was well correlated (r >0.3) with several outcomes in the survey for II/USP teachers, including both improved student learning and various aspects of school functioning related to teachers’ motivation and instruction. These teacher-related correlates of instructional coherence included: improved morale, additional teacher effort to improve instruction, improved collaboration between teachers and administrators, and use of assessment data.
With respect to II/USP and comparison schools, we found no significant difference in the level of instructional coherence reported by teachers in the two types of schools. We did find that principals were more likely to report a higher level of instructional coherence than teachers, with a larger percentage agreeing or strongly agreeing on many measures such as: the school has clear strategies for improving instruction, teachers receive specific guidance on how to improve instruction in their classrooms, and goals and priorities for the school are clear.
Contribution of II/USP to Coherence
The analysis lends support to part of the PSAA theory of action—the assumption that schools that have developed a coordinated plan and coherent set of instructional practices are more likely to experience growth in student outcomes. As we stated previously, this relationship is a consistent finding in the literature on effective schools as well.
What, then, of the relationship between II/USP and schools’ success in developing this instructionally coherent program? One would hope that II/USP would contribute to that coherence and to student outcomes in the ways anticipated by the theory of action. Indeed, in a few schools, the policy scenario seems to have played out exactly as hoped.
Consider, for example, Lincoln Elementary School. This Cohort 2 elementary school began II/USP in Decile 2, having shown significant negative growth in 1999-2000 and thus failing to make either its schoolwide or subgroup targets. School staff, though required by their district to participate in II/USP, recognized early the opportunities that the program offered them, and in the planning year took full advantage of those opportunities. Teachers mentioned that II/USP participation had generated high levels of collaboration, including within- and cross-grade planning and sharing of goals and expectations. Staff, administration, and parents were pleased with the two External Evaluators, and they also received additional training and assistance from another support provider during implementation. The school thus had a successful planning year, and implementation of the Action Plan was a focused effort. A 4th grade teacher commented that the external provider:
“helped us tremendously. They’ve helped us focus on different objectives so that all fourth grade classes are dealing with the same thing. They give us time to meet and talk about our results, our challenges, and we get to think of different ways to make it fun for the kids and different ways to help them learn.”
With respect to outcomes, the effects of these efforts built up steam in the planning year, with a gain of 9.4 percent toward the 800 goal, and then shot up even more during implementation. A very large, urban elementary school with 84 percent poverty and over 60 percent English learners, Lincoln met all of its API growth targets (schoolwide and subgroups) during planning and implementation. It has made significant progress towards the target of 800 (decreasing the distance to 800 by 32 percent in just two years). Though teachers report that they still have a long way to go, an outside observer might describe Lincoln as a “poster child” for II/USP.

Chapter 5. Implementation Years
Evaluation of the Public Schools Accountability Act of 1999 109
Not all schools reaped such benefits from II/USP, however. As discussed in Chapter 4, even those that appeared to have a productive planning year were often unable to make their pay off in terms of subsequent instructional change and student achievement. Sherman Middle, also a Cohort 2 school, is an example of this latter group. At this rural middle school, the planning year and stakeholders’ relationship with the External Evaluator were both positive. The group of External Evaluators visited the school a total of 19 times during the school year, meeting with stakeholders and observing classes. The External Evaluators saw their role as facilitating the various focus groups that worked on needs assessment and the Action Plan development. They took a systematic approach to the needs assessment and planning processes— gathering data; looking at successes, problems, and barriers; coming up with solutions and strategies; and considering funds available. Despite this extensive planning, teachers at this school did not think that much had come out of the II/USP process in terms of direct outcomes or results. Despite listing a number of initiatives that did take place as a result of II/USP (the hiring of a half-time science teacher, adoption of new curricula, an after-school program, teacher training in teaching English learners), teachers still reported that they rarely collaborated with each other or had meaningful discussions of curriculum and instruction. From the principal’s perspective, there had been a history of infighting that prevented change. He reported that many of the teachers were not open to change and collaboration, saying, “A lot of teachers are stuck in their room, they do their thing, they do the best they can.” II/USP did not seem to provide a means to develop a strong and cohesive instructional focus, and this school declined significantly in its API score in both years.49
What Facilitates or Impedes the Link Between Instructional Coherence and II/USP?
Based on prior theory and research, the conceptual framework for this evaluation anticipated that the effect of II/USP on instructional change and student achievement would vary considerably among schools. Some of this variation, we posited, would stem from variation in the nature and strength of the strategies adopted by each school. In addition, we argued that the impact of II/USP would be mediated by a number of influences external to the program itself, including district context and initial school capacity. In the sections that follow, we examine those influences. This discussion primarily addresses research question #2: What factors contribute to schools meeting or not meeting growth targets under PSAA? We consider two types of factors in turn:
• Factors related to the intervention strategies themselves (primarily “intervention strength” as defined by Porter et al., 1988)
• Factors external to the II/USP intervention that mediate the impact of those intervention on schools. Specifically, these are district context, internal school capacity and organizational structures, and other implementation constraints.
Intervention Strength
As discussed in Chapter 4, we found that II/USP schools’ primary improvement strategies were instructionally related. These included improving the curriculum, providing improved
49 Survey data provided somewhat more promising evidence overall that II/USP can contribute to the development of a
coherent instructional program. For example, 80 percent of principals (N=82) and 72 percent of teachers (N=326) reported that because of II/USP their school developed a set of goals towards which they will work; 68 percent of principals and 58 percent of teachers reported that teachers at their school were working more collaboratively with each other because of II/USP. One can expect that having clear goals and strong collaboration would both contribute to strong instructional coherence and focus.
Chapter 5. Implementation Years
110 Evaluation of the Public Schools Accountability Act of 1999
professional development and/or coaching, increasing collaboration among teachers, providing extended learning opportunities for low performing or EL students, and implementing more regular assessment/data use.50
Prior research suggests that such instructional interventions vary in their ability to move through layers of implementation to influence what happens at the classroom level. More specifically, Porter and his colleagues (1988) argue that instructional policies and interventions vary along four dimensions, which taken together determine the overall “strength” of that policy or intervention. They term these dimensions prescriptiveness, consistency, authority, and power, and argue that together they help to explain the variable impact of interventions on classroom instruction and student learning. In our conceptual framework (Exhibit 1.7), we hypothesized that strategies adopted by II/USP schools would vary along these same dimensions, and that this variation would help to explain differences in instructional and student outcomes among program participants. Below, we apply the Porter et al. framework to explore the relationship between the improvement strategies in our case study schools and the schools’ level of instructional coherence. Note that we have renamed the dimensions for greater clarity, while maintaining their analytic characteristics. Our re-named dimensions are specificity, consistency, legitimacy, and power.
Specificity. Porter et al. (1988) note that policies and programs vary in their degree of specificity/prescriptiveness. In curriculum policy, for example, broad standards would be less prescriptive than a more elaborated scope and sequence, which would be less prescriptive that a mandated curriculum and instructional materials. In our case study schools, instructional improvement strategies similarly ranged from the implementation of highly specified and prescriptive district-mandated curricula in mathematics and reading (such as Open Court) to sets of vaguely specified and loosely connected activities and/or broad principles of instruction. Although respondents sometimes complained about what they viewed as overly specified curricula, we found that those schools that were most successful in implementing a coherent instructional program had strategies that were at least specified enough to get all teachers on the same page. These strategies included, for example, a common specified curriculum or a prescriptive assessment program. Our “poster child” school described above illustrates this point. Faculty at Lincoln, a Cohort 2 II/USP elementary school that had implemented a district-mandated reading curriculum, maintained that the district mandates around curriculum implementation were “heavy-handed” and that the highly scripted approach was “insulting to teachers with experience and good instructional practices.” There was also some concern about the assessment schedule and the lack of time to reflect on the information. Despite these complaints, Lincoln was successful in meeting all of its targets and closing the distance to the API goal of 800 by a third in only two years. In fact, six of the eight schools we identified as “High Growth” in Exhibits 5.3 and 5.4 had adopted well-specified curricula. In contrast, Ford Middle School had adopted a CSRD model that was primarily a set of instructional principles. Professional development in this model, while directed generally at using state standards, specified neither curricula nor instructional techniques that all teachers—or even specific groups of teachers—would use. This school was less successful in developing a coherent program and demonstrated lower student progress. Similarly, Hidalgo, in Cohort 1, adopted a schoolwide focus on literacy, but did not
50 In only one of our case study schools was something other than instruction a primary target of the improvement
strategies. This school—a large, rural high school—had been contending with severe student climate issues including drugs and gangs. The principal reasoned that in order to reach the point where they could focus on instruction, a safe and orderly climate had to be secured. Interventions related to safety and climate were thus the primary targets. Two other case study schools also focused on climate to some extent, but not as extensively as instruction, which remained their primary focus.

Chapter 5. Implementation Years
Evaluation of the Public Schools Accountability Act of 1999 111
appear to be implementing a common curriculum to operationalize that focus. This school also made significantly less progress in student outcomes.
Consistency. Consistency in instructional strategies takes two primary forms: internal consistency, or coherence within the reform; and external consistency, or consistency with external reform programs and mandates. We found that most schools that successfully developed coherent instructional programs had both internal and external consistency. Two of our CSRD schools were exceptions to this pattern. Each was navigating conflicts between the highly prescriptive and rigidly enforced district literacy curriculum and their more constructivist, arts-based CSRD model. In each case, for the sake of coherence and in response to district accountability and monitoring, these schools opted to place highest priority on the district curriculum. Both were highly successful in raising their students’ scores.
By contrast, four of our case study schools, while avoiding external conflicts, lacked internal coherence within their own reforms and failed to make significant progress in terms of student achievement. One large rural high school, for example, used a homegrown CSRD model designed by the district that had a “hodge-podge” of reform efforts focused on improving climate, aligning curriculum to standards, implementing technology improvements, and increasing staff collegiality, among others. Similarly, the Action Plan for our least successful school—Sherman Middle in Cohort 2—included 35 strategies for teaching, learning, and staff development, and seven strategies around governance. This “laundry list” of actions to address a long list of identified barriers was a challenge for staff to implement. Due to the lack of fit among reform strategies, little instructional coherence resulted in these schools. Interestingly, two of the four schools lacking internal consistency were CSRD schools, despite the emphasis of that program on comprehensive reform.
Legitimacy. Porter et al. (1988) argue that teachers will be more likely to implement instructional reforms that have professional authority behind them. We might look at this dimension as another form of consistency—in this case, consistency with teachers’ beliefs about what constitutes good instructional practice. Our data indicate that perceived professional legitimacy—or lack thereof—influenced the level of instructional coherence at the school site. More specifically, if teachers didn’t see the reforms as professionally authoritative, they were less likely to implement them. In some cases this lack of buy-in was manifested in divisions among the faculty regarding the particular reform strategy. Two of our CSRD schools demonstrate such divisiveness and two different strategies for resolving it. In Ford Middle School, the faculty adopted a technology and project-based CSRD model on the advice of the principal and one other staff member, without knowing much about the nature of the model or its implications for instruction. When, during implementation, faculty found out what was expected of them and that participation was mandatory, a large proportion of them rebelled. In response, the school administration dropped that model and the next year adopted a less specified program that became voluntary—only for new teachers and others who wished to participate. As a result, the CSRD reform group met twice monthly while non-reform group teachers worked independently on class prep or other activities. Instructional coherence was neither evident in this school—nor, we believed, likely to occur under those conditions. Student outcomes were stagnant.
A different scenario developed at Renaissance, a Cohort 2 CSRD elementary school. Renaissance implemented a highly specified CSRD model focused on standards and literacy (both reading and writing) at a time when the faculty was very divided. One group of teachers promoted traditional education methods and structures, while another group promoted and used multi-age grouping with a whole language approach. The divisiveness among the faculty

Chapter 5. Implementation Years
112 Evaluation of the Public Schools Accountability Act of 1999
showed up in the school’s failure to meet either of their API targets for 2001. In this case, the resolution of the conflict took the form of splitting the school into two (catalyzed by district restructuring). The original principal moved to the new school that formed from the split, taking with him the CSRD program and dollars, as well as a hand-picked faculty (both from the original school and newly hired), all of whom were chosen because they believed in the instructional focus of the CSRD model and shared the principal’s same views on instruction. Reports from teachers at this “new” school revealed that there was a high level of buy-in and morale, and all teachers were focused on a common instructional method. The student outcomes that will result from these changes remain to be seen.
Power. According to Porter et al. (1988), implementation of instructional reforms is enhanced through accompanying incentive structures, including sanctions and/or rewards. (Here we are referring to the particular strategies adopted at the school, not the II/USP sanctions, which we address later in this chapter.) One form that “power” took in our case study schools involved the monitoring mechanisms that districts set up to ensure that their mandated curricula were being implemented in the classroom. These mechanisms included not only monitoring visits by district facilitators, but also the required administration and submission of frequent student tests accompanying those curricula. We found that these monitoring mechanisms were salient to school staff and influenced them in their classroom practice. For example, many respondents referred to the literacy “police” who monitored the implementation of the reading curriculum in their district. Schools were held accountable for implementing the curriculum, and teachers often felt the pressures of this system. Another approach to an incentive/monitoring structure occurred in a CSRD elementary school, where the administration, teacher leadership team, CSRD model representative, and most recently parents, conducted “focus walks” to ensure the model was being implemented as planned. This school was making significant progress in its implementation. Many schools that implemented their own reforms separate from district mandates or structured reform models, however, did not have strong incentive structures in place. This lack of power in the reform could be a potential reason for schools not making as much progress in reform as they originally planned for.
Based on these data, we concluded that the dimension of intervention strength did have salience in our case study analysis, and in the direction predicted by the Porter et al. framework.
Other Mediating Influences
In addition to the characteristics of the implementation strategies themselves, as described above, upon close examination of our case study data we found that there were factors often outside of II/USP that mediated the implementation of a coherent instructional focus. Factors both exogenous and endogenous to the school influenced the schools’ ability to effect change. We have identified three primary mediating influences:
• District context
• Mediating factors internal to the school
• Other implementation constraints associated with II/USP

Chapter 5. Implementation Years
Evaluation of the Public Schools Accountability Act of 1999 113
District Context
One of the key findings of this study is that districts matter, both directly and indirectly, in the implementation of II/USP and in the progress schools make towards achievement goals. In all aspects of this study we have found that the district plays an important role in a school’s progress towards improving outcomes. Analyses of statewide achievement data in Chapter 3, for example, revealed that the district effects significantly outweighed, and in some cases may have explained, the effects of II/USP participation. Both the case study and survey data (Chapter 4) revealed that the district played an especially strong role during the first year of II/USP—requiring many schools to apply for II/USP and choosing the External Evaluators for many schools.
Survey data revealed that 76 percent of II/USP teachers and 75 percent of II/USP principals agreed or strongly agreed that the district’s priorities determined the improvement goals in their schools. Data also indicated that districtwide mandated curricula are common among California districts. Approximately four-fifths (86.7 percent) of district respondents (N=155) reported that their district generally requires all schools to use the same state-approved textbook or instructional program in elementary reading/English/language arts. Approximately two-thirds (63.6 percent) reported that the district requires elementary schools to devote an extended block of time to literacy instruction each day. Eighty-seven percent reported a district-mandated textbook or instructional program in mathematics for elementary schools. The percentages were lower for secondary schools; still over half of the respondents reported required programs at that level as well.
In our case study sample, we also found that the district had a strong influence, both positive and negative, on the ability of schools to form a common instructional focus, and thus the ability of schools to make significant progress in improving outcomes. This influence stems from the implementation of a districtwide curricular program or from supports that the central office provided through professional development and technical assistance.
Districtwide curricula As mentioned previously, three of the case study districts (that include 10 of the Cohort 1 and 2 case study schools) had adopted highly specified reading, language arts, and/or mathematics curricula that seemed to be the main guide for instruction and the source for coherence in their schools. These curricula either dictated or took precedence over school-based or CSRD strategies. Often, this was to the benefit of the school, as the common curricular focus provided a basis for collaboration and for consistent instructional experiences for students as they progressed through grades and from one teacher to the next.
In some cases, however, the district-mandated curriculum resulted in a breakdown in the cohesiveness of the school, particularly when a cohesive reform already implemented was not consistent with the externally mandated curriculum. As described earlier, in two of the CSRD elementary schools there was a conflict between the CSRD model and the district-mandated curriculum. In one of these schools, Jefferson Elementary (a Cohort 1 CSRD school), the district was close to forbidding the school to continue implementing its CSRD model because the model conflicted with the district-mandated reading curriculum. The district curriculum was highly prescriptive and focused on basic skills, whereas the CSRD program had a strong constructivist focus. The teachers and leadership team, despite full participation in the CSRD model and in the district curriculum, were also concerned about the lack of alignment between the CSRD model, the reading curriculum, and the state standards. In Prospect Elementary, a Cohort 2 CSRD school, teachers were struggling with the integration between this same CSRD model and the district-mandated reading curriculum, both in various stages
Chapter 5. Implementation Years
114 Evaluation of the Public Schools Accountability Act of 1999
of implementation in the school. Teachers felt that there was too little time in the day to implement both programs.
Our case study data showed that these divergences were not restricted to CSRD schools. In Cesar Elementary, a Cohort 3 school, teachers were struggling with what they viewed as a conflict between the district-mandated curricula and their own reform efforts. The district pressured them to work on the reading curriculum for over two hours per day, which left little time to participate fully in other programs. The staff also felt that teacher morale had been reduced because of the prescriptive district reading curriculum that did not provide room for teaching flexibility or creativity.
District supports The case study data from all 21 schools indicated that support provided by the district during implementation varied along a continuum. The 10 schools that had coherent instructional programs were located in five school districts. Four of these five districts provided support and technical assistance in the form of professional development training and/or funds, instructional facilitators, data support, assistance with standards-based instruction, and curriculum alignment. In two of the districts, the district personnel conducted learning walks and quarterly conversations with school administrators to review data and progress. In the rural district, the county office provided more of this kind of support. Survey respondents also noted the often high level of general support their school districts provided. For example, over half of the surveyed II/USP principals (75.4 percent, N=82), II/USP teachers (75.3 percent, N=326), and External Evaluators (70.1 percent, N=97) reported that they agreed or strongly agreed that district staff provide information and expertise that support the school improvement efforts. In particular, 63.9 percent of External Evaluators reported that the school district had placed a priority on improving and assisting II/USP schools in the district.
Mixed messages District influences did not always derive from clear and specific mandates, however. For example, respondents also reported that districts did not always have clear and consistent goals for school improvement that aligned with state goals. For example, only 41.5 percent of External Evaluators (N=97) agreed that in the district where they conducted most of their work the district leaders share and communicate a common approach to school improvement. A higher percentage of district respondents agreed (89.3 percent); however over half (70.4 percent) reported that multiple accountability systems operating in the state and district cause conflicting requirements and priorities. Somewhat over half (59.1 percent) of II/USP principals (N=82), as opposed to 86.0 percent of comparison principals (N=86), reported that their school district’s instructional policies give schools clear information about what and how to teach. These reports could indicate that the II/USP schools are potentially getting more mixed messages about what programs to use. Schools that adopted their own reform strategies, for example through CSRD, may especially feel that they are receiving mixed messages. Reports from External Evaluators support these data: only 45.3 percent of respondents reported that the school district with which they worked had instructional policies that gave schools clear information about what and how to teach.
Mediating factors Internal to the School
The vast body of literature on policy implementation has long held that local capacity influences local implementation. Similarly, a recent theme in school reform research has been the influence of internal school capacity on instructional improvement and school-level responses to external accountability. Among the central aspects of school capacity discussed in the literature are professional community and collaboration (McLaughlin and Talbert,

Chapter 5. Implementation Years
Evaluation of the Public Schools Accountability Act of 1999 115
1993; Newmann and Wehlage, 1995) and site-based instructional leadership (Elmore, 2000). We found these two aspects of internal capacity, as well as the school structures (particularly the grade levels of the school), all contributed significantly to the ability of our case study schools to develop a coherent instructional focus. In many of our more coherent cases, we found the school started II/USP with relatively high levels of capacity, which allowed them to move forward even if they did not have a successful planning year. In other cases, the capacity may have been acquired through the planning process.
Professional community/initial capacity The conceptual framework in this evaluation posits that an increase in teacher and school capacity will contribute to instructional improvement, which in turn will produce improved student outcomes. A strong professional community, that is, a school with a shared vision that is highly engaged in thinking about instructional practice, builds school cohesiveness and instructional focus. In addition, initial teacher and school capacity to promote student learning contribute to this cohesiveness.
The case study data corroborate this hypothesis. The 10 case study schools that came together around a common curriculum all had moderate to high levels of professional community, either before participation in II/USP or as a result of participation in II/USP.
Hillside Elementary, a Cohort 1 state-funded II/USP school, exemplifies a school with an initially strong professional community for whom II/USP served as a wake-up call and catalyst. Prior to II/USP designation, few teachers and parents realized that their school was not doing particularly well; compared to the rest of the state, they were scoring just under the mean (Decile 4). Yet the data and the designation “underperforming” alerted them to the fact that some students were doing quite poorly academically. II/USP created an awareness in the community that they could not be complacent, and that they needed to address some academic deficits. To aid their new focus, the school already had a strong professional community, and it appeared that this relative cohesion was the base on which II/USP success was grounded. The superintendent emphasized that “two factors for school effectiveness that are consistently in the literature are school leadership and collegiality of staff…They were present at the elementary school.” School level respondents agreed. As a result, teachers were able to successfully utilize professional development from the county office of education, increasing the use and analysis of student data so that they could better tailor their instruction to target students in most need of assistance.
At Churchill Elementary, another Cohort 1 school, the most salient school characteristic to the research team visiting that school was the strength of the professional community. The faculty at Churchill had experienced an increased instructional focus and coordination among staff (both within and between grade levels) over the past two to three years. Teachers indicated repeatedly how much they appreciated the weekly collaboration time and how they felt that they were “all on the same page,” “were all working together in the same direction,” and “had become more focused.” This increase in professional capacity could potentially be attributed to the II/USP process, though it should be noted that when the school started II/USP, they also implemented a new language arts curriculum and hired a Bilingual Coordinator. It was therefore difficult to tease out which of these factors was responsible for the positive changes, as the precondition for the possibility of such positive change seemed to come from the combination of the factors.
In contrast, forming a cohesive faculty that was focused on a common curriculum was a challenge for over half of the case study schools, and especially for the middle and high schools. A prime example of this was Carver High School, a small Cohort 1 high school

Chapter 5. Implementation Years
116 Evaluation of the Public Schools Accountability Act of 1999
where most departments had only one or two teachers. The research team observed the lack of a strong professional community, which was substantiated by more than one teacher’s comments that there was “no sense of collegiality and purpose.” For the most part, teachers did not engage in any discussion of learning, how to work together on curricular issues, planning academics, among other activities. All teachers appeared to be pulling in different directions, except for two English teachers who were trying to ensure some degree of cohesion in the English curriculum. In Sherman Middle School, a small Cohort 2 middle school, teachers also lacked collegiality because many of them worked independently, and they were occupied with administrative tasks that limited the time available for collaboration. Neither of these schools were successful in implementing a coherent instructional focus.
We would expect that increased teacher knowledge and skills would contribute to a higher level of initial school capacity and thus a higher ability to implement reform successfully. None of the schools lacking a cohesive instructional program reported a high level of teacher skill and knowledge. In one of these schools, Carver High School, faculty outwardly acknowledged that many of their colleagues did not have the necessary skills to implement reform and change. One said “they don’t have the horsepower” and another said, “We don’t have the horses…the state protects the weakest of the weak.” This particular school did not make progress towards developing a strong instructional focus. Schools that did form a cohesive instructional program in general reported mixed to high levels of knowledge and skills, indicating that the initial teacher capacity can contribute to success. However, some schools were clearly able to overcome the challenges associated with a faculty mixed in their ability to implement change or in their experience levels.
Leadership Research on the effectiveness of schools and school improvement has indicated that the principal often plays a significant role in facilitating change or improvement. It is evident from the case study schools that instructional leadership was key to the school improvement process in both state-funded II/USP and CSRD schools, whether it was strong leadership from the principal as the sole administrator; an administrative team of a principal and one or more assistant principals; a leadership team composed of teachers, administrators and parents; teacher leaders; and/or resource teachers. All of the schools that had coherent implementation strategies had reportedly strong instructional leadership, and in more than half of the cases the leadership was at least moderately distributed among staff beyond the principal. For example, at Bayview Elementary, a Cohort 1 CSRD school, the principal and the vice principal were viewed together as a leadership unit. Both seemed to be well liked and trusted by the teachers. The vice principal was the administrator who ensured that the CSRD model was being followed properly. On the other hand, at Hidalgo Elementary, a Cohort 1 school, the principal was not the driving force of instruction at the school, but rather the two resource teachers/literacy coaches provided much of the instructional leadership for and support to the teachers. The leadership team substantiated this, stating that, “ultimately the resource teachers are excellent coordinators/captains.”
Two examples demonstrated the strong influence possible from the principal. At Edison, a Cohort 3 middle school, the teachers had been maintaining status quo for several years before the arrival of new leadership. The new principal clearly became the change agent at the school, and the teachers, both the veterans and the new staff, quickly built trust and respect for the new principal. In addition, the principal of Manzanita Elementary, who was an experienced bilingual educator with a doctorate in Education, appeared to be making a difference. The teachers emphasized how dedicated and hard working she was, that she spent time in the classrooms, was focused on data, and was supportive of parents. She also had a
Chapter 5. Implementation Years
Evaluation of the Public Schools Accountability Act of 1999 117
goal of developing teachers into instructional leaders. By all reports, this new leader was a contributing factor in the school meeting its API targets.
The schools that had high principal turnover, leaders who were weak or not focused on instructional practices, or limited trust in the principal among stakeholders were less likely to have implemented a coherent instructional program. For example, at Mann, a small Cohort 3 state-funded II/USP elementary school, the principal, who had been the sole administrator for three years, was overwhelmed and not able to effectively manage all of her responsibilities, which included serving as an instructional leader and a fiscal manager, and looking after buildings and grounds. Other factors contributed to the school’s lack of cohesion, such as high teacher turnover, but the fact that the principal was not managing her workload clearly had an impact on the school.
The survey data, though it confirmed some possible impacts of principal leadership, did not reveal a strong correlation with instructional outcomes. We created a survey index (α = 0.896) for principal instructional leadership based on the following questions from the teacher survey:
The principal in our school…
• Sets high standards for teaching
• Carefully monitors students’ academic progress
• Understands how children learn
• Makes clear to the staff his or her expectations for meeting instructional goals
• Sets high standards for student learning
We found that for the entire sample of teachers (II/USP, comparison, and upper decile schools), the instructional leadership index was well correlated (r >0.3) with schools developing a set of goals towards which they will work, improved morale, decreased staff divisiveness, increased collaboration among teachers and between teachers and administrators. Interestingly, contrary to our case study data, the instructional leadership index did not correlate highly with reports of instructional outcomes such as improved instruction, student learning, or a greater focus on student achievement. It should be noted, however, that this index only accounts for principal leadership, and not for distributed instructional leadership among staff as a whole or among other administrators and coaches.
School structure/Level Supportive structures can be considered a part of school capacity. Our case study data revealed that the structures inherent in the level of schooling (i.e., elementary, middle, and high) facilitated or hindered the ability of the school to form a coherent instructional focus. The case study sample included 15 elementary schools, three middle schools, and three high schools, which reflected the larger number of elementary schools in the state and in II/USP. The curricular programs differed considerably among the grades in these three school levels, and we observed generally more coherent strategies and instructional focus at the elementary level. In fact, out of the four Cohort 1 and 2 middle and high schools in our sample, none had a coherent instructional program. Middle and high school departments and teachers teaching multiple subjects appeared to reduce the likelihood of a focus on a common curriculum and collaboration among the faculty. For example, at El Puente, a Cohort 2 K-8 year-round school, within-grade level teachers met each week to collaborate, but there did not seem to be much communication between the elementary and middle school teachers. At Ford, a Cohort

Chapter 5. Implementation Years
118 Evaluation of the Public Schools Accountability Act of 1999
2 CSRD middle school, there was also not much collaboration across the grade levels, even though the staff and administration felt that it was important. At Sherman Middle, a Cohort 2 II/USP middle school, there was a mix in the teachers’ explanations of their instructional strategies. Some were able to articulate their goals for the class and their students, while one teacher explained: “I don’t have any set strategies…I don’t really think about what I do, I just do it.” This teacher’s words clearly indicated that teachers in this middle school, despite a small faculty size (under 10 teachers), were not focused on the same instructional practices.
Given these patterns, we should not be surprised that the 10 case study schools that had coherent implementation strategies and a common curriculum were all at the elementary level. Common among these schools were collaborative activities that resulted in communication about setting common goals for their students, sharing ideas on practice, and developing grade-level, targeted, unified objectives.
Other Implementation Constraints
In this section, we discuss some additional challenges and barriers that the case study II/USP schools have encountered in their implementation years. We focus primarily on schools in Cohorts 1 and 2, but include some examples of Cohort 3 schools because they are also facing similar challenges at the beginning stages of the implementation process. Survey data substantiate the findings presented below. The observed constraints are at times directly related to II/USP and in other cases are external to the policy, but impact the implementation of the policy, sometimes substantially.
Scarcity of time to implement the improvement strategies The lack of time to implement improvement strategies is a common challenge among II/USP and CSRD schools at all levels. Faculty at Jefferson Elementary, a Cohort 1 CSRD elementary school, felt that there was not enough time to implement reforms fully before another reform was mandated for the schools (they had been engaged in reform and improvement activities for a number of years). The teachers were concerned that they “did not have time to get experienced at one program before another was put in place.” At Liberty Elementary, a Cohort 3 school, teachers were overwhelmed and under pressure, and they did not have enough time to implement the changes and to analyze student data. One teacher expressed, “They keep putting more and more on and don’t take anything away.” Another teacher felt that they had “no chance to assimilate everything.”
One unique case study school, in particular, felt the press of time to implement its CSRD model. Renaissance was essentially a new K-8 school created by a break-up of the student body of an elementary school in the same district that was initially a Cohort 2 CSRD school. When the new school was formed, in the second year of CSRD implementation, it inherited the II/USP status and took the CSRD funds and program along with the former principal, 10 teachers selected by the principal, and 20 to 30 percent of the students from the elementary school. The school was officially in its second year of implementation, but they were really starting anew with a new group of teachers and students, and class enrollments were inconsistent. They were implementing the first two years of the CSRD model in one year. The principal told us he saw the current year as a “planning year, so don’t expect miracles.” This time pressure had resulted in many of the teachers feeling overwhelmed by the amount of work they had to complete. The principal found it difficult to be an instructional leader because he had to fill the role of manager in getting the school up and running, and they were in the process of building up resource materials. As the school had been in operation for less than a year in the winter of 2003, the concept of growth targets was meaningless since the school did not have a baseline from which to work.
Chapter 5. Implementation Years
Evaluation of the Public Schools Accountability Act of 1999 119
Lack of follow-through and assistance in Years 2 and 3 Administrators, faculty, and External Evaluators at II/USP schools spent a lot of effort developing an Action Plan of targeted improvement strategies, and in at least three of the Cohort 1 and 2 schools it was a challenge for them to follow through with all of their goals. For example, at El Madrone Elementary, a Cohort 1 school that had three different External Evaluators and two Action Plans, almost all of the teachers interviewed could not remember what areas or strategies of improvement were in the Action Plan. At Sherman Middle, a Cohort 2 school, there was a lack of follow-through for some of the improvement strategies from the long list included in the Action Plan. The principal commented that completing everything in the Action Plan was a challenge, and he did not realize that he was supposed to write reports every few months as part of the follow-through process. At Carver High, a Cohort 1 high school, the teachers cited a lack of follow-through during the whole process. A teacher commented, “Once you get a program started and there is no follow-through, no one else wants to do it.”
An underlying assumption of this policy is that low-performing schools lack the capacity to change on their own and need assistance. However, the policy only requires external assistance in the planning year. Interviews with staff suggested to us that where there was no high-quality external assistance built into the II/USP implementation process (by the school or district), schools were likely to experience more problems in implementation. For example, at Sherman Middle, a Cohort 2 school that was struggling and not able to improve student outcomes, the principal realized that it would have been worthwhile to have the External Evaluators return to provide recommendations for next steps. On the other hand, Lincoln Elementary, also a Cohort 2 school, was required by the district to hire an external coach to assist with implementation. Teachers praised the consultants’ role during implementation. At Mann, a member of the External Evaluating team stayed on to assist with implementation. The principal stated that she appreciates his assistance because “it is really hard to stay focused…He has been beneficial. Having another person to help me stay on what we said we were going to do [has been beneficial].” Teachers expressed similar sentiments.
The survey data support a finding of limited implementation support. Of the principals surveyed, 77 percent said they had received either no follow-up or only limited follow-up from their External Evaluators during implementation. Meanwhile, 63 percent of External Evaluators responded that confining the External Evaluator’s role to the first (planning) year of II/USP was not useful.
CSRD schools appear to differ from state-funded schools with respect to implementation assistance, perhaps because the CSRD program requires continued assistance from model providers as a condition of funding. The primary areas in which model providers provided a moderate or substantial amount of assistance, according to surveyed principals, were as follows. (Percentages in parentheses indicate the percentage of principals reporting that the model provider provided moderate or substantial assistance in that area (N=39).
• Observed instruction and provided feedback to the teachers and/or principal (77.3 percent)
• Suggested specific strategies to address our needs (75.2 percent)
• Facilitated discussions among school staff about school improvement strategies (78.0 percent)
Among the most useful types of assistance provided by the model providers, according to principals from CSRD schools, were:

Chapter 5. Implementation Years
120 Evaluation of the Public Schools Accountability Act of 1999
• Specific timelines and milestones for what their school should be doing or have accomplished in each year of implementation (87.8 percent)
• On-site assistance (78.9 percent)
• Institutes, workshops, or conferences (81.5 percent)
Principals, in general, spoke favorably of the model providers, with 88.1 percent agreeing or strongly agreeing that the model provider understands issues faced by schools like theirs, 73.0 percent agreeing or strongly agreeing that the model provider established a good rapport with the faculty and staff, and 82.6 percent reporting that the model provider was a highly competent trainer or coach. Nearly three-quarters (71.4 percent) agreed that the model provider fulfilled the school’s expectations for his/her role.
Late or inappropriate dispersal of funds School administrators in at least three case study schools reported that they expected II/USP funds in the fall and often did not receive a disbursement until October or November, and even as late as January. Failure to receive their monies by the beginning of the school year, they said, undermined the integrity of their Action Plan. One administrator explained that if a school used outside providers, the school could lose those providers when funds did not get transmitted on time. Late dispersal could also put school administrators in the mindset that they did not have to implement their Action Plan because the II/USP program was already not working. At one Cohort 3 II/USP elementary school, the leadership team reported that they were uncertain whether the school would receive their second year of II/USP funding, i.e., the funding was not guaranteed. At a Cohort 1 II/USP elementary school they did not receive their funds until November, and they were unable to implement the Action Plan strategies as intended. The principal stated: “Our plan was no longer our plan. It totally threw us off…it was very frustrating.” Since the monies needed to be spent by April, the school veered from its plan and used its II/USP funds to buy computers, computer programs, and library books.
One district administrator clearly stated the implications that late funding had in his district. In the first year, the district provided funds up front for schools to spend, with the assumption that funds would arrive from the state later in the year. This was difficult to do in later years, however, since there were so many more schools in the district participating in the program. He explained that some schools (particularly Cohort 1 schools that were granted an additional year’s funding for the 2002-03 school year) did not receive money until the spring, and most schools did not receive funding until January. He was concerned also about the requirement that schools spend the money by the end of the school year considering they received it so late in the year. This was particularly problematic for year-round schools that started their academic year in early July. This administrator argued that there was “no excuse” for these funds to arrive so late and that it is not reasonable to expect an improvement when they do not have funds until midway through the year.
The special concern of year-round schools was corroborated by Camino, a year-round elementary school in Cohort 3, visited in spring 2002. Respondents at this school reported that being a year-round school was particularly difficult given the timing of the funds. Camino’s problem was exacerbated because the district offices closed during the summer, including the textbook warehouse and other facilities. If teachers wanted to take students on field trips during the summer track, they needed to reserve buses months in advance during the “regular” school year. These processes in general hindered the ability of some schools to implement their plans.
Chapter 5. Implementation Years
Evaluation of the Public Schools Accountability Act of 1999 121
Geographic Isolation Geographic isolation was also a challenge for several schools in three case study districts. Two of the case study schools, a Cohort 3 II/USP middle school and a Cohort 1 CSRD elementary school, were in a district in a mid-sized city that is geographically isolated and economically depressed. Bayview Elementary originally served a military base until the base closed a few years ago, and the elementary school was a “spill over” school for the rest of the district. The dramatic population change had resulted in 95 percent of the students being bused to the school. All of the elementary school-level respondents suggested that the biggest challenges that the school faced were isolation and lack of community. Many of the parents had no form of transportation, and parental involvement was almost non-existent. The students were not from the same geographic neighborhoods, and teachers commented that this led to their behavior problems. At the middle school, the lack of credentialed teachers and teacher turnover were also problems. Hence, the students were “severely educationally deprived” due to this lack of consistency and credentials, according to one teacher.
Citrus Valley, a large, rural Cohort 1 CSRD high school, served a migrant population, and itinerancy at the school, its district, and neighboring districts is quite high. The school’s administrators were frustrated with API-related classifications and argued that the population that they served was both disadvantaged and highly itinerant, making progress—especially at the high school level—quite difficult.
One of the case study districts is in a small, rural and isolated town. This town has been small and homogeneous for a long time, and was only recently starting to change. The characteristics of the town—small, socioeconomically divided with a small group of wealthy rice farmers and a much larger, diverse group of lower-income families, and isolated—impacted the schools. It appears that there was not much going on in town so the school system was the main focus of attention, and many aspects of schooling, from the trivial to the substantive, became the subject of politicized scrutiny. More than one respondent alluded to the perception that the town and its schools were “in another era” or “30 years behind the rest of the country.” Implementing the state content standards was not a high priority, there was a focus on sports and the agriculture program, especially at the high school, and parental pressure to keep homework reasonable.
Limited parent involvement Parent involvement is an area of continued concern at low-performing schools, and at least half of the case study schools emphasized increased parent involvement as an improvement strategy in the Action Plan or CSRD model. At Cesar, a Cohort 3 II/USP elementary school, teachers faced challenges associated with high poverty and single parent families. However, the teachers did not seem to blame the community, or use it as an excuse for the problems of the school. Rather, they seemed to sympathize with the families, as one teacher expressed: “for many of the parents, their whole energy is taken up with putting food on the table, roof over their heads…”
At another Cohort 3 II/USP school, school administrators and teachers stated that parents were not involved with the school, and that only a small core group of parents had participated in school meetings. Teachers expressed frustration that parents had not been held accountable, that they did not communicate with teachers, they did not read to children, they did not make sure students finish their homework, and that they did not value education. Teachers felt that the low achievement of students cannot be remedied unless parents get involved in the II/USP process. Some schools had community outreach programs that bridged the gap between the school and home.

Chapter 5. Implementation Years
122 Evaluation of the Public Schools Accountability Act of 1999
The rural schools in the case study sample faced unique challenges in implementing the various components of II/USP that are of a different nature than the urban schools in the sample. Although low parental involvement, overworked and poorly educated parents were also found in the schools in city centers, the faculty in rural schools noted that the family background of some of their students was a challenge. A teacher at one of the rural high schools where the parents are migrant farmers expressed that her students’ parents “work in the fields, and they are exhausted by the end of the day, so they don’t have the time and energy to get involved.”
In sum, our case study and survey data suggest that the ability of II/USP schools to effect instructional coherence and increase student achievement was mediated by a variety of factors, including the nature of the improvement strategies selected by the school, internal school capacity, district context, and several other implementation constraints. We turn now to another aspect of the PSAA theory of action: the assumption that the threat of future sanctions will help motivate effort and improve performance in low performing schools.
II/USP Sanctions and Motivation to Improve
An important provision of the II/USP policy is the threat of sanctions should II/USP schools fail to improve. As shown in the theory of action, the threat of sanctions is expected to lead to greater motivation to improve student achievement. However, for this mechanism to work, the sanctions must be salient to school staff—staff must be both aware of the potential for sanctions and believe that the sanctions would occur if they do not improve.
Awareness and Acceptance of Potential Sanctions
Our case study and survey data demonstrated that there was a general awareness of the potential for sanctions, and that there were initial expectations that sanctions could occur. For example, we asked survey respondents whether they initially expected that II/USP would open their school to additional sanctions if they don’t improve. High percentages of II/USP principals (72.1 percent) and teachers (76.9 percent) did expect that their participation would open up their school to sanctions. In interviews, respondents noted that they had heard of the potential sanctions, with some teachers expressing that the punitive measures were disheartening. For example, at one school, several teachers reported that they thought that a reward program would be better than a “punitive measure focusing on punitive results.”
In addition, surveyed principals and teachers were asked if they thought that the concept of sanctioning schools was a valid one, i.e., if sanctioning schools will potentially result in school improvement. A higher percentage of II/USP participants agreed that it would, compared to principals and teachers in similar non-II/USP schools. Fifty percent of II/USP teachers and 43 percent of II/USP principals agreed or strongly agreed that “California’s policy of identifying, assisting, and sanctioning low performing schools is likely to help them improve,” whereas only 36 percent of comparison teachers and 43 percent of comparison principals agreed or strongly agreed with this statement. This indicates that there is some level of buy-in among II/USP schools that the threat of sanctions provides the motivation to improve.
In two Cohort 2 schools (Lincoln and Prospect), however, the threats were clear and in some cases disturbing to teachers. Teachers at one of these schools felt that the program would be better with positive incentives (such as rewards), and said that the threat made them feel like
Chapter 5. Implementation Years
Evaluation of the Public Schools Accountability Act of 1999 123
they were “doing everything wrong.” There did not seem to be a relationship between an increased awareness of sanctions and an increased focus in the school or improved outcomes.
Perceived Likelihood of Sanctions
In addition to variation in acceptance of the sanctions, we found substantial variation in respondents’ beliefs as to whether those sanctions would actually occur. This held true even among schools in their final year of implementation, though it differed somewhat by locale (particularly between rural and urban schools), and by school role (administrators vs. teachers). In addition, Cohort 1 CSRD schools did not typically view themselves as associated with II/USP, and therefore did not necessarily view sanctions as a potential outcome of their program.
In six case study schools, teachers openly expressed their disbelief that sanctions would be imposed. In three Cohort 1 schools (Hillside Elementary, Carver High, and Hidalgo) and three Cohort 2 schools (Sherman Middle, Manzanita, and Ford Middle), the sanctions were clearly not salient or believed by teachers. For example, teachers at Hillside Elementary and Carver High viewed the policy environment as one that is in flux, and believed the policies could easily change and the sanctions provision could be removed. At Carver High, teachers had heard that only a handful of schools would be taken over by the state. At Manzanita Elementary, the principal reported that when she talked with teachers about the potential for state-takeover, she found that “most of them did not take that very seriously, because they said, ‘they’ll never do it, they never do it.’ There have been threats like that before, it never happens.”
In several cases we found a higher level of saliency among principals. In three out of the six schools mentioned above where the sanctions were not particularly salient to teachers, the principals expressed greater concern. For example at Sherman Middle, the principal reported that he believed there would be sanctions and hoped that the “sanctions are strong and realistic.” At Hidalgo, the principal was quite concerned about the sanctions and was glad that his school had met its growth targets. In contrast, at Ford Middle, the sanctions were salient for neither the principal nor the staff. The principal commented that there are a lot of schools that are much lower performing than Ford (which is a Decile 3 school).
Overall, the sanctions seemed to be somewhat less salient in the rural schools than in the urban schools. At a rural middle school, four out of five teachers did not think the sanctions would occur, or were not sure what would happen. One teacher, for example, had heard of potential state take-over of schools and said, “I think it’s a bluff. Because 1) going through the legalities of it, firing the staff, it would take years to go through the courts to finally be able to do that, it just wouldn’t happen. 2) where’s the proof that some politician can do what someone who has been in education all his life wasn’t able to do.”
Survey data revealed a potential explanation for the mixed saliency observed in the case study schools. Despite the high percentage of respondents reporting that they initially expected that II/USP would open their school to sanctions, only 20.3 percent of principals and 19.6 percent of teachers reported that this expectation has been fulfilled with II/USP. When examined in greater detail, we found that the most severe sanctions (e.g., school takeover or closure, or the firing of staff or administrators) were in general not highly expected by participants in II/USP. As shown in Exhibit 5.5, less than half of the surveyed teachers participating in II/USP expected that severe sanctions would ensue. A higher percentage expected the less severe sanctions such as a public hearing or the assignment of an assistance team. Principals were slightly more expectant of highly severe sanctions,
Chapter 5. Implementation Years
124 Evaluation of the Public Schools Accountability Act of 1999
particularly the possibility that he/she would be transferred to another school or that teachers would be transferred.
Surveyed External Evaluators and district administrators reported similar expectations as teachers with regard to the possibility of sanctions. Only 18.4 percent of External Evaluators and 23.3 percent of district administrators expected that teachers were likely to be transferred, and 43.7 percent of External Evaluators and 35.2 percent of district administrators reported that the principal is likely to be transferred. Only 14.4 percent of External Evaluators and 10.5 percent of district administrators thought the state or district was likely to take over the school.51
In summary, we found that although school staff and other stakeholders were generally aware of the potential for sanctions, many teachers did not believe that severe sanctions would actually occur if they did not meet their growth targets. According to survey data, teachers and principals believed that less severe sanctions, such as a team visiting their school to provide assistance, were more likely than severe sanctions such as a state-takeover. There is, therefore, little indication that the severe sanctions are a salient motivating force in the schools.
51 District administrators were only asked about the state taking over the school.
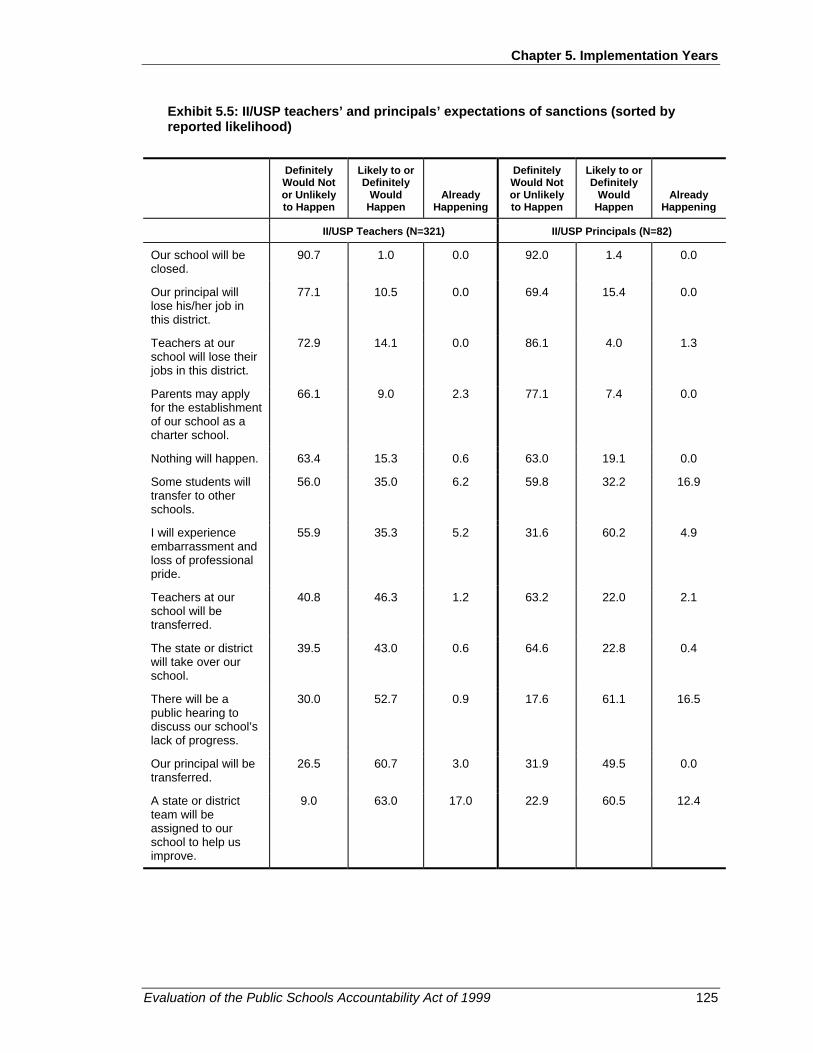
Chapter 5. Implementation Years
Evaluation of the Public Schools Accountability Act of 1999 125
Exhibit 5.5: II/USP teachers’ and principals’ expectations of sanctions (sorted by reported likelihood)
Definitely
Would Not or Unlikely to Happen
Likely to or Definitely
Would Happen
Already Happening
Definitely Would Not or Unlikely to Happen
Likely to or Definitely
Would Happen
Already Happening
II/USP Teachers (N=321) II/USP Principals (N=82)
Our school will be closed.
90.7 1.0 0.0 92.0 1.4 0.0
Our principal will lose his/her job in this district.
77.1 10.5 0.0 69.4 15.4 0.0
Teachers at our school will lose their jobs in this district.
72.9 14.1 0.0 86.1 4.0 1.3
Parents may apply for the establishment of our school as a charter school.
66.1 9.0 2.3 77.1 7.4 0.0
Nothing will happen. 63.4 15.3 0.6 63.0 19.1 0.0
Some students will transfer to other schools.
56.0 35.0 6.2 59.8 32.2 16.9
I will experience embarrassment and loss of professional pride.
55.9 35.3 5.2 31.6 60.2 4.9
Teachers at our school will be transferred.
40.8 46.3 1.2 63.2 22.0 2.1
The state or district will take over our school.
39.5 43.0 0.6
64.6 22.8 0.4
There will be a public hearing to discuss our school’s lack of progress.
30.0 52.7 0.9 17.6 61.1 16.5
Our principal will be transferred.
26.5 60.7 3.0 31.9 49.5 0.0
A state or district team will be assigned to our school to help us improve.
9.0 63.0 17.0 22.9 60.5 12.4

Chapter 5. Implementation Years
126 Evaluation of the Public Schools Accountability Act of 1999
Resource Allocation
This section address the ways in which II/USP and CSRD schools spent their program funds and what they gained from them.
Implementation Activities Supported by II/USP Funds
We analyzed the survey expenditure data from principals to examine the ways in which they utilized the II/USP and CSRD funds during the implementation years. Below we examine the state-funded II/USP schools, excluding CSRD schools since those schools spent a considerable portion of their money on a comprehensive school reform model provider. As Exhibit 5.6 shows below, in the two years of implementation, the highest percentage of dollars went to additional instructional personnel, and the second highest percentage went to instructional materials. These allocations are consistent with the emphasis on instructionally related strategies in school improvement efforts reported in Chapter 4.
Exhibit 5.6: Average percent of II/USP funds (excluding CSRD) spent on each category*
Planning Year (N=30)
First Year Implementation
(N=42)
Second Year Implementation
(N=31) External Evaluator 60.0 % 7.9 % 6.0 %
Additional instructional personnel (salaries) 13.9 % 30.1 % 29.9 %
Instructional materials (textbooks, curriculum, etc.) 3.6 % 13.0 % 16.3 %
Technology (hardware or software) 1.9 % 9.1 % 4.7 %
Comprehensive school reform model provider 2.4 % 5.5 % 5.0 %
Other professional development providers 4.0 % 4.6 % 5.0 %
Leadership training 2.5 % 1.6 % 1.8 %
Release time for teachers to participate in professional development 5.8 % 6.8 % 6.2 %
Support personnel (non-instructional) 1.9 % 3.9 % 5.8 %
Additional instructional time (before or after school, Saturdays) 1.2 % 2.5 % 1.7 %
Parent involvement activities 1.3 % 3.5 % 3.6 %
Facilities 1.0 % 1.2 % 0.7 %
Other 0.6 % 10.4 % 13.3 %
Total 100.0 % 100.0 % 100.0 % *82 II/USP and CSRD surveys were received
We then examined the data by cohort. The only significant difference (p<0.05) in the first implementation year was in the percentage of money spent on instructional materials between Cohort 2 (17.1 percent) and Cohort 3 (7.5 percent). All other differences were non-significant. In the second implementation year, Cohort 1 spent a significantly (p<0.05) larger percentage of funds (4.0 percent) on additional instructional time than did Cohort 2 (0.0 percent).

Chapter 5. Implementation Years
Evaluation of the Public Schools Accountability Act of 1999 127
Next we examined differences in the spending of schools funded with state funds, compared to schools funded with federal CSRD funds (see Exhibit 5.7). As expected, CSRD schools spent a significantly (p<0.05) larger percentage of funds on CSRD model providers. They also spent somewhat more on support personnel and somewhat less on professional development—both providers and release time – however, these differences were non-significant.
Exhibit 5.7: Average percent of II/USP funds spent on each category, by funding source
State-funded
II/USP First Year Implementation
(N=42)
CSRD First Year
Implementation (N = 16)
State-funded II/USP Second
Year Implementation
(N=31)
CSRD Second Year
Implementation (N =13)
External Evaluator 7.9 % 5.1 % 6.0 % 3.0 %
Additional instructional personnel (salaries) 30.1 % 23.2 % 29.9 % 29.5 %
Instructional materials (textbooks, curriculum, etc.) 13.0 % 15.6 % 16.3 % 16.4 %
Technology (hardware or software) 9.1 % 3.5 % 4.7 % 3.6 %
Comprehensive school reform model provider 5.5 % 21.7 % 5.0 % 20.1 %
Other professional development providers 4.6 % 2.1 % 5.0 % 3.3 %
Leadership training 1.6 % 2.4 % 1.8 % 1.4 %
Release time for teachers to participate in professional development
6.8 % 3.6 % 6.2 % 3.7 %
Support personnel (non-instructional) 3.9 % 10.7 % 5.8 % 9.1 %
Additional instructional time (before or after school, Saturdays) 2.5 % 4.0 % 1.7 % 0.5 %
Parent involvement activities 3.5 % 5.9 % 3.6 % 5.9 %
Facilities 1.2 % 0.0 % 0.7 % 0.6 %
Other 10.4 % 2.2 % 13.3 % 2.8 %
Total 100.0 % 100.0 % 100.0 % 100.0 %
There were mixed reports on the adequacy of the implementation funds for school improvement. While 70.5 percent of External Evaluators thought the implementation resources were adequate or more than adequate, only 20.4 percent of district administrators reported as such.

Chapter 5. Implementation Years
128 Evaluation of the Public Schools Accountability Act of 1999
Matching Funds
For participation in II/USP schools must provide funds to match the II/USP grants. Case study respondents in general did not report that finding matching funds was problematic. However, in a few case study schools (clustered in one rural case study district), due to fiscal constraints throughout the district, finding matching funds was a significant challenge. When principal survey respondents were asked how difficult it was to obtain matching funds for their II/USP/CSRD grants, the majority of respondents reported that it was not difficult (see Exhibit 5.8).
Exhibit 5.8: Difficulty in obtaining matching funds
All II/USP and CSRD schools* (N=74)
Extremely difficult 1.2 %
Moderately difficult 25.1 %
Slightly difficult 22.1 %
Not difficult 51.7 % *82 II/USP and CSRD surveys were received.
Over three-quarters of II/USP schools (84.4 percent), including CSRD schools, reported that they obtained the matching funds through Title 1 funds. Approximately two-thirds (61.6 percent) reported using district funds, and 33.7 percent reported using other funds. This breakdown was fairly consistent across cohorts and across funding source (CSRD vs. state-funded grants).
Sufficiency of Resources
Sufficient resources, both human and material, enable low performing schools to accomplish some objectives that they would not have been able to do without the resources. An underlying assumption is that resource-rich schools are likely to be more successful. At least five of the case study schools faced challenges due to their lack of resources. At Manzanita Elementary, a Cohort 2 school, for example, classrooms were in poor condition, and funds had been cut back for basic supplies, conferences, and translators. The special education teacher explained that she did not always get the instructional materials that the regular teachers received. They also had limited availability of instructional aides. At Ford, a Cohort 2 CSRD middle school, despite the appearance of sufficient resources (they were located on a large campus with newly painted buildings), teachers reported that they had to buy their own paper and supplies for the classroom due to a district budget freeze.
Obtaining sufficient resources in small rural schools and districts was particularly challenging. In one of the rural high schools, the enrollment was under 300 students so the per pupil funding formulae for II/USP (although there is a minimum of $50,000) did not necessarily provide enough money for sufficient support and resource staff for students. An elementary school teacher in this rural district expressed this sentiment:
“I think some of it is that we are such a small district and not a lot of funding… when there are children in need there are not a lot of resources...

Chapter 5. Implementation Years
Evaluation of the Public Schools Accountability Act of 1999 129
we don’t have manpower. On occasion I know we’ve had some special needs kids and the county has come in, but you’re more or less on your own.”
The district also did not necessarily have funds available to hire additional full-time support for special needs students. In one of the rural schools, the library was closed because they did not have a full-time librarian, and they did not have enough funds to hire someone to run the new computer lab. Literacy or math coaches were common in urban schools, whereas in the rural schools they did not have the resources to cover the salaries of these kinds of specialists. Limitations in facilities were also apparent in the rural schools, such as not having enough classrooms and storage space for P.E. equipment and musical instruments.
Opportunities Provided by II/USP Funds
An important question for state policymakers is: what is the value added by state investment in II/USP? One answer to that question derives from the bottom line result: student achievement (Research Question 4). Another answer lies in determining what schools are able to do because of their II/USP funding that they couldn’t have done otherwise.
Principal survey respondents were asked what II/USP funds allowed their schools to do that they otherwise could not have done. Over 50 percent of respondents answered “yes” for four out of the seven choices provided on the survey (see Exhibit 5.9). These included:
• Improve the quality of teachers (82.9 percent)
• Upgrade the curriculum (73.9 percent)
• Provide additional instruction time for low-achieving students (69.5 percent)
• Upgrade the technology (56.6 percent)
The first three activities closely align with the improvement strategies observed during case study site visits, the improvement priorities that principals reported through the surveys, and the ways in which surveyed principals reported spending their II/USP funds during the implementation years. As reported in Chapter 4, professional development, curricular improvements, and extended learning opportunities were all top priorities among II/USP schools. A significantly higher percentage of Cohort 2 respondents (compared to Cohort 1 and 3) reported that the funds allowed them to upgrade the curriculum; and a significantly higher percentage of Cohort 2 respondents (compared to Cohort 1) reported that the funds allowed them to upgrade the technology. There were no significant differences between respondents from CSRD schools and those from state-funded II/USP schools. Technology was not mentioned as often in the case studies or as improvement strategies in the survey. However, one may expect technology upgrades to accompany curricular improvements and the implementation of regular assessments, both of which were top priorities in schools.

Chapter 5. Implementation Years
130 Evaluation of the Public Schools Accountability Act of 1999
Exhibit 5.9: What II/USP and CSRD funds allowed schools to do that they otherwise could not have done*
All II/USP and CSRD Schools**
(N=77)
Improve the quality of the teachers 82.9 %
Upgrade the curriculum 73.9 %
Provide additional instructional time for low achieving students 69.5 %
Upgrade the technology (both hardware and software) 56.5 %
Increase parental involvement 45.7 %
Reduce class size 15.6 %
Other 22.9 % *Schools could select multiple categories. **82 II/USP and CSRD surveys were received.
Though we found that some schools with insufficient resources were still able to develop a cohesive instructional program that resulted in strong student improvement, the additional challenges associated with these schools were apparent. Many schools in particular were concerned about what they will do after the II/USP funding ends, since many resource challenges were alleviated by the influx of funds from this program.
Summary and Conclusions
This chapter presented findings from analysis of case study and survey data regarding the implementation and results of II/USP in Years 2 and 3 of the program. Our purpose was to investigate variation in outcomes and practices among II/USP schools in order to identify factors that facilitated or hindered the success of those schools. We organized our findings into three main areas: the contributions of II/USP to instructional coherence (and through instructional coherence to student outcomes); the salience of the II/USP incentives (i.e., threatened sanctions) for motivating change; and the use of II/USP dollars. We briefly summarize those findings below.
Instructional coherence
1. We find a strong relationship in our case study schools between the presence of a coherent instructional program and improvements in student achievement outcomes—that is, those schools with more coherent programs also demonstrated greater and more consistent gains in student test scores.
2. The contribution of II/USP to instructional coherence and thus to student outcomes was mediated by factors internal and external to the school, including:
• The overall “strength” of the improvement strategies themselves (vis a vis specificity, consistency, legitimacy and power)
• District context (primarily curricular policies and instructional support)

Chapter 5. Implementation Years
Evaluation of the Public Schools Accountability Act of 1999 131
• Internal capacity of the school (professional community and leadership)
• Level of schooling (elementary, middle, and high—with elementary schools being most amenably structured to facilitate instructional coherence).
3. A major finding in all aspects of this study is the important role that districts play in determining the direction and success of II/USP and II/USP-eligible schools—from application requirements and selection, to support in all phases of planning and implementation, to external policies that serve to reinforce or hinder implementation of II/USP strategies.
4. In addition, several issues related to II/USP implementation at the state level affected local implementation, including the lateness or inappropriate timing in the dispersal of funds and the lack of specificity regarding implementation assistance and monitoring in years 2 and 3.
Sanctions
5. Overall, we find the threatened severe sanctions to have little salience for school personnel. Stakeholders were more inclined to view less severe sanctions (such as a team assigned to assist their school) to be more likely to occur if they did not meet their growth targets.
Resources
6. II/USP schools spent their money primarily on instructionally related strategies, for example to hire additional instructional personnel and purchase instructional materials. CSRD schools spent a larger portion of their funds on a comprehensive school reform model provider.
7. Principals reported that II/USP funds provided opportunities for schools to improve the quality of teachers, upgrade the curriculum, provide additional instructional time, and upgrade the technology. These funds were particularly helpful for schools that lacked sufficient basic resources for instruction.
What do we make of these patterns and influences in the implementation of II/USP in Years 2 and 3 of the program? We would argue, based on these findings, that the central reason there is so much variation, such strong district influence in Years 2 and 3, and so little overall impact of the II/USP “treatment” is that there is, in fact, no discernible II/USP treatment after Year 1, other than the dispersal of additional discretionary funds to selected schools. With no required assistance or regular monitoring of the Action Plan implementation, schools are left on their own to navigate the reform terrain. In some districts, the central office stepped in with a broader (often more specified and powerful) reform effort directed at all—or at least all low performing—schools. These district efforts, when required and prescriptive, not surprisingly superceded whatever school-level plans had been made. Where the district reforms were strong, schools were often positively affected. Where they were weak, school improvement was often constrained by the limitations of internal capacity that had probably contributed to low performance in the first place.
In Chapter 7, we consider the implications of these findings for the design and implementation of future accountability and assistance efforts for low performing schools.

Chapter 5. Implementation Years
132 Evaluation of the Public Schools Accountability Act of 1999

Evaluation of the Public Schools Accountability Act of 1999 133
Chapter 6. Governor’s Performance Award
Introduction
In addition to evaluating the implementation and effects of the II/USP program, AIR was also charged with evaluating the Governor’s Performance Award (GPA) program. As explained in Chapter 1 of this report, the High Achieving/Improving Schools Program established the GPA as a reward for schools that met both their schoolwide API growth targets and their comparable growth targets, while also meeting criteria regarding participation rates. Qualifying schools received their first awards (based on scores in 2000) in February 2001. The second award cycle was delayed, due to state budgetary constraints, with the result that schools did not receive awards for meeting their 2001 targets until August 2002. Because award receipt occurred after our final year of achievement data, we do not include the second round of GPA in these analyses. No awards are scheduled for 2002 and 2003 targets because of the state budget shortfall.
Not only the timing, but also the amount of the GPAs varied in the two years of the program. The PSAA legislation limits the GPA to $150 per pupil, subject to available funds, but in neither of the two years of the program did award levels reach this high. The per-pupil award in the first year was $70, and in the second year it dropped to $36. Recipient schools have full discretion on the use of the awards, subject to approval of the local governing boards. Schools may continue to receive awards if they fulfill the award criteria in subsequent years.
Exhibit 6.1-a displays the distribution of GPA awards across cohorts and school levels in 2001 (for meeting 2000 targets). Exhibit 6.1-b displays the percentage of total schools earning GPA awards for each level.
We organize the remainder of this chapter into four sections. The first section presents results of our analyses regarding the effect of the GPA program on student achievement trends. We then discuss the observed lack of award effect in light of the case study and survey data, focusing on the salience of the award program for school-level personnel. Section 3 provides descriptive data on how recipient schools spent their reward monies, and the final section summarizes the findings and their implications.

Chapter 6. Governor’s Performance Award
134 Evaluation of the Public Schools Accountability Act of 1999
Exhibit 6.1-a: Percent distribution of schools earning GPAs for the 1999-2000 school year, by decile and level
Decile Elementary Middle High K-12
1 9.0% 8.5% 9.0% 33.3%
2 9.5% 7.0% 7.0%
3 9.6% 7.8% 9.0%
4 9.6% 10.5% 9.3% 22.2%
5 9.8% 8.6% 8.7% 22.2%
6 9.7% 9.9% 10.3% 11.1%
7 10.0% 10.0% 12.5% 11.1%
8 10.2% 12.7% 10.3%
9 10.7% 11.6% 9.6%
10 11.9% 13.5% 14.4%
Total number of schools 3540 (100%) 639 (100%) 312 (100%) 9 (100%)
Exhibit 6.1-b: Total percentage of schools earning GPAs for the 1999-2000 school year, by level
Elementary Middle High K-12 Percentage of schools in each level receiving GPA
73.2% 56.9% 38.1% 75.0%
Achievement Analyses
Effect of GPA on Recipient Schools
Assessing the effect of the GPA program on achievement presented evaluative challenges distinct from those for II/USP. One challenge lay in the confounding of receipt of a GPA with prior year academic achievement. The analysis called for modeling subsequent achievement on GPA participation, which is a direct function of prior achievement. We thus created a model using the 2001 API as the dependent variable, receipt of a GPA for 2000 as an independent variable, and the school’s 1999 and 2000 API scores as controls (along with other relevant school-level variables).52 In addition, because the awards for 2000 were distributed so late in the next academic year (February 2001), we hypothesized that schools may not have been able to realize their effect prior to the 2001 testing. We, therefore, conducted two analyses for the first round of awards. In one, we used each school’s 2001 API as the dependent variable, while the second analysis allowed for a lagged effect by using the 2002 API as the dependent variable.
52 By including both 1999 and 2000 API scores as controls, the analysis in effect controls for both the API score in
2000, the year of the award, and the growth in API between 1999 and 2000, which is the basis for the award.

Chapter 6. Governor’s Performance Award
Evaluation of the Public Schools Accountability Act of 1999 135
Exhibit 6.2 provides the parameter estimates and standard errors for each analysis. Note that in neither 2001 nor 2002 do we detect any significant impact of the GPA award on subsequent achievement.
Exhibit 6.2: Parameter estimates, multi-level model for effect of GPAs on API
Est. P value Est. P value Dependent variable =2001 API Dependent variable = 2002 API Intercept 37.91 0.000 12.78 0.016 % AFRICAN AMERICAN -0.31 0.000 -0.03 0.395 % ASIAN -0.28 0.020 -0.18 0.126 % HISPANIC -0.13 0.000 -0.01 0.653 % FREE LUNCH 0.21 0.000 0.22 0.000 % EL 0.11 0.000 0.17 0.000 MOBILITY 0.07 0.013 -0.67 0.000 AVG PARENT EDUCATION 4.12 0.000 7.81 0.000 % FULL CREDENTIALS -0.07 0.025 -0.08 0.009 GPA 20001 0.52 0.515 0.53 0.513 API 19992 0.10 0.000 0.06 0.000 API 20002 0.85 0.000 0.91 0.000
1Dichotomous variable coded 1 = GPA in 2000, 0 = No GPA in 2000. 2API scores in 1999 and 2000 respectively.
Systemic Incentive Effect of GPA on Statewide Achievement
An additional challenge for the analysis of GPA effects was to identify the systemic incentive effects of the awards, as distinct both from the direct effect on recipient schools and from the effects of the target-setting process without the awards. The source of this challenge lay in the fact that the GPA was a universal and automatic program: all schools that met their API growth targets were to achieve awards, and all those that didn’t meet the targets would not. Schools from all deciles, and even those targeted for improvement in II/USP, were in the pool of potential recipients.
One expectation behind this aspect of the policy was that the promise of a GPA would serve as an incentive for all schools to strive for their targets. (See Exhibit 1.4 and 1.5 in Chapter 1 for a display of the PSAA theory of action.) The complication for this evaluation was that since the whole system was to be affected, we had no readily available comparison group to judge whether the awards had their desired impact. The best we could hope for was a rough indication of the systemic effect inferred from changes in the percentages of schools meeting targets before and after institution of the awards program.
To obtain this indication, we began with the pre-PSAA achievement patterns and derived answers to three questions:
1. What percentage of California schools would have met API targets in 1999 had targets been established? (This is our pre-PSAA baseline.)
2. What percentage of California schools actually met their targets in 2000? (The difference between this figure and the 1999 figure gives us an indication of the effect of setting specific targets for schools to reach. Goal-setting theory and research (Locke and Latham, 1990) find that the targets themselves—even without external
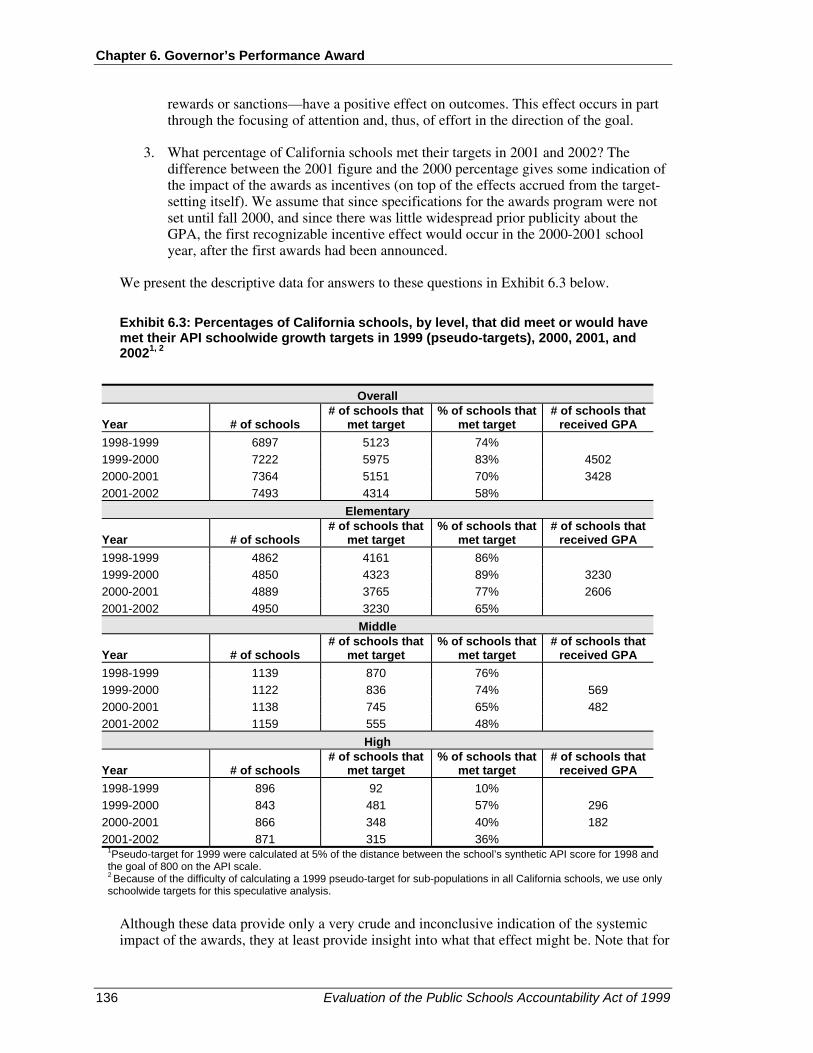
Chapter 6. Governor’s Performance Award
136 Evaluation of the Public Schools Accountability Act of 1999
rewards or sanctions—have a positive effect on outcomes. This effect occurs in part through the focusing of attention and, thus, of effort in the direction of the goal.
3. What percentage of California schools met their targets in 2001 and 2002? The difference between the 2001 figure and the 2000 percentage gives some indication of the impact of the awards as incentives (on top of the effects accrued from the target-setting itself). We assume that since specifications for the awards program were not set until fall 2000, and since there was little widespread prior publicity about the GPA, the first recognizable incentive effect would occur in the 2000-2001 school year, after the first awards had been announced.
We present the descriptive data for answers to these questions in Exhibit 6.3 below.
Exhibit 6.3: Percentages of California schools, by level, that did meet or would have met their API schoolwide growth targets in 1999 (pseudo-targets), 2000, 2001, and 20021, 2
Overall
Year # of schools # of schools that
met target % of schools that
met target # of schools that
received GPA 1998-1999 6897 5123 74% 1999-2000 7222 5975 83% 4502 2000-2001 7364 5151 70% 3428 2001-2002 7493 4314 58%
Elementary
Year # of schools # of schools that
met target % of schools that
met target # of schools that
received GPA 1998-1999 4862 4161 86% 1999-2000 4850 4323 89% 3230 2000-2001 4889 3765 77% 2606 2001-2002 4950 3230 65%
Middle
Year # of schools # of schools that
met target % of schools that
met target # of schools that
received GPA 1998-1999 1139 870 76% 1999-2000 1122 836 74% 569 2000-2001 1138 745 65% 482 2001-2002 1159 555 48%
High
Year # of schools # of schools that
met target % of schools that
met target # of schools that
received GPA 1998-1999 896 92 10% 1999-2000 843 481 57% 296 2000-2001 866 348 40% 182 2001-2002 871 315 36%
1Pseudo-target for 1999 were calculated at 5% of the distance between the school’s synthetic API score for 1998 and the goal of 800 on the API scale. 2 Because of the difficulty of calculating a 1999 pseudo-target for sub-populations in all California schools, we use only schoolwide targets for this speculative analysis.
Although these data provide only a very crude and inconclusive indication of the systemic impact of the awards, they at least provide insight into what that effect might be. Note that for

Chapter 6. Governor’s Performance Award
Evaluation of the Public Schools Accountability Act of 1999 137
elementary schools and middle schools, the percentage of schools that would have met their targets, had targets been established for 1999, appears to be quite high—86% for elementary schools and 76% for middle schools, compared with only 10% for high schools. We assume that at least some part of these large percentages in the elementary and middle levels is due to the expected rise in test scores after the first administration of a new test. Such rise is common, reflecting increasing familiarity with the format and content of the test instrument (Linn, 2000). What we find interesting are the rise in 2000 test scores for elementary schools and the big rise for high schools in that same year, followed by a growing decline in the subsequent two years. We conjecture that this sharper one-year rise in the percent of schools meeting the schoolwide target reflects, in large part, the systemic effect of the entire PSAA, including both the API and the API targets.
We have seen in other jurisdictions how the establishment of an accountability system with prescribed targets helps to focus attention on student outcomes and to direct energy towards improving those outcomes, through both intended and unintended means (O’Day, 2002). The pattern we see in Exhibit 6.3 is consistent with the interpretation of an “attention effect”—that is, of increased attention to raising student outcomes generated by the API targets and the establishment of the PSAA accountability system. The decline in the following year is more difficult to interpret. We do not know how much the decline might have been without the incentive of the GPA. Nonetheless, we might at least conclude that whatever incentive effect the GPA provided, it was not enough to sustain the rate of growth evident among the vast majority of schools across the state the previous year. This reading of the data, along with the lack of effect for recipient schools (discussed above) and the evidence from our case study schools and surveys (discussed below), leads us to conclude that although setting the targets may have had an effect, the systemic effect of the GPA program has been negligible.
Saliency of Awards
The PSAA theory of action (Exhibits 1.5 and 1.6) anticipates that the promise of financial rewards for improved performance will increase schools’ attention and motivation to improve student achievement. This anticipation is key to the Governor’s Performance Award program.
In order for the promise of awards to have this effect, the awards must be salient among key stakeholders including teachers and school administrators. We therefore examined, using case study and survey data, the level to which school staff were aware of the awards, whether they believed they would receive awards if their students’ performance increased, and whether they believed the awards would indeed encourage schools to do better. Although our case study site visits focused on II/USP, the subject of the Governor’s Performance Award often arose in our discussions of the accountability system in general. Several of our case study schools received awards for either the 1999-00 school year or the 2000-01 school year.
It was apparent from our case study interviews that the saliency of the GPA awards was minimal. Few teachers or principals talked about the awards without prompting. When asked, they gave few indications that the awards had been particularly salient to themselves or other personnel. For example, a teacher at one urban northern California school that had been eligible for an award in the 2000-01 school year emphasized the benefits of an award system compared to more punitive measures, but added that the awards based on test scores was not the proper system: “Most of that money never even came to anyone anyway, so it was all a smoke screen anyway, and we knew that coming into it.”
Some other teachers thought that to increase the achievement of students, the money could be spent in better ways: “I think if [they] took all that money that they want to chop us for test
Chapter 6. Governor’s Performance Award
138 Evaluation of the Public Schools Accountability Act of 1999
scores or give us for good test scores, and if they gave $5000 to each of the families in this neighborhood, they’d see more of a jump in their test scores.”
Some teachers indicated they were pleased to have received the awards, but still did not see them as an incentive for doing better. One teacher from an urban northern CA school reported, “[I] don’t know if money was [an] incentive during [the] process, but just a good outcome. Good that it was for the whole staff, not just for teachers.” A district representative from one of our large urban districts shared these sentiments, saying, “I think it is a nice acknowledgement, but I think the teachers would do the work anyway, and it’s after the fact. And I don’t think that was a motivation for doing the work, but it was nice as sort of a bonus.”
The survey data was somewhat more encouraging about the potential incentive of financial rewards with 50.1% of teachers from lower decile schools reporting that they agree or strongly agree that rewarding schools for meeting their API growth targets encourages schools to do better. Teachers from upper decile schools answered similarly (48.9 percent). Principals were slightly more skeptical, with 35.7 percent from lower decile schools reporting that they agree or strongly agree with the statement, and 50.5 percent from upper decile schools agreeing or strongly agreeing.
Promises, Promises
Of course, for the promise of awards to have a motivational effect, school personnel must believe that the awards will in fact be forthcoming, should the school reach its goals. Expectancy theory (Lawler, 1994; Mohrman and Lawler, 1996) holds that motivation is a function of two expectations. One is that the actor has the ability to accomplish the given task, and the second is that a valued outcome will result from that accomplishment. Thus, for the award program, school personnel must believe that they can reach the API target, they must value the reward being promised, and they must believe that they will actually receive the award if they make their target. Research on reward systems in other jurisdictions (Kelley et al., 2000) have found that the awards are often so small in amount that teachers place little value on them; in addition school personnel frequently do not trust that the promised reward will materialize.
Our data suggest that this latter situation might have undermined the salience of the GPA program. While the case study respondents indicated that the awards were a “nice acknowledgement” after the fact, the survey data show that few school personnel actually expect to receive the award. When asked how likely it would be for their school to receive a financial reward from the state if they met their API growth targets, only 27 percent (N=854) of all teachers surveyed (including II/USP, comparison, and higher decile schools) reported that it was likely to happen or definitely would happen. Six percent reported that it was already happening (see Exhibit 6.4 below). Similarly, 24 percent of principals reported that it was likely to happen or definitely would happen; 16 percent reported it was already happening. Higher percentages reported that attitudinal changes, such as increased teacher morale or a greater sense of personal satisfaction, were likely to occur.

Chapter 6. Governor’s Performance Award
Evaluation of the Public Schools Accountability Act of 1999 139
Exhibit 6.4: Teachers’ and principals’ expectations of results from meeting API targets*
Definitely
Would Not or Unlikely to Happen
Likely to or Definitely
Would Happen
Already Happening
Definitely Would Not or Unlikely to Happen
Likely to or Definitely
Would Happen
Already Happening
Teachers (N=855) Principals (N=224)
Our school will receive a financial reward from the state.
57.1% 26.9% 5.9% 55.8% 24.4% 12.6%
Our school will receive public recognition for our progress.
32.3% 58.0% 8.8% 21.5% 63.8% 14.2%
Teachers at our school will get personal monetary bonuses.
78.2% 10.5% 2.4% 74.6% 11.2% 6.2%
Teacher morale will improve at our school.
19.4% 67.8% 10.2% 60.6% 38.5% 14.4%
I will feel personal satisfaction from my school reaching its goals.
11.9% 73.7% 13.7% 7.9% 64.5% 27.7%
I will feel the satisfaction of knowing that student performance has improved.
9.3% 74.1% 15.0% 2.2% 67.3% 30.3%
Nothing will happen.
62.2% 17.6% 2.0% 92.6% 3.7% 0.0%
*Note: remaining percentages responded “Don’t Know”
When we compared responses from principals who reported having received a GPA for the 1999-2000 school year (77 principals) to those from principals who did not (147 principals), we found that the promise of future rewards was more salient for those who had received rewards previously. Thus, while 68.7 percent of non-recipients reported that if they made their growth targets, a state financial award was “unlikely” or “definitely would not happen,” only 44.1 percent of prior recipients agreed. We surmise that the incentive power of the GPA was influenced by the school’s history with the program. Extrapolating, we would argue that the suspension of the GPA awards for 2002 and 2003 is likely to negatively affect their future incentive power, should the GPA (or another reward system) be re-instituted. In other words, state failure to come through on awards promised by PSAA in the past two years has likely undermined school personnel’s expectation or trust that the state would follow through on promises in the future. Without that trust, the rewards lose their incentive power.

Chapter 6. Governor’s Performance Award
140 Evaluation of the Public Schools Accountability Act of 1999
GPA Expenditures
Both the salience of the award and their effect on subsequent achievement may also be a function of what schools that received awards were able to do with those funds. In this regard, the marked decrease in the amount of the awards in 2001 is perhaps important to note. We asked all surveyed principals whether their school had received a Governor’s Performance Award for the 1999-2000 school year (received in winter 2001). If they had received an award, we asked them to report how much of the award funds were spent in each of 12 categories. Below we examine how all of the GPA schools in our sample (both in the lower deciles and upper deciles) reported spending their funds.
GPA funds were spent quite differently from II/USP dollars. Almost half (47.5 percent) of the GPA money went toward technology, compared to 9.1 percent of II/USP dollars in the first year of implementation. The second highest percentage went to instructional materials (18.8 percent). Only 3.6 percent of GPA dollars went toward additional instructional personnel, compared to 30.1 percent for II/USP. Almost six percent of GPA dollars went toward facilities, compared to just over one percent for II/USP. (See Exhibit 6.5 below.) We find these patterns consistent with a view of the GPA as a one-time bonus to be spent on “extras” and items that required a substantial up-front outlay of money, with little subsequent continuing investment.
Exhibit 6.5: Average percent of GPA funds spent on school-related activities
All Schools that received
GPA* (N=55)
Additional instructional personnel (salaries) 3.6 %
Instructional materials (textbooks, curriculum, etc.) 18.8 %
Technology (hardware or software) 47.5 %
A comprehensive school reform model provider 0.1 %
Other professional development providers 3.0 %
Leadership training 0.5 %
Release time for teachers to participate in professional development 9.2 %
Support personnel (non-instructional) 1.9 %
Additional instructional time (before or after school, Saturdays) 3.1 %
Parent involvement activities 0.4 %
Facilities 5.9 %
Other 5.9 %
Total 100.0 % *75 surveys were received for schools that received GPA funds
Schools did not all spend their monies in the same ways, however. We also examined the data by school level, decile ranking, and II/USP participation. The only significant difference (p<0.05) between elementary and secondary spending was in parent involvement activities (1.8 percent of funds to middle/high schools vs. 0.0 percent of funds to elementary schools).

Chapter 6. Governor’s Performance Award
Evaluation of the Public Schools Accountability Act of 1999 141
When we compared lower decile schools (both II/USP and non-II/USP in deciles 1-5) to higher decile schools (deciles 6-10), several significant differences emerged, as shown in Exhibit 6.6. For example, lower decile schools spent a significantly larger percentage of funds (p<0.05) on instructional materials, release time for teachers to participate in professional development, support personnel (non-instructional), and additional instructional time than did higher decile schools. By contrast, higher decile schools spent a significantly larger percentage of their award funds on technology.
Exhibit 6.6: Average percent of GPA funds spent on school-related activities, by high and low API decile*
Low API Deciles (N=34)
High API Deciles (N=21)
Additional instructional personnel (salaries) 6.3 % 2.6 %
Instructional materials (textbooks, curriculum, etc.) 31.7 % 14.2 %
Technology (hardware or software) 10.1 % 60.9 %
A comprehensive school reform model provider 0.5 % 0.0 %
Other professional development providers 1.9 % 3.4 %
Leadership training 1.6 % 0.2 %
Release time for teachers to participate in professional development 15.4 % 7.0 %
Support personnel (non-instructional) 5.3 % 0.7 %
Additional instructional time (before or after school, Saturdays) 8.3 % 1.2 %
Parent involvement activities 0.5 % 0.4 %
Facilities 11.0 % 4.0 %
Other 7.4 % 5.4 %
Total 100.0 % 100.0 % *26 high API decile, GPA surveys were received; 49 low API decile, GPA surveys were received
When we compared expenditures in low decile II/USP (both state-funded and CSRD) schools to the low-decile comparison schools, we also identified several significant (p<0.05) differences (see Exhibit 6.7 below). In particular, low decile comparison schools spent a significantly higher percentage of their GPA funds on instructional materials and additional instructional time than schools participating in II/USP—most likely because II/USP schools had II/USP funding for these items. Comparison schools, lacking the II/USP dollars but still in the low performing category, might logically focus their GPA spending on items more centrally related to their instructional program and efforts to improve student achievement.
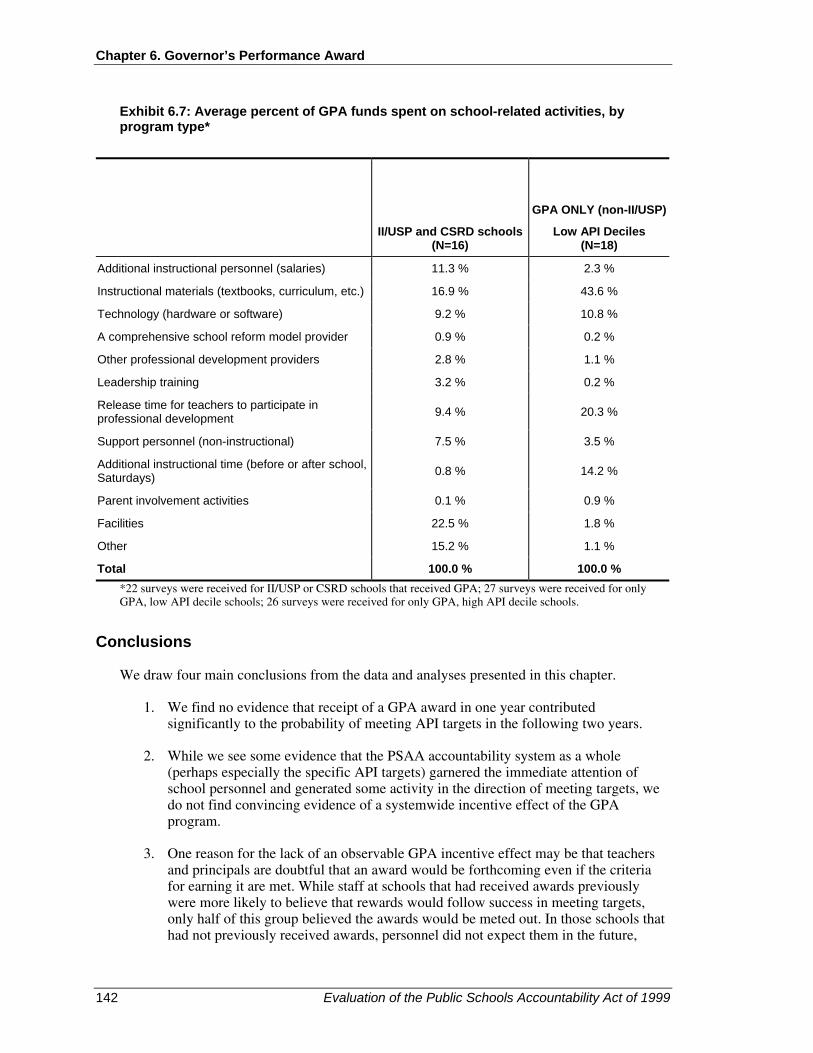
Chapter 6. Governor’s Performance Award
142 Evaluation of the Public Schools Accountability Act of 1999
Exhibit 6.7: Average percent of GPA funds spent on school-related activities, by program type*
II/USP and CSRD schools(N=16)
GPA ONLY (non-II/USP)
Low API Deciles (N=18)
Additional instructional personnel (salaries) 11.3 % 2.3 %
Instructional materials (textbooks, curriculum, etc.) 16.9 % 43.6 %
Technology (hardware or software) 9.2 % 10.8 %
A comprehensive school reform model provider 0.9 % 0.2 %
Other professional development providers 2.8 % 1.1 %
Leadership training 3.2 % 0.2 %
Release time for teachers to participate in professional development 9.4 % 20.3 %
Support personnel (non-instructional) 7.5 % 3.5 %
Additional instructional time (before or after school, Saturdays) 0.8 % 14.2 %
Parent involvement activities 0.1 % 0.9 %
Facilities 22.5 % 1.8 %
Other 15.2 % 1.1 %
Total 100.0 % 100.0 % *22 surveys were received for II/USP or CSRD schools that received GPA; 27 surveys were received for only GPA, low API decile schools; 26 surveys were received for only GPA, high API decile schools.
Conclusions
We draw four main conclusions from the data and analyses presented in this chapter.
1. We find no evidence that receipt of a GPA award in one year contributed significantly to the probability of meeting API targets in the following two years.
2. While we see some evidence that the PSAA accountability system as a whole (perhaps especially the specific API targets) garnered the immediate attention of school personnel and generated some activity in the direction of meeting targets, we do not find convincing evidence of a systemwide incentive effect of the GPA program.
3. One reason for the lack of an observable GPA incentive effect may be that teachers and principals are doubtful that an award would be forthcoming even if the criteria for earning it are met. While staff at schools that had received awards previously were more likely to believe that rewards would follow success in meeting targets, only half of this group believed the awards would be meted out. In those schools that had not previously received awards, personnel did not expect them in the future,

Chapter 6. Governor’s Performance Award
Evaluation of the Public Schools Accountability Act of 1999 143
whether they met the targets or not. The irregularity in both the amount and the distribution of the GPA awards most likely undermines the potential incentive effect.
4. An explanation for the lack of effect of the GPA on the recipient’s subsequent achievement may lie in the ways that funds were spent by recipient schools. Principals from both high and low decile schools indicated that GPA award monies were spent quite differently from II/USP monies. GPA funds tended to be spent on “extras” that were tied less directly to the heart of the instructional program. This was particularly true in the higher decile schools, which used a majority of the funds for technology hardware or software. II/USP schools were more likely to spend GPA monies on such things as facilities, which was not at all a focus of II/USP spending. Low decile non-II/USP schools, however, appear to have spent the GPA awards much like II/USP schools reported spending their II/USP awards. This pattern is not surprising, given the similar need to ratchet up instruction in all low performing schools and the unavailability of II/USP funds in comparison schools to do so.
Our overall conclusion is that the GPA lacks the saliency or regularity to be a systemic incentive and the targeting to be a direct contribution to improved achievement. It could be, however, that the use of the awards to balance out the threat of sanctions enhances the perceived fairness of the PSAA system as a whole, without providing the direct impact imagined at its outset.

Chapter 6. Governor’s Performance Award
144 Evaluation of the Public Schools Accountability Act of 1999

Evaluation of the Public Schools Accountability Act of 1999 145
Chapter 7. Conclusions and Implications
Introduction
The Request for Proposals for this evaluation set out six main research questions regarding the implementation and effects of the II/USP and GPA Programs (See Chapter 1). In the first two chapters of this report, we outlined the conceptual framework, overall design, and specific methodologies we used to address these questions. In Chapters 3 through 6, we presented our findings in four main areas: the effects of II/USP on student achievement (Chapter 3, research question 1); the II/USP planning year activities (Chapter 4; research questions 2-5); the II/USP implementation years and effects (Chapter 5, research questions 2-6); and the Governor’s Performance Award (Chapter 6, questions 1-5). Each presentation ended with a summary of relevant findings.
In this chapter, we draw on prior discussions to present central findings and lessons relevant to the policy’s implicit theory of action and to consider implications of those findings for future policy activity. In doing so, we recognize that the II/USP and the GPA programs either are in hiatus (GPA) or have been replaced by a substantially altered version of the original policy (II/USP). However, we believe that the lessons learned from II/USP should be relevant to the current High Priority Schools Grant (HPSG) program as well as to state efforts to implement the accountability and assistance provisions of the federal No Child Left Behind Act (NCLB). In addition, we believe that it would be beneficial to continue following the progress of II/USP schools to gain a better understanding of the longer term effects of this program on school improvement and student achievement.
We divide our discussion into two parts. In the first, we focus on our central cross-cutting findings concerning PSAA and factors influencing the progress of low performing schools. In the second section, we turn to the specific design features of the II/USP and GPA programs, drawing lessons of relevance for future accountability efforts.
Central Findings and Implications for Policy
In this section, we discuss our central findings in four main areas: attention to student performance, the overall effect of II/USP and GPA on achievement trends, the mediating influence of district policy and context, and the importance of instructional coherence at the school level. For each area, we present and discuss the key finding and then suggest one or more implications for policy at the state or local levels.

Chapter 7. Conclusions and Implications
146 Evaluation of the Public Schools Accountability Act of 1999
Attention to Student Achievement Outcomes
PSAA, like other performance-based accountability systems, defines academic learning as the core goal of schooling and seeks to focus the attention of the public and the educational system on the improvement of student achievement. Attention is a first step in the policy’s theory of action, as policy makers assume that educators must first attend to student achievement if they are to seek and find ways to improve it. With respect to this goal, PSAA has been very successful in capturing the attention of both district and school personnel and in focusing that attention on student achievement as measured by the API. Both survey and case study data support the salience of the API and the improvement targets. School personnel are aware of their API scores, targets, and deciles. They know that they must achieve both overall growth and sufficient subgroup growth to meet those targets each year. The analysis of percentages of schools meeting targets, presented in Chapter 6, also suggests that the establishment of specific goals for each school may have contributed to the overall achievement growth in the state. In addition, the API seems to be garnering more support as it has incorporated greater and greater emphasis on the California Standards Tests, which survey and case study respondents believe are better aligned with the learning goals and thus better indicators of their students’ progress toward state standards.
Perhaps equally important to the general focus on student achievement, PSAA has also focused attention on the lower performing schools in the state. Not only is this attention evident at the state level, where it is manifested in additional resources to these schools (as well as the threat of sanctions), but it has also been taken up by many districts. While the manifestations and extent of this attention vary from district to district, our case study data indicate that such attention is widespread, often leading to additional specific actions and programs within the district to support low performing schools—in some cases whether or not those schools are participating in II/USP. This attention may help to explain some of the large district influence on student achievement growth in II/USP and comparison schools. For example, San Diego (not one of our case study districts) has made it a districtwide goal to move all of its API 1 and 2 schools out of the bottom two deciles (American Institutes for Research, forthcoming). To accomplish its objective, district leadership has targeted substantial additional resources to API 1 and 2 “focus schools” and has called on central office departments to place a priority on meeting the needs of schools in the bottom two deciles. This attention may be one reason that San Diego is among the districts to show a significant and large positive influence on student achievement growth for both II/USP and non-II/USP schools (see Chapter 3). Other districts have manifested similar attention in a variety of ways. One case study district established a local network of low performing schools, even before II/USP. Several districts assigned central office staff to work with and monitor progress in their lowest performers, and a few required schools to adopt specific instructional packages or to obtain support from external providers. Such efforts demonstrate a widespread emphasis on low performing schools and local as well as state use of the API to target attention and resources where they are most needed.
The concentrated focus on achievement and improving test scores also has its drawbacks, however. One consequence of all this attention to academic achievement, and to reading
Key Finding: PSAA has successfully focused attention on student achievement outcomes and low performing schools, with some unintentional consequences.

Chapter 7. Conclusions and Recommendations
Evaluation of the Public Schools Accountability Act of 1999 147
and mathematics in particular, has been a reported tendency to neglect other subject areas and other developmental needs of students. This neglect was particularly noticeable at the elementary level, where in some schools and districts the school day was consumed by large blocks of time devoted solely to basic reading and mathematics instruction. In these situations, the response to accountability demands has left little time for art, music, physical education, social studies, or science. In addition, some districts have chosen to operationalize and guide the desired focus on achievement by adopting highly prescriptive curriculum packages. These curricula have the advantage of “getting everyone on the same page,” but rigid implementation of pre-set pacing plans can prevent teachers from using their professional expertise to respond to the learning needs of individual students as they progress through the instructional program. Finally, attending to children’s social and emotional development may also fall by the wayside in the press to raise test scores.
Implications for policy: Three implications for policy emerge from this discussion:
• As the state moves to respond to NCLB, it should continue to use the API as an indicator of school level performance. The API has not only garnered statewide attention but is beginning to gain wider professional acceptance through its incorporation of the California Standards Tests (CST). Moving to an entirely new system of school accountability would fuel perceptions of policy instability, which in turn tend to undermine the impact of state efforts. This recommendation does not preclude modification of the API to incorporate additional measures, as has occurred with the roll out of the CST.
• The state should continue – and perhaps sharpen – its focus on its lowest performing schools. We have found that the impact of this focus extends well beyond the schools directly participating in specific assistance programs. At the same time, we believe that the direct effect of participation in such programs might be enhanced if scarce state funds were concentrated on the schools in greatest need, as in the High Priority Schools Grant program (see below).
• Both the state and local districts should consider ways to balance attention to core academic goals with attention to other developmental and academic needs of students. We also encourage CDE to track – through its evaluations or other indicators – the degree to which accountability measures inhibit schools’ ability to address these other concerns.

Chapter 7. Conclusions and Implications
148 Evaluation of the Public Schools Accountability Act of 1999
The Impact of PSAA on Student Achievement
In Chapter 3, we discussed the overall student achievement trends in both II/USP and comparison schools, as measured by the school-level API and by student-level SAT-9 reading and mathematics scores. We noted that achievement for both groups of schools has increased sharply and significantly since the institution of the STAR testing program and the passage of PSAA. The gains have been the greatest at the elementary level (approximately 150 API points between 1998 and 2002 for Cohort 1 schools), more moderate for middle schools (approximately 70 points in this same period) and much lower for high schools (approximately 18 points). 53 Against this backdrop of rising scores overall, we find only relatively small differences between II/USP and similar comparison schools. These differences vary in direction, by level, and by cohort over the course of participation. The most consistent pattern is a small positive “bump” in growth for II/USP Cohort 1 and 2 schools relative to the non-II/USP comparison counterparts in the planning year (Year 1) of the program. The estimated difference is on the magnitude of 0.11 to 0.14 standard deviations, or about 8-9 API points at the elementary level and 7-8 points for high schools. Evaluated in the context of the substantial overall gains noted above, these growth advantages seem tiny.54 When viewed as constituting from 50 to 80 percent of the average API growth target for these schools in the relevant year, the gains appear somewhat more meaningful. In any case, for most (though not all) groups, the small jumpstart for II/USP schools begins to dissipate after the first year. In addition, we find no significant effect of II/USP participation on a school’s likelihood of meeting API growth targets, nor any impact of GPA awards on subsequent API scores.
Two aspects of these patterns invite speculation. First, why do these programs appear to have so little effect overall? And second, why did a planning year bump occur in Cohorts 1 and 2?
53 Note: These figures represent estimated mean differences from 1998-2002 in the synthetic API scores, which we
calculated using the 1999 API as the base and transforming the scores every year to adjust for changes in the STAR program. This method of calculating a synthetic API allows for comparison of scores over time, given the changes in the API formula and tests. The method, which was developed with advice and approval by the CDE, is explained in more detail in Appendix A.
54 For high schools, which gained only 18 points on average across the four years, the II/USP planning year advantage is considerably more noticeable. The real story here, however, is that there has been so little improvement in high schools, a consistent pattern throughout the country.
Key Findings: • Against the backdrop of very large increases in STAR scores in the state,
the direct additional contributions of II/USP and GPA to mean achievement across participating schools has been negligible.
• II/USP schools in Cohorts 1 and 2 generally experienced a small and short-lived “bump” in achievement growth in Year 1, most likely the result of increased attention to achievement generated by the identification process and planning year activities.
• Wide variation in growth trends among II/USP schools, coupled with case study data, indicate that II/USP schools have been differentially able to capitalize on II/USP funds to improve instruction and student achievement.

Chapter 7. Conclusions and Recommendations
Evaluation of the Public Schools Accountability Act of 1999 149
Let’s take the second question first. One possible explanation for the small planning year bump is that it is either a statistical artifact or the reflection of some underlying difference between the II/USP and comparison groups. We find this explanation unsatisfactory, given the presence and similar size of the increase in five of the six groups of Cohort 1 and 2 II/USP schools55 and the lack of a consistent pattern thereafter. This similarity exists despite differences in eligibility criteria and determination of comparison group between the cohorts. Rather, based on our case study and survey data, we believe that the planning year bump in growth is the result of the increased attention to student outcomes and instruction engendered by the selection of a school into the program, public scrutiny through the press, the activity of the External Evaluators, and the planning process itself—all concentrated in that first year. The effect of such attention in other organizational contexts has been well documented (Locke and Latham, 1990; March, 1994)56 As noted above, this attention to student outcomes is one goal of the PSAA theory of action. The failure of most groups of II/USP schools to build on or even maintain that planning year advantage, however, implies that attention in and of itself is not enough to produce long-term gains in achievement. Moreover, the failure of Cohort 3 schools to exhibit a similar increase in the planning year suggests that the bonus of that attention may be relegated to the early years of PSAA. By the time that Cohort 3 schools joined the program, the newness of the II/USP and results-based accountability may already have run its course. In addition, Cohort 3, as latecomers, may differ systematically from Cohorts 1 and 2, being either more recalcitrant or being previously better performers who only missed one target in 2001. We would need to follow Cohort 3 schools for a longer period of time to investigate their longer term patterns and differences from the other two cohorts.57
The deeper question of why so little impact overall is a harder one to answer, though we see several possibilities. One possible explanation is that II/USP has both a direct effect on participating schools and an unmeasured indirect effect on non-participating schools by way of the attention it brings to performance in general and to low performing schools in particular. Support for this line of reasoning comes from case study districts that directed resources, monitoring, and assistance to all their low performing schools, not just those in II/USP. In fact, in these and other districts, obtaining II/USP funds for some schools may have freed up other district funds to assist lower performing schools that may have been eligible (or that could be eligible in the future) for II/USP participation. To the extent that this was the case, the direct effect of II/USP on participating schools would be mitigated by the indirect effect of the program funds and PSAA on non-participating schools—most likely the very schools that were in our comparison groups. The similarities in disaggregated achievement patterns for II/USP and comparison schools may have similar roots. Following this argument, one would conclude that the impact of II/USP cannot be limited to observed differences between II/USP and comparison schools.
A second possible explanation for the program’s limited effect stems from the wide variation in achievement trends among II/USP schools, such that some appeared to benefit substantially from program participation and funding and others gained little or even lost ground. This wide variation suggests that the effects of II/USP may be mediated by other factors outside the program. We found these mediating factors to include the influence of
55 Only Cohort 2 middle schools do not experience such a bump in scores during the planning year. 56 A skeptic might view the planning year increase as a “Hawthorne effect,” which refers to the false positive
performance produced in an experimental situation by the attention generated by that situation rather than any real effect of the relevant “treatment.” In the case of II/USP and PSAA, however, attention to outcomes is part of the desired result of the policy and so not outside the treatment itself.
57 We have only one year (2002) of post program test data for Cohort 3. In addition, most schools were visited at the time they were finishing up their planning process. We urge CDE to continue following these schools to examine the longer-terms patterns in both implementation and achievement.

Chapter 7. Conclusions and Implications
150 Evaluation of the Public Schools Accountability Act of 1999
district context on the one hand, and internal school capacity on the other. Both factors influenced the level of instructional coherence that a school was able to develop—and this coherence was in turn directly tied to differences among II/USP schools in achievement growth. We discuss the role of district context and of instructional coherence below. Other factors that may mitigate the effects of II/USP and GPA participation may involve specific issues of implementation and program design, which are discussed in the second half of this chapter.
District Policy and Context
Consistent with the conceptual framework for this evaluation, we found a substantial district influence in all aspects of our investigation, with that influence varying by the extent and nature of the district action. Our case study and survey data indicate a number of ways that districts were differentially involved in the implementation of II/USP. For example, many districts determined which schools would participate in the program, in some cases requiring that all eligible schools in their jurisdiction apply. District mandates with regard to participation appear to have increased across cohorts. In addition, some districts played an active role in selecting the External Evaluators, in some cases narrowing the approved list of providers and in other cases actually making the selection for each (or all) school(s). Some districts also set up or required supports during implementation, including external assistance, professional development, and monitoring.
Implications for policy:
Three implications flow from the previous argument:
• Program design should incorporate ways to capitalize and expand on initial attention to outcomes generated by planning year activities. Monitoring and assistance during implementation may be essential to realizing long term effects.
• State and district leaders should recognize the mediating influence of other factors in the progress of II/USP or other low performing schools and incorporate that understanding into policy design. Below we suggest several ways in which the specific mediating factors identified in this evaluation could be taken into account.
• Evaluation of II/USP or similar programs may need to look beyond direct additive effects on achievement of recipient schools to more systemic effects among low performing schools generally.
Key Finding: Local districts significantly influence instructional practice and achievement trends in low performing schools – both II/USP and non-II/USP – and appear to mediate the effects of II/USP participation.

Chapter 7. Conclusions and Recommendations
Evaluation of the Public Schools Accountability Act of 1999 151
The influence of district context and actions was not limited to those directly related to II/USP. Our analysis of achievement trends presented in Chapter 3 reveals a large, statistically significant contribution (positive and negative) of district membership on both II/USP and comparison schools. Our case studies reveal that this influence came in large part through instructionally related policies for all underperforming schools (or for schools at all performance levels). Three of the four districts we analyzed through the achievement data, for example, exhibited a strong positive effect on elementary reading that seemed to coincide with the implementation of a common specified approach to literacy instruction in the district. Though the specifics of the approach differed among the districts, all have incorporated coherent, structured methods focused on early literacy instruction, frequent monitoring of student progress, and aligned professional development. Our case study data indicate the power of such mandated curricula. Over half of our case study elementary schools were situated in districts with mandated reading programs. In each case, those curricula became the central strategy of the school—even where it was in conflict with the school’s own adopted CSRD model.
While the districts’ varying instructional policies were neither confined to nor derived from the II/USP program, they appear to be at least in part responsive to PSAA attention on low performing schools, as well as other state mandates. Where the district took a strong role in curriculum and instruction, it tended to overpower or direct any independent effects of II/USP, which—as noted earlier in this report—becomes primarily a funding stream after the first (planning) year. However, not all districts have opted for centralized instructional policy. Nor do all districts have either the resources or inclination to provide instructional supports to their schools. The statistically observable district effect on achievement derives from the variation in district actions as well as the power of those actions (or inactions) to influence school practices. The fact that districts play a role, for better or for worse, suggests that the state might incorporate that role more directly into its accountability policies in order to encourage positive actions and responsibility on the part of district leadership.
Implication for policy:
At the state level, policy makers need to recognize the key role that districts play in the condition and improvement of schools in their jurisdiction.
• We suggest that at the very least any school accountability policy involving potential sanctions for low performing schools require not only district sign-off on the school’s improvement plan but the submission of a separate district plan detailing how the district will support and monitor the schools throughout the program.
• The state’s move toward district-level accountability might also include incentives (e.g., reduced regulatory requirements) for improved performance in district schools.

Chapter 7. Conclusions and Implications
152 Evaluation of the Public Schools Accountability Act of 1999
Coordinated Action and Instructional Coherence
A central goal of the II/USP planning process was to develop greater coordination and alignment of goals, activities, and resources at the school site. Instructional coherence, an outgrowth of such alignment, has long been found to be a key component of effective school organizations. Our case study data indicate a strong association between instructional coherence and growth in student achievement, while both case study and survey data reveal substantial variation among schools in their ability to develop a coherent instructional program. The planning process alone did not have a discernible influence on the development of instructional coherence. However, the strategies that schools adopted or that districts mandated contributed differentially to later coherence. Strategies that had internal consistency as well as sufficient specificity to provide common direction to school personnel, especially if they had legitimacy among the professionals in the school and some form of regular monitoring, were more likely to be implemented in a consistent and coherent fashion throughout the school.
Internal capacity at the school site also played a major role in the school’s ability to develop instructional coherence. Two aspects of this capacity stand out: collaboration and professional community among teachers, and instructional leadership by the principal or other leaders at the school site. Where teachers already had or established regular means of collaborating on instructional practice, and where they had guidance and monitoring of their progress by instructional leaders, they were better able to institute common curriculum and instructional approaches across classrooms and grades. In some cases, the professional community was an attribute of the school at the outset of the program, enabling the school to move rapidly through the planning and implementation process. In other cases, the planning served to bring teachers together or resulted in strategies that set aside time and resources for collaboration about practice. Principals often played a key role in this process though they were not always the direct source of instructional leadership, which was sometimes provided by other administrators or resource teachers.
As stated above, district policy also played a key role in the development of school-site instructional coherence. In two case study districts, the central office mandated the use of a common, highly- specified curricular program in elementary reading, with aligned regular assessments, professional development, and district monitoring. Despite some conflicts between these curricula and CSRD models adopted by individual schools and despite some teachers’ criticisms of the degree of prescriptiveness, the curricula appeared to engender more consistent and coherent instruction at the school site. Some districts also assisted schools through the assignment of district personnel to provide regular feedback and support to schools in their implementation efforts.
Key Finding: A school’s ability to develop a coordinated and coherent instructional program is a key factor in its ability to meet and surpass academic growth targets.

Chapter 7. Conclusions and Recommendations
Evaluation of the Public Schools Accountability Act of 1999 153
These four themes—PSAA’s impact on attention to student achievement, the variable and small achievement results in II/USP schools, the district influence on instruction and achievement, and the importance of coherence at the school site—cut across all aspects of our data and analysis. The resulting “story” behind II/USP is that PSAA has had a demonstrable impact on statewide attention to student achievement and low performing schools, as evidenced by the large gains in API and SAT-9 scores. The independent additive effect of II/USP and GPA, meanwhile, has been negligible, overshadowed by a strong district influence on practice and achievement and by large variations in capacity of individual schools to take advantage of opportunities afforded by II/USP dollars. We have suggested several implication for policy stemming from these four central findings. Below, we present additional findings and suggestions regarding the more specific design features of II/USP.
Implications for policy:
State level: The state is limited in its ability to directly influence instructional coherence at the school level. What the state can do is to establish and maintain a policy environment that supports rather than undermines coherence.
• Alignment of standards, assessments, professional development programs, and other instructional policies are important. This alignment process is underway in California – as demonstrated by the increased emphasis on the California Standards Test in the API – and should continue.
• Policy stability, consistency, and transparency are also important for promoting coherence. Frequent changes in accountability policies and programs engender confusion and mistrust. Burdensome and conflicting requirements for multiple plans and reporting siphon off school energy and attention from more instructionally relevant tasks.
District level: District personnel and external support providers should place priority on helping schools develop internal capacity and a coherent instructional program.
• School improvement planning efforts and assistance from external agents – including the district – should be geared in this direction and monitored for their effectiveness.
• Improvement efforts should seek to foster instructional collaboration and professional community among teachers through a common focus on student learning.
• Districts should pay particular attention to the deployment and development of instructionally strong leaders – and teachers – in low performing schools.

Chapter 7. Conclusions and Implications
154 Evaluation of the Public Schools Accountability Act of 1999
Lessons Specific to the Design and Implementation of II/USP and GPA
In this section we discuss the findings of this evaluation that are directly related to key design elements of II/USP and/or GPA, as specified in the theory of action in Chapter 1. Our goal is to tease out lessons that can inform not only the remaining implementation of II/USP but future accountability policies as well.
Identification of Low Performing Schools
One difference between II/USP and similar accountability programs in other jurisdictions is that participation in II/USP is assumed to be voluntary. The state identifies schools that are eligible for the program, and then schools apply to participate. Selection is random from the pool of applicants. The rationale for voluntary participation is that it will lead to greater buy-in and motivation on the part of participating schools. In practice, participation was often mandated by the district, more so for later cohorts than for cohort 1. While some schools resented both the label “under-performing” and the lack of choice in participation, the lack of voluntarism did not seem to influence ultimate improvement efforts or achievement. We therefore conclude that this voluntarism was not a significant aspect of the policy design.
Other issues in the identification of II/USP schools concern the eligibility criteria. One criterion was that schools rank in the bottom half of the state in their API score. The second is that they fail to make either their schoolwide or their subgroup targets for one year. Taken together, these two criteria led to a large number of schools being identified for potential participation. This policy design has the advantage of getting the attention of a broader range of schools (schools in the middle performance levels as well as low performers) but has the disadvantage of potentially drawing in schools that have less need of the additional resources and assistance. Schools that had previously made all their targets but missed on one subgroup goal were given equal eligibility with those that had failed to make any targets on multiple occasions. In addition, the policy assumes that schools will improve by roughly the same amount every year. In fact, growth was less even. Some schools made very large gains one year, followed by a year of consolidation and small gain the next. The API currently has no means for averaging improvement over a period of time longer than one year.
Findings:
• The assumption of voluntary participation in II/USP was not realized for the majority of schools; however, the lack of voluntarism did not appear to have any long term effect on improvement efforts or achievement gains.
• II/USP eligibility criteria spread dollars and assistance across a wide range of schools, some of whom were more demonstrably in need of resources and assistance than others.

Chapter 7. Conclusions and Recommendations
Evaluation of the Public Schools Accountability Act of 1999 155
School Improvement Planning
II/USP, like similar policies elsewhere, places considerable emphasis and faith in the school improvement planning process. We found that faith to be somewhat misguided. Although generally implemented according to legislative specifications, the planning process failed to make good on its initial promise. For one thing, the quality and depth of the planning year experiences varied greatly, as did the quality and capacity of External Evaluators and their organizations. However, even where External Evaluators were strong and the planning process was generally considered successful, influence on subsequent practice was often minimal. We believe that one main reason for the lack of relationship between planning and changes in either practice or outcomes is that the planning process was divorced from implementation in many respects. Moreover, we contend that this separation is a flaw in the design of the policy.
External Evaluators were initially required to be not only external to the school but also to the district and county system. This meant that External Evaluators were often unfamiliar with the district or school context. CDE recently addressed this problem by allowing schools to contract with their own district or county office to provide external evaluator assistance. More important perhaps than who provides the service, is the fact that the External Evaluator component of the program was designed to be only for the planning year. External Evaluators thus generally lacked an on-going commitment to the school and to implementation of the plan. Indeed, as we indicated in Chapter 1, II/USP is a very “front loaded” policy in that all specification of what might be called a “program” occurs with regard to planning in the first year. In years 2 and 3, II/USP becomes mainly a funding stream, with the expectation that schools will use these funds to implement the plan developed in Year 1. The lack of either regular assistance or monitoring of the implementation process in those subsequent years
Implications for policy:
Two implications stem from this discussion:
• To ensure greater reliability in the identification process, the state should base eligibility for accountability programs on more than one year’s trend in achievement growth.
• Given the current fiscal climate, we further urge the state to target scarce discretionary resources to the lowest performing schools, as it does in the High Priority Schools Grant program, rather than the broad range of performance levels, as was the case for II/USP.
Finding: Although External Evaluators, districts, and schools implemented the planning year provisions specified in the PSAA, school improvement planning did not necessarily lead to instructional coherence or improved achievement outcomes for II/USP schools.

Chapter 7. Conclusions and Implications
156 Evaluation of the Public Schools Accountability Act of 1999
undermined the value and effectiveness of even the best plans. In some cases, districts required schools to contract with an external support provider after the planning year and/or provided monitoring and assistance themselves from the central office. Where such assistance occurred in our case study schools, the school was more likely to implement the original (or a revised) Action Plan.
Resources
In this section, we discuss three types of resources in II/USP and GPA schools: money, time, and information. Each of these resources is vital to a school’s ability to improve instructional practice and student learning. Overall we found that planning and implementation of II/USP was hampered by late dispersal of funds, short time frames for meeting legislated deadlines, and inadequate information provided to schools by the state and/or districts about II/USP. GPA experienced even more severe delays in funding, as well as dwindling program funds.
Both II/USP and GPA provide additional funds intended either to assist schools in developing and implementing improvement efforts or to reward schools for achieving improvement targets. In Chapters 4, 5, and 6, we outlined the ways in which II/USP and GPA schools spent the funds they received through these programs. We noted that all cohorts of II/USP schools spent their funds on goods and services directly related to instruction, including support providers, professional development and release time, instructional materials, and instructional personnel. GPA schools, particularly those in the upper deciles, were more
Implication for policy: We urge the state to place greater emphasis on the implementation of any improvement plans developed through the accountability process. This emphasis may take a number of forms.
• Schools could be encouraged to develop multi-year contracts with external support providers, with those providers assuming some form of accountability for the progress of the schools in their charge.
• Other options would bring the district into the planning and implementation picture to a greater extent through district plans, support for implementation, and accountability for school outcomes.
Findings:
• Delays in state dispersal of funds hampered both the planning and implementation activities in II/USP schools and the use of GPA funds by award recipients.
• Schools spent program monies as expected, with II/USP spending being somewhat more directly related to instruction than that of GPA funds.
• Time and information were resources in high demand and often in short supply in II/USP schools.
Chapter 7. Conclusions and Recommendations
Evaluation of the Public Schools Accountability Act of 1999 157
likely to spend their award money on one time purchases related to technology or facilities than were II/USP schools. In both cases, schools often received the funds so late that they were unable to use them in the ways intended. Planning in II/USP schools was hampered by late arrival of funds to pay the External Evaluators coupled with the tight deadlines for carrying out the required activities before the plan had to be submitted to the state. Similar delays in subsequent years meant that schools were often unable to implement all of the activities laid out in their Action Plans, especially if those activities involved professional development or purchases to occur before the start of fall semester. In some cases, districts advanced money to schools in anticipation of the forthcoming state funds, but when the number of affected schools in the district was high, this accommodation was not always possible. We find little excuse for these logistical impediments to improvement efforts and urge the state to streamline its allocation process.
With respect to the adequacy of II/USP funds, most respondents believed that the monies allocated for planning were sufficient, but that funds for implementation were not. One reason for the perceived inadequacy may rest in the design of the eligibility criteria. More specifically, II/USP funds were spread across a broad range of schools (those in the bottom half of the achievement distribution who hadn’t met their targets) rather than being concentrated on those in most apparent need. In addition, the use of a single year’s targets as an eligibility criterion may have contributed to the selection of some schools that did not really require the proffered assistance. The HPSG program, by contrast, concentrates program dollars on the bottom decile of schools—those most in need. A possible trade-off in such an approach may be that the lowest achieving schools do not necessarily have the capacity to use the additional funds well. On the other hand, if funds are more narrowly targeted, grants to individual schools can be larger. With larger grants and more district attention, those schools may be able to build the requisite capacity over time. We believe this concentration of funds to be a reasonable approach to the use of accountability data to guide resource allocation. Unfortunately, the situation vis a vis identification of low performing schools is about to change yet again—this time due to the impending implementation of the federal No Child Left Behind Act. NCLB regulations defining “Adequate Yearly Progress” will likely place a very large proportion of California schools in the category of those not meeting “AYP” and so “in need of improvement.” Despite these requirements, we would encourage state policy makers to find a way to continue the concentration of improvement funds in the schools where they are most needed and in amounts that are more likely to lead to changes in practice.
Two other resources that were in high demand in II/USP schools were time and information. Time was not only constrained by various deadlines and late dispersal of funds, particularly in the planning year, it was also limited because of the sheer number of demands on schools and the overwhelming emphasis on reading and mathematics instruction. School-level respondents complained repeatedly about the allocation of long blocks of time to highly specified mathematics and literacy instruction such that they did not have time to spend teaching other subjects or addressing other student developmental needs. We mentioned this problem as an unintended consequence of the attention garnered by PSAA, but we felt it important to repeat here. Additionally, some school personnel pointed to the lack of sufficient information about the II/USP program as an impediment either to buy-in at the school site or appropriate implementation.
Chapter 7. Conclusions and Implications
158 Evaluation of the Public Schools Accountability Act of 1999
II/USP and GPA Incentives
The PSAA theory of action anticipates that both the threat of sanctions should a school fail to improve and the promise of financial rewards should a school meet its growth targets will serve to increase schools’ attention and motivation to improve student achievement. In order for these threats and promises to have their desired effect, however, they must be salient to school staff—i.e., staff must be aware of the incentives and believe they will be implemented under the conditions outlined by the state.
Though stakeholders were oftentimes well aware of the threat of sanctions for II/USP schools, they held mixed views on the ability of such threats to instill motivation for improvement. Some school staff believed the punitive nature of II/USP was disheartening, rather than motivating. In addition, school staff were skeptical that severe sanctions would actually be imposed by the state. In contrast, the less severe consequences like a public hearing or a state assistance team were deemed more likely to occur. Indeed, due to the high number of schools that did not meet growth targets in 2002, the state reduced the pool of sanctioned schools to those that made no growth at all during the two II/USP implementation years. Even one point of improvement on the API scale garnered an additional year of support. Even for sanctioned schools, the consequences incurred were of low severity—in the form of state intervention and assistance teams. This minimal level of sanctioning for Cohort 1 schools has likely led school staff to disbelieve that the state will impose severe sanctions in the near future. This disbelief mitigates whatever motivating effect the threat might have had.
Implications for policy:
Three implications from this discussion stand out:
• The state should streamline the allocation process to ensure that funds arrive in schools in a timely manner if they expect the accountability program to produce desired results.
• We urge the state to continue the practice begun in the High Priority School Grants program of concentrating funds in the schools most in need of improvement – that is, those in the lowest decile(s) of performance.
• Timing problems at the school site may be alleviated somewhat through greater instructional coherence and focus. However, as stated above, the current focus on reading and mathematics needs to be balanced with attention to other subjects and to students’ broader developmental needs.
Finding: Neither the threatened severe sanctions of II/USP nor the potential awards promised through the GPA program were salient among school personnel.

Chapter 7. Conclusions and Recommendations
Evaluation of the Public Schools Accountability Act of 1999 159
In the case of the GPA program, we found both the awareness and saliency of awards—therefore their motivating power—to be minimal. Though recipient schools were pleased to have received the rewards and found them to be a nice acknowledgement of their hard work, they did not believe the awards had been a strong motivating factor to improve instruction. In addition, we found that the majority of school staff did not expect that their school will actually receive awards if their outcomes improve. We expect that the state’s failure to come through on awards promised by PSAA in the past two years (in addition to late disbursal of the awards the previous two years) has likely undermined school personnel’s expectations that the state will fulfill promises of awards in the future.
Conclusion
Data and analyses from this evaluation demonstrate the broad impact of PSAA and the API at the same time they point to the very limited additive effect of the II/USP and GPA programs. This lack of average effect across schools, however, masks the large variation in how participant schools fared in the program and the mediating role that districts play in fostering improvement in their low performing schools. Attention and instructional coherence became key themes from our case study and survey data. We speculate that II/USP was able to capture initial attention in participating schools but lacked structures to ensure that this attention was maintained or directed toward implementing coherent strategies after the planning year. We have suggested a number of ways that II/USP or similar policies might be strengthened.
At this point, a cautionary note is in order. These analyses derive from data collected at a particular point in time, relatively early in the implementation of the PSAA programs. We do not know what the longer-term trajectories for II/USP schools will be. Moreover, the analyses raise important questions about the factors that influence the implementation and effects of the accountability program that have been outside the scope of this short-term evaluation to resolve. We strongly urge the state to continue to follow the progress of II/USP participants and to support further exploration into effective ways to assist low performing schools. California has made important gains in the past few years. A thoughtful approach to accountability at this juncture could help to solidify and expand the state’s progress.
Implications for policy:
• In order for incentives, either punitive or rewarding in nature, to instill attention and motivation among school staff, the incentives should be realistic in scope and implemented consistently across years.
• We would not argue for the most severe sanctions to actually be implemented at this time, especially given the lack of research evidence as to their effectiveness, but would caution the state against making empty promises or threats in the future.
• Additional resources and assistance for improvement efforts, combined with attention to outcomes, may be more powerful incentives than extrinsic rewards and sanctions.

Chapter 7. Conclusions and Implications
160 Evaluation of the Public Schools Accountability Act of 1999

Evaluation of the Public Schools Accountability Act of 1999 161
References
Abelman, C. & Elmore, R.F., with Even, J., Kenyon, S., & Marshal, J. (1999). When accountability knocks, will anyone answer? (CPRE Research Report #RR-040). Philadelphia, PA: University of Pennsylvania, Consortium for Policy Research in Education.
American Institutes for Research (forthcoming). Evaluation of the Blueprint for Student Success in a Standards-Based System, Year 2 Interim Report. Palo Alto, Ca: American Institutes for Research.
Argyris, C. and Schon, D.A. (1978). Organizational learning: A theory of action perspective. Reading, MA: Addison Wesley.
Bryk, A. (2002). No Child Left Behind, Chicago style: What has really been accomplished? Paper presented for Taking Account of Accountability: Assessing Policy and Politics, Harvard University, June, 2002.
Carlson Le Floch, K. and Desimone, L. (2002, April). Probing the trickle-down effects of standards and assessments: Are we asking the right questions? Paper presented at the annual meeting of the American Educational Research Association, New Orleans, LA.
Chimerine, C.B., Haslam, M.B., and Laguarda, K.G. (1994). Third year evaluation of the nine-site program improvement initiative. Washington, DC: Policy Studies Associates.
Cohen, D.K. and Ball, D.L. (1999). Instruction, Capacity, and Improvement. Philadelphia, PA: Consortium for Policy Research in Education.
CRESST (2002). Standards for educational accountability systems. (CRESST Policy Brief, 5). Los Angeles, CA: University of California at Los Angeles, National Center for Research on Evaluation, Standards, and Student Testing.
Darling-Hammond, L. (1996). Restructuring Schools for High Performance. In S. Fuhrman & J. A. O’Day (Eds.), Rewards and Reform: Creating Educational Incentives that Work. San Francisco, Jossey-Bass Publishers (144-192).
DeBray, E., Parson, G., & Woodworth, K. (2001). Patterns of response in four high schools under state accountability policies in Vermont and New York. In S. Fuhrman (Ed.), From the capitol to the classroom: Standards-based reform in the states (pp. 170-192). Chicago: University of Chicago Press,.
Duffy, M. (2001, April). America’s reform inferno: The nine layers of accountability. Paper presented at the annual meeting of the American Educational Research Association, Seattle, WA.
EdSource (2001). Aligning California’s Education Reforms: Progress Made and the Work that Remains. January 2001.
Elmore, R. F. (2001, April). Psychiatrists and light bulbs: Educational accountability and the problem of capacity. Paper presented at the annual meeting of the American Educational Research Association, Seattle, WA.
References
162 Evaluation of the Public Schools Accountability Act of 1999
Elmore, R. F. (2000, Winter). Building a new structure for school leadership. Washington, DC: The Albert Shanker Institute.
Finnigan, K. S. & Gross, B. M. (2001, April). Teacher motivation and the Chicago probation policy. Paper presented at the annual meeting of the American Educational Research Association, Seattle, WA.
Finnigan, K.S. & O’Day, J.A. (2003) External Support to Schools on Probation: Getting a Leg Up? (In Press) Research report jointly published by the Consortium for Policy Research in Education and the Consortium on Chicago School Research, University of Pennsylvanian, Philadelphia, PA.
Fuhrman, S. H. (1999, January). The New Accountability. CPRE Policy Brief Series RB-27. Philadelphia, PA: Consortium for Policy Research in Education, University of Pennsylvania.
Fullan, M. (1991). The New Meaning of Educational Change, Second Edition. New York: Teachers College Press, Columbia University.
Goertz, M., Duffy, M.C., with Carlson Le Floch, K. (2001). Assessment and accountability systems in the 50 states: 1999-2000. (CPRE Research Report No. RR-046). Philadelphia, PA: University of Pennsylvania, Consortium for Policy Research in Education.
Grissmer, D.W., Flanagan, A., Kawata, J., & Williamson, S. (2000). Improving student achievement: What NAEP state test scores tell us. Santa Monica, CA: RAND Corporation.
Gwynne, J. & Easton, J. Q. (2001, April). Probation, organizational capacity, and student achievement in Chicago elementary schools. Paper presented at the annual meeting of the American Educational Research Association, Seattle, WA.
Haney, W. (2000). The myth of the Texas miracle in education. Education Policy Analysis Archives, 8, 41.
Hanushek, E., and Raymond, M. (2002). Lessons and limits of state accountability systems. Paper presented for Taking Account of Accountability: Assessing Policy and Politics, Harvard University, June, 2002.
Hirshberg, D. (2003, April). What’s in a label? Educators’ attitudes about the designation of their schools as “underperforming”. Paper presented at the annual meeting of the American Educational Research Association, Chicago, IL.
Jacob, B. (2002, April). Making the grade: The impact of test-based accountability in schools. Kennedy School of Government, Harvard University (mimeo).
Kane, T., & Staiger, D. (2001, March). Improving school accountability measures. WP 8156, National Bureau of Economic Research.
Kelley, C., Milanowski, A., and Heneman, H. (1998, April). Changing teacher compensation: Cross-site analysis of the effects of school-based performance award programs. Paper presented at the annual meeting of the American Educational Research Association. San Diego, CA.
Kelley, C., Odden, A., Milanowski, A., and Heneman, H. (2000). The motivational effects of school-based performance awards. (CPRE Policy Brief #RB-29). Philadelphia, PA: University of Pennsylvania, Consortium for Policy Research in Education.
References
Evaluation of the Public Schools Accountability Act of 1999 163
Klein, S. P., Hamilton, L. S., McCaffrey, D. F., & Stecher, B. M. What do test scores in Texas tell us? Washington, DC: RAND.
Koretz, D., & Barron, S. (1998). The validity of gains on the Kentucky instructional results information system. (MR-1014-EDU) Santa Monica, CA: RAND.
Ladd, H. & Glennie, E. (2001). A replication of Jay Green’s voucher effect study using North Carolina data. In School vouchers: Examining the evidence. M. Carnoy (Ed.). Washington, DC: Economic Policy Institute: 49-52.
Lawler, E.E., III. (1994). Motivation in work organizations. San Francisco: Jossey-Bass.
Levine, D. and Lezotte, L. (1990). Unusually Effective Schools: A Review and Analysis of Research and Practice. Madison, WI: National Center for Effective Schools Research and Development.
Linn, R. (2000). Assessments and Accountability. Educational Researcher, 29 (2), 4-16.
Locke, Edwin A., & Latham, Gary P. (1990). A theory of goal setting and task performance. Englewood Cliffs, NJ: Prentice Hall
Loucks-Horsely, S. & Mundry, S. (1991). Assisting chance from without: The Technical assistance function. In J.R. Bliss, W.A. Firestone, & C.E. Richards (Eds.), Rethinking effective schools: research and practice. Inglewood Cliffs, NJ: Prentice Hall.
McLaughlin, M. and Talbert, J. (1993). Contexts that Matter for Teaching and Learning. Palo Alto: Stanford University, School of Education, Center for Research on the Context of Teaching.
March, J.G., (1994). A Primer on decision making: How decisions happen. New York: The Free Press.
Micklethwait, J. & Wooldridge, A. (1996). The Witch doctors: Making sense of the management gurus. New York: Times Books.
Mohrman, S. A. and Lawler, E. E. (1996). Motivation for School Reform. In Fuhrman, S. H. & J.A. O’Day (Eds.) Rewards and Reform Creating Educational Incentives That Work. San Francisco, Jossey-Bass Publishers: 115-143.
Newmann, F. M. and Wehlage, G.G. (1995) Successful School Restructuring: A Report to the Public and Educators by the Center on Organization and Restructuring of Schools. Madison, WI: The Center on Organization and Restructuring of Schools.
O’Day, J. A. (1996). Incentives and school improvement. In S. Fuhrman & J. A. O’Day (Eds.), Rewards and reform: Creating educational incentives that work (pp. 1-16). San Francisco, Jossey-Bass.
O’Day, J.A. (2002) Complexity, Accountability, and School Improvement, Harvard Educational Review, Vol. 72, No. 3, pp. 293-329.
O’Day, J. (2003, April). Accounting for the Effects of Accountability: Framework and Design for Evaluating California’s Public School Accountability Act of 1999. Paper presented at the annual meeting of the American Educational Research Association, Chicago, IL.

References
164 Evaluation of the Public Schools Accountability Act of 1999
O’Day, J., Goertz, M., & Floden R.(1995) Building Capacity for Education Reform. CPRE Policy Brief. New Brunswick, NJ: Rutgers University, Consortium for Policy Research in Education.
Odden, A., & Kelly, C. (1997). Paying teachers for what they know and do: New and smarter compensation strategies to improve schools. Thousand Oaks, CA: Corwin.
Porter, A. (2000, December). Doing High-Stakes Assessment Right. The School Administrator (web edition).
Porter, A. (2002, April). Assessment, Accountability, Instruction, and Learning in Selected Urban Districts, discussant remarks. Annual Meeting of the American Educational Research Association, New Orleans, LA.
Porter, A., Floden, R., Freeman, D., Schmidt, W., and Schwille, J. (1988) Content Determinants in Elementary School Mathematics. Grouws, D. and Cooney, T. (eds.) Perspectives on Research on Effective Mathematics Teaching, Volume 1. Reston, VA: National Council of Teachers of Mathematics, Inc.
Purkey, S. and Smith, M. (1983). Effective Schools: A Review. Elementary School Journal, 83 (4), 427-452.
Rowan, B. (1996). “Standards as incentives for instructional reform” in S. Fuhrman and J. O’Day (Eds.). Rewards and Reforms. San Francisco, CA: Jossey-Bass.
Appendix A:
Analysis Methods and Supplementary Tables for Chapter 3

Appendix A
Evaluation Study of the Public Schools Accountability Act of 1999 A-1
Overview
In this Appendix, we describe in more detail the methods used in conducting the analyses reported in Chapter 3. We begin with the statewide analyses, discussing the selection of the analytic sample of II/USP and comparison schools. Next, we describe the achievement measures and control variables, and we present descriptive information on the sample. We then consider the statistical methods and present tables of parameter estimates for the statewide analyses.
Following the statewide analyses we discuss the longitudinal analysis of linked student-level data obtained from three case study districts. We describe the procedure and models used for this analysis, and then present results.
Statewide Analyses: Analytic Challenges, Strategy, and Method
Sample of II/USP and Comparison Schools
Determining the sample for these analyses involved decisions both about which II/USP schools to include and about the appropriate comparison group of non-II/USP schools.
Sample of II/USP schools
Cohorts 1, 2, and 3. The first group of schools to participate in the II/USP program (Cohort 1) received their awards in the 1999-00 school year. As of the spring 2002 testing (the most recent data available), Cohort 1 schools had been in the program for three years, including one year of planning and two years of implementation. Cohort 2 schools, which received their initial round of support in 2000-01, had completed one planning year and one year of implementation by spring 2002. Cohort 3 schools, which received their initial round of support in 2001-02, were completing their first (planning) year at the time of 2002 testing. (See Exhibit A1-a for information on the number of schools receiving II/USP support. The full list of schools receiving II/USP support can be found at http://www.cde.ca.gov/iiusp/).
Exhibit A1-a: Number of II/USP schools by cohort, funding source, and school type Elementary Middle High Small Total
Cohort 1 CSRD Schools 56 13 10 1 80 Non-CSRD Schools 241 65 43 1 350 Total 297 78 53 2 430
Cohort 2 CSRD Schools 33 10 4 0 47 Non-CSRD Schools 224 92 67 0 383 Total 257 102 71 0 430
Cohort 3 CSRD Schools 10 1 5 0 16 Non-CSRD schools 289 51 74 0 414 Total 299 52 79 0 430

Appendix A
Evaluation Study of the Public Schools Accountability Act of 1999 A-2
CSRD. As noted in Chapter 3, the II/USP program incorporates two funding sources for improvement in low performing schools: state-appropriated II/USP funds (“Action Plan” schools) and federally allocated Comprehensive School Reform Demonstration grants (CSRD schools). While both groups of schools are considered to be participants in the II/USP program, the selection and allocation rules and procedures CDE employed for Cohort 1 differed between CSRD and Action Plan schools. Because of these differences, we treated the 80 Cohort 1 CSRD schools and the 47 Cohort 2 CSRD schools separately in the initial analysis presented here.1
Selection of comparison schools
To determine whether II/USP schools made progress after receiving program support, we compared II/USP schools with non-II/USP schools with similar school characteristics.
For Cohort 1, the State of California solicited applications from the 3,145 schools in the state that were in the bottom half of the state on the SAT-9 in both 1998 and 1999. Altogether, 1,420 schools applied to participate, and the State selected 350 II/USP participants at random from the applicants, by school type (elementary, middle, and high) and SAT-9 performance bands.2 Because applicant schools may have differed in unknown and thus unmeasured ways from eligible schools that did not apply for the program, we determined the non-selected pool of applicants to be a strong comparison group for this analysis.3 Fortunately, the large number of applicants relative to participants and the random selection of participants from among applicants made this group a sound and feasible choice for Cohort 1.
For Cohort 2, the State solicited applications from all 936 schools in the state that were in the bottom five API deciles in 2000 and had not achieved their growth targets from 1999 to 2000. As it did the prior year, the State selected II/USP participants at random from those that applied, within school types and API deciles. Altogether, 528 schools applied, and 430 were selected. The pool of 98 schools that applied but were not selected included no elementary schools, 38 middle schools, 55 high schools, and 5 small or alternative schools. Given the absence of elementary schools in the pool of non-selected applicants and the relatively small sample of middle schools, we concluded that the pool of non-selected applicants was too small to serve as a comparison group, and thus we used the pool of eligible schools instead. While this is not an ideal comparison, we concluded that it was the best option available.4
1 We also excluded one Cohort 1 II/USP school that is identified as a small school in the CDE database – that is, a
school enrolling fewer than 100 students and thus not included in the regular reporting of API scores. 2 Another 80 schools were selected for participation in the CSRD-supported component of the program. These schools
had applied and were selected for the CSRD program in summer 1999. They were subsequently placed into the II/USP program in fall of 1999. Thus they were selected based on a different process from the “Action Plan” schools.
3 One way to assess the appropriateness of the comparison group is to examine the API or SAT-9 trajectories in II/USP and comparison schools prior to selection for participation in 1999. Ideally, the two groups should have identical pre-award trajectories. We explored several potential comparison groups in addition to schools that applied but were not selected, including the full population of schools eligible for II/USP in 1999, and we found that these other potential comparison groups did not resemble the pre-award trajectories as well as the set of non-selected applicants.
4 It might have been possible to use non-selected applicants for the comparison at the middle and high school levels, but we decided it was preferable to maintain a parallel comparison group across elementary, middle, and high schools.

Appendix A
Evaluation Study of the Public Schools Accountability Act of 1999 A-3
For Cohort 3, the State solicited applications from all 1,266 schools in the state that were in the bottom five API deciles in 2001 and had not achieved their growth targets from 2000 to 2001. As it did the prior year, the State selected II/USP participants at random from those that applied, within school types and API deciles. Altogether, 751 schools applied, and 430 were selected. The pool of schools that applied but were not selected included 128 elementary schools, 107 middle schools, 86 high schools, and no small or alternative schools. Given the relatively small number of available comparison schools that applied but were not selected, we used the pool of eligible schools.
Subsequent participation of comparison schools in II/USP. Some comparison schools for Cohort 1 II/USP schools were eligible to participate in II/USP in 2000 and/or 2001, and some of those eligible applied and participated. Similarly, some comparison schools for Cohort 2 II/USP schools were eligible to participate in 2001 (See Exhibit A1-b for the numbers involved.) Thus, the control group for both the Cohort 1 and Cohort 2 analyses includes some schools that received II/USP support in later years. (This problem does not arise for the analysis of Cohort 3 schools, because we have data only for the first year in which Cohort 3 received funds. Comparison schools would not have become eligible for participation in subsequent years until after the first year.)
We reasoned that excluding comparison schools that subsequently participated in II/USP Cohort 2 from the comparison group for Cohort 1 would bias the apparent “II/USP effect” downwards in 2000, since it would remove unusually low-performing schools from the comparison group that year – schools that failed to meet their achievement targets and were thus eligible for participation in II/USP that year. Excluding comparison schools that subsequently entered II/USP Cohort 3 would remove unusually low-performing schools from the comparison group for both Cohort 1 and 2 in 2001, for similar reasons. On the other hand, retaining comparison schools for Cohort 1 that subsequently participated in II/USP Cohort 2 would likely bias the apparent “II/USP effect” downwards in 2001 and 2002, since the comparison group would include some schools that received the achievement benefits, if any, of participation in II/USP in these years. Similarly, retaining comparison schools for Cohort 1 or 2 that participated in II/USP Cohort 3 would bias the “II/USP effect” downward in 2002.
We dealt with this problem by investigating an estimation procedure to adjust the achievement outcomes for the comparison schools that subsequently participated in II/USP, to reflect their participation in II/USP. This analysis was conducted in steps. First, we used the Cohort 3 analysis to estimate the “true effect” of participating in Cohort 3. We used the results of this analysis to adjust the API scores for Cohort 2 comparison schools that participated in Cohort 3. We then used these adjusted scores in an analysis estimating the “true effect” of participating in Cohort 2. Finally, we used the results of these analyses to adjust the API scores for Cohort 1 comparison schools that participated in II/USP Cohorts 2 and 3. We then used these adjusted scores in an analysis estimating the “true effect” of participating in Cohort 3.5 We found that adjustment had little impact on the size or significance of the relationships, and therefore present the more straightforward unadjusted analyses throughout this report. For illustrative purposes, we include results of the adjusted analyses of API scores for Cohorts 1 and 2 (Exhibits A9-b and A10-b).
5 We are indebted to Hendricks Brown for suggesting this analysis strategy. These estimates would be unbiased if the
schools participating in II/USP Cohorts 2 and 3 were randomly drawn from those that were eligible.

Appendix A
Evaluation Study of the Public Schools Accountability Act of 1999 A-4
Exhibit A1-b: Number of Cohort 1, Cohort 2, and Cohort 3 comparison schools, and number of Cohort 1 and Cohort 2 comparison schools subsequently participating in II/USP
Elementary Middle High Total
Cohort 1 comparison schools Subsequently participated in Cohort 2 129 50 38 217 Subsequently participated in Cohort 3 127 28 26 181 Did not participate 455 90 57 602 Total 709 168 120 1000*
Cohort 2 comparison schools Subsequently participated in Cohort 3 30 16 35 81 Did not participate 197 109 113 419 Total 227 125 148 500**
Cohort 3 comparison schools Total 493 164 179 836*** * Of the 3,145 schools that were eligible to participate in II/USP Cohort 1, 1,423 schools are recorded in the CDE
database as having applied, including four small schools. Thus, the total number of elementary, middle, and high schools that applied was 1,419. In addition, 10 Cohort 1 II/USP schools are not shown in the database as having applied, including one small school. If these are included, the total number of elementary, middle, and high school applicants was 1,428. Since 428 elementary, middle, or high schools were selected for participation (see Exhibit A1-a), the number of schools in the Cohort 1 comparison group is 1000. The analyses in our first year report were based on 997 Cohort 1 comparison schools. The 3 additional schools included this year were missing their school type code in the API database (i.e., their status as elementary, middle, or high schools), but we subsequently located their school type in the CDE database identifying schools eligible for II/USP.
** According to the CDE database, 936 schools were eligible for II/USP in 2000, including 930 elementary, middle, and high schools, one alternative school, and five small schools. Of these, 430 were selected for participation. Thus, the number of Cohort 2 elementary, middle, and high comparison schools is 500.
*** In 2001, 1,266 schools were eligible for II/USP, and 430 were selected from them as Cohort 3 II/USP schools. Thus, the number of Cohort 3 comparison schools is 836.
Achievement Measures
We focus on three achievement measures: school-level API scores, the percent of schools meeting their API growth targets, and student level SAT-9 scores in reading and mathematics.
School-level API scores. School-level API scores are the primary emphasis of the II/USP program, and thus they are a central outcome measure. To use API scores in the analysis, however, several challenges must be overcome. In particular, because the focus of the evaluation is on change over time in school performance, it is important for performance to be measured on a consistent scale over the five years under study (1998-2002). While official API scores are available for spring 1999, 2000, and 2001, they are not available for 1998. In addition, the method used to calculate official API scores changed across the three years for which scores are available, due to the incorporation of additional assessments.6
To overcome these challenges, we created a set of synthetic API scores for each school, using the school’s official 1999 base API as the starting point. We refer to these scores as “synthetic” to reflect the fact that, although they are derived from each school’s official API
6 The rules used to exclude students based on mobility also changed between 1999 and 2000.

Appendix A
Evaluation Study of the Public Schools Accountability Act of 1999 A-5
scores for the years under study, we have transformed them slightly to make them more comparable over time, and we have computed scores for 1998, for which official API scores are not available.
To calculate the synthetic 2000 API, we added the school’s official API growth from 1999 to 2000 to the school’s 1999 base score.7 (See box below.) Similarly, to compute the school’s 2001 synthetic API, we added the school’s official API growth from 2000 to 2001 to the school’s synthetic API score. To calculate a synthetic 1998 API, we used student-level SAT-9 scores to compute a synthetic API for both 1998 and 1999, employing the rules the CDE used to calculate the official 1999 base year scores, but including all students enrolled.8 We then computed the change from 1998 to 1999 using this synthetic score for both years and subtracted it from the 1999 base.
Derivation of Synthetic API Scores
1998 synthetic API = 1999 base API minus 1998-99 API growth
1999 synthetic API = 1999 base API
2000 synthetic API = 1999 base API plus 1999-00 API growth
2001 synthetic API = 2000 synthetic API plus 2000-01 API growth
2002 synthetic API = 2001 synthetic API plus 2001-02 API growth
Percent of schools meeting their API growth targets. Beginning in the spring of 1999, the CDE established growth targets for most schools in the state.9 Two targets are set for each school, one based on the school’s overall API score, and the other based on the comparative improvement of specific student subgroups (e.g., subgroups defined by ethnicity, poverty, and special needs status). A schools’ overall schoolwide growth target for the coming year is calculated as 5 percent of the difference between the school’s current API score and 800. To meet the comparative improvement target, each numerically significant subgroup in the school must achieve an API growth of at least 80% of the overall schoolwide growth target. Schools must meet both targets in order to be eligible for awards. Conversely, schools that fail to meet either the schoolwide or comparative growth target are identified as eligible for
7 Each year after 1999, two different API scores are available for each school – a base score, which is used as the basis
for calculating growth over the coming year, and a growth score, which is used as the end-point in calculating growth over the previous year. The two scores are required because the rules used by the State to define API scores changed somewhat each year. The base score incorporates the changes in the definition of the API that have been adopted since the previous year, while the growth score is based on the previous year’s definition. A school’s growth from 1999 to 2000 is computed by subtracting the 1999 base score from the school’s 2000 growth score.
8 Because there was a high rate of missing data for 1998 in the student-level background indicators required to implement the State’s API exclusion rules, we included all students in computing the synthetic API growth from 1998 to 1999. Because the 1998 data were not used to compute official API scores, schools may not have reviewed the student background indicators for completeness and accuracy as carefully as they did in later years.
9 An alternative accountability system has been established “for schools with fewer than 100 students, and for schools under the jurisdiction of a county board of education or a county superintendent of schools, community day schools, and alternative schools, including continuation high schools and independent study schools. Alternative schools are defined as schools that serve a majority of students who are (1) at high risk for behavioral or educational failure, (2) expelled or under disciplinary sanction, (3) wards of the court, (4) pregnant and/or parenting, or (5) recovered dropouts.” This description is quoted from CDE document “Alternative Schools Accountability Model Indicator Reporting Guide for School Year 2001-2002”, which is available from website: http://www.cde.ca.gov/psaa/asam/guide0102.pdf

Appendix A
Evaluation Study of the Public Schools Accountability Act of 1999 A-6
II/USP. Consistent with CDE’s definition of “meeting the API growth target,” our analyses report the percent of schools meeting both targets as having achieved their annual growth goal. Data are available for the spring of 2000, 2001, and 2002 – the first three years for which growth targets were established by CDE.
Student-level SAT-9 scores in mathematics and reading. In addition to school-level API scores, we also use student-level SAT-9 scores in mathematics and reading as a second outcome measure. One advantage of the SAT-9 is that scores are reported on a consistent scale-score metric over the five years under study (1998-2002). In addition, the use of student-level SAT-9 scores allows us to control for a large number of individual student-level variables that may affect achievement and that may differ between II/USP and non-II/USP schools. We restricted the SAT-9 sample to the same schools used in our API analyses, and we performed separate analyses for elementary, middle, and high schools. Our analyses focused on math and reading score for grades 2-5 in elementary schools, grades 6-8 in middle schools, and grades 9-11 in high schools.
Missing achievement data. A few II/USP schools were missing the required data to compute synthetic API scores for one or more years of the study (1998-2002). We excluded these schools from the analytic sample. A somewhat larger proportion of CSRD and comparison schools are missing the required data. (See Exhibit A1-c.)

Appendix A
Evaluation Study of the Public Schools Accountability Act of 1999 A-7
Exhibit A1-c: Number of II/USP, CSRD, and comparison schools with missing synthetic API data for one or more years Elementary Middle High Total
Cohort 1 II/USP non-CSRD schools Schools with complete API scores 204 55 35 294 Schools missing API scores 37 10 8 45 Total 241 65 43 349
Cohort 1 CSRD schools Schools with complete API scores 39 8 8 55 Schools missing API scores 17 5 2 24 Total 56 13 10 79
Cohort 1 comparison schools Schools with complete API scores 596 133 91 820 Schools missing API scores 115 35 20 180 Total 711 168 121 1,000
Cohort 2 II/USP non-CSRD schools Schools with complete API scores 191 74 55 320 Schools missing API scores 23 18 12 63 Total 224 92 67 383
Cohort 2 CSRD schools Schools with complete API scores 29 7 3 39 Schools missing API scores 4 3 1 8 Total 33 10 4 47
Cohort 2 comparison schools Schools with complete API scores 200 107 119 426 Schools missing API scores 27 41 6 74 Total 227 148 125 500
Cohort 3 II/USP non-CSRD schools Schools with complete API scores 237 46 62 345 Schools missing API scores 52 5 15 69 Total 289 51 77 414
Cohort 3 CSRD schools Schools with complete API scores 9 1 5 15 Schools missing API scores 1 0 0 1 Total 10 1 5 16
Cohort 3 comparison schools Schools with complete API scores 407 146 124 677 Schools missing API scores 86 18 55 159 Total 493 164 179 836

Appendix A
Evaluation Study of the Public Schools Accountability Act of 1999 A-8
Control Variables
To adjust for possible demographic differences in II/USP and comparison schools, we included a set of school-level variables in our analyses of API scores, and we included both student-level and school-level variables in our analyses of SAT-9 scores. (See Exhibit A2-a for a list of the variables.) We obtained the school-level variables from the CDE school-level API database, and the student-level variables from the CDE STAR (SAT-9) database.10
Exhibit A2-a: Student-level and school-level control variables included in models Variable names Values Student-level variables
FEMALE 1=female, 0=male ASIAN 1=Asian, 0=not Asian BLACK 1=African/African American, 0=not African/African American HISPANIC 1=Hispanic, 0=not Hispanic OTHERS 1=American Indian or Alaska Native, Filipino/Filipino American, Pacific Islander and other, and
0= not American Indian or Alaska Native, Filipino/Filipino American, Pacific Islander or other EL* 1=Limited English Proficient (LEP), 0=Other students R_FEP 1=Re-designated Fluent English Proficient (R-FEP), 0=Other students EL_MISN 1=if English fluency variable missing, 0=not missing FEP 1=Fluent English Proficient (FEP), and 4=English only SFLUNCH 1=eligible for free or reduced price lunch, and 0=not eligible PARED 1=Not a high school graduate, 2=High school graduate, 3=Some college, 4=College graduate,
5=Graduate school/post graduate training (missing cases imputed using the school mean) PAREDMISN 1=if ParEd missing, 0=not missing SPECED 1=students received special education
School-level variables PCT_ASIAN Percent Asian students (0 to 100) PCT_BLACK Percent African American students (0 to 100) PCT_HISP Percent Hispanic students (0 to 100) PCT_ELL Percent English language learners (0 to 100) AVG_PARED Average education level of students’ parents (1 to 5) MOBILITY Percent of students first attending this school in current year (0 to 100) PCT_FULL Percent of teachers with full credential (0 to 100) PCT_MEALS Percent of students eligible for free or reduced price lunch (0 to 100)
* When EL used as the only dummy variable in the model, EL group includes students of EL and R_FEP.
Treatment of missing data on school-level control variables. A few comparison schools with complete API data had missing values in the school-level control variables for one or more years. We excluded schools from the analysis for the specific years in which they lacked data on the control variables, but retained them in all other years. Exhibit A2-b
10 Because the CDE did not begin computing API scores until 1999, school-level demographic variables comparable to
those appearing on the state API file were not available for 1998. We thus used 1999 values for 1998.

Appendix A
Evaluation Study of the Public Schools Accountability Act of 1999 A-9
provides information on the number of II/USP and comparison schools missing school-level control variable data for at least one year.
Exhibit A2-b: Number of Cohort 1 and 2 schools with one or more years of missing data on school-level control variables Elementary Middle High Total
Cohort 1 II/USP non-CSRD schools Schools with complete values 194 54 35 283 Schools missing values 10 1 0 11 Total* 204 55 35 294 Cohort 1 CSRD schools Schools with complete values 36 8 8 52 Schools missing values 3 0 0 3 Total* 39 8 8 55
Cohort 1 comparison schools Schools with complete values 550 131 91 772 Schools missing values 46 2 0 48 Total* 596 133 91 820
Cohort 2 II/USP non-CSRD schools Schools with complete values 184 74 54 312 Schools missing values 7 0 1 8 Total* 191 74 55 320 Cohort 2 CSRD schools Schools with complete values 28 7 3 38 Schools missing values 1 0 0 1 Total* 29 7 3 39 Cohort 2 comparison schools Schools with complete values 186 104 119 409 Schools missing values 14 3 0 17 Total* 200 107 119 426
Cohort 3 II/USP non-CSRD schools Schools with complete values 215 45 61 321 Schools missing values 22 1 1 24 Total* 237 46 62 345 Cohort 3 CSRD schools Schools with complete values 8 1 5 14 Schools missing values 1 0 0 1 Total* 9 1 5 15 Cohort 3 comparison schools Schools with complete values 380 142 124 646 Schools missing values 27 4 0 31 Total* 407 146 124 677

Appendix A
Evaluation Study of the Public Schools Accountability Act of 1999 A-10
Treatment of missing data on student-level control variables. In the analyses of SAT-9 data, we excluded students who were missing data on any required control variable. Most student-level control variables had small rates of missing data. For parent education, however, data were missing for a substantial number of students. For this variable, we imputed the missing values using the school mean, and then added a missing variable indicator to the model. This missing variable indicator allowed us to estimate the model without losing cases. The coefficients for the missing data indicator can be interpreted as the performance of students with missing data, relative to students at the means on the missing variables.
Description of the Sample
Descriptive statistics for student-level and school-level background variables for II/USP and non-II/USP comparison schools (means and standard deviations) are shown in Exhibits A3-A5. The Cohort 1 school- and student-level background data shown are for 1999, the year prior to selection; the data for Cohort 2 are for 2000; and the data for Cohort 3 are for 2001. The data indicate that II/USP schools were slightly more advantaged on average than the comparison schools. For example, the overall percent free lunch, based on student-level data, is 60 percent for Cohort 1 II/USP elementary schools and 72 percent for comparison elementary schools. The II/USP schools also had slightly higher API scores than the comparison schools in spring 1999, at the time they were selected to participate.11
11 Although Cohort 1 II/USP schools were selected at random, the selection process was conducted separately within
SAT-9 deciles, and the selection rates apparently differed somewhat across deciles. In particular, the proportion of schools selected for participation was somewhat lower in the first decile than in the fifth, resulting in a somewhat higher overall mean API score among schools selected for participation than among schools not selected. It should be noted, however, that Cohort 1 CSRD schools are skewed toward the lower end of the achievement distribution, increasing participation among Decile 1 schools. CSRD schools are not included in these initial analyses.
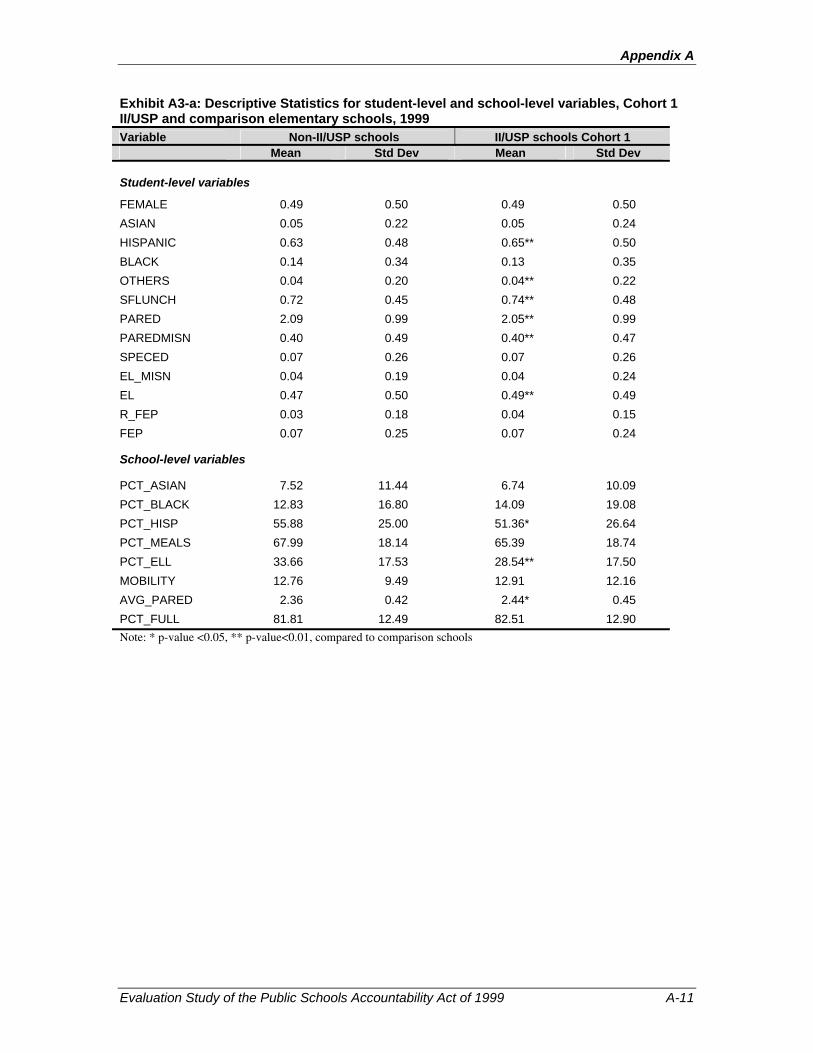
Appendix A
Evaluation Study of the Public Schools Accountability Act of 1999 A-11
Exhibit A3-a: Descriptive Statistics for student-level and school-level variables, Cohort 1 II/USP and comparison elementary schools, 1999 Variable Non-II/USP schools II/USP schools Cohort 1 Mean Std Dev Mean Std Dev Student-level variables
FEMALE 0.49 0.50 0.49 0.50 ASIAN 0.05 0.22 0.05 0.24 HISPANIC 0.63 0.48 0.65** 0.50 BLACK 0.14 0.34 0.13 0.35 OTHERS 0.04 0.20 0.04** 0.22 SFLUNCH 0.72 0.45 0.74** 0.48 PARED 2.09 0.99 2.05** 0.99 PAREDMISN 0.40 0.49 0.40** 0.47 SPECED 0.07 0.26 0.07 0.26 EL_MISN 0.04 0.19 0.04 0.24 EL 0.47 0.50 0.49** 0.49 R_FEP 0.03 0.18 0.04 0.15 FEP 0.07 0.25 0.07 0.24
School-level variables
PCT_ASIAN 7.52 11.44 6.74 10.09 PCT_BLACK 12.83 16.80 14.09 19.08 PCT_HISP 55.88 25.00 51.36* 26.64 PCT_MEALS 67.99 18.14 65.39 18.74 PCT_ELL 33.66 17.53 28.54** 17.50 MOBILITY 12.76 9.49 12.91 12.16 AVG_PARED 2.36 0.42 2.44* 0.45 PCT_FULL 81.81 12.49 82.51 12.90 Note: * p-value <0.05, ** p-value<0.01, compared to comparison schools
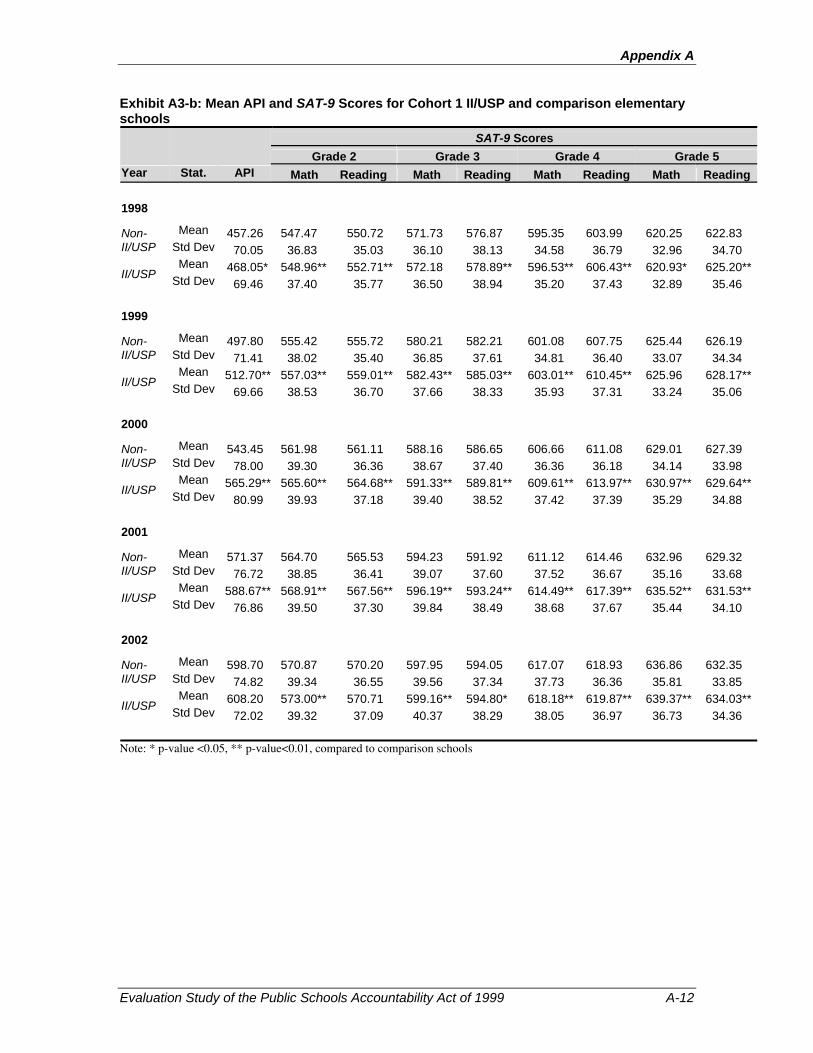
Appendix A
Evaluation Study of the Public Schools Accountability Act of 1999 A-12
Exhibit A3-b: Mean API and SAT-9 Scores for Cohort 1 II/USP and comparison elementary schools
SAT-9 Scores Grade 2 Grade 3 Grade 4 Grade 5
Year Stat. API Math Reading Math Reading Math Reading Math Reading 1998
Mean 457.26 547.47 550.72 571.73 576.87 595.35 603.99 620.25 622.83 Non-
II/USP Std Dev 70.05 36.83 35.03 36.10 38.13 34.58 36.79 32.96 34.70 Mean 468.05* 548.96** 552.71** 572.18 578.89** 596.53** 606.43** 620.93* 625.20**II/USP Std Dev 69.46 37.40 35.77 36.50 38.94 35.20 37.43 32.89 35.46
1999
Mean 497.80 555.42 555.72 580.21 582.21 601.08 607.75 625.44 626.19 Non-
II/USP Std Dev 71.41 38.02 35.40 36.85 37.61 34.81 36.40 33.07 34.34 Mean 512.70** 557.03** 559.01** 582.43** 585.03** 603.01** 610.45** 625.96 628.17**II/USP Std Dev 69.66 38.53 36.70 37.66 38.33 35.93 37.31 33.24 35.06
2000
Mean 543.45 561.98 561.11 588.16 586.65 606.66 611.08 629.01 627.39 Non-II/USP Std Dev 78.00 39.30 36.36 38.67 37.40 36.36 36.18 34.14 33.98
Mean 565.29** 565.60** 564.68** 591.33** 589.81** 609.61** 613.97** 630.97** 629.64**II/USP Std Dev 80.99 39.93 37.18 39.40 38.52 37.42 37.39 35.29 34.88 2001
Mean 571.37 564.70 565.53 594.23 591.92 611.12 614.46 632.96 629.32 Non-
II/USP Std Dev 76.72 38.85 36.41 39.07 37.60 37.52 36.67 35.16 33.68 Mean 588.67** 568.91** 567.56** 596.19** 593.24** 614.49** 617.39** 635.52** 631.53**II/USP Std Dev 76.86 39.50 37.30 39.84 38.49 38.68 37.67 35.44 34.10
2002
Mean 598.70 570.87 570.20 597.95 594.05 617.07 618.93 636.86 632.35 Non-
II/USP Std Dev 74.82 39.34 36.55 39.56 37.34 37.73 36.36 35.81 33.85 Mean 608.20 573.00** 570.71 599.16** 594.80* 618.18** 619.87** 639.37** 634.03**II/USP Std Dev 72.02 39.32 37.09 40.37 38.29 38.05 36.97 36.73 34.36
Note: * p-value <0.05, ** p-value<0.01, compared to comparison schools

Appendix A
Evaluation Study of the Public Schools Accountability Act of 1999 A-13
Exhibit A3-c: Descriptive Statistics for student-level and school-level variables, Cohort 2 II/USP and comparison elementary schools, 2000
Variable Non-II/USP schools II/USP schools Cohort 1 Mean Std Dev Mean Std Dev Student-level variables
FEMALE 0.49 0.50 0.49 0.50 ASIAN 0.07 0.26 0.05** 0.22 HISPANIC 0.61 0.49 0.60** 0.49 BLACK 0.09 0.29 0.18** 0.39 OTHERS 0.03 0.18 0.04** 0.19 SFLUNCH 0.79 0.41 0.82** 0.45 PARED 2.15 1.00 2.13** 1.02 PAREDMISN 0.29 0.45 0.38** 0.48 SPECED 0.08 0.28 0.08* 0.25 EL_MISN 0.00 0.07 0.01 0.22 EL 0.42 0.49 0.46** 0.49 R_FEP 0.03 0.18 0.03 0.16 FEP 0.08 0.27 0.06** 0.23
School-level variables
PCT_ASIAN 0.98 2.58 1.20 5.94 PCT_BLACK 9.01 10.35 18.16** 21.76 PCT_HISP 59.20 21.42 54.05* 26.85 PCT_MEALS 76.60 16.10 78.27 18.22 PCT_ELL 37.82 19.94 40.65 22.03 MOBILITY 20.76 10.54 18.50* 9.22 AVG_PARED 2.18 0.47 2.22 0.52 PCT_FULL 83.35 14.02 79.50** 14.82
Note: * p-value <0.05, ** p-value<0.01, compared to comparison schools

Appendix A
Evaluation Study of the Public Schools Accountability Act of 1999 A-14
Exhibit A3-d: Mean API and SAT-9 Scores for Cohort 2 II/USP and comparison elementary schools
SAT-9 Scores Grade 2 Grade 3 Grade 4 Grade 5
Year Stat. API Math Reading Math Reading Math Reading Math Reading 1998
Mean 490.42 552.13 555.68 578.19 584.63 600.98 611.46 626.23 630.01 Non-II/USP Std Dev 67.55 37.10 36.98 37.09 39.98 36.01 39.03 34.56 36.62
Mean 463.35** 550.15** 553.53** 574.52** 580.16** 597.53** 607.49** 622.33** 626.25**II/USP Std Dev 79.85 37.74 36.37 36.55 38.91 35.49 37.66 33.10 35.34 1999
Mean 529.51 559.83 562.50 585.31 589.35 606.43 615.00 630.68 632.58 Non-II/USP Std Dev 63.74 38.61 37.63 38.25 39.70 36.10 38.21 34.39 36.03
Mean 510.60** 557.88** 559.24** 584.11** 586.81** 603.15** 611.05** 627.64** 629.31**II/USP Std Dev 76.91 38.86 36.68 37.75 39.03 35.56 37.23 33.42 34.88 2000
Mean 544.17 567.06 567.20 593.98 593.73 613.01 617.88 634.87 633.65 Non-II/USP Std Dev 64.88 39.38 37.44 39.58 39.44 37.22 37.65 35.18 35.11
Mean 519.30** 566.11** 564.97** 591.38** 590.63** 609.02** 614.49** 631.89** 630.51**II/USP Std Dev 77.28 39.35 37.27 38.94 38.38 36.56 37.23 34.59 34.43 2001
Mean 577.46 567.21 568.60 595.48 594.93 615.33 620.18 637.50 634.39 Non-II/USP Std Dev 66.23 39.43 37.62 39.95 39.41 37.95 38.00 35.84 34.73
Mean 561.01* 564.13** 565.37** 593.18** 592.23** 610.73** 615.75** 633.22** 630.84**II/USP Std Dev 80.42 38.91 36.87 38.79 38.03 37.44 37.27 35.16 34.37 2002
Mean 595.58 572.73 571.57 599.79 597.38 619.20 622.04 641.21 637.06 Non-II/USP Std Dev 65.95 39.50 37.44 40.02 38.95 38.32 37.73 36.43 34.77
Mean 588.66 569.54** 569.10** 596.78** 594.19** 615.59** 618.73** 636.96** 632.97**II/USP Std Dev 80.71 39.25 37.25 40.03 38.12 37.75 36.80 35.88 34.25 Note: * p-value <0.05, ** p-value<0.01, compared to comparison schools

Appendix A
Evaluation Study of the Public Schools Accountability Act of 1999 A-15
Exhibit A3-e: Descriptive Statistics for student-level and school-level variables, Cohort 3 II/USP and comparison elementary schools, 2001
Variable Non-II/USP schools II/USP schools Cohort 1 Mean Std Dev Mean Std Dev Student-level variables
FEMALE 0.49 0.49 0.49 0.49 ASIAN 0.07 0.05 0.05** 0.04 HISPANIC 0.61 0.60 0.60** 0.63 BLACK 0.09 0.09 0.18** 0.13 OTHERS 0.03 0.03 0.04** 0.03 SFLUNCH 0.79 0.74 0.82** 0.79 PARED 2.15 2.22 2.13** 2.19 PAREDMISN 0.29 0.24 0.38** 0.39 SPECED 0.08 0.10 0.08** 0.10 EL_MISN 0.00 0.00 0.01** 0.00 EL 0.42 0.40 0.46** 0.41 R_FEP 0.03 0.04 0.03 0.05 FEP 0.08 0.07 0.06** 0.07
School-level variables
PCT_ASIAN 1.05 2.48 0.90 1.70 PCT_BLACK 8.88 12.27 13.54** 17.54 PCT_HISP 57.15 24.21 59.58 24.78 PCT_MEALS 72.06 18.17 77.06** 16.74 PCT_ELL 36.50 20.62 37.48 21.31 MOBILITY 20.78 12.42 20.51 8.09 AVG_PARED 2.25 0.45 2.22 0.46 PCT_FULL 85.12 13.54 82.13** 15.18
Note: * p-value <0.05, ** p-value<0.01, compared to comparison schools

Appendix A
Evaluation Study of the Public Schools Accountability Act of 1999 A-16
Exhibit A3-f: Mean API and SAT-9 Scores for Cohort 3 II/USP and comparison elementary schools
SAT-9 Scores Grade 2 Grade 3 Grade 4 Grade 5
Year Stat. API Math Reading Math Reading Math Reading Math Reading 1998
Mean 501.81 550.61 553.25 575.37 580.49 598.97 608.07 624.23 626.69 Non-II/USP Std Dev 70.55 37.05 36.32 36.46 38.95 35.94 38.28 33.78 35.95
Mean 475.99** 547.67** 551.62** 569.80** 576.35** 594.37** 604.14** 618.90** 622.52**II/USP Std Dev 72.69 37.69 36.12 36.41 38.58 35.02 37.37 33.17 34.93 1999
Mean 539.33 558.58 559.53 583.53 586.43 604.94 612.40 628.91 629.69 Non-II/USP Std Dev 68.34 38.58 36.47 37.71 38.52 35.71 37.72 34.54 35.54
Mean 515.69** 556.61** 557.52** 579.19** 582.51** 600.75** 608.89** 625.03** 626.92**II/USP Std Dev 73.53 38.58 36.43 37.23 38.12 35.43 37.22 33.63 34.95 2000
Mean 586.97 560.47 560.94 588.07 588.03 607.43 612.62 630.58 628.98 Non-II/USP Std Dev 63.91 38.73 36.63 38.59 38.15 36.68 36.96 34.40 34.27
Mean 563.61** 555.97** 557.32** 582.92** 584.04** 601.93** 608.15** 625.30** 625.15**II/USP Std Dev 68.46 38.90 36.24 38.58 37.87 36.41 36.26 33.63 34.00 2001
Mean 591.32 567.24 566.03 594.72 591.67 613.46 616.53 636.09 631.88 Non-II/USP Std Dev 66.93 39.36 37.40 39.74 39.05 37.63 37.11 35.89 34.06
Mean 563.67** 562.84** 564.03** 590.62** 589.26** 608.24** 612.84** 630.49** 627.73**II/USP Std Dev 68.26 39.24 36.92 39.51 37.83 37.85 36.90 35.14 34.07 2002
Mean 614.11 570.60 568.43 598.81 594.39 617.12 618.26 639.44 633.35 Non-II/USP Std Dev 65.16 38.99 37.24 40.50 38.85 37.85 37.19 36.27 34.07
Mean 588.92** 570.00 569.03 594.98** 592.15** 613.25** 616.07** 634.91** 631.07**II/USP Std Dev 68.87 39.73 36.94 39.88 37.35 37.80 36.61 36.00 34.12 Note: * p-value <0.05, ** p-value<0.01, compared to comparison schools

Appendix A
Evaluation Study of the Public Schools Accountability Act of 1999 A-17
Exhibit A4-a: Descriptive statistics for student-level and school-level variables, Cohort 1 and comparison middle schools, 1999
Variable Non-II/USP schools II/USP schools Cohort 1 Mean Std Dev Mean Std Dev Student-level variables
FEMALE 0.49 0.50 0.50* 0.50 ASIAN 0.06 0.24 0.05** 0.23 HISPANIC 0.61 0.49 0.55** 0.50 BLACK 0.13 0.33 0.13** 0.34 OTHERS 0.05 0.21 0.06** 0.24 SFLUNCH 0.64 0.48 0.51** 0.50 PARED 2.32 1.09 2.41** 1.13 PAREDMISN 0.25 0.44 0.20** 0.40 SPECED 0.10 0.30 0.10 0.30 EL_MISN 0.05 0.23 0.07** 0.26 EL 0.34 0.47 0.28** 0.45 R_FEP 0.15 0.36 0.08** 0.27 FEP 0.08 0.27 0.08** 0.28
School-level variables
PCT_ASIAN 7.52 11.44 6.74 10.09 PCT_BLACK 12.83 16.80 14.09 19.08 PCT_HISP 55.88 25.00 51.36 26.64 PCT_MEALS 67.99 18.14 65.39 18.74 PCT_ELL 33.66 17.53 28.54 17.50 MOBILITY 12.76 9.49 12.91 12.16 AVG_PARED 2.36 0.42 2.44 0.45 PCT_FULL 81.81 12.49 82.51 12.90
Note: * p-value <0.05, ** p-value<0.01, compared to comparison schools
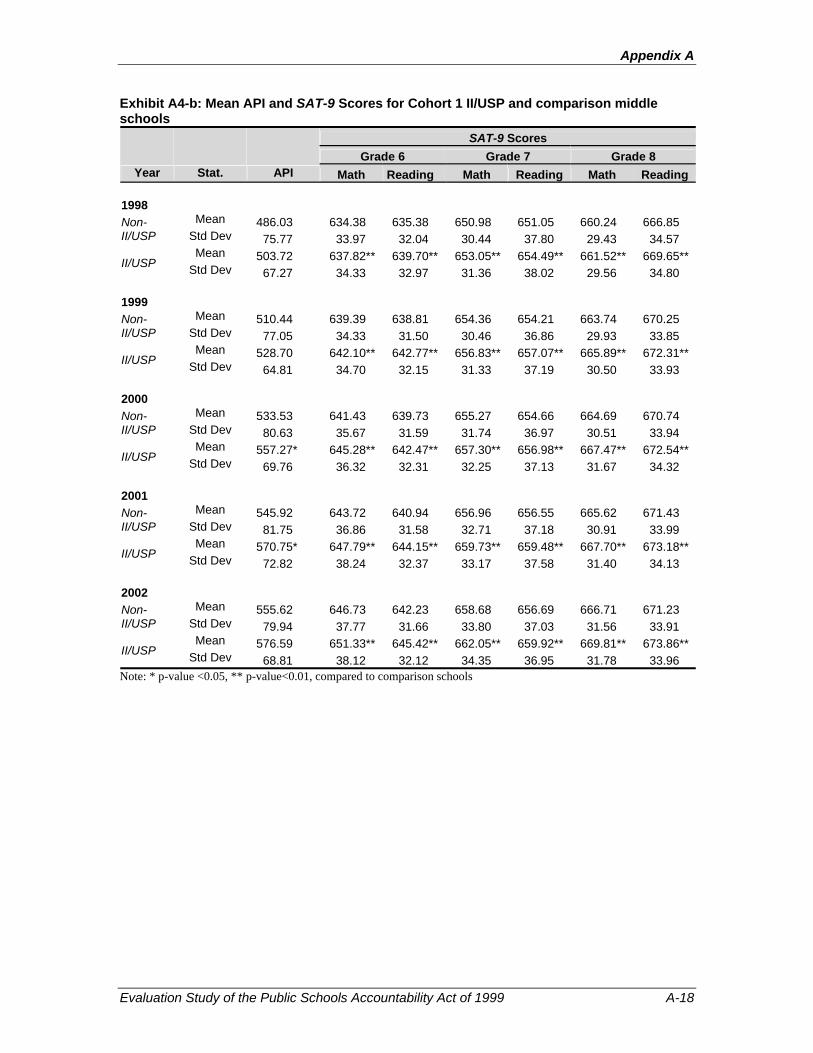
Appendix A
Evaluation Study of the Public Schools Accountability Act of 1999 A-18
Exhibit A4-b: Mean API and SAT-9 Scores for Cohort 1 II/USP and comparison middle schools
SAT-9 Scores Grade 6 Grade 7 Grade 8
Year Stat. API Math Reading Math Reading Math Reading 1998
Mean 486.03 634.38 635.38 650.98 651.05 660.24 666.85 Non-II/USP Std Dev 75.77 33.97 32.04 30.44 37.80 29.43 34.57
Mean 503.72 637.82** 639.70** 653.05** 654.49** 661.52** 669.65** II/USP Std Dev 67.27 34.33 32.97 31.36 38.02 29.56 34.80 1999
Mean 510.44 639.39 638.81 654.36 654.21 663.74 670.25 Non-II/USP Std Dev 77.05 34.33 31.50 30.46 36.86 29.93 33.85
Mean 528.70 642.10** 642.77** 656.83** 657.07** 665.89** 672.31** II/USP Std Dev 64.81 34.70 32.15 31.33 37.19 30.50 33.93 2000
Mean 533.53 641.43 639.73 655.27 654.66 664.69 670.74 Non-II/USP Std Dev 80.63 35.67 31.59 31.74 36.97 30.51 33.94
Mean 557.27* 645.28** 642.47** 657.30** 656.98** 667.47** 672.54** II/USP Std Dev 69.76 36.32 32.31 32.25 37.13 31.67 34.32 2001
Mean 545.92 643.72 640.94 656.96 656.55 665.62 671.43 Non-II/USP Std Dev 81.75 36.86 31.58 32.71 37.18 30.91 33.99
Mean 570.75* 647.79** 644.15** 659.73** 659.48** 667.70** 673.18** II/USP Std Dev 72.82 38.24 32.37 33.17 37.58 31.40 34.13 2002
Mean 555.62 646.73 642.23 658.68 656.69 666.71 671.23 Non-II/USP Std Dev 79.94 37.77 31.66 33.80 37.03 31.56 33.91
Mean 576.59 651.33** 645.42** 662.05** 659.92** 669.81** 673.86** II/USP Std Dev 68.81 38.12 32.12 34.35 36.95 31.78 33.96 Note: * p-value <0.05, ** p-value<0.01, compared to comparison schools

Appendix A
Evaluation Study of the Public Schools Accountability Act of 1999 A-19
Exhibit A4-c: Descriptive Statistics for student-level and school-level variables, Cohort 2 II/USP and comparison middle schools, 2000
Variable Non-II/USP schools II/USP schools Cohort 1 Mean Std Dev Mean Std Dev Student-level variables
FEMALE 0.49 0.50 0.49 0.50 ASIAN 0.06 0.24 0.06 0.23 HISPANIC 0.62 0.49 0.64** 0.48 BLACK 0.12 0.33 0.12 0.33 OTHERS 0.03 0.18 0.04 0.18 SFLUNCH 1.63 0.46 1.56** 0.45 PARED 2.30 1.00 2.28** 0.99 PAREDMISN 0.36 0.48 0.36* 0.48 SPECED 0.11 0.31 0.11 0.31 EL_MISN 0.00 0.06 0.00** 0.05 EL 0.34 0.45 0.35** 0.47 R_FEP 0.13 0.34 0.16** 0.36 FEP 0.10 0.29 0.08** 0.28
School-level variables
PCT_ASIAN 0.94 4.74 0.67 1.35 PCT_BLACK 11.79 13.91 12.40 14.58 PCT_HISP 59.44 21.61 55.70 23.17 PCT_MEALS 66.07 19.33 66.17 17.53 PCT_ELL 32.58 15.97 30.64 12.98 MOBILITY 22.11 18.57 20.35 16.50 AVG_PARED 2.31 0.43 2.40 0.36 PCT_FULL 77.35 14.53 80.37 13.93
Note: * p-value <0.05, ** p-value<0.01, compared to comparison schools
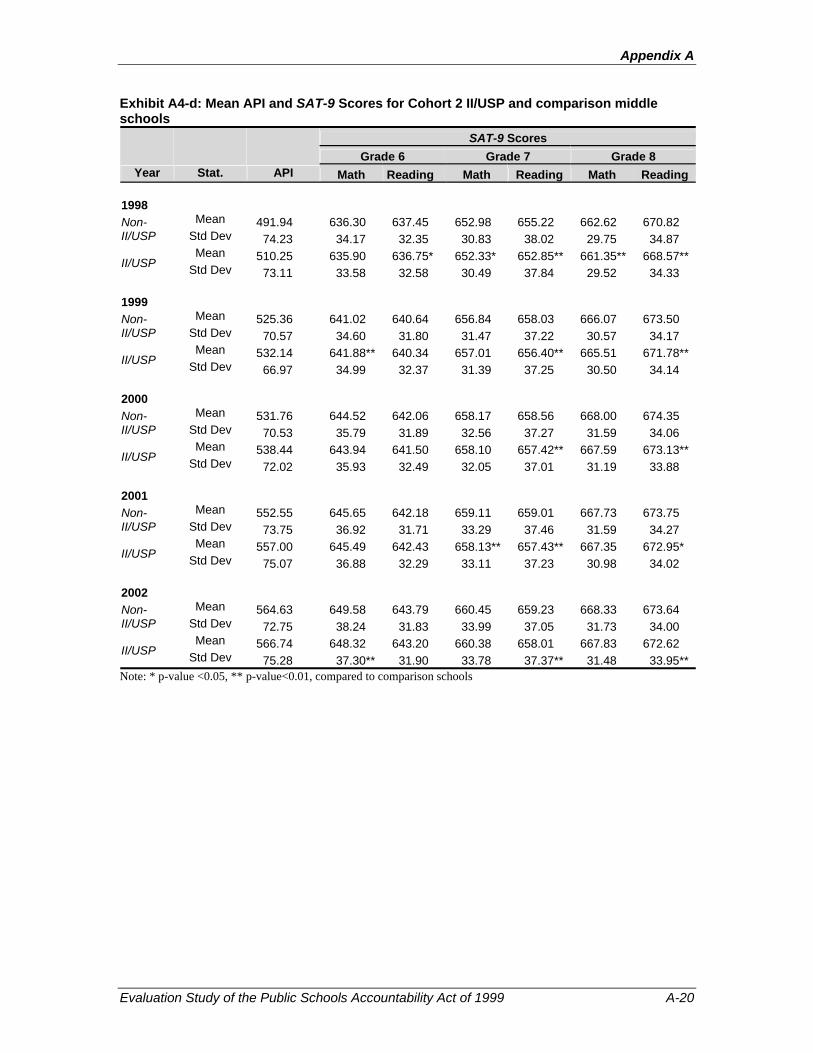
Appendix A
Evaluation Study of the Public Schools Accountability Act of 1999 A-20
Exhibit A4-d: Mean API and SAT-9 Scores for Cohort 2 II/USP and comparison middle schools
SAT-9 Scores Grade 6 Grade 7 Grade 8
Year Stat. API Math Reading Math Reading Math Reading 1998
Mean 491.94 636.30 637.45 652.98 655.22 662.62 670.82 Non-II/USP Std Dev 74.23 34.17 32.35 30.83 38.02 29.75 34.87
Mean 510.25 635.90 636.75* 652.33* 652.85** 661.35** 668.57** II/USP Std Dev 73.11 33.58 32.58 30.49 37.84 29.52 34.33 1999
Mean 525.36 641.02 640.64 656.84 658.03 666.07 673.50 Non-
II/USP Std Dev 70.57 34.60 31.80 31.47 37.22 30.57 34.17 Mean 532.14 641.88** 640.34 657.01 656.40** 665.51 671.78** II/USP Std Dev 66.97 34.99 32.37 31.39 37.25 30.50 34.14
2000
Mean 531.76 644.52 642.06 658.17 658.56 668.00 674.35 Non-II/USP Std Dev 70.53 35.79 31.89 32.56 37.27 31.59 34.06
Mean 538.44 643.94 641.50 658.10 657.42** 667.59 673.13** II/USP Std Dev 72.02 35.93 32.49 32.05 37.01 31.19 33.88 2001
Mean 552.55 645.65 642.18 659.11 659.01 667.73 673.75 Non-II/USP Std Dev 73.75 36.92 31.71 33.29 37.46 31.59 34.27
Mean 557.00 645.49 642.43 658.13** 657.43** 667.35 672.95* II/USP Std Dev 75.07 36.88 32.29 33.11 37.23 30.98 34.02 2002
Mean 564.63 649.58 643.79 660.45 659.23 668.33 673.64 Non-II/USP Std Dev 72.75 38.24 31.83 33.99 37.05 31.73 34.00
Mean 566.74 648.32 643.20 660.38 658.01 667.83 672.62 II/USP Std Dev 75.28 37.30** 31.90 33.78 37.37** 31.48 33.95** Note: * p-value <0.05, ** p-value<0.01, compared to comparison schools

Appendix A
Evaluation Study of the Public Schools Accountability Act of 1999 A-21
Exhibit A4-e: Descriptive Statistics for student-level and school-level variables, Cohort 3 II/USP and comparison middle schools, 2000
Variable Non-II/USP schools II/USP schools Cohort 1 Mean Std Dev Mean Std Dev Student-level variables
FEMALE 0.49 0.50 0.49 0.50 ASIAN 0.04 0.21 0.06** 0.24 HISPANIC 0.60 0.49 0.65** 0.48 BLACK 0.12 0.33 0.09** 0.29 OTHERS 0.04 0.19 0.03** 0.16 SFLUNCH 0.66 0.47 0.67** 0.47 PARED 2.37 1.02 2.36 1.03 PAREDMISN 0.28 0.45 0.33** 0.47 SPECED 0.11 0.32 0.12 0.32 EL_MISN 0.00 0.07 0.00 0.06 EL 0.31 0.46 0.34** 0.47 R_FEP 0.12 0.32 0.15** 0.36 FEP 0.08 0.27 0.09** 0.28
School-level variables
PCT_ASIAN 1.04 2.01 0.62 0.90 PCT_BLACK 10.89 13.64 9.81 11.45 PCT_HISP 58.01 22.37 59.13 21.19 PCT_MEALS 63.20 19.87 66.49 19.82 PCT_ELL 30.55 18.56 32.98 14.08 MOBILITY 19.58 15.32 20.83 12.96 AVG_PARED 2.37 0.41 2.38 0.46 PCT_FULL 78.59 15.30 79.00 14.62
Note: * p-value <0.05, ** p-value<0.01, compared to comparison schools

Appendix A
Evaluation Study of the Public Schools Accountability Act of 1999 A-22
Exhibit A4-f: Mean API and SAT-9 Scores for Cohort 3 II/USP and comparison middle schools
SAT-9 Scores Grade 6 Grade 7 Grade 8
Year Stat. API Math Reading Math Reading Math Reading 1998
Mean 507.38 636.75 652.33 652.85 661.35 662.62 670.82 Non-II/USP Std Dev 79.17 32.58 30.49 37.84 29.52 29.75 34.87
Mean 487.57 635.90** 636.75** 652.33 652.85** 661.35** 668.57** II/USP Std Dev 59.69 33.58 32.58 30.49 37.84 29.52 34.33 1999
Mean 535.29 640.34 657.01 656.40 665.51 666.07 673.50 Non-
II/USP Std Dev 75.88 32.37 31.39 37.25 30.50 30.57 34.17 Mean 521.00 641.88** 640.34** 657.01 656.40** 665.51 671.78** II/USP Std Dev 67.85 34.99 32.37 31.39 37.25 30.50 34.14
2000
Mean 561.08 644.52 642.06 658.17 658.56 668.00 674.35 Non-II/USP Std Dev 72.07 35.79 31.89 32.56 37.27 31.59 34.06
Mean 552.36 643.94 641.50 658.10 657.42** 667.59 673.13** II/USP Std Dev 63.90 35.93 32.49 32.05 37.01 31.19 33.88 2001
Mean 560.60 645.65 642.18 659.11 659.01 667.73 673.75 Non-II/USP Std Dev 71.64 36.92 31.71 33.29 37.46 31.59 34.27
Mean 551.53 645.49 642.43 658.13** 657.43** 667.35 672.95* II/USP Std Dev 66.12 36.88 32.29 33.11 37.23 30.98 34.02 2002
Mean 570.60 649.58 643.79 660.45 659.23 668.33 673.64 Non-II/USP Std Dev 69.59 38.24 31.83 33.99 37.05 31.73 34.00
Mean 560.00** 648.32 643.20 660.38 658.01** 667.83 672.62** II/USP Std Dev 62.54 37.30 31.90 33.78 37.37 31.48 33.95 Note: * p-value <0.05, ** p-value<0.01, compared to comparison schools

Appendix A
Evaluation Study of the Public Schools Accountability Act of 1999 A-23
Exhibit A5-a: Descriptive Statistics for student-level and school-level variables, Cohort 1 II/USP and comparison high schools, 1999
Variable Non-II/USP schools II/USP schools Cohort 1
Mean Std Dev Mean Std Dev Student-level variables
FEMALE 0.49 0.50 0.50** 0.50 ASIAN 0.07 0.25 0.12** 0.33 HISPANIC 0.55 0.50 0.45** 0.50 BLACK 0.13 0.34 0.07** 0.26 OTHERS 0.05 0.21 0.11** 0.32 SFLUNCH 0.45 0.50 0.33** 0.47 PARED 2.36 1.13 2.38** 1.12 PAREDMISN 0.24 0.43 0.20** 0.40 SPECED 0.08 0.27 0.07** 0.26 EL_MISN 0.07 0.26 0.09** 0.29 EL 0.24 0.42 0.22** 0.41 R_FEP 0.16 0.37 0.09** 0.28 FEP 0.11 0.31 0.16** 0.36
School-level variables
PCT_ASIAN 6.77 7.80 11.23* 13.56 PCT_BLACK 13.93 18.00 9.62 13.47 PCT_HISP 49.68 25.32 46.13 23.71 PCT_MEALS 49.45 20.72 47.73 19.84 PCT_ELL 22.63 13.55 19.61 13.66 MOBILITY 11.62 13.48 7.61 5.57 AVG_PARED 2.45 0.46 2.42 0.42 PCT_FULL 85.31 9.85 85.98 7.36
Note: * p-value <0.05, ** p-value<0.01, compared to comparison schools

Appendix A
Evaluation Study of the Public Schools Accountability Act of 1999 A-24
Exhibit A5-b: Mean API and SAT-9 Scores for Cohort 1 II/USP and comparison high schools
SAT-9 Scores Grade 9 Grade 10 Grade 11
Year Stat. API Math Reading Math Reading Math Reading 1998
Mean 530.21 676.17 670.48 685.56 678.04 690.68 687.78 Non-II/USP Std Dev 60.49 29.75 32.77 28.47 33.81 31.61 34.13
Mean 539.39 679.83** 673.75** 686.43** 678.64** 691.60** 688.14** II/USP Std Dev 56.01 30.66 32.88 28.25 34.22 31.99 33.92 1999
Mean 530.58 677.82 671.08 687.66 679.20 694.23 689.16 Non-II/USP Std Dev 60.86 29.75 32.48 28.09 33.01 31.95 33.15
Mean 539.16 681.52** 674.80** 689.62** 680.57** 693.19** 687.73 II/USP Std Dev 56.25 30.41 32.37 28.43 33.29 32.26 33.31 2000
Mean 542.16 679.00 672.05 687.54 679.09 694.55 689.14 Non-II/USP Std Dev 62.33 30.04 32.60 27.91 33.27 32.09 33.26
Mean 557.95 683.36** 674.95** 690.40** 680.54** 696.23** 688.87 II/USP Std Dev 55.25 30.13 32.08 28.77 33.53 31.98 32.88 2001
Mean 542.24 678.76 670.94 687.98 679.42 693.99 688.51 Non-II/USP Std Dev 64.43 30.77 32.52 28.98 34.04 33.22 34.13
Mean 560.53 683.67** 673.78** 691.18** 680.91** 696.11** 687.99 II/USP Std Dev 60.29 31.63 32.52 29.69 33.89 32.93 33.89 2002
Mean 547.79 679.26 671.40 688.85 679.07 695.05 689.76 Non-II/USP Std Dev 62.71 30.15 32.19 28.97 33.88 33.12 34.55
Mean 566.56 685.13** 674.77** 692.88** 680.99** 698.57** 690.04 II/USP Std Dev 58.28 31.45 32.33 29.69 34.30 33.50 33.65 Note: * p-value <0.05, ** p-value<0.01, compared to comparison schools

Appendix A
Evaluation Study of the Public Schools Accountability Act of 1999 A-25
Exhibit A5-c: Descriptive Statistics for student-level and school-level variables, Cohort 2 II/USP and comparison high schools, 2000
Variable Non-II/USP schools II/USP schools Cohort 1 Mean SD Mean SD
Student-level variables
FEMALE 0.50 0.50 0.50 0.50 ASIAN 0.05 0.22 0.07** 0.26 HISPANIC 0.59 0.49 0.54** 0.50 BLACK 0.10 0.31 0.12** 0.32 OTHERS 0.04 0.20 0.05** 0.21 SFLUNCH 0.50 0.50 0.52** 0.50 PARED 2.38 1.12 2.45** 1.14 PAREDMISN 0.25 0.43 0.20** 0.40 SPECED 0.09 0.28 0.09 0.28 EL_MISN 0.01 0.07 0.01** 0.08 EL 0.25 0.44 0.23** 0.42 R_FEP 0.15 0.36 0.15 0.36 FEP 0.13 0.33 0.12** 0.32
School-level variables
PCT_ASIAN 0.64 1.49 2.60* 10.47 PCT_BLACK 9.42 13.26 12.53 17.20 PCT_HISP 55.80 23.73 48.40* 23.04 PCT_MEALS 47.61 21.94 50.07 21.51 PCT_ELL 23.58 14.98 21.22 11.11 MOBILITY 12.06 7.58 15.48* 15.30 AVG_PARED 2.40 0.46 2.50 0.38 PCT_FULL 84.25 9.09 85.03 9.41
Note: * p-value <0.05, ** p-value<0.01, compared to comparison schools

Appendix A
Evaluation Study of the Public Schools Accountability Act of 1999 A-26
Exhibit A5-d: Mean API and SAT-9 Scores for Cohort 2 II/USP and comparison high schools
SAT-9 Scores Grade 9 Grade 10 Grade 11
Year Stat. API Math Reading Math Reading Math Reading 1998
Mean 531.46 676.63 671.03 685.91 678.34 691.02 688.19 Non-II/USP Std Dev 57.30 29.50 32.67 27.87 33.69 31.06 33.79
Mean 535.56 677.03 671.40 685.49 678.19 690.39* 687.51* II/USP Std Dev 59.08 30.75 33.54 28.52 34.33 31.79 34.51 1999
Mean 531.77 678.55 671.95 687.77 679.09 693.87 688.96 Non-II/USP Std Dev 57.40 29.36 32.19 27.68 32.95 31.72 32.93
Mean 535.40 679.09* 672.67* 688.60** 680.07** 694.53* 689.28 II/USP Std Dev 58.83 30.44 33.18 28.89 33.60 32.19 33.26 2000
Mean 534.61 679.99 672.21 687.89 678.48 693.87 687.64 Non-II/USP Std Dev 58.33 29.84 32.26 27.80 33.15 31.79 33.01
Mean 539.16 679.69 672.17 687.86 679.35** 694.37 688.54** II/USP Std Dev 59.20 30.34 32.79 28.12 33.63 32.76 33.77 2001
Mean 538.25 680.44 671.77 688.66 679.08 693.72 687.42 Non-II/USP Std Dev 57.17 30.58 32.26 28.84 33.77 32.36 34.02
Mean 548.26 680.45 672.12 688.95 680.61** 694.64** 688.87** II/USP Std Dev 60.24 31.43 32.89 29.49 34.24 33.77 34.62 2002
Mean 545.39 680.75 672.14 689.63 678.87 695.04 688.61 Non-II/USP Std Dev 55.71 30.09 31.87 29.12 33.85 32.94 34.12
Mean 551.03 680.95 672.36 689.87 680.43** 695.66* 689.84** II/USP Std Dev 60.16 30.94 32.10 29.54 33.96 33.65 34.43 Note: * p-value <0.05, ** p-value<0.01, compared to comparison schools
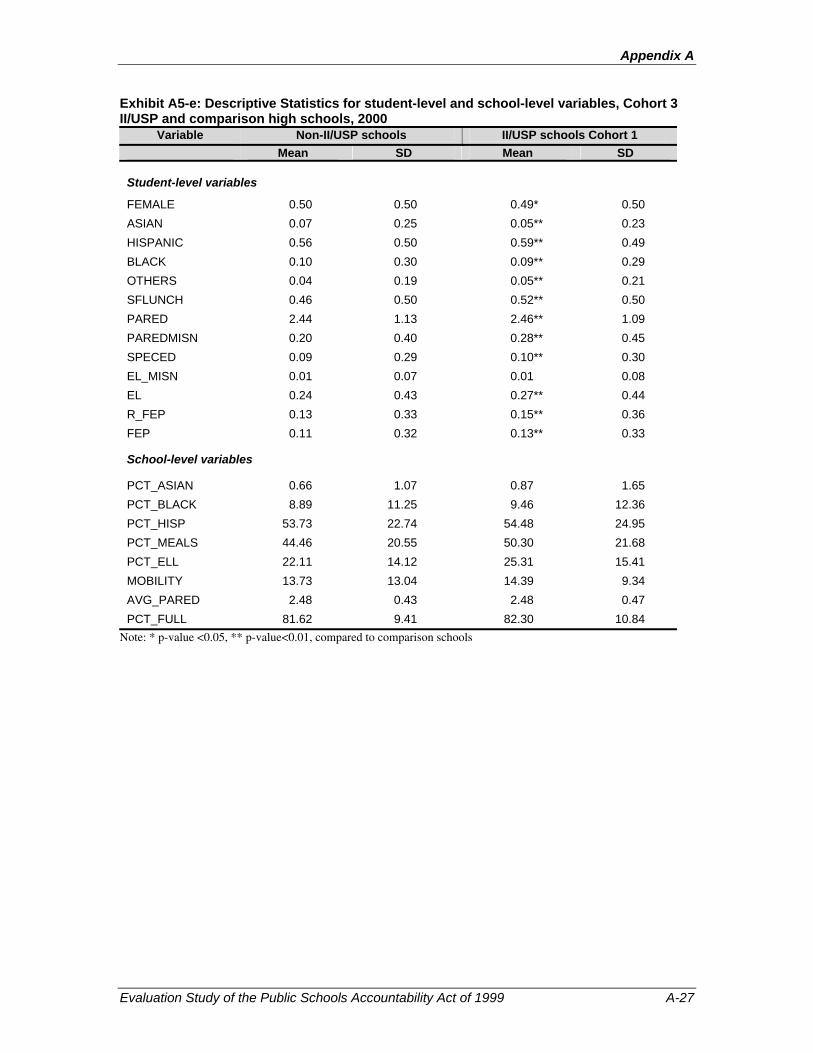
Appendix A
Evaluation Study of the Public Schools Accountability Act of 1999 A-27
Exhibit A5-e: Descriptive Statistics for student-level and school-level variables, Cohort 3 II/USP and comparison high schools, 2000
Variable Non-II/USP schools II/USP schools Cohort 1 Mean SD Mean SD
Student-level variables
FEMALE 0.50 0.50 0.49* 0.50 ASIAN 0.07 0.25 0.05** 0.23 HISPANIC 0.56 0.50 0.59** 0.49 BLACK 0.10 0.30 0.09** 0.29 OTHERS 0.04 0.19 0.05** 0.21 SFLUNCH 0.46 0.50 0.52** 0.50 PARED 2.44 1.13 2.46** 1.09 PAREDMISN 0.20 0.40 0.28** 0.45 SPECED 0.09 0.29 0.10** 0.30 EL_MISN 0.01 0.07 0.01 0.08 EL 0.24 0.43 0.27** 0.44 R_FEP 0.13 0.33 0.15** 0.36 FEP 0.11 0.32 0.13** 0.33
School-level variables
PCT_ASIAN 0.66 1.07 0.87 1.65 PCT_BLACK 8.89 11.25 9.46 12.36 PCT_HISP 53.73 22.74 54.48 24.95 PCT_MEALS 44.46 20.55 50.30 21.68 PCT_ELL 22.11 14.12 25.31 15.41 MOBILITY 13.73 13.04 14.39 9.34 AVG_PARED 2.48 0.43 2.48 0.47 PCT_FULL 81.62 9.41 82.30 10.84
Note: * p-value <0.05, ** p-value<0.01, compared to comparison schools
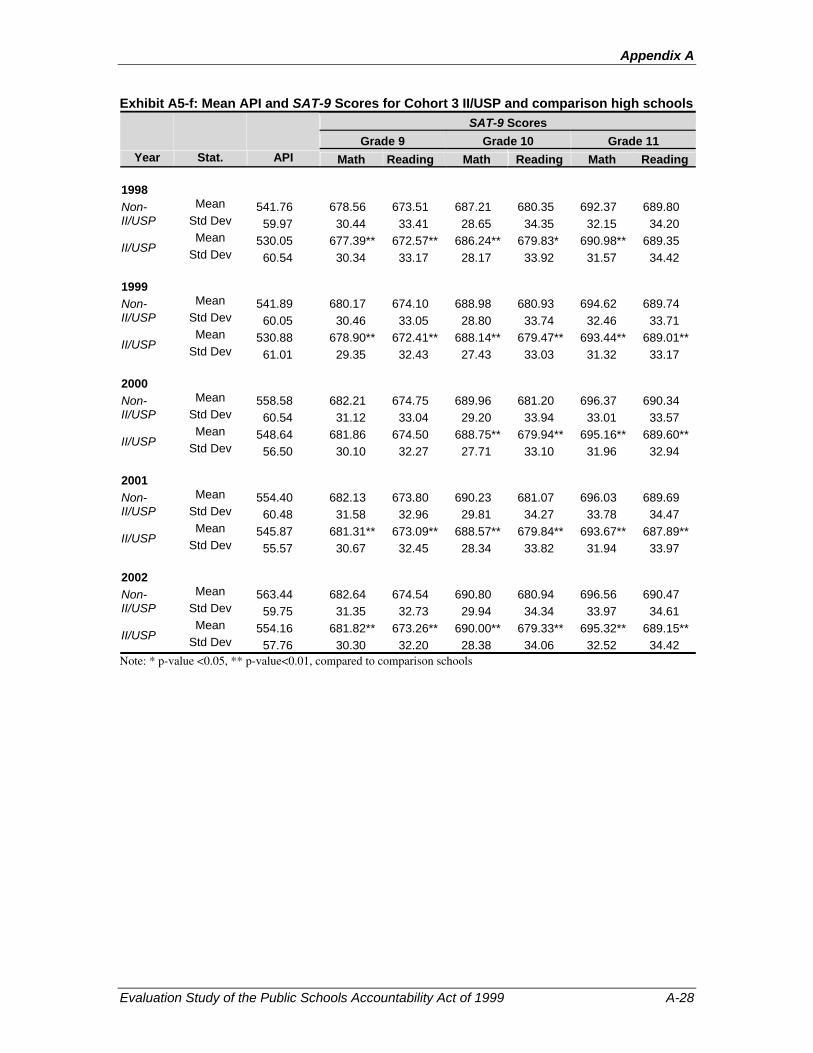
Appendix A
Evaluation Study of the Public Schools Accountability Act of 1999 A-28
Exhibit A5-f: Mean API and SAT-9 Scores for Cohort 3 II/USP and comparison high schools SAT-9 Scores
Grade 9 Grade 10 Grade 11 Year Stat. API Math Reading Math Reading Math Reading
1998
Mean 541.76 678.56 673.51 687.21 680.35 692.37 689.80 Non-II/USP Std Dev 59.97 30.44 33.41 28.65 34.35 32.15 34.20
Mean 530.05 677.39** 672.57** 686.24** 679.83* 690.98** 689.35 II/USP Std Dev 60.54 30.34 33.17 28.17 33.92 31.57 34.42 1999
Mean 541.89 680.17 674.10 688.98 680.93 694.62 689.74 Non-II/USP Std Dev 60.05 30.46 33.05 28.80 33.74 32.46 33.71
Mean 530.88 678.90** 672.41** 688.14** 679.47** 693.44** 689.01** II/USP Std Dev 61.01 29.35 32.43 27.43 33.03 31.32 33.17 2000
Mean 558.58 682.21 674.75 689.96 681.20 696.37 690.34 Non-II/USP Std Dev 60.54 31.12 33.04 29.20 33.94 33.01 33.57
Mean 548.64 681.86 674.50 688.75** 679.94** 695.16** 689.60** II/USP Std Dev 56.50 30.10 32.27 27.71 33.10 31.96 32.94 2001
Mean 554.40 682.13 673.80 690.23 681.07 696.03 689.69 Non-II/USP Std Dev 60.48 31.58 32.96 29.81 34.27 33.78 34.47
Mean 545.87 681.31** 673.09** 688.57** 679.84** 693.67** 687.89** II/USP Std Dev 55.57 30.67 32.45 28.34 33.82 31.94 33.97 2002
Mean 563.44 682.64 674.54 690.80 680.94 696.56 690.47 Non-II/USP Std Dev 59.75 31.35 32.73 29.94 34.34 33.97 34.61
Mean 554.16 681.82** 673.26** 690.00** 679.33** 695.32** 689.15** II/USP Std Dev 57.76 30.30 32.20 28.38 34.06 32.52 34.42 Note: * p-value <0.05, ** p-value<0.01, compared to comparison schools

Appendix A
Evaluation Study of the Public Schools Accountability Act of 1999 A-29
Statistical Methods
In our analyses of API scores, we have data for multiple time points for each school; and in our analysis of SAT-9 scores, we have data for multiple students and multiple time points for each school. To take the multi-level nature of the data into account, we employed hierarchical linear modeling methods. These methods make it possible to distinguish the effects of measured student-level and/or school-level factors, as well as the effect of time, and they also deal with the fact that students within the same schools are likely to have characteristics in common that we were unable to measure (such as common community characteristics). The equations for the model for the API are shown in Exhibit A6, and those for the SAT-9 are shown in Exhibit A7.
The primary hypotheses of interest concern differences in achievement trajectories between II/USP and comparison schools over the period from 1998 through 2001. To test these time-specific hypotheses for Cohort 1, we created an indicator variable (IIUSP1) to reflect participation in II/USP Cohort 1 (coded 1 for participants and 0 for comparison schools), and three variables to reflect the calendar year (YEAR99, which is coded 0 in 1998 and 1 in 1999, 2000, 2001, and 2002; YEAR00, which is coded 0 in 1998 and 1999, and 1 in 2000, 2001, and 2002; YEAR01, which is coded 0 in 1998, 1999, and 2000, and 1 in 2001 and 2002). The hypothesized effects we seek involve interactions of IIUSP1 and YEAR99, YEAR00, YEAR01, and YEAR02.12 If participating and comparison schools were similar prior to participation, we would expect the interaction of YEAR99 and IIUSP1 to be zero, whereas if participation has a positive effect on subsequent growth, we would expect the interaction of YEAR00 and IIUSP1 to be positive, as well as the interaction of YEAR01 and IIUSP1, as well as YEAR02 and IIUSP1.
To determine whether the trajectories for CSRD schools differ from those for regular (Action Plan) II/USP schools, we created an indicator variable (CSRD), coded 1 for CSRD schools, and 0 for other schools, and we included the interactions of the CSRD with each of the year variables (YEAR99 through YEAR02).
To test the time-specific hypotheses for Cohort 2, and 3, we created a parallel set of indicator variables.
12 The equations that appear in Exhibits A6 and A7 display the models in conventional two-level hierarchical linear
model form. The “time-level” model represents the effects of year on achievement, as well as the effects of school characteristics. The “school level” model represents the effects of II/USP and CSRD participation status on the level-one slopes for year. These school-level effects of II/USP and CSRD represent the interactions between II/USP and year discussed in the text.
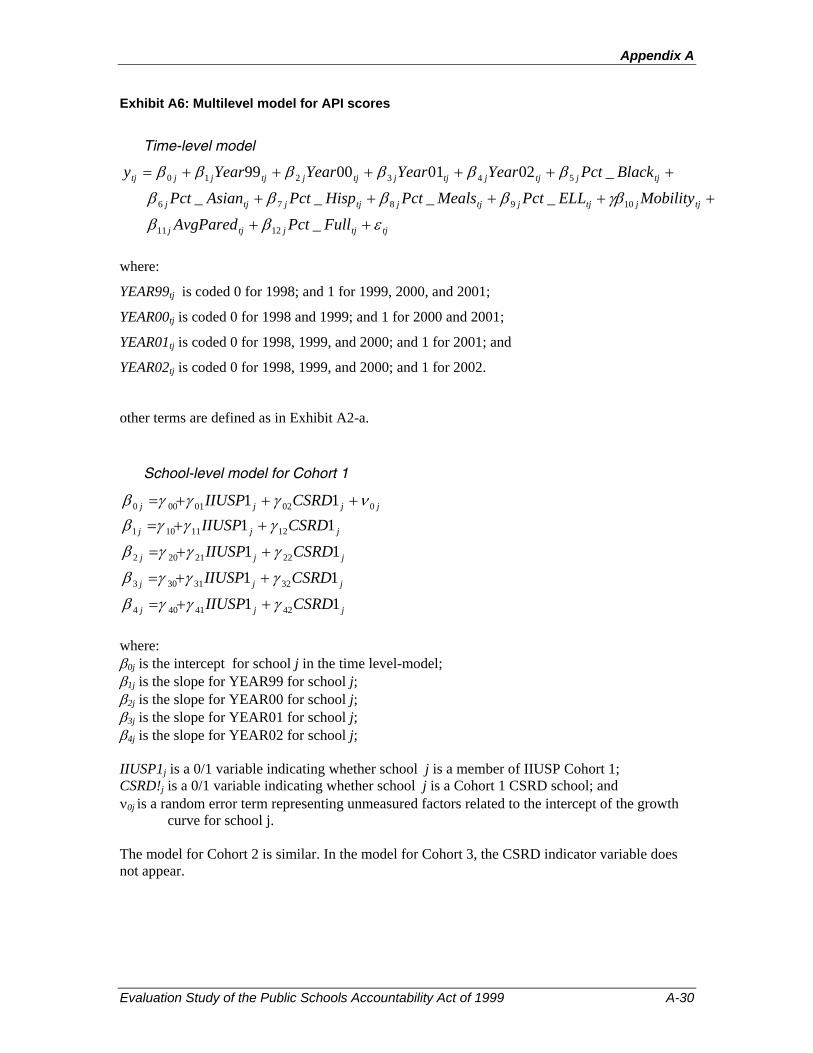
Appendix A
Evaluation Study of the Public Schools Accountability Act of 1999 A-30
Exhibit A6: Multilevel model for API scores
Time-level model
tjtjjtjj
tjjtjjtjjtjjtjj
tjjtjjtjjtjjtjjjtj
FullPctAvgPared
MobilityELLPctMealsPctHispPctAsianPct
BlackPctYearYearYearYeary
εββ
γβββββ
ββββββ
++
+++++
++++++=
_
____
_02010099
1211
109876
543210
where:
YEAR99tj is coded 0 for 1998; and 1 for 1999, 2000, and 2001;
YEAR00tj is coded 0 for 1998 and 1999; and 1 for 2000 and 2001;
YEAR01tj is coded 0 for 1998, 1999, and 2000; and 1 for 2001; and
YEAR02tj is coded 0 for 1998, 1999, and 2000; and 1 for 2002.
other terms are defined as in Exhibit A2-a.
School-level model for Cohort 1
jjjj CSRDIIUSP 00201000 11 νγγγβ +++=
jjj
jjj
jjj
jjj
CSRDIIUSP
CSRDIIUSPCSRDIIUSP
CSRDIIUSP
11
1111
11
4241404
3231303
2221202
1211101
γγγβ
γγγβ
γγγβ
γγγβ
++=
++=
++=
++=
where: β0j is the intercept for school j in the time level-model; β1j is the slope for YEAR99 for school j; β2j is the slope for YEAR00 for school j; β3j is the slope for YEAR01 for school j; β4j is the slope for YEAR02 for school j; IIUSP1j is a 0/1 variable indicating whether school j is a member of IIUSP Cohort 1; CSRD!j is a 0/1 variable indicating whether school j is a Cohort 1 CSRD school; and ν0j is a random error term representing unmeasured factors related to the intercept of the growth
curve for school j. The model for Cohort 2 is similar. In the model for Cohort 3, the CSRD indicator variable does not appear.

Appendix A
Evaluation Study of the Public Schools Accountability Act of 1999 A-31
Exhibit A7: Multilevel model for SAT-9 scores
Student/time-level model13
itjitjitjitjitj
itjitjitjitjitjitj
itjitjjitjjitjjitjjjitj
GradeGradeGradeParEd
OthersHispanicBlackAsianFSLunchELF
FemaleYearYearYearYeary
εββββ
ββββββ
ββββββ
++++
+++++++
+++++=
543
02010099
15141312
11109876
543210
where: YEAR99itj , YEAR00itj , YEAR01itj and YEAR02itj are coded as in Exhibit A6; Grade3itj, Grade4itj, and Grade5itj are 0/1 variables indicating the student’s grade level (with
similar variables included in models for middle and high schools); and other terms are defined as in Exhibit A2-a.14
School-level model for Cohort 1
jjjjj MealsPctCSRDIIUSP 0030201000 _11 νγγγγβ ++++=
jjj
jjj
jjj
jjj
CSRDIIUSP
CSRDIIUSPCSRDIIUSP
CSRDIIUSP
11
1111
11
4241404
3231303
2221202
1211101
γγγβ
γγγβ
γγγβ
γγγβ
++=
++=
++=
++=
where: β0j is the intercept for school j in the student/time level-model; β1j is the slope for YEAR99 for school j; β2j is the slope for YEAR00 for school j; β3j is the slope for YEAR01 for school j; β4j is the slope for YEAR02 for school j; IIUSP1j is a 0/1 variable indicating whether school j is a member of IIUSP Cohort 1; CSRD!j is a 0/1 variable indicating whether school j is a Cohort 1 CSRD school; Pct_Mealsj is a variable indicating the percent of students eligible for free or reduced lunch in
school j; and ν0j is a random error term representing unmeasured factors related to the intercept of the growth
curve for school j The model for Cohort 2 is similar. In the model for Cohort 3, the CSRD indicator variable does not appear.
13 For this analysis, we combined the student and time levels. This in effect assumes that there are no unmeasured
differences across years, once the trend captured by the four dummy variables (YEAR99, YEAR00, YEAR01, and YEAR02) are accounted for. The model in effect also assumes that there are no stable unmeasured differences among cohorts (i.e., groups of students who enter in the same year). We explored models that incorporate both of these complications, and the results were almost identical to those shown.
14 The student/time-level model also includes the missing value dummy variable for parent education described in Exhibit A2-a.

Appendix A
Evaluation Study of the Public Schools Accountability Act of 1999 A-32
Exhibit A8 displays the percent of the between- and within-school variation explained by measured student background characteristics. The available background variables explain a good deal of the variation among schools in 4th grade SAT-9 scores, but substantial variation remains to be explained by II/USP and other programs. In comparison to the explanatory power of the background variables at the school level, the variables explain relatively little of the variation among students within schools. For example, in 2001, the background variables together explain about 70 percent of the variation across schools in average mathematics achievement and about 81 percent of the variation among schools in average reading achievement. The background variables explain just 11 percent of the variation among students within schools in mathematics achievement, however, and 16 percent in reading.15
Exhibit A8: Percent of the between-school and within-school variance in 4th grade math and reading SAT-9 scores explained by student demographic variables Math Reading
1998 1999 2000 2001 2002 1998 1999 2000 2001 2002 Between schools
61 62 69 70 71 73 75 81 81 82
Within schools
12 11 12 11 10 16 16 16 16 15
Note: numbers shown in this exhibit are based on the 4th grade SAT-9 scores of all the schools which have 4th grade SAT-9 scores.
Statewide Analyses: Results
Exhibits A9-A14, below, present parameter estimates for the main analytic models. These parameter estimates were used to generate the achievement trajectories shown in the exhibits in the paper. In the sections that follow, we discuss the approach we took to generate these trajectories. We then turn to a brief discussion of the magnitude of the estimated effects. Estimated achievement growth trajectories. The achievement trajectories for II/USP schools shown in the exhibits in the paper were generated using the estimated parameters shown in Exhibits A9-A14, assuming that the values for all covariates are fixed at the 1999 average values for Cohort 1 II/USP schools, the 2000 values for Cohort 2 II/USP schools, and the 2001 values for Cohort 3 II/USP schools. Thus, the trajectories reflect the estimated time-pattern of change in II/USP scores, controlling for all measured variables. The trajectory for the comparison schools was generated using the parameter estimates in Exhibits A9-A14, also assuming that the values for all covariates are fixed at the same values used for II/USP schools. Thus, any differences in the II/USP and comparison trajectories shown in the graphs in the report control for all measured background variables included in the models. The actual API values for Cohort 1 elementary middle, and high schools in 1998, 1999, 2000, 2001, and 2002, which appear in Exhibits A3-A5, differ from those shown in the graphs, because the actual values reflect changes over time in school background characteristics, as well as differences between II/USP and comparison schools in these characteristics.
The magnitude of the estimated coefficients. As discussed in Chapter 3, there are several ways of assessing the magnitude of the estimated coefficients. One approach we considered
15 There is some indication that the background variables explain more of the variation at the school level in 2001 than
in 1998. It is not completely clear why this pattern is observed. Perhaps the reliability of the data has improved over time, although an improvement in reliability would likely increase the explained variation at both the student and school levels.

Appendix A
Evaluation Study of the Public Schools Accountability Act of 1999 A-33
involves converting the estimated II/USP effect on achievement growth to an effect size, by re-expressing the growth in terms of the between-school or between-student standard deviation in the outcome under study. In Chapter 3, we reported that Cohort 1 II/USP elementary schools improved their API scores over the 1999-00 school year by about 8.7 points more than comparison schools. (See Exhibit 3.2.) As reported in Exhibit A3-b, the between-school standard deviation for the comparison schools in 2000 was about 78 points. Thus, an II/USP effect of 8.7 API points is approximately one ninth of a standard deviation, producing an effect size of about 0.11.
A similar analysis can be carried out to assess the magnitude of the observed effects of II/USP support on SAT-9 scores. We found that II/USP elementary schools gained about 1.9 points more on the SAT-9 math test between 1999 and 2000 than did comparison schools. On average, schools gained about 6.9 points that year. Thus, a school that might have gained 6.9 points without participation might have grown 8.8 points if it participated. Another way to assess the magnitude of the II/USP “effect” is to compare the II/USP vs. non-II/USP difference in growth with the typical growth observed for students over a year of schooling. The mean SAT-9 math scores grew by roughly 25 points from grade 2 to 3, from grade 3 to 4, and from grade 4 to 5. Thus, an improvement of 1.9 points is about 8 percent of the expected student growth in a year.

Appendix A
Evaluation Study of the Public Schools Accountability Act of 1999 A-34
Exhibit A9-a: Parameter estimates for Cohort 1 II/USP, CSRD, and comparison schools: Multi-level model for API scores (unadjusted) Est. SE P value Est. SE P value Est. SE P value
School-level variables Elementary Schools
Middle Schools
High Schools Intercept 579.2 11.7 0.000 523.2 22.9 0.000 474.3 27.4 0.000IIUSP1 -0.9 4.6 0.843 14.0 8.0 0.080 -0.1 7.4 0.991CSRD11 -20.9 9.4 0.025 -17.2 18.9 0.364 -14.8 14.8 0.321
Time-level variables PCT_AF-AM -1.4 0.1 0.000 -2.0 0.2 0.000 -1.8 0.2 0.000PCT_ASIAN -0.1 0.1 0.118 0.2 0.1 0.046 0.2 0.1 0.136PCT_HISP -0.9 0.1 0.000 -1.4 0.2 0.000 -0.9 0.2 0.000PCT_MEALS -0.5 0.1 0.000 0.0 0.1 0.894 0.1 0.1 0.154PCT_EL -1.0 0.1 0.000 -0.5 0.1 0.001 -0.5 0.2 0.004MOBILITY -0.1 0.1 0.250 -0.3 0.1 0.000 0.0 0.1 0.872AVG_PARED 5.2 1.6 0.001 23.2 5.0 0.000 45.0 6.8 0.000PCT_FULL 0.4 0.1 0.000 0.4 0.1 0.001 0.2 0.1 0.100YEAR99 38.7 1.7 0.000 24.0 2.8 0.000 0.4 2.4 0.877YEAR00 43.3 1.7 0.000 28.2 2.9 0.000 11.3 2.6 0.000YEAR01 28.6 1.7 0.000 14.1 2.7 0.000 2.0 2.4 0.411YEAR02 29.4 1.8 0.000 9.7 2.7 0.000 5.5 2.4 0.022
Interaction variables
YEAR99*IIUSP1 3.3 3.3 0.307 -4.1 5.1 0.421 -0.7 4.6 0.887YEAR00*IIUSP1 8.7 3.2 0.007 10.8 5.0 0.031 7.8 4.7 0.093YEAR01*IIUSP1 -4.8 3.2 0.136 1.6 5.0 0.755 4.3 4.6 0.347YEAR02*IIUSP1 -7.5 3.2 0.021 -3.2 5.0 0.517 -1.1 4.6 0.806YEAR99*CSRD1 10.1 6.8 0.138 14.7 12.2 0.227 0.3 9.0 0.975YEAR00*CSRD1 3.6 6.6 0.593 -1.7 11.8 0.883 23.6 9.1 0.010YEAR01*CSRD1 -3.4 6.6 0.603 -17.8 11.7 0.129 -3.2 9.0 0.726YEAR02*CSRD1 -2.7 6.6 0.683 1.7 11.7 0.887 8.6 9.0 0.342
Unexplained Variance
Between schools 2278.2 125.25 <0.001 1949.77 250.07 <0.001 1107.54 173.64 <0.001Within schools (between years) 763.15 19.51 <0.001 474.64 25.86 <0.001 261.26 17.26 <0.001n of schools 838 196 134
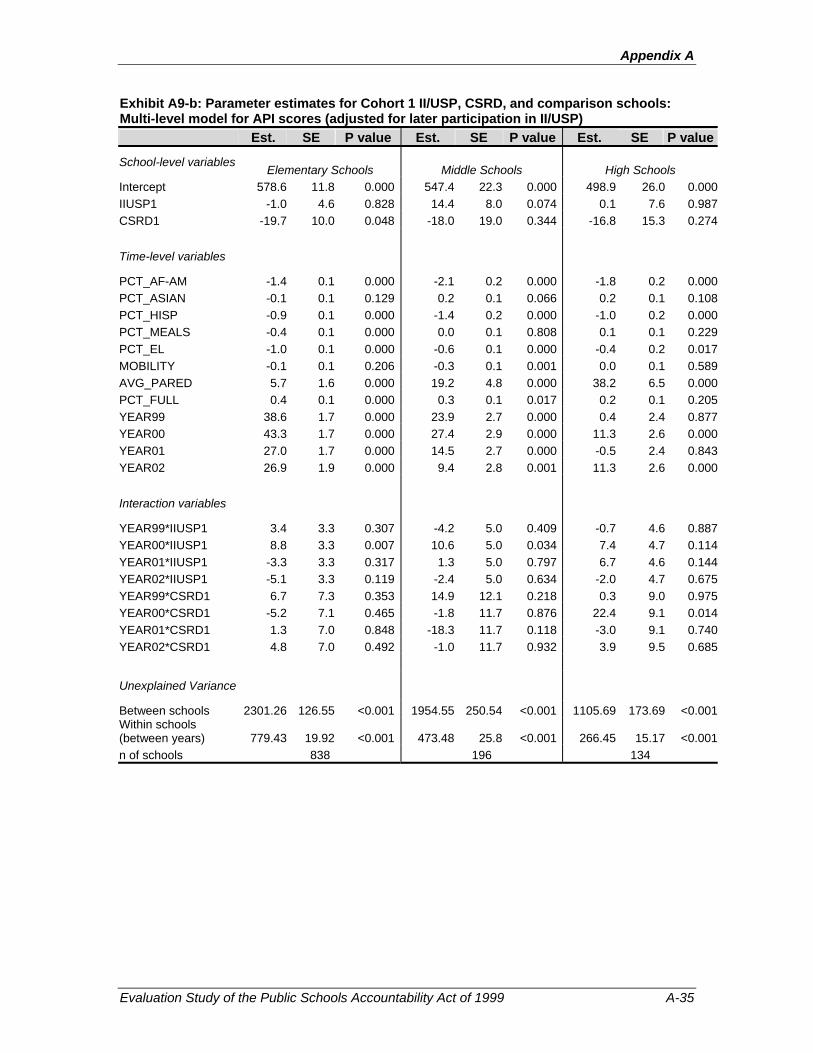
Appendix A
Evaluation Study of the Public Schools Accountability Act of 1999 A-35
Exhibit A9-b: Parameter estimates for Cohort 1 II/USP, CSRD, and comparison schools: Multi-level model for API scores (adjusted for later participation in II/USP) Est. SE P value Est. SE P value Est. SE P value
School-level variables Elementary Schools
Middle Schools
High Schools Intercept 578.6 11.8 0.000 547.4 22.3 0.000 498.9 26.0 0.000IIUSP1 -1.0 4.6 0.828 14.4 8.0 0.074 0.1 7.6 0.987CSRD1 -19.7 10.0 0.048 -18.0 19.0 0.344 -16.8 15.3 0.274
Time-level variables PCT_AF-AM -1.4 0.1 0.000 -2.1 0.2 0.000 -1.8 0.2 0.000PCT_ASIAN -0.1 0.1 0.129 0.2 0.1 0.066 0.2 0.1 0.108PCT_HISP -0.9 0.1 0.000 -1.4 0.2 0.000 -1.0 0.2 0.000PCT_MEALS -0.4 0.1 0.000 0.0 0.1 0.808 0.1 0.1 0.229PCT_EL -1.0 0.1 0.000 -0.6 0.1 0.000 -0.4 0.2 0.017MOBILITY -0.1 0.1 0.206 -0.3 0.1 0.001 0.0 0.1 0.589AVG_PARED 5.7 1.6 0.000 19.2 4.8 0.000 38.2 6.5 0.000PCT_FULL 0.4 0.1 0.000 0.3 0.1 0.017 0.2 0.1 0.205YEAR99 38.6 1.7 0.000 23.9 2.7 0.000 0.4 2.4 0.877YEAR00 43.3 1.7 0.000 27.4 2.9 0.000 11.3 2.6 0.000YEAR01 27.0 1.7 0.000 14.5 2.7 0.000 -0.5 2.4 0.843YEAR02 26.9 1.9 0.000 9.4 2.8 0.001 11.3 2.6 0.000
Interaction variables
YEAR99*IIUSP1 3.4 3.3 0.307 -4.2 5.0 0.409 -0.7 4.6 0.887YEAR00*IIUSP1 8.8 3.3 0.007 10.6 5.0 0.034 7.4 4.7 0.114YEAR01*IIUSP1 -3.3 3.3 0.317 1.3 5.0 0.797 6.7 4.6 0.144YEAR02*IIUSP1 -5.1 3.3 0.119 -2.4 5.0 0.634 -2.0 4.7 0.675YEAR99*CSRD1 6.7 7.3 0.353 14.9 12.1 0.218 0.3 9.0 0.975YEAR00*CSRD1 -5.2 7.1 0.465 -1.8 11.7 0.876 22.4 9.1 0.014YEAR01*CSRD1 1.3 7.0 0.848 -18.3 11.7 0.118 -3.0 9.1 0.740YEAR02*CSRD1 4.8 7.0 0.492 -1.0 11.7 0.932 3.9 9.5 0.685
Unexplained Variance
Between schools 2301.26 126.55 <0.001 1954.55 250.54 <0.001 1105.69 173.69 <0.001Within schools (between years) 779.43 19.92 <0.001 473.48 25.8 <0.001 266.45 15.17 <0.001n of schools 838 196 134
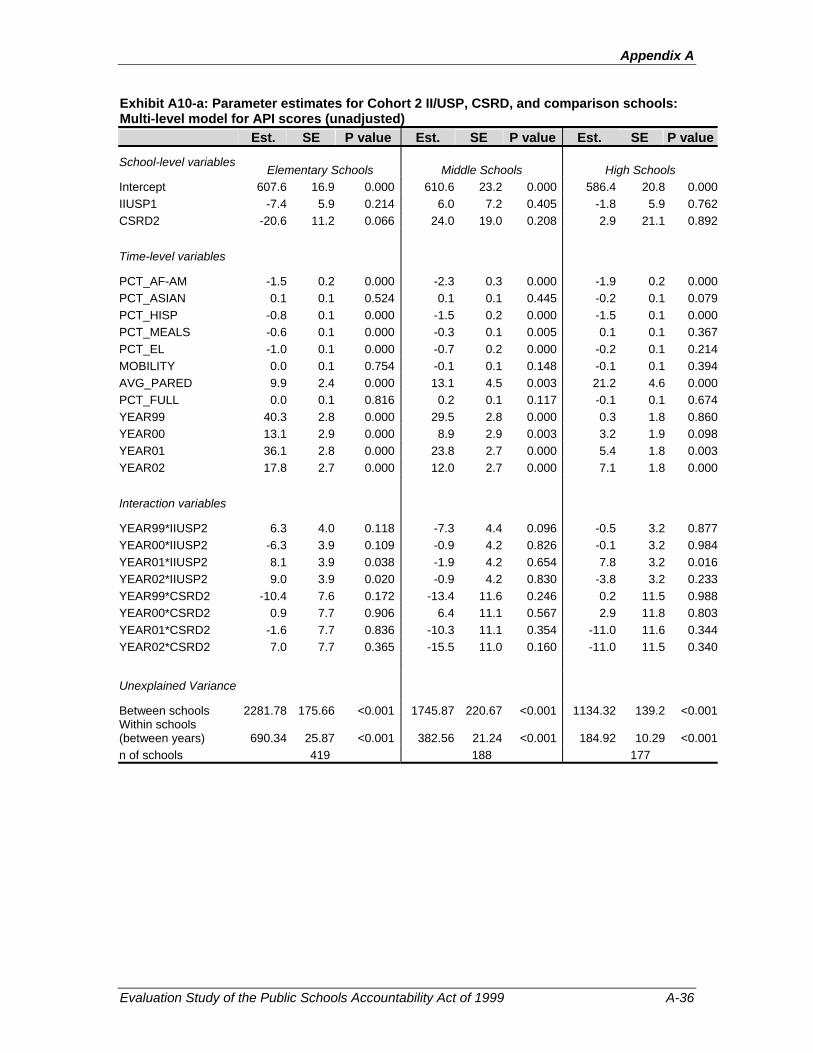
Appendix A
Evaluation Study of the Public Schools Accountability Act of 1999 A-36
Exhibit A10-a: Parameter estimates for Cohort 2 II/USP, CSRD, and comparison schools: Multi-level model for API scores (unadjusted) Est. SE P value Est. SE P value Est. SE P value
School-level variables Elementary Schools
Middle Schools
High Schools Intercept 607.6 16.9 0.000 610.6 23.2 0.000 586.4 20.8 0.000IIUSP1 -7.4 5.9 0.214 6.0 7.2 0.405 -1.8 5.9 0.762CSRD2 -20.6 11.2 0.066 24.0 19.0 0.208 2.9 21.1 0.892
Time-level variables
PCT_AF-AM -1.5 0.2 0.000 -2.3 0.3 0.000 -1.9 0.2 0.000PCT_ASIAN 0.1 0.1 0.524 0.1 0.1 0.445 -0.2 0.1 0.079PCT_HISP -0.8 0.1 0.000 -1.5 0.2 0.000 -1.5 0.1 0.000PCT_MEALS -0.6 0.1 0.000 -0.3 0.1 0.005 0.1 0.1 0.367PCT_EL -1.0 0.1 0.000 -0.7 0.2 0.000 -0.2 0.1 0.214MOBILITY 0.0 0.1 0.754 -0.1 0.1 0.148 -0.1 0.1 0.394AVG_PARED 9.9 2.4 0.000 13.1 4.5 0.003 21.2 4.6 0.000PCT_FULL 0.0 0.1 0.816 0.2 0.1 0.117 -0.1 0.1 0.674YEAR99 40.3 2.8 0.000 29.5 2.8 0.000 0.3 1.8 0.860YEAR00 13.1 2.9 0.000 8.9 2.9 0.003 3.2 1.9 0.098YEAR01 36.1 2.8 0.000 23.8 2.7 0.000 5.4 1.8 0.003YEAR02 17.8 2.7 0.000 12.0 2.7 0.000 7.1 1.8 0.000
Interaction variables
YEAR99*IIUSP2 6.3 4.0 0.118 -7.3 4.4 0.096 -0.5 3.2 0.877YEAR00*IIUSP2 -6.3 3.9 0.109 -0.9 4.2 0.826 -0.1 3.2 0.984YEAR01*IIUSP2 8.1 3.9 0.038 -1.9 4.2 0.654 7.8 3.2 0.016YEAR02*IIUSP2 9.0 3.9 0.020 -0.9 4.2 0.830 -3.8 3.2 0.233YEAR99*CSRD2 -10.4 7.6 0.172 -13.4 11.6 0.246 0.2 11.5 0.988YEAR00*CSRD2 0.9 7.7 0.906 6.4 11.1 0.567 2.9 11.8 0.803YEAR01*CSRD2 -1.6 7.7 0.836 -10.3 11.1 0.354 -11.0 11.6 0.344YEAR02*CSRD2 7.0 7.7 0.365 -15.5 11.0 0.160 -11.0 11.5 0.340
Unexplained Variance
Between schools 2281.78 175.66 <0.001 1745.87 220.67 <0.001 1134.32 139.2 <0.001Within schools (between years) 690.34 25.87 <0.001 382.56 21.24 <0.001 184.92 10.29 <0.001n of schools 419 188 177

Appendix A
Evaluation Study of the Public Schools Accountability Act of 1999 A-37
Exhibit A10-b: Parameter estimates for Cohort 2 II/USP, CSRD, and comparison schools: Multi-level model for API scores (adjusted for later participation in II/USP) Est. SE P value Est. SE P value Est. SE P value
School-level variables Elementary Schools
Middle Schools
High Schools Intercept 606.8 15.9 0.000 601.5 22.4 0.000 613.2 19.8 0.000IIUSP1 -7.8 5.8 0.184 5.8 7.1 0.413 -1.7 6.0 0.779CSRD2 -20.2 11.0 0.068 23.9 18.8 0.205 3.3 21.6 0.879
Time-level variables
PCT_AF-AM -1.5 0.2 0.000 -2.2 0.2 0.000 -1.9 0.2 0.000PCT_ASIAN 0.1 0.1 0.553 0.1 0.1 0.645 -0.2 0.1 0.056PCT_HISP -0.8 0.1 0.000 -1.4 0.2 0.000 -1.6 0.1 0.000PCT_MEALS -0.6 0.1 0.000 -0.3 0.1 0.001 0.1 0.1 0.340PCT_EL -0.9 0.1 0.000 -0.8 0.1 0.000 -0.1 0.1 0.407MOBILITY -0.1 0.1 0.381 0.0 0.1 0.637 -0.1 0.1 0.207AVG_PARED 9.2 2.3 0.000 13.9 4.3 0.001 16.2 4.3 0.000PCT_FULL 0.1 0.1 0.324 0.2 0.1 0.042 -0.2 0.1 0.165YEAR99 40.3 2.8 0.000 29.4 2.8 0.000 0.3 1.8 0.858YEAR00 13.4 2.8 0.000 8.3 2.9 0.004 2.9 1.9 0.131YEAR01 36.0 2.7 0.000 24.1 2.7 0.000 5.2 1.8 0.004YEAR02 20.3 2.9 0.000 14.2 2.8 0.000 10.6 1.9 0.000
Interaction variables
YEAR99*IIUSP2 6.2 3.9 0.117 -7.2 4.4 0.102 -0.5 3.1 0.876YEAR00*IIUSP2 -6.5 3.8 0.091 -0.8 4.2 0.858 0.2 3.2 0.950YEAR01*IIUSP2 8.1 3.8 0.034 -2.1 4.2 0.617 7.4 3.2 0.020YEAR02*IIUSP2 9.5 3.8 0.012 -0.2 4.2 0.957 -4.6 3.2 0.152YEAR99*CSRD2 -10.2 7.5 0.169 -13.3 11.5 0.247 0.2 11.4 0.988YEAR00*CSRD2 1.2 7.5 0.872 5.2 11.0 0.640 3.1 11.7 0.791YEAR01*CSRD2 -1.5 7.6 0.848 -9.0 11.0 0.416 -10.5 11.5 0.361YEAR02*CSRD2 5.0 7.5 0.508 -14.7 11.0 0.182 -5.2 13.0 0.692
Unexplained Variance
Between schools 2281.8 175.71 <0.001 1745.84 220.67 <0.001 1136.22 139.48 <0.001Within schools (between years) 692.24 24.88 <0.001 382.47 21.24 <0.001 185.32 10.32 <0.001n of schools 419 188 177

Appendix A
Evaluation Study of the Public Schools Accountability Act of 1999 A-38
Exhibit A11: Parameter estimates for Cohort 3 II/USP, CSRD, and comparison schools: Multi-level model for API scores Est. SE P value Est. SE P value Est. SE P value
School-level variables Elementary Schools
Middle Schools
High Schools Intercept 597.4 12.5 0.000 619.3 20.0 0.000 604.4 18.9 0.000IIUSP3 -10.3 4.2 0.015 -17.2 7.6 0.025 -7.8 5.2 0.138
Time-level variables
PCT_AF-AM -1.3 0.1 0.000 -2.3 0.2 0.000 -1.9 0.2 0.000PCT_ASIAN 0.0 0.1 0.990 0.2 0.1 0.213 0.0 0.1 0.815PCT_HISP -0.9 0.1 0.000 -1.3 0.2 0.000 -1.6 0.1 0.000PCT_MEALS -0.6 0.1 0.000 -0.3 0.1 0.000 -0.2 0.1 0.001PCT_EL -0.6 0.1 0.000 -0.8 0.1 0.000 0.0 0.1 0.739MOBILITY -0.1 0.1 0.046 0.1 0.1 0.127 0.0 0.0 0.933AVG_PARED 8.0 2.0 0.000 7.6 3.8 0.044 17.5 4.0 0.000PCT_FULL 0.2 0.1 0.003 0.2 0.1 0.080 0.1 0.1 0.542YEAR99 38.3 1.8 0.000 23.8 2.3 0.000 0.1 2.0 0.949YEAR00 46.8 1.9 0.000 27.3 2.3 0.000 18.5 2.2 0.000YEAR01 7.3 1.8 0.000 2.8 2.2 0.195 -2.6 2.0 0.193YEAR02 24.3 1.9 0.000 14.0 2.3 0.000 12.7 2.0 0.000
Interaction variables
YEAR99*IIUSP3 0.2 3.0 0.935 6.8 4.5 0.137 0.7 3.3 0.831YEAR00*IIUSP3 1.5 2.9 0.604 4.8 4.5 0.287 -0.3 3.3 0.923YEAR01*IIUSP3 -6.3 2.9 0.030 -1.5 4.4 0.739 2.3 3.3 0.493YEAR02*IIUSP3 3.4 2.9 0.240 -0.2 4.4 0.959 -2.5 3.4 0.467
Unexplained Variance
Between schools 1903.9 119.4 <0.001 1639.33 196.83 <0.001 932.79 110.32 <0.001Within schools (between years) 608.53 17.79 <0.001 339.78 18.47 <0.001 238.45 12.68 <0.001n of schools 650 193 191
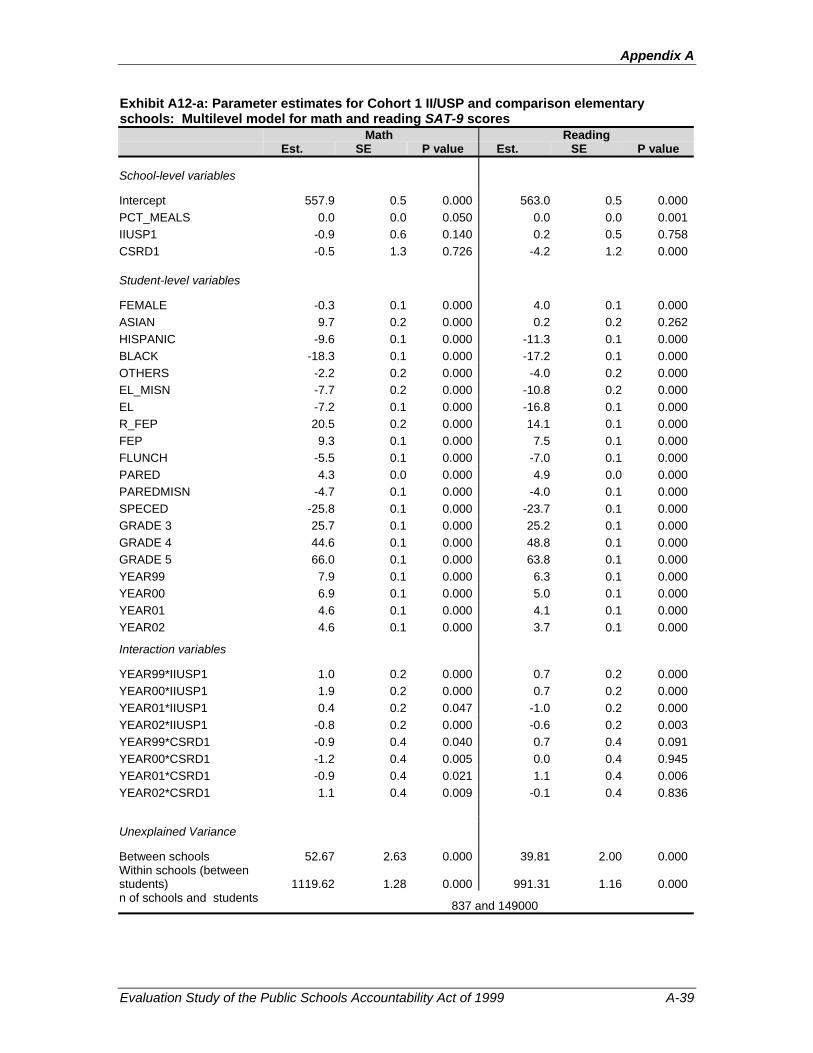
Appendix A
Evaluation Study of the Public Schools Accountability Act of 1999 A-39
Exhibit A12-a: Parameter estimates for Cohort 1 II/USP and comparison elementary schools: Multilevel model for math and reading SAT-9 scores Math Reading Est. SE P value Est. SE P value
School-level variables
Intercept 557.9 0.5 0.000 563.0 0.5 0.000PCT_MEALS 0.0 0.0 0.050 0.0 0.0 0.001IIUSP1 -0.9 0.6 0.140 0.2 0.5 0.758CSRD1 -0.5 1.3 0.726 -4.2 1.2 0.000
Student-level variables FEMALE -0.3 0.1 0.000 4.0 0.1 0.000ASIAN 9.7 0.2 0.000 0.2 0.2 0.262HISPANIC -9.6 0.1 0.000 -11.3 0.1 0.000BLACK -18.3 0.1 0.000 -17.2 0.1 0.000OTHERS -2.2 0.2 0.000 -4.0 0.2 0.000EL_MISN -7.7 0.2 0.000 -10.8 0.2 0.000EL -7.2 0.1 0.000 -16.8 0.1 0.000R_FEP 20.5 0.2 0.000 14.1 0.1 0.000FEP 9.3 0.1 0.000 7.5 0.1 0.000FLUNCH -5.5 0.1 0.000 -7.0 0.1 0.000PARED 4.3 0.0 0.000 4.9 0.0 0.000PAREDMISN -4.7 0.1 0.000 -4.0 0.1 0.000SPECED -25.8 0.1 0.000 -23.7 0.1 0.000GRADE 3 25.7 0.1 0.000 25.2 0.1 0.000GRADE 4 44.6 0.1 0.000 48.8 0.1 0.000GRADE 5 66.0 0.1 0.000 63.8 0.1 0.000YEAR99 7.9 0.1 0.000 6.3 0.1 0.000YEAR00 6.9 0.1 0.000 5.0 0.1 0.000YEAR01 4.6 0.1 0.000 4.1 0.1 0.000YEAR02 4.6 0.1 0.000 3.7 0.1 0.000
Interaction variables YEAR99*IIUSP1 1.0 0.2 0.000 0.7 0.2 0.000YEAR00*IIUSP1 1.9 0.2 0.000 0.7 0.2 0.000YEAR01*IIUSP1 0.4 0.2 0.047 -1.0 0.2 0.000YEAR02*IIUSP1 -0.8 0.2 0.000 -0.6 0.2 0.003YEAR99*CSRD1 -0.9 0.4 0.040 0.7 0.4 0.091YEAR00*CSRD1 -1.2 0.4 0.005 0.0 0.4 0.945YEAR01*CSRD1 -0.9 0.4 0.021 1.1 0.4 0.006YEAR02*CSRD1 1.1 0.4 0.009 -0.1 0.4 0.836
Unexplained Variance Between schools 52.67 2.63 0.000 39.81 2.00 0.000Within schools (between students) 1119.62 1.28 0.000 991.31 1.16 0.000n of schools and students
837 and 149000

Appendix A
Evaluation Study of the Public Schools Accountability Act of 1999 A-40
Exhibit A12-b: Parameter estimates for Cohort 1 II/USP and comparison middle schools: Multilevel model for math and reading SAT-9 scores Math Reading Est. SE P value Est. SE P value
School-level variables
Intercept 646.5 0.6 0.000 649.2 0.6 0.000PCT_MEALS 0.0 0.0 0.000 0.0 0.0 0.000IIUSP1 -0.4 0.9 0.698 0.4 0.9 0.610CSRD1 1.8 2.2 0.421 -0.3 2.1 0.878
Student-level variables FEMALE -0.2 0.1 0.001 3.6 0.1 0.000ASIAN 13.4 0.2 0.000 -1.3 0.2 0.000HISPANIC -12.2 0.1 0.000 -12.8 0.1 0.000BLACK -20.1 0.1 0.000 -20.1 0.1 0.000OTHERS -3.7 0.2 0.000 -7.2 0.2 0.000EL_MISN -7.5 0.2 0.000 -11.1 0.2 0.000EL -12.2 0.1 0.000 -22.8 0.1 0.000R_FEP 9.8 0.1 0.000 6.9 0.1 0.000FEP 6.8 0.1 0.000 6.1 0.1 0.000FLUNCH -4.3 0.1 0.000 -5.2 0.1 0.000PARED 3.4 0.0 0.000 4.0 0.0 0.000PAREDMISN -4.6 0.1 0.000 -4.9 0.1 0.000SPECED -22.7 0.1 0.000 -27.6 0.1 0.000GRADE 7 11.7 0.1 0.000 3.2 0.1 0.000GRADE 8 19.8 0.1 0.000 1.6 0.1 0.000YEAR99 3.6 0.1 0.000 1.1 0.1 0.000YEAR00 2.1 0.1 0.000 0.7 0.1 0.000YEAR01 1.4 0.1 0.000 12.6 0.1 0.000YEAR02 2.1 0.1 0.000 27.0 0.1 0.000
Interaction variables YEAR99*IIUSP1 0.6 0.2 0.007 -0.2 0.2 0.353YEAR00*IIUSP1 2.9 0.2 0.000 2.0 0.2 0.000YEAR01*IIUSP1 0.1 0.2 0.516 0.1 0.2 0.741YEAR02*IIUSP1 0.9 0.2 0.000 0.7 0.2 0.001YEAR99*CSRD1 0.9 0.5 0.091 0.9 0.5 0.088YEAR00*CSRD1 -4.8 0.5 0.000 -2.1 0.5 0.000YEAR01*CSRD1 -2.5 0.5 0.000 -1.3 0.5 0.015YEAR02*CSRD1 -1.8 0.5 0.000 -2.4 0.5 0.000
Unexplained Variance Between schools 31.80 3.26 0.000 28.29 2.94 0.000Within schools (between students) 776.24 1.18 0.000 789.36 1.20 0.000n of schools and students
195 and 842639
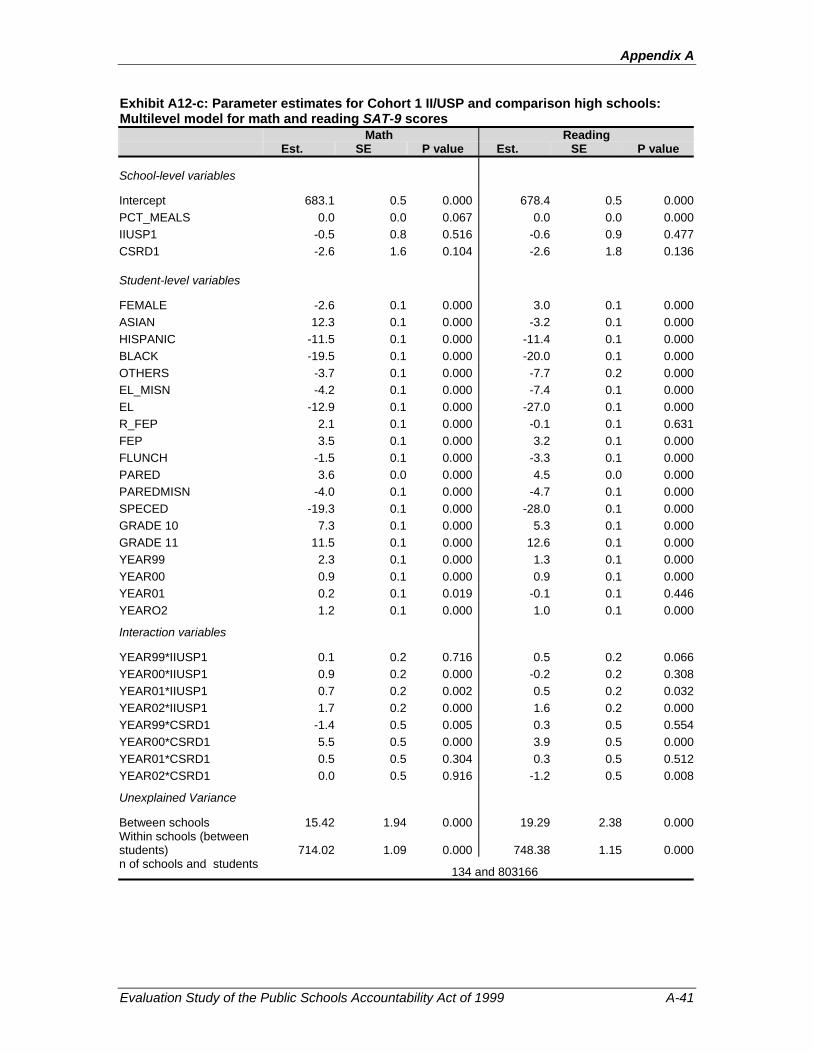
Appendix A
Evaluation Study of the Public Schools Accountability Act of 1999 A-41
Exhibit A12-c: Parameter estimates for Cohort 1 II/USP and comparison high schools: Multilevel model for math and reading SAT-9 scores Math Reading Est. SE P value Est. SE P value
School-level variables
Intercept 683.1 0.5 0.000 678.4 0.5 0.000PCT_MEALS 0.0 0.0 0.067 0.0 0.0 0.000IIUSP1 -0.5 0.8 0.516 -0.6 0.9 0.477CSRD1 -2.6 1.6 0.104 -2.6 1.8 0.136
Student-level variables FEMALE -2.6 0.1 0.000 3.0 0.1 0.000ASIAN 12.3 0.1 0.000 -3.2 0.1 0.000HISPANIC -11.5 0.1 0.000 -11.4 0.1 0.000BLACK -19.5 0.1 0.000 -20.0 0.1 0.000OTHERS -3.7 0.1 0.000 -7.7 0.2 0.000EL_MISN -4.2 0.1 0.000 -7.4 0.1 0.000EL -12.9 0.1 0.000 -27.0 0.1 0.000R_FEP 2.1 0.1 0.000 -0.1 0.1 0.631FEP 3.5 0.1 0.000 3.2 0.1 0.000FLUNCH -1.5 0.1 0.000 -3.3 0.1 0.000PARED 3.6 0.0 0.000 4.5 0.0 0.000PAREDMISN -4.0 0.1 0.000 -4.7 0.1 0.000SPECED -19.3 0.1 0.000 -28.0 0.1 0.000GRADE 10 7.3 0.1 0.000 5.3 0.1 0.000GRADE 11 11.5 0.1 0.000 12.6 0.1 0.000YEAR99 2.3 0.1 0.000 1.3 0.1 0.000YEAR00 0.9 0.1 0.000 0.9 0.1 0.000YEAR01 0.2 0.1 0.019 -0.1 0.1 0.446YEARO2 1.2 0.1 0.000 1.0 0.1 0.000
Interaction variables YEAR99*IIUSP1 0.1 0.2 0.716 0.5 0.2 0.066YEAR00*IIUSP1 0.9 0.2 0.000 -0.2 0.2 0.308YEAR01*IIUSP1 0.7 0.2 0.002 0.5 0.2 0.032YEAR02*IIUSP1 1.7 0.2 0.000 1.6 0.2 0.000YEAR99*CSRD1 -1.4 0.5 0.005 0.3 0.5 0.554YEAR00*CSRD1 5.5 0.5 0.000 3.9 0.5 0.000YEAR01*CSRD1 0.5 0.5 0.304 0.3 0.5 0.512YEAR02*CSRD1 0.0 0.5 0.916 -1.2 0.5 0.008
Unexplained Variance Between schools 15.42 1.94 0.000 19.29 2.38 0.000Within schools (between students) 714.02 1.09 0.000 748.38 1.15 0.000n of schools and students
134 and 803166

Appendix A
Evaluation Study of the Public Schools Accountability Act of 1999 A-42
Exhibit A13-a: Parameter estimates for Cohort 2 II/USP and comparison elementary schools: Multilevel model for math and reading SAT-9 scores Math Reading Est. SE P value Est. SE P value
School-level variables
Intercept 558.5 0.8 0.000 562.4 0.8 0.000PCT_MEALS 0.0 0.0 0.011 0.0 0.0 0.045IIUSP2 -0.9 0.7 0.226 -0.2 0.7 0.763CSRD2 -1.6 1.5 0.275 -0.6 1.3 0.663
Student-level variables FEMALE -0.1 0.1 0.159 4.2 0.1 0.000ASIAN 8.0 0.2 0.000 -1.3 0.2 0.000HISPANIC -9.5 0.1 0.000 -11.6 0.1 0.000BLACK -19.0 0.2 0.000 -17.8 0.2 0.000OTHERS -2.9 0.2 0.000 -5.4 0.2 0.000EL_MISN -8.3 0.3 0.000 -10.8 0.3 0.000EL -7.7 0.1 0.000 -16.6 0.1 0.000R_FEP 21.2 0.2 0.000 15.1 0.2 0.000FEP 9.7 0.2 0.000 7.9 0.2 0.000FLUNCH -6.1 0.1 0.000 -7.6 0.1 0.000PARED 4.8 0.0 0.000 5.4 0.0 0.000PAREDMISN -5.0 0.1 0.000 -4.3 0.1 0.000SPECED -25.9 0.1 0.000 -24.6 0.1 0.000GRADE 3 25.4 0.1 0.000 25.4 0.1 0.000GRADE 4 44.6 0.1 0.000 49.4 0.1 0.000GRADE 5 66.7 0.1 0.000 64.5 0.1 0.000YEAR99 7.5 0.2 0.000 6.3 0.2 0.000YEAR00 4.5 0.2 0.000 2.8 0.2 0.000YEAR01 6.4 0.2 0.000 4.3 0.2 0.000YEAR02 4.0 0.2 0.000 2.5 0.2 0.000
Interaction variables YEAR99*IIUSP2 1.2 0.3 0.000 0.8 0.3 0.002YEAR00*IIUSP2 -1.3 0.3 0.000 -0.7 0.2 0.008YEAR01*IIUSP2 0.7 0.2 0.003 1.4 0.2 0.000YEAR02*IIUSP2 0.7 0.2 0.002 1.0 0.2 0.000YEAR99*CSRD2 -1.3 0.5 0.007 -1.9 0.5 0.000YEAR00*CSRD2 -0.2 0.5 0.655 1.2 0.4 0.007YEAR01*CSRD2 -1.2 0.4 0.008 -1.3 0.4 0.002YEAR02*CSRD2 1.2 0.4 0.005 1.1 0.4 0.007
Unexplained Variance Between schools 15.42 1.94 0.000 19.29 2.38 0.000Within schools (between students) 714.02 1.09 0.000 748.38 1.15 0.000n of schools and students
419 and 727935

Appendix A
Evaluation Study of the Public Schools Accountability Act of 1999 A-43
Exhibit A13-b: Parameter estimates for Cohort 2 II/USP and comparison middle schools: Multilevel model for math and reading SAT-9 scores Math Reading Est. SE P value Est. SE P value
School-level variables
Intercept 646.2 0.7 0.000 647.4 0.7 0.000PCT_MEALS 0.0 0.0 0.000 0.1 0.0 0.000IIUSP2 0.0 0.9 0.968 0.0 0.9 0.962CSRD2 4.9 2.4 0.039 3.7 2.2 0.101
Student-level variables FEMALE -0.4 0.1 0.000 3.5 0.1 0.000ASIAN 12.9 0.2 0.000 0.1 0.2 0.528HISPANIC -10.9 0.1 0.000 -11.1 0.1 0.000BLACK -19.4 0.1 0.000 -19.3 0.1 0.000OTHERS -2.9 0.2 0.000 -6.1 0.2 0.000EL_MISN -7.7 0.2 0.000 -11.4 0.2 0.000EL -12.9 0.1 0.000 -23.4 0.1 0.000R_FEP 10.2 0.1 0.000 6.8 0.1 0.000FEP 7.7 0.1 0.000 6.5 0.1 0.000FLUNCH -4.6 0.1 0.000 -5.9 0.1 0.000PARED 3.5 0.0 0.000 4.0 0.0 0.000PAREDMISN -4.4 0.1 0.000 -4.8 0.1 0.000SPECED -23.0 0.1 0.000 -28.0 0.1 0.000GRADE 7 10.9 0.1 0.000 12.7 0.1 0.000GRADE 8 18.9 0.1 0.000 27.0 0.1 0.000YEAR99 3.9 0.1 0.000 3.1 0.1 0.000YEAR00 2.3 0.1 0.000 1.4 0.1 0.000YEAR01 2.6 0.1 0.000 1.7 0.1 0.000YEAR02 2.3 0.1 0.000 1.2 0.1 0.000
Interaction variables YEAR99*IIUSP2 0.9 0.2 0.000 1.2 0.2 0.000YEAR00*IIUSP2 -1.9 0.2 0.000 -1.4 0.2 0.000YEAR01*IIUSP2 -0.2 0.2 0.271 0.1 0.2 0.540YEAR02*IIUSP2 0.0 0.2 0.968 -0.3 0.2 0.107YEAR99*CSRD2 -4.1 0.5 0.000 -2.5 0.5 0.000YEAR00*CSRD2 0.0 0.5 0.999 0.2 0.5 0.695YEAR01*CSRD2 -1.2 0.4 0.008 -1.1 0.4 0.010YEAR02*CSRD2 -1.1 0.4 0.013 -1.2 0.4 0.006
Unexplained Variance Between schools 34.54 3.64 0.000 31.20 3.35 0.000Within schools (between students) 780.03 1.16 0.000 784.42 1.17 0.000n of schools and students
187 and 884569
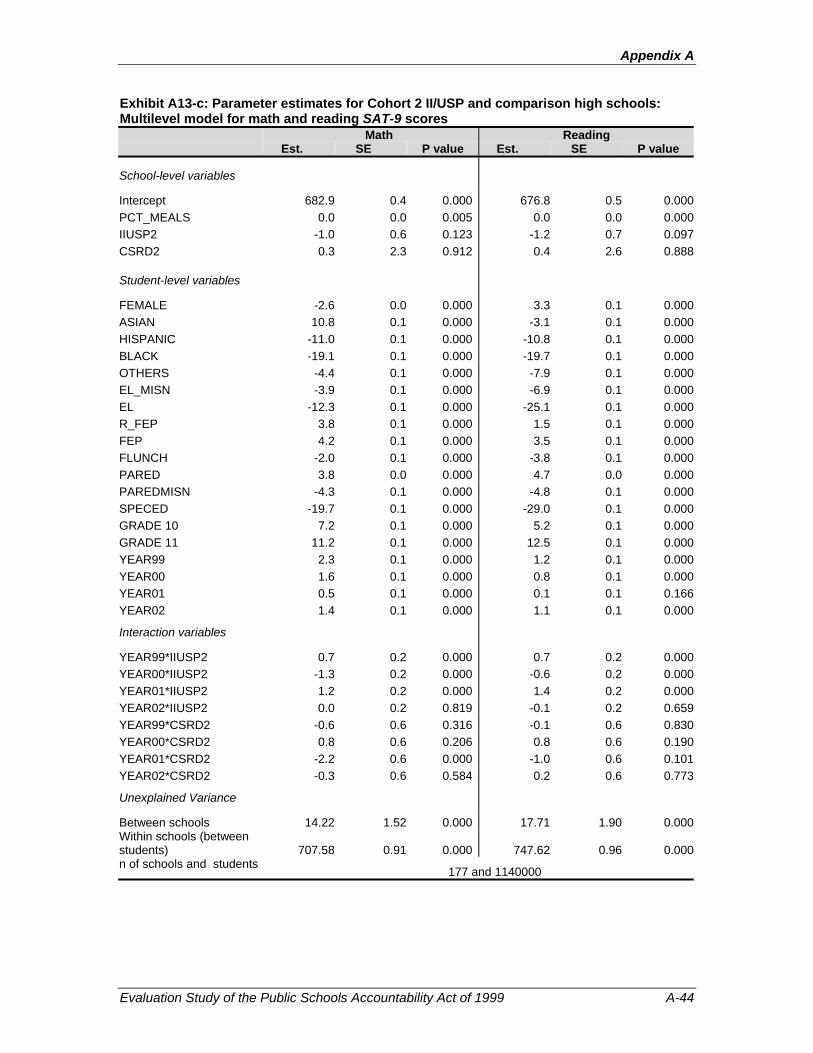
Appendix A
Evaluation Study of the Public Schools Accountability Act of 1999 A-44
Exhibit A13-c: Parameter estimates for Cohort 2 II/USP and comparison high schools: Multilevel model for math and reading SAT-9 scores Math Reading Est. SE P value Est. SE P value
School-level variables
Intercept 682.9 0.4 0.000 676.8 0.5 0.000PCT_MEALS 0.0 0.0 0.005 0.0 0.0 0.000IIUSP2 -1.0 0.6 0.123 -1.2 0.7 0.097CSRD2 0.3 2.3 0.912 0.4 2.6 0.888
Student-level variables FEMALE -2.6 0.0 0.000 3.3 0.1 0.000ASIAN 10.8 0.1 0.000 -3.1 0.1 0.000HISPANIC -11.0 0.1 0.000 -10.8 0.1 0.000BLACK -19.1 0.1 0.000 -19.7 0.1 0.000OTHERS -4.4 0.1 0.000 -7.9 0.1 0.000EL_MISN -3.9 0.1 0.000 -6.9 0.1 0.000EL -12.3 0.1 0.000 -25.1 0.1 0.000R_FEP 3.8 0.1 0.000 1.5 0.1 0.000FEP 4.2 0.1 0.000 3.5 0.1 0.000FLUNCH -2.0 0.1 0.000 -3.8 0.1 0.000PARED 3.8 0.0 0.000 4.7 0.0 0.000PAREDMISN -4.3 0.1 0.000 -4.8 0.1 0.000SPECED -19.7 0.1 0.000 -29.0 0.1 0.000GRADE 10 7.2 0.1 0.000 5.2 0.1 0.000GRADE 11 11.2 0.1 0.000 12.5 0.1 0.000YEAR99 2.3 0.1 0.000 1.2 0.1 0.000YEAR00 1.6 0.1 0.000 0.8 0.1 0.000YEAR01 0.5 0.1 0.000 0.1 0.1 0.166YEAR02 1.4 0.1 0.000 1.1 0.1 0.000
Interaction variables YEAR99*IIUSP2 0.7 0.2 0.000 0.7 0.2 0.000YEAR00*IIUSP2 -1.3 0.2 0.000 -0.6 0.2 0.000YEAR01*IIUSP2 1.2 0.2 0.000 1.4 0.2 0.000YEAR02*IIUSP2 0.0 0.2 0.819 -0.1 0.2 0.659YEAR99*CSRD2 -0.6 0.6 0.316 -0.1 0.6 0.830YEAR00*CSRD2 0.8 0.6 0.206 0.8 0.6 0.190YEAR01*CSRD2 -2.2 0.6 0.000 -1.0 0.6 0.101YEAR02*CSRD2 -0.3 0.6 0.584 0.2 0.6 0.773
Unexplained Variance Between schools 14.22 1.52 0.000 17.71 1.90 0.000Within schools (between students) 707.58 0.91 0.000 747.62 0.96 0.000n of schools and students
177 and 1140000

Appendix A
Evaluation Study of the Public Schools Accountability Act of 1999 A-45
Exhibit A14-a: Parameter estimates for Cohort 3 II/USP and comparison elementary schools: Multilevel model for math and reading SAT-9 scores Math Reading Est. SE P value Est. SE P value
School-level variables
Intercept 554.5 0.6 0.000 564.4 0.6 0.000PCT_MEALS 0.0 0.0 0.000 0.0 0.0 0.014IIUSP3 -1.5 0.6 0.010 -1.4 0.5 0.003
Student-level variables FEMALE -0.3 0.1 0.000 4.2 0.1 0.000ASIAN 9.4 0.2 0.000 0.5 0.2 0.005HISPANIC -9.3 0.1 0.000 -11.0 0.1 0.000BLACK -18.4 0.1 0.000 -17.3 0.1 0.000OTHERS -2.3 0.2 0.000 -4.2 0.2 0.000EL_MISN -7.4 0.2 0.000 -9.9 0.2 0.000EL -8.1 0.1 0.000 -17.4 0.1 0.000R_FEP 18.4 0.2 0.000 12.1 0.2 0.000FEP 8.7 0.1 0.000 6.6 0.1 0.000FLUNCH -6.1 0.1 0.000 -7.4 0.1 0.000PARED 5.2 0.0 0.000 5.8 0.0 0.000PAREDMISN -5.5 0.1 0.000 -4.5 0.1 0.000SPECED -26.7 0.1 0.000 -25.4 0.1 0.000GRADE 3 26.0 0.1 0.000 26.1 0.1 0.000GRADE 4 45.1 0.1 0.000 49.9 0.1 0.000GRADE 5 67.4 0.1 0.000 65.2 0.1 0.000YEAR99 7.5 0.1 0.000 6.4 0.1 0.000YEAR00 8.5 0.1 0.000 5.6 0.1 0.000YEAR01 2.1 0.1 0.000 2.0 0.1 0.000YEAR02 4.6 0.1 0.000 3.0 0.1 0.000
Interaction variables YEAR99*IIUSP3 0.8 0.2 0.000 0.7 0.2 0.001YEAR00*IIUSP3 -0.4 0.2 0.076 0.0 0.2 0.818YEAR01*IIUSP3 -1.0 0.2 0.000 -0.7 0.2 0.001YEAR02*IIUSP3 0.0 0.2 0.970 0.3 0.2 0.202
Unexplained Variance Between schools 46.46 2.65 0.000 32.49 1.89 0.000Within schools (between students) 1141.60 1.52 0.000 1036.36 1.41 0.000n of schools and students
650 and 1060000

Appendix A
Evaluation Study of the Public Schools Accountability Act of 1999 A-46
Exhibit A14-b: Parameter estimates for Cohort 3 II/USP and comparison middle schools: Multilevel model for math and reading SAT-9 scores Math Reading Est. SE P value Est. SE P value
School-level variables
Intercept 648.9 0.5 0.000 652.0 0.5 0.000PCT_MEALS 0.0 0.0 0.025 0.0 0.0 0.876IIUSP3 -1.2 0.9 0.186 -1.2 0.8 0.135
Student-level variables FEMALE -0.4 0.1 0.000 3.5 0.1 0.000ASIAN 11.2 0.2 0.000 -2.6 0.2 0.000HISPANIC -11.2 0.1 0.000 -12.3 0.1 0.000BLACK -18.9 0.1 0.000 -18.7 0.1 0.000OTHERS -3.2 0.2 0.000 -7.1 0.2 0.000EL_MISN -6.8 0.2 0.000 -9.0 0.2 0.000EL -11.8 0.1 0.000 -22.3 0.1 0.000R_FEP 10.6 0.1 0.000 7.9 0.1 0.000FEP 6.7 0.1 0.000 6.1 0.1 0.000FLUNCH -5.2 0.1 0.000 -6.2 0.1 0.000PARED 3.4 0.0 0.000 4.0 0.0 0.000PAREDMISN -4.5 0.1 0.000 -4.7 0.1 0.000SPECED -24.0 0.1 0.000 -29.1 0.1 0.000GRADE 7 11.0 0.1 0.000 13.2 0.1 0.000GRADE 8 19.1 0.1 0.000 27.5 0.1 0.000YEAR99 3.9 0.1 0.000 3.0 0.1 0.000YEAR00 3.8 0.1 0.000 2.9 0.1 0.000YEAR01 0.5 0.1 0.000 0.1 0.1 0.635YEAR02 2.2 0.1 0.000 1.0 0.1 0.000
Interaction variables YEAR99*IIUSP3 1.1 0.2 0.000 0.8 0.2 0.001YEAR00*IIUSP3 -1.0 0.2 0.000 -0.7 0.2 0.003YEAR01*IIUSP3 0.2 0.2 0.473 0.6 0.2 0.005YEAR02*IIUSP3 0.2 0.2 0.298 0.1 0.2 0.547
Unexplained Variance Between schools 26.45 2.71 0.000 23.27 2.42 0.000Within schools (between students) 794.57 1.21 0.000 800.64 1.23 0.000n of schools and students
193 and 824638
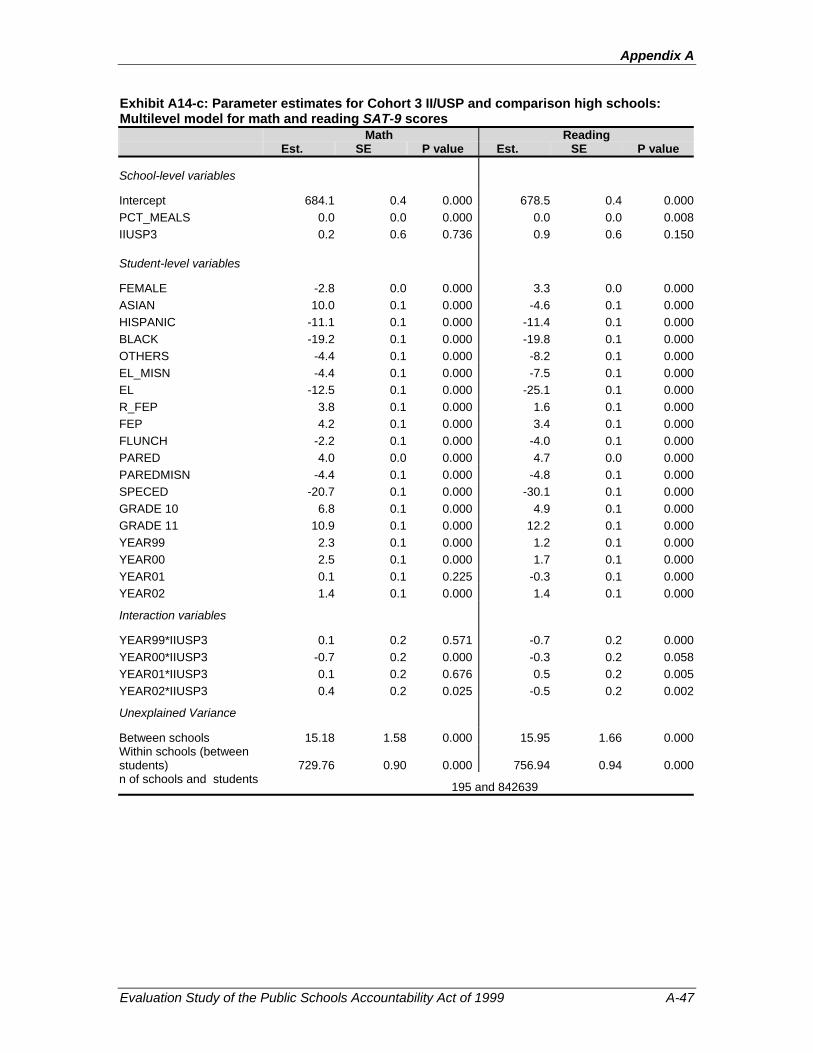
Appendix A
Evaluation Study of the Public Schools Accountability Act of 1999 A-47
Exhibit A14-c: Parameter estimates for Cohort 3 II/USP and comparison high schools: Multilevel model for math and reading SAT-9 scores Math Reading Est. SE P value Est. SE P value
School-level variables
Intercept 684.1 0.4 0.000 678.5 0.4 0.000PCT_MEALS 0.0 0.0 0.000 0.0 0.0 0.008IIUSP3 0.2 0.6 0.736 0.9 0.6 0.150
Student-level variables FEMALE -2.8 0.0 0.000 3.3 0.0 0.000ASIAN 10.0 0.1 0.000 -4.6 0.1 0.000HISPANIC -11.1 0.1 0.000 -11.4 0.1 0.000BLACK -19.2 0.1 0.000 -19.8 0.1 0.000OTHERS -4.4 0.1 0.000 -8.2 0.1 0.000EL_MISN -4.4 0.1 0.000 -7.5 0.1 0.000EL -12.5 0.1 0.000 -25.1 0.1 0.000R_FEP 3.8 0.1 0.000 1.6 0.1 0.000FEP 4.2 0.1 0.000 3.4 0.1 0.000FLUNCH -2.2 0.1 0.000 -4.0 0.1 0.000PARED 4.0 0.0 0.000 4.7 0.0 0.000PAREDMISN -4.4 0.1 0.000 -4.8 0.1 0.000SPECED -20.7 0.1 0.000 -30.1 0.1 0.000GRADE 10 6.8 0.1 0.000 4.9 0.1 0.000GRADE 11 10.9 0.1 0.000 12.2 0.1 0.000YEAR99 2.3 0.1 0.000 1.2 0.1 0.000YEAR00 2.5 0.1 0.000 1.7 0.1 0.000YEAR01 0.1 0.1 0.225 -0.3 0.1 0.000YEAR02 1.4 0.1 0.000 1.4 0.1 0.000
Interaction variables YEAR99*IIUSP3 0.1 0.2 0.571 -0.7 0.2 0.000YEAR00*IIUSP3 -0.7 0.2 0.000 -0.3 0.2 0.058YEAR01*IIUSP3 0.1 0.2 0.676 0.5 0.2 0.005YEAR02*IIUSP3 0.4 0.2 0.025 -0.5 0.2 0.002
Unexplained Variance Between schools 15.18 1.58 0.000 15.95 1.66 0.000Within schools (between students) 729.76 0.90 0.000 756.94 0.94 0.000n of schools and students
195 and 842639

Appendix A
Evaluation Study of the Public Schools Accountability Act of 1999 A-48
Exhibit A15-a: Effect Sizes for SAT-9 Mathematics, All Cohorts Cohort 1 Cohort 2 Cohort 3 Yr 1 (2000) Yr 2 (2001) Yr 3 (2002) Yr 1 (2001) Yr 2 (2002) Yr 1 (2002)
Elementary
SAT-9 1.9 0.4 -0.8 0.7 0.7 0.0 SD 44.5 45.3 45.3 45.7 45.9 46.0 effect size 0.04 0.01 -0.02 0.02 0.02 0.00 effect sig. ** * ** ** **
Middle
SAT-9 2.9 0.1 0.9 -0.2 0.0 0.2 SD 33.7 34.3 35.1 34.1 34.7 35.1 effect size 0.09 0.00 0.03 -0.01 0.00 0.01 effect sig. ** **
High
SAT-9 0.9 0.7 1.7 1.2 0.0 0.4 SD 30.6 31.5 31.2 31.0 31.1 32.1 effect size 0.03 0.02 0.05 0.04 0.00 0.01
effect sig. ** ** ** ** * *p<.05; **<.01. A positive effect size indicates II/USP growth exceeds non-II/USP growth
Exhibit A15-b: Effect Sizes for SAT-9 Reading, All Cohorts
Cohort 1 Cohort 2 Cohort 3 Yr 1 (2000) Yr 2 (2001) Yr 3 (2002) Yr 1 (2001) Yr 2 (2002) Yr 1 (2002)
Elementary
SAT-9 0.7 -1.0 -0.6 1.4 1.0 0.3 SD 43.8 43.5 43.2 44.5 44.3 44.7 effect size 0.02 -0.02 -0.01 0.03 0.02 0.01 effect sig. ** * ** ** **
Middle
SAT-9 2.0 0.1 0.7 0.1 -0.3 0.1 SD 36.6 36.6 36.4 36.2 35.8 36.6 effect size 0.05 0.00 0.02 0.00 -0.01 0.00 effect sig. ** **
High
SAT-9 -0.2 0.5 1.6 1.4 -0.1 -0.5 SD 33.7 34.2 34.1 33.8 33.8 34.4 effect size -0.01 0.02 0.05 0.04 0.00 -0.01
effect sig. ** ** ** ** *p<.05; **<.01. A positive effect size indicates II/USP growth exceeds non-II/USP growth
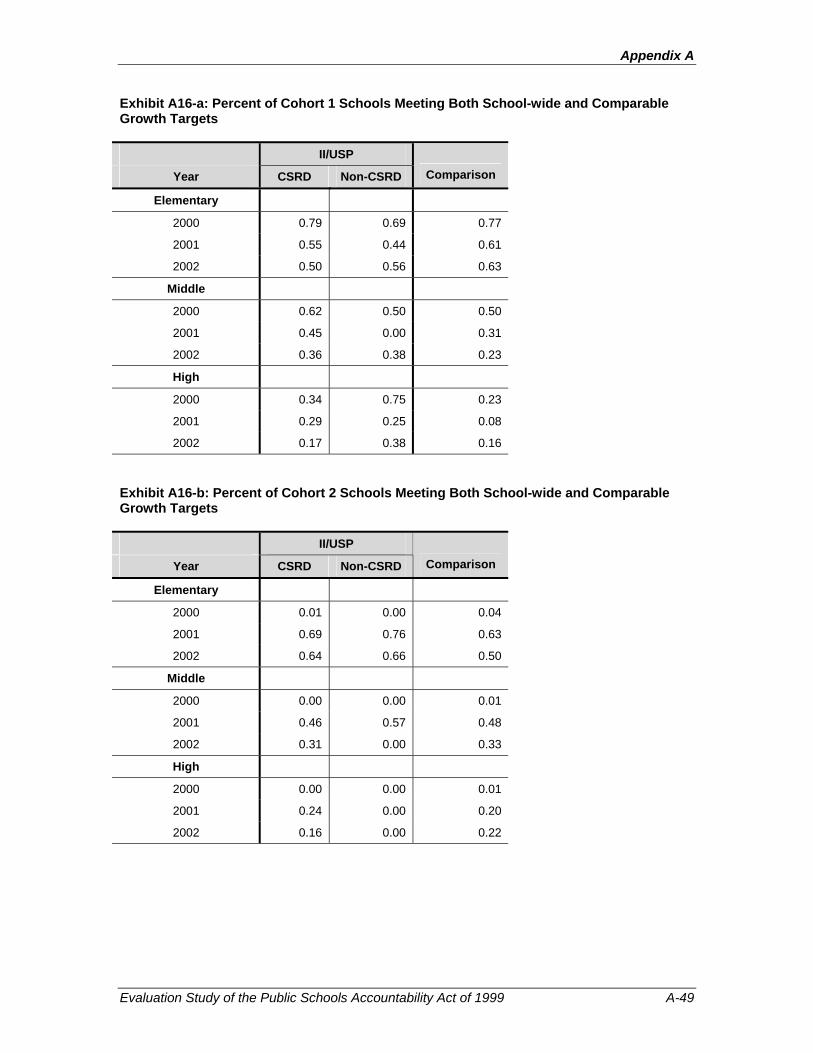
Appendix A
Evaluation Study of the Public Schools Accountability Act of 1999 A-49
Exhibit A16-a: Percent of Cohort 1 Schools Meeting Both School-wide and Comparable Growth Targets
II/USP
Year CSRD Non-CSRD Comparison
Elementary
2000 0.79 0.69 0.77
2001 0.55 0.44 0.61
2002 0.50 0.56 0.63
Middle
2000 0.62 0.50 0.50
2001 0.45 0.00 0.31
2002 0.36 0.38 0.23
High
2000 0.34 0.75 0.23
2001 0.29 0.25 0.08
2002 0.17 0.38 0.16
Exhibit A16-b: Percent of Cohort 2 Schools Meeting Both School-wide and Comparable Growth Targets
II/USP
Year CSRD Non-CSRD Comparison
Elementary
2000 0.01 0.00 0.04
2001 0.69 0.76 0.63
2002 0.64 0.66 0.50
Middle
2000 0.00 0.00 0.01
2001 0.46 0.57 0.48
2002 0.31 0.00 0.33
High
2000 0.00 0.00 0.01
2001 0.24 0.00 0.20
2002 0.16 0.00 0.22
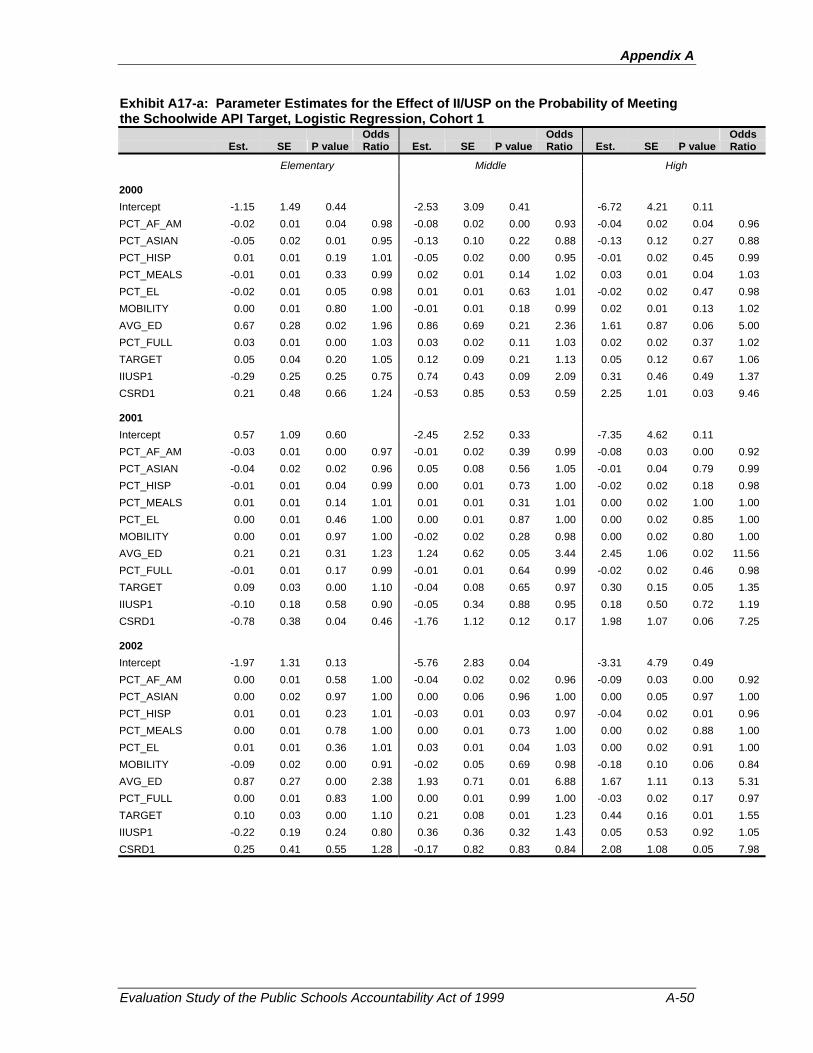
Appendix A
Evaluation Study of the Public Schools Accountability Act of 1999 A-50
Exhibit A17-a: Parameter Estimates for the Effect of II/USP on the Probability of Meeting the Schoolwide API Target, Logistic Regression, Cohort 1
Est. SE P valueOdds Ratio Est. SE P value
Odds Ratio Est. SE P value
Odds Ratio
Elementary Middle High 2000 Intercept -1.15 1.49 0.44 -2.53 3.09 0.41 -6.72 4.21 0.11 PCT_AF_AM -0.02 0.01 0.04 0.98 -0.08 0.02 0.00 0.93 -0.04 0.02 0.04 0.96 PCT_ASIAN -0.05 0.02 0.01 0.95 -0.13 0.10 0.22 0.88 -0.13 0.12 0.27 0.88 PCT_HISP 0.01 0.01 0.19 1.01 -0.05 0.02 0.00 0.95 -0.01 0.02 0.45 0.99 PCT_MEALS -0.01 0.01 0.33 0.99 0.02 0.01 0.14 1.02 0.03 0.01 0.04 1.03 PCT_EL -0.02 0.01 0.05 0.98 0.01 0.01 0.63 1.01 -0.02 0.02 0.47 0.98 MOBILITY 0.00 0.01 0.80 1.00 -0.01 0.01 0.18 0.99 0.02 0.01 0.13 1.02 AVG_ED 0.67 0.28 0.02 1.96 0.86 0.69 0.21 2.36 1.61 0.87 0.06 5.00 PCT_FULL 0.03 0.01 0.00 1.03 0.03 0.02 0.11 1.03 0.02 0.02 0.37 1.02 TARGET 0.05 0.04 0.20 1.05 0.12 0.09 0.21 1.13 0.05 0.12 0.67 1.06 IIUSP1 -0.29 0.25 0.25 0.75 0.74 0.43 0.09 2.09 0.31 0.46 0.49 1.37 CSRD1 0.21 0.48 0.66 1.24 -0.53 0.85 0.53 0.59 2.25 1.01 0.03 9.46 2001 Intercept 0.57 1.09 0.60 -2.45 2.52 0.33 -7.35 4.62 0.11 PCT_AF_AM -0.03 0.01 0.00 0.97 -0.01 0.02 0.39 0.99 -0.08 0.03 0.00 0.92 PCT_ASIAN -0.04 0.02 0.02 0.96 0.05 0.08 0.56 1.05 -0.01 0.04 0.79 0.99 PCT_HISP -0.01 0.01 0.04 0.99 0.00 0.01 0.73 1.00 -0.02 0.02 0.18 0.98 PCT_MEALS 0.01 0.01 0.14 1.01 0.01 0.01 0.31 1.01 0.00 0.02 1.00 1.00 PCT_EL 0.00 0.01 0.46 1.00 0.00 0.01 0.87 1.00 0.00 0.02 0.85 1.00 MOBILITY 0.00 0.01 0.97 1.00 -0.02 0.02 0.28 0.98 0.00 0.02 0.80 1.00 AVG_ED 0.21 0.21 0.31 1.23 1.24 0.62 0.05 3.44 2.45 1.06 0.02 11.56 PCT_FULL -0.01 0.01 0.17 0.99 -0.01 0.01 0.64 0.99 -0.02 0.02 0.46 0.98 TARGET 0.09 0.03 0.00 1.10 -0.04 0.08 0.65 0.97 0.30 0.15 0.05 1.35 IIUSP1 -0.10 0.18 0.58 0.90 -0.05 0.34 0.88 0.95 0.18 0.50 0.72 1.19 CSRD1 -0.78 0.38 0.04 0.46 -1.76 1.12 0.12 0.17 1.98 1.07 0.06 7.25 2002 Intercept -1.97 1.31 0.13 -5.76 2.83 0.04 -3.31 4.79 0.49 PCT_AF_AM 0.00 0.01 0.58 1.00 -0.04 0.02 0.02 0.96 -0.09 0.03 0.00 0.92 PCT_ASIAN 0.00 0.02 0.97 1.00 0.00 0.06 0.96 1.00 0.00 0.05 0.97 1.00 PCT_HISP 0.01 0.01 0.23 1.01 -0.03 0.01 0.03 0.97 -0.04 0.02 0.01 0.96 PCT_MEALS 0.00 0.01 0.78 1.00 0.00 0.01 0.73 1.00 0.00 0.02 0.88 1.00 PCT_EL 0.01 0.01 0.36 1.01 0.03 0.01 0.04 1.03 0.00 0.02 0.91 1.00 MOBILITY -0.09 0.02 0.00 0.91 -0.02 0.05 0.69 0.98 -0.18 0.10 0.06 0.84 AVG_ED 0.87 0.27 0.00 2.38 1.93 0.71 0.01 6.88 1.67 1.11 0.13 5.31 PCT_FULL 0.00 0.01 0.83 1.00 0.00 0.01 0.99 1.00 -0.03 0.02 0.17 0.97 TARGET 0.10 0.03 0.00 1.10 0.21 0.08 0.01 1.23 0.44 0.16 0.01 1.55 IIUSP1 -0.22 0.19 0.24 0.80 0.36 0.36 0.32 1.43 0.05 0.53 0.92 1.05 CSRD1 0.25 0.41 0.55 1.28 -0.17 0.82 0.83 0.84 2.08 1.08 0.05 7.98

Appendix A
Evaluation Study of the Public Schools Accountability Act of 1999 A-51
Exhibit A17-b. Parameter Estimates for the Effect of II/USP on the Probability of Meeting the Schoolwide API Target, Logistic Regression, Cohort 2
Est. SE P valueOdds Ratio Est. SE P value
Odds Ratio Est. SE P value
Odds Ratio
Elementary Middle High 2001 Intercept -1.48 1.83 0.42 2.03 2.90 0.48 -8.59 4.58 0.06 PCT_AF_AM -0.02 0.01 0.07 0.981 -0.02 0.02 0.23 0.98 -0.05 0.02 0.02 0.95 PCT_ASIAN -0.06 0.03 0.04 0.946 0.06 0.15 0.68 1.06 0.00 0.03 0.98 1.00 PCT_HISP 0.00 0.01 0.82 1.002 0.00 0.01 0.88 1.00 0.00 0.01 0.80 1.00 PCT_MEALS 0.01 0.01 0.38 1.009 -0.01 0.01 0.46 0.99 -0.02 0.01 0.16 0.98 PCT_EL 0.00 0.01 0.71 0.996 -0.03 0.02 0.08 0.97 0.01 0.02 0.54 1.01 MOBILITY 0.01 0.01 0.28 1.014 -0.02 0.01 0.11 0.98 -0.03 0.02 0.27 0.97 AVG_ED 0.68 0.36 0.06 1.972 0.27 0.65 0.68 1.31 1.21 0.94 0.20 3.34 PCT_FULL 0.00 0.01 0.72 0.997 -0.01 0.01 0.51 0.99 0.04 0.02 0.07 1.04 TARGET 0.06 0.05 0.21 1.064 0.04 0.08 0.67 1.04 0.21 0.13 0.10 1.23 IIUSP1 0.11 0.27 0.68 1.115 0.20 0.33 0.55 1.22 1.01 0.38 0.01 2.75 CSRD1 0.62 0.61 0.31 1.859 -0.76 0.85 0.37 0.47 -1.02 1.44 0.48 0.36 2002 Intercept -0.79 1.82 0.66 -3.86 3.03 0.20 -8.35 5.17 0.11 PCT_AF_AM 0.00 0.01 0.76 1.00 -0.02 0.02 0.41 0.98 -0.12 0.03 0.00 0.89 PCT_ASIAN -0.04 0.03 0.14 0.96 0.00 0.06 0.94 1.00 0.21 0.36 0.55 1.24 PCT_HISP -0.01 0.01 0.56 0.99 0.00 0.01 0.78 1.00 -0.05 0.02 0.02 0.95 PCT_MEALS 0.00 0.01 0.82 1.00 0.00 0.01 0.78 1.00 0.02 0.01 0.09 1.02 PCT_EL 0.01 0.01 0.39 1.01 -0.01 0.02 0.69 0.99 0.03 0.02 0.20 1.03 MOBILITY -0.05 0.03 0.14 0.95 -0.02 0.06 0.78 0.98 -0.11 0.08 0.14 0.89 AVG_ED 0.46 0.39 0.25 1.58 1.54 0.72 0.03 4.67 3.85 1.20 0.00 46.88 PCT_FULL 0.00 0.01 0.95 1.00 0.00 0.01 0.89 1.00 -0.08 0.03 0.00 0.93 TARGET 0.07 0.05 0.10 1.08 0.12 0.08 0.14 1.13 0.57 0.17 0.00 1.77 IIUSP1 0.28 0.24 0.24 1.33 -0.27 0.32 0.41 0.77 -0.06 0.45 0.89 0.94 CSRD1 0.32 0.53 0.55 1.37 -2.10 1.14 0.07 0.12 -12.68 819.88 0.99 0.00

Appendix A
Evaluation Study of the Public Schools Accountability Act of 1999 A-52
Exhibit A18-a: Parameter estimates for District Influence on Cohort 1 II/USP, CSRD, and comparison schools: Multi-level model for API scores (unadjusted) Est. SE P value
School-level variables Elementary Schools Intercept 592.1 11.6 0.000IIUSP1 1.1 4.9 0.824CSRD1 -20.0 10.2 0.050
Time-level variables
PCT_AF-AM -1.4 0.1 0.000PCT_ASIAN -0.4 0.1 0.000PCT_HISP -1.1 0.1 0.000PCT_MEALS -0.7 0.1 0.000PCT_EL -0.8 0.1 0.000MOBILITY 0.0 0.1 0.990AVG_PARED 2.5 1.5 0.107PCT_FULL 0.5 0.1 0.000YEAR99 39.2 2.1 0.000YEAR00 44.2 2.1 0.000YEAR01 25.7 2.0 0.000YEAR02 21.9 2.2 0.000SF 23.6 15.1 0.119Oakland -19.9 11.4 0.081San Diego 15.7 16.6 0.344LA 21.4 5.3 0.000
Interaction variables
II/USP1*SF -1.8 24.6 0.941II/USP1*Oakland 5.3 24.2 0.826II/USP1*San Diego 35.8 23.8 0.133II/USP1*LA -9.1 14.8 0.538YEAR99*IIUSP1 0.7 3.5 0.841YEAR00*IIUSP1 8.3 3.5 0.017YEAR01*IIUSP1 -0.3 3.5 0.942YEAR02*IIUSP1 0.8 3.5 0.814YEAR99*CSRD1 10.4 7.4 0.161YEAR00*CSRD1 -4.3 7.2 0.554YEAR01*CSRD1 -4.0 7.2 0.579YEAR02*CSRD1 -2.6 7.1 0.720YEAR99*SF -7.8 10.6 0.458YEAR00*SF -15.0 10.7 0.163YEAR01*SF -18.2 10.7 0.088YEAR02*SF -15.1 10.6 0.155YEAR99*OAK 19.9 7.3 0.007YEAR00*OAK -26.3 7.3 0.000YEAR01* OAK -18.7 7.0 0.008YEAR02* OAK 16.5 7.1 0.021YEAR99*SAN DIEGO 19.2 12.0 0.108

Appendix A
Evaluation Study of the Public Schools Accountability Act of 1999 A-53
Est. SE P value YEAR00*SAN DIEGO -3.2 12.0 0.792YEAR01*SAN DIEGO -5.3 12.0 0.658YEAR02*SAN DIEGO 12.9 11.9 0.278YEAR99*LA -5.6 3.5 0.109YEAR00* LA -0.9 3.5 0.805YEAR01* LA 15.4 3.5 0.000YEAR02* LA 24.0 3.5 0.000 IIUSP1*YEAR99*SF 14.2 17.9 0.425IIUSP1*YEAR00*SF -3.9 17.6 0.826IIUSP1*YEAR01*SF -6.3 17.1 0.714IIUSP1*YEAR02*SF -8.7 17.1 0.613IIUSP1*YEAR99*OAK 0.7 17.2 0.966IIUSP1*YEAR00*OAK -10.7 17.1 0.532IIUSP1*YEAR01* OAK 8.3 17.0 0.624IIUSP1*YEAR02* OAK -3.6 17.0 0.833IIUSP1*YEAR99*SAN DIEGO 14.5 17.0 0.396IIUSP1*YEAR00*SAN DIEGO -6.1 17.0 0.722IIUSP1*YEAR01*SAN DIEGO -19.4 17.0 0.255IIUSP1*YEAR02*SAN DIEGO -11.9 17.0 0.482IIUSP1*YEAR99*LA -2.2 10.5 0.833IIUSP1*YEAR00* LA -9.0 10.7 0.399IIUSP1*YEAR01* LA 4.4 11.0 0.687IIUSP1*YEAR02* LA 3.2 10.8 0.766

Appendix A
Evaluation Study of the Public Schools Accountability Act of 1999 A-54
Exhibit A18-b: Parameter estimates for District Influence on Cohort 2 II/USP, CSRD, and comparison schools: Multi-level model for API scores (unadjusted) Est. SE P value
School-level variables Elementary Schools Intercept 615.6 15.9 0.000IIUSP2 -7.9 6.2 0.207CSRD2 -21.9 10.9 0.045
Time-level variables
PCT_AF-AM -1.3 0.2 0.000PCT_ASIAN -0.1 0.1 0.193PCT_HISP -0.8 0.1 0.000PCT_MEALS -0.9 0.1 0.000PCT_EL -0.8 0.1 0.000MOBILITY 0.0 0.1 0.765AVG_PARED 6.1 2.3 0.009PCT_FULL 0.3 0.1 0.006YEAR99 40.1 2.7 0.000YEAR00 12.2 2.8 0.000YEAR01 36.4 2.6 0.000YEAR02 21.1 2.8 0.000SF 40.3 19.7 0.041Oakland -33.7 14.6 0.021San Diego 10.4 31.0 0.739LA 41.5 53.2 0.435
Interaction variables
II/USP2*SF 0.0 II/USP2*Oakland 0.0 II/USP2*San Diego 9.0 43.8 0.837II/USP2*LA -35.2 53.9 0.514YEAR99*IIUSP2 3.5 4.3 0.416YEAR00*IIUSP2 -8.8 4.2 0.036YEAR01*IIUSP2 13.1 4.2 0.002YEAR02*IIUSP2 1.8 4.2 0.667YEAR99*CSRD2 -8.0 7.3 0.276YEAR00*CSRD2 1.0 7.4 0.888YEAR01*CSRD2 -7.6 7.4 0.306YEAR02*CSRD2 2.1 7.4 0.771YEAR99*SF -1.3 13.1 0.919YEAR00*SF -16.6 13.3 0.213YEAR01*SF -39.1 13.2 0.003YEAR02*SF -10.6 13.1 0.421YEAR99*OAK 17.5 8.9 0.049YEAR00*OAK 5.6 8.9 0.528YEAR01* OAK -41.1 8.6 0.000YEAR02* OAK 16.0 8.6 0.063YEAR99*SAN DIEGO 13.7 20.9 0.513

Appendix A
Evaluation Study of the Public Schools Accountability Act of 1999 A-55
Est. SE P value YEAR00*SAN DIEGO 7.0 20.9 0.737YEAR01*SAN DIEGO -27.7 20.9 0.185YEAR02*SAN DIEGO -3.5 20.9 0.868YEAR99*LA -2.5 36.0 0.945YEAR00* LA 1.3 36.0 0.971YEAR01* LA -30.8 36.0 0.393YEAR02* LA 55.7 36.0 0.122IIUSP2*YEAR99*SF 0.0 IIUSP2*YEAR00*SF 0.0 IIUSP2*YEAR01*SF 0.0 IIUSP2*YEAR02*SF 0.0 IIUSP2*YEAR99*OAK 0.0 IIUSP2*YEAR00*OAK 0.0 IIUSP2*YEAR01* OAK 0.0 IIUSP2*YEAR02* OAK 0.0 IIUSP2*YEAR99*SAN DIEGO 22.9 29.6 0.440IIUSP2*YEAR00*SAN DIEGO -25.1 29.6 0.397IIUSP2*YEAR01*SAN DIEGO 11.6 29.6 0.696IIUSP2*YEAR02*SAN DIEGO 39.1 29.6 0.187IIUSP2*YEAR99*LA 4.1 36.5 0.910IIUSP2*YEAR00* LA 9.8 36.5 0.789IIUSP2*YEAR01* LA 33.6 36.5 0.358IIUSP2*YEAR02* LA -29.4 36.5 0.421

Appendix A
Evaluation Study of the Public Schools Accountability Act of 1999 A-56
Exhibit A19-a: Parameter Estimates for District Effect on SAT-9 scores, Cohort 1 Elementary Schools Math Reading Est. SE P value Est. SE P value
School-level variables
Intercept 554.2 0.6 0.000 563.1 0.5 0.000 PCT_MEALS 0.0 0.0 0.014 0.0 0.0 0.617 IIUSP1 0.6 0.7 0.382 1.2 0.6 0.033 CSRD1 -3.1 1.4 0.024 -5.4 1.2 0.000
Student-level variables FEMALE -0.3 0.1 0.000 4.0 0.1 0.000 ASIAN 9.7 0.2 0.000 0.2 0.2 0.120 HISPANIC -9.5 0.1 0.000 -11.3 0.1 0.000 BLACK -18.3 0.1 0.000 -17.2 0.1 0.000 OTHERS -2.3 0.2 0.000 -4.1 0.2 0.000 EL_MISN -7.4 0.2 0.000 -10.9 0.2 0.000 EL -7.2 0.1 0.000 -16.8 0.1 0.000 R_FEP 20.6 0.2 0.000 14.1 0.1 0.000 FEP 9.3 0.1 0.000 7.5 0.1 0.000 FLUNCH -6.1 0.1 0.000 -7.2 0.1 0.000 PARED 4.3 0.0 0.000 4.9 0.0 0.000 PAREDMISN -4.7 0.1 0.000 -4.2 0.1 0.000 SPECED -25.8 0.1 0.000 -23.7 0.1 0.000 GRADE 3 25.7 0.1 0.000 25.2 0.1 0.000 GRADE 4 44.5 0.1 0.000 48.9 0.1 0.000 GRADE 5 66.0 0.1 0.000 63.8 0.1 0.000 YEAR99 8.4 0.1 0.000 6.9 0.1 0.000 YEAR00 8.6 0.1 0.000 5.2 0.1 0.000 YEAR01 4.6 0.1 0.000 3.0 0.1 0.000 YEAR02 3.8 0.1 0.000 2.9 0.1 0.000 SF 7.6 2.2 0.001 6.1 1.9 0.002 Oakland -3.5 1.4 0.014 -2.7 1.2 0.024 San Diego 0.0 2.4 0.995 -4.1 2.0 0.043 LA 6.3 0.7 0.000 4.1 0.6 0.000
Interaction variables II/USP1*SF 1.1 3.6 0.765 -4.4 3.1 0.159 II/USP1*Oakland 2.6 3.4 0.432 -2.9 2.9 0.315 II/USP1*San Diego 1.0 3.4 0.766 3.0 2.9 0.295 II/USP1*LA 0.8 2.0 0.713 -0.2 1.7 0.902 YEAR99*IIUSP1 0.2 0.2 0.322 -0.3 0.2 0.233 YEAR00*IIUSP1 0.9 0.2 0.000 0.8 0.2 0.001 YEAR01*IIUSP1 0.7 0.2 0.005 -0.1 0.2 0.547 YEAR02*IIUSP1 -0.2 0.2 0.471 0.0 0.2 0.888 YEAR99*CSRD1 0.5 0.5 0.285 2.2 0.5 0.000 YEAR00*CSRD1 1.4 0.5 0.005 0.5 0.5 0.281 YEAR01*CSRD1 -1.6 0.5 0.001 0.2 0.5 0.595 YEAR02*CSRD1 -0.2 0.5 0.690 -0.9 0.4 0.044
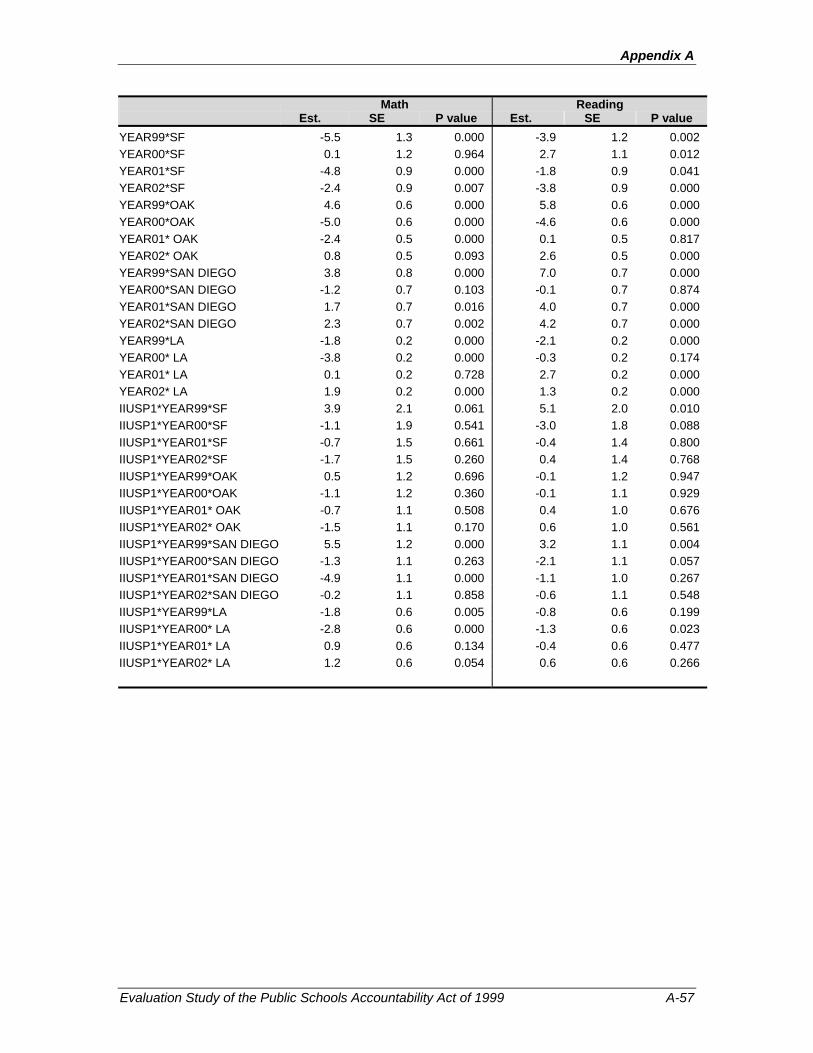
Appendix A
Evaluation Study of the Public Schools Accountability Act of 1999 A-57
Math Reading Est. SE P value Est. SE P value YEAR99*SF -5.5 1.3 0.000 -3.9 1.2 0.002 YEAR00*SF 0.1 1.2 0.964 2.7 1.1 0.012 YEAR01*SF -4.8 0.9 0.000 -1.8 0.9 0.041 YEAR02*SF -2.4 0.9 0.007 -3.8 0.9 0.000 YEAR99*OAK 4.6 0.6 0.000 5.8 0.6 0.000 YEAR00*OAK -5.0 0.6 0.000 -4.6 0.6 0.000 YEAR01* OAK -2.4 0.5 0.000 0.1 0.5 0.817 YEAR02* OAK 0.8 0.5 0.093 2.6 0.5 0.000 YEAR99*SAN DIEGO 3.8 0.8 0.000 7.0 0.7 0.000 YEAR00*SAN DIEGO -1.2 0.7 0.103 -0.1 0.7 0.874 YEAR01*SAN DIEGO 1.7 0.7 0.016 4.0 0.7 0.000 YEAR02*SAN DIEGO 2.3 0.7 0.002 4.2 0.7 0.000 YEAR99*LA -1.8 0.2 0.000 -2.1 0.2 0.000 YEAR00* LA -3.8 0.2 0.000 -0.3 0.2 0.174 YEAR01* LA 0.1 0.2 0.728 2.7 0.2 0.000 YEAR02* LA 1.9 0.2 0.000 1.3 0.2 0.000 IIUSP1*YEAR99*SF 3.9 2.1 0.061 5.1 2.0 0.010 IIUSP1*YEAR00*SF -1.1 1.9 0.541 -3.0 1.8 0.088 IIUSP1*YEAR01*SF -0.7 1.5 0.661 -0.4 1.4 0.800 IIUSP1*YEAR02*SF -1.7 1.5 0.260 0.4 1.4 0.768 IIUSP1*YEAR99*OAK 0.5 1.2 0.696 -0.1 1.2 0.947 IIUSP1*YEAR00*OAK -1.1 1.2 0.360 -0.1 1.1 0.929 IIUSP1*YEAR01* OAK -0.7 1.1 0.508 0.4 1.0 0.676 IIUSP1*YEAR02* OAK -1.5 1.1 0.170 0.6 1.0 0.561 IIUSP1*YEAR99*SAN DIEGO 5.5 1.2 0.000 3.2 1.1 0.004 IIUSP1*YEAR00*SAN DIEGO -1.3 1.1 0.263 -2.1 1.1 0.057 IIUSP1*YEAR01*SAN DIEGO -4.9 1.1 0.000 -1.1 1.0 0.267 IIUSP1*YEAR02*SAN DIEGO -0.2 1.1 0.858 -0.6 1.1 0.548 IIUSP1*YEAR99*LA -1.8 0.6 0.005 -0.8 0.6 0.199 IIUSP1*YEAR00* LA -2.8 0.6 0.000 -1.3 0.6 0.023 IIUSP1*YEAR01* LA 0.9 0.6 0.134 -0.4 0.6 0.477 IIUSP1*YEAR02* LA 1.2 0.6 0.054 0.6 0.6 0.266

Appendix A
Evaluation Study of the Public Schools Accountability Act of 1999 A-58
Exhibit A19-b: Parameter Estimates for District Effect on SAT-9 scores, Cohort 2 Elementary Schools Math Reading Est. SE P value Est. SE P value
School-level variables
Intercept 559.4 0.9 0.000 564.1 0.8 0.000 PCT_MEALS 0.0 0.0 0.000 0.0 0.0 0.617 IIUSP2 -2.0 0.8 0.013 -0.8 0.7 0.292 CSRD2 -3.0 1.4 0.037 -1.3 1.3 0.319
Student-level variables FEMALE -0.1 0.1 0.176 4.2 0.1 0.000 ASIAN 8.0 0.2 0.000 -1.2 0.2 0.000 HISPANIC -9.5 0.1 0.000 -11.6 0.1 0.000 BLACK -19.0 0.2 0.000 -17.7 0.2 0.000 OTHERS -3.0 0.2 0.000 -5.5 0.2 0.000 EL_MISN -8.2 0.3 0.000 -10.8 0.3 0.000 EL -7.7 0.1 0.000 -16.6 0.1 0.000 R_FEP 21.3 0.2 0.000 15.1 0.2 0.000 FEP 9.7 0.2 0.000 7.9 0.2 0.000 FLUNCH -6.3 0.1 0.000 -7.8 0.1 0.000 PARED 4.8 0.0 0.000 5.4 0.0 0.000 PAREDMISN -5.0 0.1 0.000 -4.5 0.1 0.000 SPECED -25.9 0.1 0.000 -24.6 0.1 0.000 GRADE 3 25.4 0.1 0.000 25.4 0.1 0.000 GRADE 4 44.6 0.1 0.000 49.4 0.1 0.000 GRADE 5 66.7 0.1 0.000 64.4 0.1 0.000 YEAR99 7.5 0.2 0.000 6.3 0.2 0.000 YEAR00 4.6 0.2 0.000 2.7 0.2 0.000 YEAR01 6.4 0.2 0.000 4.3 0.2 0.000 YEAR02 4.0 0.2 0.000 2.5 0.2 0.000 SF 10.6 2.8 0.000 11.0 2.5 0.000 Oakland -3.7 1.7 0.028 -3.7 1.5 0.014 San Diego -1.5 4.1 0.723 -1.7 3.7 0.650 LA 6.0 7.1 0.392 5.6 6.2 0.370
Interaction variables II/USP2*SF 0.0 0.0 II/USP2*Oakland 0.0 0.0 II/USP2*San Diego 5.0 5.9 0.396 -1.8 5.2 0.728 II/USP2*LA 0.2 7.1 0.978 -1.9 6.3 0.764 YEAR99*IIUSP2 1.4 0.3 0.000 1.1 0.3 0.000 YEAR00*IIUSP2 -1.1 0.3 0.000 -0.9 0.3 0.001 YEAR01*IIUSP2 2.0 0.3 0.000 1.5 0.3 0.000 YEAR02*IIUSP2 0.1 0.3 0.684 0.2 0.3 0.376 YEAR99*CSRD2 -0.5 0.5 0.263 -0.7 0.5 0.114 YEAR00*CSRD2 0.1 0.5 0.758 0.9 0.5 0.048 YEAR01*CSRD2 -1.5 0.4 0.001 -2.0 0.4 0.000 YEAR02*CSRD2 0.6 0.4 0.194 0.8 0.4 0.053 YEAR99*SF -4.7 1.7 0.006 -3.5 1.6 0.034

Appendix A
Evaluation Study of the Public Schools Accountability Act of 1999 A-59
Math Reading Est. SE P value Est. SE P value YEAR00*SF -3.2 1.4 0.027 -0.1 1.4 0.961 YEAR01*SF -8.5 1.2 0.000 -5.7 1.1 0.000 YEAR02*SF -2.4 1.1 0.032 -3.2 1.1 0.003 YEAR99*OAK 3.5 0.7 0.000 4.9 0.7 0.000 YEAR00*OAK -0.8 0.7 0.254 -1.6 0.7 0.013 YEAR01* OAK -6.1 0.6 0.000 -2.6 0.6 0.000 YEAR02* OAK 0.6 0.6 0.277 2.7 0.6 0.000 YEAR99*SAN DIEGO 3.3 1.5 0.027 3.1 1.4 0.030 YEAR00*SAN DIEGO -2.3 1.4 0.106 3.0 1.4 0.030 YEAR01*SAN DIEGO 1.3 1.4 0.338 2.3 1.3 0.073 YEAR02*SAN DIEGO -1.3 1.4 0.336 3.2 1.3 0.018 YEAR99*LA -1.3 2.0 0.532 -0.2 2.0 0.932 YEAR00* LA -0.2 1.9 0.926 3.6 1.8 0.050 YEAR01* LA -5.4 1.8 0.003 -1.6 1.7 0.354 YEAR02* LA 6.2 1.8 0.000 -2.0 1.7 0.236 IIUSP2*YEAR99*SF 0.0 0.0 IIUSP2*YEAR00*SF 0.0 0.0 IIUSP2*YEAR01*SF 0.0 0.0 IIUSP2*YEAR02*SF 0.0 0.0 IIUSP2*YEAR99*OAK 0.0 0.0 IIUSP2*YEAR00*OAK 0.0 0.0 IIUSP2*YEAR01* OAK 0.0 0.0 IIUSP2*YEAR02* OAK 0.0 0.0 IIUSP2*YEAR99*SAN DIEGO 2.9 2.2 0.180 4.3 2.1 0.041 IIUSP2*YEAR00*SAN DIEGO -1.1 2.1 0.608 -5.4 2.0 0.007 IIUSP2*YEAR01*SAN DIEGO -2.4 1.9 0.217 -0.8 1.8 0.672 IIUSP2*YEAR02*SAN DIEGO 4.6 1.9 0.016 2.1 1.8 0.245 IIUSP2*YEAR99*LA -0.7 2.1 0.741 -2.3 2.0 0.251 IIUSP2*YEAR00* LA -0.9 2.0 0.654 -2.4 1.9 0.204 IIUSP2*YEAR01* LA 3.8 1.8 0.041 2.7 1.8 0.125 IIUSP2*YEAR02* LA -4.0 1.8 0.026 3.6 1.7 0.036

Appendix A
Evaluation Study of the Public Schools Accountability Act of 1999 A-60
Exhibit A20: Number of II/USP and Comparison Schools in Cohorts 1 and 2 by District
Cohort 1 Elementary Middle High II/USP Non-II/USP II/USP Non-II/USP II/USP Non-II/USP
LA 18 179 3 28 0 31 Oakland 6 31 4 11 0 4 SF 8 13 4 2 4 6 San Diego 10 11 2 4 3 3
Cohort 2
Elementary Middle High II/USP Non-II/USP II/USP Non-II/USP II/USP Non-II/USP LA 51 1 15 10 11 19Oakland 21 0 6 4 3 1SF 8 0 4 1 0 2San Diego 3 3 2 2 4 2

Appendix A
Evaluation Study of the Public Schools Accountability Act of 1999 A-61
Exhibit A21-a: Parameter Estimates for SAT-9 Scores Disaggregated by EL Status, Cohort 1 Elementary Schools 16 Math Reading Est. SE P value Est. SE P value
School-level variables
Intercept 553.3 0.6 0.000 559.0 0.5 0.000 PCT_MEALS 0.0 0.0 0.744 0.0 0.0 0.000 IIUSP1 -1.0 0.6 0.117 -0.5 0.5 0.344
Student-level variables FEMALE 1.0 0.1 0.000 5.2 0.1 0.000 ASIAN 14.3 0.2 0.000 4.5 0.2 0.000 HISPANIC -7.1 0.1 0.000 -9.1 0.1 0.000 BLACK -19.1 0.1 0.000 -17.9 0.1 0.000 OTHERS 0.2 0.2 0.153 -1.8 0.2 0.000 FLUNCH -5.9 0.1 0.000 -7.5 0.1 0.000 PARED 4.6 0.0 0.000 5.3 0.0 0.000 PAREDMISN -5.4 0.1 0.000 -4.7 0.1 0.000 EL -7.3 0.2 0.000 -17.0 0.2 0.000 GRADE 3 25.8 0.1 0.000 25.4 0.1 0.000 GRADE 4 45.2 0.1 0.000 49.7 0.1 0.000 GRADE 5 67.3 0.1 0.000 65.5 0.1 0.000 YEAR99 8.6 0.2 0.000 7.1 0.2 0.000 YEAR00 6.3 0.2 0.000 4.0 0.1 0.000 YEAR01 4.8 0.2 0.000 3.9 0.1 0.000 YEAR02 4.0 0.2 0.000 3.1 0.1 0.000
Interaction variables EL*IIUSP1 -1.0 0.3 0.002 -1.5 0.3 0.000 EL*YEAR99 0.0 0.2 0.975 -0.2 0.2 0.292 EL*YEAR00 0.2 0.2 0.326 1.1 0.2 0.000 EL*YEAR01 0.5 0.2 0.008 1.4 0.2 0.000 EL*YEAR02 1.1 0.2 0.000 1.0 0.2 0.000 YEAR99*IIUSP1 0.7 0.3 0.025 0.2 0.3 0.412 YEAR00*IIUSP1 2.0 0.3 0.000 1.3 0.3 0.000 YEAR01*IIUSP1 -0.1 0.3 0.641 -1.0 0.3 0.000 YEAR02*IIUSP1 -0.5 0.3 0.048 -0.6 0.3 0.015 EL*YEAR99*IIUSP1 0.6 0.4 0.158 1.6 0.4 0.000 EL*YEAR00*IIUSP1 -0.7 0.4 0.080 -1.1 0.4 0.005 EL*YEAR01*IIUSP1 0.0 0.4 0.943 -0.3 0.4 0.397 EL*YEAR02*IIUSP1 0.6 0.4 0.149 0.9 0.4 0.013
16 Note: EL is dichotomous variable coded as follows: EL and R_FEP students=1, FEP and English-only=0.

Appendix A
Evaluation Study of the Public Schools Accountability Act of 1999 A-62
Exhibit A21-b: Parameter Estimates for SAT-9 Scores Disaggregated by EL Status, Cohort 2 Elementary Schools 17 Math Reading Est. SE P value Est. SE P value
School-level variables
Intercept 555.3 0.9 0.000 559.1 0.8 0.000 PCT_MEALS 0.0 0.0 0.086 0.0 0.0 0.002 IIUSP2 -2.2 0.8 0.006 -0.8 0.7 0.262
Student-level variables FEMALE 1.2 0.1 0.000 5.4 0.1 0.000 ASIAN 12.7 0.2 0.000 3.2 0.2 0.000 HISPANIC -6.8 0.1 0.000 -9.2 0.1 0.000 BLACK -19.5 0.2 0.000 -18.3 0.2 0.000 OTHERS -0.1 0.3 0.561 -2.7 0.2 0.000 FLUNCH -6.5 0.1 0.000 -8.1 0.1 0.000 PARED 5.2 0.0 0.000 5.8 0.0 0.000 PAREDMISN -5.6 0.1 0.000 -4.9 0.1 0.000 EL -10.2 0.3 0.000 -18.7 0.3 0.000 GRADE 3 25.5 0.1 0.000 25.5 0.1 0.000 GRADE 4 45.1 0.1 0.000 50.0 0.1 0.000 GRADE 5 67.6 0.1 0.000 65.6 0.1 0.000 YEAR99 7.5 0.3 0.000 6.1 0.3 0.000 YEAR00 3.9 0.3 0.000 1.8 0.2 0.000 YEAR01 6.3 0.2 0.000 4.6 0.2 0.000 YEAR02 4.1 0.2 0.000 2.2 0.2 0.000
Interaction variables EL*IIUSP2 2.4 0.4 0.000 1.3 0.4 0.001 EL*YEAR99 1.4 0.4 0.000 1.5 0.4 0.000 EL*YEAR00 0.3 0.4 0.410 1.3 0.4 0.000 EL*YEAR01 0.6 0.4 0.087 -0.1 0.3 0.668 EL*YEAR02 0.7 0.4 0.055 1.4 0.3 0.000 YEAR99*IIUSP2 1.1 0.4 0.003 0.4 0.4 0.235 YEAR00*IIUSP2 -1.2 0.4 0.000 -0.4 0.3 0.279 YEAR01*IIUSP2 0.6 0.3 0.102 0.9 0.3 0.005 YEAR02*IIUSP2 0.5 0.3 0.175 0.8 0.3 0.013 EL*YEAR99*IIUSP2 -0.3 0.5 0.559 -0.2 0.5 0.743 EL*YEAR00*IIUSP2 -0.3 0.5 0.531 -0.1 0.5 0.793 EL*YEAR01*IIUSP2 -0.1 0.5 0.907 0.7 0.5 0.119 EL*YEAR02*IIUSP2 0.6 0.5 0.188 0.3 0.5 0.572
17 Note: EL is dichotomous variable coded as follows: EL and R_FEP students=1, FEP and English-only=0.

Appendix A
Evaluation Study of the Public Schools Accountability Act of 1999 A-63
Exhibit A22-a: Parameter Estimates for SAT-9 Scores Disaggregated for Students Receiving Special Education Services, Cohort 1 Elementary Schools Math Reading Est. SE P value Est. SE P value
School-level variables
Intercept 558.4 0.5 0.000 563.6 0.5 0.000 PCT_MEALS 0.0 0.0 0.009 0.0 0.0 0.004 IIUSP1 -1.2 0.6 0.032 -0.8 0.5 0.101
Student-level variables FEMALE -0.3 0.1 0.000 3.9 0.1 0.000 ASIAN 9.7 0.2 0.000 0.5 0.2 0.001 HISPANIC -9.6 0.1 0.000 -11.1 0.1 0.000 BLACK -18.5 0.1 0.000 -17.5 0.1 0.000 OTHERS -2.2 0.2 0.000 -3.9 0.2 0.000 FLUNCH -5.6 0.1 0.000 -7.2 0.1 0.000 PARED 4.2 0.0 0.000 4.9 0.0 0.000 PAREDMISN -4.7 0.1 0.000 -4.0 0.1 0.000 EL -7.4 0.1 0.000 -17.1 0.1 0.000 R_FEP 20.4 0.2 0.000 13.9 0.1 0.000 FEP 9.2 0.1 0.000 7.3 0.1 0.000 SPECED -24.4 0.3 0.000 -23.4 0.3 0.000 GRADE 3 25.8 0.1 0.000 25.2 0.1 0.000 GRADE 4 44.5 0.1 0.000 48.8 0.1 0.000 GRADE 5 65.9 0.1 0.000 63.7 0.1 0.000 YEAR99 7.8 0.1 0.000 6.3 0.1 0.000 YEAR00 6.9 0.1 0.000 5.0 0.1 0.000 YEAR01 4.6 0.1 0.000 4.1 0.1 0.000 YEAR02 4.9 0.1 0.000 3.9 0.1 0.000
Interaction variables SPECED*IIUSP1 -0.9 0.6 0.123 -2.2 0.6 0.000 YEAR99*IIUSP1 1.0 0.2 0.000 1.0 0.2 0.000 YEAR00*IIUSP1 1.9 0.2 0.000 1.0 0.2 0.000 YEAR01*IIUSP1 0.3 0.2 0.141 -0.7 0.2 0.000 YEAR02*IIUSP1 -0.7 0.2 0.000 -0.7 0.2 0.000 SPECED*YEAR99 2.0 0.4 0.000 2.1 0.4 0.000 SPECED*YEAR00 -2.9 0.4 0.000 -1.4 0.4 0.001 SPECED*YEAR01 -0.2 0.4 0.597 0.3 0.4 0.403 SPECED*YEAR02 -3.5 0.4 0.000 -3.1 0.3 0.000 SPECED*YEAR99*IIUSP1 -0.8 0.8 0.370 -0.1 0.8 0.861 SPECED*YEAR00*IIUSP1 0.5 0.8 0.531 0.4 0.8 0.584 SPECED*YEAR01*IIUSP1 -0.7 0.7 0.322 -0.8 0.7 0.206 SPECED*YEAR02*IIUSP1 1.6 0.7 0.017 1.7 0.7 0.011

Appendix A
Evaluation Study of the Public Schools Accountability Act of 1999 A-64
Exhibit A22-b: Parameter Estimates for SAT-9 Scores Disaggregated for Students Receiving Special Education Services, Cohort 2 Elementary Schools Math Reading Est. SE P value Est. SE P value
School-level variables
Intercept 559.3 0.9 0.000 563.3 0.8 0.000 PCT_MEALS 0.0 0.0 0.000 0.0 0.0 0.165 IIUSP2 -1.2 0.7 0.101 -0.4 0.6 0.483
Student-level variables FEMALE -0.2 0.1 0.047 4.1 0.1 0.000 ASIAN 8.0 0.2 0.000 -1.1 0.2 0.000 HISPANIC -9.5 0.1 0.000 -11.5 0.1 0.000 BLACK -19.2 0.2 0.000 -17.9 0.2 0.000 OTHERS -3.0 0.2 0.000 -5.3 0.2 0.000 FLUNCH -6.3 0.1 0.000 -7.8 0.1 0.000 PARED 4.8 0.0 0.000 5.4 0.0 0.000 PAREDMISN -5.0 0.1 0.000 -4.3 0.1 0.000 EL -7.8 0.1 0.000 -16.8 0.1 0.000 R_FEP 21.1 0.2 0.000 14.9 0.2 0.000 FEP 9.6 0.2 0.000 7.8 0.2 0.000 SPECED -25.0 0.5 0.000 -26.3 0.5 0.000 GRADE 3 25.4 0.1 0.000 25.4 0.1 0.000 GRADE 4 44.6 0.1 0.000 49.4 0.1 0.000 GRADE 5 66.6 0.1 0.000 64.4 0.1 0.000 YEAR99 7.5 0.2 0.000 6.1 0.2 0.000 YEAR00 4.6 0.2 0.000 2.8 0.2 0.000 YEAR01 6.6 0.2 0.000 4.5 0.2 0.000 YEAR02 4.2 0.2 0.000 2.6 0.2 0.000
Interaction variables SPECED*IIUSP2 0.5 0.7 0.459 2.5 0.7 0.001 YEAR99*IIUSP2 1.2 0.3 0.000 0.6 0.3 0.018 YEAR00*IIUSP2 -1.5 0.3 0.000 -0.5 0.2 0.050 YEAR01*IIUSP2 0.4 0.2 0.125 1.1 0.2 0.000 YEAR02*IIUSP2 1.1 0.2 0.000 1.3 0.2 0.000 SPECED*YEAR99 0.9 0.8 0.234 1.1 0.8 0.150 SPECED*YEAR00 -1.4 0.7 0.063 0.7 0.7 0.367 SPECED*YEAR01 -2.6 0.6 0.000 -1.2 0.6 0.044 SPECED*YEAR02 -1.7 0.6 0.006 -1.8 0.6 0.002 SPECED*YEAR99*IIUSP2 0.5 1.1 0.660 0.2 1.1 0.878 SPECED*YEAR00*IIUSP2 0.1 1.0 0.948 -0.8 1.0 0.445 SPECED*YEAR01*IIUSP2 1.9 0.9 0.025 1.2 0.8 0.152 SPECED*YEAR02*IIUSP2 -2.2 0.9 0.009 -1.4 0.8 0.083

Appendix A
Evaluation Study of the Public Schools Accountability Act of 1999 A-65
Exhibit A23-a: Parameter Estimates for SAT-9 Scores – Students Receiving Free and Reduced-Price Lunch in Title I Schools, Cohort 1 Elementary Schools Math Reading Est. SE P value Est. SE P value
School-level variables
Intercept 549.9 0.6 0.000 557.1 0.5 0.000 PCT_MEALS 0.0 0.0 0.000 0.0 0.0 0.000 IIUSP1 0.4 0.6 0.505 -0.1 0.5 0.902
Student-level variables FEMALE 0.8 0.1 0.000 4.9 0.1 0.000 ASIAN 10.1 0.2 0.000 0.8 0.2 0.000 HISPANIC -9.0 0.1 0.000 -10.7 0.1 0.000 BLACK -18.3 0.1 0.000 -17.4 0.1 0.000 OTHERS -1.4 0.2 0.000 -3.2 0.2 0.000 PARED 4.3 0.0 0.000 4.9 0.0 0.000 PAREDMISN -5.0 0.1 0.000 -4.3 0.1 0.000 EL -6.2 0.2 0.000 -16.1 0.1 0.000 R_FEP 23.1 0.1 0.000 16.3 0.1 0.000 FEP 10.8 0.2 0.000 8.7 0.1 0.000 FLUNCH -1.1 0.1 0.000 -4.2 0.2 0.000 GRADE 3 25.1 0.1 0.000 24.6 0.1 0.000 GRADE 4 43.5 0.1 0.000 47.9 0.1 0.000 GRADE 5 64.6 0.1 0.000 62.6 0.1 0.000 YEAR99 9.7 0.2 0.000 8.4 0.2 0.000 YEAR00 9.4 0.3 0.000 6.4 0.2 0.000 YEAR01 4.3 0.3 0.000 2.9 0.3 0.000 YEAR02 3.8 0.3 0.000 2.6 0.3 0.000
Interaction variables FLUNCH*IIUSP1 -1.5 0.3 0.000 -0.2 0.3 0.452 YEAR99*IIUSP1 0.9 0.4 0.008 0.5 0.3 0.142 YEAR00*IIUSP1 1.9 0.4 0.000 1.9 0.4 0.000 YEAR01*IIUSP1 -0.8 0.5 0.092 -1.9 0.4 0.000 YEAR02*IIUSP1 0.3 0.5 0.544 0.7 0.4 0.118 FLUNCH*YEAR99 -3.1 0.3 0.000 -3.0 0.2 0.000 FLUNCH*YEAR00 -4.0 0.3 0.000 -2.4 0.3 0.000 FLUNCH*YEAR01 0.1 0.3 0.611 1.3 0.3 0.000 FLUNCH*YEAR02 1.1 0.3 0.000 1.4 0.3 0.000 FLUNCH*YEAR99*IIUSP1 -0.1 0.5 0.785 0.0 0.5 0.968 FLUNCH*YEAR00*IIUSP1 -0.1 0.5 0.829 -1.4 0.5 0.003 FLUNCH*YEAR01*IIUSP1 1.2 0.5 0.016 1.5 0.5 0.001 FLUNCH*YEAR02*IIUSP1 -1.2 0.5 0.021 -1.7 0.5 0.001
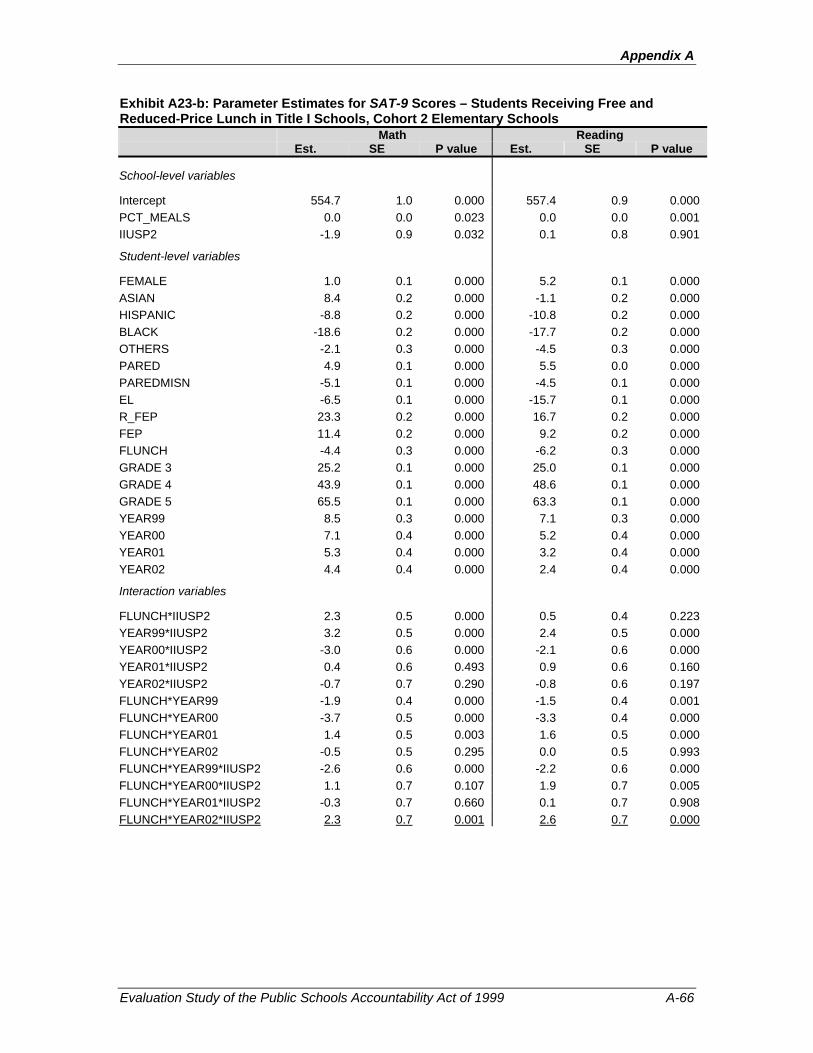
Appendix A
Evaluation Study of the Public Schools Accountability Act of 1999 A-66
Exhibit A23-b: Parameter Estimates for SAT-9 Scores – Students Receiving Free and Reduced-Price Lunch in Title I Schools, Cohort 2 Elementary Schools Math Reading Est. SE P value Est. SE P value
School-level variables
Intercept 554.7 1.0 0.000 557.4 0.9 0.000 PCT_MEALS 0.0 0.0 0.023 0.0 0.0 0.001 IIUSP2 -1.9 0.9 0.032 0.1 0.8 0.901
Student-level variables FEMALE 1.0 0.1 0.000 5.2 0.1 0.000 ASIAN 8.4 0.2 0.000 -1.1 0.2 0.000 HISPANIC -8.8 0.2 0.000 -10.8 0.2 0.000 BLACK -18.6 0.2 0.000 -17.7 0.2 0.000 OTHERS -2.1 0.3 0.000 -4.5 0.3 0.000 PARED 4.9 0.1 0.000 5.5 0.0 0.000 PAREDMISN -5.1 0.1 0.000 -4.5 0.1 0.000 EL -6.5 0.1 0.000 -15.7 0.1 0.000 R_FEP 23.3 0.2 0.000 16.7 0.2 0.000 FEP 11.4 0.2 0.000 9.2 0.2 0.000 FLUNCH -4.4 0.3 0.000 -6.2 0.3 0.000 GRADE 3 25.2 0.1 0.000 25.0 0.1 0.000 GRADE 4 43.9 0.1 0.000 48.6 0.1 0.000 GRADE 5 65.5 0.1 0.000 63.3 0.1 0.000 YEAR99 8.5 0.3 0.000 7.1 0.3 0.000 YEAR00 7.1 0.4 0.000 5.2 0.4 0.000 YEAR01 5.3 0.4 0.000 3.2 0.4 0.000 YEAR02 4.4 0.4 0.000 2.4 0.4 0.000
Interaction variables FLUNCH*IIUSP2 2.3 0.5 0.000 0.5 0.4 0.223 YEAR99*IIUSP2 3.2 0.5 0.000 2.4 0.5 0.000 YEAR00*IIUSP2 -3.0 0.6 0.000 -2.1 0.6 0.000 YEAR01*IIUSP2 0.4 0.6 0.493 0.9 0.6 0.160 YEAR02*IIUSP2 -0.7 0.7 0.290 -0.8 0.6 0.197 FLUNCH*YEAR99 -1.9 0.4 0.000 -1.5 0.4 0.001 FLUNCH*YEAR00 -3.7 0.5 0.000 -3.3 0.4 0.000 FLUNCH*YEAR01 1.4 0.5 0.003 1.6 0.5 0.000 FLUNCH*YEAR02 -0.5 0.5 0.295 0.0 0.5 0.993 FLUNCH*YEAR99*IIUSP2 -2.6 0.6 0.000 -2.2 0.6 0.000 FLUNCH*YEAR00*IIUSP2 1.1 0.7 0.107 1.9 0.7 0.005 FLUNCH*YEAR01*IIUSP2 -0.3 0.7 0.660 0.1 0.7 0.908 FLUNCH*YEAR02*IIUSP2 2.3 0.7 0.001 2.6 0.7 0.000

Appendix A
Evaluation Study of the Public Schools Accountability Act of 1999 A-67
Longitudinal Analysis: Strategy and Method
Procedure
In three of the case study districts, we obtained linked student-level SAT-9 reading and mathematics NCE scores. In order to follow an intact cohort through 2002, we selected all students who were in grade 5 in 2002. Their first year of testing data would have been as second graders in 1999.
We fit growth curves to each individual student through four years of data (details of the model appear below). Our intent was to examine whether these growth trajectories differed systematically between II/USP schools and comparison schools. These comparisons were made for all schools across the three districts, as well as within each district separately. Finally, we examined the aggregate growth curves on a school-by-school basis for II/USP schools, in order to assess the between-school variability in student growth.
Models
We fit three different models, corresponding to the particular II/USP cohorts under consideration. For Cohort 1 schools (selected in 1999), we expected the effects of school improvement to first appear in the spring 2000 testing data. We fit a straight line to each student through the 1999 through 2002 test scores, where the 1999 year corresponded to a random intercept term. The slope of this line indicates mean student growth from 1999 to 2002, relative to the national norms. We computed the mean slope of these growth lines for II/USP schools and compared this slope to the mean slope of similar schools not selected for II/USP.
Cohort 2 schools were selected in 2000, with achievement consequences expected to first appear in 2001. For these schools we fit piecewise linear models, with the first segment representing achievement for 1999 and 2000, and the second segment representing achievement in 2001 and 2002. These slopes were also compared against other schools not selected for II/USP. In addition, we also compared the slope of the second line segment to that of the first, to ascertain changes in growth trajectory beginning in 2001.
Cohort 3 schools were selected in 2001. We therefore only had one year of post-selection test scores to examine for program impact. As with Cohort 2 schools, we fit a two-segment growth curve to each student, with the first segment encompassing the years 1999, 2000, and 2001, and the last segment representing a deviation from the extrapolated trajectory into 2002.
The general model used to predict an individual achievement score for student i in school j is.
0, 1 2, 1 3, 2 4, 1 5, 2ij ij j ij ij ij j ij jY IIUSP Year Year Year IIUSP Year IIUSPβ β β β β β= + + + + +
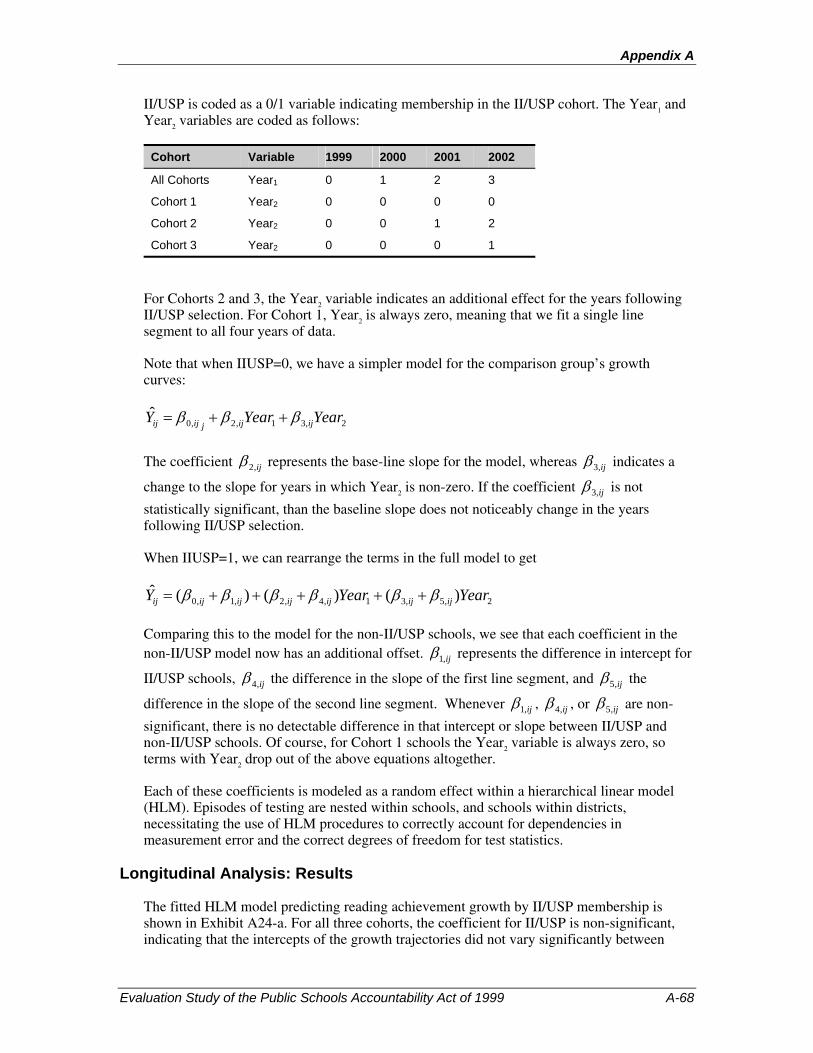
Appendix A
Evaluation Study of the Public Schools Accountability Act of 1999 A-68
II/USP is coded as a 0/1 variable indicating membership in the II/USP cohort. The Year1 and Year2 variables are coded as follows:
Cohort Variable 1999 2000 2001 2002
All Cohorts Year1 0 1 2 3
Cohort 1 Year2 0 0 0 0
Cohort 2 Year2 0 0 1 2
Cohort 3 Year2 0 0 0 1
For Cohorts 2 and 3, the Year2 variable indicates an additional effect for the years following II/USP selection. For Cohort 1, Year2 is always zero, meaning that we fit a single line segment to all four years of data.
Note that when IIUSP=0, we have a simpler model for the comparison group’s growth curves:
0, 2, 1 3, 2ij ij ij ijjY Year Yearβ β β= + +
The coefficient 2,ijβ represents the base-line slope for the model, whereas 3,ijβ indicates a
change to the slope for years in which Year2 is non-zero. If the coefficient 3,ijβ is not
statistically significant, than the baseline slope does not noticeably change in the years following II/USP selection.
When IIUSP=1, we can rearrange the terms in the full model to get
0, 1, 2, 4, 1 3, 5, 2ˆ ( ) ( ) ( )ij ij ij ij ij ij ijY Year Yearβ β β β β β= + + + + +
Comparing this to the model for the non-II/USP schools, we see that each coefficient in the non-II/USP model now has an additional offset. 1,ijβ represents the difference in intercept for
II/USP schools, 4,ijβ the difference in the slope of the first line segment, and 5,ijβ the
difference in the slope of the second line segment. Whenever 1,ijβ , 4,ijβ , or 5,ijβ are non-
significant, there is no detectable difference in that intercept or slope between II/USP and non-II/USP schools. Of course, for Cohort 1 schools the Year2 variable is always zero, so terms with Year2 drop out of the above equations altogether.
Each of these coefficients is modeled as a random effect within a hierarchical linear model (HLM). Episodes of testing are nested within schools, and schools within districts, necessitating the use of HLM procedures to correctly account for dependencies in measurement error and the correct degrees of freedom for test statistics.
Longitudinal Analysis: Results
The fitted HLM model predicting reading achievement growth by II/USP membership is shown in Exhibit A24-a. For all three cohorts, the coefficient for II/USP is non-significant, indicating that the intercepts of the growth trajectories did not vary significantly between

Appendix A
Evaluation Study of the Public Schools Accountability Act of 1999 A-69
II/USP and comparison schools. Both the year1 and IIUSP*year1 coefficients were also non-significant in all three cohorts, indicating essentially flat growth with no significant group differences in growth rate.
Exhibit A24-a: HLM model predicting reading achievement, all three districts Cohort 1 Cohort 2 Cohort 3 Model Term Coef. SE p-value Coef. SE p-value Coef. SE p-value Intercept 33.7* (1.41) <0.001 35.2* (0.85) <0.001 38.7* (2.04) <0.001
IIUSP 0.4 (2.61) 0.882 1.0 (1.58) 0.540 -1.3 (3.39) 0.712
year1 0.6 (0.45) 0.174 -1.1 (0.78) 0.147 -1.9 (1.16) 0.107
IIUSP*year1 -0.2 (0.84) 0.849 1.0 (1.47) 0.505 -1.0 (1.91) 0.604
year2 2.3* (1.10) 0.035 3.8 (2.04) 0.059
IIUSP*year2 -0.7 (2.05) 0.717 -0.4 (3.41) 0.909
In Cohort 2, however, we do observe a significant positive value for year2 (which is also marginally significant in Cohort 3). This indicates that the growth of non-II/USP scores significantly increased beginning in 2001. The corresponding non-significant II/USP*year2 coefficients indicate that the II/USP schools did not differ significantly from non-II/USP schools in this regard; they too experienced an upturn in growth. This can be seen graphically in Exhibit A24-b.
Exhibit A24-b: Reading score fitted trajectories of Cohort 2 II/USP and comparison schools, all three districts
Reading NCE, Cohort 2, All districts
05
101520253035404550
1999 2000 2001 2002
Comparison Schools II/USP Schools
In contrast, there was no significant change in mathematics score growth across the three II/USP cohorts (see Exhibit A25).

Appendix A
Evaluation Study of the Public Schools Accountability Act of 1999 A-70
Exhibit A25: HLM model predicting mathematics achievement, all three districts Cohort 1 Cohort 2 Cohort 3
Model Term Coef. SE p-value Coef. SE p-value Coef. SE p-value
Intercept 39.6* (1.35) <0.001 41.8* (1.34) <0.001 41.9* (1.62) <0.001
IIUSP 0.3 (2.49) 0.913 -0.2 (2.51) 0.935 -1.3 (2.64) 0.632
year1 1.0 (0.57) 0.084 -0.5 (1.24) 0.681 -2.8 (1.53) 0.070
IIUSP*year1 -0.6 (1.07) 0.582 0.9 (2.34) 0.697 1.2 (2.52) 0.626
year2 1.2 (1.47) 0.408 6.1 (3.52) 0.085
IIUSP*year2 -1.2 (2.76) 0.665 -5.9 (5.84) 0.311
When considering each district separately, none of the model terms indicating II/USP membership are significant (Exhibit A26). While some districts exhibit significant growth either before or after cohort selection, there do not appear to be any significant differences between II/USP and comparison schools in overall reading score trajectory. To maintain confidentiality we re-name the districts below to indicate their geographic region.
Exhibit A26: HLM model predicting reading achievement, by district Cohort 1 Cohort 2 Cohort 3
District Model Term Coef. SE p-value Coef. SE p-value Coef. SE p-valueCentral Intercept 32.3* 3.45 0.011 37.2* 2.92 0.050 33.9* 3.07 0.002 IIUSP -1.4 4.84 0.801 3.0 5.02 0.660 1.2 4.70 0.810 year1 -1.2 1.44 0.407 -3.1 2.87 0.276 -1.1 2.10 0.594 IIUSP*year1 1.1 2.03 0.585 3.8 4.99 0.449 -1.3 3.19 0.676 year2 2.4 3.65 0.512 2.6 3.90 0.507 IIUSP*year2 -5.6 6.36 0.383 0.1 6.00 0.990 Southern Intercept 33.2* 1.15 <0.001 34.6* 1.11 <0.001 42.1 5.17 0.078 IIUSP 5.2 3.07 0.155 1.5 2.08 0.492 3.5 8.97 0.761 year1 1.4* 0.53 0.009 -1.2 1.22 0.328 -2.0 2.88 0.499 IIUSP*year1 -0.7 1.42 0.620 1.1 2.29 0.642 -3.1 5.02 0.536 year2 3.5* 1.76 0.044 1.0 3.54 0.771 IIUSP*year2 -0.5 3.30 0.887 5.5 6.28 0.385 Northern Intercept 36.8* 2.67 0.046 35.3* 2.81 <0.001 43.8* 3.46 0.050 IIUSP 0.4 4.55 0.947 -2.2 5.40 0.699 -9.3 6.52 0.390 year1 -0.1 0.82 0.872 -0.2 1.62 0.882 -2.1 2.84 0.470 IIUSP*year1 1.1 1.40 0.427 0.6 3.24 0.855 1.4 5.07 0.776 year2 0.7 1.36 0.590 6.9* 2.52 0.007 IIUSP*year2 0.3 2.75 0.908 -4.6 5.10 0.363
In mathematics, only one district (“Central”) shows a significant II/USP effect, which occurs in Cohort 2. Following selection into Cohort 2, the score trajectory slope for II/USP schools decreased significantly when compared to the trajectory of comparison schools. Recall that in the model, the terms are cumulative. That is, for comparison schools, the slope of the second line segment for comparison schools equals year1 (-7.2) plus year2 (6.3), or –0.9 points per year. For II/USP schools, the slope equals year1 (-7.2) plus IIUSP*year1 (7.4) plus year2 (6.3) plus IIUSP*year2 (-13.2), for a total of –7.8 points per year. This contrast can be seen graphically in Exhibit A27-b.

Appendix A
Evaluation Study of the Public Schools Accountability Act of 1999 A-71
Exhibit A27-a: HLM model predicting mathematics achievement, by district Cohort 1 Cohort 2 Cohort 3
District Model Term Coef. SE p-value Coef. SE p-value Coef. SE p-valueCentral Intercept 36.4* 4.15 0.013 49.3* 2.87 0.037 39.6* 2.88 0.001 IIUSP 2.5 5.82 0.712 -2.4 4.92 0.716 1.3 4.35 0.781 year1 0.0 1.14 0.980 -7.2* 3.06 0.018 -3.5 2.68 0.190 IIUSP*year1 -0.4 1.59 0.792 7.4 5.31 0.167 1.1 4.09 0.782 year2 6.3 3.23 0.051 9.6 5.05 0.056 IIUSP*year2 -13.2* 5.63 0.019 -7.3 7.84 0.353 Southern Intercept 40.0* 1.60 0.000 40.5* 1.31 0.000 42.8* 3.05 0.045 IIUSP -0.7 4.26 0.877 0.6 2.45 0.821 1.2 5.70 0.865 year1 1.3 0.79 0.106 0.6 1.29 0.634 -1.1 4.02 0.782 IIUSP*year1 1.3 2.10 0.537 -0.1 2.43 0.959 0.2 6.99 0.973 year2 1.1 2.17 0.604 -2.6 4.78 0.587 IIUSP*year2 0.2 4.07 0.962 -2.3 8.28 0.778 Northern Intercept 41.9* 2.43 0.037 39.3* 2.87 0.000 45.0 4.81 0.068 IIUSP 0.3 4.06 0.951 1.3 5.51 0.827 -15.9 8.88 0.325 year1 0.9 1.82 0.604 1.4 2.05 0.498 -4.0 3.60 0.264 IIUSP*year1 -1.1 3.14 0.736 -1.7 4.03 0.668 8.1 6.40 0.208 year2 -1.2 1.83 0.523 8.5* 3.53 0.016 IIUSP*year2 4.4 3.62 0.230 -7.8 6.72 0.247
Exhibit A27-b: Mathematics score fitted trajectories of Cohort 2 II/USP and comparison schools, “Central”
Mathematics NCE, Cohort 2, Central
05
101520253035404550
1999 2000 2001 2002
Comparison Schools II/USP Schools
Finally, we present the school-by-school HLM coefficients for reading (Exhibit A28-a) and mathematics (Exhibit A28-b) for the case study schools. By modeling each school separately, we no longer need a coefficient for II/USP membership. Thus only an intercept and two slopes are modeled for each school.

Appendix A
Evaluation Study of the Public Schools Accountability Act of 1999 A-72
Exhibit A28-a: School-by-school HLM coefficients for Reading achievement – II/USP schools
Intercept Year1 Year2 District Cohort School Coef. SE p-value Coef. SE p-value Coef. SE p-value Central C1 Churchill 28.0 * 0.91 <0.001 1.1 * 0.34 0.002 Hidalgo 33.9 * 1.10 <0.001 -1.2 * 0.45 0.009 C2 Renaissance 40.1 * 1.74 <0.001 0.4 1.83 0.812 -2.9 2.43 0.232 C3 Liberty 35.9 * 2.88 <0.001 -0.7 2.32 0.759 1.8 3.59 0.611 Camino 34.6 * 2.08 <0.001 -3.8 * 1.91 0.047 3.6 2.70 0.182Southern C1 Jefferson 38.2 * 1.57 <0.001 0.8 0.49 0.101 C2 Prospect 36.1 * 2.19 <0.001 0.9 1.90 0.633 2.1 2.04 0.303 El Puente 36.7 * 1.66 <0.001 -1.4 1.41 0.315 3.7 * 1.70 0.029 C3 Cesar 46.1 * 2.43 <0.001 -5.5 * 1.15 0.000 7.2 * 2.30 0.002Northern C1 El Madrone 37.3 * 1.61 <0.001 0.9 0.55 0.098 C2 Lincoln 33.2 * 1.70 <0.001 -2.4 1.36 0.079 2.7 1.48 0.071 Manzanita 33.3 * 8.50 <0.001 4.8 7.17 0.504 -1.7 7.49 0.822 C3 Mann 33.5 * 3.96 <0.001 0.0 1.72 0.993 1.5 3.26 0.643
Exhibit A28-b: School-by-school HLM coefficients for Mathematics achievement Intercept Year1 Year2 District Cohort School Coef. SE p-value Coef. SE p-value Coef. SE p-value Central C1 Churchill 36.4 * 1.15 <0.001 -0.1 0.41 0.808 Hidalgo 42.3 * 1.54 <0.001 -1.0 0.65 0.113 C2 Renaissance 47.3 * 1.83 <0.001 -0.3 2.21 0.909 -6.5 * 2.74 0.019 C3 Liberty 43.6 * 3.71 <0.001 -3.0 2.87 0.299 4.7 4.11 0.257 Camino 38.7 * 2.21 <0.001 -1.9 1.74 0.265 0.3 2.35 0.905Southern C1 Jefferson 39.3 * 1.47 <0.001 2.6 * 0.47 0.000 C2 Prospect 39.5 * 1.99 <0.001 2.8 1.85 0.133 0.0 2.14 0.992 El Puente 42.3 * 1.75 <0.001 -1.2 1.55 0.447 1.9 1.90 0.314 C3 Cesar 44.1 * 3.76 <0.001 -0.9 2.76 0.745 -4.8 3.46 0.166Northern C1 El Madrone 42.2 * 2.13 <0.001 0.0 0.66 0.983 C2 Lincoln 44.4 * 2.85 <0.001 -6.7 * 2.27 0.003 6.9 * 2.29 0.003 Manzanita 34.0 * 8.60 <0.001 9.8 7.86 0.214 -4.8 8.39 0.566 C3 Mann 30.9 * 5.49 <0.001 2.8 3.94 0.482 0.5 5.15 0.925

Appendix B:
Supplementary Methodology Details


Appendix B
Evaluation of the Public Schools Accountability Act of 1999 B-1
In this appendix we provide supplementary information for Chapter 2, including more detailed descriptions of the methods used throughout the study. We focus on the case studies of II/USP and CSRD schools (Level 4) and the survey methodology for the broad sample of principals and teachers (Level 3) and for district staff and external support providers (Level 2). We also provide information on the Advisory Board we convened for the study.
Case Studies of II/USP Schools
As discussed in Chapter 2, our purpose in conducting case studies was to obtain in-depth information on the context, implementation, and effects of II/USP from the perspectives of school and district stakeholders and the External Evaluators working with the schools. This component of the study specifically addresses Research Questions 2, 3, 5, and 6. In this section we discuss in greater detail the processes we used to develop instruments for case study site visits and the activities we conducted during site visits.
Sample Selection
Sample selection was discussed in detail in Chapter 2. For reference, below we provide the distribution of the case study schools and the final sample of schools. As noted earlier, we are not releasing the names of schools and districts in our sample to maintain the confidentiality of our respondents.
Exhibit B-1: Distribution of II/USP Case Study Schools
Cohort Funding Source Elementary Middle/ High
CSRD 2 1 Cohort 1
State-funded 4 1
CSRD 2 1 Cohort 2
State-funded 3 1
CSRD 0 1 Cohort 3
State-funded 4 1
Our final sample of 21 schools included:
• Seven CSRD, 14 Action Plan schools
• 15 elementary; three middle, three high schools
• Eight Cohort 1 schools, seven Cohort 2 schools, six Cohort 3 schools
• Nine northern, 6 mid-, six southern California schools
• Six different CSRD models; range of External Evaluators
• 15 urban, four suburban/urban fringe, three rural schools
• Nine Decile 1 schools, four Decile 2 schools, four Decile 3 schools, two Decile 4 schools, two Decile 5 schools (based on year that school began participation)

Appendix B
Evaluation of the Public Schools Accountability Act of 1999 B-2
Evaluation Activities Prior to Site Visitations
Instrument Development
As discussed in Chapter 2, we developed protocols for the multiple data collection activities that took place during each site visit to ensure that we collected comparable data across sites. Copies of all instruments developed for this study are included in Appendix C. They include:
• Principal interview protocol • Teacher interview protocol • Resource teacher interview protocol • External Evaluator interview protocol • CSRD model provider interview protocol • District staff interview protocol • Leadership/Action Plan team focus group protocol • Parent focus group protocol • Document collection guide • Classroom observation guide • School observation guide
To develop the protocols we first used the conceptual framework for the study to specify in detail the key constructs and variables at the district, school, and classroom levels as discussed above and shown in the construct matrix in Appendix C. These specifications guided the development of our data collection instruments for case studies.
Second, we reviewed existing interview and focus group protocols to seek valid and reliable means of collecting the required information. In general, it is preferable to use items from existing instruments that have been tested in the field and for which the reliability properties have already been established.
Third, we framed a set of questions unique to this investigation and that we deemed to be measures for the constructs. We selected questions that were appropriate for the interviews and focus groups that were conducted during site visits. To ensure that the items were operating as intended, we conducted limited piloting procedures, consisting of local in-person or telephone interviews with a small sample of principals and teachers. For these interviews, respondents answered the questions and then discussed items that were problematic, ambiguous, or insufficiently detailed. In addition, we submitted the instruments for review and comment by the CDE and our Advisory Board. These same procedures were followed for survey development, with more extensive pilot testing.
The final step consisted of mapping each instrument to each research question and construct, to ensure that each construct was addressed by one or more items contained in the instruments. We addressed the following considerations specific to the development of the instruments used in the site visits:
Case study focus groups. We recognized the importance of developing broad questions to initiate discussion and allow the participants’ voices to be expressed, followed by probes that would elicit insights in crucial areas. The questions and follow-up probes were carefully developed to identify and screen out any language that may have been loaded, vague, or leading. Both teachers and parents were prompted to discuss their understanding of the state and local accountability system and the effects they had observed.

Appendix B
Evaluation of the Public Schools Accountability Act of 1999 B-3
Case study interviews. Interviews can be an effective way to obtain a large amount of data in a relatively short time frame, but the interview protocols must be crafted in a manner that allows the interviewer to probe the key constructs and variables that shape the other instruments. We developed the interview protocols in conjunction with the focus groups and other data collection instruments. We structured the protocols to gather in-depth information about the implementation and impact of PSAA.
School document collection guide. The school document collection guide served as a manual for data collectors, including guidelines for data collection procedures and documents to be obtained. The document collection included: school improvement plans, professional development plans, school curriculum guides, parent-school compacts, school report cards, budget information, and any documentation that would have been distributed to the general public. These guides were used not only during site visits, but also afterwards, in order to obtain information that principals and other school administrators did not have readily available during the visits.
Observation guides. These guides served as aides for recording observations at both the school and classroom levels. Where appropriate, we provided checklists for simple note taking and areas for more extensive notes on classroom characteristics, instruction, materials, and curriculum. We used the observations to corroborate information provided in interviews and focus groups, rather than for a formal evaluation of instruction.
It should be noted that several versions of each protocol were created to take into account the varying circumstances of each cohort and each funding source. We have included sample copies in Appendix C representing one protocol each for state-funded schools and CSRD-funded schools.
PACE researchers worked with AIR to develop and refine all instruments. As a partner in this study, PACE utilized the same set of protocols as AIR researchers.
Site Visit Planning
All site visitors from AIR and PACE participated in a one-day training session on March 28, 2002. We provided a training manual to all site visitors that included information such as legislation background, detailed data on the sample of case study schools, the site visit itinerary, instructions on site visit methods, a list of actions to take before the visit, and copies of all protocols. The purpose of the training was to review the materials and ensure that all site visitors had a full understanding of the legislation, the study design, and the constructs assessed in the protocols. Researchers discussed each type of protocol to ensure that we collected comparable data from all site visits.
To gain access to case study districts, researchers first contacted district superintendents concurrently by phone and fax. We faxed (and in many cases sent by mail) a letter communicating the purpose of the study. We asked for district participation in the project, ensuring confidentiality of district and school names and explaining measures we would take to reduce the burden on those involved. We also sent information outlining the data collection processes we would employ, and, when possible, a generalized letter of support from the CDE. In all cases, we explained to district personnel that participation was voluntary. In some cases, to secure access to the district, we made multiple calls to several district staff members beyond the superintendent. Several districts either required us to speak with a representative from the district research office or required us to fill out a form explaining our research objectives and methods. As noted in Chapter 2, several districts

Appendix B
Evaluation of the Public Schools Accountability Act of 1999 B-4
declined our request for participation since they were overburdened with internal projects or other research studies. These districts were replaced with districts of comparable demographics, size, and geographic location.
After gaining access at the district level, researchers used several methods to contact the sampled schools. In some cases, district staff contacted school principals first to explain the study, inform them that we would be contacting them, and encourage their participation. In other districts, we were asked to contact schools on our own. In all cases, study team members first contacted the principal by phone and simultaneously faxed material similar to that sent to the district staff. In some cases, a research team member visited the school to speak with the principal in person. For the final four schools in our sample our contract monitor at the CDE assisted us with access by contacting district representatives to communicate the importance of this study. As with the district-level contacts, we assured school contacts that the names of their schools would not be released, that we would strive to reduce the burden placed on school staff, and that their participation was voluntary. Upon receiving permission from the principals to visit the schools, we worked closely with either the principals or other members of the school staff (such as vice principals) to develop schedules for the two-day visits. We worked closely with the district- and school-level contacts to identify the appropriate respondents for the site visit interviews and focus groups, and to develop a two-day schedule that did not impose on teachers’ classroom teaching time and did not place undue burden on school staff.
Site Visit Administration
In this section we outline the detailed site visit procedures used for each data collection method. In general a two-person research team with at least one senior researcher visited each school for two days.
Case study interviews. In general, we conducted interviews with approximately three district staff members knowledgeable about the II/USP process from each district, the school principal (and in some cases vice principal) of each school, four to six teachers at each school, and the External Evaluator and/or CSRD model provider for each school. AIR and PACE staff worked with the school contacts to choose teachers for interviews. In most cases, researchers interviewed one resource teacher, four randomly selected teachers from a range of grade levels, and one teacher whom the principal expected to have an interesting or strong viewpoint about the II/USP policy. In many cases, we were able to interview the teachers’ union representative for the school.
All interviewers used the developed protocols to guide interviews with school and district staff. The protocols included additional “probe” questions that interviewers could use to probe more deeply into topics directly related to the interviewees. Most interviews were conducted by two researchers: one who asked the questions and directed the interview and one who took notes. When respondents granted permission, we audiotaped the interview sessions. In some cases, to accommodate school and district staff schedules, interviewers had to split up and conduct interviews individually. We asked all respondents to sign a consent form that outlines AIR/PACE’s confidentiality policy and explains the benefits and risks of participation in the study. This consent form was approved by both AIR and PACE’s Internal Review Boards. We assured interviewees that they would not be identified in any reports and that results for this study would be reported in aggregate form. Interviews generally lasted 30-60 minutes.
Appendix B
Evaluation of the Public Schools Accountability Act of 1999 B-5
Case study focus groups. The research teams conducted focus groups with parents and, separately, with the Leadership or Action Plan Team (a team of teachers and/or parents who participated in the development of the school’s Action Plan, or played a leadership role in the CSRD process). Focus groups consisted of two to 12 participants and generally lasted one hour. We held the focus groups either after school or in the evening, whichever worked best for the school and participants involved.
Recruiting parents for the focus groups was a difficult task. For each school, we asked that either a staff member or a parent leader help to coordinate the focus group. This person typically recruited the participants, reserved a location for the discussion, and provided a translator(s) when necessary. In some cases, researchers provided a flyer advertising the focus group that the school contact could send to parents or post where parent information is typically located in the school.
As with the interviews, most focus groups were conducted by two researchers, one who led the discussion and the other who took notes. In one instance, the focus group was large, and therefore the researchers split and conducted two separate discussions. Focus group discussions were guided by detailed protocols. (See Appendix C.) When necessary, a translator was provided to facilitate interactions with parents who were not fully proficient in English. We asked all participants to sign consent forms after we had explained the confidentiality policy to them. In a few cases, we provided Spanish-speaking parents with a translated consent form. When permission was granted, we audiotaped the sessions.
Case study classroom observations. Site visitors observed four to six classrooms at each site, for approximately 30 minutes each. Researchers utilized the classroom observation form to record notes on classroom instruction, content, materials, and set-up and were trained to be unobtrusive observers. (See Appendix C.) Typically site visitors observed classes of teachers who were interviewed. When possible, we observed classes prior to the interviews to provide the opportunity to ask the teachers questions related to the observations. These observations were designed primarily for researchers to gain an understanding of the curricular and instructional models used at the school, in particular those related to changes implemented through the II/USP process. They were not designed to formally evaluate instruction or teacher practice.
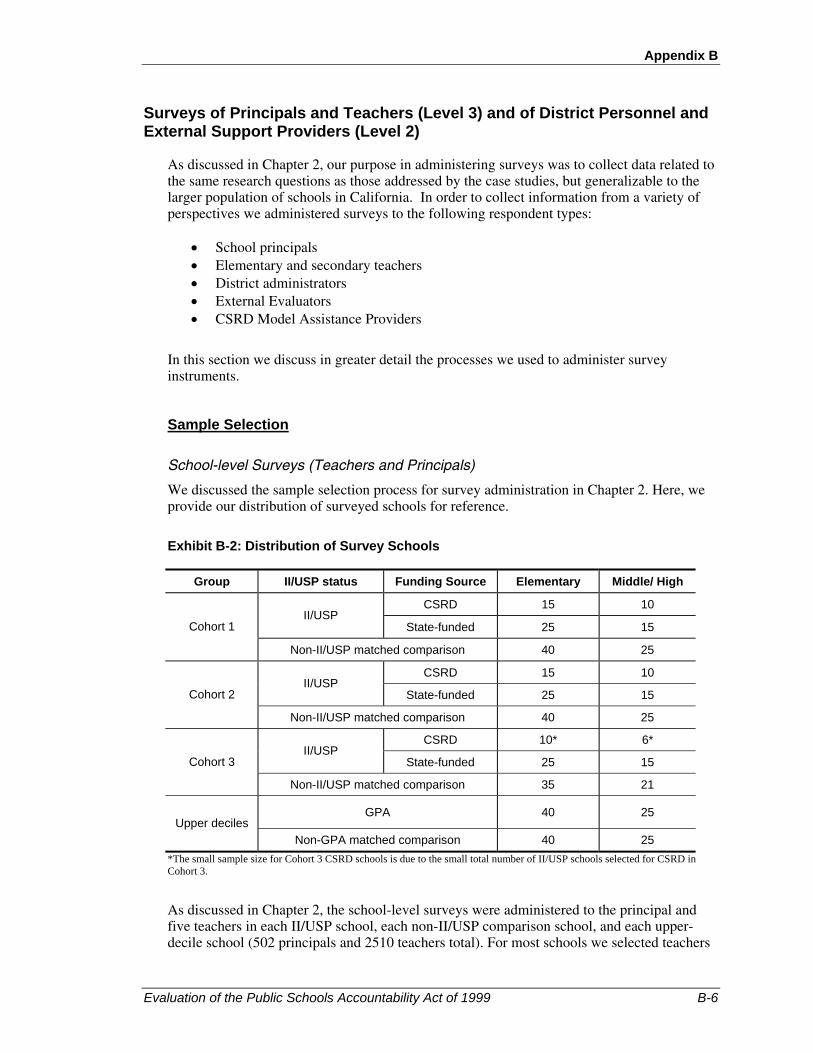
Appendix B
Evaluation of the Public Schools Accountability Act of 1999 B-6
Surveys of Principals and Teachers (Level 3) and of District Personnel and External Support Providers (Level 2)
As discussed in Chapter 2, our purpose in administering surveys was to collect data related to the same research questions as those addressed by the case studies, but generalizable to the larger population of schools in California. In order to collect information from a variety of perspectives we administered surveys to the following respondent types:
• School principals • Elementary and secondary teachers • District administrators • External Evaluators • CSRD Model Assistance Providers
In this section we discuss in greater detail the processes we used to administer survey instruments.
Sample Selection
School-level Surveys (Teachers and Principals)
We discussed the sample selection process for survey administration in Chapter 2. Here, we provide our distribution of surveyed schools for reference.
Exhibit B-2: Distribution of Survey Schools
Group II/USP status Funding Source Elementary Middle/ High
CSRD 15 10 II/USP
State-funded 25 15 Cohort 1
Non-II/USP matched comparison 40 25
CSRD 15 10 II/USP
State-funded 25 15 Cohort 2
Non-II/USP matched comparison 40 25
CSRD 10* 6* II/USP
State-funded 25 15 Cohort 3
Non-II/USP matched comparison 35 21
GPA 40 25 Upper deciles
Non-GPA matched comparison 40 25 *The small sample size for Cohort 3 CSRD schools is due to the small total number of II/USP schools selected for CSRD in Cohort 3.
As discussed in Chapter 2, the school-level surveys were administered to the principal and five teachers in each II/USP school, each non-II/USP comparison school, and each upper-decile school (502 principals and 2510 teachers total). For most schools we selected teachers

Appendix B
Evaluation of the Public Schools Accountability Act of 1999 B-7
to survey by choosing randomly from teacher rosters. We obtained teacher rosters for approximately 80% of our sampled schools through a web search and phone calls to schools (where necessary). Some schools and districts we called required us to provide proof of our contract with the CDE. For these schools the CDE drafted a letter outlining the study and AIR’s contract. We faxed this letter to schools that requested proof of the contract. In addition, one district requested that we send copies of the surveys to the district’s research review board.
Once we obtained the teacher rosters we selected five teachers from each school: two resource teachers and three classroom teachers. Classroom teachers were distributed across grade levels for elementary schools and included department heads/teacher leaders for math, English/language arts, science, and/or social studies for middle and high schools. Many schools did not have two resource teachers; in these cases we selected an additional classroom teacher. For the schools for which we were unable to obtain rosters, we asked principals to select the teachers (see “Survey Administration and Follow-up” below).
District Surveys
As discussed in Chapter 2, the study team surveyed district staff who were knowledgeable experts in curriculum and instruction, assessment and evaluation, and federal and state programs in half of the public school districts with at least one school participating in one of the three II/USP cohorts. This included 134 districts. We first selected the 20 districts that had the largest number of II/USP schools. All of these districts had 11 or more II/USP schools. We then selected the remaining 114 districts through simple random sampling of districts with at least one II/USP school.
We obtained names for up to four district staff members, including II/USP, curriculum/instruction, Title I, and accountability representatives by placing calls to II/USP district representatives. In some cases we obtained all four names, in other cases there were fewer staff members responsible for these programs. It should be noted that we were unable to obtain contact information for relevant staff at five districts in our original sample. We replaced those districts with districts of similar geography, urbanicity, and II/USP participation. We obtained contact information for all five of the replacement districts. We then administered an on-line survey to the contacts in all sampled districts, ranging from one to four representatives per district.
External Assistance Provider Surveys
As we outlined in Chapter 2, we originally planned to survey all External Evaluators who worked with II/USP schools and CSRD model providers who worked with at least one school in the II/USP program. Obtaining full contact information for all of these individuals, especially for those from large model providers or from External Evaluating organizations that were approved in the first year of II/USP, was a challenge. We obtained addresses from the CDE for the External Evaluators and from the web for most CSRD model providers. We then followed up with phone calls to External Evaluating organizations and CSRD model providers to obtain names of individuals who worked with II/USP and CSRD schools in California. The challenges in obtaining a full sample for the survey were many:

Appendix B
Evaluation of the Public Schools Accountability Act of 1999 B-8
• Many addresses were outdated.
• The CDE did not have names and contact information for all External Evaluators, particularly for Cohort 3.
• Many CSRD model providers also served as External Evaluators. We did not want to burden them with two surveys and therefore administered only the External Evaluator survey to them.
• Due to budget limitations we were unable to follow-up extensively with External Evaluator organizations that did not return phone calls or e-mails requesting names of individuals for the survey.
As a result, we administered surveys to 265 External Evaluators and 37 CSRD model providers. Due to a low sample size, coupled with a low response rate, we were unable to analyze the data obtained from the CSRD model provider survey.
Survey Instrument Development
We outlined the preliminary survey development process in Chapter 2. To detect potential problems with questions asked on the written surveys, we pilot tested the teacher and principal surveys with six teachers and two principals to ensure that the questions were clear, valid, and appropriate. Researchers utilized methods developed in AIR’s Cognitive Survey Laboratory, creating a series of questions to ask teachers and principals about the survey. We conducted piloting both by phone and in person. In five cases we asked respondents to fill out the draft survey prior to the interview in order to obtain an accurate measure of the time they took to complete the survey. We then asked them questions about individual items. In three cases we had the respondents complete the survey with an AIR researcher present to ask questions and solicit feedback as the survey was completed. We found on average that the teacher survey took 30-40 minutes to complete, and the principal survey took approximately 45 minutes to complete. Pilot testers held two meetings to compile feedback and discuss issues that arose during pilot testing. We integrated the feedback into the survey revision process. We provided each pilot testing respondent a $50 incentive to complete the survey and participate in a one to two hour interview with an AIR researcher.
Survey Administration and Follow-up
Teacher and Principal Surveys
We sent out packets of surveys to all schools in our sample (502 schools) during the week of November 11, 2002. Each packet was addressed to the principal of the school. We worked to ensure a high response rate by including cover letters and supporting materials that accurately conveyed the importance and benefits of participation. The packets contained the following:
• A cover letter from AIR asking the principal to distribute the surveys to the designated teachers
• A letter of support from the CDE
• A sealed packet for the principal that contained the survey, a business-reply envelope, a cover letter from AIR, a flyer explaining the incentive (see below), and a ticket to fill out to qualify for the incentive.
Appendix B
Evaluation of the Public Schools Accountability Act of 1999 B-9
• Five sealed packets for teachers that each contained the survey, a business-reply envelope, a cover letter from AIR, the letter of support from the CDE, a flyer explaining the incentive, and a ticket to fill out to qualify for the incentive.
We obtained names of teachers from teacher rosters for approximately 80% of the sampled schools. For these schools we labeled each packet with a name and ID number and asked the principal to distribute the packets to the named teachers. The surveys were labeled on the back page with the ID number and a bar code to track respondents for follow-up. We asked principals to substitute with comparable teachers if one of the teachers was new this year to the school or had left the school. We were unable to obtain teacher rosters for approximately 20% of schools. For these schools we asked the principals of middle and high schools to distribute them to the lead teachers or department heads in math, English, social studies, and/or science. We asked the principals of elementary schools to randomly select five teachers (four classroom and one resource) who had been at the school longer than one year.
Our budget had limited funds for respondent incentives. We therefore worked to find an incentive structure that best took advantage of the available funds. For the initial round of survey mailings to schools, respondents were offered the opportunity to qualify for a monetary bonus incentive. We offered 60 monetary bonuses of $100 each to randomly chosen respondents who sent their surveys back to us postmarked by the end of November. We made this decision in consultation with our contract monitor and the legal counsel at CDE and with our pilot survey respondents.
Due to lower-than-expected response rates on the teacher and principal surveys, we spent the following three months following up with non-respondents, offering additional incentives, and providing additional means to fill out the survey. Our follow-up procedures included:
• We offered a second round of incentives: 40 rewards of $75 for surveys returned by the end of December 2002 (this was later extended to the end of February 2003).
• We faxed non-respondent teachers and principals twice to remind them of the incentives and to request their participation in the study.
• We e-mailed principals of all schools from which we had not received all surveys asking them to encourage teachers to fill out the survey. E-mails were sent once in December and once in January.
• We called schools from which we had no responses to ask if they had declined participation or required an additional set of surveys (e.g., if they had been misplaced or discarded).
• We re-sent surveys to schools from which we either had no response or only one response.
• We placed calls to all principals of CSRD schools and re-mailed surveys to these schools upon request.
• We created a shortened on-line teacher survey and converted it to a web-based format hoping that this would be an easier format for teachers to fill-out. We then sent letters to all non-respondent teachers in mid-February with a log-in and password to access the on-line survey. We included a letter of support from the CDE and a brochure outlining our study and the on-line survey process.
• We created an on-line version of the II/USP principal survey. A temporary staff member conducted follow-up calls to principals in March. She called each respondent to remind him/her of the survey and to obtain an e-mail address. We

Appendix B
Evaluation of the Public Schools Accountability Act of 1999 B-10
subsequently sent an e-mail to each of these respondents with the URL, login, and password for the on-line principal survey.
District Surveys
We administered a web-based district survey in mid-February. We sent all respondents a letter in the mail with a login and password to access the on-line survey. We included a letter of support from the CDE and a brochure outlining our study and the on-line survey process.
We began following up with phone calls to district staff respondents 10 days after the letters were mailed out. We also faxed all respondents a reminder approximately two weeks after administration. When possible we obtained e-mail addresses for district respondents and e-mailed letters to them with the URL and their password included.
External Assistance Provider Surveys
In early-March we administered External Evaluator and CSRD model provider on-line surveys. We sent all respondents a letter in the mail with a log-in and password to access the on-line survey. Once again, we included a letter of support from the CDE and a brochure outlining our study and the on-line survey process.
A temporary staff member conducted follow-up calls to the External Evaluators, calling each respondent to remind him/her of the survey and to obtain an e-mail address. We subsequently sent an e-mail to each of these respondents with the URL, login, and password. A research assistant conducted similar follow-up calls to CSRD model providers.
Survey Log-in and Data File Preparation
As surveys were returned, they were logged in to a database so that researchers could identify which sites required follow-up reminder calls. To prepare for statistical analyses, researchers developed coding schemes for each written survey type and reviewed all surveys to check for multiple responses, check marks that were outside of boxes, and errors in skip patterns. The surveys were then sent to a subcontractor for key taping. All data files were checked for coding and data entry errors.
Convening of Advisory Board
AIR, in consultation with the CDE, convened an Advisory Board to provide feedback and advice on the study design, data collection activities, and data analyses associated with this study. We met with the Advisory Board two times during each phase of the study. The following members participated on the Advisory Board for this project:
• Holly Covin Jacobson (California School Boards Association)
• Brian Edwards (Office of the Secretary), Phase 1
• Stu Greenfeld (Superintendent of Washington Unified School District)
• Lisa Horwitch (Senate Education Committee)
• Robert Manwaring/Victoria Carreon (Legislative Analyst’s Office)
• Lynette Nyaggah (California Teachers Association)

Appendix B
Evaluation of the Public Schools Accountability Act of 1999 B-11
• Jeannie Oropeza /Mohammed Wardak (Department of Finance)
• David Sanchez (Principal of Liggett Elementary in Los Angeles Unified School District)
• Lisa Tyrell (1st grade teacher at Glenwood Elementary School in Robla School District)
• Louise Waters (Assistant Superintendent of Accountability, Oakland Unified School District)
• Chuck Weis (Ventura County Superintendent of Schools; PSAA Advisory Committee)
The first Advisory Board meeting took place on February 28, 2002, at the AIR Sacramento, CA office. During this meeting we reviewed the overall study design including the conceptual framework and construct map, the sampling techniques used for case study site selection, and initial drafts of our data collection instruments, including interview and focus group protocols. The purpose of the second meeting, which took place on May 31, 2002, at the Employment Development Department office in Sacramento, CA, was to review the status of the project and the PSAA legislation, and to discuss results from preliminary student achievement data analyses and emerging themes from case study site visits in preparation for the Phase I report. The third Advisory Board meeting was held on September 20, 2002 at the AIR office in Sacramento. The purpose of this meeting was to discuss updated information gained from site visits and achievement analyses, to discuss plans for survey administration, and to review drafts of teacher and principal surveys. The final Advisory Board meeting was held on May 9, 2003 at the AIR office in Sacramento. During this meeting we discussed results from the full set of case study site visits, the teacher, principal, and External Evaluator surveys, and the statewide student achievement analyses in preparation for the completion of this final report.
Appendix B
Evaluation of the Public Schools Accountability Act of 1999 B-12