event-driven scalability predictors: improving energy- efficiency under hard performance constraints...
TRANSCRIPT

Event-Driven Scalability Predictors: Improving Energy-Efficiency under Hard Performance Constraints on Multiprocessors
Dimitris NikolopoulosDepartment of Computer ScienceVirginia Tech
Joint work with:
Matt Curtis-MauryJames DzierwaChristos Antonopoulos

2
How to make multi-context architectures more energy-friendly without compromising HPC
Multi-core/multi-threaded processors
Energy awareness
Concurrency control

3
How to make multi-context architectures more energy-friendly without compromising HPC
Scalability predictors
Continuous hardware monitors

4
Multi-Core and Multi-Threaded Architectures
Diminishing returns form ILP (ideal pipeline!)
T ρ 1
sT 0
T ρ = cI
ρRIM
1−s
ρ
Rs−1 Μ
C0

5
Latency and parallelism considerations
Need thousands of threads to overlap latencies, at a
large cost for power (and performance?)

6
Representative power consumption
SMT and multi-core power over 100W. Power density comparable to nuclear reactors.

7
Concurrency control
Concurrency as a knob
Energy-aware Performance

8
Concurrency -power trade-off revisited (HPC)
Power increases linearly with concurrency.
Performance gains diminishwith higher concurrency.
Is there an “optimal” concurrency (sweet-spot)?

9
Exploiting the trade-off: program phases
Code regions with uniform characteristics
Characteristics of interest: IPC, memory access intensity
Our case: scalability
Real example:NAS FT

10
Exploiting the trade-off: polymorphic threading
Code regions react differently to SMT
Characteristics of interest: ILP, memory access intensity
Our case: educated choicebetween precomputation, TLP,and sequential execution

11
Optimality
Maximum performance at minimum power
Exponential space for searching O(nphasesthreads)
Search at runtime needs heuristics
S
P
E
P

12
Related work
DVFS (stretching)[Penn State, Cornell,DAC'04,ISPASS'05,IPDPS'06]
DVFS during idle timeat synchronization points[NCSU, VT SC'05, PPoPP'05]
Direct search methods[Cornell HPCA'06]
Green: compute, highest frequencyBlue: compute, lower frequencyRed:idle (memory, or synch.)

13
Scalability predictors
Predict optimal concurrency and system configuration using real-time feedback
Predict scaling of phases with varying operating points (#threads, #cores, #CPUs)
Use hardware event counters to pin-point scalability bottlenecks

14
IPC scalability predictors
IPCt= f(ES
obs)
t, represent target configuration
f, non-linear approximation function
ES are samples of event rates with effect on scalability
IPC denotes useful computation, excluding spinning.

15
IPC scalability predictors - Steps
Need f()
Find event sets
Fit models to samples
Find f co-efficients
Identify program phases
Static training Runtime
Sample event rates
Predict and adapt

16
IPC scalability predictors - Steps
Need f()
Find event sets
Fit models to samples
Find f co-efficients
Identify program phases
Static training Runtime
Sample event rates
Predict and adapt

17
IPC scalability model – event sets
CPIevent
i
=counter
i
instructions
cyclesi
eventi
Available at runtime through counters
Available through trainingand linear regression
CPI=∑i=1
n
f CPIevent
i

18
IPC scalability model – event set training summary
Standard benchmark set(NAS, SPEC-OMP)
Collect event counts for 22major processor components
Run linear regression to estimate cycles/event.
Keep dominant events (maximum feasible to count simultaneouslywith available hardware counters)

19
IPC scalability predictors - Steps
Need f()
Find event sets
Fit models to samples
Find f co-efficients
Identify program phases
Static training Runtime
Sample event rates
Predict and adapt
20
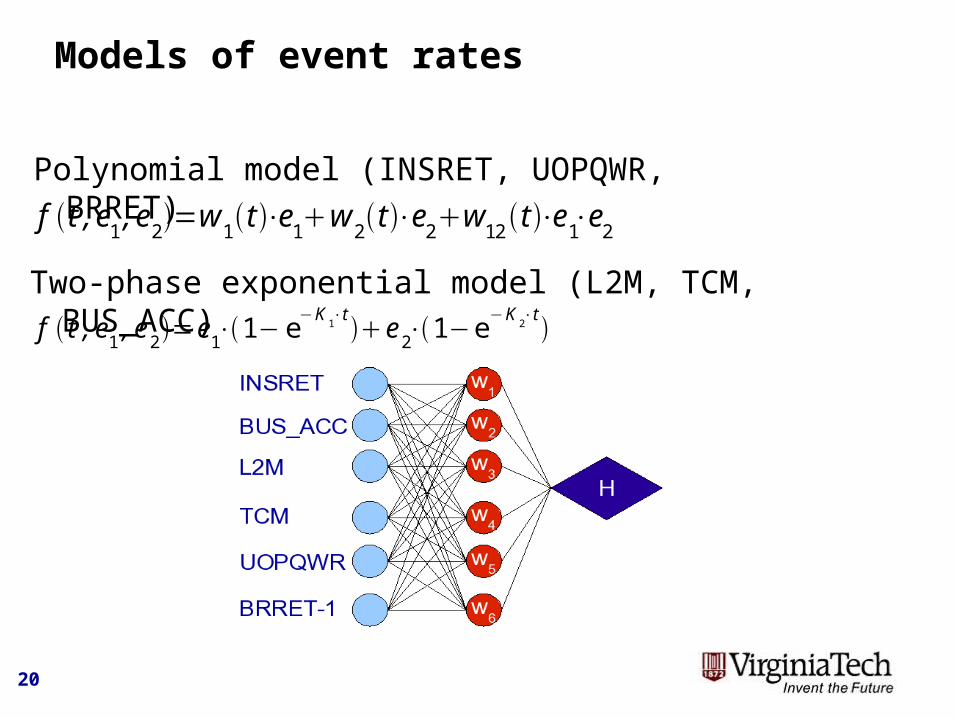
Models of event rates
Polynomial model (INSRET, UOPQWR, BRRET)
w2
f t , e1, e2=w
1t ⋅e
1w
2t ⋅e
2w
12t ⋅e
1⋅e2
Two-phase exponential model (L2M, TCM, BUS_ACC)f t , e
1, e
2=e
1⋅1− e
−K1⋅te
2⋅1−e
−K2⋅t

21
Scalability prediction – layered architecture
BRRET-2
Intel SMP Intel SMT

22
IPC scalability model – event sets
CPI=∑i=1
n
f CPIevent
i
CPIevent
i
=counter
i
instructions
cyclesi
eventi
Available at runtime through counters
Available through trainingand linear regression
Select events with maximumstatistical effect on performanceand scalability

23
Models of event rates
Polynomial model (INSRET, UOPQWR, BRRET)
w2
f t , e1, e2=w
1t ⋅e
1w
2t ⋅e
2w
12t ⋅e
1⋅e2
Two-phase exponential model (L2M, TCM, BUS_ACC)f t , e
1, e
2=e
1⋅1− e
−K1⋅te
2⋅1−e
−K2⋅t
Train with two programs (MM5, NAS UA):Find best fit for each dominant event
CPIevent
i
=counter
i
instructions
cyclesi
eventi
CPI t =∑i=1
n
CPIevent
i
counteri= f t , e
max, emax / 2

24
IPC scalability predictors - Steps
Need f()
Find event sets
Fit models to samples
Find f co-efficients
Identify program phases
Static training Runtime
Sample event rates
Predict and adapt

25
Dominant phases – runtime BBV analysis
Instrument //loop
entry points
Set of distinct points
defines phase
Maximal cardinality
repeated set defines
period

26
IPC scalability predictors - Steps
Need f()
Find event sets
Fit models to samples
Find f co-efficients
Identify program phases
Static training Runtime
Sample event rates
Predict and adapt

27
PACMAN
Accurate, fine-grain
performance monitoring
Dynamic partitioning of
HPM register file between threads
Software identification
and elimination of spinning events

28
IPC scalability predictors - Steps
Need f()
Find event sets
Fit models to samples
Find f co-efficients
Identify program phases
Static training Runtime
Sample event rates
Predict and adapt

29
IPC scalability prediction - Steps
phase {
layer L, nl≥L≥1 of parallelism from the innermost to the outermost {
sample event rates at max max/2 //;
predict // to optimize;
adapt on next instance; }}

30
IPC scalability prediction - Steps
phase {
layer L, nl≥L≥1 of parallelism from the innermost to the outermost {
sample event rates at max max/2 //;
predict // to optimize;
adapt on next instance; }}

31
IPC scalability prediction - Steps
execute phases for analysis; // Max 3 outer iterations in NAS/SPEComp
layer L, nl≥L≥1 of parallelism from the innermost to the outermost {
//Max 3 layers in current architectures
config = cnlcnl-1...c1pl-1...p2p1; ES = ESconfig;
execute phase with configuration config and record IPC, ES;
predict number of processing elements pL to use at layer L for maximizing IPC;}

32
IPC scalability predictors - Steps
Need f()
Find event sets
Fit models to samples
Find f co-efficients
Identify program phases
Static training Runtime
Sample event rates
Predict and adapt

33
SMT configuration predictors
Bus/cycle<0.0139
Branch/cycle < 0.0112l2m/cycle < 0.0040
0.9 < IPC < 1.00.7 < IPC < 0.80.2 < IPC < 0.3
TRUEFALSE
Bus/cycle<0.0215
0.3 < IPC < 0.40.1 < IPC < 0.2
FALSEFALSE
FALSE
TRUETRUE
TRUE
Pruned tree at < 4 levels, confidence >= 80%Adding fpuops/cycle increases confidence to >93%

34
Results – Experiments with real siliconInitial platform:
Dell PowerEdge 6650(8 threads, 4 dual-SMT Xeon @1.4 Ghz,8-KB L1, 256KB lL2, 512KB L3,1 GB RAM)
perfctr interface (custom kernel) plus PACMAN
New platform:
IBM OpenPower 720(16 threads, dual-SMT-core Power5 1.65 Ghz,32-KB L1, 1.92 MB L2, 36 MB L3,8 GB RAM)
oprofile plus extensions.

35
Results – Power modelling and measurementPower model
Adapted from Martonosi and Isci [MICRO'03].
Uses hardware counters and arearatios to estimate nominal powerconsumption in major components
Used for energy prediction during adaptation and fine-grain measurements (err <= 5%)
Physical infrastructure
Yokogawa WT230 multimeter
granularity: 100ms

36
Results – Opportunities on IBM system

37
Results – Energy-performance gains on IBM (NAS, SpecOMP)

38
Results – configuration prediction accuracy on IBM

39
Results – configuration prediction accuracy on IBM

40
Summary
Dynamic discovery and exploitation of power/performance adaptation opportunities
More energy-efficient multicore processors
Further research: inter-phase interference
More info: ICS'06, HP-PAC'06,QEST'06
http://www.cs.vt/edu/~dsn Questions?
32 for $1M
32 for $2Kor 13K for 1M

41
Results – IPC prediction accuracy

42
Energy considerations
Power increases fast in the desktop/server world, somewhat slower in the laptop world...

43

44