event log aggregation scenario - sap · 6.2 your marketing and sales campaign: wrap-up.....41 2...
TRANSCRIPT

PUBLIC
SAP BusinessObjects Predictive Analytics 3.12017-10-26
Event Log Aggregation ScenarioData Manager User Guide

Content
1 Before you Start. . . . . . . . . . . . . . . . . . . . . . . . . . . . . . . . . . . . . . . . . . . . . . . . . . . . . . . . . . . . . 3
1.1 About this Document. . . . . . . . . . . . . . . . . . . . . . . . . . . . . . . . . . . . . . . . . . . . . . . . . . . . . . . . . . 3
What's New in Event Aggregation Scenario. . . . . . . . . . . . . . . . . . . . . . . . . . . . . . . . . . . . . . . . .3
1.2 Prerequisites. . . . . . . . . . . . . . . . . . . . . . . . . . . . . . . . . . . . . . . . . . . . . . . . . . . . . . . . . . . . . . . . 4
1.3 Use Scenario: Overview. . . . . . . . . . . . . . . . . . . . . . . . . . . . . . . . . . . . . . . . . . . . . . . . . . . . . . . . .4
2 Event logging: Description. . . . . . . . . . . . . . . . . . . . . . . . . . . . . . . . . . . . . . . . . . . . . . . . . . . . . 7
3 Use Scenario: Introduction. . . . . . . . . . . . . . . . . . . . . . . . . . . . . . . . . . . . . . . . . . . . . . . . . . . . 10
4 Step 1 - Configuring the Data Source. . . . . . . . . . . . . . . . . . . . . . . . . . . . . . . . . . . . . . . . . . . . 12
4.1 Importing CSV Files into a Database. . . . . . . . . . . . . . . . . . . . . . . . . . . . . . . . . . . . . . . . . . . . . . . 13
5 Step 2 - Modeling your Data. . . . . . . . . . . . . . . . . . . . . . . . . . . . . . . . . . . . . . . . . . . . . . . . . . . 15
5.1 Simple Method: Using Only Reference Data. . . . . . . . . . . . . . . . . . . . . . . . . . . . . . . . . . . . . . . . . . 15
Simple Method: Description. . . . . . . . . . . . . . . . . . . . . . . . . . . . . . . . . . . . . . . . . . . . . . . . . . 15
Simple Method: Modeling Process. . . . . . . . . . . . . . . . . . . . . . . . . . . . . . . . . . . . . . . . . . . . . . 15
Simple Method: Results. . . . . . . . . . . . . . . . . . . . . . . . . . . . . . . . . . . . . . . . . . . . . . . . . . . . . 21
5.2 Intermediate Method: Adding Demographic Data. . . . . . . . . . . . . . . . . . . . . . . . . . . . . . . . . . . . . .23
Intermediate Method: Description. . . . . . . . . . . . . . . . . . . . . . . . . . . . . . . . . . . . . . . . . . . . . . 23
Intermediate Method: Modeling Process. . . . . . . . . . . . . . . . . . . . . . . . . . . . . . . . . . . . . . . . . 23
Intermediate Method: Results. . . . . . . . . . . . . . . . . . . . . . . . . . . . . . . . . . . . . . . . . . . . . . . . . 24
5.3 Overall Method: Adding Transaction Data. . . . . . . . . . . . . . . . . . . . . . . . . . . . . . . . . . . . . . . . . . . 25
Overall Method: Description. . . . . . . . . . . . . . . . . . . . . . . . . . . . . . . . . . . . . . . . . . . . . . . . . . 25
Overall Method: Modeling Process. . . . . . . . . . . . . . . . . . . . . . . . . . . . . . . . . . . . . . . . . . . . . .25
Overall Method: Results. . . . . . . . . . . . . . . . . . . . . . . . . . . . . . . . . . . . . . . . . . . . . . . . . . . . . 35
6 Step 3 - Making a Decision and Taking Action. . . . . . . . . . . . . . . . . . . . . . . . . . . . . . . . . . . . . 36
6.1 Identifying the Customers to Contact. . . . . . . . . . . . . . . . . . . . . . . . . . . . . . . . . . . . . . . . . . . . . . 36
Applying the Model to the Reference Data Table. . . . . . . . . . . . . . . . . . . . . . . . . . . . . . . . . . . . 36
Extracting the Customers to Contact. . . . . . . . . . . . . . . . . . . . . . . . . . . . . . . . . . . . . . . . . . . .40
6.2 Your Marketing and Sales Campaign: Wrap-Up. . . . . . . . . . . . . . . . . . . . . . . . . . . . . . . . . . . . . . . .41
2 P U B L I CEvent Log Aggregation Scenario
Content

1 Before you Start
1.1 About this Document
The primary goal of this document is to show the added value that event logging – an Automated Analytics data manipulation feature – can bring to your data mining activity. At the same time, it will serve as a tutorial for people who want to evaluate and get started with:
● Event Logging,● Modeler - Regression/Classification.
This document first gives a description of the application. Then, a use scenario takes you through the steps of creating data models first using the regression/classification model , then using event logging combined with the regression/classification model . All the data modeling tasks are performed using SAP BusinessObjects Predictive Analytics.
At the end of the scenario, you will understand how event logging can help you make the most out of your transaction data
Full Documentation
Complete documentation can be found on the SAP Help Portal at http://help.sap.com/pa.
1.1.1 What's New in Event Aggregation Scenario
Links to information about the new features and documentation changes for Event Aggregation Scenario.
SAP Predictive Analytics 2.4
What's New Link to More Information
Link to the sample files Use Scenario: Overview [page 4]
Event Log Aggregation ScenarioBefore you Start P U B L I C 3

1.2 Prerequisites
To perform the scenario presented in this document, we recommend that you have a basic knowledge of predictive analytics concepts. To give you a few examples, you must understand what the following concepts stand for: "target variable", "predictive power", "prediction confidence", "profit curves", and so on.
For more information on these topics, see Classification, Regression, Segmentation and Clustering – Automated Analytics User Guide.
1.3 Use Scenario: Overview
A Scenario in Three Main Steps
The use scenario will take you through the three following steps:
1. Importing the data samples provided to you as CSV files into your DBMS, in order to create a database whose tables can be indexed and joined.
2. Creating an ODBC connection to the database created in step 1, so that Automated Analytics can access it.3. Creating three different predictive models, by taking into account different data sources and by using only
a regression/classification model for the first two models, and then event logging combined with a regression/classification model for the third model. You will then be able to compare the results obtained with each model according the data sources used.
Technical Requirements
Use Scenario: Configuring Tasks
The first two tasks of this scenario – Importing the Sample Data into your DBMS and Creating an ODBC connection – are configuring tasks. The details related to performing these tasks depend on your technical environment.
For more information, see the two documents Import Flat Files into your DBMS - Support Document and Connect to your DBMS - Support Document, or please ask your system administrator.
Use Scenario: SQL Queries
In this scenario, you will have to use SQL queries. Versions of these queries have been tested and will work on the following DBMS:
● Microsoft Access,● IBM DB2,● Oracle 8i.
4 P U B L I CEvent Log Aggregation Scenario
Before you Start

Introduction to Sample Data Files
You can download the sample files from the SAP Help Portal page at http://help.sap.com/pa.
The File... Contains...
Customers.csv reference data about your company's customers.
It lists 360,000 customers, who are described by 13 variables, such as their gender, their age or their occupation, and so on.
Demog.csv demographic data.
It lists 200 geographic areas that are described by their number of inhabitants, the average income per inhabitant and other continuous variables.
Sales.csv transaction data of the customers referenced in the Customers.csv file.
It lists about 3,400,000 purchases, that are described by an identifier, an amount and a date. About a dozen transactions or so are referenced for each customer.
Mailings1_2.csv This file contains the responses of the first 60,000 customers of the Customers.csv file to the incentive mailing that your marketing department sent. It also contains the date the mailing was sent on.
Mailing3.csv This file contains the actual responses to the marketing incentive mailing of the 300,000 customers you will need to target. You will not use this file to perform the scenario. You could use it at the end of the scenario in order to check the efficiency of the customer targeting that you will have done thanks to your data mining model.
CautionWe strongly recommend that you do not change the names that we specify for data tables and other files. Otherwise, you will have to adapt SQL queries and other settings to your particular situation.
The diagram below shows the data tables used for the scenario and the relationships between these tables.
Event Log Aggregation ScenarioBefore you Start P U B L I C 5
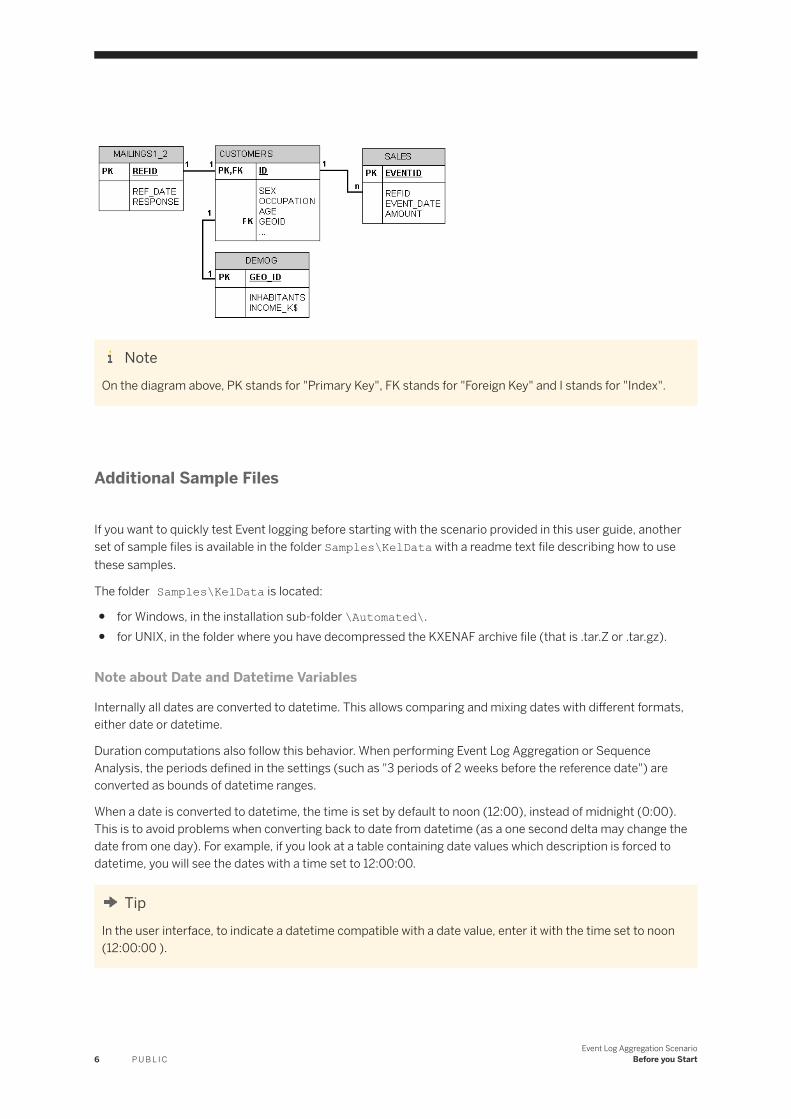
NoteOn the diagram above, PK stands for "Primary Key", FK stands for "Foreign Key" and I stands for "Index".
Additional Sample Files
If you want to quickly test Event logging before starting with the scenario provided in this user guide, another set of sample files is available in the folder Samples\KelData with a readme text file describing how to use these samples.
The folder Samples\KelData is located:
● for Windows, in the installation sub-folder \Automated\.● for UNIX, in the folder where you have decompressed the KXENAF archive file (that is .tar.Z or .tar.gz).
Note about Date and Datetime Variables
Internally all dates are converted to datetime. This allows comparing and mixing dates with different formats, either date or datetime.
Duration computations also follow this behavior. When performing Event Log Aggregation or Sequence Analysis, the periods defined in the settings (such as "3 periods of 2 weeks before the reference date") are converted as bounds of datetime ranges.
When a date is converted to datetime, the time is set by default to noon (12:00), instead of midnight (0:00). This is to avoid problems when converting back to date from datetime (as a one second delta may change the date from one day). For example, if you look at a table containing date values which description is forced to datetime, you will see the dates with a time set to 12:00:00.
TipIn the user interface, to indicate a datetime compatible with a date value, enter it with the time set to noon (12:00:00 ).
6 P U B L I CEvent Log Aggregation Scenario
Before you Start

2 Event logging: Description
What
Event logging is a data manipulation feature that builds a “mineable” representation of an event history. It merges reference information from a table with information from history tables, which is aggregated automatically per period of time.
Why
The information necessary to build predictive models is often spread across a table containing “static” information such as customer demographics or equipment specifications and a log of transactions such as purchase history, service call history or equipment alarms. To build predictive models, this data must be compressed and combined into a single row per analytic record, representing both the static reference information and the event history.
How
Event logging creates aggregates on user defined periods. Period length can be day, week, month, and so on. They are computed from a reference date that can be fixed or specific to each of the reference cases (for example, date of first purchase for a customer). When a specific reference date is selected, the application creates what is called Relative Aggregation, that is an aggregation not based on calendar or even fiscal periods, both of which are static for all data. The details and timing of event data is extremely important in understanding the customer’s behavior. The following figure shows how selecting a specific reference date can reveal a pattern in the customers' behavior.
Event Log Aggregation ScenarioEvent logging: Description P U B L I C 7

The application is programmable and you can specify the aggregates (min, max, sum, count, and so on).
The figure below illustrates how the application works.
Benefits for the business user
Event Logging does not require programming to perform this sophisticated aggregation. Due to the speed of the application, several aggregation options can be tested ad-hoc to find the most meaningful solution.
8 P U B L I CEvent Log Aggregation Scenario
Event logging: Description

Benefits for the Data Mining expert
Event Logging enables the Data Mining professional to include additional historical data in the analysis process, resulting in better models. The application is fast and can handle very large data sets.
Benefits for the Integration specialist and IT
Only one pass of the log table is required, using an efficient internal data representation. Building transactional aggregates can be done in minutes instead of days, and can be used to prototype permanent ETL processes. No changes to the underlying schema are required.
Examples
For Customer Relationship Management (CRM), the most valuable information is how a customer has interacted with a company and its products. This information is typically stored as a purchase history, or call center log. When performing an analysis to predict customer churn, a customer's actions with respect to the time they left can be critical for maximizing model quality. This requires an event aggregation based on the churn date. Customers churn at different times, so aggregating on a fixed date, such as January 2001, is not necessarily meaningful for the analysis. In this case, the count of purchases and complaint calls, and the sum of purchases could be automatically aggregated for each month in the year before the churn date. Once this is done by event logging, a regression/classification model could be used to predict churn.
In a different scenario, when predicting machine part failure, the static information about a particular piece of equipment (lot number, manufacture date, and so on) is not nearly as important as how the equipment has been used. The operating logs, with conditions such as temperature and pressure can be utilized by the application. A series of alarms in a new machine can be very different than the same set of alarms in a ten-year-old machine. Alarm counts along with maximum pressure and temperature for each quarter over the first five years of service life could be automatically created by the application. In this case, a segmentation/clustering model might be used in addition to create segments of equipment with high risk and low risk for failure.
Event Log Aggregation ScenarioEvent logging: Description P U B L I C 9

3 Use Scenario: Introduction
Your Objective
You are a member of the Sales Management team in a large retail bank.
The current date is July 02, 2007. Your Sales Director has just asked you to generate additional revenues of $1,500,000 before September 01, 2007. You must find ways to sell more "Credit++" – the new product of consumer credit that has been developed within your company for the last six months.
Your Means and Constraints
A few months back, your marketing department has sent incentive mailings to people referenced in its customer database, offering them to apply for the new consumer credit product.
The two waves of mailings were sent one month from one another, each one to a sample of 30,000 people randomly selected among the overall population referenced in the customer database.
According to the CRM processes in force in your company, any person who has not responded to a mailing within two months is considered to have responded negatively. Taking such an hypothesis into account, the average response rate obtained for the first two mailings amounts to 4.99%. In other words, 2,994 out of the 60,000 people contacted have eventually applied for the new credit product. Only the first two waves – that is, 60,000 people – can indeed be taken into account with respect to the time required to identify non-responders. The average revenue generated from a person that responds positively to a mailing is $900.
For all the 360,000 people referenced in your customer database, you have at your disposal:
● Reference data,● Transaction data● Demographic data, that your marketing department purchased. This data provides information such as the
standard of living or the number of inhabitants for every demographic area.
You also have at your disposal Response Data, that is a table containing a list of the 60,000 people who were sent the marketing incentive mailing, 2,994 of which responded positively with regard to the new consumer credit product. For each of these 2,994 responders, you also know the amount of the credit they were granted.
Your Business Issue
Based on the average revenue per person – that is, $900 – 1667 responders need to be contacted to generate an income of $1,500,000. Based on the average response rate – that is, 4.99% – a mailing should be sent to 33,400 people.
Your problem is that you will not be able to find the time to contact over 33,000 people due to the operational constraints you face within your company. In order to maximize your response rate, you need to develop a
10 P U B L I CEvent Log Aggregation Scenario
Use Scenario: Introduction

targeted marketing campaign to predict which customers are the most likely to respond to the incentive mailing among the 300,000 referenced in your database.
Your Solutions
Your solution here is Data Mining: You will generate a predictive model supervised by the known responses of the 60,000 customers already contacted. You will then apply this model on the other 300,000 customers referenced in your database. As a result of the model application, you will obtain a file containing the customers who are the most likely to respond positively to your incentive mailing.
So, your point here is not to select the best Data Mining tool available on the market, but to select the best method to build the predictive model among the three following ones:
● A simple method, that consists of using only the customers' reference data.● A intermediate method, that consists of using the customers' reference data combined with the purchased
demographic data.● An overall method, which consists of using the customers' reference data, combined with the purchased
demographic data and the customers' transaction data.
For the first two methods, you will use the regression/classification engine. The third method is where event logging comes into play, enabling you to pre-process the transaction data so that it can be processed by the regression/classification engine.
Event Log Aggregation ScenarioUse Scenario: Introduction P U B L I C 11

4 Step 1 - Configuring the Data Source
To enable the joining and indexing of data tables, you need to import the data samples into your database management system (DBMS). Data Toolkit provides you with a Data Transfer feature that will allow you to easily import the provide csv files into your database.
Data Sources Supported
The following data sources are supported:
● Flat files (text files) in which the data are separated by a delimiter, such as commas in .csv (Comma Separated Value) format file. For instance, the sample file Census01.csv, used for the regression/classification and segmentation/clustering application scenarios, is a .csv file.
RestrictionWhen accessing data in .csv files, Automated Analytics only supports CR + LF (common on Microsoft Windows) or LF (common on UNIX) for line breaks.
● ODBC-compatible data sources.
CautionSAP HANA information views are not supported by Data Manager, only standard tables or views can be used as data source.
Note
For the list of supported platforms, refer to the Product Availability Matrix .
Creating an ODBC Connection
Before using the Data Transfer feature to import the sample files in your database, you need to create an ODBC connection so that Automated Analytics can access it.
To know how to create an ODBC connection, see the document Connecting to your Database Management System on Windows or UNIX, or ask your system administrator.
12 P U B L I CEvent Log Aggregation Scenario
Step 1 - Configuring the Data Source

Importing CSV Files into your DBMS Using Data Transfer
To import the csv files provided as sample files into a database, you can use the Data Transfer feature. The table below lists the files to import in the database and the settings to apply for the import.
When Importing the file.. Use the description... Specify the following field as primary key...
Index the following field...
Customers.csv Customers_desc.txt ID GeoID
Demog.csv Demog_desc.txt GEO_ID -
Sales.csv EVENTID REFID
Mailings1_2.csv mailings_desc.txt REFID -
Mailing3.csv mailings_desc.txt REFID -
NoteAn index speeds up queries on the indexed fields as well as sorting and grouping operations. A primary key field holds data that uniquely identifies each record in a table.
4.1 Importing CSV Files into a Database
1. On the start menu, in the Toolkit section, click the option Perform a Data Transfer.
The panel Select Data Set Source is displayed.2. In the list Data Type, select the option Text Files.3. Use the Browse button located next to the Folder field to select the folder where you have saved the event
logging sample files.4. Use the Browse button located next to the field Data Set to select the file you want to import.5. Click the Next button. The panel Describe Data Set is displayed.6. If a description file exists for the file you have selected as a source:
1. Click the button Open Description.2. Select the description file in the window Load a Description for ...3. Click the OK button.4. Else click the Analyze button.
The file description is displayed.
NoteThe application automatically indexes all fields that have their key field set to 1 in the description.
7. Click the Next button. The panel Create Data Set Copy is displayed.8. In the list Data Type, select the option Data Base.
Event Log Aggregation ScenarioStep 1 - Configuring the Data Source P U B L I C 13

9. Use the Browse button located next to the Folder field to select the data base in which you want to import the data.
The pop-up window Data Selection opens.
NoteIf it has not been done yet, contact your administrator to set up the database connection on your computer.
10. If the selected database is password-protected, enter the login information in the User and Password fields.11. Click the OK button.12. In the field Output Data Set, enter the name of the table to create. It should have the same name as the file
from which the data have been imported.13. Click the Next button. The panel Data Transfer is displayed. A progress bar indicates the advancement of
the transfer.14. Once the transfer is over, click the Next button to go back to the starting menu.15. Repeat the whole procedure for each file to import.
14 P U B L I CEvent Log Aggregation Scenario
Step 1 - Configuring the Data Source

5 Step 2 - Modeling your Data
5.1 Simple Method: Using Only Reference Data
5.1.1 Simple Method: Description
To tackle your issue, you decide to first try and see if the customers' reference data you own contain enough information to allow for an effective targeting of your sales campaign.
Using the regression/classification engine, you will generate a predictive model in order to determine the way prospects will respond to incentive mailings.
This model will be generated by using the reference data of the 60,000 customers who received the first two waves of mailings sent by your marketing department.
It means that you will need to:
● Join the table containing the first 60,000 customers’ responses (Mailings1_2.csv) with the table containing their customers' reference data (Customers.csv).
5.1.2 Simple Method: Modeling Process
The regression/classification engine allows you to create explanatory and predictive models.
The first step in the modeling process consists of defining the modeling parameters:
1. Select a cutting strategy.2. Select a data source to be used as training data set.3. Describe the data set selected.4. Select the target variable, and possibly a weight variable.5. Select the explanatory variables.
Summary of the Modeling Settings to Use
The table below summarizes the modeling settings that you must use for the simple method. It should be sufficient for users who are already familiar with SAP BusinessObjects Predictive Analytics.
For detailed procedures and more information, see the following sections.
Task(s) Screen Settings
Event Log Aggregation ScenarioStep 2 - Modeling your Data P U B L I C 15

Creating an analytical data set merging two tables
Data Manipulation Define a New
Analytical Data Set Merge
● source table: mailings1_2
Merge:
● source field: REFID / target table: customers / target field: ID
Update Fields:
● Set GEOID and REFID as integer and nominal .
● Set REF-DATE as datetime and continuous .
● Check that REFID is a key variable.
Save as:
● KEL_ADS_SimpleMethod
● Specifying the data source Data to be Modeled ● Select the option ODBC Source .● In the ODBC Source field, specify
the data source to be used● In the Estimation field, select the
analytical data set KEL_ADS_SimpleMethod , created in the previous step.
Describing the data Data Description Create the data description using the Analyze button.
Selecting the Target Variable and a weight variable
Selecting the Target Variable Select the variable RESPONSE as your target variable.
Selecting explanatory variables Selecting Variables Exclude the variables REFID and REF_DATE from the list of variables to be used for modeling.
5.1.2.1 Creating the Analytical Data Set
1. In the Start menu, double-click the option Define a New Analytical Data Set.2. Select the table mailings1_2.3. Click Next. The panel Edit Temporal Analytical Data Set is displayed.4. Click the Merge tab.5. Select REFID as the Source Field.6. Select customers as the Target Table.7. Select ID as the Target Field.8. Click the button New Merge. The newly created merge is displayed in the upper part of the panel.9. Click the Fields tab.10. Click the type corresponding to REFID and set it to nominal.11. Repeat step 10 for GEOID.12. Click the type corresponding to REF_DATE and set it to continuous.
16 P U B L I CEvent Log Aggregation Scenario
Step 2 - Modeling your Data

13. Check that REFID is identified as a key.14. Click the Next button. The panel Save and Export is displayed.15. In the field Analytic Data Set Name, enter KEL_ADS_SimpleMethod as the name of the new analytical data
set.16. Click the Save button.17. Click the Cancel button to go back to the Start menu.
5.1.2.2 Selecting a Data Source
To generate the model, you first need to combine your customers' reference data (Customers table) with the responses data (Mailings1_2 table) validated by your CRM processes, that is, the responses of the customers who were contacted in the first two waves of mailings.
You can join these tables:
● Either in your DBMS.● Or directly in SAP BusinessObjects Predictive Analytics by creating an analytical data set in the Data
Manipulation feature.
For this Scenario, join the table containing the 60,000 customer responses (Mailings1_2.csv) with the table containing their customers' reference data (Customers.csv).
To Select a Data Source:
1. On the screen Select a Data Source in the list Data Type, select the ODBC option.
NoteBy default, the Text files option is selected.
2. Click the Browse button.
Depending on the option you selected at step 1, the dialog box Data Source Selection will appear.3. Select the folder or database where your data is stored. If the database is password protected, enter the
login information in the fields User and Password.4. Click the Browse button associated with Estimation field.
A selection window will appear.5. Select the data file to be used.
The name of the file will appear in the Estimation field.6. If you have selected the Customized cutting strategy, repeat steps 4 and 5 for the Validation and Test fields.7. To select only part of the data set, use the Advanced Settings.8. Click the Next button.
The screen Data Description will appear.9. Go to the section Describing the Data Selected.
Event Log Aggregation ScenarioStep 2 - Modeling your Data P U B L I C 17

5.1.2.3 Describing the Data
How to Describe Selected Variables
To describe your data, you can:
● Either use an existing description file, that is, taken from your information system or saved from a previous use of SAP BusinessObjects Predictive Analytics,
● Or create a description file using the Analyze option, available to you in the Modeling Assistant. In this case, it is important that you validate the description file obtained. You can save this file for later re-use. If you name the description file KxDoc_<SourceFileName>, it will be automatically loaded when clicking the Analyze button.
CautionThe description file obtained using the Analyze option results from the analysis of the first 100 lines of the initial data file. In order to avoid all bias, we encourage you to mix up your data set before performing this analysis.
Each variable is described by the fields detailed in the following table:
The Field... Gives information on...
Name the variable name (which cannot be modified)
Storage the type of values stored in this variable:
● Number: the variable contains only "computable" numbers (be careful a telephone number, or an account number should not be considered numbers)
● String : the variable contains character strings● Datetime : the variable contains date and time stamps● Date: the variable contains dates
Value the value type of the variable:
● Continuous : a numeric variable from which mean, variance, etc. can be computed
● Nominal : categorical variable which is the only possible value for a string
● Ordinal : discrete numeric variable where the relative order is important
Key whether this variable is the key variable or identifier for the record:
● 0 the variable is not an identifier;● 1 primary identifier;● 2 secondary identifier...
18 P U B L I CEvent Log Aggregation Scenario
Step 2 - Modeling your Data

Order whether this variable represents a natural order.
There must be at least one variable set as Order in the Event data source.
CautionIf the data source is a file and the variable stated as a natural order is not actually ordered, an error message will be displayed before model checking or model generation.
Missing the string used in the data description file to represent missing values (e.g. "999" or "#Empty" - without the quotes)
Group the name of the group to which the variable belongs
Description an additional description label for the variable
To Create a Description File:
For this Scenario,create the data description by clicking the Analyze button.
1. On the screen Data Description, click the Analyze button.The data description will appear.
2. Check that the description obtained is correct.If your initial data file contains variables that serve as keys, they are not automatically recognized. Describe them manually, as described in the procedure To Specify that a Variable is a Key.
3. Once the data description has been validated, you can:○ Save it by clicking the Save button.○ Click the Next button to go to the following step.
The screen Selecting the Target Variable will appear.4. Go to the section Selecting a Target Variable.
To Specify that a Variable is a Key
1. In the Key column, click the box corresponding to the row of the key variable.2. Type in the value "1" to define this as a key variable.
Event Log Aggregation ScenarioStep 2 - Modeling your Data P U B L I C 19

Selecting the Target Variable and a Weight Variable
For this Scenario:
1. Select the variable RESPONSE as your target variable.2. Do not select any weight variable.
To Select Target Variable:
1. On the screen Selecting Variables, in the section Explanatory Variables Selected (left hand side), select the variable you want to use as Target Variable.
NoteOn the screen Selecting Variables, variables are presented in the same order as that in which they appear in the table of data. To sort them alphabetically, select the option Alphabetic sort, presented beneath each of the variables list.
2. Click the button > located on the left of the screen section Target(s) Variable(s) (upper right hand side). The variable moves to the screen section Target(s) Variable(s). Also, select a variable in the screen section Target(s) Variable(s) and click the button < to move the variables back to the screen section Explanatory variables selected.
20 P U B L I CEvent Log Aggregation Scenario
Step 2 - Modeling your Data

Selecting Explanatory Variables
By default, and with the exception of key variables (such as KxIndex), all variables contained in your data set are taken into consideration for generation of the model. You may exclude some of these variables.
Event Logging Select Explanatory Var > For this ScenarioFor this Scenario
● Exclude the variables REFID and REF_DATE from the list of variables to be used for modeling.
NoteThese two variables, representing the customer unique identifier (REFID) and the date on which the different mailings were sent (REF_DATE), are excluded since their values are sure to be completely different from the data found in the apply data set. This can be tested by using the deviations analysis in the menu Using the Model.
● Retain all the other variables.
To Select Variables for Data Analysis
1. On the screen Selecting Variables, in the section Explanatory variables selected (left hand side), select the variable to be excluded.
NoteOn the screen Selecting Variables, variables are presented in the same order as that in which they appear in the table of data. To sort them alphabetically, select the option Alphabetic sort, presented beneath each of the two parts of the screen.
2. Click the button > located in the center of the screen. The variable moves to the screen section Variables excluded. Also, click the button < to move the variables to the screen section Explanatory variables selected.
3. Click the Next button. The screen Summary of Modeling Parameters will appear.
5.1.3 Simple Method: Results
Model Performance Indicators
Once the model has been generated, you must verify its validity by examining the performance indicators:
● The predictive power is a quality indicator that allows you to evaluate the explanatory power of the model, that is, its capacity to explain the target variable when applied to the training data set. A perfect model would possess a predictive power equal to 1 and a completely random model would possess a predictive power equal to 0.
● The prediction confidence is a robustness indicator that defines the degree of robustness of the model, that is, its capacity to achieve the same explanatory power when applied to a new data set. In other words,
Event Log Aggregation ScenarioStep 2 - Modeling your Data P U B L I C 21

the degree of robustness corresponds to the predictive power of the model applied to an application data set.
To see how the predictive power and the prediction confidence are calculated, see Predictive Power, Prediction Confidence and Profit Curves in the document Classification, Regression, Segmentation and Clustering Scenarios - Automated Analytics User Guide.
NoteValidation of the model is a critically important phase in the overall process of data mining. Always be sure to assign significant importance to the values obtained for the predictive power and prediction confidence of a model.
The model generated on the customers' reference data gives the following results:
● Predictive power = 0.198 ● Prediction confidence = 0.976
Presentation of the User Menu
Once the model has been generated, click the Next button. The screen Using the Model will appear.
The screen Using the Model presents the various options for using a model, that allow you to:
● Display the information relating to the model just generated or opened (Display section), referring to the model curve plots, contributions by variables, the various variables themselves, HTML statistical reports, table debriefing, as well as the model parameters.
● Apply the model just generated or opened to new data, to run simulations, and to refine the model by performing automatic selection of the explanatory variables to be taken into consideration (Run section).
● Save the model, or generate the source code (Save/Export section).
Taking a Closer Look at the Model
From the screen Using the Model, you can display a suite of plotting tools that allow you to analyze and understand the model generated in details. Three useful tools are described in the table below.
On the screen... You can observe and analyze...
Profit Curves The performance of the model with respect to a hypothetical perfect model and a random type of model
Contributions by Variables The contribution of each of the explanatory variables with respect to the target variable
Significance of Categories The significance of the various categories of each variable with respect to the target variable
On the screen Contributions by Variables (see below), you notice that the GEOID variable is one of the variables that contribute the most to the explanation of the target variable. This result lead you to believe that taking the
22 P U B L I CEvent Log Aggregation Scenario
Step 2 - Modeling your Data

demographic data might significantly improve the predictive power, thus obtaining a better model. This leads you to the intermediate method.
5.2 Intermediate Method: Adding Demographic Data
5.2.1 Intermediate Method: Description
The results of the simple method shed light on the importance of the GEOID variable. So, after using only the customers' reference data, you decide to now combine them with the externally purchased demographic data to build your predictive model.
Your goal is to check whether this data may contribute to a better targeting of your sales campaign, compared to the simple method.
As the table of demographic data (Demog) you own contains no dynamic data (or events), you can still use the sole regression/classification engine to generate the model.
As with the simple method, you will need to join the tables to be used - that is, the Customers, Mailings1_2 and Demog tables.
5.2.2 Intermediate Method: Modeling Process
The process of building a predictive model on the customers' reference data combined with the demographic data is approximately the same as the one you used for building the model on the reference data.
The only additional step you have to perform is to join the customers' reference data table (Customers) with the response data table (Mailings1_2) with the demographic data table (Demog). To join these tables, you will use the Data Manipulation feature.
Summary of the Modeling Settings to Use
The table below summarizes the modeling settings that you must use for the intermediate method. Except for the additional SQL query to be used on the screen Data to be Modeled, the other settings are similar to the ones used for the simple method.
For detailed procedures and more information, see the Modeling Process section of the Simple Method section.
Event Log Aggregation ScenarioStep 2 - Modeling your Data P U B L I C 23

Task(s) Screen Settings
Creating the analytical data set Data Manipulation Define a New
Analytical Data Set Merge
● source table: KEL_ADS_SimpleMethod
Merges
● source field: GEOID / Target table: Demog / Target field: GEO_ID
Save as:
● KEL_ADS_IntermediateMethod
● Selecting a cutting strategy● Specifying the data source
Data to be Modeled ● Cutting strategy: Random● Select the option ODBC Source .● In the ODBC Source field, specify
the data source to be used● In the Estimation field, select the
analytical data set KEL_ADS_IntermediateMethod , created in the previous step.
Describing the data Data Description Create the data description using the Analyze button.
Selecting the Target Variable and a weight variable
Selecting the Target Variable Select the variable RESPONSE as your target variable.
Selecting explanatory variables Selecting Variables Exclude the variables REFID and REF_DATE from the list of variables to be used for modeling.
5.2.3 Intermediate Method: Results
The Training the Model screen shows the predictive power and the prediction confidence, which indicate the quality and robustness of the model generated on the customers' reference data combined with the demographic data.
The table below compares these results with the ones obtained for the simple method.
Predictive Power Prediction Confidence
Simple Method 0.198 0.976
Intermediate Method 0.199 0.971
Taking the geographic data into account has led you to obtain a model that has the same quality, which means that a regression/classification model does not find more information in the added data. However when adding the events data, the geographic data may add to the model quality. Before making strategic decisions and taking action, the last test you need to perform is to determine whether taking the events data you own into account can take you further into enhancing your model.
24 P U B L I CEvent Log Aggregation Scenario
Step 2 - Modeling your Data

5.3 Overall Method: Adding Transaction Data
5.3.1 Overall Method: Description
Although the intermediate method resulted in a model that was both accurate and robust, you still have transaction data (Sales table) at your disposal. The last method you will use consists of taking all the data you own into account for building your model, that is:
● The reference data● The demographic data● The transaction data
The transaction data contains event data, where there may be zero, one, or many entries for each customer. Since the regression/classification model is not designed to process such data, you will need to use a data manipulation feature. That is where event logging comes into play!
Event logging is a data manipulation feature that combines and compresses event data in a manner that makes it available to Modeler. Event Logging adds no difficulty to the modeling process. All you have to do to is to configure specific application settings in SAP BusinessObjects Predictive Analytics.
NoteFor a longer description of event logging, see Long Description.
As with the simple and intermediate methods, you will need to join the tables to be used - that is, the Customers, Mailings1_2 and Demog tables.
5.3.2 Overall Method: Modeling Process
Compared to using only the regression/classification model as you did for the first two methods, using event logging means performing the four additional steps below:
1. Selecting Events Data Source.2. Describing Events Data.3. Setting event logging Parameters.4. Setting event logging Events Statistics
You will have to go through the same overall modeling process as the one you went through for the two other methods, with event logging steps taking place just:
● After the step Describing Data,● Before the step Selecting the Target Variable.
Event Log Aggregation ScenarioStep 2 - Modeling your Data P U B L I C 25

Summary of the Modeling Settings to Use
The table below summarizes the modeling settings you must use for the overall method. Except for the four steps specific to event logging, the other settings are similar to the ones used for the intermediate method.
Event logging steps are presented in details in the following sections.
For detailed procedures and more information, see the Modeling Process section of the Simple Method section.
Task(s) Screen Settings
● Selecting a cutting strategy● Specifying the data source
Data to be Modeled ● Cutting strategy: Random● Select the option ODBC Source .● In the ODBC Source field, specify
the data source to be used● In the Estimation field, select the
analytical data set KEL_ADS_IntermediateMethod .
Describing the data Data Description ● Create the data description using the Analyze button.
Selecting an Event Data Source Events Data Select the option Data Base .
In the Folder field, specify the data source to be used
In the Events field, select the table Sales .
Describing Event Data Events Data Description Use the description sales_desc
Setting Event Logging Parameters Event Logging Parameters Settings Fill in the fields with the following values:
Column for Join / Reference Dataset: REFID
Column for Join / Log Dataset: REFID
Log Date Column / Log Dataset: EVENT_DATE
Setting Event Statistics Event Logging Variables Selection for Functions
Check Selected Aggregate on the line AMOUNT / Sum .
Reference Date: Variable / REF_DATE
Period Type: Simple
Period Definition: Define 3 successive period(s) of 1Month / Starting 3 Months before REF_DATE
Selecting the target variable and a weight variable
Selecting the Target Variable Select the variable RESPONSE as your target variable.
26 P U B L I CEvent Log Aggregation Scenario
Step 2 - Modeling your Data

Task(s) Screen Settings
Selecting explanatory variables Selecting Variables Exclude the variables REFID and REF_DATE from the list of variables to be used for modeling.
Selecting the Type of Model to Create
In the Explorer area of the main menu, click the option Perform anEvent Log Aggregation.
The screen Add a Modeling Feature is displayed.
Click the option Add a Classification/Regression.
NoteWhen building a model you can either create aggregations or add extra transformations such as a classification/regression or a clustering/segmentation using Modeler.
5.3.2.1 Selecting Reference Data
The Events Data Source screen lets you specify the data source to be used as transaction data.
For this Scenario:
● The Folder field should already be filled in with the name of the data source that you specified on the Data to be Modeled screen.
● In the Events field, select the table Sales.
This analytical data set contains the customers that were contacted in the two first waves of incentive mailings that your marketing department sent.
To Select Events Data/
1. Select the type of your data source (Text Files, ODBC, ...).2. In the Folder field, specify the folder where your data source is stored.3. In the Events field, specify the access path and name of your data source.4. If needed, press the Enter key to activate the Next button.5. Click the Next button. The screen Events Data Description is displayed.
5.3.2.2 Describing Events Data
The screen Events Data Description lets you describe your events data, offering you the same options as the screen Data Description. For detailed procedures on how to set parameters on this screen, see Describing the Data.
Event Log Aggregation ScenarioStep 2 - Modeling your Data P U B L I C 27

For this Scenario
1. Create the data description by clicking the Analyze button.
The description of your data appears.2. Make sure the description is similar to the one on the screen below, that is:
○ The EVENTID variable must be set as integer and nominal and be specified as a key variable.○ The REFID variable must be set as integer and nominal, be specified as a key variable and as an order
variable.○ The EVENT_DATE variable must be set as date and continuous.○ The AMOUNT variable must be set as number and continuous.
3. Click the Next button.The data description is taken into account.
The screen Event Logging Parameters Settings appears.
5.3.2.3 Setting Event Loggging Parameters
The screen Event Logging Parameters Settings lets you to set some parameters by performing the following tasks:
● Join your reference data with your transaction data.● Select the variable to be used as the transaction variable.● Set time parameters required for the generation of event logging statistics.● Specify the storage type for internal computation.● Specify a prefix for variables generated by the event logging.
For this scenario, the reference date will be the date when the mailing was sent, that is REF_DATE.
You are interested in each customer purchases on the three months preceding the date on which they were sent the incentive mailing by your marketing department.
The panel Event Logging Parameters Settings looks like the one below.
The table below summarizes the modeling settings to use for the screen Event Logging Parameters Settings.
Field Setting
Column for Join / Reference Data Set REFID
Column for Join / Log Data Set REFID
28 P U B L I CEvent Log Aggregation Scenario
Step 2 - Modeling your Data

Log Date Column / Log Data Set EVENT_DATE
Reference Date Variable
Columns for Join
Because event logging aggregates two sets of data, there must be a column that will be the pivot for this operation, and this column has to be present in both data sets. This parameter allows that: specifying for both data sets which column is holding the identifiers that will enable the aggregation to take place. Thus, it is not required that these columns have the same name as long as they are semantically equivalent.
Log Date Column
Knowing the pivot column is not enough in order to aggregate the data sets. Events are aggregated for each identifier, but within specific time windows as well. Hence, events timestamps have to be present in the data set; this parameter specifies which column holds this information.
Storage type
Aggregating data sets may consume a lot of memory. Selecting the On Disk option rather than Memory causes the application to store its internal computations in a temporary file, thus lowering virtual memory consumption (but lowering speed as well).
NoteDue to their completely different structures, the two modes are not comparable in terms of internal storage size.
Variables Prefix
Because event logging generates additional variables, it is possible to recognize them easily by specifying a prefix to their names.
Event Log Aggregation ScenarioStep 2 - Modeling your Data P U B L I C 29

5.3.2.4 Selecting Event Logging Statistics
The Variables Selection for Functions screen lets you specify:
● the aggregates you want to calculate on transaction data (or events),● the periods over which you want to calculate these aggregates,● and possibly filters on the data.
For this Scenario, you decide to calculate for every customer the amount of their purchases on the three months preceding the date on which they were sent the incentive mailing by your marketing department. That way, you should be able to determine and understand your customers' purchase behaviors.
5.3.2.4.1 Specifying the Aggregates
The screen is split in two parts:
● the upper part of the panel allows you to select the meta operators to apply on the count operation. This operation, which is always done, counts the number of events in each defined period (see table below for details on the meta-operators).
● the table in the lower part of the panel displays the available aggregates.
For this Scenario:
● Do not select any meta-operators on the count operation.● For the variable Amount, that gives for every customer the amount their individual purchases, select the
function Sum, that calculate for every customer the sum of all their purchases amounts.● Do not select any meta-operators.
To Create an Aggregate on Transaction Data:
1. Click the button 1- Click toDefine the Aggregates to display the corresponding section.
NoteThis section is displayed by default when opening the panel Event Logging Variables Selection for Functions.
2. You can choose to apply meta-operators on the Count operator. This operator, which is always computed, counts the number of events in each defined period (see table below for details on the meta-operators).
3. In the table, check the box Selected Aggregate corresponding to the variable and the operator to use to create the aggregate. Four types of operators are available for each variable: Max, Sum, Average, and Min.
Depending on the results you want to obtain, you can apply meta-operators on the aggregates you are creating. The five types of meta-operators can be applied concurrently.
The meta-operator... adds to the aggregate... calculates...
Variation one column for each couple of consecutive periods (that is n-1)
the difference between the values of two consecutive periods for all the periods of the aggregate
30 P U B L I CEvent Log Aggregation Scenario
Step 2 - Modeling your Data
Percentage Variation one column for each couple of consecutive periods
the difference in percentage between the values of two consecutive periods for all the periods of the aggregate
Accumulation one column for each period, except the first one
the current total accumulation for each period of the aggregate
Backward Accumulation one column for each period, except the last one
the current total accumulation for each period of the aggregate calculated backwards
Global Sum one column the sum of all periods values of the aggregate
4. By default all numerical variables are displayed in the table, however you can choose to display only the continuous variables by checking the box Display only Continuous Variables.
5. Click the button 2 - Click to Define the Periods to select the periods over which the aggregates will be calculated.
5.3.2.4.2 Setting the Periods
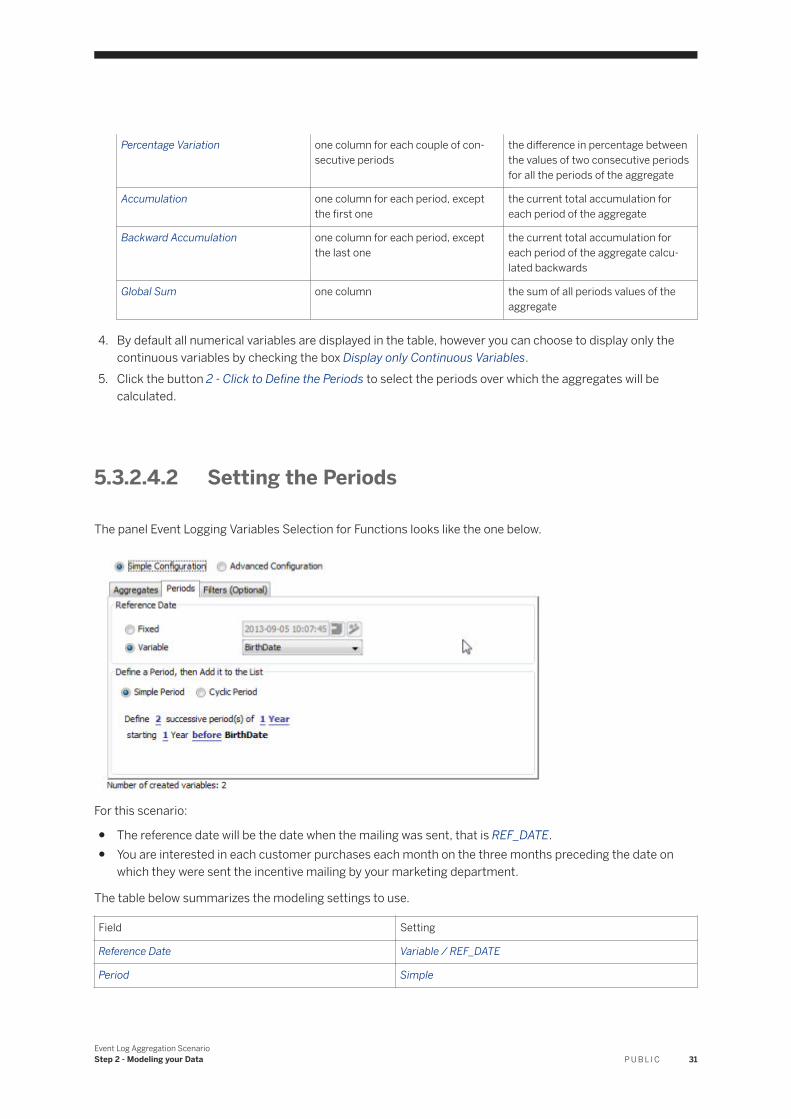
The panel Event Logging Variables Selection for Functions looks like the one below.
For this scenario:
● The reference date will be the date when the mailing was sent, that is REF_DATE.● You are interested in each customer purchases each month on the three months preceding the date on
which they were sent the incentive mailing by your marketing department.
The table below summarizes the modeling settings to use.
Field Setting
Reference Date Variable / REF_DATE
Period Simple
Event Log Aggregation ScenarioStep 2 - Modeling your Data P U B L I C 31

Period Definition Define 3 successive period(s) of 1Month
Starting 3 Months beforeREF_DATE
To Define the Periods:
1. Select the type of the reference date by checking either Fixed or Variable. The reference date is the starting date used to define the periods to be analyzed. This date can be:○ either Fixed, that is, a specific date, for example 05-24-2004,○ or Variable, that is, a date defined by a variable from the data set. For example, the first purchase date,
the churn date, and so on.2. Depending on the option selected above, either specify a fixed date in the corresponding text field, or
select a date variable from the available date variables in the reference table.3. Select the type of period you want to define. There are two types of periods:
○ Simple Periods, which are successive periods of a defined length○ Cyclic Periods, which are recurring periods such as every day, every month, every year, and so on.
4. The period definition interface depends on the period type you have selected.If you want to define a Simple Period:1. In the displayed sentence, click the word or number corresponding to the parameter to modify. The
periods are defined by:○ a number of periods,○ a duration,○ a starting date, which can be before or after the reference date previously selected.
2. Repeat this step for all the parameters to define.
If you want to define a Cyclic Period:
1. Check the option Cyclic Period in the frame Define a Period...2. In the drop-down list Create one period for each, select the cycle.
You can apply the periods to the entire data set or select one or more successive periods:
○ select the option All Events to get the cyclic periods in the whole data set.○ select the option Only over the following time frame to limit the cyclic periods to a specific time frame.
Defining this time frame amounts to creating simple periods.
NoteThe number of variables created by event logging is indicated at the bottom of the panel. This number grows with the number of periods defined.
5. Once you have defined the periods you can set filters or pivots, by clicking the button Optional - Click to Define the Filters.
5.3.2.4.3 Setting Filters (optional)
The option Filter allows you to filter your data depending on the variables values.
32 P U B L I CEvent Log Aggregation Scenario
Step 2 - Modeling your Data

The option Pivot allows you to create one event logging engine for each selected value. Creating a pivot amounts to creating a filter on one category for each selected categories.
For this Scenario, do not define any filters or pivots.
To Define a Filter or a Pivot:
1. Click the button Optional - Click to Define the Filters to display the filter interface.2. Check the option Filter or Pivot depending on how you want to filter your data.3. Select the Filter Type. Two types of filters are available:
○ by Excluded Value(s), which means that the filter will exclude events containing the values listed in the table,
○ by Kept Value(s), which means that the filter will keep only the events containing the values listed in the table.
4. Select the variable to filter by in the Variables drop-down list.5. To add categories to the table, you can:
○ either automatically extract the selected variable categories by clicking the magnifier button located next to the list and then select the values to keep or exclude by checking the corresponding Selection box.
○ or enter a value in the field New Category and click the + button.
NoteThe number of variables created by event logging is indicated at the bottom of the panel. This number grows exponentially when filtering by pivot. The higher the number of variables, the longer the model learning.
5.3.2.4.4 Selecting the Variables
Once event logging has run on the data and computed the requested aggregates, new variables have been created. These variables appear in the list Explanatory Variables Selected of the panel Selecting Variables.
Different variables are created depending on the selected operators and meta operators. Different elements are used to build the variables names:
<prefix> By default, the prefix is set to el , but can be modified.
<Engine> ● Name of the event logging engine, when several event logging engines are used (when using a pivot or the advanced configuration).
● Engine if only one event logging engine is used.
Event Log Aggregation ScenarioStep 2 - Modeling your Data P U B L I C 33

● <Period, Pn> Number of the current period.
The periods are numbered from 0. If there are 4 periods from -2 years to +2 years, the periods are numbered 0, 1, 2, 3. With 0 being the oldest one and 3 the last one.
NoteNote that the numbering of output columns for cyclic and non-cyclic periods is different. For example, suppose that there is a fixed date of 8/18/2007, and you ask for the last 24 months (non-cyclic). Then output columns will have months numbered 0 through 23, with month 23 having entries between 7/19/2007 and 8/18/2007. On the other hand, if you specify cyclic by months, then output columns will be numbered 0 (Jan) through 11(Dec), regardless of the fixed date.
<n> Total number of periods minus 1. For the example above n=3.
<Operator> The operator applied
<Meta> The meta operator applied
<Variable> The variable on which the operator applies
The following table details the generated output variables.
Operator /
Meta Operator
Name
Syntax Example
Count (CNT) <prefix>_<engine>_CNT_<PeriodNumber>
el_Engine_CNT_0
Sum (SUM)
Min (MIN)
Max (MAX)
Average (AVG)
<prefix>_<engine>_<operator>_<period>_<variable>
el_Engine_SUM_1_OS
el_Engine_MIN_0_OS
el_Engine_AVG_3_OS
el_Engine_MAX_2_OS
Variation (DIF)
Percentage Variation (PER)
<prefix>_<engine>_<Meta>_<Operator>_P0_P 1_<variable>
<prefix>_<engine>_<Meta>_<Operator>_P1_P 2_<variable>
...
<prefix>_<engine>_<Meta>_<Operator>_Pn1_P n_<variable>
el_Engine_DIFF_MIN_0_1_OS
el_Engine_PER_SUM_1_2_OS
34 P U B L I CEvent Log Aggregation Scenario
Step 2 - Modeling your Data

Accumulation (ACC) <prefix>_<engine>_<Meta>_<Operator>_P0_P 1_<variable>
<prefix>_<engine>_<Meta>_<Operator>_P0_P 2_<variable>
...
<prefix>_<engine>_<Meta>_<Operator>_P0_P n_<variable>
el_Engine_ACC_MIN_0_1_OS
el_Engine_ACC_CNT_0_2
Back Accumulation (BACK) <prefix>_<engine>_<Meta>_<Operator>_P0_P n_<variable>
<prefix>_<engine>_<Meta>_<Operator>_P1_P n_<variable>
...
<prefix>_<engine>_<Meta>_<Operator>_Pn1+P n_<variable>
el_Engine_BACK_MAX_ 2_3_OS
el_Engine_BACK_CNT_0_3
Global Sum (FUL) <prefix>_<engine>_<Meta>_<Operator>_0_n_<variable>
el_Engine_FUL_AVG_0<->3_OS
5.3.3 Overall Method: Results
The screen shows the predictive power and the prediction confidence, which indicate the quality and robustness of the model generated on the customers' reference data combined with the demographic and the transaction data.
The table below compares these results with the ones obtained for the simple and intermediate methods.
Predictive Power Prediction Confidence
Simple Method 0.198 0.976
Intermediate Method 0.199 0.971
Overall Method 0.399 0.986
Taking the transaction data into account has led you to obtaining a model that has a much better predictive power than with the two other methods. Thanks to event logging, you have been able to make the most out of your transaction data. On the basis of the model obtained, you can develop an extremely targeted marketing campaign that will help you in maximizing your profit.
Event Log Aggregation ScenarioStep 2 - Modeling your Data P U B L I C 35

6 Step 3 - Making a Decision and Taking Action
6.1 Identifying the Customers to Contact
You now need to clearly identify who these customers are among all the customers referenced in your database.
You will do this by:
● Applying the model to the customers' reference data table.● Extracting the customers to contact from the application result file.
6.1.1 Applying the Model to the Reference Data Table
For this Scenario, the table below summarizes the modeling settings to apply the model.
For a detailed procedure, see To Apply the Model to a New Data Set.
36 P U B L I CEvent Log Aggregation Scenario
Step 3 - Making a Decision and Taking Action

Task Screen Settings
Creating the Application Data Set Data Manipulation Create a New
Analytical Dat Setsource table: Customers
Fields
● Rename ID alias in REFID
New Fields >Function:
● New Function Miscellaneous
Operators Constant● Type: DateTime
Value: '2007-07-01 12:00:00'
Name: REF_DATE
Merge:
● source field: GEOID / target table: Demog / target field: GEO_ID
Filter:
● On: REFID / Operator: Greater than / Right Operand: Constant(Integer)=59999
Save
● name: KEL_ADS_ApplyDataSet
Selecting the Events Data Set Apply Events Data ● Select the option Data Base .● in the Folder field, specify the data
source to be used.● In the Events field, select the ana
lytical data set Sales .
Setting the Reference Date Apply Events Data ● For the Reference Date , check the Variable option.
● In the list Reference Column , select REF_DATE .
Selecting the Application Data Set Applying the Mode Application
Data Set l
● Select the option Data Base .● In the Folder field, specify the data
source where the application data set is located.
● In the Data field, select the analytical data set KEL_ADS_ApplyDataSet .
Selecting the Generation Options Applying the Model Generation
Options
● In the Generate list, select Decision .
● In the Mode list, select Apply .
Event Log Aggregation ScenarioStep 3 - Making a Decision and Taking Action P U B L I C 37

Task Screen Settings
Setting where the Results will be Saved Applying the Model Results
Generated by the ModelSelect the option Data Base .
This will lead into creating a table containing the application results in your database
● In the Folder field, specify the data source to be used.
● In the Data field, specify a name – for example, KXSCORE – for the application results table to be created in your database.
The following panel is set with this information:
To Apply the Model to a New Data Set:
1. On the screen Using the Model, click the option Apply the Model to a New Data Set.
The screen Apply Events Data appears.2. In the section Events Data Set, select the format of the data source (Text files, Data Base, ...).3. Click the Browse button to select:
○ In the Folder field, the folder or data base which contains your data set,○ In the Events field, the name of the file, table or analytical data set corresponding to your data set.
4. In the section Fixed, select the Reference Date type.○ Fixed corresponds to a constant date you define.○ Variable corresponds to a date variable existing in the events data set.
38 P U B L I CEvent Log Aggregation Scenario
Step 3 - Making a Decision and Taking Action

5. Click the Next button.
A dialog box appears asking to confirm the event data set replacement.6. Click the Yes button.
The screen Applying the Model appears.7. In the section Application Data Set, select the format of the data source (Text Files, Data Base, ...).8. Click the Browse button to select:
○ In the Folder field, the folder or data base which contains your data set,○ In the Data field, the name of the file, table or analytical data set corresponding to your data set.
9. In the section Generation Options, select type of results you want to obtain in the Generate drop-down list.10. In the Mode drop-down list, select the application mode of the model.
NoteIf you select the Keep only outliers option, only the outlier observations will be presented in the results file obtained after applying the model.
11. In the section Results Generated by the Model, select the file format for the output file (Text Files, Data Base, ...).
12. Click the Browse button to select:○ In the Folder field, the folder or data base in which you want to save the results.○ In the Data field, the name of the file or table in which the results will be saved.
13. Click the Apply button.
If you have selected the Decision option in the Generate list, the Classification Decision screen appears.
6.1.1.1 Defining the Number of Customers to Contact
According to the income you have to generate – that is $1,500,000 – you determined that you had to contact 1,667 people who would respond positively to your incentive mailing (Your Business Issue (see Your Objective)). These 1,667 responders represent 11.1% of the potential responders contained in the database. Taking into account that, though the KI is significantly higher with the last method, it is below 0.5, you should select a slightly higher percentage of detected target to be sure to reach your goal.
In this Scenario:
● Select 12% of Detected Target.● Set the Total Population to 300,000.
To Define the Number of Customers to Contact:
1. In the field % of Detected Target, enter 12.
The cursor scale moves to 0.9% (see above), thus indicating that you need to send the incentive mailing to 0.9% of the customers referenced in your database – that is to 2,700 people – to contact 12% of responders.
2. To estimate the number of responders correctly identified by the model, you can use the Confusion Matrix.
Event Log Aggregation ScenarioStep 3 - Making a Decision and Taking Action P U B L I C 39

In the field Total Population, enter the total number of customers in your apply data set, that is, 300,000. By default, the Total Population is the number of records in the Validation data set.
The following table details how to read the confusion matrix.
Predicted[Target Category] Positive Observations Predicted
Predicted[Non-target Category] Negative Observations Predicted
Total
True[Target Category] Actual Positive Observations
Number of correctly predicted positive observations
Number of actual positive observations that have been predicted negative
Total number of actual positive observations
True[Non-target Category] Actual Negative Observations
Number of actual negative observations that have been predicted positive
Number of correctly predicted negative observations
Total number of actual negative observations
Total Total number of positive observations predicted
Total number of negative observations predicted
Total number of observations in the data set
The Classification Rate, that is, the percentage of data accurately classified by the model when applied on the training data set, is indicated below the confusion matrix.
You can also visualize the profit you will make by using the Cost Matrix.
1. Enter the average revenue generated from a person that responds positively in the cell True true/Predicted True.The Profit generated is displayed on the right of the Cost Matrix.
2. Click the Next button.The Applying the Model screen appears.Once application of the model has been completed, the results files of the application is automatically saved in the location that you had defined from the screen Applying the Model.
6.1.2 Extracting the Customers to Contact
At the end of the model application, you will find a table containing the application results in your database. This table has been created on the fly by the application. If you followed the recommended settings for this scenario, it is named KXSCORE.
The figure below shows the first lines of this table.
The table below describes the application results table.
40 P U B L I CEvent Log Aggregation Scenario
Step 3 - Making a Decision and Taking Action

The column... Contains...
REFID The customers' unique identifiers
RESPONSE No values. You will fill in this column once you know the actual responses of the customers to be contacted. That way, you can compare them with the responses predicted by the model.
rr_RESPONSE The score, or value predicted by the model for the target variable of each observation.
decision_rr_RESPONSE The decision madeby the model indicating whether the customer should be contacted or not.
proba_decision_rr_RESPONSE The probability found by the model that the customer responds positively.
For this Scenario, you will extract the customers that you need to contact, that is who should respond positively to your campaign, from the rest of the table.
1. To Select the Customers to Contact:a. Create a new analytical data set, using the KXSCORE table as the data source main table.b. Add a filter on the field decision_rr_RESPONSE to select only the customers for which the decision
equals "true".c. Click the Next button.d. Save the data set as ADS_CustomersToContact.
The result of this selection is a table listing 2,583 customers to contact. You will now need to save this table in your database by using the Data Transfer feature.
2. To Save the Selected Data into a Table:a. Open the Data Transfer feature.b. Select the analytical data set ADS_CustomersToContact as data source.c. Click the Next button.d. Click the Analyze button to create the data description.e. Set the REFID variable as a key.f. Click the Next button.g. Name the name table CustomersToContact.h. Click the Next button.
According to the data mining model, all the customers contained in this table are the ones within your database who are the most likely to respond positively to the incentive mailing. With their ID, you can now use the Reference Data to extract their e-mail addresses and send them the incentive mailing.
6.2 Your Marketing and Sales Campaign: Wrap-Up
Two months after you sent the incentive mailings to your customers, you need to verify the efficiency of your campaign. To do this, you need to compare the actual responses of the customers with the ones predicted by the model that you used to target your incentive mailings.
Event Log Aggregation ScenarioStep 3 - Making a Decision and Taking Action P U B L I C 41

The actual responses of the customers are contained in the table Mailing3 and the list of customers that you contacted are contained in the table CustomersToContact (created using the Data Transfer feature). You will need to:
● First create an analytical data set merging the Mailing3 table and the CustomersToContact table.● Use the Descriptive Statistics feature to see the results.
To Merge the Tables Mailing3 and CustomersToContact:
1. In the Data Transformation section of the Start menu, click the option Define Data Set.2. In your data base, select the Mailing3 table as the data source.3. Click the Next button.4. In the Merge tab, select:
○ REFID as the Source Field○ CustomersToContact as the Target Table○ REFID as the Target Field
5. Click the button New Merge.6. In the Fields tab, check the Visibility option only for the field RESPONSE of the Mailing3 table and the field
decision_rr_RESPONSE of the CustomersToContact table.7. Create a filter to select all customers having actually responded positively to the mailing, that is, the
customers for which the field RESPONSE of the Mailing3 table equals true.8. Click the Next button.9. Save the analytical data set as KEL_ADS_CheckResults.
To Compare the Model to the Actual Results:10. In the Data Toolkit section of the Start menu, click the option Descriptive Statistics.11. Select KEL_ADS_CheckResults as the input data set.12. Click the Next button.13. Click the Analyze button to create the data description.14. Click the Next button.15. Do not select a target variable.16. Click the Next button.17. There are no estimators to define, click the Next button.18. Click the Generate button.
The data set contains 1809 records. Using the Automated Analytics model, you contacted 2,583 customers intending to hit at least 1667 responders and generate an income of $1,500,000.
Not only have you fulfilled your primary business objective, but you have also realized an unexpected profit margin. Knowing that the average income generated by each responder is $900, the model enabled you to generate a profit margin of $127,800 ($900 * 142 unexpected responders).
To finish up with this campaign, there is one last thing you need to do:
Let's celebrate all this with your boss!
42 P U B L I CEvent Log Aggregation Scenario
Step 3 - Making a Decision and Taking Action

Important Disclaimers and Legal Information
Coding SamplesAny software coding and/or code lines / strings ("Code") included in this documentation are only examples and are not intended to be used in a productive system environment. The Code is only intended to better explain and visualize the syntax and phrasing rules of certain coding. SAP does not warrant the correctness and completeness of the Code given herein, and SAP shall not be liable for errors or damages caused by the usage of the Code, unless damages were caused by SAP intentionally or by SAP's gross negligence.
AccessibilityThe information contained in the SAP documentation represents SAP's current view of accessibility criteria as of the date of publication; it is in no way intended to be a binding guideline on how to ensure accessibility of software products. SAP in particular disclaims any liability in relation to this document. This disclaimer, however, does not apply in cases of willful misconduct or gross negligence of SAP. Furthermore, this document does not result in any direct or indirect contractual obligations of SAP.
Gender-Neutral LanguageAs far as possible, SAP documentation is gender neutral. Depending on the context, the reader is addressed directly with "you", or a gender-neutral noun (such as "sales person" or "working days") is used. If when referring to members of both sexes, however, the third-person singular cannot be avoided or a gender-neutral noun does not exist, SAP reserves the right to use the masculine form of the noun and pronoun. This is to ensure that the documentation remains comprehensible.
Internet HyperlinksThe SAP documentation may contain hyperlinks to the Internet. These hyperlinks are intended to serve as a hint about where to find related information. SAP does not warrant the availability and correctness of this related information or the ability of this information to serve a particular purpose. SAP shall not be liable for any damages caused by the use of related information unless damages have been caused by SAP's gross negligence or willful misconduct. All links are categorized for transparency (see: http://help.sap.com/disclaimer).
Event Log Aggregation ScenarioImportant Disclaimers and Legal Information P U B L I C 43

go.sap.com/registration/contact.html
© 2017 SAP SE or an SAP affiliate company. All rights reserved.No part of this publication may be reproduced or transmitted in any form or for any purpose without the express permission of SAP SE or an SAP affiliate company. The information contained herein may be changed without prior notice.Some software products marketed by SAP SE and its distributors contain proprietary software components of other software vendors. National product specifications may vary.These materials are provided by SAP SE or an SAP affiliate company for informational purposes only, without representation or warranty of any kind, and SAP or its affiliated companies shall not be liable for errors or omissions with respect to the materials. The only warranties for SAP or SAP affiliate company products and services are those that are set forth in the express warranty statements accompanying such products and services, if any. Nothing herein should be construed as constituting an additional warranty.SAP and other SAP products and services mentioned herein as well as their respective logos are trademarks or registered trademarks of SAP SE (or an SAP affiliate company) in Germany and other countries. All other product and service names mentioned are the trademarks of their respective companies.Please see http://www.sap.com/corporate-en/legal/copyright/index.epx for additional trademark information and notices.