event visualisation tools at lep - core · event visualisation tools at lep ... have implemented...
TRANSCRIPT

Event visualisation tools at LEP
David McNally CERN, Geneva, SwitzerlandAbstract
This note reviews the main features of the event visualisation systems used by the four LEPcollaborations: ALEPH, DELPHI, L3 and OPAL.
Keywords: ALEPH, DELPHI, L3, OPAL, Event visualisation; GUI; Data abstraction
1 Introduction
In this review an attempt is made to describe the event visualisationsystems which were implementedand are used by the four experiments operating at the LEP collider at CERN. The discussion willfocus on the visualisation systems used during offline analysis, detector and reconstruction softwaredevelopment.During their design and commissioning phase all four LEP experiments (see section 2) recognised theneed for graphical visualisation systems of their detector and recorded event structures. Investinga large amount of manpower and financial resources each experiment proceeded to develop andimplement such visualisation systems. During this period there was virtually no discussion betweenthe different collaborations. In this light it is interesting to review how each collaborationaddressed theproblem of event visualisation and to compare in what respects the four independent solutions eitherdiverge or reflect common functionality. Further one may note that both design and implementationof the systems discussed herein was undertaken in the years 1988 to 1990 and, due to manpowerconstraints, these systems have not undergone fundamental redesign or reprogramming over the lastsix years. On the other hand a fair bit of effort has been invested by all four collaborations to improvetheir existing visualisation systems in view of user requests, improved functionality and reliability aswell as addressing new needs for physics analysis and reconstruction software development. Hencethe underlying philosophy as well as the functionality and features presented in this document reflectthe experience gained by many physicists actually using event visualisation systems during theirdaily work. As experimental high energy physics is currently venturing into a new era with theongoing development work for the two large LHC detectors, systems operating under conditionswhere event visualisationwill be essential for both detector understanding and physics interpretation,a review of proven visualisation tools may act as a starting point for the development challengesahead.This report is organised as follows: First a brief description of the four LEP experiments (section 2)will be presented. The requirements are outlined which need to be addressed when designing an eventvisualisation system (section 3). A discussion of the underlying philosophy and implementationchosen by each of the four LEP experiments (section 4) is followed by examples outlining some ofthe methods used for data representation, abstraction and analysis (section 5). Some final remarkswill then conclude this review.
2 The four LEP experiments
The four experiments taking data at the CERN Large Electron Positron collider (LEP), ALEPH [1],DELPHI [2], L3 [3] and OPAL [4] (figure 2), are situated at equidistant points along the 26.6 km LEPtunnel. Each experiment hasO(105) readout channels and�10 individual subdetectors, each withdifferent requirements concerning both detector and event visualisation. ALEPH and OPAL have asimilar layout with, following a line from the interaction point radially outwards, a tracking systemconsisting of a high precision microvertex detector complemented by gaseous tracking chambers.The tracking system is surrounded by an electromagnetic calorimeter followed by a solenoidal magnet

(ALEPH: superconductingcoil), a hadron calorimeter and muon chamber system. L3 differs from thisdesign by placing a similar set of detectors, complemented by a high precision muon spectrometer,entirely within a large conventional magnet of '13m diameter. The DELPHI detector is highlysegmented, both radially and along the beam axis, incorporating silicon microvertex, ring imagingcherenkov, drift and time projection chamber detectors and a superconducting solenoid placed infront of the hadron calorimeter and muon systems.In view of event visualisation these four detectors pose the following challenges and constraints:ALEPH: The very large (>3m diameter) tracking system delivers high precision measurements in allthree dimensions, complemented by powerful particle identification through dE/dx measurements.The calorimeters, on the other hand, have a relatively crude segmentation. Hence the main focus ofthe ALEPH visualisation system is aimed at obtaining good representations of the objects measuredin the tracker while reflecting calorimetric and muon chamber objects in a more abstracted form.DELPHI: Due to the complex and highly segmented detector, good representations of the individualsubdetectors is required. Particle identification and tagging of neutrals takes place independently inmany subdetectors requiring good three dimensional visualisation and powerful graphical abstrac-tions.L3: The very large detector with high precision tracking both close to the interaction point and in themuon spectrometer require powerful three dimensional visualisation tools enabling fast rotations,panning and zooming. The finely segmented calorimeters allow for individual energy measurementsof most particles in an event. This demands good visual abstractions of reconstructed calorimeterobjects enhanced by suitably chosen colour coding and cross referencing.OPAL: Poses similar visualisation challenges as the ALEPH detector.Contrary to hadron machines, LEP events are relatively simple, both in view of topology and mul-tiplicity. The events are free of irreducible backgrounds so that visualisation systems do not need todeal with high backgrounds which can confuse the view while carrying little essential information.
3 Event visualisation in HEP
3.1 Why visualise events
Human perception is mainly based on visual input as �80% of our brains raw processing power,dedicated to the treatment of sensoral input, is related to our vision. This, for example, is reflected inthe fact that we usually present physics results in the form of graphs and not tables of numbers which,for most of us, require a higher degree of concentration and reflection in order to make sense. An eventrecorded in our detectors constitutes a set of measurements, spatially correlated in three dimensions.So it lays in our nature to reflect this information in a form most suitable to our perception, that isin a view or picture. These views may contain representations of objects which we know from ourdaily experience, such as silicon wafers in a vertex detector, but also abstractions which have no realworld visible equivalent, such as temperature, high voltage status or the energy profile of a showerin a calorimeter. Hence event visualisation offers a direct and intuitive insight into the processestaking place in our detectors. Using visual abstractions which are carefully designed to convey thecorrect impression can save time during development and analysis work, be educational and fun.
3.2 Event visualisation requirements
The LEP collaborations designed their event visualisation programs with four main areas of use inmind:� Debugging the detector and monitoring its performance.� Assistance in the development of, and checking the reconstruction software.� Physics analysis.

DE
LPH
IV
erte
x D
etec
tor
Inne
r D
etec
tor
Tim
e P
roje
ctio
n C
ham
ber
Sm
all A
ngle
Tile
Cal
orim
eter
Ver
y S
mal
l Ang
le T
agge
r
Bea
m P
ipe
Qua
drup
ole
Bar
rel R
ICH
Out
er D
etec
tor
Hig
h D
ensi
ty P
roje
ctio
n C
ham
ber
Sup
erco
nduc
ting
Coi
l
Sci
ntill
ator
s
Bar
rel H
adro
n C
alor
imet
er
Bar
rel M
uon
Cha
mbe
rsF
orw
ard
Cha
mbe
r A
For
war
d R
ICH
For
war
d C
ham
ber
B
For
war
d E
M C
alor
imet
er
For
war
d H
adro
n C
alor
imet
er
For
war
d H
odos
cope
For
war
d M
uon
Cha
mbe
rs
Sur
roun
d M
uon
Cha
mbe
rs
Su
pp
ort
Tu
be
B G
O
L u m
i n o s
i t y M
o n i
t o r
H a d
r o n
C a l
o r i m
e t e r
V e r
t e x
C h a
m b e
r
e -
e +
Mag
net
Co
il
Mag
net
Yo
ke
Mu
on
Ch
amb
ers
Mag
net
Po
le
L3
Figure 1: Schematic views of the four LEP detectors.

� Education and generation of publication quality pictures.
These requirements demand a high degree of functional flexibility. In particular support for twoclasses of interactive operations should be provided which, following reference [5], will be termed:Local interactivity, that is operations acting directly on the view through low level graphics operationssuch as zooming, rotations and modifications of the display list. Global interactivity, comprising alloperations which affect or require information from the underlying event and detector data structures.Examples for global interactivity are: pick a set of hits in a tracker, refit the track and display theresult or regenerate the view highlighting objects which pass certain cuts specified through the userinterface. A system addressing the main areas of usage listed above should satisfy the followingfive requirements:
1 Access to event data, detector geometry and data bases:The program should have (in)direct access to the same data structures which are passed to, andgenerated by the reconstruction software. The views of the detector should reflect the actual position,geometry and status at the time the event was recorded. Only through access to the relevant databasescan detector monitoring functions be fully supported.
2 Access to functionality embedded in the reconstruction program:Together with point 1 this is an essential requirement in order to support global interactivity as definedabove.
3 Three dimensional rendering enhanced by a set of local interactive operations.This functionality enhances the intuitive impression through user controlled motion and selectionof the viewed objects. Special projection operations my be implemented aimed at enhancing certainfeatures of an event.
4 Variable levels of graphical data abstraction:Addressing the different situations for which the system will be used.
5 Support extensive cross referencing:To improve intuitive understanding it is useful to present the same information in different ways,for example as a graphics object in the view and as alphanumeric information on a separate screen.
4 Event visualisation systems design
One of the principal decisions to be taken during the early design phase of a visualisation system isthat of integrating it into the detector reconstruction. An integrated system offers many advantages:� Implicit access to the full functionality of the reconstruction program.� Easy access to event data, data base and detector geometry.� Any modification or improvement of the reconstruction software will automatically
propagate into the viewing system.These are to be compared with the advantages of implementing a stand alone system:� Flexibility during implementation and maintenance.� Relatively small program allowing for time saving development due to a rapid
compile-link-load cycle.� Inclusion of user specified code and graphics can be easily accomplished.� Good performance during execution.
Table 4 lists the design choices made by the four experiments together with the program namesand some references. Figures 3.2 and 2 show schematic flow charts of the L3Scan and DELGRAvisualisation systems. L3Scan is inherently tied into the reconstruction program with both the HIGZ[10] and KUIP [11] software packages acting as interface between the graphics system and thereconstruction. All data structures, including high level representations of the graphics objects andcross references to their parent event and database entries, are maintained using ZEBRA [12]. Thisallows for seamless handling of data throughout the program.

DatabaseEvent DataZEBRA
Detector Geometry GEANT
Reconstruction
Program
KUIPCommunication
MOTIFUser interface
WS window manager
‘X’ PHIGSLow level graphics
HIGZHigh level graphics
data - ZEBRAVisible object
ZEBRA
Figure 2: Program flow chart for the L3 visualisation system L3Scan.
Graphics
PHIGS
Screen &
Low level graphics
Mouse
Tracking &
Analysis code
High level
Communication &
Interface
Data/Geometry
User interface
repository
DELPHI event
Figure 3: Program flow chart for the DELPHI visualisation system DELGRA. The functionality shown to the
right of the dashed line is reproduced for each session of DELGRA while that to the left runs once per server.
The solid dashed line connecting the three top boxes represents the interprocess communication package.
Experiment Visualisation program Implementation Descriptionname
ALEPH DALI Stand alone [6]DELPHI DELGRA Stand alone [7]
L3 L3Scan Integrated [8]OPAL GROPE Integrated [9]
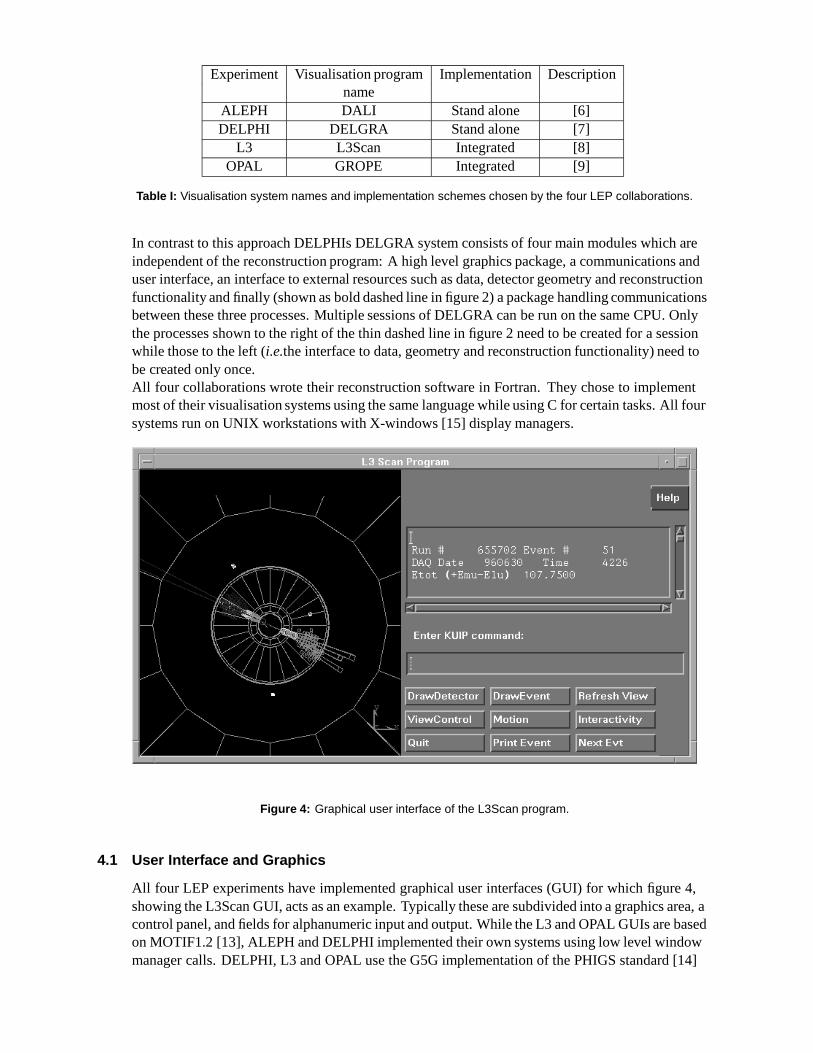
Table I: Visualisation system names and implementation schemes chosen by the four LEP collaborations.
In contrast to this approach DELPHIs DELGRA system consists of four main modules which areindependent of the reconstruction program: A high level graphics package, a communications anduser interface, an interface to external resources such as data, detector geometry and reconstructionfunctionality and finally (shown as bold dashed line in figure 2) a package handling communicationsbetween these three processes. Multiple sessions of DELGRA can be run on the same CPU. Onlythe processes shown to the right of the thin dashed line in figure 2 need to be created for a sessionwhile those to the left (i.e.the interface to data, geometry and reconstruction functionality) need tobe created only once.All four collaborations wrote their reconstruction software in Fortran. They chose to implementmost of their visualisation systems using the same language while using C for certain tasks. All foursystems run on UNIX workstations with X-windows [15] display managers.
Figure 4: Graphical user interface of the L3Scan program.
4.1 User Interface and Graphics
All four LEP experiments have implemented graphical user interfaces (GUI) for which figure 4,showing the L3Scan GUI, acts as an example. Typically these are subdivided into a graphics area, acontrol panel, and fields for alphanumeric input and output. While the L3 and OPAL GUIs are basedon MOTIF1.2 [13], ALEPH and DELPHI implemented their own systems using low level windowmanager calls. DELPHI, L3 and OPAL use the G5G implementation of the PHIGS standard [14]
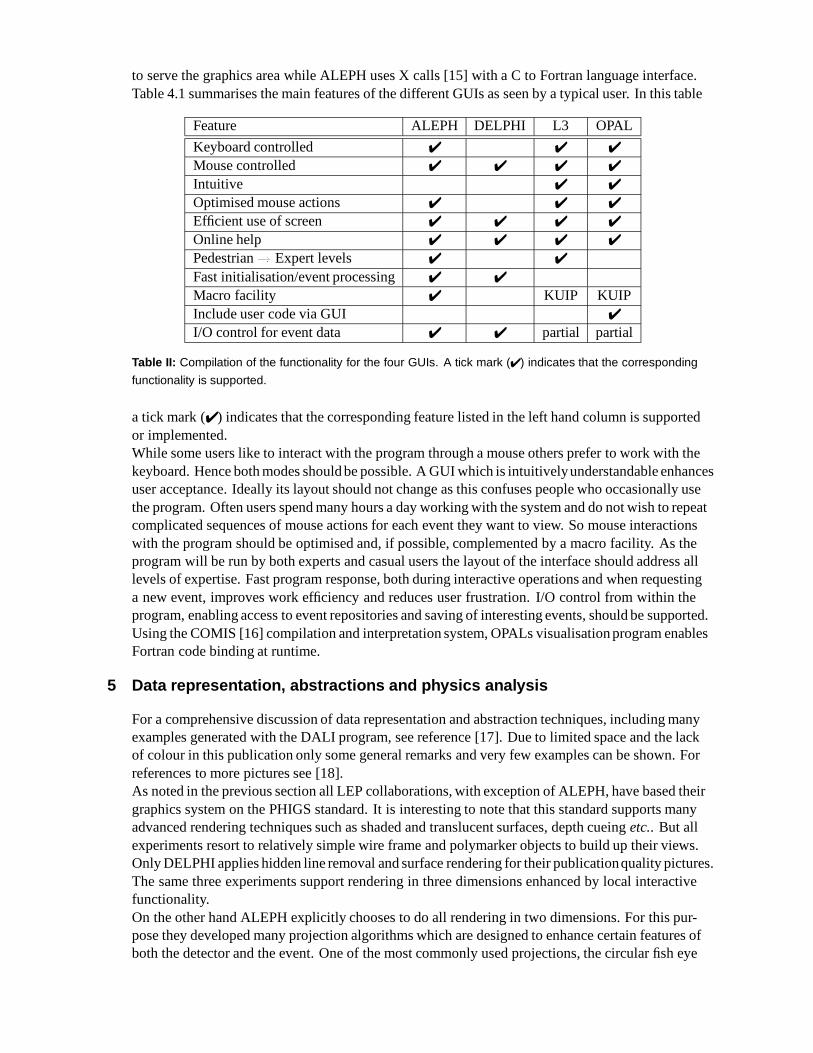
to serve the graphics area while ALEPH uses X calls [15] with a C to Fortran language interface.Table 4.1 summarises the main features of the different GUIs as seen by a typical user. In this table
Feature ALEPH DELPHI L3 OPAL
Keyboard controlled ✔ ✔ ✔
Mouse controlled ✔ ✔ ✔ ✔
Intuitive ✔ ✔
Optimised mouse actions ✔ ✔ ✔
Efficient use of screen ✔ ✔ ✔ ✔
Online help ✔ ✔ ✔ ✔
Pedestrian! Expert levels ✔ ✔
Fast initialisation/event processing ✔ ✔
Macro facility ✔ KUIP KUIPInclude user code via GUI ✔
I/O control for event data ✔ ✔ partial partial
Table II: Compilation of the functionality for the four GUIs. A tick mark (✔) indicates that the corresponding
functionality is supported.
a tick mark (✔) indicates that the corresponding feature listed in the left hand column is supportedor implemented.While some users like to interact with the program through a mouse others prefer to work with thekeyboard. Hence both modes should be possible. A GUI which is intuitivelyunderstandable enhancesuser acceptance. Ideally its layout should not change as this confuses people who occasionally usethe program. Often users spend many hours a day working with the system and do not wish to repeatcomplicated sequences of mouse actions for each event they want to view. So mouse interactionswith the program should be optimised and, if possible, complemented by a macro facility. As theprogram will be run by both experts and casual users the layout of the interface should address alllevels of expertise. Fast program response, both during interactive operations and when requestinga new event, improves work efficiency and reduces user frustration. I/O control from within theprogram, enabling access to event repositories and saving of interesting events, should be supported.Using the COMIS [16] compilation and interpretation system, OPALs visualisation program enablesFortran code binding at runtime.
5 Data representation, abstractions and physics analysis
For a comprehensive discussion of data representation and abstraction techniques, including manyexamples generated with the DALI program, see reference [17]. Due to limited space and the lackof colour in this publication only some general remarks and very few examples can be shown. Forreferences to more pictures see [18].As noted in the previous section all LEP collaborations, with exception of ALEPH, have based theirgraphics system on the PHIGS standard. It is interesting to note that this standard supports manyadvanced rendering techniques such as shaded and translucent surfaces, depth cueing etc.. But allexperiments resort to relatively simple wire frame and polymarker objects to build up their views.Only DELPHI applies hidden line removal and surface rendering for their publicationquality pictures.The same three experiments support rendering in three dimensions enhanced by local interactivefunctionality.On the other hand ALEPH explicitly chooses to do all rendering in two dimensions. For this pur-pose they developed many projection algorithms which are designed to enhance certain features ofboth the detector and the event. One of the most commonly used projections, the circular fish eye

DALI
Run=15768 Evt=5906 ALEPH
Figure 5: Event displays generated by the DALI program showing the effect of the fish eye transformation
as described in the text.
Run # 655702 Event # 132
Transverse Imbalance : Longitudinal Imbalance :
Thrust : Major : Minor :
Event DAQ Time :
Total Energy : 27.02 GeV
.2688 -.1740
.9282 .2803 .0426
960630 4243
Run : even t 7402 : 203918 Da t e 960808 T ime 31751 Ebeam 80 . 500 Ev i s 80 . 1 Emi ss 80 . 9 V t x ( 0 . 00 , 0 . 00 , 0 . 00 ) Bz=4 . 028 Bunch l e t 1 / 2 Th r us t =0 . 9659 Ap l an=0 . 0009 Ob l a t =0 . 1844 Sphe r =0 . 0649
C t r k (N= 2 Sump= 71 . 9 ) Eca l (N= 9 SumE= 49 . 9 ) Hca l (N= 3 SumE= 5 . 1 ) Muon (N= 1 ) Sec V t x (N= 0 ) Fde t (N= 0 SumE= 0 . 0 )
y
x
x - y v i ew
Ph i =204 .
z
S i de v i ew - p l ane o f Th r us t ax i s
Ph i =114 .
zS i de v i ew - p l ane pe r p . t o Th r us t
Figure 6: On the left: Event display generated by the L3Scan program showing a cosmic muon traversing
the entire detector. This picture underlines the power of a true three dimensional representation. On the right:
Three views of an OPAL e+e�
! =Z! WW ! e�e��� event. The orientation of the side views are chosen
to lay in (top) and perpendicular to (bottom) the event thrust axis direction.
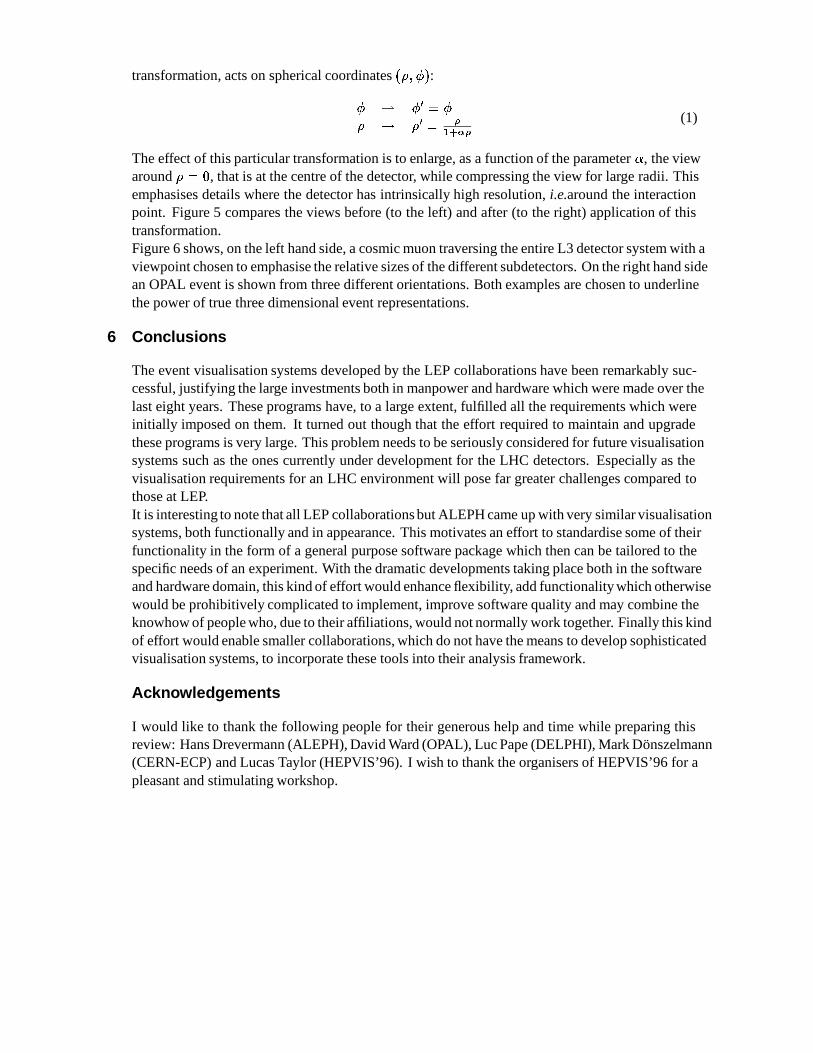
transformation, acts on spherical coordinates (�; �):
� ! �0 = �
� ! �0 = �
1+��
(1)
The effect of this particular transformation is to enlarge, as a function of the parameter �, the viewaround � = 0, that is at the centre of the detector, while compressing the view for large radii. Thisemphasises details where the detector has intrinsically high resolution, i.e.around the interactionpoint. Figure 5 compares the views before (to the left) and after (to the right) application of thistransformation.Figure 6 shows, on the left hand side, a cosmic muon traversing the entire L3 detector system with aviewpoint chosen to emphasise the relative sizes of the different subdetectors. On the right hand sidean OPAL event is shown from three different orientations. Both examples are chosen to underlinethe power of true three dimensional event representations.
6 Conclusions
The event visualisation systems developed by the LEP collaborations have been remarkably suc-cessful, justifying the large investments both in manpower and hardware which were made over thelast eight years. These programs have, to a large extent, fulfilled all the requirements which wereinitially imposed on them. It turned out though that the effort required to maintain and upgradethese programs is very large. This problem needs to be seriously considered for future visualisationsystems such as the ones currently under development for the LHC detectors. Especially as thevisualisation requirements for an LHC environment will pose far greater challenges compared tothose at LEP.It is interesting to note that all LEP collaborations but ALEPH came up with very similar visualisationsystems, both functionally and in appearance. This motivates an effort to standardise some of theirfunctionality in the form of a general purpose software package which then can be tailored to thespecific needs of an experiment. With the dramatic developments taking place both in the softwareand hardware domain, this kind of effort would enhance flexibility, add functionality which otherwisewould be prohibitively complicated to implement, improve software quality and may combine theknowhow of people who, due to their affiliations, would not normally work together. Finally this kindof effort would enable smaller collaborations, which do not have the means to develop sophisticatedvisualisation systems, to incorporate these tools into their analysis framework.
Acknowledgements
I would like to thank the following people for their generous help and time while preparing thisreview: Hans Drevermann (ALEPH), David Ward (OPAL), Luc Pape (DELPHI), Mark Donszelmann(CERN-ECP) and Lucas Taylor (HEPVIS’96). I wish to thank the organisers of HEPVIS’96 for apleasant and stimulating workshop.

References
1 ALEPH Collab., D. Decamp et al., Nucl. Instr. Meth. A294 121 (1990)2 DELPHI Collab., P. Aarnio et al., Nucl. Instr. Meth. A303 233 (1991)3 L3 Collab., B. Adeva et al., Nucl. Instr. Meth. A289 35 (1990)4 OPAL Collab., K. Ahmet et al., Nucl. Instr. Meth. A305 275 (1991)
P. P. Allport et al., Nucl. Instr. Meth. A324 34 (1993)5 H. Stone, Event visualisation – a physicists perspective, these proceedings.6 H. Drevermann and C. Grab, Graphical Concepts For The Representation Of Events in
High Energy Physics, Int. J. Mod. Phys. C, 1 (1990) 147 - 163.C. Grab, DALI - Event Display User’s Guide, ALEPH internal note,contact [email protected] and visithttp://axaonl.cern.ch:8000/disk$user/cattaneo/work/bookreader/ALL_10.HTML
7 D. Bertrand et al., DELGRA - DELPHI Graphics for interactive Event Viewing UserManual, DELPHI internal note (1996), contact: [email protected]. Bertrand, L. Pape, Track analysis and Graphics Package, DELPHI internal note 87-95PROG-98 (1992)
8 D. McNally, A users guide to the L3 scan program, L3 internal note 1985 (1996),http://wwwcn.cern.ch/~dmcnally/doc/l3scan.ps.Z (340 kB).
9 D. Ward, J. Banks, A GRope Primer, OPAL internal note GR202 (1995)contact [email protected]
10 HIGZ: CERN program library long writeup Q120, Y251 (1994).11 KUIP: CERN program library long writeup I102 (1993).12 ZEBRA: CERN program library long writeup Q100, Q101 (1995).13 MOTIF: D.Heller & P.M.Ferguson, Motif Programming Manual, O’Reilly & Assocs.
(1994).14 PHIGS implementation used by the LEP collaborations from: G5G S.A., Chateau
Rouquey, BP 168, 33708 Merignac Cedex, France.PHIGS: T.Gaskins, PHIGS Programming Manual, O’Reilly & Assocs. (1992).PHIGS Standard: ISO/IEC 9592-1,2,3:1989(E), 9593:1998(E).
15 X: A. Ney & T. O’Reilly, X Toolkit Intrinsics Programming Manual, OSF/Motif1.2Edition, O’Reilly & Assocs. (1992).
16 COMIS: CERN program library long writeup L210 (1993).17 H. Drevermann, D. Kuhn and B.S. Nilsson, Event Display: Can we see what we want to
see?, CERN/ECP95-25 (1995).18 ALEPH: http://alephwww.cern.ch/DALI/dali_form.html
DELPHI:http://delonline.cern.ch/delphi$www/public/das/events_at_161_gev.html
L3: http://hpl3sn02.cern.ch/160GeV.htmlOPAL: http://www.cern.ch/Opal/events/opalpics.html