everi lp 5.8 - s1.q4cdn.coms1.q4cdn.com/401000259/files/doc_presentations/2018/investor... ·...
TRANSCRIPT

Investor Presentation Results of Operations
For the period ended March 31, 2018
Forward-Looking Statements; Non-GAAP Financial Measures
This presentation contains “forward-looking” statements within the meaning of Section 27A of the Securities Act of 1933, as amended (the “Securities Act”), Section 21E of the Securities Exchange Act of 1934, as amended (the “Exchange Act”), and the Private Securities Litigation Reform Act of 1995. From time to time, we also provide forward-looking statements in other materials we release to the public, as well as oral forward-looking statements. We have tried, wherever possible, to identify such statements by using words such as “anticipate,” “believe,” “expect,” “intend,” “estimate,” “project,” “may,” “should,” “will,” “likely,” “will likely result,” “will continue,” “future,” “plan,” “target,” “forecast,” “goal,” “observe,” “seek,” “strategy” and other words and terms of similar meaning.
Forward-looking statements are neither historical facts nor assurances of future performance. Instead, they are based only on our current beliefs, expectations and assumptions regarding the future of our business, future plans and strategies, projections, anticipated events and trends, the economy and other future conditions. Because forward-looking statements relate to the future, they are subject to inherent risks, uncertainties and change in circumstances that are often difficult to predict and many of which are beyond our control. Our actual results and financial condition may differ materially from those indicated in forward-looking statements. Important factors that could cause our actual results and financial condition to differ materially from those indicated in the forward-looking statements include, without limitation, our history of net losses and our ability to generate profits in the future; our substantial leverage and our ability to raise additional capital to fund operations; our ability to generate sufficient cash to service all of our indebtedness and fund working capital and capital expenditures; restrictions under our indebtedness; our ability to compete in the gaming industry; the impact of changes in Federal corporate tax laws; our ability to maintain our current customers; our ability to generate profits in the future; our ability to execute on mergers, acquisitions and/or strategic alliances, including our ability to integrate and operate such acquisitions consistent with our forecasts; expectations regarding our existing and future installed base and win per day; expectations regarding development and placement fee arrangements; inaccuracies in underlying operating assumptions; expectations regarding customers’ preferences and demands for future gaming offerings; expectations regarding our product portfolio; the overall growth of the gaming industry, if any; our ability to replace revenue associated with terminated contracts; margin degradation from contract renewals; our ability to comply with the Europay, MasterCard and Visa global standard for cards equipped with security chip technology; our ability to introduce new products and services, including third-party licensed content; gaming establishment and patron preferences; expenditures and product development; anticipated sales performance; employee turnover; national and international economic conditions; changes in gaming regulatory, card association and statutory requirements; regulatory and licensing difficulties; competitive pressures; operational limitations; gaming market contraction; changes to tax laws; uncertainty of litigation outcomes; interest rate fluctuations; business prospects; unanticipated expenses or capital needs; technological obsolescence; and those other risks and uncertainties discussed in our most recent Annual Report on Form 10-K filed with the U.S. Securities and Exchange Commission. In light of these risks and uncertainties, there can be no assurance that the forward-looking information contained in this presentation will in fact transpire or prove to be accurate. Readers are cautioned to not to place undue reliance on the forward-looking statements contained herein, which are based only on information currently available to us and speak only as of the date hereof.
Additional Notes
This presentation contains industry market data, industry forecasts and other statistical information. Such information has been obtained from publicly available information and industry publications. Everi has not independently verified such information and makes no representations as to the accuracy of such information.
Non-GAAP Financial Measures
In order to enhance investor understanding of the underlying trends in our business and to provide for better comparability between periods in different years, we are providing in this presentation Adjusted EBITDA and Adjusted EBITDA Margin, which are not measures of our financial performance or position under United States Generally Accepted Accounting Principles (“GAAP”). Accordingly, these measures should not be considered in isolation or as a substitute for, and should be read in conjunction with, our net income (loss), operating income (loss), basic or diluted earnings (loss) per share and cash flow data prepared in accordance with GAAP. Everi defines Adjusted EBITDA as earnings (loss) before interest, loss on extinguishment of debt, taxes, depreciation and amortization, non-cash stock compensation expense, goodwill impairment charges, accretion of contract rights, separation costs related to the Company’s former CEO, non-cash write-down of note receivable and warrant, loss on the sale of aircraft, manufacturing relocation costs, acquisition and other costs related to mergers and purchase accounting adjustments less a benefit from one-time legal settlement proceeds. Everi presents Adjusted EBITDA as it uses this measure to manage its business and considers this measure to be supplemental to its operating performance. Everi also makes certain compensation decisions based, in part, on its operating performance, as measured by Adjusted EBITDA; and its credit facility and senior unsecured notes require Everi to comply with a consolidated secured leverage ratio that includes performance metrics substantially similar to Adjusted EBITDA. We define Adjusted EBITDA Margin as Adjusted EBITDA divided by revenues. A reconciliation of Everi’s most directly comparable GAAP measure to Adjusted EBITDA and Adjusted EBITDA Margin is included in Everi’s earning releases located on Everi’s website at ir.everi.com. Additionally, a reconciliation of each segment’s operating income (loss) to Adjusted EBITDA is also included. On a segment level, operating income (loss) per GAAP, rather than net earnings (loss) per GAAP, is reconciled to Adjusted EBITDA as Everi does not report net earnings (loss) by segment. In addition, Adjusted EBITDA Margin is provided on a segment level. Management believes that this presentation is meaningful to investors in evaluating the performance of Everi’s segments.
Disclaimer
2

Everi is a transformative industry force, delivering innovative products and
services that enhance the casino experience
3
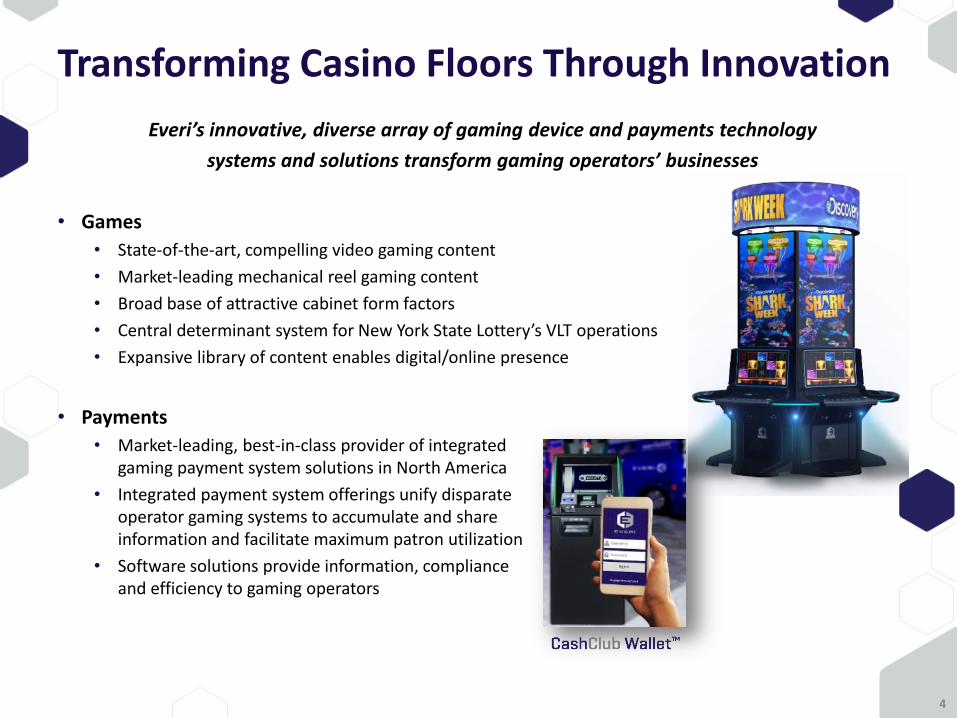
Transforming Casino Floors Through Innovation
Everi’s innovative, diverse array of gaming device and payments technology
systems and solutions transform gaming operators’ businesses
• Games
• State-of-the-art, compelling video gaming content
• Market-leading mechanical reel gaming content
• Broad base of attractive cabinet form factors
• Central determinant system for New York State Lottery’s VLT operations
• Expansive library of content enables digital/online presence
• Payments
• Market-leading, best-in-class provider of integrated gaming payment system solutions in North America
• Integrated payment system offerings unify disparate operator gaming systems to accumulate and share information and facilitate maximum patron utilization
• Software solutions provide information, compliance and efficiency to gaming operators
4
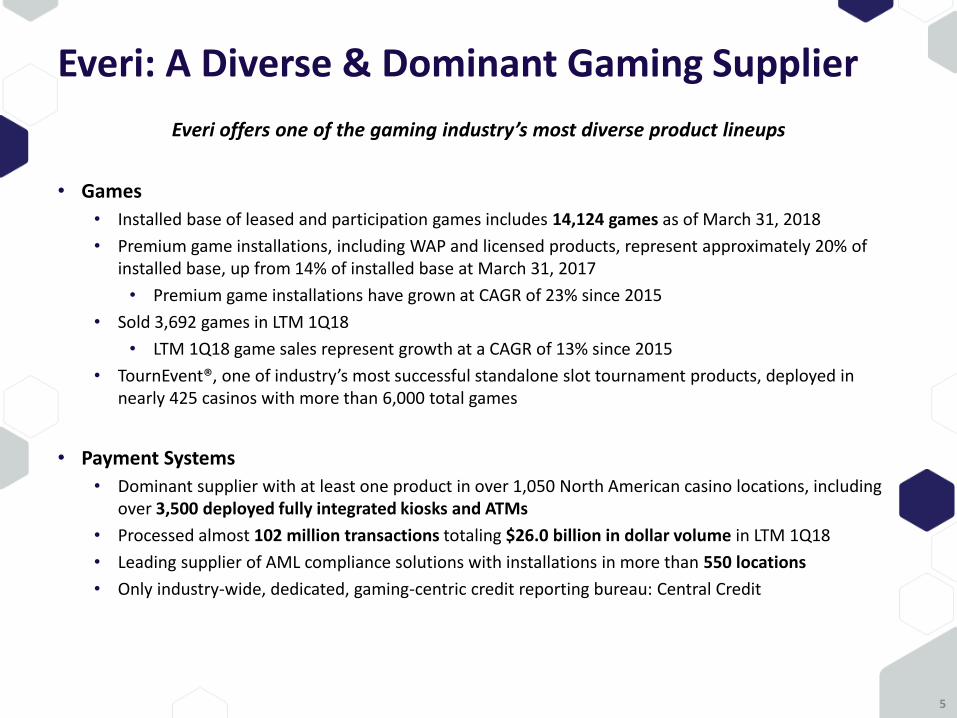
Everi: A Diverse & Dominant Gaming Supplier
Everi offers one of the gaming industry’s most diverse product lineups
• Games
• Installed base of leased and participation games includes 14,124 games as of March 31, 2018
• Premium game installations, including WAP and licensed products, represent approximately 20% of installed base, up from 14% of installed base at March 31, 2017
• Premium game installations have grown at CAGR of 23% since 2015
• Sold 3,692 games in LTM 1Q18
• LTM 1Q18 game sales represent growth at a CAGR of 13% since 2015
• TournEvent®, one of industry’s most successful standalone slot tournament products, deployed in nearly 425 casinos with more than 6,000 total games
• Payment Systems
• Dominant supplier with at least one product in over 1,050 North American casino locations, including over 3,500 deployed fully integrated kiosks and ATMs
• Processed almost 102 million transactions totaling $26.0 billion in dollar volume in LTM 1Q18
• Leading supplier of AML compliance solutions with installations in more than 550 locations
• Only industry-wide, dedicated, gaming-centric credit reporting bureau: Central Credit
5
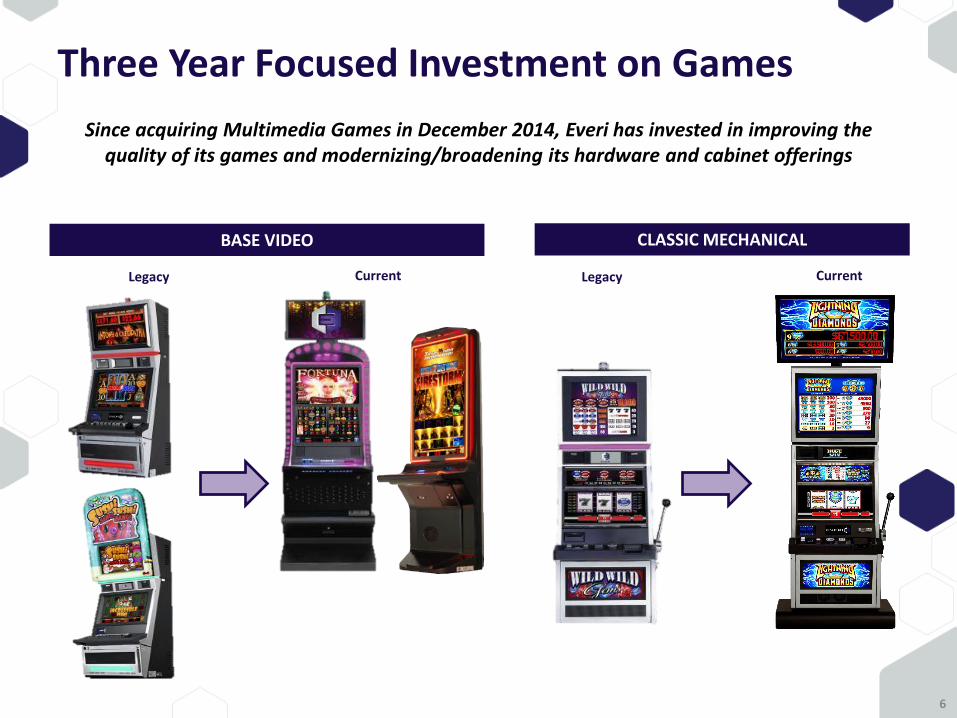
Three Year Focused Investment on Games
Since acquiring Multimedia Games in December 2014, Everi has invested in improving the quality of its games and modernizing/broadening its hardware and cabinet offerings
6
Legacy Current
BASE VIDEO CLASSIC MECHANICAL
Legacy Current
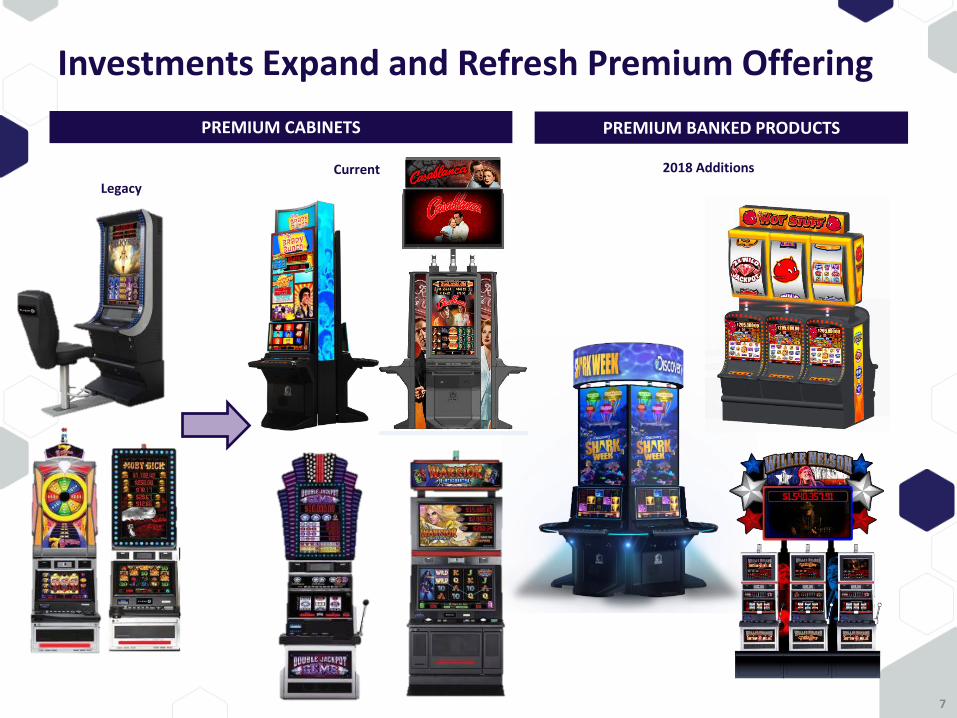
Investments Expand and Refresh Premium Offering
7
Legacy
Current 2018 Additions
PREMIUM CABINETS PREMIUM BANKED PRODUCTS
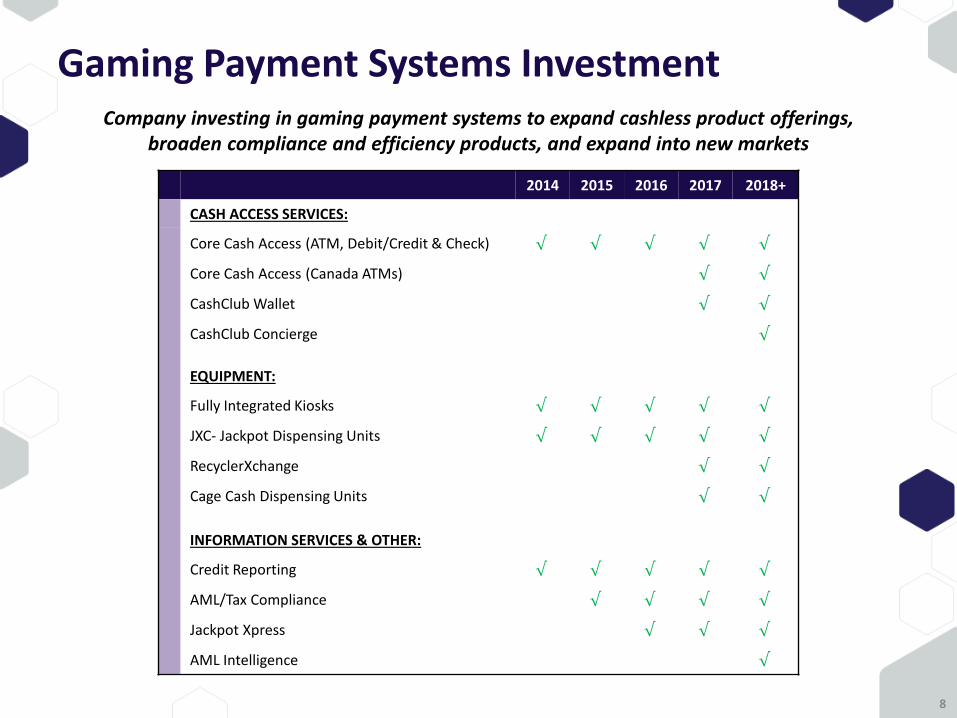
Gaming Payment Systems Investment
2014 2015 2016 2017 2018+
CASH ACCESS SERVICES:
Core Cash Access (ATM, Debit/Credit & Check) √ √ √ √ √
Core Cash Access (Canada ATMs) √ √
CashClub Wallet √ √
CashClub Concierge √
EQUIPMENT:
Fully Integrated Kiosks √ √ √ √ √
JXC- Jackpot Dispensing Units √ √ √ √ √
RecyclerXchange √ √
Cage Cash Dispensing Units √ √
INFORMATION SERVICES & OTHER:
Credit Reporting √ √ √ √ √
AML/Tax Compliance √ √ √ √
Jackpot Xpress √ √ √
AML Intelligence √
8
Company investing in gaming payment systems to expand cashless product offerings, broaden compliance and efficiency products, and expand into new markets

Business Overview
9
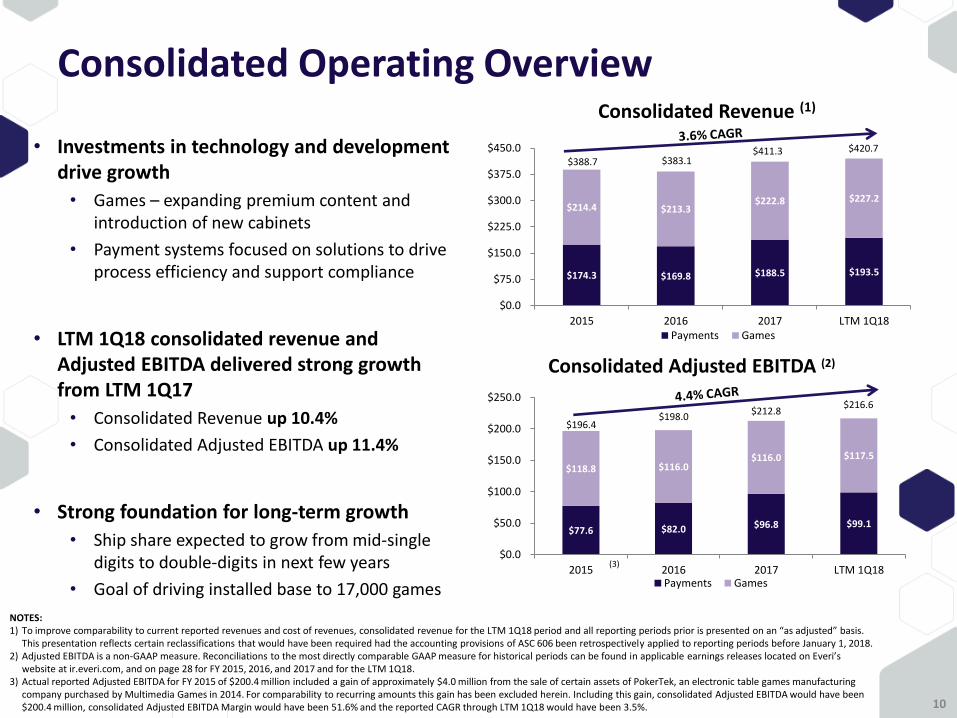
Consolidated Operating Overview
• Investments in technology and development drive growth
• Games – expanding premium content and introduction of new cabinets
• Payment systems focused on solutions to drive process efficiency and support compliance
• LTM 1Q18 consolidated revenue and Adjusted EBITDA delivered strong growth from LTM 1Q17
• Consolidated Revenue up 10.4%
• Consolidated Adjusted EBITDA up 11.4%
• Strong foundation for long-term growth
• Ship share expected to grow from mid-single digits to double-digits in next few years
• Goal of driving installed base to 17,000 games
$174.3 $169.8 $188.5 $193.5
$214.4 $213.3 $222.8 $227.2
$0.0
$75.0
$150.0
$225.0
$300.0
$375.0
$450.0
2015 2016 2017 LTM 1Q18
Consolidated Revenue (1)
Payments Games
$77.6 $82.0 $96.8 $99.1
$118.8 $116.0 $116.0 $117.5
$0.0
$50.0
$100.0
$150.0
$200.0
$250.0
2015 2016 2017 LTM 1Q18
Consolidated Adjusted EBITDA (2)
Payments Games
10
NOTES: 1) To improve comparability to current reported revenues and cost of revenues, consolidated revenue for the LTM 1Q18 period and all reporting periods prior is presented on an “as adjusted” basis.
This presentation reflects certain reclassifications that would have been required had the accounting provisions of ASC 606 been retrospectively applied to reporting periods before January 1, 2018. 2) Adjusted EBITDA is a non-GAAP measure. Reconciliations to the most directly comparable GAAP measure for historical periods can be found in applicable earnings releases located on Everi’s
website at ir.everi.com, and on page 28 for FY 2015, 2016, and 2017 and for the LTM 1Q18. 3) Actual reported Adjusted EBITDA for FY 2015 of $200.4 million included a gain of approximately $4.0 million from the sale of certain assets of PokerTek, an electronic table games manufacturing
company purchased by Multimedia Games in 2014. For comparability to recurring amounts this gain has been excluded herein. Including this gain, consolidated Adjusted EBITDA would have been $200.4 million, consolidated Adjusted EBITDA Margin would have been 51.6% and the reported CAGR through LTM 1Q18 would have been 3.5%.
(3)
$196.4 $198.0
$212.8 $216.6
$420.7 $411.3 $383.1 $388.7
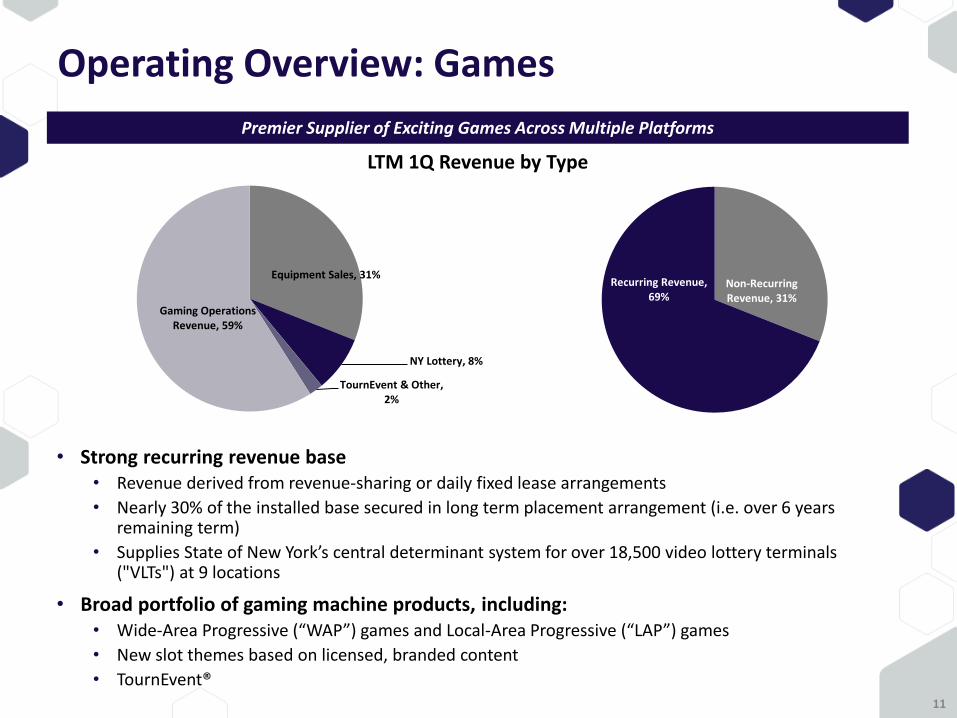
Operating Overview: Games
• Strong recurring revenue base • Revenue derived from revenue-sharing or daily fixed lease arrangements
• Nearly 30% of the installed base secured in long term placement arrangement (i.e. over 6 years remaining term)
• Supplies State of New York’s central determinant system for over 18,500 video lottery terminals ("VLTs") at 9 locations
• Broad portfolio of gaming machine products, including: • Wide-Area Progressive (“WAP”) games and Local-Area Progressive (“LAP”) games
• New slot themes based on licensed, branded content
• TournEvent®
Premier Supplier of Exciting Games Across Multiple Platforms
11
Non-Recurring Revenue, 31%
Recurring Revenue, 69%
Equipment Sales, 31%
NY Lottery, 8%
TournEvent & Other, 2%
Gaming Operations Revenue, 59%
LTM 1Q Revenue by Type
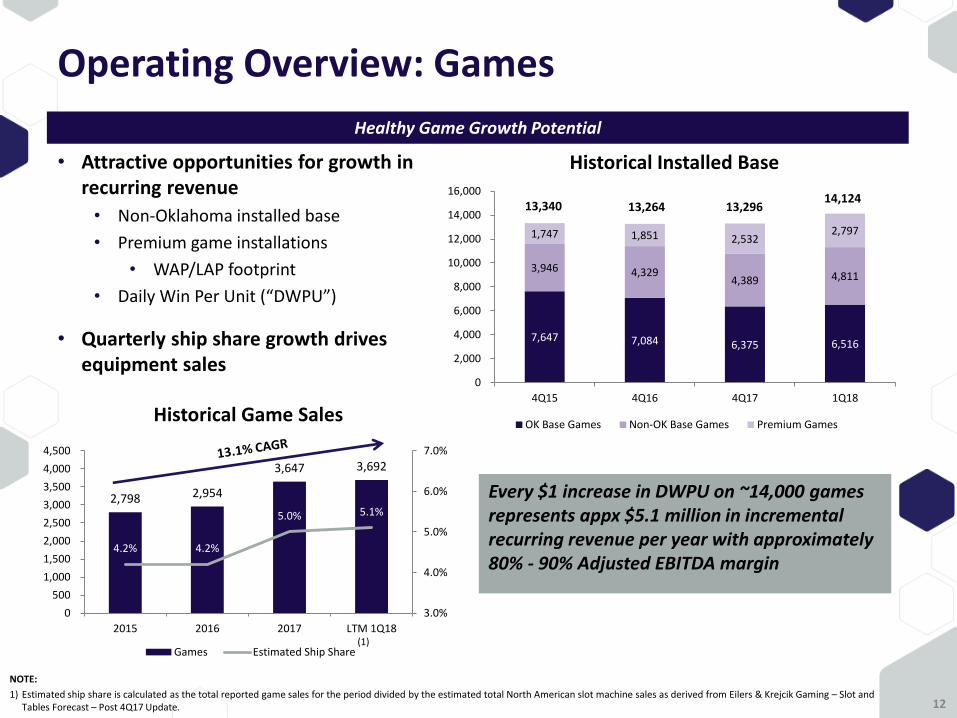
7,647 7,084 6,375 6,516
3,946 4,329 4,389 4,811
1,747 1,851 2,532 2,797
0
2,000
4,000
6,000
8,000
10,000
12,000
14,000
16,000
4Q15 4Q16 4Q17 1Q18
Historical Installed Base
OK Base Games Non-OK Base Games Premium Games
Operating Overview: Games
12
Healthy Game Growth Potential
• Attractive opportunities for growth in recurring revenue
• Non-Oklahoma installed base
• Premium game installations
• WAP/LAP footprint
• Daily Win Per Unit (“DWPU”)
• Quarterly ship share growth drives equipment sales
2,798 2,954
3,647 3,692
4.2% 4.2%
5.0% 5.1%
3.0%
4.0%
5.0%
6.0%
7.0%
0
500
1,000
1,500
2,000
2,500
3,000
3,500
4,000
4,500
2015 2016 2017 LTM 1Q18
Historical Game Sales
Games Estimated Ship Share
13,264 13,340 13,296 14,124
(1)
NOTE:
1) Estimated ship share is calculated as the total reported game sales for the period divided by the estimated total North American slot machine sales as derived from Eilers & Krejcik Gaming – Slot and Tables Forecast – Post 4Q17 Update.
Every $1 increase in DWPU on ~14,000 games represents appx $5.1 million in incremental recurring revenue per year with approximately 80% - 90% Adjusted EBITDA margin
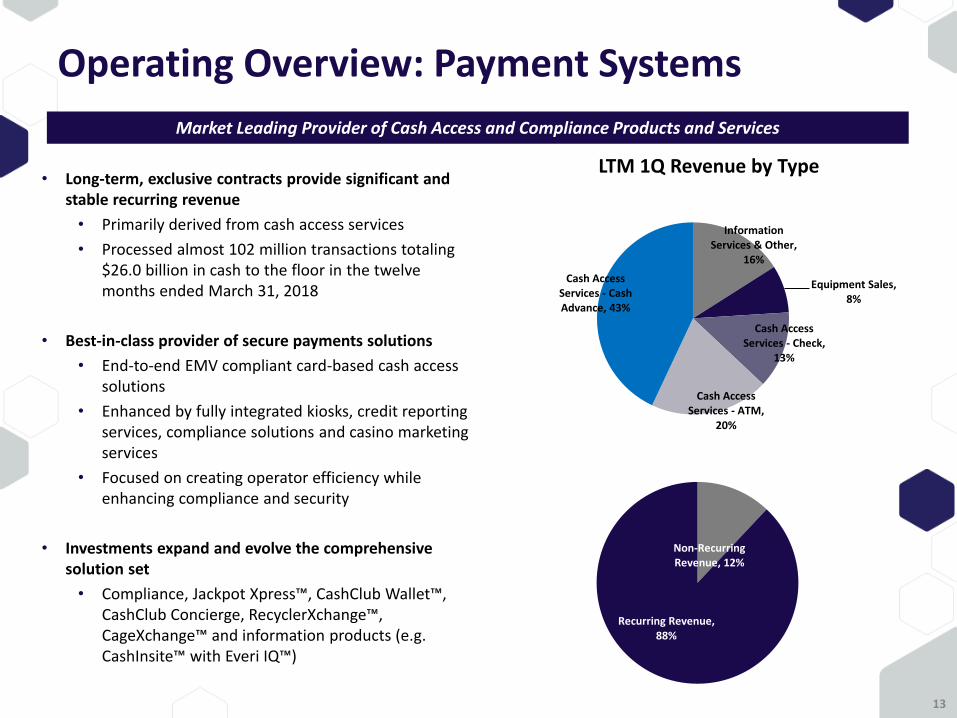
Operating Overview: Payment Systems
• Long-term, exclusive contracts provide significant and stable recurring revenue
• Primarily derived from cash access services
• Processed almost 102 million transactions totaling $26.0 billion in cash to the floor in the twelve months ended March 31, 2018
• Best-in-class provider of secure payments solutions
• End-to-end EMV compliant card-based cash access solutions
• Enhanced by fully integrated kiosks, credit reporting services, compliance solutions and casino marketing services
• Focused on creating operator efficiency while enhancing compliance and security
• Investments expand and evolve the comprehensive solution set
• Compliance, Jackpot Xpress™, CashClub Wallet™, CashClub Concierge, RecyclerXchange™, CageXchange™ and information products (e.g. CashInsite™ with Everi IQ™)
Market Leading Provider of Cash Access and Compliance Products and Services
13
Non-Recurring Revenue, 12%
Recurring Revenue, 88%
Information Services & Other,
16%
Equipment Sales, 8%
Cash Access Services - Check,
13%
Cash Access Services - ATM,
20%
Cash Access Services - Cash Advance, 43%
LTM 1Q Revenue by Type

What Makes Everi Different?
14
What Makes Everi Different?
• Diverse solution set offers more innovative gaming technology than any other provider • Full-scale games portfolio alongside full array of gaming payment systems offerings
• Focus on less traditional markets • Class II tribal gaming market
• Tournament
• Casino-specific payments systems and solutions
• Market presence expansion enhances growth opportunities • Class III tribal market
• Class III commercial gaming market
• Wide-Area Progressive and Local Area Progressive
• International opportunities (South America, Asia, Europe, Australia)
• Payments expansion (Canada ATM)
• Integrated payments offerings • Everi is the ONLY gaming supplier with an integrated suite of gaming-specific payments system
solutions
• Investments aimed at driving technology leadership
15
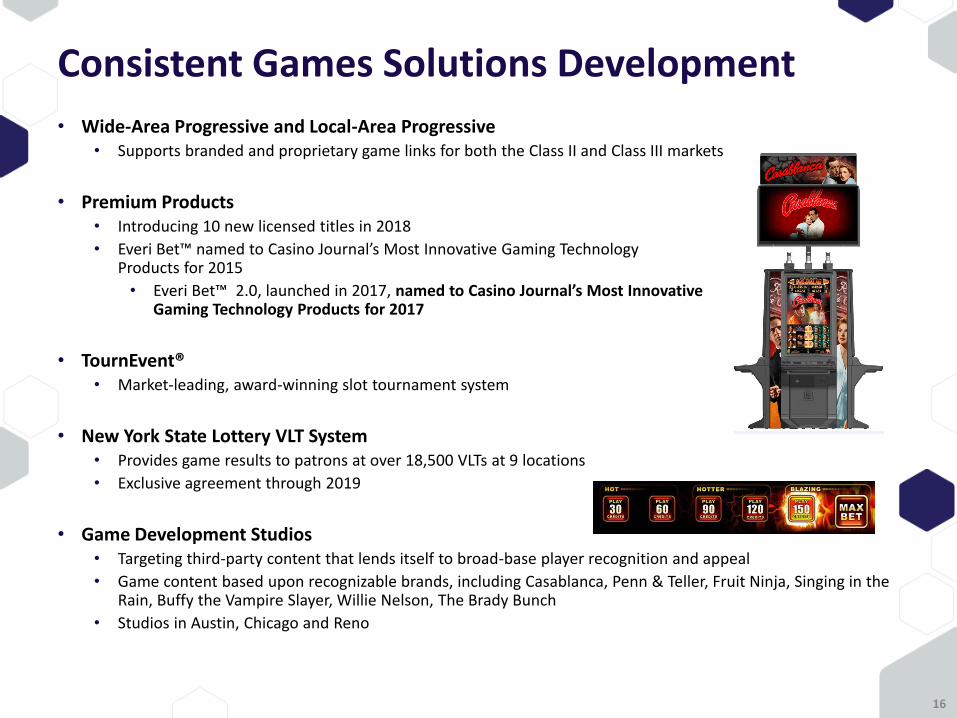
Consistent Games Solutions Development
• Wide-Area Progressive and Local-Area Progressive • Supports branded and proprietary game links for both the Class II and Class III markets
• Premium Products • Introducing 10 new licensed titles in 2018
• Everi Bet™ named to Casino Journal’s Most Innovative Gaming Technology Products for 2015
• Everi Bet™ 2.0, launched in 2017, named to Casino Journal’s Most Innovative Gaming Technology Products for 2017
• TournEvent® • Market-leading, award-winning slot tournament system
• New York State Lottery VLT System • Provides game results to patrons at over 18,500 VLTs at 9 locations
• Exclusive agreement through 2019
• Game Development Studios • Targeting third-party content that lends itself to broad-base player recognition and appeal
• Game content based upon recognizable brands, including Casablanca, Penn & Teller, Fruit Ninja, Singing in the Rain, Buffy the Vampire Slayer, Willie Nelson, The Brady Bunch
• Studios in Austin, Chicago and Reno
16
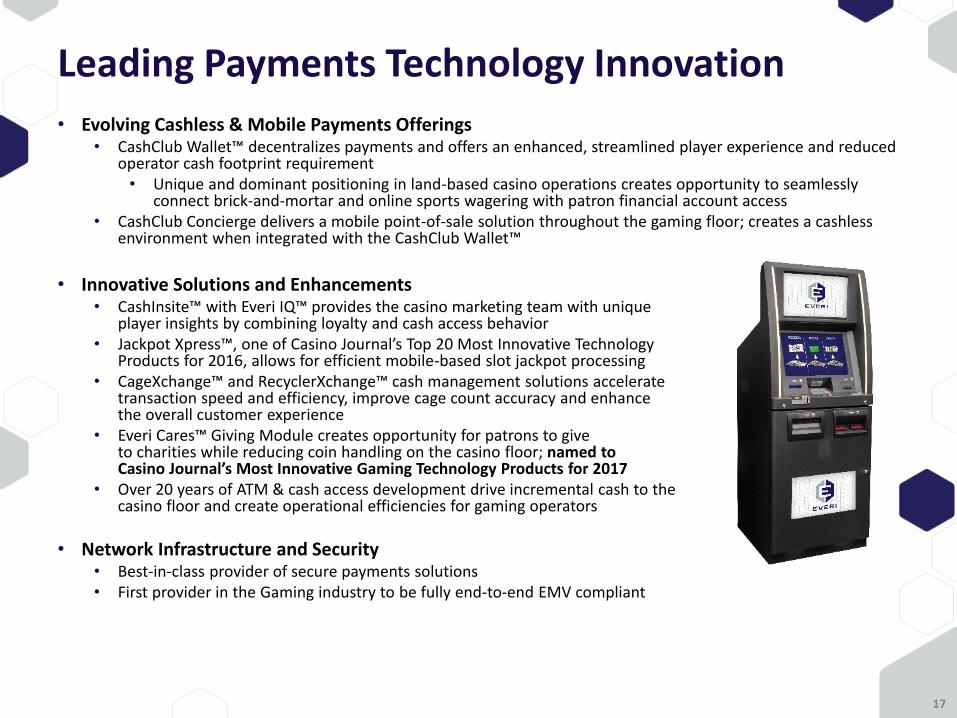
Leading Payments Technology Innovation
• Evolving Cashless & Mobile Payments Offerings • CashClub Wallet™ decentralizes payments and offers an enhanced, streamlined player experience and reduced
operator cash footprint requirement • Unique and dominant positioning in land-based casino operations creates opportunity to seamlessly
connect brick-and-mortar and online sports wagering with patron financial account access • CashClub Concierge delivers a mobile point-of-sale solution throughout the gaming floor; creates a cashless
environment when integrated with the CashClub Wallet™
• Innovative Solutions and Enhancements
• CashInsite™ with Everi IQ™ provides the casino marketing team with unique player insights by combining loyalty and cash access behavior
• Jackpot Xpress™, one of Casino Journal’s Top 20 Most Innovative Technology Products for 2016, allows for efficient mobile-based slot jackpot processing
• CageXchange™ and RecyclerXchange™ cash management solutions accelerate transaction speed and efficiency, improve cage count accuracy and enhance the overall customer experience
• Everi Cares™ Giving Module creates opportunity for patrons to give to charities while reducing coin handling on the casino floor; named to Casino Journal’s Most Innovative Gaming Technology Products for 2017
• Over 20 years of ATM & cash access development drive incremental cash to the casino floor and create operational efficiencies for gaming operators
• Network Infrastructure and Security • Best-in-class provider of secure payments solutions • First provider in the Gaming industry to be fully end-to-end EMV compliant
17

Financials
18
Key Recent Highlights & Wins
• Sold 1,063 games in 1Q18; two consecutive years of quarterly Y/Y game sales growth • Sold 3,647 games in FY 2017, up 23.5% Y/Y
• Sold 3,692 games in LTM 1Q18, up 4.3% Y/Y
• Payments revenue and Adjusted EBITDA(1) up in 1Q18 for eighth consecutive quarter • 14th consecutive quarter of growth in same-store transactions and dollars processed
• Signed long-term game placement agreement with largest customer in OK in July 2017 • Covers approximately 4,300 Class II games for 83 months
• $10.0 million cash payment made in August 2017; $5.6 million in quarterly cash payments for placement fees began in January 2018 and will continue through July 2019
• Represents approximately 30% of total current installed base
• Launched Casablanca and Penn & Teller games for Class II WAP link and Class III LAP in 2017 • Over 400 games with WAP and LAP connected titles deployed as of March 31, 2018
• Introduced additional licensed Class II and Class III video and mechanical reel WAP content in 1H18 • Titles include The Brady Bunch, Buffy the Vampire Slayer, Willie Nelson’s Shotgun Willie and Willie
Nelson’s Whiskey River
19
NOTE:
1) Adjusted EBITDA is a non-GAAP measure. Reconciliation to the most directly comparable GAAP measure can be found in applicable earnings releases located on Everi's website at ir.everi.com for historical periods and page 28 for FY 2015, 2016, and 2017 and for the LTM 1Q18.
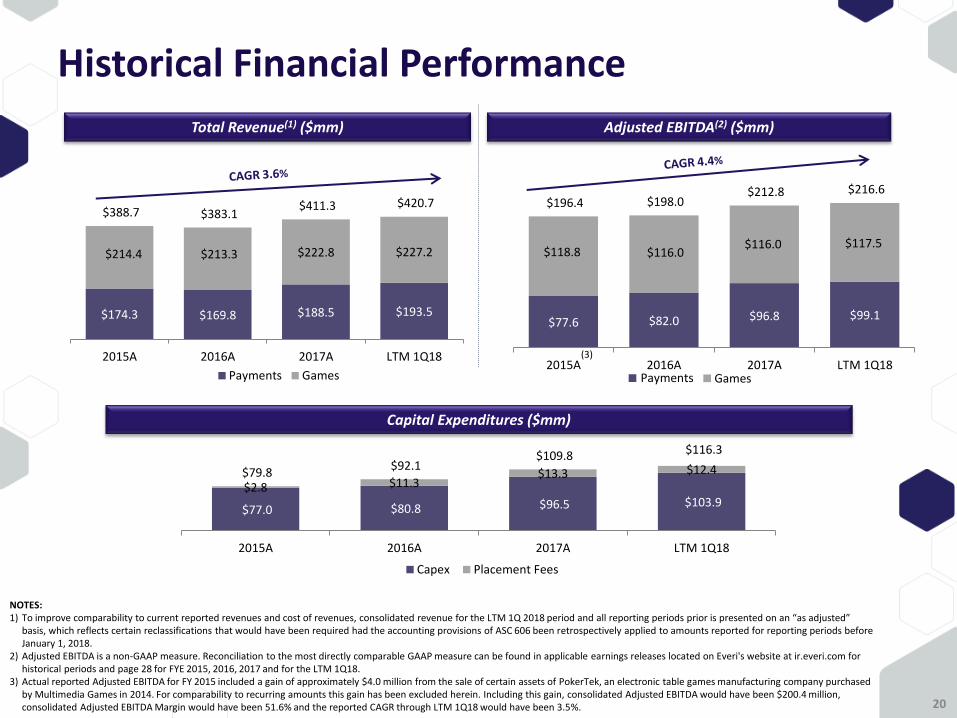
$77.6 $82.0 $96.8 $99.1
$118.8 $116.0 $116.0 $117.5
$196.4 $198.0 $212.8 $216.6
2015A 2016A 2017A LTM 1Q18
Historical Financial Performance
Adjusted EBITDA(2) ($mm) Total Revenue(1) ($mm)
$174.3 $169.8 $188.5 $193.5
$214.4 $213.3 $222.8 $227.2
$388.7 $383.1 $411.3 $420.7
2015A 2016A 2017A LTM 1Q18
Payments Games Payments Games
(3)
Capital Expenditures ($mm)
$77.0 $80.8 $96.5 $103.9 $2.8 $11.3
$13.3 $12.4 $79.8 $92.1
$109.8 $116.3
2015A 2016A 2017A LTM 1Q18
Capex Placement Fees
NOTES: 1) To improve comparability to current reported revenues and cost of revenues, consolidated revenue for the LTM 1Q 2018 period and all reporting periods prior is presented on an “as adjusted”
basis, which reflects certain reclassifications that would have been required had the accounting provisions of ASC 606 been retrospectively applied to amounts reported for reporting periods before January 1, 2018.
2) Adjusted EBITDA is a non-GAAP measure. Reconciliation to the most directly comparable GAAP measure can be found in applicable earnings releases located on Everi's website at ir.everi.com for historical periods and page 28 for FYE 2015, 2016, 2017 and for the LTM 1Q18.
3) Actual reported Adjusted EBITDA for FY 2015 included a gain of approximately $4.0 million from the sale of certain assets of PokerTek, an electronic table games manufacturing company purchased by Multimedia Games in 2014. For comparability to recurring amounts this gain has been excluded herein. Including this gain, consolidated Adjusted EBITDA would have been $200.4 million, consolidated Adjusted EBITDA Margin would have been 51.6% and the reported CAGR through LTM 1Q18 would have been 3.5%. 20
Current Capitalization
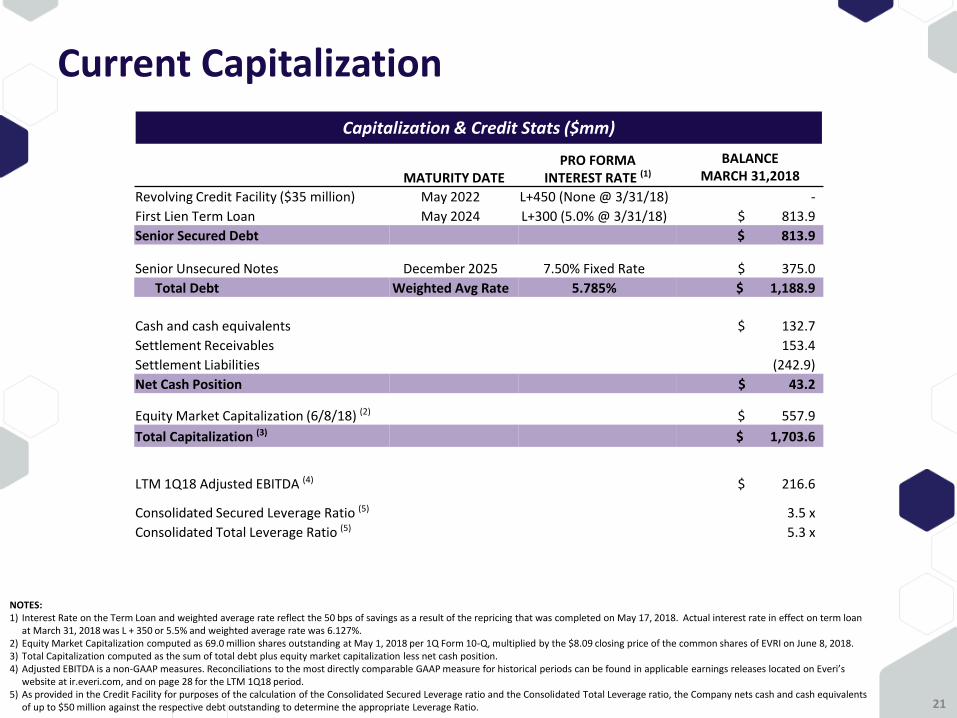
Capitalization & Credit Stats ($mm)
21
MATURITY DATE
PRO FORMA INTEREST RATE (1)
BALANCE MARCH 31,2018
Revolving Credit Facility ($35 million) May 2022 L+450 (None @ 3/31/18) -
First Lien Term Loan May 2024 L+300 (5.0% @ 3/31/18) $ 813.9
Senior Secured Debt $ 813.9
Senior Unsecured Notes December 2025 7.50% Fixed Rate $ 375.0
Total Debt Weighted Avg Rate 5.785% $ 1,188.9
Cash and cash equivalents $ 132.7
Settlement Receivables 153.4
Settlement Liabilities (242.9)
Net Cash Position $ 43.2
Equity Market Capitalization (6/8/18) (2) $ 557.9
Total Capitalization (3) $ 1,703.6
LTM 1Q18 Adjusted EBITDA (4) $ 216.6
Consolidated Secured Leverage Ratio (5) 3.5 x
Consolidated Total Leverage Ratio (5) 5.3 x
NOTES: 1) Interest Rate on the Term Loan and weighted average rate reflect the 50 bps of savings as a result of the repricing that was completed on May 17, 2018. Actual interest rate in effect on term loan
at March 31, 2018 was L + 350 or 5.5% and weighted average rate was 6.127%. 2) Equity Market Capitalization computed as 69.0 million shares outstanding at May 1, 2018 per 1Q Form 10-Q, multiplied by the $8.09 closing price of the common shares of EVRI on June 8, 2018. 3) Total Capitalization computed as the sum of total debt plus equity market capitalization less net cash position. 4) Adjusted EBITDA is a non-GAAP measures. Reconciliations to the most directly comparable GAAP measure for historical periods can be found in applicable earnings releases located on Everi’s
website at ir.everi.com, and on page 28 for the LTM 1Q18 period. 5) As provided in the Credit Facility for purposes of the calculation of the Consolidated Secured Leverage ratio and the Consolidated Total Leverage ratio, the Company nets cash and cash equivalents
of up to $50 million against the respective debt outstanding to determine the appropriate Leverage Ratio.
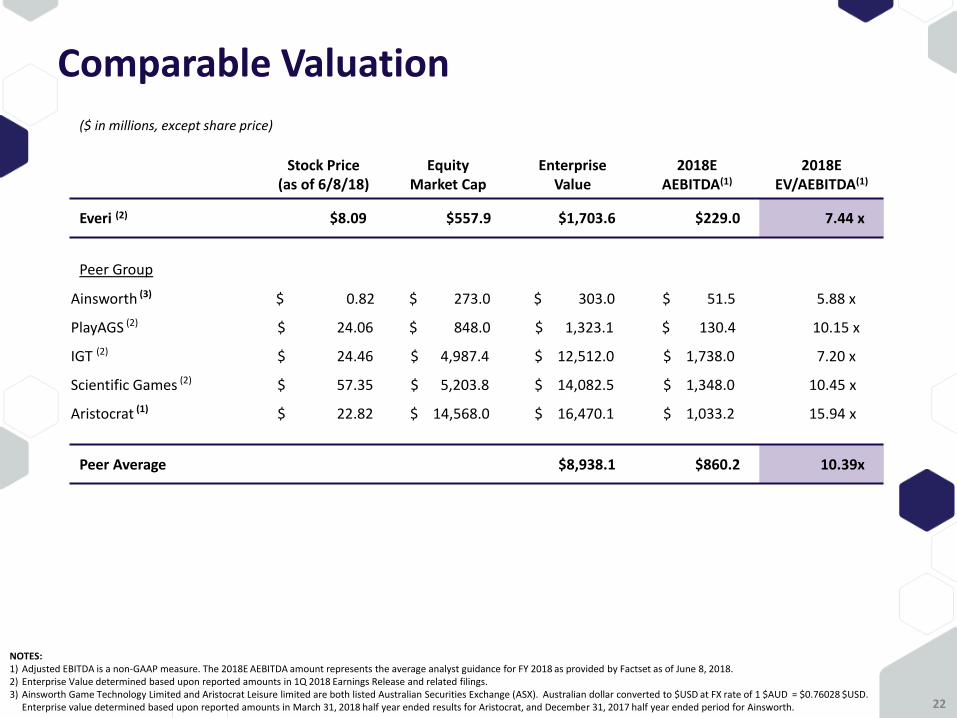
Comparable Valuation
($ in millions, except share price)
Stock Price (as of 6/8/18)
Equity Market Cap
Enterprise Value
2018E AEBITDA(1)
2018E EV/AEBITDA(1)
Everi (2) $8.09 $557.9 $1,703.6 $229.0 7.44 x
Peer Group
Ainsworth (3) $ 0.82 $ 273.0 $ 303.0 $ 51.5 5.88 x
PlayAGS (2) $ 24.06 $ 848.0 $ 1,323.1 $ 130.4 10.15 x
IGT (2) $ 24.46 $ 4,987.4 $ 12,512.0 $ 1,738.0 7.20 x
Scientific Games (2) $ 57.35 $ 5,203.8 $ 14,082.5 $ 1,348.0 10.45 x
Aristocrat (1) $ 22.82 $ 14,568.0 $ 16,470.1 $ 1,033.2 15.94 x
Peer Average $8,938.1 $860.2 10.39x
22
NOTES: 1) Adjusted EBITDA is a non-GAAP measure. The 2018E AEBITDA amount represents the average analyst guidance for FY 2018 as provided by Factset as of June 8, 2018. 2) Enterprise Value determined based upon reported amounts in 1Q 2018 Earnings Release and related filings. 3) Ainsworth Game Technology Limited and Aristocrat Leisure limited are both listed Australian Securities Exchange (ASX). Australian dollar converted to $USD at FX rate of 1 $AUD = $0.76028 $USD.
Enterprise value determined based upon reported amounts in March 31, 2018 half year ended results for Aristocrat, and December 31, 2017 half year ended period for Ainsworth.
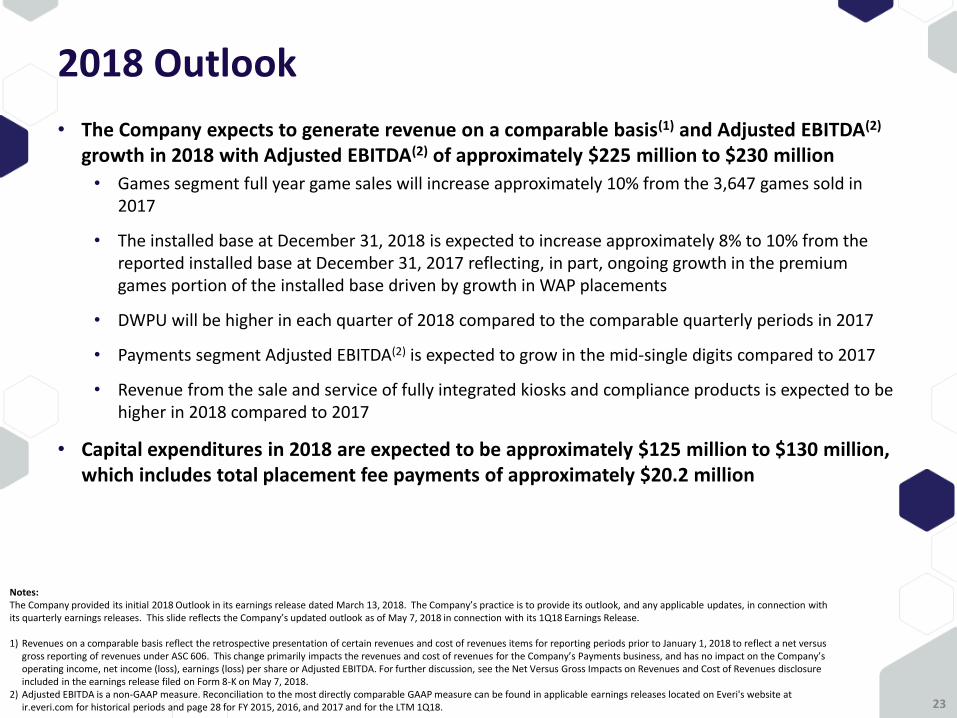
2018 Outlook
• The Company expects to generate revenue on a comparable basis(1) and Adjusted EBITDA(2) growth in 2018 with Adjusted EBITDA(2) of approximately $225 million to $230 million
• Games segment full year game sales will increase approximately 10% from the 3,647 games sold in 2017
• The installed base at December 31, 2018 is expected to increase approximately 8% to 10% from the reported installed base at December 31, 2017 reflecting, in part, ongoing growth in the premium games portion of the installed base driven by growth in WAP placements
• DWPU will be higher in each quarter of 2018 compared to the comparable quarterly periods in 2017
• Payments segment Adjusted EBITDA(2) is expected to grow in the mid-single digits compared to 2017
• Revenue from the sale and service of fully integrated kiosks and compliance products is expected to be higher in 2018 compared to 2017
• Capital expenditures in 2018 are expected to be approximately $125 million to $130 million, which includes total placement fee payments of approximately $20.2 million
23
Notes: The Company provided its initial 2018 Outlook in its earnings release dated March 13, 2018. The Company’s practice is to provide its outlook, and any applicable updates, in connection with its quarterly earnings releases. This slide reflects the Company’s updated outlook as of May 7, 2018 in connection with its 1Q18 Earnings Release.
1) Revenues on a comparable basis reflect the retrospective presentation of certain revenues and cost of revenues items for reporting periods prior to January 1, 2018 to reflect a net versus
gross reporting of revenues under ASC 606. This change primarily impacts the revenues and cost of revenues for the Company’s Payments business, and has no impact on the Company’s operating income, net income (loss), earnings (loss) per share or Adjusted EBITDA. For further discussion, see the Net Versus Gross Impacts on Revenues and Cost of Revenues disclosure included in the earnings release filed on Form 8-K on May 7, 2018.
2) Adjusted EBITDA is a non-GAAP measure. Reconciliation to the most directly comparable GAAP measure can be found in applicable earnings releases located on Everi's website at ir.everi.com for historical periods and page 28 for FY 2015, 2016, and 2017 and for the LTM 1Q18.

Investment Highlights
24
Diverse Portfolio of Gaming Solutions 1
Robust Recurring Revenue Base 2
Growing Game Sales 3
Dominant Payments Market Position 4
Path To FCF Growth 5
• Provides diverse, growing portfolio of gaming device and payments technology solutions
• Installed base of approximately 14,125 recurring revenue games • Signed long-term placement agreement with largest customer for ~4,300 games in 3Q17
• Extended agreement to provide central determinant system to NY Lottery to 2019
• Strong portfolio of proprietary and branded Class II and Class III content • Game sales up Y/Y for eight consecutive quarters
• Clear gaming industry payments solutions leader • Best-in-class offerings drive efficiency and enhance customer experience
• Improving operating results • Refinancing transactions have reduced annual cash interest expense approximately $16 million at 1Q18 ending rates • Front-loaded quarterly placement agreement payments of $5.6 million conclude in 3Q19

Q&A
25

Appendix
26
Non-GAAP Financial Measures
In order to enhance investor understanding of the underlying trends in our business, our cash balance and cash available for our operating needs, and to provide for better comparability between periods in different years, we are providing in this investor presentation Adjusted EBITDA and Adjusted EBITDA Margin, which are not measures of our financial performance or position under United States Generally Accepted Accounting Principles (“GAAP”). Accordingly, these measures should not be considered in isolation nor as a substitute for, and should be read in conjunction with, our net earnings (loss), operating income (loss), basic or diluted earnings (loss) per share and cash flow data prepared in accordance with GAAP, with respect to Adjusted EBITDA and Adjusted EBITDA Margin.
We define Adjusted EBITDA as earnings (loss) before interest, taxes, loss on extinguishment of debt, depreciation and amortization, non-cash stock compensation expense, goodwill impairment, accretion of contract rights, separation costs related to the Company’s former CEO, write-down of note receivable and warrant, loss on sale of the aircraft, manufacturing relocation costs, acquisition expenses, other merger related costs and purchase accounting adjustments, and non-recurring gain on the sale of PokerTek assets . We present Adjusted EBITDA as we use this measure to manage our business and consider this measure to be supplemental to our operating performance. We also make certain compensation decisions based, in part, on our operating performance, as measured by Adjusted EBITDA; and our current credit facility and existing senior unsecured notes require us to comply with a consolidated secured leverage ratio that includes performance metrics substantially similar to Adjusted EBITDA. We define Adjusted EBITDA Margin as Adjusted EBITDA divided by revenues.
A reconciliation of the Company’s net loss per GAAP to Adjusted EBITDA is included in the Unaudited Reconciliation of Net Loss to EBITDA and Adjusted EBITDA provided at the end of this investor presentation. Additionally, a reconciliation of each segment’s operating income to Adjusted EBITDA for the LTM 1Q18 is also included. On a segment level, operating income (loss) per GAAP, rather than net earnings (loss) per GAAP, is reconciled to Adjusted EBITDA as the Company does not report net earnings (loss) by segment. Management believes that this presentation is meaningful to investors in evaluating the performance of the Company’s segments.
27
NOTE:
1) EBITDA and Adjusted EBITDA are non-GAAP measures. Reconciliation to the most directly comparable GAAP measure can be found in applicable earnings releases located on Everi's website at ir.everi.com for historical periods and above.
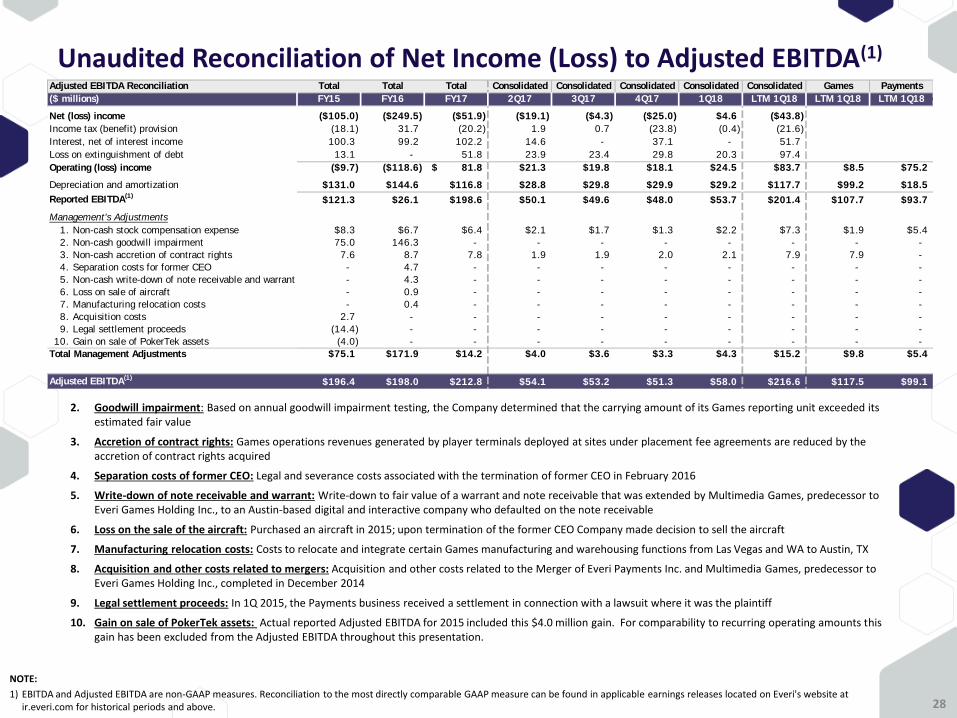
2. Goodwill impairment: Based on annual goodwill impairment testing, the Company determined that the carrying amount of its Games reporting unit exceeded its estimated fair value
3. Accretion of contract rights: Games operations revenues generated by player terminals deployed at sites under placement fee agreements are reduced by the accretion of contract rights acquired
4. Separation costs of former CEO: Legal and severance costs associated with the termination of former CEO in February 2016
5. Write-down of note receivable and warrant: Write-down to fair value of a warrant and note receivable that was extended by Multimedia Games, predecessor to Everi Games Holding Inc., to an Austin-based digital and interactive company who defaulted on the note receivable
6. Loss on the sale of the aircraft: Purchased an aircraft in 2015; upon termination of the former CEO Company made decision to sell the aircraft
7. Manufacturing relocation costs: Costs to relocate and integrate certain Games manufacturing and warehousing functions from Las Vegas and WA to Austin, TX
8. Acquisition and other costs related to mergers: Acquisition and other costs related to the Merger of Everi Payments Inc. and Multimedia Games, predecessor to Everi Games Holding Inc., completed in December 2014
9. Legal settlement proceeds: In 1Q 2015, the Payments business received a settlement in connection with a lawsuit where it was the plaintiff
10. Gain on sale of PokerTek assets: Actual reported Adjusted EBITDA for 2015 included this $4.0 million gain. For comparability to recurring operating amounts this gain has been excluded from the Adjusted EBITDA throughout this presentation.
Unaudited Reconciliation of Net Income (Loss) to Adjusted EBITDA(1)
28
Adjusted EBITDA Reconciliation Total Total Total Consolidated Consolidated Consolidated Consolidated Consolidated Games Payments
($ millions) FY15 FY16 FY17 2Q17 3Q17 4Q17 1Q18 LTM 1Q18 LTM 1Q18 LTM 1Q18
Net (loss) income ($105.0) ($249.5) ($51.9) ($19.1) ($4.3) ($25.0) $4.6 ($43.8)
Income tax (benefit) provision (18.1) 31.7 (20.2) 1.9 0.7 (23.8) (0.4) (21.6)
Interest, net of interest income 100.3 99.2 102.2 14.6 - 37.1 - 51.7
Loss on extinguishment of debt 13.1 - 51.8 23.9 23.4 29.8 20.3 97.4
Operating (loss) income ($9.7) ($118.6) 81.8$ $21.3 $19.8 $18.1 $24.5 $83.7 $8.5 $75.2
Depreciation and amortization $131.0 $144.6 $116.8 $28.8 $29.8 $29.9 $29.2 $117.7 $99.2 $18.5
Reported EBITDA(1)
$121.3 $26.1 $198.6 $50.1 $49.6 $48.0 $53.7 $201.4 $107.7 $93.7
Management's Adjustments
1. Non-cash stock compensation expense $8.3 $6.7 $6.4 $2.1 $1.7 $1.3 $2.2 $7.3 $1.9 $5.4
2. Non-cash goodwill impairment 75.0 146.3 - - - - - - - -
3. Non-cash accretion of contract rights 7.6 8.7 7.8 1.9 1.9 2.0 2.1 7.9 7.9 -
4. Separation costs for former CEO - 4.7 - - - - - - - -
5. Non-cash write-down of note receivable and warrant - 4.3 - - - - - - - -
6. Loss on sale of aircraft - 0.9 - - - - - - - -
7. Manufacturing relocation costs - 0.4 - - - - - - - -
8. Acquisition costs 2.7 - - - - - - - - -
9. Legal settlement proceeds (14.4) - - - - - - - - -
10. Gain on sale of PokerTek assets (4.0) - - - - - - - - -
Total Management Adjustments $75.1 $171.9 $14.2 $4.0 $3.6 $3.3 $4.3 $15.2 $9.8 $5.4
Adjusted EBITDA(1)
$196.4 $198.0 $212.8 $54.1 $53.2 $51.3 $58.0 $216.6 $117.5 $99.1