everyone counts planning for patients 2013-14 · pdf fileeveryone counts: planning for...
TRANSCRIPT

Everyone Counts: Planning for Patients 2013/14 Technical Definitions

Everyone Counts: Planning for Patients 2013/14 Technical Definitions
2
Everyone Counts: Planning for Patients 2013/14 Technical Definitions First published: 21 December 2012 Second publication: 4 April 2013
Prepared by: Analytical Service (Operations)
Contact: [email protected]

Everyone Counts: Planning for Patients 2013/14 Technical Definitions
3
Amendment History: Version Date Line Amendment History
First 21-12-2012
Original
Second 04-04-2013
CB_A1 Combined into one line Denominator changed to CCG registered population
CB_A2 Denominator changed to CCG registered population
CB_A3 Denominator changed to CCG registered population
CB_A4 Denominator changed to CCG registered population
CB_A5 Denominator changed to CCG registered population
CB_A6 Rate clarified as directly age and sex standardised rate
CB_A6_01 Denominator changed to CCG registered populationExclusions added to list of conditions Rate clarified as directly age and sex standardised rate Indicator previously only included persons aged 19 and over
CB_A6_02 Denominator changed to CCG registered populationRate clarified as directly age and sex standardised rate
CB_A6_03 Denominator changed to CCG registered populationExclusions added to list of conditions Rate clarified as directly age and sex standardised rate Indicator previously only included persons aged 19 and over
CB_A6_04 Denominator changed to CCG registered populationRate clarified as directly age and sex standardised rate
CB_B15_01 In description of “clock stop” the phrase “emergency response vehicle” has been changed to “ambulance service-dispatched emergency responder”
CB_B15_02 In description of “clock stop” the phrase “emergency response vehicle” has been changed to “ambulance service-dispatched emergency responder”
CB_S5 Full roll out of programme has been clarified as “at least 15% of adults with relevant disorders having timely access to services”

Everyone Counts: Planning for Patients 2013/14 Technical Definitions
4
Contents CB_A1: Potential years of life lost (PYLL) from causes considered amenable to healthcare ...................................................................................................................... 7 CB_A2: Under 75 mortality rate from cardiovascular disease ...................................... 11 CB_A3: Under 75 mortality rate from respiratory disease ............................................ 13 CB_A4: Under 75 mortality rate from liver disease ...................................................... 15 CB_A5: Under 75 mortality rate from cancer ................................................................ 17 CB_A6: Composite measure on emergency admissions ............................................. 19 CB_A6_01: Unplanned hospitalisation for chronic ambulatory care sensitive conditions ..................................................................................................................................... 21 CB_A6_02: Unplanned hospitalisation for asthma, diabetes and epilepsy in under 19s ..................................................................................................................................... 23 CB_A6_03: Emergency admissions for acute conditions that should not usually require hospital admission ........................................................................................................ 25 CB_A6_04: Emergency admissions for children with Lower Respiratory Tract Infections (LRTI) ........................................................................................................................... 27 CB_A7: Proportion of people feeling supported to manage their condition .................. 29 CB_A8: Health-related quality of life for people with long-term conditions ................... 31 CB_A9: Estimated diagnosis rate for people with dementia ......................................... 34 CB_A10: Emergency readmissions within 30 days of discharge from hospital ............ 36 CB_A11: Total health gain assessed by patients: i. Hip replacement; ii. Knee replacement; iii. Groin hernia; iv. Varicose veins .......................................................... 38 CB_A12: Patient experience of primary care i) GP Services ii) GP Out of Hours services ........................................................................................................................ 41 CB_A13 Friends and family test ................................................................................... 43 CB_A14: Patient experience of hospital care ............................................................... 45 CB_A15: Healthcare acquired infection (HCAI) measure (MRSA) ............................... 48 CB_A16: Healthcare acquired infection (HCAI) measure (clostridium difficile infections) ..................................................................................................................................... 50 CB_B1-B3: Referral to Treatment pathways ................................................................ 52 CB_B4: Diagnostic test waiting times ........................................................................... 54 CB_B5: A&E waiting time - total time in the A&E department ...................................... 56 CB_B6-B7: Cancer 2 week waits ................................................................................. 58 CB_B8-B11: Cancer day 31 waits ................................................................................ 61 CB_B12-B14: Cancer 62 day waits .............................................................................. 64 CB_B15_01: Ambulance clinical quality – Category A (Red 1) 8 minute response time .............................................................................................................................. 67 CB_B15_02: Ambulance clinical quality – Category A (Red 2) 8 minute response time ..................................................................................................................................... 69 CB_B16: Ambulance clinical quality - Category A 19 minute transportation time ......... 71 CB_B17: Mixed Sex Accommodation (MSA) Breaches ............................................... 73 CB_B18: Cancelled Operations ................................................................................... 76 CB_B19: Mental Health Measure – Care Programme Approach (CPA) ...................... 78 CB_S1: Non-elective FFCEs (First Finished Consultant Episode) ............................... 80 CB_S2: All first outpatient attendances ........................................................................ 82 CB_S3: Elective finished first consultant episodes (FFCEs) ........................................ 84 CB_S4: A&E Attendances ............................................................................................ 86 CB_S5: Mental Health Measure- Improved access to psychological services ............. 88 CB_S6: Number of 52 week Referral to Treatment Pathways ..................................... 90 CB_S7: Ambulance handover time .............................................................................. 92 CB_S8: Crew Clear ...................................................................................................... 94

Everyone Counts: Planning for Patients 2013/14 Technical Definitions
5
CB_S9: Trolley waits in A&E ........................................................................................ 96 CB_S10: Urgent operations cancelled for a second time ............................................. 98

Everyone Counts: Planning for Patients 2013/14 Technical Definitions
6
Executive summary The purpose of this Technical Definitions document is to describe the indicators in ‘Everyone Counts: Planning for Patients 2013/14’, and to set out for each measure:
• Definitions • Monitoring Arrangements • Accountability Expectations • Planning Requirements, if applicable • Further Information

Everyone Counts: Planning for Patients 2013/14 Technical Definitions
7
Everyone Counts - Annex A Measures
CB_A1: Potential years of life lost (PYLL) from causes considered amenable to healthcare DEFINITIONS Detailed Descriptor: Rate of potential years of life lost (PYLL) from causes considered amenable to health care
Lines Within Indicator (Units): Rate of potential years of life lost (PYLL) from causes considered amenable to health care
Data Definition: Denominator: Unconstrained GP registered population counts by single year of age and sex from the NHAIS (Exeter) Systems; supplied annually on 1 January for the forthcoming calendar year. Numerator: Death registrations in the calendar year for all England deaths based on GP of registration from the Primary Care Mortality Database (PCMD). GP Practice to CCG mapping file is used: http://www.connectingforhealth.nhs.uk/systemsandservices/data/ods/ccginterim/index.html Where no GP Practice code is recorded in the HES APC data, the CCG of responsibility is derived using the home postcode of the individual and a mapping file of postcode to lower super output area (LSOA) and to CCG. Standard population: The standard population is the ONS mid-year England population estimates for the respective calendar years. If estimates are not available for the specific calendar year, the most recently available estimates are used. Causes considered amenable to healthcare (as published in April 2012 by ONS): ICD–10 codes Condition group and
cause Ages included
Infections A15–A19, B90 Tuberculosis 0–74 A38–A41, A46, A48.1, B50–B54, G00, G03, J02, L03
Selected invasive bacterial and protozoal infections
0–74
B17.1, B18.2 Hepatitis C 0-74 B20-B24 HIV/AIDS All Neoplasms C18–C21 Malignant neoplasm of
colon and rectum 0–74
C43 Malignant melanoma of skin
0–74
C50 Malignant neoplasm of breast
0–74

Everyone Counts: Planning for Patients 2013/14 Technical Definitions
8
C53 Malignant neoplasm of cervix uteri
0–74
C67 Malignant neoplasm of bladder
0–74
C73 Malignant neoplasm of thyroid gland
0–74
C81 Hodgkin’s disease 0–74 C91, C92.0 Leukaemia 0–44 D10–D36 Benign neoplasms 0–74 Nutritional, endocrine and metabolic E10–E14 Diabetes mellitus 0–49 Neurological disorders G40–G41 Epilepsy and status
epilepticus 0–74
Cardiovascular diseases (CVD) I01–I09 Rheumatic and other
valvular heart disease 0–74
I10–I15 Hypertensive diseases 0–74 I20–I25 Ischaemic heart disease 0–74 I60–I69 Cerebrovascular diseases 0–74 Respiratory diseases J09–J11 Influenza (including swine
flu) 0–74
J12–J18 Pneumonia 0–74 J45– J46 Asthma 0–74 Digestive disorders K25–K28 Gastric and duodenal
ulcer 0–74
K35–K38, K40–K46, K80–K83, K85,K86.1-K86.9, K91.5
Acute abdomen, appendicitis, intestinal obstruction, cholecystitis / lithiasis, pancreatitis, hernia
0–74
Genitourinary disorders N00–N07, N17–N19, N25-N27
Nephritis and nephrosis 0–74
N13, N20–N21, N35, N40, N99.1
Obstructive uropathy & prostatic hyperplasia
0–74
Maternal & infant P00–P96, A33 Complications of perinatal
period All
Q00–Q99 Congenital malformations, deformations and chromosomal anomalies
0–74
Injuries Y60–Y69, Y83–Y84 Misadventures to patients
during surgical and medical care
All
Indicator construction: Causes considered amenable to health care are those from which premature deaths should not occur in the presence of timely and effective health care. The concept of ‘amenable’ mortality generally relates to deaths under age 75, due

Everyone Counts: Planning for Patients 2013/14 Technical Definitions
9
to the difficulty in determining cause of death in older people who often have multiple morbidities. The Office for National Statistics (ONS) produces mortality data by cause, which excludes deaths under 28 days (for which cause of death is not classified by ICD-10 codes). These indicators therefore relate to deaths between 28 days and 74 years of age inclusive. ONS consulted on a proposed list of causes considered amenable to healthcare in February 2011 and updated the list in April 2012 (see table below). ONS’s definition and related data for 2010 for England and Wales can be found at: http://www.ons.gov.uk/ons/rel/subnational-health4/avoidable-mortality-in-england-and-wales/2010/stb-avoidable-mortality.html Indicator format: Age-Standardised Potential Years of Life Lost rate per 100,000 population. The standard population is the ONS mid-year England population estimates for the respective calendar years. If estimates are not available for the specific calendar year, the most recently available estimates are used. The methodology for calculating the PYLL rate uses the average age-specific period life expectancy (LE) for each five-year age band for the relevant year as the age to which a person in that age band who died from one of the amenable causes might be expected to live in the presence of timely and effective healthcare. The age-specific period LE is different for each year. Period life expectancy is the average number of additional years a person can be expected to live for, if he or she experiences the age-specific mortality rates of the given time period for the rest of his or her life. Period life expectancy is the average number of additional years a person can be expected to live for, if he or she experiences the age-specific mortality rates of the given time period for the rest of his or her life. MONITORING Monitoring Frequency: Annual (calendar year). 2011 mortality data were released in November 2012. The ONS Statistical Bulletin on avoidable mortality for 2011 will be published in March 2013. Mid-year population estimates for 2011 were released in September 2012.
Monitoring Data Source: Office for National Statistics: http://www.ons.gov.uk/ons/rel/subnational-health4/avoidable-mortality-in-england-and-wales/2010/stb-avoidable-mortality.html and http://www.ons.gov.uk/ons/rel/pop-estimate/population-estimates-for-england-and-wales/index.html ACCOUNTABILITY What Success Looks Like, Direction, Milestones: Reduced PYLL from causes amenable to health care.

Everyone Counts: Planning for Patients 2013/14 Technical Definitions
10
Timeframe/Baseline: Ongoing
Rationale: Please see the NHS Outcomes Framework 2013/14, which can be found here http://www.dh.gov.uk/health/2012/11/nhs-outcomes-framework/. PLANNING REQUIREMENTS Are plans required and if so, at what frequency? No FURTHER INFORMATION This indicator is the same as C1.1 indicator in the CCG outcomes indicator set technical guidance, which can be found here: http://www.commissioningboard.nhs.uk/files/2012/12/ccg-ois-tech-guide.pdf.. Data and further information about this indicator are published in the Clinical Commissioning Group Indicators section of the NHS IC Indicator Portal, which can be found here https://indicators.ic.nhs.uk/webview/.

Everyone Counts: Planning for Patients 2013/14 Technical Definitions
11
CB_A2: Under 75 mortality rate from cardiovascular disease DEFINITIONS Detailed Descriptor: Indicator description: Mortality rate from cardiovascular disease, ages under 75, per 100,000 population
Lines Within Indicator (Units): Numerator: Number of deaths under 75 from cardiovascular disease. Denominator: GP Registered population under 75 years.
Data Definition: Numerator: Number of deaths under 75 from cardiovascular disease. Cardiovascular disease is defined in terms of the following ICD-10 codes: All ICD-10 codes in Chapter IX - Diseases of the circulatory system (I00-I99). Death registrations in the calendar year for all England deaths based on GP of registration from PCMD. Mortality data by cause excludes deaths under 28 days for which cause of death is not classified by ICD-10 code. This indicator therefore relates to deaths between 28 days and 74 years of age inclusive. GP Practice to CCG mapping file is used: http://www.connectingforhealth.nhs.uk/systemsandservices/data/ods/ccginterim/index.html Where no GP practice code is recorded in the PCMD, the CCG of responsibility is derived using the home postcode of the individual and a mapping files of postcode to lower super output area (LSOA) and to CCG Denominator: Unconstrained GP registered population counts by single year of age and sex from the NHAIS (Exeter) Systems; extracted annually on 1 January for the forthcoming calendar year. Indicator format: Directly age and sex standardised mortality rate for people aged under 75 in the respective calendar year per 100,000 CCG population. The standard population is the ONS mid-year England population estimates for the respective calendar years. If estimates are not available for the specific calendar year, the most recently available estimates are used. MONITORING Monitoring Frequency: Annual (calendar year).
Monitoring Data Source: Primary Care Mortality Database (PCMD) and NHAIS (Exeter) Systems. ACCOUNTABILITY

Everyone Counts: Planning for Patients 2013/14 Technical Definitions
12
What Success Looks Like, Direction, Milestones: Reduced premature mortality from cardiovascular disease
Timeframe/Baseline: Ongoing
Rationale: Please see the NHS Outcomes Framework 2013/14, which can be found here http://www.dh.gov.uk/health/2012/11/nhs-outcomes-framework/. PLANNING REQUIREMENTS Are plans required and if so, at what frequency? No FURTHER INFORMATION This indicator is the same as C1.2 indicator in the CCG outcomes indicator set technical guidance, which can be found here: http://www.commissioningboard.nhs.uk/files/2012/12/ccg-ois-tech-guide.pdf.. Data and further information about this indicator are published in the Clinical Commissioning Group Indicators section of the NHS IC Indicator Portal, which can be found here https://indicators.ic.nhs.uk/webview/.

Everyone Counts: Planning for Patients 2013/14 Technical Definitions
13
CB_A3: Under 75 mortality rate from respiratory disease DEFINITIONS Detailed Descriptor: Mortality rate from respiratory disease, ages under 75, per 100,000 population.
Lines Within Indicator (Units): Numerator: Number of deaths under 75 from respiratory disease Denominator: GP Registered population under 75 years
Data Definition: Numerator: Number of deaths under 75 from respiratory disease. Respiratory disease is defined in terms of the following ICD-10 codes: All ICD-10 codes in Chapter X - Diseases of the respiratory system (J00-J99) Death registrations in the calendar year for all England deaths based on GP of registration from PCMD. Mortality data by cause excludes deaths under 28 days for which cause of death is not classified by ICD-10 code. This indicator therefore relates to deaths between 28 days and 74 years of age inclusive. GP Practice to CCG mapping file is used: http://www.connectingforhealth.nhs.uk/systemsandservices/data/ods/ccginterim/index.html Where no GP practice code is recorded in the PCMD, the CCG of responsibility is derived using the home postcode of the individual and a mapping files of postcode to lower super output area (LSOA) and to CCG. Denominator: Unconstrained GP registered population counts by single year of age and sex from the NHAIS (Exeter) Systems; extracted annually on 1 January for the forthcoming calendar year. Indicator format Directly age and sex standardised mortality rate for people aged under 75 in the respective calendar year per 100,000 CCG population. The standard population is the ONS mid-year England population estimates for the respective calendar years. If estimates are not available for the specific calendar year, the most recently available estimates are used. MONITORING Monitoring Frequency: Annual (calendar year).
Monitoring Data Source: Primary Care Mortality Database (PCMD) and NHAIS (Exeter) Systems. ACCOUNTABILITY

Everyone Counts: Planning for Patients 2013/14 Technical Definitions
14
What success looks like, Direction, Milestones: Reduced premature mortality from respiratory disease.
Timeframe/Baseline: Ongoing
Rationale:
Please see the NHS Outcomes Framework 2013/14, which can be found here http://www.dh.gov.uk/health/2012/11/nhs-outcomes-framework/.. PLANNING REQUIREMENTS Are plans required and if so, at what frequency? No FURTHER INFORMATION This indicator is the same as C1.6 indicator in the CCG outcomes indicator set technical guidance, which can be found here: http://www.commissioningboard.nhs.uk/files/2012/12/ccg-ois-tech-guide.pdf.. Data and further information about this indicator are published in the Clinical Commissioning Group Indicators section of the NHS IC Indicator Portal, which can be found here https://indicators.ic.nhs.uk/webview/.

Everyone Counts: Planning for Patients 2013/14 Technical Definitions
15
CB_A4: Under 75 mortality rate from liver disease DEFINITIONS Detailed Descriptor: Mortality rate from liver disease, ages under 75, per 100,000 population.
Lines Within Indicator (Units): Numerator: Number of deaths under 75 from liver disease Denominator: GP Registered population under 75 years
Data Definition: Numerator: Number of deaths under 75 from liver disease Definitions of liver disease in terms of the following ICD-10 codes: K70 - Alcoholic liver disease K71 - Toxic liver disease K72 - Hepatic failure, not elsewhere classified K73 - Chronic hepatitis, not elsewhere classified K74 - Fibrosis and cirrhosis of liver K75 - Other inflammatory liver diseases K76 - Other diseases of liver K77 - Liver disorders in diseases classified elsewhere B15 - Acute hepatitis A B16 - Acute hepatitis B B17 - Other acute viral hepatitis B18 - Chronic viral hepatitis B19 - Unspecified viral hepatitis C22 - Malignant neoplasm of liver and intrahepatic bile ducts I81 - Portal vein thrombosis I85 - Oesophageal varices T86.4 - Liver transplant failure and rejection Denominator: Unconstrained GP registered population counts by single year of age and sex from the NHAIS (Exeter) Systems; extracted annually on 1 January for the forthcoming calendar year. Indicator format Directly age and sex standardised mortality rate for people aged under 75 in the respective calendar year per 100,000 CCG population. The standard population is the ONS mid-year England population estimates for the respective calendar years. If estimates are not available for the specific calendar year, the most recently available estimates are used. MONITORING Monitoring Frequency: Annual (calendar year).

Everyone Counts: Planning for Patients 2013/14 Technical Definitions
16
Monitoring Data Source: Primary Care Mortality Database (PCMD) and NHAIS (Exeter) Systems. ACCOUNTABILITY What Success Looks Like, Direction, Milestones: Reduced premature mortality from liver disease.
Timeframe/Baseline: Ongoing
Rationale: Please see the NHS Outcomes Framework 2013/14, which can be found here http://www.dh.gov.uk/health/2012/11/nhs-outcomes-framework/. PLANNING REQUIREMENTS Are plans required and if so, at what frequency? No FURTHER INFORMATION This indicator is aligned to the C1.7 indicator in the CCG outcomes indicator set technical guidance, which can be found here: http://www.commissioningboard.nhs.uk/files/2012/12/ccg-ois-tech-guide.pdf.. Similar mortality indicators are published annually in the NHS IC Indicator Portal using the narrower definition of liver disease (Mortality from chronic liver disease including cirrhosis, ICD-10 K70, K73 and K74). Data for 2008-10 were published in March 2012: https://indicators.ic.nhs.uk/download/NCHOD/Data/25A_043DR0074_10_V1_D.xls Source data available as a continuous time series from at least 1993, enabling the construction of this indicator from that year.

Everyone Counts: Planning for Patients 2013/14 Technical Definitions
17
CB_A5: Under 75 mortality rate from cancer DEFINITIONS Detailed Descriptor: Mortality rate from cancer, ages under 75, per 100,000 population
Lines Within Indicator (Units): Numerator: Number of deaths under 75 from all cancers Denominator: GP Registered population under 75 years
Data Definition: Numerator: Number of deaths under 75 from all cancers. Cancer is defined in terms of the following ICD10 codes:
All ICD-10 codes for Malignant Neoplasms in Chapter II - Neoplasms (C00-C97).
Death registrations in the calendar year for all England deaths based on GP of registration from PCMD. Mortality data by cause excludes deaths under 28 days for which cause of death is not classified by ICD-10 code. This indicator therefore relates to deaths between 28 days and 74 years of age inclusive.
GP Practice to CCG mapping file is used;
http://www.connectingforhealth.nhs.uk/systemsandservices/data/ods/ccginterim/index.html
Where no GP practice code is recorded in the PCMD, the CCG of responsibility is derived using the home postcode of the individual and a mapping files of postcode to lower super output area (LSOA) and to CCG. Denominator: Unconstrained GP registered population counts by single year of age and sex from the NHAIS (Exeter) Systems, extracted annually on 1 January for the forthcoming calendar year. Indicator format: Directly age and sex standardised mortality rate for people aged under 75 in the respective calendar year per 100,000 CCG population.
MONITORING Monitoring Frequency: Annual (calendar year).
Monitoring Data Source: Primary Care Mortality Database (PCMD) and NHAIS (Exeter) Systems. ACCOUNTABILITY

Everyone Counts: Planning for Patients 2013/14 Technical Definitions
18
What Success Looks Like, Direction, Milestones: Reduced premature mortality from cancer.
Timeframe/Baseline: Ongoing
Rationale: Please see the NHS Outcomes Framework 2013/14, which can be found here http://www.dh.gov.uk/health/2012/11/nhs-outcomes-framework/. . PLANNING REQUIREMENTS Are plans required and if so, at what frequency? No FURTHER INFORMATION This indicator is the same as C1.9 indicator in the CCG outcomes indicator set technical guidance, which can be found here: http://www.commissioningboard.nhs.uk/files/2012/12/ccg-ois-tech-guide.pdf.. Data and further information about this indicator are published in the Clinical Commissioning Group Indicators section of the NHS IC Indicator Portal, which can be found here https://indicators.ic.nhs.uk/webview/. Historical time series available from NHS Information Centre Compendium of Population Health Indicators from 1993 to 2009 for England and geographical breakdown: https://indicators.ic.nhs.uk/download/NCHOD/Data/11B_075DRT0074_09_V1_D.xls

Everyone Counts: Planning for Patients 2013/14 Technical Definitions
19
CB_A6: Composite measure on emergency admissions DEFINITIONS Detailed Descriptor: An aggregate of four other indicators relating to avoidable or preventable admissions, expressed as a rate per 100,000 population
Lines Within Indicator (Units): Numerator: A sum of the numerators for indicators CB_A6_01, CB_A6_02, CB_A6_03, and CB_A6_04, excluding any duplication of admissions between these indicators Denominator: Total population Indicator Format: Age and sex standardised rate per 100,000 population The standard population is the ONS mid-year England population estimates for the respective calendar years. If estimates are not available for the specific calendar year, the most recently available estimates are used. For some purposes, an indirectly standardised rate may be used.
Data Definition: The proportion of persons admitted to hospital for conditions aggregated across four indicators in the NHS outcomes framework, expressed as a rate per 100,000 population
MONITORING Monitoring Frequency: Monthly
Monitoring Data Source: Hospital Episode Statistics (HES) (NHS Information Centre); http://www.ic.nhs.uk/statistics-and-data-collections/hospital-care/hospital-activity-hospital-episode-statistics--hes and NHAIS (Exeter) ACCOUNTABILITY What Success Looks Like, Direction, Milestones: A lower rate indicates a reduction in admissions that are avoidable or preventable.
Timeframe/Baseline: Ongoing Rationale: This indicator combined 4 others which all represent admissions to hospital that are avoidable or preventable. Therefore, it provides a good overall summary of avoidable and/or preventable admissions.

Everyone Counts: Planning for Patients 2013/14 Technical Definitions
20
PLANNING REQUIREMENTS Are plans required and if so, at what frequency? No FURTHER INFORMATION

Everyone Counts: Planning for Patients 2013/14 Technical Definitions
21
CB_A6_01: Unplanned hospitalisation for chronic ambulatory care sensitive conditions DEFINITIONS Detailed Descriptor: The proportion of people with chronic conditions admitted to hospital as an emergency admission.
Lines Within Indicator (Units): Numerator: The number of people with chronic conditions admitted to hospital as an emergency admission Denominator: Unconstrained GP registered population
Data Definition: This definition is based on the Health and Social Care Information Centre’s Compendium of Population Health indicator: Emergency hospital admissions: chronic conditions usually managed in primary care. Numerator: The number of finished and unfinished continuous inpatient spells (CIPS) in Hospital Episode Statistics for Admitted Patient Care (HES APC), excluding transfers, for patients of all ages with an emergency method of admission and with primary diagnoses for chronic ambulatory care sensitive conditions listed below:
a) B18.0, B18.1. Exclude people with a secondary diagnosis of D57 (Sickle-cell disorders). b) J45, J46X
c) I11.0, I50, J81X, I13.0. OPCS4 codes excluded: K0, K1, K2, K3, K4, K50, K52, K55, K56, K57, K60, K61, K66, K67, K68, K69, K71
d) E10, E11, E12, E13, E14
e) J20, J41, J42X, J43, J44, J47X. J20 only with second diagnosis of J41, J42, J43, J44, J47
f) I20, I25. OPCS4 codes excluded: A, B, C, D, E, F, G, H, I, J, K, L, M, N, O, P, Q, R, S, T, V, W, X0, X1, X2, X4, X5
g) D50.1, D50.8, D50.9, D51, D52
h) I10X, I11.9. OPCS4 codes excluded: K0, K1, K2, K3, K4, K50, K52, K55, K56, K57, K60, K61, K66, K67, K68, K69, K71
i) G40, G41, F00, F01, F02, F03, I48X Denominator: Unconstrained GP registered population counts by single year of age and sex from the NHAIS (Exeter) Systems, extracted annually on 1 April for the forthcoming financial year.

Everyone Counts: Planning for Patients 2013/14 Technical Definitions
22
Indicator format: Directly age and sex standardised rate per 100,000 population. The standard population is the ONS mid-year England population estimates for the respective calendar years. If estimates are not available for the specific calendar year, the most recently available estimates are used. For some purposes, an indirectly standardised rate may be used MONITORING Monitoring Frequency: HES reports provisional data monthly, annual data by financial year is available in the autumn/winter after the end of the period.
Monitoring Data Source: Hospital Episode Statistics (HES) (NHS Information Centre); http://www.ic.nhs.uk/statistics-and-data-collections/hospital-care/hospital-activity-hospital-episode-statistics--hes and NHAIS (Exeter) ACCOUNTABILITY What Success Looks Like, Direction, Milestones: Reduced serious deterioration in people with ambulatory care sensitive (ACS) conditions
Timeframe/Baseline: Ongoing
Rationale: Please see the NHS Outcomes Framework 2013/14, which can be found here http://www.dh.gov.uk/health/2012/11/nhs-outcomes-framework/. PLANNING REQUIREMENTS Are plans required and if so, at what frequency? No FURTHER INFORMATION This indicator is the same as C2.6 indicator in the CCG outcomes indicator set technical guidance, which can be found here: http://www.commissioningboard.nhs.uk/files/2012/12/ccg-ois-tech-guide.pdf.. Data and further information about this indicator are published in the Clinical Commissioning Group Indicators section of the NHS IC Indicator Portal, which can be found here https://indicators.ic.nhs.uk/webview/.

Everyone Counts: Planning for Patients 2013/14 Technical Definitions
23
CB_A6_02: Unplanned hospitalisation for asthma, diabetes and epilepsy in under 19s DEFINITIONS Detailed Descriptor: Rate of emergency admissions episodes in people under 19 (0 – 18 years) for asthma, diabetes or epilepsy per 100,000 population
Lines Within Indicator (Units): Numerator: Total number of emergency admissions for people under 19 (0 – 18 years) where asthma, diabetes or epilepsy was the primary diagnosis. Denominator: Unconstrained GP registered population for under 19s Indicator Format: Directly age and sex standardised rate per 100,000 population
Data Definition: Numerator: The number of finished and unfinished continuous inpatient spells (CIPS) in Hospital Episode Statistics for Admitted Patient Care (HES APC), excluding transfers, for children under 19 years with an emergency method of admission and with primary diagnoses of asthma, diabetes or epilepsy (J45, J46, E10, G40, G41). Denominator: Unconstrained GP registered population counts by single year of age and sex from the NHAIS (Exeter) Systems, extracted annually on 1 April for the forthcoming financial year Indicator Format: Directly age and sex standardised rate per 100,000 population. The standard population is the ONS mid-year England population estimates for the respective calendar years. If estimates are not available for the specific calendar year, the most recently available estimates are used. For some purposes, an indirectly standardised rate may be used MONITORING Monitoring Frequency: HES reports provisional data monthly, annual data by financial year is available in the autumn/winter after the end of the period.
Monitoring Data Source: Hospital Episode Statistics (HES) (NHS Information Centre); http://www.ic.nhs.uk/statistics-and-data-collections/hospital-care/hospital-activity-hospital-episode-statistics--hes and NHAIS (Exeter) ACCOUNTABILITY What Success Looks Like, Direction, Milestones: Reduced unplanned time spent in hospital by children with specific long-term conditions

Everyone Counts: Planning for Patients 2013/14 Technical Definitions
24
that should be managed outside hospital.
Timeframe/Baseline: Ongoing
Rationale: Please see the NHS Outcomes Framework 2013/14, which can be found here http://www.dh.gov.uk/health/2012/11/nhs-outcomes-framework/. PLANNING REQUIREMENTS Are plans required and if so, at what frequency? No FURTHER INFORMATION This indicator is the same as C2.7 indicator in the CCG outcomes indicator set technical guidance, which can be found here: http://www.commissioningboard.nhs.uk/files/2012/12/ccg-ois-tech-guide.pdf.. Data and further information about this indicator are published in the Clinical Commissioning Group Indicators section of the NHS IC Indicator Portal, which can be found here https://indicators.ic.nhs.uk/webview/.

Everyone Counts: Planning for Patients 2013/14 Technical Definitions
25
CB_A6_03: Emergency admissions for acute conditions that should not usually require hospital admission DEFINITIONS Detailed Descriptor: Emergency admissions to hospital of persons with acute conditions (ear/nose/throat infections, kidney/urinary tract infections, heart failure, among others) that usually could have been avoided through better management in primary care.
Lines Within Indicator (Units): Numerator: The number of emergency admissions to hospital of persons with acute conditions (ear/nose/throat infections, kidney/urinary tract infections, heart failure, among others) that usually could have been avoided through better management in primary care. Denominator: Unconstrained GP registered population Data Definition: Indicator construction: The indicator is defined as the number of admissions for these conditions as a proportion of the number of persons of all ages in England. The list of conditions included in the definition was originally reviewed for the purposes of the NHS Outcomes Framework and was considered the most up-to-date and comprehensive list available at the time, taking account of the views of expert clinicians. However the list is being reviewed again to further improve the definition. The indicator is standardised by age and sex. Numerator: The number of finished and unfinished continuous inpatient spells (CIPS) in Hospital Episode Statistics for Admitted Patient Care (HES APC), excluding transfers, with an emergency method of admission and with primary diagnoses for acute conditions, as listed below. a) J10, J11, J13X, J14, J15.3, J15.4, J15.7, J15.9, J16.8, J18.1, J18.8, A36, A37, B05, B06, B16.1, B16.9, B26, M01.4. Exclude people with a secondary diagnosis of D57 (Sickle-cell disorders) b) I24.0, I24.8, I24.9. OPCS4 codes excluded: A, B, C, D, E, F, G, H, I, J, K, L, M, N, O, P, Q, R, S, T, V, W, X0, X1, X2, X4, X5. c) E86, K52, A02.0, A04, A05.9, A07.2, A08, A09 d) N10, N11, N12, N13.6, N15.9, N39.0, N30.0, N30.8, N30.9 e) K25.0-K25.2, K25.4-K25.6, K26.0-K26.2, K26.4-K26.6, K27.0-K27.2, K27.4-K27.6, K28.0-K28.2, K28.4-K28.6, K20, K21 f) L03, L04, L08.0, L08.8, L08.9, L88, L98.0, I89.1, L01, L02. OPCS4 codes excluded: A, B, C, D, E, F, G, H, I, J, K, L, M, N, O, P, Q, R, S1, S2, S3, S41, S42, S43, S44, S45, S48, S49, T, V, W, X0, X1, X2, X4, X5. S47 is allowed if by itself. g) H66, H67, J02, J03, J06, J31.2, J04.0 h) A69.0, K02, K03, K04, K05, K06, K08, K09.8, K09.9, K12, K13 i) R56, O15, G25.3 Denominator: Unconstrained GP registered population counts by single year of age and sex from the NHAIS (Exeter) Systems, extracted annually on 1 April for the forthcoming financial year

Everyone Counts: Planning for Patients 2013/14 Technical Definitions
26
Indicator Format: Directly age and sex standardised rate per 100,000 population. The standard population is the ONS mid-year England population estimates for the respective calendar years. If estimates are not available for the specific calendar year, the most recently available estimates are used. For some purposes, an indirectly standardised rate may be used
MONITORING Monitoring Frequency: HES reports provisional data monthly, annual data by financial year are available in the autumn/winter after the end of the period.
Monitoring Data Source: Hospital Episode Statistics (HES) (NHS Information Centre); http://www.ic.nhs.uk/statistics-and-data-collections/hospital-care/hospital-activity-hospital-episode-statistics--hes and NHAIS (Exeter) ACCOUNTABILITY What Success Looks Like, Direction, Milestones: Preventing conditions from becoming more serious. This includes prevention, early detection and treatment and provision of alternative types of care.
Timeframe/Baseline: Ongoing
Rationale: Please see the NHS Outcomes Framework 2013/14, which can be found here http://www.dh.gov.uk/health/2012/11/nhs-outcomes-framework/. PLANNING REQUIREMENTS Are plans required and if so, at what frequency? No FURTHER INFORMATION This indicator is the same as C3.1 indicator in the CCG outcomes indicator set technical guidance, which can be found here: http://www.commissioningboard.nhs.uk/files/2012/12/ccg-ois-tech-guide.pdf.. Data and further information about this indicator are published in the Clinical Commissioning Group Indicators section of the NHS IC Indicator Portal, which can be found here https://indicators.ic.nhs.uk/webview/.

Everyone Counts: Planning for Patients 2013/14 Technical Definitions
27
CB_A6_04: Emergency admissions for children with Lower Respiratory Tract Infections (LRTI) DEFINITIONS Detailed Descriptor:: Emergency admissions to hospital of children with selected types of Lower Respiratory Tract Infections (bronchiolitis, bronchopneumonia and pneumonia).
Lines Within Indicator (Units): The indicator is defined as the proportion of children aged up to 19 years of age admitted to hospital as an emergency admission for LRTIs.
Data Definition: This definition is based on that used for an NHS IC Compendium of Population Health indicator on children and LRTIs. Indicator construction: The indicator is defined as the proportion of children aged up to 19 years of age admitted to hospital as an emergency admission for LRTIs. Numerator: The number of finished and unfinished continuous inpatient spells (CIPS) in Hospital Episode Statistics for Admitted Patient Care (HES APC), excluding transfers, for children under 19 with an emergency method of admission and with primary diagnoses of lower respiratory tract infections as listed below: J10.0, J11.0, J11.1, J12.-, J13, J14, J15.-, J16.-, J18.0, J18.1, J18.9, J21. Denominator: The unconstrained GP registered population for under 19s. Indicator Format: Directly age and sex standardised rate per 100,000 population. The standard population is the ONS mid-year England population estimates for the respective calendar years. If estimates are not available for the specific calendar year, the most recently available estimates are used. For some purposes, an indirectly standardised rate may be used MONITORING Monitoring Frequency: Monthly (provisional), quarterly for HES (Hospital Episode Statistics) data, annual for population estimates
Monitoring Data Source: Hospital Episode Statistics (HES) (NHS Information Centre); http://www.ic.nhs.uk/statistics-and-data-collections/hospital-care/hospital-activity-hospital-episode-statistics--hes and NHAIS (Exeter) ACCOUNTABILITY

Everyone Counts: Planning for Patients 2013/14 Technical Definitions
28
What success looks like, Direction, Milestones: Preventing lower respiratory tract infections in children from becoming more serious.
Timeframe/Baseline: Ongoing
Rationale: Please see the NHS Outcomes Framework 2013/14, which can be found here http://www.dh.gov.uk/health/2012/11/nhs-outcomes-framework/. PLANNING REQUIREMENTS Are plans required and if so, at what frequency? No FURTHER INFORMATION This indicator is the same as C3.4 indicator in the CCG outcomes indicator set technical guidance, which can be found here: http://www.commissioningboard.nhs.uk/files/2012/12/ccg-ois-tech-guide.pdf.. Data and further information about this indicator are published in the Clinical Commissioning Group Indicators section of the NHS IC Indicator Portal, which can be found here https://indicators.ic.nhs.uk/webview/.

Everyone Counts: Planning for Patients 2013/14 Technical Definitions
29
CB_A7: Proportion of people feeling supported to manage their condition DEFINITIONS Detailed Descriptor:: The proportion of people feeling supported to manage their long-term condition. Lines Within Indicator (Units): Numerator: Total number of people with long term conditions who feel supported to manage their condition. Denominator: Total number of people with long term conditions.
Data Definition: Indicator construction: The indicator will be based on responses to questions in the GP Patient Survey GPPS) as follows: Numerator For people who answer yes to the Question 30 “Do you have a long-standing health condition” (cited in template for indicator 2). The numerator is the total number of ‘Yes, definitely’ or ‘Yes, to some extent’ answers to GPPS Question 32: In the last 6 months, have you had enough support from local services or organisations to help you manage your long-term condition(s)? Please think about all services and organisations, not just health services • Yes, definitely • Yes, to some extent • No • I have not needed such support • Don’t know/can’t say Responses will be weighted according to the following 0-100 scale: “No” = 0 “Yes, to some extent” = 50 “Yes, definitely” = 100 Denominator The denominator is the total number of ‘Yes, definitely’, ‘Yes, to some extent’ and ‘No’ answers to question 32 above. Indicator format Percentage (weighted numerator/denominator) MONITORING Monitoring Frequency: Bi-annual in future. Available approximately three months after the end of each data collection period in future so 2011/12 data released in summer 2012.
Monitoring Data Source: GP patient survey http://www.gp-patient.co.uk/

Everyone Counts: Planning for Patients 2013/14 Technical Definitions
30
ACCOUNTABILITY What Success Looks Like, Direction, Milestones: A greater proportion of people aged 18 and over suffering from a long-term condition feeling supported to manage their condition
Timeframe/Baseline: Ongoing
Rationale: Please see the NHS Outcomes Framework 2013/14 and Technical Appendix, which can be found here http://www.dh.gov.uk/health/2012/11/nhs-outcomes-framework/. PLANNING REQUIREMENTS Are plans required and if so, at what frequency? No FURTHER INFORMATION This indicator is the same as indicator 2.1 in the NHS Outcomes Framework 2013/14 Technical Appendix, which can be found here https://www.wp.dh.gov.uk/publications/files/2012/11/121109-Technical-Appendix.pdf. Series from GPPS available from Q3 2009/10. Summaries of quarterly data are available from: http://www.gp-patient.co.uk/results/results/annualsummary The standardisation methodology for this indicator has changed and is still under development.

Everyone Counts: Planning for Patients 2013/14 Technical Definitions
31
CB_A8: Health-related quality of life for people with long-term conditions DEFINITIONS Detailed Descriptor:: Average health status score for individuals aged 18 and over reporting that they have a long-term condition
Lines Within Indicator (Units): Average health status score for individuals aged 18 and over reporting that they have a long-term condition
Data Definition: Indicator construction: Average health status (EQ-5D*) score for individuals aged 18 and over reporting that they have a long-term condition. It assesses whether health-related quality of life is increasing over time for the population with long-term conditions, while controlling for measurable confounders (age, gender, disease mix, etc.). Health status is derived from responses to Q34 on the GP Patient Survey (GPPS), which asks respondents to describe their health status using the five dimensions of the EuroQuol 5D (EQ-5D) survey instrument: • Mobility • Self-care • Usual activities • Pain/discomfort • Anxiety/depression A single measure of Health Related Quality of life for each survey respondent is derived using a standard tariff, itself elicited from a representative sample of the general population (For the derivation see Dolan, Gudex, Kind and Williams “A Social Tariff for EuroQol: Results from a UK General Population survey”, Discussion Paper 138, Centre for Health Economics, University of York. Available online at http://www.york.ac.uk/media/che/documents/papers/discussionpapers/CHE%20Discussion%20Paper%20138.pdf ). The derived value takes a maximum score of 1 (full health) and is anchored at zero (a state of no intrinsic value, for example unconscious). Long-term condition status for individuals is obtained from ‘yes’ responses to Question 30 in the GP Patient Survey: Do you have a long-standing health condition? Response options: Yes, No, Don’t know/Can’t say Responses to Question 30 may be influenced by responses to Question 31 in the same survey asking about which medical conditions the respondent has. Question 31: Which, if any, of the following medical conditions do you have? Please x all the boxes that apply to you: • Alzheimer’s disease or dementia • Angina or long-term heart problem • Arthritis or long-term joint problem • Asthma or long-term chest problem • Blindness or severe visual impairment • Cancer in the last 5 years • Deafness or severe hearing impairment

Everyone Counts: Planning for Patients 2013/14 Technical Definitions
32
• Diabetes • Epilepsy • High blood pressure • Kidney or liver disease • Learning difficulty • Long-term back problem • Long-term mental health problem • Long-term neurological problem • Another long-term condition • None of these conditions • I would prefer not to say Indicator format: Number The indicator will be standardised to take demographic and health status factors into account, so that trends in the indicator can be distinguished from changes in the population. Standardisation will allow for a respondents’ mix of long term conditions, but not for those co-morbidities that are avoidable sequelae of other conditions. Indicator construction: Average health status (EQ-5D*) score for individuals aged 18 and over reporting that they have a long-term condition. It assesses whether health-related quality of life is increasing over time for the population with long-term conditions, while controlling for measurable confounders (age, gender, disease mix, etc.). *EQ-5D™ is a registered trademark of EuroQol. Further details are available from http://www.euroqol.org MONITORING Monitoring Frequency: Bi-annually from the GPPS approximately three months after the end of each data collection period.
Monitoring Data Source: GP Patient Survey (GPPS) The most recent GPPS data covering 2011/12, is available at http://www.gp-patient.co.uk/results/ From 2011/12, health status (EQ-5D) and the questions required for case-mix adjustment have been included in the GPPS www.gp- patient.co.uk/ Health Survey for England (HSE) An alternative source that can be used to corroborate this indicator is the HSE http://www.dh.gov.uk/en/Publicationsandstatistics/PublishedSurvey/HealthSurveyForEngland/index.htm (Data from the annual HSE is available between 12 to 15 months after the end of each calendar year) ACCOUNTABILITY What success looks like, Direction, Milestones: Improved health-related quality of life for people with long-term conditions.

Everyone Counts: Planning for Patients 2013/14 Technical Definitions
33
Timeframe/Baseline: Ongoing
Rationale: Please see the NHS Outcomes Framework 2013/14 and Technical Appendix, which can be found here http://www.dh.gov.uk/health/2012/11/nhs-outcomes-framework/. PLANNING REQUIREMENTS Are plans required and if so, at what frequency? No FURTHER INFORMATION This indicator is the same as indicator 2 in the NHS Outcomes Framework 2013/14 Technical Appendix, which can be found here https://www.wp.dh.gov.uk/publications/files/2012/11/121109-Technical-Appendix.pdf. Work is underway with the Health and Social Care Information Centre’s Methodology Review Group to agree the standardisation methodology.
Changes to the indicator may be biased as a representation of change to the outcomes sought due to unmeasured changes in: • The average period that the surveyed individuals have suffered a long-term condition, a major determinant of stage and severity of disease, and hence of health status. If the average period since incidence of the sampled population decreases, for example through earlier diagnosis, the measured health related quality of life of the sample will improve without genuine improvement of outcome. Conversely, if the period since incidence increases, for example as improvements in care defer mortality, the measured health related quality of life will decline without genuine deterioration of outcome. • Readiness to diagnose or report a "long standing health condition”, which might reflect change in tolerance of conditions by different age cohorts. For example, if a current cohort considers itself to suffer from a “long-term back problem” which an earlier cohort would have considered a normal part of ageing, the average case mix of the sample population will lighten

Everyone Counts: Planning for Patients 2013/14 Technical Definitions
34
CB_A9: Estimated diagnosis rate for people with dementia DEFINITIONS Detailed Descriptor: Diagnosis rate for people with dementia, expressed as a percentage of the estimated prevalence Lines Within Indicator (Units): Numerator: Numbers of people diagnosed Denominator: Prevalence of dementia
Data Definition: Numerator: Numbers of people diagnosed – The number of people on the dementia register for England in the Quality and Outcomes Framework (QOF). This figure is published by the Health and Social Care Information Centre as the QOF DEM1 indicator. Denominator: Prevalence – Dementia prevalence rates published in Dementia UK report (2007), adjusted for general practice register patient numbers, and numbers of general practice patients in care homes (Adjusted National Dementia Prevalence, NHS Commissioning Board Dementia Prevalence Calculator, 2012). Indicator format: Percentage MONITORING Monitoring Frequency: Annual Last publication in October based on previous financial year end.
Monitoring Data Source: Quality and Outcomes Framework Health and Social Care Information Centre Dementia UK report 2007 Office for National Statistics Population Statistics ACCOUNTABILITY What success looks like, Direction, Milestones: Improving the ability of people living with dementia to cope with symptoms, and access treatment, care and support
Timeframe/Baseline: Ongoing
Rationale:

Everyone Counts: Planning for Patients 2013/14 Technical Definitions
35
A diagnosis enables people living with dementia, and their carers/families to access treatment, care and support, and to plan in advance in order to cope with the impact of the disease. A diagnosis enables primary and secondary health and care services to anticipate needs, and with people living with dementia, plan and deliver personalised care plans and integrated services, thereby improving outcomes.
PLANNING REQUIREMENTS Are plans required and if so, at what frequency? Yes, annual plans for 2013/14 and 2014/15 FURTHER INFORMATION This is similar to indicator 2.6.i in the NHS Outcomes Framework 2013/14. It was published by the Health and Social Care Information Centre in September 2012 as a provisional indicator. Data and further information about this indicator are published in the NHS Outcomes Framework section of the NHS IC Indicator Portal, which can be found here https://indicators.ic.nhs.uk/webview/. An updated version of the indicator will be published in December 2012, covering England as well as cases from age 30 and above. To view Dementia Prevalence Calculator, NHS Commissioning Board, 2012 go to www.dementiapartnerships.org.uk/diagnosis/dementia_prevalence_calculator.

Everyone Counts: Planning for Patients 2013/14 Technical Definitions
36
CB_A10: Emergency readmissions within 30 days of discharge from hospital DEFINITIONS Detailed Descriptor: Emergency readmissions within 30 days of discharge from hospital.
Lines Within Indicator (Units): Percentage of emergency admissions to any hospital in England occurring within 30 days of the last, previous discharge from hospital after admission.
Data Definition: Numerator: The number of finished and unfinished continuous inpatient (CIP) spells that are emergency admissions within 0-29 days (inclusive) of the last, previous discharge from hospital (see denominator), including those where the patient dies, but excluding the following: those with a main specialty upon readmission coded under obstetric; and those where the readmitting spell has a diagnosis of cancer (other than benign or in situ) or chemotherapy for cancer coded anywhere in the spell. Denominator: The number of finished CIP spells within selected medical and surgical specialties, with a discharge date up to 31 March
within the year of analysis. Day
cases, spells with a discharge coded as death, maternity spells (based on specialty, episode type, diagnosis), and those with mention of a diagnosis of cancer or chemotherapy for cancer anywhere in the spell are excluded. Patients with mention of a diagnosis of cancer or chemotherapy for cancer anywhere in the 365 days prior to admission are excluded. Indicator format: Standardised percentage rate. MONITORING Monitoring Frequency: HES reports provisional data monthly, annual data by financial year are available in the autumn/winter after the end of the period.
Monitoring Data Source: Hospital Episode Statistics ACCOUNTABILITY What success looks like, Direction, Milestones: Effective recovery from illnesses and injuries requiring hospitalisation.
Timeframe/Baseline: Ongoing
Rationale: Please see the NHS Outcomes Framework 2013/14 and Technical Appendix, which can be found here http://www.dh.gov.uk/health/2012/11/nhs-outcomes-framework/.

Everyone Counts: Planning for Patients 2013/14 Technical Definitions
37
PLANNING REQUIREMENTS Are plans required and if so, at what frequency? No FURTHER INFORMATION This indicator is the same as indicator 3b in the NHS Outcomes Framework 2013/14 Technical Appendix, which can be found here https://www.wp.dh.gov.uk/publications/files/2012/11/121109-Technical-Appendix.pdf. Data and further information about this indicator are published in the NHS Outcomes Framework section of the NHS IC Indicator Portal, which can be found here https://indicators.ic.nhs.uk/webview/.

Everyone Counts: Planning for Patients 2013/14 Technical Definitions
38
CB_A11: Total health gain assessed by patients: i. Hip replacement; ii. Knee replacement; iii. Groin hernia; iv. Varicose veins DEFINITIONS Detailed Descriptor:: Patient reported outcomes measures (PROMs) for elective procedures: i. Hip replacement; ii. Knee replacement; iii. Groin hernia; iv. Varicose veins
Lines Within Indicator (Units): This indicator is split into four lines i. Patient reported outcomes measures for elective procedures: hip replacement; ii. Patient reported outcomes measures for elective procedures: knee replacement; iii. Patient reported outcomes measures for elective procedures: groin hernia; iv. Patient reported outcomes measures for elective procedures: varicose veins
Data Definition: Indicator description: Number of interventions together with measures of health status before and after intervention for selected elective procedures (procedures detailed below) reported separately. The product of the average assessed effectiveness (based upon before and after health status) and number provides an estimate of overall health gain from the elective procedures measured. Patient’s reported improvement in health status following elective procedures, currently covering groin hernia, hip replacement, knee replacement and varicose veins, are based upon the Patient Reported Outcome Measures (PROMs) programme. PROMs comprise a pair of questionnaires measuring health status completed by the patient, one before and one after surgery (at least three months after for groin hernia and varicose vein operations, or at least six months after for hip and knee replacements). A comparison of these measurements shows whether, and to what extent, the procedure has improved their health status. Indicator construction: For the purposes of the NHS Outcomes Framework: • EQ-5D – a generic health status measure (see www.euroqol.org/) There are four sets of procedures for which PROMs are collected and these are reported as the EQ-5D index case-mix adjusted average health gain only for the four separate indicators for the purposes of the NHS OF. These are: i. Unilateral Hip Replacements (Primary and Revisions), ii. Unilateral Knee Replacements (Primary and Revisions), iii. Groin Hernia Surgery, iv. Varicose Vein Surgery. All patients receiving one of the relevant Procedures from an NHS-funded Provider are eligible to participate and should be invited to complete PROMs questionnaires. PROMs data are collected for patients aged 15 years and above. Indicator format: The average health gain adjusted for case-mix. The responses to the pre- and post-operative PROMs questionnaires are converted into pre- and post-

Everyone Counts: Planning for Patients 2013/14 Technical Definitions
39
operative health status measurements by the application of scoring algorithms, where appropriate. The difference between the pre- and post-operative health status scores is a measure of the outcome of the procedure. The risk adjustment model takes into account variables such as patient characteristics, age, sex and the presence of comorbidities. For further information on the case-mix adjustment model please see http://www.dh.gov.uk/en/Publicationsandstatistics/Publications/PublicationsPolicyAndGuidance/DH_133445 The number of individuals receiving the procedures is multiplied by the assessed average risk-adjusted improvement in health status. MONITORING Monitoring Frequency: Monthly. Data published in various ways – from April 2009 monthly on a cumulative basis for each financial year. The last publication of provisional monthly PROMs covers the period April 2011 to March 2012 (published on August 2012) – around a 5-month time lag for publication. In terms of annual data, the 2009/10 and 2010/11 final data are available now. Data for 2011/12 are currently provisional. Provisional quarterly data will become available for 2012/13 Q1 in November (Q2 in February etc). Annual data are published along with Q4. Data on the number of individuals receiving procedures is scheduled to be published from March 2013
Monitoring Data Source: Health and Social Care Information Centre’s PROMs data publication and dataset, part of the Hospital Episode Statistics dataset (see – http://www.hesonline.nhs.uk/Ease/servlet/ContentServer?siteID=1937&categoryID=1295) ACCOUNTABILITY What success looks like, Direction, Milestones: Increased health gain from planned procedures
Timeframe/Baseline: Ongoing
Rationale: Please see the NHS Outcomes Framework and Technical Appendix, which can be found here http://www.dh.gov.uk/health/2012/11/nhs-outcomes-framework/. PLANNING REQUIREMENTS Are plans required and if so, at what frequency? No

Everyone Counts: Planning for Patients 2013/14 Technical Definitions
40
FURTHER INFORMATION These indicators are the same as indicators 3.1i-iv in the NHS Outcomes Framework 2013/14 Technical Appendix, which can be found here https://www.wp.dh.gov.uk/publications/files/2012/11/121109-Technical-Appendix.pdf. PROMs are currently only collected for the 4 elective procedures covered by this indicator. The DH is working presently with the National Cardiac Benchmarking Collaborative to pilot the collection of PROMs for elective Coronary Artery Bypass Grafts and Angioplasties. The pilot is due to report towards the end of 2013. As the PROMs programme develops and subject to positive results, it will need to considered if Outcome Framework indicators should include more elective procedures

Everyone Counts: Planning for Patients 2013/14 Technical Definitions
41
CB_A12: Patient experience of primary care i) GP Services ii) GP Out of Hours services DEFINITIONS Detailed Descriptor:: Percentage of patients who have a positive experience of i. GP Services and ii. GP Out of Hours based on responses to the GP Patient Survey.
Lines Within Indicator (Units): These will be presented as separate indicators derived from the GP Patient Survey (GPPS) measuring experience of GP services and GP Out of Hours services. The indicators are based on the percentage of people responding Good or Very Good to each of the following questions:
• Overall, how would you describe your experience of your GP Surgery? • Overall, how would you describe your experience of out-of-hours GP services?
Subject to review, supplementary information will also be provided, indicating the percentage of survey respondents for each of the possible responses to each question.
Data Definition: Numerator: Two separate numerators, one for each part of the indicator. Each is the number of people answering Good or Very Good to the questions above. Denominator: Two separate denominators, one for each part of the indicator. Each is the total number of people answering the questions above. Data is weighted based on demographic data to ensure results are representative of the normal population. The weighing scheme has been developed by Ipsos MORI, incorporating elements such as age and gender of the survey respondent as well as factors from the area where the respondent lives such as level of deprivation, ethnicity profile, ACORN* classification and so on, which have been shown to impact on non-response bias within the GPPS The GPPS is sent to adults 18 years and older Indicator format: This indicator will take values between 0-100, where 0 is the worst score and 100 is the best score. *ACORN is a geodemographic segmentation of the UK’s population which segments small neighbourhoods, postcodes, or consumer households into 5 categories, 17 groups and 56 types. MONITORING Monitoring Frequency: The indicator is based on aggregated data from two collections each year. From June

Everyone Counts: Planning for Patients 2013/14 Technical Definitions
42
2012 onwards, data is published on a rolling six-monthly basis, the indicator will only be produced annually based on data for the full financial year. Producing the indicator on a six-monthly bases will mean that data will overlap with the previously calculated score. The 2011/12 survey provides the fist data, published in June 2012.
Monitoring Data Source: The GPPS from 2011/12 onwards (http://www.gp-patient.co.uk/results/). ACCOUNTABILITY What success looks like, Direction, Milestones: Improvement in patients’ experiences of GP services and GP Out of Hours services
Timeframe/Baseline: Ongoing
Rationale: Please see the NHS Outcomes Framework and Technical Appendix, which can be found here http://www.dh.gov.uk/health/2012/11/nhs-outcomes-framework/. PLANNING REQUIREMENTS Are plans required and if so, at what frequency? No FURTHER INFORMATION These indicators are the same as indicators 4a i and ii in the NHS Outcomes Framework 2013/14 Technical Appendix, which can be found here https://www.wp.dh.gov.uk/publications/files/2012/11/121109-Technical-Appendix.pdf. Data do not currently exist in a directly comparable format, however, patient experience of primary care services has been measured through the GPPS before it was redesigned this year (see- http://www.gp-patient.co.uk/)

Everyone Counts: Planning for Patients 2013/14 Technical Definitions
43
CB_A13 Friends and family test DEFINITIONS Detailed Descriptor:: The friends and family test will measure whether people receiving NHS treatment would recommend the place where they received care to their friends and family. The national roll out of the test was one of a set of recommendations by the Nursing and Quality Care Forum in May 2012. The Friends and Family Test will be implemented in inpatient wards and A&E departments from April 2013, and for maternity services from October 2013
Lines Within Indicator (Units): The precise formulation of the indicator is still to be confirmed.
Data Definition: Patients will be asked a standard question at the point of discharge from hospital. They will be asked to record a response against a six point scale: Extremely likely/ Likely/ neither likely or unlikely/ unlikely/ extremely unlikely/ don’t know. The precise mechanism for scoring responses and converting the data into an indicator is yet to be confirmed. The definition of the indicator will depend on the output from research work that is currently underway and expected to report in January. MONITORING Monitoring Frequency: To be decided
Monitoring Data Source: Under development ACCOUNTABILITY What Success Looks Like, Direction, Milestones: Improving the number or proportion of positive recommendations to friends and family by people receiving NHS Treatment for the place where they received this care. It is still to be decided how positive and negative responses will be combined to form an indicator.
Timeframe/Baseline: Ongoing
Rationale: The friends and family test will measure whether people receiving NHS treatment would recommend the place where they received care to their friends and family. The national roll out of the test was one of a set of recommendations by the Nursing and Quality Care Forum in May 2012. The Friends and Family Test will be implemented in inpatient wards and A&E departments from April 2013

Everyone Counts: Planning for Patients 2013/14 Technical Definitions
44
PLANNING REQUIREMENTS Are plans required and if so, at what frequency? No FURTHER INFORMATION This indicator is the same as indicator 4c in the NHS Outcomes Framework 2013/14 Technical Appendix, which can be found here https://www.wp.dh.gov.uk/publications/files/2012/11/121109-Technical-Appendix.pdf.

Everyone Counts: Planning for Patients 2013/14 Technical Definitions
45
CB_A14: Patient experience of hospital care DEFINITIONS Detailed Descriptor:: Patient experience of hospital care, as reported by patients in responses to the Care Quality Commission Inpatient Survey.
Lines Within Indicator (Units): This overall patient experience score is the average (mean) of five domain scores, and each domain score is the average (mean) of scores from a number of selected questions in the CQC Inpatient Services Survey.
Data Definition: Indicator construction: Access & waiting domain: Q9: How do you feel about the length of time you were on the waiting list before your admission to hospital? (Scores: “I was admitted as soon as I thought was necessary” 100; “I should have been admitted a bit sooner” 50; “I should have been admitted a lot sooner” 0.) Q11: Was your admission date changed by the hospital? (Scores: “No” 100; “Yes, once” 67; “Yes, 2 or 3 times” 33; “Yes, 4 times or more” 0.) Q12: From the time you arrived at the hospital, did you feel that you had to wait a long time to get to a bed on a ward? (Scores: “No” 100; “Yes, to some extent” 50; “Yes, definitely” 0.) Safe, high quality co-ordinated care domain: Q40: Sometimes in a hospital, a member of staff will say one thing and another will say something quite different. Did this happen to you? (Scores: “No” 100; “Yes, sometimes” 50; “Yes, often” 0.) Q59: On the day you left hospital, was your discharge delayed for any reason? (Scores: “No” 100; “Yes 0”. Exception: Records are excluded where the answer to Q60 “What was the main reason for the delay?” is “Something else” and not “I had to wait for medicines”, “I had to wait to see the doctor” or “I had to wait for an ambulance”.) Q67: Did a member of staff tell you about any danger signals you should watch for after you went home? (Scores: “Yes, completely” 100; “Yes, to some extent” 50; “No” 0.) Better information, more choice domain: Q41: Were you involved as much as you wanted to be in decisions about your care and treatment? (Scores: “Yes, definitely” 100; “Yes, to some extent” 50; “No” 0.) Q63: Did a member of staff explain the purpose of the medicines you were to take at home in a way you could understand? (Scores: “Yes, completely” 100; “Yes, to some extent” 50; “No” 0; “I did not need an explanation” and “I had no medicines” are excluded.) Q64: Did a member of staff tell you about medication side effects to watch for when you went home? (Scores: “Yes, completely” 100; “Yes, to some extent” 50; “No” 0; “I did not need an explanation” are excluded.) Building closer relationships domain:

Everyone Counts: Planning for Patients 2013/14 Technical Definitions
46
Q31: When you had important questions to ask a doctor, did you get answers that you could understand? (Scores: “Yes, always” 100; “Yes, sometimes” 50; “No” 0; “I had no need to ask” are excluded.) Q33: Did doctors talk in front of you as if you weren’t there? (Scores: “No” 100; “Yes, sometimes” 50; “Yes, often” 0.) Q35: When you had important questions to ask a nurse, did you get answers that you could understand? (Scores: “Yes, always” 100; “Yes, sometimes” 50; “No” 0; “I had no need to ask” are excluded.) Q37: Did nurses talk in front of you as if you weren’t there? (Scores: “No” 100; “Yes, sometimes” 50; “Yes, often” 0.) Clean, friendly, comfortable place to be domain: Q20 & Q21: Mean average of “Were you ever bothered by noise at night from other patients?” and “Were you ever bothered by noise at night from hospital staff?” (Scores for both: “No” 100; “Yes” 0.) Q22: In your opinion, how clean was the hospital room or ward that you were in? (Scores: “Very clean” 100; “Fairly clean” 67; “Not very clean” 33; “Not at all clean” 0.) Q28: How would you rate the hospital food? (Scores: “Very good” 100; “Good” 67; “Fair” 33; “Poor” 0.) Q46: Were you given enough privacy when being examined or treated? (Scores: “Yes, always” 100; “Yes, sometimes” 50; “No” 0.) Q48: Do you think the hospital staff did everything they could to help control your pain? (Scores: “Yes, definitely” 100; “Yes, to some extent” 50; “No” 0.) Q72: Overall, did you feel you were treated with respect and dignity while you were in the hospital? (Scores: “Yes, always” 100; “Yes, sometimes” 50; “No” 0.) Indicator format: Number. Individual questions are scored according to a pre-defined scoring regime that awards scores between 0-100. Therefore, this indicator will also take values between 0-100, where 0 is the worst score and 100 is the best score. Subject to review, additional information will be provided indicating the proportion of survey respondents giving a response that can be interpreted as “very poor” (see introductory section to this Domain). These data will be at national level. Assessment of question responses that indicate “very poor” care is based on considerations of experience that should not occur in a health care setting. Only the overall score will be used as the high level outcome measure. However, performance can be disaggregated by each of the domains, and then again at the level of each individual survey question that makes up the indicator. Confirmation of the methodology used to construct the indicator is available on the DH website: www.dh.gov.uk/en/Publicationsandstatistics/PublishedSurvey/NationalsurveyofNHSpatients/DH_087516 The 2011 questionnaire is on the Picker Institute site: www.nhssurveys.org/survey/1093 MONITORING Monitoring Frequency: Annual (calendar year).

Everyone Counts: Planning for Patients 2013/14 Technical Definitions
47
2011 data published April 2012. Data for 2012 will be available in April/May 2013. The national data for this measure are published annually on the DH website in accordance with national statistics guidelines (see the first link below). Detailed results for each provider, presented question by question, are also published on the CQC website (see second link below). http://webarchive.nationalarchives.gov.uk/+/www.dh.gov.uk/en/Publicationsandstatistics/PublishedSurvey/NationalsurveyofNHspatients/DH_087516; http://www.cqc.org.uk/aboutcqc/howwedoit/involvingpeoplewhouseservices/patientsurveys.cfm
Monitoring Data Source: The Care Quality Commission’s Adult Inpatient Survey – from the CQC nationally coordinated patient survey programme. The latest adult inpatient survey (2011) was published by CQC and the updated Overall Patient Experience measure, presenting results as used for this indicator, were published in April 2012 by DH at the following websites, respectively: http://www.cqc.org.uk/aboutcqc/howwedoit/involvingpeoplewhouseservices/patientsurveys/inpatientservices.cfm; http://transparency.dh.gov.uk/tools-for-understanding-patient-experience/ Guidance material for this survey (covering inclusion and exclusion criteria for compiling the sample frame) is available on the NHS national patient survey coordination centre website: www.nhssurveys.org. ACCOUNTABILITY What success looks like, Direction, Milestones: Improvement in patients’ experiences of NHS inpatient care.
Timeframe/Baseline: Ongoing
Rationale: Please see the NHS Outcomes Framework and Technical Appendix, which can be found here http://www.dh.gov.uk/health/2012/11/nhs-outcomes-framework/. PLANNING REQUIREMENTS Are plans required and if so, at what frequency? No FURTHER INFORMATION This indicator is the same as indicator 4b in the NHS Outcomes Framework 2013/14 Technical Appendix, which can be found here https://www.wp.dh.gov.uk/publications/files/2012/11/121109-Technical-Appendix.pdf. Data and further information about this indicator are published in the NHS Outcomes Framework section of the NHS IC Indicator Portal, which can be found here https://indicators.ic.nhs.uk/webview/.

Everyone Counts: Planning for Patients 2013/14 Technical Definitions
48
CB_A15: Healthcare acquired infection (HCAI) measure (MRSA) DEFINITIONS Detailed Descriptor:: Number of cases of Methicillin-resistant Staphylococcus aureus (MRSA) bacteraemia, as defined below.
Lines Within Indicator (Units): Infections (positive samples).
Data Definition: Indicator description: Overall number of cases of MRSA bacteraemia. Indicator construction: Based on mandatory surveillance of MRSA through the HPA Data Capture System. Indicator format: Number. MONITORING Monitoring Frequency: Monthly, quarterly and annual summaries of surveillance data. Monthly data are published around 6 weeks afters the period covered.
Monitoring Data Source: Mandatory surveillance of MRSA bacteraemia (Health Protection Agency – HPA) ACCOUNTABILITY What success looks like, direction, milestones Reducing the incidence of healthcare associated infections (HCAI)
Timeframe/Baseline: Ongoing
Rationale: Please see the NHS Outcomes Framework and Technical Appendix, which can be found here http://www.dh.gov.uk/health/2012/11/nhs-outcomes-framework/. PLANNING REQUIREMENTS Are plans required and if so, at what frequency? No FURTHER INFORMATION This indicator is the same as indicator 5.2i in the NHS Outcomes Framework 2013/14 Technical Appendix, which can be found here

Everyone Counts: Planning for Patients 2013/14 Technical Definitions
49
https://www.wp.dh.gov.uk/publications/files/2012/11/121109-Technical-Appendix.pdf. Data and further information about this indicator are published in the NHS Outcomes Framework section of the NHS IC Indicator Portal, which can be found here https://indicators.ic.nhs.uk/webview/. Guidance on the NHS commissioning board’s approach to zero tolerance of MRSA bacteraemia will be published early in 2013.

Everyone Counts: Planning for Patients 2013/14 Technical Definitions
50
CB_A16: Healthcare acquired infection (HCAI) measure (clostridium difficile infections) DEFINITIONS Detailed Descriptor: Number of Clostridium difficile infections, as defined below, for patients aged 2 or more on the date the specimen was taken.
Lines Within Indicator (Units): Infections (cases diagnosed as C. difficile infections)
Data Definition: Indicator description: Overall number of cases of C. difficile Indicator construction: Based on mandatory surveillance of C. difficile as reported to the HPA Data Capture System. Indicator format: Number MONITORING Monitoring Frequency: Monthly, quarterly and annual summaries of surveillance data Monthly data are published around 6 weeks after the period covered.
Monitoring Data Source: Mandatory surveillance of C. difficile (HPA) ACCOUNTABILITY What success looks like, direction, milestones Reducing the incidence of healthcare associated infection (HCAI)
Timeframe/Baseline: Ongoing
Rationale: Please see the NHS Outcomes Framework and Technical Appendix, which can be found here http://www.dh.gov.uk/health/2012/11/nhs-outcomes-framework/. PLANNING REQUIREMENTS Are plans required and if so, at what frequency? No, CCGS are required to self certify delivery of their objective. FURTHER INFORMATION

Everyone Counts: Planning for Patients 2013/14 Technical Definitions
51
This indicator is the same as indicator 5.2ii in the NHS Outcomes Framework 2013/14 Technical Appendix, which can be found here https://www.wp.dh.gov.uk/publications/files/2012/11/121109-Technical-Appendix.pdf. Data and further information about this indicator are published in the NHS Outcomes Framework section of the NHS IC Indicator Portal, which can be found here https://indicators.ic.nhs.uk/webview/. The objectives for each organisation (providers and CCGs) are available through the Everyone counts: Planning for Patients 2013/14 section of the NHS Commissioning Board website (http://www.commissioningboard.nhs.uk/everyonecounts/)

Everyone Counts: Planning for Patients 2013/14 Technical Definitions
52
Everyone Counts - Annex B Measures CB_B1-B3: Referral to Treatment pathways DEFINITIONS Detailed Descriptor:: The percentage of Referral to Treatment (RTT) pathways within 18 weeks for completed admitted pathways, completed non-admitted pathways and incomplete pathways.
Lines Within Indicator (Units): CB_B1 - the percentage of admitted pathways within 18 weeks for admitted patients whose clocks stopped during the period on an adjusted basis CB_B2 - the percentage of non-admitted pathways within 18 weeks for non-admitted patients whose clocks stopped during the period CB_B3 - the percentage of incomplete pathways within 18 weeks for patients on incomplete pathways at the end of the period
Data Definition: A calculation of the percentage within 18 weeks for completed admitted RTT pathways, completed non-admitted RTT pathways and incomplete RTT pathways based on referral to treatment data provided by NHS and independent sector organisations and signed off by NHS commissioners. The definitions that apply for RTT waiting times are set out in the RTT Clock Rules Suite found here: http://transparency.dh.gov.uk/2012/06/29/rtt-waiting-times-guidance/ MONITORING Monitoring Frequency: Monthly
Monitoring Data Source: Consultant-led RTT Waiting Times data collection (National Statistics) ACCOUNTABILITY What success looks like, Direction, Milestones: Performance will be judged against the following waiting time standards:-
• Admitted operational standard of 90% – the percentage of admitted pathways (on an adjusted basis) within 18 weeks should equal or exceed 90%
• Non-admitted operational standard of 95% – the percentage of non-admitted pathways within 18 weeks should equal or exceed 95%
• Incomplete operational standard of 92% – the percentage of incomplete pathways within 18 weeks should equal or exceed 92%
Timeframe/Baseline: Ongoing

Everyone Counts: Planning for Patients 2013/14 Technical Definitions
53
Rationale: The operational standards of 90 per cent for admitted and 95 per cent for non-admitted completed waits as set out in the standing rules. In order to sustain the delivery of these standards, trusts also need to ensure that a minimum of 92 per cent of patients on an incomplete pathway should have been waiting no more than 18 weeks. These RTT waiting time standards leave an operational tolerance to allow for patients who wait longer than 18 weeks to start their treatment because of choice or clinical exception. These circumstances can be categorised as:
• Patient choice - patients choose not to accept earliest offered reasonable appointments along their pathway or choose to delay treatments for personal or social reasons
• Co-operation - patients who do not attend appointments that they have agreed along their pathways
• Clinical exceptions - where it is not clinically appropriate to start a patient's treatment within 18 weeks
PLANNING REQUIREMENTS Are plans required and if so, at what frequency? No FURTHER INFORMATION Data and full guidance can be found here: http://transparency.dh.gov.uk/2012/06/29/rtt-waiting-times/

Everyone Counts: Planning for Patients 2013/14 Technical Definitions
54
CB_B4: Diagnostic test waiting times DEFINITIONS Detailed Descriptor:: The percentage of patients waiting 6 weeks or more for a diagnostic test.
Lines Within Indicator (Units):
The percentage of patients waiting 6 weeks or more for a diagnostic test (15 key diagnostic tests) at the end of the period
Data Definition:
The number of patients waiting 6 weeks or more for a diagnostic test (15 key tests) based on monthly diagnostics data provided by NHS and independent sector organisations and signed off by NHS commissioners as a percentage of the total number of patients waiting at the end of the period. The definitions that apply for diagnostics are set out in the guidance here: http://transparency.dh.gov.uk/2012/07/05/diagnostics-information/
MONITORING Monitoring Frequency: Monthly
Monitoring Data Source: Monthly diagnostics data collection - DM01 ACCOUNTABILITY What Success Looks Like, Direction, Milestones: Performance will be judged against the following standard: Diagnostic operational standard of less than 1% – the percentage of patients waiting 6 weeks or more for a diagnostic test should be less than 1%
Timeframe/Baseline: Ongoing
Rationale: Prompt access to diagnostic tests is a key supporting measure to the delivery of the NHS Constitution referral to treatment (RTT) maximum waiting time standards. Early diagnosis is also important for patients and central to improving outcomes, e.g. early diagnosis of cancer improves survival rates. PLANNING REQUIREMENTS Are plans required and if so, at what frequency?

Everyone Counts: Planning for Patients 2013/14 Technical Definitions
55
No FURTHER INFORMATION Data and full guidance can be found here: http://transparency.dh.gov.uk/2012/07/05/diagnostics-information/ Updated guidance will be published in early 2013 to reflect the organisation of the NHS from April 2013. The current principles and rules of monitoring waiting times will remain.

Everyone Counts: Planning for Patients 2013/14 Technical Definitions
56
CB_B5: A&E waiting time - total time in the A&E department DEFINITIONS Detailed Descriptor:: Percentage of patients who spent 4 hours or less in A&E
Lines Within Indicator (Units): 1. Total number of A&E attendances. 2. Number of A&E attendances where the patient spent 4 hours or less in A&E from arrival to transfer, admission or discharge. 3. Percentage of A&E attendances where the patient spent 4 hours or less in A&E from arrival to transfer, admission or discharge
Data Definition: Full definitions can be found in weekly sitrep guidance notes at the following address http://transparency.dh.gov.uk/2012/06/14/ae-info/ A&E, means a Type 1, Type 2 or Type 3 A&E department. Types of A&E/Minor Injury Unit (MIU) service are: Type 1 A&E department = A consultant led 24 hour service with full resuscitation facilities and designated accommodation for the reception of accident and emergency patients Type 2 A&E department = A consultant led single specialty accident and emergency service (e.g. ophthalmology, dental) with designated accommodation for the reception of patients Type 3 A&E department = Other type of A&E/minor injury units (MIUs)/Walk-in Centres, primarily designed for the receiving of accident and emergency patients. A type 3 department may be doctor led or nurse led. It may be co-located with a major A&E or sited in the community. A defining characteristic of a service qualifying as a type 3 department is that it treats at least minor injuries and illnesses (sprains for example) and can be routinely accessed without appointment. An appointment based service (for example an outpatient clinic) or one mainly or entirely accessed via telephone or other referral (for example most out of hours services), or a dedicated primary care service (such as GP practice or GP-led health centre) is not a type 3 A&E service even though it may treat a number of patients with minor illness or injury. MONITORING Monitoring Frequency: Weekly
Monitoring Data Source:
Weekly sitrep data (WSitAE).
Everyone Counts: Planning for Patients 2013/14 Technical Definitions
57
ACCOUNTABILITY What success looks like, Direction, Milestones: Standard is 95% of patients seen within 4 hours
Timeframe/Baseline: Ongoing
Rationale: Longer lengths of stay in the emergency department are associated with poorer health outcomes and patient experience as well as transport delays, treatment delays, ambulance diversion, patients leaving without being seen, and financial effects. It is critical that patients receive the care they need in a timely fashion, so that patients who require admission are placed in a bed as soon as possible, patients who need to be transferred to other healthcare providers receive transport with minimal delays, and patients who are fit to go home are discharged safely and rapidly. There is professional agreement that some patients need prolonged times in A&E. However, these exceptions are rare and unlikely to account for more than 5% of attendances. International literature suggests increases in adverse outcomes for patients who have been in the A&E for more than 4-6 hours. Excessive total time in the A&E is linked to poor outcomes and patient delays should be minimised (but care should not be hurried or rushed). Changes in the practice of emergency medicine in some departments also means that more is being done for patients in the A&E, which may take longer but is for the benefit of the patient. PLANNING REQUIREMENTS Are plans required and if so, at what frequency? No FURTHER INFORMATION

Everyone Counts: Planning for Patients 2013/14 Technical Definitions
58
CB_B6-B7: Cancer 2 week waits DEFINITIONS Detailed Descriptor:: Two week wait (urgent referral) services (including cancer)- Percentage of patients seen within two weeks of an urgent GP referral for suspected cancer (CB_B6) and percentage of patients seen within two weeks of an urgent referral for breast symptoms where cancer was not initially suspected (CB_B7).
Lines Within Indicator (Units): CB_B6: All cancer two week wait All patients urgently referred with suspected cancer by their GP (GMP or GDP) who were first seen within a period Patients urgently referred with suspected cancer by their GP (GMP or GDP) who were first seen within 14 calendar days within a period CB_B7: Two week wait for breast symptoms (where cancer was not initially suspected) All patients urgently referred for evaluation/investigation of “breast symptoms” by a primary or secondary care professional within a period, excluding those referred urgently for suspected breast cancer who were first seen within the period. Patients urgently referred for evaluation/investigation of “breast symptoms” by a primary or secondary care professional during a period (excluding those referred urgently for suspected breast cancer) who were first seen within 14 calendar days during the period. All referrals to a breast clinical team, excluding those for suspected cancer, and those to family history clinics should be included within the dataset supplied for CB_B7.
Data Definition: Numerator and denominator details are defined above. All data are to be returned to the Cancer Waiting Times Database (CWT-Db) as per the definitions and mandates for the National Cancer Waiting Times Monitoring Dataset (NCWTMDS) specified to the NHS in Amd 23/2011. A copy of this documentation is available at: http://www.isb.nhs.uk/documents/isb-0147/amd-23-2011/index_html An interactive copy of the NCWTMDS definitions, including the changes specified in Amd 23/2011, is available in the NHS Data Dictionary at: http://www.datadictionary.nhs.uk/data_dictionary/messages/clinical_data_sets/data_sets/national_cancer_waiting_times_monitoring_data_set_fr.asp?shownav=1 MONITORING Monitoring Frequency: Monthly and Quarterly
Monitoring Data Source:

Everyone Counts: Planning for Patients 2013/14 Technical Definitions
59
Data are sourced from the CWT-Db on a monthly and quarterly basis. ACCOUNTABILITY What success looks like, Direction, Milestones: CB_B6: All cancer two week wait Performance is to be sustained at or above the published operational standard CB_B7: Two week wait for breasts symptoms (where cancer was not initially suspected) Performance is to be sustained at or above the published operational standard Details of current operational standards are available at: http://www.dh.gov.uk/en/Publicationsandstatistics/Lettersandcirculars/Dearcolleagueletters/DH_103436
Timeframe/Baseline: Ongoing
Rationale: These two week wait services are a vital component of the patient pathway, they ensure fast access to diagnostic tests, supporting the provision of an earlier diagnosis and therefore assist in improving survival rates for cancer. It remains important for patients with cancer or its symptoms, to be seen by the right person, with appropriate expertise, within two weeks to ensure that they receive the best possible survival probability and a lower level of anxiety than if they were waiting for a routine appointment. This indicator also relates to a patient’s right to be seen in two weeks as expressed in the NHS Constitution. Details of this are available at: http://www.dh.gov.uk/prod_consum_dh/groups/dh_digitalassets/@dh/@en/@ps/documents/digitalasset/dh_113644.pdf PLANNING REQUIREMENTS Are plans required and if so, at what frequency? No FURTHER INFORMATION The all cancer two week wait was introduced by the NHS Cancer Plan (2000), a copy of which is available at: http://www.dh.gov.uk/en/Publicationsandstatistics/Publications/PublicationsPolicyAndGuidance/DH_4009609 The two week wait for breast symptoms (where cancer was not initially suspected) was introduced by the Cancer Reform Strategy (2007), a copy of which is available at: http://www.dh.gov.uk/en/Publicationsandstatistics/Publications/PublicationsPolicyAndGuidance/DH_081006 As part of the development of Improving Outcomes: a Strategy for Cancer (2011) a

Everyone Counts: Planning for Patients 2013/14 Technical Definitions
60
Review of Waiting Times Standards was undertaken, this identified that these standards should be retained due to their benefits for patients. Both these documents are available at: http://www.dh.gov.uk/en/Publicationsandstatistics/Publications/PublicationsPolicyAndGuidance/DH_123371 Full guidance on the monitoring of these services and supporting information on the scope and patient pathways are available at: http://nww.connectingforhealth.nhs.uk/nhais/cancerwaiting/documentation

Everyone Counts: Planning for Patients 2013/14 Technical Definitions
61
CB_B8-B11: Cancer day 31 waits DEFINITIONS Detailed Descriptor:: Cancer 31 day waits- Percentage of patients receiving first definitive treatment within one month (31-days) of a cancer diagnosis (measured from ‘date of decision to treat’) (CB_B8) Percentage of patients receiving subsequent treatment for cancer within 31-days, where that treatment is a Surgery (CB_B9), an Anti-Cancer Drug Regimen (CB_B10) or a Radiotherapy Treatment Course (CB_B11).
Lines Within Indicator (Units): CB_B8: Percentage of patients receiving first definitive treatment within one month
of a cancer diagnosis (measured from ‘date of decision to treat’) Denominator: Total number of patients receiving first definitive treatment for cancer within a given period for all cancers (ICD-10 C00 to C97 and D05) Numerator: Number of patients receiving first definitive treatment for cancer within 31 days of receiving a diagnosis (decision to treat) within a given period for all cancers (ICD-10 C00 to C97 and D05) CB_B9: 31-day standard for subsequent cancer treatments-surgery Denominator: Total number of patients receiving subsequent surgery within a given period, including patients with recurrent cancer. Numerator: Number of patients receiving subsequent surgery within a maximum waiting time of 31-days during a given period, including patients with recurrent cancer. Scope: Those treatments classified as “Surgery” within the National Cancer Waiting Times Monitoring Dataset (NCWTMDS) CB_B10: 31-day standard for subsequent cancer treatments-anti cancer drug regimens Denominator: Total number of patients receiving a subsequent/adjuvant anti-cancer drug regimen within a given period, including patients with recurrent cancer. Numerator: Number of patients receiving a subsequent/adjuvant anti-cancer drug regimen within a maximum waiting time of 31-days during a given period, including patients with recurrent cancer. Scope: Using the definitions published in the NCWTMDS “Anti-Cancer Drug Regimens” might include: Cytotoxic Chemotherapy, Immunotherapy, Hormone Therapy and other and unspecified drug treatments. CB_B11: 31-day standard for subsequent cancer treatments-radiotherapy Denominator: Total number of patients receiving subsequent/adjuvant radiotherapy treatment within a given period, including patients with recurrent cancer. Numerator: Number of patients receiving subsequent/adjuvant radiotherapy treatment

Everyone Counts: Planning for Patients 2013/14 Technical Definitions
62
within a maximum waiting time of 31-days during a given period, including patients with recurrent cancer. Scope: Using the definitions published in the NCWTMDS “Radiotherapy Treatments” might include: Teletherapy (beam radiation), Brachytherapy, Chemoradiotherapy and Proton Therapy.
Data Definition: Numerator and denominator details are defined above. All data are to be returned to the Cancer Waiting Times Database (CWT-Db) as per the definitions and mandates for the National Cancer Waiting Times Monitoring Dataset (NCWTMDS) specified to the NHS in Amd 23/2011. A copy of this documentation is available at: http://www.isb.nhs.uk/documents/isb-0147/amd-23-2011/index_html An interactive copy of the NCWTMDS definitions, including the changes specified in Amd 23/2011, is available in the NHS Data Dictionary at: http://www.datadictionary.nhs.uk/data_dictionary/messages/clinical_data_sets/data_sets/national_cancer_waiting_times_monitoring_data_set_fr.asp?shownav=1 MONITORING Monitoring Frequency: Monthly and Quarterly
Monitoring Data Source: Data are sourced from the CWT-Db on a monthly and quarterly basis. ACCOUNTABILITY What success looks like, Direction, Milestones: Performance is to be sustained at or above the published operational standard Details of current operational standards are available at: http://www.dh.gov.uk/en/Publicationsandstatistics/Lettersandcirculars/Dearcolleagueletters/DH_103436
Timeframe/Baseline: Ongoing
Rationale: Maintaining these standards will ensure that cancer patients receive all treatments within their package of care within clinically appropriate timeframes, thus providing a better patient-centred care and improve cancer outcomes. PLANNING REQUIREMENTS Are plans required and if so, at what frequency? No

Everyone Counts: Planning for Patients 2013/14 Technical Definitions
63
FURTHER INFORMATION The all cancer one-month standard was introduced by the NHS Cancer Plan (2000), a copy of which is available at: http://www.dh.gov.uk/en/Publicationsandstatistics/Publications/PublicationsPolicyAndGuidance/DH_4009609 The 31-day subsequent treatment standards (surgery, anti-cancer drug regimen and radiotherapy) were introduced, with different operational timings, by the Cancer Reform Strategy (2007), a copy of which is available at: http://www.dh.gov.uk/en/Publicationsandstatistics/Publications/PublicationsPolicyAndGuidance/DH_081006 As part of the development of Improving Outcomes: a Strategy for Cancer( 2011) a review of waiting times standards was undertaken, this confirmed that these standards should be retained due to their benefits for patients. Both these documents are available at: http://www.dh.gov.uk/en/Publicationsandstatistics/Publications/PublicationsPolicyAndGuidance/DH_123371 Full guidance on the monitoring of these services and supporting information on the scope and patient pathways are available at: http://nww.connectingforhealth.nhs.uk/nhais/cancerwaiting/documentation

Everyone Counts: Planning for Patients 2013/14 Technical Definitions
64
CB_B12-B14: Cancer 62 day waits DEFINITIONS Detailed Descriptor:: CB_B12: Percentage of patients receiving first definitive treatment for cancer within two
months (62 days) of an urgent GP referral for suspected cancer. CB_B13: Percentage of patients receiving first definitive treatment for cancer within 62-
days of referral from an NHS Cancer Screening Service. CB_B14: Percentage of patients receiving first definitive treatment for cancer within 62-
days of a consultant decision to upgrade their priority status.
Lines Within Indicator (Units): CB_B12: All cancer two month urgent referral to first treatment wait Total number of patients receiving first definitive treatment for cancer following an urgent GP (GDP or GMP) referral for suspected cancer within a given period, for all cancers (ICD-10 C00 to C97 and D05) Number of patients receiving first definitive treatment for cancer within 62-days following an urgent GP (GDP or GMP) referral for suspected cancer within a given period, for all cancers (ICD-10 C00 to C97 and D05) CB_B13: 62-day wait for first treatment following referral from an NHS cancer
screening service Total number of patients receiving first definitive treatment for cancer following referral from an NHS Cancer Screening Service within a given period (covers any cancer ICD-10 C00 to C97 and D05) Number of patients receiving first definitive treatment for cancer within 62-days following referral from an NHS Cancer Screening Service during a given period (covers any cancer ICD-10 C00 to C97 and D05) CB_B14: 62-Day wait for first treatment For cancer following a consultants decision
to upgrade the patient’s priority Total number of patients receiving first definitive treatment for cancer following a consultant decision to upgrade their priority status within a given period Numerator: Number of patients receiving first definitive treatment for cancer within 62-days of a consultant decision to upgrade their priority status. Scope: Patients included in this indicator will not have been referred urgently for suspected cancer by their GP or referred with suspected cancer from an NHS Cancer Screening Service with suspected cancer (routine referrals from these services where cancer was not initially suspected may be upgraded).
Data Definition: Numerator and denominator details are defined above. All data are to be returned to the Cancer Waiting Times Database (CWT-Db) as per

Everyone Counts: Planning for Patients 2013/14 Technical Definitions
65
the definitions and mandates for the National Cancer Waiting Times Monitoring Dataset (NCWTMDS) specified to the NHS in Amd 23/2011. A copy of this documentation is available at: http://www.isb.nhs.uk/documents/isb-0147/amd-23-2011/index_html An interactive copy of the NCWTMDS definitions, including the changes specified in Amd 23/2011, is available in the NHS Data Dictionary at: http://www.datadictionary.nhs.uk/data_dictionary/messages/clinical_data_sets/data_sets/national_cancer_waiting_times_monitoring_data_set_fr.asp?shownav=1 MONITORING Monitoring Frequency: Monthly and Quarterly
Monitoring Data Source: Data are sourced from the CWT-Db on a monthly and quarterly basis. ACCOUNTABILITY What success looks like, Direction, Milestones: CB_B12-B13: Performance is to be sustained at or above the published operational standard Details of current operational standards are available at: http://www.dh.gov.uk/en/Publicationsandstatistics/Lettersandcirculars/Dearcolleagueletters/DH_103436 CB_B14: There is no current operational standard for this component, therefore this will not be centrally assessed against a set threshold. These performance data will however be monitored and published as national statistics.
Timeframe/Baseline: Ongoing
Rationale: Maintaining these standards will ensure that a cancer patient will receive timely access to treatment and move along their pathway of care at a clinically appropriate pace, thus providing better patient-centred care and improve cancer outcomes. PLANNING REQUIREMENTS Are plans required and if so, at what frequency? No FURTHER INFORMATION The All Cancer Two Month Standard was introduced by the NHS Cancer Plan (2000), a copy of which is available at: http://www.dh.gov.uk/en/Publicationsandstatistics/Publications/PublicationsPolicyAndGuidance/DH_4009609

Everyone Counts: Planning for Patients 2013/14 Technical Definitions
66
The 62-day wait for first treatment following referral from an NHS Screening Service was introduced by the Cancer Reform Strategy (2007), a copy of which is available at: http://www.dh.gov.uk/en/Publicationsandstatistics/Publications/PublicationsPolicyAndGuidance/DH_081006 The 62-day standard was extended to include those patients whose priority is upgraded by the consultant responsible for their care in the same document. As part of the development of Improving Outcomes: a Strategy for Cancer (2011) a Review of Waiting Times Standards was undertaken which confirmed that these standards should be retained due to their benefits for patients. Both these documents are available at: http://www.dh.gov.uk/en/Publicationsandstatistics/Publications/PublicationsPolicyAndGuidance/DH_123371 Full guidance on the monitoring of these services and supporting information on the scope and patient pathways are available at: http://nww.connectingforhealth.nhs.uk/nhais/cancerwaiting/documentation
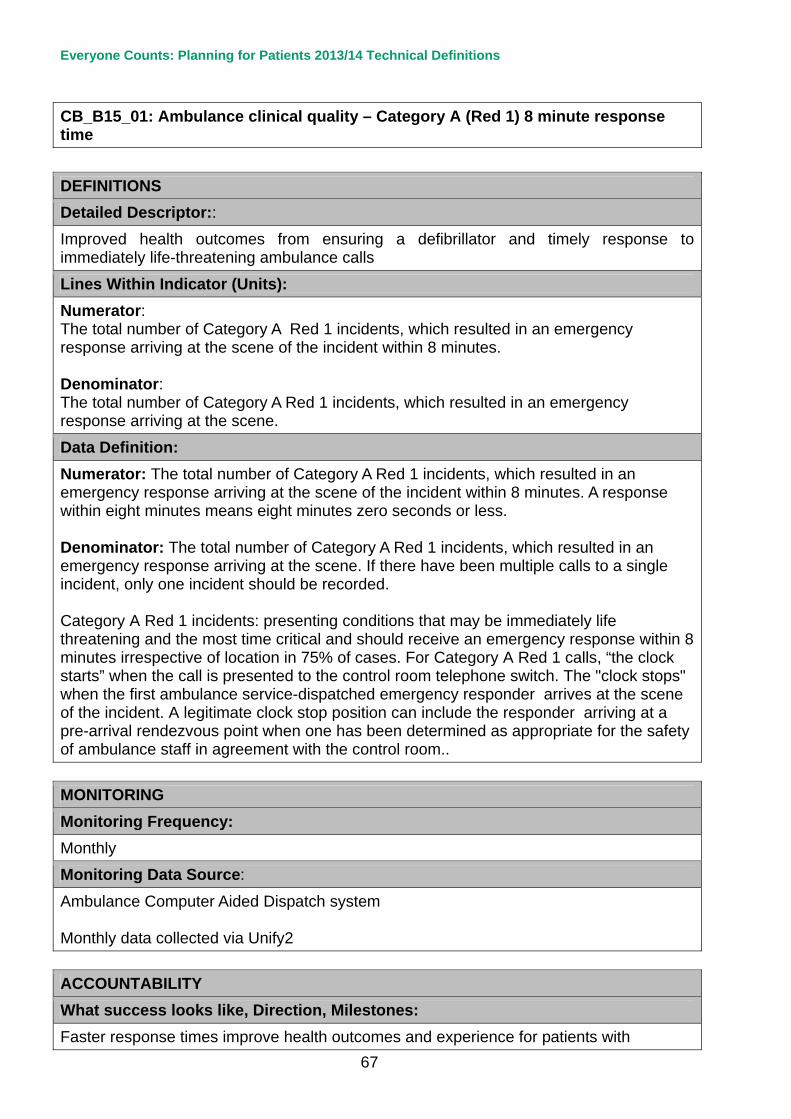
Everyone Counts: Planning for Patients 2013/14 Technical Definitions
67
CB_B15_01: Ambulance clinical quality – Category A (Red 1) 8 minute response time DEFINITIONS Detailed Descriptor:: Improved health outcomes from ensuring a defibrillator and timely response to immediately life-threatening ambulance calls
Lines Within Indicator (Units): Numerator: The total number of Category A Red 1 incidents, which resulted in an emergency response arriving at the scene of the incident within 8 minutes. Denominator: The total number of Category A Red 1 incidents, which resulted in an emergency response arriving at the scene.
Data Definition: Numerator: The total number of Category A Red 1 incidents, which resulted in an emergency response arriving at the scene of the incident within 8 minutes. A response within eight minutes means eight minutes zero seconds or less. Denominator: The total number of Category A Red 1 incidents, which resulted in an emergency response arriving at the scene. If there have been multiple calls to a single incident, only one incident should be recorded. Category A Red 1 incidents: presenting conditions that may be immediately life threatening and the most time critical and should receive an emergency response within 8 minutes irrespective of location in 75% of cases. For Category A Red 1 calls, “the clock starts” when the call is presented to the control room telephone switch. The "clock stops" when the first ambulance service-dispatched emergency responder arrives at the scene of the incident. A legitimate clock stop position can include the responder arriving at a pre-arrival rendezvous point when one has been determined as appropriate for the safety of ambulance staff in agreement with the control room.. MONITORING Monitoring Frequency: Monthly Monitoring Data Source:
Ambulance Computer Aided Dispatch system Monthly data collected via Unify2 ACCOUNTABILITY What success looks like, Direction, Milestones: Faster response times improve health outcomes and experience for patients with

Everyone Counts: Planning for Patients 2013/14 Technical Definitions
68
immediately life-threatening conditions. Category A Red 1 incidents: Presenting conditions that may be immediately life threatening and the most time critical and should receive an emergency response within 8 minutes irrespective of location in 75% of cases.
Timeframe/Baseline: Ongoing
Rationale: Faster response times improve health outcomes and experience for patients with immediately life-threatening conditions. Ambulance services should aim for continuous improvement on these indicators and monitor as long a time series as possible (24 continuous months is preferable). In addition to comparing current performance with performance in the immediately preceding periods, services may also find it helpful to compare current performance against a baseline of activity in the same period in the previous year. This will allow services to place current performance in context, and stimulate discussion on how to continuously improve. When comparing current performance with historical performance care should be taken to assess how much of the observed change in activity or performance is affected by changes in the coverage and quality of the data PLANNING REQUIREMENTS Are plans required and if so, at what frequency? No FURTHER INFORMATION Further guidance on all indicators included in the Ambulance Quality Indicators collection can be found on the Department of Health Transparency website at: http://transparency.dh.gov.uk/2012/06/19/ambqiguidance/

Everyone Counts: Planning for Patients 2013/14 Technical Definitions
69
CB_B15_02: Ambulance clinical quality – Category A (Red 2) 8 minute response time DEFINITIONS Detailed Descriptor:: Improved health outcomes from ensuring a defibrillator and timely response to immediately life-threatening ambulance calls
Lines Within Indicator (Units): Numerator: The total number of Category A Red 2 incidents, which resulted in an emergency response arriving at the scene of the incident within 8 minutes. Denominator: The total number of Category A Red 2 incidents, which resulted in an emergency response arriving at the scene.
Data Definition: Numerator: The total number of Category A Red 2 incidents, which resulted in an emergency response arriving at the scene of the incident within 8 minutes. A response within eight minutes means eight minutes zero seconds or less. Denominator: The total number of Category A Red 2 incidents, which resulted in an emergency response arriving at the scene. If there have been multiple calls to a single incident, only one incident should be recorded. Category A Red 2 incidents: Presenting conditions which may be life threatening but less time critical than Red 1 and should receive an emergency response within 8 minutes irrespective of location in 75% of cases. For Category A Red 2 calls, “the clock starts” from the earliest of the chief complaint information being obtained, a vehicle being assigned or 60 seconds after the time at which the call is presented to the control room telephone switch. The "clock stops" when the first ambulance service-dispatched emergency responder arrives at the scene of the incident. A legitimate clock stop position can include the responder arriving at a pre-arrival rendezvous point when one has been determined as appropriate for the safety of ambulance staff in agreement with the control room. MONITORING Monitoring Frequency: Monthly
Monitoring Data Source: Ambulance Computer Aided Dispatch system Monthly data collected via Unify2 ACCOUNTABILITY What Success Looks Like, Direction, Milestones: Faster response times improve health outcomes and experience for patients with

Everyone Counts: Planning for Patients 2013/14 Technical Definitions
70
immediately life-threatening conditions. Category A Red 2 incidents: presenting conditions that may be life threatening but less time critical than Red 1 and should receive an emergency response within 8 minutes irrespective of location in 75% of cases.
Timeframe/Baseline: Ongoing
Rationale: Faster response times improve health outcomes and experience for patients with immediately life-threatening conditions. Ambulance services should aim for continuous improvement on these indicators and monitor as long a time series as possible (24 continuous months is preferable). In addition to comparing current performance with performance in the immediately preceding periods, services may also find it helpful to compare current performance against a baseline of activity in the same period in the previous year. This will allow services to place current performance in context, and stimulate discussion on how to continuously improve. When comparing current performance with historical performance care should be taken to assess how much of the observed change in activity or performance is affected by changes in the coverage and quality of the data PLANNING REQUIREMENTS Are plans required and if so, at what frequency? No FURTHER INFORMATION Further guidance on all indicators included in the Ambulance Quality Indicators collection can be found on the Department of Health Transparency website at: http://transparency.dh.gov.uk/2012/06/19/ambqiguidance/

Everyone Counts: Planning for Patients 2013/14 Technical Definitions
71
CB_B16: Ambulance clinical quality - Category A 19 minute transportation time DEFINITIONS Detailed Descriptor:: Patient outcomes can be improved by ensuring patients with immediately life-threatening conditions receive a response at the scene which is able to transport the patient in a clinically safe manner, if they require such a response.
Lines Within Indicator (Units): Numerator: The total number of calls resulting in an ambulance arriving at the scene of the incident within 19 minutes. Denominator: The total number of Category A incidents with ambulance response arriving at the scene of the incident
Data Definition: Numerator: The total number of Category A incidents, which resulted in a fully equipped ambulance vehicle (car or ambulance) able to transport the patient in a clinically safe manner arriving at the scene within 19 minutes of the request being made Denominator: The total number of Category A calls resulting in an ambulance able to transport the patient arriving at the scene of the incident Category A incidents: Presenting conditions, which may be immediately life threatening and should receive an ambulance response at the scene within 19 minutes irrespective of location in 95% of cases. The "clock stops" when the first emergency response vehicle able to transport the patient arrives at the scene of the incident. A legitimate clock stop position can include the vehicle arriving at a pre-arrival rendezvous point when one has been determined as appropriate for the safety of ambulance staff in agreement with the control room. MONITORING Monitoring Frequency: Monthly
Monitoring Data Source: Ambulance Computer Aided Dispatch system, collected via Unify2 ACCOUNTABILITY What success looks like, Direction, Milestones: Faster response times improve health outcomes and experience for patients with immediately life-threatening conditions. Category A incidents: Presenting conditions, which may be immediately life threatening and should receive an ambulance response at the scene within 19 minutes irrespective of location in 95% of cases.

Everyone Counts: Planning for Patients 2013/14 Technical Definitions
72
Timeframe/Baseline: Ongoing
Rationale: Patient outcomes can be improved by ensuring patients with immediately life-threatening conditions receive a response at the scene which is able to transport the patient in a clinically safe manner, if they require such a response. Ambulance services should aim for continuous improvement on these indicators and monitor as long a time series as possible (24 continuous months is preferable). In addition to comparing current performance with performance in the immediately preceding periods, services may also find it helpful to compare current performance against a baseline of activity in the same period in the previous year. This will allow services to place current performance in context, and stimulate discussion on how to continuously improve. When comparing current performance with historical performance care should be taken to assess how much of the observed change in activity or performance is affected by changes in the coverage and quality of the data. PLANNING REQUIREMENTS Are plans required and if so, at what frequency? No FURTHER INFORMATION Further guidance on all indicators included in the Ambulance Quality Indicators collection can be found on the Department of Health Transparency website at: http://transparency.dh.gov.uk/2012/06/19/ambqiguidance/

Everyone Counts: Planning for Patients 2013/14 Technical Definitions
73
CB_B17: Mixed Sex Accommodation (MSA) Breaches DEFINITIONS Detailed Descriptor:: Patient Experience: Breaches of Same Sex Accommodation All providers of NHS funded care are expected to eliminate mixed-sex accommodation, except where it is in the overall best interest of the patient, in accordance with the definitions set out in the Professional Letter CNO/2010/3. Since April 2011, all providers of NHS funded care have routinely reported breaches of sleeping accommodation, as set out in national guidance, and hence attract contract sanctions in respect of each patient affected.
Lines Within Indicator (Units): This data set supports the collection of consistently defined data on breaches of DH guidance on Mixed-Sex Accommodation. (NB: The policy commitment relates to gender, not sex, but to ensure a better public understanding it is referred to as Mixed-Sex Accommodation (MSA)). The focus of the indicator and the associated central reporting, is on MSA breaches in respect of sleeping accommodation only - even though the NHS is required to monitor locally all justified mixing in sleeping accommodation, all mixed-sex sharing of bathroom/toilet facilities (including passing through accommodation or toilet/bathroom facilities used by the opposite gender). Locally, it will also monitor lack of provision of women-only day areas in mental health units. A breach of the policy occurs each time an admitted patient is placed in MSA, outside the terms of the policy. The collection of NHS organisations’ MSA breaches in relation to sleeping accommodation commenced from 1 December 2010, with routine reporting from January 2011. NHS organisations must submit aggregated data to the Unify2 data collection system, detailing the hospital site where the breach occurred and the patient’s commissioning organisation. For performance monitoring of MSA, it will be the MSA breach rate (MSA breaches per 1,000 FCEs [Finished Consultant Episode]), as well as the number of breaches, that will need to be monitored. MSA Breach Rate Indicator Definition: The number of breaches of mixed-sex accommodation (MSA) sleeping accommodation, per 1,000 FCEs. Formula: MSA Breach Rate = Numerator/Denominator x 1,000 Numerator: The number of MSA breaches for the reporting month in question. Data Source: MSA Unify2 data collection

Everyone Counts: Planning for Patients 2013/14 Technical Definitions
74
Denominator: The number of FCEs that finished in the month, regardless of when they started. Data source: Inpatient HES (Hospital Episode Statistics)
Data Definition: Providers are required to report all breaches of sleeping accommodation* - i.e. for each patient affected, via the Unify2 system. Detailed definition of what constitutes a breach of same sex guidance is provided in Professional Letter CNO/2010/3. * “Sleeping accommodation” includes areas where patients are admitted and cared for on beds or trolleys, even where they do not stay overnight. It therefore includes all admissions and assessment units (including clinical decision units), plus day surgery and endoscopy units. It does not include areas where patients have not been admitted, such as accident and emergency cubicles. An Information Standards Notice (ISN) has been published for the MSA data collection (Ref: ISB 1573). This can be found at: http://www.isb.nhs.uk/library/standard/226 New NHS Data Dictionary standards have been published for the MSA data collection. These can be found at: http://www.isb.nhs.uk/documents/isb-1573/amd-168-2010/cr1207.pdf
MONITORING Monitoring Frequency: Monitoring is based on a monthly data collection. Monthly publications take place on the third Thursday of every month.
Monitoring Data Source: Unify2 Performance monitoring arrangements. ACCOUNTABILITY What success looks like, Direction, Milestones: All providers of NHS funded care are expected to eliminate mixed-sex accommodation, except where it is in the overall best interest of the patient. Ability to deliver this requirement is the key indicator of success.
Timeframe/Baseline: Ongoing
Rationale: Patients have told us that mixed sex accommodation is distressing to patients at a time when they feel at their most vulnerable. The above focus means that organisations will be held to account for managing beds and facilities to eliminate MSA. It also better facilitates commissioners’ application of sanctions to NHS organisations that breach the guidance. Publication of the associated breach data means that patients and the public will be better informed about an organisation’s progress in eliminating mixed sex accommodation.

Everyone Counts: Planning for Patients 2013/14 Technical Definitions
75
PLANNING REQUIREMENTS Are plans required and if so, at what frequency? No FURTHER INFORMATION For more information on the MSA breach rate indicator, please refer to the methodology paper on the MSA publication website. This can be located via: http://transparency.dh.gov.uk/2012/07/10/mixed-sex-accommodation/

Everyone Counts: Planning for Patients 2013/14 Technical Definitions
76
CB_B18: Cancelled Operations DEFINITIONS Detailed Descriptor:: All patients who have operations cancelled, on or after the day of admission (including the day of surgery), for non-clinical reasons to be offered another binding date within 28 days, or the patient’s treatment to be funded at the time and hospital of the patient’s choice.
Lines Within Indicator (Units): Numerator: The number of breaches of the cancelled operations standard in the quarter. A breach should be counted at the point it occurs i.e. if after 28 days of a last minute cancellation the patient has not been treated then the breach should be recorded. The last minute cancellation associated with this breach may have occurred in the same quarter or in a previous quarter. Please note that the 28 day period does not stop at the end of a quarter but is continuous. Denominator: The number of last minute cancellations by the hospital for non clinical reasons in the quarter. Last minute means on the day the patient was due to arrive, after the patient has arrived in hospital or on the day of the operation or surgery.
Data Definition: Guidance and definitions are available here: http://transparency.dh.gov.uk/2012/07/10/cancelled-elective-operations-2/ MONITORING Monitoring Frequency: Quarterly.
Monitoring Data Source: QMCO Quarterly Monitoring Cancelled Operations Unify2 Performance monitoring arrangements. ACCOUNTABILITY What success looks like, Direction, Milestones: Reduction in the number of cancelled operations.
Timeframe/Baseline: Ongoing
Rationale: It is not in the patient’s interest to have their operation cancelled. PLANNING REQUIREMENTS Are plans required and if so, at what frequency? No

Everyone Counts: Planning for Patients 2013/14 Technical Definitions
77
FURTHER INFORMATION

Everyone Counts: Planning for Patients 2013/14 Technical Definitions
78
CB_B19: Mental Health Measure – Care Programme Approach (CPA) DEFINITIONS Detailed Descriptor:: Care Programme Approach (CPA) 7 day follow up- The proportion of those patients on Care Programme Approach (CPA) discharged from inpatient care who are followed up within 7 days
Lines Within Indicator (Units): The indicator is the numerator divided by the denominator, expressed as a percentage Numerator: The number of people under adult mental illness specialties on CPA who were followed up (either by face to face contact or by phone discussion) within 7 days of discharge from psychiatric in-patient care. Denominator: The total number of people under adult mental illness specialties on CPA who were discharged from psychiatric in-patient care. All patients discharged from a psychiatric in-patient ward are regarded as being on CPA.
Data Definition: All patients discharged to their place of residence, care home, residential accommodation, or to non psychiatric care must be followed up within 7 days of discharge. All avenues need to be exploited to ensure patients are followed up within 7 days of discharge. Where a patient has been transferred to prison, contact should be made via the prison in-reach team. Exemption:
• Patients who die within 7 days of discharge may be excluded.
• Where legal precedence has forced the removal of a patient from the country.
• Patients transferred to NHS psychiatric inpatient ward.
• CAMHS (child and adolescent mental health services) are not included. The 7 day period should be measured in days not hours and should start on the day after the discharge. MONITORING Monitoring Frequency: Quarterly
Monitoring Data Source: Unify2 ACCOUNTABILITY

Everyone Counts: Planning for Patients 2013/14 Technical Definitions
79
What success looks like, Direction, Milestones: Achieving at least 95% rate of patients followed up after discharge each quarter
Timeframe/Baseline: Ongoing
Rationale: Reduction in the overall rate of death by suicide will be supported by arrangement for securing provision by commissioners of appropriate care for all those with mental ill health. To reduce risk and social exclusion and improve care pathways to Patients on CPA discharged from a spell of in-patient care. PLANNING REQUIREMENTS Are plans required and if so, at what frequency? No FURTHER INFORMATION Data and full guidance can be found here: http://transparency.dh.gov.uk/2012/06/21/mh-community-teams-activity-information/

Everyone Counts: Planning for Patients 2013/14 Technical Definitions
80
Everyone Counts - Supporting Measure CB_S1: Non-elective FFCEs (First Finished Consultant Episode) DEFINITIONS Detailed Descriptor:: Total number of non-elective FFCEs in general & acute (G&A) specialties in a month
Lines Within Indicator (Units): Number of G&A non-elective FFCEs in the period
Data Definition: Non-Elective FFCEs data are derived from the Monthly Activity Return, which is collected from the NHS. It is collected from providers (both NHS and IS) who provide the data broken down by Commissioner. Number of first finished consultant episodes (FFCEs) for the G&A specialties (see below) relating to hospital provider spells for which: patient classification = ordinary admission; admission method = emergency admission, maternity admission, other admission
(codes 21-83); episode number = 1.
Exclude "well babies". These are defined as having admission method = other and neonatal level of care = normal care. General & Acute specialties include: 100-192, 300-460, 502, 800-831, 900 and 901 exclude: 501, 700-715
Monthly Activity Return guidance is available here: http://transparency.dh.gov.uk/?p=18657 MONITORING Monitoring Frequency: Monthly
Monitoring Data Source: Monthly Activity Returns ACCOUNTABILITY What success looks like, Direction, Milestones: There should be a reduction in the growth of the number of non-elective FFCEs.
Timeframe/Baseline: Ongoing

Everyone Counts: Planning for Patients 2013/14 Technical Definitions
81
Rationale: Where clinically appropriate, it is better for patients to be treated or continue their treatment at home or in their community rather than in hospital. The local NHS should be looking to treat patients in the most clinically appropriate way. PLANNING REQUIREMENTS Are plans required and if so, at what frequency? Yes, monthly for 2013/14 and forecast outturn for 2012/13. FURTHER INFORMATION http://www.connectingforhealth.nhs.uk/systemsandservices/data/nhsdmds/faqs

Everyone Counts: Planning for Patients 2013/14 Technical Definitions
82
CB_S2: All first outpatient attendances DEFINITIONS Detailed Descriptor:: All first outpatient attendances (consultant-led) in general and acute specialties.
Lines Within Indicator (Units): Number of attendances in the period.
Data Definition: A count of all outpatient attendances taking place within the period, whether taking place within a consultant clinic session or outside a session. The patient must have been seen by a consultant, or a clinician acting for the consultant, for examination or treatment. Specifically, the number of consultant outpatient attendances in general & acute specialties for which: • first attendance = yes; • attended or did not attend = attended (and was seen); • First Attendance of the Out-Patient Attendance Consultant Care Contact = National Code 1 'First attendance face to face' or 3 'First telephone or telemedicine consultation'. This includes first outpatient attendance for all consultant outpatient episodes for all sources of referral. Activity delivered in a primary care setting lines should also be included. General & Acute specialties: include: 100-192, 300-460, 502, 800-831, 900, 901 but exclude: 501,700-715 Monthly Activity Return guidance is available here: http://transparency.dh.gov.uk/?p=18657 MONITORING Monitoring Frequency: Monthly.
Monitoring Data Source: Monthly Activity Return (MAR). ACCOUNTABILITY What success looks like, Direction, Milestones: Sustain compliance with the NHS constitution’s right to access services within maximum waiting times
Timeframe/Baseline: Ongoing

Everyone Counts: Planning for Patients 2013/14 Technical Definitions
83
Rationale: Commissioners need to show that their plans for referrals and activity are realistic, and will sustain compliance with the NHS constitution’s right to access services within maximum waiting times. PLANNING REQUIREMENTS Are plans required and if so, at what frequency? Yes, monthly for 2013/14 and forecast outturn for 2012/13. FURTHER INFORMATION Connecting for Health website: http://www.connectingforhealth.nhs.uk/systemsandservices/data/datamodeldictionary/help/faqs-07/index_html

Everyone Counts: Planning for Patients 2013/14 Technical Definitions
84
CB_S3: Elective finished first consultant episodes (FFCEs) DEFINITIONS Detailed Descriptor:: Number of general & acute (G&A) elective admissions FFCEs
Lines Within Indicator (Units): Line 1: number of G&A elective ordinary admission FFCEs in the period Line 2: number of G&A daycase FFCEs in the period Line 3: total number of G&A elective FFCEs in the period Note: Line 1 + Line 2 = Line 3
Data Definition: Number of finished first consultant episodes (FFCEs) for the G&A specialties (see below) relating to hospital provider spells for which: • patient classification = ordinary admission (1) Daycase admission (2); • admission method = elective admission (admission method 11, 12, 13); Exclude “well babies”. These are defined as having admission method = other and neonatal level of care = normal care. • episode number = 1 General & Acute specialties include:100-192, 300-460, 502, 800-831, 900, 901 exclude: 501, 700-715 Monthly Activity Return guidance is available here: http://transparency.dh.gov.uk/?p=18657 MONITORING Monitoring Frequency: Monthly
Monitoring Data Source: Monthly Activity Return ACCOUNTABILITY What success looks like, Direction, Milestones: That elective activity will reflect future demand and the move of activity into other primary care and community settings where appropriate.

Everyone Counts: Planning for Patients 2013/14 Technical Definitions
85
Timeframe/Baseline: 2012/13 annual forecast outturn
Rationale: Commissioners need to show that their plans for referrals and activity are realistic, and will sustain compliance with the NHS constitution’s right to access services within maximum waiting times. PLANNING REQUIREMENTS Are plans required and if so, at what frequency? Yes, for line 3 (total number of G&A elective FFCEs) only. FURTHER INFORMATION Connecting for Health website: http://www.connectingforhealth.nhs.uk/systemsandservices/data/datamodeldictionary/help/faqs-07/index_html

Everyone Counts: Planning for Patients 2013/14 Technical Definitions
86
CB_S4: A&E Attendances DEFINITIONS Detailed Descriptor:: Number of attendances at A&E departments
Lines Within Indicator (Units): Line 1: Number of attendances at Type 1 A&E Departments Line 2: Total Number of attendances at all A&E Departments Note: Line 1 is subset of Line 2
Data Definition: A&E Attendance figures are sourced from weekly SitRep data provided to a central Unify2 collection by Trusts – this is a weekly total taken from a reporting period of 00.01 Monday to 24.00 Sunday. ‘Total A&E attendances’ is defined as the total of type 1, type 2 and type 3 attendances. This is automatically calculated on the SitRep submission form. Data from the forms are collated from Trusts into monthly and quarterly totals on Unify2 and then aggregated into area and national totals by the NHS CB. MONITORING Monitoring Frequency: Weekly
Monitoring Data Source: Weekly Sitrep data ACCOUNTABILITY What success looks like, Direction, Milestones: There should be a reduction in the growth of the number of A&E attendances
Timeframe/Baseline: Ongoing
Rationale: Patients requiring urgent and emergency care get the right care by the right person at the right place and time. There are instances where people presenting to accident and emergency departments because they either do not know how, or are unable, to access the care they feel they need when they want it. The introduction of NHS 111 will assist patients in finding the most appropriate and convenient service for their needs so they receive the best care first time. A reduction in the growth of the number of A&E attendances may indicate a more appropriate use of expensive emergency care, and improve use of other services where appropriate.

Everyone Counts: Planning for Patients 2013/14 Technical Definitions
87
PLANNING REQUIREMENTS Are plans required and if so, at what frequency? Yes, line 2 (total number of attendances at all A&E), for 2013/14, and forecast outturn for 2012/13 FURTHER INFORMATION

Everyone Counts: Planning for Patients 2013/14 Technical Definitions
88
CB_S5: Mental Health Measure- Improved access to psychological services DEFINITIONS Detailed Descriptor:: The primary purpose of this indicator is to measure improved access to psychological services (IAPS) for people with depression and/or anxiety disorders. This is done using two indicators : 1. The proportion of people that enter treatment against the level of need in the general population (the level of prevalence addressed or ‘captured’ by referral routes); and 2. The proportion of people who complete treatment who are moving to recovery
Lines Within Indicator (Units): Indicator 1: The proportion of people that enter treatment against the level of need in the general population i.e. the proportion of people who have depression and/or anxiety disorders who receive psychological therapies Numerator: The number of people who receive psychological therapies Denominator: The number of people who have depression and/or anxiety disorders (local estimate based on Psychiatric Morbidity Survey) Indicator 2: The number of people who are moving to recovery Numerator: The number of people who have completed treatment having attended at least two treatment contacts and are moving to recovery (those who at initial assessment achieved "caseness” and at final session did not) Denominator: (The number of people who have completed treatment within the reporting quarter, having attended at least two treatment contacts) minus (The number of people who have completed treatment not at clinical caseness at initial assessment)
Data Definition: Relevant IAPS data items and the permissible values for each data item are defined in the IAPT Data Standard Psychological therapy: NICE recommended treatment from a qualified psychological therapist (low or high intensity). Definition of a ‘case’: A patient suffering from depression and/or anxiety disorders, as determined by scores on the Patient Health Questionnaire for depression and/or the Patient Health Questionnaire (GAD7) for anxiety disorders, or other anxiety disorder specific measure as appropriate for the patient’s diagnosis. Completed treatment: This is a count of all those who have left treatment within the reporting quarter having attended at least two treatment contacts, for any reason including: planned completion; deceased; dropped out (unscheduled discontinuation); referred to another service or unknown For the denominator of indicator 1, the expectation is NOT that CCGs carry out a survey of their own, but that they extrapolate local prevalence from the national Psychiatric

Everyone Counts: Planning for Patients 2013/14 Technical Definitions
89
Morbidity Survey as part of their needs assessment MONITORING Monitoring Frequency: Quarterly
Monitoring Data Source: NHS Information Centre, Omnibus returns ACCOUNTABILITY What success looks like, Direction, Milestones: Ongoing improvement is anticipated. The mandate anticipates the completion of the full roll-out of the access to psychological therapies programme by 2014/15 (full roll-out is at least 15% of adults with relevant disorders having timely access to services) and the NHS CB will expect CCGs to commission services with that roll-out in mind and for the recovery rate to reach 50%. Progress will be measured by looking at the increase in the proportion of people with anxiety disorders and depression, who access evidence-based psychological therapies. Additionally, it is important to measure the recovery rate of those who receive treatment. Timeframe/Baseline: Ongoing, to 2013/14
Rationale: This indicator focuses on improved access to psychological therapies, in order to address the enduring unmet need. Around one in six adults in England suffer from a common mental health problem, such as depression or an anxiety disorder. Collecting this indicator will demonstrate the extent to which this need is being met. PLANNING REQUIREMENTS Are plans required and if so, at what frequency?
Yes, commissioner plan for 2013/14 for indicator 1 (the proportion of people that enter treatment) FURTHER INFORMATION The IAPT Data Handbook which explains the function of effective data collection and reporting in IAPT is available from http://www.iapt.nhs.uk/services/measuring-outcomes. Detailed guidance on use of the IAPT data set in compiling reports referred to here is contained in the appendices.

Everyone Counts: Planning for Patients 2013/14 Technical Definitions
90
DEFINITIONS Detailed Descriptor:: The number of Referral to Treatment (RTT) pathways greater than 52 weeks for completed admitted pathways (un-adjusted), completed non-admitted pathways and incomplete pathways.
Lines Within Indicator (Units): 1 - the number of admitted pathways greater than 52 weeks for admitted patients whose clocks stopped during the period on an un-adjusted basis 2 - the number of non-admitted pathways greater than 52 weeks for non-admitted patients whose clocks stopped during the period 3 - the number of incomplete pathways greater than 52 weeks for patients on incomplete pathways at the end of the period Note: Contractual fines will apply to line 3 (incomplete pathways), but all three lines will be monitored.
Data Definition: The definitions that apply for RTT waiting times are set out in the RTT Clock Rules Suite found here: http://transparency.dh.gov.uk/2012/06/29/rtt-waiting-times-guidance/ MONITORING Monitoring Frequency: Monthly
Monitoring Data Source: Consultant-led Referral to Treatment Waiting Times data collection (National Statistics) ACCOUNTABILITY What success looks like, Direction, Milestones: Zero RTT pathways greater than 52 weeks
Timeframe/Baseline: Ongoing.
Rationale: The operational standards of 90 per cent for admitted and 95 per cent for non-admitted completed waits as set out in the standing rules. In order to sustain the delivery of these standards, trusts also need to ensure that a minimum of 92 per cent of patients on an incomplete pathway should have been waiting no more than 18 weeks. These RTT waiting time standards leave an operational tolerance to allow for patients who wait longer than 18 weeks to start their treatment because of choice or clinical exception. These circumstances can be categorised as:
CB_S6: Number of 52 week Referral to Treatment Pathways

Everyone Counts: Planning for Patients 2013/14 Technical Definitions
91
• Patient choice - patients choose not to accept earliest offered reasonable appointments along their pathway or choose to delay treatments for personal or social reasons
• Co-operation - patients who do not attend appointments that they have agreed along their pathways
• Clinical exceptions - where it is not clinically appropriate to start a patient's treatment within 18 weeks
Each patient has a right to access non-urgent consultant-led treatment within the maximum waiting time of 18 weeks, or for the NHS to take all reasonable steps to offer a range of alternative providers if this is not possible. However, there remains a small number of patients who are waiting too long. It is unfair to provide patients with a right and then not deliver against it. As such, we wish to identify an absolute minimum for all patients. From 2013/14 the following additional safeguard will be in place:
• Zero tolerance of any referral to treatment waits of more than 52 weeks, with intervention, including contractual fines when this occurs.
PLANNING REQUIREMENTS Are plans required and if so, at what frequency? No FURTHER INFORMATION Data and full guidance can be found here: http://transparency.dh.gov.uk/2012/06/29/rtt-waiting-times/

Everyone Counts: Planning for Patients 2013/14 Technical Definitions
92
DEFINITIONS Detailed Descriptor:: Ambulance handover delays
Lines Within Indicator (Units): 1. Ambulance handover delays of over 30 minutes 2. Ambulance handover delays of over 1 hour
Data Definition: The number of handover delays of longer than 30 minutes, and of those the number over one hour. Clock start - arrival to handover performance (acute trusts) : When an ambulance wheels stop in the patient offloading bay (handbrake applied and ‘Red at Hospital’ button is pressed on the MDT) Clock stop - Patient Handover / Trolley Clear performance (acute trusts): The time at which clinical handover has been fully completed and the patient has been physically transferred onto hospital apparatus. Ambulance apparatus must have been returned, enabling the ambulance crew to leave the department. Count all accident, emergency and urgent patients if destined for A&E (either Type 1, 2 or 3). This includes GP urgent patients brought by ambulance to A&E. Do NOT count non-emergency patients. Patients being transported between locations/trusts/hospitals (e.g. for outpatient clinics, tertiary care) should not be counted. Ambulance trusts should not count the time required for crews to complete record forms, clean vehicles, re-stock vehicles or have a break. MONITORING Monitoring Frequency: For local determination
Monitoring Data Source: Local data but currently winter daily sitreps collect data on 30 minute handovers at acute trusts http://transparency.dh.gov.uk/2012/10/26/winter-pressures-daily-situation-reports/ ACCOUNTABILITY What success looks like, Direction, Milestones: Reductions expected in the numbers of handover delays
Timeframe/Baseline:
CB_S7: Ambulance handover time
Everyone Counts: Planning for Patients 2013/14 Technical Definitions
93
Ongoing
Rationale: Delaying ambulances outside A&E as a result of a temporary mismatch between A&E/hospital capacity and numbers of elective/emergency patients arriving is not acceptable. Implementation of the full hospital escalation plan should ensure that A&Es have significant capacity to avoid most instances of ambulance queuing. Patients waiting in the back of ambulances is not acceptable, and there are risks to patients in the community who are not able to receive a 999 response whilst ambulances are waiting at A&E. PLANNING REQUIREMENTS Are plans required and if so, at what frequency? No FURTHER INFORMATION

Everyone Counts: Planning for Patients 2013/14 Technical Definitions
94
DEFINITIONS Detailed Descriptor:: Crew clear delays
Lines Within Indicator (Units): 1. Crew clear delays of over 30 minutes 2. Crew clear delays of over 1 hour
Data Definition: The number of crew clear delays of longer than 30 minutes, and of those the number over one hour. Clock start - Patient Handover / Trolley Clear performance (ambulance service): The time at which clinical handover has been fully completed and the patient has been physically transferred onto hospital apparatus. Ambulance apparatus must have been returned, enabling the ambulance crew to leave the department. Clock stop - Crew Clear performance (ambulance service) and the ambulance turnaround process as a whole: The time at which the ambulance crew has repatriated equipment, finalised paperwork, restocked where appropriate and cleaned the vehicle ready for the next call. Count all accident, emergency and urgent patients if destined for A&E (either Type 1, 2 or 3). This includes GP urgent patients brought by ambulance to A&E. Do NOT count non-emergency patients. Patients being transported between locations/trusts/hospitals (e.g. for outpatient clinics, tertiary care) should not be counted. MONITORING Monitoring Frequency: For local determination
Monitoring Data Source: Local data ACCOUNTABILITY What success looks like, Direction, Milestones: Reductions expected in the numbers of crew ready delays
Timeframe/Baseline: Ongoing
Rationale: Delaying ambulances outside A&E as a result of delays in crews being ready to respond to further calls is not acceptable. There are risks to patients in the community who are not
CB_S8: Crew Clear

Everyone Counts: Planning for Patients 2013/14 Technical Definitions
95
able to receive a 999 response whilst ambulances are waiting at A&E, and ambulance service capacity is severely constrained if crews do not promptly declare themselves clear to respond. PLANNING REQUIREMENTS Are plans required and if so, at what frequency? No FURTHER INFORMATION

Everyone Counts: Planning for Patients 2013/14 Technical Definitions
96
DEFINITIONS Detailed Descriptor:: Patients who have waited over 12 hours in A&E from decision to admit to admission
Lines Within Indicator (Units): Total number of patients who have waited over 12 hours in A&E from decision to admit to admission
Data Definition: The waiting time for an emergency admission via A&E is measured from the time when the decision is made to admit, or when treatment in A&E is completed (whichever is later) to the time when the patient is admitted. i) Time of decision to admit is defined as the time when a clinician decides and records a decision to admit the patient or the time when treatment that must be carried out in A&E before admission is complete – whichever is the later. ii) An emergency admission via A&E is defined as an admission under code 21. Time of admission is defined as the time when such a patient leaves the department to go to:
• An operating theatre. • A bed in a ward (see definition of ward below) • An X-ray or diagnostic test or other treatment directly en route to a bed in a
ward (as defined below) or operating theatre. However, leaving A&E for a diagnostic test or other treatment does not count as time of admission if the patient then returns to A&E to continue waiting for a bed.
Note that in the NHS Data Dictionary, patients waiting following a decision to admit are known as 'Lodged Patients', and they remain in the A&E department from the decision to admit to their Lodging End Time. The lodging end time is defined as follows: ‘The time that the responsibility for nursing care is transferred from an accident and emergency department to a ward thus ending the period as a lodged patient. This will be the same as A&E departure time if the patient was lodged as a result of an accident and emergency attendance.’ ‘The transfer of responsibility may occur when the patient is received into a bed in an appropriate ward, an operating theatre or another setting for immediate treatment (e.g. an X-ray Department) before being received into a bed in an appropriate ward. A bed in an A&E observation and assessment ward may be a transfer of responsibility but a trolley, bed or chair in a corridor would not.’ MONITORING Monitoring Frequency:
CB_S9: Trolley waits in A&E

Everyone Counts: Planning for Patients 2013/14 Technical Definitions
97
Weekly
Monitoring Data Source:
WSitAE http://transparency.dh.gov.uk/2012/06/14/ae-info/ ACCOUNTABILITY What success looks like, Direction, Milestones: There should be no instances of 12 hour trolley waits
Timeframe/Baseline: Ongoing
Rationale: It is not acceptable for patients to be waiting on trolleys for admission for this length of time PLANNING REQUIREMENTS Are plans required and if so, at what frequency? No FURTHER INFORMATION

Everyone Counts: Planning for Patients 2013/14 Technical Definitions
98
DEFINITIONS Detailed Descriptor: Number of urgent operations that are cancelled by the trust for non-clinical reasons, which have already been previously cancelled once for non-clinical reasons.
Lines Within Indicator (Units): Number of urgent operations that are cancelled by the trust for non-clinical reasons, which have already been previously cancelled once for non-clinical reasons.
Data Definition: Count of all urgent operations that are cancelled by the trust for non-clinical reasons, which have already been previously cancelled once for non-clinical reasons. This should exclude patient cancellations. Include all urgent operations that are cancelled for a second time, including emergency patients (i.e. non-elective) who have their operations cancelled. In principle, the majority of urgent cancellations will be urgent elective patients but it is possible that an emergency patient has their operation cancelled (e.g. patient presents at A&E with complex fracture which needs operating on. Patient’s operation is arranged and subsequently cancelled.). Definition of “urgent operation” The definition of 'urgent operation' is one that should be agreed locally in the light of clinical and patient need. However, it is recommended that the guidance as suggested by the National Confidential Enquiry into Perioperative Deaths (NCEPOD) should be followed. Broadly these are: I. Immediate - Immediate (A) life saving or (B) limb or organ saving intervention. Operation
target time within minutes of decision to operate.
II. Urgent – acute onset or deterioration of conditions that threaten life, limb or organ survival. Operation target time within hours of decision to operate.
III. Expedited – stable patient requiring early intervention for a condition that is not an immediate threat to life, limb or organ survival. Operation target time within days of decision to operate.
IV. Elective – Surgical procedure planned or booked in advance of routine admission to
hospital Broadly, (i), (ii) and (iii) should be regarded as 'urgent' for the purpose of meeting this requirement. MONITORING Monitoring Frequency: For local determination
Monitoring Data Source:
Local data but currently winter daily sitreps collect data on urgent operations cancelled for a second time
CB_S10: Urgent operations cancelled for a second time

Everyone Counts: Planning for Patients 2013/14 Technical Definitions
99
http://transparency.dh.gov.uk/2012/10/26/winter-pressures-daily-situation-reports/ ACCOUNTABILITY What success looks like, Direction, Milestones: No patient should have an urgent operation cancelled for a second time.
Timeframe/Baseline: Ongoing
Rationale: Improved patient experience and patient outcomes PLANNING REQUIREMENTS Are plans required and if so, at what frequency? No FURTHER INFORMATION

Everyone Counts: Planning for Patients 2013/14 Technical Definitions
100
© Crown copyright Year 2013 First published 21 December 2012 Second Publication 4 April 2013