evidence-based diabetes management · tients with diabetes, a common marker ... evidence-based ....
TRANSCRIPT

Bridging the gap among payer, provider, and patient perspectives March 2016Volume 22
Special Issue 4
Joslin Diabetes Center
Measuring the Quality of Diabetes CareJ O A N N A M I T R I , M D , M S , A N D R O B E R T A . G A B B AY, M D , P H D , F A C P
Mayo Clinic
When Quality Fails Patients: Finding the Best in Diabetes CareI A N H A R G R A V E S , P H D ; R E N E R O D R I G U E Z - G U T I E R R E Z , M D ; A N D V I C T O R M . M O N T O R I , M D , M S C
National Quality Forum
Getting to Better Care and Outcomes for Diabetes Through MeasurementH E L E N B U R S T I N , M D , M P H , A N D K A R E N J O H N S O N , M S
Recently, while visiting a primary care clinic, one of the authors saw a sign posted on an exam
room wall encouraging patients with diabetes to have their cholesterol mea-sured. Amidst the noise of notices to be found in clinical spaces this seemed in-nocuous enough. The sign went on to explain that patients were encouraged to measure their low-density lipopro-tein cholesterol (LDL-C) levels, so that the clinic could meet its quality target of 100% of diabetes patients with mea-sured cholesterol levels. We also recent-ly heard the story of a woman who un-derwent mammography, only because she did not want to affect her clinician’s screening numbers. In both cases, the rationale for therapy was cast in terms of meeting target quality measures, rather than in terms of doing what is best for the patient. In the care of pa-tients with diabetes, a common marker of quality has been the achievement of tight glycemic control (eg glycated he-moglobin (A1C) - below 7%).1,2 Failure to respond to higher A1C levels with treat-ment intensification has been called “clinical inertia,” and patients who do not achieve this target are often seen as “noncompliant” or difficult.3 The focus on A1C is so pervasive, that a survey of patients, with diabetes, identified lowering A1C as a more important jus-tification to try a new diabetes drug than avoiding amputations, blindness, or kidney damage.4 The only outcome surveyed patients ranked higher than A1C was avoiding death. How is it that lowering A1C, as a goal, can be second only to avoiding death?
(continued on SP144) (continued on SP145) (continued on SP147)
ROLE OF PHARMACY. Where the clinical pharmacist fits into the success of diabetes care with Montefiore’s Care Management Organization, SP128.
BENEFITS OF BIOMARKERS. How can stakeholders—payers, patients, and pharma—benefit from the identification of blood proteins to predict cardiovascular events in those treated for diabetes? SP132.
CHANGE IN KENTUCKY. How case management by Coventry Healthcare, a division of Aetna, produced measurable change in hard-to-treat diabetes patients in Appalachia, SP130.
AFREZZA’S WILD RIDE. From the end of a relationship with Sanofi to the death of MannKind’s founder, recent months have brought one change after another for the only inhaled insulin on the market, SP137.
Also In This Issue...
SODA POLITICSSP140THE NEW TOBACCO? An interview with nutrition advocate Marion Nestle, PhD, MPH, on her book Soda Politics, which traces how Coca-Cola and PepsiCo came to occupy their places in our culture and our refrigerators. With CDC data on soda consumption, diabetes, and obesity.
Evidence-Based Diabetes ManagementS P E C I A L I S S U E : A L L A B O U T M E A S U R E M E N T
Diabetes is the 7th leading cause of death in the United States and afflicts more than 29 mil-
lion Americans, often causing major complications, such as heart disease, retinopathy, and chronic kidney dis-ease.1 Existing quality measures have provided an important foundation to help improve diabetes care. Specifically, healthcare performance measures are important tools used to quantify the quality, cost, and efficiency of care pro-vided to patients. Healthcare providers use measurement results to gauge the quality of care that is being provided, determine where improvement efforts are most needed, and monitor whether or not improvement activities are hav-ing the desired effects. The primary goal of healthcare performance mea-surement is to improve the quality of healthcare received by patients and their families, and ultimately, to im-prove health.
To help drive broader health im-provements for people living with dia-betes or prediabetes, the healthcare community needs to address the lack of measures in numerous important areas, such as measures to better as-sess patients’ health outcomes, mea-sures targeted to those with metabolic syndrome, and measures that use various types of clinical and patient-reported information.
NQF MEASURE ENDORSEMENT The mission of the National Quality Forum (NQF), a nonprofit, nonpartisan, membership-based organization, is to
INTRODUCTION
The prevalence of diabetes con-tinues to rise worldwide, plac-ing an increasing burden on
healthcare systems, payers, and pro-viders. Despite a national decline in glycated hemoglobin (A1C), 33% to 49% of patients still do not meet tar-gets for glycaemia, blood pressure (BP), or low-density lipoprotein (LDL) cholesterol control, and only 14% meet targets for all 3 measures and nonsmoking status1.
The huge gap between ideal and actual diabetes care is not surprising. Diabetes management is complex. Our healthcare system is more acute care–oriented and not well equipped to meet the needs of chronic disease management, which requires a focus on self-management support, patient engagement, team-based care, and population management.
Diabetes management should also extend beyond glycemic control. Opti-mal diabetes management requires not only control of blood glucose levels; BP and cholesterol control are also critical to prevent cardiovascular disease—the leading cause of mortality for those with diabetes. In addition, screening for early complications through an-nual eye and foot exams, and lifestyle modifications, such as physical activ-ity, dietary modification, and smoking cessation require extensive counseling and coordination. Without appropriate tracking, these items are likely to be missed.
The driving force for any quality measurement program is to improve medical care to produce better health outcomes. Among chronic diseases,

As accountable care organizations and other emerging delivery and payment models move healthcare away from traditional fee-for-service toward cost-effective and value-based care, the need to understand how these models will evolve is critical to building long-term strategic solutions.
The mission of The American Journal of Managed Care’s ACO & Emerging Healthcare Delivery Coalition is to bring together a diverse group of key stakeholders, including ACO providers and leaders, payers, IDNs, retail and specialty pharmacy, academia, national quality organizations, patient advocacy groups, employers, and pharmaceutical manufacturers to work collaboratively to build value and improve the quality and overall outcomes of patient care.
Coalition members share ideas and best practices through 2 live meetings and 4 Web-based interactive sessions each year. Distinguishing features are the Coalition’s access to leading experts and its small workshops that allow creative problem solving. To learn more and to sign up as a member, visit www.ajmc.com/acocoalition.
Our next live meeting is April 28-29, 2016, at the JW Marriott Camelback Inn in Scottsdale, Arizona. To register, visit www.ajmc.com/acocoalition/spring16.
“We have some great speakers lined up for the spring meeting. But even more important are the conversations that occur after the speakers. How are we facilitating dialogue that continues to advance our thinking, so when we go back to work on Monday we can actually implement what we learned.”Anthony D. Slonim, MD, DrPH, CPE, FACPE, president and CEO, Renown Health; ACO & Emerging Healthcare Delivery Coalition Chair
Please contact us at [email protected] with any questions or for additional information. We look forward to hearing from you soon.
Accountable Care®
The American Journal of
April 28-29, 2016 • Scottsdale, AZ
April 28-29, 2016 • Scottsdale, AZ
ACO Spring 2016

Evidence-Based Diabetes Management • March 2016 • Volume 22, Special Issue 4 | SP125
Office Center at Princeton Meadows, Bldg. 300 Plainsboro, NJ 08536 • (609) 716-7777
Copyright © 2016 by Managed Care & Healthcare Communications, LLC
The American Journal of Managed Care ISSN 1088-0224 (print) & ISSN 1936-2692 (online) is published monthly by Managed Care & Healthcare Communications, LLC, 666 Plainsboro Rd, Bldg. 300, Plainsboro, NJ 08536. Copyright© 2016 by Managed Care & Healthcare Communications, LLC. All rights reserved. As provided by US copyright law, no part of this publication may be reproduced, displayed, or transmitted in any form or by any means, electronic or mechanical, without the prior written permission of the publisher. For subscription in-quiries or change of address, please call 888-826-3066. For permission to photocopy or reuse material from this journal, please contact the Copyright Clearance Center, Inc., 222 Rosewood Drive, Danvers, MA 01923; Tel: 978-750-8400; Web: www.copyright.com. Reprints of articles are available in minimum quantities of 250 copies. To order custom reprints, please contact Brian Haug, The American Journal of Managed Care, [email protected]; Tel: 609-716-7777. The American Journal of Managed Care is a registered trademark of Managed Care & Healthcare Communications, LLC. www.ajmc.com • Printed on acid-free paper.
Scan here to visitajmc.com.
SENIOR VICE PRESIDENT OF OPERATIONS AND CLINICAL AFFAIRSJeff D. Prescott, PharmD, RPh ASSOCIATE EDITORIAL DIRECTORNicole Beagin
MANAGING EDITORMary K. Caffrey
MANAGING EDITORSurabhi Dangi-Garimella, PhD
QUALITY ASSURANCE EDITORSMaggie ShawGriselda Demassey
DESIGNERGwen Salas
PUBLISHING STAFF
CHAIRMAN AND CEOMike Hennessy, Sr
VICE CHAIRMANJack Lepping PRESIDENTMike Hennessy, Jr
EXECUTIVE VICE PRESIDENTAND GENERAL MANAGERJohn Maglione CHIEF OPERATING OFFICERAND CHIEF FINANCIAL OFFICERNeil Glasser, CPA/CFE
PRESIDENT, MANAGED MARKETS, PHARMACY, AND RARE DISEASEBrian Haug
VICE PRESIDENT, DIGITAL
MEDIAJung Kim
CHIEF CREATIVE OFFICERJeff Brown HUMAN RESOURCE DIRECTORShari Lundenberg
CORPORATE OFFICERS
ASSOCIATE PUBLISHERJustin T. Gallagher
DIRECTOR OF SALESSara Belanger
NATIONAL ACCOUNT MANAGERGil Hernandez
CONTROLLERLeah Babitz, CPA
ACCOUNTANTSTejinder GillKim Rotunno VICE PRESIDENT OFFINANCEMichael Pico
GROUP DIRECTOR, CIRCULATION & PRODUCTIONJohn Burke
SALES & MARKETING
Volume 22 Special Issue 4 | C O N T E N T S
SP126 F RO M T H E C H A I R M A N
SP127 F RO M T H E E D I TO R I N C H I E F Understanding Matters of Measurement in Diabetes Care ROBERT A . GABBAY, MD, PHD, FACP
FEATURES
R O L E O F P H A R M AC Y
SP128 The Role of the Clinical Pharmacist in Achieving Clinical and Quality Outcomes in Diabetes Management JOSEPH MANGANELL I , PHARMD, MPA
P O P U L AT I O N H E A LT H
SP129 Closing the Gap on Health Inequality HARVEY W. KAUFMAN , MD, MBA , FCAP
PAY E R P E R S P E C T I V E
SP130 Impact of the Coventry Complex Case Management Program in the Kentucky Medicaid Population KENNETH J SNOW, MD, MBA
B I O M A R K E R S I N D I A B E T E S
SP132 Evidence for the Benefit of Targeted Proteomics in the Era of the “Big Data” Approach RALPH MCDADE, PHD
H E A LT H I T
SP133 In Mississippi, Telehealth Makes a Measurable Difference in Diabetes Care MARY CAFFREY
DATA P R OT E C T I O N
SP134 Getting the Most From Healthcare Data Requires Steps to Prevent Breaches LEE BARRETT
PAT I E N T- R E P O R T E D O U TC O M E S
SP135 Demystifying “Patient-Centered” Care in Type 2 Diabetes: The Role of Systematic Measurement SHANA B . TRAINA , PHD, AND APRIL SLEE , MS
P H A R M A U P DAT E
SP137 MannKind: Path to Afrezza Survival Involves Lower Prices to Woo Payers ANDREW SMITH
O B E S I T Y
SP140 Is Soda the New Tobacco? An Expert, and New CDC Data, Say Yes MARY CAFFREY
DEPARTMENTS
R E S E A RC H R E P O R T MARY CAFFREY
SP142 Aflibercept Outperforms Bevacizumab for DME in Patients With Moderate Vision Loss 5-Year Study Finds Liraglutide Reduced Risk of Major CV Events
M A NAG E D CA R E U P DAT E
SP142 CMS, AHIP Align and Simplify Quality Measures With 7 Core Sets L AURA JOSZT
COVER FEATURES
M AYO C L I N I C
SP144 When Quality Fails Patients: Finding the Best in Diabetes Care IAN HARGRAVES, PHD; RENE RODRIGUEZ -
GUTIERREZ , MD; AND V ICTOR M. MONTORI ,
MD, MSC
NAT I O NA L Q UA L I T Y F O RU M
SP145 Getting to Better Care and Outcomes for Diabetes Through Measurement HELEN BURST IN , MD, MPH, AND KAREN
JOHNSON , MS
J O S L I N D I A B E T E S C E N T E R
SP147 Measuring the Quality of Diabetes Care JOANNA MITR I , MD, MS, AND ROBERT A .
GABBAY, MD, PHD, FACP
Source: CDC
Trends in Diabetes and Risk Factors, 2004 to 2012*Diabetes Incidence Among Adults | Age-Adjusted per 1000 | 2012*
SP130As accountable care organizations and other emerging delivery and payment models move healthcare away from traditional fee-for-service toward cost-effective and value-based care, the need to understand how these models will evolve is critical to building long-term strategic solutions.
The mission of The American Journal of Managed Care’s ACO & Emerging Healthcare Delivery Coalition is to bring together a diverse group of key stakeholders, including ACO providers and leaders, payers, IDNs, retail and specialty pharmacy, academia, national quality organizations, patient advocacy groups, employers, and pharmaceutical manufacturers to work collaboratively to build value and improve the quality and overall outcomes of patient care.
Coalition members share ideas and best practices through 2 live meetings and 4 Web-based interactive sessions each year. Distinguishing features are the Coalition’s access to leading experts and its small workshops that allow creative problem solving. To learn more and to sign up as a member, visit www.ajmc.com/acocoalition.
Our next live meeting is April 28-29, 2016, at the JW Marriott Camelback Inn in Scottsdale, Arizona. To register, visit www.ajmc.com/acocoalition/spring16.
“We have some great speakers lined up for the spring meeting. But even more important are the conversations that occur after the speakers. How are we facilitating dialogue that continues to advance our thinking, so when we go back to work on Monday we can actually implement what we learned.”Anthony D. Slonim, MD, DrPH, CPE, FACPE, president and CEO, Renown Health; ACO & Emerging Healthcare Delivery Coalition Chair
Please contact us at [email protected] with any questions or for additional information. We look forward to hearing from you soon.
Accountable Care®
The American Journal of
April 28-29, 2016 • Scottsdale, AZ
April 28-29, 2016 • Scottsdale, AZ
ACO Spring 2016
Evidence-Based Diabetes ManagementE D I TO R I A L B OA R D
E D I T O R I N C H I E FROBERT GABBAY, MD, PHD, FACPChief Medical Officer and Senior Vice PresidentJoslin Diabetes CenterBoston, MA
MICHAEL E . CHERNEW, PHDDepartment of Health Care PolicyHarvard Medical SchoolBoston, MA
JEFFREY D . DUNN , PHARMD, MBAFormulary and Contract ManagerSelectHealthSalt Lake City, UT
A . MARK FENDRICK, MDProfessor of Medicine and Health Management and PolicySchools of Medicine & HealthUniversity of MichiganAnn Arbor, MI
DANA GOLDMAN, PHDDirectorLeonard D. Schaeffer Center for Health Policy and EconomicsUniversity of Southern CaliforniaLos Angeles, CA
WILLIAM H. HERMAN, MD, MPHFajans/GSK Professor of DiabetesUniversity of Michigan Health SystemDirector, Michigan Diabetes Research and Training CenterAnn Arbor, MI
D A R I U S N . L A K D A W A L L A , P H DAssociate Professor, Sol Price School of Public PolicyUniversity of Southern CaliforniaLos Angeles, CA
JEREMY NOBEL, MD, MPHMedical DirectorNortheast Business Group on HealthNew York, NY
TERESA L . PEARSON, MS, RN, CDE, FAADEDirector, Clinical ServicesInnovative Health Care DesignsMinneapolis, MN
A N N E P E T E R S , M D , C D EProfessor, Keck School of MedicineDirector, Clinical Diabetes ProgramUniversity of Southern CaliforniaLos Angeles, CA
SCOTT SOBOCINSKI , PHARMDSenior Pharmacy DirectorPharmacy InformaticsActiveHealth ManagementNew York, NY
ALBERT TZEEL, MD, MHSA , FACPENational Medical DirectorHumanaOne & KMGClinical Leadership & Policy Development HumanaWaukesha, WI
DENEEN VOJTA , MDExecutive VP & Chief Clinical OfficerDiabetes Prevention & Control AllianceUnitedHealthcareMinnetonka, MN
WADE M. AUBRY, MDAssociate Clinical ProfessorDepartment of MedicinePhilip R. Lee Institute for Health Policy StudiesUniversity of California, San FranciscoSan Francisco, CA
F R O M T H E C H A I R M A N
E D I T O R I A L M I S S I O N
To present policy makers, payers, and providers with the clinical, pharmacoeconomic, and regulatory information they need to improve efficiency and outcomes in diabetes.
Opinions expressed by authors, contributors, and advertisers are their own and not necessarily those of Clinical Care Targeted Communications, LLC, d/b/a Managed Care & Healthcare Communications, LLC, the editorial staff, or any member of the editorial advisory board. Clinical Care Targeted Communications, LLC, d/b/a Managed Care & Healthcare Communications, LLC, is not responsible for accuracy of dosages given in articles printed herein. The appearance of advertisements in this journal is not a warranty, endorsement, or approval of the products or services advertised or of their effectiveness, quality, or safety. Clinical Care Targeted Communications, LLC, d/b/a Managed Care & Healthcare Communications, LLC, disclaims responsibility for any injury to persons or property resulting from any ideas or products referred to in the articles or advertisements.
The content contained in this publication is for general information purposes only. The reader is encouraged to confirm the information presented with other sources. Evidence-Based Diabetes Management makes no representations or warranties of any kind about the completeness, accuracy, timeliness, reliability, or suitability of any of the information, including content or advertisements, contained in this publication and expressly disclaims liability for any errors and omissions that may be presented in this publication. Evidence-Based Diabetes Management reserves the right to alter or correct any error or omission in the information it provides in this publication, without any obligations. Evidence-Based Diabetes Management further disclaims any and all liability for any direct, indirect, consequential, special, exemplary, or other damages arising from the use or misuse of any material or information presented in this publication. The views expressed in this publication are those of the authors and do not necessarily reflect the opinion or policy of Evidence-Based Diabetes Management.
SP126 | March 2016 • Volume 22, Special Issue 4 • Evidence-Based Diabetes Management
M I K E H E N N E S S Y , S R
The Next Wave of Diabetes Measurement
This issue covers both the
lessons learned in the first wave of measurement in diabetes care, and the new frontiers, such as use of biomarkers to prevent cardiovascular events.”
With this issue of Evidence-Based Diabetes Management, we show what The American Journal of Managed Care does best: bring together the views of stakeholders from across the healthcare spectrum on a matter of
importance to our primary audience, payers, and also to leading providers, regu-lators, policy leaders, and advocacy groups for patients. Increasingly, measure-
ment and reimbursement go hand-in-hand, and nowhere is that more true than in diabetes care. As this issue of EBDM goes to press, HHS Secre-tary Sylvia Burwell has announced that CMS is meeting its 2016 target that 30% of Medicare pay-ments will be tied to alternate payment models rewarding quality. Our own editor in chief, Dr Robert A. Gabbay of Joslin Diabetes Center, has been a pioneer in connecting payment with qual-ity performance, in a multi-payer patient-centered medical home model. But with years of experience in diabetes measurement behind us, the tools of measurement are being refined to better reflect the individual needs and differences in the population—that one size doesn’t fit all. This issue covers both the lessons learned in the first wave of measure-ment in diabetes care, and the new frontiers such as use of biomarkers to prevent cardiovascular events. A case study from Aetna’s subsidiary, Coventry Healthcare, reveals how measurement can be a cornerstone of good case management and produce tangible results, even in the most challenging populations. There’s always room for innovation, as we learn from Dr Gabbay and co-author Dr Joanna Mitri, who outline the param-
eters and rational for the Joslin Clinical Analytic Tool. Dr Gabbay will be the chair and Dr Mitri will be pre-senting at our upcoming conference, Patient-Centered Diabetes Care, set for April 7-8, 2016, in Teaneck, New Jersey. If you have not registered, I encourage you to visit http://www.ajmc.com/meetings/pcdc16, for information. Please join us, and thank you for reading.
Sincerely,
Mike Hennessy, SrC H A I R M A N A N D C E O
Evidence-Based Diabetes Management • March 2016 • Volume 22, Special Issue 4 | SP127
This issue addresses an area of increased importance in diabetes care: measurement. It helps us understand the progress of an individual patient and the perfor-
mance of a practice, and is the first step towards improving quality. Big data can serve as an early warning system that a new therapy poses a risk, or that there is a weakness in a care delivery system.
I have said often that the movement toward rewarding val-ue began in diabetes care, and our field remains at the fore-front of the revolution that is happening today in healthcare. Those of us who have spent years in diabetes care are already seeking ways to improve on the early steps. At Joslin Diabe-tes Center, we have done this with the Joslin Clinical Analytic Tool, (JCAT), which my colleague Joanna Mitri, MD, MS, and I discuss in this issue.
The logic of JCAT is simple: measurement matters, not just for payment, but especially for driving better care. Actionable data empowers provider teams to improve their outcomes, ul-timately, for the benefit of patients. Ultimately, we need tools that address the uniqueness that each patient presents and aligns with individual goal setting.
As Ian Hargraves, PhD, and his co-authors from the Mayo Clinic address in their commentary, our quest for hitting qual-ity targets must never be at the expense of the patient in front of us; fortunately, both guidelines and measures are moving in a direction that takes this into account.
The National Quality Forum (NQF) understands the need to continually refine diabetes measures; as Chief Scientific Officer Helen Burstin, MD, MPH, and Senior Director Karen Johnson, MS, discuss in their article, the firm foundation that NQF has created is forming the basis for the “next generation” of measures that will be driven by patients and the trend to-ward greater self-management. A combined focus on process measures, intermediate clinical outcome measures and pop-ulation-level health outcomes can significantly improve care, particularly as payment models reward quality and value.
This issue of Evidence-Based Diabetes Management also fea-tures perspectives on the role of the pharmacist in driving better clinical outcomes, a case study from a payer that pro-duced improved measures in a hard-to-treat diabetes popu-lation in Kentucky, and a discussion of the potential role of biomarkers to guide treatment.
Bringing stakeholders in diabetes care together is the mis-sion of both EBDM and The American Journal of Managed Care. We do this both in our print publication and at our live meet-ing, Patient-Centered Diabetes Care, which will convene next month, April 7-8, 2016, in Teaneck, New Jersey. Dr Mitri and several other outstanding faculty from Joslin will join me in presenting the program, which for the first time will feature special sessions on obesity. Please visit http://www.ajmc.com/meetings/pcdc16 to register, and I hope to see you. EBDM
Understanding Matters of Measurement in Diabetes CareR O B E R T A . G A B B AY , M D , P H D , F A C P
F R O M T H E E D I T O R I N C H I E F
A B O U T T H E E D I T O R I N C H I E F
ROBERT A. GABBAY, MD, PHD, FACP
Dr Gabbay is chief medical officer and senior vice president of Joslin Diabetes Center. He serves as editor in chief of Evidence-Based Diabetes Management.
Call for PAPERS
Submit your articles to The American Journal of Managed Care’s Evidence-Based Diabetes Management
As a contributor to Evidence-Based Diabetes Management, you are provided a platform to share your thoughts on
clinical research and policy, both in print and online, with thou-sands of diabetes stakeholders.
Sign up and become a contributor today!Please contact:
Mary K. Caffrey ([email protected]) or Surabhi Dangi-Garimella ([email protected])
Bridging the gap between payer and provider perspectives June 2015Volume 21
Special Issue 9
A p r i l 1 6 - 1 7 , 2 0 1 5 ● B O S T O N , M A
Highlights Include:
• Matching Therapeutic Regimens to Patients
• The Role of Social Media in Diabetes Care
• Can a Mobile App Improve Self-Care?
• Measurement Matters in Driving Change
• How Clinicians and Diabetes Educators Can Change Behavior
• When Does Combination Therapy Make Sense?
Highlights From Patient-Centered Diabetes Care 2015
E X C L U S I V E C O N F E R E N C E C O V E R A G E
Evidence-Based Diabetes Management™

SP128 | March 2016 • Volume 22, Special Issue 4 • Evidence-Based Diabetes Management
When a patient transitions across care settings such as from a hospital to a home, discrepancies in medications taken or prescribed may occur.
A B O U T T H E A U T H O R
JOSEPH MANGANELLI, PHARMD, MPA
Dr Manganelli is senior director, Network Care Management, Pharmacy Program, Montefiore Care Management Organization.
When clinical pharmacists are part of the interdis-ciplinary team that manages chronic conditions, such as diabetes, their interventions contribute to
positive patient outcomes. As the trend toward value-based contracting with both private and government healthcare payers accelerates, clinical pharmacists can play a vital role in achieving cost and quality benchmarks.
At Montefiore Health System, which has such arrange-ments covering more than 350,000 lives, including over 50,000 in a Pioneer Model accountable care organization (ACO), clinical pharmacists at the Care Management Orga-nizaton (CMO), Montefiore Care Management, are integral participants in the interdisciplinary care teams that provide healthcare and care coordination services.
All of the CMO’s pharmacists are licensed doctors of phar-macy; most have completed postgraduate residencies, and several have additional credentialing in ambulatory care or other specialties. As part of orientation and training, each must complete a course in motivational interviewing.
Diabetes is a condition that affects approximately 29.1 million individuals in the United States1 and is prevalent in the population served by Montefiore Care Management. The organization has dedicated resources, including robust case management programs for beneficiaries with type 2 diabetes (T2D), as well as chronic conditions, such as heart failure and respiratory conditions.
The clinical pharmacists have various roles in diabetes management. Some are centrally based and interact with patients telephonically and with providers via the electron-ic health record (EHR). Other pharmacists are embedded in community-based primary care sites, where they meet face-to-face with patients by appointment or by physician refer-ral. The pharmacists who practice at the primary care sites are trained as Certified Diabetic Educators.
Medication therapy management (MTM) ensures that Part D-covered drugs are used to optimize therapeutic out-comes through improved medication use. MTM programs are developed in cooperation with licensed and practicing pharmacists and physicians, and are intended to reduce the risk of adverse events.2 Diabetes remains among the top targeted diseases for MTM initiatives.
When reviewing pharmacotherapy, a form of MTM is performed by all pharmacists regardless of practice loca-tion. Montefiore Care Management pharmacists provide cognitive services and are referred to patients by providers throughout the integrated delivery network. After a review of lab results and prescription and nonprescription thera-pies, the pharmacist offers recommendations intended to optimize medication treatment for diabetes and other con-ditions.
Providers are encouraged to document the reason when they refer cases for pharmacist review. In general, the rea-sons for referral include at least one of the following:
• Transitions of Care. When a patient transitions across care settings such as from hospital to home, discrepan-cies in medications prescribed or taken may occur. In these cases, the pharmacist must access several databas-es to reconcile medication lists from the prehospital ad-mission, the hospital stay, and the postdischarge setting.
• Polypharmacy. Frequently, patients presenting with diabetes are taking several medications to treat the condition, as well as medications that treat comorbid conditions. Patients who are struggling with complex medication regimens are contacted by a pharmacist to discuss strategies that address adherence. Some of our recommendations include keeping medication lists and using pillboxes or blister-packaging prescription drugs. If a combination agent is available that would decrease daily pill burden, this agent will be recommended.
• Financial Issues. Montefiore serves an area where pover-ty affects a large portion of the population. Patients who take multiple medications for diabetes and other condi-tions often have challenges with medication costs and co-payments. ACO pharmacists are often called upon to connect these patients with resources, such as pharma-ceutical manufacturer programs, to help cover the costs of therapy.
• Patient Education. Educated patients are empowered to self-manage their medications and their health condi-tions. The Montefiore Care Management pharmacists provide telephonic and face-to-face education to make sure patients understand their medications’ indications and proper utilization. During the education process, pharmacists use “teach-back” methods to ensure that patients are using their medications and devices cor-rectly. Motivational interviewing strategies are employed during these interactions.
The next level of pharmacist intervention involves joint ventures with providers, known as collaborative drug thera-py management (CDTM). A CDTM arrangement allows phar-macists to initiate, adjust, and monitor pharmacotherapy. The pharmacists must have specialized training in the con-dition being managed and patients must consent to this co-management. Upon successful completion of the credential-ing process, the pharmacists are granted limited prescribing privileges in the EHR of the integrated delivery system. There is always physician oversight, and a defined escalation pro-tocol is written into the collaborative agreement. CDTM agreements are currently in place for the co-management of anticoagulation, heart failure, and respiratory conditions. A CDTM is being developed for the co-management of T2D and is expected to be implemented in early 2016.
Organizations that participate in ACOs and other value-based contracts are responsible for meeting quality and fi-nancial benchmarks to earn shared savings. Pharmacist in-tervention can positively impact several of these measures. For example, in the domain of “care coordination/patient safety,” medication reconciliation after discharge is a service Montefiore Care Management pharmacists are performing. Talks with patients about preventive health, such as influ-enza immunization and pneumococcal vaccination, have been woven into the pharmacist’s script. Vaccination status is then documented in the EMR.
While conducting comprehensive medication reviews, the pharmacist also has a key role in meeting the measures that address “at-risk populations-diabetes,” such as control of glycated hemoglobin (A1C), low-density lipoprotein (LDL) cholesterol, and blood pressure. Pharmacists also inquire
The Role of the Clinical Pharmacist in Achieving Clinical and Quality Outcomes in Diabetes ManagementJ O S E P H M A N G A N E L L I , P H A R M D , M P A
R O L E O F P H A R M A C Y
Evidence-Based Diabetes Management • March 2016 • Volume 22, Special Issue 4 | SP129
R O L E O F P H A R M A C Y
A B O U T T H E A U T H O R
HARVEY W. KAUFMAN, MD, MBA, FCAP
Dr Kaufman is senior medical director at Quest Diagnostics. He was the lead author of the 2015 study in Diabetes Care, which found a 23% increase in new diabetes cases among Medicaid patients in states that expanded the program under the Affordable Care Act.
about tobacco use, and connect patients who are still smok-ing with tobacco- cessation programs.
Another important component of the comprehensive medication review is making sure that all therapy recom-mendations are aligned with the patient’s formulary. Some medications or pen devices may not be on a preferred drug list. There are also many coverage edits associated with dia-betes treatments, such as quantity limitations and prior au-thorizations. Coverage of diabetic supplies may default to a medical benefit versus a pharmacy benefit. The coverage process may be confusing and frustrating for both providers and patients. If this results in nonadherence, poor outcomes can be expected. Having a pharmacist who is a member of the interdisciplinary care team intervene and resolve these problems has reduced barriers to diabetic medications and supplies, and has had a positive effect on outcomes.
As the drug experts, pharmacists also conduct or arrange periodic continuing staff education for case managers, as well as medical and pharmacy residents in the ACO’s inte-grated delivery network. There have been several new treat-ments and devices approved for diabetes. It is important to keep all members of a patient’s interdisciplinary care team informed and up-to-date.
In conclusion, when an interdisciplinary team that in-cludes clinical pharmacists is charged with managing diabe-tes in a population, the results are positive, with significant clinical and quality outcomes. Internal data analysis reveals an overall lowering of A1C, LDL cholesterol, and blood pres-sure. It has also been noted that there has been a decrease in inpatient admissions and the 30-day readmission rate. Most of all, at Montefiore, we have observed reduced morbidity and mortality in our population, and therefore, an improve-ment in patient quality of life. EBDM
R E F E R E N C E S
1. National diabetes statistics report: estimates of diabetes and its burden in the United
States. CDC website. http://www.cdc.gov/diabetes/pubs/statsreport14/national-diabetes-
report-web.pdf. Published 2014. Accessed February 12, 2016.
2. Medication therapy management. CMS website. https://www.cms.gov/medicare/
prescription-drug-coverage/prescriptiondrugcovcontra/mtm.html. Updated February 3, 2016.
Accessed February 12, 2016.
P O P U L A T I O N H E A L T H
Although the US healthcare system is the envy of much of the world, it is troubling that persistent and well-documented health disparities still exist between dif-
ferent racial and ethnic populations.But evidence is emerging that, as a nation, we are beginning
to make inroads into achieving health equity and eliminating health disparities by investing in prevention and wellness.
A study conducted by Quest Diagnostics, and published in a recent issue of Diabetes Care,1 found that people in states that expanded Medicaid under the Affordable Care Act (ACA) are far more likely to be newly diagnosed with diabetes than those in states that elected not to expand the program. Based on an analysis of de-identified test results of 434,288 Ameri-cans from Quest’s uniquely large database, we found that diagnoses of newly identified diabetes in Medicaid patients surged 23% in expansion states in the first few months after the ACA went into effect, but increased just 0.4% in those states that opted out of Medicaid expansion during the same time period.
While we did not examine demographics beyond age and state, it is likely that many of the newly identified individu-als from the Quest study are part of a racial or ethnic mi-nority, given that African Americans and Hispanic/Latino Americans are at a sharply increased risk of diabetes than non-Hispanic whites. And with new US Census Bureau data2 showing the uninsured rate among blacks, Hispanics, and Asians all declined by more than 4 percentage points be-tween 2013 and 2014, attributable to Medicaid expansion, our findings suggest that increasing access to healthcare could serve as a catalyst for improved health statuses for all Americans, especially minorities.
Early diagnosis and treatment of diabetes can lead to fewer complications and more effective disease management—and potentially, lower long-term costs. Too often, people don’t know they have the disease or are at risk of developing it, which is why it is critical they receive a blood test called an A1C (which measures their levels of glycated hemoglobin) to help diagnose it. Our study suggests that increased access to care helps people get this simple blood test, receive a diagno-
sis, and hopefully act on it by improving their diet or medica-tion use, to arrest further disease progression.
The Quest study also suggests that preventive screening un-der the ACA may produce the same impact on chronic diseases and conditions beyond diabetes, including hypertension and chronic kidney disease. For many of these conditions, the gap in health status by race, ethnicity, and socioeconomic status has widened over the last decade. National Health Disparities Reports, produced by the federal Agency for Healthcare Re-search and Quality, have demonstrated that racial and ethnic minorities often receive poorer quality of care and face more barriers in seeking care—including preventive services, acute treatment, or chronic disease management—than do non-Hispanic white patients. Minority groups experience rates of preventable hospitalizations that are, in some cases, almost double that of non-Hispanic whites. Today, a person who is black has a 1.5-times greater rate of heart disease death and a 1.8-times greater rate of fatal stroke than a white person. In-creased access to preventive care will help close this gap and improve health outcomes.
We see great potential in using nationally representative de-identified laboratory data to reveal important insights into population health. The US Health and Human Services’ Action Plan to Reduce Racial and Ethnic Health Disparities calls for increasing the availability, quality, and use of data to improve the health of minority populations. This surveillance and monitoring should be implemented broadly across a variety of sectors, both public and private, to ensure that we are ac-curately identifying where health disparities exist and how they are being addressed. These efforts will help us progress toward equality of care for all Americans. EBDM
R E F E R E N C E S
1. Kaufman HW, Chen Z, Fonseca VA, McPhaul MJ. Surge in newly identified diabetes among
Medicaid patients in 2014 within Medicaid expansion states under Affordable Care Act.
Diabetes Care. 2015;38(5):833-837. doi: 10.2337/dc14-2334.
2. Income, poverty, and health insurance coverage in the United States: 2015 [press release].
Suitland, MD: US Census Bureau; September 16, 2015. https://www.census.gov/news-
room/press-releases/2015/cb15-157.html.
Closing the Gap on Health Inequality H A R V E Y W . K A U F M A N , M D , M B A , F C A P
SP130 | March 2016 • Volume 22, Special Issue 4 • Evidence-Based Diabetes Management
INTRODUCTION
Diabetes is an increasingly common and costly issue for both the state of Kentucky and the United States, as a whole. According to the National Diabetes Sta-
tistics 2014 Report, prepared by the CDC, 29.1 million, or 9.3% of Americans had diabetes in 2012.1 This was an increase of 3.3 million Americans with diabetes just since 2010. While there is no large statistical difference between the inci-dences in men (15.6 million) versus women (13.5 million), there are large discrepancies by race/ethnicity in terms of who is more at risk for diabetes. In descending order, the age-adjusted percentage for individuals 20 years of age or older, with a diagnosis of diabetes, is as follows: American Indians/Alaska Natives (15.9%), non-Hispanic blacks (13.2%), Hispanics (12.8%), Asian Americans (9.0%), and non-Hispanic whites (7.6%).1
In addition, the risk of having diabetes is independently related to socioeconomic status. Comparing prevalence by education level, high school dropouts are twice as likely to have diabetes as men who have attended college.2 Hav-ing less than a high school education is associated with a 2-fold higher mortality rate from diabetes. Having a family
income, below the federal poverty level, is also associated with a 2-fold higher mortality rate compared with adults with the highest family incomes. These relationships hold true even after controlling for well-known risk factors, such as age, race/ethnicity, and body mass index.3 Many effective therapies exist to control blood glucose levels in people with diabetes and to control comorbidities, such as hypertension, and high cholesterol that contribute to the complications associated with diabetes. However, left inadequately con-trolled, diabetes is a leading cause of blindness, kidney fail-ure, amputation, heart attack, and stroke.
The rise in the prevalence of diabetes in Kentucky has been faster than the national rate. According to the 2013 Com-monwealth of Kentucky Diabetes Report,4 the percentage of residents with diabetes has nearly tripled from 3.5% in 1995 to 10% in 2010. Among Kentucky’s Medicaid population, the prevalence of diabetes is 18%. The highest rates of diabetes are in the rural eastern counties, where the prevalence of di-abetes exceeds 20%. This region is home to 26% of members involved in the CoventryCares Comprehensive Diabetes Care HEDIS® Measure.5 (HEDIS refers to the Healthcare Effective-ness Data and Information Set, a tool of 81 measures created by the National Committee on Quality Assurance. It used by most major health plans to measure care and service.)
COVENTRY COMPLEX CASE MANAGEMENT PROGRAMCoventry Healthcare, a subsidiary of Aetna, initiated the Complex Case Management (CCM) program to strive for ex-cellence in case management. The CCM program provided quality services to members, met industry and accreditation standards, and supported Coventry’s goals for cost manage-ment. CCM is a collaborative process based on assessment, planning, implementation, coordination, monitoring, and assessment of options and services to meet an individual member’s healthcare needs. Communication with the indi-vidual member or caregiver, and healthcare provider, com-bined with the availability of resources, assists in promoting quality cost-effective outcomes.
Members eligible for CCM were identified through a variety of referral sources, including, but not limited, to the use of a predictive modeling tool, disease management, concurrent review, self-referrals, and provider referrals. HEDIS data were integrated into each member’s record in the care manage-ment system, providing a snapshot of compliance for each case manager. As part of the case management process, HE-DIS measures were then addressed accordingly. This process included educating members on the importance of condi-tion-specific testing through direct contacts and mailers, as-sisting members to locate specialists, and assisting members with the scheduling of appointments. CoventryCares was an opt-out option offered by Kentucky’s CCM program, in which every eligible member could choose to decline participation.
The purpose of the Coventry Health CCM Program is to im-prove members’ adherence to appropriate indicators, includ-ing glycated hemoglobin (A1C) screening (assessing diabetes control), diabetic retinal exams (DRE) (assessing eye involve-ment and the need for therapy to prevent blindness), and nephropathy screening (assessing kidney involvement and the need for therapy to prevent kidney failure). These indica-tors are taken from the Comprehensive Diabetes Care (CDC) HEDIS Measure diabetes submeasures.
P A Y E R P E R S P E C T I V E
Impact of the Coventry Complex Case Management Program in the Kentucky Medicaid PopulationK E N N E T H J S N O W , M D , M B A
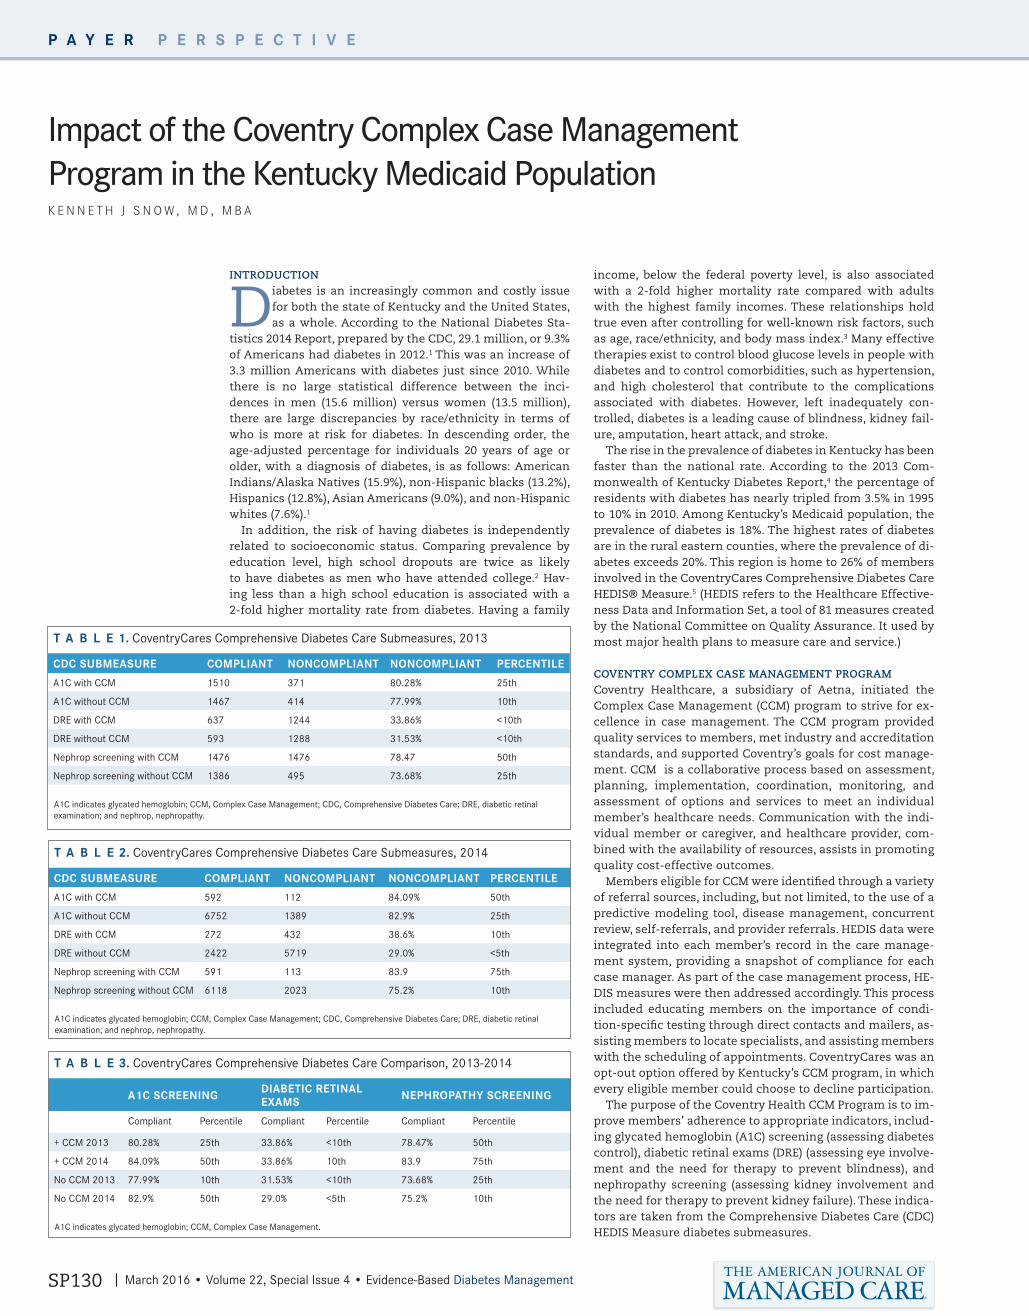
T A B L E 1. CoventryCares Comprehensive Diabetes Care Submeasures, 2013
CDC SUBMEASURE COMPLIANT NONCOMPLIANT NONCOMPLIANT PERCENTILE
A1C with CCM 1510 371 80.28% 25th
A1C without CCM 1467 414 77.99% 10th
DRE with CCM 637 1244 33.86% <10th
DRE without CCM 593 1288 31.53% <10th
Nephrop screening with CCM 1476 1476 78.47 50th
Nephrop screening without CCM 1386 495 73.68% 25th
A1C indicates glycated hemoglobin; CCM, Complex Case Management; CDC, Comprehensive Diabetes Care; DRE, diabetic retinal examination; and nephrop, nephropathy.
T A B L E 2. CoventryCares Comprehensive Diabetes Care Submeasures, 2014
CDC SUBMEASURE COMPLIANT NONCOMPLIANT NONCOMPLIANT PERCENTILE
A1C with CCM 592 112 84.09% 50th
A1C without CCM 6752 1389 82.9% 25th
DRE with CCM 272 432 38.6% 10th
DRE without CCM 2422 5719 29.0% <5th
Nephrop screening with CCM 591 113 83.9 75th
Nephrop screening without CCM 6118 2023 75.2% 10th
A1C indicates glycated hemoglobin; CCM, Complex Case Management; CDC, Comprehensive Diabetes Care; DRE, diabetic retinal examination; and nephrop, nephropathy.
T A B L E 3. CoventryCares Comprehensive Diabetes Care Comparison, 2013-2014
A1C SCREENING DIABETIC RETINAL EXAMS NEPHROPATHY SCREENING
Compliant Percentile Compliant Percentile Compliant Percentile
+ CCM 2013 80.28% 25th 33.86% <10th 78.47% 50th
+ CCM 2014 84.09% 50th 33.86% 10th 83.9 75th
No CCM 2013 77.99% 10th 31.53% <10th 73.68% 25th
No CCM 2014 82.9% 50th 29.0% <5th 75.2% 10th
A1C indicates glycated hemoglobin; CCM, Complex Case Management.
Evidence-Based Diabetes Management • March 2016 • Volume 22, Special Issue 4 | SP131
P A Y E R P E R S P E C T I V E
RESULTS The CDC HEDIS member data showed 5917 CDC submeasures reported for 2013. Of these, 1881 were contacted by CCM and another 1881, who were not contacted, were randomly chosen to serve as a comparator group. The improvement in compli-ance was significant enough to move to a higher percentile in 2 of the 3 measures. The results are shown in TABLE 1.
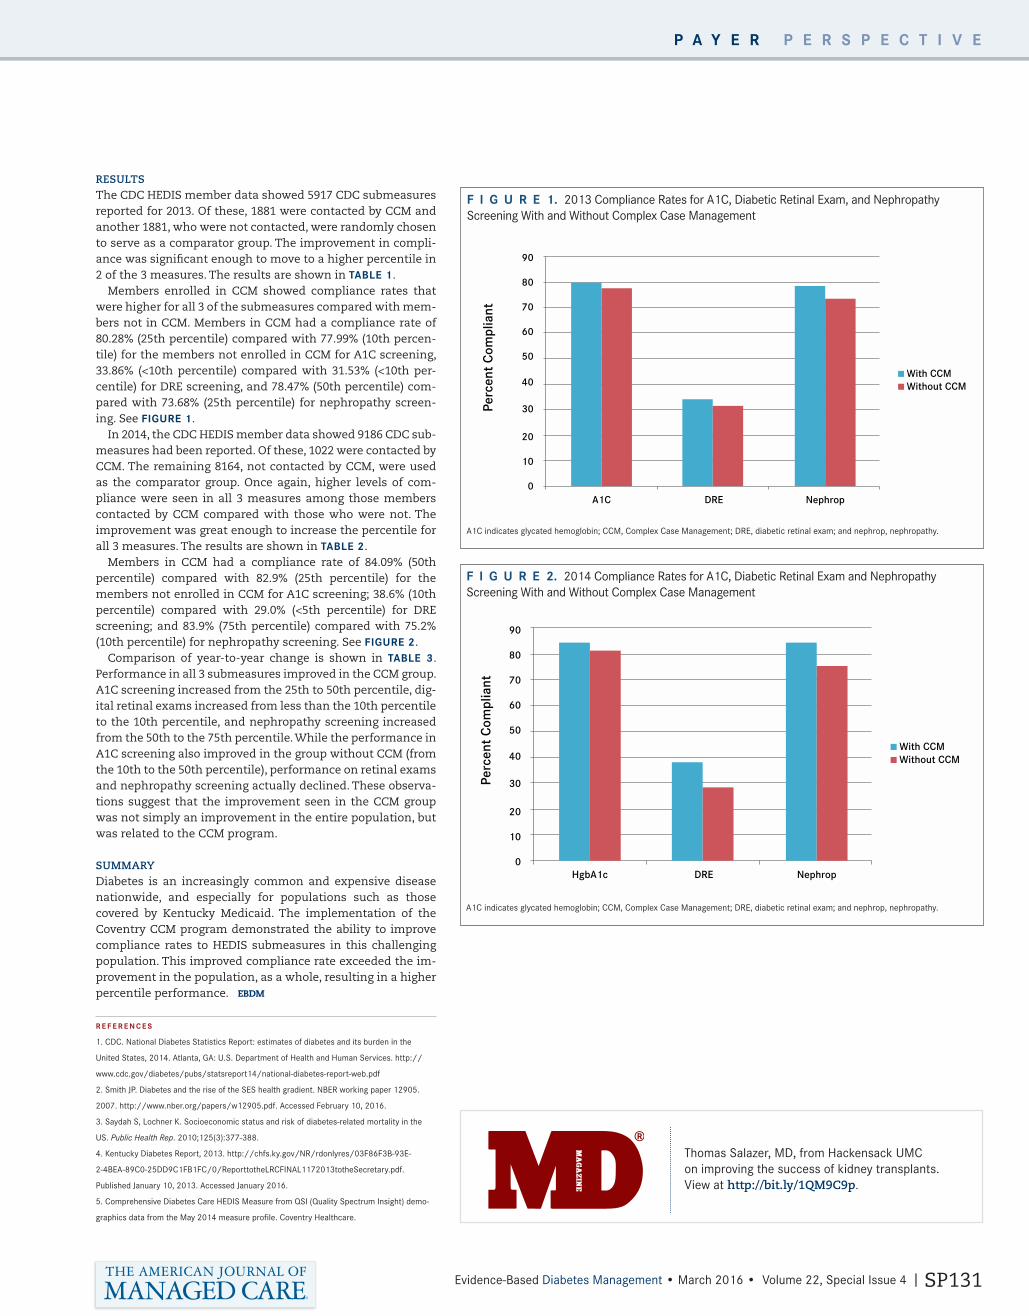
Members enrolled in CCM showed compliance rates that were higher for all 3 of the submeasures compared with mem-bers not in CCM. Members in CCM had a compliance rate of 80.28% (25th percentile) compared with 77.99% (10th percen-tile) for the members not enrolled in CCM for A1C screening, 33.86% (<10th percentile) compared with 31.53% (<10th per-centile) for DRE screening, and 78.47% (50th percentile) com-pared with 73.68% (25th percentile) for nephropathy screen-ing. See FIGURE 1.
In 2014, the CDC HEDIS member data showed 9186 CDC sub-measures had been reported. Of these, 1022 were contacted by CCM. The remaining 8164, not contacted by CCM, were used as the comparator group. Once again, higher levels of com-pliance were seen in all 3 measures among those members contacted by CCM compared with those who were not. The improvement was great enough to increase the percentile for all 3 measures. The results are shown in TABLE 2.
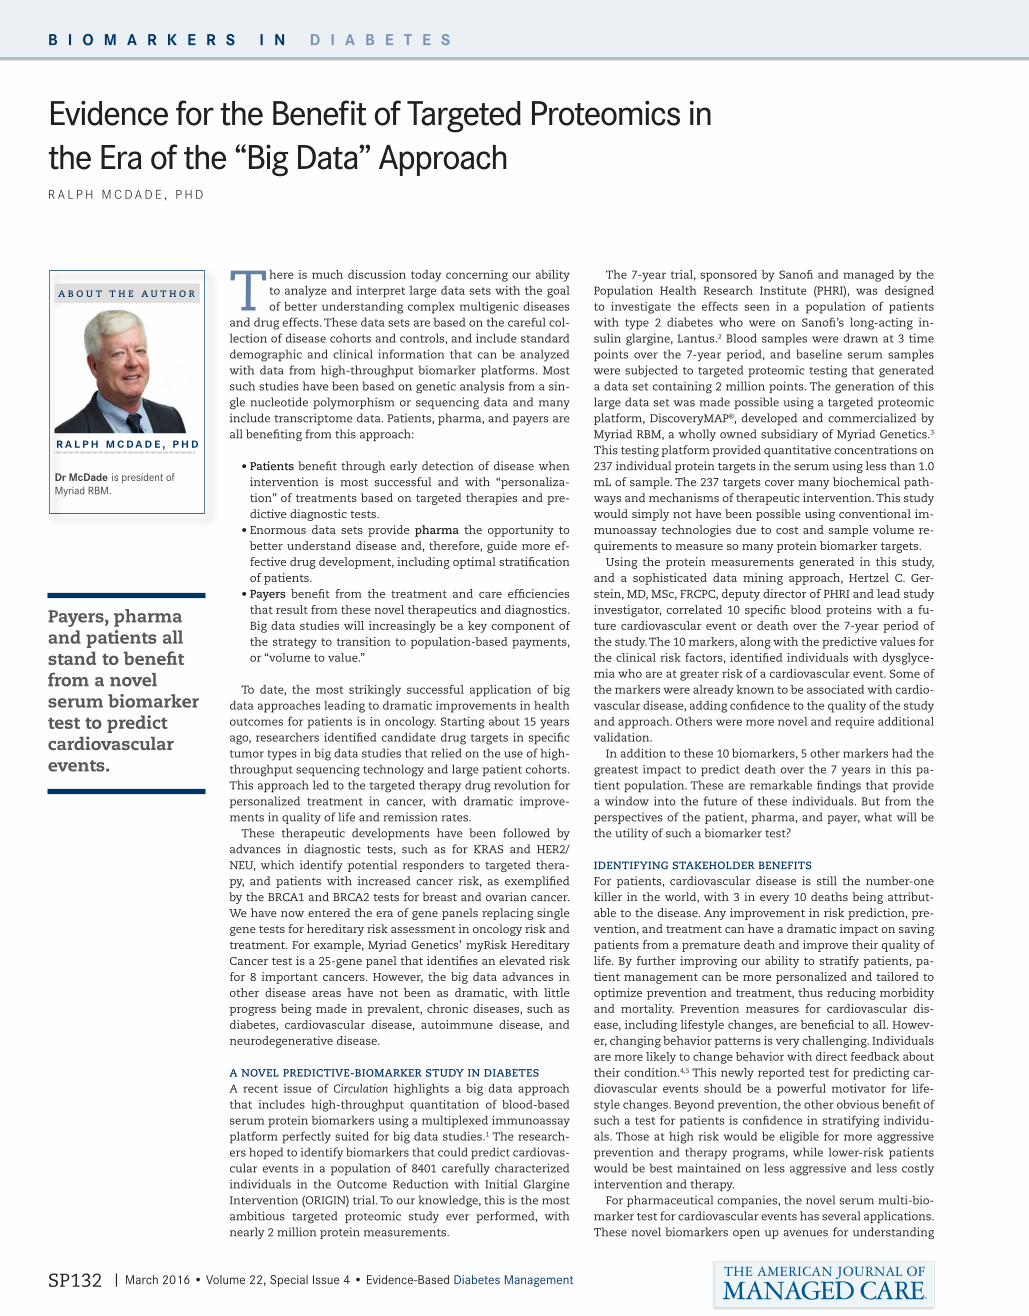
Members in CCM had a compliance rate of 84.09% (50th percentile) compared with 82.9% (25th percentile) for the members not enrolled in CCM for A1C screening; 38.6% (10th percentile) compared with 29.0% (<5th percentile) for DRE screening; and 83.9% (75th percentile) compared with 75.2% (10th percentile) for nephropathy screening. See FIGURE 2.
Comparison of year-to-year change is shown in TABLE 3. Performance in all 3 submeasures improved in the CCM group. A1C screening increased from the 25th to 50th percentile, dig-ital retinal exams increased from less than the 10th percentile to the 10th percentile, and nephropathy screening increased from the 50th to the 75th percentile. While the performance in A1C screening also improved in the group without CCM (from the 10th to the 50th percentile), performance on retinal exams and nephropathy screening actually declined. These observa-tions suggest that the improvement seen in the CCM group was not simply an improvement in the entire population, but was related to the CCM program.
SUMMARYDiabetes is an increasingly common and expensive disease nationwide, and especially for populations such as those covered by Kentucky Medicaid. The implementation of the Coventry CCM program demonstrated the ability to improve compliance rates to HEDIS submeasures in this challenging population. This improved compliance rate exceeded the im-provement in the population, as a whole, resulting in a higher percentile performance. EBDM
R E F E R E N C E S
1. CDC. National Diabetes Statistics Report: estimates of diabetes and its burden in the
United States, 2014. Atlanta, GA: U.S. Department of Health and Human Services. http://
www.cdc.gov/diabetes/pubs/statsreport14/national-diabetes-report-web.pdf
2. Smith JP. Diabetes and the rise of the SES health gradient. NBER working paper 12905.
2007. http://www.nber.org/papers/w12905.pdf. Accessed February 10, 2016.
3. Saydah S, Lochner K. Socioeconomic status and risk of diabetes-related mortality in the
US. Public Health Rep. 2010;125(3):377-388.
4. Kentucky Diabetes Report, 2013. http://chfs.ky.gov/NR/rdonlyres/03F86F3B-93E-
2-4BEA-89C0-25DD9C1FB1FC/0/ReporttotheLRCFINAL1172013totheSecretary.pdf.
Published January 10, 2013. Accessed January 2016.
5. Comprehensive Diabetes Care HEDIS Measure from QSI (Quality Spectrum Insight) demo-
graphics data from the May 2014 measure profile. Coventry Healthcare.
F I G U R E 1. 2013 Compliance Rates for A1C, Diabetic Retinal Exam, and Nephropathy Screening With and Without Complex Case Management
A1C indicates glycated hemoglobin; CCM, Complex Case Management; DRE, diabetic retinal exam; and nephrop, nephropathy.
F I G U R E 2. 2014 Compliance Rates for A1C, Diabetic Retinal Exam and Nephropathy Screening With and Without Complex Case Management
A1C indicates glycated hemoglobin; CCM, Complex Case Management; DRE, diabetic retinal exam; and nephrop, nephropathy.
A1C DRE Nephrop
■ With CCM■ Without CCM
90
80
70
60
50
40
30
20
10
0
HgbA1c DRE Nephrop
■ With CCM■ Without CCM
90
80
70
60
50
40
30
20
10
0
Thomas Salazer, MD, from Hackensack UMC on improving the success of kidney transplants. View at http://bit.ly/1QM9C9p.
SP132 | March 2016 • Volume 22, Special Issue 4 • Evidence-Based Diabetes Management
Payers, pharma and patients all stand to benefit from a novel serum biomarker test to predict cardiovascular events.
B I O M A R K E R S I N D I A B E T E S
There is much discussion today concerning our ability to analyze and interpret large data sets with the goal of better understanding complex multigenic diseases
and drug effects. These data sets are based on the careful col-lection of disease cohorts and controls, and include standard demographic and clinical information that can be analyzed with data from high-throughput biomarker platforms. Most such studies have been based on genetic analysis from a sin-gle nucleotide polymorphism or sequencing data and many include transcriptome data. Patients, pharma, and payers are all benefiting from this approach:
• Patients benefit through early detection of disease when intervention is most successful and with “personaliza-tion” of treatments based on targeted therapies and pre-dictive diagnostic tests.
• Enormous data sets provide pharma the opportunity to better understand disease and, therefore, guide more ef-fective drug development, including optimal stratification of patients.
• Payers benefit from the treatment and care efficiencies that result from these novel therapeutics and diagnostics. Big data studies will increasingly be a key component of the strategy to transition to population-based payments, or “volume to value.”
To date, the most strikingly successful application of big data approaches leading to dramatic improvements in health outcomes for patients is in oncology. Starting about 15 years ago, researchers identified candidate drug targets in specific tumor types in big data studies that relied on the use of high-throughput sequencing technology and large patient cohorts. This approach led to the targeted therapy drug revolution for personalized treatment in cancer, with dramatic improve-ments in quality of life and remission rates.
These therapeutic developments have been followed by advances in diagnostic tests, such as for KRAS and HER2/NEU, which identify potential responders to targeted thera-py, and patients with increased cancer risk, as exemplified by the BRCA1 and BRCA2 tests for breast and ovarian cancer. We have now entered the era of gene panels replacing single gene tests for hereditary risk assessment in oncology risk and treatment. For example, Myriad Genetics’ myRisk Hereditary Cancer test is a 25-gene panel that identifies an elevated risk for 8 important cancers. However, the big data advances in other disease areas have not been as dramatic, with little progress being made in prevalent, chronic diseases, such as diabetes, cardiovascular disease, autoimmune disease, and neurodegenerative disease.
A NOVEL PREDICTIVE-BIOMARKER STUDY IN DIABETESA recent issue of Circulation highlights a big data approach that includes high-throughput quantitation of blood-based serum protein biomarkers using a multiplexed immunoassay platform perfectly suited for big data studies.1 The research-ers hoped to identify biomarkers that could predict cardiovas-cular events in a population of 8401 carefully characterized individuals in the Outcome Reduction with Initial Glargine Intervention (ORIGIN) trial. To our knowledge, this is the most ambitious targeted proteomic study ever performed, with nearly 2 million protein measurements.
The 7-year trial, sponsored by Sanofi and managed by the Population Health Research Institute (PHRI), was designed to investigate the effects seen in a population of patients with type 2 diabetes who were on Sanofi’s long-acting in-sulin glargine, Lantus.2 Blood samples were drawn at 3 time points over the 7-year period, and baseline serum samples were subjected to targeted proteomic testing that generated a data set containing 2 million points. The generation of this large data set was made possible using a targeted proteomic platform, DiscoveryMAP®, developed and commercialized by Myriad RBM, a wholly owned subsidiary of Myriad Genetics.3 This testing platform provided quantitative concentrations on 237 individual protein targets in the serum using less than 1.0 mL of sample. The 237 targets cover many biochemical path-ways and mechanisms of therapeutic intervention. This study would simply not have been possible using conventional im-munoassay technologies due to cost and sample volume re-quirements to measure so many protein biomarker targets.
Using the protein measurements generated in this study, and a sophisticated data mining approach, Hertzel C. Ger-stein, MD, MSc, FRCPC, deputy director of PHRI and lead study investigator, correlated 10 specific blood proteins with a fu-ture cardiovascular event or death over the 7-year period of the study. The 10 markers, along with the predictive values for the clinical risk factors, identified individuals with dysglyce-mia who are at greater risk of a cardiovascular event. Some of the markers were already known to be associated with cardio-vascular disease, adding confidence to the quality of the study and approach. Others were more novel and require additional validation.
In addition to these 10 biomarkers, 5 other markers had the greatest impact to predict death over the 7 years in this pa-tient population. These are remarkable findings that provide a window into the future of these individuals. But from the perspectives of the patient, pharma, and payer, what will be the utility of such a biomarker test?
IDENTIFYING STAKEHOLDER BENEFITSFor patients, cardiovascular disease is still the number-one killer in the world, with 3 in every 10 deaths being attribut-able to the disease. Any improvement in risk prediction, pre-vention, and treatment can have a dramatic impact on saving patients from a premature death and improve their quality of life. By further improving our ability to stratify patients, pa-tient management can be more personalized and tailored to optimize prevention and treatment, thus reducing morbidity and mortality. Prevention measures for cardiovascular dis-ease, including lifestyle changes, are beneficial to all. Howev-er, changing behavior patterns is very challenging. Individuals are more likely to change behavior with direct feedback about their condition.4,5 This newly reported test for predicting car-diovascular events should be a powerful motivator for life-style changes. Beyond prevention, the other obvious benefit of such a test for patients is confidence in stratifying individu-als. Those at high risk would be eligible for more aggressive prevention and therapy programs, while lower-risk patients would be best maintained on less aggressive and less costly intervention and therapy.
For pharmaceutical companies, the novel serum multi-bio-marker test for cardiovascular events has several applications. These novel biomarkers open up avenues for understanding
A B O U T T H E A U T H O R
R A L P H M C D A D E , P H D
Dr McDade is president of Myriad RBM.
Evidence for the Benefit of Targeted Proteomics in the Era of the “Big Data” ApproachR A L P H M C D A D E , P H D
Evidence-Based Diabetes Management • March 2016 • Volume 22, Special Issue 4 | SP133
B I O M A R K E R S I N D I A B E T E S
and exploring new drug targets and mechanisms of action. Preclinical and exploratory human research into the biomark-ers will further our understanding of their relationship to car-diovascular disease. The new test could also have significant implications for cardiovascular clinical trials. New drugs for cardiovascular disease and diabetes have to undergo large and lengthy clinical trials to monitor cardiovascular events and death. Use of the cardiovascular risk panel could help re-duce the size and complexity of such trials. Such a test could also potentially be used to correlate decreased cardiovascular risk with therapeutic intervention.
For the payer, the rapid formation and consolidation of population-based health systems are increasingly turning to big data analytics to mine ever more sophisticated electronic health records (EHRs). This provides the cost-effective man-agement of their patients as payers shift from fee-for-service to a capitated system of value-based payment. Reducing acute cardiovascular events is one of the most effective ways of reducing healthcare costs and improving a health system’s quality scores. Each year, a larger percentage of value-based reimbursements are tied to a provider’s patient population quality metrics. As structured, the additional bonus payments by payers to healthcare systems for improvements in patient quality scores is more than offset by the savings to the payer in reduced costs for healthcare services. Providers are incen-tivized to use data from EHRs to more directly and personally interact with their patients through innovations such as the patient-centered medical home.6,7
This personalized approach by providers can have profound improvements on prevention via additional incentives for pa-tients to alter their behavior and adhere to prescribed thera-pies. The new cardiovascular risk panel discovered by this big data study could be a powerful new addition to the EHR for managing a subpopulation of patients with dysglycemia who are at a higher risk for acute cardiovascular events and death.
The implementation of “big data” analyses should include not only molecular genetics approaches but also a targeted proteomics approach as documented by Gerstein et al. This study revealed a set of protein biomarkers in the blood whose concentrations could predict cardiovascular events and/or death within a 7-year period. Going forward, the impact of these types of studies to the patient, pharma, and payer will be to decrease morbidity and mortality in the higher risk pop-ulations, help develop more effective drugs, and, ultimately, save the healthcare system money through more efficient, tai-lored treatments. EBDM
R E F E R E N C E S
1. Gerstein HC, Pare G, McQueen MJ, et al. Identifying novel biomarkers for cardiovascular events or
death in people with dysglycemia. Circulation. 2015; 132(24):2297-2304. doi: 10.1161/CIRCULA-
TIONAHA.115.015744.
2. Sanofi announces results of ORIGIN, the world’s longest and largest randomized clinical trial in
pre- and early diabetes [press release]. Paris, France: PRNewswire, June 11, 2012. http://www.
news.sanofi.us/2012-06-11-Sanofi-Announces-Results-of-ORIGIN-the-Worlds-Longest-and-Largest-
Randomized-Clinical-Trial-in-Pre-and-Early-Diabetes.
3. DiscoveryMAP. Myriad RBM website. http://rbm.myriad.com/discoverymap/. Accessed February
12, 2016.
4. Chi CL, Street NW, Robinson JG, Crawford MA. Individualized patient-centered lifestyle recommen-
dations: an expert system for communicating patient specific cardiovascular risk information and pri-
oritizing lifestyle options. J Biomed Inform. 2012;45(6):1164:1174. doi: 10.1016/j.jbi.2012.07.011.
5. Lin JS, O’Connor EA, Evans CV, Senger CA, Rowland MG, Groom HC. Behavioral counseling to
promote a healthy lifestyle for cardiovascular disease prevention in persons with cardiovascular risk
factors: an updated systematic evidence review for the US Preventive Services Task Forces. National
Center for Biotechnology Information website. http://www.ncbi.nlm.nih.gov/books/NBK241537/.
Accessed February 12, 2016.
6. How can providers use health IT to create a medical home? Health Resources & Services Admin-
istration website. http://www.hrsa.gov/healthit/toolbox/Childrenstoolbox/BuildingMedicalHome/
healthitmedicalhome.html. Accessed February 15, 2016.
7. Kern LM, Edwards A, Kaushal K. The patient-centered medical home, electronic health record, and
quality of care. Ann Intern Med. 2014;160(11):741-749. doi: 10.7326/M13-1798.
H E A L T H I T
For decades, staying on top of those with type 2 diabetes (T2D) in the Mississippi Delta region seemed an unsolv-able problem. Poverty and limited resources meant just
reaching patients was a challenge, much less getting them to stay on a regimen to keep glycated hemoglobin in check.
Today, however, a state that historically has had little to brag about when it comes to healthcare is leading the nation in managing diabetes through telehealth, which it is using to get to patients earlier, drive behavioral change, and keep patients out of the hospital. The Diabetes Telehealth Network, which began in 2014, is part of a larger commitment to remote de-livery of health services through the Center for Telehealth at the University of Mississippi Medical Center (UMMC), located in the state capital of Jackson. The state’s former US senator, Trent Lott, is now a lobbyist and proponent of the technol-ogy.1 (CMS has continued to update rules to expand Medi-care reimbursement for telehealth, although advocates say it would enjoy even greater use with additional changes.2)
Through a partnership with GE Healthcare and C-Spire,3 UMMC began a research project in Sunflower County, a poor area of the Mississippi Delta best known for being home to the state penitentiary. US Census Bureau 2015 data on the county listed the population at 72.9% African American; of those un-
der age 65, 10.1% had a disability and 21.3% had no health in-surance. The median household income is $27,941, and 34.8% of the residents live in poverty.4
Rates of T2D here are 12%, and 293 people died of com-plications of the disease in 2010.3 To change that, in late 2014, UMMC started toward a goal of enrolling 200 patients in a study, with each patient receiving 18 months of remote care. This involves teaching patients about their diabetes and using tablet technology to check in with them to moni-tor their disease.
According to Michael Adcock, administrator at the Cen-ter for Telehealth, each enrollee receives a remote patient-monitoring kit that includes an iPad Mini and peripherals, such as a blood glucose meter, that allow patients to man-age several types of chronic conditions, including diabetes/hypertension, chronic obstructive pulmonary disease, and congestive heart failure. Daily health lessons are delivered to the patient on the iPad, which is set with an alarm as a reminder to start the lesson.
“Whatever time you want it, you let us know when you want the alarm,” Adcock said in an interview with Evidence-Based Di-abetes Management. The lessons are interactive: patients have to answer questions through a “decision tree.”
In Mississippi, Telehealth Makes a Measurable Difference in Diabetes CareM A R Y C A F F R E Y
Seema Haines, PharmD, from
the University of Mississippi
School of Pharmacy, discusses
the right components of
counseling obese patients
to lose weight. View more at http://bit.ly/1nwMEuv.

SP134 | March 2016 • Volume 22, Special Issue 4 • Evidence-Based Diabetes Management
H E A L T H I T
Whatever time you want it,
you let us know when you want that alarm.”
— M I C H A E L A D O O C K ,
A D M I N I S T R AT O R , U M M C
C E N T E R F O R T E L E H E A LT H
“It asks, ‘Did you take your medication?’ but if the answer is negative, it asks, ‘Why not?’” Adcock explained. If a prescrip-tion hasn’t been filled, there’s a contact to a pharmacy. If there are transportation issues, UMMC tries to address those. Most of all, the system allows for intervention at the first sign of trouble: if UMMC can’t reach a patient who typically logs in for a lesson, the staff reach a designated alternate contact person.
Alhough unpublished thus far, Adcock said the early results are attracting notice. “Of the first 100 patients we enrolled, we had zero readmissions,” he said. “There were zero ER visits for uncontrolled diabetes.”
At the time of the EBDM interview, the study had enrolled 141 patients; with the first 100 patients, the project uncovered 18 cases of diabetic retinopathy that would not have been found otherwise, Adcock said. Reimbursement for telehealth is not an issue, he said, because the Mississippi legislature re-quires coverage. The program is creating significant cost sav-ings because in addition to keeping patients out of the hos-pital, it is also eliminating travel costs to the state medical school for specialized care.
“We’ve saved 10,000 miles of travel for our first 100 pa-tients,” Adcock said.
Beyond improved clinical outcomes, reduced travel, and avoided readmissions, there are the intangibles of empower-
ing patients to take control of their own care, as well. “Daily interaction with the tablet has made a huge difference,” ac-cording to Adcock. Getting day-to-day reinforcement about positive changes—and coaching for confessions like “I just ate a piece of pie”—help patients slowly change a lifetime of habits.
Those who had expected to see themselves slowly decline with diabetes, to lose toes or feet the way older relatives had, suddenly awaken to the idea that things don’t have to be that way. “It’s truly life-altering,” Adcock said. “They had never re-ally been engaged in technology.” EBDM
R E F E R E N C E S
1. Pittman D. Mississippi emerges as telemedicine leader. Politico website. http://www.po-
litico.com/story/2015/02/mississippi-telemedicine-115515. Published February 26, 2015.
Accessed February 28, 2016.
2. Drobac K. Telehealth: an important tool in achieving the goals of the ACO program and why
restrictions should be lifted in the final ACO rule. Am J Account Care. 2014;2(4):24-25.
3. Extending access to quality care in the Mississippi Delta: Diabetes Telehealth Network sees
early patient success. GE Healthcare newsroom. http://newsroom.gehealthcare.com/extend-
ing-access-quality-care-mississippi-delta-diabetes-telehealth-network/. Published December
4, 2014. Accessed February 28, 2016.
4. Sunflower County, Mississippi. 2015. US Census Bureau website. http://www.census.gov/
quickfacts/table/PST045215/28133. Accessed March 2, 2016.
D A T A P R O T E C T I O N
“Who’s going to hack our data?” — I fielded this question recently from a care provider at a medical and dental practice where I serve as chief compliance officer, in addi-
tion to my full-time position as executive director of the Elec-tronic Health Network Accreditation Commission (EHNAC).
No doubt the provider was thinking about data breaches at Anthem, Premera Blue Cross, and Excellus Health Plan, as well as other major breaches in the first 9 months of 2015, which affected an eye-popping 109 million individuals.1 While those breaches certainly made huge headlines, the theft, loss, unau-thorized disclosure, or hacking of patient data is reported al-most daily to the Office of Civil Rights (OCR), the federal agen-cy charged with compiling and publishing data on breaches that affect more than 500 individuals.2
“If you don’t protect your data, you may not have a practice,” I replied to the physician. I explained that a single significant breach affecting the data of more than 500 patients requires reporting to the OCR and local media, and would potentially subject the practice to significant fines, as well as erosion of patient trust and credibility with shareholders.
After hearing all of this, the physician quickly understood the importance of data security. “You’re right,” is all he said.
BREACHES ARE BECOMING WIDESPREADSix major breaches of more than 1 million records each repre-sented the lion’s share of affected records. However, an addi-tional 200 breaches reported to OCR during the first 9 months of 2015 hit more than 3.6 million patient records.1 The offend-ers included a nursing home, a cancer center, a dentist, and medical practices in urology, neurology, radiology and anes-thesiology. Business associates were affected, too, including
several billing practices and an attorney. Medical Informat-ics Engineering, an IT software development firm, reported a breach of 3.9 million records in July.
Why are breaches so widespread? The emergence of elec-tronic medical records and increasing use of electronic means to transmit and share data allow not only providers, health plans, payers, and others to share critical patient data and make better care decisions, but it also gives more entry points to criminals.
According to the Ponemon Institute’s 5th annual privacy and security report, criminal attacks are the primary cause of data breaches in healthcare. Breaches have been reported by 90% of healthcare organizations and 60% of their business as-sociates.3 Since 2010, nearly 8 in 10 healthcare organizations have reported more than one breach.3
On the black market, a credit card record is worth $1. How-ever, because of the rich amount of personal information contained in a medical record that can be easily used to com-mit medical fraud, each of these records commands between $5 and $10.
GREAT PROMISE IN USING DATA, BUT HIGH STAKESFor providers of any size, the stakes have never been higher to safeguard data. Even solo practitioners are using portals and mobile apps, contracting with business associates and partici-pating in health information exchanges, accountable care or-ganizations (ACOs) and other initiatives where data sharing is crucial to understanding and interacting with patients and oth-er information sources, such as labs, pharmacies, hospitals, etc.
Make no mistake: the ready exchange of patient data helps providers make quicker, more informed diagnoses; helps pa-
Getting the Most From Healthcare Data Requires Steps to Prevent BreachesL E E B A R R E T T
A B O U T T H E A U T H O R
L E E B A R R E T T
Mr Barrett is the executive director of the Electronic Healthcare Network Accreditation Commission.
Evidence-Based Diabetes Management • March 2016 • Volume 22, Special Issue 4 | SP135
D A T A P R O T E C T I O N
tients avoid unnecessary scans and lab tests; and gives the myriad of caregivers who interact with a patient a place to collaborate and to coordinate patient care. But intentional or unintentional breaches can occur at the intersections of each of these data exchange touchpoints.
The fear of a major data breach has elevated the roles of chief information security officer or chief privacy officer, many of whom now report directly to their entity’s governing board. Even smaller organizations and practices should have a com-pliance officer who can put in place policies, procedures, and controls; conduct annual risk assessments; and minimize the risk for a breach. Smaller organizations can use a third-party compliance officer who is well-versed in healthcare.
Tto understand the promise of coordinated care, look no fur-ther than the Rio Grande Valley ACO in Texas, which concen-trates its efforts on patients with diabetes. In the Rio Grande Valley, nearly 30% of people live with some type of diabetes, a rate 3 times the national average.
Jose F. Pena, MD, CEO and chief medical officer for the ACO, credits a coordinated care approach that optimizes its elec-tronic health record (EHR) system to enable care team mem-bers to use pop-up reminders to track such patient measures as glycated hemoglobin, low-density lipoprotein cholesterol, blood pressure, smoking status, and the use of anti-platelet therapy. This coordinated approach modestly improved in-dividual quality measures but dramatically improved com-pliance with all 5 quality measures (blood pressure, lipids, glucose, aspirin use, and tobacco avoidance), moving from a national average 23% compliance rate in the first year to 48% in the second. A success such as this underlines the impor-tance of getting data security right.
HOW THE INDUSTRY IS RESPONDING A hospital may use up to 150 information technology systems, many of which need to interact and interface with other sys-tems to push or pull data or compile reports. No hospital has a fully integrated system from a single vendor, so data leakage can occur at the junctures between systems.
As the industry moves from fee-for-service to fee-for-value, interoperability among disparate IT systems has become criti-cal. True interoperability can plug many of the data leakage holes. The CommonWell Health Alliance has been working since 2013 to create interoperability among major EHR sys-tems. Member organizations represent 70% of the acute care EHR market and 24% of the ambulatory care market. Carequal-ity, a public/private collaborative, was formed in 2015 with a similar theme.
The EHNAC/Direct Trusted Agent Accreditation Program (DTAAP) allows accredited health information service providers
(HISPs) to send e-mail that is authenticated, encrypted health information directly to known, trusted recipients over the In-ternet. DTAAP meets Meaningful Use Stage 2 standards. Two accredited HISPs can transmit information to one another with confidence, knowing that sensitive data is properly protected.
The nonprofit Health Level Seven International has devel-oped what it calls a next-generation standards framework: FHIR (Fast Healthcare Interoperability Resources) is still being vetted, but is seen as an emerging standard for the develop-ment of interoperable healthcare technology. Truly interoper-able systems have fewer data leakage concerns.
Many organizations are specifying accreditation with EHNAC standards for vendors and business associates. Our standards are supported by not only federal and state or-ganizations but also by dozens of leading companies in the healthcare industry. Requiring EHNAC accreditation demon-strates a commitment to data security that resonates with organization executives as well as patients, customers, and stakeholders. Medical Group Management Association and the American Medical Association have created a toolkit for selecting a practice management system that calls for EHNAC accreditation of those practice management vendors as a key step and quality assurance check for providers.
CONTINUAL EMPHASIS ON DATA SECURITYRegulations are constantly changing. Organizations need to evaluate and purchase new software. Employee training on data security and privacy rules is required on at least an an-nual, but more importantly, on an ongoing basis. For these reasons and more, protecting an organization’s data should be an ongoing concern, which is why companies have chief pri-vacy and chief security officers. It’s also why even the smallest organizations should have someone in charge of data secu-rity—even if it’s a third-party vendor. When possible, specify that the business associates and vendors you work with are accredited to safeguard your sensitive information.
We all are patients and should recognize that the data we protect could be our own. EBDM
R E F E R E N C E S
1. Breaches affecting 500 or more individuals. Department of Health and Human Services Of-
fice for Civil Rights Breach Portal website. https://ocrportal.hhs.gov/ocr/breach/breach_re-
port.jsf. Accessed February 12, 2016.
2. Breach notification rule. Department of Health and Human Services website. http://www.
hhs.gov/hipaa/for-professionals/breach-notification/index.html. Accessed February 12,
2016.
3. Ponemon Institute/MIFA. 5th annual benchmark study on privacy and security of health-
care data. Published May 2015. https://www2.idexpertscorp.com/fifth-annual-ponemon-
study-on-privacy-security-incidents-of-healthcare-data Accessed February 12, 2016.
PAT I E N T - R E P O R T E D O U T C O M E S
PRECIS
Questionnaires are noninvasive, inexpensive measures that can identify key elements of the patient perspec-tive that are important for the achievement of better
outcomes in diabetes care.
COMMENTARYOver the last several decades, tremendous advancements
have been made in understanding the microvascular and macrovascular pathophysiology of type 2 diabetes (T2D) and in understanding the roles of a healthy diet, physical activ-ity, and pharmacotherapies in reducing morbidity and mor-tality associated with uncontrolled plasma glucose levels.1 Major public health initiatives have been implemented to support the prevention and management of T2D, and recent guidelines from the American Diabetes Association (ADA), the
Demystifying “Patient-Centered” Care in Type 2 Diabetes: The Role of Systematic MeasurementS H A N A B . T R A I N A , P H D , A N D A P R I L S L E E , M S

SP136 | March 2016 • Volume 22, Special Issue 4 • Evidence-Based Diabetes Management
P A T I E N T - R E P O R T E D O U T C O M E S
A B O U T T H E A U T H O R S
S H A N A B . T R A I N A , P H D
Dr Traina is director, Global Market Access CVM; Janssen Global Services, LLC.
Address for correspondence:Janssen Global Services920 Route 202 SouthRaritan, N.J. 08869
If individuals feel satisfied with their health, they will be more likely to initiate or continue healthy behaviors and experience better long-term outcomes.
American Association of Diabetes Educators, and the Acad-emy of Nutrition and Dietetics outline diabetes self-manage-ment education and support strategies that healthcare pro-viders and accountable care organizations (ACOs) can use to promote self-care behaviors.2
These self-care behaviors include healthy eating, physical activity, daily monitoring activities, medication adherence, problem-solving skills, risk reduction strategies, and healthy coping strategies.2 These guidelines, along with the joint ADA/European Association for the Study of Diabetes position state-ment on the treatment of T2D emphasize the importance of considering individual patient perspectives (eg, health and cultural beliefs, health literacy, physical limitations, family support, emotional health, and financial status) when col-laborating on disease management strategies.2,3 Significant emphasis is placed on the role of patient behaviors in deter-mining outcomes associated with T2D.2,3
Payers and healthcare consumers are also contributing tre-mendous financial resources toward T2D management: be-tween 2002 and 2011, the annual direct medical costs of dia-betes were estimated to exceed $218 billion.4 On an individual level, average lifetime medical costs have been estimated to be more than $85,000 per patient with T2D.5
Despite recent advances in drug therapies, initiatives to im-prove self-care, and the enormous financial investments in managing T2D, disease outcomes are still far from ideal. Cur-rent approaches that encourage individuals to follow behavior recommendations are simply not working: between 1998 and 2006, significant declines in adherence to healthy behaviors were observed among US adults, including those with diabe-tes.6 In addition, analyses of diabetes medication adherence, based on measures such as medication possession ratio (MPR; proportion of doses taken to doses prescribed), found that compliance with treatment is poor.7 Consequently, a recent analysis of data from the National Health and Nutrition Ex-amination Survey and the Behavioral Risk Factor Surveillance System indicated that fewer than 50% of individuals with dia-betes are meeting their recommended glycemic goals.1
Provision of high-quality care requires achieving the triple aim of improving the individual experience of care, improving the health of populations, and reducing the per capita cost of care. Meeting these goals will require addressing defects in healthcare quality and reducing wasteful spending on ser-vices of limited value.8 Diabetes care, in particular, presents unique challenges to meeting these goals because high-qual-ity healthcare for chronic diseases is costly, given that effec-tive disease management may require regular appointments with primary care practitioners, as well as diabetes educators and a range of specialists (eg, nutritionists and ophthalmolo-gists).9 This “performance paradox” in T2D makes it extremely difficult to achieve all of the triple aims at once. For example, data indicate that ACOs reporting the greatest cost savings are simultaneously receiving lower scores for quality of diabetes care, while ACOs with the highest quality scores show only modest cost savings.9 These findings highlight challenges in the design of programs such as the Healthcare Effectiveness Data and Information Set (HEDIS), the Physician Quality Re-porting System (PQRS), and the Medicare 5-star rating pro-gram, which all require implementation of quality measures that reduce costs, manage side effects, and support a positive patient experience.
T2D is a chronic disease that requires persistent attention to disease management by individuals. If steps can be taken to help patients become actively engaged in managing the ev-eryday challenges of their disease, they could be in a position to substantially improve their healthcare quality and reduce costs.10 Thus, it is exceedingly important to empower patients in their role as self-managers of their disease. This empow-erment requires measurement of concepts including patient knowledge, skill, belief, confidence, satisfaction, support, and health-related quality of life so that education and support
efforts can be tailored to the unique needs of each individual. Starting with appropriate goals that fit each patient’s level of knowledge, skill, and engagement, and working toward in-creasing activation over time, patients can experience small successes and steadily build up the confidence and ability they need to effectively self-manage their disease.11,12
In contrast to some other chronic diseases, people often do not experience burdensome symptoms of T2D on a daily ba-sis. The absence of symptoms may limit motivation to adhere to medication and self-care behaviors. In addition, although patients often understand that uncontrolled chronic hyper-glycemia can have serious long-term health consequences, the nearer-term burdens of keeping up with diet and exercise regimens and tolerating the potential side effects of antihy-perglycemic medications may take precedence. Making last-ing lifestyle changes is difficult, and evidence suggests that an investment in ongoing professional support would be re-quired to impact outcomes at a population level.13 In addition, side effects such as edema, nausea, hypoglycemia, and weight gain, can be disincentives to not only medication adherence, but also performance of healthy behaviors.14
In contrast, if individuals feel satisfied with their health, research indicates that they will be more likely to initiate or continue healthy behaviors and experience better long-term outcomes.15-17 Healthy behaviors can lead to a positive cycle of continuous benefits and reinforcement.18 Belief in the impor-tance of—as well as confidence in—performing healthy be-haviors are necessary components of self-care.18 Using well-formulated questionnaires to assess concepts such as health satisfaction, belief, and confidence, as well as changes in be-havior, is a viable, concrete, and cost-effective way to facilitate the practice of patient-centered care.18
There are several well-established questionnaires avail-able to measure and track the concepts related to self-care and adherence. Data from these questionnaires can increase healthcare worker awareness of potential barriers to effec-tive long-term disease management and allow providers to address these issues before unfavorable outcomes occur. Patient-provider discussions of questionnaire responses can provide a forum for increased patient engagement and clini-cal practice improvement. Collecting these data in electronic form and incorporating them into the medical record would be valuable, allowing for insights into the patient experience over time. Conversing about these types of data will aid in op-erationalizing the central role of the patient in collaborative disease management efforts. EBDM
ACKNOWLEDGEMENTSShana B. Traina, PhD, is a full-time employee of Janssen Global Services, LLC. April Slee, MS, is a full-time employee of Axio Research, which has provided consulting services for Jans-sen Global Services. Editorial support was provided by Cherie Koch, PhD, of MedErgy, and was funded by Janssen Global Ser-vices, LLC.
FUNDING SOURCEJanssen Global Services, LLC
R E F E R E N C E S
1. Ali MK, Bullard KM, Saaddine JB, Cowie CC, Imperatore G, Gregg EW. Achievement of
goals in U.S. diabetes care, 1999-2010 [published correction appears in N Engl J Med.
2013;369(6):587]. N Engl J Med. 2013;368(17):1613-1624. doi: 10.1056/NEJMsa1213829.
2. Powers MA, Bardsley J, Cypress M, et al. Diabetes self-management education and support
in type 2 diabetes: a joint position statement of the American Diabetes Association, the
American Association of Diabetes Educators, and the Academy of Nutrition and Dietetics.
Diabetes Care. 2015;38(7):1372-1382. doi: 10.2337/dc15-0730.
3. Inzucchi SE, Bergenstal RM, Buse JB, et al. Management of hyperglycemia in type 2
diabetes, 2015: a patient-centered approach: update to a position statement of the American
Diabetes Association and the European Association for the Study of Diabetes. Diabetes Care.
2015;38(1):140-149. doi: 10.2337/dc14-2441.
4. Ozieh MN, Bishu KG, Dismuke CE, Egede LE. Trends in health care expenditure in US adults
A P R I L S L E E , M S
Ms Slee is a project director at Axio Research Corporation.

Evidence-Based Diabetes Management • March 2016 • Volume 22, Special Issue 4 | SP137
P A T I E N T - R E P O R T E D O U T C O M E S
with diabetes: 2002-2011. Diabetes Care. 2015;38(10):1844-1851. doi: 10.2337/dc15-0369.
5. Zhuo X, Zhang P, Hoerger TJ. Lifetime direct medical costs of treating type 2 diabe-
tes and diabetic complications. Am J Prev Med. 2013;45(3):253-261. doi: 10.1016/j.
amepre.2013.04.017.
6. King DE, Mainous AG, III, Carnemolla M, Everett CJ. Adherence to healthy lifestyle
habits in US adults, 1988-2006. Am J Med. 2009;122(6):528-534. doi: 10.1016/j.am-
jmed.2008.11.013.
7. García-Pérez LE, Alvarez M, Dilla T, Gil-Guillen V, Orozco-Beltran D. Adherence to therapies
in patients with type 2 diabetes. Diabetes Ther. 2013;4(2):175-194. doi: 10.1007/s13300-
013-0034-y.
8. Berwick DM, Nolan TW, Whittington J. The triple aim: care, health, and cost. Health Aff
(Millwood). 2008;27(3):759-769. doi: 10.1377/hlthaff.27.3.759.
9. Caffrey M. Among ACO pioneers, data reveal diabetes performance paradox. Am J Manag
Care. 2014;20(SP15):SP571.
10. Hibbard JH, Stockard J, Mahoney ER, Tusler M. Development of the Patient Activation
Measure (PAM): conceptualizing and measuring activation in patients and consumers. Health
Serv Res. 2004;39(4 Pt 1):1005-1026.
11. Bandura A. Social cognitive theory of self-regulation. Organ Behav Hum Decis Process.
1991;50:248-287.
12. Battersby MW, Ask A, Reece MM, Markwick MJ, Collins JP. The Partners in Health scale:
the development and psychometric properties of a generic assessment scale for chronic
condition self-management. Aust J Prim Health. 2003;9:41-52.
13. Look AHEAD Research Group. Eight-year weight losses with an intensive lifestyle
intervention: the look AHEAD study. Obesity (Silver Spring). 2014;22(1):5-13. doi: 10.1002/
oby.20662.
14. Traina S, Guthrie R, Slee A. The impact of weight loss on weight-related quality of life
and health satisfaction: results from a trial comparing canagliflozin with sitagliptin in triple
therapy among people with type 2 diabetes. Postgrad Med. 2014;126(3):7-15. doi: 10.3810/
pgm.2014.05.2752.
15. Anderson LA, Eyler AA, Galuska DA, Brown DR, Brownson RC. Relationship of satisfaction
with body size and trying to lose weight in a national survey of overweight and obese women
aged 40 and older, United States. Prev Med. 2002;35(4):390-396.
16. Blake CE, Hébert JR, Lee DC, et al. Adults with greater weight satisfaction report
more positive health behaviors and have better health status regardless of BMI. J Obes.
2013;2013:291371. doi: 10.1155/2013/291371.
17. Mostafavi-Darani F, Daniali SS, Azadbakht L. Relationship of body satisfaction, with nutri-
tion and weight control behaviors in women. Int J Prev Med. 2013;4(4):467-474.
18. Traina SB, Slee A, Woo S, Canovatchel W. The importance of weight change experiences
for performance of diabetes self-care: a patient-centered approach to evaluating clinical
outcomes in type 2 diabetes. Diabetes Ther. 2015;6(4):611-625.
P H A R M A U P D A T E
MannKind Corp has been racing to reinvent itself since Sanofi backed out of a deal to market its in-halable insulin.1 However, the product remains in
limbo. Until the companies can complete a complex tran-sition, Sanofi maintains control over Afrezza. MannKind cannot market the drug, negotiate coverage with insurers, file for regulatory approval in new jurisdictions, or take any other steps to turn the notorious flop into the success that MannKind’s leaders still hope it can be.
Nonetheless, a flurry of announcements has kept the Cali-fornia-based company in the news, sometimes to the delight of investors and sometimes to their chagrin. In less than 3 months, MannKind’s founder left the board and passed away; it parted ways with 2 chief executives, attracted a class-action lawsuit, begun the hunt for a chief marketing officer, negotiated with potential international marketing partners, signed a deal that could be worth more than $100 million with a mysterious biotech, discussed potentially il-legal short-selling with regulators, and announced its inten-tion to win insurer coverage by lowering Afrezza prices.
“We learned many things in 2015, and those lessons will benefit us greatly as we look forward to launching our own strategies this year,” said CEO Matthew Pfeffer during a Feb-ruary 3, 2016, investor conference call,2 which provided the most detailed glimpse to date of his plans for the company.
Pfeffer is the fourth man to run MannKind since Novem-ber, when CEO Hakan Edstrom resigned after just 11 months on the job and founder and chairman Alfred Mann stepped in on a temporary basis.3 MannKind offered the post to Duane DeSisto, the former CEO of the insulin pump maker Insulet, but Insulet protested on grounds of a noncompete agreement. MannKind withdrew the offer4 just after DeSis-to had started and offered the job to Pfeffer, who had been
serving as the company’s chief financial officer and now fills both roles.
“The Afrezza transition is MannKind’s top priority, and it is getting the full attention it deserves,” Pfeffer told investors, noting the company’s particular focus on insuring continuity of supply for the few people who do use the drug. “The transi-tion teams have been formed and include operations, scien-tific, and legal personnel from both MannKind and Sanofi. The teams have met and begun discussions about the complex process that a transfer like this involves. MannKind is target-ing April 5 as the transition date for the rights to develop and commercialize Afrezza, but may request that Sanofi agree to a later date.
“There are many factors that influence when the transition will occur, including a myriad of regulatory, commercial, and development activities, many of which involve third-party vendors or regulatory authorities, and all of which need to be transferred in a smooth and coordinated fashion,” Pfeffer said.
BRINGING PAYERS ON BOARDMannKind’s basic plan for boosting Afrezza sales in the Unit-ed States is to lower prices enough to get insurers to cover the product on favorable terms and then market it in unconven-tional ways rather than sending an army of sales representa-tives to doctors. Sanofi failed to get any major payer to include Afrezza on its standard formulary in 2015, even though the drug became available as a fast-acting prandial insulin for pa-tients with type 1 diabetes (T1D) early in the year. Thus, nearly all would-be users needed to secure prior authorization from their doctors before they could get any coverage for the drug.
Both MannKind and outsiders who believe Afrezza can still be a big seller agree that securing widespread coverage is a necessary first step to success. Of course, lowering prices will
MannKind: Path to Afrezza Survival Involves Lower Prices to Woo PayersA N D R E W S M I T H
In a short span, MannKind's founder
passed away, it parted ways with 2
chief executives, and it lost its marketing
partner.
SP138 | March 2016 • Volume 22, Special Issue 4 • Evidence-Based Diabetes Management
P H A R M A U P D A T E
hurt margins on existing sales, but Pfeffer hopes to offset the damage by launching Afrezza in some of the many foreign markets that will rapidly approve drugs that already have FDA approval. MannKind reports that it is already in talks with po-tential partners from a number of countries that could ap-prove Afrezza without any additional trials. These partners would use their knowledge of the local market not only to shepherd Afrezza onto pharmacy shelves, but also to market it to doctors and patients. Thanks to the potential for fast ap-proval, such partnerships could begin boosting Afrezza sales just months after they start, said Pfeffer, who noted that any substantial increase in sales volume would mitigate the ef-fect of domestic price cuts on margins by allowing MannKind factories to operate more efficiently, thus reducing unit costs.
“Much of Afrezza’s future hinges on what kind of deals MannKind signs with companies in foreign markets,” Keith Markey, PhD, who follows MannKind for Griffin Securities, said in an interview with Evidence-Based Diabetes Management (EBDM). “If MannKind only signs a couple low-dollar deals, then it will struggle to offer Afrezza at competitive prices here and it will struggle to escape its current situation. If MannKind can generate significant near-term revenues from foreign deals, though, it will have a real chance of turning things around. Any real cash flow would ease fears about the company’s financial position and increase its ability to market Afrezza in the US. Significant extra sales would also create the sort of economies of scale that would allow MannKind to price Afrezza competitively and still profit on its US business.”
REKINDLING MARKETING EFFORTSAs MannKind develops its plans for negotiation with payers after the Afrezza transfer from Sanofi, it is also developing plans for marketing the product. In the days after Sanofi an-nounced that it would back out of its deal to market and de-velop Afrezza, MannKind said that it would try something very different than the traditional campaign Sanofi had attempted, a campaign that largely hinged on sending sales personnel to doctors’ offices. MannKind also said that it would begin using social media to share more information, in a timelier fashion, with people who wish to follow the company. These statements led many to hope—or even to wrongly believe—that the company planned to market Afrezza via social media, both because the product already has a number of enthusias-tic supporters on sites like Twitter and because social media can allow savvy companies to reach large numbers of people more cheaply than they can with traditional marketing and advertising.
“Unfortunately,” Pfeffer said during the conference call, “that is not allowed under FDA regulations, which prohibit us from disseminating anecdotal information of any kind. In fact, no promotional information regarding Afrezza can be disseminated by us without including the black box warning and all associated safety information. Since these user ac-counts [with positive stories about Afrezza] obviously do not include such information, we cannot be directly associated with them. This means that MannKind’s Facebook and Twitter accounts may not even like or retweet such posts.”
Pfeffer said that MannKind is actively seeking a seasoned executive to run its sales and marketing efforts. He also said the company had formed an advisory council consisting of physicians, Afrezza users, and other stakeholders both to bind it more closely to the sort of opinion makers who can drive sales and to ask them for ideas about how a money-losing company that started the year with only $60 million in cash can afford to market a drug effectively.5
MannKind may get some additional cash to spend from an organization that says it will use Afrezza at outpatient dia-
betes clinics scheduled to open in major cities across the na-tion by the end of the first quarter, with a pilot facility in New Jersey. MannKind, which has not disclosed the name of the company opening those clinics, may also get some help with the cost of domestic marketing by finding a new partner in the United States, but it has no plans to enter an agreement like the one it signed with Sanofi and may not sign with anyone at all.
“MannKind is looking at other potential partners that may see Afrezza as a value-adding addition to their portfolios. But in addition, we are putting plans together to market and sell Afrezza ourselves,” Pfeffer said. “We’re also evaluating con-tract commercial organizations that can provide the neces-sary infrastructure as we build, or in lieu of, our own commer-cial infrastructure. Regardless of whether we take on another partner, it is our full intention to market the product ourselves retaining full rights of ownership, and Afrezza, at most, will be co-promoted with an additional partner or partners.”
Investors will have to wait until at least the second quarter of 2016 to see MannKind’s new marketing strategy and get any sense of its potential, but they may soon get some data about how better insurance coverage will affect Afrezza sales. Ac-cording to Markey, Sanofi signed deals that would make the drug a part of the standard formulary offered by 2 organiza-tions as of January 1, 2016. The first, Harvard Pilgrim Health Care, is a small regional insurer, but the second, CVS Care-mark, is the pharmacy benefits manager for nearly aquarter of all privately-insured Americans.6 MannKind’s next quar-terly results, in other words, will be the first to cover a pe-riod when any substantial number of Americans could get an Afrezza prescription covered by standard insurance.
Analysts who cover the company are not expecting any dra-matic sales surge—the company’s stock still trades around $1 and a recent consensus target price was under $37—but Afrez-za sales have been so low to date that a relatively small sales increase would be easy to see. This might indicate that there is some pent-up demand for the product among patients who have been unable to get it at reasonable prices so far. Indeed, it is hard to overstate how disappointing sales have been to date: before Afrezza hit the market, estimates of peak annual revenues ranged from $182 million to $2 billion.8 In its first 9 months on the market, however, total sales revenues barely exceeded $5 million.9
The big question, of course, is why sales have been so poor. MannKind and Afrezza supporters have always contended there would be strong demand for a product that not only would save patients with T1D from more than 1000 injections per year but also work faster than other short-acting insu-lin formulations.10 Patients with every conceivable condition mostly choose to avoid injectable medications whenever they can because they hate shots. They say this desire is so strong that widespread insurance coverage and decent marketing will allow Afrezza to thrive despite obstacles that include a black box warning about potential harm to user respiration and a requirement that patients undergo a spirometry test before beginning on Afrezza. Other observers disagree vehe-mently. They say that Afrezza’s failure to date, along with the failure of an earlier inhalable insulin called Exubera, demon-strates that patients with T1D simply are not clamoring for any such product.
“It’s pretty straightforward in my humble opinion: inhaling insulin is a dumb idea,” said Scott Hanselman, who blogs11 about his experiences with T1D and new options for treat-ing the condition. “The accuracy is questionable because it’s hard to translate units injected into units inhaled. It can de-monstrably and measurably lower lung function, presumably because lungs aren’t meant to absorb insulin,” he said in an
A B O U T M A N N K I N D
A L F R E D E . M A N N , M S
Mr Mann died February 25, 2016, at age 90 shortly after leaving the MannKind board. He had a long career in the biomedical industry before founding MannKind and developing Afrezza with his own funds.
M AT T H E W J . P F E F F E R Mr Pfeffer became CEO on January 10, 2016, after an ear-lier choice had to step down due to a post-employment restric-tion. He has been chief financial officer since 2008.

Evidence-Based Diabetes Management • March 2016 • Volume 22, Special Issue 4 | SP139
P H A R M A U P D A T E
The big question about Afrezza is why
sales have been so poor, when
supporters believed there
would be strong demand for a
product that would spare
those with type 1 diabetes up
to 1000 injections
a year.
interview with EBDM. “On the other hand, pens [for injecting insulin] are great: easy and nearly painless. And we’ll soon see super–fast acting insulins, and that’ll change the game when combined with continuous glucose monitors like the Dexcom G5 and the do-it-yourself open-source closed-loop systems or the Bigfoot Biomedical system. Afrezza is a solution without a problem.”
The evidence is also split on how much Afrezza users like the product. MannKind says the feedback it has received is overwhelmingly positive, and a quick search of social media will certainly find enthusiastic users.12,13 That said, Sanofi’s figures indicate that such enthusiasm is far from universal. Company spokeswoman Susan Brooks wrote in an e-mail that, as of January, only 35% of the 6000 patients who have ever started on Afrezza were still using it.
NONSTOP NEWS FOR MANNKINDAs MannKind refines its plans to increase those user figures, the company has also been generating news on other fronts. At least 2 legal practices are trying to launch a class-action lawsuit against the company.14,15 On the flip side, Pfeffer said during the conference call that the company had noticed what some of its investors considered suspicious short-selling and that MannKind was investigating the allegations and speak-ing to regulators about protecting the company’s investors.
The other big news from MannKind this year has struck some observers as even more mysterious. The company signed a deal to work on developing inhalable treatments for conditions, such as chronic pain, with a company called Receptor Life Sciences. MannKind announced that the deal could eventually bring in more than $100 million in milestone payments, but the most intriguing thing about the pact may be the utter lack of public information about Receptor.16
“I don’t understand the secrecy around Receptor Life Sci-ences and this deal. Is there anything you can say to provide some perspective or some comfort because right now there’s nothing for anyone to go on?” JP Morgan analyst Cory Kasimov asked Pfeffer during the conference call. “No one had ever heard of the company before the deal. It has no website. And the CFO is a 12-year valued employee of MannKind. Is there anything at all that you can share on this?”
“We’re not at liberty to disclose proprietary information of theirs,” Pfeffer said. “I can disclose that the company has been operating for some time. It’s not as new as it might seem, although they did recently change their name, which is why it may seem that it sprung up fairly recently. We know a lot about things we cannot talk about, like who the management team is and who’s behind the company and how they’re fund-ed. They have some reasons of their own why they don’t want to make those things public…and we have to respect that.”
Receptor will not be paying any cash to MannKind upfront, so the deal should not have any immediate effect on the company’s ability to market Afrezza. Finally, as EBDM went to press, word came that Mann had passed away in Las Ve-gas, just a week after leaving the board of the company he founded. MannKind had announced that Kent Kresa, the for-mer chairman and CEO of Northrup Grumman, will become chairman.17-18 EBDM
R E F E R E N C E S
1. Smith A. Sanofi pulls plug on Afrezza deal, putting drug’s future in doubt. American Journal
of Managed Care website. http://www.ajmc.com/newsroom/sanofi-pulls-plug-on-afrezza-
deal-putting-drugs-future-in-doubt. Published January 6, 2016. Accessed February 17, 2016.
2. MannKind Corp. Management Conference Call webcast archive. http://edge.media-server.
com/m/p/dezd7h9o. Published February 3, 2016. Accessed February 17, 2016.
3. MannKind announces senior management changes [press release]. Valencia, CA:
Globe Newsire; November 20, 2015. http://investors.MannKindcorp.com/releasedetail.
cfm?ReleaseID=943816. Accessed date?
4. Peterson M. Troubled drugmaker names another CEO. Los Angeles Times website. http://
www.latimes.com/business/la-fi-MannKind-ceo-20160111-story.html. Published January 11,
2016. Access February 17, 2016.
5. Feroldi B. Is MannKind Corporation’s stock really only worth 5 cents? Motley Fool website.
http://www.fool.com/investing/general/2016/01/06/is-mannkind-corporation-really-only-
worth-5-cents.aspx. Published January 6, 2016. Accessed February 17, 2016.
6. 2014 PBM market share. Pharmacy Benefit Management Institute website. https://www.
pbmi.com/2015/04/2014-pbm-market-share/. Published March 31, 2015. Accessed Febru-
ary 17, 2016.
7. Dobrow T. MannKind Co (MNKD) raised to strong buy at Vetr Inc. Financial Market News
website. http://www.financial-market-news.com/MannKind-co-mnkd-raised-to-strong-buy-at-
vetr-inc/794780/. Published February 5, 2016. Accessed February 17, 2016.
8. Staton T. It’s put up or shut up time for Sanofi and MannKind as Afrezza hits the market.
FiercePharma website. http://www.fiercepharma.com/story/its-put-or-shut-time-sanofi-and-
MannKind-afrezza-hits-market/2015-02-03. Published February 3, 2015. Accessed February
17, 2016.
9. Hirschler B. Poor sales prompt Sanofi to pull plug on MannKind inhaled insulin. Reuters
website. http://www.reuters.com/article/us-sanofi-MannKind-idUSKBN0UJ1KO20160105.
Published January 5, 2016. Accessed February 17, 2016.
10. Sanofi and MannKind partner to bring ultra-rapid inhaled insulin Afrezza to market by early
2015. The diatribe Foundation website. http://diatribe.org/issues/68/new-now-next/3.
Published August 19, 2014. Accessed February 17, 2016.
11. Scott Hanselman blog. http://www.hanselman.com/. Accessed February 17, 2016.
12. Afrezzauser (Sam Finta) Twitter account. https://twitter.com/afrezzauser. Accessed
February 17, 2016.
13. Afrezza Spiro Twitter account. https://twitter.com/SpiroHere. Accessed February 17,
2016.
14. Federman & Sherwood announces filing of securities class action lawsuit against
MannKind Corp [press release]. Oklahoma City, OK: Yahoo Finance; January 20, 2016. http://
finance.yahoo.com/news/federman-sherwood-announces-filing-securities-165502983.html.
Accessed February 17, 2016.
15. Investor alert: Law offices of Vincent Wong notify investors of a class action involv-
ing MannKind Corp. and a lead plaintiff deadline of March 15, 2016 [press release]. New
York, NY: Business Wire; February 16, 2016. http://www.businesswire.com/news/
home/20160216006440/en/. February 17, 2016.
16. MannKind enters into collaboration and license agreement [press release]. Valencia, CA:
Globe Newswire; January 21, 2016. http://finance.yahoo.com/news/mannkind-enters-
collaboration-license-agreement-140000395.html. February 17, 2016.
17. Alfred Mann steps down as executive chairman of MannKind [press release]. Valencia,
CA: Globe Newswire; February 19, 2016. http://investors.mannkindcorp.com/releasedetail.
cfm?ReleaseID=955814. Accessed February 19. 2016.
18. MannKind’s Alfred E. Mann, 90, Remembered as Entrepreneur and Philanthropist. GEN
News Highlights. Published and accessed February 26, 2016. http://www.genengnews.com/
gen-news-highlights/mannkind-s-alfred-e-mann-90-remembered-as-entrepreneur-and-philan-
thropist/81252414/
A B O U T T H E E X P E R T
K E I T H D . M A R K E Y, P H D
Dr Markey is an analyst with Griffin Industries. He says MannKind's future depends on the deals it reaches in foreign markets.

SP140 | March 2016 • Volume 22, Special Issue 4 • Evidence-Based Diabetes Management
O B E S I T Y
I left that meeting
convinced that those of us who care about diet and health ought to follow the lead of the anti-smoking advocates and pay the same kind of close critical attention to Coke and Pepsi.”
M A R I O N N E S T L E , P H D , M P H ,
A U T H O R , S O D A P O L I T I C S
Is Soda the New Tobacco? An Expert, and New CDC Data, Say YesM A R Y C A F F R E Y
The way sugar-sweetened beverages have been mar-keted—so that get children hooked early, despite long-term health effects—is strikingly similar to how
tobacco companies peddled cigarettes, both before and after the 1964 US Surgeon General’s report highlighting the link be-tween smoking and cancer.1
So argues Marion Nestle, PhD, MPH, in Soda Politics, a book that traces the history of how soda giants Coca-Cola and Pep-siCo came to occupy their place in both our consciousness and our refrigerators. While US consumption of sugary drinks, especially soda, declined 25% between 1998 and 2014, that drop has been uneven in a way that also resembles tobacco: more sugary drinks are consumed in poorer states that are now plagued with higher rates of diabetes and obesity.
In her introduction, Nestle, the Paulette Goddard Professor of Nutrition, Food Studies, and Public Health at New York Uni-versity, describes the revelation she experienced at a confer-ence during the 1990s. Already very interested in the effect of sodas on health, she attended a talk on cigarette advertising to global markets, much of it aimed at children. “The speakers demonstrated how cigarette companies deliberately created their ads to blend into the surroundings and slip below the radar of conscious notice or critical thought,” she writes. “I left that meeting convinced that those of us who care about diet and health ought to follow the lead of anti-smoking advocates and pay that same kind of close critical attention to the mar-keting of Coke and Pepsi.”1
In gathering information for Soda Politics, one of Nestle’s biggest challenges was obtaining data on how much soda is produced and consumed. For decades until 2003, the US De-partment of Agriculture (USDA) published data on the number of gallons of carbonated beverages produced by the industry, until the companies refused to allow publication. Nestle paid to gain access to the industry data, which show production leveling off and declining after 2003.
“The word is out that they’re not good for you,” Nestle said of soda and sugary drinks in an interview with Evidence-Based Diabetes Management (EBDM). There’s been a real shift in con-sumption patterns, she said, but that doesn’t mean the bever-age industry is giving up without a fight.
GETTING SODA OUT OF SNAPNestle is among the nutrition advocates who argue that tack-ling America’s obesity and diabetes crisis means taking on the soda industry through a variety of means, from taxes to warn-ing labels, and especially getting soda removed from eligibility for the Supplemental Nutrition Assistance Program (SNAP), better known as food stamps. The logic is the same as new laws that are banning smoking from public housing: taxpay-ers should not subsidize unhealthy behavior, the consequenc-es of which drive up Medicaid and Medicare costs.
A 12-ounce can of Coke has 140 calories, 39 g of sugar, and no nutritional value. If the empty calories from soda are such an obvious cause of obesity, why does SNAP still pay for soda? Because, Nestle writes, the beverage companies have fought every attempt at reform. What sets her apart from many nutrition advocates is her ability to “follow the money” and show the connections between industry influence–peddling and health policy. (Her well-known blog, Food Politics, regu-larly calls out industry-funded nutrition studies that produce favorable results.)
For example, when New York City sought a waiver from
USDA in 2011 to keep soda out of SNAP, she writes, the Ameri-can Beverage Association (ABA) called it “another attempt by government to tell New Yorkers what they should eat and drink.” ABA also targeted members of the Congressional Black Caucus (CBC) and urged them to get USDA to reject the waiver. Coke and Pepsi each also contributed to the CBC Foundation, in the range of $250,000.1 (Right now, a New York State law-maker is trying to get soda out of SNAP through legislation.2)
The CBC contribution is a classic example of soda market-ing that Nestle highlights: gifts to charitable causes, especially in minority communities, that build goodwill for soda compa-nies. The soda giants are masters at seizing such moments: in January, Coke and Pepsi (along with Walmart) announced plans to distribute free water to public school children in Flint, Michigan, where lead contamination has made the public wa-ter system a health hazard.3
Nestle is not alone in taking aim at the soda giants. The Center for Science in the Public Interest (CSPI) has increasing-ly set its sights on Big Soda, calling for soda taxes and warn-ing labels in order to get sugary drinks out of kids’ menus, hospital settings, and government facilities.4 As EBDM went to press, CSPI cited new data from CDC, which bolster Nestle’s case that marketing of soda hits hardest on the poor and on minorities, with serious health consequences.4,5
And the soda companies, looking to replace lost revenue, have taken one more page from the cigarette manufacturers, Nestle writes: they have looked overseas for new customers, bringing soda to the developing world.
DATA SHOW LINKS WITH DIABETES AND OBESITYA review of the CDC study, which covered 23 states and the District of Columbia in 2013, identified the share of the popu-lation that reported drinking at least 1 sugar-sweetened bever-age per day, which could include a nondiet soda, a sweetened iced tea, a sugar-sweetened fruit drink, or a sports energy drink. States with the highest sugary drink consumption were Mississippi (47.5%), Louisiana (45.5%), and West Virginia, (45.2%).5 According to 2013 data from CDC, these states rank second, seventh, and fourth, respectively, among the 50 states for incidence of diabetes per 100 population (see TABLE ).6
T A B L E. States With High Soda Consumption Rank High for Diabetes, Obesity.
STATESHARE DRINKING ≥ 1 SODA PER DAY (RANK)1
DIABETES INCIDENCE/100 POPULATION (RANK)2
OBESITY (RANK)3
Mississippi 47.5% (1st) 12.0 (2nd) 35.5% (3rd)
Louisiana 45.5% (2nd) 10.8 (7th) 34.9% (4th)
West Virginia
45.2% (3rd) 11.2 (4th) 35.7% (2nd)
1. Park S, Xu F, Town M, Blanck HM. Prevalence of sugar-sweetened beverage intake among adults—23 states and the District of Columbia, 2013. Mortal Morb Wkly Rep. 2016;65(7):169-174. doi: 10.15585/mmwr.mm6507a1. 2. National Diabetes Surveillance System. CDC website. http://gis.cdc.gov/grasp/diabetes/DiabetesAtlas.html. Accessed February 25, 2016.3. Adult obesity facts. CDC website. http://www.cdc.gov/obesity/data/table-adults.html. Updated September 21, 2015. Accessed February 25, 2016.
These states also had 3 of the 4 highest self-reported rates of obesity in the country in 2014, according to the Behavioral Risk Factor Survey System. After Arkansas’ rate of 35.9%, West Virginia reported 35.7%, followed by Mississippi at 35.5% and Louisiana at 34.9%.7 The CDC study also found that sugary
A B O U T T H E E X P E R T
M A R I O N N E S T L E , P H D , M P H
Dr Nestle is the Paulette Goddard Professor of Nutrition, Food Studies, and Public Health at New York University.

Evidence-Based Diabetes Management • March 2016 • Volume 22, Special Issue 4 | SP141
Much like the tobacco companies
before them, Nestle writes,
the soda industry and its
ally, the sugar industry, have
flexed their muscles to open new markets in the developing
world.
O B E S I T Y
drink consumption was most common among the 18-to-24-year-old age group (43.3%), non-Hispanic blacks (39.9%), the unemployed (34.4%), and those with less than a high school education (42.4%).5 CSPI called for action because the study found soda consumption is 1.5 times higher among blacks and 1.4 times higher among Hispanics than whites.4
RESEARCH, MARKETING, AND MONEYMuch like the tobacco companies before them, Nestle writes, the soda industry and its ally, the sugar industry, have flexed their muscles to open new markets in the developing world, removing any obstacles—including individuals who ques-tioned the health effects of soda.
Nestle chronicles the saga of Derek Yach, MBChB, MPH, for-merly of the World Health Organization (WHO). In 2006, he was working on the WHO strategy to extend worldwide the US recommended limits that no more than 10% of daily calories come from sugar. With no warning, Yach was pushed out of his research post. Leaked e-mails later revealed the role that US lobbyists played in getting senators from sugar- and corn syrup–producing states to threaten to cut WHO funding. The report Yach was working on lacked the 10% recommendation, but a report issued in 2015 did call for this limit.8
Yach then stunned former colleagues when he accepted a post with PepsiCo to run its global health strategy, to try to change the industry from within. In a response that Nestle published, Yach wrote that distrust of the industry is so mas-sive that he was blackballed from publishing in many aca-demic journals. He reported working with PepsiCo to reduce salt, sugar, and saturated fat in its food products, as well as re-formulation strategies for many foods and beverages. He has since left PepsiCo to run the Vitality Institute.
Coca-Cola, meanwhile, copied the tobacco companies of the 1960s by funding research to deflect blame for soda’s role in obesity. In her book, Nestle writes about this “physical activity diversion,” and just after Soda Politics went to press, Coca-Cola’s efforts massively backfired. In August 2015, The New York Times wrote the first of several stories that would expose that Coca-Cola had more than a funding role in the Global Energy Balance Network (GEBN), whose scholars found that lack of exercise, not calorie consumption, is responsible for obesity.9 The Uni-versity of Colorado returned a $1-million grant that had origi-nated with Coca-Cola, and the network has since disbanded.10
To Nestle, the GEBN saga was shocking on one level, but not when taken in the context of where things had been headed. Previously, research backed by Coca-Cola had attacked the va-lidity of the National Health and Nutrition Examination Survey (NHANES) data, which ask Americans about what they eat and drink to track consumption and public health trends. As Nes-tle writes, NHANES data, which have consistently found that about half of Americans drink soda on any given day, also find that about 20% drink more than 4 sodas a day and consump-tion begins when children are very young.
The media’s ability to document how Coca-Cola was direct-ing a research enterprise “was the smoking gun,” Nestle said in the EBDM interview. “And the fallout has been extraordinary.”
DOCUMENTING GLOBAL MARKETINGNestle’s Soda Politics is a road map through the paths that bev-erage companies have plowed into the fabric of American life through marketing, charitable gifts, and, increasingly, targeted outreach to minority groups, especially the growing Hispanic population. Despite this, public health leaders have succeed-ed in pushing back against Big Soda: a massive change came in 2013 when McDonald’s stopped offering soda as the default option with Happy Meals. After 2 years, the share of children ordering soda dropped from 56% to 48%.11
Since the Yach incident, advocacy groups are singling out WHO to do more to lead efforts against soda consumption. In February, CSPI issued a report, Carbonating the World, that documents levels of global investment by the soda compa-
nies as US consumption has ebbed.12 The group found that Coca-Cola has invested $12.4 million in Mexico, which leads the world in obesity; other investments include $7.6 billion in Brazil, $17 billion on the African continent, $4 billion in China, $5 billion in India, and $1.2 billion in the Philippines.12
Both Soda Politics and the CSPI report discuss at length mar-keting efforts that reach children, and neither is swayed by in-dustry’s claims of improved behavior. Nestle spends an entire chapter picking apart the guidelines that bar “direct” advertis-ing when 35% of the audience is under age 12. Like Nestle, the CSPI authors draw multiple comparisons to earlier efforts by Big Tobacco to take their strategies abroad once US sales declined.1,12
In response to the CSPI report, the International Council of Beverage Associations (ICBA) called beverage companies “good global citizens” and said the report “ignores the eco-nomic importance of jobs and the investments beverage com-panies bring to the hundreds of thousands of employees and their families.” ICBA took particular exception to the claims about marketing to children, saying that tests show 94% com-pliance with the advertising guidelines in every market.13
Nestle is encouraged by the advocacy work she sees, but said more needs to be done. “There is interest in tax initiatives in a lot more locations,” she said, and more papers about to be published, but the long road of public education remains. It’s a matter of getting children to drink water, getting the FDA to put “added sugar” on food labels, and promoting a simple message: “We shouldn’t be drinking sugar.” EBDM
R E F E R E N C E S
1. Nestle M. Soda Politics: Taking on Big Soda (and Winning). 1st ed. New York, NY: Oxford
University Press; 2015.
2. Olson S. SNAP benefits may cut out junk food and luxury items in effort to limit food
stamps to ‘essentials.’ Medical Daily website. http://www.medicaldaily.com/food-stamps-
junk-food-snap-benefits-luxury-items-374786. Published February 23, 2016. Accessed
February 28, 2016.
3. Walmart, Coca-Cola, Nestle, and PepsiCo come together to provide Flint, Mich., public
schools with water for students through the end of the year [press release]. Bentonville, AR:
Walmart; January 26, 2016. http://news.walmart.com/news-archive/2016/01/26/walmart-
coca-cola-nestle-and-pepsico-come-together-to-provide-flint-mich-public-schools-with-water-
for-students-through-the-end-of-the-year. Accessed February 28, 2016.
4. Americans guzzling too much soda, despite declines [press release]. Washington, DC:
Center for Science in the Public Interest; February 25, 2016. http://www.cspinet.org/
new/201602251.html. Accessed February 25, 2016.
5. Park S, Xu F, Town M, Blanck HM. Prevalence of sugar-sweetened beverage intake among
adults—23 states and the District of Columbia, 2013. Mortal Morb Wkly Rep. 2016;65(7):169-
174. doi: 10.15585/mmwr.mm6507a1.
6. National Diabetes Surveillance System. CDC website. http://gis.cdc.gov/grasp/diabetes/
DiabetesAtlas.html. Accessed February 25, 2016.
7. Adult obesity facts. CDC website. http://www.cdc.gov/obesity/data/table-adults.html.
Updated September 21, 2015. Accessed February 25, 2016.
8. WHO calls on countries to reduce sugars intake among adults and children [press release].
Geneva, Switzerland: World Health Organization; March 4, 2015. http://www.who.int/media-
centre/news/releases/2015/sugar-guideline/en/. February 28, 2016.
9. O’Connor A. Coca-Cola funds scientists who shift blame for obesity away from bad diets.
The New York Times website. http://well.blogs.nytimes.com/2015/08/09/coca-cola-funds-
scientists-who-shift-blame-for-obesity-away-from-bad-diets/?_r=0. Published August 9, 2015.
Accessed February 25, 2016.
10. O’Connor A. Research group funded by Coca-Cola to disband. The New York Times
website. http://well.blogs.nytimes.com/2015/12/01/research-group-funded-by-coca-cola-
to-disband/. Published December 1, 2015. Accessed February 25, 2016.
11. Giammona C. McDonalds finds many kids still want soda with Happy Meals. Bloomberg
website. http://www.bloomberg.com/news/articles/2015-06-25/mcdonald-s-finds-many-
kids-still-want-soda-with-happy-meals. Published June 25, 2015. Accessed February 25, 2016.
12. Taylor AL, Jacobson MF. Carbonating the world: the marketing and health impact of sugar
drinks in low- and middle-income countries. Center for Science in the Public Interest website.
http://www.cspinet.org/carbonatingreport.pdf. Accessed February 9, 2016.
13. Caffrey M. Soda giants turn to developing world to replace lost US sales, report finds.
American Journal of Managed Care website. http://www.ajmc.com/focus-of-the-week/0216/
soda-giants-turn-to-developing-world-to-replace-lost-us-sales-report-finds. Published February
9, 2016. Accessed February 25, 2016.
Pregnant women with
diabetes may have trouble
breastfeeding later. View more
at http://bit.ly/1Tt93qS

SP142 | March 2016 • Volume 22, Special Issue 4 • Evidence-Based Diabetes Management
Topline results show that liraglutide, marketed for patients with type 2 dia-
betes as Victoza, reduced the risk of major adverse cardiovascular events for
these patients over a 5-year period.
Results of the LEADER trial were reported March 4, 2016, by drug maker Novo Nord-
isk, which also markets a different dose of liraglutide for patients with obesity under
the brand name Saxenda.1 Liraglutide is a glucagon-like peptide (GLP-1) receptor ago-
nist; it is approved in 1.2-mg and 1.8-mg doses for the treatment of type 2 diabetes
(T2D). The larger 3-mg dose is approved to treat obesity.
According to a statement from Novo Nordisk, the trial in 9000 adult patients com-
pared the addition of either liraglutide or placebo to standard of care and met the
primary endpoint of showing noninferiority as well as demonstrated superiority,
with a statistically significant reduction in cardiovascular risk. The primary end-
point of the study was defined as the composite outcome of the first occurrence of
cardiovascular death, nonfatal myocardial infarction, or nonfatal stroke. The supe-
rior reduction of major adverse cardiovascular events demonstrated by liraglutide
was derived from all 3 components of the endpoint. Safety outcomes were consis-
tent with previous clinical trials.
“People with type 2 diabetes generally have a higher risk of experiencing ma-
jor adverse cardiovascular events. That’s why we are very excited about the results
from LEADER, which showed that Victoza, in addition to helping people with type
2 diabetes control their blood sugar levels, also reduces their risk of major adverse
cardiovascular events,” said Mads Krogsgaard Thomsen, executive vice president
and chief science officer of Novo Nordisk.
Novo Nordisk’s statement said full results will be presented at the 76th Scientific
Sessions of the American Diabetes Association, to be held in New Orleans in June
2016.1 EBDM
R E F E R E N C E S
1. Victoza significantly reduces the risk of major adverse cardiovascular events in the LEADER trial [press release].
Bagsværd, Denmark: Novo Nordisk; March 4, 2016. http://www.novonordisk.com/media/news-details.1991879.html.
Accessed?
CMS, AHIP Align and Simplify Quality Measures With 7 Core Sets L AU R A J O S Z T
A collaboration led by CMS and America’s Health Insurance Plans (AHIP) has
resulted in 7 sets of core quality measures created to support quality im-
provement and provide better alignment. The measures, developed as part
of a broad Core Quality Measures Collaborative of healthcare system participants,
are an effort to reduce complexity for reporting clinicians, decrease cost burden to
consumers and the system, and ensure high-quality care for patients.
“In the US healthcare system, where we are moving to measure and pay for qual-
ity, patients and care providers deserve a uniform approach to measure quality,”
CMS Acting Administrator, Andy Slavitt, said in a statement. “This agreement…
will reduce unnecessary burden for physicians and accelerate the country’s move-
ment to better quality.”
The core measures released—meant to be implemented in several stages—are in
the following 7 sets:
• Accountable care organizations, patient-centered medical homes, and primary care
• Cardiology
• Gastroenterology
• HIV and hepatitis C
• Oncology
• Obstetrics and gynecology
• Orthopedics
While CMS is already using measures from the core sets, it plans to implement
new core measures while eliminating those that are redundant. The Health Care
R E S E A R C H R E P O R T
Results of a 2-year trial show that patients who have already experienced
moderate vision loss from diabetic macular edema (DME) would be better
off using aflibercept (Eylea) than trying to get by with a cancer drug that
some have used for the condition to save money.1 The National Institutes of Health
(NIH) issued a press release February 29, 2016,2 to announce results of the study,
conducted by the Diabetic Clinical Research Network and funded by the National
Eye Institute.
Aflibercept and ranibizumab (Lucentis) are approved by the FDA specifically to
treat DME and other ocular conditions, while bevacizumab (Avastin), another drug
in the class of vascular endothelial growth factor (VEGF) inhibitors, is approved to
treat a number of metastatic cancers. The NIH study first reported results a year
ago and found a clear advantage for aflibercept for patients with vision of 20/50 or
worse at the start of treatment.3 At the 2-year mark, however, the FDA-approved
treatments aflibercept and ranibizumab showed no statistical difference for pa-
tients who started with at least moderate vision loss (20/50 or worse). For those
with vision of 20/32 to 20/40 at the start of treatment, all 3 drugs produced about
the same results, according to the NIH statement.2
DME occurs when diabetes progresses to the point that central vision blurs due to
leakage of fluid from abnormal blood vessels in the retina. The macula is the area of
the retina used when looking straight forward. During treatment, the drug is injected
into the eye and blocks the VEGF that normally promotes blood vessel growth and
causes the leakage. Although the 3 therapies have a similar mechanism of action,
they differ substantially in cost, with bevacizumab costing $60 a dose compared with
$1850 for aflibercept and $1200 for ranibizumab.2
Besides varying results, dosing protocols are different: both aflibercept and ra-
nibizumab require dosing every 4 weeks for the first 5 cycles, but then aflibercept
only requires dosing every 8 weeks. A 2015 analysis by Adverse Events, now Advera
Health Analytics, found that this difference, among others, meant that aflibercept
was actually more cost-effective in the long run.4
The study enrolled 660 patients at 89 clinical trial sites; participants could have
type 1 or type 2 diabetes and the average age was 61 years. Participants were ran-
domly assigned to take one of the 3 study drugs and then were evaluated once a
month for the first year and between every 4 and 16 weeks during the second year.1
According to the NIH, most participants received monthly injections during the
first 6 months and then additional injections until DME resolved or vision did not
improve. Injections could resume if DME worsened, and laser treatments could be
added if DME persisted. Before the anti-VEGF class of therapies became standard,
laser treatment was the only option for patients with DME.2
John A. Wells, MD, the lead author of the study and a specialist at Palmetto Retina
Center in Columbia, South Carolina, said, “The study suggests there is little advan-
tage of choosing Eylea or Lucentis over Avastin when a patient’s loss of visual acu-
ity from macular edema is mild, meaning visual acuity is 20/40 or better. However,
patients with 20/50 or worse vision loss may benefit from Eylea, which over the
course of the 2-year study, outperformed Lucentis and Avastin.”2
The number of injections needed was about the same for all 3 treatment groups,
according to the statement from NIH. EBDM
R E F E R E N C E
1. Wells JA, Glassman AR, Ayala AR, et al; Diabetic Retinopathy Clinical Research Network. Aflibercept, bevacizumab, or ranibizumab
for diabetic macular edema: two-year results from a comparative effectiveness randomized clinical trial [published online February 29,
2016]. Ophthalmology. doi:http://dx.doi.org/10.1016/j.ophtha.2016.02.022.
2. Eylea outperforms Avastin for diabetic macular edema with moderate or worse vision loss [press release]. Bethesda, MD: National
Institutes of Health; February 29, 2016. http://www.nih.gov/news-events/news-releases/eylea-outperforms-avastin-diabetic-macu-
lar-edema-moderate-or-worse-vision-loss. Accessed February 29, 2016.
3. Wells JA, Glassman AR, Ayala AR, et al; Diabetic Retinopathy Clinical Network. Aflibercept, bevacizumab, or ranibizumab for diabetic
macular edema. N Engl J Med. 2015;372(13):1193-1203. doi:10.1056/NEJMoa1414264.
4. Caffrey MK. NEJM study: Aflibercept offers benefits over rivals for DME if vision loss is worse at outset. Am J Manag Care.
2015;21(SP11):SP370.
5-Year Study Finds Liraglutide Reduced Risk of Major CV Events M A R Y C A F F R E Y
Aflibercept Outperforms Bevacizumab for DME in Patients With Moderate Vision Loss M A R Y C A F F R E Y
D E P A R T M E N T / T I T L E
M A N A G E D C A R E U P D A T E
SAFETY: 6.75”
SAFETY: 9.5”
TRIM: 7.75”
TRIM: 10.5”
BLEED: 8.75”
BLEED: 11.5”
THIS ADVERTISEMENT PREPARED BY NeONClient: J&JProduct: INVOKANAJob#: 10458324Job Name: A-SizeAd Code: 034582-151016
Publications:Colors: 4CSizes: Bleed: 8.75" W x 11.5" H Trim: 7.75" W x 10.5" H Live: 6.75" W x 9.5" H
10458324 UPDATED EXPERIENCE DECEMBER ADS A-SIZE
© Janssen Pharmaceuticals, Inc. 2015 December 2015 034582-151016
Janssen Pharmaceuticals, Inc.Canaglifl ozin is licensed from Mitsubishi Tanabe Pharma Corporation.
* Data on fi le. Based on TRx data sourced from IMS NPA Database, weekly data through 11/09/15.
Reference: 1. Data on fi le. Janssen Pharmaceuticals, Inc., Titusville, NJ.
6 MILLION
PRESCRIPTIONS
TO DATE 1*
MORE THAN
6 MILLION
PRESCRIPTIONS
TO DATE 1*
MORE THAN
Learn more and register for updatesat INVOKANAhcp.com
And preferred coverage for more than80% of commercial patients1
Preferred coverage for
MORE THAN 90%of Medicare Part D patients1
034582-151016_Exp_Journal_Ad_DEC_Update_A_FR.indd 1 11/6/15 4:35 PM
Payment Learning and Action Network will integrate the measures, as will com-
mercial health plans when their contracts come up for renewal.
Helen Burstin, MD, MPH, chief scientific officer of the National Quality Forum (NQF),
who also participated in the collaborative’s efforts, called the agreement on core mea-
sures sets “an important step” toward making healthcare more effective and efficient.
“Clinicians need fewer, and more meaningful measures that reduce the burden of
reporting multiple quality measures to different entities and take time away from
direct patient care,” Burstin said in a statement. “And consumers need measures
that provide actionable information to better inform healthcare decisions.”
NQF-provided technical assistance, and many of the core measures, are already
endorsed by the organization.
The core measure sets will be reviewed on an ongoing basis and the collaborative
will develop a process to ensure the measure sets reflect the most up-to-date evidence.
“The collaborative’s efforts are a critical step forward in improving health out-
comes and quality care for patients,” Carmella Bocchino, executive vice president
of AHIP, said in a statement. “This process will ensure measures and reporting are
consistent across programs in both the private and public sectors.” EBDM
R E F E R E N C E
Core Measures. CMS website. https://www.cms.gov/Medicare/Quality-Initiatives-Patient-Assessment-Instruments/
QualityMeasures/Core-Measures.html. Updated February 16, 2016. Accessed March 9, 2016.

SP144 | March 2016 • Volume 22, Special Issue 4 • Evidence-Based Diabetes Management
M A Y O C L I N I C
We find ourselves in a situation in which quality targets may not be helping, and in some cases, may be harming patients struggling with the hard work of living with diabetes.5 Consider the case of Maria, a single mother of 3 who works 2 part-time jobs while living with type 2 diabetes and hypertension. Over the last 2 years, she has partnered with her primary care cli-nician to improve her diabetes control. During this time, she has worked on improving her diet and regularly taking 2 oral antidiabetic drugs, and a daily injection of long-acting insulin. Her A1C has dropped from 14% to 8%, she has lost weight, and she has been free of hypoglycemia. This is an achievement that Maria and her clinician consider worthy of celebration. Yet, in order to meet a reimbursement-tied A1C quality target <7.5%, she would likely need to switch to a self-managed and complex multi-dose insulin program. This approach is both demanding and expensive. This program will add a financial and treatment burden that may compete with, and even compromise, her ability to maintain the positive lifestyle changes that she has achieved, while contributing to weight gain and hypoglycemia. Is achieving the A1C target really the best for this patient? Was the clinic really not providing high quality care when her A1C dropped from 14% to 8%? Furthermore, are these “wins” not particularly relevant for practices that serve populations with difficult living conditions and poor health profiles, in which the resources to implement complex treatments are more limited? Perversely, by tying reimbursement to strict A1C targets, payers may be penalizing practices that are serving populations, most challenged by the demands of living with diabetes, and reward-ing practices that actively exclude those patients from care.
HOW DID WE GET HERE? Diabetes care is a practice that is rampant with measures—it is through these measures that we commonly detect diabe-tes, in the first place, and monitor the progression of a dis-ease that often remains asymptomatic. The Diabetes Qual-ity Improvement Project (DQIP), in the early 2000s, proposed A1C, lipid testing, LDL ≤ 130, blood pressure control, foot, eye and renal examinations as measures of diabetes care quality. These measures were widely adopted along with the Health-care Effectiveness Data and Information Set (HEDIS),6 and re-flected what was easier to retrieve and report to payers or the public from medical records and laboratory results. They do not, however, take into account how care comes together to advance the situation of a given patient.
Many diabetes patients present with multiple competing conditions, many of which are also chronic.7 Being chronic, these conditions invariably intertwine with one another and the economic, time, familial, and social burdens of day-to-day life. For these patients, it is harder to isolate diabetes as a dis-crete illness or to separate its management from the other demands of life. Early, single-disease-specific measures, that offer a narrow measure of quality such as A1C, neglect the quality and character of the work that patients and clinicians are doing in treating lives lived with diabetes.
GOALS AND WHAT IS BEST FOR THE PATIENTQuality targets work well when they promote a practice that is effective, safe, and feasible, regardless of the presence of co-morbidities and social and economic complications. In short, quality targets work well to drive compliance when medical science clearly knows what is best for the patient. Most dia-betes care fails this criterion. Lowering A1C to <7.5%, for ex-ample, is associated with modest beneficial effects, at best, for the average patient.8 In Maria’s case, it is difficult, and likely futile, to isolate diabetes as an object of care given the com-plex tapestry of personal, social, and economic concerns that characterize her situation. Achieving levels of A1C <7.5% is clearly possible, yet it is not clear that in achieving this target we are providing high-quality care for Maria.
Contemporary diabetes care is not a practice of clear-ly knowing what is best and applying that knowledge to achieve high-quality care. Diabetes care is practiced in con-ditions in which it is far from clear what the best course of action is for the individual patient and her family. Goals such as quality targets that dictate action in situations where we clearly know what is best for a patient and her family, do not necessarily work in situations in which we remain uncertain as to what “best” is.9
In the context of the intellectually, practically, and emo-tionally troubling situations of life with comorbid diabetes, medicine must go beyond the application of knowledge. It must partner with patients to create courses of action that address the specific challenges of each patient. When what is best is unclear, processes must be found to find a coher-ent way forward. These may include activities such as shared decision making—a deliberative act in which patients and clinicians think and talk through hypotheses of how to proceed.10 In the course of these conversations, goals may emerge—for example, to work on strengthening the patient’s mental state and supportive relationships so that she can better deal with challenges. These situational goals, how-ever, will have different qualities than existing fixed targets, specifically:
1. Situational goals arise in order to attend to the problem of an individual’s situation. In so doing, a goal will help to discern, from the tangle of contextual complications, the nature of the particular problem that currently requires action, along with the means by which the problem may possibly be addressed.
2. Because the function of a situational goal is to help clini-cians deal with the problem of a patient’s particular situ-ation, it is integrally connected to the problem at hand. In contrast, external arbiters apply fixed quality targets without regard for their applicability to the problems faced by each patient.
3. Situational goals are flexible and respond to changes in circumstances—as the problems of life with diabetes change, patients and clinicians will develop changing goals to attend to new circumstances.
Fixed quality targets are not intended to attend to the prob-lems of living with and treating diabetes. More commonly, they are adapted to problems of policy, organizational man-agement, and safety. There are significant challenges in all of these aspects of providing diabetes care, and fixed quality targets undoubtedly have a role to play in ensuring that best practices are followed. We should, however, be mindful of the problems that targets were designed to address and modify them when they no longer serve. In some cases, targets like, A1C, belong to a time when the problem of getting a quality measure implemented was more important than getting the right measure implemented.
Arguably, goals and targets are not developed for clini-cians and patients to achieve them, but to draw attention to problems in treating and living with diabetes, and open con-sideration of appropriate ways to address them, given each patient’s situation. Nothing is more frustrating for clinicians than to feel pushed to do the wrong thing for a patient by a misguided quality target. If quality targets are designed to improve our practice, then these targets should promote the best practices of patient-clinician collaboration to address the problems of life with comorbid diabetes. This may in-clude, as in the case of Maria, knowing when to celebrate. We may then find that quality in diabetes care is not the ap-plication of what medical science knows to be best. Rather, it is finding kind and careful ways forward when what is best is far from clear.
A B O U T T H E A U T H O R S
IAN HARGRAVES, PHD
Dr Hargraves is affiliated with the Knowledge and Evaluation Unit, Division of Endocrinology, Diabetes, Metabolism, and Nutrition; Department of Medicine, Mayo Clinic.
RENE RODRIGUEZ-GUTIERREZ, MD
Dr Rodriguez-Gutierrez is affiliated with the Knowledge and Evaluation Unit, Division of Endocrinology, Diabetes, Metabolism, and Nutrition; Department of Medicine, Mayo Clinic; and the Endocrinology Division, Joseph E. Gonzalez University Hospital, Monterrey, Mexico.
When Quality Fails Patients: Finding the Best in Diabetes Care(CONTINUED FROM COVER)
Arguably, goals and targets are not developed for clinicians and patients to achieve them, but to draw attention to problems in treating and living with diabetes, and open consideration of each patient's situation.

Evidence-Based Diabetes Management • March 2016 • Volume 22, Special Issue 4 | SP145
M A Y O C L I N I C
ACKNOWLEDGMENTSFor the last decade, the Patient Advisory Group, a group of pa-tients with diabetes from the community, has met with inves-tigators of the KER Unit, at Mayo Clinic, to ground their work on what matters to patients. The insights developed here would not have been possible without their generous contri-bution to the science of healthcare.
AUTHOR INFORMATIONThe authors are all affiliated with the Knowledge and Eval-uation Unit, Division of Endocrinology, Diabetes, Metabo-lism and Nutrition; Department of Medicine, Mayo Clinic, Rochester, Minnesota.
Dr Rodriguez-Gutierrez is also affiliated with the Endocri-nology Division, Department of Internal Medicine, Joseph E. Gonzalez University Hospital, Monterrey, Mexico.
AUTHOR CONTRIBUTIONSIH and VMM conceived and designed the outline for the man-uscript. IH drafted the manuscript. RRG and VMM contributed to manuscript critical appraisal and review. VMM is the guar-antor of this study. All authors had full access to all of the data and take responsibility for the integrity of the data and the accuracy of data. All authors reviewed and agreed on the final version of the manuscript. EBDM
CONFLICTS OF INTEREST: The authors declare no conflicts of interest.FINANCIAL DISCLOSURE: This publication was made possible by CTSA Grant Number UL1 TR000135 from the National Center for Advancing Translational Sciences (NCATS), a component of the National Institutes of Health (NIH). Its contents are solely the responsibility of the authors and do not necessarily represent the official view of NIH.
R E F E R E N C E S
1. Garber AJ, Abrahamson MJ, Barzilay JI, et al. AACE/ACE comprehensive diabetes manage-
ment algorithm 2015. Endocr Pract. 2015;21(4):438-47. doi: 10.4158/EP15693.CS.
2. American Diabetes Association. Standards of medical care in diabetes. Diabetes Care.
2005;28 Suppl 1:S4-S36.
3. Phillips LS, Branch WT, Cook CB, et al. Clinical inertia. Ann Intern Med. 2001;135(9):825-
34.
4. Murad MH, Shah ND, Van Houten HK, et al. Individuals with diabetes preferred that future
trials use patient-important outcomes and provide pragmatic inferences. J Clin Epidemiol.
2011;64(7):743-8. doi: 10.1016/j.jclinepi.2010.08.005.
5. Saver BG, Martin SA, Adler RN, et al. Care that matters: quality measurement and health
care. PLoS Med. 2015;12(11):e1001902. doi: 10.1371/journal.pmed.1001902.
6. Fleming BB, Greenfield S, Engelgau MM, Pogach LM, Clauser SB, Parrott MA. The Diabetes
Quality Improvement Project: moving science into health policy to gain an edge on the diabe-
tes epidemic. Diabetes Care. 2001;24(10):1815-20.
7. Wallace E, Salisbury C, Guthrie B, Lewis C, Fahey T, Smith SM. Managing patients with
multimorbidity in primary care. BMJ. 2015;350:h176. doi: 10.1136/bmj.h176.
8. Montori VM, Fernández-Balsells M. Glycemic control in type 2 diabetes: time for an
evidence-based about-face? Ann Intern Med. 2009;150(11):803-8.
9. May C, Montori VM, Mair FS. We need minimally disruptive medicine. BMJ.
2009;339:b2803. doi: 10.1136/bmj.b2803.
10. Tamhane S, Rodriguez-Gutierrez R, Hargraves I, Montori VM. Shared decision-making in
diabetes care. Curr Diab Rep. 2015;15(12):112. doi: 10.1007/s11892-015-0688-0.
A B O U T T H E A U T H O R
V I C TO R M . M O N TO R I , M D , M S C
Dr Montori is affiliated with the Knowledge and Evaluation Unit, Division of Endocrinology, Diabetes, Metabolism, and Nutrition; Department of Medicine, Mayo Clinic.
Address for correspondenceVictor M. Montori, MD, MSc, Knowledge and Evaluation Research Unit, Division of Endocrinology, DiabetesMetabolism and NutritionMayo Clinic200 1st Street SW, RochesterMN 55905
N A T I O N A L Q U A L I T Y F O R U M
lead national collaboration to improve health and healthcare quality through measurement. One way that NQF fulfills this mission is to endorse performance measures. Measures en-dorsed by NQF undergo a stringent evaluation by multistake-holder committees comprised of clinicians and other experts from hospitals and other healthcare providers, employers, health plans, public agencies, community coalitions, and patients—many of whom use measures on a daily basis to ensure better care. NQF-endorsed measures undergo routine reevaluation to ensure that they are still the best available measures and reflect current scientific knowledge. Because NQF’s endorsement process is rigorous, fully transparent, and powered by multistakeholder consensus, performance measures endorsed by NQF are considered to be those most likely to facilitate achievement of high quality and efficient healthcare for patients and their families.
NQF’S PORTFOLIO OF DIABETES MEASURESCurrently, NQF has a portfolio of 35 endorsed diabetes mea-sures. Many of these measures are among NQF’s longest standing measures, several of which have been endorsed since 2002. Many measures in the portfolio are currently used in various public and/or private accountability and quality improvement programs, including public reporting and pay-for-performance programs administered by CMS.
In an effort to illuminate a path forward for diabetes qual-ity measurement, in 2008, a panel of diabetes and measure-ment experts, convened by NQF, developed a measurement framework for diabetes2 (see FIGURE). This framework reflects the full spectrum of the disease by incorporating 4 trajectories specific to diabetes type and related outcomes and comor-bidities. Key measurement opportunities, portrayed in the framework, include prevention through behavioral and life-style interventions, as well as glycemic, lipid, and blood pres-sure management (phase 1); ongoing management that also incorporates the prevention, screening, diagnosis, and early treatment of complications (phase 2); and management and treatment of complications (phase 3). This framework can be used both to map and assess existing performance measures for diabetes as well as to highlight gaps in measurement. NQF’s Endocrine Standing Committee, which is responsible for evaluating many of the measures in the diabetes portfo-lio, reevaluated this framework in 2014 but made no changes.
NQF’s portfolio of diabetes measures includes at least a few measures for each of the 3 phases in the measurement framework. These include measures focusing on:
• Weight and body mass index (BMI) • Eye care • Foot care
Getting to Better Care and Outcomes for Diabetes Through Measurement(CONTINUED FROM COVER)
A B O U T T H E A U T H O R
HELEN BURSTIN, MD, MPH
Dr Burstin is chief scientific officer, National Quality Forum.
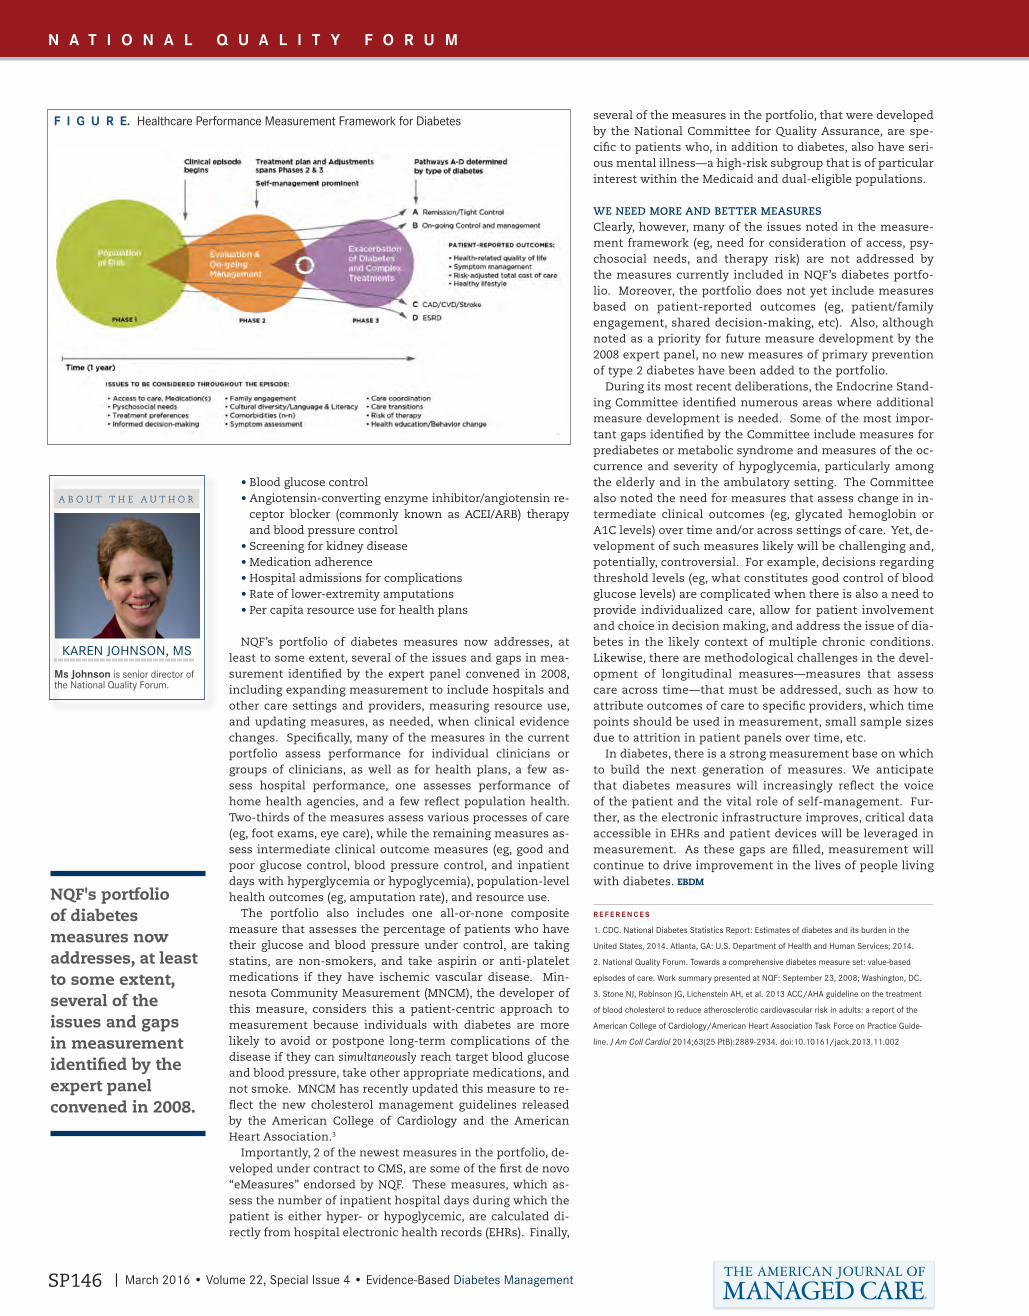
SP146 | March 2016 • Volume 22, Special Issue 4 • Evidence-Based Diabetes Management
NQF's portfolio of diabetes measures now addresses, at least to some extent, several of the issues and gaps in measurement identified by the expert panel convened in 2008.
• Blood glucose control • Angiotensin-converting enzyme inhibitor/angiotensin re-
ceptor blocker (commonly known as ACEI/ARB) therapy and blood pressure control
• Screening for kidney disease • Medication adherence • Hospital admissions for complications• Rate of lower-extremity amputations• Per capita resource use for health plans
NQF’s portfolio of diabetes measures now addresses, at least to some extent, several of the issues and gaps in mea-surement identified by the expert panel convened in 2008, including expanding measurement to include hospitals and other care settings and providers, measuring resource use, and updating measures, as needed, when clinical evidence changes. Specifically, many of the measures in the current portfolio assess performance for individual clinicians or groups of clinicians, as well as for health plans, a few as-sess hospital performance, one assesses performance of home health agencies, and a few reflect population health. Two-thirds of the measures assess various processes of care (eg, foot exams, eye care), while the remaining measures as-sess intermediate clinical outcome measures (eg, good and poor glucose control, blood pressure control, and inpatient days with hyperglycemia or hypoglycemia), population-level health outcomes (eg, amputation rate), and resource use.
The portfolio also includes one all-or-none composite measure that assesses the percentage of patients who have their glucose and blood pressure under control, are taking statins, are non-smokers, and take aspirin or anti-platelet medications if they have ischemic vascular disease. Min-nesota Community Measurement (MNCM), the developer of this measure, considers this a patient-centric approach to measurement because individuals with diabetes are more likely to avoid or postpone long-term complications of the disease if they can simultaneously reach target blood glucose and blood pressure, take other appropriate medications, and not smoke. MNCM has recently updated this measure to re-flect the new cholesterol management guidelines released by the American College of Cardiology and the American Heart Association.3
Importantly, 2 of the newest measures in the portfolio, de-veloped under contract to CMS, are some of the first de novo “eMeasures” endorsed by NQF. These measures, which as-sess the number of inpatient hospital days during which the patient is either hyper- or hypoglycemic, are calculated di-rectly from hospital electronic health records (EHRs). Finally,
several of the measures in the portfolio, that were developed by the National Committee for Quality Assurance, are spe-cific to patients who, in addition to diabetes, also have seri-ous mental illness—a high-risk subgroup that is of particular interest within the Medicaid and dual-eligible populations.
WE NEED MORE AND BETTER MEASURESClearly, however, many of the issues noted in the measure-ment framework (eg, need for consideration of access, psy-chosocial needs, and therapy risk) are not addressed by the measures currently included in NQF’s diabetes portfo-lio. Moreover, the portfolio does not yet include measures based on patient-reported outcomes (eg, patient/family engagement, shared decision-making, etc). Also, although noted as a priority for future measure development by the 2008 expert panel, no new measures of primary prevention of type 2 diabetes have been added to the portfolio.
During its most recent deliberations, the Endocrine Stand-ing Committee identified numerous areas where additional measure development is needed. Some of the most impor-tant gaps identified by the Committee include measures for prediabetes or metabolic syndrome and measures of the oc-currence and severity of hypoglycemia, particularly among the elderly and in the ambulatory setting. The Committee also noted the need for measures that assess change in in-termediate clinical outcomes (eg, glycated hemoglobin or A1C levels) over time and/or across settings of care. Yet, de-velopment of such measures likely will be challenging and, potentially, controversial. For example, decisions regarding threshold levels (eg, what constitutes good control of blood glucose levels) are complicated when there is also a need to provide individualized care, allow for patient involvement and choice in decision making, and address the issue of dia-betes in the likely context of multiple chronic conditions. Likewise, there are methodological challenges in the devel-opment of longitudinal measures—measures that assess care across time—that must be addressed, such as how to attribute outcomes of care to specific providers, which time points should be used in measurement, small sample sizes due to attrition in patient panels over time, etc.
In diabetes, there is a strong measurement base on which to build the next generation of measures. We anticipate that diabetes measures will increasingly reflect the voice of the patient and the vital role of self-management. Fur-ther, as the electronic infrastructure improves, critical data accessible in EHRs and patient devices will be leveraged in measurement. As these gaps are filled, measurement will continue to drive improvement in the lives of people living with diabetes. EBDM
R E F E R E N C E S
1. CDC. National Diabetes Statistics Report: Estimates of diabetes and its burden in the
United States, 2014. Atlanta, GA: U.S. Department of Health and Human Services; 2014.
2. National Quality Forum. Towards a comprehensive diabetes measure set: value-based
episodes of care. Work summary presented at NQF: September 23, 2008; Washington, DC.
3. Stone NJ, Robinson JG, Lichenstein AH, et al. 2013 ACC/AHA guideline on the treatment
of blood cholesterol to reduce atherosclerotic cardiovascular risk in adults: a report of the
American College of Cardiology/American Heart Association Task Force on Practice Guide-
line. J Am Coll Cardiol 2014;63(25 PtB):2889-2934. doi:10.10161/jack.2013.11.002
N A T I O N A L Q U A L I T Y F O R U M
F I G U R E. Healthcare Performance Measurement Framework for Diabetes
XXXXX
A B O U T T H E A U T H O R
KAREN JOHNSON, MS
Ms Johnson is senior director of the National Quality Forum.

Evidence-Based Diabetes Management • March 2016 • Volume 22, Special Issue 4 | SP147
Multiple factors can contribute
to the control of risk factors, and
these could be patient-related
and/or provider-related.
A B O U T T H E A U T H O R
JOANNA MITRI, MD, MS
Dr Mitri is a staff physician with Joslin Diabetes Center.
Address for correspondenceJoanna Mitri, MD1 Joslin Place #239Boston, MA, 02215
J O S L I N D I A B E T E S C E N T E R
diabetes has been a focus of performance measurement for many years, and it stands as one of the first conditions for which disease-specific indicators based on evidence-based clinical guidelines have been used to evaluate the quality of care and preventive services.2-4
Standardized performance measures are needed in order to assess the quality of care in the United States. CMS, the National Committee on Quality Assurance (NCQA), and the American Diabetes Association (ADA) led the first national ef-fort to develop a set of performance measured for diabetes.2 The Diabetes Quality Improvement Program measures were first adopted by NCQA to use in the Healthcare Effectiveness Data and Information Set (HEDIS) and subsequently widely adopted for performance assessment in commercial, Medi-care, and Medicaid health plans.
CURRENT STATUS OF DIABETES PERFORMANCE MEASURESProcess MeasuresThese measures are the specific steps in a process that lead—either positively or negatively—to a particular outcome met-ric. It is easy to identify simple processes such as periodic testing for A1C, LDL cholesterol, microalbuminuria, or retinal examination. This could be done through medical records or health claims. The proportion of patients receiving these pro-cesses of care has recently increased.5 However this does not necessarily translate into improvements in key intermediate outcomes such as A1C, BP, and LDL-C.6,7 This discrepancy be-tween processes and outcomes raises concern about the value of some process quality indicators and the need to develop alternative process indicators more closely linked to interme-diate outcomes of care.
INTERMEDIATE OUTCOME MEASURESIntermediate outcome measures are strongly linked to health outcomes. Adequate control of intermediate outcomes such as A1C, BP, and LDL levels have been included in most diabetes quality measurement sets. It has been shown that control of risk factors is related to improved outcomes, although this is dependent on patient factors as well as the strategies used to modify these factors.8
Limitations of Diabetes Quality measuresSimple reliance on measuring and reporting processes is un-likely to have substantial impact on patient outcomes, and improvement in process measures can no longer be taken as evidence that quality of care has improved.9 However, process measures can be helpful in quality improvement efforts since they often change first and can indicate some changes in healthcare delivery. Performance measures based on control of risk factors such as A1C, BP, and LDL cholesterol are appeal-ing because these risk factors predict clinical outcomes. How-ever, this approach is complex and holds challenges. Multiple factors can contribute to the control of risk factors, and these could be patient-related (eg, patient behavior, demographics, and comorbidities) and/or provider-related (eg, inadequate escalation of therapy and clinical inertia). Most performance measures have set dichotomized thresholds expressed as a percentage at goal. Although thresholds are simply reported and collected, they obscure the need to individualize goals based on comorbidities and other patient characteristics.
NEW OPPORTUNITIES FOR QUALITY MEASUREMENT IN DIABETESIndividualized glycemic control and multifactorial risk reduc-tion are the cornerstones of high-quality diabetes care. Many trials failed to show increased cardiovascular benefit with ag-gressive glucose control.10-12 Since then, there has been em-phasis on individualized glycemic targets based on age, co-existing conditions, time since the diagnosis of diabetes, and
socioeconomic profile.13 However, the nature of the individu-alization makes it a challenge to evaluate the achievement of goals of care in the entire population.
During a consensus-development conference convened by the ADA to discuss the future of performance measurement, experts identified several new opportunities for quality mea-surement in diabetes.14 These include:
1. Clinical action measures 2. Weighted quality measures3. Personalized risk-based quality measures4. Measures of over treatment5. Quality measures for primary prevention of diabetes6. Incorporating measures of adherence into performance
measures7. Incorporating costs into quality measures8. Using performance measurement to reduce, not worsen,
health disparities
Improved quality measures will need to be electronically extractable, result in better quality of care, and be included in EHR so they can be queried to identify individuals with gaps in care. Since many of the items described by the ADA con-sensus panel have yet to present in most EHRs, attempts to individualize goals for patient groups will require a more fo-cused approach.
JOSLIN CLINICAL ANALYTIC TOOL At present, the quality of diabetes care is usually assessed by the NCQA and CMS. However, these measures are crude, not adjusted for patient mix, do not reflect data from recent clini-cal trials to individualize goals, and do little to inform clini-cians about specific gaps in care or about which interventions would most benefit their patients.
The Joslin Clinical Analytic Tool (JCAT) was developed to ad-dress this deficiency. We currently use JCAT to measure clini-cal quality of care in our national affiliate network, includ-ing primary care practices. It captures data from the EHR for analysis and grades the quality of care of individual providers and entire clinics, and across health systems.
By identifying prescribing patterns in relation to outcomes, JCAT identifies those patients who have more advanced dis-ease and whose disease is difficult to treat. JCAT results will identify opportunities for improvement that can better direct continuous quality improvement projects.
Description of JCATThe JCAT engine requires readily available data on biomark-ers, medications, dates of service, and basic demographics to generate quality scores at the practice and individual-provid-er level, along with a detailed report covering outcomes in 5 areas, breaking each of these areas into 2 to 5 subgroups. The report discusses each of the specific diabetes care gaps identi-fied and presents comparisons to other providers, practices, and national benchmark data.
The areas and subgroups include:• glycemic control: 5 subgroups• BP: 4 subgroups• lipids, focusing on LDL cholesterol: 2 subgroups• renal function: 2 subgroups• smoking: 2 subgroups
By stratifying the population of individuals with diabetes into these treatment groups, subpopulations that are most appropriate for targeted quality improvement efforts are identified. The utility of this grouping can be seen by using A1C and BP. JCAT separates people with early (using 0-2 anti-hyperglycemic medications), intermediate, and more com-
Measuring the Quality of Diabetes Care(CONTINUED FROM COVER)

SP148 | March 2016 • Volume 22, Special Issue 4 • Evidence-Based Diabetes Management
It is clear that the current dichotomized HEDIS and NCQA metrics fail to account for the need to individualize care as recommended by the ADA, the AADE, and others.
plex, and typically longer-duration, diabetes (involving basal and bolus insulin treatment). Although JCAT identifies gaps in all 3 groups, targeting the first 2 groups may be more ef-fective and easier to improve than the more advanced group. The goals have been set based on landmark diabetes studies. It has been shown that a lower A1C is associated with reduc-tion in microvascular complications and may reduce long-term cardiovascular disease rates.15-17 It has been suggested that targeting a lower A1C is beneficial during the early period after diagnosis of diabetes, while a higher goal is advised12,17 later in disease, the surrogate of disease stage being medical complexity and hence escalation in anti-diabetes therapy.
Similarly, for BP control, JCAT groups patients based on the number of anti-hypertensive medications they are taking. Those on 3 or more anti-hypertensive medications have less benefit and increased risk side effects, from treatment inten-sification.
The JCAT report also comprises a table of current practice medication usage including combinations and most used therapies; this is also compared to other practices and na-tional data. If requested, this data can be informed by relevant pharmacy formularies.
Rationale for JCATSeveral recent studies have examined the relationship be-tween HEDIS and NCQA scores and what happens to scores when patient mix or regimen complexity is taken into con-sideration. The JCAT tool, by adjusting for disease severity and other factors, more accurately assesses the effectiveness of treatment being delivered to a population with a variety of patient characteristics.
JCAT can be used to complement current quality metrics by identifying addressable gaps in care. By using clinical and prescription data from patient charts and EHRs, patients are stratified into appropriate treatment groups. Because of this stratified approach, the tool is applicable to any care setting and any patient mix, and will accurately pinpoint subpopula-tions in need of targeted quality intervention.
CONCLUSIONTracking quality of care indicators nationwide is essential, not only to simply assess physician performance, but to plan and implement successful quality improvement measures. It is clear that the current dichotomized HEDIS and NCQA metrics fail to account for the need to individualize care as recom-mended by ADA, the American Association of Clinical Endo-crinologists, and others. A key barrier to optimal quality met-rics is access to data, and for now, many providers are limited to what is captured in EHRs. These can and will be augmented by claims data that could flow more quickly to providers to identify care gaps and opportunities for improvement.
The evidence base in diabetes is rapidly evolving. Debates over how to optimize performance indicators continue. More nuanced measures and innovative quality indicators that are evidence-based and patient-centered will continue to evolve. Patients, providers, and systems must all play a role in estab-lishing diabetes outcome measures. EBDM
R E F E R E N C E S
1. Ali MK, Bullard KM, Saaddine JB, Cowie CC, Imperatore G, Gregg EW. Achievement of goals
in U.S. diabetes care, 1999-2010. N Engl J Med. 2013;368(17):1613-1624. doi: 10.1056/
NEJMsa1213829.
2. Fleming BB, Greenfield S, Engelgau MM, Pogach LM, Clauser SB, Parrott MA. The Diabetes
Quality Improvement Project: moving science into health policy to gain an edge on the diabe-
tes epidemic. Diabetes Care. 2001;24(10):1815-1820.
3. Pogach L, Aron DC. Sudden acceleration of diabetes quality measures. JAMA.
2011;305(7):709-710. doi: 10.1001/jama.2011.153.
4. Ahmann AJ. Guidelines and performance measures for diabetes. Am J Manag Care.
2007;13(suppl 2):S41-S46.
5. Saaddine JB, Cadwell B, Gregg EW, et al. Improvements in diabetes processes of care and
intermediate outcomes: United States, 1988-2002. Ann Intern Med. 2006;144(7):465-474.
6. Mangione CM, Gerzoff RB, Williamson DF, et al; TRIAD Study Group. The association be-
tween quality of care and the intensity of diabetes disease management programs. Ann Intern
Med. 2006;145(2):107-116.
7. Ackermann RT, Thompson TJ, Selby JV, et al; TRIAD Study Group. Is the number of docu-
mented diabetes process-of-care indicators associated with cardiometabolic risk factor levels,
patient satisfaction, or self-rated quality of diabetes care? The Translating Research into
Action for Diabetes (TRIAD) study. Diabetes Care. 2006;29(9):2108-2113.
8. Krumholz HM, Lee TH. Redefining quality—implications of recent clinical trials. N Engl J Med.
2008;358(24):2537-2539. doi: 10.1056/NEJMp0803740.
9. Selby JV, Swain BE, Gerzoff RB, et al; TRIAD Study Group. Understanding the gap between
good processes of diabetes care and poor intermediate outcomes: Translating Research into
Action for Diabetes (TRIAD). Med Care. 2007;45(12):1144-1153.
10. Duckworth W, Abraira C, Moritz T, et al; VADT Investigators. Glucose control and vascular
complications in veterans with type 2 diabetes. N Engl J Med. 2009;360(2):129-139. doi:
10.1056/NEJMoa0808431.
11. Patel A, MacMahon S, Chalmers J, et al; ADVANCE Collaborative Group. Intensive blood
glucose control and vascular outcomes in patients with type 2 diabetes. N Engl J Med.
2008;358(24):2560-2572. doi: 10.1056/NEJMoa0802987.
12. Gerstein HC, Miller ME, Byington RP, et al; Action to Control Cardiovascular Risk in
Diabetes Study Group. Effects of intensive glucose lowering in type 2 diabetes. N Engl J Med.
2008;358(24):2545-2559. doi: 10.1056/NEJMoa0802743.
13. Inzucchi SE, Bergenstal RM, Buse JB, et al; American Diabetes Association (ADA); Euro-
pean Association for the Study of Diabetes (EASD). Management of hyperglycemia in type 2
diabetes: a patient-centered approach: position statement of the American Diabetes Associa-
tion (ADA) and the European Association for the Study of Diabetes (EASD). Diabetes Care.
2012;35(6):1364-1379. doi: 10.2337/dc12-0413.
14. O’Connor PJ, Bodkin NL, Fradkin J, et al. Diabetes performance measures: current status
and future directions. Diabetes Care. 2011;34(7):1651-1659. doi: 10.2337/dc11-0735.
15. Holman RR, Paul SK, Bethel MA, Matthews DR, Neil HA. 10-year follow-up of intensive
glucose control in type 2 diabetes. N Engl J Med. 2008;359(15):1577-1589. doi: 10.1056/
NEJMoa0806470.
16. Intensive blood-glucose control with sulphonylureas or insulin compared with conventional
treatment and risk of complications in patients with type 2 diabetes (UKPDS 33). UK Prospec-
tive Diabetes Study (UKPDS) Group. Lancet. 1998;352(9131):837-853.
17. American Diabetes Association. Glycemic targets. Diabetes Care. 2016;39(suppl 1):S39-
S46.
J O S L I N D I A B E T E S C E N T E R
A B O U T T H E A U T H O R
ROBERT A. GABBAY, MD, PHD, FACP
Dr Gabbay is the chief medical officer and senior vice president of Joslin Diabetes Center and a faculty member at Harvard Medical School.
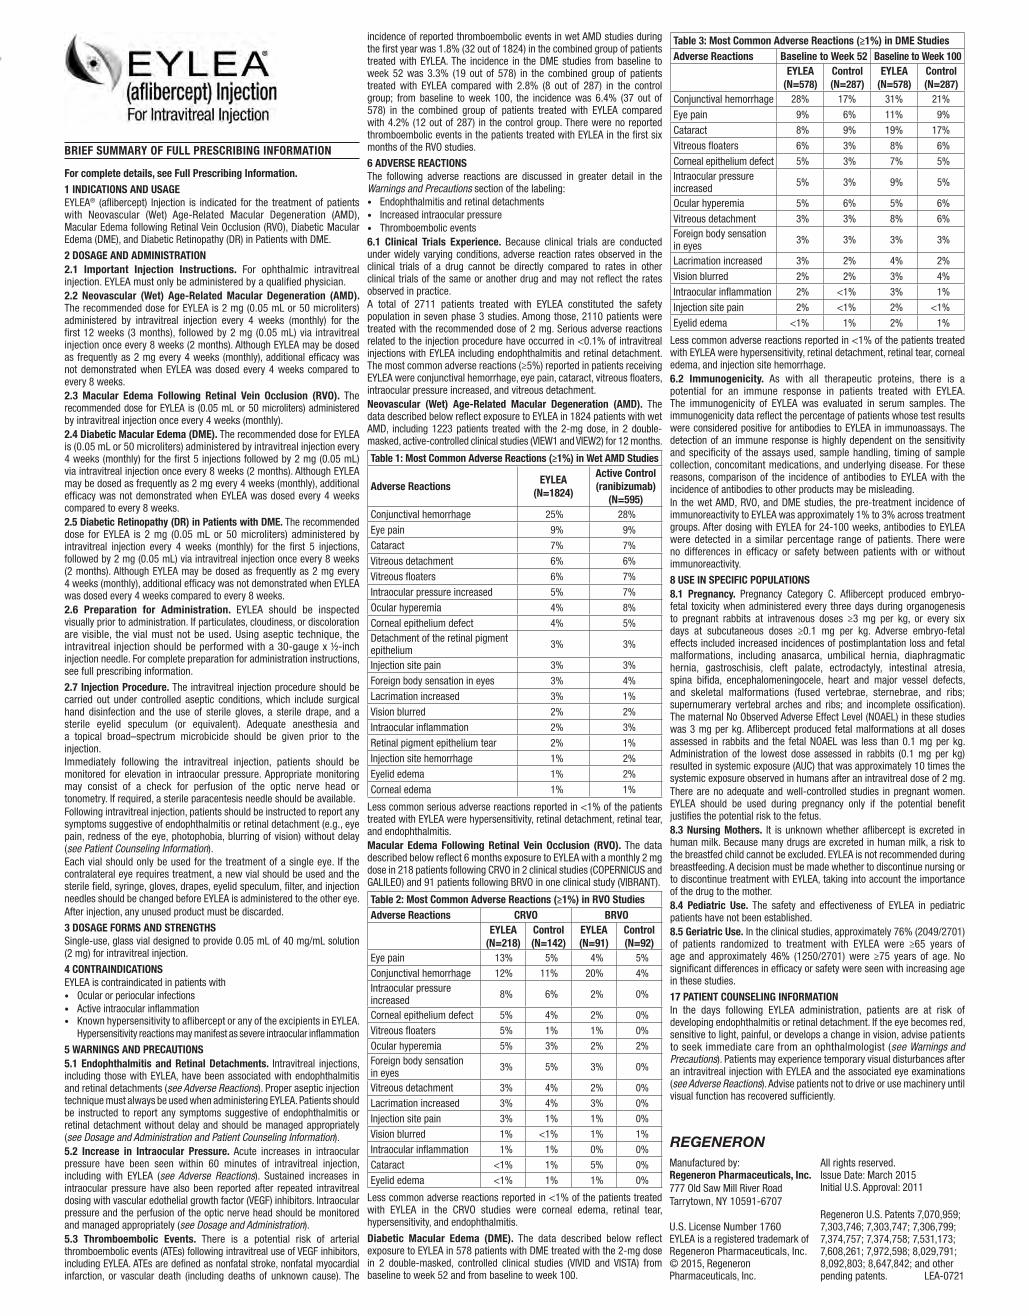
For complete details, see Full Prescribing Information.1 INDICATIONS AND USAGEEYLEA® (aflibercept) Injection is indicated for the treatment of patients with Neovascular (Wet) Age-Related Macular Degeneration (AMD), Macular Edema following Retinal Vein Occlusion (RVO), Diabetic Macular Edema (DME), and Diabetic Retinopathy (DR) in Patients with DME.
2 DOSAGE AND ADMINISTRATION2.1 Important Injection Instructions. For ophthalmic intravitreal injection. EYLEA must only be administered by a qualified physician.2.2 Neovascular (Wet) Age-Related Macular Degeneration (AMD). The recommended dose for EYLEA is 2 mg (0.05 mL or 50 microliters) administered by intravitreal injection every 4 weeks (monthly) for the first 12 weeks (3 months), followed by 2 mg (0.05 mL) via intravitreal injection once every 8 weeks (2 months). Although EYLEA may be dosed as frequently as 2 mg every 4 weeks (monthly), additional efficacy was not demonstrated when EYLEA was dosed every 4 weeks compared to every 8 weeks.2.3 Macular Edema Following Retinal Vein Occlusion (RVO). The recommended dose for EYLEA is (0.05 mL or 50 microliters) administered by intravitreal injection once every 4 weeks (monthly).2.4 Diabetic Macular Edema (DME). The recommended dose for EYLEA is (0.05 mL or 50 microliters) administered by intravitreal injection every 4 weeks (monthly) for the first 5 injections followed by 2 mg (0.05 mL) via intravitreal injection once every 8 weeks (2 months). Although EYLEA may be dosed as frequently as 2 mg every 4 weeks (monthly), additional efficacy was not demonstrated when EYLEA was dosed every 4 weeks compared to every 8 weeks.2.5 Diabetic Retinopathy (DR) in Patients with DME. The recommended dose for EYLEA is 2 mg (0.05 mL or 50 microliters) administered by intravitreal injection every 4 weeks (monthly) for the first 5 injections, followed by 2 mg (0.05 mL) via intravitreal injection once every 8 weeks (2 months). Although EYLEA may be dosed as frequently as 2 mg every 4 weeks (monthly), additional efficacy was not demonstrated when EYLEA was dosed every 4 weeks compared to every 8 weeks. 2.6 Preparation for Administration. EYLEA should be inspected visually prior to administration. If particulates, cloudiness, or discoloration are visible, the vial must not be used. Using aseptic technique, the intravitreal injection should be performed with a 30-gauge x ½-inch injection needle. For complete preparation for administration instructions, see full prescribing information.
2.7 Injection Procedure. The intravitreal injection procedure should be carried out under controlled aseptic conditions, which include surgical hand disinfection and the use of sterile gloves, a sterile drape, and a sterile eyelid speculum (or equivalent). Adequate anesthesia and a topical broad–spectrum microbicide should be given prior to the injection. Immediately following the intravitreal injection, patients should be monitored for elevation in intraocular pressure. Appropriate monitoring may consist of a check for perfusion of the optic nerve head or tonometry. If required, a sterile paracentesis needle should be available. Following intravitreal injection, patients should be instructed to report any symptoms suggestive of endophthalmitis or retinal detachment (e.g., eye pain, redness of the eye, photophobia, blurring of vision) without delay (see Patient Counseling Information).Each vial should only be used for the treatment of a single eye. If the contralateral eye requires treatment, a new vial should be used and the sterile field, syringe, gloves, drapes, eyelid speculum, filter, and injection needles should be changed before EYLEA is administered to the other eye.After injection, any unused product must be discarded.
3 DOSAGE FORMS AND STRENGTHSSingle-use, glass vial designed to provide 0.05 mL of 40 mg/mL solution (2 mg) for intravitreal injection.
4 CONTRAINDICATIONSEYLEA is contraindicated in patients with • Ocular or periocular infections• Active intraocular inflammation• Known hypersensitivity to aflibercept or any of the excipients in EYLEA.
Hypersensitivity reactions may manifest as severe intraocular inflammation
5 WARNINGS AND PRECAUTIONS5.1 Endophthalmitis and Retinal Detachments. Intravitreal injections, including those with EYLEA, have been associated with endophthalmitis and retinal detachments (see Adverse Reactions). Proper aseptic injection technique must always be used when administering EYLEA. Patients should be instructed to report any symptoms suggestive of endophthalmitis or retinal detachment without delay and should be managed appropriately (see Dosage and Administration and Patient Counseling Information).5.2 Increase in Intraocular Pressure. Acute increases in intraocular pressure have been seen within 60 minutes of intravitreal injection, including with EYLEA (see Adverse Reactions). Sustained increases in intraocular pressure have also been reported after repeated intravitreal dosing with vascular edothelial growth factor (VEGF) inhibitors. Intraocular pressure and the perfusion of the optic nerve head should be monitored and managed appropriately (see Dosage and Administration).5.3 Thromboembolic Events. There is a potential risk of arterial thromboembolic events (ATEs) following intravitreal use of VEGF inhibitors, including EYLEA. ATEs are defined as nonfatal stroke, nonfatal myocardial infarction, or vascular death (including deaths of unknown cause). The
incidence of reported thromboembolic events in wet AMD studies during the first year was 1.8% (32 out of 1824) in the combined group of patients treated with EYLEA. The incidence in the DME studies from baseline to week 52 was 3.3% (19 out of 578) in the combined group of patients treated with EYLEA compared with 2.8% (8 out of 287) in the control group; from baseline to week 100, the incidence was 6.4% (37 out of 578) in the combined group of patients treated with EYLEA compared with 4.2% (12 out of 287) in the control group. There were no reported thromboembolic events in the patients treated with EYLEA in the first six months of the RVO studies.
6 ADVERSE REACTIONSThe following adverse reactions are discussed in greater detail in the Warnings and Precautions section of the labeling:• Endophthalmitis and retinal detachments• Increased intraocular pressure• Thromboembolic events6.1 Clinical Trials Experience. Because clinical trials are conducted under widely varying conditions, adverse reaction rates observed in the clinical trials of a drug cannot be directly compared to rates in other clinical trials of the same or another drug and may not reflect the rates observed in practice.A total of 2711 patients treated with EYLEA constituted the safety population in seven phase 3 studies. Among those, 2110 patients were treated with the recommended dose of 2 mg. Serious adverse reactions related to the injection procedure have occurred in <0.1% of intravitreal injections with EYLEA including endophthalmitis and retinal detachment. The most common adverse reactions (≥5%) reported in patients receiving EYLEA were conjunctival hemorrhage, eye pain, cataract, vitreous floaters, intraocular pressure increased, and vitreous detachment.Neovascular (Wet) Age-Related Macular Degeneration (AMD). The data described below reflect exposure to EYLEA in 1824 patients with wet AMD, including 1223 patients treated with the 2-mg dose, in 2 double-masked, active-controlled clinical studies (VIEW1 and VIEW2) for 12 months.
Table 1: Most Common Adverse Reactions (≥1%) in Wet AMD Studies
Adverse ReactionsEYLEA
(N=1824)
Active Control (ranibizumab)
(N=595)Conjunctival hemorrhage 25% 28%
Eye pain 9% 9%
Cataract 7% 7%
Vitreous detachment 6% 6%
Vitreous floaters 6% 7%
Intraocular pressure increased 5% 7%
Ocular hyperemia 4% 8%
Corneal epithelium defect 4% 5%Detachment of the retinal pigment epithelium
3% 3%
Injection site pain 3% 3%
Foreign body sensation in eyes 3% 4%
Lacrimation increased 3% 1%
Vision blurred 2% 2%
Intraocular inflammation 2% 3%
Retinal pigment epithelium tear 2% 1%
Injection site hemorrhage 1% 2%
Eyelid edema 1% 2%
Corneal edema 1% 1%
Less common serious adverse reactions reported in <1% of the patients treated with EYLEA were hypersensitivity, retinal detachment, retinal tear, and endophthalmitis.Macular Edema Following Retinal Vein Occlusion (RVO). The data described below reflect 6 months exposure to EYLEA with a monthly 2 mg dose in 218 patients following CRVO in 2 clinical studies (COPERNICUS and GALILEO) and 91 patients following BRVO in one clinical study (VIBRANT).
Table 2: Most Common Adverse Reactions (≥1%) in RVO StudiesAdverse Reactions CRVO BRVO
EYLEA (N=218)
Control (N=142)
EYLEA (N=91)
Control (N=92)
Eye pain 13% 5% 4% 5%
Conjunctival hemorrhage 12% 11% 20% 4%Intraocular pressure increased
8% 6% 2% 0%
Corneal epithelium defect 5% 4% 2% 0%
Vitreous floaters 5% 1% 1% 0%
Ocular hyperemia 5% 3% 2% 2%Foreign body sensation in eyes
3% 5% 3% 0%
Vitreous detachment 3% 4% 2% 0%
Lacrimation increased 3% 4% 3% 0%
Injection site pain 3% 1% 1% 0%
Vision blurred 1% <1% 1% 1%
Intraocular inflammation 1% 1% 0% 0%
Cataract <1% 1% 5% 0%
Eyelid edema <1% 1% 1% 0%
Less common adverse reactions reported in <1% of the patients treated with EYLEA in the CRVO studies were corneal edema, retinal tear, hypersensitivity, and endophthalmitis.
Diabetic Macular Edema (DME). The data described below reflect exposure to EYLEA in 578 patients with DME treated with the 2-mg dose in 2 double-masked, controlled clinical studies (VIVID and VISTA) from baseline to week 52 and from baseline to week 100.
Table 3: Most Common Adverse Reactions (≥1%) in DME StudiesAdverse Reactions Baseline to Week 52 Baseline to Week 100
EYLEA (N=578)
Control (N=287)
EYLEA (N=578)
Control (N=287)
Conjunctival hemorrhage 28% 17% 31% 21%
Eye pain 9% 6% 11% 9%
Cataract 8% 9% 19% 17%
Vitreous floaters 6% 3% 8% 6%
Corneal epithelium defect 5% 3% 7% 5%Intraocular pressure increased
5% 3% 9% 5%
Ocular hyperemia 5% 6% 5% 6%
Vitreous detachment 3% 3% 8% 6%Foreign body sensation in eyes
3% 3% 3% 3%
Lacrimation increased 3% 2% 4% 2%
Vision blurred 2% 2% 3% 4%
Intraocular inflammation 2% <1% 3% 1%
Injection site pain 2% <1% 2% <1%
Eyelid edema <1% 1% 2% 1%
Less common adverse reactions reported in <1% of the patients treated with EYLEA were hypersensitivity, retinal detachment, retinal tear, corneal edema, and injection site hemorrhage.6.2 Immunogenicity. As with all therapeutic proteins, there is a potential for an immune response in patients treated with EYLEA. The immunogenicity of EYLEA was evaluated in serum samples. The immunogenicity data reflect the percentage of patients whose test results were considered positive for antibodies to EYLEA in immunoassays. The detection of an immune response is highly dependent on the sensitivity and specificity of the assays used, sample handling, timing of sample collection, concomitant medications, and underlying disease. For these reasons, comparison of the incidence of antibodies to EYLEA with the incidence of antibodies to other products may be misleading. In the wet AMD, RVO, and DME studies, the pre-treatment incidence of immunoreactivity to EYLEA was approximately 1% to 3% across treatment groups. After dosing with EYLEA for 24-100 weeks, antibodies to EYLEA were detected in a similar percentage range of patients. There were no differences in efficacy or safety between patients with or without immunoreactivity.
8 USE IN SPECIFIC POPULATIONS8.1 Pregnancy. Pregnancy Category C. Aflibercept produced embryo-fetal toxicity when administered every three days during organogenesis to pregnant rabbits at intravenous doses ≥3 mg per kg, or every six days at subcutaneous doses ≥0.1 mg per kg. Adverse embryo-fetal effects included increased incidences of postimplantation loss and fetal malformations, including anasarca, umbilical hernia, diaphragmatic hernia, gastroschisis, cleft palate, ectrodactyly, intestinal atresia, spina bifida, encephalomeningocele, heart and major vessel defects, and skeletal malformations (fused vertebrae, sternebrae, and ribs; supernumerary vertebral arches and ribs; and incomplete ossification). The maternal No Observed Adverse Effect Level (NOAEL) in these studies was 3 mg per kg. Aflibercept produced fetal malformations at all doses assessed in rabbits and the fetal NOAEL was less than 0.1 mg per kg. Administration of the lowest dose assessed in rabbits (0.1 mg per kg) resulted in systemic exposure (AUC) that was approximately 10 times the systemic exposure observed in humans after an intravitreal dose of 2 mg.There are no adequate and well-controlled studies in pregnant women. EYLEA should be used during pregnancy only if the potential benefit justifies the potential risk to the fetus. 8.3 Nursing Mothers. It is unknown whether aflibercept is excreted in human milk. Because many drugs are excreted in human milk, a risk to the breastfed child cannot be excluded. EYLEA is not recommended during breastfeeding. A decision must be made whether to discontinue nursing or to discontinue treatment with EYLEA, taking into account the importance of the drug to the mother.8.4 Pediatric Use. The safety and effectiveness of EYLEA in pediatric patients have not been established.8.5 Geriatric Use. In the clinical studies, approximately 76% (2049/2701) of patients randomized to treatment with EYLEA were ≥65 years of age and approximately 46% (1250/2701) were ≥75 years of age. No significant differences in efficacy or safety were seen with increasing age in these studies.
17 PATIENT COUNSELING INFORMATIONIn the days following EYLEA administration, patients are at risk of developing endophthalmitis or retinal detachment. If the eye becomes red, sensitive to light, painful, or develops a change in vision, advise patients to seek immediate care from an ophthalmologist (see Warnings and Precautions). Patients may experience temporary visual disturbances after an intravitreal injection with EYLEA and the associated eye examinations (see Adverse Reactions). Advise patients not to drive or use machinery until visual function has recovered sufficiently.
BRIEF SUMMARY OF FULL PRESCRIBING INFORMATION
Manufactured by: Regeneron Pharmaceuticals, Inc.777 Old Saw Mill River RoadTarrytown, NY 10591-6707
U.S. License Number 1760 EYLEA is a registered trademark of Regeneron Pharmaceuticals, Inc.© 2015, Regeneron Pharmaceuticals, Inc.
All rights reserved. Issue Date: March 2015 Initial U.S. Approval: 2011
Regeneron U.S. Patents 7,070,959; 7,303,746; 7,303,747; 7,306,799; 7,374,757; 7,374,758; 7,531,173; 7,608,261; 7,972,598; 8,029,791; 8,092,803; 8,647,842; and other pending patents. LEA-0721
REGEYL116_Amer_Jrl_Man_Care (T-10_75x13_75) JA_R1.indd 2 6/17/15 10:15 AM

Strength
EYLEA is a registered trademark of Regeneron Pharmaceuticals, Inc.
©2015, Regeneron Pharmaceuticals, Inc., All rights reserved 05/2015777 Old Saw Mill River Road, Tarrytown, NY 10591 LEA-0834
Please see brief summary of full Prescribing Information on the following page.
INDICATIONS AND IMPORTANT SAFETY INFORMATION INDICATIONS EYLEA® (aflibercept) Injection is indicated for the treatment of patients with Neovascular (Wet) Age-related Macular Degeneration (AMD), Macular Edema following Retinal Vein Occlusion (RVO), Diabetic Macular Edema (DME), and Diabetic Retinopathy (DR) in Patients with DME.
CONTRAINDICATIONS EYLEA® (aflibercept) Injection is contraindicated in patients with ocular or periocular infections, active intraocular inflammation, or known hypersensitivity to aflibercept or to any of the excipients in EYLEA.
WARNINGS AND PRECAUTIONS Intravitreal injections, including those with EYLEA, have been associated with endophthalmitis and retinal detachments. Proper aseptic injection technique must always be used when administering EYLEA. Patients should be instructed to report any symptoms suggestive of endophthalmitis or retinal detachment without delay and should be managed appropriately. Intraocular inflammation has been reported with the use of EYLEA. Acute increases in intraocular pressure have been seen within 60 minutes of intravitreal injection, including with EYLEA. Sustained increases in intraocular pressure have also been reported after repeated intravitreal dosing with VEGF inhibitors. Intraocular pressure and the perfusion of the optic nerve head should be monitored and managed appropriately.
There is a potential risk of arterial thromboembolic events (ATEs) following intravitreal use of VEGF inhibitors, including EYLEA. ATEs are defined as nonfatal stroke, nonfatal myocardial infarction, or vascular death (including deaths of unknown cause). The incidence of reported thromboembolic events in wet AMD studies during the first year was 1.8% (32 out of 1824) in the combined group of patients treated with EYLEA. The incidence in the DME studies from baseline to week 52 was 3.3% (19 out of 578) in the combined group of patients treated with EYLEA compared with 2.8% (8 out of 287) in the control group; from baseline to week 100, the incidence was 6.4% (37 out of 578) in the combined group of patients treated with EYLEA compared with 4.2% (12 out of 287) in the control group. There were no reported thromboembolic events in the patients treated with EYLEA in the first six months of the RVO studies.
ADVERSE REACTIONS Serious adverse reactions related to the injection procedure have occurred in <0.1% of intravitreal injections with EYLEA including endophthalmitis and retinal detachment. The most common adverse reactions (≥5%) reported in patients receiving EYLEA were conjunctival hemorrhage, eye pain, cataract, vitreous floaters, intraocular pressure increased, and vitreous detachment.
Choose EYLEA® (aflibercept) Injection from the start
Learn about EYLEA at EYLEA.us/op
As demonstrated in phase 3 clinical trials in patients with Wet AMD, Macular Edema following RVO, DME, and DR in patients with DME
Discover
in efficacy
REGEYL116_Amer_Jrl_Man_Care (T-10_75x13_75) JA_R1.indd 1 6/17/15 10:15 AM