evidence from california county departments of public health how effective are public health...
TRANSCRIPT

How Effective are Public Health Departments at Improving Health Status and Preventing Mortality?
Evidence from California County Departments of Public Health
Timothy T. Brown, PhDSchool of Public Health
University of California, Berkeley
10th Annual Public Health Finance RoundtableNovember 16, 2014

Funding
Robert Wood Johnson Foundation
Public Health Services and System Research
ID Number 67617

Roadmap
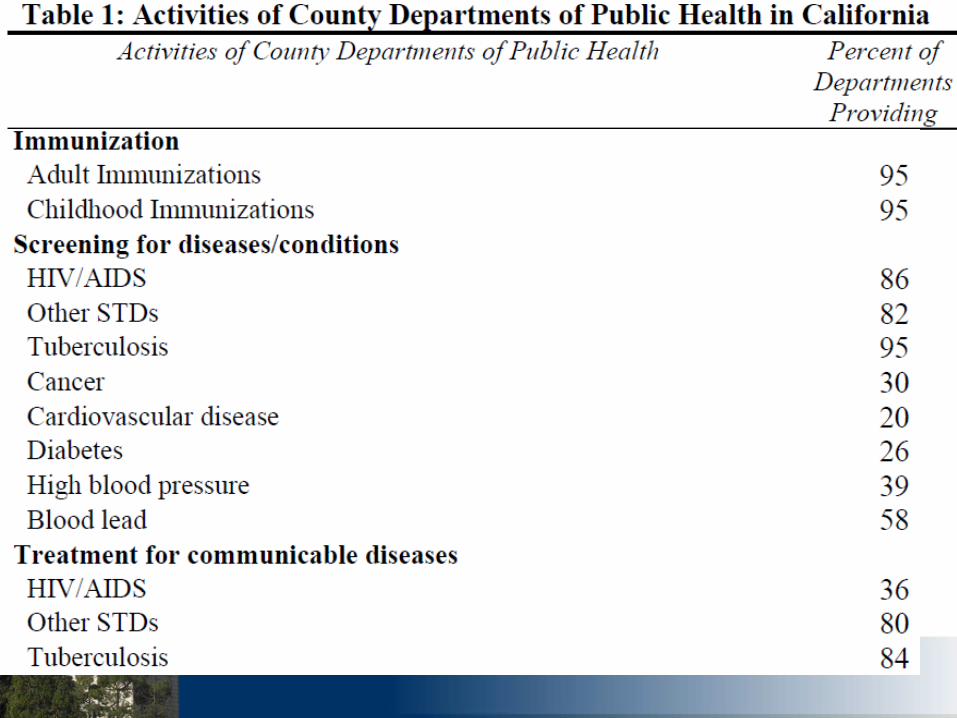
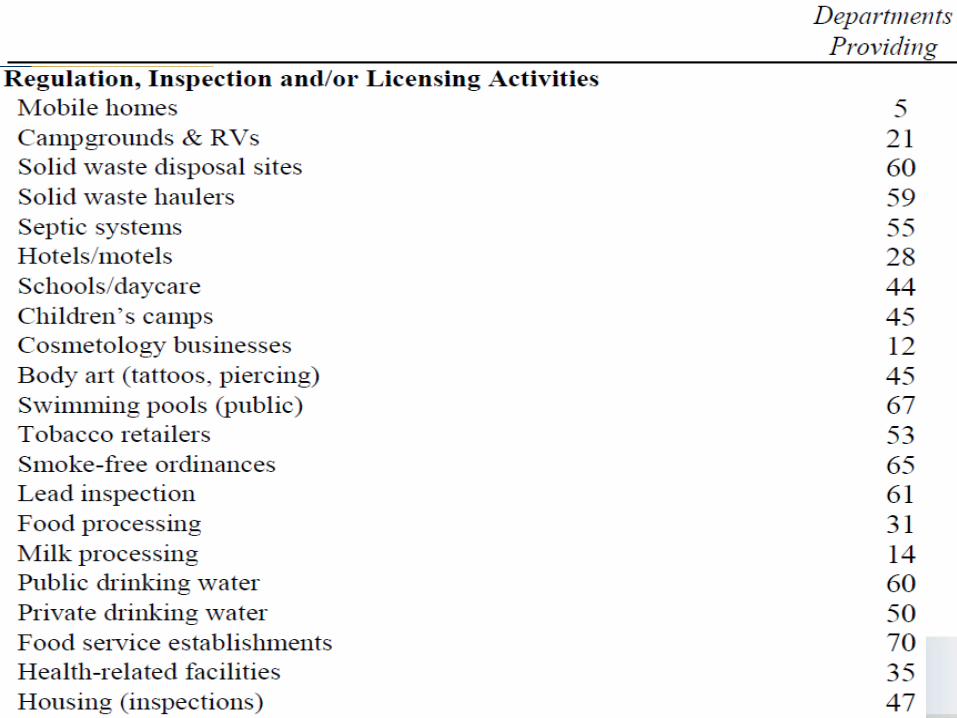
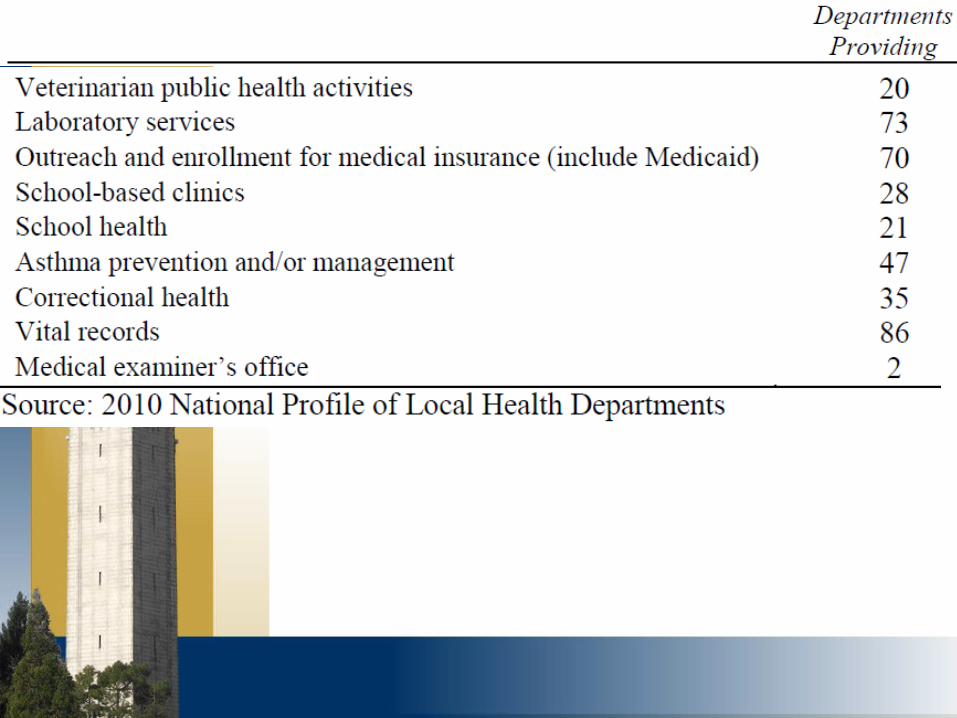
What do Departments of Public Health do? Prevention takes time How do we figure this out? Results Limitations


Prevention Takes Time
Prevention will usually affect health status before mortality with very short or no lag
It generally takes at least a decade for changes in health status to fully impact mortality rates
Models need to incorporate lag times to account for the overall impact of public health spending on mortality


Prevention Takes Time

How do we figure this out?
Short-term and long-term relationships
Lags are likely, possibly extended lags
Requires panel data

Koyck Distributed Lag Model
Flexible lag structure – based on fit to data Instrumental variables to obtain causal
estimates (correct reverse causation, measurement error, omitted variable bias).

Koyck Distributed Lag Model
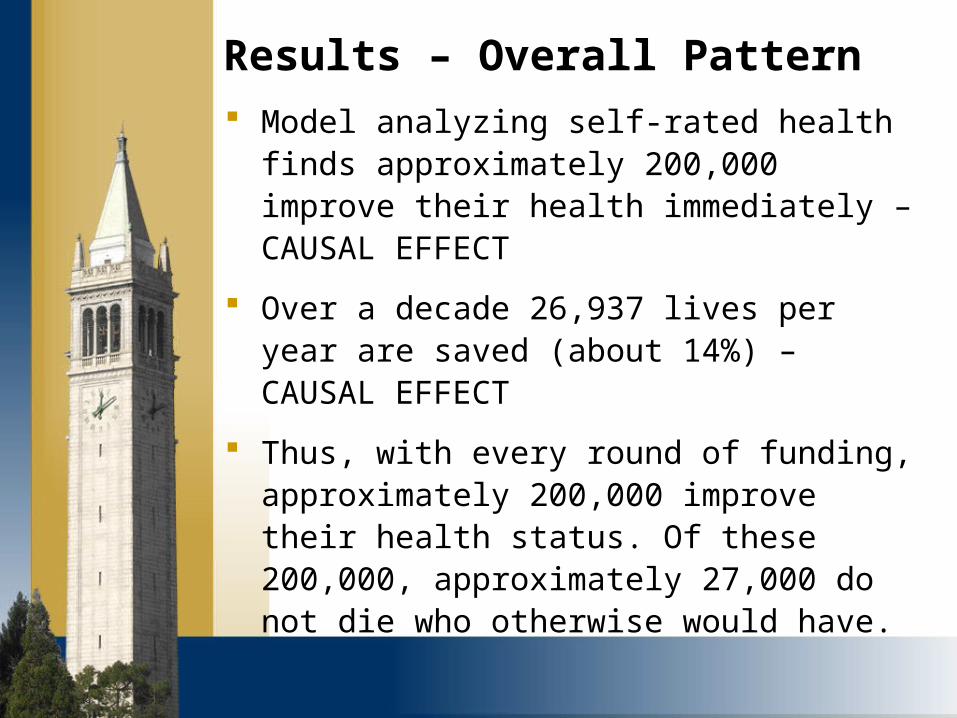
Results – Overall Pattern Model analyzing self-rated health finds
approximately 200,000 improve their health immediately – CAUSAL EFFECT
Over a decade 26,937 lives per year are saved (about 14%) – CAUSAL EFFECT
Thus, with every round of funding, approximately 200,000 improve their health status. Of these 200,000, approximately 27,000 do not die who otherwise would have.

Results – Overall Pattern Average long-run impact
9.1 lives saved per 100,000 for every $10 per capita invested.
Cost per life saved: $109,514
(limited societal perspective of public health agencies – does not include costs to individuals using programs – e.g., cost of any lifestyle changes)
26,937 lives per year

Discussion - ComparisonsCost per life saved: $109,514 Flu-vaccine for adults over age 50
$35,000 per life saved
Mammography
$100,000 per life saved
Higher nurse-to-patient ratio
$136,000 to $449,000 per life saved
Mandated mental health insurance
$1.3 million per life saved

Discussion – Overall Pattern
Results can be expressed differently
- Can value statistical lives ($7.9 million – EPA)
- Can include the value of change in health status
from other research
- Using the above information and adding additional information, results can be expressed in cost- benefit terms or “societal ROI” terms
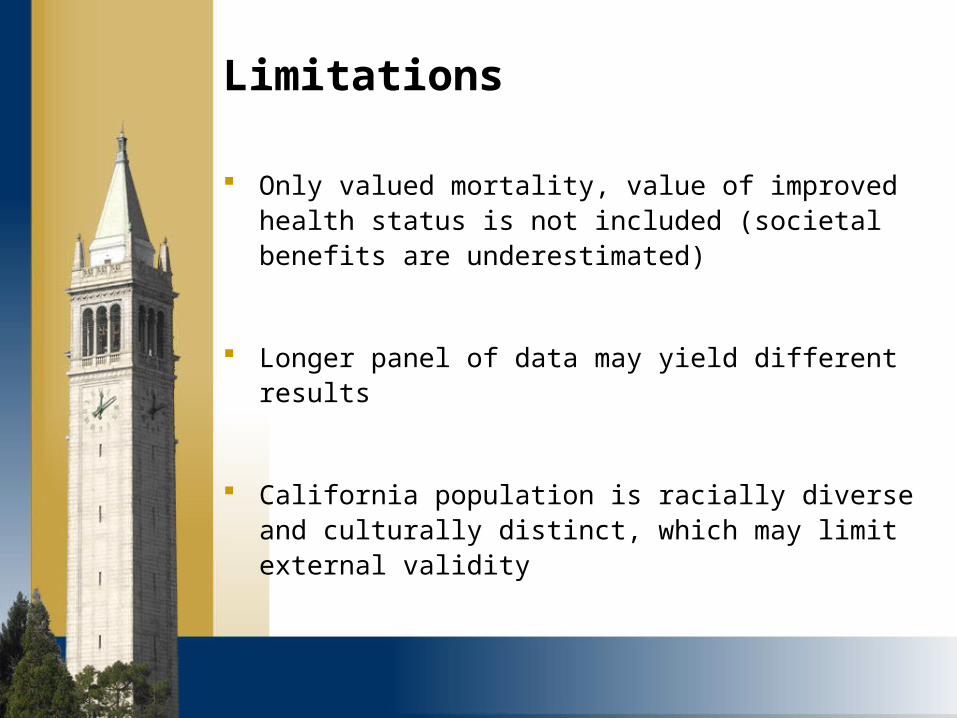
Limitations
Only valued mortality, value of improved health status is not included (societal benefits are underestimated)
Longer panel of data may yield different results
California population is racially diverse and culturally distinct, which may limit external validity

Publications
Brown, TT. (2014). How Effective are Health Departments at Preventing Mortality? Economics and Human Biology 13, 34-45. (Released online in 2013). PHSR Article of the Year
Brown TT, Martinez-Gutierrez MS, Navab B. (2014). The Impact of Changes in County Public Health Expenditures on General Health in the Population. Health Economics, Policy and Law 9, 251-269.

Thank You!

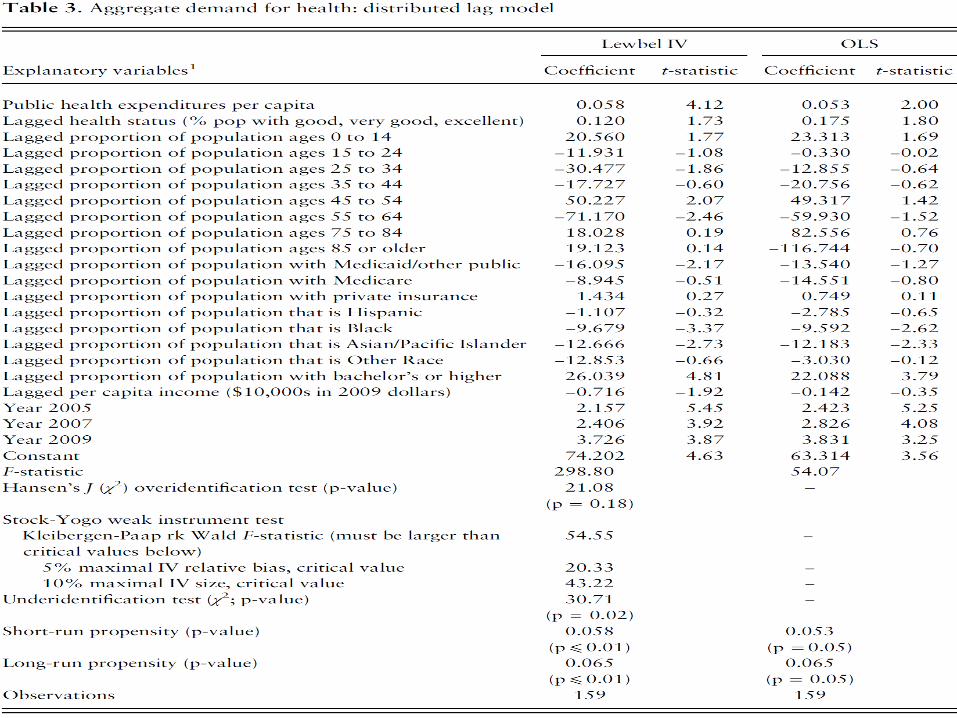
Econometric Estimation Generalized method of moments Unit root test Clustered standard errors (by county) Lewbel instrumental variables
Weak instrument testUnderidentification testOveridentification test


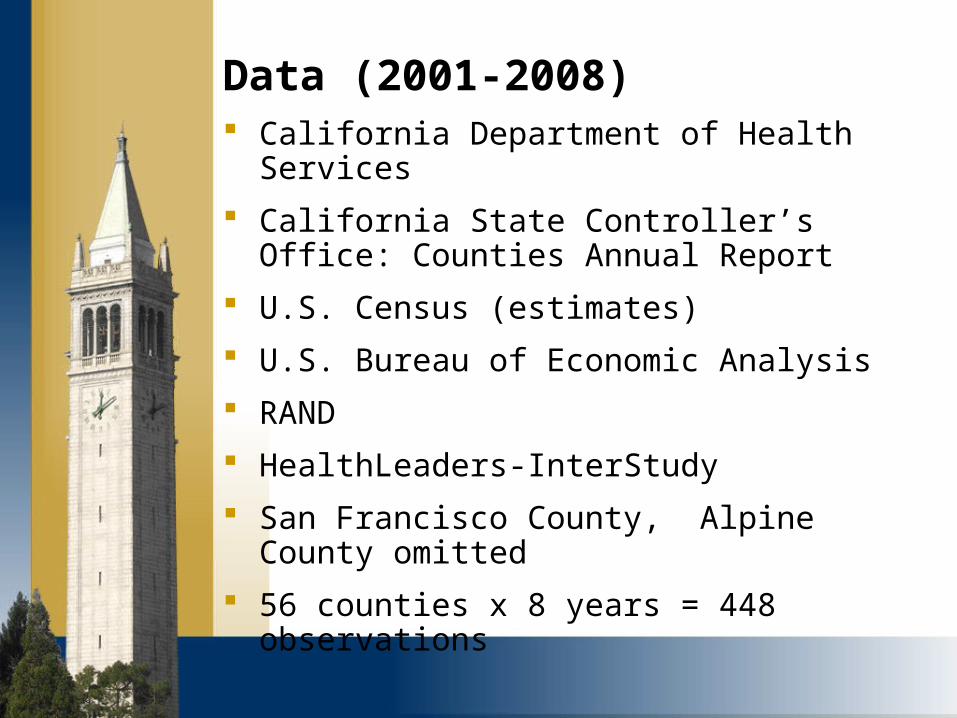
Data (2001-2008) California Department of Health Services
California State Controller’s Office: Counties Annual Report
U.S. Census (estimates)
U.S. Bureau of Economic Analysis
RAND
HealthLeaders-InterStudy
San Francisco County, Alpine County omitted
56 counties x 8 years = 448 observations
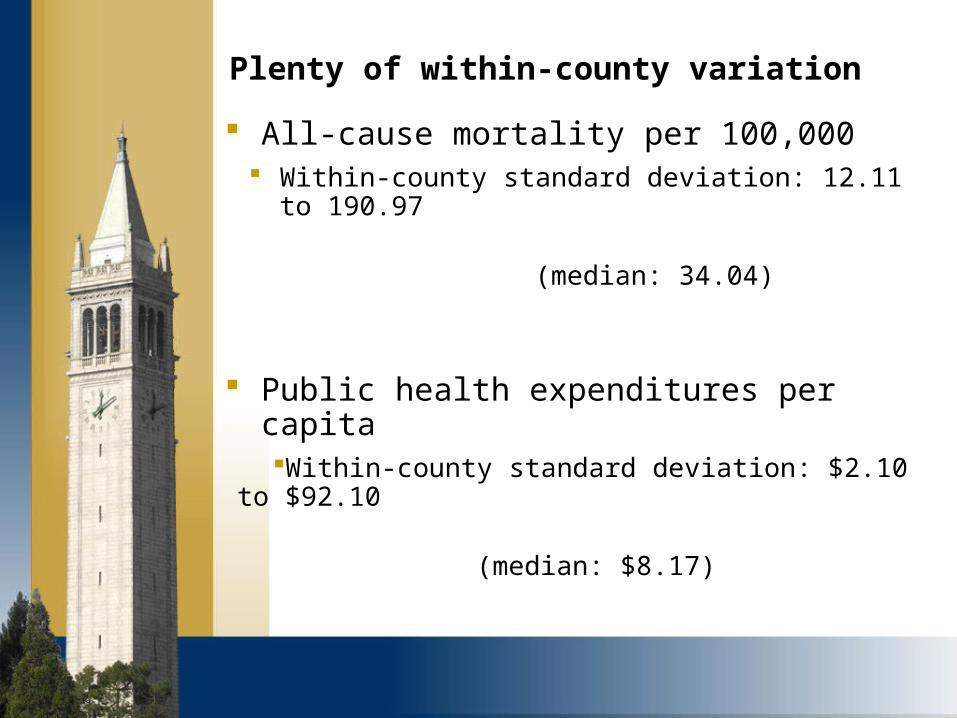
Plenty of within-county variation
All-cause mortality per 100,000 Within-county standard deviation: 12.11 to 190.97
(median: 34.04)
Public health expenditures per capitaWithin-county standard deviation: $2.10 to $92.10
(median: $8.17)

Koyck Distributed Lag Model
y = all-cause mortality per 100,000
x = public health expenditures per capita
k = vector of private insurance, Medicare, Medicaid, proportion of population by age, proportion of population by race/ethnicity, crime index, relative per capita income, unemployment, education proxies, population density
f = year fixed effects

Koyck Distributed Lag Model

Koyck Distributed Lag Model